core.ac.uk · PDF file1 Introduction Recent empirical studies suggest that there is...
44
econstor www.econstor.eu Der Open-Access-Publikationsserver der ZBW – Leibniz-Informationszentrum Wirtschaft The Open Access Publication Server of the ZBW – Leibniz Information Centre for Economics Standard-Nutzungsbedingungen: Die Dokumente auf EconStor dürfen zu eigenen wissenschaftlichen Zwecken und zum Privatgebrauch gespeichert und kopiert werden. Sie dürfen die Dokumente nicht für öffentliche oder kommerzielle Zwecke vervielfältigen, öffentlich ausstellen, öffentlich zugänglich machen, vertreiben oder anderweitig nutzen. Sofern die Verfasser die Dokumente unter Open-Content-Lizenzen (insbesondere CC-Lizenzen) zur Verfügung gestellt haben sollten, gelten abweichend von diesen Nutzungsbedingungen die in der dort genannten Lizenz gewährten Nutzungsrechte. Terms of use: Documents in EconStor may be saved and copied for your personal and scholarly purposes. You are not to copy documents for public or commercial purposes, to exhibit the documents publicly, to make them publicly available on the internet, or to distribute or otherwise use the documents in public. If the documents have been made available under an Open Content Licence (especially Creative Commons Licences), you may exercise further usage rights as specified in the indicated licence. zbw Leibniz-Informationszentrum Wirtschaft Leibniz Information Centre for Economics Alstadsæter, Annette; Jacob, Martin Working Paper Who participates in tax avoidance? Arqus-Diskussionsbeiträge zur quantitativen Steuerlehre, No. 148 Provided in Cooperation with: arqus - Working Group in Quantitative Tax Research Suggested Citation: Alstadsæter, Annette; Jacob, Martin (2013) : Who participates in tax avoidance?, Arqus-Diskussionsbeiträge zur quantitativen Steuerlehre, No. 148 This Version is available at: http://hdl.handle.net/10419/86157
Transcript of core.ac.uk · PDF file1 Introduction Recent empirical studies suggest that there is...
econstor www.econstor.eu
Der Open-Access-Publikationsserver der ZBW – Leibniz-Informationszentrum WirtschaftThe Open Access Publication Server of the ZBW – Leibniz Information Centre for Economics
Standard-Nutzungsbedingungen:
Die Dokumente auf EconStor dürfen zu eigenen wissenschaftlichenZwecken und zum Privatgebrauch gespeichert und kopiert werden.
Sie dürfen die Dokumente nicht für öffentliche oder kommerzielleZwecke vervielfältigen, öffentlich ausstellen, öffentlich zugänglichmachen, vertreiben oder anderweitig nutzen.
Sofern die Verfasser die Dokumente unter Open-Content-Lizenzen(insbesondere CC-Lizenzen) zur Verfügung gestellt haben sollten,gelten abweichend von diesen Nutzungsbedingungen die in der dortgenannten Lizenz gewährten Nutzungsrechte.
Terms of use:
Documents in EconStor may be saved and copied for yourpersonal and scholarly purposes.
You are not to copy documents for public or commercialpurposes, to exhibit the documents publicly, to make thempublicly available on the internet, or to distribute or otherwiseuse the documents in public.
If the documents have been made available under an OpenContent Licence (especially Creative Commons Licences), youmay exercise further usage rights as specified in the indicatedlicence.
zbw Leibniz-Informationszentrum WirtschaftLeibniz Information Centre for Economics
Alstadsæter, Annette; Jacob, Martin
Working Paper
Who participates in tax avoidance?
Arqus-Diskussionsbeiträge zur quantitativen Steuerlehre, No. 148
Provided in Cooperation with:arqus - Working Group in Quantitative Tax Research
Suggested Citation: Alstadsæter, Annette; Jacob, Martin (2013) : Who participates in taxavoidance?, Arqus-Diskussionsbeiträge zur quantitativen Steuerlehre, No. 148
This Version is available at:http://hdl.handle.net/10419/86157
Arbeitskreis Quantitative Steuerlehre
Quantitative Research in Taxation – Discussion Papers
Annette Alstadsæter / Martin Jacob
Who Participates in Tax Avoidance?
arqus Discussion Paper No. 148
June 2013
www.arqus.info
ISSN 1861-8944
Who Participates in Tax Avoidance?∗
Annette Alstadsæter
University of Oslo
Martin Jacob†
WHU – Otto Beisheim School of Management
June 28, 2013
Abstract
This paper analyzes the sources of heterogeneity in legal tax avoidance strategies
across individuals. Three conditions are required for a taxpayer to participate in tax
avoidance: incentive, access, and awareness. Using rich Swedish administrative panel data
with a unique link between corporate and individual tax returns, we analyze individual
participation in legal tax planning around the 2006 Swedish tax reform. Our results
suggest that closely held corporations are utilized to facilitate income shifting across tax
bases to reduce the individual’s overall tax burden. We find that both tax incentives and
awareness of tax incentives impact the decision to access income-shifting opportunities.
Our results show that factors explaining participation in legal tax avoidance substantially
differ from those explaining participation in illegal tax evasion.
Keywords: Tax avoidance, Income shifting, Income taxation, Dividend taxation
∗We are grateful to Kay Blaufus, Lisa De Simone, Karin Edmark, Martin Fochmann, Jochen Hundsdoer-fer, Adrian Kubata, Diderik Lund, Axel Mohlmann, Jukka Pirttila, Ulrich Schreiber, Jan Sodersten, BridgetStomberg, Erin Towery, Altin Vejsiu, and seminar participants at the WHU - Otto Beisheim School of Man-agement, Center for European Economic Research (ZEW) in Mannheim, Annual Congress of the EuropeanAccounting Association in Paris, Spring Meeting of the Tax Section of the German Academic Association forBusiness Research, Research Institute of Industrial Economics (IFN) in Stockholm, Oslo Fiscal Studies, Uni-versity of Mannheim, University of Muenster, University of Magdeburg, and Uppsala Center for Fiscal Studies,for helpful comments and suggestions. We thank Statistics Sweden (SCB) and Barbro Olsson for excellent as-sistance with the data. Financial support from the Research Council of Norway, grant 17139/H20, is gratefullyacknowledged.
†Corresponding author at: WHU – Otto Beisheim School of Management, Burgplatz 2, 56179 Vallendar,Germany. Tel: +49 261 6509 350; fax: +49 261 6509 359.
1 Introduction
Recent empirical studies suggest that there is substantial heterogeneity in the uptake of incen-
tives to participate in tax avoidance strategies across individuals. Both access to evasion and
potential punishment upon detection explain why not everyone evades taxes (Kleven, Knudsen,
Kreiner, Pedersen, and Saez, 2011). Yet, these explanations do not necessarily hold for legal tax
avoidance that carries no risk of penalty. Still, very little is known about whether participation
in illegal tax evasion and legal tax avoidance are driven by the same factors. A question stands
as to why not all individuals participate in legal tax avoidance.
Three conditions are required for a taxpayer to participate in legal tax avoidance. We
categorize these conditions as incentive, access, and awareness. First, the taxpayer must have
an incentive to participate in tax avoidance. That is, the tax benefit from tax avoidance must
outweigh its costs. Second, the taxpayer needs access to tax-minimizing strategies. For example,
employees generally have less opportunity to shift income across tax bases than owner-managers
of closely held corporations. Finally, the taxpayer must have awareness of the tax code, of the
incentive to minimize taxes, and of the opportunities available to do so.1
As argued by Slemrod and Yitzhaki (2002), the distinction between legal tax avoidance
and illegal tax evasion is often blurred, because of either ambiguous laws or a lack of focus on
particular types of transactions by tax authorities. The main challenge for empirical studies on
participation in tax avoidance is the lack of convincing individual income tax data that allows
both control of demographic characteristics and observation of legal tax avoidance behavior.
In this analysis, we focus on legal tax avoidance strategies of individuals that can be observed
in the micro data.
We employ a rich administrative panel data set from Sweden to analyze sources of hetero-
geneity involved in participation in observable income shifting. Income shifting is defined as the
legal process of relabeling existing income or assets in order to reduce total tax payments.2 Our
1We have encountered first-hand, anecdotal evidence on the importance of awareness. Several seminarparticipants told us after having listened to our presentation, i.e., after becoming aware, that they will followthe tax avoidance strategies outlined in this paper.
2The main types of income shifting are across time, across tax bases, and across taxpayers (Stiglitz, 1985).Income shifting across time can involve deferral of capital gains realization (Ivkovic, Poterba, and Weisbenner,2005) or the timing of dividend payouts (Chetty and Saez, 2005; Jacob and Jacob, 2012). Income shiftingacross tax bases involves reclassification of labor income as capital income through choice of organizational
1
panel data set for the years 2000–2008 contains the tax returns of all corporations in Sweden,
along with income tax returns and demographic information from a representative panel of
6.6% of the Swedish population. Using a unique link from the corporate to the individual level,
we are able to identify owners of corporations and to link information across data sets. This
allows us to identify corporations designed for tax avoidance purposes and to link this charac-
teristic to the individual owner level. Using this link, we are able to observe the socioeconomic
characteristics of individuals participating in income shifting.
With a progressive tax on labor income and a proportional tax on capital income, the
Swedish dual income tax incentivizes income shifting from the labor income tax base to the
capital income tax base. In particular, owner-managers of closely held corporations can deter-
mine how much to distribute as wages or dividends to themselves. To prevent this type of tax
avoidance, Sweden limits the amount of dividends from closely held corporations that are taxed
at the proportional tax rate. This limit—the dividend allowance—depends on equity and wages
costs. Empirical identification of income shifting is based on the 2006 tax reform, which, to
foster entrepreneurship and simplify compliance, cut the tax rate on dividends to active owners
of closely held corporations (CHC) from 30% to 20%. At the same time, the dividend allowance
was increased substantially and an alternative allowance, independent of activity and equity in
the firm, was introduced. This brought about two effects on tax avoidance incentives. First,
the reform promotes income shifting from the labor to the capital income tax base. Second,
the tax wedge between dividend income from CHC and widely held corporations (WHC) sets
an incentive to shift assets and shares to the CHC level to defer and to reduce dividend and
capital gains taxes. Neither of the two tax avoidance effects induced by the reform—shifting
income from the labor to the capital income tax base and shifting income within the capital
income tax base—were intended by the tax authorities. We use this tax reform as a natural
experiment to analyze heterogeneity across individuals in their participation in these two types
of legal tax avoidance.
form of a firm and wage–dividend payout (Romanov, 2006; Thoresen and Alstadsæter, 2010; Elschner, 2013).Income shifting across taxpayers includes intrafamily transfer of income and assets (Stephens and Ward-Batts,2004). See Alstadsæter and Jacob (2012) for a discussion of the concept of income shifting and a review of theliterature.
2

We define an individual as an income shifter if he actively participates in: (i) a holding
corporation, (ii) a low-turnover corporation, or (iii) a shell corporation. A holding corporation
enables individuals to shift income within the capital income tax base, that is, to re-label
dividends from a WHC as lower-taxed dividends from a CHC. A low-turnover corporation
can be established to channel labor income through the corporation to benefit from the tax
wedge between labor and capital income. However, such a firm could also be used to generate
additional income. Our empirical results suggest that these firms are indeed used to shift
existing income and not for income generation. A shell corporation is a tax avoidance tool
that serves as an option for future tax savings. If the individual expects high income streams
in the future, the individual has incentives to establish a shell corporation to accumulate and
forward unused dividend allowances, to facilitate future income shifting. We find that the
uptake of holding, shell, and low-turnover corporations increased substantially after the 2006
reform. For example, we classify more than one-fifth of all newly founded CHC in 2006 as
holding companies. In total, more than 25% of all new firms established after 2006 meet our
income-shifting criteria—an increase of over 11 percentage points compared to the pre-reform
average.
The first part of this paper documents income shifting through holding, low-turnover, and
shell corporations. Using a difference-in-difference approach around the 2006 reform, we find
that individuals who establish low-turnover firms substitute labor income with capital income
to reduce the overall income tax burden. At the same time, these individuals do not gener-
ate higher before-tax income. This result holds even when taking into account revenues and
turnover from the corporation in calculating individual before-tax income. We further find
that owners of holding corporations reclassify ordinary capital income as tax-favored dividends
from a CHC around the 2006 tax reform. Again, we find no before-tax total income effect.
These findings are consistent with tax avoidance behavior and show that having access to firms
designed for income shifting leads to substitution of more highly taxed income with lower taxed
income.
The second part analyzes the heterogeneity in participation in income shifting. Not all
individuals with a tax incentive to invest in a tax sheltering firm do so. For example, even
3
though about 17% of employed individuals would benefit from shifting labor income to capital
income (2005 values), less than 0.5% of taxpayers have a low-turnover corporation. Our unique
data set enables us to identify the demographic and socioeconomic factors that characterize
individuals participating in income shifting. Using a two-stage selection model that controls
for being a CHC owner-manager, we find that incentives, access, and awareness matter in the
decision to pursue income shifting. We find evidence of substantial effects from socioeconomic
variables on income shifting.3 Highly taxed individuals are more likely to be an owner in a CHC
designed to access income-shifting opportunities. Having a university education, particularly
a business degree, has a substantial positive effect on the likelihood of participating in tax
avoidance. Individuals with a business degree have a 4.5 percentage point higher likelihood
of participating in a holding corporation—about 77% of the unconditional mean. We also
employ a more exogenous measure of tax awareness. Individuals born in Sweden generally have
fewer language difficulties in understanding the tax code and tax incentives. Consistent with
this notion, we find that Swedish-born individuals are significantly more likely to participate
in income shifting. We also find a significant effect from age and gender on income shifting.
Finally, our results indicate that individuals with easier access to income shifting, such as
consultants and accountants, are more likely to invest in tax sheltering firms than individuals
with limited access to income shifting, such as public employees. This is a strong indication
that awareness and access explain part of the heterogeneity in participation in income shifting
across individuals.
The third part of this study examines more closely the impact of incentives and awareness
on tax avoidance activity. This section also addresses concerns over our proxies. We opera-
tionalize the tax incentive with a dummy variable equal to 1 if an individual’s income is above
the first state tax threshold. Above this threshold, the marginal income tax increases by 20
percentage points. Individuals with income below this threshold do not have a tax incentive
to re-label labor income as capital income, while individuals above this threshold do have such
incentive. We run local linear regressions around the kink to identify the tax effect. Using very
3This finding differs from studies on corporate tax avoidance. Dyreng, Hanlon, and Maydew (2010) showthat managers have an impact on firm tax avoidance. Yet, these authors cannot identify common, observableindividual characteristics that explain executives’ propensity to reduce effective corporate tax rates.
4
narrow bands around the state tax threshold, our results from these local linear regressions
confirm a substantial economic effect from taxes on tax avoidance activities. Crossing the state
tax threshold in the prior year increases the likelihood of owning a shell corporation by 1.6
percentage points, or about 100% of the unconditional mean. This surprisingly large effect can
be explained by the salience of the kink (Chetty, Looney, and Kroft, 2009). Individuals below
the threshold pay only municipality tax. Individuals above the kink pay municipality and state
tax. These two income taxes have different names that make the marginal tax rate increase
very visible. Next, we address concerns that our tax awareness measures: age, education, and
country of birth are correlated with other variables and may thus be poor proxies for awareness
of tax planning opportunities. Alstadsæter, Kopczuk, and Telle (2012) find that participation
in tax avoidance spreads through social networks. We build upon this notion and use cross-
municipality differences in the density of tax avoidance activities as a proxy for awareness. If
more individuals in a municipality participate in a firm designed for tax avoidance purposes,
information spreads more easily and other individuals in the same municipality are more likely
to participate in income shifting as well. We find evidence in favor of this prediction. The
percentage of individuals owning a firm designed for tax avoidance in a municipality positively
affects the likelihood that an individual establishes a new income shifting firm in the following
year.
This paper contributes to the empirical literature on the determinants of tax minimization,
including the effects of tax incentives and demographic characteristics. Our results point toward
substantial differences in the effect of tax incentives and socioeconomic variables on illegal tax
evasion on the one hand, and on legal tax avoidance on the other. Kleven, Knudsen, Kreiner,
Pedersen, and Saez (2011) find no effects of tax rates on participation in tax evasion by self-
employed individuals. Higher education and age seem to have a negative effect on participation
in tax evasion. In contrast to illegal tax evasion, we find a strong and positive effect from tax
rates, education, and age on participation in legal tax avoidance. Gender points in the same
direction for tax evasion and for tax avoidance: Women are less likely to participate in any
form of tax minimization.
5
Our results have important policy implications. If mainly high-income individuals benefit
from tax incentives, income inequality increases and vertical equity is reduced. In addition, hor-
izontal equity is reduced, as only informed individuals with awareness of tax changes and access
to income shifting react to tax incentives. This is relevant for tax authorities when designing
and communicating tax reforms. If tax rules are overly complex and the resulting incentives are
not transparent, unintended effects can occur if awareness of incentives is concentrated among
informed, highly taxed individuals.
The remainder of the paper is organized as follows. In Section 2, we discuss the relevant
literature and provide a theoretical background for our analysis. In Section 3, we describe the
Swedish tax system, the tax reform of 2006, and the resulting incentives. Section 4 describes
the data and variables. In Section 5, we present our empirical results. Finally, Section 6 sets
forth our conclusions.
2 Related literature and heterogeneity in participation
in tax minimization
Recent empirical research documents heterogeneity in participation in tax minimization. The
question is, why do not all taxpayers participate in tax evasion or avoidance? We argue that
there are three main reasons for this: First, in order to participate in tax-minimizing strategies,
the taxpayer must have an incentive to do so. Second, the taxpayer needs access to tax-
minimizing strategies. Finally, the taxpayer requires awareness of the tax code as well as the
incentives and income-shifting opportunities available. We simultaneously test the effects of
incentive, access, and awareness on participation in tax avoidance across individuals. Let us
now discuss each of these conditions in detail.
2.1 Incentive for tax minimization
Individuals participate in legal tax avoidance if the expected benefits exceed the costs associated
with tax avoidance. The benefit of tax minimization is the expected reduction in tax payments,
and thus an increase in disposable income. In turn, the costs of tax minimization can include
monetary outlays to obtain access to the tax-minimizing strategy, e.g., fees for tax consultants,
6
cost of time spent pursuing tax-minimizing strategies, and other non-pecuniary costs such as
tax morale (Andreoni, Erard, and Feinstein, 1998; Fortin, Lacroix, and Villeval, 2007).
Because of a general lack of suitable data, few studies analyze the effects of incentives on
participation in tax minimization and the reasons for observed heterogeneity across individuals.
There is, however, a sizable and growing literature on income shifting through choice of organi-
zational form by owner individuals. High-income individuals change the organizational form of
their businesses to reduce their total tax burden (see, for example, Gordon and Mackie-Mason,
1994; Romanov, 2006; Elschner, 2013). A substantial literature evaluates the responses of tax-
able income to tax changes or changing incentives, as surveyed by Saez, Slemrod, and Giertz
(2012). Kopczuk (2012) documents increases in reported income in response to an optional
new tax rule that increased incentives for many taxpayers to declare income, thus weakening
the tax incentives for underreporting income.
2.2 Access to tax minimization
Access to tax-minimization strategies is a second important source of heterogeneity in partici-
pation in tax minimization. In many cases, several actions are necessary to participate in tax
avoidance, for example, setting up a holding company, becoming self-employed (for example,
Kleven, Knudsen, Kreiner, Pedersen, and Saez, 2011; Pirttila and Selin, 2011; Shaw, Slemrod,
and Whiting, 2010), or owning stock options (Goolsbee, 2000). An owner-manager of his own
firm can determine the tax-minimizing combination of compensation across wage and capital
income. In contrast, employed individuals have fewer opportunities to shift income; they need
to negotiate with their employer, for example, on compensation via a stock compensation plan.
This reduces not only the available income-shifting opportunities, but also increases the costs
associated with income shifting for employed taxpayers.
Likewise, access to tax evasion, in particular to underreporting income, also depends on who
reports the income and who remits the taxes (see, for example, Kopczuk and Slemrod, 2006;
Kleven, Knudsen, Kreiner, Pedersen, and Saez, 2011). Third-party reporting limits access to
underreporting income for ordinary wage earners, as the employer remits taxes on behalf of
the employee. This removes the opportunity for ordinary wage earners not to pay wage income
7
taxes (Shaw, Slemrod, and Whiting, 2010). In countries with third-party reporting of income
and withholding taxes, access to tax evasion is thus restricted to taxpayers that self-report their
income, such as self-employed individuals. However, even among those with the opportunity to
evade, only about 40% actually do so (Kleven, Knudsen, Kreiner, Pedersen, and Saez, 2011).
2.3 Awareness of tax minimization
A growing literature also emphasizes tax awareness as a source of heterogeneity in participa-
tion in tax minimization. The taxpayer’s awareness of tax rules depends on the salience of
taxes, on the accessibility of information about the tax system, and on the individual’s ability
to process information. If there is only third-party reporting of income, and if the employer
or other institutions such as banks remit the taxes, tax payments become less salient. This
reduces awareness of how much taxes individuals actually pay (Chetty, Looney, and Kroft,
2009; Finkelstein, 2009). As a consequence, individuals may be unaware of the incentive to
participate in tax-minimizing strategies. For example, Slemrod, Blumenthal, and Christian
(2001), surprisingly, find indications of increased tax minimization among high-income individ-
uals following a written audit threat. The audit letter appears to raise the awareness of tax
payments and, subsequently, increases participation in tax minimization. Slowness in adapting
to changing income levels may also explain why not all individuals respond to tax incentives
(Jones, 2012). Similarly, Kopczuk (2007) suggests that procrastination is one reason why not
all individuals participate fully in legal estate tax planning. Further, the ability to process the
available information varies across individuals, as does the flow of information through indi-
vidual networks. Alstadsæter, Kopczuk, and Telle (2012) conclude that informal spreading of
information within the family is important to participation in tax-avoidance strategies.
8
3 Incentives for income shifting
3.1 Tax rules for labor and capital income, and the 2006 tax reform
in Sweden
We next discuss the structure of the Swedish tax system and of income-shifting incentives in
detail. Sweden has a dual income tax, with progressive taxes on labor income and a proportional
tax on capital income. This system was implemented in 1991. The progressivity of the tax on
labor income is achieved through a basic flat municipality tax and two additional state taxes
that apply at different thresholds. Table 1 is an overview of developments in top marginal tax
rates and thresholds for the period 2000–2008.
[Insert Table 1 about here]
The difference between the top marginal tax rates on labor and capital income creates
strong incentives to reclassify wage income as dividend income for individuals subject to the
state tax. Ordinary wage earners have little access to this type of income shifting. In contrast,
active owners of smaller firms can decide how to distribute firm profits as wages or dividends.
In the most extreme scenario, all wage earners could start their own firms and pay out the
compensation for their labor effort as the least-taxed income source.
Sweden’s so-called 3:12 rules are designed to prevent such income shifting by firm owners.
According to these rules, dividends to active owners4 of CHCs5 are taxed as dividends only up
to a particular limit—the imputed dividend allowance. This dividend allowance is a function of
the equity and wage costs of the corporation (general imputation method).6 Dividends in excess
of the dividend allowance are taxed as labor income. The dividend allowance is calculated by
the individual for each firm according to ownership share in the corporation. Any unused
dividend allowances are carried forward with interest.4A shareholder is active if he contributes to profit generation in the firm to a considerable extent. This is
not precisely defined in the tax law, and because of an apparent lack of control by the tax authorities, it wouldappear that, in practice, the owner can define himself as active and still come under the 3:12 rules should theowner so choose, independent of the level of activeness.
5The tax law defines a corporation as closely held if 4 or fewer shareholders own at least 50% of the shares.Multiple family members count as a single shareholder. If these criteria are not met, the corporation is considereda WHC. There are no differences in taxation at the corporate level between WHCs and CHCs. Differences intax treatment occur at the shareholder level.
6For a detailed overview on the 3:12 rules and the definition of the dividend allowance, see Alstadsæter andJacob (2012), Chapter 3 and Appendix I.
9
In 2006, the 3:12 rules were reformed to foster entrepreneurship and growth of privately
held firms. The reform included an increase in the dividend allowance and a reduction in the
tax rate on dividends within the dividend allowance. The reform effectively cut tax rates and
narrowed tax bases for CHCs in three ways. First, the marginal tax rate on dividends within the
dividend allowance was reduced from 30% to 20%.7 Second, the dividend allowance calculated
under the general imputation rule increased. Third, an optional, fixed dividend allowance per
firm (the simplification rule), independent of activity, equity, and employment in the firm was
introduced.8 Approximately 80% of active owners under the 3:12 rules chose the simplification
rule to calculate the dividend allowance after 2006.
3.2 Incentives for participation in income shifting
As soon as an individual is subject to the state income tax, there are strong incentives to
reclassify labor income as capital income. The 2006 reform further increased these incentives,
as the tax rate on dividends to active owners of closely held corporations was reduced, the
dividend allowance was increased, and the opportunity arose to accumulate dividend allowances
under the simplification rule with no or little activity in the firm. We consider three particular
types of corporation that appear to be designed for the purpose of legally reducing the tax
burden on a given income with no substantial income generating activity.
All three of these tax avoidance methods, designed to facilitate access to shifting income,
are legal. There is no audit risk that may influence any of these decisions. Everyone is free to
establish a corporation. The minimum required equity amount was SEK 100,000 (about USD
13,550 in 2006) during our sample period. All corporations were additionally required to file
balance sheets and income statements, with expected annual costs for accountants amounting
7Before the reform, owners of CHCs were entitled to a small tax-exempt dividend (Lattnadsregeln). Thistax-exempt dividend was limited to 70% of the interest rate on government bonds, which varied between 4% and5% during over the 2001-2005 period. The dividend allowance for taxable dividends amounted to the interestrate on government bonds plus seven percentage points and a wage base allowance. In total, the dividendallowance for taxable dividends was well above the allowance for tax-exempt dividends. Thus, it is reasonableto assume that the tax reform indeed led to a tax decrease even in the average tax rate.
8During our sample period, the dividend allowance from the simple rule has gradually increased from 64,950Swedish krona (SEK) in 2006 to SEK 91,800 in 2008.
10
to approximately SEK 10,000. We now present the three tax avoidance strategies that we
analyze in this paper.9
3.2.1 Holding corporation: Income shifting across types of capital income
A holding corporation is established for the purpose of owning assets and shares in other corpo-
rations at the corporate level instead of the individual level. Apart from organizational reasons,
there are clear tax incentives that favor operating a holding corporation. As of 2004, dividend
income and capital gains from WHCs are tax-exempt at the corporate level.10 Individuals can
thus defer dividend and capital gains taxes until they decide to distribute these funds from
the holding company. This is particularly important for minority shareholdings in unlisted
corporations, where the minority owner has less control over dividend payout policy. As of
2006, holding companies additionally allow individual shareholders to reduce the tax rates on
dividends from WHCs from 30% (if listed) or 25% (if unlisted) to 20% if capital income is
channeled through a closely held holding company. The organizational, non-tax motivation for
founding a holding company did not change in 2006. Hence, any behavioral response or change
in individual characteristics around the tax reform can be attributed to tax reasons.
We define a corporation as a holding company if the main source of income and turnover
arises from financial income (dividends and profit distributions) from affiliated companies.
In our data, we assign the attribute “holding company” to firms where at least 80% of the
corporation’s turnover arises from financial income.
3.2.2 Low-turnover corporation: Income shifting across income categories, from
labor income to capital income
High-income wage earners have incentives to channel parts of their wage income through a side
business organized as a closely held corporation. By re-classifying wage income in excess of the
state tax threshold as dividend income, the marginal tax burden can be reduced from about
9One possible concern is tax rule uncertainty in Sweden. Individuals may be reluctant to take up theseincome shifting incentives if the rules change frequently. Swedish tax law, however, has proven to be verystable. The dual income tax was introduced in 1991 and there is no discussion of abandoning the presentsystem. Further, the 3:12 rules may have experienced minor adjustments over time, but a change in incentiveswith a tax rate cut, as in 2006, was a unique occurrence in the past two decades.
10For shares in listed firms, dividends and capital gains are tax exempt only if the company holds 10% ormore of the voting rights or if the shares are held for organizational purposes. Therefore, a holding companydoes not work as a tax avoidance tool for portfolios of listed stocks.
11

51% to the combined marginal tax rate on dividends from CHCs of 42.4% (as of 2006). If an
individual is in the top tax bracket, the combined tax burden on labor income (social security
tax and income tax) increases to about 67.2%. Anecdotal evidence suggests that high-income
individuals, consultants in particular, create firms for side business or anticipated business.
Whether these firms are used for income shifting or generation of additional income is an
empirical question addressed in Section 5.2. We define a firm as a low-turnover firm if average
turnover is below SEK 200,000 (about USD 27,100), average wages are less than SEK 100,000,
and if the firm is not a holding corporation.
3.2.3 Shell corporation: Option for income shifting from labor income to capital
income
The third tax avoidance tool is the shell corporation. The purpose of the shell corporation is
to accumulate unused dividend allowances under the simplification rule and to forward these
with interest. The possibility to accumulate and forward unused dividend allowance represents
an option value on expected future tax savings. This provides incentives to found companies
mainly for the purpose of accumulating dividend allowances. Due to high dividend allowances
under the simplification rule beginning in 2006 and the reduced dividend tax rate, the option
value increased considerably after that year. In our data, we define a firm as a shell company
if it has no turnover and if the firm is not a holding corporation.
However, this definition is apparently at odds with the legal definition of an active owner, as
there is no profit generation. Yet, we observe that owners of these firms claim and accumulate
dividend allowances over a period of years. This behavior is, surprisingly, not regarded as tax
evasion by the Swedish tax administration.
4 Data and summary statistics
4.1 Data sources
We use the Firm Register and Individual Database (FRIDA) provided by Statistics Sweden.
This data set is a combination of three main data sources: corporate tax statements, income
tax statements, and the so-called K10-Form. Each owner of a CHC files a K10 for each CHC
12
in which the owner actively participates. This filing requirement enables us to link corporate
tax data and individual tax returns. Figure 1 illustrates the linking procedure.
Insert Figure 1 about here
The first data set comprises a full sample of all corporations registered in Sweden for the
period 2000–2008 (referred to as the Corporate Tax Data). The corporate tax data are a
panel data set based on corporate tax returns from the obligatory INK 2 form filed by all
listed and unlisted corporations.11 The tax returns include information on tax balance-sheet
items and the profit and loss statement. The raw data contain 442,772 firms and 2,904,123
firm-year observations for the period 2000–2008. We make several sample adjustments. First,
we drop observations where a corporation filed two or more tax statements in a single year.
We further exclude firm-years with negative total assets, nominal capital, sales, turnover, or
scheduled depreciation, and observations where information on dividends, share capital, and
organizational form is missing. Finally, we exclude central banks, funds, foundations, and
government-owned entities. This yields a final sample of 426,949 firms and 2,736,747 firm-year
observations. Using this sample, we identify tax avoidance firms. We then link this information
to the K10-Form data.
The second pillar of our data set is the K10-Form data. Each active owner of a CHC must
file this form for each of CHC under ownership. We identify CHCs using the successful link from
the corporate tax to the K10-Form data. For 259,830 firms, we have unique identifiers from the
corporate tax data, which we can successfully link to the K10-Form data, thereby identifying
some 61% of all Swedish corporations as closely held. In the final step, we link information from
the corporate data—our tax avoidance measures—and the K10-Form data—the identification
of CHC owners—to the representative panel of individuals.
The third and main data source is a representative panel data set of income tax returns of
approximately 6.6% of the Swedish population. The raw data set contains 6,118,061 observa-
tions and 702,077 individuals from the original representative sample. For the representative
panel, we have 452,809 successful links to the K10-Form data. That is, about 2.8% of the
11See, for example, http://www.skatteverket.se/download/18.f273d1c11967381d5480001443/200217.pdf for acorporate income tax declaration for 2008 (retrieved January 18, 2013).
13
population are active owner-managers in a CHC. We exclude a number of observations in two
steps. First, we exclude observations with missing information on age, gender, marital status,
and income for at least three consecutive years. We also censor extreme observations outside
the 0.01 and 99.99 percentiles of the income distribution, to remove any outliers. Second, we
include only observations where the individual’s age is between 18 and 70. This yields our final
sample of 2,684,706 observations and 438,294 individuals.
4.2 Variable definitions
4.2.1 Dependent variables
We specify three proxies of tax avoidance as our dependent variables, based on the definitions
from Section 3.2. Owing to the unique data structure, we are able to observe directly the
behavior and purpose of a corporation. We then link the status of the firm to a specific
individual. The dummy variable Shell Firm Owner takes the value 1 if an individual owns a
CHC without economic activity, zero otherwise. The main purpose of a firm is to accumulate
dividend allowances to reclassify future labor income as capital income. The dummy variable
Low-Turnover Firm takes the value 1 if a taxpayer owns a CHC with some activity (for example,
as a side business), zero otherwise. Together, these measures capture the incentive to run a
corporation in addition to the owner’s regular employment. The dummy variable Holding
Corporation takes the value 1 if the CHC of the active owner is a holding company, zero
otherwise.
As shown in Table 2, descriptive statistics indicate that about 15% of all individuals who
actively participate in a CHC also actively participate in a firm regarded as a shell, low-turnover,
or holding corporation. That is, more than one-seventh of Swedish owner-managers participate
to at least some extent in income-shifting firms. Since the tax rules became more beneficial for
income-shifting purposes with the 2006 reform, we expect an increase in the uptake of income-
shifting companies. Figure 2 depicts the percentage of CHCs designed for income-shifting
purposes, according to our definitions, among newly registered CHCs.
Insert Figure 2 about here
14
As expected, the percentage of holding companies, low turnover firms, and shell corporations
increases in 2006 and remains at a higher level post-reform. The percentage of new firms that
are shell corporations (low-turnover firms) increases to about 5% (more than 10%) following
the reform. In 2006, we categorize more than 20% of newly founded firms as holding companies.
In sum, about one-third of all newly founded CHCs in 2006 are some kind of income-shifting
vehicle. This is a first indication that tax avoidance increased following the 2006 reform.
Further, the 2004 increase in holding companies is very likely to be tax-related. The tax-
exemption for dividends and capital gains at the corporate level from unlisted shares was
introduced in this year.
4.2.2 Incentives for tax minimization
We expect substantial cross-sectional variation in tax incentives. As long as an individual’s
income is below the state tax threshold, that individual is subject only to the municipality
tax. In this case, the difference in the top marginal tax rates on dividends and labor income is
negative. Labor income is the less-taxed income source in this case. If a taxpayer is, however,
subject to the first level of the state tax of 20%, the incentives change, and the difference in the
top marginal tax rate is positive. Income in excess of the state tax threshold is least taxed if it is
earned as capital income. We thus operationalize the tax incentive effect on tax avoidance using
a simple dummy variable, State Tax t−1, which takes the value 1 if the individual was subject to
the state tax of 20% in the preceding year, zero otherwise. Table 2 presents summary statistics
for our final sample. Panel A in Table 2 summarizes the income variables for the full sample.
Panel B in Table 2 presents statistics on the demographic characteristics of education. As
shown in Table 2, about 22% of the individual observations in our sample were subject to state
tax in the preceding year. Individuals in our sample have an average taxable income over three
years of SEK 236,502 (in 2006, USD 1 = SEK 7.38), of which most is labor income.
Insert Table 2 about here
The average labor income in our sample is SEK 237,408. Labor income varies considerably,
from SEK 58,306 (10th percentile) to SEK 399,043 (90th percentile); that is, not every tax-
payer has an incentive to establish a low-turnover firm. For example, in 2005 the threshold
15
for the state tax was SEK 313,000. In 2005, about 17% of all individuals had labor income
exceeding the threshold for the state tax by at least SEK 20,000 (not reported in Table 2).
However, we observe that only 0.3% of the Swedish population invests in low-turnover firms
(=107,182/2,684,706×0.0824). Further, we observe that capital income averages only SEK
4,409. This creates little incentive for the average taxpayer to shift income within the capital
income tax base using holding corporations. Still, a considerable number of individuals have
an incentive to establish a holding corporation. For example, 2.4% of taxpayers in our sample
have capital income exceeding SEK 100,000, yet only 0.25% of all taxpayers are holding CHC
owners. Our descriptive statistics indicate that a considerable number of individuals have tax
incentives to establish tax sheltering firms; however, just a few participate in a holding, shell,
or low-turnover corporation.
4.2.3 Access to tax minimization
One explanation for the observation that not all individuals with tax incentives participate in
income shifting firms relates to access to tax avoidance. For example, the nature of the job
determines whether an individual can participate in income shifting. To shift income from labor
to the capital income tax base, an individual needs to cooperate with his employer. Instead
of paying a wage, the employer (partly) compensates the employee through a tax sheltering
firm. Since we have information on job occupation, we can analyze cross-sectional differences
in access to income shifting. Specifically, we argue that consultants and accountants have the
ability to cooperate with their employer. In contrast, public employees working for a central
or local government have little access to such income shifting, since the employer, that is, the
government, is unlikely to support it (see, for example, Kreiner, Leth-Petersen, and Skov, 2012,
in the Danish context). To proxy for access through type of job occupation, we thus include
dummy variables for being a consultant, accountant, or a public employee.12 The fact that one
needs a third party to reclassify labor income as capital income through a low-turnover firm
can also explain why the percentage of individuals responding to tax incentives is higher for
12We define a Consultant as an individual working for a management consulting company, a software orhardware consulting company, or a marketing consulting company. The job occupation Accountant coversaccountants, auditors, and tax consultants. As public employees we include individuals working for a state orlocal government administration.
16

holding corporations (about 10% = (0.25%/2.4%)) than for low-turnover corporations (about
2% = (0.3%/17%)). To establish a holding corporation and to reallocate assets to the CHC,
an individual does not require a cooperating third party.
Further, to participate in income shifting under these particular tax rules, an individual
must be an active owner of a CHC. However, this induces certain costs. For example, running
a company is associated with accounting and reporting requirements that generally increase
complexity and the costs of income-shifting mechanisms. We thus expect that there is a self-
selection process associated with being an active owner. If we find evidence for such self-
selection, the distribution of access to income shifting is not equal across individuals.13 We
employ a two-stage estimation approach to test this expectation.
4.2.4 Awareness of tax minimization
Our set of demographic controls includes taxpayer age, gender, marital status, type and level of
education,14 and whether the individual was born in Sweden. We use three proxies to indicate
stronger awareness of the tax code and tax avoidance opportunities: namely, having higher
education in either business (Business Education) or law (Law Education), and being born in
Sweden (Born in Sweden).15 These three variables are expected to positively affect participation
in income shifting. We additionally include age and age-squared to control for experience. We
expect income shifting to be positively affected by age. However, the effect may decrease above
a particular age when individuals are close to retirement. Their option value inherent in a shell
corporation is much lower than for younger individuals.16
13An alternative measure of access to income shifting is ownership share. However, we use firms specificallyestablished for tax avoidance purposes to proxy for income shifting. Therefore, there is a potential reversecausality in the ownership share. We thus do not include ownership share as a measure for access in ourapproach.
14We define tertiary education as a four-year university or college degree.15Unfortunately, we have information only on whether the individual was born in Sweden. A better measure to
capture awareness would be distance, e.g., geographical or cultural, of the country of birth compared to Sweden.This biases against our variable, as we treat all foreign-born individuals similarly. For example, Norwegiansor Danes can more easily understand the Swedish language (and concomitantly, the Swedish tax code) thanindividuals from more distant countries. Further, our measure would be more accurate if we could control foryear of immigration. For instance, if an individual immigrated to Sweden very early in life, that individualshould face very little problem in reading and understanding the tax rules. Both these concerns qualify ourfindings, at least in part.
16There is, unfortunately, no information in the data on whether the tax statement was prepared by a taxconsultant.
17
After controlling for age, education, and income, country of birth is a suitably exogenous
proxy for the knowledge hurdle required to understand the tax code. We expect native speakers,
as proxied by birth in Sweden, to be more able to process changes in the Swedish tax codes
than foreign-born individuals. As shown in Table 2, about 85% of the observations are for
individuals born in Sweden. Approximately 11% have a tertiary-level business education and
about 1% have a tertiary level law education. The average taxpayer is 44.5 years of age and
there are slightly more men than women in our sample (50.54%). The business degree is the
dominant type of education among individuals with higher degrees.
5 Empirical evidence on tax avoidance
Our empirical identification strategy has two stages. First, we assess the validity of our tax
avoidance measures Shell Firm Owner, Low-Turnover Firm and Holding Corporation. If our
measures of income shifting are meaningful, we should be able to observe changes in the income
composition of individuals participating in these tax avoidance strategies. In particular, we are
interested in the income composition of owner-managers in holding companies and low-turnover
corporations. A focus on shell corporation owners is not meaningful, as income substitution can
be observed at the time of income realization at the corporate level. Our definition, however, is
based on expected income shifting and rules out income realization during our sample period.
If income shifting is present, we should observe it within the capital income tax base via
holding companies, and from the labor to the capital income tax base via low-turnover firms.
To test this prediction, we use a difference-in-difference approach around the 2006 tax reform.
Second, we are interested in the individual characteristics of owners of tax avoidance firms;
that is, we endogenize and model the decision to invest in a tax sheltering firm. If our tax
avoidance measures detect income shifting, that is, if our difference-in-difference results are as
expected, we can analyze the factors that drive the likelihood to participate in such a firm. To
ensure that our difference-in-difference estimates are not biased, we use a matching procedure,
described in detail below.
18

5.1 Income shifting within capital income tax base
First, we focus on holding companies. We expect that individuals transfer shares in listed and
unlisted corporations to their CHCs. In doing so, owner-managers of a holding company can
postpone dividend and capital gains taxation until they decide to distribute these proceeds to
the individual level. Individuals could further reduce the dividend and capital gains tax burden
to 20% following the 2006 tax reform. If our simple dummy variable captures income shifting,
we should be able to observe a substitution effect across income sources for owners of holding
corporations around the 2006 tax reform.
We use owners of a holding CHC as our treatment group. We only include individuals in
the treatment group if they own a holding company in all sample years (2002–2008). This
condition has two advantages. First, it ensures that the decision to own a holding company is
not affected by the 2006 tax reform. Second, individuals cannot enter or exit the treatment
group over the sample period. The control group consists of a matched sample of CHC owners
who run a CHC in all sample years but who do not invest in a tax sheltering company. We use
a one-to-one matching procedure without replacement with respect to average income, State
Tax, and demographic characteristics, as described in Table 2.17
We use five variables to measure a potential income shifting activity. First, we use total
before-tax income. Second, we use total before-tax income and add the CHC’s turnover to
control for corporate income. Third, we use labor income to control for additional income
shifting from labor to capital income. Fourth, we include the amount of CHC dividends. Finally,
we are interested in dividend and interest income unrelated to any CHC. All income variables are
measured before taxes.18 In the presence of income shifting, overall income is expected to remain
constant relative to that of other owner-managers. However, an insignificant total income effect
does not allow us to draw conclusions on the presence of income shifting. If owner-managers use
their holding companies to shift assets from the individual to the corporate level, we expect that
17After matching, we detect no differences in demographic and socioeconomic characteristics between treat-ment and control group. The differences also do not change from before to after the reform for all variablesexcept for one demographic characteristic (Consultant). Since we include all control variables in the regression,we are confident that our difference-in-difference estimate for the income shifting effect around the reform isnot biased.
18We Winsorize income variables at the 0.1% level to prevent extreme values and outliers from biasing ourresults. We further exclude capital gains from capital income to account for large, one-time capital gains in thedefinition of permanent capital income (see, e.g., Jacob, 2012).
19
individuals substitute capital income derived outside the CHC with dividends from the CHC,
for example, by shifting assets and shares in unlisted, WHCs to the holding CHC. If holding
owners additionally channel some labor income through their CHC, we should observe lower
labor income post-reform. Table 3 presents the difference-in-difference estimates for the five
dependent variables. We add controls (results not reported) for demographic characteristics,
county-fixed effects, and year-fixed effects.
[Insert Table 3 about here]
We find that owners of holding companies do not experience higher total income growth than
other CHC owners (Column 1 and 2). In fact, the difference-in-difference estimate is negative,
but not significant. Most importantly, we are interested in the substitution effect of capital
income related to WHCs with dividend income from CHCs. We find that holding CHC owners
increase dividends from CHCs substantially relative to the control group. The difference-in-
difference estimate with controls is SEK 43,002 and is significant (Column 4). In contrast,
the difference-in-difference estimate for capital income realized outside the CHC (Column 5) is
SEK 64,849 and statistically significant. It thus appears that investors use holding companies
to shift capital income from WHCs to CHCs. Further, it appears as if holding CHC owners
postpone the dividend payout since the decrease in CHC-unrelated dividends is higher than the
increase in CHC dividends. This behavior reflects income shifting across bases and over time.
The negative difference-in-difference estimate for labor income indicates that these firms are
also used to reclassify some labor income as dividend income. The average tax savings amount
to SEK 11,105 for a holding CHC owner in the top tax bracket.19
5.2 Income shifting from labor income to capital income
Second, we focus on the owners of low-turnover firms. We expect that individuals actively use
low turnover firms to shift income from the labor income tax base to the capital income tax
base. However, these firms could also be used to generate additional income. Since the marginal
19The combined tax savings are computed as the tax advantage from shifting within the capital incometax base (SEK 3,242=5% × 64,849) and from the tax wedge between labor income and capital income (SEK7,863=((67.2%-42.4%) × SEK 31,704)).
20
tax rate on income earned as dividends through the CHC can be below the marginal income tax
rate, individuals may increase labor supply and generate additional income. Also, negotiating
contracts through a CHC can increase the return to labor supply as, for example, compensation
per hour increases. It is an empirical question whether our definition of low-turnover firms picks
up income shifting or income generation.
For this purpose, we analyze the total income and income composition of individuals who
established a low-turnover firm post-reform, our treatment group. This group contains only
individuals who do not participate in any CHC pre-reform. For our control group, we use
a matched sample of employed individuals who do not participate in a CHC or low-turnover
firm in any year. In other words, we compare employed individuals with low-turnover firms
post-reform (treatment group) to employed individuals without a CHC (control group). Since
the decision to establish a low-turnover firm is not exogenous (see Section 5.3), we match the
individuals in our treatment group to employed individuals who are similar with respect to
income, tax status, and demographic variables. By matching on these variables, we ensure
that the individuals in the treatment and control groups are similar with respect to factors ex-
plaining participation in tax sheltering firms. We use a one-to-one matching procedure without
replacement and ensure that taxpayers cannot move across groups.20 In the presence of income
shifting, total income of individuals with a low-turnover firm is expected to be constant (relative
to the control group). Capital income is expected to substitute labor income. Table 4 presents
the difference-in-difference estimates using the matched sample around the 2006 reform.
[Insert Table 4 about here]
The results indicate that individuals who establish a low-turnover firm after the reform do
not generate higher before-tax income than employed individuals (Column 1). Put differently,
it appears that individuals with a low-turnover firm do not generate additional income. In fact,
the difference-in-difference estimate is negative (SEK -23,412), but statistically insignificant.
One potential explanation for this result is the lock-in of capital and profits at the corporate
level. If owners of low-turnover CHCs retain a large fraction of their earnings, we may mis-
interpret income generation as income shifting. We thus add turnover and revenues of the
20After matching, we detect no differences in demographic and socioeconomic characteristics between treat-ment and control group.
21
corporation to the owner’s total income (Column 2). Still, the difference-in-difference estimate
is negative (SEK -23,319) and statistically insignificant. In line with the income shifting ar-
gument, labor income of low-turnover firm owners decreases relative to the labor income of
employed individuals (SEK -38,997). At the same time, the capital income of individuals in
the treatment group increases post-reform by SEK 40,574. This is equivalent to tax savings of
about SEK 9,671 (=((67.2%-42.4%) × SEK -38,997)) for individuals in the top tax bracket.
Individuals apparently use low-turnover firms to reclassify labor income as capital income,
while they do not generate additional income. This also indicates the importance of access to
income shifting. Individuals with access to income shifting or individuals who establish access
to income shifting firms use their CHC to shift income across tax bases to reduce overall tax
liability and to increase net-of-tax income.
5.3 Identifying characteristics of income shifters
We next turn to OLS regression analysis, which takes advantage of the entire cross-sectional
variation in the data. We are interested in the likelihood of owning a shell, low-turnover,
or holding corporation. We thus endogenize the decision to own a tax sheltering firm. In
our estimation approach, we must account for differences between firm owners and employed
individuals. Put differently, we need to control for the potential selection bias of being an
active CHC owner. This relates to the dimension of access to income shifting in that only the
owners of CHCs can exploit the incentives inherent in the 3:12 rules. We thus run the following
two-stage regression model.
Owneri,t = α1 + δΓi,t + γ ·Business150i,t−1 + αc + αt + ϵi,t (1)
Shifteri,t = β1 + θΓi,t + ψ · InvMillsi,t−1 + βc + βt + ϵi,t if Owneri,t = 1 (2)
In the first stage, we estimate whether an individual owns a CHC using a probit model
(Equation 1). The dependent variable Owner is a dummy variable taking the value 1 if the
individual actively participates in a CHC, zero otherwise. The individual-level variables, de-
noted by the vector Γi,t, include average income over the past two years (excluding income from
22
CHC), and a dummy variable if the individual was subject to the state tax in the preceding
year, zero otherwise. The vector also includes demographic characteristics for being born in
Sweden, age, gender, and marital status; dummy variables for tertiary education and a busi-
ness, law, or information technology (IT) degree; dummy variables if the individual works as
an accountant or consultant or for a central or local government agency (Public Employee);
and a dummy variable if the taxpayer resides in a city. We also include age squared to control
for nonlinear relations with age and being a firm-owner and income shifter, respectively. As an
exogenous variable in the criterion function, we include a dummy variable Business150 that
takes the value 1 if the individual realized income of more than SEK 150,000 in the previous
year from self-employment and business activity, zero otherwise. This dummy is a proxy for
the incentive to incorporate an existing business to optimize the choice of organizational form.
Having substantial business income and choosing the tax-optimal organizational form is not
related to the type of tax avoidance that we try to capture. We also include county-fixed effects
(αc) for the 21 Swedish first-level administrative regions and year-fixed effects (αt) to control
for differences across time and counties.
In the second stage, we specify our three measures of tax avoidance activity as dependent
variables. These three variables capture several dimensions of income shifting. First, we set
our indicator variable Shifter to 1 if the CHC owner owns (at least) one CHC that has no
economic activity. Second, we set our indicator variable Shifter to 1 if the one of the firms
that the CHC owner owns is considered a low-turnover firm. Third, we set Shifter to 1 if at
least one of the individual’s CHCs is a holding company. We include the vector Γi,t, the inverse
Mills ratio, to control for sample selection and access to income shifting, county-fixed effects
βc, and year-fixed effects βc as explanatory variables. In both models, our statistical inference
is based on heteroskedasticity-robust standard errors clustered at the individual level.
[Insert Table 5 about here]
Table 5 shows the regression results. The results for the criterion function (Equation 1)
show that being born in Sweden, being subject to the state tax in the preceding year, marital
status, holding a university degree, and having substantial business income, each increases the
likelihood of being an active CHC owner. In contrast, the probability of being a CHC owner
23

is lower if the individual is female or if the taxpayer lives in a large city. The effect of age is
hump-shaped.
We are mainly interested in the individual characteristics that affect income-shifting be-
havior, as shown in columns (2) to (4). We find that being subject to the state tax positively
affects shifting behavior. This is consistent with our expectations. Ceteris paribus, highly taxed
individuals have an incentive to shift income into CHCs. The effect we find is substantial. The
likelihood of being a holding firm owner increases by over 10.4 percentage points (over 160% of
the unconditional mean) if the individual is subject to the state tax. Likewise, the likelihood of
being a shell corporation owner increases by 1.1 percentage points (or 67% of the unconditional
mean). Yet there is some concern that this dummy variable is correlated with other variables.
For example, it could capture an income effect (high versus low income) instead of a tax effect.
We address this concern in Section 5.4 below using local linear regressions around the major
kink in the marginal tax rate schedule.
We are next interested in the factors related to awareness of income shifting. We designate
the variables Age, Born in Sweden, Tertiary Education, and the types of education as our
main variables of interest. Our results suggest that having a degree in business or economics
significantly increases the likelihood of participating in income shifting. However, we cannot
interpret our results as indicating a causal link between education and income shifting, because
our measures capture many dimensions related to awareness. For example, an individual with
a business degree may not only have greater knowledge about tax rules through education, but
also stronger individual preferences for business matters, at least compared with graduates in
other disciplines. We also find some evidence that individuals born in Sweden are more likely
to participate in income shifting. After controlling for education and income, country of birth
is a good proxy for hurdles in understanding the tax code. From this, we cautiously conclude
that awareness of the tax rules appears to be one economically significant factor explaining
part of the heterogeneity in participation in income shifting across individuals.
In addition, we find a significant effect of age in the form of an inverted U-shaped function.
For low turnover firms, only age squared is significant. These results indicate that experience
measured via age is one determinant of participation in income shifting. We observe consistent
24
effects for the variable Female. Once again, the effects are economically substantial in that
the likelihood of owning a holding company increases by 7.1 percentage points (over 100% of
the unconditional mean) if the individual is male.
Finally, we are interested in the variables related to access. Our controls for job occupation
indicate that individuals with easier access to income shifting are more likely to own a tax
sheltering firm. For example, the likelihood of owning a shell corporation increases by 51% if
the individual is a consultant. At the same time, public employees are less likely to shift income
across tax bases, due to lack of access—since the employer, that is, the government, is unlikely
to cooperate in income shifting. Not surprisingly, being an accountant has a strong effect on
the likelihood of owning a tax sheltering firm. The likelihood of owning a shell corporation
increases by 132% if the individual is an accountant, that is, an individual with both awareness
and access.
The significance of the inverse Mills ratio indicates the importance of controlling for both
sample selection and access to income-shifting opportunities. Self-selection indicates that dis-
tribution of access to income shifting is not equal across individuals. The result of the Business
Degree coefficient is further related to access to tax avoidance. Taken together, the results
of Kleven, Knudsen, Kreiner, Pedersen, and Saez (2011) and our results indicate that highly
educated individuals participate less in illegal tax evasion and more in legal tax avoidance.
Access to tax evasion through underreporting of income is limited for individuals with higher
education due to the nature of their professions. A self-employed individual providing manual
labor to private clients can more easily arrange for “under-the-table” payments than highly
educated individuals such as business consultants. The latter sell services to clients that expect
receipts to deduct these costs from their taxable income. This effectively limits access to illegal
tax evasion. Tax minimization thus necessitates access to legal tax avoidance, for example,
through any of the types of income shifting firms described above.
5.4 Tax incentive and local linear regressions
Let us turn to a more detailed analysis of the tax incentive to address concerns about our tax
incentive measure. First, our definition could capture an income effect (high versus low income)
25
instead of a tax effect. Even if we include the marginal tax rate as an explanatory variable,
concerns about the correlation between income and the marginal tax rate remain. Second, the
regression analysis above captures a correlation. However, we are particularly interested in a
causal link between taxes and income shifting.
The marginal tax rate structure of the Swedish tax code provides a good opportunity to
test the tax effect on income-shifting activities. We use the kink of 20 percentage points in
the marginal tax rate function around the first state tax threshold and employ a local linear
regression. If tax incentives drive legal tax avoidance, individuals slightly above the state tax
threshold should be more likely to participate in income shifting than individuals below the
threshold. We believe that a tax rate increase of 20 percentage points is sufficiently large to
identify this change in behavior. Further, this tax rate increase is very salient (see Chetty,
Looney, and Kroft, 2009; Finkelstein, 2009, on tax salience)). Below the threshold, individuals
pay only municipality income tax. Above this threshold, their income is subject to an additional
20% state tax, as explicitly stated in the tax assessment. As these different levels of tax rates
have different names, the kink very salient to taxpayers. We use ranges of SEK 5,000, SEK
10,000, and SEK 20,000 (about USD 678, USD 1,355, and USD 2,710 in 2006) around the state
tax threshold.
We use a local linear regression design, with our income shifting measures as the dependent
variable and the State Tax Threshold dummy as the explanatory variable of interest. Again, we
define the dummy variable for the tax incentive based on the prior year. There are two concerns
about using a local linear regression around the tax threshold. The first relates to bunching
at kink points (Saez, 2010). For example, Bastani and Selin (2012) show bunching of the self-
employed around the major kink point in Sweden. We, however, believe that bunching does
not bias our estimate of the tax incentive on income shifting upwards. If individuals who bunch
and show awareness of tax incentives are normally distributed around the kink, crossing the
state tax threshold does not change the tax incentives to participate in income shifting firms for
these individuals. There are reasons to believe that bunching could drive our coefficient towards
zero. First, not all individuals bunch at kink points. Second, it is reasonable to assume that the
presence of bunching rather leads to more individuals locating below the state tax threshold.
26

In fact, 52% to 54% of taxpayers are below the threshold for our three ranges of SEK 5,000 to
20,000. This gives us confidence that our estimates are not biased upwards due to bunching.
A second concern about the local linear regression is that individuals are similar across groups.
The local linear regression design can be applied only if individual characteristics around the
state tax threshold are similar.
[Insert Table 6 about here]
Table 6 presents differences between individuals above and below the threshold. The data
around the threshold appears to be reasonably smooth, and we are therefore confident that we
are able to identify a tax effect. With one exception, all differences are statistically insignificant.
We nevertheless test the robustness of our results by controlling for demographic characteristics,
selection, and county-fixed effects as well as year-fixed effects. We present the results for the
three income ranges around the state tax threshold and for our three income shifting measures.
[Insert Table 7 about here]
Our results in Table 7 show that crossing the state tax threshold increases the likelihood of
participating in income shifting. We consistently find a statistically and economically significant
effect of crossing the state tax threshold on tax avoidance activities with and without controls.
This effect is surprising, since the incentive to participate in a holding company is actually
independent from the marginal income tax on labor income. Yet, the visibility of the kink in
the tax code raises awareness of incentives to reduce taxes. Further, our analysis in Section
5.1 shows that holding firms also facilitate some income shifting from labor income to capital
income.
The effects of crossing the state tax threshold on participation in income shifting for shell
corporations and holding companies are economically significant. For example, crossing the
state tax threshold (using the SEK 5,000 range around the threshold) increases the likelihood
of owning a holding company by 1.6 percentage points or about 100% of the unconditional
mean. One potential explanation for this strong effect is the salience of the increase in marginal
income tax. Once individuals cross the state tax threshold, they become aware of their change
in the marginal tax rate and they respond to tax incentives. At first glance, it may still appear
27
irrational to establish a shell corporation or a low-turnover corporation just because one has
crossed the state tax threshold by a small amount. The tax savings on this small amount of
income in excess of the state tax threshold does not cover the costs of a CHC. However, the
option value inherent in the possibility to carry forward and accumulate dividend allowances
with interest and expected income growth provide rational explanations for why individuals
participate in these income shifting firms.
We also test two further kinks in the tax code that are less tax salient. First, social security
contributions cease to create benefit above a particular income level. Second, there is a second
stage of the state tax of an additional 5%. Both thresholds are well above the first state tax
threshold. In contrast to the first state tax threshold, these two kinks in the marginal tax rate
do not create an incentive to establish a low-turnover or a shell corporation. Both kinks simply
increase the benefits of income shifting using shell corporations and low-turnover corporations.
We find no significant effect from crossing these two thresholds on the likelihood to participate
in income shifting, using local linear regression around the respective thresholds. From this, we
conclude that tax incentives and their salience are key sources of the heterogeneity in income
shifting across individuals.
5.5 Awareness and Network Effects
Our final concern relates to the measure of awareness. Our proxies of awareness include age,
level of education, type of education, and country of birth. However, these variables may be
correlated with other variables, such as income and may thus be poor proxies for the effect of
awareness on income shifting. We thus use a more exogenous measure based on network theory
(see, Alstadsæter, Kopczuk, and Telle, 2012). Policy makers interpreted the 2006 reform as
a minor adjustment to the tax code with very little awareness that incentives to participate
in income shifting had changed. However, anecdotal evidence suggests that tax consultants
understood these changes in incentives and helped individuals to establish income shifting
firms.
We use cross-municipality differences in the density of tax avoidance as a measure of tax
awareness. We define each municipality—the 290 lower-level local government entities—as a
28
network. If more individuals in a municipality participate in an income shifting firm, informa-
tion spreads more easily within the network and individuals are more likely to participate in
income shifting as well.
We test this effect using logit regressions on the likelihood to establish an income shifting
firm. Our dependent variable is a dummy variable equal to 1 if the individual establishes an
income shifting firm in year t and if the individual has not actively participated in a CHC in
the prior year t-1, zero otherwise. As our key explanatory variable, we use the percentage of
shell, low-turnover, or holding corporation owners in the municipality in the previous year. The
percentage is based on the whole population. Alternatively, we use the percentage of individuals
in a municipality that participate in any of these three firm types in year t-1. If the network
theory using our very broad definition of a municipality as a network holds, we should obtain
a positive coefficient on the percentage of income shifters in a network.
[Insert Table 8 about here]
Table 8 shows regression results from logit regressions using the full sample of individuals.
We find that the network effect is positive and significant in all specifications and for all measures
of income shifting. This indicates that part of the cross-sectional variation in participation in
income shifting can be explained by awareness. If information spreads through networks, e.g.,
through a higher density of tax consultants in a municipality, the likelihood of participating in
income shifting in a network increases. This makes us confident that awareness of tax incentives
is an important explanation for why some individuals participate in income shifting and others
do not.
6 Conclusion
We document substantial heterogeneity with respect to access, incentive, and awareness in par-
ticipation in income shifting across individuals. All three conditions are required for taxpayers
to actively avoid taxes. Our results point towards differences in the effect of socioeconomic
variables on illegal tax evasion and on legal tax avoidance. In contrast to participation in il-
legal tax evasion (Kleven, Knudsen, Kreiner, Pedersen, and Saez, 2011), we find a strong and
29

positive effect of tax rates on participation in legal tax avoidance. Further, tertiary business
education and age have positive effects on participation in legal tax avoidance. Gender is one of
the few factors that points in the same direction for tax evasion as for tax avoidance: Women
are less likely to participate in any form of tax minimization.
Our results have important policy implications for tax authorities. In the presence of het-
erogeneity in the take-up of tax incentives, unintended consequences of tax reforms can occur.
For example, if taxpayers are not informed about tax incentives or if tax incentives are complex,
costly to pursue, and/or not transparent, only some taxpayers respond to tax incentives. Com-
plex and non-transparent reforms that are poorly communicated are likely to promote income
shifting and tax avoidance strategies. This has unintended consequences on horizontal and
vertical equity, as informed, highly-taxed and educated individuals are more likely to respond
to tax incentives. Studying the welfare consequences of heterogeneity in legal tax avoidance is
a natural avenue for further investigation.
30
References
Alstadsæter, Annette and Martin Jacob (2012): Income Shifting in Sweden – An empirical
evaluation of the 3:12 rules. Report to the Expert Group for Public Economics, Ministry of
Finance, Stockholm.
Alstadsæter, Annette, Wojciech Kopczuk, and Kjetil Telle (2012): Social networks and indi-
viduals’ tax avoidance participation, Mimeo, University of Oslo, Columbia University, and
Statistics Norway.
Andreoni, James, Brian Erard, and Jonathan Feinstein (1998): Tax compliance, Journal of
Economic Literature, 36: 818–860.
Bastani, Spencer and Hakan Selin (2012): Bunching and Non-Bunching at Kink Points of the
Swedish Tax Schedule, Cesifo Working Paper No. 3865.
Chetty, Raj, Adam Looney, and Kory Kroft (2009): Salience and Taxation: Theory and Evi-
dence, American Economic Review, 99: 1145–1177.
Chetty, Raj and Emmanuel Saez (2005): Dividend taxes and corporate behavior. Evidence
from the 2003 dividend tax cut, Quarterly Journal of Economics, 120: 791–833.
Dyreng, Scott, Michelle Hanlon, and Edward L. Maydew (2010): The Effects of Executives on
Corporate Tax Avoidance, The Accounting Review, 85: 1163–1189.
Elschner, Christina (2013): Special tax regimes and the choice of organizational form: Evidence
from the European Tonnage Taxes, Journal of Public Economics, 97: 206–216.
Finkelstein, Amy (2009): E-ZTAX: Tax Salience and Tax Rates, Quarterly Journal of Eco-
nomics, 124: 969–1010.
Fortin, Bernard, Guy Lacroix, and Marie-Claire Villeval (2007): Tax evasion and social inter-
actions, Journal of Public Economics, 91: 2089–2112.
Goolsbee, Austan (2000): What Happens When You Tax the Rich? Evidence from Executive
Compensation, Journal of Political Economy, 108: 352–378.
Gordon, Roger. H. and Jeffrey K. Mackie-Mason (1994): Tax Distortions to the Choice of
Organizational Form, Journal of Public Economics, 55: 279–306.
Ivkovic, Zoran, James M. Poterba, and Scott J. Weisbenner (2005): Tax-Motivated Trading by
Individual Investors, American Economic Review, 95 (5): 1605–1630.
Jacob, Marcus and Martin Jacob (2012): Taxation, Dividends, and Share Repurchases: Taking
Evidence Global, Journal of Financial and Quantitative Analysis, forthcoming.
31
Jacob, Martin (2012): Tax Regimes and Capital Gains Realizations, FAccT Center Working
Paper No. 06/2012.
Jones, Damon (2012): Inertia and Overwithholding: Explaining the Prevalence of Income Tax
Refunds, American Economic Journal: Economic Policy, 4: 158–185.
Kleven, Henrik, Martin Knudsen, Claus Thustrup Kreiner, Soren Pedersen, and Emmanuel
Saez (2011): Unwilling or Unable to Cheat? Evidence from a Tax Audit Experiment in
Denmark, Econometrica, 79: 651–692.
Kopczuk, Wojciech (2007): Bequest and Tax Planning: Evidence from Estate Tax Returns,
Quarterly Journal of Economics, 122: 1801–1854.
Kopczuk, Wojciech (2012): The Polish business “flat” tax and its effect on reported incomes:
a Pareto improving tax reform?, Mimeo, Columbia University.
Kopczuk, Wojciech and Joel B. Slemrod (2006): Putting Firms into Optimal Tax Theory,
American Economic Review, 96: 130–134.
Kreiner, Claus Thustrup, Søren Leth-Petersen, and Peer Ebbesen Skov (2012): Tax Reforms
and Intertemporal Shifting of Wage Income: Evidence from Danish Monthly Payroll Records,
Working Paper.
Pirttila, Jukka and Hakan Selin (2011): Income Shifting Within a Dual Income Tax System.
Evidence from the Finnish Tax Reform of 1993, Scandinavian Journal of Economics, 113:
120–144.
Romanov, Dmitri (2006): The Corporation as a Tax Shelter: Evidence from Recent Israeli Tax
Changes, Journal of Public Economics, 90: 1939–1954.
Saez, Emmanuel (2010): Do Taxpayers Bunch at Kink Points?, American Economic Journal:
Economic Policy, 2: 180–212.
Saez, Emmanuel, Joel B. Slemrod, and Seth H. Giertz (2012): The elasticity of taxable income
with respect to marginal tax rates: A critical review, Journal of Economic Literature, 50:
3–50.
Shaw, Jonathan, Joel B. Slemrod, and John Whiting (2010): Administration and Compliance,
In Dimensions of Tax Design. The Mirrlees Review. Oxford University Press, pages 1100–
1162.
Slemrod, Joel B., Marsha Blumenthal, and Charles W. Christian (2001): Taxpayer response
to an increased probability of audit: evidence from a controlled experiment in Minnesota,
Journal of Public Economics, 79: 455–483.
32
Slemrod, Joel B. and Shlomo Yitzhaki (2002): Tax avoidance, evasion, and administration, In
Alan J. Auerbach and Martin Feldstein, editors, Handbook of Public Economics, volume 3,
page 1423–1470. Elsevier.
Stephens, Melvin Jr. and Jennifer Ward-Batts (2004): The impact of separate taxation on the
intra-household allocation of assets: evidence from the UK, Journal of Public Economics, 88:
1989–2007.
Stiglitz, Joseph E. (1985): The General Theory of Tax Avoidance, National Tax Journal, 38:
325–338.
Thoresen, Thor O. and Annette Alstadsæter (2010): Shifts in Organizational Form under a
Dual Income Tax System, FinanzArchiv/Public Finance Analysis, 66: 384–418.
33
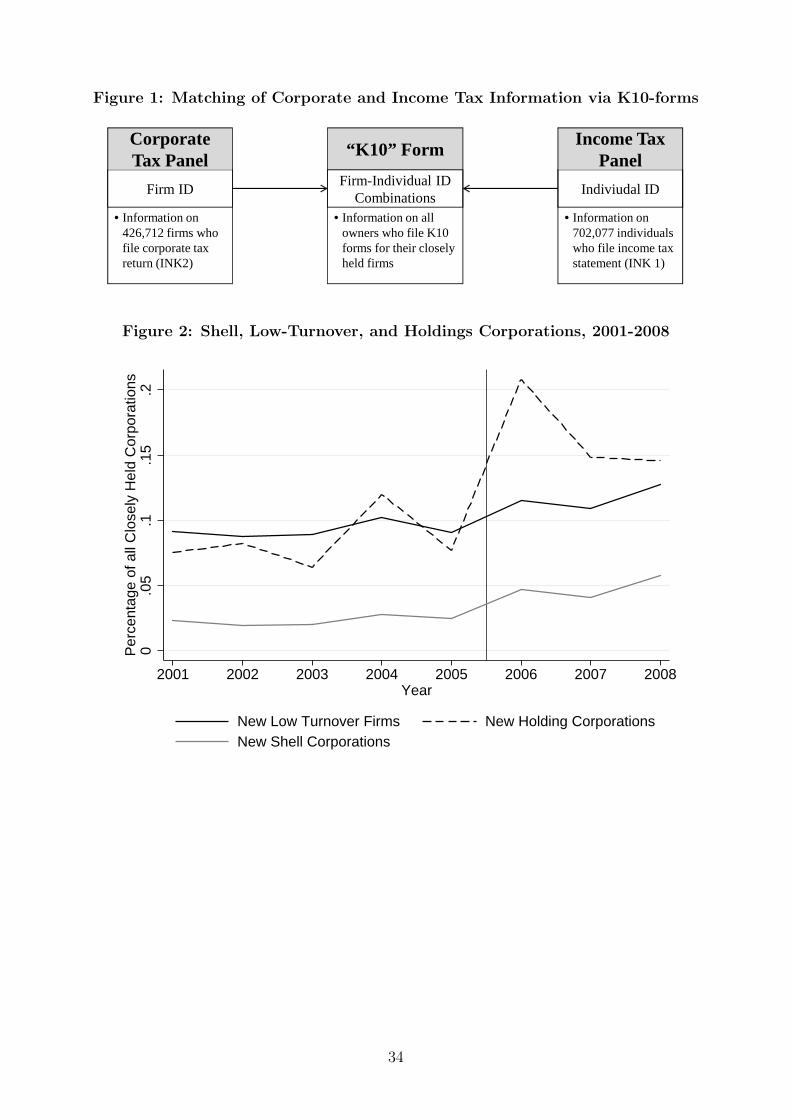
Figure 1: Matching of Corporate and Income Tax Information via K10-forms
“K10” Form
Firm IDFirm-Individual ID
CombinationsIndiviudal ID
Corporate Tax Panel
Income Tax Panel
• Information on all owners who file K10 forms for their closelyheld firms
• Information on 426,712 firms whofile corporate taxreturn (INK2)
• Information on 702,077 individualswho file income taxstatement (INK 1)
Figure 2: Shell, Low-Turnover, and Holdings Corporations, 2001-2008
0.0
5.1
.15
.2P
erce
ntag
e of
all
Clo
sely
Hel
d C
orpo
ratio
ns
2001 2002 2003 2004 2005 2006 2007 2008Year
New Low Turnover Firms New Holding CorporationsNew Shell Corporations
34
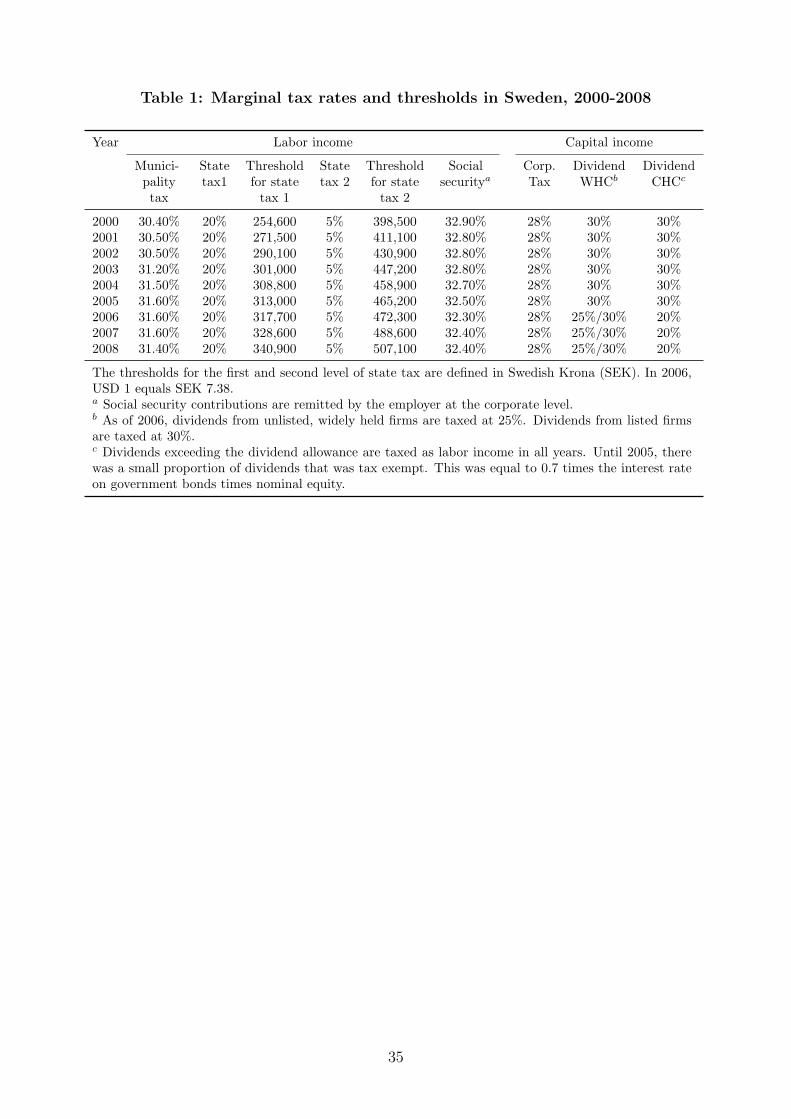
Table 1: Marginal tax rates and thresholds in Sweden, 2000-2008
Year Labor income Capital income
Munici- State Threshold State Threshold Social Corp. Dividend Dividendpality tax1 for state tax 2 for state securitya Tax WHCb CHCc
tax tax 1 tax 2
2000 30.40% 20% 254,600 5% 398,500 32.90% 28% 30% 30%2001 30.50% 20% 271,500 5% 411,100 32.80% 28% 30% 30%2002 30.50% 20% 290,100 5% 430,900 32.80% 28% 30% 30%2003 31.20% 20% 301,000 5% 447,200 32.80% 28% 30% 30%2004 31.50% 20% 308,800 5% 458,900 32.70% 28% 30% 30%2005 31.60% 20% 313,000 5% 465,200 32.50% 28% 30% 30%2006 31.60% 20% 317,700 5% 472,300 32.30% 28% 25%/30% 20%2007 31.60% 20% 328,600 5% 488,600 32.40% 28% 25%/30% 20%2008 31.40% 20% 340,900 5% 507,100 32.40% 28% 25%/30% 20%
The thresholds for the first and second level of state tax are defined in Swedish Krona (SEK). In 2006,USD 1 equals SEK 7.38.a Social security contributions are remitted by the employer at the corporate level.b As of 2006, dividends from unlisted, widely held firms are taxed at 25%. Dividends from listed firmsare taxed at 30%.c Dividends exceeding the dividend allowance are taxed as labor income in all years. Until 2005, therewas a small proportion of dividends that was tax exempt. This was equal to 0.7 times the interest rateon government bonds times nominal equity.
35
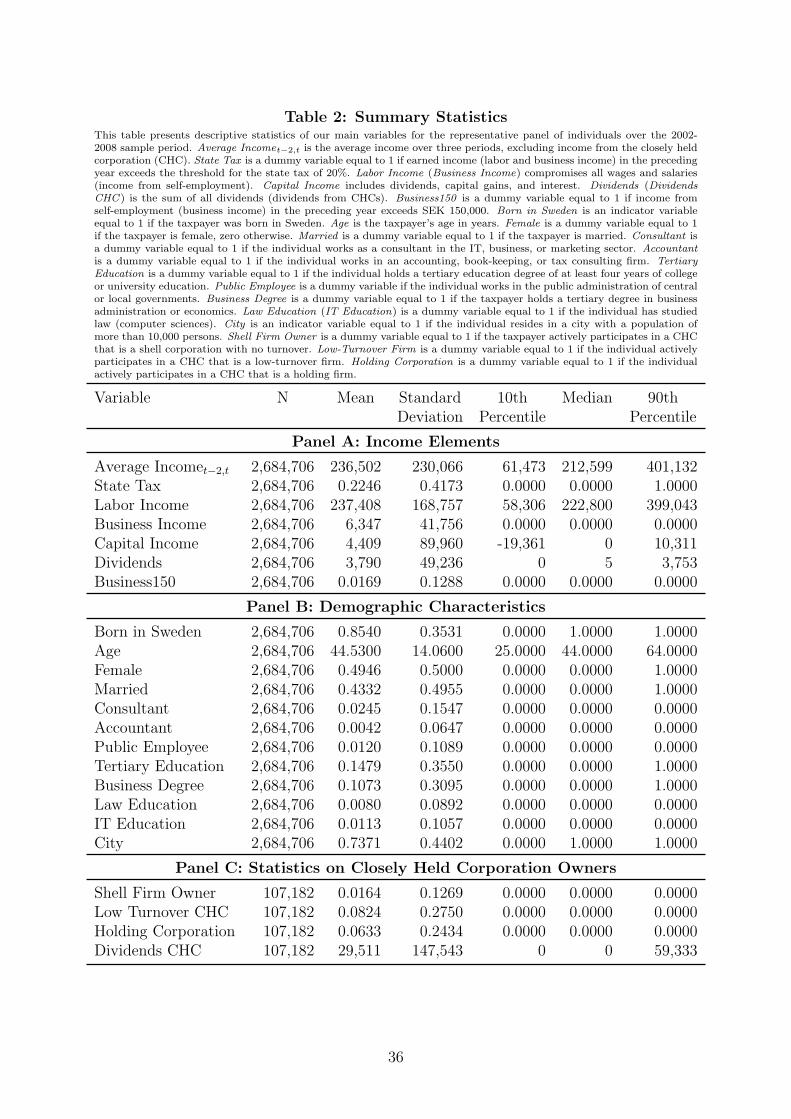
Table 2: Summary StatisticsThis table presents descriptive statistics of our main variables for the representative panel of individuals over the 2002-2008 sample period. Average Incomet−2,t is the average income over three periods, excluding income from the closely heldcorporation (CHC). State Tax is a dummy variable equal to 1 if earned income (labor and business income) in the precedingyear exceeds the threshold for the state tax of 20%. Labor Income (Business Income) compromises all wages and salaries(income from self-employment). Capital Income includes dividends, capital gains, and interest. Dividends (DividendsCHC ) is the sum of all dividends (dividends from CHCs). Business150 is a dummy variable equal to 1 if income fromself-employment (business income) in the preceding year exceeds SEK 150,000. Born in Sweden is an indicator variableequal to 1 if the taxpayer was born in Sweden. Age is the taxpayer’s age in years. Female is a dummy variable equal to 1if the taxpayer is female, zero otherwise. Married is a dummy variable equal to 1 if the taxpayer is married. Consultant isa dummy variable equal to 1 if the individual works as a consultant in the IT, business, or marketing sector. Accountantis a dummy variable equal to 1 if the individual works in an accounting, book-keeping, or tax consulting firm. TertiaryEducation is a dummy variable equal to 1 if the individual holds a tertiary education degree of at least four years of collegeor university education. Public Employee is a dummy variable if the individual works in the public administration of centralor local governments. Business Degree is a dummy variable equal to 1 if the taxpayer holds a tertiary degree in businessadministration or economics. Law Education (IT Education) is a dummy variable equal to 1 if the individual has studiedlaw (computer sciences). City is an indicator variable equal to 1 if the individual resides in a city with a population ofmore than 10,000 persons. Shell Firm Owner is a dummy variable equal to 1 if the taxpayer actively participates in a CHCthat is a shell corporation with no turnover. Low-Turnover Firm is a dummy variable equal to 1 if the individual activelyparticipates in a CHC that is a low-turnover firm. Holding Corporation is a dummy variable equal to 1 if the individualactively participates in a CHC that is a holding firm.
Variable N Mean Standard 10th Median 90thDeviation Percentile Percentile
Panel A: Income Elements
Average Incomet−2,t 2,684,706 236,502 230,066 61,473 212,599 401,132State Tax 2,684,706 0.2246 0.4173 0.0000 0.0000 1.0000Labor Income 2,684,706 237,408 168,757 58,306 222,800 399,043Business Income 2,684,706 6,347 41,756 0.0000 0.0000 0.0000Capital Income 2,684,706 4,409 89,960 -19,361 0 10,311Dividends 2,684,706 3,790 49,236 0 5 3,753Business150 2,684,706 0.0169 0.1288 0.0000 0.0000 0.0000
Panel B: Demographic Characteristics
Born in Sweden 2,684,706 0.8540 0.3531 0.0000 1.0000 1.0000Age 2,684,706 44.5300 14.0600 25.0000 44.0000 64.0000Female 2,684,706 0.4946 0.5000 0.0000 0.0000 1.0000Married 2,684,706 0.4332 0.4955 0.0000 0.0000 1.0000Consultant 2,684,706 0.0245 0.1547 0.0000 0.0000 0.0000Accountant 2,684,706 0.0042 0.0647 0.0000 0.0000 0.0000Public Employee 2,684,706 0.0120 0.1089 0.0000 0.0000 0.0000Tertiary Education 2,684,706 0.1479 0.3550 0.0000 0.0000 1.0000Business Degree 2,684,706 0.1073 0.3095 0.0000 0.0000 1.0000Law Education 2,684,706 0.0080 0.0892 0.0000 0.0000 0.0000IT Education 2,684,706 0.0113 0.1057 0.0000 0.0000 0.0000City 2,684,706 0.7371 0.4402 0.0000 1.0000 1.0000
Panel C: Statistics on Closely Held Corporation Owners
Shell Firm Owner 107,182 0.0164 0.1269 0.0000 0.0000 0.0000Low Turnover CHC 107,182 0.0824 0.2750 0.0000 0.0000 0.0000Holding Corporation 107,182 0.0633 0.2434 0.0000 0.0000 0.0000Dividends CHC 107,182 29,511 147,543 0 0 59,333
36
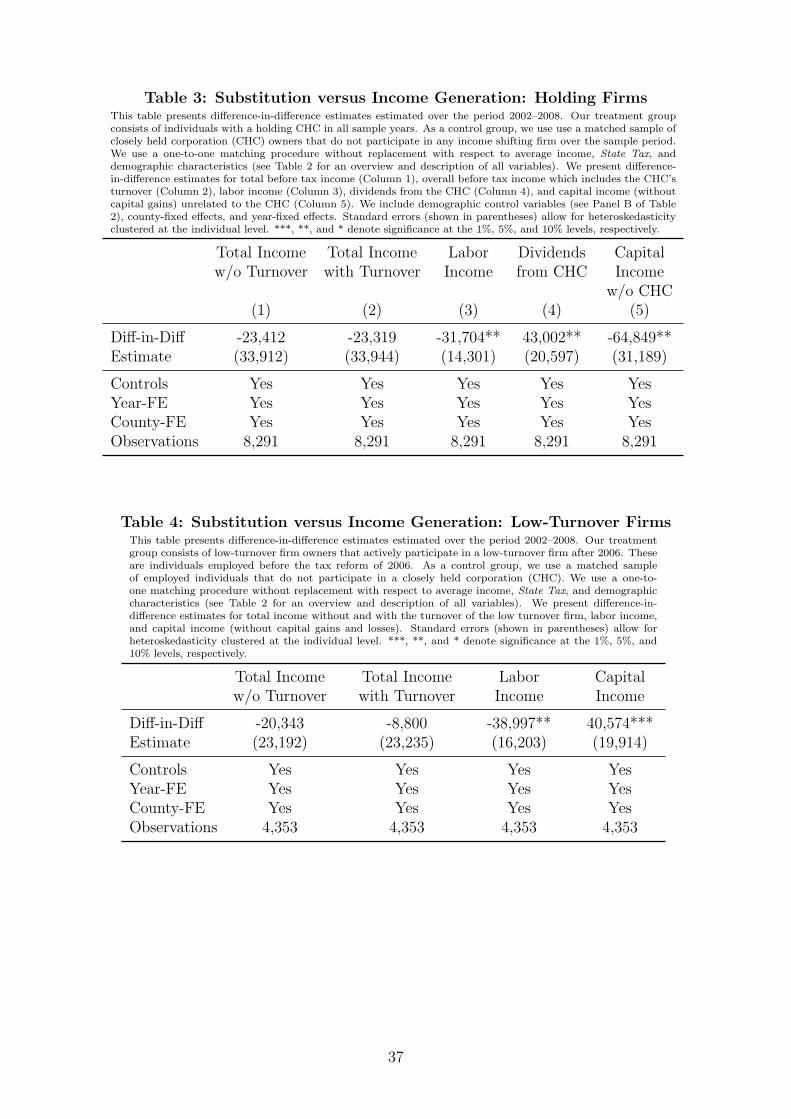
Table 3: Substitution versus Income Generation: Holding FirmsThis table presents difference-in-difference estimates estimated over the period 2002–2008. Our treatment groupconsists of individuals with a holding CHC in all sample years. As a control group, we use use a matched sample ofclosely held corporation (CHC) owners that do not participate in any income shifting firm over the sample period.We use a one-to-one matching procedure without replacement with respect to average income, State Tax, anddemographic characteristics (see Table 2 for an overview and description of all variables). We present difference-in-difference estimates for total before tax income (Column 1), overall before tax income which includes the CHC’sturnover (Column 2), labor income (Column 3), dividends from the CHC (Column 4), and capital income (withoutcapital gains) unrelated to the CHC (Column 5). We include demographic control variables (see Panel B of Table2), county-fixed effects, and year-fixed effects. Standard errors (shown in parentheses) allow for heteroskedasticityclustered at the individual level. ***, **, and * denote significance at the 1%, 5%, and 10% levels, respectively.
Total Income Total Income Labor Dividends Capitalw/o Turnover with Turnover Income from CHC Income
w/o CHC(1) (2) (3) (4) (5)
Diff-in-Diff -23,412 -23,319 -31,704** 43,002** -64,849**Estimate (33,912) (33,944) (14,301) (20,597) (31,189)
Controls Yes Yes Yes Yes YesYear-FE Yes Yes Yes Yes YesCounty-FE Yes Yes Yes Yes YesObservations 8,291 8,291 8,291 8,291 8,291
Table 4: Substitution versus Income Generation: Low-Turnover FirmsThis table presents difference-in-difference estimates estimated over the period 2002–2008. Our treatmentgroup consists of low-turnover firm owners that actively participate in a low-turnover firm after 2006. Theseare individuals employed before the tax reform of 2006. As a control group, we use a matched sampleof employed individuals that do not participate in a closely held corporation (CHC). We use a one-to-one matching procedure without replacement with respect to average income, State Tax, and demographiccharacteristics (see Table 2 for an overview and description of all variables). We present difference-in-difference estimates for total income without and with the turnover of the low turnover firm, labor income,and capital income (without capital gains and losses). Standard errors (shown in parentheses) allow forheteroskedasticity clustered at the individual level. ***, **, and * denote significance at the 1%, 5%, and10% levels, respectively.
Total Income Total Income Labor Capitalw/o Turnover with Turnover Income Income
Diff-in-Diff -20,343 -8,800 -38,997** 40,574***Estimate (23,192) (23,235) (16,203) (19,914)
Controls Yes Yes Yes YesYear-FE Yes Yes Yes YesCounty-FE Yes Yes Yes YesObservations 4,353 4,353 4,353 4,353
37
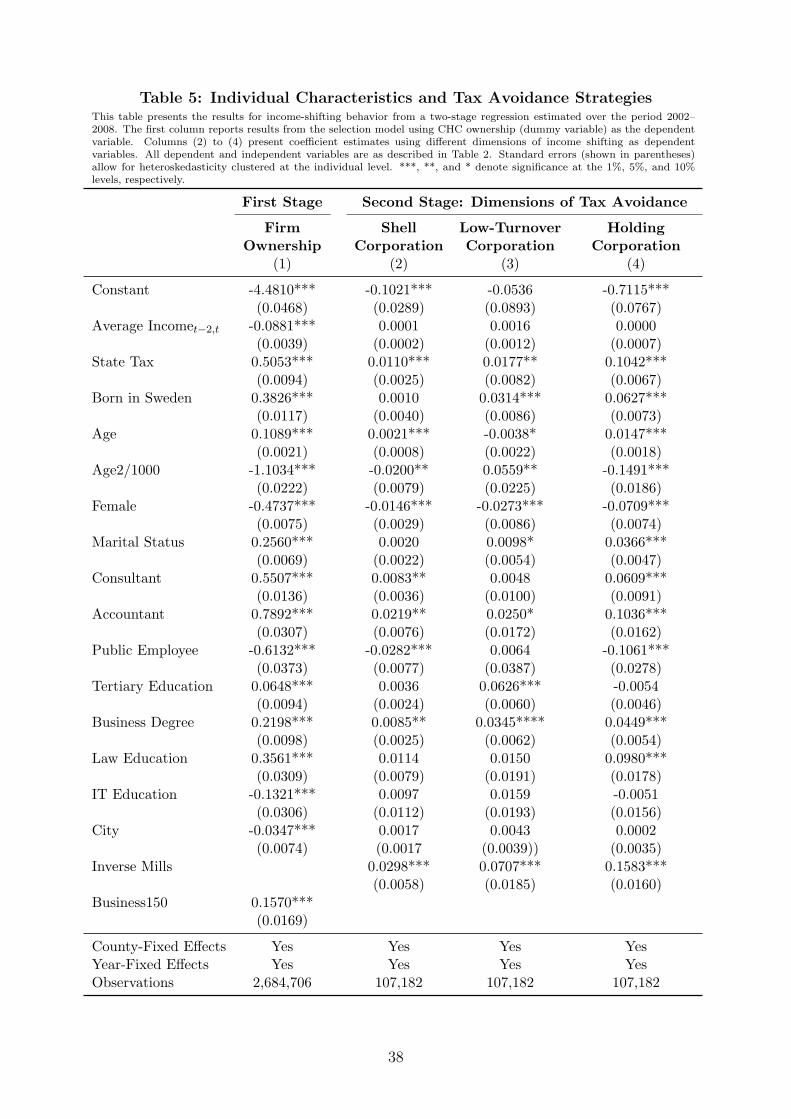
Table 5: Individual Characteristics and Tax Avoidance StrategiesThis table presents the results for income-shifting behavior from a two-stage regression estimated over the period 2002–2008. The first column reports results from the selection model using CHC ownership (dummy variable) as the dependentvariable. Columns (2) to (4) present coefficient estimates using different dimensions of income shifting as dependentvariables. All dependent and independent variables are as described in Table 2. Standard errors (shown in parentheses)allow for heteroskedasticity clustered at the individual level. ***, **, and * denote significance at the 1%, 5%, and 10%levels, respectively.
First Stage Second Stage: Dimensions of Tax Avoidance
Firm Shell Low-Turnover HoldingOwnership Corporation Corporation Corporation
(1) (2) (3) (4)
Constant -4.4810*** -0.1021*** -0.0536 -0.7115***(0.0468) (0.0289) (0.0893) (0.0767)
Average Incomet−2,t -0.0881*** 0.0001 0.0016 0.0000(0.0039) (0.0002) (0.0012) (0.0007)
State Tax 0.5053*** 0.0110*** 0.0177** 0.1042***(0.0094) (0.0025) (0.0082) (0.0067)
Born in Sweden 0.3826*** 0.0010 0.0314*** 0.0627***(0.0117) (0.0040) (0.0086) (0.0073)
Age 0.1089*** 0.0021*** -0.0038* 0.0147***(0.0021) (0.0008) (0.0022) (0.0018)
Age2/1000 -1.1034*** -0.0200** 0.0559** -0.1491***(0.0222) (0.0079) (0.0225) (0.0186)
Female -0.4737*** -0.0146*** -0.0273*** -0.0709***(0.0075) (0.0029) (0.0086) (0.0074)
Marital Status 0.2560*** 0.0020 0.0098* 0.0366***(0.0069) (0.0022) (0.0054) (0.0047)
Consultant 0.5507*** 0.0083** 0.0048 0.0609***(0.0136) (0.0036) (0.0100) (0.0091)
Accountant 0.7892*** 0.0219** 0.0250* 0.1036***(0.0307) (0.0076) (0.0172) (0.0162)
Public Employee -0.6132*** -0.0282*** 0.0064 -0.1061***(0.0373) (0.0077) (0.0387) (0.0278)
Tertiary Education 0.0648*** 0.0036 0.0626*** -0.0054(0.0094) (0.0024) (0.0060) (0.0046)
Business Degree 0.2198*** 0.0085** 0.0345**** 0.0449***(0.0098) (0.0025) (0.0062) (0.0054)
Law Education 0.3561*** 0.0114 0.0150 0.0980***(0.0309) (0.0079) (0.0191) (0.0178)
IT Education -0.1321*** 0.0097 0.0159 -0.0051(0.0306) (0.0112) (0.0193) (0.0156)
City -0.0347*** 0.0017 0.0043 0.0002(0.0074) (0.0017 (0.0039)) (0.0035)
Inverse Mills 0.0298*** 0.0707*** 0.1583***(0.0058) (0.0185) (0.0160)
Business150 0.1570***(0.0169)
County-Fixed Effects Yes Yes Yes YesYear-Fixed Effects Yes Yes Yes YesObservations 2,684,706 107,182 107,182 107,182
38
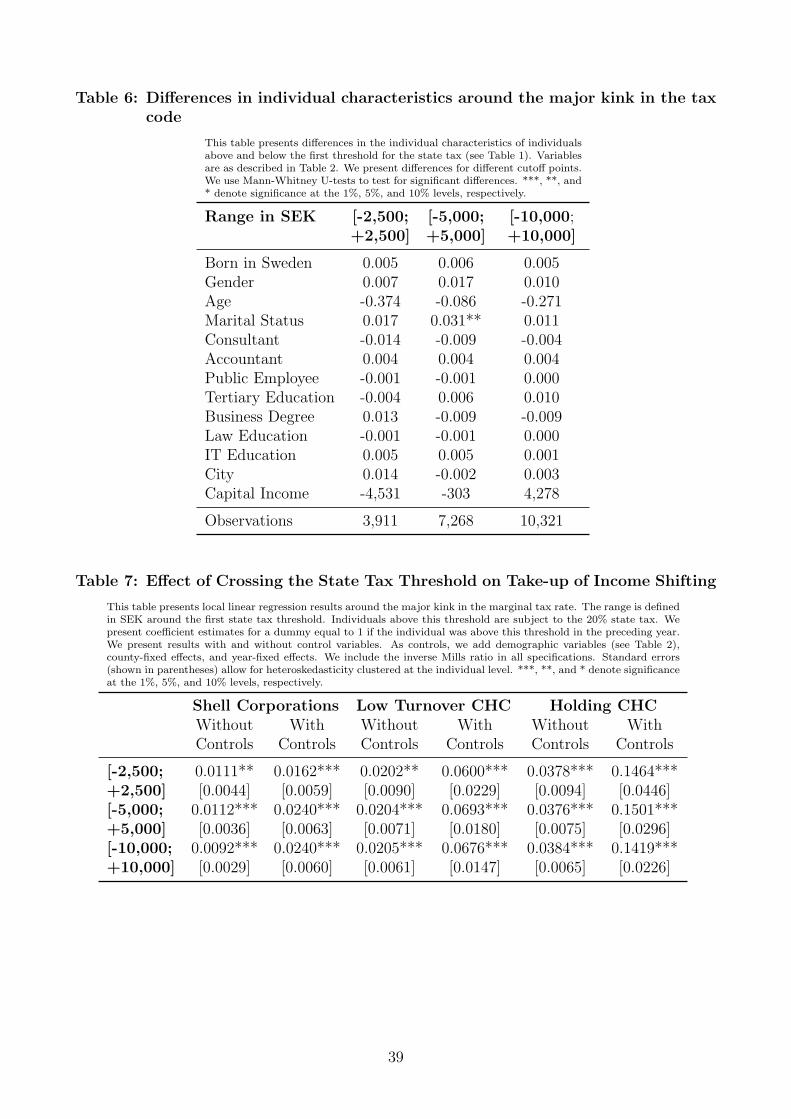
Table 6: Differences in individual characteristics around the major kink in the taxcode
This table presents differences in the individual characteristics of individualsabove and below the first threshold for the state tax (see Table 1). Variablesare as described in Table 2. We present differences for different cutoff points.We use Mann-Whitney U-tests to test for significant differences. ***, **, and* denote significance at the 1%, 5%, and 10% levels, respectively.
Range in SEK [-2,500; [-5,000; [-10,000;+2,500] +5,000] +10,000]
Born in Sweden 0.005 0.006 0.005Gender 0.007 0.017 0.010Age -0.374 -0.086 -0.271Marital Status 0.017 0.031** 0.011Consultant -0.014 -0.009 -0.004Accountant 0.004 0.004 0.004Public Employee -0.001 -0.001 0.000Tertiary Education -0.004 0.006 0.010Business Degree 0.013 -0.009 -0.009Law Education -0.001 -0.001 0.000IT Education 0.005 0.005 0.001City 0.014 -0.002 0.003Capital Income -4,531 -303 4,278
Observations 3,911 7,268 10,321
Table 7: Effect of Crossing the State Tax Threshold on Take-up of Income Shifting
This table presents local linear regression results around the major kink in the marginal tax rate. The range is definedin SEK around the first state tax threshold. Individuals above this threshold are subject to the 20% state tax. Wepresent coefficient estimates for a dummy equal to 1 if the individual was above this threshold in the preceding year.We present results with and without control variables. As controls, we add demographic variables (see Table 2),county-fixed effects, and year-fixed effects. We include the inverse Mills ratio in all specifications. Standard errors(shown in parentheses) allow for heteroskedasticity clustered at the individual level. ***, **, and * denote significanceat the 1%, 5%, and 10% levels, respectively.
Shell Corporations Low Turnover CHC Holding CHCWithout With Without With Without WithControls Controls Controls Controls Controls Controls
[-2,500; 0.0111** 0.0162*** 0.0202** 0.0600*** 0.0378*** 0.1464***+2,500] [0.0044] [0.0059] [0.0090] [0.0229] [0.0094] [0.0446][-5,000; 0.0112*** 0.0240*** 0.0204*** 0.0693*** 0.0376*** 0.1501***+5,000] [0.0036] [0.0063] [0.0071] [0.0180] [0.0075] [0.0296][-10,000; 0.0092*** 0.0240*** 0.0205*** 0.0676*** 0.0384*** 0.1419***+10,000] [0.0029] [0.0060] [0.0061] [0.0147] [0.0065] [0.0226]
39
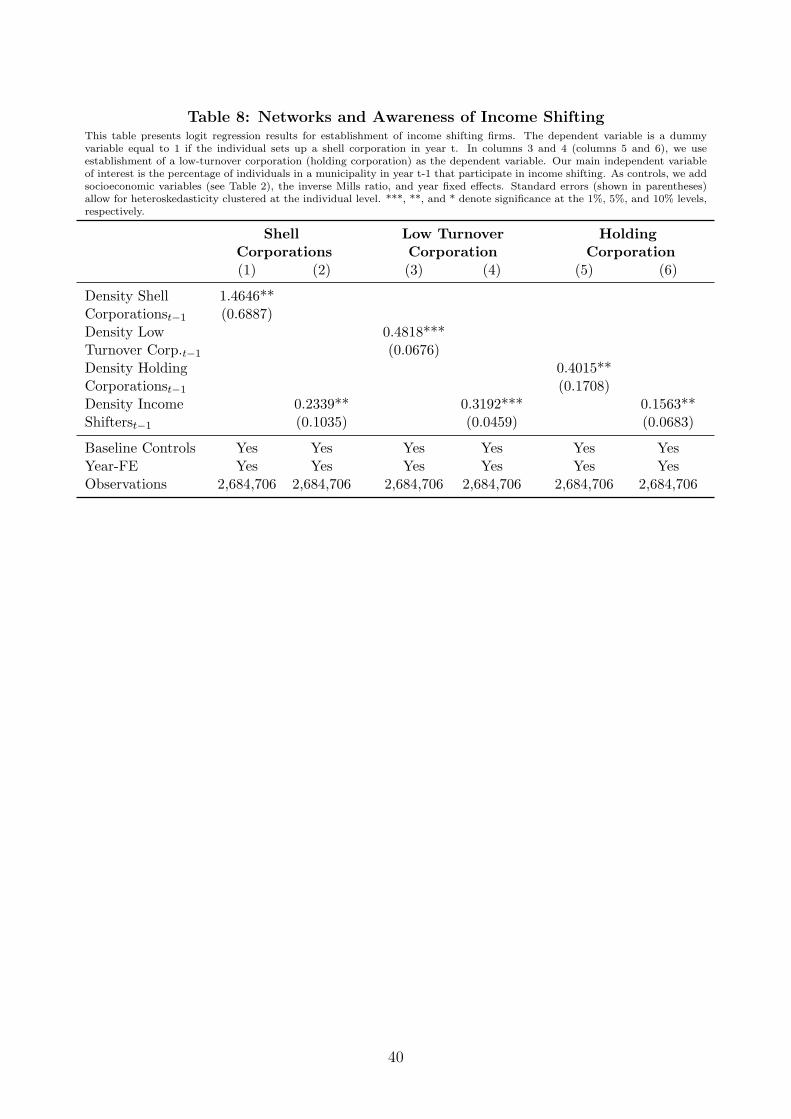
Table 8: Networks and Awareness of Income ShiftingThis table presents logit regression results for establishment of income shifting firms. The dependent variable is a dummyvariable equal to 1 if the individual sets up a shell corporation in year t. In columns 3 and 4 (columns 5 and 6), we useestablishment of a low-turnover corporation (holding corporation) as the dependent variable. Our main independent variableof interest is the percentage of individuals in a municipality in year t-1 that participate in income shifting. As controls, we addsocioeconomic variables (see Table 2), the inverse Mills ratio, and year fixed effects. Standard errors (shown in parentheses)allow for heteroskedasticity clustered at the individual level. ***, **, and * denote significance at the 1%, 5%, and 10% levels,respectively.
Shell Low Turnover HoldingCorporations Corporation Corporation(1) (2) (3) (4) (5) (6)
Density Shell 1.4646**Corporationst−1 (0.6887)Density Low 0.4818***Turnover Corp.t−1 (0.0676)Density Holding 0.4015**Corporationst−1 (0.1708)Density Income 0.2339** 0.3192*** 0.1563**Shifterst−1 (0.1035) (0.0459) (0.0683)
Baseline Controls Yes Yes Yes Yes Yes YesYear-FE Yes Yes Yes Yes Yes YesObservations 2,684,706 2,684,706 2,684,706 2,684,706 2,684,706 2,684,706
40
Impressum: Arbeitskreis Quantitative Steuerlehre, arqus, e.V. Vorstand: Prof. Dr. Ralf Maiterth (Vorsitzender), Prof. Dr. Kay Blaufus, Prof. Dr. Dr. Andreas Löffler Sitz des Vereins: Berlin Herausgeber: Kay Blaufus, Jochen Hundsdoerfer, Martin Jacob, Dirk Kiesewetter, Rolf J. König, Lutz Kruschwitz, Andreas Löffler, Ralf Maiterth, Heiko Müller, Jens Müller, Rainer Niemann, Deborah Schanz, Sebastian Schanz, Caren Sureth, Corinna Treisch Kontaktadresse: Prof. Dr. Caren Sureth, Universität Paderborn, Fakultät für Wirtschaftswissenschaften, Warburger Str. 100, 33098 Paderborn, www.arqus.info, Email: [email protected]
ISSN 1861-8944


![Thiele Plättcheninhibition prähospital · Total (95% CI)* 85/3292 105/3191 100.00 0.78 [0.58, 1.04] Test for heterogeneity: Chi² = 9.60, df = 15 (P = 0.84), I² = 0% Test for overall](https://static.fdokument.com/doc/165x107/5f7bf63d01fae364dd7d7865/thiele-plttcheninhibition-pr-total-95-ci-853292-1053191-10000-078-058.jpg)