Crystal Engineering in Nanoporous Matricesnbn:de:gbv:700... · den nanoporösen Wirtssystemen AAO...
173
Crystal Engineering in Nanoporous Matrices Dissertation zur Erlangung des akademischen Grades doctor rerum naturalium (Dr. rer. nat.) genehmigt durch Institut für Chemie neuer Materialien der Universität Osnabrück vorgelegt von Frau M. Sc. Gitte Graubner Gutachter: 1. Prof. Dr. Martin Steinhart 2. Prof. Dr. Mario Beiner Osnabrück, Oktober 2014
Transcript of Crystal Engineering in Nanoporous Matricesnbn:de:gbv:700... · den nanoporösen Wirtssystemen AAO...
Crystal Engineering
in Nanoporous Matrices
Dissertation
zur Erlangung des akademischen Grades
doctor rerum naturalium
(Dr. rer. nat.)
genehmigt durch
Institut für Chemie neuer Materialien der Universität Osnabrück
vorgelegt von
Frau M. Sc. Gitte Graubner
Gutachter:
1. Prof. Dr. Martin Steinhart
2. Prof. Dr. Mario Beiner
Osnabrück, Oktober 2014


Was man nicht aufgibt, hat man nie verloren.
Friedrich Schiller

Abstract
The topic of this PhD thesis is the systematic investigation of crystallization parameters
and their influence on nucleation and crystal growth of the two selected model
compounds acetaminophen (ACE) and n-tetracosane inside porous hosts. The materials
in the two model matrices AAO and CPG have been investigated with X-ray diffraction
(WAXS) and DSC measurements. The pore morphology of the nanoporous matrices
(interconnected-spongelike/aligned cylindrical) determines which ACE polymorphic
form crystallizes and influences the kinetics of the solid/solid transition from form III to
form II. Release of ACE having rough crystal faces oriented normal to the AAO pore
axis is nearly as fast as release of amorphous ACE. Release kinetics can be reproduced
with the Korsmeyer-Peppas model. n-Tetracosane under confinement shows a more
complex phase behavior than the high-molecular weight analogue polyethylene. The
presented work expands the available strategies for mesoscopic crystal engineering.
Kurzdarstellung des Inhalts
Thema dieser Dissertation ist die systematische Untersuchung von
Kristallisationsparametern und deren Einfluss auf Keimbildung und Kristallwachstum
in porösen Matrices von Acetaminophen (ACE) und n-Tetracosan. Die Materialien in
den nanoporösen Wirtssystemen AAO und CPG wurden neben der Kalorimetrie (DSC)
mit Streumethoden (WAXS) untersucht. So ist die Porenmorphologie der Wirtssysteme
(kontinuierlich schwammartig/parallel zylindrisch) ein wichtiger Parameter der zum
einen beeinflusst, welche polymorphe Form von ACE kristallisiert, zum anderen den
Fest/Festphasenübergang von Form III zu Form II. Eine polymorph-spezifische
Wirkstofffreisetzung von ACE aus AAO zeigt, dass die Freisetzung mit dem
Korsmeyer-Peppas-Model beschrieben werden kann. Einkapselung von ACE in AAO
verlangsamt die Wirkstofffreisetzung, beeinflusst aber nicht die Freisetzungskinetik. n-
Tetracosan in nanoporösen Systemen besitzt ein weitaus komplexeres
Kristallisationsverhalten als das vergleichbare Polymer Polyethylen. Die
vorgeschlagenen Schritte zur Beeinflussung der Kristallisation werden in dieser Arbeit
als mesoscopic crystal engineering zusammengefasst.

Contents
Motivation ...................................................................................................... i
1 State of the Art ........................................................................................ 1
1.1 Crystallization ............................................................................................................................. 1
1.1.1 Nucleation............................................................................................................................... 1
1.1.2 Structural Description of Crystals .......................................................................................... 4
1.1.3 Crystal Growth and Growth Morphology ............................................................................... 5
1.2 Polymorphism ............................................................................................................................. 9
1.3 Soft Material Confined to Nanoporous Matrices ...................................................................... 11
2 Model Systems ...................................................................................... 14
2.1 Anodic Aluminum Oxide (AAO) ............................................................................................. 14
2.2 Controlled Porous Glasses (CPG) ............................................................................................. 16
2.3 Acetaminophen (ACE) .............................................................................................................. 17
2.4 n-Alkanes: n-Tetracosane ......................................................................................................... 19
3 Experimental Section ............................................................................ 22
3.1 Sample Preparation ................................................................................................................... 22
3.2 X-ray Diffraction ...................................................................................................................... 28
3.2.1 Principles .............................................................................................................................. 28
3.2.2 Set-up X-ray Diffractometer ................................................................................................. 32
3.2.3 Texture Analysis ................................................................................................................... 34
3.2.4 Data Interpretation ................................................................................................................ 35
3.3 Thermal Analysis ...................................................................................................................... 36
3.4 Scanning Electron Microscopy ................................................................................................. 40
3.5 Electron Paramagnetic Resonance ............................................................................................ 40
4 AAO Membrane Characterization ........................................................ 41
4.1 Influence of Thermal and Water Treatment on AAO Membranes ............................................ 41
4.2 Influence of AAO Preparation on EPR signals ......................................................................... 42
5 Acetaminophen Confined to Nanoporous Matrices ............................. 46
5.1 Influence of Crystallization Parameter on ACE in AAO Membranes ...................................... 46
5.1.1 ACE in 60 nm AAO Quenched in the Presence of Bulk Material ........................................ 47
5.1.2 ACE in 60 nm AAO Cooled at 0.5 K/min in the Presence of Bulk Material ....................... 49
5.1.3 Amorphous ACE in 60 nm AAO Membranes ...................................................................... 53
5.2 Isothermal Crystallization of ACE in AAO 60 nm ................................................................... 54
5.3 ACE in Controlled Porous Glasses (CPG) ................................................................................ 57
5.4 ACE in AAO with Pore Sizes Ranging from 25 to 400 nm ...................................................... 59
5.4.1 Non-Isothermal Crystallization ............................................................................................ 60
5.4.2 Cold Crystallization (Isothermal Crystallization) ................................................................. 64
5.5 Discussion of Acetaminophen in 2D-Confinement .................................................................. 68
5.5.1 Crystallite Orientation and Crystal Growth Kinetics in AAO Membranes .......................... 69
5.5.2 Influence of Pore Sizes and Volume on Crystallization in AAO Membranes ...................... 73
5.5.3 Influence of Pore Morphology on Crystallization in Nanoporous Matrices ......................... 75
6 Release Kinetics of Acetaminophen from AAO Membranes .............. 77
6.1 Controlled Drug Release from 60 nm AAO Membranes .......................................................... 77
6.2 Controlled Drug Release from AAO with Pore Sizes Ranging from 25 to 400 nm .................. 80
6.3 Kinetic Modeling of the Drug Release ...................................................................................... 82
6.4 Encapsulation of Acetaminophen in AAO Membrane using Polymer Films ........................... 84
6.5 Discussion ................................................................................................................................. 88
7 n-Tetracosane Confined to Nanoporous Matrices ................................ 92
7.1 Crystallization of Bulk n-Tetracosane ...................................................................................... 92
7.2 n-Tetracosane in AAO Cooled at 0.5 K/min in the Presence of Bulk Material ........................ 96
7.3 Lamellar Crystals of n-Tetracosane in AAO Membranes ....................................................... 102
7.4 n-Tetracosane in AAO Cooled at 0.5 K/min in Absence of Bulk Material............................. 104
7.5 n-Tetracosane in CPG Cooled at 0.5 K/min ............................................................................ 109
7.6 Thermal Analysis of n-Tetracosane in Nanoporous Matrices ................................................. 112
7.7 Aging Behavior of n-Tetracosane in AAO Membranes .......................................................... 115
7.8 Discussion of n-Tetracosane in 2D-Confinement ................................................................... 117
7.8.1 Crystallite Orientation of Triclinic n-Tetracosane in AAO Membranes............................. 117
7.8.2 Influence of Pore Size, Bulk Surface Material, and Pore Wall Modification ..................... 119
7.8.3 Lamellar Crystals ................................................................................................................ 123
7.8.4 Rotator Phases of n-Tetracosane in AAO Membranes ....................................................... 126
7.8.5 Summary............................................................................................................................. 128
8 Conclusions and Outlook .................................................................... 130
9 Bibliography........................................................................................ 135
10 List of Figures and Tables................................................................... 144

11 Abbreviations and Symbols ................................................................ 151
11.1 Abbreviations .......................................................................................................................... 151
11.2 Symbols .................................................................................................................................. 154
Acknowledgements / Danksagung ............................................................ 155
Appendix A ............................................................................................... 157
Appendix B................................................................................................ 158
i
Motivation
During the last decade, crystallization behavior of confined material has attracted many
researchers. Investigations reveal that characteristic properties of a substance, such as
melting points, enthalpies of fusion1, or crystal orientation are affected by nanoporous
matrices. Moreover, the confinement has influence on polymorphic drug crystallization2
which has a significant importance for possible solid/solid phase transitions.
Additionally, the confinement has influence on polymorph dissolution, release kinetics,
and bioavailability3. These properties are linked to the increase of the surface-to-volume
ratio due to the decrease of pore size and hence, the resulting crystal size. Thermotropic
properties which are influenced by the size of the material can be equated with the
critical size concept described by the classical nucleation theory. This theory establishes
a nucleation barrier. As a result, the critical size must have a size at which the
unfavorable surface free energy is compensated by the volume free energy before
crystal growth occurs. In general, nucleation and crystal growth are kinetic processes.
On the other hand, the properties of confined materials are a consequence of their
thermodynamics.4
For investigation of nanosized material two host-systems are mostly used: anodic
aluminum oxide (AAO)5 with isolated, cylindrical (anisotropic) pores, and controlled
porous glasses (CPG) with interconnected, curved (isotropic) pores.6 Systematic studies
of polymorphic material in CPG matrices reveal that the stability of polymorphs
depends on the crystals size, which is consistent with Ostwald’s rule of stages.7
Additionally, isotropic nanopores can be used as matrices in order to gain knowledge
about the early stages of crystallization 7-9, or about the basic building principles of
condensed matter10. Matrices with anisotropic pores provide good opportunity to
investigate crystal orientation within the pores. For example, different kinds of
materials11-14 in isolated nanopores show a dominant growth direction parallel to the
pore axis. Furthermore, unique features such as low cost fabrication, controllable pore
structures, tailored surface chemistry, high surface area, chemical resistivity,
mechanical rigidity and pore walls, which can be modified chemically allows crystal
ii
growth manipulation, or control over crystal orientation. As a consequence,
crystallization in nanoporous matrices provides new routes to functional materials such
as ferroelectric polymers15, or liquid crystal-based devices with tunable optical, thermal,
and dielectric properties.16, 17 Investigations on confined material also have an impact on
food, pharmaceutical, explosive or dye industries.2 The use of nanopores matrices for
drug delivery applications18 is also important. Encapsulated drugs offer several
advantages; e.g., protection from degradation, drug release only under specific
conditions19, extended drug release time, or increased bioavailability of the drug20.
Nanoporous membranes with tailored properties can be used directly or can be placed in
an implant device20. In this PhD study comes together the ability to control
polymorphism, the particle size and the crystal orientation with the use of the matrices
as drug delivery carriers. Sufficient information about the crystallization conditions and
their influence on phase behavior, crystal texture, and stability of polymorphs should be
retrieved prior to drug delivery experiments. In previous studies, nanosized materials
have been used for investigations of crystal orientations or thermotropic properties.
However, little work has been done on the systematic study of the influence of
crystallization parameters on crystallization kinetics. What are those crystallization
parameters? Crystallization conditions are not only different pore morphologies (i.e.,
interconnected/isolated) but also parameters such as:
♦ pore sizes of matrices; ranging from 2 nm to 400 nm
♦ pore wall chemistry; hydrophilic or hydrophobic
♦ thermal history; isothermal, non-isothermal (cooling rates)
♦ bulk surface reservoir; present or absent
Crystallization conditions can be used as a basic for specific polymorph formation or to
study crystallization of more complex materials. In this investigation, two model
compounds have been selected.
♦ Acetaminophen, a low-molecular weight polymorphic drug, was chosen
for investigation of crystallization kinetics and polymorphic transitions in
interconnected and isolated nanopores.
iii
♦ n-Tetracosane an n-alkane family member, which exhibits a series of
rotator phase transitions between crystal and liquid phase. Further, n-
alkanes form lamellar crystals. Such crystals can have anisotropic
physical properties. n-Tetracosane may be used as model compound for
the more complex crystallization behavior of polymer materials under
confinement.
There is still an open question about the influence of crystallization parameters (e.g.,
cooling rates, in contact to bulk surface material, pore morphology) on crystallization
kinetics of material in anisotropic AAO membranes. Therefore, acetaminophen is
confined to AAO under variation of the crystallization parameters. The achieved results
will be compared with acetaminophen in CPG membranes solidified under identical
crystallization conditions and with already reported crystallization results7, 21, 22. A
nucleation and crystal growth model will be presented. Based on the results from part
one acetaminophen is encapsulated in anodic aluminum oxide and controlled drug
release experiments will be performed. Such experiments will reveal a relationship
between acetaminophen modifications and their dissolution rates from AAO
membranes. Additional studies with n-tetracosane will be done. The orientation of
lamellar crystals is also an open question as well as the behavior of rotator phases under
confinement.
Collectively, the study of the two compounds confined to nanoporous matrices will
provide a systematic description of crystal orientation and crystal growth kinetics. In
fact, the results desired from this research have an impact on the mesoscopic design of
drug delivery systems, on nanowire-based organic electronics, or on the development of
new types of phase change materials. In general, crystal engineering in nanoporous
matrices combines two different branches of the knowledge of crystallography and
chemistry. The combination of both is therefore the interplay between the structure and
properties of molecules and the resulting crystals.23
1 State of the Art
1
1 State of the Art
1.1 Crystallization
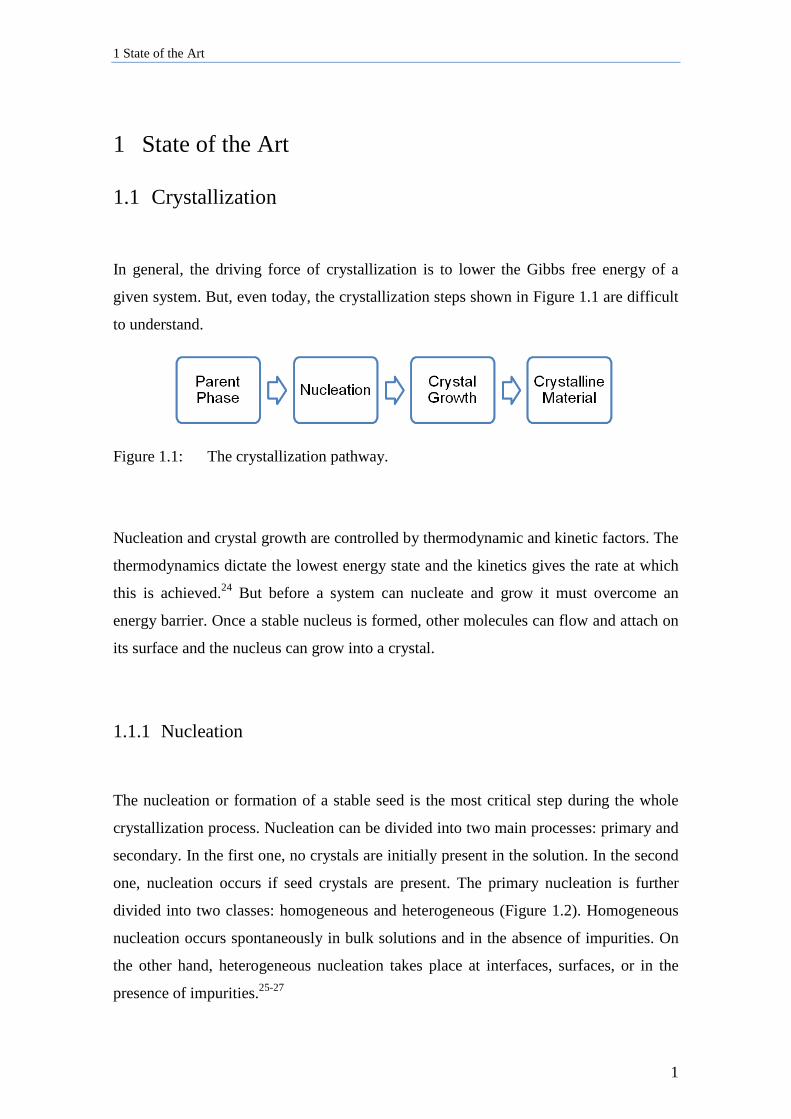
In general, the driving force of crystallization is to lower the Gibbs free energy of a
given system. But, even today, the crystallization steps shown in Figure 1.1 are difficult
to understand.
Figure 1.1: The crystallization pathway.
Nucleation and crystal growth are controlled by thermodynamic and kinetic factors. The
thermodynamics dictate the lowest energy state and the kinetics gives the rate at which
this is achieved.24 But before a system can nucleate and grow it must overcome an
energy barrier. Once a stable nucleus is formed, other molecules can flow and attach on
its surface and the nucleus can grow into a crystal.
1.1.1 Nucleation
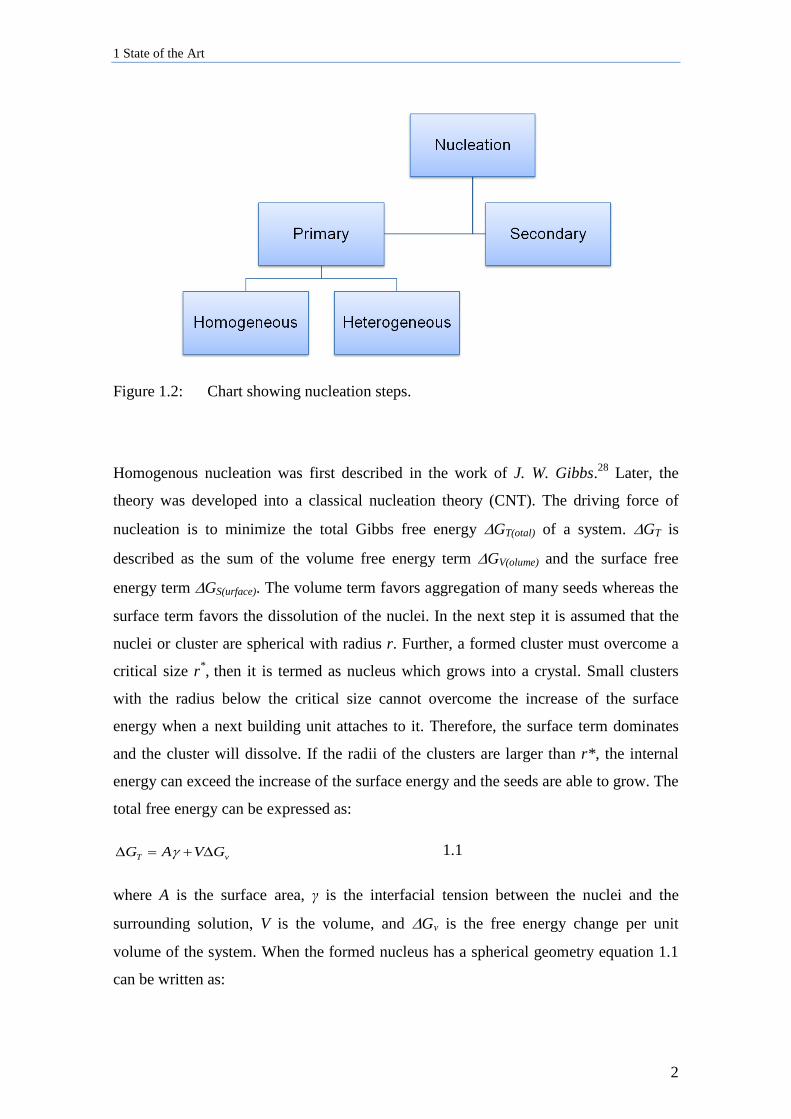
The nucleation or formation of a stable seed is the most critical step during the whole
crystallization process. Nucleation can be divided into two main processes: primary and
secondary. In the first one, no crystals are initially present in the solution. In the second
one, nucleation occurs if seed crystals are present. The primary nucleation is further
divided into two classes: homogeneous and heterogeneous (Figure 1.2). Homogeneous
nucleation occurs spontaneously in bulk solutions and in the absence of impurities. On
the other hand, heterogeneous nucleation takes place at interfaces, surfaces, or in the
presence of impurities.25-27
1 State of the Art
2
Figure 1.2: Chart showing nucleation steps.
Homogenous nucleation was first described in the work of J. W. Gibbs.28 Later, the
theory was developed into a classical nucleation theory (CNT). The driving force of
nucleation is to minimize the total Gibbs free energy ∆GT(otal) of a system. ∆GT is
described as the sum of the volume free energy term ∆GV(olume) and the surface free
energy term ∆GS(urface). The volume term favors aggregation of many seeds whereas the
surface term favors the dissolution of the nuclei. In the next step it is assumed that the
nuclei or cluster are spherical with radius r. Further, a formed cluster must overcome a
critical size r*, then it is termed as nucleus which grows into a crystal. Small clusters
with the radius below the critical size cannot overcome the increase of the surface
energy when a next building unit attaches to it. Therefore, the surface term dominates
and the cluster will dissolve. If the radii of the clusters are larger than r*, the internal
energy can exceed the increase of the surface energy and the seeds are able to grow. The
total free energy can be expressed as:
vT GVAG ∆+=∆ γ 1.1
where A is the surface area, γ is the interfacial tension between the nuclei and the
surrounding solution, V is the volume, and ∆Gν is the free energy change per unit
volume of the system. When the formed nucleus has a spherical geometry equation 1.1
can be written as:
1 State of the Art
3
volumeterm
v
msurfaceter
T GrrG ∆+=∆ 32
344 πγπ 1.2
Both terms are of opposite sign and depend differently on the size of the nucleus r.
Furthermore, when the free energy G is plotted versus the nucleus size r the total free
energy GT reaches a maximum. At the maximum, the radius of the critical cluster size r*
can be calculated by differentiating ∆G and setting 0=∆dr
Gd :
υ
γG
r∆
−=2* 1.3
Substituting equation 1.2 into 1.3 gives for the critical energy ∆G*:27
2
3*
)(316
υ
πγG
G∆
=∆ 1.4
This energy needs a system to overcome the nucleation barrier which corresponds to the
activation free energy of nucleation. For free energy change per volume can be written:
VcV STHG ∆−∆=∆ υ 1.5
where ∆HV and ∆SV are the volume enthalpy and entropy of crystallization, respectively,
and Tc is the equilibrium temperature.
The nucleation rate J can be expressed through an Arrhenius temperature dependence.
The rate gives the number of nuclei formed per time and volume unit:
∆−=
TkGAJB
*
exp 1. 6
where A is the pre-exponential factor and kB is the Boltzmann constant. Combining
equation 1.4 and the equation for the nucleation rate, the following expression is
obtained:
∆
−= 2
3
)(316exp
υ
πγGTk
AJB
1. 7
1 State of the Art
4
The equation for the homogenous nucleation rate expresses the complexity of the
nucleation process.26 Different factors such as temperature, surface tension or the degree
of supersaturation may influence the nucleation rate.
As previously mentioned, heterogeneous nucleation occurs in the presence of
impurities, dust, nucleation agents, or other crystals. It is easier to form a stable nucleus
in presence of surfaces with solid heterogeneities. Contacts to other surfaces reduce the
overall surface energies of the seeds and hence, the critical radii. As a result,
heterogeneous nucleation is easier to achieve and starts at lower supercooling than other
nucleation mechanisms. Heterogeneous nucleation can occur, for example, in cavities
under conditions in which the nucleus is normally unstable on a flat surface. In general,
the diameter of the cylindrical cavity determines which seeds can act as nuclei.27, 29
The term secondary nucleation is used when nucleation is induced by crystals. It is
known that a supersaturated solution nucleates easier when crystals are present or added
(i.e., crystal seeding).27
1.1.2 Structural Description of Crystals
After nucleation, the nuclei grow into crystals. For a better understanding it is important
to describe well the regular arrangement or symmetry of the atoms or molecules in the
crystal and to use the right termini. The description starts with the smallest or minimal
building units of a crystal which can be atoms, ions or molecules. Each of the unit
contains the same structural features and symmetry elements and can be translated in
three dimensions. The minimal block is called the unit cell of the crystal structure and
contains at least one molecule. When the unit cell is translated in the three-dimensional
space, a point lattice is formed. The size and shape of the unit cell can be defined with
three vectors a, b and c. The three vectors are the crystallographic axes of the unit cell
and have the same starting point. A vector is characterized by length and direction.
Further, a unit cell can be described with six parameters; where a, b and c are the length
of the three vectors, and α, β and γ are the angles between the vectors. The relationship
among the six parameters results in various crystal systems. Seven crystal systems are
1 State of the Art
5
enough to describe all the possibilities of the 14 point lattices termed Bravais lattices.30,
31 There are 32 possible combinations referred to as point groups. In summary the 32
point groups with the 14 Bravais lattices give 230 unique arrangements of points in
space, called space groups.
Other important concepts to keep in mind are lattice directions and crystal planes. The
lattice direction is described by three integers [uvw]. In a crystal, all symmetry
equivalent directions to [uvw] are represented by the notation wuv . The orientation
of a lattice plane can be described in a similar way with three integers referred to as
Miller indices (hkl). These indices are the reciprocal intercepts of the plane with the unit
cell axis. The notation (hkl) denotes a single plane. The symbol {hkl} specifies a set of
planes that are symmetry equivalent to (hkl). When a lattice plane is parallel to one of
the main axis, the intercept is ∞ and the Miller index is zero. For example, the (200)
lattice plane is oriented parallel to axes b and c and intercepts axis a at half-length. The
spacing between adjacent planes is described as lattice, interplanar or d-spacing dhkl.
More details can be found in references 30, 32, 33.
1.1.3 Crystal Growth and Growth Morphology
As previously mentioned, crystal growth starts when stable nuclei are larger than the
critical size. However, after nucleation, some questions arise: how to attach a building
block to a crystal surface, and then how does the crystal grow? In recent years different
crystal growth theories have been developed in order to solve these questions. At first
J.W. Gibbs suggested that the total free energy of a crystal in equilibrium would be a
minimum for a given volume at constant pressure and temperature. Therefore, during
growing, the crystal will reach a minimum of the total free surface energy. Assuming
that the volume free energy per unit volume is constant throughout the crystal then:
min=⋅∑n
iii Ga 1. 8
1 State of the Art
6
where ai is the area of the ith face of a crystal bounded by n faces, and Gi is the surface
free energy per unit area of the ith face.27
Later the Gibbs-Volmer theory based on thermodynamics explained that, when growth
units attach on the crystal face, they are not immediately bound to it. They lose one
degree of freedom but they can still move along the crystal face. This theory suggests
that the units will change into a position where attractive forces are the highest. The
Kossel model developed the Gibbs-Volmer theory and showed that growing crystal
faces have flat surfaces, steps, kinks, or edge vacancies.27 In fact, at T = 0 °C all atoms
are at the same energy level and hence, all crystal faces are energetically equal. At
higher temperatures unit blocks can interchange to energetically more favorable sites,
leaving behind vacancies or unsaturated lateral bonds with a higher energy level. When
a building block attaches at those sites, some energy is released and the crystal face
surface energy is reduced. Such sites are classified as kinked sites (K). On a kink site a
molecule is bound by three sites. But on a step site (S), molecules are only bound by
two sites, and they can move to find a lower energy kink site. In general, the crystal
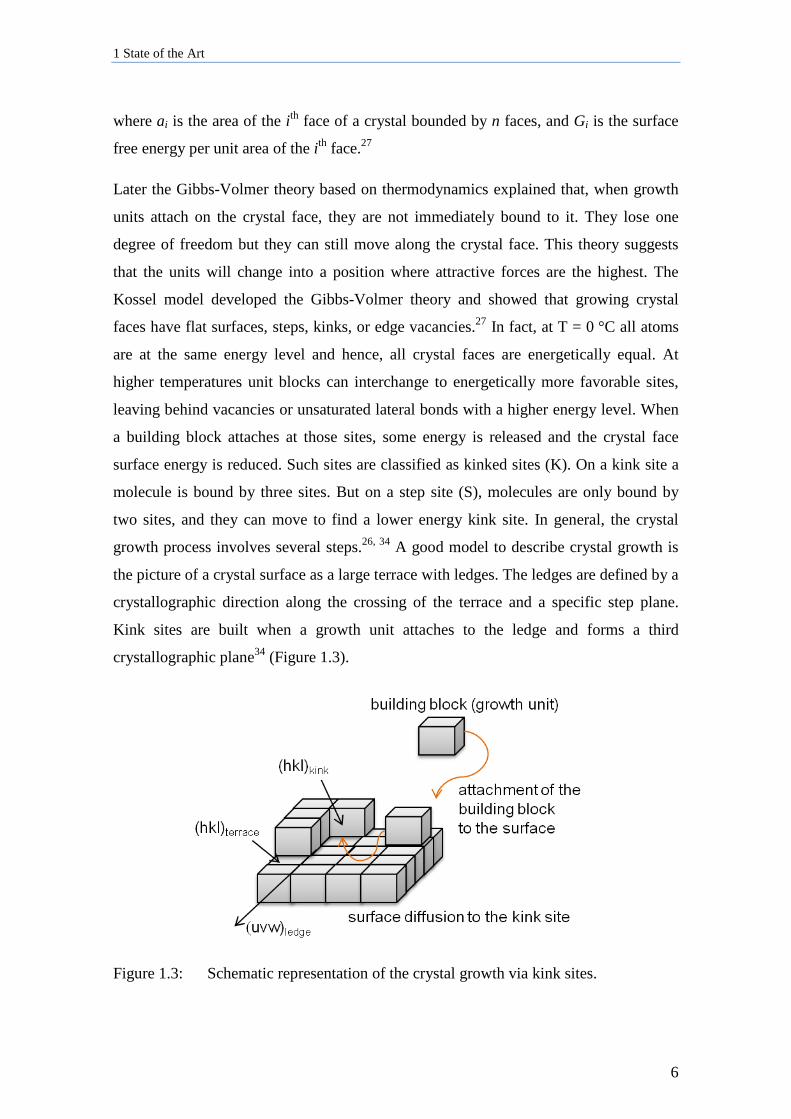
growth process involves several steps.26, 34 A good model to describe crystal growth is
the picture of a crystal surface as a large terrace with ledges. The ledges are defined by a
crystallographic direction along the crossing of the terrace and a specific step plane.
Kink sites are built when a growth unit attaches to the ledge and forms a third
crystallographic plane34 (Figure 1.3).
Figure 1.3: Schematic representation of the crystal growth via kink sites.
1 State of the Art
7
Growth entities from the bulk diffuse to the crystal surface and attach to the specific
surface. The absorbed unit can either stay there or change to a more suitable low-energy
site26. On the atomic scale crystal faces can be smoother or rougher which has a
significant influence on the crystal growth process. Rough surfaces have isotropic
properties. On the other hand, smooth surfaces have anisotropic properties and form
microscopic or macroscopic facets. The transition between the two modes is called
surface-roughening transition and can be studied with the Ising model. Surface
roughness or α-factor is an intrinsic property of the surface at equilibrium. The α-factor
can be estimated and depends on the nature of the two phases separated by the interface
and on the atomic structure of the surface.35
In general, a crystal face grows by any process that provides the fastest growth rates.
Step and kink faces grow through a rough growing, flat sites (F) via a layered growth
mechanism.36 Rough growth occurs at high supersaturation and with high growth rates.
On K faces molecules incorporate into the crystal independently of their position on the
crystal face. As a result of high growth rates, rough faces are short-living and grow into
edges or vertices. On the other hand, layered growth takes place below the surface-
roughening transition. On F faces, kink sites were only found along edges. Layered
growth is a growing process slower than rough growth. Growth units grow layer-by-
layer in a perpendicular direction to the crystal face.36
The reduction of the surface free energy is the driving force for crystal growth. The
evolution of the morphology is driven by a reduction in energy due to the minimization
of the area of high surface energy resulting in faceted crystallites. Some crystal faces
grow fast and have little or no effect on the growth shape. The crystal morphology is
governed by the slow-growing faces.27 The growth of each face is influenced by the
density of growth sites, the defects and the environmental conditions. As mentioned
before, the density of growing sites depends on the roughness of the crystal face. For
further details regarding crystal growth models, see references 27, 36.
The knowledge of the growing rates and the resulting crystal structure is important for
the pharmaceutical industry. Hence, prediction of the morphology generates remarkable
interest. For this purpose different methodologies can be used. The basic model of
prediction brings together the growth rate of a crystal face with the d-spacing dhkl and is
1 State of the Art
8
called the Bravais, Friedel, Donnay and Harker law (BFDH). The law linked the
thickness of a growth layer dhkl to the chemical bond formation and therefore, to the
growing rate. This assumption is only valid when the bonds are isotropic. In more
complex organic crystals, van der Waals interactions or hydrogen bonding must be
taken into account. Hartman and Perdok37, 38 developed a more sophisticated concept
about growth units and bonds in addition to the crystal geometry which used only in the
BFDH model. They considered the attachment energy instead of the surface energy. The
attachment energy is defined as the bond energy released when a growth unit is attached
to the surface of a crystal face.39 This theory assumes that intermolecular forces
determine the crystal morphology. Additionally, the existence of uninterrupted chains of
molecules bonded with crystal faces is identified and the theory is called the periodic
bond chain (PBC). Nowadays the Hartman-Perdok theory is known as the crystal graph.
The crystal graph is a mathematical representation of the crystal structure as an infinite
set of translationally vertices and edges.40 With the PBC theory the crystal growth
process is explained as a formation of uninterrupted bonds between growth units during
crystallization. A crystal network is built with different PBCs which have different
energies (weak or strong). The shapes of the crystals are determined by the weakest
bond; therefore, important zone directions are parallel to PBCs and contain only strong
bonds. Furthermore, two PBCs in different directions [uvw] which span the d-spacing
dhkl create a connected net with the crystallographic orientation (hkl)40.
The crystal graph or PBCs theory divides the crystal faces also into three classes: K, F,
or S faces. The F faces contain a connected net perpendicular to the reciprocal space
vector Hhkl. Note the vector Hhkl is perpendicular to the corresponding crystal face (see
Ch. 3.2.1). S faces have non-connected PBCs, and K faces have no PBCs perpendicular
to Hhkl.40 This theory is consistent with the idea that the energy of the crystal faces have
influence on the growth direction and with the idea that the time needed for bond
formation decreases as the bond energy increases. Consequently, perpendicular growth
rates of a crystal face increase when the attachment energies increase. This gives the
relationship between attachment energies E and the Gibbs free energies G, where i and j
are indices for different faces:
jiattj
atti GGEE >⇒> 1.9
1 State of the Art
9
The attachment energy Eatt can be determined as follows
atthkl
slicehkl
latt EEE += 1.10
where Elatt is the total energy of intermolecular interactions per mole in a crystal. The
slice energy Eslice is the energy released during formation of a growth layer of thickness
dhkl.26, 36 Relative growth rates of faces (hkl) are proportional to atthklE which means that,
knowing the attachment energies of all (hkl) faces, it is possible to predict the growth
morphology.40
1.2 Polymorphism
Controlling polymorphism is an important factor in crystal engineering. Polymorphism
influences the solid state properties which depend on crystal structures, and it is
common in the pharmaceutical sector, for instance in active pharmaceutical ingredients
(APIs).41 Polymorphic materials are organic or inorganic compounds and have more
than one crystal form. The crystal forms can differ in their physical and/or chemical
properties. A very good example is the polymorphism of carbon i.e., the hexagonal
graphite and the cubic diamond form. Graphite is the thermodynamically stable form at
room temperature, but the high activation barrier makes the transition rate from
diamond to graphite very slow.42 This is a well-known example showing that
thermodynamic and kinetic factors influence the stability of polymorphs. The solid/solid
transition occurs on a very slow time scale.
Polymorphic materials are classified into three types: conformational, packing, and
pseudo polymorphism. Conformational polymorphism describes the existence of
different conformers of the same molecules in different polymorphic forms. Packing
polymorphism regards how flexible molecules can fold into different three-dimensional
structures (i.e., unit cells). The crystal packing influences the crystal energy termed as
the lattice energy. The lattice energy is influenced by non-covalent interactions, such as
hydrogen bonds, van der Waals forces, π-π stacking or ionic and electrostatic
1 State of the Art
10
interactions. Hydrogen bonds and van der Waals forces (both attractive interactions) are
the major intermolecular forces in pharmaceuticals25, 43. The term pseudo polymorph is
used for a new structure, either hydrated or solvated.
The thermodynamic theory includes that crystallization is a process where the Gibbs
free energy of a system is reduced. Polymorphs can crystallize in structures with similar
lattice energy. The stability of polymorphs under the given conditions depends on its
free energies. The structure with the lowest energy is more stable for a given system.
For this reason energy-temperature phase diagrams are used in this context. These
diagrams show the relationship between the stability of polymorph forms versus the
thermodynamic variables. Further details can be found in the basic study of Burger et
al.44. Transitions from one polymorphic form to another can be classified as
enantiotropic or monotropic depending on whether one form can transform reversibly to
another or not. Enantiotropism occurs if there is a transition point e.g., two polymorphic
forms below their melting points and both forms undergo a reversible solid/solid
transition. Monotropism occurs if one of the polymorphs is always stable below the
melting points of both polymorphs.3
As previously described, the most stable polymorph will have the lowest free energy for
a given system expressed as Gibbs free energy G:
2TH
TG
T p
∆−=
∆
∂∂ 1. 11
where H is the enthalpy, S is the entropy, T is the temperature and p stands for pressure.
The equation 1.11 is useful for example when a system is changing the physical state at
constant pressure. It shows that, if the change in enthalpy of a system is known, then it
is also possible to know the change in the Gibbs free energy with temperature.33
1 State of the Art
11
1.3 Soft Material Confined to Nanoporous Matrices
The idea to use acetaminophen as a model compound for investigation of material under
confinement has been based on the research done by Rangarajan et al.7, 21, 22 and Beiner
et al.9. In those works, acetaminophen is embedded in CPG membranes and research
conducted with differential scanning calorimetry (DSC) and X-ray diffraction.
Acetaminophen, a polymorphic drug, exhibits melting point depression in CPG
consistent with the Gibbs-Thompson equation.9 Furthermore, all acetaminophen forms
(see Ch. 2.3) are achieved in CPG matrices. The commercial form I is obtained by rapid
cooling of the melt in the presence of a bulk surface film. Form III, unstable in bulk
material, is obtained in pores smaller than ~100 nm by isothermal crystallization
without a bulk surface reservoir. The metastable form II cannot be achieve in pores
smaller than 100 nm except by transformation of form III crystals via thermal cycling
procedures. In small CPG (4.6 nm pore diameter) crystallization can be suppressed in
favor of the amorphous phase.21 Systematic studies show that the transition between the
polymorphs in CPG depends on the crystal size. A thermodynamic model of polymorph
behavior under confinement is presented.
Researchers focused on anthranilic acid45 in CPG membranes ranging from 7.5 nm to
55 nm find similar results. The preference for the metastable form in smaller pore sizes
is explained with a smaller critical nucleus size as compared to the other
thermodynamic stable polymorphic forms. The same is reported when ROY45 is
crystallized in cylindrical pores of nanoporous polymer monoliths. Additionally to the
selective polymorph formation the material shows pronounced oriented crystallization
in the polymer monoliths.
Crystallization studies of organic compounds46, 47, 8 in CPG membranes or porous
diblock copolymer monoliths reveal a melting point decreasing with decreasing pore
sizes, consistent with the increasing surface-to-volume ratio of the crystals.
Apart from the investigation of thermotropic properties, the uniaxial crystal growth in
straight cylindrical pores has also attracted many researchers in the last few years.
Mostly polymorphic organic and polymeric materials display highly oriented crystal
1 State of the Art
12
growth. For example, linear polyethylene in straight alumina nanopores13, or linear 1-
alcohols48 in mesoporous silicon show, that the molecular long axes are oriented normal
to the pore axis. The material tends to grow with their fast-growth direction(s) parallel
to the nanopores axis.
Cylindrical alumina nanopores have been used for investigation of the ferroelectric
properties of PVDF-TrFE15. After crystallization, highly oriented crystals in the high
temperature paraelectric phase are observed; the subsequent transition to the
ferroelectric phases goes along with the loss of orientation. Isotactic poly(propylene)49
in alumina nanopores reveals a transition from heterogeneous to homogeneous
nucleation in dependence to pore size decrease. Crystallization is suppressed in pores
below 20 nm.
Rodlike liquid crystals17 in anodic aluminum oxide membranes (AAO) show phase
transition suppression. The nematic-to-isotropic and the crystal-to-nematic transition
temperatures reduce linearly with the inverse of the pore diameter. The crystalline phase
is suppressed in smaller pores which gives access to the critical nucleus size. Discotic
liquid crystals16 in AAO membranes show a uniform alignment of the columnar axis.
An optimal stacking of the aromatic cores allows the charge carrier mobility along such
columnar axis. For applications as active semiconductors knowledge about the exact
phase form and about the uniform columnar arrangement is essential. This is why the
study of the material orientation in nanoporous matrices is so relevant.
Linear hydrocarbons named n-alkanes50 in mesoporous silicon with straight aligned
pores form lamellar crystals. In the lamellar structure the molecular long axes of the n-
alkanes are oriented normal to the pore axis. n-Alkanes51 are also infiltrated in matrices
with changed pore chemistry. Polytetrafluoroethylene (PTFE) has hydrophobic
interconnected nanopores; in contrast Anopore has separated hydrophilic pores. For
example, the phase transitions RII→RI and RI→RV of n-tetracosane change to a second
order mechanism in such pores. Crystallization behavior of hentetracontane52 in
nanoporous alumina membranes with different surface energies has also been
investigated. This study reports that the crystallization and the crystal orientation are
influenced by the degree of confinement and the nature of the membrane surface. n-
Alkanes in porous SBA-15 and in CPG membranes show differences in phase behavior
1 State of the Art
13
and an influence of the CPG pore size of the molecule arrangement.53 Recently, a
published article54 summarizes the crystallization features of n-alkanes under
confinement. The authors underline that the studies of n-alkanes can help to understand
the more complex work with polymers.
2 Model Systems
14
2 Model Systems
2.1 Anodic Aluminum Oxide (AAO)
Anodic aluminum oxide (AAO) is widely used as an inorganic model matrix. The
matrix contains isolated, straight cylindrical nanopores. The nanopores are uniform in
length and have a narrow size distribution. Such highly ordered aluminum oxide or
alumina structures are achieved by a two-step mild anodization (MA) process. The
procedure was first reported in the work of Masuda et al.5, 55. In the first anodization
step a disordered porous alumina layer grows on the aluminum surface and self-
assembles into a hexagonal lattice. The alumina layer is subsequently etched away by a
wet-chemical step. The remaining aluminum layer is patterned with hexagonal arrays of
alumina. In the second step well-ordered nanopores grow on these arrays.56-58 The
interpore distance Dint, the pore diameter/size Dp, and the pore depth Tp are controlled
by the choice of electrolyte such as oxalic, sulfuric or phosphoric acid and the
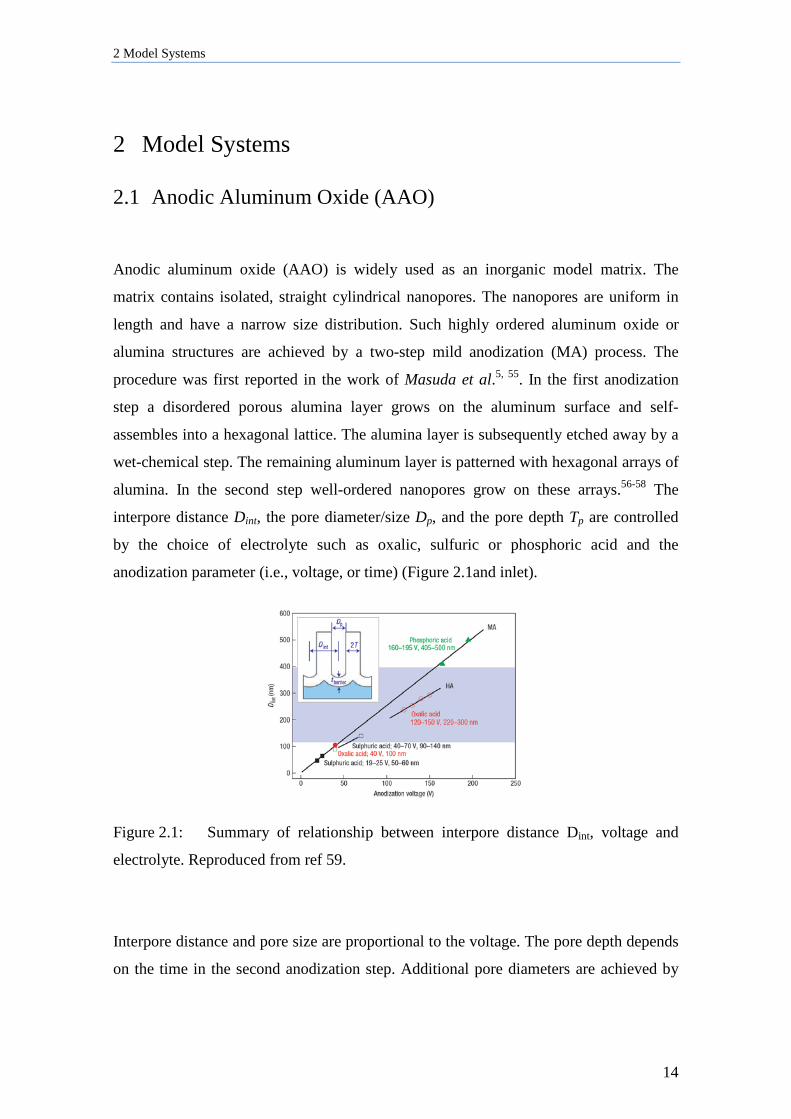
anodization parameter (i.e., voltage, or time) (Figure 2.1and inlet).
Figure 2.1: Summary of relationship between interpore distance Dint, voltage and
electrolyte. Reproduced from ref 59.
Interpore distance and pore size are proportional to the voltage. The pore depth depends
on the time in the second anodization step. Additional pore diameters are achieved by
2 Model Systems
15
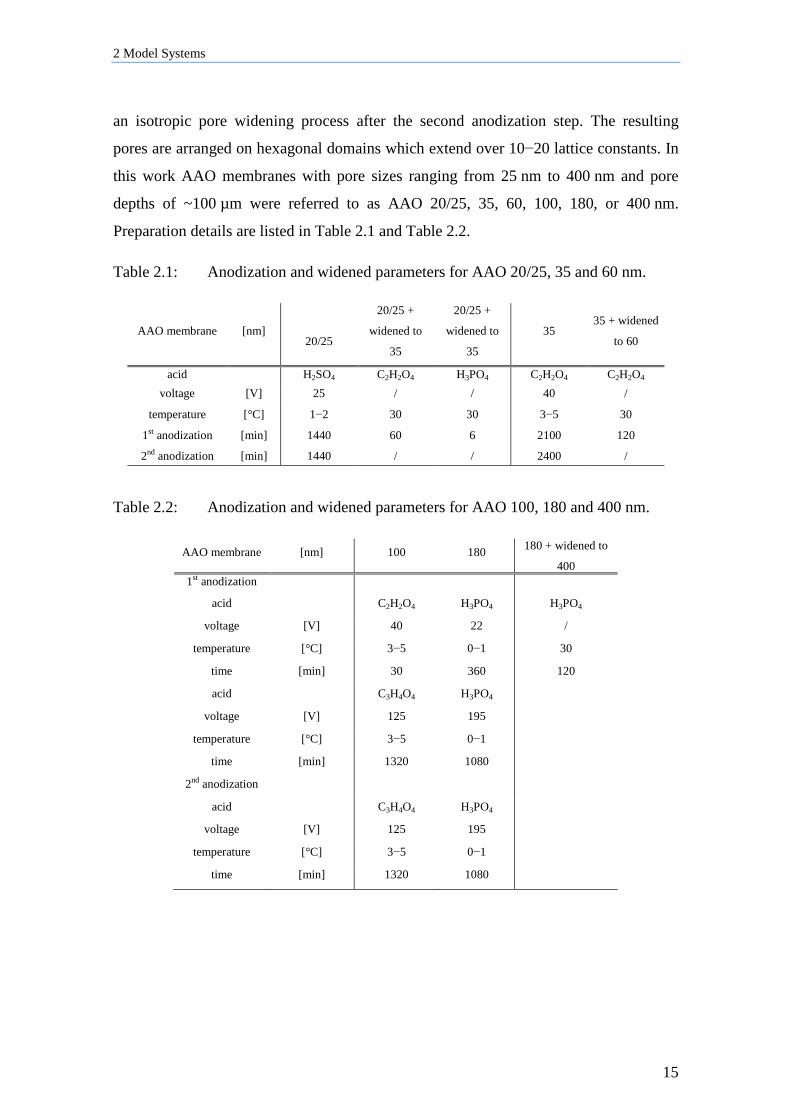
an isotropic pore widening process after the second anodization step. The resulting
pores are arranged on hexagonal domains which extend over 10−20 lattice constants. In
this work AAO membranes with pore sizes ranging from 25 nm to 400 nm and pore
depths of ~100 µm were referred to as AAO 20/25, 35, 60, 100, 180, or 400 nm.
Preparation details are listed in Table 2.1 and Table 2.2.
Table 2.1: Anodization and widened parameters for AAO 20/25, 35 and 60 nm.
AAO membrane [nm]
20/25
20/25 +
widened to
35
20/25 +
widened to
35
35 35 + widened
to 60
acid
H2SO4 C2H2O4 H3PO4 C2H2O4 C2H2O4 voltage [V] 25 / / 40 /
temperature [°C] 1−2 30 30 3−5 30
1st anodization [min] 1440 60 6 2100 120
2nd anodization [min]
1440 / / 2400 /
Table 2.2: Anodization and widened parameters for AAO 100, 180 and 400 nm.
AAO membrane [nm] 100 180 180 + widened to
400 1st anodization
acid
C2H2O4 H3PO4 H3PO4
voltage [V] 40 22 /
temperature [°C] 3−5 0−1 30
time [min] 30 360 120
acid
C3H4O4 H3PO4
voltage [V] 125 195
temperature [°C] 3−5 0−1
time [min] 1320 1080
2nd anodization
acid
C3H4O4 H3PO4
voltage [V] 125 195
temperature [°C] 3−5 0−1
time [min] 1320 1080
2 Model Systems
16
2.2 Controlled Porous Glasses (CPG)
The second used model matrices are controlled porous glasses (CPG). They have a
bicontinuous morphology and contain interconnected, curved nanopores with narrow
pore size distribution. Porous glasses are leaching products of phase-separated alkali
borosilicate glasses. The textural properties such as surface area, pore volume, and
porosity are well investigated. The parameters are estimated based on mercury intrusion
and nitrogen absorption and are listed in Table 2.3. Further details can be found in the
study of Enke et al.6. Used CPG membranes had pore diameters ranging from 2 nm to
60 nm. The samples were hereinafter referred to as CPG 2, 25, or 60 nm, respectively.
Table 2.3: Textural properties of CPG membranes.
pore diameter internal surface area specific pore volume porosity
[nm] [m2 g-1] [cm3 g-1] [%]
60 25.9 0.364 41
25 102 0.366 42
2 271 0.113
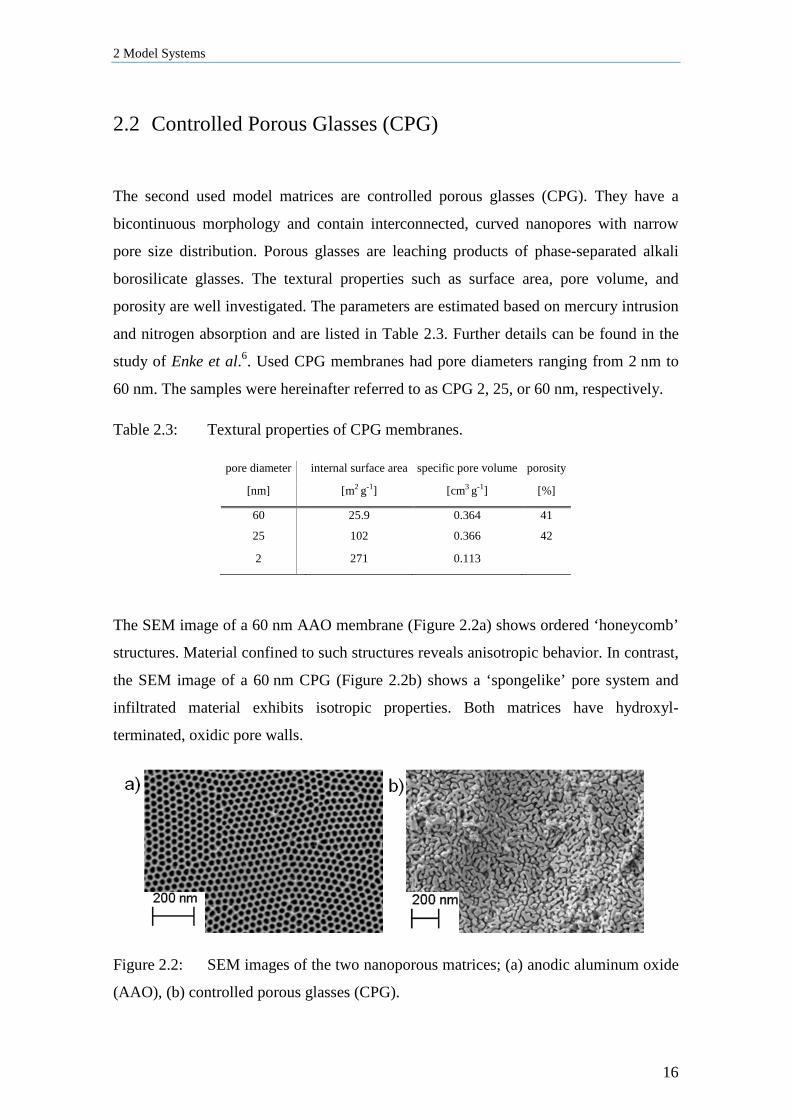
The SEM image of a 60 nm AAO membrane (Figure 2.2a) shows ordered ‘honeycomb’
structures. Material confined to such structures reveals anisotropic behavior. In contrast,
the SEM image of a 60 nm CPG (Figure 2.2b) shows a ‘spongelike’ pore system and
infiltrated material exhibits isotropic properties. Both matrices have hydroxyl-
terminated, oxidic pore walls.
Figure 2.2: SEM images of the two nanoporous matrices; (a) anodic aluminum oxide
(AAO), (b) controlled porous glasses (CPG).
2 Model Systems
17
2.3 Acetaminophen (ACE)
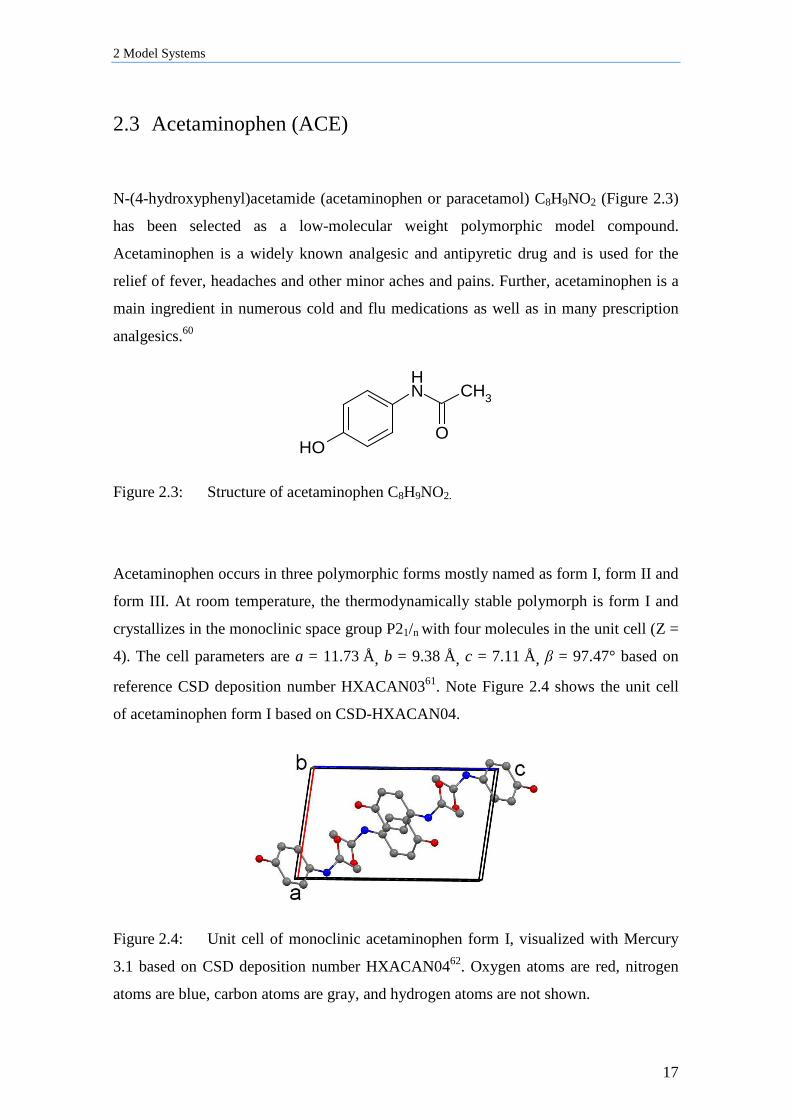
N-(4-hydroxyphenyl)acetamide (acetaminophen or paracetamol) C8H9NO2 (Figure 2.3)
has been selected as a low-molecular weight polymorphic model compound.
Acetaminophen is a widely known analgesic and antipyretic drug and is used for the
relief of fever, headaches and other minor aches and pains. Further, acetaminophen is a
main ingredient in numerous cold and flu medications as well as in many prescription
analgesics.60
OH
NH
CH3
O
Figure 2.3: Structure of acetaminophen C8H9NO2.
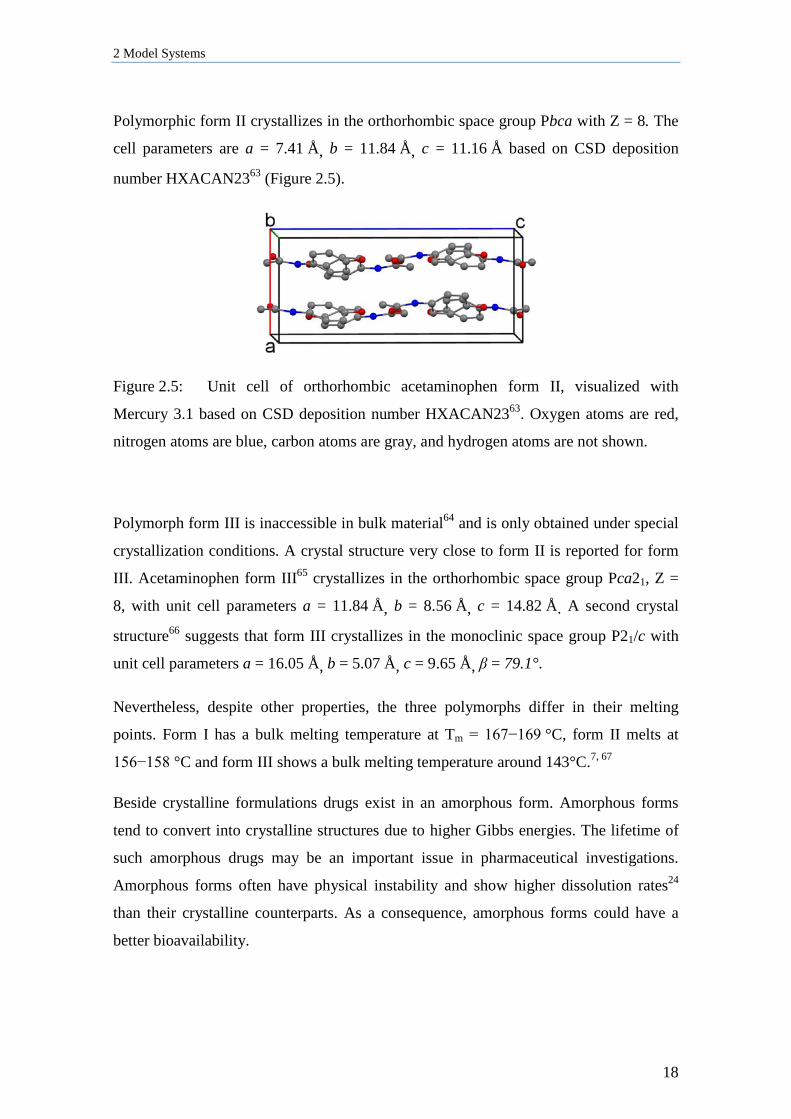
Acetaminophen occurs in three polymorphic forms mostly named as form I, form II and
form III. At room temperature, the thermodynamically stable polymorph is form I and
crystallizes in the monoclinic space group P21/n with four molecules in the unit cell (Z =
4). The cell parameters are a = 11.73 Å, b = 9.38 Å, c = 7.11 Å, β = 97.47° based on
reference CSD deposition number HXACAN0361. Note Figure 2.4 shows the unit cell
of acetaminophen form I based on CSD-HXACAN04.
Figure 2.4: Unit cell of monoclinic acetaminophen form I, visualized with Mercury
3.1 based on CSD deposition number HXACAN0462. Oxygen atoms are red, nitrogen
atoms are blue, carbon atoms are gray, and hydrogen atoms are not shown.
2 Model Systems
18
Polymorphic form II crystallizes in the orthorhombic space group Pbca with Z = 8. The
cell parameters are a = 7.41 Å, b = 11.84 Å, c = 11.16 Å based on CSD deposition
number HXACAN2363 (Figure 2.5).
Figure 2.5: Unit cell of orthorhombic acetaminophen form II, visualized with
Mercury 3.1 based on CSD deposition number HXACAN2363. Oxygen atoms are red,
nitrogen atoms are blue, carbon atoms are gray, and hydrogen atoms are not shown.
Polymorph form III is inaccessible in bulk material64 and is only obtained under special
crystallization conditions. A crystal structure very close to form II is reported for form
III. Acetaminophen form III65 crystallizes in the orthorhombic space group Pca21, Z =
8, with unit cell parameters a = 11.84 Å, b = 8.56 Å, c = 14.82 Å. A second crystal
structure66 suggests that form III crystallizes in the monoclinic space group P21/c with
unit cell parameters a = 16.05 Å, b = 5.07 Å, c = 9.65 Å, β = 79.1°.
Nevertheless, despite other properties, the three polymorphs differ in their melting
points. Form I has a bulk melting temperature at Tm = 167−169 °C, form II melts at
156−158 °C and form III shows a bulk melting temperature around 143°C.7, 67
Beside crystalline formulations drugs exist in an amorphous form. Amorphous forms
tend to convert into crystalline structures due to higher Gibbs energies. The lifetime of
such amorphous drugs may be an important issue in pharmaceutical investigations.
Amorphous forms often have physical instability and show higher dissolution rates24
than their crystalline counterparts. As a consequence, amorphous forms could have a
better bioavailability.
2 Model Systems
19
2.4 n-Alkanes: n-Tetracosane
n-Tetracosane, chosen as the second model compound, is a member of the normal
alkanes family. Normal alkanes or short n-alkanes are some of the simplest organic
molecules, but the main building blocks of lipids, surfactants, liquid crystals or
polymers. n-Alkanes are also common materials in applied science. They are the basic
constituents of crude petroleum or pharmaceuticals.68 Crystallization of n-alkanes have
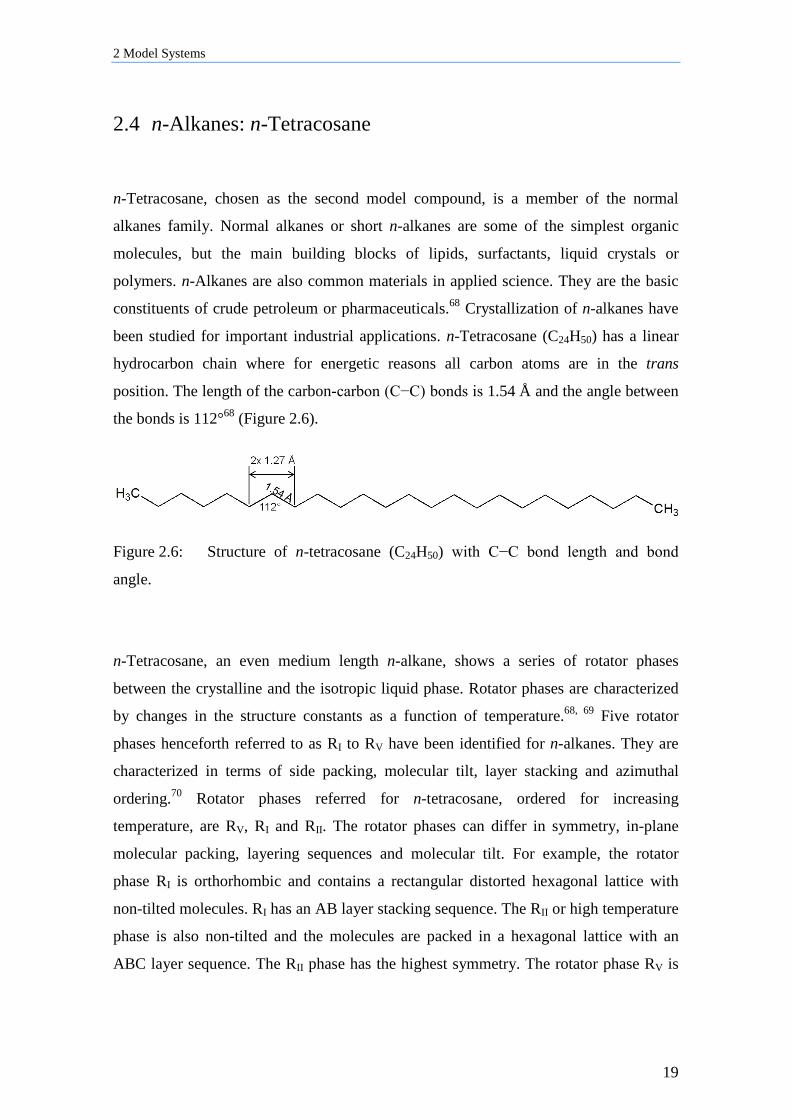
been studied for important industrial applications. n-Tetracosane (C24H50) has a linear
hydrocarbon chain where for energetic reasons all carbon atoms are in the trans
position. The length of the carbon-carbon (C−C) bonds is 1.54 Å and the angle between
the bonds is 112°68 (Figure 2.6).
Figure 2.6: Structure of n-tetracosane (C24H50) with C−C bond length and bond
angle.
n-Tetracosane, an even medium length n-alkane, shows a series of rotator phases
between the crystalline and the isotropic liquid phase. Rotator phases are characterized
by changes in the structure constants as a function of temperature.68, 69 Five rotator
phases henceforth referred to as RI to RV have been identified for n-alkanes. They are
characterized in terms of side packing, molecular tilt, layer stacking and azimuthal
ordering.70 Rotator phases referred for n-tetracosane, ordered for increasing
temperature, are RV, RI and RII. The rotator phases can differ in symmetry, in-plane
molecular packing, layering sequences and molecular tilt. For example, the rotator
phase RI is orthorhombic and contains a rectangular distorted hexagonal lattice with
non-tilted molecules. RI has an AB layer stacking sequence. The RII or high temperature
phase is also non-tilted and the molecules are packed in a hexagonal lattice with an
ABC layer sequence. The RII phase has the highest symmetry. The rotator phase RV is
2 Model Systems
20
like RI but the molecules are tilted.51, 68, 69 The rotator phase sequence with
corresponding temperatures is shown in Figure 2.7.
Figure 2.7: Phase transitions temperatures of n-tetracosane: triclinic to rotator phase
(triclinic→RV), rotator to rotator phase (RV→RI, RI→RII), and rotator to liquid phase
(RII→melt). Reproduced from ref 69.
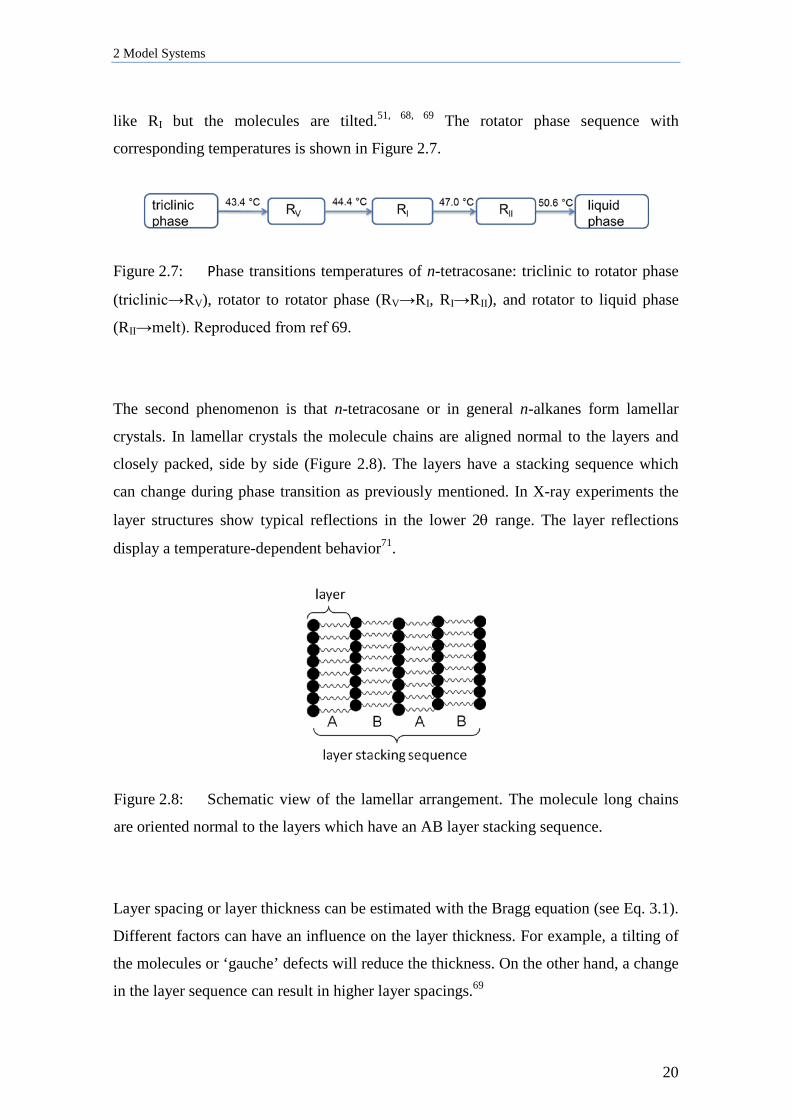
The second phenomenon is that n-tetracosane or in general n-alkanes form lamellar
crystals. In lamellar crystals the molecule chains are aligned normal to the layers and
closely packed, side by side (Figure 2.8). The layers have a stacking sequence which
can change during phase transition as previously mentioned. In X-ray experiments the
layer structures show typical reflections in the lower 2θ range. The layer reflections
display a temperature-dependent behavior71.
Figure 2.8: Schematic view of the lamellar arrangement. The molecule long chains
are oriented normal to the layers which have an AB layer stacking sequence.
Layer spacing or layer thickness can be estimated with the Bragg equation (see Eq. 3.1).
Different factors can have an influence on the layer thickness. For example, a tilting of
the molecules or ‘gauche’ defects will reduce the thickness. On the other hand, a change
in the layer sequence can result in higher layer spacings.69
2 Model Systems
21
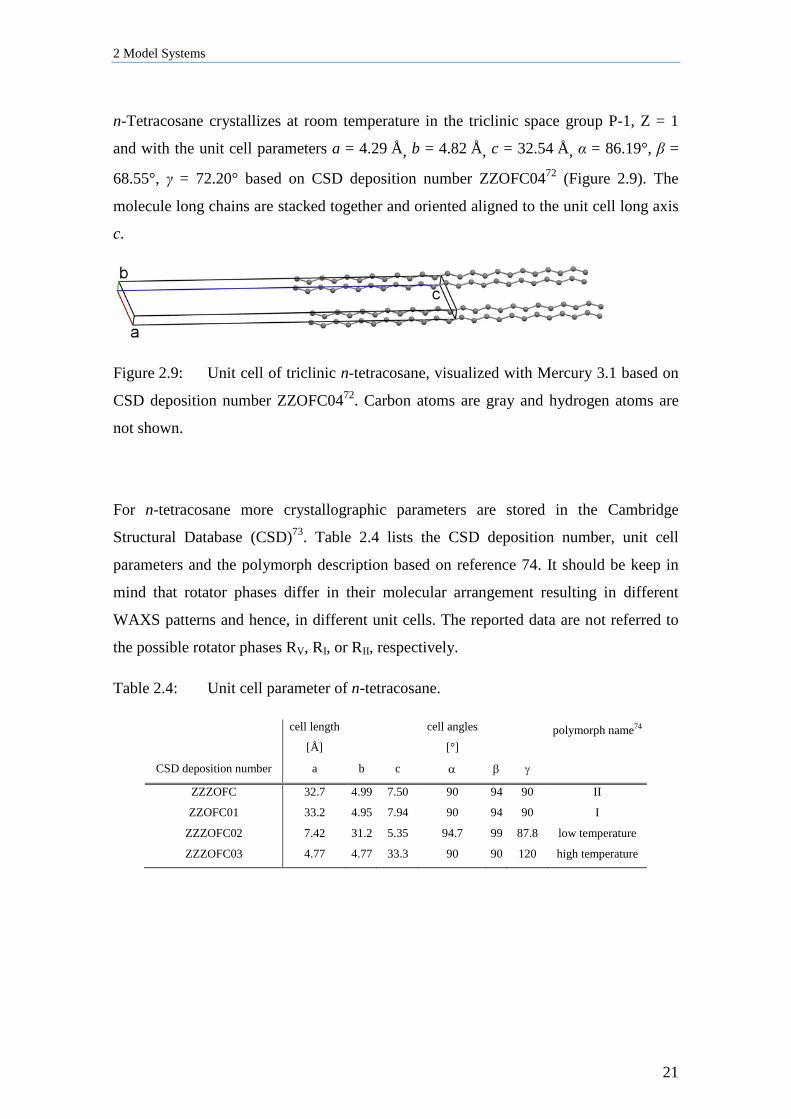
n-Tetracosane crystallizes at room temperature in the triclinic space group P-1, Z = 1
and with the unit cell parameters a = 4.29 Å, b = 4.82 Å, c = 32.54 Å, α = 86.19°, β =
68.55°, γ = 72.20° based on CSD deposition number ZZOFC0472 (Figure 2.9). The
molecule long chains are stacked together and oriented aligned to the unit cell long axis
c.
Figure 2.9: Unit cell of triclinic n-tetracosane, visualized with Mercury 3.1 based on
CSD deposition number ZZOFC0472. Carbon atoms are gray and hydrogen atoms are
not shown.
For n-tetracosane more crystallographic parameters are stored in the Cambridge
Structural Database (CSD)73. Table 2.4 lists the CSD deposition number, unit cell
parameters and the polymorph description based on reference 74. It should be keep in
mind that rotator phases differ in their molecular arrangement resulting in different
WAXS patterns and hence, in different unit cells. The reported data are not referred to
the possible rotator phases RV, RI, or RII, respectively.
Table 2.4: Unit cell parameter of n-tetracosane.
cell length
[Å]
cell angles
[°] polymorph name74
CSD deposition number a b c α β γ
ZZZOFC 32.7 4.99 7.50 90 94 90 II
ZZOFC01 33.2 4.95 7.94 90 94 90 I
ZZZOFC02 7.42 31.2 5.35 94.7 99 87.8 low temperature
ZZZOFC03 4.77 4.77 33.3 90 90 120 high temperature
3 Experimental Section
22
3 Experimental Section
3.1 Sample Preparation (1) AAO Pore Wall Modification with ODPA
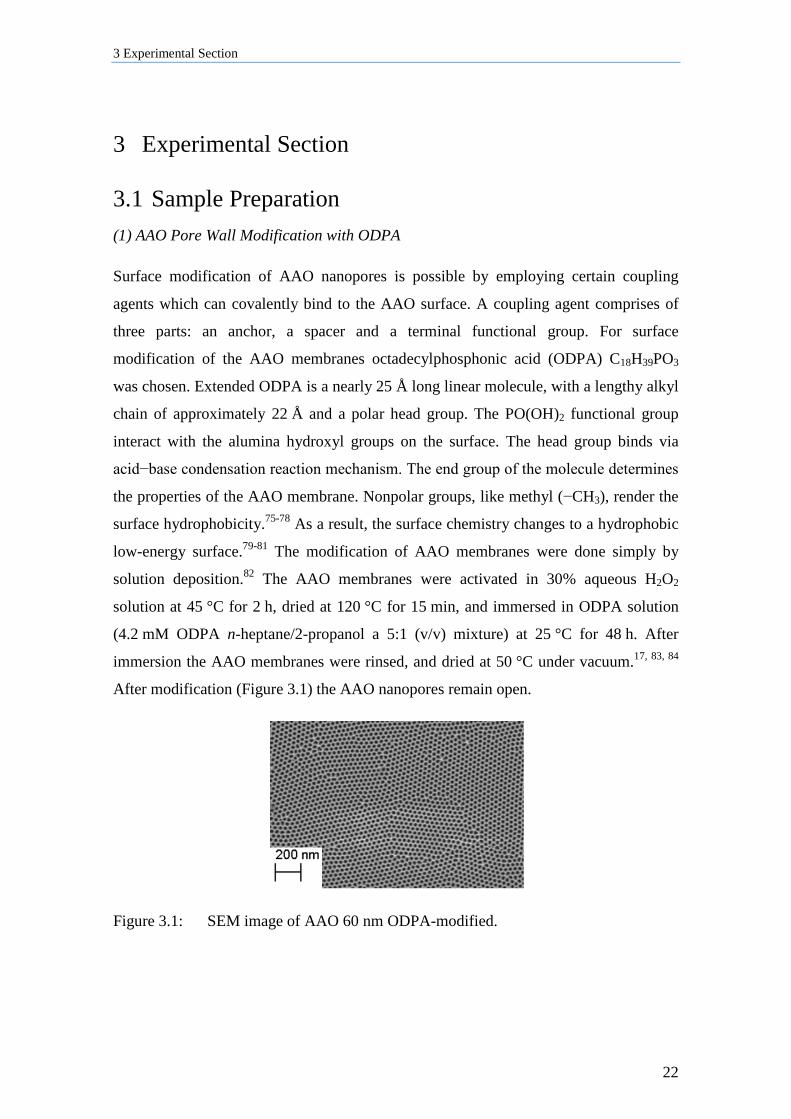
Surface modification of AAO nanopores is possible by employing certain coupling
agents which can covalently bind to the AAO surface. A coupling agent comprises of
three parts: an anchor, a spacer and a terminal functional group. For surface
modification of the AAO membranes octadecylphosphonic acid (ODPA) C18H39PO3
was chosen. Extended ODPA is a nearly 25 Å long linear molecule, with a lengthy alkyl
chain of approximately 22 Å and a polar head group. The PO(OH)2 functional group
interact with the alumina hydroxyl groups on the surface. The head group binds via
acid−base condensation reaction mechanism. The end group of the molecule determines
the properties of the AAO membrane. Nonpolar groups, like methyl (−CH3), render the
surface hydrophobicity.75-78 As a result, the surface chemistry changes to a hydrophobic
low-energy surface.79-81 The modification of AAO membranes were done simply by
solution deposition.82 The AAO membranes were activated in 30% aqueous H2O2
solution at 45 °C for 2 h, dried at 120 °C for 15 min, and immersed in ODPA solution
(4.2 mM ODPA n-heptane/2-propanol a 5:1 (v/v) mixture) at 25 °C for 48 h. After
immersion the AAO membranes were rinsed, and dried at 50 °C under vacuum.17, 83, 84
After modification (Figure 3.1) the AAO nanopores remain open.
Figure 3.1: SEM image of AAO 60 nm ODPA-modified.
3 Experimental Section
23
Prior to infiltration of AAO membranes with guest material, each membrane was
annealed at 180°C for 2 h under vacuum to remove traces of water. The membranes
were weighed before and after infiltration.
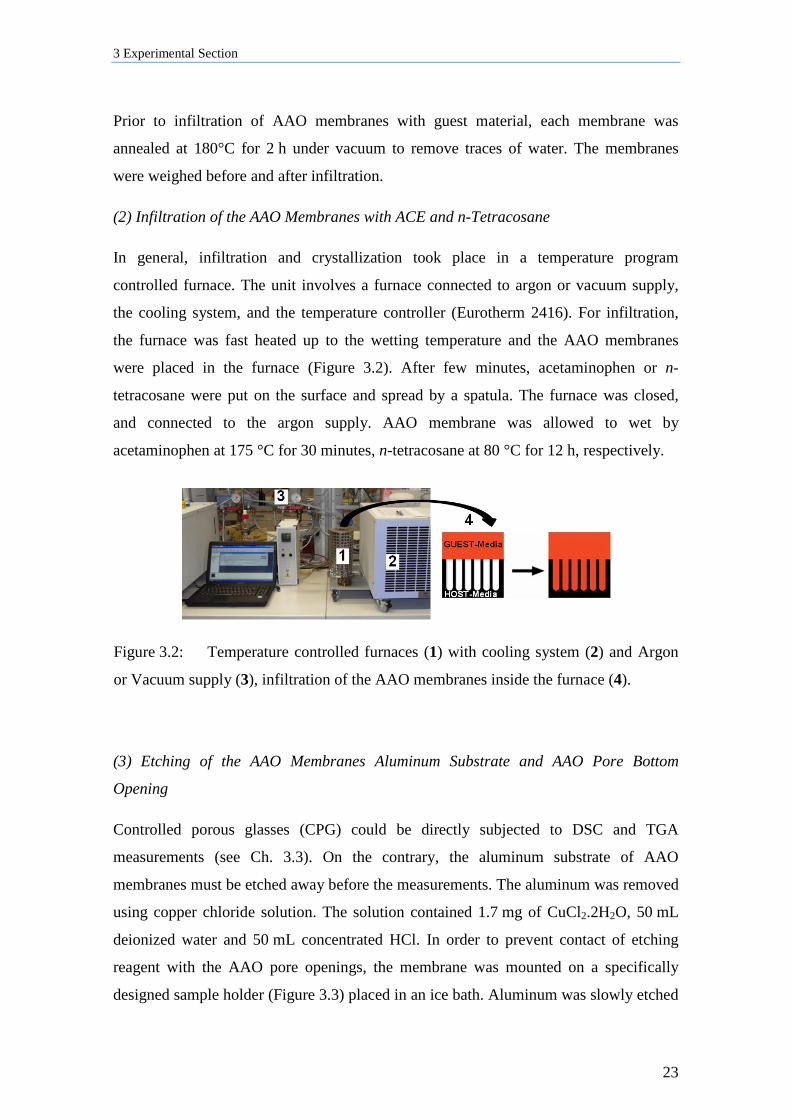
(2) Infiltration of the AAO Membranes with ACE and n-Tetracosane
In general, infiltration and crystallization took place in a temperature program
controlled furnace. The unit involves a furnace connected to argon or vacuum supply,
the cooling system, and the temperature controller (Eurotherm 2416). For infiltration,
the furnace was fast heated up to the wetting temperature and the AAO membranes
were placed in the furnace (Figure 3.2). After few minutes, acetaminophen or n-
tetracosane were put on the surface and spread by a spatula. The furnace was closed,
and connected to the argon supply. AAO membrane was allowed to wet by
acetaminophen at 175 °C for 30 minutes, n-tetracosane at 80 °C for 12 h, respectively.
Figure 3.2: Temperature controlled furnaces (1) with cooling system (2) and Argon
or Vacuum supply (3), infiltration of the AAO membranes inside the furnace (4).
(3) Etching of the AAO Membranes Aluminum Substrate and AAO Pore Bottom
Opening
Controlled porous glasses (CPG) could be directly subjected to DSC and TGA
measurements (see Ch. 3.3). On the contrary, the aluminum substrate of AAO
membranes must be etched away before the measurements. The aluminum was removed
using copper chloride solution. The solution contained 1.7 mg of CuCl2.2H2O, 50 mL
deionized water and 50 mL concentrated HCl. In order to prevent contact of etching
reagent with the AAO pore openings, the membrane was mounted on a specifically
designed sample holder (Figure 3.3) placed in an ice bath. Aluminum was slowly etched
3 Experimental Section
24
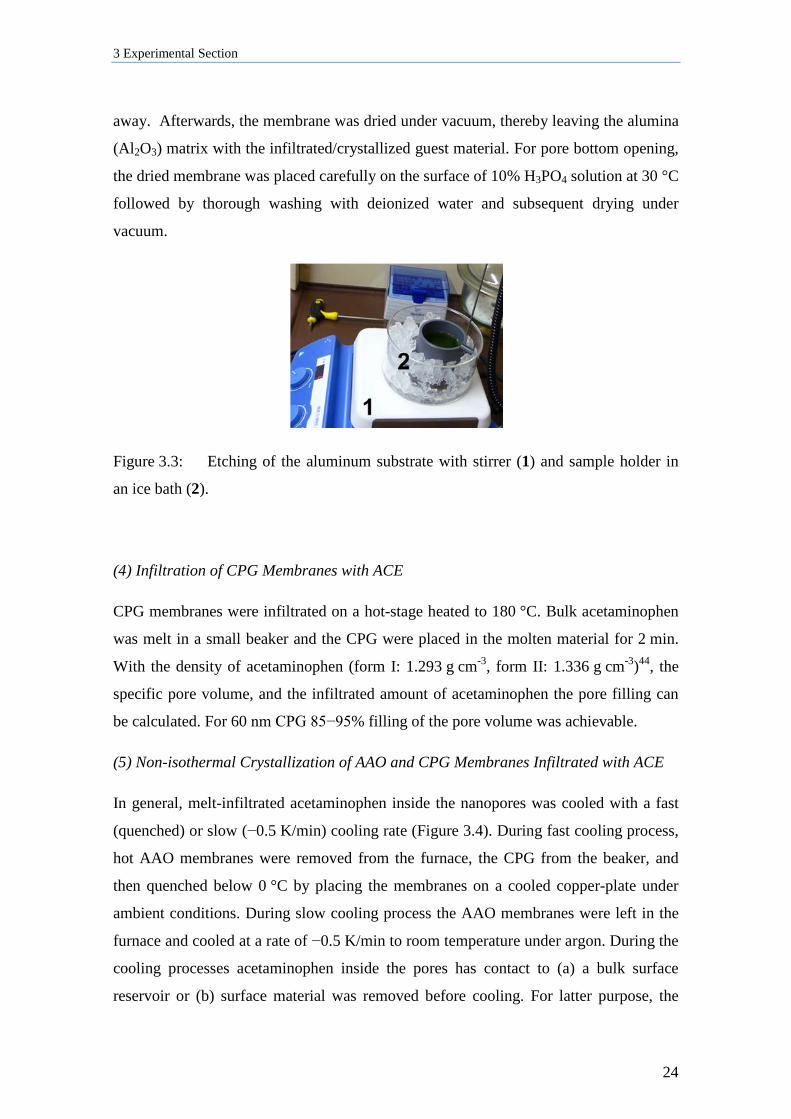
away. Afterwards, the membrane was dried under vacuum, thereby leaving the alumina
(Al2O3) matrix with the infiltrated/crystallized guest material. For pore bottom opening,
the dried membrane was placed carefully on the surface of 10% H3PO4 solution at 30 °C
followed by thorough washing with deionized water and subsequent drying under
vacuum.
Figure 3.3: Etching of the aluminum substrate with stirrer (1) and sample holder in
an ice bath (2).
(4) Infiltration of CPG Membranes with ACE
CPG membranes were infiltrated on a hot-stage heated to 180 °C. Bulk acetaminophen
was melt in a small beaker and the CPG were placed in the molten material for 2 min.
With the density of acetaminophen (form I: 1.293 g cm-3, form II: 1.336 g cm-3)44, the
specific pore volume, and the infiltrated amount of acetaminophen the pore filling can
be calculated. For 60 nm CPG 85−95% filling of the pore volume was achievable.
(5) Non-isothermal Crystallization of AAO and CPG Membranes Infiltrated with ACE
In general, melt-infiltrated acetaminophen inside the nanopores was cooled with a fast
(quenched) or slow (−0.5 K/min) cooling rate (Figure 3.4). During fast cooling process,
hot AAO membranes were removed from the furnace, the CPG from the beaker, and
then quenched below 0 °C by placing the membranes on a cooled copper-plate under
ambient conditions. During slow cooling process the AAO membranes were left in the
furnace and cooled at a rate of −0.5 K/min to room temperature under argon. During the
cooling processes acetaminophen inside the pores has contact to (a) a bulk surface
reservoir or (b) surface material was removed before cooling. For latter purpose, the
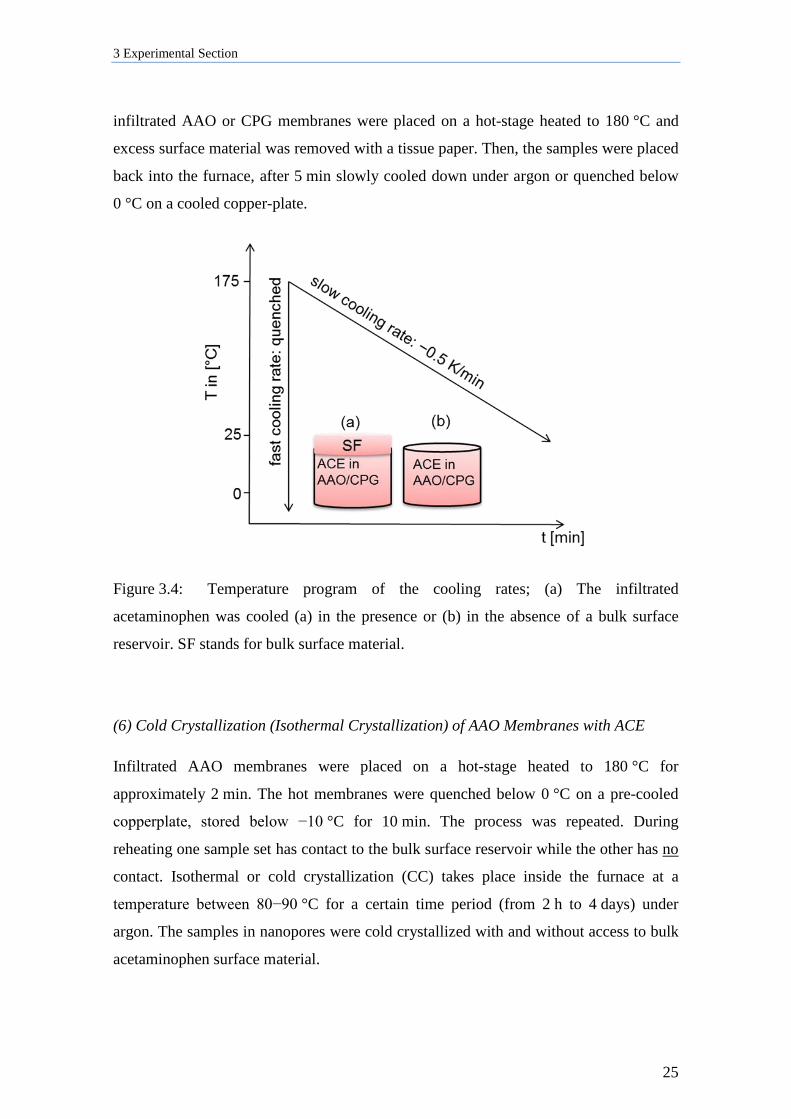
3 Experimental Section
25
infiltrated AAO or CPG membranes were placed on a hot-stage heated to 180 °C and
excess surface material was removed with a tissue paper. Then, the samples were placed
back into the furnace, after 5 min slowly cooled down under argon or quenched below
0 °C on a cooled copper-plate.
Figure 3.4: Temperature program of the cooling rates; (a) The infiltrated
acetaminophen was cooled (a) in the presence or (b) in the absence of a bulk surface
reservoir. SF stands for bulk surface material.
(6) Cold Crystallization (Isothermal Crystallization) of AAO Membranes with ACE
Infiltrated AAO membranes were placed on a hot-stage heated to 180 °C for
approximately 2 min. The hot membranes were quenched below 0 °C on a pre-cooled
copperplate, stored below −10 °C for 10 min. The process was repeated. During
reheating one sample set has contact to the bulk surface reservoir while the other has no
contact. Isothermal or cold crystallization (CC) takes place inside the furnace at a
temperature between 80−90 °C for a certain time period (from 2 h to 4 days) under
argon. The samples in nanopores were cold crystallized with and without access to bulk
acetaminophen surface material.
3 Experimental Section
26
(7) Infiltration of CPG Membranes with n-Tetracosane
As a second model compound, n-tetracosane was infiltrated in CPG membranes on a
hot-stage heated to 80 °C. The CPG were placed in bulk material (contained in a
beaker) for 10 min, quickly transferred to the furnace and subjected to cooling.
(8) Non-isothermal Crystallization of AAO and CPG Membranes Infiltrated with n-
Tetracosane
After infiltration n-Tetracosane was cooled to 25 °C at a cooling rate of −0.5 K/min in
the presence or in the absence of bulk surface reservoir, respectively. For latter purpose
the infiltrated samples were put on a hot-stage heated to 80 °C and excess bulk surface
material was removed with a tissue-paper before cooling. Then, the samples were
placed back into the furnace, re-infiltrated for 5 min, and crystallized at a cooling rate of
−0.5 K/min under argon. Before WAXS measurements the bulk surface film was
carefully removed. Membranes were weighed before and after infiltration. With the
known density of n-tetracosane (0.773 g cm-3 at 333 K)85 and the specific pore volume
(Table 2.3), the total amount of filled material inside 100 nm and 25 nm CPG
membranes was calculated to be around 100%, and almost 60% for 2 nm CPG.
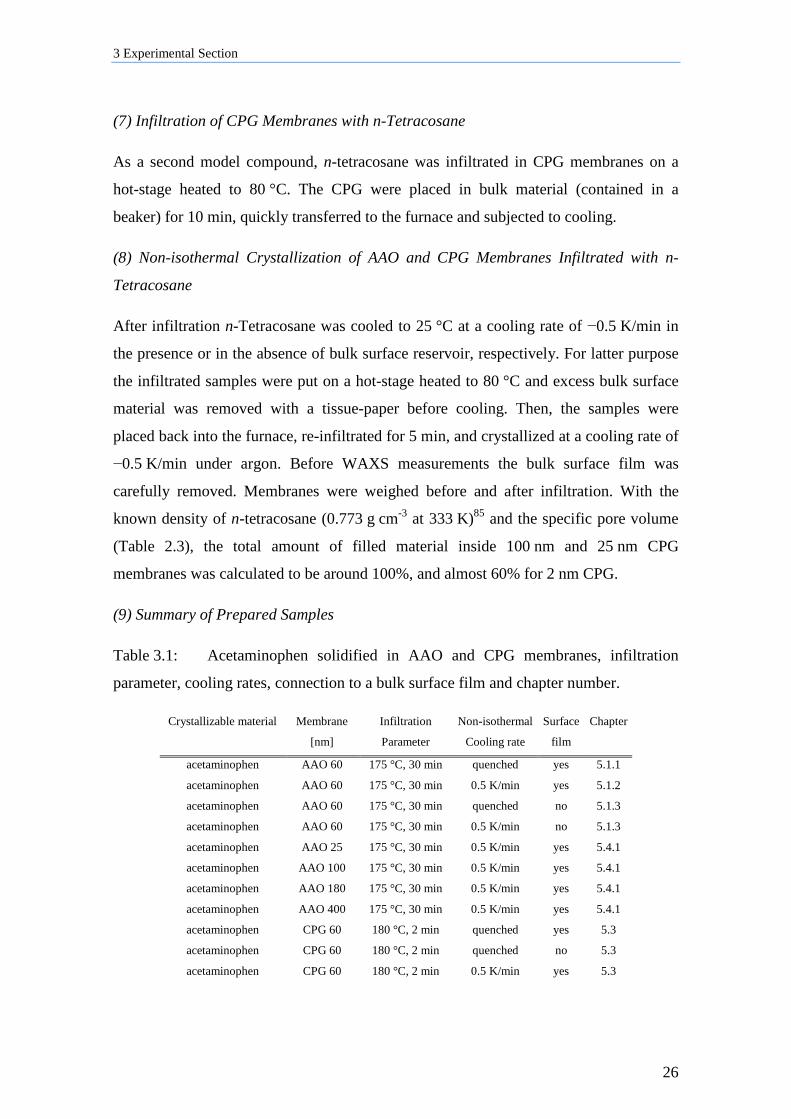
(9) Summary of Prepared Samples
Table 3.1: Acetaminophen solidified in AAO and CPG membranes, infiltration
parameter, cooling rates, connection to a bulk surface film and chapter number.
Crystallizable material Membrane Infiltration Non-isothermal Surface Chapter
[nm] Parameter Cooling rate film
acetaminophen AAO 60 175 °C, 30 min quenched yes 5.1.1
acetaminophen AAO 60 175 °C, 30 min 0.5 K/min yes 5.1.2
acetaminophen AAO 60 175 °C, 30 min quenched no 5.1.3
acetaminophen AAO 60 175 °C, 30 min 0.5 K/min no 5.1.3
acetaminophen AAO 25 175 °C, 30 min 0.5 K/min yes 5.4.1
acetaminophen AAO 100 175 °C, 30 min 0.5 K/min yes 5.4.1
acetaminophen AAO 180 175 °C, 30 min 0.5 K/min yes 5.4.1
acetaminophen AAO 400 175 °C, 30 min 0.5 K/min yes 5.4.1
acetaminophen CPG 60 180 °C, 2 min quenched yes 5.3
acetaminophen CPG 60 180 °C, 2 min quenched no 5.3
acetaminophen CPG 60 180 °C, 2 min 0.5 K/min yes 5.3
3 Experimental Section
27
acetaminophen CPG 60 180 °C, 2 min 0.5 K/min no 5.3
cold
crystallization
(isothermal)
acetaminophen AAO 60 175 °C, 30 min 90°C, 4 days no 5.2
acetaminophen AAO 60 175 °C, 30 min 80°C, 2 h yes 5.2
acetaminophen AAO 25 175 °C, 30 min 80°C, 2 h yes 5.4.2
acetaminophen AAO 100 175 °C, 30 min 80°C, 2 h yes 5.4.2
acetaminophen AAO 180 175 °C, 30 min 80°C, 2 h yes 5.4.2
acetaminophen AAO 400 175 °C, 30 min 80°C, 2 h yes 5.4.2
acetaminophen AAO 25 175 °C, 30 min 80°C, 2 h no 5.4.2
acetaminophen AAO 100 175 °C, 30 min 80°C, 2 h no 5.4.2
acetaminophen AAO 180 175 °C, 30 min 80°C, 2 h no 5.4.2
acetaminophen AAO 400 175 °C, 30 min 80°C, 2 h no 5.4.2
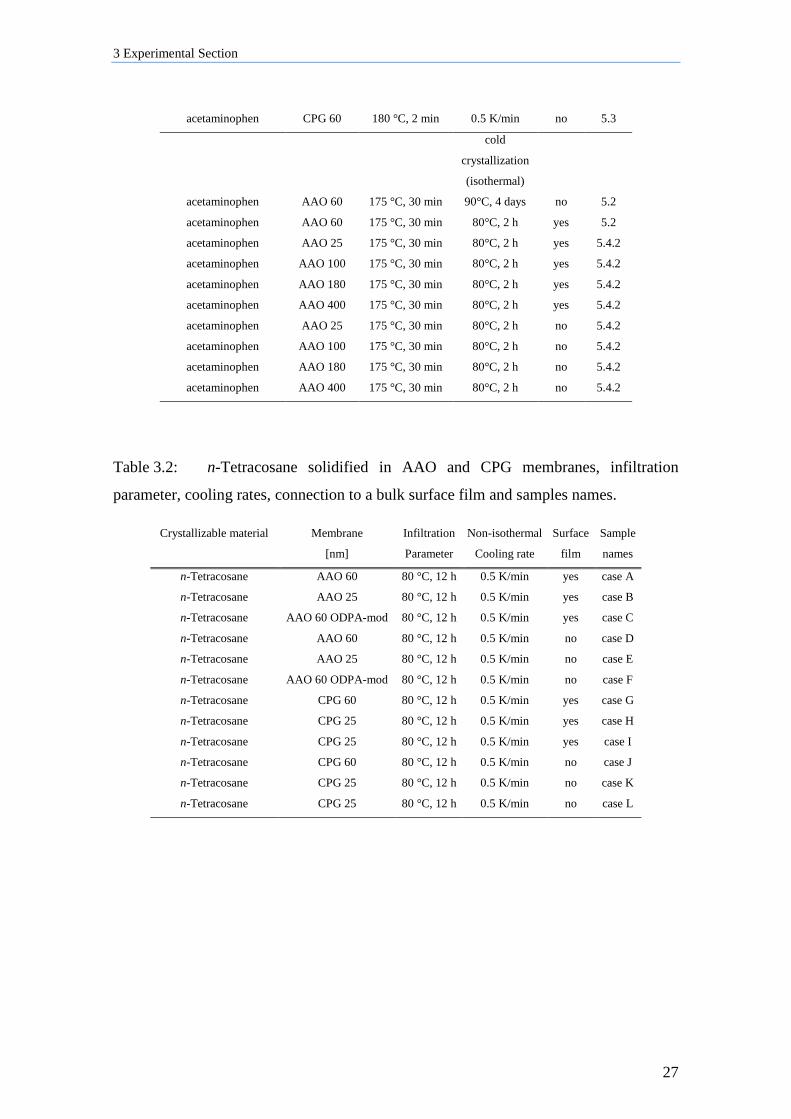
Table 3.2: n-Tetracosane solidified in AAO and CPG membranes, infiltration
parameter, cooling rates, connection to a bulk surface film and samples names.
Crystallizable material Membrane Infiltration Non-isothermal Surface Sample
[nm] Parameter Cooling rate film names
n-Tetracosane AAO 60 80 °C, 12 h 0.5 K/min yes case A
n-Tetracosane AAO 25 80 °C, 12 h 0.5 K/min yes case B
n-Tetracosane AAO 60 ODPA-mod 80 °C, 12 h 0.5 K/min yes case C
n-Tetracosane AAO 60 80 °C, 12 h 0.5 K/min no case D
n-Tetracosane AAO 25 80 °C, 12 h 0.5 K/min no case E
n-Tetracosane AAO 60 ODPA-mod 80 °C, 12 h 0.5 K/min no case F
n-Tetracosane CPG 60 80 °C, 12 h 0.5 K/min yes case G
n-Tetracosane CPG 25 80 °C, 12 h 0.5 K/min yes case H
n-Tetracosane CPG 25 80 °C, 12 h 0.5 K/min yes case I
n-Tetracosane CPG 60 80 °C, 12 h 0.5 K/min no case J
n-Tetracosane CPG 25 80 °C, 12 h 0.5 K/min no case K
n-Tetracosane CPG 25 80 °C, 12 h 0.5 K/min no case L
3 Experimental Section
28
3.2 X-ray Diffraction
3.2.1 Principles
X-ray diffraction is an important tool to investigate crystal structures. X-rays are
electromagnetic radiations with wavelengths of the order 10-10 m. There are two waves
in the same region of space they can interfere: constructively to have enhanced or
destructively to have smaller amplitudes. X-rays are generated by directing an electron
beam onto a cooled metal target. The electrons decelerate when they hit the metal and
generate radiation with a continuous range of wavelengths (Bremsstrahlung). Sharp
peaks arise from the collision of the incoming electrons with inner shell electrons. The
electron from the inner shell emits and into the vacant site can drop an electron from a
higher energy state, emitting the excess energy as an X-ray photon. If an electron falls
into a K shell the X-rays are categorized as K-radiation (e.g., Kα, Kβ lines).33 In
crystalline samples, for certain sharply define wavelengths, incident and diffraction
directions, intense peaks of scattered radiation can be observed. The simplest way to
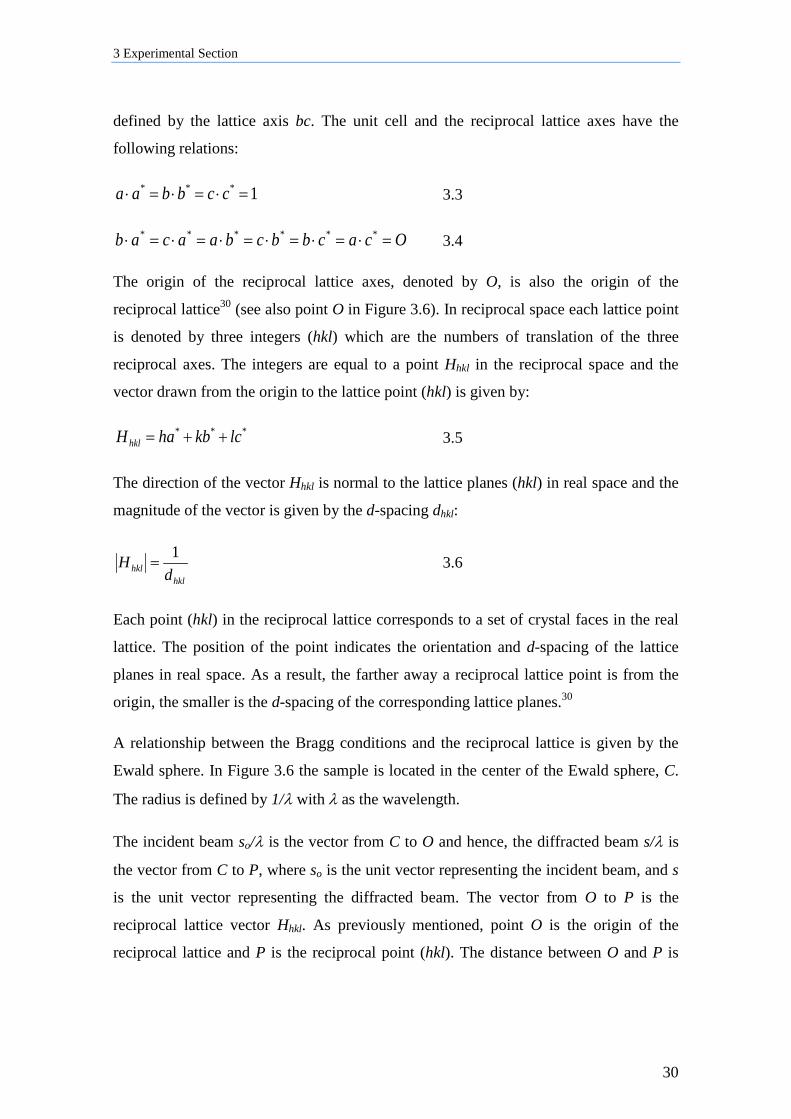
describe such diffracted X-rays is given by the Bragg Law:
Θ= sin2dnλ 3.1
where λ is the wavelength, θ is the scattering angle, d is the lattice spacing and n is an
integer number. Constructive interference results in reflections. At this time the incident
X-rays are elastically scattered by the atoms or molecule in any lattice plane30, 33 (Figure
3.5).
Figure 3.5: Bragg reflections from particular family of lattice planes where incident
beam and diffracted beam enclose an angle of θ.
3 Experimental Section
29
The observed diffraction peaks are displayed as diffracted intensities at a range of 2θ
angles. Ideal conditions (i.e., perfect crystal and instrumentation) should give peaks
with the shape of a delta function. In reality, the peaks broaden because of imperfect
crystal structure, atomic thermal vibration or instrumental settings, etc. The X-ray
diffraction (XRD) pattern gives a peak profile line which places the diffracted intensity
distribution I over the selected Bragg angle θ. The highest point in the profile
corresponds to the maximum intensity Imax. The width of the peak is characterized with
the full width at half-maximum (FWHM) value.30 The scattered X-rays form a specific
diffraction pattern which depends on the atomic arrangement. When the materials have
long- or short-range order the diffraction pattern of a specific material has more or less
sharp peaks. The peaks correspond to various lattice planes based on the Bragg law,
whereby peaks at lower 2θ angles come from planes of large d-spacing and vice versa.
A diffraction pattern can be collected from a single crystal or from polycrystalline
materials. Crystallographic parameters for many compounds are collected in the
Cambridge Structural Database (CSD)73 and can be used for comparison and structure
drawing, for example. Materials with no long-range order like liquids or amorphous
solids have only a narrow atomic distance distribution. The intensity of the scattered X-
rays forms a very broad distribution in the 2θ range referred to as amorphous halo.
For X-ray studies the scattering data are analyzed in terms of the reciprocal lattice. The
reciprocal lattice is a transformation of the crystal lattice in real space to reciprocal
space. The reciprocal lattice is then defined by three vectors a, b, c of the unit cell and
all start from a single lattice point. The unit cell of the corresponding reciprocal lattice is
given by:
),(1* cbV
a ×= ),(1* acV
b ×= ),(1* baV
c ×= cbaV ×⋅= 3.2
where V is the volume of the crystal unit cell in real space.
As can be seen each reciprocal lattice axis is a vector product of two lattice axis in real
space, the reciprocal lattice axis is perpendicular to the planes which are defined by two
lattice axis. For example, the reciprocal lattice vector a* is perpendicular to the planes
3 Experimental Section
30
defined by the lattice axis bc. The unit cell and the reciprocal lattice axes have the
following relations:
1*** =⋅=⋅=⋅ ccbbaa 3.3
Ocacbbcbaacab =⋅=⋅=⋅=⋅=⋅=⋅ ****** 3.4
The origin of the reciprocal lattice axes, denoted by O, is also the origin of the
reciprocal lattice30 (see also point O in Figure 3.6). In reciprocal space each lattice point
is denoted by three integers (hkl) which are the numbers of translation of the three
reciprocal axes. The integers are equal to a point Hhkl in the reciprocal space and the
vector drawn from the origin to the lattice point (hkl) is given by:
*** lckbhaHhkl ++= 3.5
The direction of the vector Hhkl is normal to the lattice planes (hkl) in real space and the
magnitude of the vector is given by the d-spacing dhkl:
hklhkl d
H 1= 3.6
Each point (hkl) in the reciprocal lattice corresponds to a set of crystal faces in the real
lattice. The position of the point indicates the orientation and d-spacing of the lattice
planes in real space. As a result, the farther away a reciprocal lattice point is from the
origin, the smaller is the d-spacing of the corresponding lattice planes.30
A relationship between the Bragg conditions and the reciprocal lattice is given by the
Ewald sphere. In Figure 3.6 the sample is located in the center of the Ewald sphere, C.
The radius is defined by 1/λ with λ as the wavelength.
The incident beam so/λ is the vector from C to O and hence, the diffracted beam s/λ is
the vector from C to P, where so is the unit vector representing the incident beam, and s
is the unit vector representing the diffracted beam. The vector from O to P is the
reciprocal lattice vector Hhkl. As previously mentioned, point O is the origin of the
reciprocal lattice and P is the reciprocal point (hkl). The distance between O and P is
3 Experimental Section
31
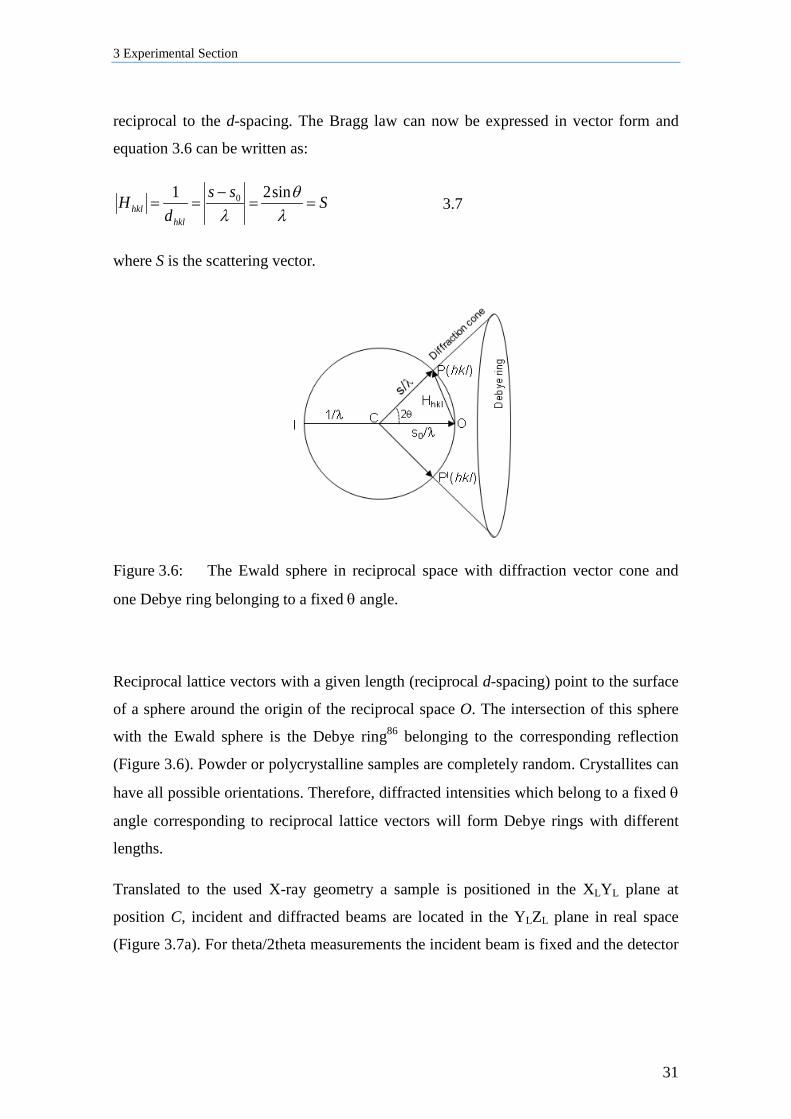
reciprocal to the d-spacing. The Bragg law can now be expressed in vector form and
equation 3.6 can be written as:
Sssd
Hhkl
hkl ==−
==λ
θλ
sin21 0 3.7
where S is the scattering vector.
Figure 3.6: The Ewald sphere in reciprocal space with diffraction vector cone and
one Debye ring belonging to a fixed θ angle.
Reciprocal lattice vectors with a given length (reciprocal d-spacing) point to the surface
of a sphere around the origin of the reciprocal space O. The intersection of this sphere
with the Ewald sphere is the Debye ring86 belonging to the corresponding reflection
(Figure 3.6). Powder or polycrystalline samples are completely random. Crystallites can
have all possible orientations. Therefore, diffracted intensities which belong to a fixed θ
angle corresponding to reciprocal lattice vectors will form Debye rings with different
lengths.
Translated to the used X-ray geometry a sample is positioned in the XLYL plane at
position C, incident and diffracted beams are located in the YLZL plane in real space
(Figure 3.7a). For theta/2theta measurements the incident beam is fixed and the detector
3 Experimental Section
32
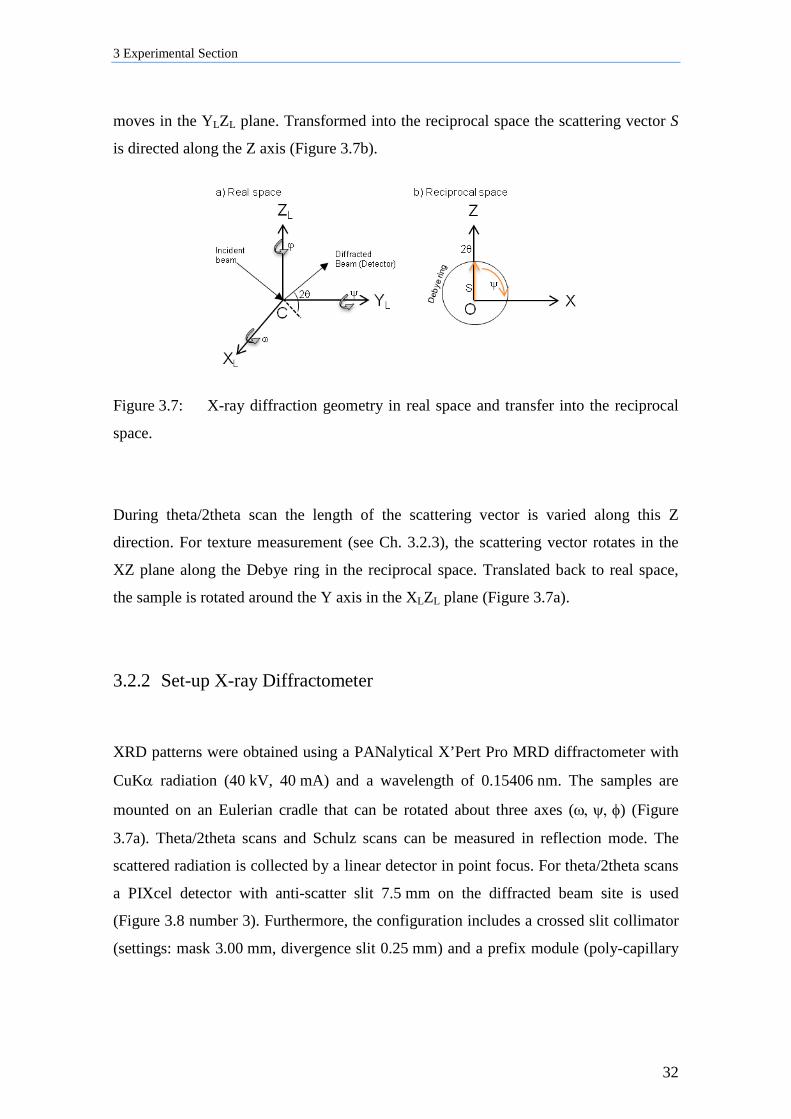
moves in the YLZL plane. Transformed into the reciprocal space the scattering vector S
is directed along the Z axis (Figure 3.7b).
Figure 3.7: X-ray diffraction geometry in real space and transfer into the reciprocal
space.
During theta/2theta scan the length of the scattering vector is varied along this Z
direction. For texture measurement (see Ch. 3.2.3), the scattering vector rotates in the
XZ plane along the Debye ring in the reciprocal space. Translated back to real space,
the sample is rotated around the Y axis in the XLZL plane (Figure 3.7a).
3.2.2 Set-up X-ray Diffractometer
XRD patterns were obtained using a PANalytical X’Pert Pro MRD diffractometer with
CuKα radiation (40 kV, 40 mA) and a wavelength of 0.15406 nm. The samples are
mounted on an Eulerian cradle that can be rotated about three axes (ω, ψ, φ) (Figure
3.7a). Theta/2theta scans and Schulz scans can be measured in reflection mode. The
scattered radiation is collected by a linear detector in point focus. For theta/2theta scans
a PIXcel detector with anti-scatter slit 7.5 mm on the diffracted beam site is used
(Figure 3.8 number 3). Furthermore, the configuration includes a crossed slit collimator
(settings: mask 3.00 mm, divergence slit 0.25 mm) and a prefix module (poly-capillary
3 Experimental Section
33
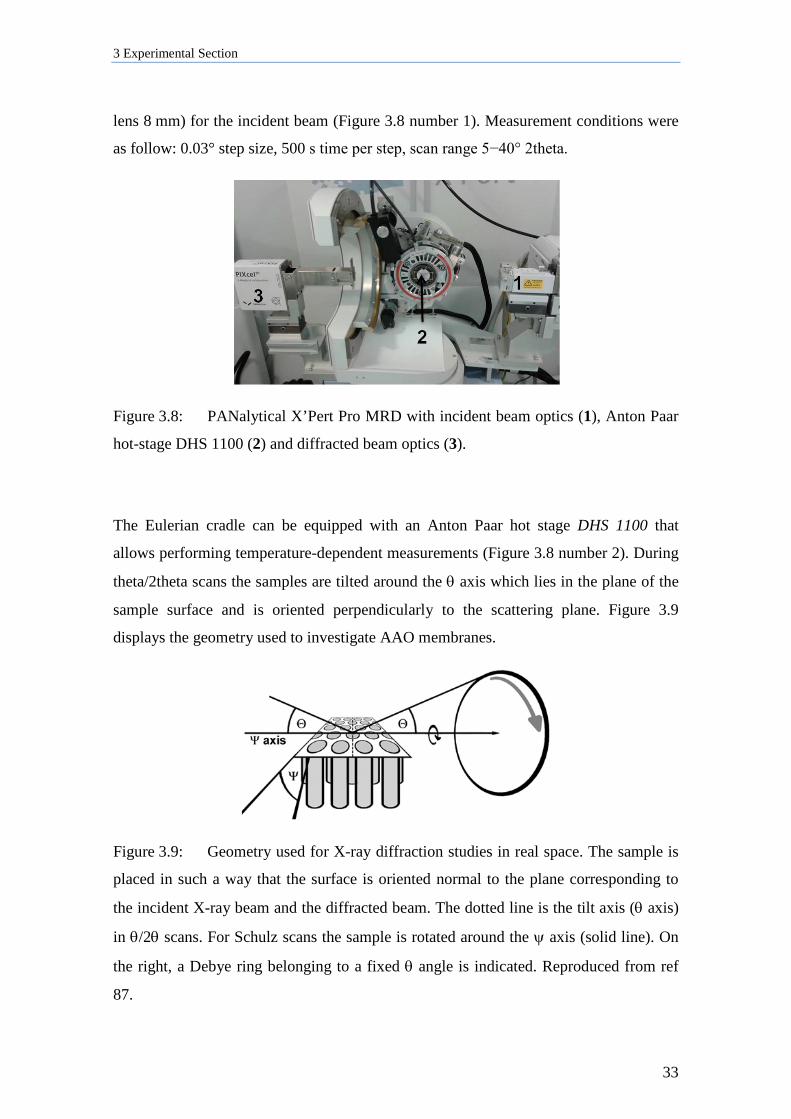
lens 8 mm) for the incident beam (Figure 3.8 number 1). Measurement conditions were
as follow: 0.03° step size, 500 s time per step, scan range 5−40° 2theta.
Figure 3.8: PANalytical X’Pert Pro MRD with incident beam optics (1), Anton Paar
hot-stage DHS 1100 (2) and diffracted beam optics (3).
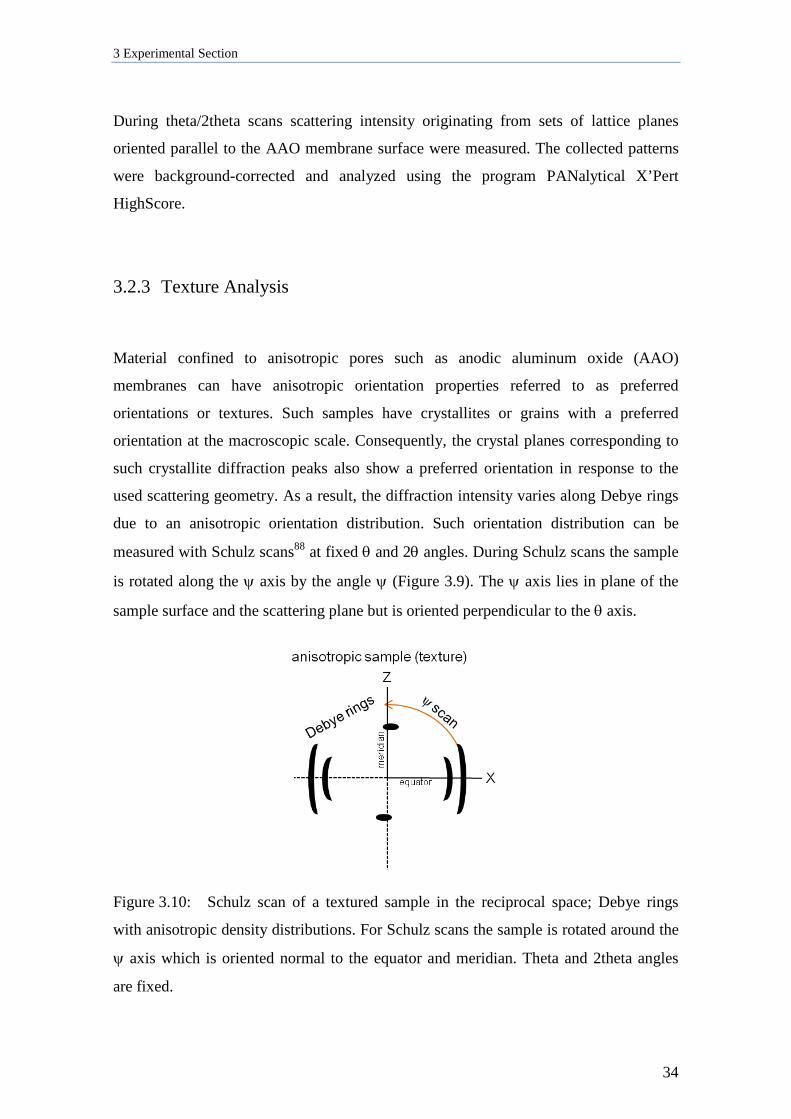
The Eulerian cradle can be equipped with an Anton Paar hot stage DHS 1100 that
allows performing temperature-dependent measurements (Figure 3.8 number 2). During
theta/2theta scans the samples are tilted around the θ axis which lies in the plane of the
sample surface and is oriented perpendicularly to the scattering plane. Figure 3.9
displays the geometry used to investigate AAO membranes.
Figure 3.9: Geometry used for X-ray diffraction studies in real space. The sample is
placed in such a way that the surface is oriented normal to the plane corresponding to
the incident X-ray beam and the diffracted beam. The dotted line is the tilt axis (θ axis)
in θ/2θ scans. For Schulz scans the sample is rotated around the ψ axis (solid line). On
the right, a Debye ring belonging to a fixed θ angle is indicated. Reproduced from ref
87.
3 Experimental Section
34
During theta/2theta scans scattering intensity originating from sets of lattice planes
oriented parallel to the AAO membrane surface were measured. The collected patterns
were background-corrected and analyzed using the program PANalytical X’Pert
HighScore.
3.2.3 Texture Analysis
Material confined to anisotropic pores such as anodic aluminum oxide (AAO)
membranes can have anisotropic orientation properties referred to as preferred
orientations or textures. Such samples have crystallites or grains with a preferred
orientation at the macroscopic scale. Consequently, the crystal planes corresponding to
such crystallite diffraction peaks also show a preferred orientation in response to the
used scattering geometry. As a result, the diffraction intensity varies along Debye rings
due to an anisotropic orientation distribution. Such orientation distribution can be
measured with Schulz scans88 at fixed θ and 2θ angles. During Schulz scans the sample
is rotated along the ψ axis by the angle ψ (Figure 3.9). The ψ axis lies in plane of the
sample surface and the scattering plane but is oriented perpendicular to the θ axis.
Figure 3.10: Schulz scan of a textured sample in the reciprocal space; Debye rings
with anisotropic density distributions. For Schulz scans the sample is rotated around the
ψ axis which is oriented normal to the equator and meridian. Theta and 2theta angles
are fixed.
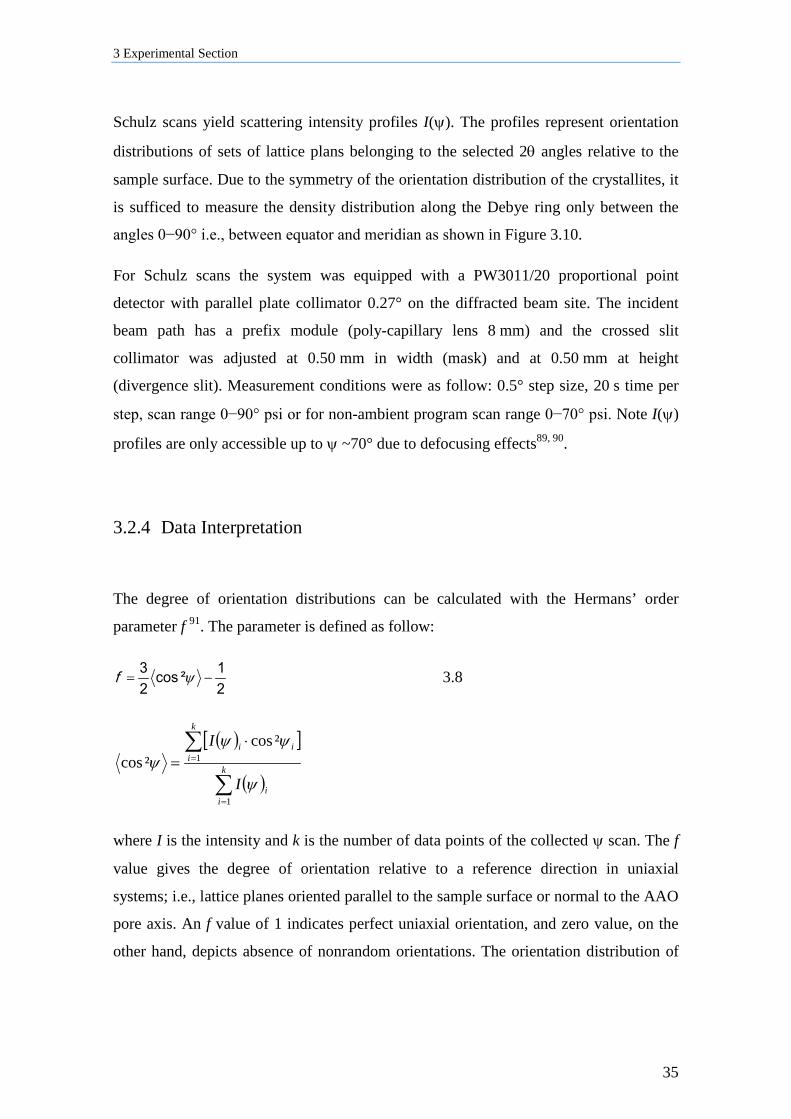
3 Experimental Section
35
Schulz scans yield scattering intensity profiles I(ψ). The profiles represent orientation
distributions of sets of lattice plans belonging to the selected 2θ angles relative to the
sample surface. Due to the symmetry of the orientation distribution of the crystallites, it
is sufficed to measure the density distribution along the Debye ring only between the
angles 0−90° i.e., between equator and meridian as shown in Figure 3.10.
For Schulz scans the system was equipped with a PW3011/20 proportional point
detector with parallel plate collimator 0.27° on the diffracted beam site. The incident
beam path has a prefix module (poly-capillary lens 8 mm) and the crossed slit
collimator was adjusted at 0.50 mm in width (mask) and at 0.50 mm at height
(divergence slit). Measurement conditions were as follow: 0.5° step size, 20 s time per
step, scan range 0−90° psi or for non-ambient program scan range 0−70° psi. Note I(ψ)
profiles are only accessible up to ψ ~70° due to defocusing effects89, 90.
3.2.4 Data Interpretation
The degree of orientation distributions can be calculated with the Hermans’ order
parameter f 91. The parameter is defined as follow:
21²cos
23
−= ψf 3.8
( )[ ]
( )∑
∑
=
=
⋅= k
ii
k
iii
I
I
1
1²cos
²cosψ
ψψψ
where I is the intensity and k is the number of data points of the collected ψ scan. The f
value gives the degree of orientation relative to a reference direction in uniaxial
systems; i.e., lattice planes oriented parallel to the sample surface or normal to the AAO
pore axis. An f value of 1 indicates perfect uniaxial orientation, and zero value, on the
other hand, depicts absence of nonrandom orientations. The orientation distribution of
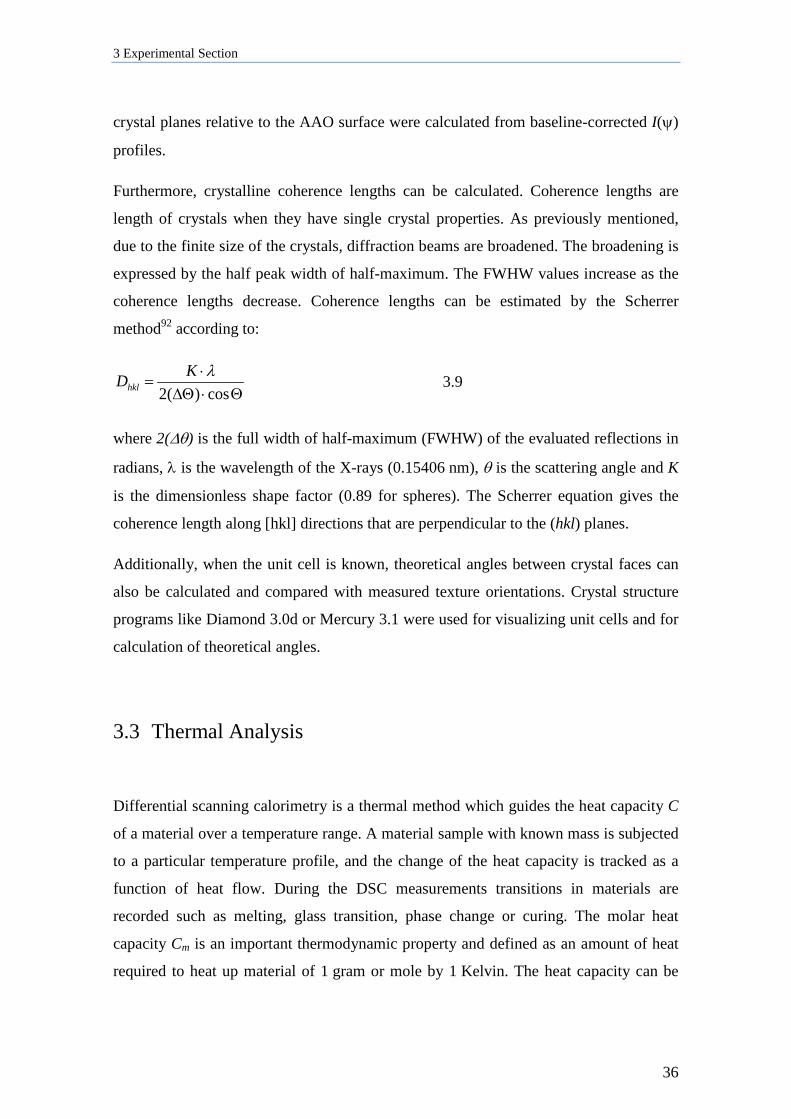
3 Experimental Section
36
crystal planes relative to the AAO surface were calculated from baseline-corrected I(ψ)
profiles.
Furthermore, crystalline coherence lengths can be calculated. Coherence lengths are
length of crystals when they have single crystal properties. As previously mentioned,
due to the finite size of the crystals, diffraction beams are broadened. The broadening is
expressed by the half peak width of half-maximum. The FWHW values increase as the
coherence lengths decrease. Coherence lengths can be estimated by the Scherrer
method92 according to:
Θ⋅∆Θ⋅
=cos)(2λKDhkl 3.9
where 2(∆θ) is the full width of half-maximum (FWHW) of the evaluated reflections in
radians, λ is the wavelength of the X-rays (0.15406 nm), θ is the scattering angle and K
is the dimensionless shape factor (0.89 for spheres). The Scherrer equation gives the
coherence length along [hkl] directions that are perpendicular to the (hkl) planes.
Additionally, when the unit cell is known, theoretical angles between crystal faces can
also be calculated and compared with measured texture orientations. Crystal structure
programs like Diamond 3.0d or Mercury 3.1 were used for visualizing unit cells and for
calculation of theoretical angles.
3.3 Thermal Analysis
Differential scanning calorimetry is a thermal method which guides the heat capacity C
of a material over a temperature range. A material sample with known mass is subjected
to a particular temperature profile, and the change of the heat capacity is tracked as a
function of heat flow. During the DSC measurements transitions in materials are
recorded such as melting, glass transition, phase change or curing. The molar heat
capacity Cm is an important thermodynamic property and defined as an amount of heat
required to heat up material of 1 gram or mole by 1 Kelvin. The heat capacity can be
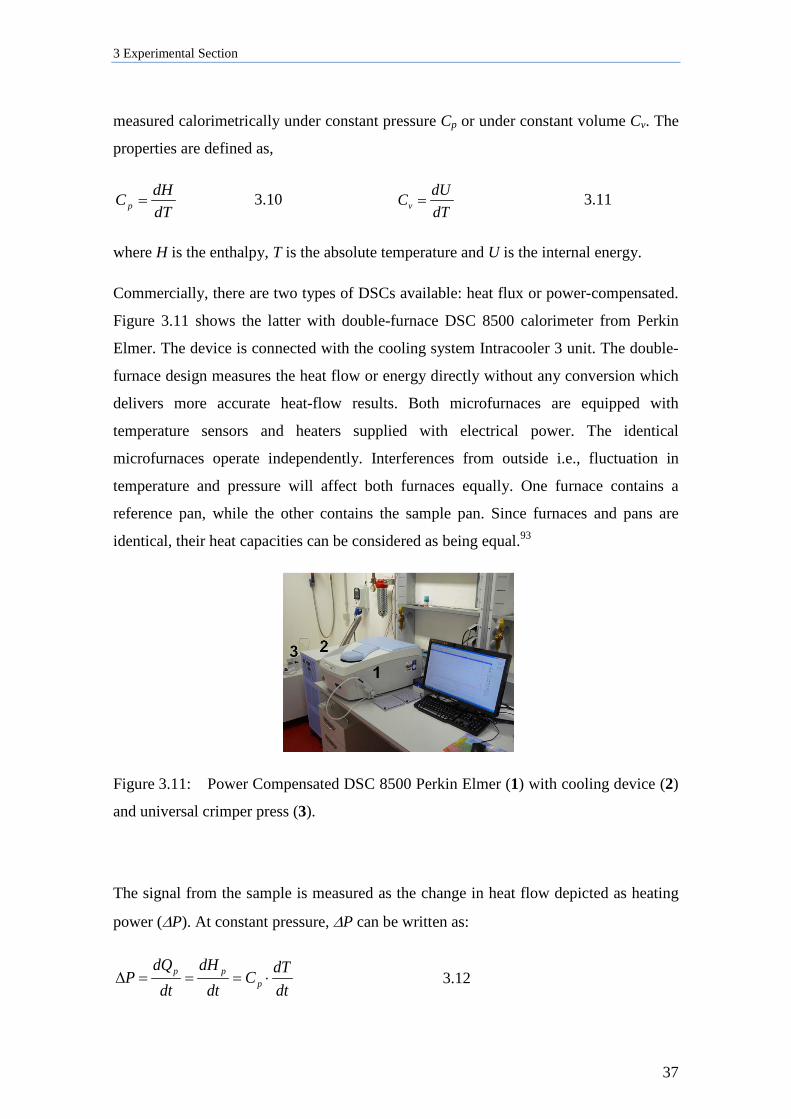
3 Experimental Section
37
measured calorimetrically under constant pressure Cp or under constant volume Cv. The
properties are defined as,
dTdHC p = 3.10
dTdUCv = 3.11
where H is the enthalpy, T is the absolute temperature and U is the internal energy.
Commercially, there are two types of DSCs available: heat flux or power-compensated.
Figure 3.11 shows the latter with double-furnace DSC 8500 calorimeter from Perkin
Elmer. The device is connected with the cooling system Intracooler 3 unit. The double-
furnace design measures the heat flow or energy directly without any conversion which
delivers more accurate heat-flow results. Both microfurnaces are equipped with
temperature sensors and heaters supplied with electrical power. The identical
microfurnaces operate independently. Interferences from outside i.e., fluctuation in
temperature and pressure will affect both furnaces equally. One furnace contains a
reference pan, while the other contains the sample pan. Since furnaces and pans are
identical, their heat capacities can be considered as being equal.93
Figure 3.11: Power Compensated DSC 8500 Perkin Elmer (1) with cooling device (2)
and universal crimper press (3).
The signal from the sample is measured as the change in heat flow depicted as heating
power (∆P). At constant pressure, ∆P can be written as:
dtdTC
dtdH
dtdQ
P ppp ⋅===∆ 3.12
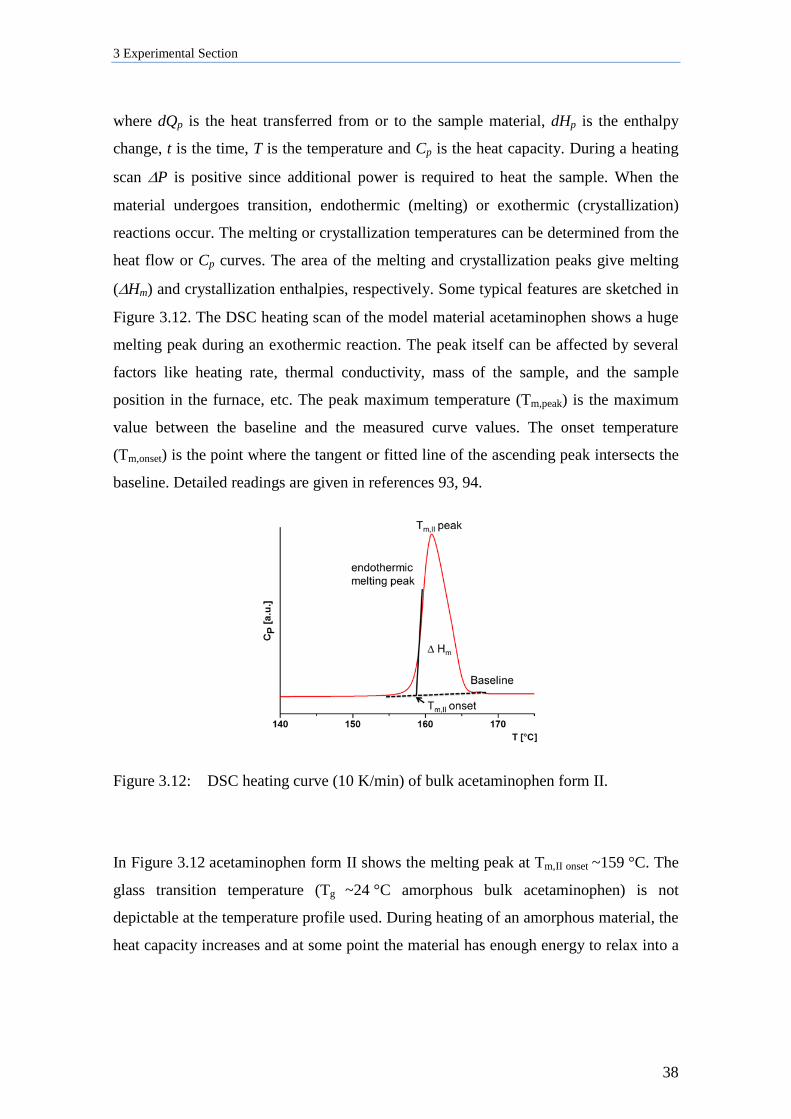
3 Experimental Section
38
where dQp is the heat transferred from or to the sample material, dHp is the enthalpy
change, t is the time, T is the temperature and Cp is the heat capacity. During a heating
scan ∆P is positive since additional power is required to heat the sample. When the
material undergoes transition, endothermic (melting) or exothermic (crystallization)
reactions occur. The melting or crystallization temperatures can be determined from the
heat flow or Cp curves. The area of the melting and crystallization peaks give melting
(∆Hm) and crystallization enthalpies, respectively. Some typical features are sketched in
Figure 3.12. The DSC heating scan of the model material acetaminophen shows a huge
melting peak during an exothermic reaction. The peak itself can be affected by several
factors like heating rate, thermal conductivity, mass of the sample, and the sample
position in the furnace, etc. The peak maximum temperature (Tm,peak) is the maximum
value between the baseline and the measured curve values. The onset temperature
(Tm,onset) is the point where the tangent or fitted line of the ascending peak intersects the
baseline. Detailed readings are given in references 93, 94.
Figure 3.12: DSC heating curve (10 K/min) of bulk acetaminophen form II.
In Figure 3.12 acetaminophen form II shows the melting peak at Tm,II onset ~159 °C. The
glass transition temperature (Tg ~24 °C amorphous bulk acetaminophen) is not
depictable at the temperature profile used. During heating of an amorphous material, the
heat capacity increases and at some point the material has enough energy to relax into a
3 Experimental Section
39
more ordered crystalline form. This requires a fair amount of energy which appears as a
step in the DSC heat flow95 referred to as glass transition temperature.
Melting points of bulk material or material embedded in nanopores matrices were
measured using a power-compensated double-furnace DSC 8500 as mentioned earlier.
CPG membranes could be used directly. The aluminum substrate of AAO membranes
was removed before DSC and TGA (see Ch. 3.1). Then, 5−10 mg of the membranes
were put in aluminum DSC pans, hermetically closed and placed in the DSC device.
As described above, when material is embedded in nanoporous hosts their properties
may differ from the bulk material. Material under confinement exhibits a melting point
depression. The depression results from the finite size of the crystallites inside the
pores.21, 96 The melting point depression Tm(confinement) can be described with the Gibbs-
Thomson equation9:
⋅∆⋅
⋅−⋅= ∞ )(41)()(
Cm
CLmtconfinemenm Hd
TTρ
γ 3.13
where Tm(∞) is the melting temperature of the infinitely large crystal, γCL is the interfacial
tension between crystal and liquid, ∆Hm is the heat of melting and ρC is the crystal
density. The equation gives a relationship between the measured melting temperature
Tm(confinement) and the crystal thickness d. Crystallization curves can be drawn which
represent the association between the crystallization temperature and the inverse crystal
thickness 1/d96 assuming that other parameters are independent of size. The same goes
with melting curves, the melting point also shows a relationship to the inverse crystal
thickness. The Gibbs-Thomson equation predicts a linear relationship between the
melting point and the inverse particle size or pore size.
The thermo gravimetric analysis (TGA) is a technique where the mass loss of a material
is monitored as a function of temperature or time. The measurements take place with a
controlled temperature program and under controlled atmosphere. TGA measurments
were carried out with a Netzsch STA 449 Ca. The samples were heated from 25 to
500 °C with a heating rate of 10 K/min.
a Universität Osnabrück, Inst. für Chemie neuer Materialien, AK Haase
3 Experimental Section
40
3.4 Scanning Electron Microscopy
Before scanning electron microscopy (SEM) AAO membranes were coated with a thin
Pt/Ir layer. For high magnification images, a Zeiss Auriga CrossBeam Workstation
EVO MA10 equipped with a Gemini FE-SEM column was used. Acceleration voltage
between 1−3 kV was used to investigate the samples.
3.5 Electron Paramagnetic Resonance
Electron paramagnetic resonance (EPR) spectroscopy is a universal, sensitive and
quantitative method to detect possible formation of radical species in solid materials.97
EPR is a study of molecules and ions having unpaired electrons by observing the
magnetic fields at which they come into resonance with monochromatic radiation.33
Electrons have a spin with s = 1/2 and magnetic moment with ms = ± 1/2. If electrons
extended to a magnetic field B0 the electron spin is separated between ms = −1/2 and ms
= +1/2 levels. The energy separations come into resonance with the radiation v when the
frequency satisfies the resonance condition:
0Bµghv Be= 3.14
where h is the Planck’ constant, µB is the Bohr magneton, and ge is the g-value (ge
~2.0023 for a ‘free’ electron). The magnetic moment of an unpaired electron interacts
with an external field. But the g-value differs from that for a free electron because of
local fields induced by the molecular framework of the radical.33 Therefore the g-value
gives information about the electronic structure.
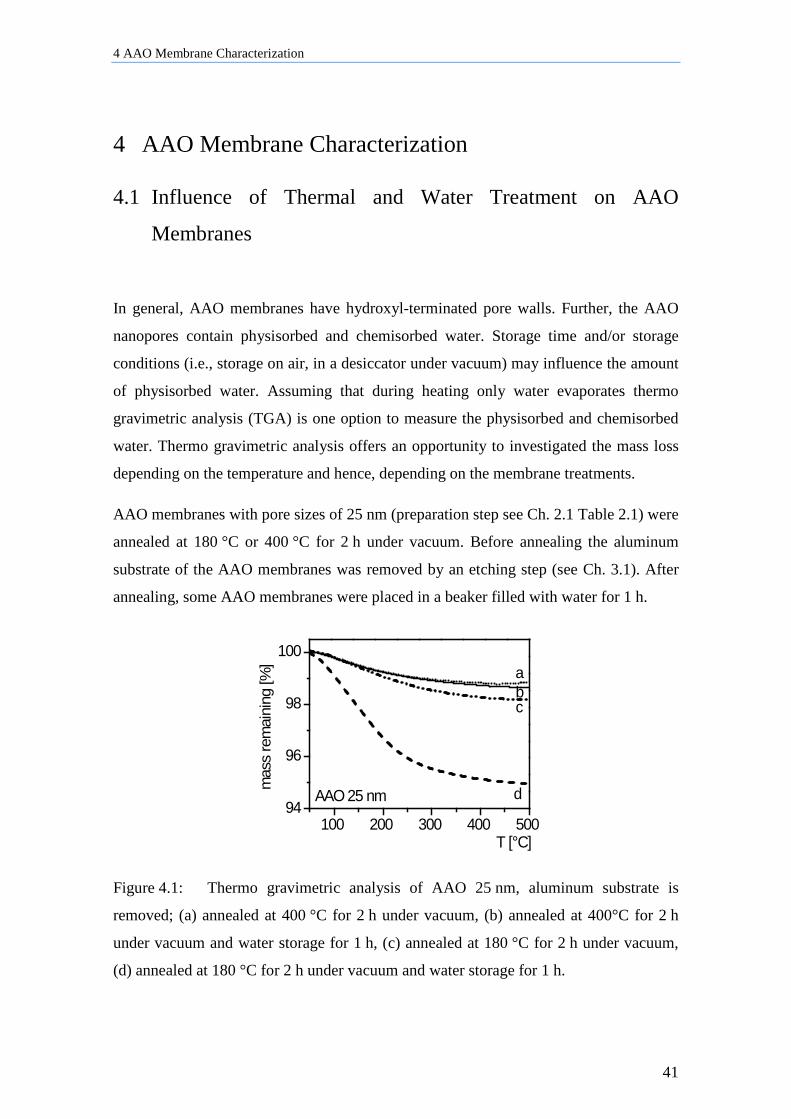
4 AAO Membrane Characterization
41
4 AAO Membrane Characterization
4.1 Influence of Thermal and Water Treatment on AAO
Membranes
In general, AAO membranes have hydroxyl-terminated pore walls. Further, the AAO
nanopores contain physisorbed and chemisorbed water. Storage time and/or storage
conditions (i.e., storage on air, in a desiccator under vacuum) may influence the amount
of physisorbed water. Assuming that during heating only water evaporates thermo
gravimetric analysis (TGA) is one option to measure the physisorbed and chemisorbed
water. Thermo gravimetric analysis offers an opportunity to investigated the mass loss
depending on the temperature and hence, depending on the membrane treatments.
AAO membranes with pore sizes of 25 nm (preparation step see Ch. 2.1 Table 2.1) were
annealed at 180 °C or 400 °C for 2 h under vacuum. Before annealing the aluminum
substrate of the AAO membranes was removed by an etching step (see Ch. 3.1). After
annealing, some AAO membranes were placed in a beaker filled with water for 1 h.
100 200 300 400 50094
96
98
100
T [°C]
d
cb
mas
s re
mai
ning
[%] a
AAO 25 nm
Figure 4.1: Thermo gravimetric analysis of AAO 25 nm, aluminum substrate is
removed; (a) annealed at 400 °C for 2 h under vacuum, (b) annealed at 400°C for 2 h
under vacuum and water storage for 1 h, (c) annealed at 180 °C for 2 h under vacuum,
(d) annealed at 180 °C for 2 h under vacuum and water storage for 1 h.
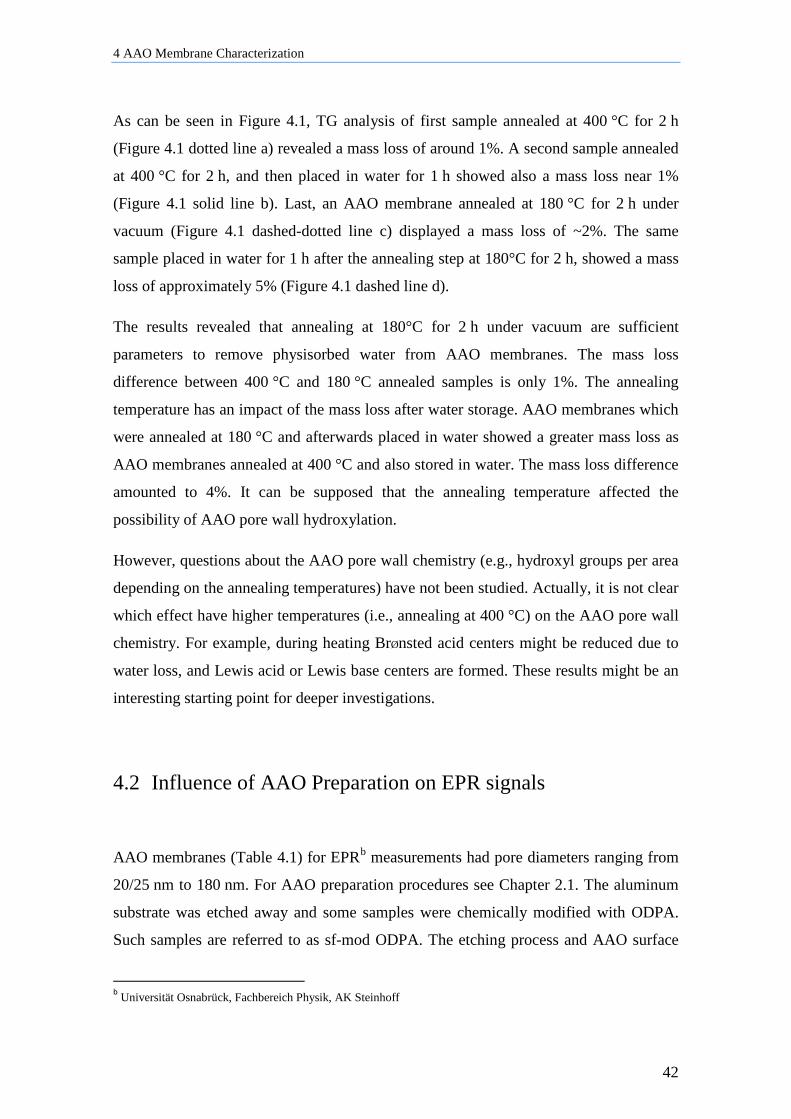
4 AAO Membrane Characterization
42
As can be seen in Figure 4.1, TG analysis of first sample annealed at 400 °C for 2 h
(Figure 4.1 dotted line a) revealed a mass loss of around 1%. A second sample annealed
at 400 °C for 2 h, and then placed in water for 1 h showed also a mass loss near 1%
(Figure 4.1 solid line b). Last, an AAO membrane annealed at 180 °C for 2 h under
vacuum (Figure 4.1 dashed-dotted line c) displayed a mass loss of ~2%. The same
sample placed in water for 1 h after the annealing step at 180°C for 2 h, showed a mass
loss of approximately 5% (Figure 4.1 dashed line d).
The results revealed that annealing at 180°C for 2 h under vacuum are sufficient
parameters to remove physisorbed water from AAO membranes. The mass loss
difference between 400 °C and 180 °C annealed samples is only 1%. The annealing
temperature has an impact of the mass loss after water storage. AAO membranes which
were annealed at 180 °C and afterwards placed in water showed a greater mass loss as
AAO membranes annealed at 400 °C and also stored in water. The mass loss difference
amounted to 4%. It can be supposed that the annealing temperature affected the
possibility of AAO pore wall hydroxylation.
However, questions about the AAO pore wall chemistry (e.g., hydroxyl groups per area
depending on the annealing temperatures) have not been studied. Actually, it is not clear
which effect have higher temperatures (i.e., annealing at 400 °C) on the AAO pore wall
chemistry. For example, during heating BrØnsted acid centers might be reduced due to
water loss, and Lewis acid or Lewis base centers are formed. These results might be an
interesting starting point for deeper investigations.
4.2 Influence of AAO Preparation on EPR signals
AAO membranes (Table 4.1) for EPRb measurements had pore diameters ranging from
20/25 nm to 180 nm. For AAO preparation procedures see Chapter 2.1. The aluminum
substrate was etched away and some samples were chemically modified with ODPA.
Such samples are referred to as sf-mod ODPA. The etching process and AAO surface
b Universität Osnabrück, Fachbereich Physik, AK Steinhoff
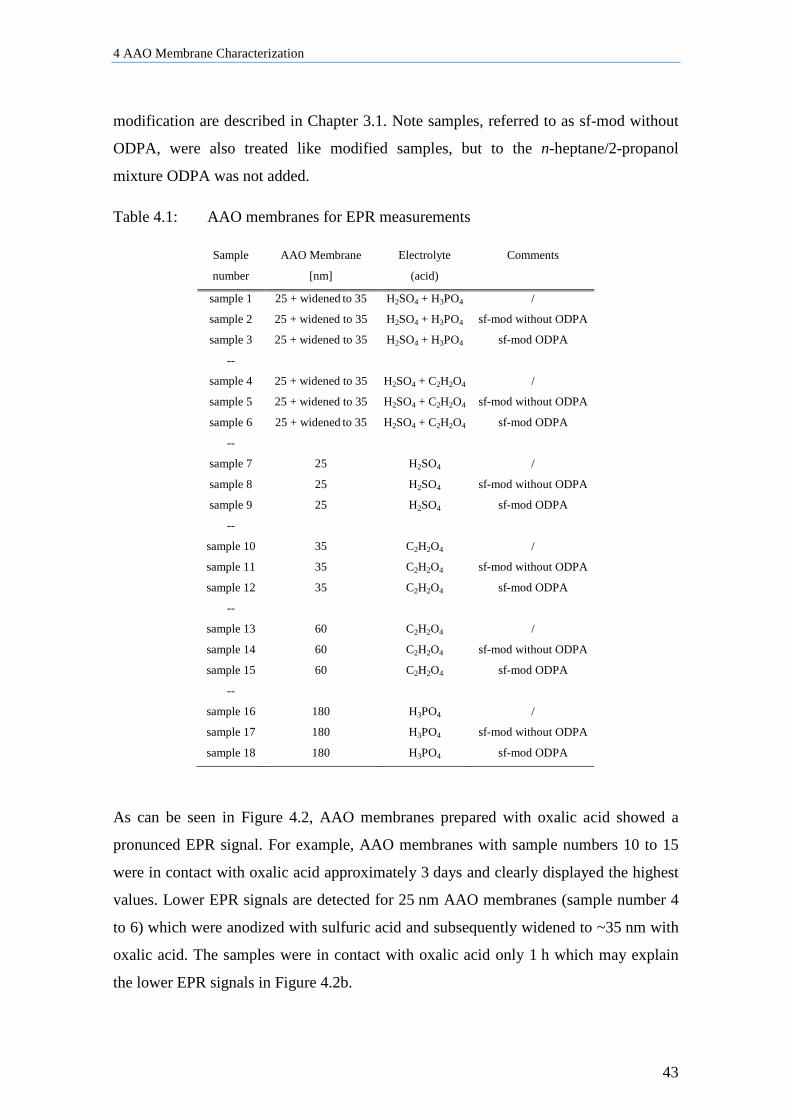
4 AAO Membrane Characterization
43
modification are described in Chapter 3.1. Note samples, referred to as sf-mod without
ODPA, were also treated like modified samples, but to the n-heptane/2-propanol
mixture ODPA was not added.
Table 4.1: AAO membranes for EPR measurements
Sample AAO Membrane Electrolyte Comments
number [nm] (acid)
sample 1 25 + widened to 35 H2SO4 + H3PO4 /
sample 2 25 + widened to 35 H2SO4 + H3PO4 sf-mod without ODPA
sample 3 25 + widened to 35 H2SO4 + H3PO4 sf-mod ODPA
--
sample 4 25 + widened to 35 H2SO4 + C2H2O4 /
sample 5 25 + widened to 35 H2SO4 + C2H2O4 sf-mod without ODPA
sample 6 25 + widened to 35 H2SO4 + C2H2O4 sf-mod ODPA
--
sample 7 25 H2SO4 /
sample 8 25 H2SO4 sf-mod without ODPA
sample 9 25 H2SO4 sf-mod ODPA
--
sample 10 35 C2H2O4 /
sample 11 35 C2H2O4 sf-mod without ODPA
sample 12 35 C2H2O4 sf-mod ODPA
--
sample 13 60 C2H2O4 /
sample 14 60 C2H2O4 sf-mod without ODPA
sample 15 60 C2H2O4 sf-mod ODPA
--
sample 16 180 H3PO4 /
sample 17 180 H3PO4 sf-mod without ODPA
sample 18 180 H3PO4 sf-mod ODPA
As can be seen in Figure 4.2, AAO membranes prepared with oxalic acid showed a
pronunced EPR signal. For example, AAO membranes with sample numbers 10 to 15
were in contact with oxalic acid approximately 3 days and clearly displayed the highest
values. Lower EPR signals are detected for 25 nm AAO membranes (sample number 4
to 6) which were anodized with sulfuric acid and subsequently widened to ~35 nm with
oxalic acid. The samples were in contact with oxalic acid only 1 h which may explain
the lower EPR signals in Figure 4.2b.
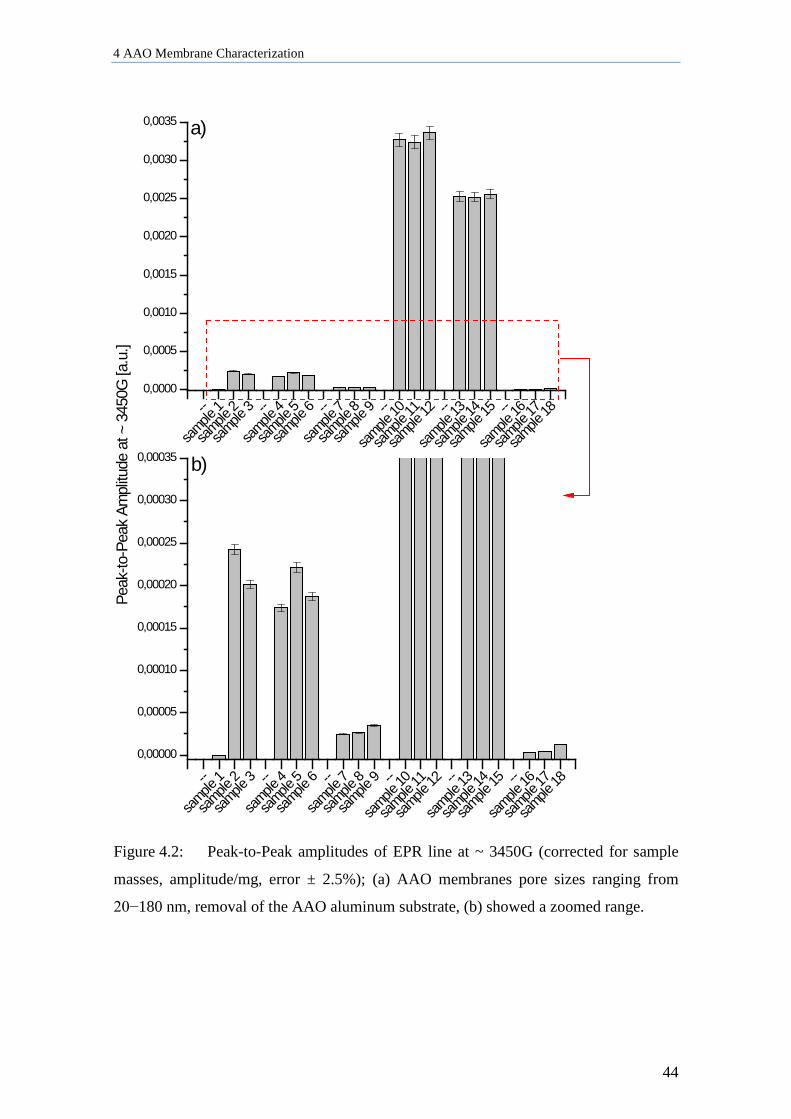
4 AAO Membrane Characterization
44
--
sample
1
sample
2
sample
3 --
sample
4
sample
5
sample
6 --
sample
7
sample
8
sample
9 --
sample
10
sample
11
sample
12 --
sample
13
sample
14
sample
15 --
sample
16
sample
17
sample
180,0000
0,0005
0,0010
0,0015
0,0020
0,0025
0,0030
0,0035
Peak
-to-P
eak
Ampl
itude
at ~
345
0G [a
.u.]
a)
--
sample
1
sample
2
sample
3 --
sample
4
sample
5
sample
6 --
sample
7
sample
8
sample
9 --
sample
10
sample
11
sample
12 --
sample
13
sample
14
sample
15 --
sample
16
sample
17
sample
18
0,00000
0,00005
0,00010
0,00015
0,00020
0,00025
0,00030
0,00035 b)
Figure 4.2: Peak-to-Peak amplitudes of EPR line at ~ 3450G (corrected for sample
masses, amplitude/mg, error ± 2.5%); (a) AAO membranes pore sizes ranging from
20−180 nm, removal of the AAO aluminum substrate, (b) showed a zoomed range.
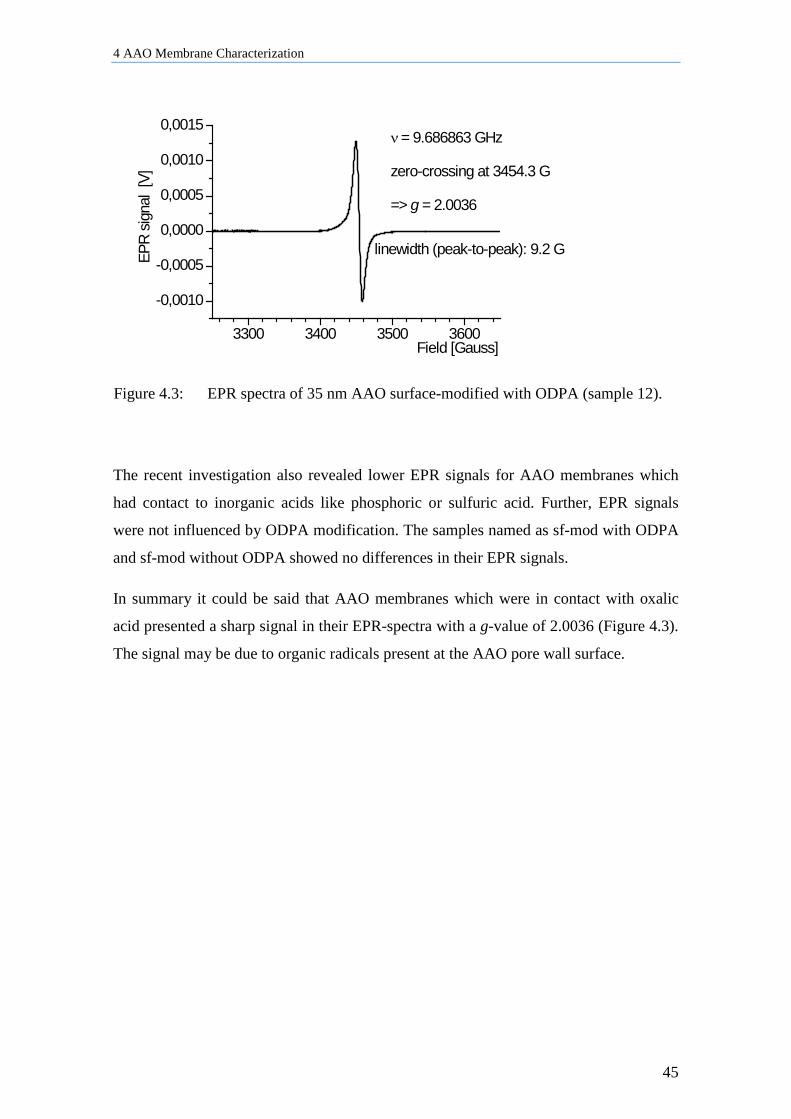
4 AAO Membrane Characterization
45
3300 3400 3500 3600
-0,0010
-0,0005
0,0000
0,0005
0,0010
0,0015EP
R sig
nal
[V]
Field [Gauss]
ν = 9.686863 GHz
zero-crossing at 3454.3 G
=> g = 2.0036
linewidth (peak-to-peak): 9.2 G
Figure 4.3: EPR spectra of 35 nm AAO surface-modified with ODPA (sample 12).
The recent investigation also revealed lower EPR signals for AAO membranes which
had contact to inorganic acids like phosphoric or sulfuric acid. Further, EPR signals
were not influenced by ODPA modification. The samples named as sf-mod with ODPA
and sf-mod without ODPA showed no differences in their EPR signals.
In summary it could be said that AAO membranes which were in contact with oxalic
acid presented a sharp signal in their EPR-spectra with a g-value of 2.0036 (Figure 4.3).
The signal may be due to organic radicals present at the AAO pore wall surface.
5 Acetaminophen Confined to Nanoporous Matrices
46
5 Acetaminophen Confined to Nanoporous Matrices
Acetaminophen (ACE), a low-molecular model weight drug, was solidified in isolated,
anisotropic AAO and in connected, isotropic CPG membranes. The influence of
crystallization conditions on nucleation and crystal growth was investigated. A basic
crystallization model is presented. Additional, the AAO membranes were used as drug
delivery carriers. In the second part acetaminophen was encapsulated in AAO
membranes and drug release studies were performed. Resulting dissolution profiles
were fitted to basic kinetic laws and to a mathematical model.
5.1 Influence of Crystallization Parameter on ACE in AAO
Membranes
Acetaminophen confined in anisotropic AAO membranes was used to study the
influence of crystallization parameters such as cooling rates, the presence or the absence
of a bulk surface reservoir on nucleation and crystal growth kinetics. The compound
was melt infiltrated and (i) quenched, or (ii) slowly cooled at a rate of −0.5 K/min.
Additionally, the infiltrated acetaminophen was cooled (iii) in the presence or (iv) in the
absence of a bulk surface reservoir. Preparation details can be found in Chapter 3.1. The
used AAO membranes had (v) pore sizes of 60 nm and pore depths of ~100 µm. These
five variations of the crystallization parameters will have an impact on the
crystallization behavior of acetaminophen under confinement compared to its bulk
counterpart. The material embedded in AAO was investigated with X-ray diffraction
and DSC measurements.
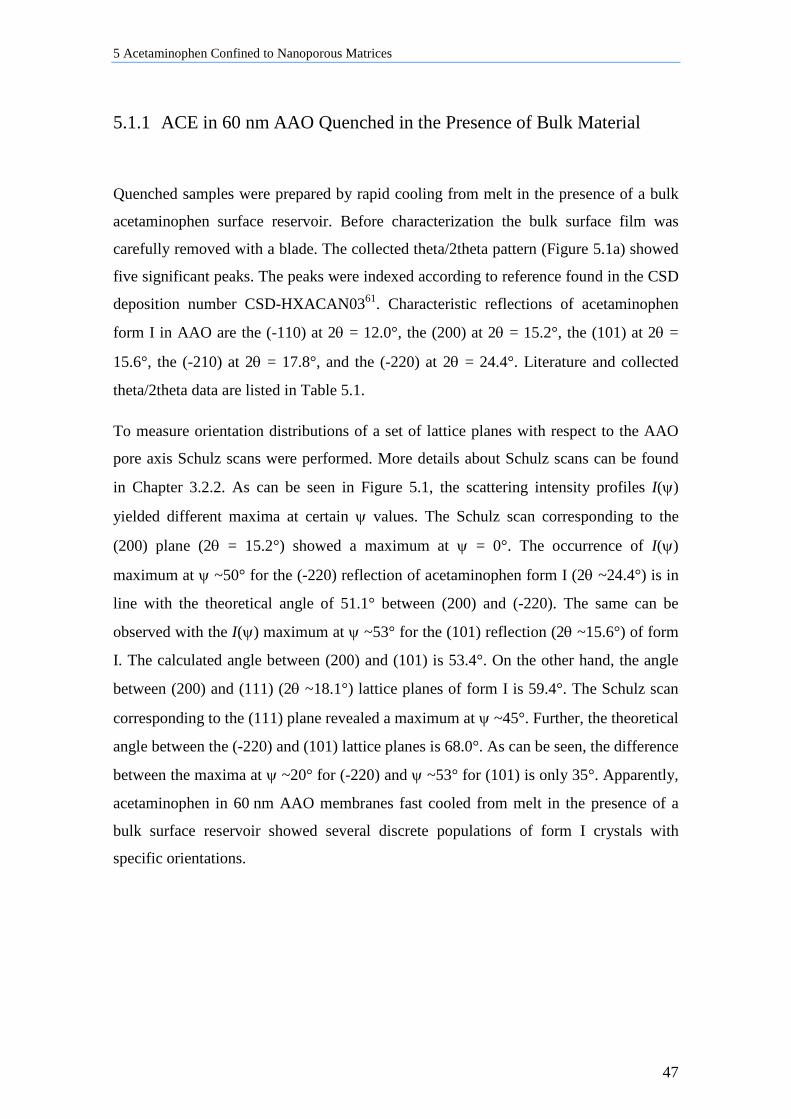
5 Acetaminophen Confined to Nanoporous Matrices
47
5.1.1 ACE in 60 nm AAO Quenched in the Presence of Bulk Material
Quenched samples were prepared by rapid cooling from melt in the presence of a bulk
acetaminophen surface reservoir. Before characterization the bulk surface film was
carefully removed with a blade. The collected theta/2theta pattern (Figure 5.1a) showed
five significant peaks. The peaks were indexed according to reference found in the CSD
deposition number CSD-HXACAN0361. Characteristic reflections of acetaminophen
form I in AAO are the (-110) at 2θ = 12.0°, the (200) at 2θ = 15.2°, the (101) at 2θ =
15.6°, the (-210) at 2θ = 17.8°, and the (-220) at 2θ = 24.4°. Literature and collected
theta/2theta data are listed in Table 5.1.
To measure orientation distributions of a set of lattice planes with respect to the AAO
pore axis Schulz scans were performed. More details about Schulz scans can be found
in Chapter 3.2.2. As can be seen in Figure 5.1, the scattering intensity profiles I(ψ)
yielded different maxima at certain ψ values. The Schulz scan corresponding to the
(200) plane (2θ = 15.2°) showed a maximum at ψ = 0°. The occurrence of I(ψ)
maximum at ψ ~50° for the (-220) reflection of acetaminophen form I (2θ ~24.4°) is in
line with the theoretical angle of 51.1° between (200) and (-220). The same can be
observed with the I(ψ) maximum at ψ ~53° for the (101) reflection (2θ ~15.6°) of form
I. The calculated angle between (200) and (101) is 53.4°. On the other hand, the angle
between (200) and (111) (2θ ~18.1°) lattice planes of form I is 59.4°. The Schulz scan
corresponding to the (111) plane revealed a maximum at ψ ~45°. Further, the theoretical
angle between the (-220) and (101) lattice planes is 68.0°. As can be seen, the difference
between the maxima at ψ ~20° for (-220) and ψ ~53° for (101) is only 35°. Apparently,
acetaminophen in 60 nm AAO membranes fast cooled from melt in the presence of a
bulk surface reservoir showed several discrete populations of form I crystals with
specific orientations.
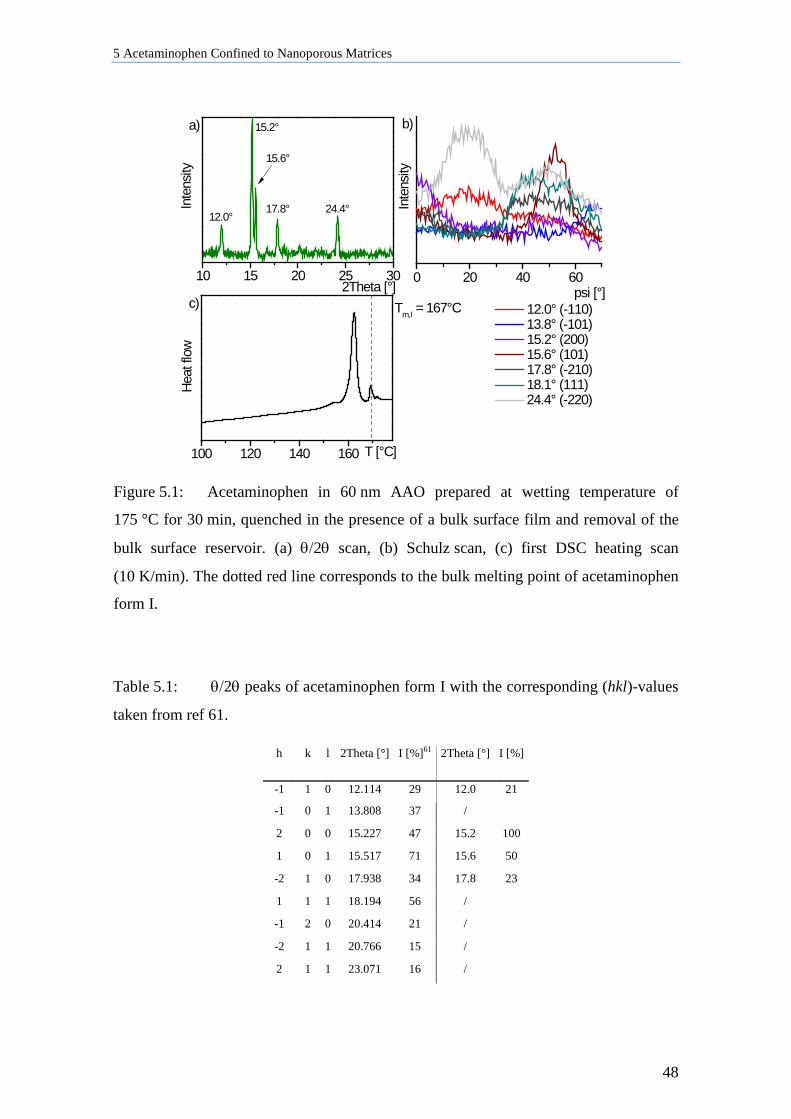
5 Acetaminophen Confined to Nanoporous Matrices
48
10 15 20 25 30 0 20 40 60
100 120 140 160
Inte
nsity
b)
24.4°
15.6°
17.8°
15.2°
Inte
nsity
2Theta [°]
12.0°
a)
12.0° (-110) 13.8° (-101) 15.2° (200) 15.6° (101) 17.8° (-210) 18.1° (111) 24.4° (-220)
psi [°]
Heat
flow
T [°C]
Tm,I = 167°Cc)
Figure 5.1: Acetaminophen in 60 nm AAO prepared at wetting temperature of
175 °C for 30 min, quenched in the presence of a bulk surface film and removal of the
bulk surface reservoir. (a) θ/2θ scan, (b) Schulz scan, (c) first DSC heating scan
(10 K/min). The dotted red line corresponds to the bulk melting point of acetaminophen
form I.
Table 5.1: θ/2θ peaks of acetaminophen form I with the corresponding (hkl)-values
taken from ref 61.
h k l 2Theta [°] I [%]61 2Theta [°] I [%]
-1 1 0 12.114 29 12.0 21
-1 0 1 13.808 37 /
2 0 0 15.227 47 15.2 100
1 0 1 15.517 71 15.6 50
-2 1 0 17.938 34 17.8 23
1 1 1 18.194 56 /
-1 2 0 20.414 21 /
-2 1 1 20.766 15 /
2 1 1 23.071 16 /
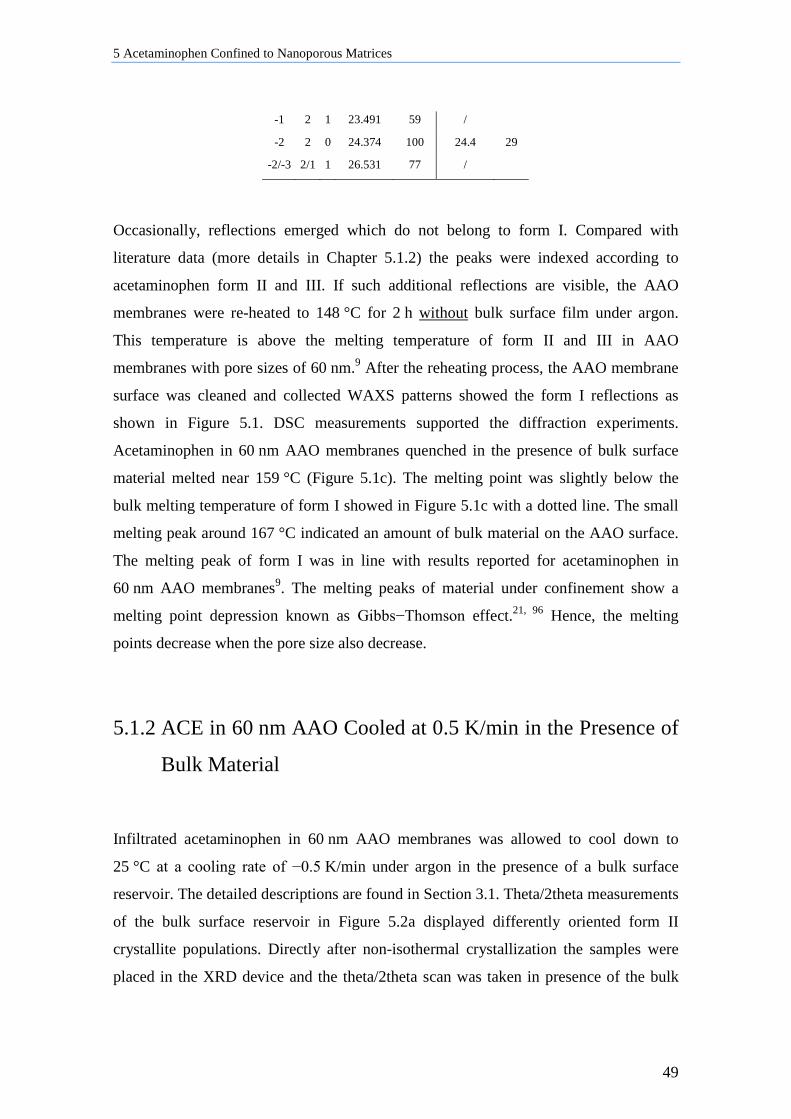
5 Acetaminophen Confined to Nanoporous Matrices
49
-1 2 1 23.491 59 /
-2 2 0 24.374 100 24.4 29
-2/-3 2/1 1 26.531 77 /
Occasionally, reflections emerged which do not belong to form I. Compared with
literature data (more details in Chapter 5.1.2) the peaks were indexed according to
acetaminophen form II and III. If such additional reflections are visible, the AAO
membranes were re-heated to 148 °C for 2 h without bulk surface film under argon.
This temperature is above the melting temperature of form II and III in AAO
membranes with pore sizes of 60 nm.9 After the reheating process, the AAO membrane
surface was cleaned and collected WAXS patterns showed the form I reflections as
shown in Figure 5.1. DSC measurements supported the diffraction experiments.
Acetaminophen in 60 nm AAO membranes quenched in the presence of bulk surface
material melted near 159 °C (Figure 5.1c). The melting point was slightly below the
bulk melting temperature of form I showed in Figure 5.1c with a dotted line. The small
melting peak around 167 °C indicated an amount of bulk material on the AAO surface.
The melting peak of form I was in line with results reported for acetaminophen in
60 nm AAO membranes9. The melting peaks of material under confinement show a
melting point depression known as Gibbs−Thomson effect.21, 96 Hence, the melting
points decrease when the pore size also decrease.
5.1.2 ACE in 60 nm AAO Cooled at 0.5 K/min in the Presence of
Bulk Material
Infiltrated acetaminophen in 60 nm AAO membranes was allowed to cool down to
25 °C at a cooling rate of −0.5 K/min under argon in the presence of a bulk surface
reservoir. The detailed descriptions are found in Section 3.1. Theta/2theta measurements
of the bulk surface reservoir in Figure 5.2a displayed differently oriented form II
crystallite populations. Directly after non-isothermal crystallization the samples were
placed in the XRD device and the theta/2theta scan was taken in presence of the bulk
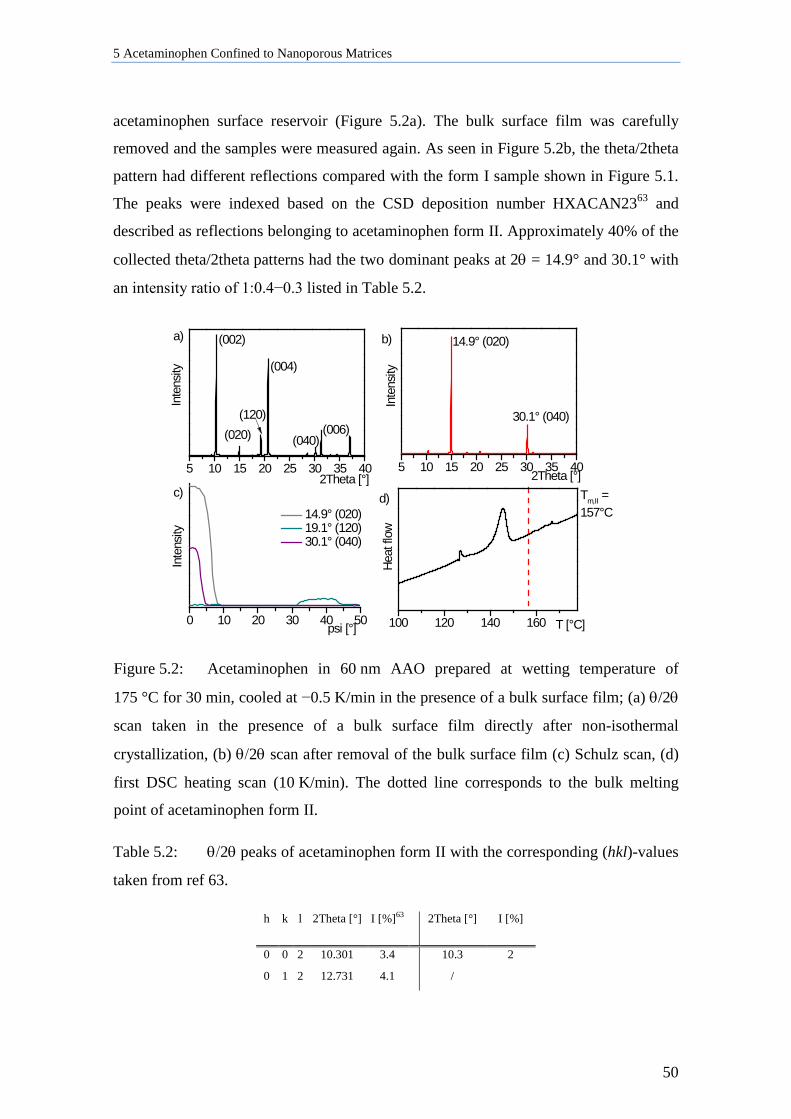
5 Acetaminophen Confined to Nanoporous Matrices
50
acetaminophen surface reservoir (Figure 5.2a). The bulk surface film was carefully
removed and the samples were measured again. As seen in Figure 5.2b, the theta/2theta
pattern had different reflections compared with the form I sample shown in Figure 5.1.
The peaks were indexed based on the CSD deposition number HXACAN2363 and
described as reflections belonging to acetaminophen form II. Approximately 40% of the
collected theta/2theta patterns had the two dominant peaks at 2θ = 14.9° and 30.1° with
an intensity ratio of 1:0.4−0.3 listed in Table 5.2.
5 10 15 20 25 30 35 405 10 15 20 25 30 35 40
0 10 20 30 40 50 100 120 140 160
30.1° (040)
Inte
nsity
2Theta [°]
14.9° (020)
(120)
(040)(006)
(004)
(020)
Inte
nsity
2Theta [°]
(002)
14.9° (020) 19.1° (120) 30.1° (040)
Inte
nsity
psi [°]
Heat
flow
T [°C]
Tm,II = 157°C
b)
d)c)
a)
Figure 5.2: Acetaminophen in 60 nm AAO prepared at wetting temperature of
175 °C for 30 min, cooled at −0.5 K/min in the presence of a bulk surface film; (a) θ/2θ
scan taken in the presence of a bulk surface film directly after non-isothermal
crystallization, (b) θ/2θ scan after removal of the bulk surface film (c) Schulz scan, (d)
first DSC heating scan (10 K/min). The dotted line corresponds to the bulk melting
point of acetaminophen form II.
Table 5.2: θ/2θ peaks of acetaminophen form II with the corresponding (hkl)-values
taken from ref 63.
h k l 2Theta [°] I [%]63 2Theta [°] I [%]
0 0 2 10.301 3.4
10.3 2
0 1 2 12.731 4.1 /
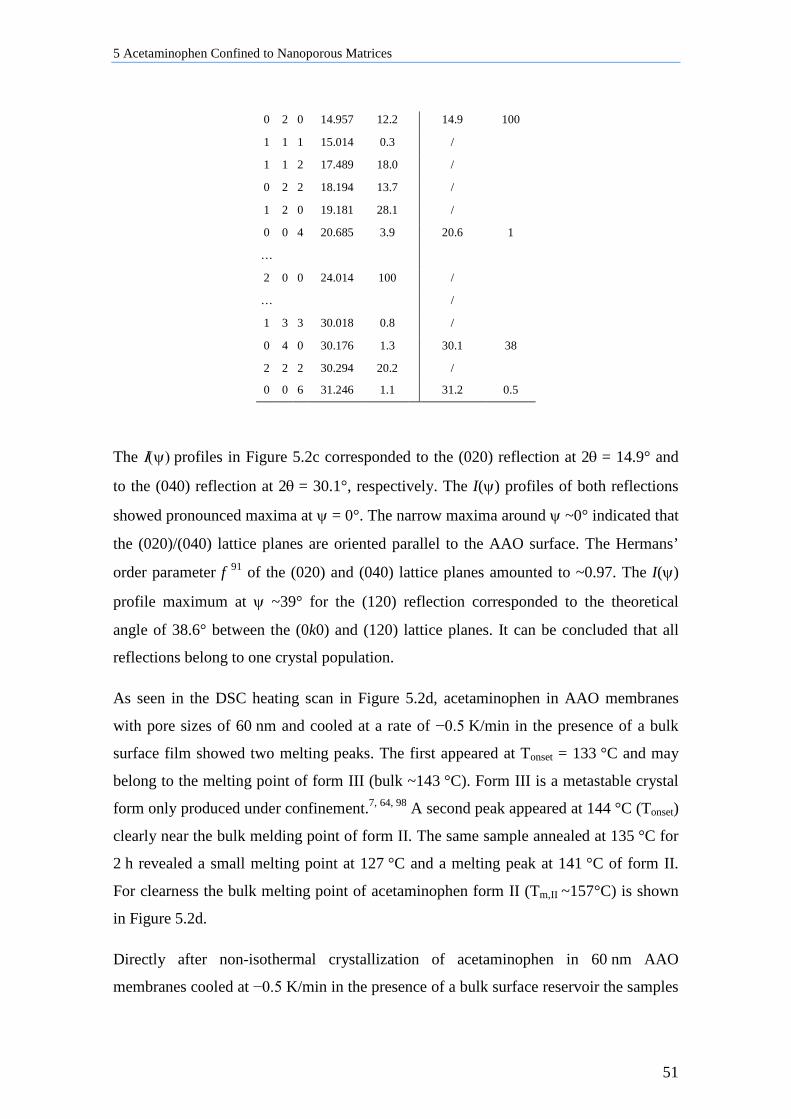
5 Acetaminophen Confined to Nanoporous Matrices
51
0 2 0 14.957 12.2
14.9 100
1 1 1 15.014 0.3
/
1 1 2 17.489 18.0
/
0 2 2 18.194 13.7 /
1 2 0 19.181 28.1
/
0 0 4 20.685 3.9
20.6 1
…
2 0 0 24.014 100 /
…
/
1 3 3 30.018 0.8
/
0 4 0 30.176 1.3
30.1 38
2 2 2 30.294 20.2 /
0 0 6 31.246 1.1
31.2 0.5
The Ι(ψ) profiles in Figure 5.2c corresponded to the (020) reflection at 2θ = 14.9° and
to the (040) reflection at 2θ = 30.1°, respectively. The I(ψ) profiles of both reflections
showed pronounced maxima at ψ = 0°. The narrow maxima around ψ ~0° indicated that
the (020)/(040) lattice planes are oriented parallel to the AAO surface. The Hermans’
order parameter f 91 of the (020) and (040) lattice planes amounted to ~0.97. The I(ψ)
profile maximum at ψ ~39° for the (120) reflection corresponded to the theoretical
angle of 38.6° between the (0k0) and (120) lattice planes. It can be concluded that all
reflections belong to one crystal population.
As seen in the DSC heating scan in Figure 5.2d, acetaminophen in AAO membranes
with pore sizes of 60 nm and cooled at a rate of −0.5 K/min in the presence of a bulk
surface film showed two melting peaks. The first appeared at Tonset = 133 °C and may
belong to the melting point of form III (bulk ~143 °C). Form III is a metastable crystal
form only produced under confinement.7, 64, 98 A second peak appeared at 144 °C (Tonset)
clearly near the bulk melding point of form II. The same sample annealed at 135 °C for
2 h revealed a small melting point at 127 °C and a melting peak at 141 °C of form II.
For clearness the bulk melting point of acetaminophen form II (Tm,II ~157°C) is shown
in Figure 5.2d.
Directly after non-isothermal crystallization of acetaminophen in 60 nm AAO
membranes cooled at −0.5 K/min in the presence of a bulk surface reservoir the samples
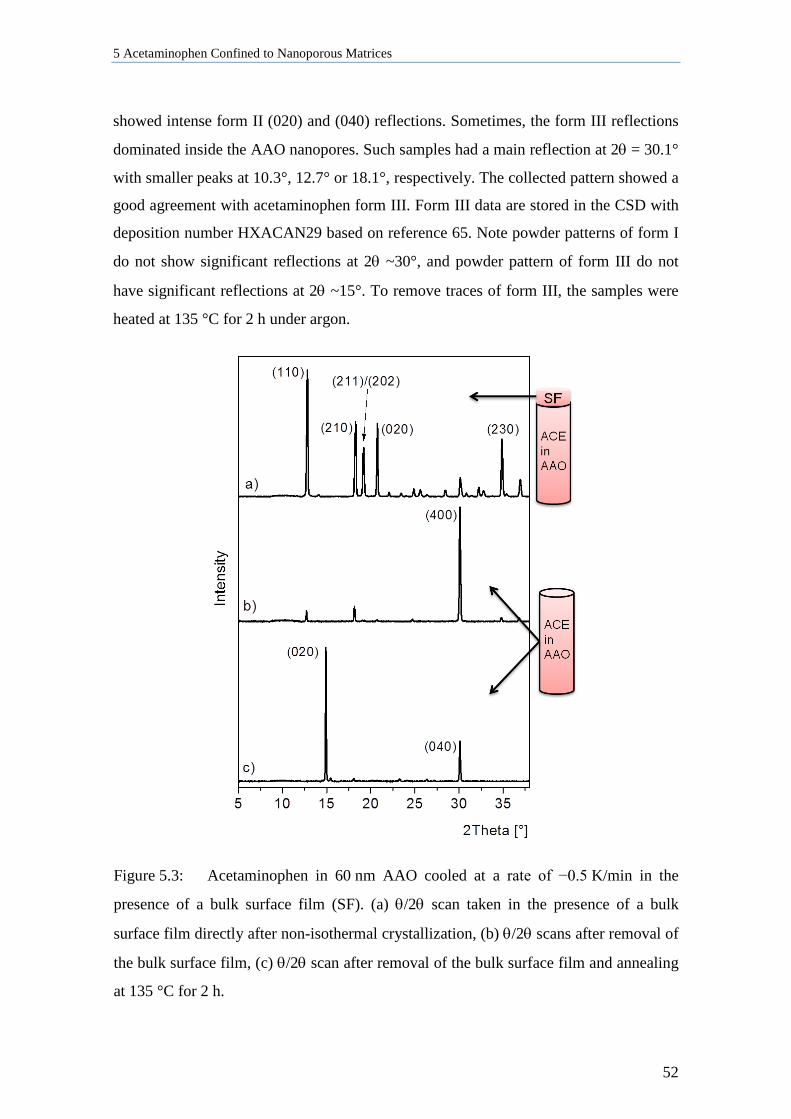
5 Acetaminophen Confined to Nanoporous Matrices
52
showed intense form II (020) and (040) reflections. Sometimes, the form III reflections
dominated inside the AAO nanopores. Such samples had a main reflection at 2θ = 30.1°
with smaller peaks at 10.3°, 12.7° or 18.1°, respectively. The collected pattern showed a
good agreement with acetaminophen form III. Form III data are stored in the CSD with
deposition number HXACAN29 based on reference 65. Note powder patterns of form I
do not show significant reflections at 2θ ~30°, and powder pattern of form III do not
have significant reflections at 2θ ~15°. To remove traces of form III, the samples were
heated at 135 °C for 2 h under argon.
Figure 5.3: Acetaminophen in 60 nm AAO cooled at a rate of −0.5 K/min in the
presence of a bulk surface film (SF). (a) θ/2θ scan taken in the presence of a bulk
surface film directly after non-isothermal crystallization, (b) θ/2θ scans after removal of
the bulk surface film, (c) θ/2θ scan after removal of the bulk surface film and annealing
at 135 °C for 2 h.
5 Acetaminophen Confined to Nanoporous Matrices
53
Several form III reflections originating from crystals in the bulk surface film can be
seen in Figure 5.3a. After removal of the bulk surface material, the pattern is dominated
by a strong reflection at 2θ = 30.1° (Figure 5.3b). Annealing at 135 °C for 2 h without
bulk surface film converted form III crystals into form II crystals indicated by the
appearance of strong reflections at 2θ = 14.9° and 30.1°, respectively (Figure 5.3c). At
this temperature form III melts in 60 nm AAO membranes according to the estimated
melting point in reference 9.
In general, acetaminophen in AAO membranes with pore sizes of 60 nm and cooled at
−0.5 K/min in the presence of a bulk surface reservoir yielded highly oriented form II
and/or form III crystals. These results will be discussed in Chapter 5.5.1.
5.1.3 Amorphous ACE in 60 nm AAO Membranes
A former study22 shows that crystallization of acetaminophen is completely suppressed
in CPG membranes with pore sizes of 4.6 nm. Based on these reports, acetaminophen in
60 nm AAO membranes was quenched or cooled at a rate of −0.5 K/min in the absence
of a bulk surface reservoir. Independently from the cooling rates the confined material
displayed no reflection during the theta/2theta scan (Figure 5.4).
First DSC heating scans in Figure 5.4b showed a small melting peak at Tonset = 152 °C.
It might be assumed that the material inside AAO pores is not fully amorphous and
small volume fractions could be crystalline. DSC measurements involved the removal
of the aluminum substrate. During the etching process the AAO membrane was slightly
heated up which may influence the possibility for crystallization.
Amorphous samples stored for a certain time period under ambient conditions revealed
crystalline structures. For example, an amorphous AAO sample showed reflection of
acetaminophen form I after 9 month storage (Figure 5.4c). Schulz scans (Figure 5.4d)
revealed the coexistence of several populations of form I crystals with different
orientations. This result is in line with acetaminophen form I in 60 nm AAO membranes
as shown in Chapter 5.1.1.
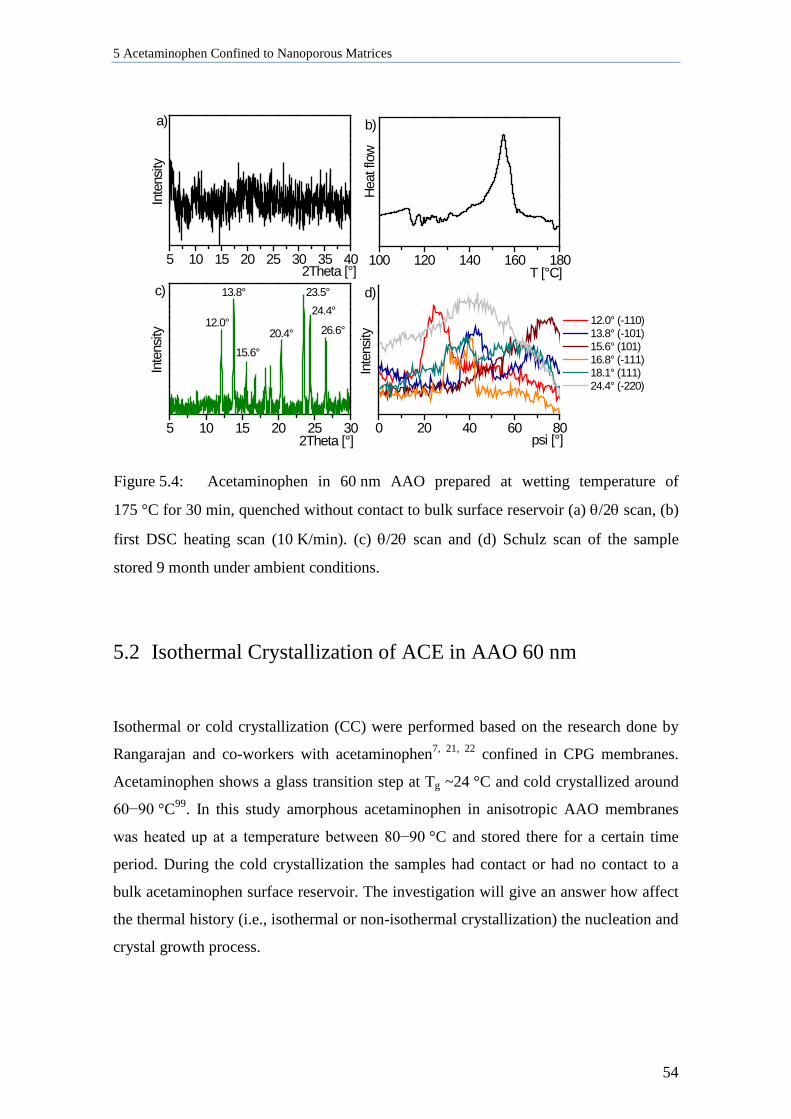
5 Acetaminophen Confined to Nanoporous Matrices
54
5 10 15 20 25 30 35 40 100 120 140 160 180
5 10 15 20 25 30 0 20 40 60 80
Inte
nsity
2Theta [°]
Heat
flow
T [°C]
15.6°
26.6°
24.4°23.5°
20.4°
13.8°
Inte
nsity
2Theta [°]
12.0°
12.0° (-110) 13.8° (-101) 15.6° (101) 16.8° (-111) 18.1° (111) 24.4° (-220)
Inte
nsity
psi [°]
d)c)
b)a)
Figure 5.4: Acetaminophen in 60 nm AAO prepared at wetting temperature of
175 °C for 30 min, quenched without contact to bulk surface reservoir (a) θ/2θ scan, (b)
first DSC heating scan (10 K/min). (c) θ/2θ scan and (d) Schulz scan of the sample
stored 9 month under ambient conditions.
5.2 Isothermal Crystallization of ACE in AAO 60 nm
Isothermal or cold crystallization (CC) were performed based on the research done by
Rangarajan and co-workers with acetaminophen7, 21, 22 confined in CPG membranes.
Acetaminophen shows a glass transition step at Tg ~24 °C and cold crystallized around
60−90 °C99. In this study amorphous acetaminophen in anisotropic AAO membranes
was heated up at a temperature between 80−90 °C and stored there for a certain time
period. During the cold crystallization the samples had contact or had no contact to a
bulk acetaminophen surface reservoir. The investigation will give an answer how affect
the thermal history (i.e., isothermal or non-isothermal crystallization) the nucleation and
crystal growth process.
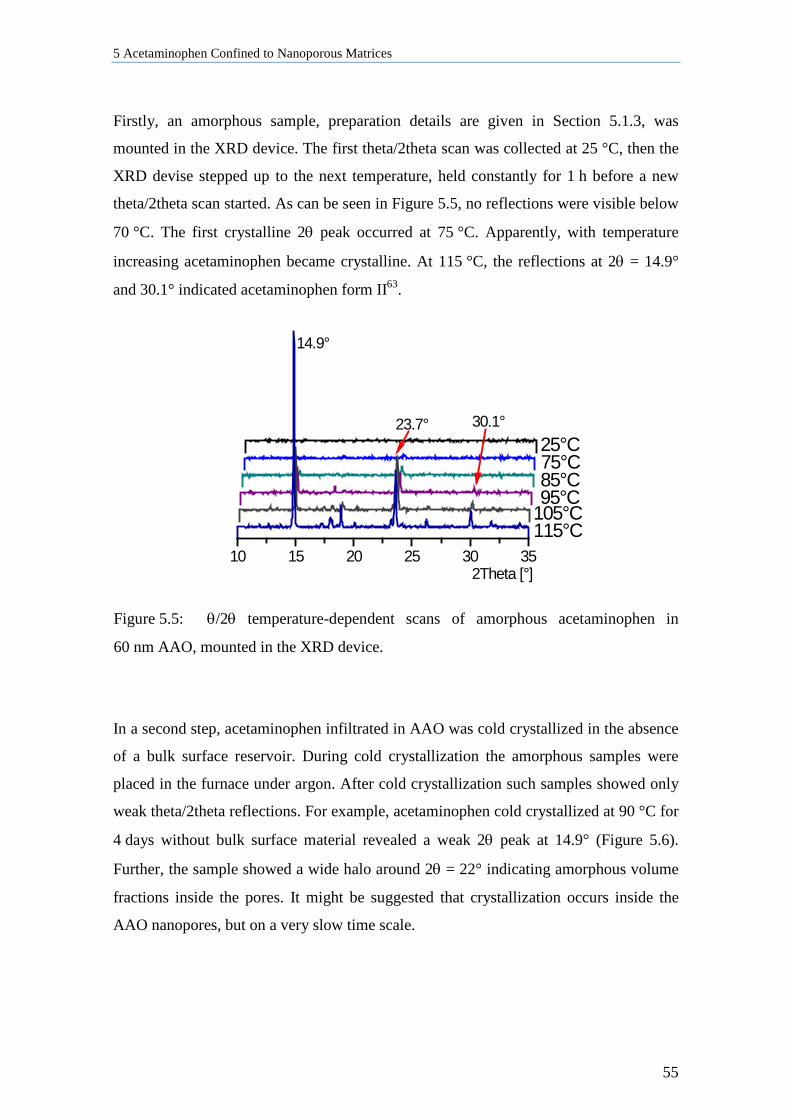
5 Acetaminophen Confined to Nanoporous Matrices
55
Firstly, an amorphous sample, preparation details are given in Section 5.1.3, was
mounted in the XRD device. The first theta/2theta scan was collected at 25 °C, then the
XRD devise stepped up to the next temperature, held constantly for 1 h before a new
theta/2theta scan started. As can be seen in Figure 5.5, no reflections were visible below
70 °C. The first crystalline 2θ peak occurred at 75 °C. Apparently, with temperature
increasing acetaminophen became crystalline. At 115 °C, the reflections at 2θ = 14.9°
and 30.1° indicated acetaminophen form II63.
10 15 20 25 30 35
14.9°
30.1°
115°C105°C
25°C
95°C85°C75°C
2Theta [°]
23.7°
Figure 5.5: θ/2θ temperature-dependent scans of amorphous acetaminophen in
60 nm AAO, mounted in the XRD device.
In a second step, acetaminophen infiltrated in AAO was cold crystallized in the absence
of a bulk surface reservoir. During cold crystallization the amorphous samples were
placed in the furnace under argon. After cold crystallization such samples showed only
weak theta/2theta reflections. For example, acetaminophen cold crystallized at 90 °C for
4 days without bulk surface material revealed a weak 2θ peak at 14.9° (Figure 5.6).
Further, the sample showed a wide halo around 2θ = 22° indicating amorphous volume
fractions inside the pores. It might be suggested that crystallization occurs inside the
AAO nanopores, but on a very slow time scale.
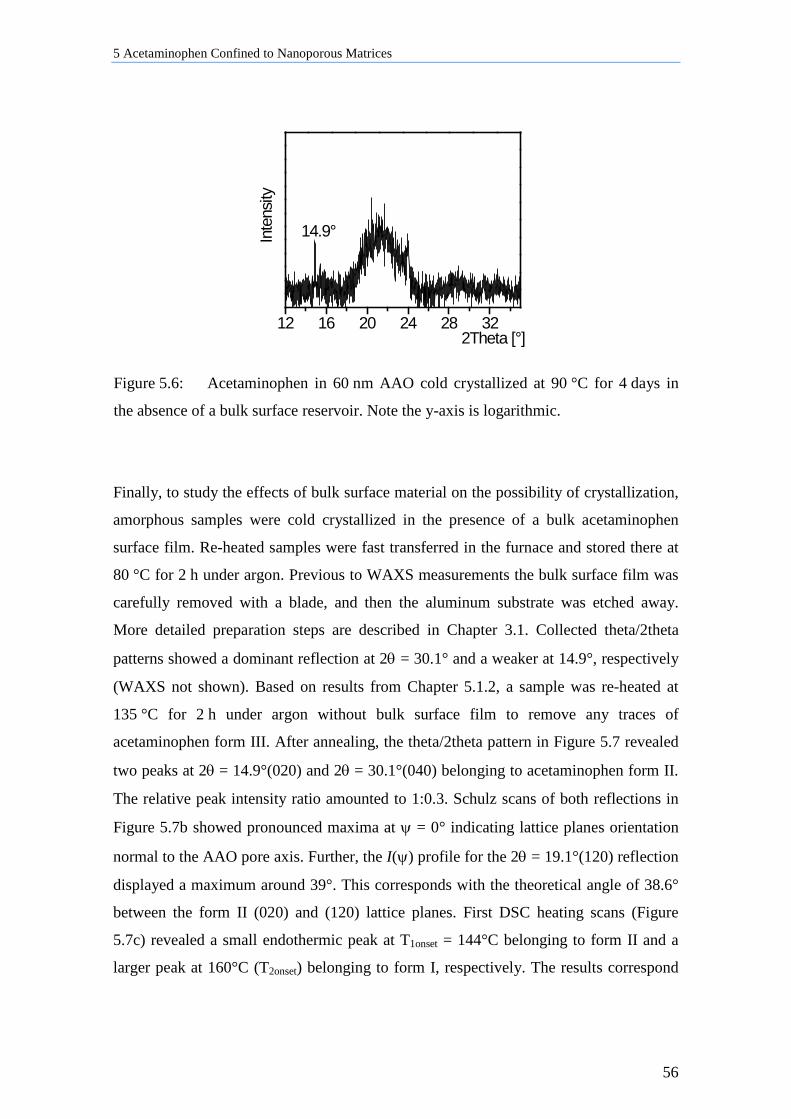
5 Acetaminophen Confined to Nanoporous Matrices
56
12 16 20 24 28 32
Inte
nsity
2Theta [°]
14.9°
Figure 5.6: Acetaminophen in 60 nm AAO cold crystallized at 90 °C for 4 days in
the absence of a bulk surface reservoir. Note the y-axis is logarithmic.
Finally, to study the effects of bulk surface material on the possibility of crystallization,
amorphous samples were cold crystallized in the presence of a bulk acetaminophen
surface film. Re-heated samples were fast transferred in the furnace and stored there at
80 °C for 2 h under argon. Previous to WAXS measurements the bulk surface film was
carefully removed with a blade, and then the aluminum substrate was etched away.
More detailed preparation steps are described in Chapter 3.1. Collected theta/2theta
patterns showed a dominant reflection at 2θ = 30.1° and a weaker at 14.9°, respectively
(WAXS not shown). Based on results from Chapter 5.1.2, a sample was re-heated at
135 °C for 2 h under argon without bulk surface film to remove any traces of
acetaminophen form III. After annealing, the theta/2theta pattern in Figure 5.7 revealed
two peaks at 2θ = 14.9°(020) and 2θ = 30.1°(040) belonging to acetaminophen form II.
The relative peak intensity ratio amounted to 1:0.3. Schulz scans of both reflections in
Figure 5.7b showed pronounced maxima at ψ = 0° indicating lattice planes orientation
normal to the AAO pore axis. Further, the I(ψ) profile for the 2θ = 19.1°(120) reflection
displayed a maximum around 39°. This corresponds with the theoretical angle of 38.6°
between the form II (020) and (120) lattice planes. First DSC heating scans (Figure
5.7c) revealed a small endothermic peak at T1onset = 144°C belonging to form II and a
larger peak at 160°C (T2onset) belonging to form I, respectively. The results correspond

5 Acetaminophen Confined to Nanoporous Matrices
57
to the expected melting temperatures for acetaminophen form I and form II in AAO
membranes with pore sizes of 60 nm9.
5 10 15 20 25 30 35 0 10 20 30 40 50 60
100 120 140 160
Inte
nsity
2Theta [°]
14.9°(020)
30.1°(040)
a)
14.9° (020) 19.1° (120) 30.1° (040)
Inte
nsity
psi [°]
b)
T2
Hea
t flo
w
T [°C]
c)
T1
Figure 5.7: Acetaminophen in 60 nm AAO cold crystallized at 80 °C for 2 h in the
presence of a bulk surface film, removal of the bulk surface material, and annealing at
135 °C for 2 h; (a) θ/2θ scan, (b) Schulz scan, (c) first DSC heating scan (10 K/min).
5.3 ACE in Controlled Porous Glasses (CPG)
Confined acetaminophen in AAO membranes revealed that the crystallization system is
sensitive to changes in the crystallization conditions. Moreover, different crystallization
conditions offer new ways to stabilize crystal forms which are inaccessible in bulk
material. However, the crystallization experiments were done in cylindrical, isolated
pores. To change the pore morphology a second host matrix with connected nanopores
has been selected. Acetaminophen was infiltrated in 60 nm CPG membranes on a hot-
stage at 180 °C for 2 min, the samples details are given in Chapter 3.1. The hot CPG
membranes were placed in the furnace, and (i) quenched, or (ii) cooled at a rate of
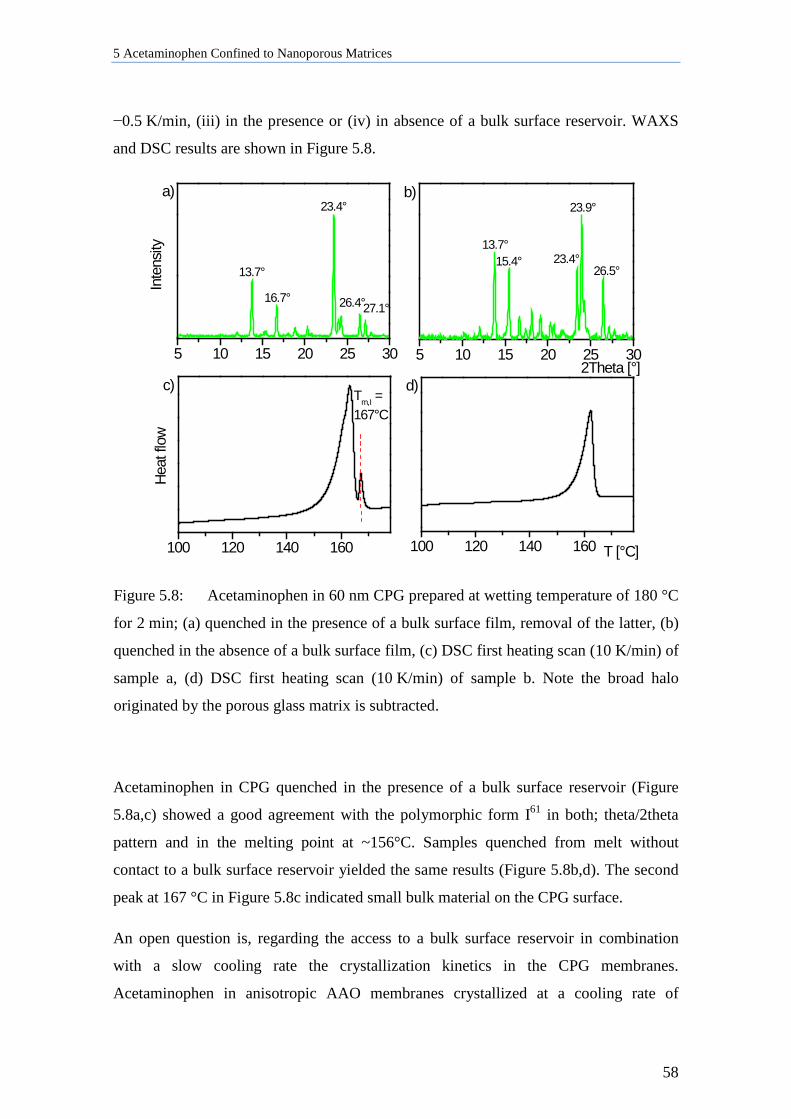
5 Acetaminophen Confined to Nanoporous Matrices
58
−0.5 K/min, (iii) in the presence or (iv) in absence of a bulk surface reservoir. WAXS
and DSC results are shown in Figure 5.8.
5 10 15 20 25 30 5 10 15 20 25 30
100 120 140 160 100 120 140 160
27.1°26.4°
23.4°
16.7°
Inte
nsity
13.7°
a)
26.5°
23.9°
23.4°15.4°
2Theta [°]
13.7°
b)
Heat
flow
c)Tm,I = 167°C
T [°C]
d)
Figure 5.8: Acetaminophen in 60 nm CPG prepared at wetting temperature of 180 °C
for 2 min; (a) quenched in the presence of a bulk surface film, removal of the latter, (b)
quenched in the absence of a bulk surface film, (c) DSC first heating scan (10 K/min) of
sample a, (d) DSC first heating scan (10 K/min) of sample b. Note the broad halo
originated by the porous glass matrix is subtracted.
Acetaminophen in CPG quenched in the presence of a bulk surface reservoir (Figure
5.8a,c) showed a good agreement with the polymorphic form I61 in both; theta/2theta
pattern and in the melting point at ~156°C. Samples quenched from melt without
contact to a bulk surface reservoir yielded the same results (Figure 5.8b,d). The second
peak at 167 °C in Figure 5.8c indicated small bulk material on the CPG surface.
An open question is, regarding the access to a bulk surface reservoir in combination
with a slow cooling rate the crystallization kinetics in the CPG membranes.
Acetaminophen in anisotropic AAO membranes crystallized at a cooling rate of
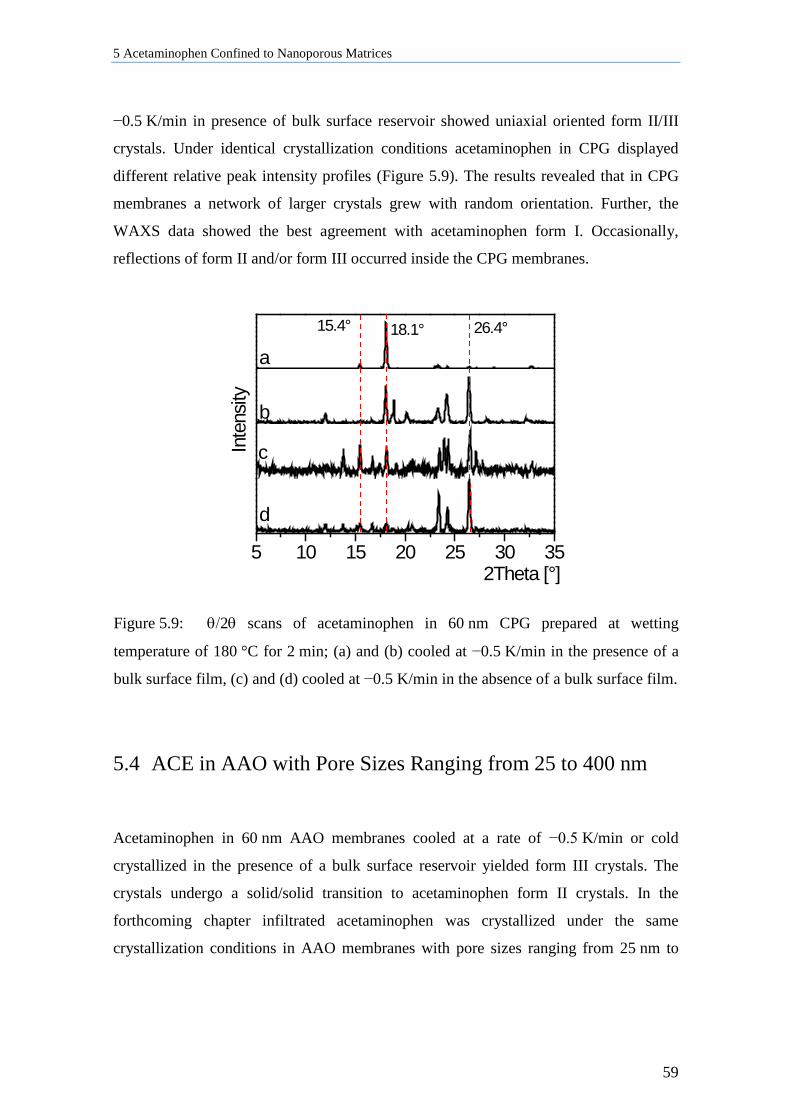
5 Acetaminophen Confined to Nanoporous Matrices
59
−0.5 K/min in presence of bulk surface reservoir showed uniaxial oriented form II/III
crystals. Under identical crystallization conditions acetaminophen in CPG displayed
different relative peak intensity profiles (Figure 5.9). The results revealed that in CPG
membranes a network of larger crystals grew with random orientation. Further, the
WAXS data showed the best agreement with acetaminophen form I. Occasionally,
reflections of form II and/or form III occurred inside the CPG membranes.
5 10 15 20 25 30 35
Inte
nsity
26.4°18.1°
15.4°
a
b
c
d 2Theta [°]
Figure 5.9: θ/2θ scans of acetaminophen in 60 nm CPG prepared at wetting
temperature of 180 °C for 2 min; (a) and (b) cooled at −0.5 K/min in the presence of a
bulk surface film, (c) and (d) cooled at −0.5 K/min in the absence of a bulk surface film.
5.4 ACE in AAO with Pore Sizes Ranging from 25 to 400 nm
Acetaminophen in 60 nm AAO membranes cooled at a rate of −0.5 K/min or cold
crystallized in the presence of a bulk surface reservoir yielded form III crystals. The
crystals undergo a solid/solid transition to acetaminophen form II crystals. In the
forthcoming chapter infiltrated acetaminophen was crystallized under the same
crystallization conditions in AAO membranes with pore sizes ranging from 25 nm to
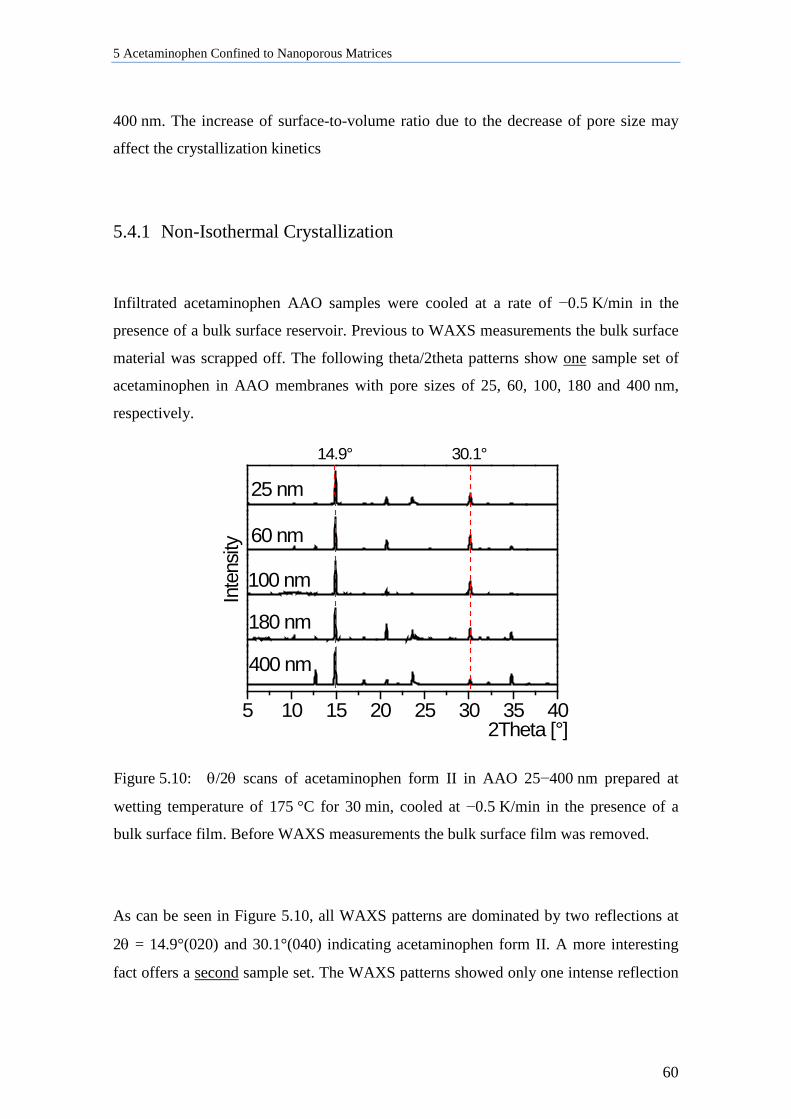
5 Acetaminophen Confined to Nanoporous Matrices
60
400 nm. The increase of surface-to-volume ratio due to the decrease of pore size may
affect the crystallization kinetics
5.4.1 Non-Isothermal Crystallization
Infiltrated acetaminophen AAO samples were cooled at a rate of −0.5 K/min in the
presence of a bulk surface reservoir. Previous to WAXS measurements the bulk surface
material was scrapped off. The following theta/2theta patterns show one sample set of
acetaminophen in AAO membranes with pore sizes of 25, 60, 100, 180 and 400 nm,
respectively.
5 10 15 20 25 30 35 40
400 nm
2Theta [°]
180 nm
30.1°14.9°
100 nm Inte
nsity 60 nm
25 nm
Figure 5.10: θ/2θ scans of acetaminophen form II in AAO 25−400 nm prepared at
wetting temperature of 175 °C for 30 min, cooled at −0.5 K/min in the presence of a
bulk surface film. Before WAXS measurements the bulk surface film was removed.
As can be seen in Figure 5.10, all WAXS patterns are dominated by two reflections at
2θ = 14.9°(020) and 30.1°(040) indicating acetaminophen form II. A more interesting
fact offers a second sample set. The WAXS patterns showed only one intense reflection
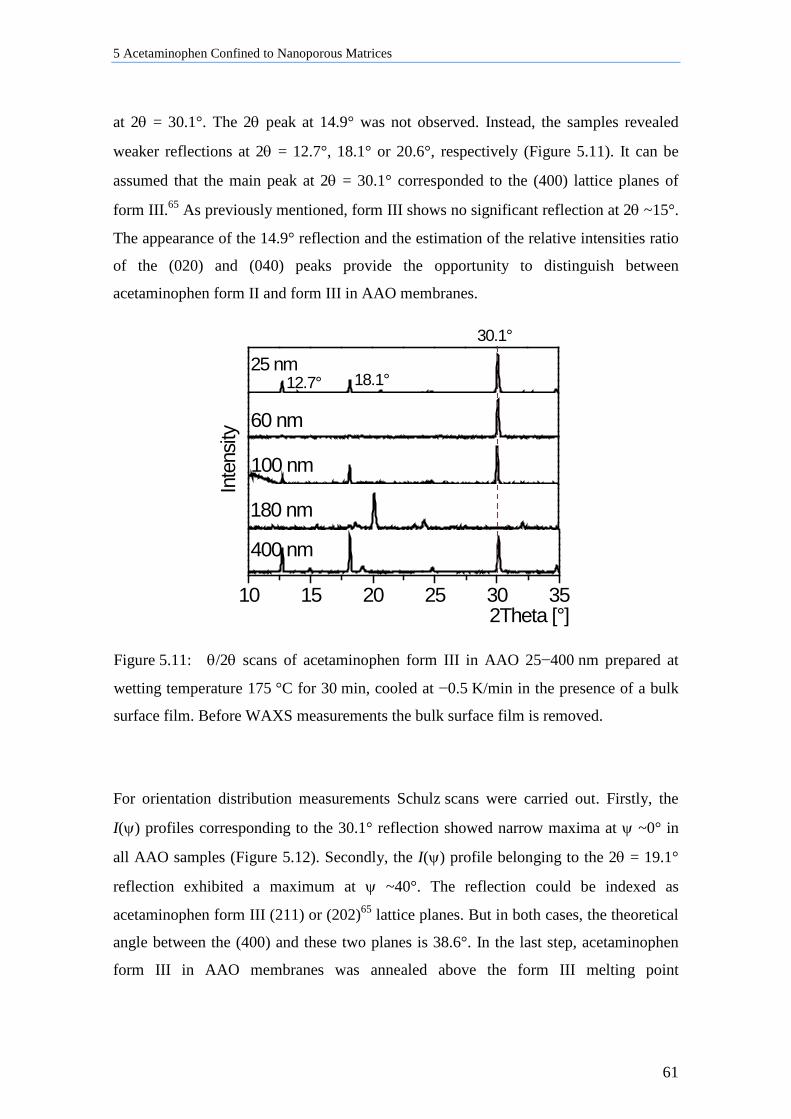
5 Acetaminophen Confined to Nanoporous Matrices
61
at 2θ = 30.1°. The 2θ peak at 14.9° was not observed. Instead, the samples revealed
weaker reflections at 2θ = 12.7°, 18.1° or 20.6°, respectively (Figure 5.11). It can be
assumed that the main peak at 2θ = 30.1° corresponded to the (400) lattice planes of
form III.65 As previously mentioned, form III shows no significant reflection at 2θ ~15°.
The appearance of the 14.9° reflection and the estimation of the relative intensities ratio
of the (020) and (040) peaks provide the opportunity to distinguish between
acetaminophen form II and form III in AAO membranes.
10 15 20 25 30 35
400 nm
2Theta [°]
180 nm
100 nm
Inte
nsity
60 nm
18.1°
30.1°
25 nm12.7°
Figure 5.11: θ/2θ scans of acetaminophen form III in AAO 25−400 nm prepared at
wetting temperature 175 °C for 30 min, cooled at −0.5 K/min in the presence of a bulk
surface film. Before WAXS measurements the bulk surface film is removed.
For orientation distribution measurements Schulz scans were carried out. Firstly, the
I(ψ) profiles corresponding to the 30.1° reflection showed narrow maxima at ψ ~0° in
all AAO samples (Figure 5.12). Secondly, the I(ψ) profile belonging to the 2θ = 19.1°
reflection exhibited a maximum at ψ ~40°. The reflection could be indexed as
acetaminophen form III (211) or (202)65 lattice planes. But in both cases, the theoretical
angle between the (400) and these two planes is 38.6°. In the last step, acetaminophen
form III in AAO membranes was annealed above the form III melting point
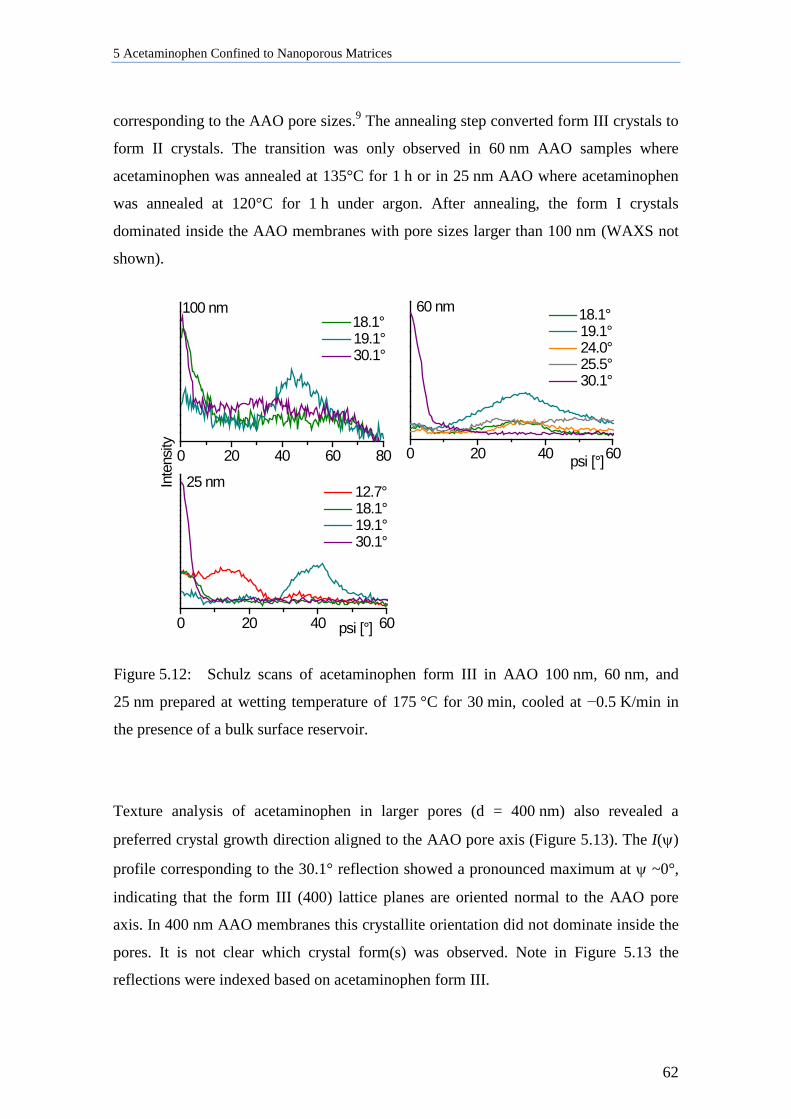
5 Acetaminophen Confined to Nanoporous Matrices
62
corresponding to the AAO pore sizes.9 The annealing step converted form III crystals to
form II crystals. The transition was only observed in 60 nm AAO samples where
acetaminophen was annealed at 135°C for 1 h or in 25 nm AAO where acetaminophen
was annealed at 120°C for 1 h under argon. After annealing, the form I crystals
dominated inside the AAO membranes with pore sizes larger than 100 nm (WAXS not
shown).
0 20 40 60 80 0 20 40 60
0 20 40 60
18.1° 19.1° 30.1°
Inte
nsity
100 nm
18.1° 19.1° 24.0° 25.5° 30.1°
psi [°]
60 nm
12.7° 18.1° 19.1° 30.1°
psi [°]
25 nm
Figure 5.12: Schulz scans of acetaminophen form III in AAO 100 nm, 60 nm, and
25 nm prepared at wetting temperature of 175 °C for 30 min, cooled at −0.5 K/min in
the presence of a bulk surface reservoir.
Texture analysis of acetaminophen in larger pores (d = 400 nm) also revealed a
preferred crystal growth direction aligned to the AAO pore axis (Figure 5.13). The I(ψ)
profile corresponding to the 30.1° reflection showed a pronounced maximum at ψ ~0°,
indicating that the form III (400) lattice planes are oriented normal to the AAO pore
axis. In 400 nm AAO membranes this crystallite orientation did not dominate inside the
pores. It is not clear which crystal form(s) was observed. Note in Figure 5.13 the
reflections were indexed based on acetaminophen form III.
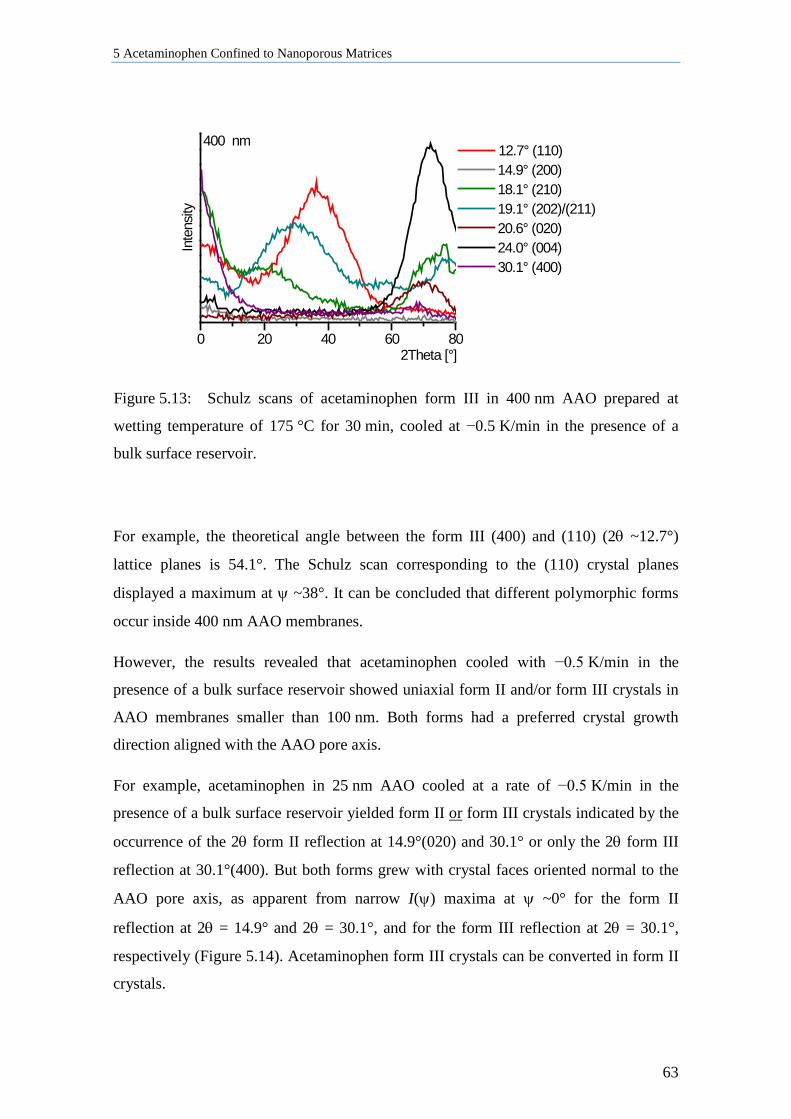
5 Acetaminophen Confined to Nanoporous Matrices
63
0 20 40 60 80
12.7° (110) 14.9° (200) 18.1° (210) 19.1° (202)/(211) 20.6° (020) 24.0° (004) 30.1° (400)
Inte
nsity
2Theta [°]
400 nm
Figure 5.13: Schulz scans of acetaminophen form III in 400 nm AAO prepared at
wetting temperature of 175 °C for 30 min, cooled at −0.5 K/min in the presence of a
bulk surface reservoir.
For example, the theoretical angle between the form III (400) and (110) (2θ ~12.7°)
lattice planes is 54.1°. The Schulz scan corresponding to the (110) crystal planes
displayed a maximum at ψ ~38°. It can be concluded that different polymorphic forms
occur inside 400 nm AAO membranes.
However, the results revealed that acetaminophen cooled with −0.5 K/min in the
presence of a bulk surface reservoir showed uniaxial form II and/or form III crystals in
AAO membranes smaller than 100 nm. Both forms had a preferred crystal growth
direction aligned with the AAO pore axis.
For example, acetaminophen in 25 nm AAO cooled at a rate of −0.5 K/min in the
presence of a bulk surface reservoir yielded form II or form III crystals indicated by the
occurrence of the 2θ form II reflection at 14.9°(020) and 30.1° or only the 2θ form III
reflection at 30.1°(400). But both forms grew with crystal faces oriented normal to the
AAO pore axis, as apparent from narrow I(ψ) maxima at ψ ~0° for the form II
reflection at 2θ = 14.9° and 2θ = 30.1°, and for the form III reflection at 2θ = 30.1°,
respectively (Figure 5.14). Acetaminophen form III crystals can be converted in form II
crystals.
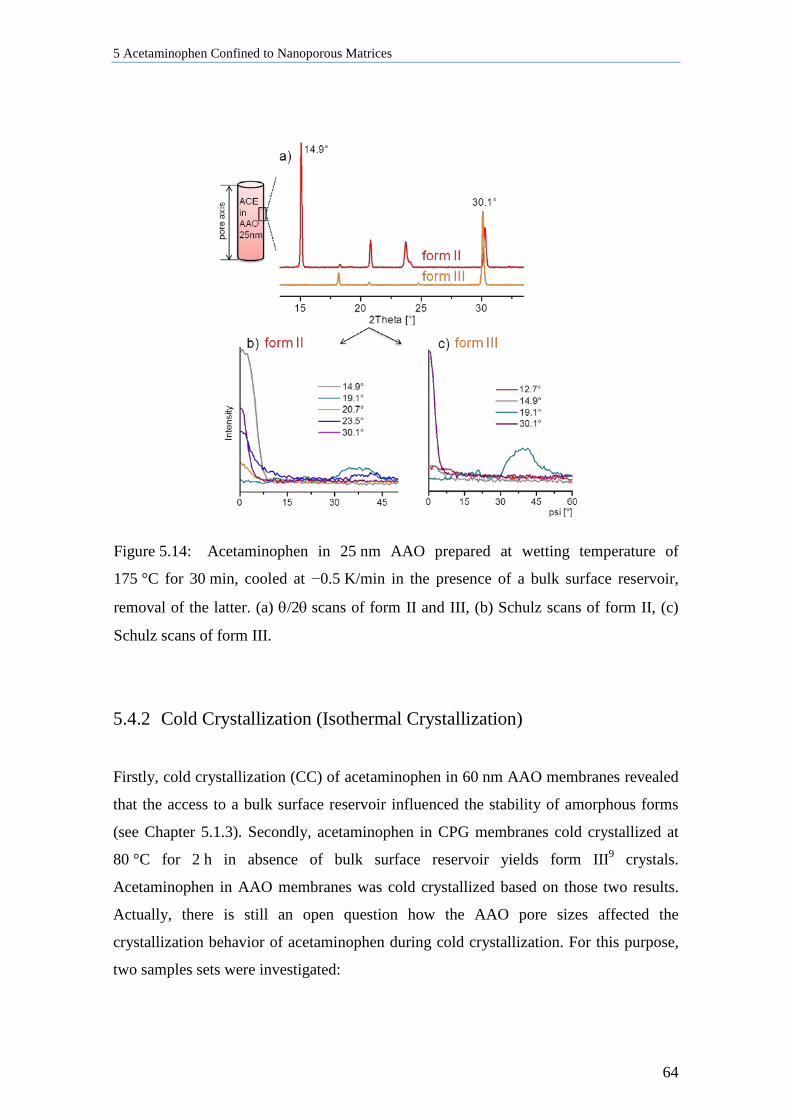
5 Acetaminophen Confined to Nanoporous Matrices
64
Figure 5.14: Acetaminophen in 25 nm AAO prepared at wetting temperature of
175 °C for 30 min, cooled at −0.5 K/min in the presence of a bulk surface reservoir,
removal of the latter. (a) θ/2θ scans of form II and III, (b) Schulz scans of form II, (c)
Schulz scans of form III.
5.4.2 Cold Crystallization (Isothermal Crystallization)
Firstly, cold crystallization (CC) of acetaminophen in 60 nm AAO membranes revealed
that the access to a bulk surface reservoir influenced the stability of amorphous forms
(see Chapter 5.1.3). Secondly, acetaminophen in CPG membranes cold crystallized at
80 °C for 2 h in absence of bulk surface reservoir yields form III9 crystals.
Acetaminophen in AAO membranes was cold crystallized based on those two results.
Actually, there is still an open question how the AAO pore sizes affected the
crystallization behavior of acetaminophen during cold crystallization. For this purpose,
two samples sets were investigated:
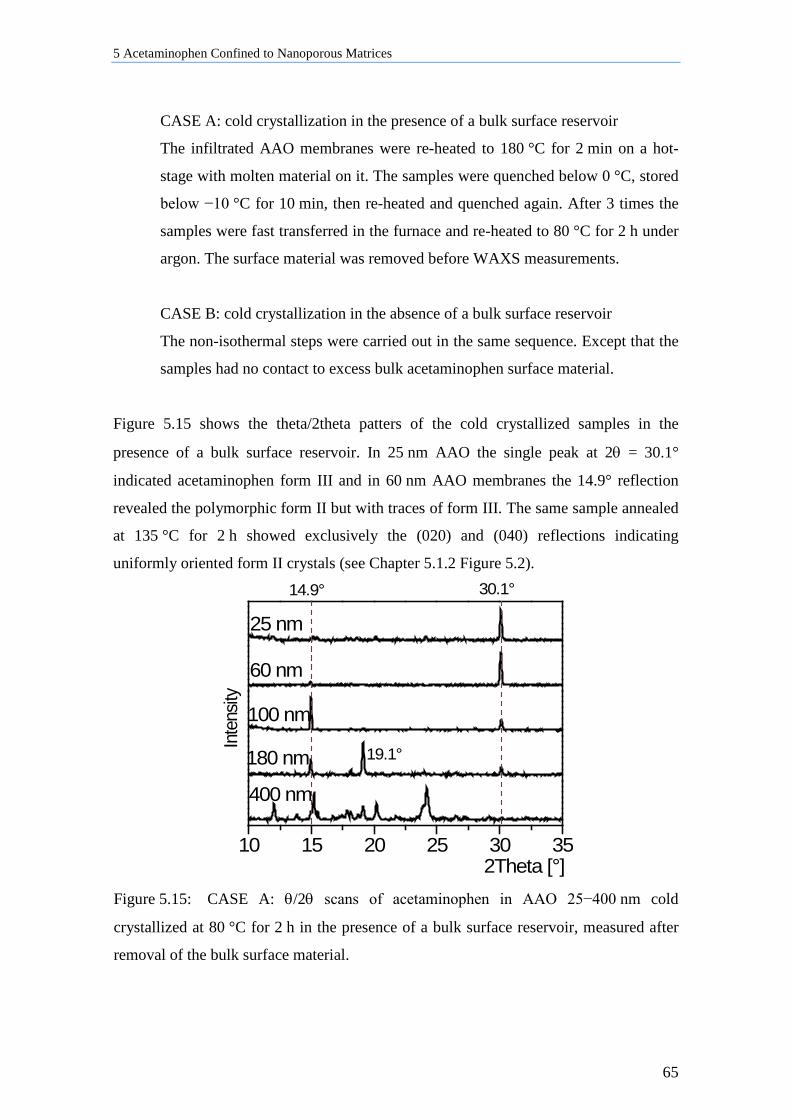
5 Acetaminophen Confined to Nanoporous Matrices
65
CASE A: cold crystallization in the presence of a bulk surface reservoir
The infiltrated AAO membranes were re-heated to 180 °C for 2 min on a hot-
stage with molten material on it. The samples were quenched below 0 °C, stored
below −10 °C for 10 min, then re-heated and quenched again. After 3 times the
samples were fast transferred in the furnace and re-heated to 80 °C for 2 h under
argon. The surface material was removed before WAXS measurements.
CASE B: cold crystallization in the absence of a bulk surface reservoir
The non-isothermal steps were carried out in the same sequence. Except that the
samples had no contact to excess bulk acetaminophen surface material.
Figure 5.15 shows the theta/2theta patters of the cold crystallized samples in the
presence of a bulk surface reservoir. In 25 nm AAO the single peak at 2θ = 30.1°
indicated acetaminophen form III and in 60 nm AAO membranes the 14.9° reflection
revealed the polymorphic form II but with traces of form III. The same sample annealed
at 135 °C for 2 h showed exclusively the (020) and (040) reflections indicating
uniformly oriented form II crystals (see Chapter 5.1.2 Figure 5.2).
10 15 20 25 30 35
400 nm
2Theta [°]
180 nm
Inte
nsity
19.1°
100 nm 30.1°
60 nm 14.9°
25 nm
Figure 5.15: CASE A: θ/2θ scans of acetaminophen in AAO 25−400 nm cold
crystallized at 80 °C for 2 h in the presence of a bulk surface reservoir, measured after
removal of the bulk surface material.
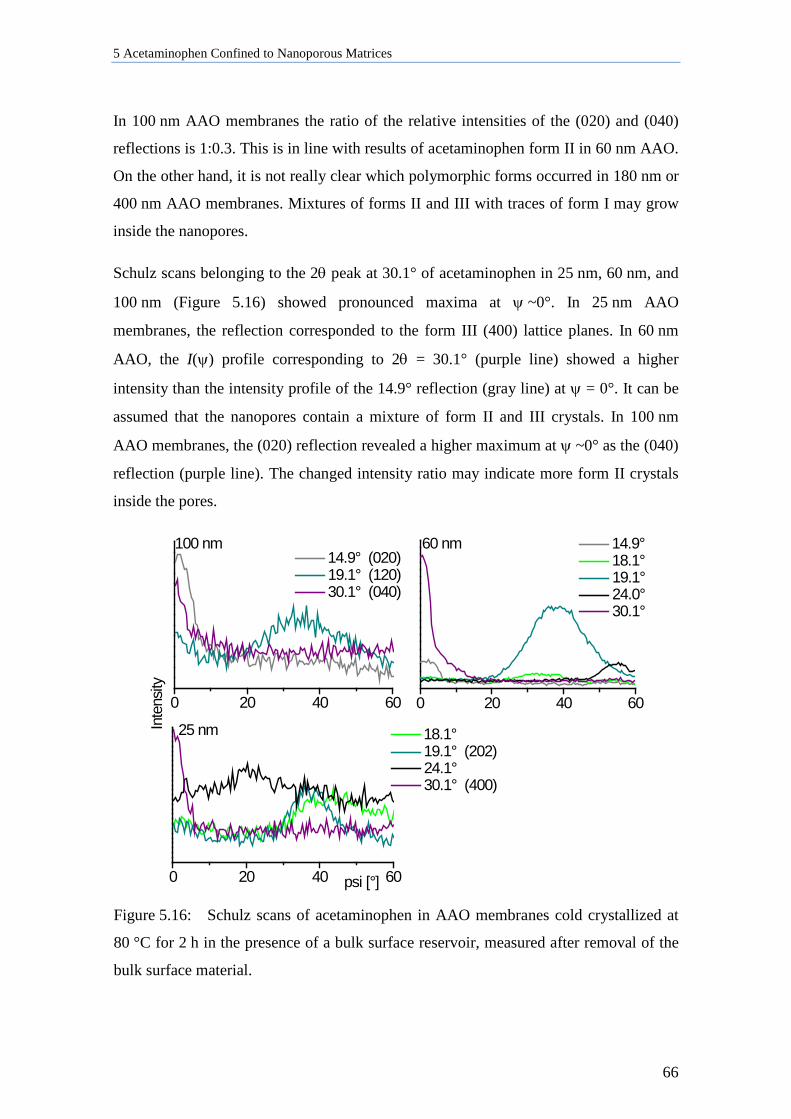
5 Acetaminophen Confined to Nanoporous Matrices
66
In 100 nm AAO membranes the ratio of the relative intensities of the (020) and (040)
reflections is 1:0.3. This is in line with results of acetaminophen form II in 60 nm AAO.
On the other hand, it is not really clear which polymorphic forms occurred in 180 nm or
400 nm AAO membranes. Mixtures of forms II and III with traces of form I may grow
inside the nanopores.
Schulz scans belonging to the 2θ peak at 30.1° of acetaminophen in 25 nm, 60 nm, and
100 nm (Figure 5.16) showed pronounced maxima at ψ ~0°. In 25 nm AAO
membranes, the reflection corresponded to the form III (400) lattice planes. In 60 nm
AAO, the I(ψ) profile corresponding to 2θ = 30.1° (purple line) showed a higher
intensity than the intensity profile of the 14.9° reflection (gray line) at ψ = 0°. It can be
assumed that the nanopores contain a mixture of form II and III crystals. In 100 nm
AAO membranes, the (020) reflection revealed a higher maximum at ψ ~0° as the (040)
reflection (purple line). The changed intensity ratio may indicate more form II crystals
inside the pores.
0 20 40 60 0 20 40 60
0 20 40 60
Inte
nsity
60 nm 14.9° (020) 19.1° (120) 30.1° (040)
100 nm
14.9° 18.1° 19.1° 24.0° 30.1°
18.1° 19.1° (202) 24.1° 30.1° (400)
psi [°]
25 nm
Figure 5.16: Schulz scans of acetaminophen in AAO membranes cold crystallized at
80 °C for 2 h in the presence of a bulk surface reservoir, measured after removal of the
bulk surface material.
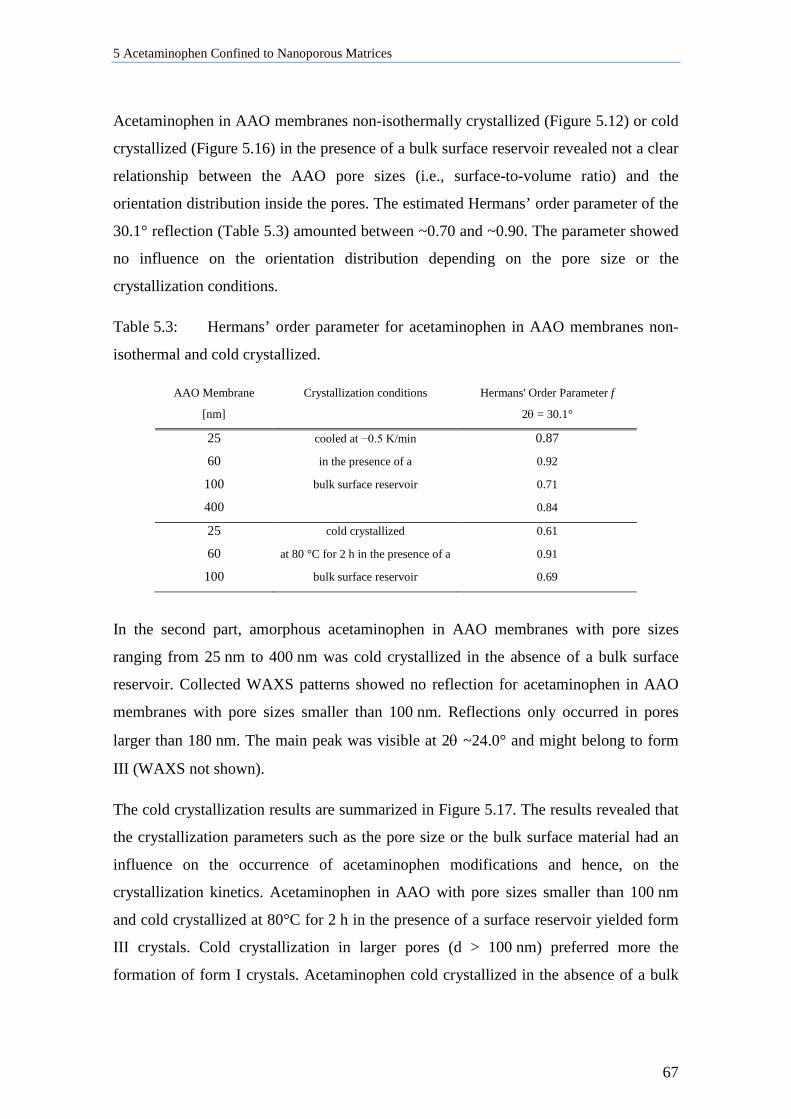
5 Acetaminophen Confined to Nanoporous Matrices
67
Acetaminophen in AAO membranes non-isothermally crystallized (Figure 5.12) or cold
crystallized (Figure 5.16) in the presence of a bulk surface reservoir revealed not a clear
relationship between the AAO pore sizes (i.e., surface-to-volume ratio) and the
orientation distribution inside the pores. The estimated Hermans’ order parameter of the
30.1° reflection (Table 5.3) amounted between ~0.70 and ~0.90. The parameter showed
no influence on the orientation distribution depending on the pore size or the
crystallization conditions.
Table 5.3: Hermans’ order parameter for acetaminophen in AAO membranes non-
isothermal and cold crystallized.
AAO Membrane Crystallization conditions Hermans' Order Parameter f
[nm] 2θ = 30.1°
25 cooled at −0.5 K/min 0.87
60 in the presence of a 0.92
100 bulk surface reservoir 0.71
400 0.84
25 cold crystallized 0.61
60 at 80 °C for 2 h in the presence of a 0.91
100 bulk surface reservoir 0.69
In the second part, amorphous acetaminophen in AAO membranes with pore sizes
ranging from 25 nm to 400 nm was cold crystallized in the absence of a bulk surface
reservoir. Collected WAXS patterns showed no reflection for acetaminophen in AAO
membranes with pore sizes smaller than 100 nm. Reflections only occurred in pores
larger than 180 nm. The main peak was visible at 2θ ~24.0° and might belong to form
III (WAXS not shown).
The cold crystallization results are summarized in Figure 5.17. The results revealed that
the crystallization parameters such as the pore size or the bulk surface material had an
influence on the occurrence of acetaminophen modifications and hence, on the
crystallization kinetics. Acetaminophen in AAO with pore sizes smaller than 100 nm
and cold crystallized at 80°C for 2 h in the presence of a surface reservoir yielded form
III crystals. Cold crystallization in larger pores (d > 100 nm) preferred more the
formation of form I crystals. Acetaminophen cold crystallized in the absence of a bulk
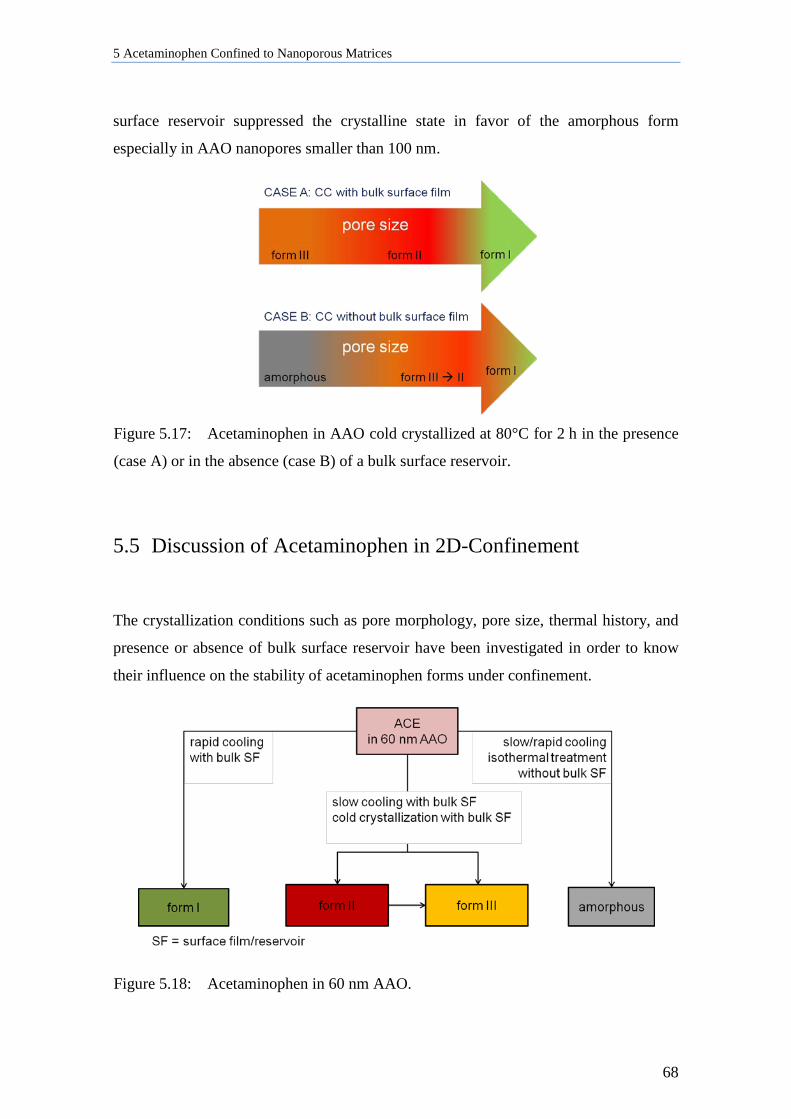
5 Acetaminophen Confined to Nanoporous Matrices
68
surface reservoir suppressed the crystalline state in favor of the amorphous form
especially in AAO nanopores smaller than 100 nm.
Figure 5.17: Acetaminophen in AAO cold crystallized at 80°C for 2 h in the presence
(case A) or in the absence (case B) of a bulk surface reservoir.
5.5 Discussion of Acetaminophen in 2D-Confinement
The crystallization conditions such as pore morphology, pore size, thermal history, and
presence or absence of bulk surface reservoir have been investigated in order to know
their influence on the stability of acetaminophen forms under confinement.
Figure 5.18: Acetaminophen in 60 nm AAO.
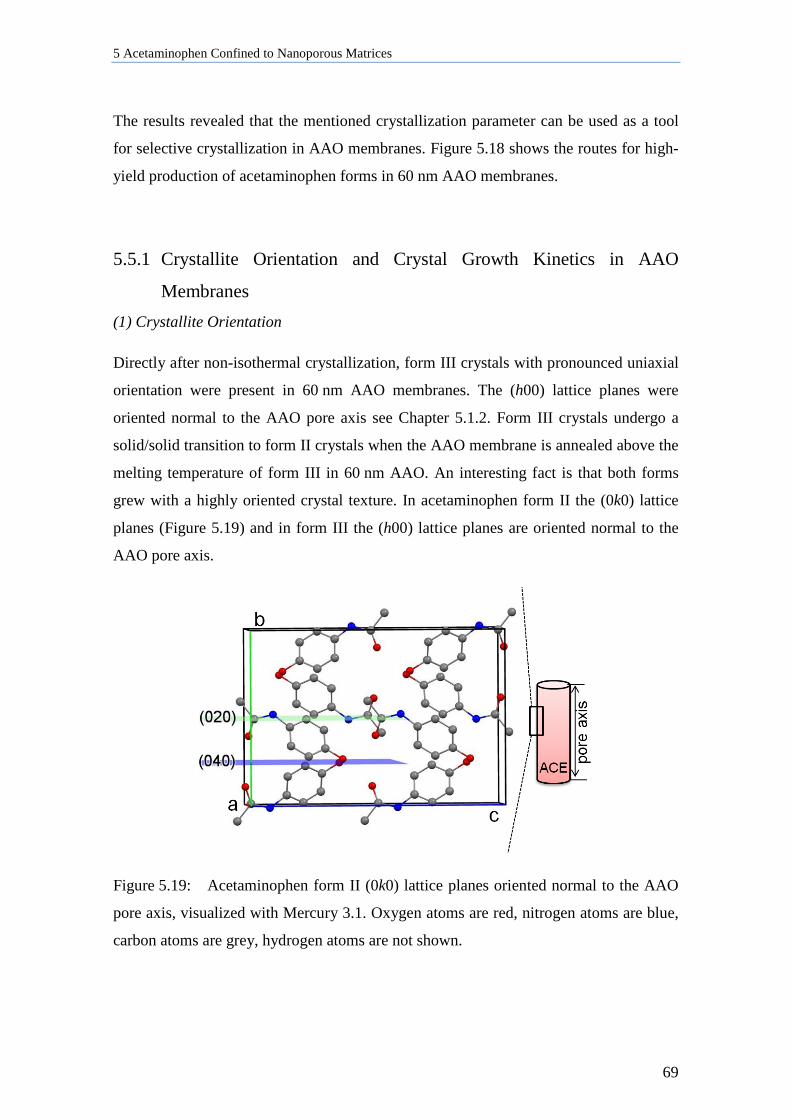
5 Acetaminophen Confined to Nanoporous Matrices
69
The results revealed that the mentioned crystallization parameter can be used as a tool
for selective crystallization in AAO membranes. Figure 5.18 shows the routes for high-
yield production of acetaminophen forms in 60 nm AAO membranes.
5.5.1 Crystallite Orientation and Crystal Growth Kinetics in AAO
Membranes (1) Crystallite Orientation
Directly after non-isothermal crystallization, form III crystals with pronounced uniaxial
orientation were present in 60 nm AAO membranes. The (h00) lattice planes were
oriented normal to the AAO pore axis see Chapter 5.1.2. Form III crystals undergo a
solid/solid transition to form II crystals when the AAO membrane is annealed above the
melting temperature of form III in 60 nm AAO. An interesting fact is that both forms
grew with a highly oriented crystal texture. In acetaminophen form II the (0k0) lattice
planes (Figure 5.19) and in form III the (h00) lattice planes are oriented normal to the
AAO pore axis.
Figure 5.19: Acetaminophen form II (0k0) lattice planes oriented normal to the AAO
pore axis, visualized with Mercury 3.1. Oxygen atoms are red, nitrogen atoms are blue,
carbon atoms are grey, hydrogen atoms are not shown.
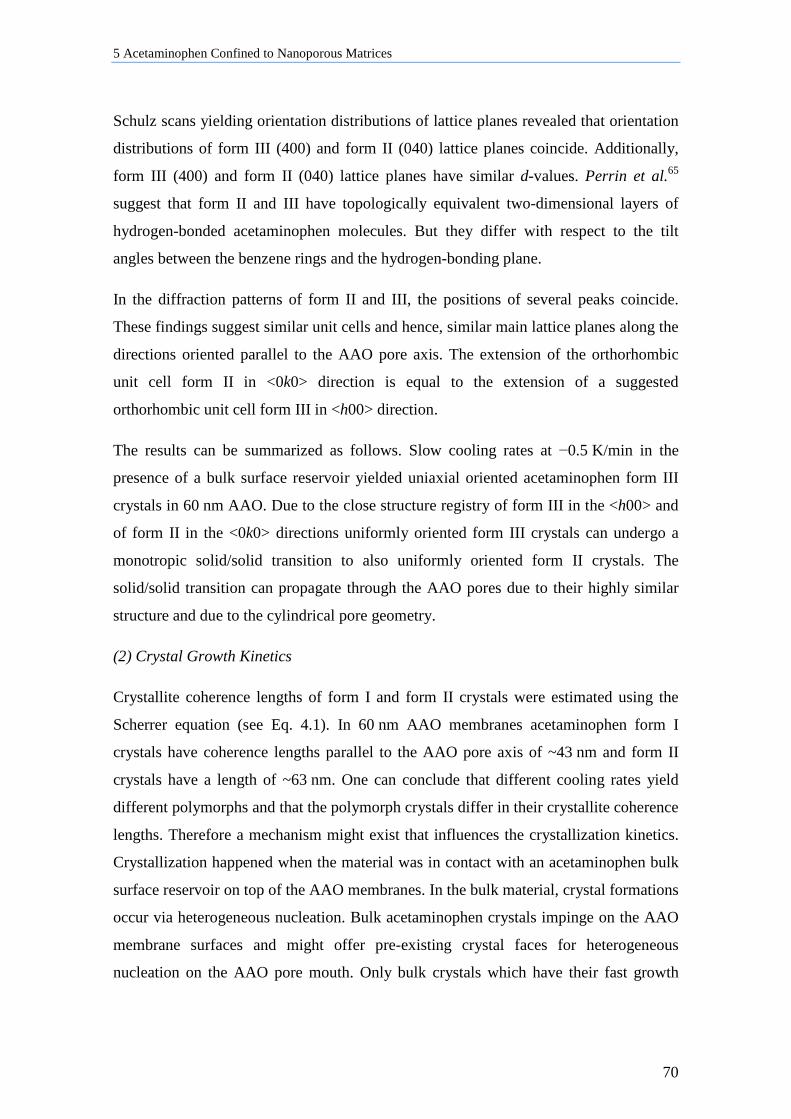
5 Acetaminophen Confined to Nanoporous Matrices
70
Schulz scans yielding orientation distributions of lattice planes revealed that orientation
distributions of form III (400) and form II (040) lattice planes coincide. Additionally,
form III (400) and form II (040) lattice planes have similar d-values. Perrin et al.65
suggest that form II and III have topologically equivalent two-dimensional layers of
hydrogen-bonded acetaminophen molecules. But they differ with respect to the tilt
angles between the benzene rings and the hydrogen-bonding plane.
In the diffraction patterns of form II and III, the positions of several peaks coincide.
These findings suggest similar unit cells and hence, similar main lattice planes along the
directions oriented parallel to the AAO pore axis. The extension of the orthorhombic
unit cell form II in <0k0> direction is equal to the extension of a suggested
orthorhombic unit cell form III in <h00> direction.
The results can be summarized as follows. Slow cooling rates at −0.5 K/min in the
presence of a bulk surface reservoir yielded uniaxial oriented acetaminophen form III
crystals in 60 nm AAO. Due to the close structure registry of form III in the <h00> and
of form II in the <0k0> directions uniformly oriented form III crystals can undergo a
monotropic solid/solid transition to also uniformly oriented form II crystals. The
solid/solid transition can propagate through the AAO pores due to their highly similar
structure and due to the cylindrical pore geometry.
(2) Crystal Growth Kinetics
Crystallite coherence lengths of form I and form II crystals were estimated using the
Scherrer equation (see Eq. 4.1). In 60 nm AAO membranes acetaminophen form I
crystals have coherence lengths parallel to the AAO pore axis of ~43 nm and form II
crystals have a length of ~63 nm. One can conclude that different cooling rates yield
different polymorphs and that the polymorph crystals differ in their crystallite coherence
lengths. Therefore a mechanism might exist that influences the crystallization kinetics.
Crystallization happened when the material was in contact with an acetaminophen bulk
surface reservoir on top of the AAO membranes. In the bulk material, crystal formations
occur via heterogeneous nucleation. Bulk acetaminophen crystals impinge on the AAO
membrane surfaces and might offer pre-existing crystal faces for heterogeneous
nucleation on the AAO pore mouth. Only bulk crystals which have their fast growth
5 Acetaminophen Confined to Nanoporous Matrices
71
direction aligned with the AAO pore axis can grow into the pore. It is a well-known fact
that anisotropic pores dictate fast crystal growth parallel to the pore axis (Figure 5.20).
This observation has been interpreted as a version of the Bridgman single-crystal
growth process.100 Furthermore, slow growing crystals or crystal faces without their
fast-growth direction aligned with the AAO pore axis are suppressed in cylindrical
nanopores. Other nucleation mechanisms that initiate the formation of crystals away
from the pore mouth might be suppressed.
Figure 5.20: Schematic view of acetaminophen form III/form II fast-growth direction
aligned with the AAO pore axis.
After nucleation some crystal faces can grow faster in specific crystallographic
directions. The growth rates are influenced by the attachment rates of the molecular
building blocks to each crystal face. Following the Hartman and Perdok37 model (see
Chapter 1.1.3) it can be concluded that acetaminophen should have rough crystal faces
without connected nets of molecular growth units oriented normal to the AAO pore
axes. During crystal growth, the energy of a crystal face guides the crystal growth
direction. It can be assumed that the occurrence of preferred crystal faces of form II/III
are influenced by the different growth rates of lattice planes. On a fast-growing crystal
plane, the attachment rates of building blocks normal to the growth direction are higher
than on a slow-growing crystal face. It can be concluded that the form III <h00>
direction is a fast-growing direction aligned to the AAO pore axis. Attachment-energy
prediction101 suggests that the (020) lattice plane of acetaminophen form II is a slow
5 Acetaminophen Confined to Nanoporous Matrices
72
growing face. This could suggest that form III is nucleated firstly, and then converted to
form II crystals undergoing a solid/solid transition.
Furthermore, growing crystals compete for growth volume. In straight non-connected
nanopores the crystal growth rate parallel to the pore axes is higher than in any other
direction (Figure 5.20). The free growth path there is tens of micrometers. Instead the
free growth path in diameter is only few tens of nanometers.
The crystal growth is also affected by kinetic selection processes11. Rapid cooling from
melt favors more nucleation than crystal growth. Crystallization takes place at low
temperatures, and therefore at high supercooling. High supercooling supports
homogeneous nucleation with formation of many nuclei. Hence, many growing crystals
compete for growth volume. It is possible that crystals with different growth directions
have a change to occupy a certain growth volume. Fast growing crystals originated from
the heterogeneous nucleation close to the pore mouth might grow, but they might also
impinge on other growing crystals. As a consequence, the dominance of the crystallites
having (020)/(040) form II or (400) form III lattice planes oriented normal to the pore
axis are suppressed. In 60 nm AAO, rapid cooling from melt in the presence of a bulk
surface reservoir favors several populations of form I crystals with different
orientations. Furthermore, the different growth directions of form I crystals explain the
shorter crystallite coherence length. Form II and/or form III crystals can rapidly grow
along the AAO pores. In contrast, growing form I crystals may impinge on other
growing form I crystals.
(3) Amorphous Form
Amorphous form can be reached when material is quenched from melt due to rapid
cooling.24 In thermodynamics terms, it can be said that if no crystallization occurs, the
nuclei for the crystalline forms cannot overcome the critical size r* and will not reach a
size necessary for crystal growth. Henceforth, the amorphous form is
thermodynamically stable under the given system. Not reaching the crystalline state can
be also due to kinetic reasons. During rapid cooling the material is transferred to lower
temperatures very quickly. At low temperatures molecular mobility might be too small
to observe crystallization22. The investigation of acetaminophen in 60 nm AAO showed
5 Acetaminophen Confined to Nanoporous Matrices
73
that the amorphous form can also be obtained by slow cooling at −0.5 K/min in the
absence of a bulk surface reservoir. It might be assumed that the occurrence of
amorphous acetaminophen in AAO membranes is linked to the availability of material
during cooling. In absence of bulk acetaminophen in each pore, the material crystallizes
separately. Therefore, nucleation process shifts from heterogeneous to homogeneous.
As a result, the reduced number of heterogeneous nuclei or the increase of
homogeneous nuclei in smaller pores could contribute to slow crystallization kinetics
since each crystallizing volume is homogeneously nucleated. Or in other words, the
system must overcome a higher nucleation barrier.
The formation of amorphous drugs may be of interest for further studies. In most of the
cases amorphous forms could have better dissolution rates and hence, a better
bioavailability than their crystalline counterparts. For drug formulation, it could be
useful to know which conditions support the amorphous form. Furthermore, the results
show that the amorphous form is stable under typical storage conditions for specific
shelf time intervals.
5.5.2 Influence of Pore Sizes and Volume on Crystallization in AAO
Membranes
The results from Chapter 5.4 revealed that the occurrence of acetaminophen
modifications depended on different factors such as the pore volume, the pore size and
hence, the crystal size. The existence of different formations under confinement can also
have kinetic reasons. Acetaminophen in AAO with pore sizes from 25 nm to 400 nm
slowly cooled with bulk surface reservoir revealed form II/form III crystals with their
(0k0)/(h00) lattice planes oriented normal to the AAO pore axis. It can be assumed that
the same nucleation and crystal growth mechanism takes place as described for
acetaminophen in 60 nm AAO. Table 5.4 summarizes the occurrence of the (0k0) and
(h00) lattice planes in 25 nm and 60 nm AAO membranes.
5 Acetaminophen Confined to Nanoporous Matrices
74
Table 5.4: Acetaminophen in 25 and 60 nm AAO cooled at −0.5 K/min in the
presence of a bulk surface reservoir.
Polymorph: main reflections (Index) AAO 60 nm
AAO 25 nm
(11 samples)
(17 samples)
form II: 14.9°(020), 30.1°(040) 36%
53%
form III: 30.1°(400) 36%
47%
other main reflections of form II or III
occasionally form I 27%
/
In both AAO pore sizes form II or form III reflections occur with a 50% probability.
Further, in 25 nm AAO membranes other crystallite orientations are suppressed due to
the vicinity of the pore walls.
Cold crystallization experiments in AAO membranes with pore sizes of 60 nm or
smaller, in absence of a bulk surface reservoir, yielded amorphous acetaminophen. The
same results can be achieved when acetaminophen is cooled from melt with no contact
with bulk surface material. In absence of bulk material, the nucleation process starts in
each pore separately towards a more homogeneous nucleation. Nucleation is more
favored than crystal growth. The crystallization kinetics may be influenced by
immobilized surface layers. Such layers can have a thickness of around one nanometer
and are formed at high energy pore walls.22 This effect could be relevant when the
surface-to-volume ratio increase due to smaller pore sizes (Table 5.5). Acetaminophen
can interact with the hydroxyl-terminated AAO pore walls which might stabilize the
amorphous form in smaller pore sizes (d < 100 nm).
Table 5.5: Estimated single pore volume, pore area, and surface-to-volume ratio of
cylindrical AAO pores.
AAO 25 nm AAO 60 nm AAO 180 nm AAO 400 nm
r [nm] 12.5 30 90 200
h [µm] 100 100 100 100
cylindrical single pore
volume πr²h [µm³] 0.05 0.28 1.1 13
area 2πr² + 2πrh [µm²] 7.8 19 38 130
surface-to-volume ratio 160 68 35 4.0
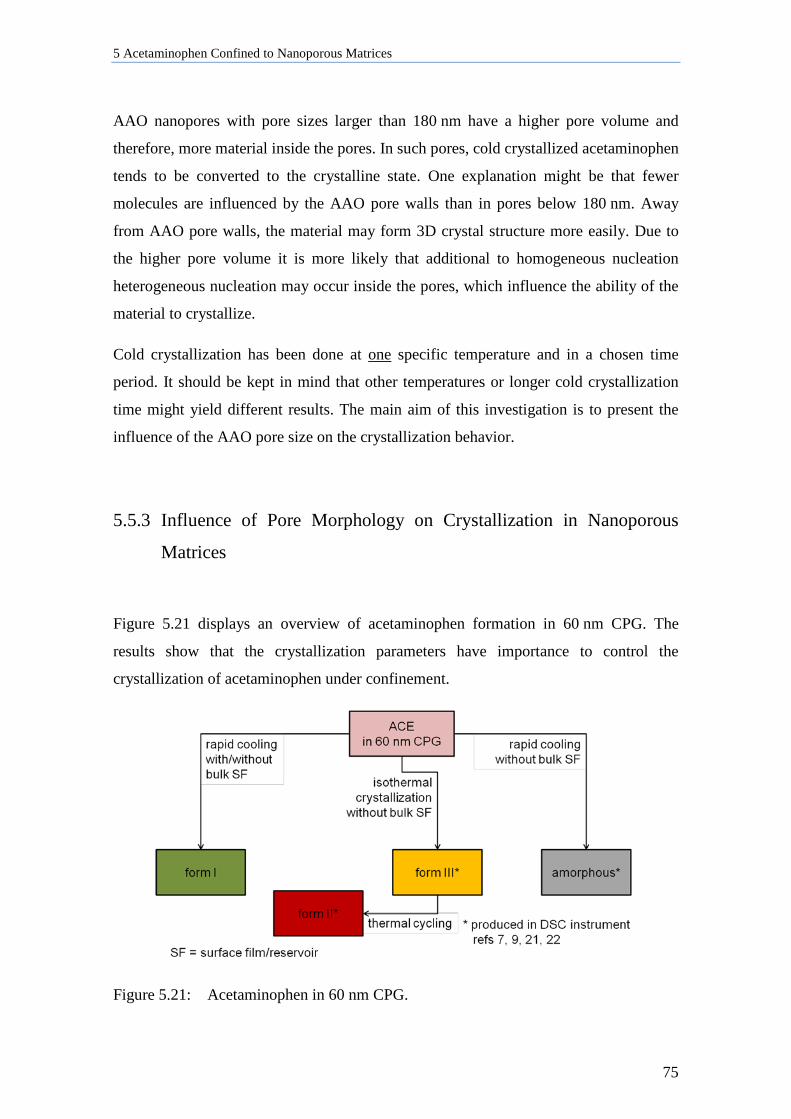
5 Acetaminophen Confined to Nanoporous Matrices
75
AAO nanopores with pore sizes larger than 180 nm have a higher pore volume and
therefore, more material inside the pores. In such pores, cold crystallized acetaminophen
tends to be converted to the crystalline state. One explanation might be that fewer
molecules are influenced by the AAO pore walls than in pores below 180 nm. Away
from AAO pore walls, the material may form 3D crystal structure more easily. Due to
the higher pore volume it is more likely that additional to homogeneous nucleation
heterogeneous nucleation may occur inside the pores, which influence the ability of the
material to crystallize.
Cold crystallization has been done at one specific temperature and in a chosen time
period. It should be kept in mind that other temperatures or longer cold crystallization
time might yield different results. The main aim of this investigation is to present the
influence of the AAO pore size on the crystallization behavior.
5.5.3 Influence of Pore Morphology on Crystallization in Nanoporous
Matrices
Figure 5.21 displays an overview of acetaminophen formation in 60 nm CPG. The
results show that the crystallization parameters have importance to control the
crystallization of acetaminophen under confinement.
Figure 5.21: Acetaminophen in 60 nm CPG.
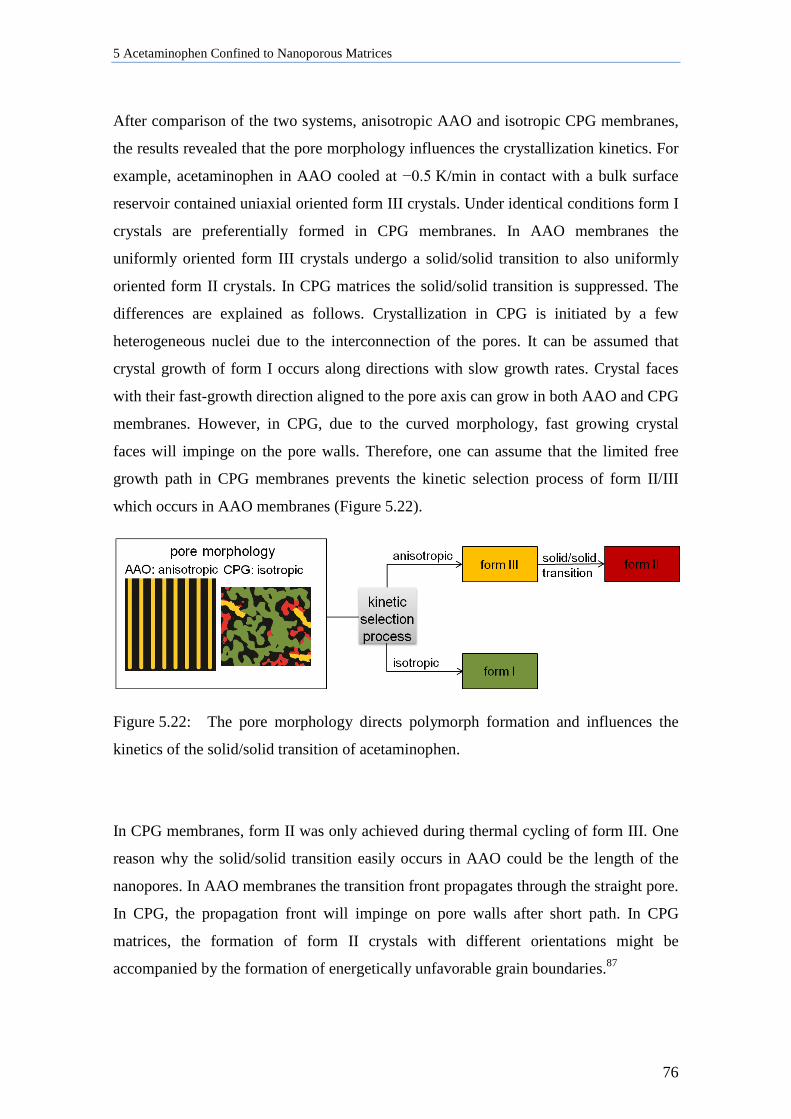
5 Acetaminophen Confined to Nanoporous Matrices
76
After comparison of the two systems, anisotropic AAO and isotropic CPG membranes,
the results revealed that the pore morphology influences the crystallization kinetics. For
example, acetaminophen in AAO cooled at −0.5 K/min in contact with a bulk surface
reservoir contained uniaxial oriented form III crystals. Under identical conditions form I
crystals are preferentially formed in CPG membranes. In AAO membranes the
uniformly oriented form III crystals undergo a solid/solid transition to also uniformly
oriented form II crystals. In CPG matrices the solid/solid transition is suppressed. The
differences are explained as follows. Crystallization in CPG is initiated by a few
heterogeneous nuclei due to the interconnection of the pores. It can be assumed that
crystal growth of form I occurs along directions with slow growth rates. Crystal faces
with their fast-growth direction aligned to the pore axis can grow in both AAO and CPG
membranes. However, in CPG, due to the curved morphology, fast growing crystal
faces will impinge on the pore walls. Therefore, one can assume that the limited free
growth path in CPG membranes prevents the kinetic selection process of form II/III
which occurs in AAO membranes (Figure 5.22).
Figure 5.22: The pore morphology directs polymorph formation and influences the
kinetics of the solid/solid transition of acetaminophen.
In CPG membranes, form II was only achieved during thermal cycling of form III. One
reason why the solid/solid transition easily occurs in AAO could be the length of the
nanopores. In AAO membranes the transition front propagates through the straight pore.
In CPG, the propagation front will impinge on pore walls after short path. In CPG
matrices, the formation of form II crystals with different orientations might be
accompanied by the formation of energetically unfavorable grain boundaries.87
6 Release Kinetics of Acetaminophen from AAO Membranes
77
6 Release Kinetics of Acetaminophen from AAO
Membranes
AAO membranes with tailored pore geometries are interesting materials for controlled
drug delivery systems. The ordered and controlled pore structures can have an influence
on dissolution rates of the drug molecules from the pores and therefore, of the drug
release.18, 20 In general, the drug release is a kinetic process and quantified by the
dissolution rate in dependence on the time. For testing the release kinetics of
acetaminophen dissolution measurements were performed. Such in vitro tests provide
an opportunity to make precise and reproducible release measurements. The methods
are divided in two types: natural or forced convection.41 The main difference is that the
forced convection includes a degree of agitation. The used dissolution test apparatus in
this study falls in the latter category. Release kinetic measurements give answers how
the elution of a drug depends on parameters such as solid form (i.e., crystalline or
amorphous) or particle size. Beside this, drug dissolution is affected by more parameters
such as the surface wetting, the chosen medium, or the matrix material.
6.1 Controlled Drug Release from 60 nm AAO Membranes
To achieve acetaminophen form I, form II and amorphous form in 60 nm AAO
membranes, the material was infiltrated and cooled as is described in Chapter 5.1. Prior
infiltration, the AAO membranes were cut in 1 x 1 cm pieces. After infiltration and
cooling, all samples were cleaned with a wetted tissue to remove any residues outside
the AAO membranes. The collected WAXS patterns were in line with nanosized
acetaminophen form I from Ch. 5.1.1, Figure 5.1 or with form II from Ch. 5.1.2, Figure
5.2. The main theta/2theta reflections of the crystalline samples are listed in Table 6.1.
Amorphous acetaminophen showed no reflections in theta/2theta scans. Each AAO
membrane contained approximately 3−4 mg acetaminophen.
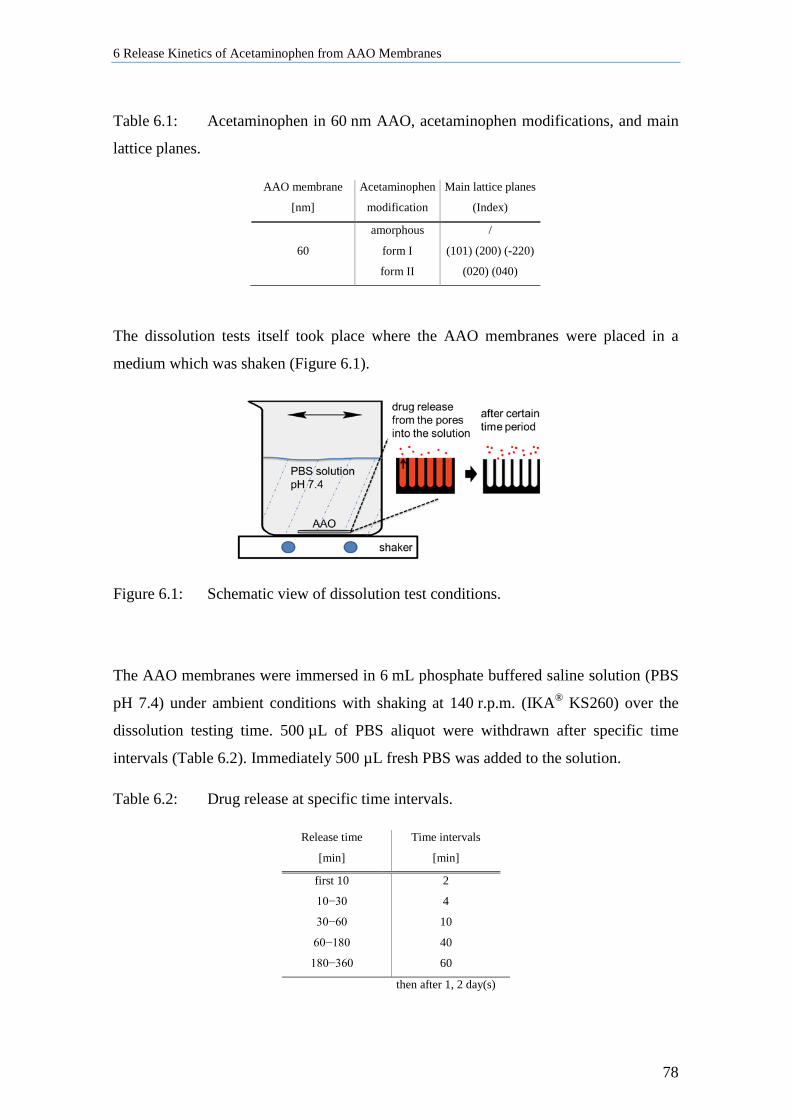
6 Release Kinetics of Acetaminophen from AAO Membranes
78
Table 6.1: Acetaminophen in 60 nm AAO, acetaminophen modifications, and main
lattice planes.
AAO membrane
[nm]
Acetaminophen
modification
Main lattice planes
(Index)
amorphous /
60 form I (101) (200) (-220)
form II (020) (040)
The dissolution tests itself took place where the AAO membranes were placed in a
medium which was shaken (Figure 6.1).
Figure 6.1: Schematic view of dissolution test conditions.
The AAO membranes were immersed in 6 mL phosphate buffered saline solution (PBS
pH 7.4) under ambient conditions with shaking at 140 r.p.m. (IKA® KS260) over the
dissolution testing time. 500 µL of PBS aliquot were withdrawn after specific time
intervals (Table 6.2). Immediately 500 µL fresh PBS was added to the solution.
Table 6.2: Drug release at specific time intervals.
Release time
[min]
Time intervals
[min]
first 10 2
10−30 4
30−60 10
60−180 40
180−360 60
then after 1, 2 day(s)
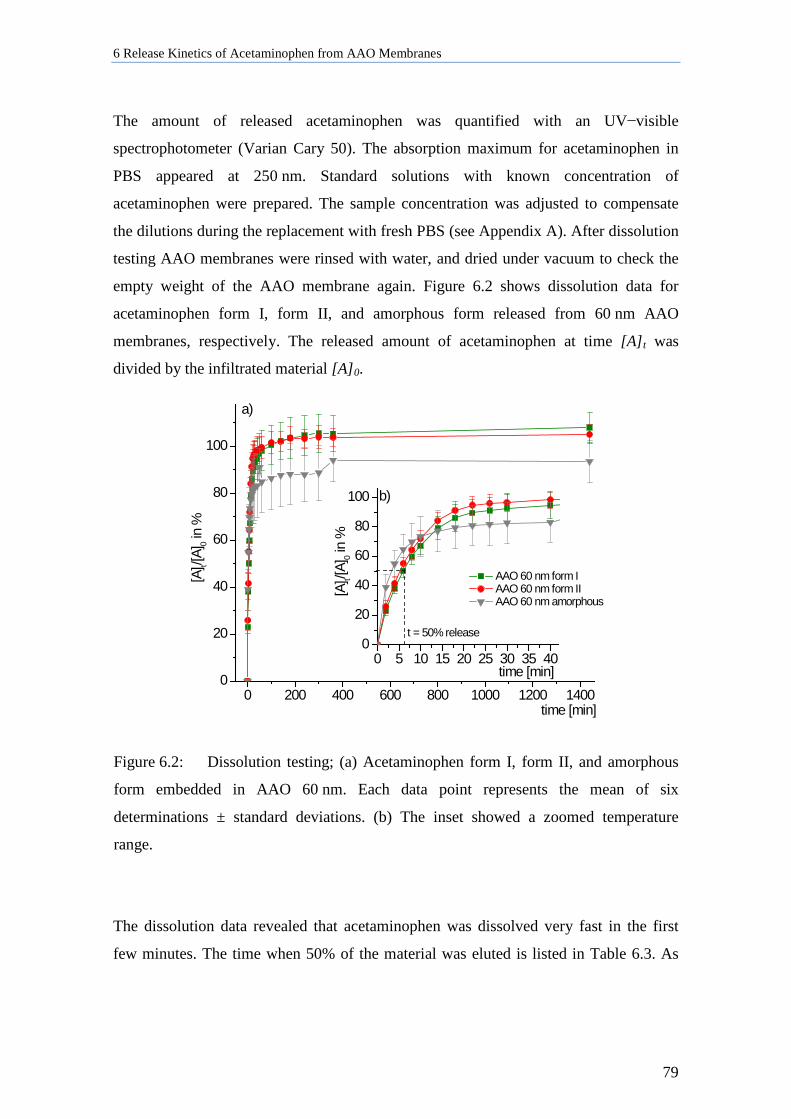
6 Release Kinetics of Acetaminophen from AAO Membranes
79
The amount of released acetaminophen was quantified with an UV−visible
spectrophotometer (Varian Cary 50). The absorption maximum for acetaminophen in
PBS appeared at 250 nm. Standard solutions with known concentration of
acetaminophen were prepared. The sample concentration was adjusted to compensate
the dilutions during the replacement with fresh PBS (see Appendix A). After dissolution
testing AAO membranes were rinsed with water, and dried under vacuum to check the
empty weight of the AAO membrane again. Figure 6.2 shows dissolution data for
acetaminophen form I, form II, and amorphous form released from 60 nm AAO
membranes, respectively. The released amount of acetaminophen at time [A]t was
divided by the infiltrated material [A]0.
0 200 400 600 800 1000 1200 14000
20
40
60
80
100
0 5 10 15 20 25 30 35 400
20
40
60
80
100
AAO 60 nm form I AAO 60 nm form II AAO 60 nm amorphous
[A] t/[A
] 0 in
%
time [min]
a)
[A] t/[A
] 0 in
%
time [min]
t = 50% release
b)
Figure 6.2: Dissolution testing; (a) Acetaminophen form I, form II, and amorphous
form embedded in AAO 60 nm. Each data point represents the mean of six
determinations ± standard deviations. (b) The inset showed a zoomed temperature
range.
The dissolution data revealed that acetaminophen was dissolved very fast in the first
few minutes. The time when 50% of the material was eluted is listed in Table 6.3. As
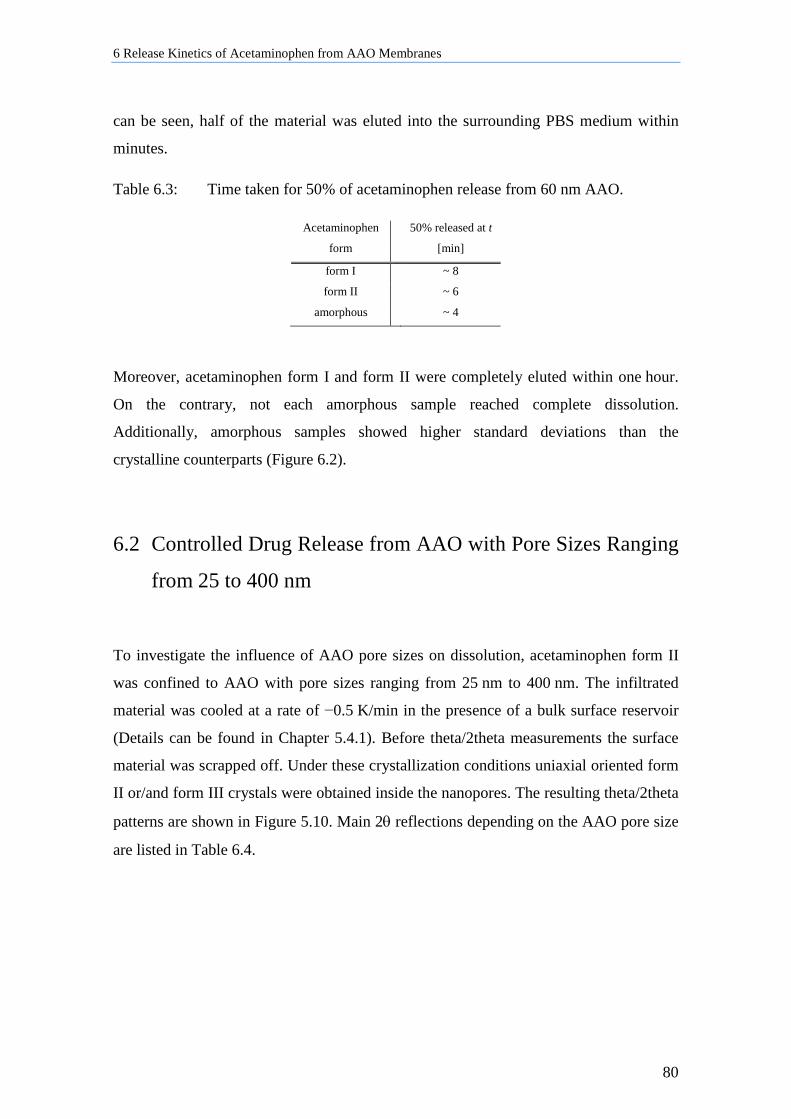
6 Release Kinetics of Acetaminophen from AAO Membranes
80
can be seen, half of the material was eluted into the surrounding PBS medium within
minutes.
Table 6.3: Time taken for 50% of acetaminophen release from 60 nm AAO.
Acetaminophen 50% released at t
form [min]
form I ~ 8
form II ~ 6
amorphous ~ 4
Moreover, acetaminophen form I and form II were completely eluted within one hour.
On the contrary, not each amorphous sample reached complete dissolution.
Additionally, amorphous samples showed higher standard deviations than the
crystalline counterparts (Figure 6.2).
6.2 Controlled Drug Release from AAO with Pore Sizes Ranging
from 25 to 400 nm
To investigate the influence of AAO pore sizes on dissolution, acetaminophen form II
was confined to AAO with pore sizes ranging from 25 nm to 400 nm. The infiltrated
material was cooled at a rate of −0.5 K/min in the presence of a bulk surface reservoir
(Details can be found in Chapter 5.4.1). Before theta/2theta measurements the surface
material was scrapped off. Under these crystallization conditions uniaxial oriented form
II or/and form III crystals were obtained inside the nanopores. The resulting theta/2theta
patterns are shown in Figure 5.10. Main 2θ reflections depending on the AAO pore size
are listed in Table 6.4.
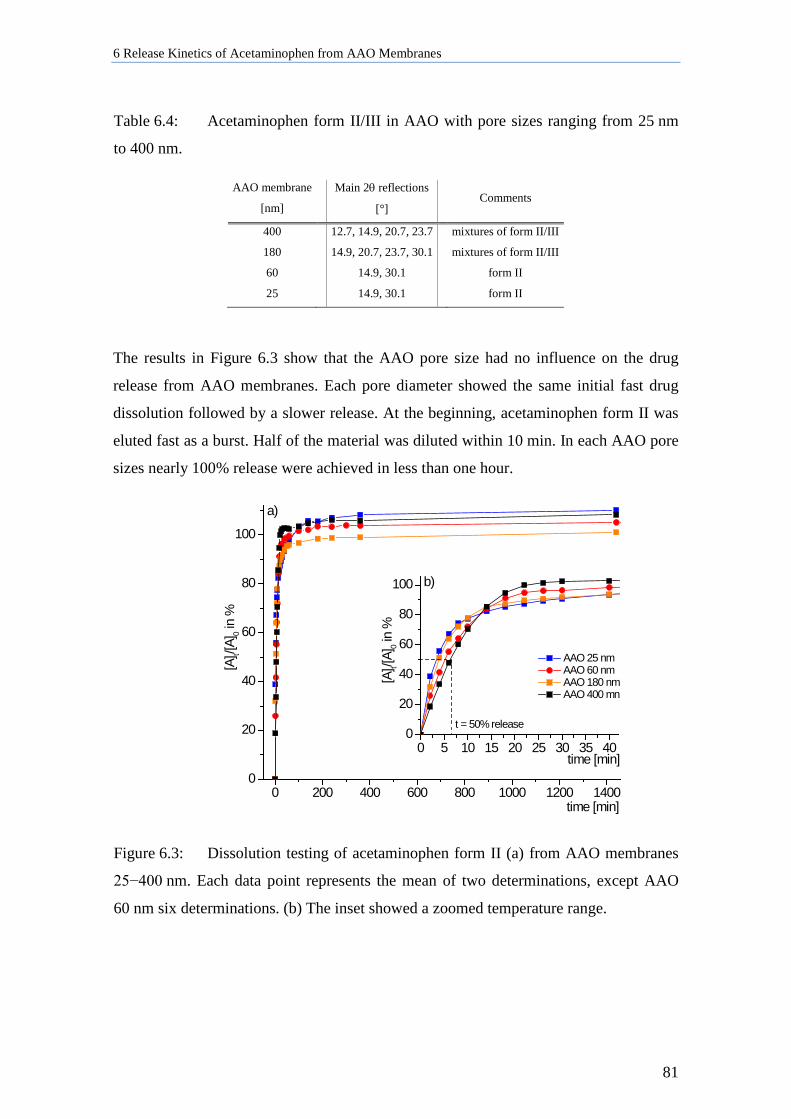
6 Release Kinetics of Acetaminophen from AAO Membranes
81
Table 6.4: Acetaminophen form II/III in AAO with pore sizes ranging from 25 nm
to 400 nm.
AAO membrane
[nm]
Main 2θ reflections
[°]
Comments
400 12.7, 14.9, 20.7, 23.7 mixtures of form II/III
180 14.9, 20.7, 23.7, 30.1 mixtures of form II/III
60 14.9, 30.1 form II
25 14.9, 30.1 form II
The results in Figure 6.3 show that the AAO pore size had no influence on the drug
release from AAO membranes. Each pore diameter showed the same initial fast drug
dissolution followed by a slower release. At the beginning, acetaminophen form II was
eluted fast as a burst. Half of the material was diluted within 10 min. In each AAO pore
sizes nearly 100% release were achieved in less than one hour.
0 200 400 600 800 1000 1200 14000
20
40
60
80
100
0 5 10 15 20 25 30 35 400
20
40
60
80
100
[A] t/[A
] 0 in
%
time [min]
a)
AAO 25 nm AAO 60 nm AAO 180 nm AAO 400 mn
[A] t/[A
] 0 in
%
time [min]
t = 50% release
b)
Figure 6.3: Dissolution testing of acetaminophen form II (a) from AAO membranes
25−400 nm. Each data point represents the mean of two determinations, except AAO
60 nm six determinations. (b) The inset showed a zoomed temperature range.
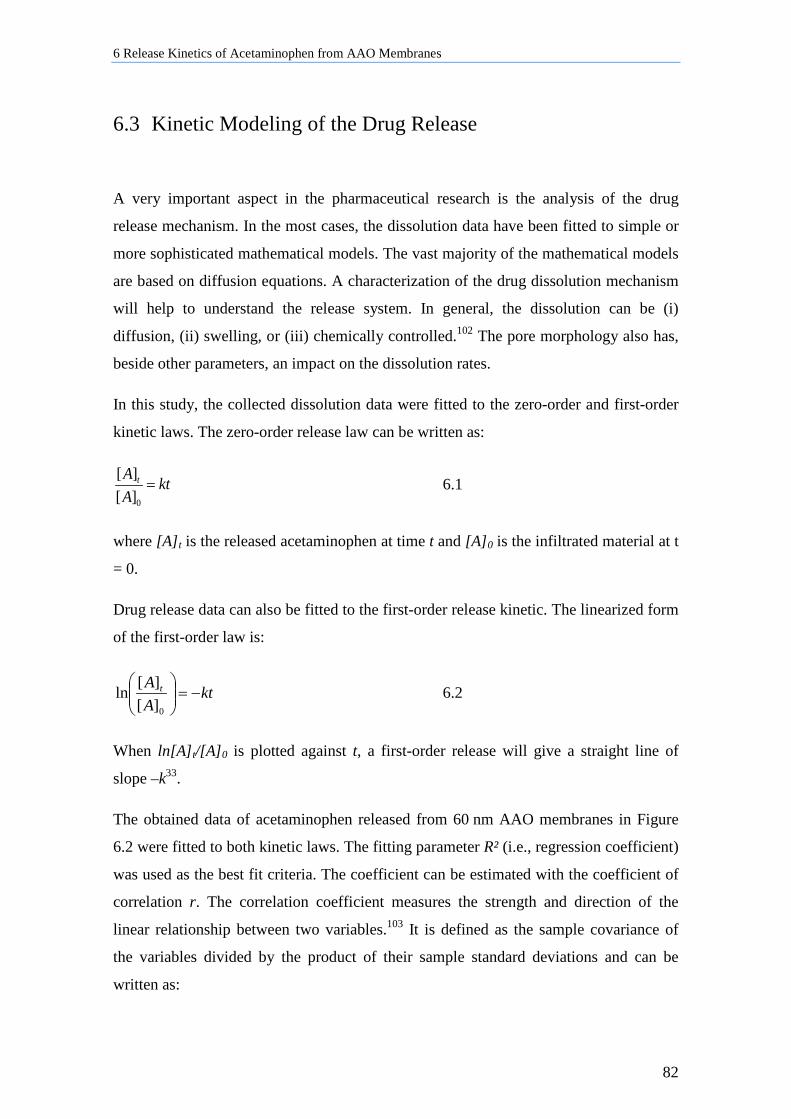
6 Release Kinetics of Acetaminophen from AAO Membranes
82
6.3 Kinetic Modeling of the Drug Release
A very important aspect in the pharmaceutical research is the analysis of the drug
release mechanism. In the most cases, the dissolution data have been fitted to simple or
more sophisticated mathematical models. The vast majority of the mathematical models
are based on diffusion equations. A characterization of the drug dissolution mechanism
will help to understand the release system. In general, the dissolution can be (i)
diffusion, (ii) swelling, or (iii) chemically controlled.102 The pore morphology also has,
beside other parameters, an impact on the dissolution rates.
In this study, the collected dissolution data were fitted to the zero-order and first-order
kinetic laws. The zero-order release law can be written as:
ktAA t =
0][][
6.1
where [A]t is the released acetaminophen at time t and [A]0 is the infiltrated material at t
= 0.
Drug release data can also be fitted to the first-order release kinetic. The linearized form
of the first-order law is:
ktAA t −=
0][][ln 6.2
When ln[A]t/[A]0 is plotted against t, a first-order release will give a straight line of
slope –k33.
The obtained data of acetaminophen released from 60 nm AAO membranes in Figure
6.2 were fitted to both kinetic laws. The fitting parameter R² (i.e., regression coefficient)
was used as the best fit criteria. The coefficient can be estimated with the coefficient of
correlation r. The correlation coefficient measures the strength and direction of the
linear relationship between two variables.103 It is defined as the sample covariance of
the variables divided by the product of their sample standard deviations and can be
written as:
6 Release Kinetics of Acetaminophen from AAO Membranes
83
( ) ( )[ ]
( ) ( )∑ ∑
∑
= =
=
−⋅−
−⋅−=
k
i
k
iii
k
iii
yyxx
yyxxr
1 1
22
1 6.3
where xi is the concentration, yi is the absorption signal at 250 nm, x and y are the
arithmetic means103, and k is the number of data points.
For a better modeling of the controlled drug release from different matrices more
mathematical concepts have been developed. A simple exponential relation gives the
Korsmeyer-Peppas model.102, 104, 105
nt ktAA
=0][
][ 6.4
where n is the diffusional exponent and describes the transport mechanism. With n = 1
the release follows the zero-order law (see Eq.6.1). The exponent n has been
investigated for different shaped matrices. For example, in a cylindrical system n = 0.45
describes a Fickian diffusion and between 0.45 and 0.89 an anomalous (non-Fickian)
transport.102 The limitation factor is that the model should only be used for the first 60%
of the release (i.e., [A]t/[A]0 ≤ 0.6).102, 104 According to the limitation, dissolution data
from Figure 6.2 were also fitted to the Korsmeyer-Peppas model and are shown in
Figure 6.4.
2 4 6 8 10
0,2
0,4
0,6
AAO 60 nm form I AAO 60 nm form II AAO 60 nm amorphous Fit Korsmeyer-Peppas model
[A]/[
A]0
time [min]
Figure 6.4: Acetaminophen form I, form II and amorphous form confined to AAO.
Release data fitted to the Korsmeyer-Peppas model.
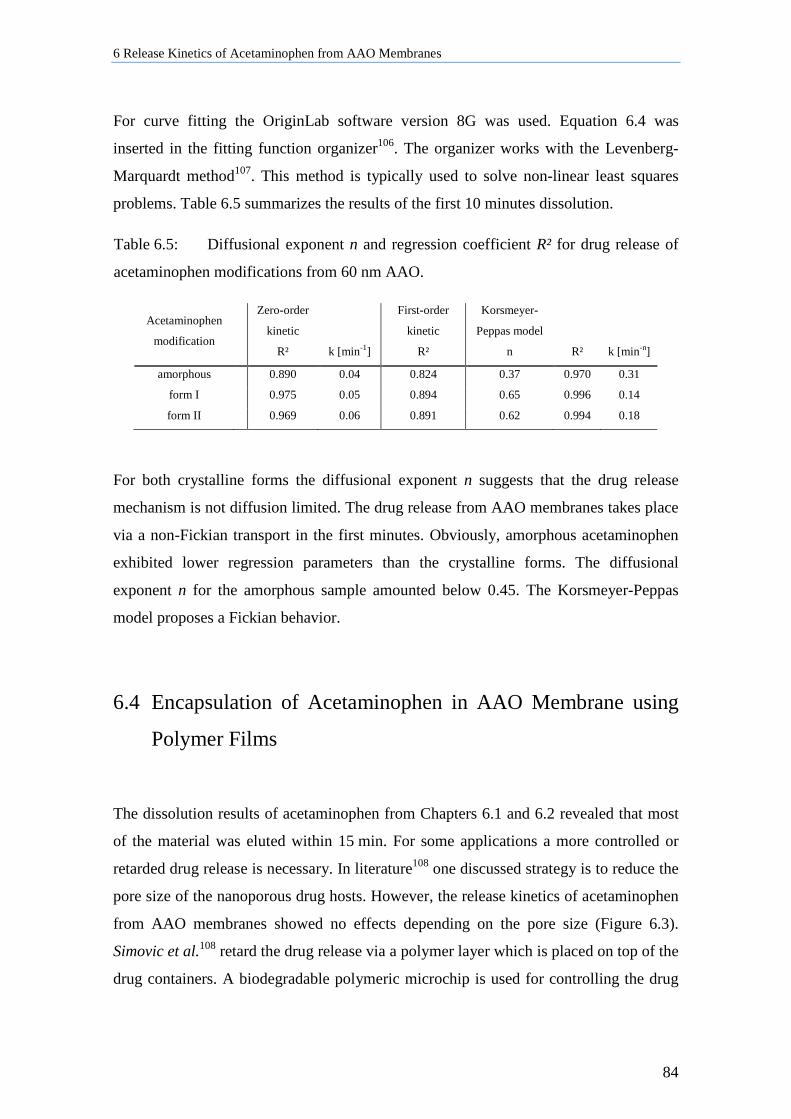
6 Release Kinetics of Acetaminophen from AAO Membranes
84
For curve fitting the OriginLab software version 8G was used. Equation 6.4 was
inserted in the fitting function organizer106. The organizer works with the Levenberg-
Marquardt method107. This method is typically used to solve non-linear least squares
problems. Table 6.5 summarizes the results of the first 10 minutes dissolution.
Table 6.5: Diffusional exponent n and regression coefficient R² for drug release of
acetaminophen modifications from 60 nm AAO.
Acetaminophen
modification
Zero-order
kinetic
R²
k [min-1]
First-order
kinetic
R²
Korsmeyer-
Peppas model
n
R²
k [min-n]
amorphous
0.890 0.04 0.824 0.37 0.970 0.31
form I
0.975 0.05 0.894 0.65 0.996 0.14
form II
0.969 0.06 0.891 0.62 0.994 0.18
For both crystalline forms the diffusional exponent n suggests that the drug release
mechanism is not diffusion limited. The drug release from AAO membranes takes place
via a non-Fickian transport in the first minutes. Obviously, amorphous acetaminophen
exhibited lower regression parameters than the crystalline forms. The diffusional
exponent n for the amorphous sample amounted below 0.45. The Korsmeyer-Peppas
model proposes a Fickian behavior.
6.4 Encapsulation of Acetaminophen in AAO Membrane using
Polymer Films
The dissolution results of acetaminophen from Chapters 6.1 and 6.2 revealed that most
of the material was eluted within 15 min. For some applications a more controlled or
retarded drug release is necessary. In literature108 one discussed strategy is to reduce the
pore size of the nanoporous drug hosts. However, the release kinetics of acetaminophen
from AAO membranes showed no effects depending on the pore size (Figure 6.3).
Simovic et al.108 retard the drug release via a polymer layer which is placed on top of the
drug containers. A biodegradable polymeric microchip is used for controlling the drug
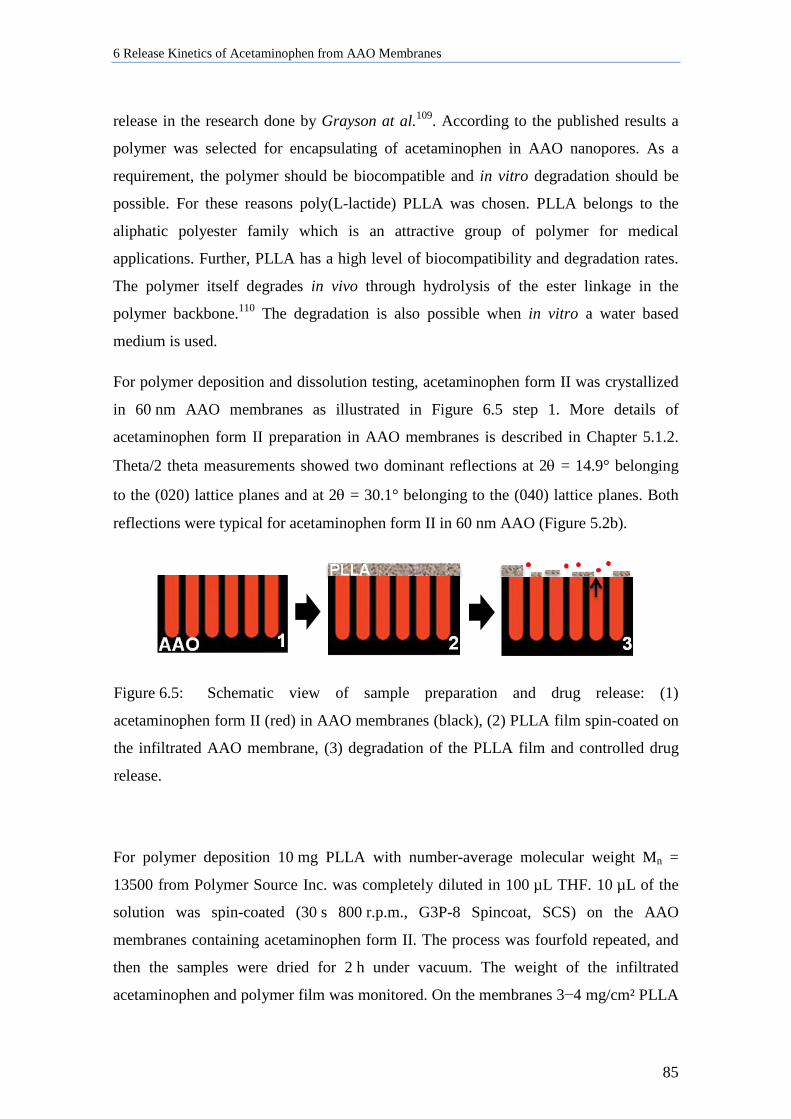
6 Release Kinetics of Acetaminophen from AAO Membranes
85
release in the research done by Grayson at al.109. According to the published results a
polymer was selected for encapsulating of acetaminophen in AAO nanopores. As a
requirement, the polymer should be biocompatible and in vitro degradation should be
possible. For these reasons poly(L-lactide) PLLA was chosen. PLLA belongs to the
aliphatic polyester family which is an attractive group of polymer for medical
applications. Further, PLLA has a high level of biocompatibility and degradation rates.
The polymer itself degrades in vivo through hydrolysis of the ester linkage in the
polymer backbone.110 The degradation is also possible when in vitro a water based
medium is used.
For polymer deposition and dissolution testing, acetaminophen form II was crystallized
in 60 nm AAO membranes as illustrated in Figure 6.5 step 1. More details of
acetaminophen form II preparation in AAO membranes is described in Chapter 5.1.2.
Theta/2 theta measurements showed two dominant reflections at 2θ = 14.9° belonging
to the (020) lattice planes and at 2θ = 30.1° belonging to the (040) lattice planes. Both
reflections were typical for acetaminophen form II in 60 nm AAO (Figure 5.2b).
Figure 6.5: Schematic view of sample preparation and drug release: (1)
acetaminophen form II (red) in AAO membranes (black), (2) PLLA film spin-coated on
the infiltrated AAO membrane, (3) degradation of the PLLA film and controlled drug
release.
For polymer deposition 10 mg PLLA with number-average molecular weight Mn =
13500 from Polymer Source Inc. was completely diluted in 100 µL THF. 10 µL of the
solution was spin-coated (30 s 800 r.p.m., G3P-8 Spincoat, SCS) on the AAO
membranes containing acetaminophen form II. The process was fourfold repeated, and
then the samples were dried for 2 h under vacuum. The weight of the infiltrated
acetaminophen and polymer film was monitored. On the membranes 3−4 mg/cm² PLLA
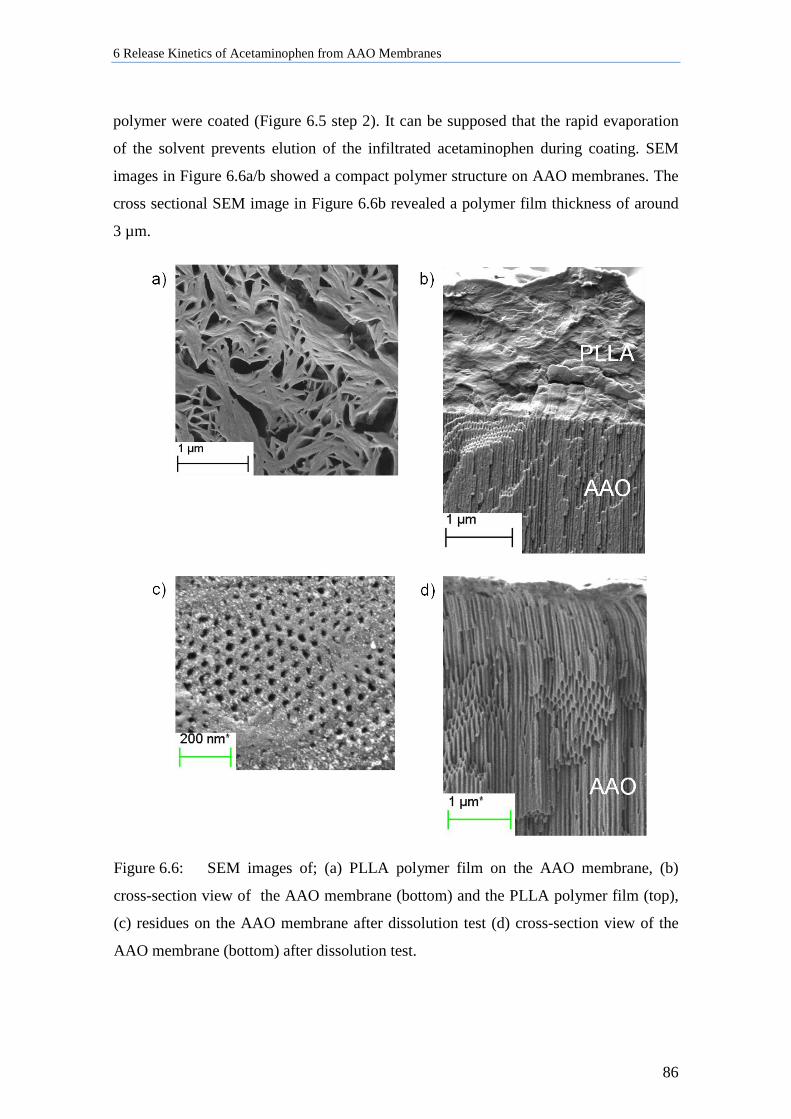
6 Release Kinetics of Acetaminophen from AAO Membranes
86
polymer were coated (Figure 6.5 step 2). It can be supposed that the rapid evaporation
of the solvent prevents elution of the infiltrated acetaminophen during coating. SEM
images in Figure 6.6a/b showed a compact polymer structure on AAO membranes. The
cross sectional SEM image in Figure 6.6b revealed a polymer film thickness of around
3 µm.
Figure 6.6: SEM images of; (a) PLLA polymer film on the AAO membrane, (b)
cross-section view of the AAO membrane (bottom) and the PLLA polymer film (top),
(c) residues on the AAO membrane after dissolution test (d) cross-section view of the
AAO membrane (bottom) after dissolution test.
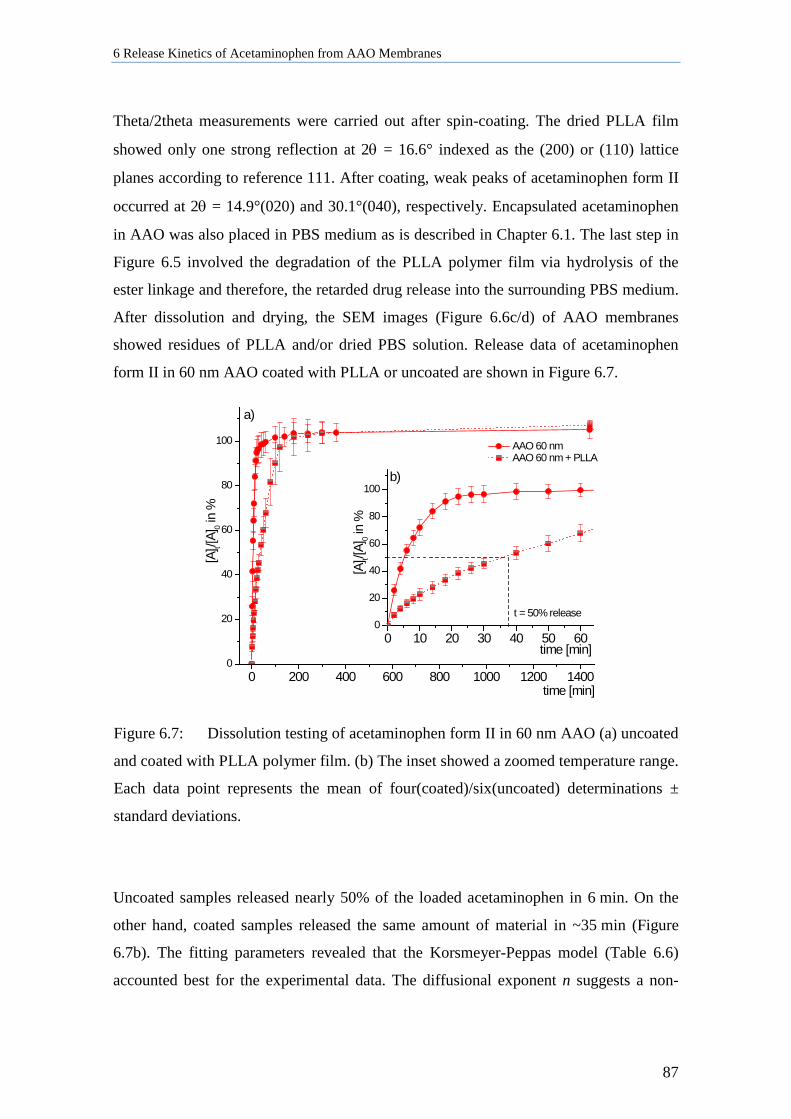
6 Release Kinetics of Acetaminophen from AAO Membranes
87
Theta/2theta measurements were carried out after spin-coating. The dried PLLA film
showed only one strong reflection at 2θ = 16.6° indexed as the (200) or (110) lattice
planes according to reference 111. After coating, weak peaks of acetaminophen form II
occurred at 2θ = 14.9°(020) and 30.1°(040), respectively. Encapsulated acetaminophen
in AAO was also placed in PBS medium as is described in Chapter 6.1. The last step in
Figure 6.5 involved the degradation of the PLLA polymer film via hydrolysis of the
ester linkage and therefore, the retarded drug release into the surrounding PBS medium.
After dissolution and drying, the SEM images (Figure 6.6c/d) of AAO membranes
showed residues of PLLA and/or dried PBS solution. Release data of acetaminophen
form II in 60 nm AAO coated with PLLA or uncoated are shown in Figure 6.7.
0 200 400 600 800 1000 1200 14000
20
40
60
80
100
0 10 20 30 40 50 600
20
40
60
80
100
AAO 60 nm AAO 60 nm + PLLA
[A] t/[A
] 0 in
%
time [min]
a)
[A] t/[A
] 0 in
%
time [min]
t = 50% release
b)
Figure 6.7: Dissolution testing of acetaminophen form II in 60 nm AAO (a) uncoated
and coated with PLLA polymer film. (b) The inset showed a zoomed temperature range.
Each data point represents the mean of four(coated)/six(uncoated) determinations ±
standard deviations.
Uncoated samples released nearly 50% of the loaded acetaminophen in 6 min. On the
other hand, coated samples released the same amount of material in ~35 min (Figure
6.7b). The fitting parameters revealed that the Korsmeyer-Peppas model (Table 6.6)
accounted best for the experimental data. The diffusional exponent n suggests a non-
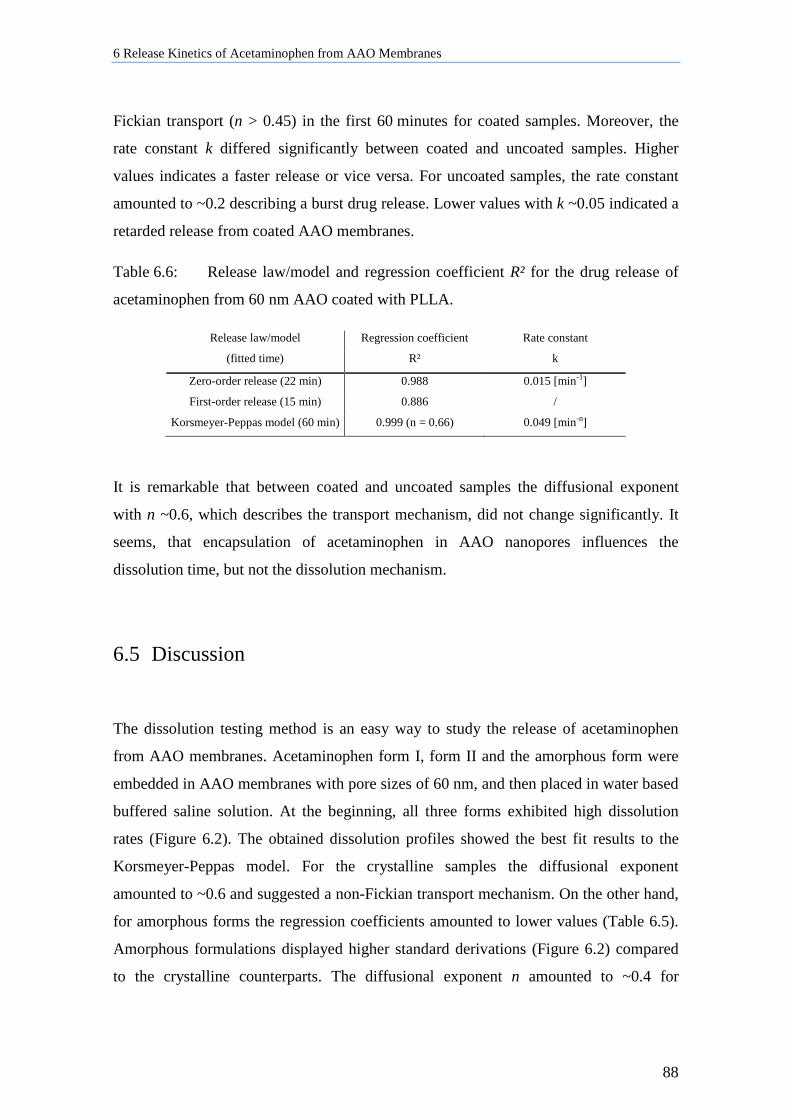
6 Release Kinetics of Acetaminophen from AAO Membranes
88
Fickian transport (n > 0.45) in the first 60 minutes for coated samples. Moreover, the
rate constant k differed significantly between coated and uncoated samples. Higher
values indicates a faster release or vice versa. For uncoated samples, the rate constant
amounted to ~0.2 describing a burst drug release. Lower values with k ~0.05 indicated a
retarded release from coated AAO membranes.
Table 6.6: Release law/model and regression coefficient R² for the drug release of
acetaminophen from 60 nm AAO coated with PLLA.
Release law/model Regression coefficient Rate constant
(fitted time) R² k
Zero-order release (22 min) 0.988 0.015 [min-1]
First-order release (15 min) 0.886 /
Korsmeyer-Peppas model (60 min) 0.999 (n = 0.66) 0.049 [min-n]
It is remarkable that between coated and uncoated samples the diffusional exponent
with n ~0.6, which describes the transport mechanism, did not change significantly. It
seems, that encapsulation of acetaminophen in AAO nanopores influences the
dissolution time, but not the dissolution mechanism.
6.5 Discussion
The dissolution testing method is an easy way to study the release of acetaminophen
from AAO membranes. Acetaminophen form I, form II and the amorphous form were
embedded in AAO membranes with pore sizes of 60 nm, and then placed in water based
buffered saline solution. At the beginning, all three forms exhibited high dissolution
rates (Figure 6.2). The obtained dissolution profiles showed the best fit results to the
Korsmeyer-Peppas model. For the crystalline samples the diffusional exponent
amounted to ~0.6 and suggested a non-Fickian transport mechanism. On the other hand,
for amorphous forms the regression coefficients amounted to lower values (Table 6.5).
Amorphous formulations displayed higher standard derivations (Figure 6.2) compared
to the crystalline counterparts. The diffusional exponent n amounted to ~0.4 for
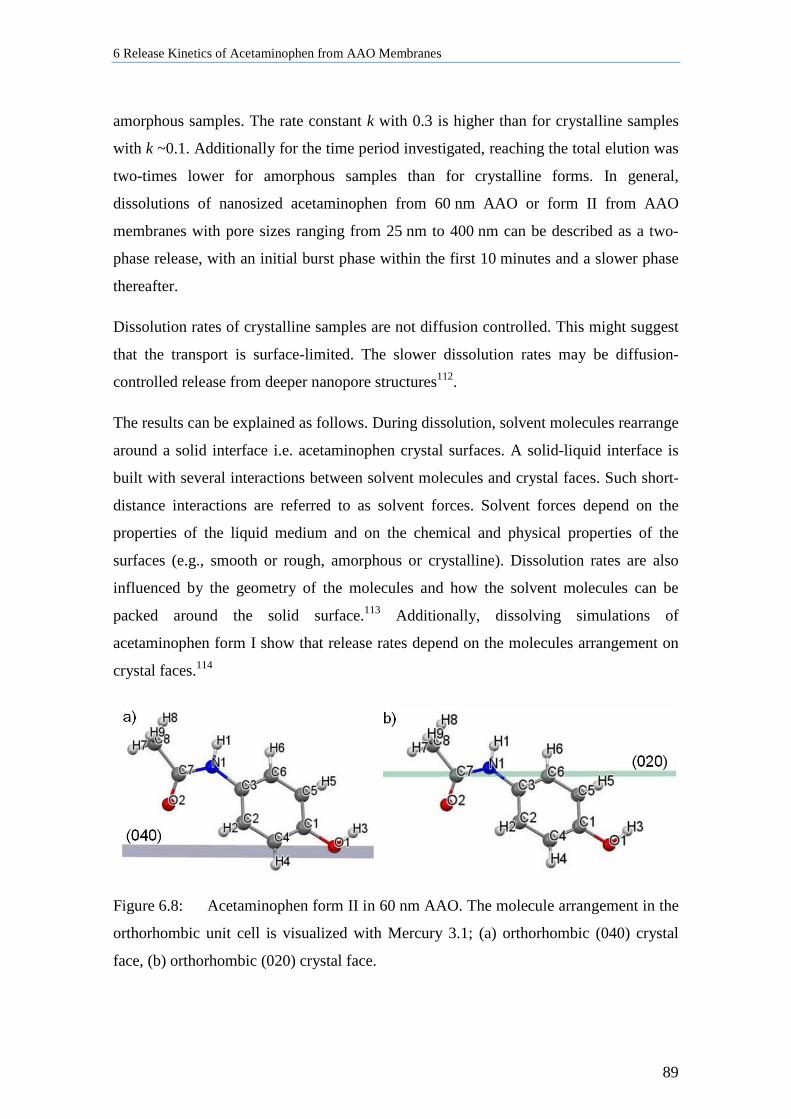
6 Release Kinetics of Acetaminophen from AAO Membranes
89
amorphous samples. The rate constant k with 0.3 is higher than for crystalline samples
with k ~0.1. Additionally for the time period investigated, reaching the total elution was
two-times lower for amorphous samples than for crystalline forms. In general,
dissolutions of nanosized acetaminophen from 60 nm AAO or form II from AAO
membranes with pore sizes ranging from 25 nm to 400 nm can be described as a two-
phase release, with an initial burst phase within the first 10 minutes and a slower phase
thereafter.
Dissolution rates of crystalline samples are not diffusion controlled. This might suggest
that the transport is surface-limited. The slower dissolution rates may be diffusion-
controlled release from deeper nanopore structures112.
The results can be explained as follows. During dissolution, solvent molecules rearrange
around a solid interface i.e. acetaminophen crystal surfaces. A solid-liquid interface is
built with several interactions between solvent molecules and crystal faces. Such short-
distance interactions are referred to as solvent forces. Solvent forces depend on the
properties of the liquid medium and on the chemical and physical properties of the
surfaces (e.g., smooth or rough, amorphous or crystalline). Dissolution rates are also
influenced by the geometry of the molecules and how the solvent molecules can be
packed around the solid surface.113 Additionally, dissolving simulations of
acetaminophen form I show that release rates depend on the molecules arrangement on
crystal faces.114
Figure 6.8: Acetaminophen form II in 60 nm AAO. The molecule arrangement in the
orthorhombic unit cell is visualized with Mercury 3.1; (a) orthorhombic (040) crystal
face, (b) orthorhombic (020) crystal face.
6 Release Kinetics of Acetaminophen from AAO Membranes
90
The crystalline nanosized acetaminophen exposed only few crystal faces to the solvent.
Outfacing functional groups might interact with water molecules and/or PBS buffer
ions. As a result, acetaminophen−acetaminophen molecule interactions will decrease
and solvent−acetaminophen interactions will increase. Solvation or hydration forces
will become dominant. A good example is, acetaminophen form II in AAO membranes
contained uniaxial oriented (020)/(040) crystal faces (Figure 5.19). On such crystal
faces the hydroxyl groups of the aryl moieties protrude from the (040) faces (Figure
6.8a) whereas the amide carbonyl groups protrude from the (020) faces (Figure 6.8b). It
can be concluded that hydroxyl or amide groups can form strong hydrogen bounds
(O−H∙∙O) with solvent molecules. One can therefore assume that crystal faces with out-
facing hydrophilic functional moiety might facilitate the interaction with solute
molecules. As a result, dissolution rates of crystalline forms are as fast as amorphous
forms. Note that the concept of solubility should not be applied to amorphous forms.
The amorphous material in a solute can be understood as a kinetically driven state that
is not in equilibrium.25 In this study, the term ‘solubility’ is used in context of all
acetaminophen formulations.
Nevertheless, in all three forms solvent molecules could more or less fluctuate fast
through the pores. Fast dissolution rates indicate that solvent molecules and/or diluted
molecules are less hindered to move out in the bulk medium. It should be kept in mind
that the nanosize of the crystallites also favors higher dissolution rates.
However, dissolution profiles revealed differences between crystalline and amorphous
forms. As previously reported7, acetaminophen forms rigid amorphous layer on CPG
pore walls indicated by a second glass transition step (Tg) at ~35°C additional to the
bulk Tg at ~24°C. CPG and AAO pore walls are both hydroxyl-terminated and it can be
assumed that CPG and AAO pore walls have a similar chemical behavior. Hence,
acetaminophen might also form an immobilized layer on AAO pore walls. One can
conclude that the amorphous material builds such a stabile interfacial layer on AAO
pore walls during the aging of the sample. Furthermore, such layers might influence the
molecule mobility near the pore walls, too. As a result, complete release of amorphous
acetaminophen from AAO nanopores takes more time than for crystalline samples.
Crystalline samples may not form interfacial layers on AAO pore walls.
6 Release Kinetics of Acetaminophen from AAO Membranes
91
Anodic aluminum oxide membranes with different pore sizes do not influence the
release kinetics of acetaminophen. The model drug acetaminophen is a small molecule.
Therefore, the chosen pore sizes cannot control the drug delivery of such small sized
molecules. Agreeing with a previous study115 of crystal violet in AAO membranes it has
been suggested that the molecule size must extent that the pore size becomes the speed-
controlling function. Another assumption might be that the crystallinity of the samples
compensates the influence of the pore sizes on dissolution rates.
Using a biodegradable polymer for encapsulating acetaminophen in nanopores is one
strategy to enlarge the drug release time. Acetaminophen infiltrated in AAO membranes
and covered with a PLLA polymer film showed a retarded drug release (Figure 6.7).
The dissolution results revealed that the rate constant k decreases from uncoated (0.2) to
coated (0.05) samples. The diffusional exponent amounted to ~0.6 for coated as well as
for uncoated samples. It is assumed that the release is not influenced by the diffusion of
the solvent or hydrated acetaminophen molecules through the PLLA polymer film. The
polymer film is slowly degraded when placed in the PBS medium due to the hydrolysis
of the ester bound. The PLLA polymer film reduces and solvent molecules reach the
acetaminophen in the AAO pores. It can be assumed that not all nanopores are open at
the same time. Hence, dissolutions only occur when the PLLA polymer film is removed
from the pores which lead to a retarded drug release. Experimental data suggests that
the dissolution process of encapsulated ACE is surface-limited. Sealing the AAO
nanopores with a PLLA polymer film influences the dissolution time due to the removal
of the film before dissolution but does not influence the release kinetics.
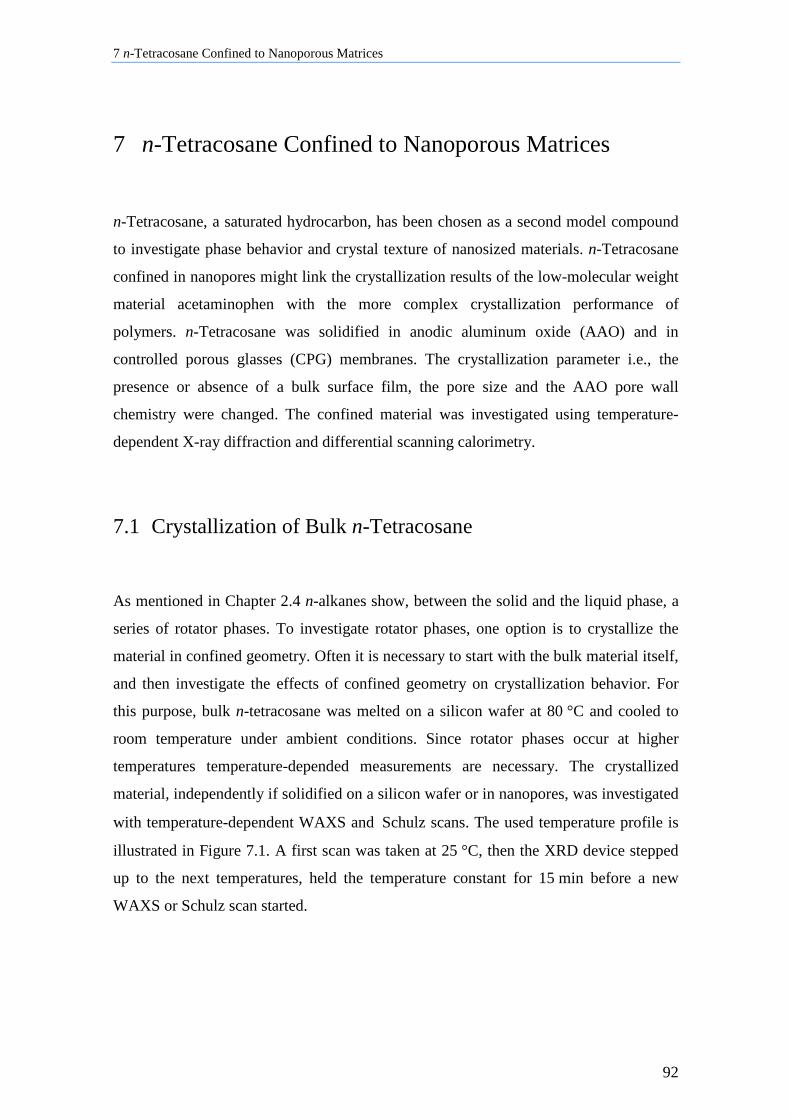
7 n-Tetracosane Confined to Nanoporous Matrices
92
7 n-Tetracosane Confined to Nanoporous Matrices
n-Tetracosane, a saturated hydrocarbon, has been chosen as a second model compound
to investigate phase behavior and crystal texture of nanosized materials. n-Tetracosane
confined in nanopores might link the crystallization results of the low-molecular weight
material acetaminophen with the more complex crystallization performance of
polymers. n-Tetracosane was solidified in anodic aluminum oxide (AAO) and in
controlled porous glasses (CPG) membranes. The crystallization parameter i.e., the
presence or absence of a bulk surface film, the pore size and the AAO pore wall
chemistry were changed. The confined material was investigated using temperature-
dependent X-ray diffraction and differential scanning calorimetry.
7.1 Crystallization of Bulk n-Tetracosane
As mentioned in Chapter 2.4 n-alkanes show, between the solid and the liquid phase, a
series of rotator phases. To investigate rotator phases, one option is to crystallize the
material in confined geometry. Often it is necessary to start with the bulk material itself,
and then investigate the effects of confined geometry on crystallization behavior. For
this purpose, bulk n-tetracosane was melted on a silicon wafer at 80 °C and cooled to
room temperature under ambient conditions. Since rotator phases occur at higher
temperatures temperature-depended measurements are necessary. The crystallized
material, independently if solidified on a silicon wafer or in nanopores, was investigated
with temperature-dependent WAXS and Schulz scans. The used temperature profile is
illustrated in Figure 7.1. A first scan was taken at 25 °C, then the XRD device stepped
up to the next temperatures, held the temperature constant for 15 min before a new
WAXS or Schulz scan started.
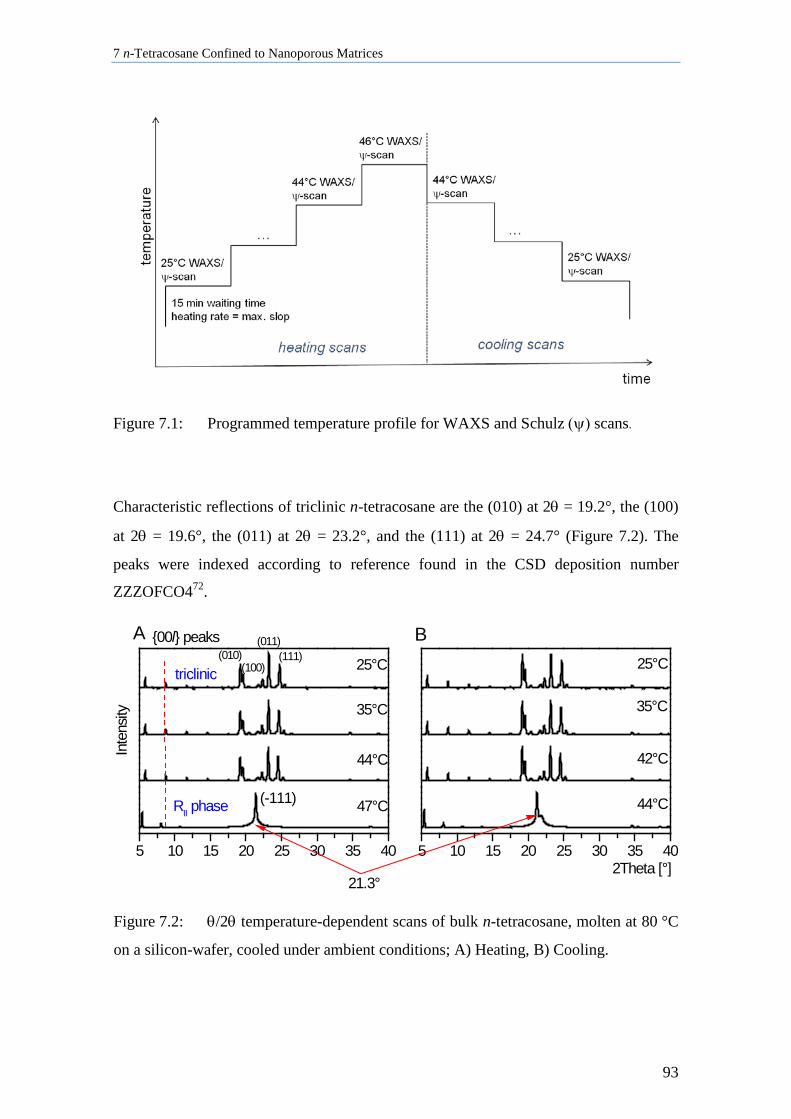
7 n-Tetracosane Confined to Nanoporous Matrices
93
Figure 7.1: Programmed temperature profile for WAXS and Schulz (ψ) scans.
Characteristic reflections of triclinic n-tetracosane are the (010) at 2θ = 19.2°, the (100)
at 2θ = 19.6°, the (011) at 2θ = 23.2°, and the (111) at 2θ = 24.7° (Figure 7.2). The
peaks were indexed according to reference found in the CSD deposition number
ZZZOFCO472.
5 10 15 20 25 30 35 40 5 10 15 20 25 30 35 40
Inte
nsity
(010)
(100)(111)
(011)
triclinic
35°C
21.3°
{00l} peaks
44°C
47°C
(-111)RII phase
25°C
35°C
42°C
44°C
B
2Theta [°]
A25°C
Figure 7.2: θ/2θ temperature-dependent scans of bulk n-tetracosane, molten at 80 °C
on a silicon-wafer, cooled under ambient conditions; A) Heating, B) Cooling.
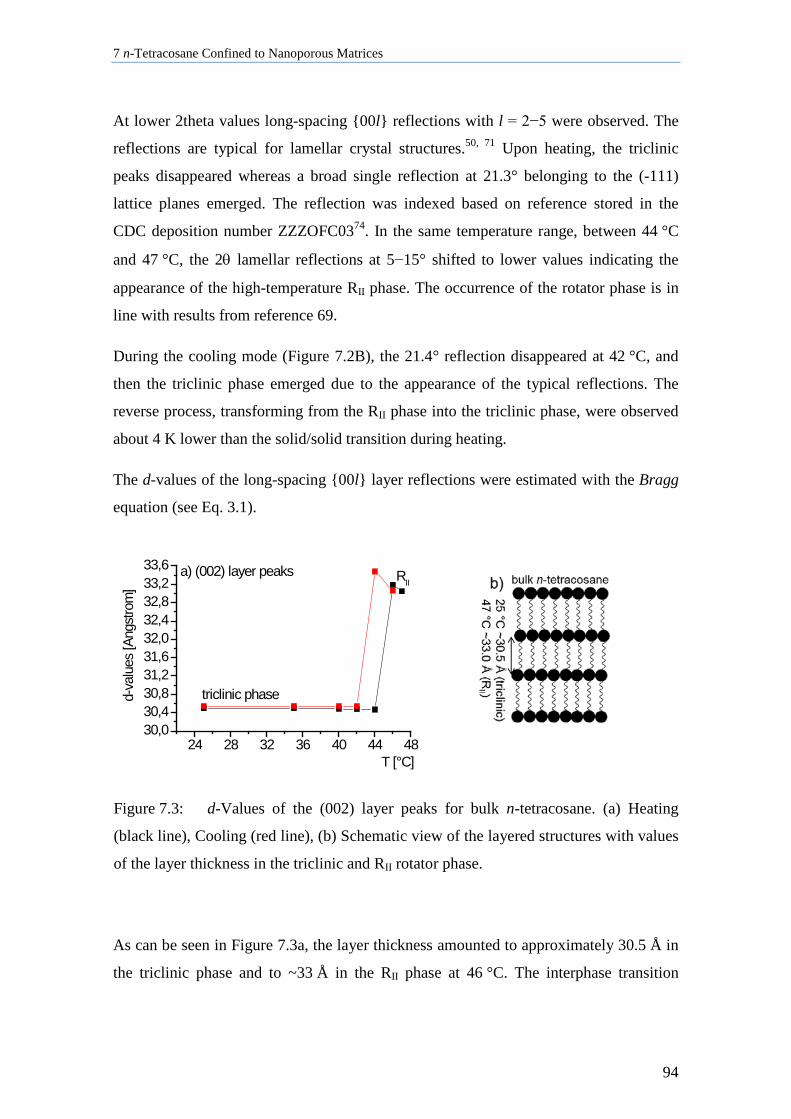
7 n-Tetracosane Confined to Nanoporous Matrices
94
At lower 2theta values long-spacing {00l} reflections with l = 2−5 were observed. The
reflections are typical for lamellar crystal structures.50, 71 Upon heating, the triclinic
peaks disappeared whereas a broad single reflection at 21.3° belonging to the (-111)
lattice planes emerged. The reflection was indexed based on reference stored in the
CDC deposition number ZZZOFC0374. In the same temperature range, between 44 °C
and 47 °C, the 2θ lamellar reflections at 5−15° shifted to lower values indicating the
appearance of the high-temperature RII phase. The occurrence of the rotator phase is in
line with results from reference 69.
During the cooling mode (Figure 7.2B), the 21.4° reflection disappeared at 42 °C, and
then the triclinic phase emerged due to the appearance of the typical reflections. The
reverse process, transforming from the RII phase into the triclinic phase, were observed
about 4 K lower than the solid/solid transition during heating.
The d-values of the long-spacing {00l} layer reflections were estimated with the Bragg
equation (see Eq. 3.1).
24 28 32 36 40 44 4830,030,430,831,231,632,032,432,833,233,6
d-va
lues
[Ang
stro
m]
T [°C]
a) (002) layer peaks
triclinic phase
RII
Figure 7.3: d-Values of the (002) layer peaks for bulk n-tetracosane. (a) Heating
(black line), Cooling (red line), (b) Schematic view of the layered structures with values
of the layer thickness in the triclinic and RII rotator phase.
As can be seen in Figure 7.3a, the layer thickness amounted to approximately 30.5 Å in
the triclinic phase and to ~33 Å in the RII phase at 46 °C. The interphase transition
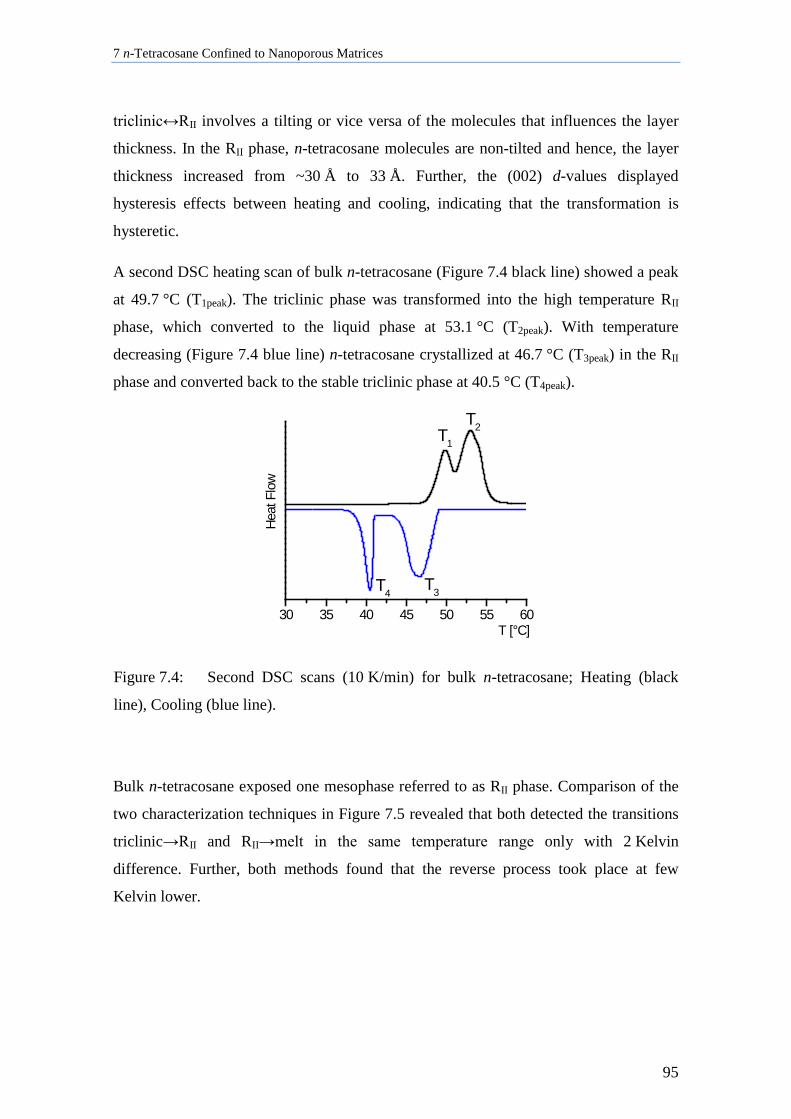
7 n-Tetracosane Confined to Nanoporous Matrices
95
triclinic↔RII involves a tilting or vice versa of the molecules that influences the layer
thickness. In the RII phase, n-tetracosane molecules are non-tilted and hence, the layer
thickness increased from ~30 Å to 33 Å. Further, the (002) d-values displayed
hysteresis effects between heating and cooling, indicating that the transformation is
hysteretic.
A second DSC heating scan of bulk n-tetracosane (Figure 7.4 black line) showed a peak
at 49.7 °C (T1peak). The triclinic phase was transformed into the high temperature RII
phase, which converted to the liquid phase at 53.1 °C (T2peak). With temperature
decreasing (Figure 7.4 blue line) n-tetracosane crystallized at 46.7 °C (T3peak) in the RII
phase and converted back to the stable triclinic phase at 40.5 °C (T4peak).
30 35 40 45 50 55 60
T4T3
T2
Heat
Flo
w
T [°C]
T1
Figure 7.4: Second DSC scans (10 K/min) for bulk n-tetracosane; Heating (black
line), Cooling (blue line).
Bulk n-tetracosane exposed one mesophase referred to as RII phase. Comparison of the
two characterization techniques in Figure 7.5 revealed that both detected the transitions
triclinic→RII and RII→melt in the same temperature range only with 2 Kelvin
difference. Further, both methods found that the reverse process took place at few
Kelvin lower.
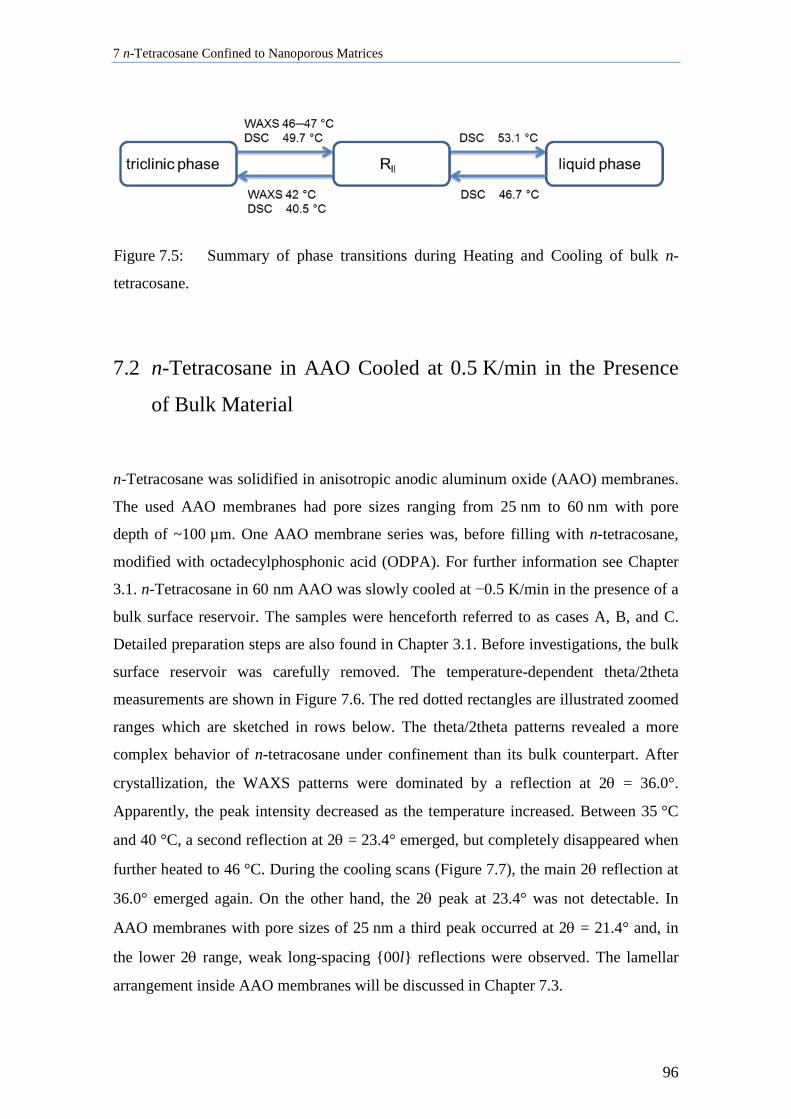
7 n-Tetracosane Confined to Nanoporous Matrices
96
Figure 7.5: Summary of phase transitions during Heating and Cooling of bulk n-
tetracosane.
7.2 n-Tetracosane in AAO Cooled at 0.5 K/min in the Presence
of Bulk Material
n-Tetracosane was solidified in anisotropic anodic aluminum oxide (AAO) membranes.
The used AAO membranes had pore sizes ranging from 25 nm to 60 nm with pore
depth of ~100 µm. One AAO membrane series was, before filling with n-tetracosane,
modified with octadecylphosphonic acid (ODPA). For further information see Chapter
3.1. n-Tetracosane in 60 nm AAO was slowly cooled at −0.5 K/min in the presence of a
bulk surface reservoir. The samples were henceforth referred to as cases A, B, and C.
Detailed preparation steps are also found in Chapter 3.1. Before investigations, the bulk
surface reservoir was carefully removed. The temperature-dependent theta/2theta
measurements are shown in Figure 7.6. The red dotted rectangles are illustrated zoomed
ranges which are sketched in rows below. The theta/2theta patterns revealed a more
complex behavior of n-tetracosane under confinement than its bulk counterpart. After
crystallization, the WAXS patterns were dominated by a reflection at 2θ = 36.0°.
Apparently, the peak intensity decreased as the temperature increased. Between 35 °C
and 40 °C, a second reflection at 2θ = 23.4° emerged, but completely disappeared when
further heated to 46 °C. During the cooling scans (Figure 7.7), the main 2θ reflection at
36.0° emerged again. On the other hand, the 2θ peak at 23.4° was not detectable. In
AAO membranes with pore sizes of 25 nm a third peak occurred at 2θ = 21.4° and, in
the lower 2θ range, weak long-spacing {00l} reflections were observed. The lamellar
arrangement inside AAO membranes will be discussed in Chapter 7.3.
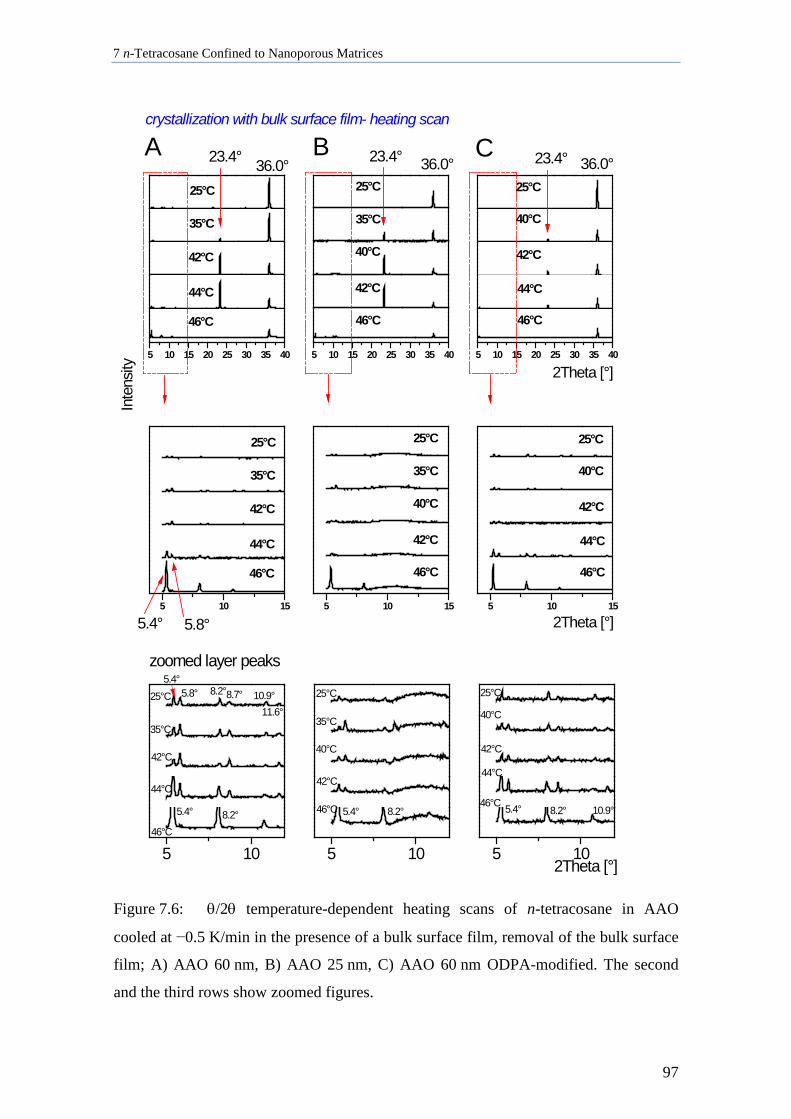
7 n-Tetracosane Confined to Nanoporous Matrices
97
5 10 15 20 25 30 35 40 5 10 15 20 25 30 35 40 5 10 15 20 25 30 35 40
5 10 15 5 10 15 5 10 15
25°C
23.4°
25°C
35°C
42°C
44°C
46°C
crystallization with bulk surface film- heating scan 35°C
Inte
nsity
42°C
44°C
46°C
25°C
25°C
35°C
40°C
42°C
46°C
35°C
40°C
42°C
46°C
25°C
40°C
42°C
44°C
46°C
2Theta [°]
25°C
40°C
42°C
44°C
46°C
36.0°
5.4° 5.8°
23.4° 36.0°36.0°23.4°A C
2Theta [°]
B
5 10 5 10 5 10
25°C11.6°
10.9°8.7°8.2°
5.4°5.8°
35°C
42°C
25°C
35°C
40°C
42°C
46°C
5.4°
25°C
42°C
44°C
46°C
40°C
44°C
46°C8.2°
5.4°
8.2°5.4°
10.9°8.2°
2Theta [°]
zoomed layer peaks
Figure 7.6: θ/2θ temperature-dependent heating scans of n-tetracosane in AAO
cooled at −0.5 K/min in the presence of a bulk surface film, removal of the bulk surface
film; A) AAO 60 nm, B) AAO 25 nm, C) AAO 60 nm ODPA-modified. The second
and the third rows show zoomed figures.
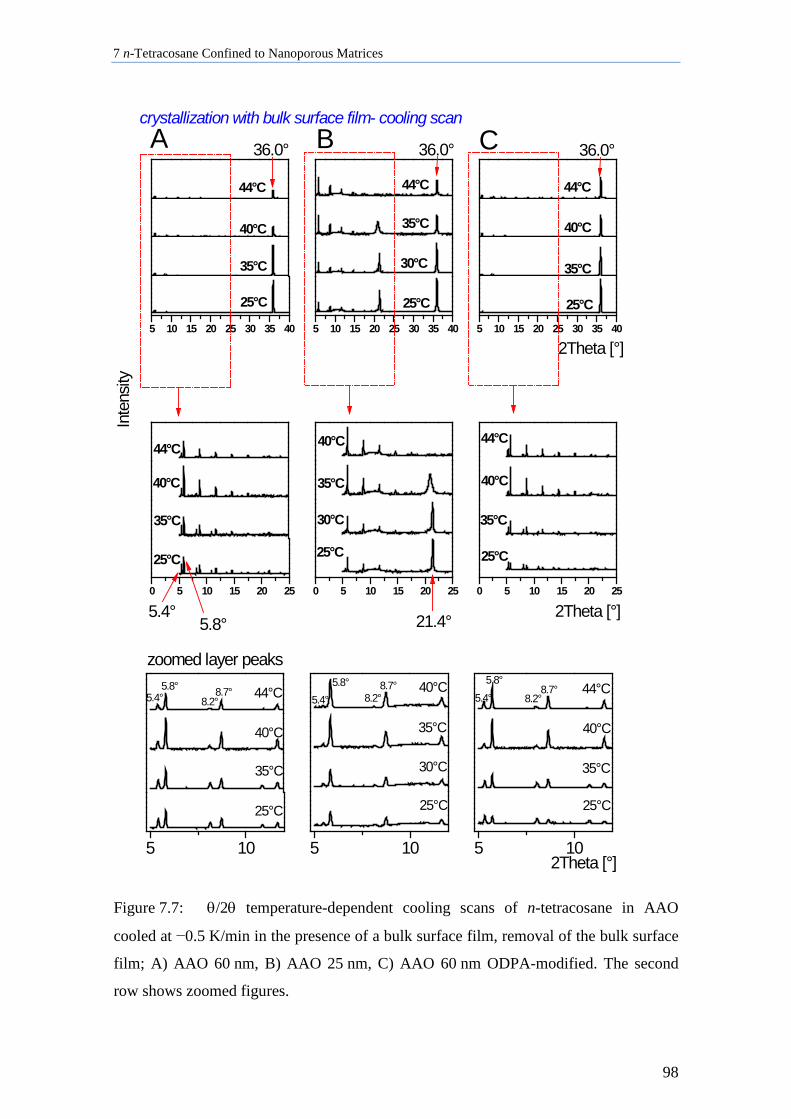
7 n-Tetracosane Confined to Nanoporous Matrices
98
5 10 15 20 25 30 35 40 5 10 15 20 25 30 35 40 5 10 15 20 25 30 35 40
0 5 10 15 20 25 0 5 10 15 20 25 0 5 10 15 20 25
Inte
nsity
25°C
35°C
40°C
44°C
25°C
30°C
35°C
44°C
2Theta [°]
25°C
35°C
40°C
44°C
25°C
35°C
40°C
44°C
25°C
30°C 35°C
40°C
CB
2Theta [°]
25°C
Acrystallization with bulk surface film- cooling scan
35°C 5.8°
5.4°
36.0°36.0°
40°C
36.0°
21.4°
44°C
5 10 5 10 5 10
25°C
35°C
40°C
8.2°8.7°5.8°
44°C
25°C
30°C
35°C
40°C5.4°
8.7°5.8°
25°C
2Theta [°]
zoomed layer peaks
5.4°
35°C
40°C
44°C5.4°8.2° 8.2°
8.7°5.8°
Figure 7.7: θ/2θ temperature-dependent cooling scans of n-tetracosane in AAO
cooled at −0.5 K/min in the presence of a bulk surface film, removal of the bulk surface
film; A) AAO 60 nm, B) AAO 25 nm, C) AAO 60 nm ODPA-modified. The second
row shows zoomed figures.
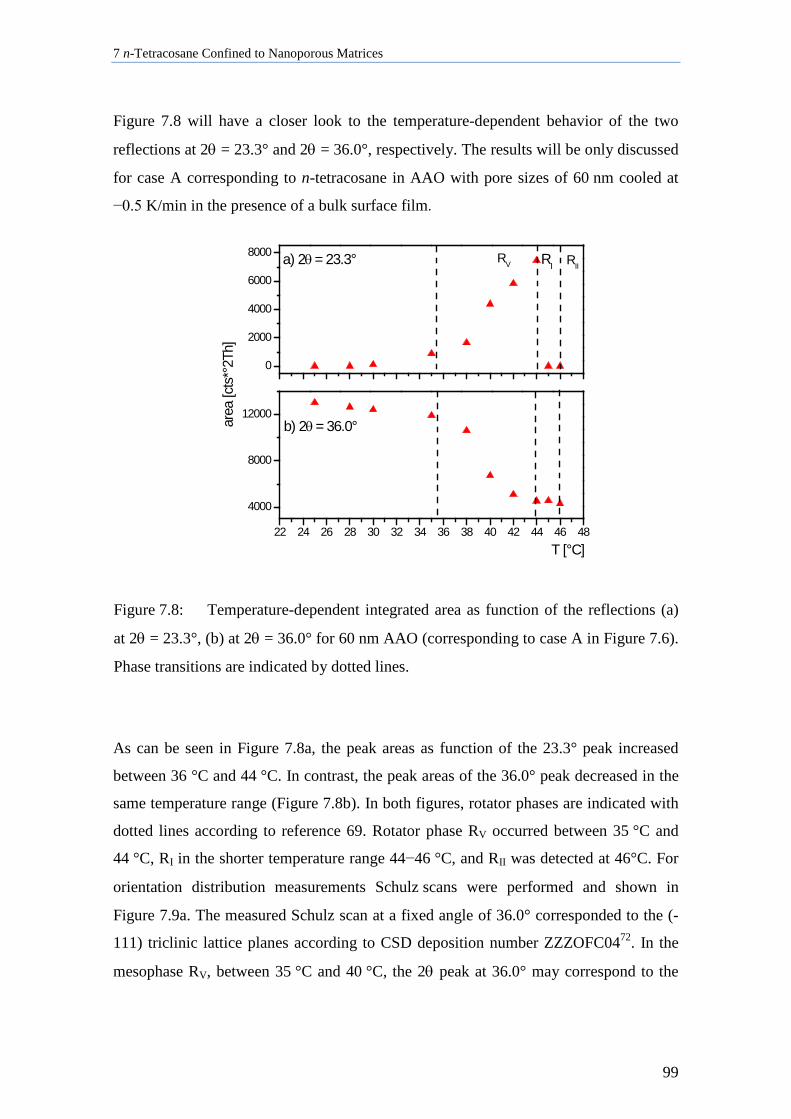
7 n-Tetracosane Confined to Nanoporous Matrices
99
Figure 7.8 will have a closer look to the temperature-dependent behavior of the two
reflections at 2θ = 23.3° and 2θ = 36.0°, respectively. The results will be only discussed
for case A corresponding to n-tetracosane in AAO with pore sizes of 60 nm cooled at
−0.5 K/min in the presence of a bulk surface film.
0
2000
4000
6000
8000
22 24 26 28 30 32 34 36 38 40 42 44 46 48
4000
8000
12000
RIIRV RI
a) 2θ = 23.3°
area
[cts
*°2T
h]
T [°C]
b) 2θ = 36.0°
Figure 7.8: Temperature-dependent integrated area as function of the reflections (a)
at 2θ = 23.3°, (b) at 2θ = 36.0° for 60 nm AAO (corresponding to case A in Figure 7.6).
Phase transitions are indicated by dotted lines.
As can be seen in Figure 7.8a, the peak areas as function of the 23.3° peak increased
between 36 °C and 44 °C. In contrast, the peak areas of the 36.0° peak decreased in the
same temperature range (Figure 7.8b). In both figures, rotator phases are indicated with
dotted lines according to reference 69. Rotator phase RV occurred between 35 °C and
44 °C, RI in the shorter temperature range 44−46 °C, and RII was detected at 46°C. For
orientation distribution measurements Schulz scans were performed and shown in
Figure 7.9a. The measured Schulz scan at a fixed angle of 36.0° corresponded to the (-
111) triclinic lattice planes according to CSD deposition number ZZZOFC0472. In the
mesophase RV, between 35 °C and 40 °C, the 2θ peak at 36.0° may correspond to the
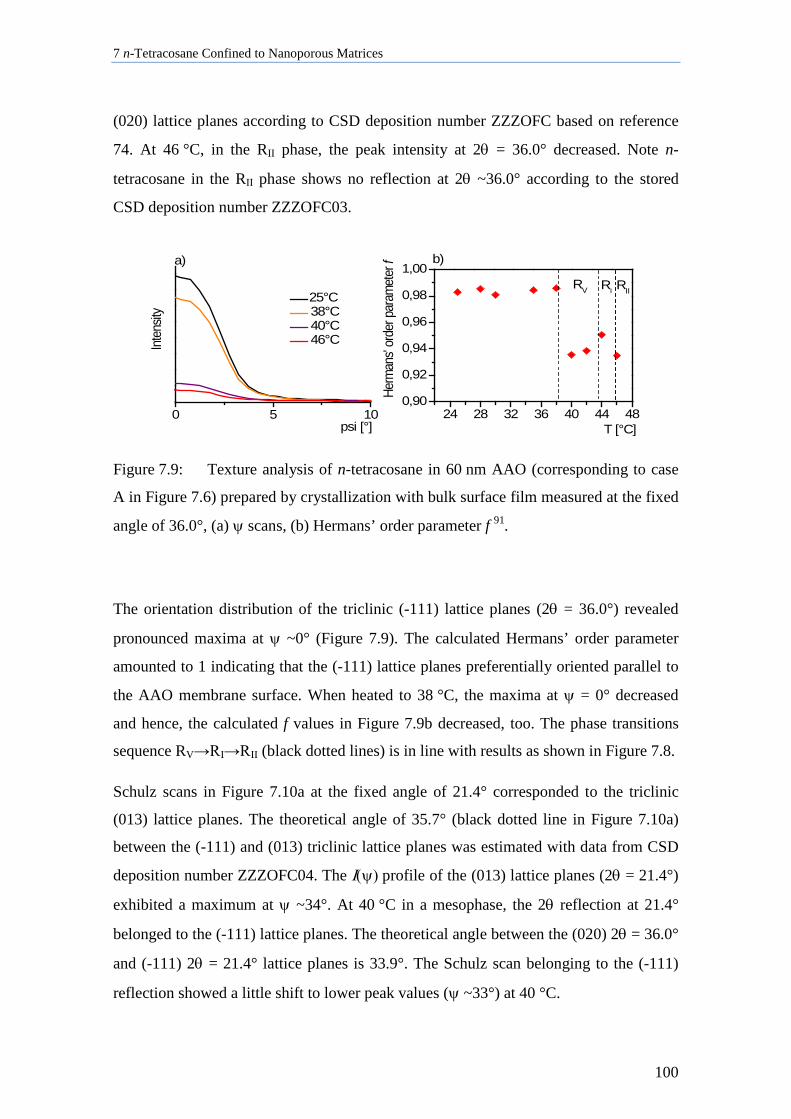
7 n-Tetracosane Confined to Nanoporous Matrices
100
(020) lattice planes according to CSD deposition number ZZZOFC based on reference
74. At 46 °C, in the RII phase, the peak intensity at 2θ = 36.0° decreased. Note n-
tetracosane in the RII phase shows no reflection at 2θ ~36.0° according to the stored
CSD deposition number ZZZOFC03.
0 5 10 24 28 32 36 40 44 480,90
0,92
0,94
0,96
0,98
1,00
25°C 38°C 40°C 46°CIn
tens
ity
psi [°]
a)
RIIRI
Herm
ans'
orde
r par
amet
er f
T [°C]
b)
RV
Figure 7.9: Texture analysis of n-tetracosane in 60 nm AAO (corresponding to case
A in Figure 7.6) prepared by crystallization with bulk surface film measured at the fixed
angle of 36.0°, (a) ψ scans, (b) Hermans’ order parameter f 91.
The orientation distribution of the triclinic (-111) lattice planes (2θ = 36.0°) revealed
pronounced maxima at ψ ~0° (Figure 7.9). The calculated Hermans’ order parameter
amounted to 1 indicating that the (-111) lattice planes preferentially oriented parallel to
the AAO membrane surface. When heated to 38 °C, the maxima at ψ = 0° decreased
and hence, the calculated f values in Figure 7.9b decreased, too. The phase transitions
sequence RV→RI→RII (black dotted lines) is in line with results as shown in Figure 7.8.
Schulz scans in Figure 7.10a at the fixed angle of 21.4° corresponded to the triclinic
(013) lattice planes. The theoretical angle of 35.7° (black dotted line in Figure 7.10a)
between the (-111) and (013) triclinic lattice planes was estimated with data from CSD
deposition number ZZZOFC04. The Ι(ψ) profile of the (013) lattice planes (2θ = 21.4°)
exhibited a maximum at ψ ~34°. At 40 °C in a mesophase, the 2θ reflection at 21.4°
belonged to the (-111) lattice planes. The theoretical angle between the (020) 2θ = 36.0°
and (-111) 2θ = 21.4° lattice planes is 33.9°. The Schulz scan belonging to the (-111)
reflection showed a little shift to lower peak values (ψ ~33°) at 40 °C.
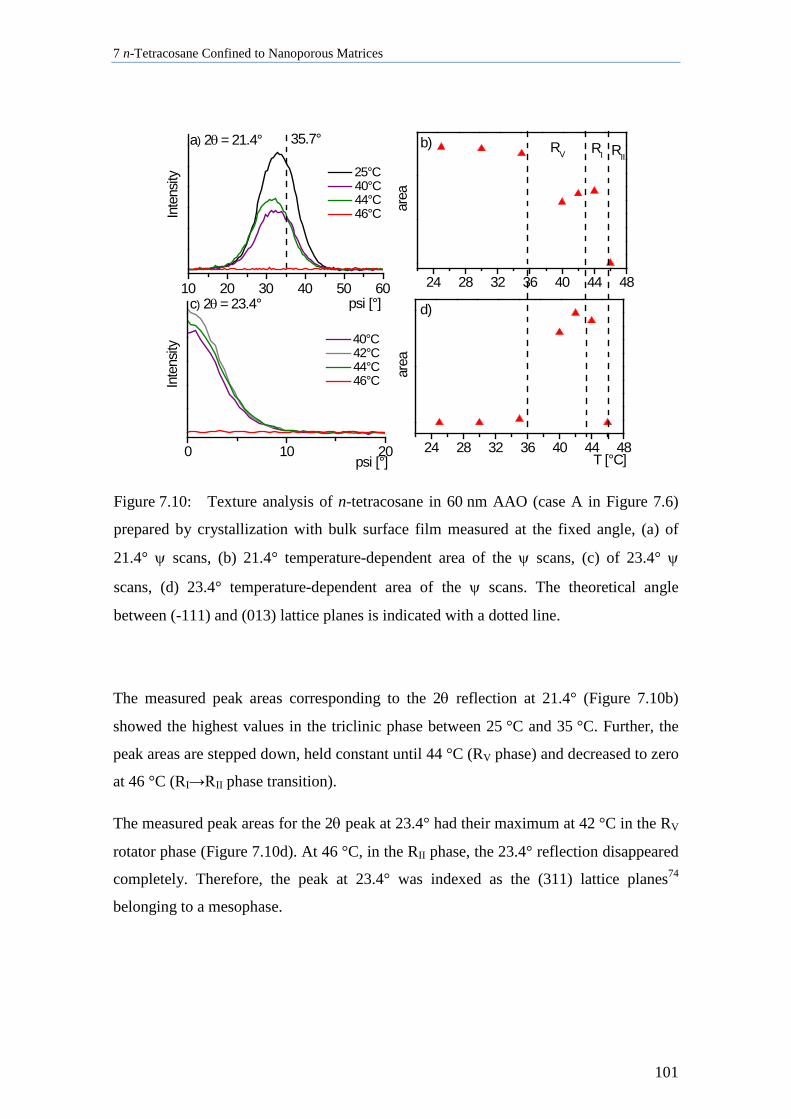
7 n-Tetracosane Confined to Nanoporous Matrices
101
10 20 30 40 50 60 24 28 32 36 40 44 48
0 10 20 24 28 32 36 40 44 48
Inte
nsity
psi [°]
25°C 40°C 44°C 46°C
a) 2θ = 21.4° 35.7°
RIIRI
area
b) RV
Inte
nsity
psi [°]
40°C 42°C 44°C 46°C
c) 2θ = 23.4°
area
T [°C]
d)
Figure 7.10: Texture analysis of n-tetracosane in 60 nm AAO (case A in Figure 7.6)
prepared by crystallization with bulk surface film measured at the fixed angle, (a) of
21.4° ψ scans, (b) 21.4° temperature-dependent area of the ψ scans, (c) of 23.4° ψ
scans, (d) 23.4° temperature-dependent area of the ψ scans. The theoretical angle
between (-111) and (013) lattice planes is indicated with a dotted line.
The measured peak areas corresponding to the 2θ reflection at 21.4° (Figure 7.10b)
showed the highest values in the triclinic phase between 25 °C and 35 °C. Further, the
peak areas are stepped down, held constant until 44 °C (RV phase) and decreased to zero
at 46 °C (RI→RII phase transition).
The measured peak areas for the 2θ peak at 23.4° had their maximum at 42 °C in the RV
rotator phase (Figure 7.10d). At 46 °C, in the RII phase, the 23.4° reflection disappeared
completely. Therefore, the peak at 23.4° was indexed as the (311) lattice planes74
belonging to a mesophase.
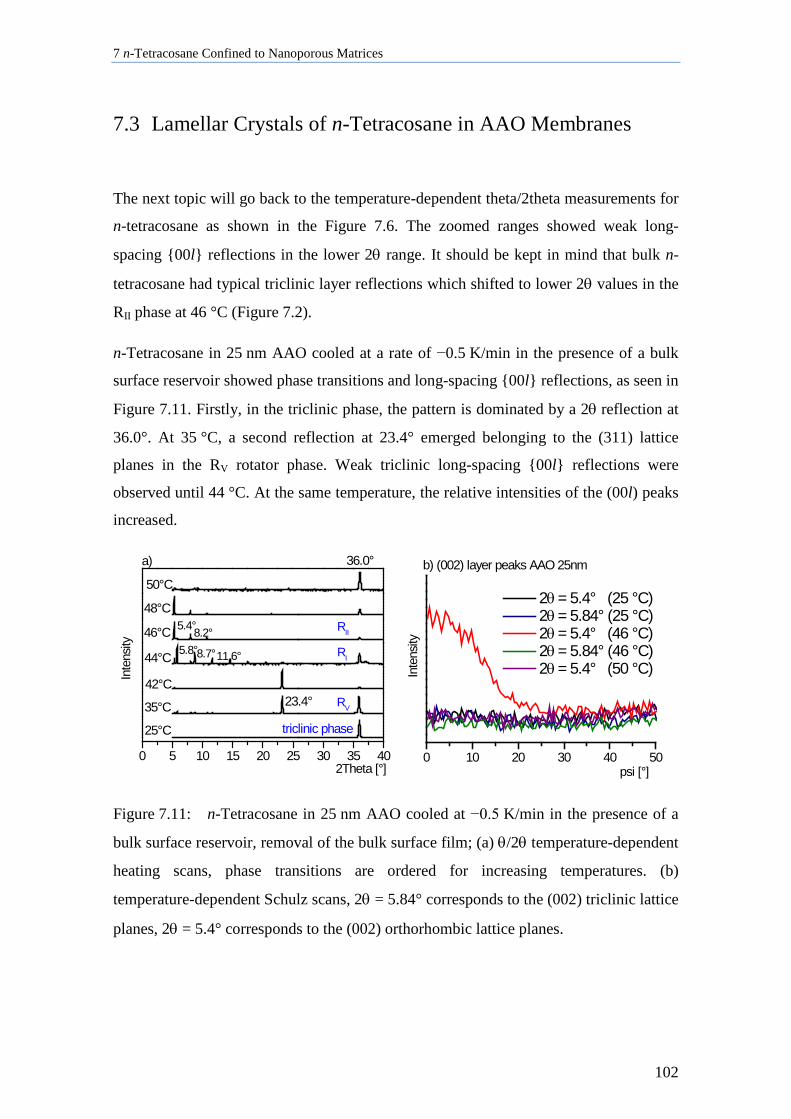
7 n-Tetracosane Confined to Nanoporous Matrices
102
7.3 Lamellar Crystals of n-Tetracosane in AAO Membranes
The next topic will go back to the temperature-dependent theta/2theta measurements for
n-tetracosane as shown in the Figure 7.6. The zoomed ranges showed weak long-
spacing {00l} reflections in the lower 2θ range. It should be kept in mind that bulk n-
tetracosane had typical triclinic layer reflections which shifted to lower 2θ values in the
RII phase at 46 °C (Figure 7.2).
n-Tetracosane in 25 nm AAO cooled at a rate of −0.5 K/min in the presence of a bulk
surface reservoir showed phase transitions and long-spacing {00l} reflections, as seen in
Figure 7.11. Firstly, in the triclinic phase, the pattern is dominated by a 2θ reflection at
36.0°. At 35 °C, a second reflection at 23.4° emerged belonging to the (311) lattice
planes in the RV rotator phase. Weak triclinic long-spacing {00l} reflections were
observed until 44 °C. At the same temperature, the relative intensities of the (00l) peaks
increased.
0 5 10 15 20 25 30 35 40 0 10 20 30 40 50
25°C
2Theta [°]
36.0°
triclinic phase35°C 23.4° RV
42°C
RI44°C
Inte
nsity 5.8°8.7°11.6°
RII46°C
5.4°8.2°
48°C
50°C
Inte
nsity
psi [°]
2θ = 5.4° (25 °C) 2θ = 5.84° (25 °C) 2θ = 5.4° (46 °C) 2θ = 5.84° (46 °C) 2θ = 5.4° (50 °C)
b) (002) layer peaks AAO 25nma)
Figure 7.11: n-Tetracosane in 25 nm AAO cooled at −0.5 K/min in the presence of a
bulk surface reservoir, removal of the bulk surface film; (a) θ/2θ temperature-dependent
heating scans, phase transitions are ordered for increasing temperatures. (b)
temperature-dependent Schulz scans, 2θ = 5.84° corresponds to the (002) triclinic lattice
planes, 2θ = 5.4° corresponds to the (002) orthorhombic lattice planes.
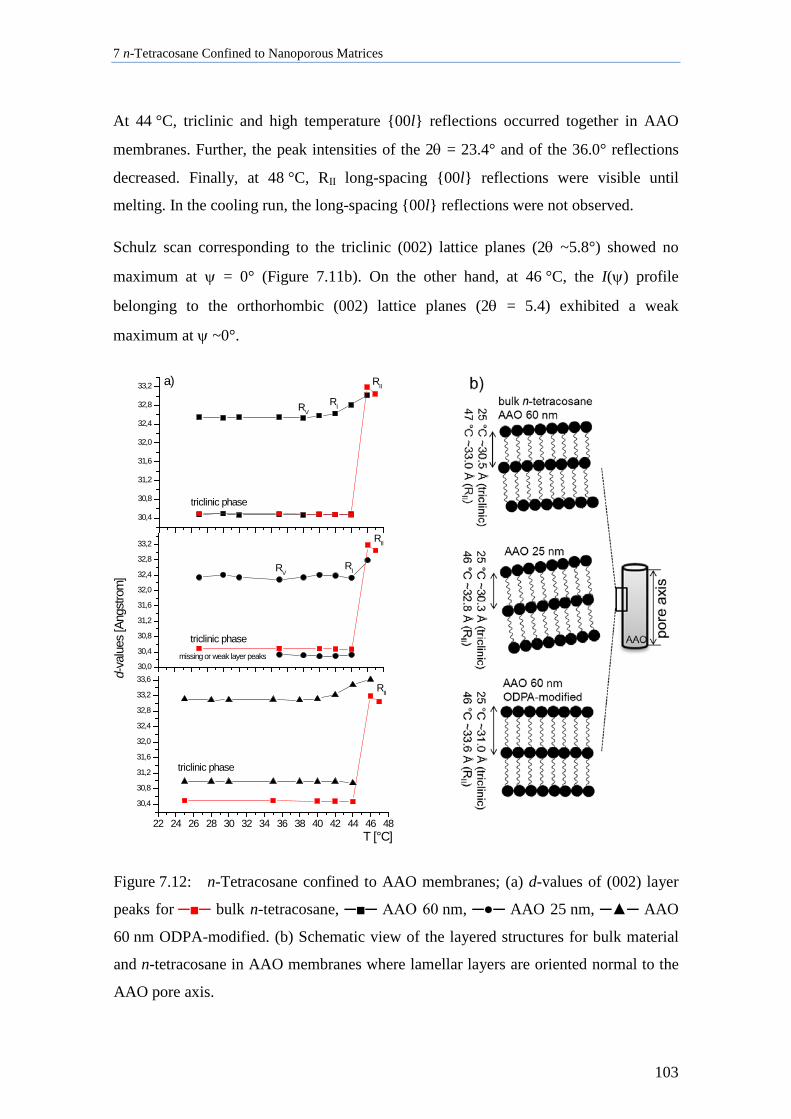
7 n-Tetracosane Confined to Nanoporous Matrices
103
At 44 °C, triclinic and high temperature {00l} reflections occurred together in AAO
membranes. Further, the peak intensities of the 2θ = 23.4° and of the 36.0° reflections
decreased. Finally, at 48 °C, RII long-spacing {00l} reflections were visible until
melting. In the cooling run, the long-spacing {00l} reflections were not observed.
Schulz scan corresponding to the triclinic (002) lattice planes (2θ ~5.8°) showed no
maximum at ψ = 0° (Figure 7.11b). On the other hand, at 46 °C, the I(ψ) profile
belonging to the orthorhombic (002) lattice planes (2θ = 5.4) exhibited a weak
maximum at ψ ~0°.
30,4
30,8
31,2
31,6
32,0
32,4
32,8
33,2
30,0
30,4
30,8
31,2
31,6
32,0
32,4
32,8
33,2
22 24 26 28 30 32 34 36 38 40 42 44 46 48
30,4
30,8
31,2
31,6
32,0
32,4
32,8
33,2
33,6
RVRI
triclinic phase
a)
triclinic phase
RII
RIRV
d-va
lues
[Ang
stro
m]
RII
missing or weak layer peaks
triclinic phase
RII
T [°C]
Figure 7.12: n-Tetracosane confined to AAO membranes; (a) d-values of (002) layer
peaks for ─■─ bulk n-tetracosane, ─■─ AAO 60 nm, ─●─ AAO 25 nm, ─▲─ AAO
60 nm ODPA-modified. (b) Schematic view of the layered structures for bulk material
and n-tetracosane in AAO membranes where lamellar layers are oriented normal to the
AAO pore axis.
7 n-Tetracosane Confined to Nanoporous Matrices
104
Estimated d-values of the {00l} long-spacing layer reflections of 60 nm, 25 nm, and
60 nm ODPA-modified AAO samples are summarized in Figure 7.12. Values for bulk
n-tetracosane (red rectangle) are shown for comparison. For triclinic n-tetracosane in
60 nm AAO d-values amounted to 30.5 Å (Figure 7.12a black rectangle). Between
40 °C and 44 °C, d-values amounted to 32.5 Å assuming that not the orthorhombic RII
layer arrangement occurred but rather RV and/or RI rotator phases. Between 44 °C and
46 °C in the RII rotator phase, the d-values increased to 33.0 Å.
In 25 nm AAO membranes d-values amounted to 30.3 Å and are slightly lower than for
bulk material (bulk d-values = 30.5 Å). At 44 °C, layer thickness increased from 32.3 Å
to 32.8 Å (Figure 7.12a black circle). n-Tetracosane in AAO membranes with ODPA
modified pore walls (Figure 7.12a black triangle) showed layer thicknesses of around
31 Å in the triclinic (bulk d-values = 30.5 Å) and 33.6 Å (bulk d-values = 33.2 Å) in the
orthorhombic RII phase. A schematic view of the layer structures is given in Figure
7.12b. The results will be discussed in Chapter 7.8.3.
7.4 n-Tetracosane in AAO Cooled at 0.5 K/min in Absence of
Bulk Material
Infiltrated n-tetracosane in AAO membranes were cooled from 80°C to room
temperature at −0.5 K/min in the absence of a bulk surface reservoir. The samples were
referred to as cases D, E, and F (Table 3.2), preparation details are given in Chapter 3.1.
n-Tetracosane confined in 25 nm and 60 nm AAO membranes showed a dominant peak
at 2θ = 21.4°. The peak was indexed as the triclinic (013)72 or the (-111)74 lattice planes
belonging to a mesophase (Figure 7.13). The peak intensity of the 21.4° reflection
decreased when heated up to 40°C. Moreover, the peak shape became broader and peak
maxima shifted to lower 2θ-values.
In all three samples (i.e., 25 nm, 60 nm, or 60 nm ODPA-modified AAO membranes) a
peak at 2θ = 36.0° occurred. The peak only dominated the patterns of n-tetracosane in
AAO membranes with ODPA modified pore walls. On the other hand, the 36.0°
7 n-Tetracosane Confined to Nanoporous Matrices
105
reflection was detectable in the temperature range from 25 °C to 40 °C independently of
the AAO pore size or the pore wall modification. As previously mentioned, the peak
belongs to the triclinic (-111)72 lattice planes at 25 °C and to the (020)74 lattice planes in
a rotator phase at ~35 °C. Additional peaks emerged at 2θ = 19.3° and at 23.4°,
respectively.
During cooling scans (Figure 7.14), the 2θ peak at 2θ = 36.0° emerged again but
showed, in all investigated samples, hysteresis effects. At 25 °C, the WAXS patterns
were dominated by the 2θ = 36.6° peak. At 2θ = 21.4° a weak peak was observed. Last
point to mention is that n-tetracosane in AAO cooled at −0.5 K/min in the absence of a
bulk surface reservoir showed no evidence of layer reflection in the used theta/2theta
geometry. No reflections at lower 2θ values were observed, not in the heating neither in
the cooling scans.
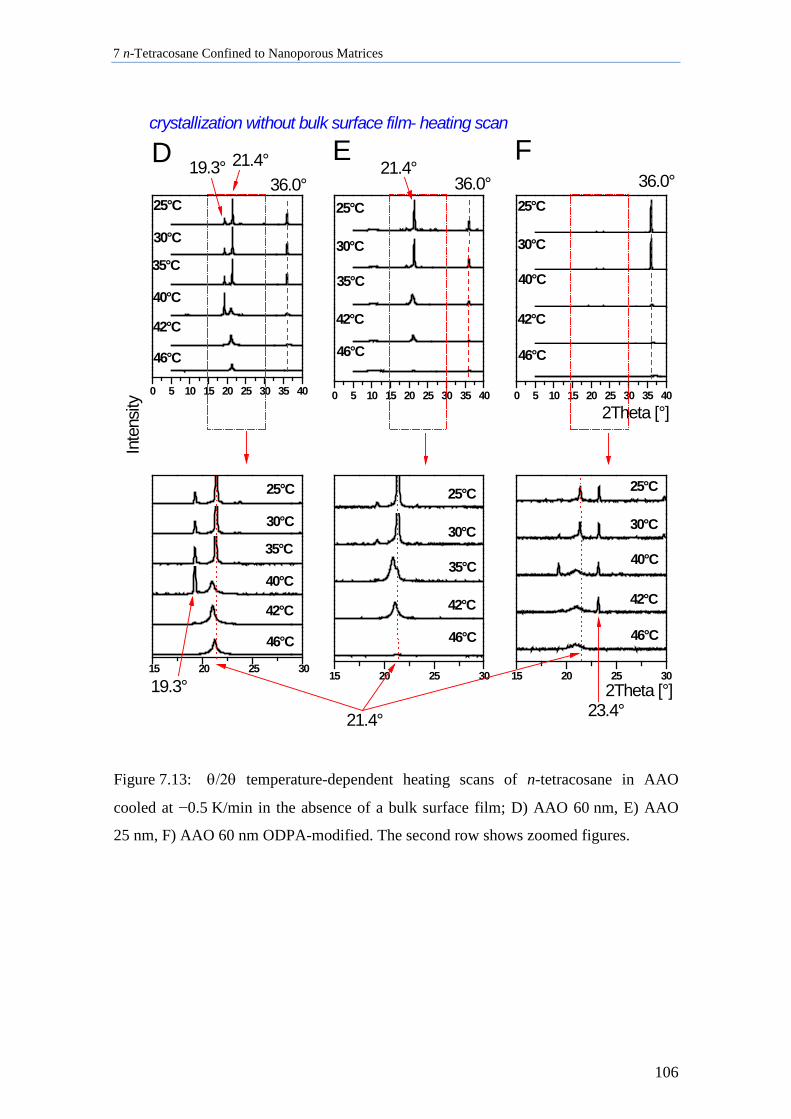
7 n-Tetracosane Confined to Nanoporous Matrices
106
0 5 10 15 20 25 30 35 40 0 5 10 15 20 25 30 35 40 0 5 10 15 20 25 30 35 40
15 20 25 30 15 20 25 30 15 20 25 30
25°C
30°C
42°C
46°C
35°C
25°C
30°C
40°C
42°C
35°C
FED 19.3° 21.4°
46°C
21.4°
25°C
30°C
42°C
46°C
40°C
36.0° 36.0°
2Theta [°]
Inte
nsity
23.4°19.3°
21.4°
25°C
30°C
42°C
46°C
35°C
25°C
30°C
42°C
46°C
40°C
2Theta [°]
36.0°
25°C
30°C
40°C
42°C
35°C
46°C
crystallization without bulk surface film- heating scan
Figure 7.13: θ/2θ temperature-dependent heating scans of n-tetracosane in AAO
cooled at −0.5 K/min in the absence of a bulk surface film; D) AAO 60 nm, E) AAO
25 nm, F) AAO 60 nm ODPA-modified. The second row shows zoomed figures.
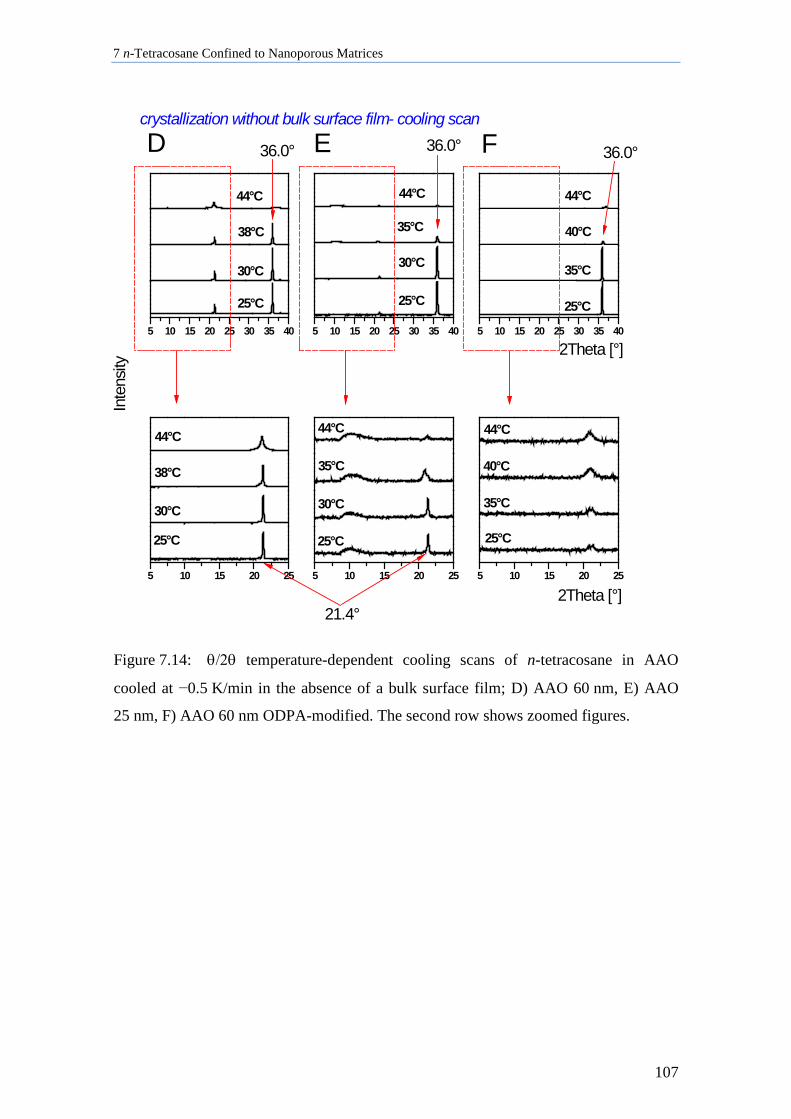
7 n-Tetracosane Confined to Nanoporous Matrices
107
5 10 15 20 25 30 35 40 5 10 15 20 25 30 35 40 5 10 15 20 25 30 35 40
5 10 15 20 25 5 10 15 20 25 5 10 15 20 25
Inte
nsity
25°C
30°C
38°C
44°C
25°C
36.0°
30°C
35°C
44°C
FE
21.4°
2Theta [°]
25°C
Dcrystallization without bulk surface film- cooling scan
35°C
40°C
44°C
25°C
30°C
38°C
44°C
25°C
30°C
35°C
36.0° 36.0°
44°C
2Theta [°]
25°C
35°C
40°C
44°C
Figure 7.14: θ/2θ temperature-dependent cooling scans of n-tetracosane in AAO
cooled at −0.5 K/min in the absence of a bulk surface film; D) AAO 60 nm, E) AAO
25 nm, F) AAO 60 nm ODPA-modified. The second row shows zoomed figures.
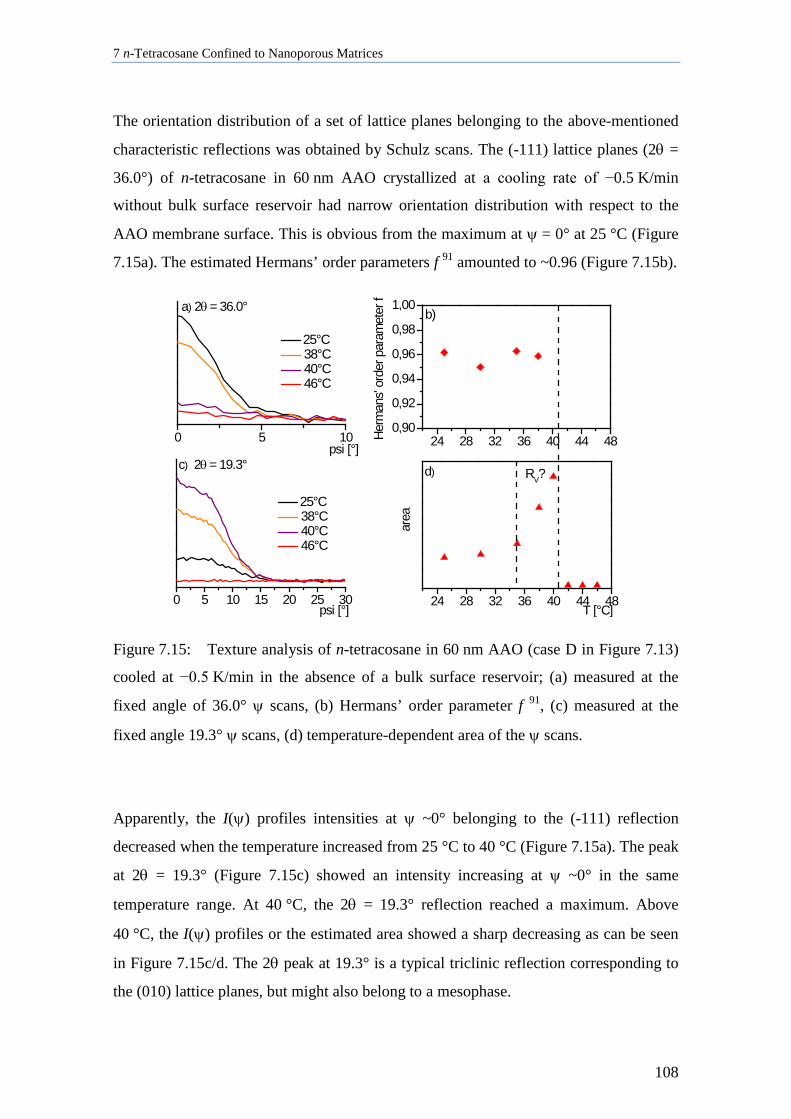
7 n-Tetracosane Confined to Nanoporous Matrices
108
The orientation distribution of a set of lattice planes belonging to the above-mentioned
characteristic reflections was obtained by Schulz scans. The (-111) lattice planes (2θ =
36.0°) of n-tetracosane in 60 nm AAO crystallized at a cooling rate of −0.5 K/min
without bulk surface reservoir had narrow orientation distribution with respect to the
AAO membrane surface. This is obvious from the maximum at ψ = 0° at 25 °C (Figure
7.15a). The estimated Hermans’ order parameters f 91 amounted to ~0.96 (Figure 7.15b).
0 5 10 24 28 32 36 40 44 480,90
0,92
0,94
0,96
0,98
1,00
0 5 10 15 20 25 30 24 28 32 36 40 44 48
25°C 38°C 40°C 46°C
psi [°]
a) 2θ = 36.0°
Herm
ans'
orde
r par
amet
er f
b)
25°C 38°C 40°C 46°C
psi [°]
c) 2θ = 19.3°
area
T [°C]
d) RV?
Figure 7.15: Texture analysis of n-tetracosane in 60 nm AAO (case D in Figure 7.13)
cooled at −0.5 K/min in the absence of a bulk surface reservoir; (a) measured at the
fixed angle of 36.0° ψ scans, (b) Hermans’ order parameter f 91, (c) measured at the
fixed angle 19.3° ψ scans, (d) temperature-dependent area of the ψ scans.
Apparently, the I(ψ) profiles intensities at ψ ~0° belonging to the (-111) reflection
decreased when the temperature increased from 25 °C to 40 °C (Figure 7.15a). The peak
at 2θ = 19.3° (Figure 7.15c) showed an intensity increasing at ψ ~0° in the same
temperature range. At 40 °C, the 2θ = 19.3° reflection reached a maximum. Above
40 °C, the I(ψ) profiles or the estimated area showed a sharp decreasing as can be seen
in Figure 7.15c/d. The 2θ peak at 19.3° is a typical triclinic reflection corresponding to
the (010) lattice planes, but might also belong to a mesophase.
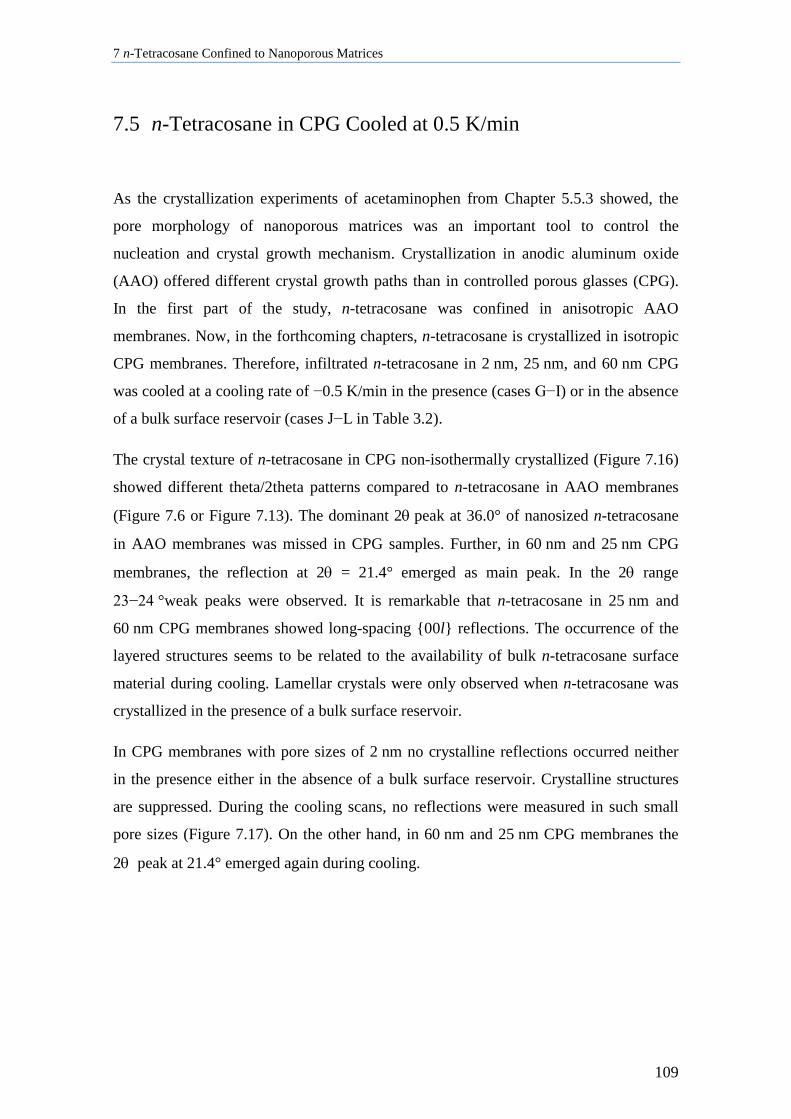
7 n-Tetracosane Confined to Nanoporous Matrices
109
7.5 n-Tetracosane in CPG Cooled at 0.5 K/min
As the crystallization experiments of acetaminophen from Chapter 5.5.3 showed, the
pore morphology of nanoporous matrices was an important tool to control the
nucleation and crystal growth mechanism. Crystallization in anodic aluminum oxide
(AAO) offered different crystal growth paths than in controlled porous glasses (CPG).
In the first part of the study, n-tetracosane was confined in anisotropic AAO
membranes. Now, in the forthcoming chapters, n-tetracosane is crystallized in isotropic
CPG membranes. Therefore, infiltrated n-tetracosane in 2 nm, 25 nm, and 60 nm CPG
was cooled at a cooling rate of −0.5 K/min in the presence (cases G−I) or in the absence
of a bulk surface reservoir (cases J−L in Table 3.2).
The crystal texture of n-tetracosane in CPG non-isothermally crystallized (Figure 7.16)
showed different theta/2theta patterns compared to n-tetracosane in AAO membranes
(Figure 7.6 or Figure 7.13). The dominant 2θ peak at 36.0° of nanosized n-tetracosane
in AAO membranes was missed in CPG samples. Further, in 60 nm and 25 nm CPG
membranes, the reflection at 2θ = 21.4° emerged as main peak. In the 2θ range
23−24 °weak peaks were observed. It is remarkable that n-tetracosane in 25 nm and
60 nm CPG membranes showed long-spacing {00l} reflections. The occurrence of the
layered structures seems to be related to the availability of bulk n-tetracosane surface
material during cooling. Lamellar crystals were only observed when n-tetracosane was
crystallized in the presence of a bulk surface reservoir.
In CPG membranes with pore sizes of 2 nm no crystalline reflections occurred neither
in the presence either in the absence of a bulk surface reservoir. Crystalline structures
are suppressed. During the cooling scans, no reflections were measured in such small
pore sizes (Figure 7.17). On the other hand, in 60 nm and 25 nm CPG membranes the
2θ peak at 21.4° emerged again during cooling.
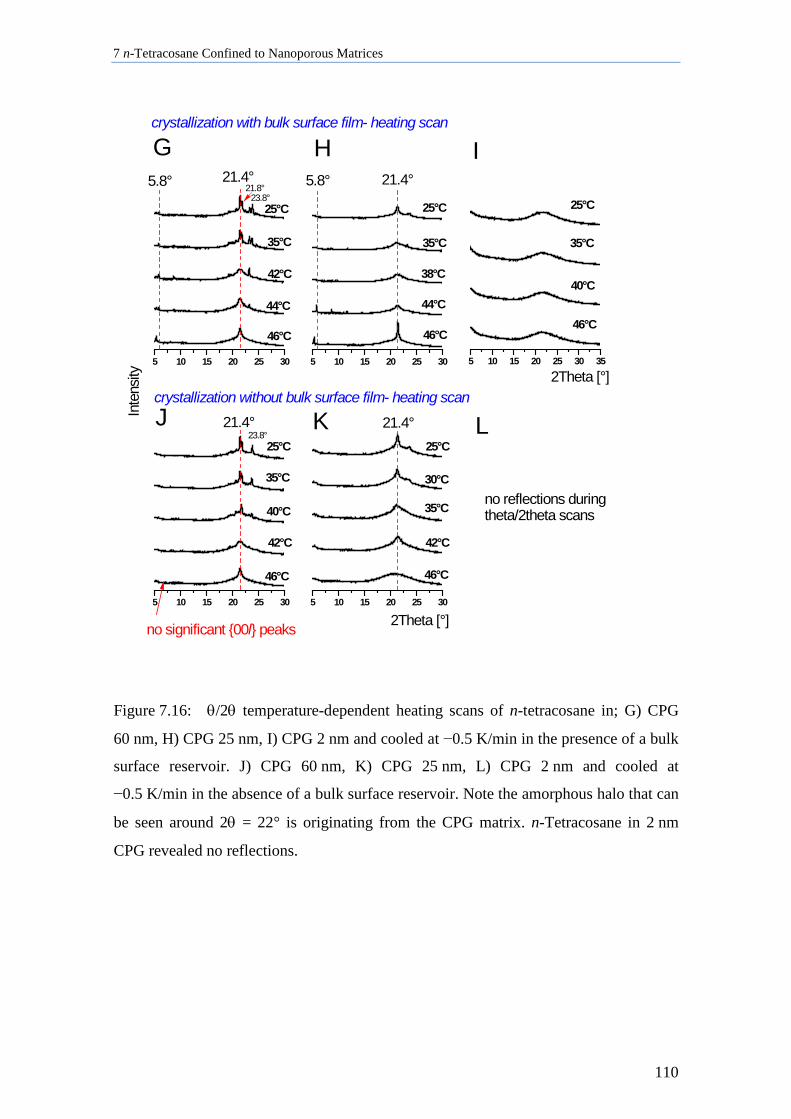
7 n-Tetracosane Confined to Nanoporous Matrices
110
5 10 15 20 25 30 5 10 15 20 25 30 5 10 15 20 25 30 35
5 10 15 20 25 30 5 10 15 20 25 30
21.4°
25°C
35°C
21.8°23.8°
Inte
nsity
42°C
crystallization with bulk surface film- heating scan
crystallization without bulk surface film- heating scan
46°C
44°C
21.4° 21.4°
21.4°5.8° 5.8°
25°C
35°C
38°C
44°C
46°C
25°C
35°C
40°C
no reflections duringtheta/2theta scans
LKJ
2Theta [°]
46°C
2Theta [°]
25°C23.8°
35°C
40°C
42°C
46°C
no significant {00l} peaks
25°C
30°C
35°C
42°C
IH
46°C
G
Figure 7.16: θ/2θ temperature-dependent heating scans of n-tetracosane in; G) CPG
60 nm, H) CPG 25 nm, I) CPG 2 nm and cooled at −0.5 K/min in the presence of a bulk
surface reservoir. J) CPG 60 nm, K) CPG 25 nm, L) CPG 2 nm and cooled at
−0.5 K/min in the absence of a bulk surface reservoir. Note the amorphous halo that can
be seen around 2θ = 22° is originating from the CPG matrix. n-Tetracosane in 2 nm
CPG revealed no reflections.
7 n-Tetracosane Confined to Nanoporous Matrices
111
5 10 15 20 25 30 5 10 15 20 25 30 5 10 15 20 25 30 35
5 10 15 20 25 30 5 10 15 20 25 30
25°C
21.8°
38°C23.8°
40°C
44°C
21.4°
25°C
30°C
42°C
crystallization without bulk surface film- cooling scan
IH21.4°44°C
Gcrystallization with bulk surface film- cooling scan
LKJ
2Theta [°]
25°C
30°C
42°C
44°C
25°C
38°C23.8°
40°C
44°C
2Theta [°]
25°C
Inte
nsity
no reflections duringtheta/2theta scan30°C
42°C
44°C
Figure 7.17: θ/2θ temperature-dependent cooling scans of n-tetracosane in; G) CPG
60 nm, H) CPG 25 nm, I) CPG 2 nm and cooled at −0.5 K/min in the presence of a bulk
surface reservoir. J) CPG 60 nm, K) CPG 25 nm, L) CPG 2 nm and cooled at
−0.5 K/min in the absence of a bulk surface reservoir.
As previously described, n-tetracosane in 25 nm CPG crystallized at a cooling rate of
−0.5 K/min in the presence of a bulk surface reservoir yielded a triclinic main peak at
2θ = 21.4° (Figure 7.16 case H or Figure 7.18a). At 42 °C, the peak widths became
broader which may indicate the RV rotator phase. Triclinic long-spacing {00l}
reflections occurred in the temperature range between 44 °C and 46 °C. Above 46 °C,
the peak maxima shifted to lower 2θ values indicating the RII rotator phase. At the same
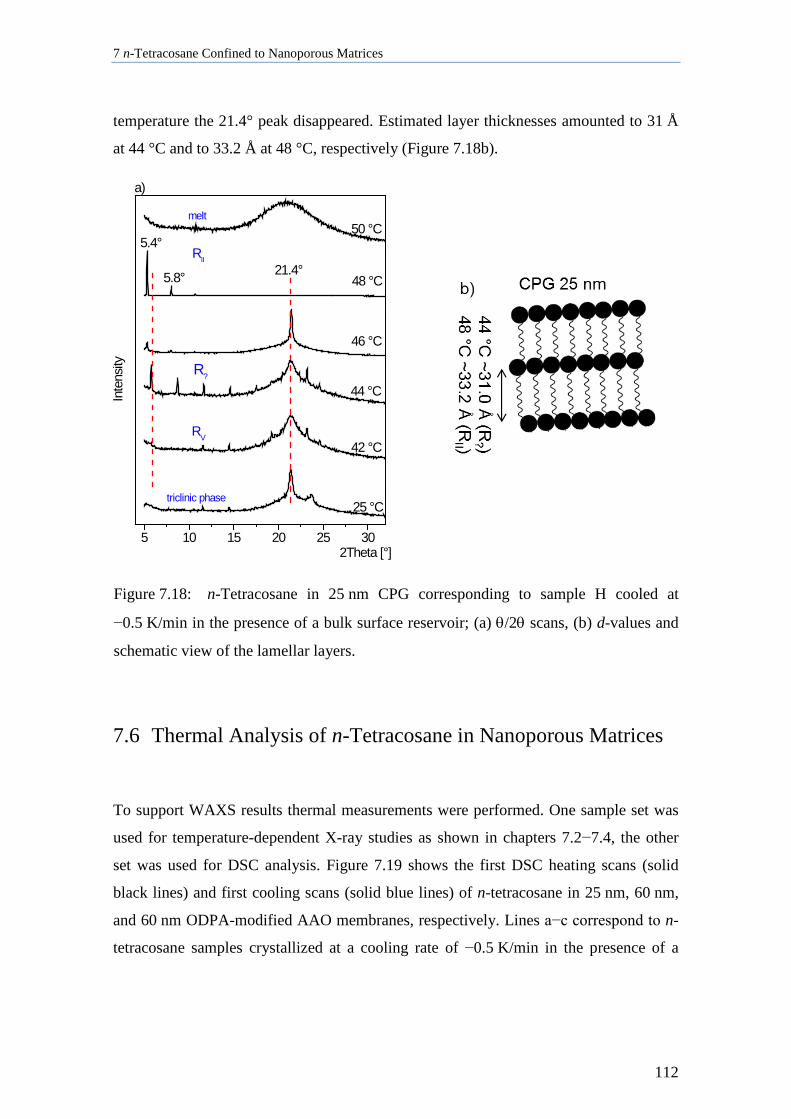
7 n-Tetracosane Confined to Nanoporous Matrices
112
temperature the 21.4° peak disappeared. Estimated layer thicknesses amounted to 31 Å
at 44 °C and to 33.2 Å at 48 °C, respectively (Figure 7.18b).
5 10 15 20 25 30
2Theta [°]
25 °Ctriclinic phase
42 °C 44 °C
R?
RV
46 °C
Inte
nsity
48 °C
21.4°5.8°
RII
50 °C
5.4°
a)
melt
Figure 7.18: n-Tetracosane in 25 nm CPG corresponding to sample H cooled at
−0.5 K/min in the presence of a bulk surface reservoir; (a) θ/2θ scans, (b) d-values and
schematic view of the lamellar layers.
7.6 Thermal Analysis of n-Tetracosane in Nanoporous Matrices
To support WAXS results thermal measurements were performed. One sample set was
used for temperature-dependent X-ray studies as shown in chapters 7.2−7.4, the other
set was used for DSC analysis. Figure 7.19 shows the first DSC heating scans (solid
black lines) and first cooling scans (solid blue lines) of n-tetracosane in 25 nm, 60 nm,
and 60 nm ODPA-modified AAO membranes, respectively. Lines a−c correspond to n-
tetracosane samples crystallized at a cooling rate of −0.5 K/min in the presence of a
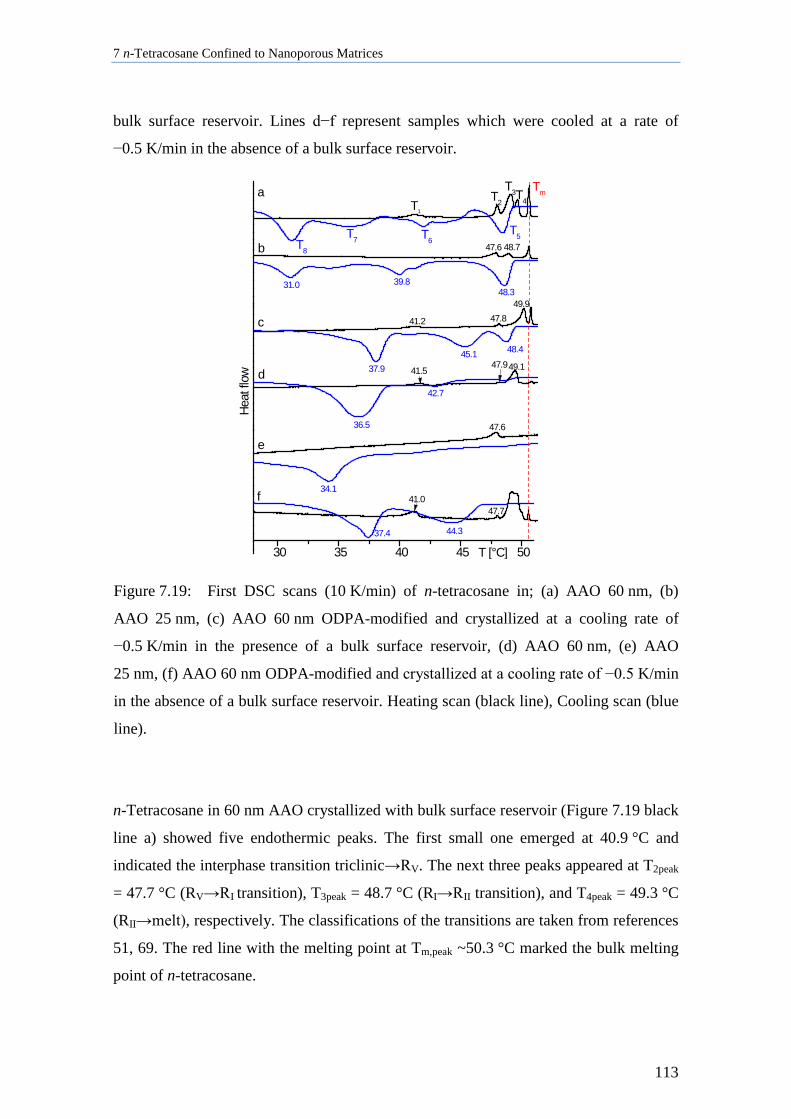
7 n-Tetracosane Confined to Nanoporous Matrices
113
bulk surface reservoir. Lines d−f represent samples which were cooled at a rate of
−0.5 K/min in the absence of a bulk surface reservoir.
30 35 40 45 50
T7 T6T5
T4
T3T2a Tm
T1
47.6b
41.2c
47.941.5
42.7
36.5
49.1d
47.6
e
Heat
flow
f
T [°C]
T8
31.0 39.8
48.7
48.349.9
47.8
48.445.137.9
34.1
44.3
41.047.7
37.4
Figure 7.19: First DSC scans (10 K/min) of n-tetracosane in; (a) AAO 60 nm, (b)
AAO 25 nm, (c) AAO 60 nm ODPA-modified and crystallized at a cooling rate of
−0.5 K/min in the presence of a bulk surface reservoir, (d) AAO 60 nm, (e) AAO
25 nm, (f) AAO 60 nm ODPA-modified and crystallized at a cooling rate of −0.5 K/min
in the absence of a bulk surface reservoir. Heating scan (black line), Cooling scan (blue
line).
n-Tetracosane in 60 nm AAO crystallized with bulk surface reservoir (Figure 7.19 black
line a) showed five endothermic peaks. The first small one emerged at 40.9 °C and
indicated the interphase transition triclinic→RV. The next three peaks appeared at T2peak
= 47.7 °C (RV→RI transition), T3peak = 48.7 °C (RI→RII transition), and T4peak = 49.3 °C
(RII→melt), respectively. The classifications of the transitions are taken from references
51, 69. The red line with the melting point at Tm,peak ~50.3 °C marked the bulk melting
point of n-tetracosane.
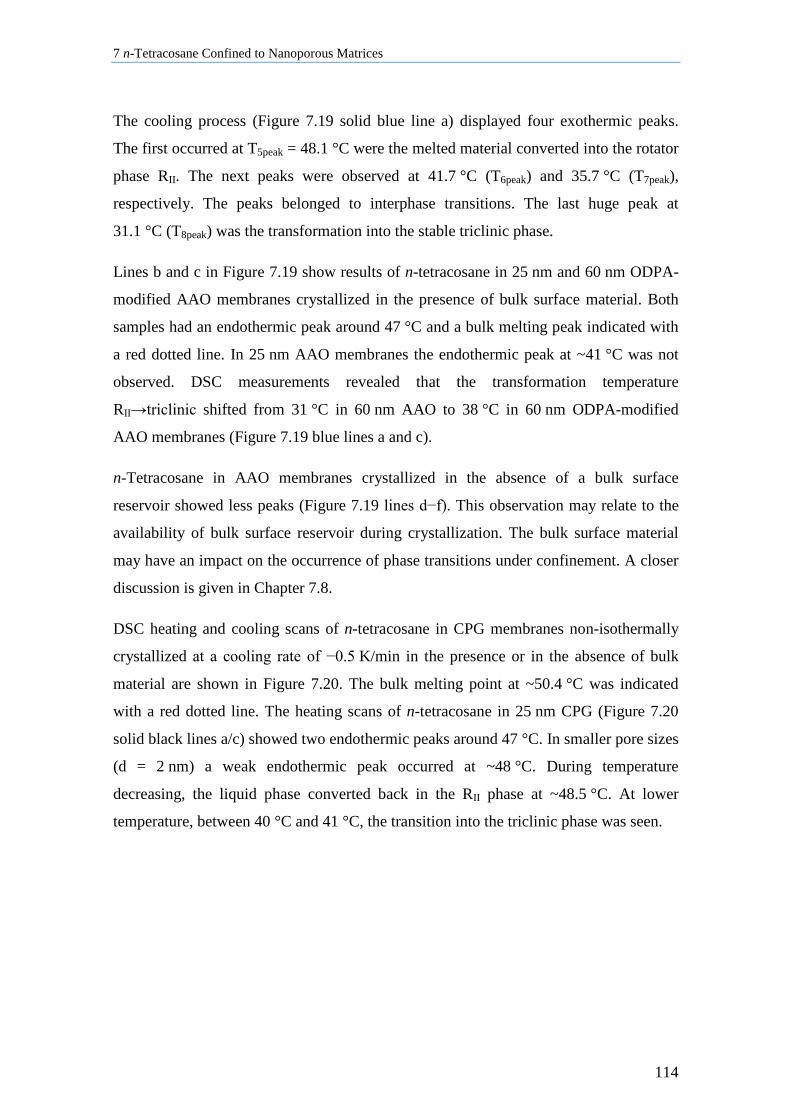
7 n-Tetracosane Confined to Nanoporous Matrices
114
The cooling process (Figure 7.19 solid blue line a) displayed four exothermic peaks.
The first occurred at T5peak = 48.1 °C were the melted material converted into the rotator
phase RII. The next peaks were observed at 41.7 °C (T6peak) and 35.7 °C (T7peak),
respectively. The peaks belonged to interphase transitions. The last huge peak at
31.1 °C (T8peak) was the transformation into the stable triclinic phase.
Lines b and c in Figure 7.19 show results of n-tetracosane in 25 nm and 60 nm ODPA-
modified AAO membranes crystallized in the presence of bulk surface material. Both
samples had an endothermic peak around 47 °C and a bulk melting peak indicated with
a red dotted line. In 25 nm AAO membranes the endothermic peak at ~41 °C was not
observed. DSC measurements revealed that the transformation temperature
RII→triclinic shifted from 31 °C in 60 nm AAO to 38 °C in 60 nm ODPA-modified
AAO membranes (Figure 7.19 blue lines a and c).
n-Tetracosane in AAO membranes crystallized in the absence of a bulk surface
reservoir showed less peaks (Figure 7.19 lines d−f). This observation may relate to the
availability of bulk surface reservoir during crystallization. The bulk surface material
may have an impact on the occurrence of phase transitions under confinement. A closer
discussion is given in Chapter 7.8.
DSC heating and cooling scans of n-tetracosane in CPG membranes non-isothermally
crystallized at a cooling rate of −0.5 K/min in the presence or in the absence of bulk
material are shown in Figure 7.20. The bulk melting point at ~50.4 °C was indicated
with a red dotted line. The heating scans of n-tetracosane in 25 nm CPG (Figure 7.20
solid black lines a/c) showed two endothermic peaks around 47 °C. In smaller pore sizes
(d = 2 nm) a weak endothermic peak occurred at ~48 °C. During temperature
decreasing, the liquid phase converted back in the RII phase at ~48.5 °C. At lower
temperature, between 40 °C and 41 °C, the transition into the triclinic phase was seen.
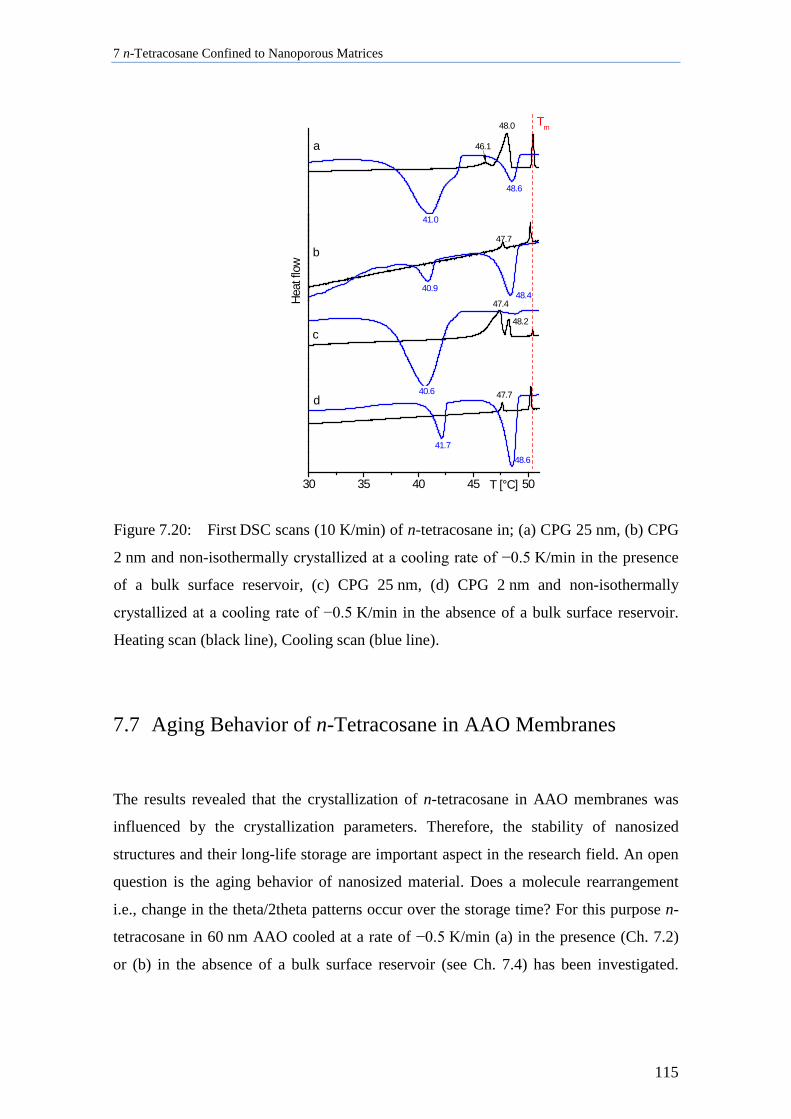
7 n-Tetracosane Confined to Nanoporous Matrices
115
30 35 40 45 50
48.6
47.7
d
T [°C]
c
Heat
flow
40.948.4
47.7
b
a
41.7
40.6
47.4
48.2
46.1
41.0
48.6
Tm48.0
Figure 7.20: First DSC scans (10 K/min) of n-tetracosane in; (a) CPG 25 nm, (b) CPG
2 nm and non-isothermally crystallized at a cooling rate of −0.5 K/min in the presence
of a bulk surface reservoir, (c) CPG 25 nm, (d) CPG 2 nm and non-isothermally
crystallized at a cooling rate of −0.5 K/min in the absence of a bulk surface reservoir.
Heating scan (black line), Cooling scan (blue line).
7.7 Aging Behavior of n-Tetracosane in AAO Membranes
The results revealed that the crystallization of n-tetracosane in AAO membranes was
influenced by the crystallization parameters. Therefore, the stability of nanosized
structures and their long-life storage are important aspect in the research field. An open
question is the aging behavior of nanosized material. Does a molecule rearrangement
i.e., change in the theta/2theta patterns occur over the storage time? For this purpose n-
tetracosane in 60 nm AAO cooled at a rate of −0.5 K/min (a) in the presence (Ch. 7.2)
or (b) in the absence of a bulk surface reservoir (see Ch. 7.4) has been investigated.
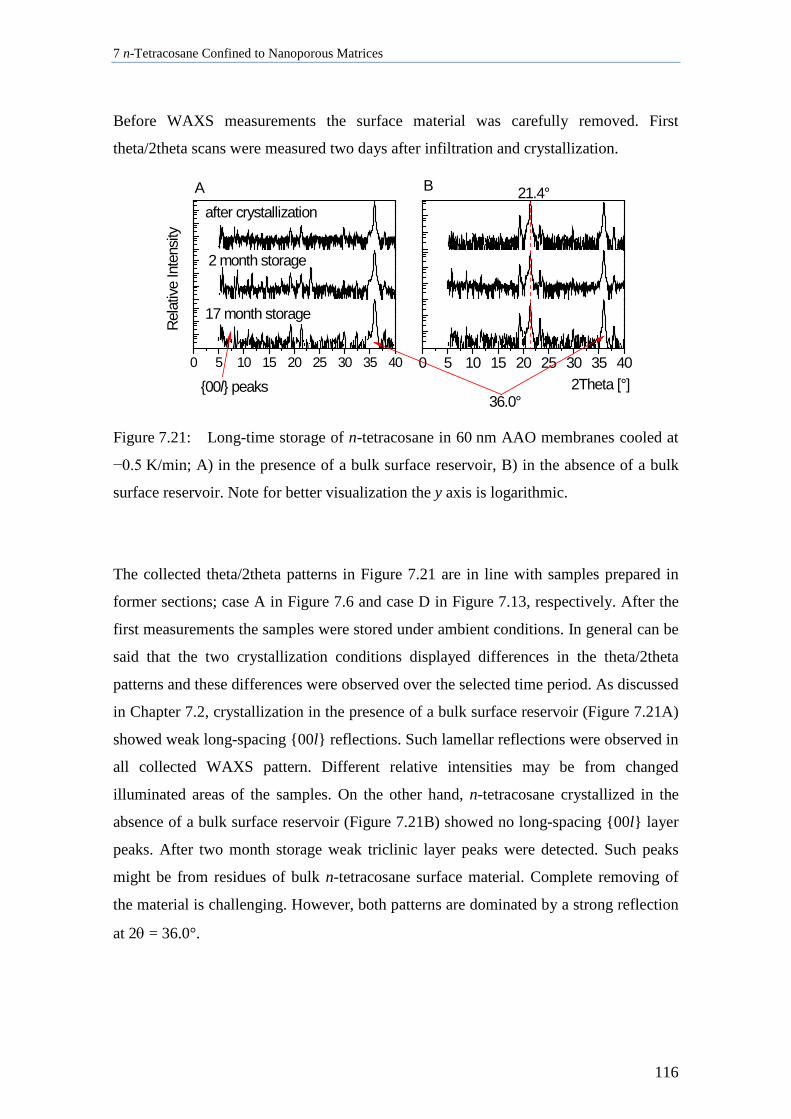
7 n-Tetracosane Confined to Nanoporous Matrices
116
Before WAXS measurements the surface material was carefully removed. First
theta/2theta scans were measured two days after infiltration and crystallization.
0 5 10 15 20 25 30 35 40 0 5 10 15 20 25 30 35 40
after crystallization
2 month storage
Rela
tive
Inte
nsity
A
17 month storage
B
{00l} peaks36.0°
21.4°
2Theta [°]
Figure 7.21: Long-time storage of n-tetracosane in 60 nm AAO membranes cooled at
−0.5 K/min; A) in the presence of a bulk surface reservoir, B) in the absence of a bulk
surface reservoir. Note for better visualization the y axis is logarithmic.
The collected theta/2theta patterns in Figure 7.21 are in line with samples prepared in
former sections; case A in Figure 7.6 and case D in Figure 7.13, respectively. After the
first measurements the samples were stored under ambient conditions. In general can be
said that the two crystallization conditions displayed differences in the theta/2theta
patterns and these differences were observed over the selected time period. As discussed
in Chapter 7.2, crystallization in the presence of a bulk surface reservoir (Figure 7.21A)
showed weak long-spacing {00l} reflections. Such lamellar reflections were observed in
all collected WAXS pattern. Different relative intensities may be from changed
illuminated areas of the samples. On the other hand, n-tetracosane crystallized in the
absence of a bulk surface reservoir (Figure 7.21B) showed no long-spacing {00l} layer
peaks. After two month storage weak triclinic layer peaks were detected. Such peaks
might be from residues of bulk n-tetracosane surface material. Complete removing of
the material is challenging. However, both patterns are dominated by a strong reflection
at 2θ = 36.0°.
7 n-Tetracosane Confined to Nanoporous Matrices
117
It can be supposed that long-time storage did not change the crystal texture which
directly occurred after crystallization. Molecule rearrangement may occur, but on a very
slow time scale. n-Tetracosane in AAO membranes is stable over a longer time period
which may be of interest for further studies when measurements are more time
consuming.
7.8 Discussion of n-Tetracosane in 2D-Confinement
The results revealed that n-tetracosane in nanoporous matrices showed a more complex
crystallization behavior than the bulk material. The investigations highlighted that
crystallization conditions such as the presence or the absence of bulk surface reservoirs,
the pore sizes, the modification of AAO with ODPA, or the pore morphology play an
important role for the crystallization pathways.
7.8.1 Crystallite Orientation of Triclinic n-Tetracosane in AAO
Membranes
Texture analysis of n-tetracosane in AAO membranes crystallized at a rate of
−0.5 K/min in the presence (Ch. 7.2) or in the absence (Ch. 7.4) of a n-tetracosane
surface reservoir revealed uniaxial oriented crystals with their triclinic (-111) lattice
planes72 oriented normal to the pore axis (Figure 7.22). Directly after non-isothermal
crystallization such preferred orientation was observed. When the (-111) lattice planes
are oriented normal to the AAO pore axis, the molecules long axes are also oriented
normal to the AAO pore axis. In contrast, the (00l) lattice planes are oriented parallel to
the AAO pore axis. The theoretical angle between the (-111) 2θ = 36.0° and (002) (2θ =
5.8°) lattice planes is 69.5°. Furthermore, the (-111) reflection at 2θ = 36.0° was
observed in all prepared samples independently of AAO pore sizes or modification of
AAO with ODPA. Differences only occur depending on the temperature which will be
discussed in the forthcoming section.
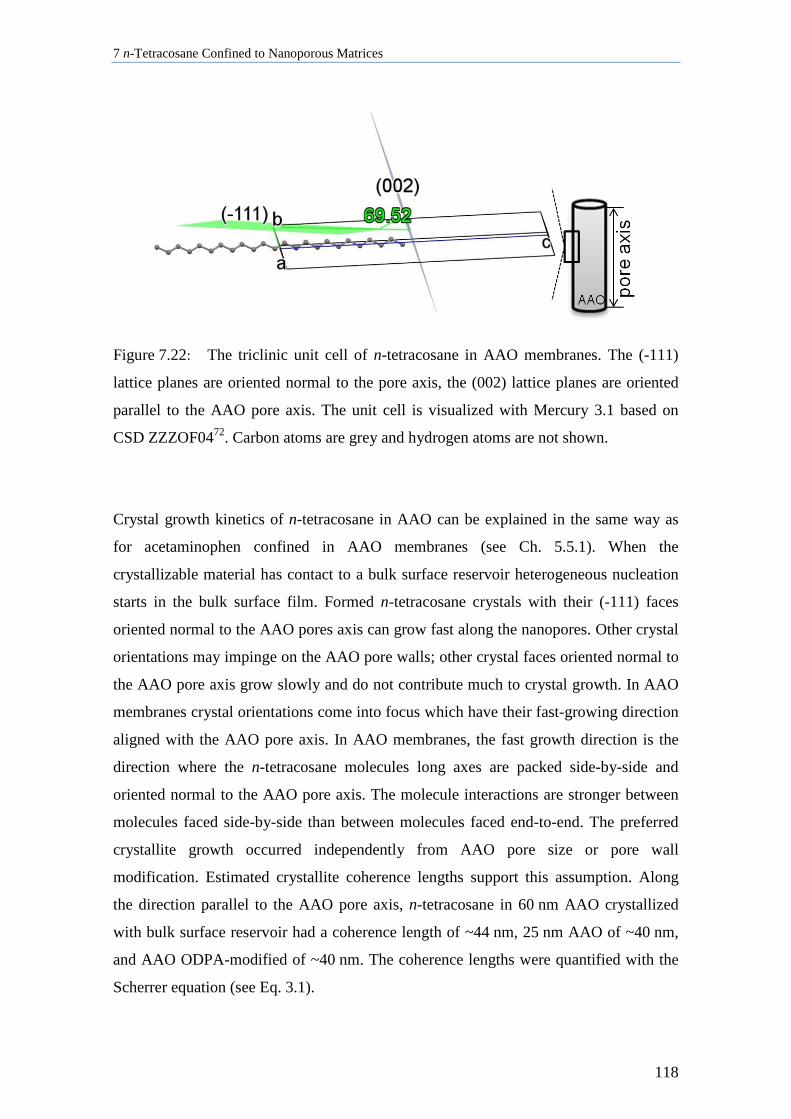
7 n-Tetracosane Confined to Nanoporous Matrices
118
Figure 7.22: The triclinic unit cell of n-tetracosane in AAO membranes. The (-111)
lattice planes are oriented normal to the pore axis, the (002) lattice planes are oriented
parallel to the AAO pore axis. The unit cell is visualized with Mercury 3.1 based on
CSD ZZZOF0472. Carbon atoms are grey and hydrogen atoms are not shown.
Crystal growth kinetics of n-tetracosane in AAO can be explained in the same way as
for acetaminophen confined in AAO membranes (see Ch. 5.5.1). When the
crystallizable material has contact to a bulk surface reservoir heterogeneous nucleation
starts in the bulk surface film. Formed n-tetracosane crystals with their (-111) faces
oriented normal to the AAO pores axis can grow fast along the nanopores. Other crystal
orientations may impinge on the AAO pore walls; other crystal faces oriented normal to
the AAO pore axis grow slowly and do not contribute much to crystal growth. In AAO
membranes crystal orientations come into focus which have their fast-growing direction
aligned with the AAO pore axis. In AAO membranes, the fast growth direction is the
direction where the n-tetracosane molecules long axes are packed side-by-side and
oriented normal to the AAO pore axis. The molecule interactions are stronger between
molecules faced side-by-side than between molecules faced end-to-end. The preferred
crystallite growth occurred independently from AAO pore size or pore wall
modification. Estimated crystallite coherence lengths support this assumption. Along
the direction parallel to the AAO pore axis, n-tetracosane in 60 nm AAO crystallized
with bulk surface reservoir had a coherence length of ~44 nm, 25 nm AAO of ~40 nm,
and AAO ODPA-modified of ~40 nm. The coherence lengths were quantified with the
Scherrer equation (see Eq. 3.1).
7 n-Tetracosane Confined to Nanoporous Matrices
119
n-Tetracosane in AAO non-isothermally crystallized without contact to a bulk surface
reservoir also yielded crystals with the (-111) faces oriented normal to the AAO pore
axis. Additionally, a second growth direction at 2θ = 21.4° (013) or (-111) occurred.
These results may be explained with homogenous nucleation at higher supercooling.
Many homogeneous nuclei can be formed in a narrow temperature range and hence, the
growing of more crystals is initiated. The growing crystals compete for growth volume
and have a change to occupy a volume portion in the AAO pores. As a consequence, the
dominance of the crystallites with their triclinic (-111) lattice planes oriented normal to
the AAO pore axis is hindered and a subpopulation of crystals with the triclinic (013)
crystal face occur. A second explanation might be that, when crystallized without
contact to a bulk surface film, a rotator phase is stabilized inside the AAO nanopores at
25 °C. Thus, the peak at 2θ = 21.4° belongs to the (-111) lattice planes corresponding to
a mesophase. n-Tetracosane in 60 nm AAO membranes crystallized without bulk
surface reservoir had along the direction normal to the (-111) lattice planes (2θ = 36.0°)
a coherence length of ~40 nm, in 25 nm AAO membranes of ~34 nm, and in AAO
ODPA-modified of ~44 nm. The estimated coherence length for the 21.4°(013)/(-111)
reflection amounted to the same value. The coherence length reveal that the crystal size
is not influenced by the crystallization kinetics i.e., homogeneous or heterogeneous
nucleated.
7.8.2 Influence of Pore Size, Bulk Surface Material, and Pore Wall
Modification
A second aspect to consider is the effect of the pore size, the bulk surface material and
the pore wall modification on crystallite orientation. It is important to understand the
relationship between the resulting molecular structures and the crystallization
conditions. The investigation will give answers how crystallization parameters affect
resulting crystal textures. Interpretation of the temperature-dependent molecule
orientation under confinement seems quite complex. However, the next two figures will
illustrate the influence of the pore size, the bulk surface material and the AAO
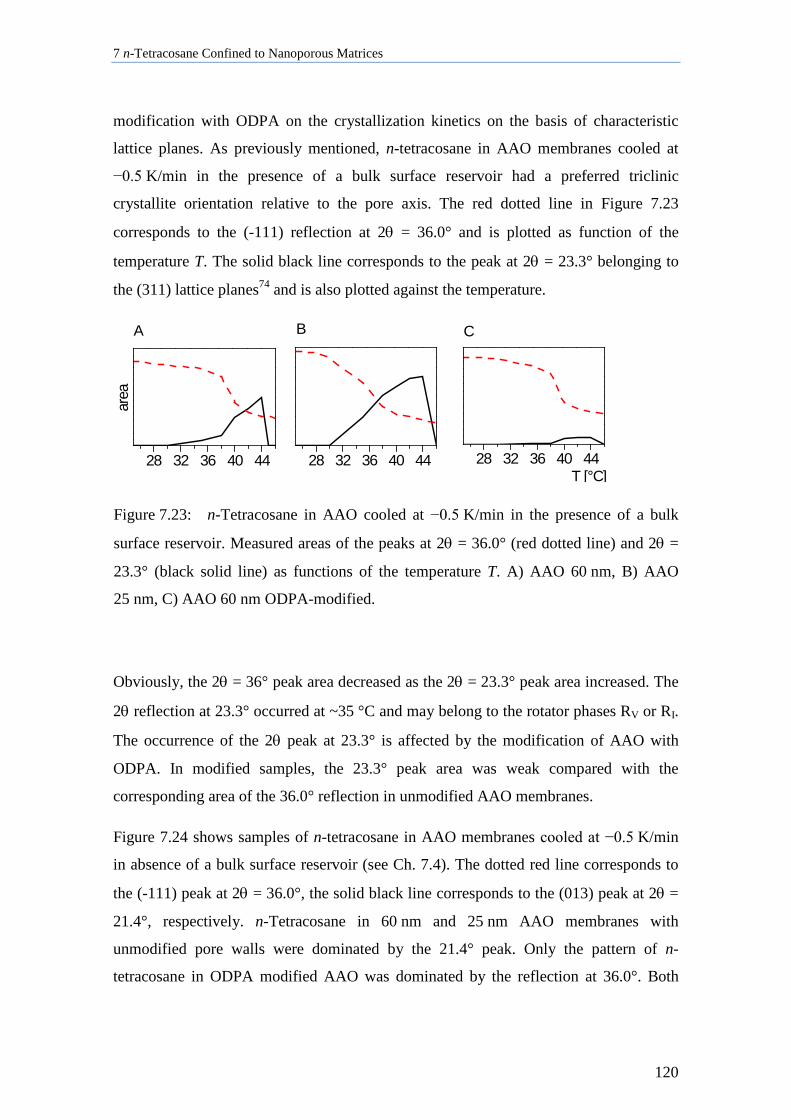
7 n-Tetracosane Confined to Nanoporous Matrices
120
modification with ODPA on the crystallization kinetics on the basis of characteristic
lattice planes. As previously mentioned, n-tetracosane in AAO membranes cooled at
−0.5 K/min in the presence of a bulk surface reservoir had a preferred triclinic
crystallite orientation relative to the pore axis. The red dotted line in Figure 7.23
corresponds to the (-111) reflection at 2θ = 36.0° and is plotted as function of the
temperature T. The solid black line corresponds to the peak at 2θ = 23.3° belonging to
the (311) lattice planes74 and is also plotted against the temperature.
28 32 36 40 44
area
28 32 36 40 44
28 32 36 40 44
CB
T [°C]
A
Figure 7.23: n-Tetracosane in AAO cooled at −0.5 K/min in the presence of a bulk
surface reservoir. Measured areas of the peaks at 2θ = 36.0° (red dotted line) and 2θ =
23.3° (black solid line) as functions of the temperature T. A) AAO 60 nm, B) AAO
25 nm, C) AAO 60 nm ODPA-modified.
Obviously, the 2θ = 36° peak area decreased as the 2θ = 23.3° peak area increased. The
2θ reflection at 23.3° occurred at ~35 °C and may belong to the rotator phases RV or RI.
The occurrence of the 2θ peak at 23.3° is affected by the modification of AAO with
ODPA. In modified samples, the 23.3° peak area was weak compared with the
corresponding area of the 36.0° reflection in unmodified AAO membranes.
Figure 7.24 shows samples of n-tetracosane in AAO membranes cooled at −0.5 K/min
in absence of a bulk surface reservoir (see Ch. 7.4). The dotted red line corresponds to
the (-111) peak at 2θ = 36.0°, the solid black line corresponds to the (013) peak at 2θ =
21.4°, respectively. n-Tetracosane in 60 nm and 25 nm AAO membranes with
unmodified pore walls were dominated by the 21.4° peak. Only the pattern of n-
tetracosane in ODPA modified AAO was dominated by the reflection at 36.0°. Both
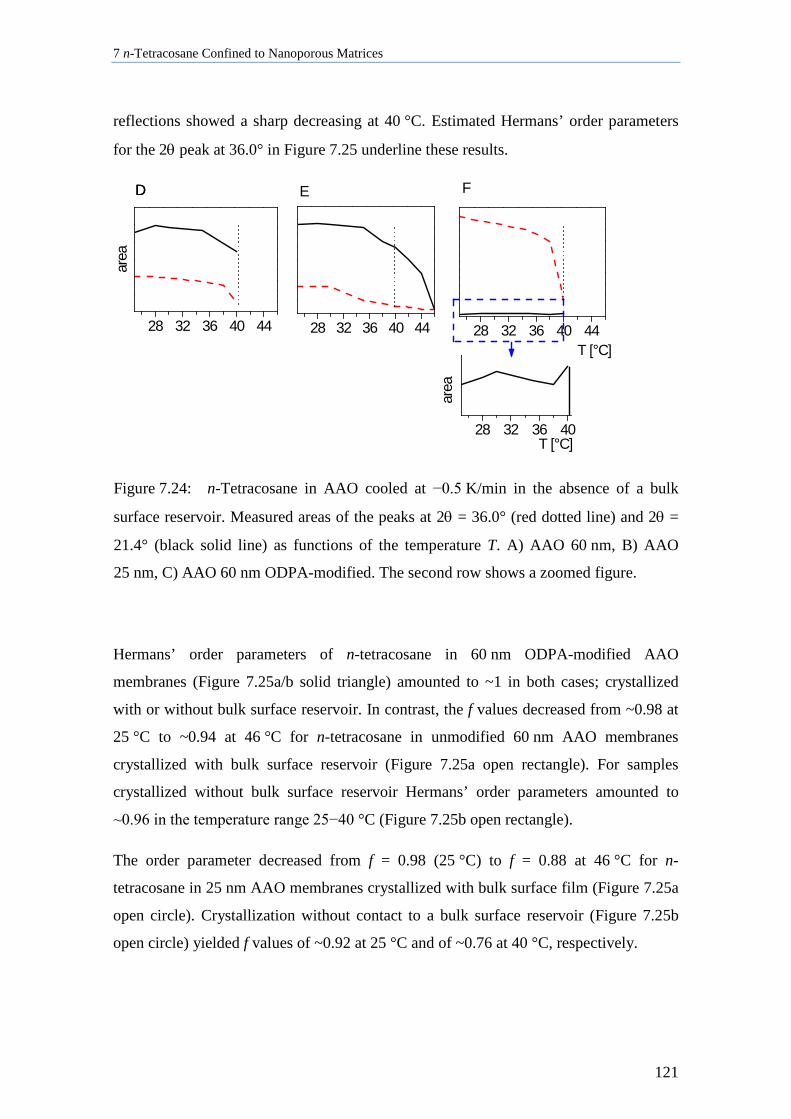
7 n-Tetracosane Confined to Nanoporous Matrices
121
reflections showed a sharp decreasing at 40 °C. Estimated Hermans’ order parameters
for the 2θ peak at 36.0° in Figure 7.25 underline these results.
28 32 36 40 44
area
FE
area
28 32 36 40 44
28 32 36 40 44
T [°C]
D
28 32 36 40
T [°C]
D
Figure 7.24: n-Tetracosane in AAO cooled at −0.5 K/min in the absence of a bulk
surface reservoir. Measured areas of the peaks at 2θ = 36.0° (red dotted line) and 2θ =
21.4° (black solid line) as functions of the temperature T. A) AAO 60 nm, B) AAO
25 nm, C) AAO 60 nm ODPA-modified. The second row shows a zoomed figure.
Hermans’ order parameters of n-tetracosane in 60 nm ODPA-modified AAO
membranes (Figure 7.25a/b solid triangle) amounted to ~1 in both cases; crystallized
with or without bulk surface reservoir. In contrast, the f values decreased from ~0.98 at
25 °C to ~0.94 at 46 °C for n-tetracosane in unmodified 60 nm AAO membranes
crystallized with bulk surface reservoir (Figure 7.25a open rectangle). For samples
crystallized without bulk surface reservoir Hermans’ order parameters amounted to
~0.96 in the temperature range 25−40 °C (Figure 7.25b open rectangle).
The order parameter decreased from f = 0.98 (25 °C) to f = 0.88 at 46 °C for n-
tetracosane in 25 nm AAO membranes crystallized with bulk surface film (Figure 7.25a
open circle). Crystallization without contact to a bulk surface reservoir (Figure 7.25b
open circle) yielded f values of ~0.92 at 25 °C and of ~0.76 at 40 °C, respectively.
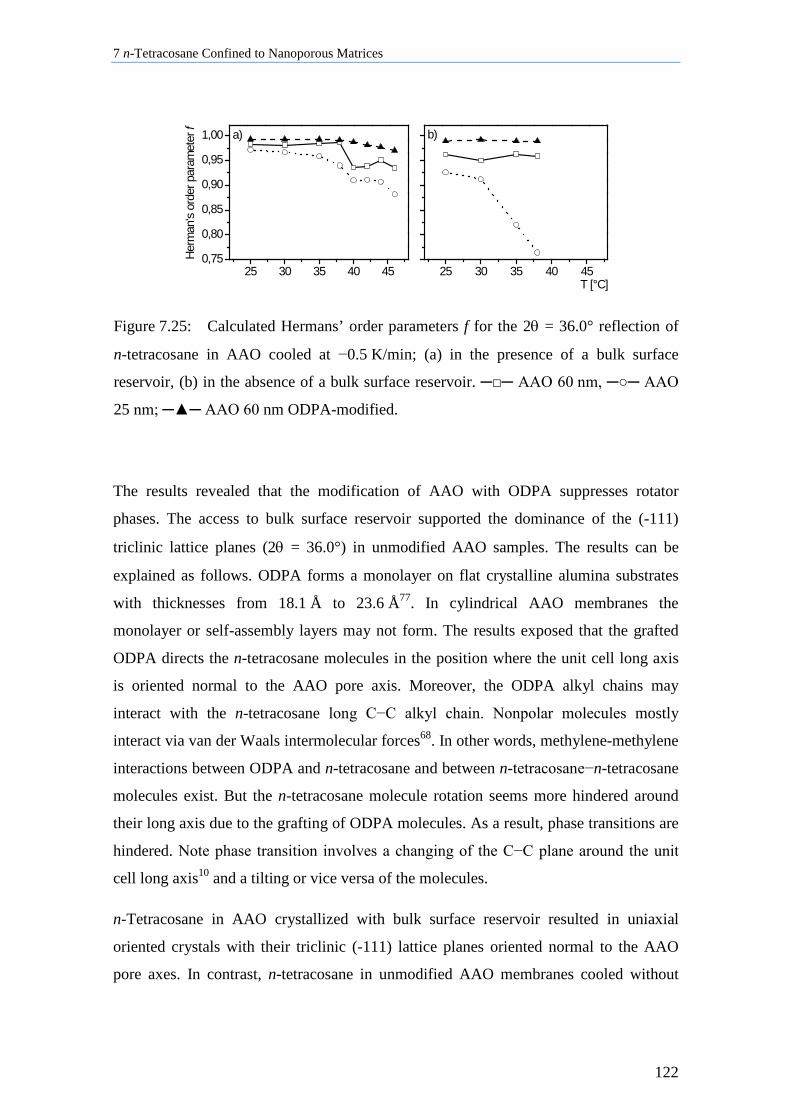
7 n-Tetracosane Confined to Nanoporous Matrices
122
25 30 35 40 450,75
0,80
0,85
0,90
0,95
1,00
25 30 35 40 45
a)
Herm
an's
orde
r par
amet
er f b)
T [°C]
Figure 7.25: Calculated Hermans’ order parameters f for the 2θ = 36.0° reflection of
n-tetracosane in AAO cooled at −0.5 K/min; (a) in the presence of a bulk surface
reservoir, (b) in the absence of a bulk surface reservoir. ─□─ AAO 60 nm, ─○─ AAO
25 nm; ─▲─ AAO 60 nm ODPA-modified.
The results revealed that the modification of AAO with ODPA suppresses rotator
phases. The access to bulk surface reservoir supported the dominance of the (-111)
triclinic lattice planes (2θ = 36.0°) in unmodified AAO samples. The results can be
explained as follows. ODPA forms a monolayer on flat crystalline alumina substrates
with thicknesses from 18.1 Å to 23.6 Å77. In cylindrical AAO membranes the
monolayer or self-assembly layers may not form. The results exposed that the grafted
ODPA directs the n-tetracosane molecules in the position where the unit cell long axis
is oriented normal to the AAO pore axis. Moreover, the ODPA alkyl chains may
interact with the n-tetracosane long C−C alkyl chain. Nonpolar molecules mostly
interact via van der Waals intermolecular forces68. In other words, methylene-methylene
interactions between ODPA and n-tetracosane and between n-tetracosane−n-tetracosane
molecules exist. But the n-tetracosane molecule rotation seems more hindered around
their long axis due to the grafting of ODPA molecules. As a result, phase transitions are
hindered. Note phase transition involves a changing of the C−C plane around the unit
cell long axis10 and a tilting or vice versa of the molecules.
n-Tetracosane in AAO crystallized with bulk surface reservoir resulted in uniaxial
oriented crystals with their triclinic (-111) lattice planes oriented normal to the AAO
pore axes. In contrast, n-tetracosane in unmodified AAO membranes cooled without
7 n-Tetracosane Confined to Nanoporous Matrices
123
bulk surface reservoir showed a second crystal orientation or subpopulation of crystals
with different orientations. As discussed above, the nucleation process changed from
heterogeneous starting in bulk material to homogeneous when material nucleates in
each AAO nanopore separately. Homogeneous nucleation results in formation of many
growing crystals, then crystals with other orientations have also a chance to occupy a
certain volume portion. Or, as a second explanation, homogeneous nucleation favors the
stabilization of a rotator phase at lower temperatures.
7.8.3 Lamellar Crystals (1) Anodic Aluminum Oxide (AAO)
Bulk n-tetracosane formed lamellar crystals which showed typical {00l} long-spacing
reflections in X-ray studies (Figure 7.2). n-Tetracosane confined in AAO membranes
crystallized at a rate of −0.5 K/min in presence of a bulk surface reservoir also showed
{00l} layer reflections (Figure 7.11). Additionally, in AAO membranes triclinic and
high temperature layer reflections occurred together. In all AAO membranes the d-
values of the {00l} layer reflections were higher in the RII than in the triclinic phase.
This is in line with the assumption that the phase transition RII→triclinic involves a
tilting of the molecules. In the RII phase molecules are non-tilted and therefore, the layer
thicknesses have higher values. n-Tetracosane molecules in 25 nm nanopores, due to the
reduced pore size, are more tilted than in 60 nm AAO membranes or in bulk material.
Furthermore, it could suggest that the crafted alkyl ODPA chains on the AAO pore
walls influence the n-tetracosane molecule arrangement. In such samples d-values are
higher than in samples with the same pore size but unmodified pore walls. There are
two possibilities: (a) the molecules are more stretched or (b) the ODPA alkyl moieties
are involved in the detectable n-tetracosane layer arrangement that influences the layer
spacing.
Note during theta/2theta scans the AAO surface is oriented normal to the scattered
plane. In this geometry, only crystals that meet the Bragg condition and have the
corresponding set of lattice planes normal to the AAO pore axis contribute to the
detected scattering intensity. More details are given in the experimental section 3.1.
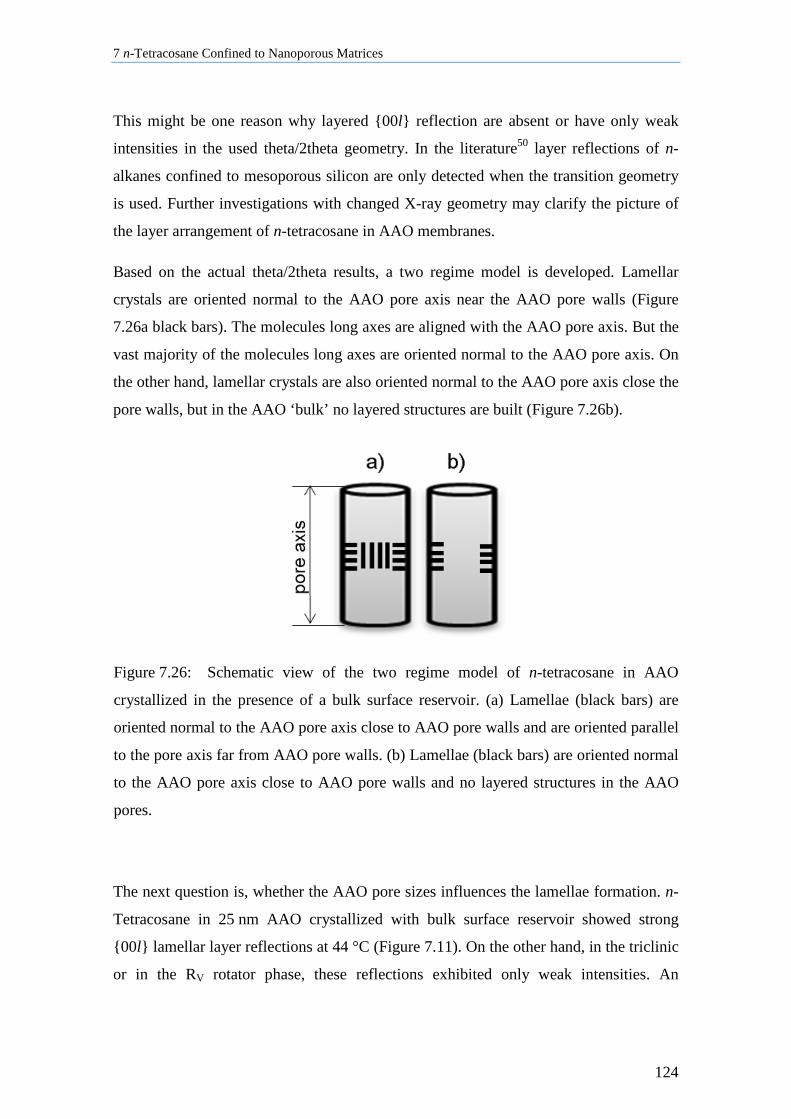
7 n-Tetracosane Confined to Nanoporous Matrices
124
This might be one reason why layered {00l} reflection are absent or have only weak
intensities in the used theta/2theta geometry. In the literature50 layer reflections of n-
alkanes confined to mesoporous silicon are only detected when the transition geometry
is used. Further investigations with changed X-ray geometry may clarify the picture of
the layer arrangement of n-tetracosane in AAO membranes.
Based on the actual theta/2theta results, a two regime model is developed. Lamellar
crystals are oriented normal to the AAO pore axis near the AAO pore walls (Figure
7.26a black bars). The molecules long axes are aligned with the AAO pore axis. But the
vast majority of the molecules long axes are oriented normal to the AAO pore axis. On
the other hand, lamellar crystals are also oriented normal to the AAO pore axis close the
pore walls, but in the AAO ‘bulk’ no layered structures are built (Figure 7.26b).
Figure 7.26: Schematic view of the two regime model of n-tetracosane in AAO
crystallized in the presence of a bulk surface reservoir. (a) Lamellae (black bars) are
oriented normal to the AAO pore axis close to AAO pore walls and are oriented parallel
to the pore axis far from AAO pore walls. (b) Lamellae (black bars) are oriented normal
to the AAO pore axis close to AAO pore walls and no layered structures in the AAO
pores.
The next question is, whether the AAO pore sizes influences the lamellae formation. n-
Tetracosane in 25 nm AAO crystallized with bulk surface reservoir showed strong
{00l} lamellar layer reflections at 44 °C (Figure 7.11). On the other hand, in the triclinic
or in the RV rotator phase, these reflections exhibited only weak intensities. An
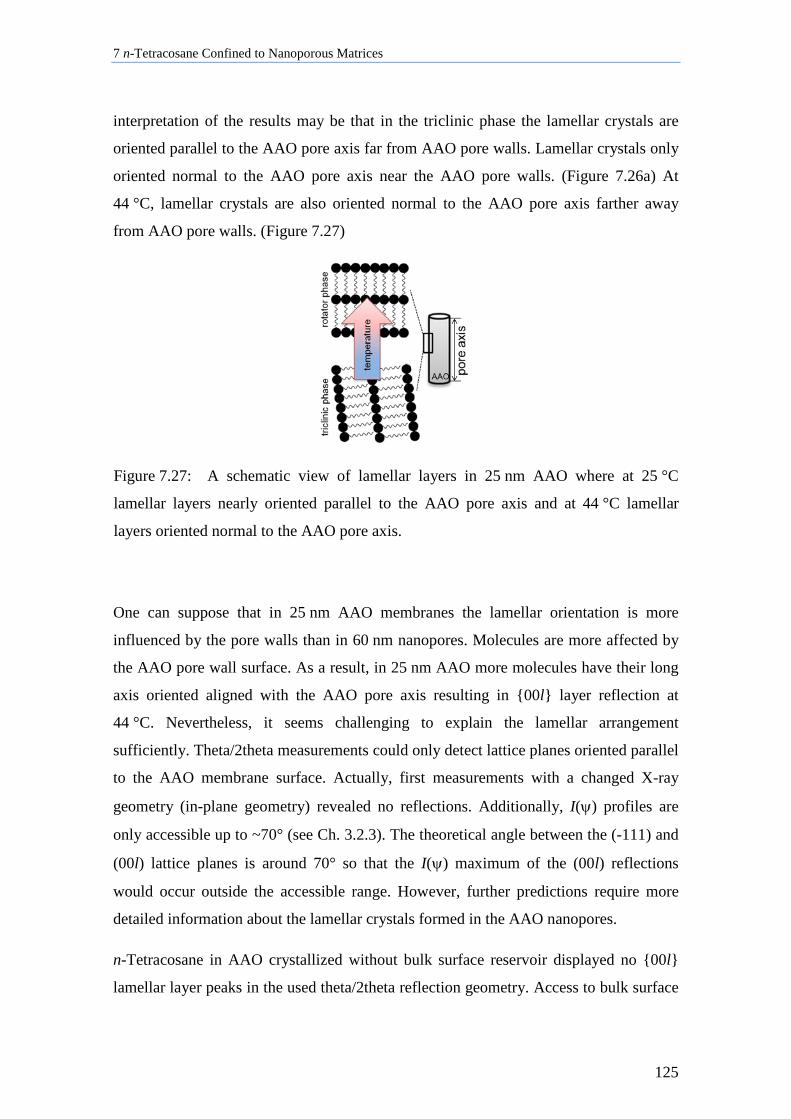
7 n-Tetracosane Confined to Nanoporous Matrices
125
interpretation of the results may be that in the triclinic phase the lamellar crystals are
oriented parallel to the AAO pore axis far from AAO pore walls. Lamellar crystals only
oriented normal to the AAO pore axis near the AAO pore walls. (Figure 7.26a) At
44 °C, lamellar crystals are also oriented normal to the AAO pore axis farther away
from AAO pore walls. (Figure 7.27)
Figure 7.27: A schematic view of lamellar layers in 25 nm AAO where at 25 °C
lamellar layers nearly oriented parallel to the AAO pore axis and at 44 °C lamellar
layers oriented normal to the AAO pore axis.
One can suppose that in 25 nm AAO membranes the lamellar orientation is more
influenced by the pore walls than in 60 nm nanopores. Molecules are more affected by
the AAO pore wall surface. As a result, in 25 nm AAO more molecules have their long
axis oriented aligned with the AAO pore axis resulting in {00l} layer reflection at
44 °C. Nevertheless, it seems challenging to explain the lamellar arrangement
sufficiently. Theta/2theta measurements could only detect lattice planes oriented parallel
to the AAO membrane surface. Actually, first measurements with a changed X-ray
geometry (in-plane geometry) revealed no reflections. Additionally, I(ψ) profiles are
only accessible up to ~70° (see Ch. 3.2.3). The theoretical angle between the (-111) and
(00l) lattice planes is around 70° so that the I(ψ) maximum of the (00l) reflections
would occur outside the accessible range. However, further predictions require more
detailed information about the lamellar crystals formed in the AAO nanopores.
n-Tetracosane in AAO crystallized without bulk surface reservoir displayed no {00l}
lamellar layer peaks in the used theta/2theta reflection geometry. Access to bulk surface
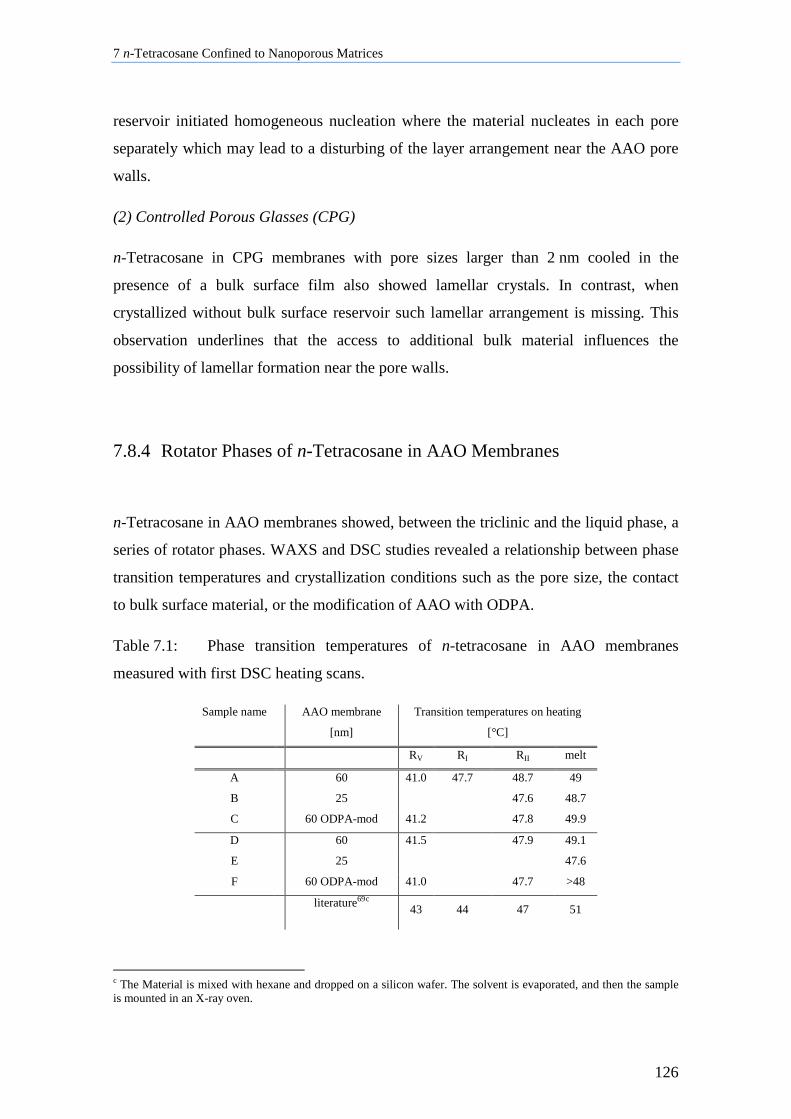
7 n-Tetracosane Confined to Nanoporous Matrices
126
reservoir initiated homogeneous nucleation where the material nucleates in each pore
separately which may lead to a disturbing of the layer arrangement near the AAO pore
walls.
(2) Controlled Porous Glasses (CPG)
n-Tetracosane in CPG membranes with pore sizes larger than 2 nm cooled in the
presence of a bulk surface film also showed lamellar crystals. In contrast, when
crystallized without bulk surface reservoir such lamellar arrangement is missing. This
observation underlines that the access to additional bulk material influences the
possibility of lamellar formation near the pore walls.
7.8.4 Rotator Phases of n-Tetracosane in AAO Membranes
n-Tetracosane in AAO membranes showed, between the triclinic and the liquid phase, a
series of rotator phases. WAXS and DSC studies revealed a relationship between phase
transition temperatures and crystallization conditions such as the pore size, the contact
to bulk surface material, or the modification of AAO with ODPA.
Table 7.1: Phase transition temperatures of n-tetracosane in AAO membranes
measured with first DSC heating scans.
Sample name
AAO membrane
[nm]
Transition temperatures on heating
[°C]
RV RI RII melt
A
60 41.0 47.7 48.7 49
B
25 47.6 48.7
C
60 ODPA-mod 41.2 47.8 49.9
D
60 41.5 47.9 49.1
E
25
47.6
F
60 ODPA-mod 41.0 47.7 >48
literature69c 43 44 47 51
c The Material is mixed with hexane and dropped on a silicon wafer. The solvent is evaporated, and then the sample is mounted in an X-ray oven.
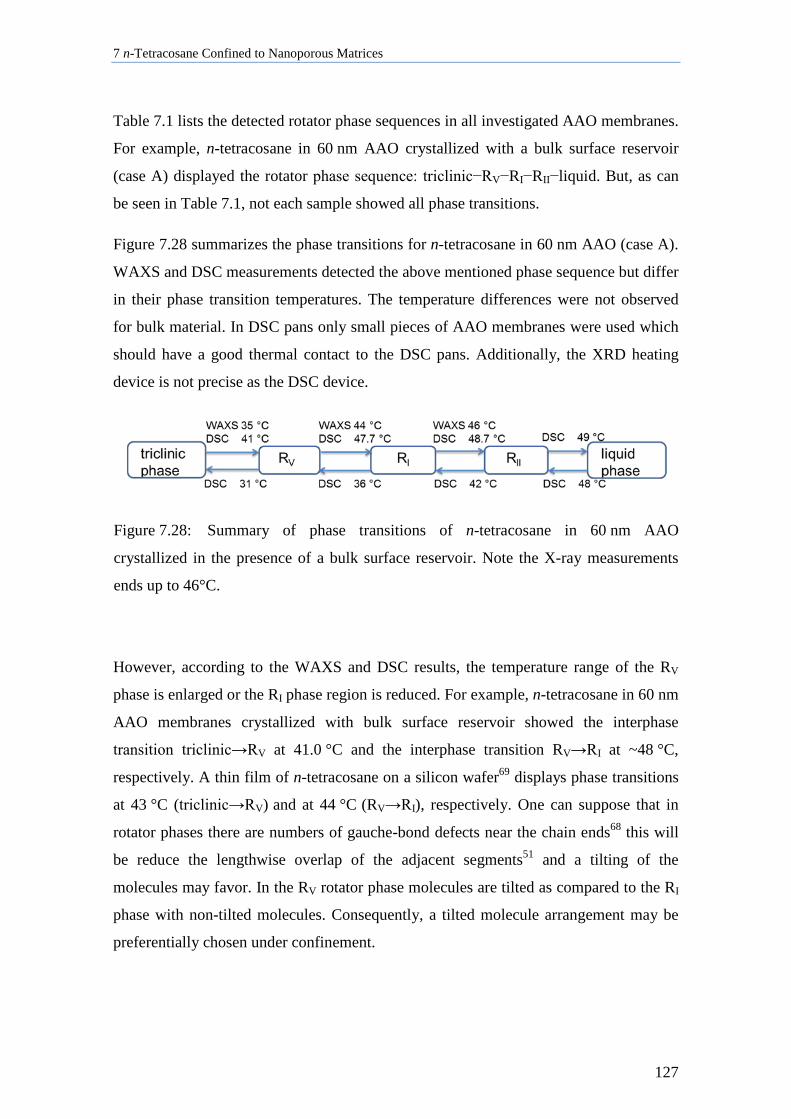
7 n-Tetracosane Confined to Nanoporous Matrices
127
Table 7.1 lists the detected rotator phase sequences in all investigated AAO membranes.
For example, n-tetracosane in 60 nm AAO crystallized with a bulk surface reservoir
(case A) displayed the rotator phase sequence: triclinic−RV−RI−RII−liquid. But, as can
be seen in Table 7.1, not each sample showed all phase transitions.
Figure 7.28 summarizes the phase transitions for n-tetracosane in 60 nm AAO (case A).
WAXS and DSC measurements detected the above mentioned phase sequence but differ
in their phase transition temperatures. The temperature differences were not observed
for bulk material. In DSC pans only small pieces of AAO membranes were used which
should have a good thermal contact to the DSC pans. Additionally, the XRD heating
device is not precise as the DSC device.
Figure 7.28: Summary of phase transitions of n-tetracosane in 60 nm AAO
crystallized in the presence of a bulk surface reservoir. Note the X-ray measurements
ends up to 46°C.
However, according to the WAXS and DSC results, the temperature range of the RV
phase is enlarged or the RI phase region is reduced. For example, n-tetracosane in 60 nm
AAO membranes crystallized with bulk surface reservoir showed the interphase
transition triclinic→RV at 41.0 °C and the interphase transition RV→RI at ~48 °C,
respectively. A thin film of n-tetracosane on a silicon wafer69 displays phase transitions
at 43 °C (triclinic→RV) and at 44 °C (RV→RI), respectively. One can suppose that in
rotator phases there are numbers of gauche-bond defects near the chain ends68 this will
be reduce the lengthwise overlap of the adjacent segments51 and a tilting of the
molecules may favor. In the RV rotator phase molecules are tilted as compared to the RI
phase with non-tilted molecules. Consequently, a tilted molecule arrangement may be
preferentially chosen under confinement.
7 n-Tetracosane Confined to Nanoporous Matrices
128
WAXS studies in Chapter 7.2 and DSC heating scans in Chapter 7.6 support the notion
that some phase transitions do not occur; (i) when material crystallized in each pore
separately, (ii) in 25 nm AAO, and (iii) in ODPA modified AAO membranes. Reasons
for suppressed phase transitions can be complex. For example, n-tetracosane confined in
25 nm AAO membranes crystallized with bulk surface reservoir showed only the phase
transition triclinic→RII at ~47° (Table 7.1). On the other hand, theta/2theta
measurements exhibited interphase transitions at 35 °C (triclinic→RV) and at ~46°C
(RV→RII), respectively (Figure 7.6). As previously mentioned, the transition RV↔RI
involves only a change in the molecule tilt angle. The transition RI↔RII includes a
change in the layer stacking sequence AB↔ABC accompanied by a lattice distortion.
The phase transition enthalpy of RI↔RII should by higher than for the RV↔RI
transition. Some phase transitions show only a small enthalpy change and may not be
detected during a DSC scan.
7.8.5 Summary
Crystallite orientation, rotator phases and lamellar crystals formation of n-tetracosane
confined in cylindrical, isolated AAO and in curved, interconnected CPG membranes
can be summarized as follows. (1) In AAO membranes uniformly oriented crystals
grow with their (-111) lattice planes oriented normal to the AAO pore axes. Such
preferred growth occurs independently from the AAO pore size, the modification of
AAO with ODPA, or the access to bulk surface reservoir. (2) The preferred crystal
growth was not detected in CPG membranes. In CPG membranes the free crystal
growth path is limited due to the curved morphology. Isotropic pore morphologies do
no show crystal texture. (3) Bulk n-tetracosane forms lamellar crystals. Under
confinement such lamellar structures were also observed, especially in cases of
crystallization in contact to a bulk surface reservoir. Actually, a two regime model of
the lamellar crystal arrangement in AAO membranes is suggested. The lamellar layers
are oriented normal to the pore axis near the AAO pore walls and (a) oriented parallel to
the pore axis far from AAO pore walls, or (b) no layered structures occurred in the
AAO pores. But a changed X-ray geometry (e.g., in-plane) may help to explain the
7 n-Tetracosane Confined to Nanoporous Matrices
129
lamellar arrangement in AAO membranes in more details. (4) n-Tetracosane in CPG
membranes also exhibited lamellar structures especially in the rotator phases. (5) The
crystalline phase was suppressed in smaller CPG membranes (d ~2 nm). One
assumption might be that on CPG walls a rigid amorphous layer is built and the
thickness of the layer lies in the pore size range. (6) In 60 nm AAO membranes the
temperature range, where the RV rotator phase occur, could be enlarged. Under
confinement, a tilting of the molecules is favored and rotator phase RV will be more
stabilized. (7) n-Tetracosane in 60 nm AAO membranes crystallized with bulk surface
reservoir revealed the rotator phase sequence: triclinic−RV−RI−RII−liquid. (8) In AAO
pore sizes smaller than 60 nm the observation of the phase transition is challenging. One
reason might be the influence of AAO pore walls due to the surface-to-volume ratio
increasing in smaller pore sizes. (9) Crafted ODPA molecules on AAO pore walls might
interact via the alkyl moieties with the alkyl moieties of n-tetracosane. Hence, on the
AAO pore wall an interphase of the octadecyl moieties of ODPA and the alkyl moieties
of n-tetracosane exist. The octadecyl moieties support the molecule arrangement where
the long axis is oriented normal to the pore axis. Such interaction hinders the occurrence
of rotator phases. (10) Confined n-tetracosane shows stable crystallite orientation for a
longer time interval. The nanosized material can be used for more time consuming
investigations. Sample storage under ambient conditions is possible.
8 Conclusions and Outlook
130
8 Conclusions and Outlook
Acetaminophen, a low-molecular weight polymorphic drug, and n-tetracosane, a
saturated hydrocarbon, have been chosen as model guest compounds embedded in two
nanoporous matrices: AAO containing aligned cylindrical, isolated pores and CPG
containing curved, interconnected pores. Additional studies reveal that both model
guests are sensitive to changes in their crystallization conditions. The influence of the
crystallization parameters (i.e., the pore morphology, the thermal history, the pore sizes,
the pore wall chemistry, the presence or the absence of a bulk surface reservoir) of the
crystallizing species on crystallization kinetics was systematically screened. For
example, in the case of acetaminophen it could be shown that the pore morphology is an
important parameter controlling polymorph formation as well as crystallite orientation,
and the kinetics of solid/solid transitions under confinement. Non-isothermal
crystallization of acetaminophen in AAO with a pore diameter of 60 nm at −0.5 K/min
in the presence of a bulk surface reservoir yields highly oriented form II/form III
crystals. Under identical conditions, acetaminophen form I crystals preferentially grow
in CPG. Acetaminophen form II and form III crystals have a close structure registry
along the crystal directions aligned with the AAO pore axes. Thus, in AAO membranes
uniformly oriented form III crystals undergo a solid/solid transition to uniformly
oriented form II crystals during which the transition front propagates through the
straight AAO pores. In CPG membranes, the propagation front will impinge on the pore
walls after a short propagation path. One can conclude that under identical
crystallization conditions the pore morphology initiates a kinetic selection process.
Apart from crystalline forms for pharmaceutical application, the amorphous form of a
drug is of interest. Amorphous forms often exhibit higher dissolution rates and hence
better bioavailability regarding to the thermodynamic more stable crystalline forms.
Therefore, amorphous forms and their life time are pharmaceutically relevant aspects.
Amorphous acetaminophen in AAO membranes can easily be obtained by rapid
quenching of the melt without bulk acetaminophen surface reservoir. Moreover,
crystallization can be suppressed in AAO membranes with 25 nm pores. It can be
8 Conclusions and Outlook
131
assumed that nucleation of acetaminophen in isolated AAO pores is predominantly
homogeneous which could be one reason for the retarded crystallization kinetics.
Nanosized amorphous acetaminophen is stable for several months.
The study on crystallization parameters such as the thermal history, and the presence or
the absence of bulk surface reservoir shows that they can be used as a tool for high-yield
productions of specific polymorphs of polymorphic drugs in AAO membranes.
Crystallization parameters can be optimized to obtain the desired drug polymorph or
crystallite orientation. The capability to produce drugs consisting of specific
polymorphs with specific crystal orientation does not only enable polymorph-specific
drug release but also crystal-face specific drug release from nanosized drug carriers.
Drug release rates can be linked to specific crystal faces. Rough crystal faces have out-
facing functional moieties which can interact with solvent molecules. Dissolution tests
of acetaminophen in AAO membranes reveal that form I and form II crystals having
rough crystal faces exposed to the environment are dissolved nearly as fast as
amorphous acetaminophen in a burst mechanism within the first few minutes. However,
complete dissolution was only observed for crystalline acetaminophen, whereas in the
case of amorphous acetaminophen a small portion of the material did not dissolve. This
outcome indicates that amorphous acetaminophen forms stable interfacial layers on the
AAO pore walls during the aging of the sample. Fitted release data suggest that the
dissolution of acetaminophen from AAO membranes is not diffusion-controlled within
the first minutes. It can be assumed that the dissolution is surface-limited. Retardation
of the release of acetaminophen from AAO was accomplished by encapsulation of
acetaminophen in AAO with a biodegradable polymer. The dissolution tests show a
delay in the drug release. The encapsulation process retards the drug release but does
not modify the release kinetics.
In this thesis, controlled polymorph formation in geometrically defined
nanoconfinement and the use of AAO membranes as drug delivery carriers was
combined. This concept might be extended to the use of other matrices, for example
titanium oxide nanotube arrays116, or block copolymer membranes20 as drug delivery
systems. Titania nanotube arrays have, for example, been used as orthopedic or dental
8 Conclusions and Outlook
132
implants18 due to their high biocompatibility. First drug release kinetics based on titania
nanotube arrays show promising results.112
Crystallization of n-tetracosane has also been studied, because this member of the n-
alkane family is representative of compounds forming lamella crystals. Besides triclinic
lamella crystals, bulk n-tetracosane forms one rotator phase between the solid triclinic
and the isotropic liquid phase. Non-isothermal crystallization of n-tetracosane in
unmodified 60 nm AAO pores in the presence of a bulk n-tetracosane surface reservoir
yields the rotator phase sequence: triclinic−RV−RI−RII−liquid. The occurrence of rotator
phases is linked to crystallization parameters such as the pore size, the presence of bulk
surface reservoirs of n-tetracosane, and the modification of the AAO pore walls with
coupling agents such as ODPA. Furthermore, n-tetracosane in AAO non-isothermally
crystallized with or without bulk surface reservoirs of n-tetracosane revealed uniaxial
oriented crystals. It can be assumed that only crystals with their directions of fast
growth aligned to the AAO pore axis will fill the volume of the nanopores. Other
crystals with different orientations might impinge on the AAO pore walls and will not
be able to grow further. The preferred crystal growth occurs independently from AAO
pore size or modification of AAO with ODPA. On the other hand, modification of AAO
with ODPA suppresses the occurrence of rotator phases. The octadecyl moieties of
ODPA and the alkyl moieties of n-tetracosane build an interphase near the AAO pore
wall. The crafted ODPA molecules favor a strong alignment of n-tetracosane where the
long axes of the n-tetracosane molecules are oriented normal to the AAO pore axis.
Interpretation of the lamellar order in AAO membranes is difficult; therefore, a two
regime model is described here. n-Tetracosane in AAO crystallized with a bulk surface
reservoir forms lamellar crystals which are oriented normal to the AAO pore axis near
the pore walls. On the other hand, away from the pore walls (a) the lamellae are oriented
parallel to the AAO pore axis or (b) no layered structures are built.
In CPG membranes, lamellar order is also detected. No crystalline structures occur in
smaller CPG pores (mean pore diameter ~2 nm) and hence, no layered arrangement is
observed in wide-angle X-ray scattering experiments. In such small pores, with large
surface-to-volume ratio, the AAO pore walls prevent ordering of a large portion of n-
tetracosane molecules so that crystallization is inhibited. In general, n-tetracosane shows
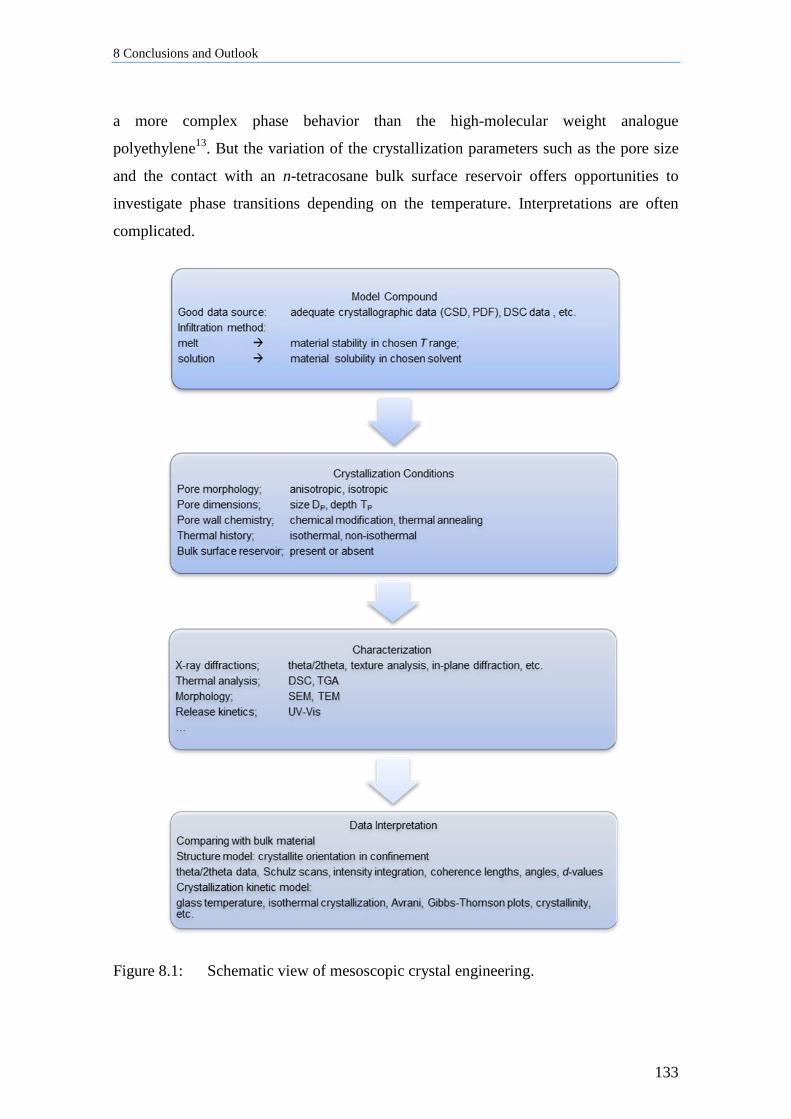
8 Conclusions and Outlook
133
a more complex phase behavior than the high-molecular weight analogue
polyethylene13. But the variation of the crystallization parameters such as the pore size
and the contact with an n-tetracosane bulk surface reservoir offers opportunities to
investigate phase transitions depending on the temperature. Interpretations are often
complicated.
Figure 8.1: Schematic view of mesoscopic crystal engineering.
8 Conclusions and Outlook
134
The use of anisotropic AAO and isotropic CPG membranes as hosts for crystallizable
guests opens new pathways to manipulate crystal growth with control over polymorph
formation, phase transitions and crystallite orientation. This work highlights the
influence of crystallization parameters such as the pore morphology, the thermal
history, the pore sizes, the pore wall chemistry, and the presence or the absence of bulk
surface reservoir on crystal growth in nanoscale environments. The present study offers
strategies to modify the crystallization pathways and extends the parameter space by
parameters such as the pore morphology and the presence or the absence of a bulk
reservoir of the crystallizing species in contact with the crystallizing nanostructures for
mesoscopic crystal engineering (Figure 8.1). The methods might be transferred into
other areas of interest such as polymorphism screening, and the preparation of
nanostructures where the functional properties depend on the way the materials
crystallize. Examples are nanowires with ferroelectric or specific optoelectronic
properties.
The use of anodic aluminum oxide membranes as nanoporous matrices is one aspect;
the characterization of AAO membranes is another. For example, electron paramagnetic
resonance spectroscopy shows a relationship between the AAO preparation (i.e.,
electrolyte solution) and formation of organic radicals. AAO pore walls are grafted with
alkyl chains by modifying them with ODPA which result in hydrophobic low energy
surfaces. A deeper understanding of how such coupling agents arrange on curved pore
walls is a quite interesting topic.117 Another question is, whether the polarity (−OH >
−NH2 > −CH3) of the functional group has an influence on the AAO surface energy.
New functional groups will change the AAO surface chemistry (i.e.,
hydrophilic−hydrophobic properties) which might influence the crystallization kinetics.
Nevertheless, the density of hydroxyl groups on AAO pore walls is a good example of
an important parameter for the binding rate of coupling agents. Determination of the
hydroxyl groups should be investigated with proper surface characterization
techniques.76, 77, 79
9 Bibliography
135
9 Bibliography
1. Alcoutlabi, M.; McKenna, G. B. J. Phys. Condens. Matter 2005, 17, R461-R524.
2. Hamilton, B. D.; Ha, J.-M.; Hillmyer, M. A.; Ward, M. D. Acc. Chem. Res. 2012, 45
414-423.
3. Lu, J.; Rohani, S. Curr. Med. Chem. 2009, 16, 884-905.
4. Jiang, Q.; Ward, M. D. Chem. Soc. Rev. 2014, 43, 2066-2079.
5. Masuda, H.; Fukuda, K. Science 1995, 268, 1466-1468.
6. Enke, D.; Janowski, F.; Schwieger, W. Micropor. Mesopor. Mater. 2003, 60, 19-30.
7. Rengarajan, G. T.; Enke, D.; Steinhart, M.; Beiner, M. Phys. Chem. Chem. Phys.
2011, 13, 21367-21374.
8. Hamilton, B. D.; Hillmyer, M. A.; Ward, M. D. Cryst. Growth Des. 2008, 8, 3368-
3375.
9. Beiner, M.; Rengarajan, G. T.; Pankaj, S.; Enke, D.; Steinhart, M. Nano Lett. 2007, 7,
1381-1385.
10. Huber, P.; Wallacher, D.; Albers, J.; Knorr, K. Europhys. Lett. 2004, 65, 351-357.
11. Steinhart, M.; Göring, P.; Dernaika, H.; Prabhukaran, M.; Gösele, U.; Hempel, E.;
Thurn-Albrecht, T. Phys. Rev. Lett. 2006, 97, 027801.
12. Steinhart, M.; Senz, S.; Wehrspohn, R. B.; Gösele, U.; Wendorff, J. H.
Macromolecules 2003, 36, 3646-3651.
13. Shin, K.; Woo, E.; Jeong, Y. G.; Kim, C.; Huh, J.; Kwang-Woo, K. Macromolecules
2007, 40, 6617-6623.
9 Bibliography
136
14. Hamilton, B. D.; Weissbuch, I.; Lahav, M., Hillmyer, M. A.; Ward, M. D. J. Am.
Chem. Soc. 2009, 131, 2588-2596.
15. Shingne, N.; Geuss, M.; Hartmann-Azanza, B.; Steinhart, M.; Thurn-Albrecht, T.
Polymer 2013, 54, 2737-2744.
16. Duran, H.; Hartmann-Azanza, B.; Steinhart, M.; Gehring, D.; Laquai, F.; Feng, X.;
Müllen, K.; Butt, H.-J.; Floudas, G. ACS Nano 2012, 6, 9359-9365.
17. Grigoriadis, C.; Duran, H.; Steinhart, M.; Kappl, M.; Butt, H.-J.; Floudas, G. ACS
Nano 2011, 11, 9208-9215.
18. Losic, D.; Simovic, S. Expert Opin. Drug Deliv. 2009, 6, 1363-1381.
19. Perry, J. L.; Martin, C. R.; Stewart, J. D. Chem. Eur. J. 2011, 17, 6296-6302.
20. Jeon, G.; Yun Yang, S.; Kon Kim, J. J. Mater. Chem. 2012, 22, 14814-14834.
21. Rengarajan, G. T.; Enke, D.; Beiner, M. Open J. Phys. Chem. 2007, 1, 18-24.
22. Rengarajan, G. T.; Enke, D.; Steinhart, M.; Beiner, M. J. Mater. Chem. 2008, 15,
2537-2539.
23. Desiraju, G. R. J. Am. Chem. Soc. 2013, 135, 9952-9967.
24. Cui, Y. Int. J. Pharm. 2007, 339, 3-18.
25. Hilfiker, editor, Polymorphism. Wiley-VCH Verlag GmbH Co. KGaA: 2006.
26. Pethrick, R. A. Polymer Structure Characterization from Nano to Macro
Organization; RSC Publishing, Cambridge, 2007.
27. Mullin, J. W. Crystallization; Butterworth-Heinemann: 2001.
28. The Collected Works of Gibbs, J. W. Longmas, Green and Co., New York, London,
Totonto, 1928.
9 Bibliography
137
29. Turnbull, D. J. J. Chem. Phys. 1950, 18, 198-203.
30. He, B. B. Two-Dimensional X-Ray Diffraction; John Wiley & Sons, Inc.: Hoboken,
New Jersey, 2009.
31. Spieß, L.; Teichert, G.; Schwarzer, R.; Behnken, H.; Genzel, C. Moderne
Röntgenbeugung; Vieweg+Teubner, GWV Fachverlage GmbH: Wiesbaden, 2009.
32. Massa, W. Kristallstrukturbestimmung; B. G. Teubner Verlag: Wiesbaden, 2007.
33. Atkins, P.; de Paula, J. Physical Chemistry; W. H. Freeman and Company: New
York, 2006.
34. Ward, M. D. Chem. Rev. 2001, 101, 1697-1725.
35. Jackson, K. A. Chapter 21 The Surface-Roughening Transition. In Kinetic
Processes; Wiley-VCH Verlag GmbH & Co. KGaA: 2004; pp 283-310.
36. Lovette, M. A.; Robben Browning, A.; Griffin, D. W.; Sizemore, J. P.; Snyder, R.
C.; Doherty, M. F. Ind. Eng. Chem. Res. 2008, 47, 9812-9833.
37. Hartman, P.; Perdok, W. G. Acta Cryst. 1955, 8, 49-52.
38. Grimbergen, R. F. P.; Meekes, H.; Bennema, P.; Strom, C. S.; Vogels, L. J. P. Acta
Cryst. 1998, A54, 491-500.
39. Hartman, P.; Bennema, P. J. Cryst. Growth 1980, 49, 145-156.
40. Bennema, P.; Meekes, H.; Boerrigter, S. X. M.; Cuppen, H. M.; Deij, M. A.; van
Eupen, J.; Verwer, P.; Vlieg, E. Cryst. Growth Des. 2004, 4, 905-913.
41. Florence, A. T.; Attwood, D. Physicochemical Principles of Pharmacy;
Pharmaceutical Press: 2006.
42. Bernstein, J.; Davey, R. J.; Henck, J.-O. Angew. Chem. Int. Ed. 1999, 38, 3440-
3461.
9 Bibliography
138
43. Datta, S.; Grant, D. J. W. Nat. Rev. Drug Discov. 2004, 3, 42-57.
44. Burger, A.; Ramberger, R. Mikrochim. Acta 1979, 2, 259-271.
45. Ha, J.-M.; Wolf, J. H.; Hillmyer, M. A.; Ward, M. D. J. Am. Chem. Soc. 2004, 126,
3382-3383.
46. Ha, J.-M.; Hillmyer, M. A.; Ward, M. D. J. Phys. Chem. B 2005, 109, 1392-1399.
47. Ha, J.-M.; Hamilton, B. D.; Hillmyer, M. A.; Ward, M. D. Cryst. Growth Des. 2009,
9, 4766-4777.
48. Henschel, A.; Huber, P.; Knorr, K. Phys. Rev. E 2008, 77, 042602.
49. Duran, H.; Steinhart, M.; Butt, H.-J.; Floudas, G. Nano Lett. 2011, 11, 1671-1675.
50. Henschel, A.; Hofmann, T.; Huber, P.; Knorr, K. Phys. Rev. E 2007, 75, 021607.
51. Kumar, M. V.; Prasad, S. K.; Rao, D. S. S. Langmuir 2010, 26, 18362-18368.
52. Kim, B. S.; Jeong, Y. G.; Shin, K. J. Phys. Chem. B 2013, 117, 5978-5988.
53. Yan, X.; Wang, T. B.; Gao, C. F.; Lan, X. Z. J. Phys. Chem. C 2013, 117, 17245-
17255.
54. Su, Y.; Liu, G.; Xie, B.; Fu, D.; Wang, D. Acc. Chem. Res. 2014, 47, 192-201.
55. Masuda, H.; Yada, K.; Osaka, A. Jpn. J. Appl. Phys. 1998, 37, L 1340-L 1342.
56. Li, A. P.; Müller, F.; Birner, A.; Nielsch, K.; Gösele, U. J. Appl. Phys. 1998, 84,
6023-6026.
57. Schwirn, K.; Lee, W.; Hillebrand, R.; Steinhart, M.; Nielsch, K.; Gösele, U. ACS
Nano 2008, 2, 302-310.
58. Steinhart, M. Adv. Polym. Sci. 2008, 220, 123-187.
9 Bibliography
139
59. Lee, W.; Ji, R.; Gösele, U.; Nielsch, K. Nature Materials 2006, 5, 741-747.
60. http://www.drugbank.ca/ (accessed Juni/18, 2012).
61. Welton, J. M.; McCarthy, G. J. Powder Diffr. 1988, 3, 102-103.
62. Naumov, D. Y.; Vasilchenko, M. A.; Howard, J. A. K. Acta Crystallogr., Sect. C.:
Cryst. Struct. Commun. 1998, 54, 653.
63. Drebushchak, T. N.; Boldyreva, E. V. Z. Kristallogr. 2004, 219, 506-512.
64. Di Martino, P.; Conflant, P.; Drache, M.; Huvenne, J.-P.; Guyot-Hermann, A.-M.
J.Therm. Anal. Calorim. 1997, 48, 447-458.
65. Perrin, M.-A.; Neumann, M. A.; Elmaleh, H.; Zaske, L. Chem. Commun. 2009,
3181-3183.
66. Peterson, M. L.; Morissette, S. L.; McNulty, C.; Goldsweig, A.; Shaw, P.;
LeQuesne, M.; Monagle, J.; Encina, N.; Marchionna, J.; Johnson, A.; Gonzalez-Zugasti,
J.; Lemmo, A. V.; Ellis, S. J.; Cima, M. J.; Almarsson, O. J. J. Am. Chem. Soc. 2002,
124, 10958-10959.
67. Nichols, G.; Frampton, C. S. J. Pharm. Sci. 1998, 87, 684-693.
68. Ocko, B. M.; Wu, X. Z.; Sirota, E. B.; Sinha, S. K.; Gang, O.; Deutsch, M. Phys.
Rev. E 1997, 55, 3164-3182.
69. Sirota, E. B.; King, J.,H. E.; Singer, D. M.; Shao, H. H. J. Chem. Phys. 1993, 98,
5809-5824.
70. Zammit, U.; Marinelli, F.; Mercuri, F.; Paoloni, S. J. Phys. Chem. B 2010, 114,
8134-8139.
71. Craievich, A. F.; Doucet, J.; Denicolo, I. Phys. Rev. B 1985, 32, 4164-4168.
72. Gerson, A. R.; Nyburg, S. C. Acta Cryst. 1992, B48, 737-741.
9 Bibliography
140
73. Fletcher, D. A.; McMeeking, R. F.; Parkin, D. J. Chem. Inf. Comput. Sci. 1996, 36,
746-749.
74. Mazee, W. M. Rec. Tra. Chim. 1948, 67, 197-213.
75. Fontes, G. N.; Malachias, A.; Magalhaes-Paniago, R.; Neves, B. R. A. Langmuir
2003, 19, 3345-3349.
76. Luschtinetz, R.; Seifert, G.; Jaehne, E.; Adler, H.-J. P. Macromol. Symp. 2007, 254,
248-253.
77. Luschtinetz, R.; Oliveira, A. F.; Duarte, H. A.; Seifert, G. Z. Anorg. Allg. Chem.
2010, 636, 1506-1512.
78. Love, J. C.; Estroff, L. A.; Kriebel, J. K.; Nuzzo, R. G.; Whitesides, G. M. Chem.
Rev. 2005, 105, 1103-1169.
79. Thissen, P.; Valtiner, M.; Grundmeier, G. Langmuir 2010, 26, 156-164.
80. Hoque, E.; DeRose, J. A.; Kulik, G.; Hoffmann, P.; Mathieu, H. J.; Bhushan, B. J.
Phys. Chem. B 2006, 110, 10855-10861.
81. Hoque, E.; DeRose, J. A.; Hoffmann, P.; Mathieu, H. J.; Bhushan, B.; Cichomski,
M. J. Chem. Phys. 2006, 124, 174710-1-174710-6.
82. Schreiber, F. Prog. Surf. Sci. 2000, 65, 151-256.
83. Liakos, I. L.; McAlpine, E.; Chen, X.; Newman, R.; Alexander, R. M. Appl. Surf.
Sci. 2008, 255, 3276-3282.
84. Textor, M.; Ruiz, L.; Hofer, R.; Rossi, A.; Feldman, K.; Hähner, G.; Spencer, N. D.
Langmuir 2000, 16, 3257-3271.
85. Cui, S. T.; Gupta, S. A.; Cummings, P. T.; Cochran, H. D. J. Chem. Phys. 1996,
105, 1214-1220.
9 Bibliography
141
86. Pecharsky, V. K.; Zavalij, P. Y. Origin of the powder diffraction pattern. In
Fundamentals of Powder Diffraction and Structural Characterization of Materials;
Springer Science+Business Media, Inc.: 2003; pp 153-158.
87. Graubner, G.; Rengarajan, G. T.; Anders, N.; Sonnenberger, N.; Enke, D.; Beiner,
M.; Steinhart, M. Cryst. Growth Des. 2014, 14, 78-86.
88. Schulz, L. G. J. Appl. Phys. 1949, 20, 1030-1033.
89. Shingne, N. Morphology and Crystal Orientation of Ferroelectric P(VDF-ran-TrFE)
Nanostructures in Porous Aluminium Oxide, Martin-Luther-Universität Halle-
Wittenberg, Dissertation, 2010.
90. Chernock, W. P.; Beck, P. A. J. Appl. Phys. 1952, 23, 341-345.
91. Hermans, P. H.; Weidinger, A.; Vermaas, D. Rec. Trav. Chim. 1946, 65, 427-447.
92. Patterson, A. L. Phys. Rev. 1939, 56, 978-982.
93. Höhne, G. W. H.; Hemminger, W. F.; Flammersheim, H.-J. Differential Scanning
Calorimetry; Springer-Verlag: Berlin, Heidelberg, New York, 2003.
94. Cammenga, H. K.; Epple, M. Angew. Chem. 1995, 107, 1284-1301.
95. Differential Scanning Calorimetry (DSC) A Beginner's Guide.
http://www.perkinelmer.de/CMSResources/Images/4474542GDE_DSCBeginnersGuide.
pdf 2014).
96. Strobel, G. The Physics of Polymers; Springer-Verlag: Berlin-Heidelberg, 2007.
97. Roland, U.; Holzer, F.; Pöppl, A.; Kopinke, F.-D. Appl. Catal. B-Environ. 2005, 58,
227-234.
98. Burley, J. C.; Duer, M. J.; Stein, R. S.; Vrcelj, R. M. Eur. J. Pharm. Sci. 2007, 31,
271-276.
9 Bibliography
142
99. Rengarajan, G. T. Polymorphism of Acetaminophen under Nanoconfinement,
Martin-Luther-Universität Halle-Wittenberg, Dissertation, 2009.
100. Bridgman, P. W. Proc. Am. Acad. Arts Sci. 1925, 60, 305-385.
101. Beyer, T.; Day, G. M.; Price, S. L. J. Am. Chem. Soc. 2001, 123, 5086-5094.
102. Siepmann, J.; Peppas, N. A. Int. J. Pharm. 2011, 418, 6-12.
103. Gottwald, W. Statistik für Anwender; WILEY-VCH GmbH: Weinheim, 2004.
104. Korsmeyer, R. W.; Gurny, R.; Doelker, E.; Buri, P.; Peppas, N. A. Int. J. Pharm.
1983, 15, 25-35.
105. Ritger, P. L.; Peppas, N. A. J. Control Release 1987, 5, 23-36.
106. Einführung in Origin 8.1.
http://www.additive-net.de/ftp/win32/software/origin/EinfuehrunginOrigin8.pdf
(accessed 09.10.2013).
107. Gavin, H. P. The Levenberg-Marquardt method for nonlinear least squares curve-
fitting problems. http://people.duke.edu/~hpgavin/ce281/lm.pdf 2014).
108. Simovic, S.; Losic, D.; Vasilev, K. Chem. Commun. 2010, 46, 1317-1319.
109. Grayson, A. C. R.; Choi, I. S.; Tyler, B. M.; Wang, P. P.; Brem, H.; Cima, M. J.;
Langer, R. Nat. Mater. 2003, 2, 767-772.
110. Weir, N. A.; Buchanan, F. J.; Orr, J. F.; Dickson, G. R. Proc. Instn. Mech. Engrs.
Part H: J. Engineering in Medicine 2004, 218, 307-319.
111. Brizzolara, D.; Cantow, H.-J. J.; Diederichs, K.; Keller, E.; Domb, A. J.
Macromolecules 1996, 29, 191-197.
112. Aw, M. S.; Addai-Mensah, J.; Losic, D. Chem. Commun. 2012, 48, 3348-3350.
9 Bibliography
143
113. Israelachvili, J. N. Intermolecular and Surface Forces; Elsevier Inc.: 2011.
114. Gao, Y.; Olsen, K. W. Mol. Pharmaceutics 2013, 10, 905-917.
115. Kipke, S.; Schmid, G. Adv. Funct. Mater. 2004, 14, 1184-1188.
116. Yin, J.; Xu, Q.; Wang, Z.; Yao, X.; Wang, Y. J. Mater. Chem. C 2013, 1, 1029-
1036.
117. Lassiaz, S.; Galarneau, A.; Trens, P.; Labarre, D.; Mutin, H.; Brunel, D. New. J.
Chem. 2010, 34, 1424-1435.
10 List of Figures and Tables
144
10 List of Figures and Tables
FIGURE 1.1: THE CRYSTALLIZATION PATHWAY. ..................................................................................... 1 FIGURE 1.2: CHART SHOWING NUCLEATION STEPS. ................................................................................ 2 FIGURE 1.3: SCHEMATIC REPRESENTATION OF THE CRYSTAL GROWTH VIA KINK SITES. ......................... 6
FIGURE 2.1: SUMMARY OF RELATIONSHIP BETWEEN INTERPORE DISTANCE DINT, VOLTAGE AND ELECTROLYTE. REPRODUCED FROM REF 59. ....................................................................................... 14
FIGURE 2.2: SEM IMAGES OF THE TWO NANOPOROUS MATRICES; (A) ANODIC ALUMINUM OXIDE (AAO), (B) CONTROLLED POROUS GLASSES (CPG). ........................................................................... 16
FIGURE 2.3: STRUCTURE OF ACETAMINOPHEN C8H9NO2. ..................................................................... 17 FIGURE 2.4: UNIT CELL OF MONOCLINIC ACETAMINOPHEN FORM I, VISUALIZED WITH MERCURY 3.1
BASED ON CSD DEPOSITION NUMBER HXACAN0462. OXYGEN ATOMS ARE RED, NITROGEN ATOMS ARE BLUE, CARBON ATOMS ARE GRAY, AND HYDROGEN ATOMS ARE NOT SHOWN. ............................. 17
FIGURE 2.5: UNIT CELL OF ORTHORHOMBIC ACETAMINOPHEN FORM II, VISUALIZED WITH MERCURY 3.1 BASED ON CSD DEPOSITION NUMBER HXACAN2363. OXYGEN ATOMS ARE RED, NITROGEN ATOMS
ARE BLUE, CARBON ATOMS ARE GRAY, AND HYDROGEN ATOMS ARE NOT SHOWN. ............................. 18 FIGURE 2.6: STRUCTURE OF N-TETRACOSANE (C24H50) WITH C−C BOND LENGTH AND BOND ANGLE. .. 19 FIGURE 2.7: PHASE TRANSITIONS TEMPERATURES OF N-TETRACOSANE: TRICLINIC TO ROTATOR PHASE
(TRICLINIC→RV), ROTATOR TO ROTATOR PHASE (RV→RI, RI→RII), AND ROTATOR TO LIQUID PHASE (RII→MELT). REPRODUCED FROM REF 69. .......................................................................................... 20
FIGURE 2.8: SCHEMATIC VIEW OF THE LAMELLAR ARRANGEMENT. THE MOLECULE LONG CHAINS ARE ORIENTED NORMAL TO THE LAYERS WHICH HAVE AN AB LAYER STACKING SEQUENCE. .................... 20
FIGURE 2.9: UNIT CELL OF TRICLINIC N-TETRACOSANE, VISUALIZED WITH MERCURY 3.1 BASED ON CSD DEPOSITION NUMBER ZZOFC0472. CARBON ATOMS ARE GRAY AND HYDROGEN ATOMS ARE NOT SHOWN. .......................................................................................................................................... 21
TABLE 2.1: ANODIZATION AND WIDENED PARAMETERS FOR AAO 20/25, 35 AND 60 NM. .................. 15 TABLE 2.2: ANODIZATION AND WIDENED PARAMETERS FOR AAO 100, 180 AND 400 NM................... 15 TABLE 2.3: TEXTURAL PROPERTIES OF CPG MEMBRANES. .................................................................. 16 TABLE 2.4: UNIT CELL PARAMETER OF N-TETRACOSANE. .................................................................... 21
FIGURE 3.1: SEM IMAGE OF AAO 60 NM ODPA-MODIFIED. ................................................................ 22 FIGURE 3.2: TEMPERATURE CONTROLLED FURNACES (1) WITH COOLING SYSTEM (2) AND ARGON OR
VACUUM SUPPLY (3), INFILTRATION OF THE AAO MEMBRANES INSIDE THE FURNACE (4). ................ 23 FIGURE 3.3: ETCHING OF THE ALUMINUM SUBSTRATE WITH STIRRER (1) AND SAMPLE HOLDER IN AN ICE
BATH (2). .......................................................................................................................................... 24 FIGURE 3.4: TEMPERATURE PROGRAM OF THE COOLING RATES; (A) THE INFILTRATED ACETAMINOPHEN
WAS COOLED (A) IN THE PRESENCE OR (B) IN THE ABSENCE OF A BULK SURFACE RESERVOIR. SF STANDS FOR BULK SURFACE MATERIAL. ............................................................................................. 25
FIGURE 3.5: BRAGG REFLECTIONS FROM PARTICULAR FAMILY OF LATTICE PLANES WHERE INCIDENT BEAM
AND DIFFRACTED BEAM ENCLOSE AN ANGLE OF θ. ............................................................................. 28
10 List of Figures and Tables
145
FIGURE 3.6: THE EWALD SPHERE IN RECIPROCAL SPACE WITH DIFFRACTION VECTOR CONE AND ONE
DEBYE RING BELONGING TO A FIXED θ ANGLE. .................................................................................. 31 FIGURE 3.7: X-RAY DIFFRACTION GEOMETRY IN REAL SPACE AND TRANSFER INTO THE RECIPROCAL
SPACE. .......................................................................................................................................... 32 FIGURE 3.8: PANALYTICAL X’PERT PRO MRD WITH INCIDENT BEAM OPTICS (1), ANTON PAAR HOT-
STAGE DHS 1100 (2) AND DIFFRACTED BEAM OPTICS (3). .................................................................. 33 FIGURE 3.9: GEOMETRY USED FOR X-RAY DIFFRACTION STUDIES IN REAL SPACE. THE SAMPLE IS
PLACED IN SUCH A WAY THAT THE SURFACE IS ORIENTED NORMAL TO THE PLANE CORRESPONDING TO
THE INCIDENT X-RAY BEAM AND THE DIFFRACTED BEAM. THE DOTTED LINE IS THE TILT AXIS (θ AXIS)
IN θ/2θ SCANS. FOR SCHULZ SCANS THE SAMPLE IS ROTATED AROUND THE ψ AXIS (SOLID LINE). ON
THE RIGHT, A DEBYE RING BELONGING TO A FIXED θ ANGLE IS INDICATED. REPRODUCED FROM REF
87. .......................................................................................................................................... 33 FIGURE 3.10: SCHULZ SCAN OF A TEXTURED SAMPLE IN THE RECIPROCAL SPACE; DEBYE RINGS WITH
ANISOTROPIC DENSITY DISTRIBUTIONS. FOR SCHULZ SCANS THE SAMPLE IS ROTATED AROUND THE ψ
AXIS WHICH IS ORIENTED NORMAL TO THE EQUATOR AND MERIDIAN. THETA AND 2THETA ANGLES ARE FIXED. .......................................................................................................................................... 34
FIGURE 3.11: POWER COMPENSATED DSC 8500 PERKIN ELMER (1) WITH COOLING DEVICE (2) AND UNIVERSAL CRIMPER PRESS (3). .......................................................................................................... 37
FIGURE 3.12: DSC HEATING CURVE (10 K/MIN) OF BULK ACETAMINOPHEN FORM II. ............................ 38
TABLE 3.1: ACETAMINOPHEN SOLIDIFIED IN AAO AND CPG MEMBRANES, INFILTRATION PARAMETER, COOLING RATES, CONNECTION TO A BULK SURFACE FILM AND CHAPTER NUMBER. ............................ 26
TABLE 3.2: N-TETRACOSANE SOLIDIFIED IN AAO AND CPG MEMBRANES, INFILTRATION PARAMETER, COOLING RATES, CONNECTION TO A BULK SURFACE FILM AND SAMPLES NAMES. ............................... 27
FIGURE 4.1: THERMO GRAVIMETRIC ANALYSIS OF AAO 25 NM, ALUMINUM SUBSTRATE IS REMOVED; (A) ANNEALED AT 400 °C FOR 2 H UNDER VACUUM, (B) ANNEALED AT 400°C FOR 2 H UNDER VACUUM AND WATER STORAGE FOR 1 H, (C) ANNEALED AT 180 °C FOR 2 H UNDER VACUUM, (D) ANNEALED AT 180 °C FOR 2 H UNDER VACUUM AND WATER STORAGE FOR 1 H. ....................................................... 41
FIGURE 4.2: PEAK-TO-PEAK AMPLITUDES OF EPR LINE AT ~ 3450G (CORRECTED FOR SAMPLE MASSES, AMPLITUDE/MG, ERROR ± 2.5%); (A) AAO MEMBRANES PORE SIZES RANGING FROM 20−180 NM, REMOVAL OF THE AAO ALUMINUM SUBSTRATE, (B) SHOWED A ZOOMED RANGE. ............................. 44
FIGURE 4.3: EPR SPECTRA OF 35 NM AAO SURFACE-MODIFIED WITH ODPA (SAMPLE 12). ................ 45
TABLE 4.1: AAO MEMBRANES FOR EPR MEASUREMENTS .................................................................. 43
FIGURE 5.1: ACETAMINOPHEN IN 60 NM AAO PREPARED AT WETTING TEMPERATURE OF 175 °C FOR 30 MIN, QUENCHED IN THE PRESENCE OF A BULK SURFACE FILM AND REMOVAL OF THE BULK SURFACE
RESERVOIR. (A) θ/2θ SCAN, (B) SCHULZ SCAN, (C) FIRST DSC HEATING SCAN (10 K/MIN). THE
DOTTED RED LINE CORRESPONDS TO THE BULK MELTING POINT OF ACETAMINOPHEN FORM I. ........... 48 FIGURE 5.2: ACETAMINOPHEN IN 60 NM AAO PREPARED AT WETTING TEMPERATURE OF 175 °C FOR
30 MIN, COOLED AT −0.5 K/MIN IN THE PRESENCE OF A BULK SURFACE FILM; (A) θ/2θ SCAN TAKEN IN
THE PRESENCE OF A BULK SURFACE FILM DIRECTLY AFTER NON-ISOTHERMAL CRYSTALLIZATION, (B)
θ/2θ SCAN AFTER REMOVAL OF THE BULK SURFACE FILM (C) SCHULZ SCAN, (D) FIRST DSC HEATING
10 List of Figures and Tables
146
SCAN (10 K/MIN). THE DOTTED LINE CORRESPONDS TO THE BULK MELTING POINT OF ACETAMINOPHEN FORM II. ................................................................................................................. 50
FIGURE 5.3: ACETAMINOPHEN IN 60 NM AAO COOLED AT A RATE OF −0.5 K/MIN IN THE PRESENCE OF
A BULK SURFACE FILM (SF). (A) θ/2θ SCAN TAKEN IN THE PRESENCE OF A BULK SURFACE FILM
DIRECTLY AFTER NON-ISOTHERMAL CRYSTALLIZATION, (B) θ/2θ SCANS AFTER REMOVAL OF THE
BULK SURFACE FILM, (C) θ/2θ SCAN AFTER REMOVAL OF THE BULK SURFACE FILM AND ANNEALING
AT 135 °C FOR 2 H. ............................................................................................................................. 52 FIGURE 5.4: ACETAMINOPHEN IN 60 NM AAO PREPARED AT WETTING TEMPERATURE OF 175 °C FOR
30 MIN, QUENCHED WITHOUT CONTACT TO BULK SURFACE RESERVOIR (A) θ/2θ SCAN, (B) FIRST DSC
HEATING SCAN (10 K/MIN). (C) θ/2θ SCAN AND (D) SCHULZ SCAN OF THE SAMPLE STORED 9 MONTH
UNDER AMBIENT CONDITIONS. ............................................................................................................ 54 FIGURE 5.5: θ/2θ TEMPERATURE-DEPENDENT SCANS OF AMORPHOUS ACETAMINOPHEN IN 60 NM AAO,
MOUNTED IN THE XRD DEVICE. ......................................................................................................... 55 FIGURE 5.6: ACETAMINOPHEN IN 60 NM AAO COLD CRYSTALLIZED AT 90 °C FOR 4 DAYS IN THE
ABSENCE OF A BULK SURFACE RESERVOIR. NOTE THE Y-AXIS IS LOGARITHMIC. ................................ 56 FIGURE 5.7: ACETAMINOPHEN IN 60 NM AAO COLD CRYSTALLIZED AT 80 °C FOR 2 H IN THE PRESENCE
OF A BULK SURFACE FILM, REMOVAL OF THE BULK SURFACE MATERIAL, AND ANNEALING AT 135 °C
FOR 2 H; (A) θ/2θ SCAN, (B) SCHULZ SCAN, (C) FIRST DSC HEATING SCAN (10 K/MIN). ..................... 57 FIGURE 5.8: ACETAMINOPHEN IN 60 NM CPG PREPARED AT WETTING TEMPERATURE OF 180 °C FOR
2 MIN; (A) QUENCHED IN THE PRESENCE OF A BULK SURFACE FILM, REMOVAL OF THE LATTER, (B) QUENCHED IN THE ABSENCE OF A BULK SURFACE FILM, (C) DSC FIRST HEATING SCAN (10 K/MIN) OF SAMPLE A, (D) DSC FIRST HEATING SCAN (10 K/MIN) OF SAMPLE B. NOTE THE BROAD HALO
ORIGINATED BY THE POROUS GLASS MATRIX IS SUBTRACTED. ............................................................ 58 FIGURE 5.9: θ/2θ SCANS OF ACETAMINOPHEN IN 60 NM CPG PREPARED AT WETTING TEMPERATURE OF
180 °C FOR 2 MIN; (A) AND (B) COOLED AT −0.5 K/MIN IN THE PRESENCE OF A BULK SURFACE FILM, (C) AND (D) COOLED AT −0.5 K/MIN IN THE ABSENCE OF A BULK SURFACE FILM. ............................... 59
FIGURE 5.10: θ/2θ SCANS OF ACETAMINOPHEN FORM II IN AAO 25−400 NM PREPARED AT WETTING
TEMPERATURE OF 175 °C FOR 30 MIN, COOLED AT −0.5 K/MIN IN THE PRESENCE OF A BULK SURFACE FILM. BEFORE WAXS MEASUREMENTS THE BULK SURFACE FILM WAS REMOVED. ............................. 60
FIGURE 5.11: θ/2θ SCANS OF ACETAMINOPHEN FORM III IN AAO 25−400 NM PREPARED AT WETTING
TEMPERATURE 175 °C FOR 30 MIN, COOLED AT −0.5 K/MIN IN THE PRESENCE OF A BULK SURFACE FILM. BEFORE WAXS MEASUREMENTS THE BULK SURFACE FILM IS REMOVED. ................................. 61
FIGURE 5.12: SCHULZ SCANS OF ACETAMINOPHEN FORM III IN AAO 100 NM, 60 NM, AND 25 NM PREPARED AT WETTING TEMPERATURE OF 175 °C FOR 30 MIN, COOLED AT −0.5 K/MIN IN THE
PRESENCE OF A BULK SURFACE RESERVOIR. ....................................................................................... 62 FIGURE 5.13: SCHULZ SCANS OF ACETAMINOPHEN FORM III IN 400 NM AAO PREPARED AT WETTING
TEMPERATURE OF 175 °C FOR 30 MIN, COOLED AT −0.5 K/MIN IN THE PRESENCE OF A BULK SURFACE RESERVOIR. ........................................................................................................................................ 63
FIGURE 5.14: ACETAMINOPHEN IN 25 NM AAO PREPARED AT WETTING TEMPERATURE OF 175 °C FOR
30 MIN, COOLED AT −0.5 K/MIN IN THE PRESENCE OF A BULK SURFACE RESERVOIR, REMOVAL OF THE
LATTER. (A) θ/2θ SCANS OF FORM II AND III, (B) SCHULZ SCANS OF FORM II, (C) SCHULZ SCANS OF
FORM III. .......................................................................................................................................... 64 FIGURE 5.15: CASE A: θ/2θ SCANS OF ACETAMINOPHEN IN AAO 25−400 NM COLD CRYSTALLIZED AT
80 °C FOR 2 H IN THE PRESENCE OF A BULK SURFACE RESERVOIR, MEASURED AFTER REMOVAL OF THE BULK SURFACE MATERIAL. ................................................................................................................. 65
FIGURE 5.16: SCHULZ SCANS OF ACETAMINOPHEN IN AAO MEMBRANES COLD CRYSTALLIZED AT 80 °C FOR 2 H IN THE PRESENCE OF A BULK SURFACE RESERVOIR, MEASURED AFTER REMOVAL OF THE BULK
SURFACE MATERIAL. ........................................................................................................................... 66 FIGURE 5.17: ACETAMINOPHEN IN AAO COLD CRYSTALLIZED AT 80°C FOR 2 H IN THE PRESENCE (CASE
A) OR IN THE ABSENCE (CASE B) OF A BULK SURFACE RESERVOIR. .................................................... 68
10 List of Figures and Tables
147
FIGURE 5.18: ACETAMINOPHEN IN 60 NM AAO. .................................................................................... 68 FIGURE 5.19: ACETAMINOPHEN FORM II (0K0) LATTICE PLANES ORIENTED NORMAL TO THE AAO PORE
AXIS, VISUALIZED WITH MERCURY 3.1. OXYGEN ATOMS ARE RED, NITROGEN ATOMS ARE BLUE, CARBON ATOMS ARE GREY, HYDROGEN ATOMS ARE NOT SHOWN. ...................................................... 69
FIGURE 5.20: SCHEMATIC VIEW OF ACETAMINOPHEN FORM III/FORM II FAST-GROWTH DIRECTION ALIGNED WITH THE AAO PORE AXIS. ................................................................................................. 71
FIGURE 5.21: ACETAMINOPHEN IN 60 NM CPG. ..................................................................................... 75 FIGURE 5.22: THE PORE MORPHOLOGY DIRECTS POLYMORPH FORMATION AND INFLUENCES THE
KINETICS OF THE SOLID/SOLID TRANSITION OF ACETAMINOPHEN. ...................................................... 76
TABLE 5.1: θ/2θ PEAKS OF ACETAMINOPHEN FORM I WITH THE CORRESPONDING (HKL)-VALUES TAKEN
FROM REF 61. ...................................................................................................................................... 48 TABLE 5.2: θ/2θ PEAKS OF ACETAMINOPHEN FORM II WITH THE CORRESPONDING (HKL)-VALUES
TAKEN FROM REF 63. .......................................................................................................................... 50 TABLE 5.3: HERMANS’ ORDER PARAMETER FOR ACETAMINOPHEN IN AAO MEMBRANES NON-
ISOTHERMAL AND COLD CRYSTALLIZED. ............................................................................................ 67 TABLE 5.4: ACETAMINOPHEN IN 25 AND 60 NM AAO COOLED AT −0.5 K/MIN IN THE PRESENCE OF A
BULK SURFACE RESERVOIR. ................................................................................................................ 74 TABLE 5.5: ESTIMATED SINGLE PORE VOLUME, PORE AREA, AND SURFACE-TO-VOLUME RATIO OF
CYLINDRICAL AAO PORES. ................................................................................................................ 74
FIGURE 6.1: SCHEMATIC VIEW OF DISSOLUTION TEST CONDITIONS....................................................... 78 FIGURE 6.2: DISSOLUTION TESTING; (A) ACETAMINOPHEN FORM I, FORM II, AND AMORPHOUS FORM
EMBEDDED IN AAO 60 NM. EACH DATA POINT REPRESENTS THE MEAN OF SIX DETERMINATIONS ±
STANDARD DEVIATIONS. (B) THE INSET SHOWED A ZOOMED TEMPERATURE RANGE........................... 79 FIGURE 6.3: DISSOLUTION TESTING OF ACETAMINOPHEN FORM II (A) FROM AAO MEMBRANES
25−400 NM. EACH DATA POINT REPRESENTS THE MEAN OF TWO DETERMINATIONS, EXCEPT AAO 60 NM SIX DETERMINATIONS. (B) THE INSET SHOWED A ZOOMED TEMPERATURE RANGE. .................. 81
FIGURE 6.4: ACETAMINOPHEN FORM I, FORM II AND AMORPHOUS FORM CONFINED TO AAO. RELEASE
DATA FITTED TO THE KORSMEYER-PEPPAS MODEL. ........................................................................... 83 FIGURE 6.5: SCHEMATIC VIEW OF SAMPLE PREPARATION AND DRUG RELEASE: (1) ACETAMINOPHEN
FORM II (RED) IN AAO MEMBRANES (BLACK), (2) PLLA FILM SPIN-COATED ON THE INFILTRATED AAO MEMBRANE, (3) DEGRADATION OF THE PLLA FILM AND CONTROLLED DRUG RELEASE. ........... 85
FIGURE 6.6: SEM IMAGES OF; (A) PLLA POLYMER FILM ON THE AAO MEMBRANE, (B) CROSS-SECTION
VIEW OF THE AAO MEMBRANE (BOTTOM) AND THE PLLA POLYMER FILM (TOP), (C) RESIDUES ON THE AAO MEMBRANE AFTER DISSOLUTION TEST (D) CROSS-SECTION VIEW OF THE AAO MEMBRANE (BOTTOM) AFTER DISSOLUTION TEST. ................................................................................................. 86
FIGURE 6.7: DISSOLUTION TESTING OF ACETAMINOPHEN FORM II IN 60 NM AAO (A) UNCOATED AND COATED WITH PLLA POLYMER FILM. (B) THE INSET SHOWED A ZOOMED TEMPERATURE RANGE. EACH
DATA POINT REPRESENTS THE MEAN OF FOUR(COATED)/SIX(UNCOATED) DETERMINATIONS ± STANDARD DEVIATIONS. ..................................................................................................................... 87
FIGURE 6.8: ACETAMINOPHEN FORM II IN 60 NM AAO. THE MOLECULE ARRANGEMENT IN THE ORTHORHOMBIC UNIT CELL IS VISUALIZED WITH MERCURY 3.1; (A) ORTHORHOMBIC (040) CRYSTAL FACE, (B) ORTHORHOMBIC (020) CRYSTAL FACE. ............................................................................... 89
TABLE 6.1: ACETAMINOPHEN IN 60 NM AAO, ACETAMINOPHEN MODIFICATIONS, AND MAIN LATTICE PLANES. .......................................................................................................................................... 78
10 List of Figures and Tables
148
TABLE 6.2: DRUG RELEASE AT SPECIFIC TIME INTERVALS. .................................................................. 78 TABLE 6.3: TIME TAKEN FOR 50% OF ACETAMINOPHEN RELEASE FROM 60 NM AAO. ........................ 80 TABLE 6.4: ACETAMINOPHEN FORM II/III IN AAO WITH PORE SIZES RANGING FROM 25 NM TO 400 NM.
.......................................................................................................................................... 81 TABLE 6.5: DIFFUSIONAL EXPONENT N AND REGRESSION COEFFICIENT R² FOR DRUG RELEASE OF
ACETAMINOPHEN MODIFICATIONS FROM 60 NM AAO. ....................................................................... 84 TABLE 6.6: RELEASE LAW/MODEL AND REGRESSION COEFFICIENT R² FOR THE DRUG RELEASE OF
ACETAMINOPHEN FROM 60 NM AAO COATED WITH PLLA. ............................................................... 88
FIGURE 7.1: PROGRAMMED TEMPERATURE PROFILE FOR WAXS AND SCHULZ (ψ) SCANS. ................. 93 FIGURE 7.2: θ/2θ TEMPERATURE-DEPENDENT SCANS OF BULK N-TETRACOSANE, MOLTEN AT 80 °C ON A
SILICON-WAFER, COOLED UNDER AMBIENT CONDITIONS; A) HEATING, B) COOLING. ........................ 93 FIGURE 7.3: D-VALUES OF THE (002) LAYER PEAKS FOR BULK N-TETRACOSANE. (A) HEATING (BLACK
LINE), COOLING (RED LINE), (B) SCHEMATIC VIEW OF THE LAYERED STRUCTURES WITH VALUES OF THE LAYER THICKNESS IN THE TRICLINIC AND RII ROTATOR PHASE. ................................................... 94
FIGURE 7.4: SECOND DSC SCANS (10 K/MIN) FOR BULK N-TETRACOSANE; HEATING (BLACK LINE), COOLING (BLUE LINE). ....................................................................................................................... 95
FIGURE 7.5: SUMMARY OF PHASE TRANSITIONS DURING HEATING AND COOLING OF BULK N-TETRACOSANE. ................................................................................................................................... 96
FIGURE 7.6: θ/2θ TEMPERATURE-DEPENDENT HEATING SCANS OF N-TETRACOSANE IN AAO COOLED AT
−0.5 K/MIN IN THE PRESENCE OF A BULK SURFACE FILM, REMOVAL OF THE BULK SURFACE FILM; A) AAO 60 NM, B) AAO 25 NM, C) AAO 60 NM ODPA-MODIFIED. THE SECOND AND THE THIRD ROWS
SHOW ZOOMED FIGURES. .................................................................................................................... 97 FIGURE 7.7: θ/2θ TEMPERATURE-DEPENDENT COOLING SCANS OF N-TETRACOSANE IN AAO COOLED AT
−0.5 K/MIN IN THE PRESENCE OF A BULK SURFACE FILM, REMOVAL OF THE BULK SURFACE FILM; A) AAO 60 NM, B) AAO 25 NM, C) AAO 60 NM ODPA-MODIFIED. THE SECOND ROW SHOWS ZOOMED
FIGURES. .......................................................................................................................................... 98 FIGURE 7.8: TEMPERATURE-DEPENDENT INTEGRATED AREA AS FUNCTION OF THE REFLECTIONS (A) AT
2θ = 23.3°, (B) AT 2θ = 36.0° FOR 60 NM AAO (CORRESPONDING TO CASE A IN FIGURE 7.6). PHASE
TRANSITIONS ARE INDICATED BY DOTTED LINES. ................................................................................ 99 FIGURE 7.9: TEXTURE ANALYSIS OF N-TETRACOSANE IN 60 NM AAO (CORRESPONDING TO CASE A IN
FIGURE 7.6) PREPARED BY CRYSTALLIZATION WITH BULK SURFACE FILM MEASURED AT THE FIXED
ANGLE OF 36.0°, (A) ψ SCANS, (B) HERMANS’ ORDER PARAMETER F 91. ........................................... 100 FIGURE 7.10: TEXTURE ANALYSIS OF N-TETRACOSANE IN 60 NM AAO (CASE A IN FIGURE 7.6)
PREPARED BY CRYSTALLIZATION WITH BULK SURFACE FILM MEASURED AT THE FIXED ANGLE, (A) OF
21.4° ψ SCANS, (B) 21.4° TEMPERATURE-DEPENDENT AREA OF THE ψ SCANS, (C) OF 23.4° ψ SCANS, (D) 23.4° TEMPERATURE-DEPENDENT AREA OF THE ψ SCANS. THE THEORETICAL ANGLE BETWEEN (-111) AND (013) LATTICE PLANES IS INDICATED WITH A DOTTED LINE. .............................................. 101
FIGURE 7.11: N-TETRACOSANE IN 25 NM AAO COOLED AT −0.5 K/MIN IN THE PRESENCE OF A BULK
SURFACE RESERVOIR, REMOVAL OF THE BULK SURFACE FILM; (A) θ/2θ TEMPERATURE-DEPENDENT
HEATING SCANS, PHASE TRANSITIONS ARE ORDERED FOR INCREASING TEMPERATURES. (B)
TEMPERATURE-DEPENDENT SCHULZ SCANS, 2θ = 5.84° CORRESPONDS TO THE (002) TRICLINIC
LATTICE PLANES, 2θ = 5.4° CORRESPONDS TO THE (002) ORTHORHOMBIC LATTICE PLANES. ............ 102 FIGURE 7.12: N-TETRACOSANE CONFINED TO AAO MEMBRANES; (A) D-VALUES OF (002) LAYER PEAKS
FOR ─■─ BULK N-TETRACOSANE, ─■─ AAO 60 NM, ─●─ AAO 25 NM, ─▲─ AAO 60 NM ODPA-MODIFIED. (B) SCHEMATIC VIEW OF THE LAYERED STRUCTURES FOR BULK MATERIAL AND N-TETRACOSANE IN AAO MEMBRANES WHERE LAMELLAR LAYERS ARE ORIENTED NORMAL TO THE AAO PORE AXIS. .............................................................................................................................. 103
10 List of Figures and Tables
149
FIGURE 7.13: θ/2θ TEMPERATURE-DEPENDENT HEATING SCANS OF N-TETRACOSANE IN AAO COOLED AT
−0.5 K/MIN IN THE ABSENCE OF A BULK SURFACE FILM; D) AAO 60 NM, E) AAO 25 NM, F) AAO 60 NM ODPA-MODIFIED. THE SECOND ROW SHOWS ZOOMED FIGURES. ........................................... 106
FIGURE 7.14: θ/2θ TEMPERATURE-DEPENDENT COOLING SCANS OF N-TETRACOSANE IN AAO COOLED AT
−0.5 K/MIN IN THE ABSENCE OF A BULK SURFACE FILM; D) AAO 60 NM, E) AAO 25 NM, F) AAO 60 NM ODPA-MODIFIED. THE SECOND ROW SHOWS ZOOMED FIGURES. ........................................... 107
FIGURE 7.15: TEXTURE ANALYSIS OF N-TETRACOSANE IN 60 NM AAO (CASE D IN FIGURE 7.13) COOLED
AT −0.5 K/MIN IN THE ABSENCE OF A BULK SURFACE RESERVOIR; (A) MEASURED AT THE FIXED ANGLE
OF 36.0° ψ SCANS, (B) HERMANS’ ORDER PARAMETER F 91, (C) MEASURED AT THE FIXED ANGLE 19.3°
ψ SCANS, (D) TEMPERATURE-DEPENDENT AREA OF THE ψ SCANS. .................................................... 108 FIGURE 7.16: θ/2θ TEMPERATURE-DEPENDENT HEATING SCANS OF N-TETRACOSANE IN; G) CPG 60 NM,
H) CPG 25 NM, I) CPG 2 NM AND COOLED AT −0.5 K/MIN IN THE PRESENCE OF A BULK SURFACE RESERVOIR. J) CPG 60 NM, K) CPG 25 NM, L) CPG 2 NM AND COOLED AT −0.5 K/MIN IN THE ABSENCE OF A BULK SURFACE RESERVOIR. NOTE THE AMORPHOUS HALO THAT CAN BE SEEN AROUND
2θ = 22° IS ORIGINATING FROM THE CPG MATRIX. N-TETRACOSANE IN 2 NM CPG REVEALED NO
REFLECTIONS. ................................................................................................................................... 110 FIGURE 7.17: θ/2θ TEMPERATURE-DEPENDENT COOLING SCANS OF N-TETRACOSANE IN; G) CPG 60 NM,
H) CPG 25 NM, I) CPG 2 NM AND COOLED AT −0.5 K/MIN IN THE PRESENCE OF A BULK SURFACE RESERVOIR. J) CPG 60 NM, K) CPG 25 NM, L) CPG 2 NM AND COOLED AT −0.5 K/MIN IN THE ABSENCE OF A BULK SURFACE RESERVOIR. ....................................................................................... 111
FIGURE 7.18: N-TETRACOSANE IN 25 NM CPG CORRESPONDING TO SAMPLE H COOLED AT −0.5 K/MIN IN
THE PRESENCE OF A BULK SURFACE RESERVOIR; (A) θ/2θ SCANS, (B) D-VALUES AND SCHEMATIC VIEW
OF THE LAMELLAR LAYERS. .............................................................................................................. 112 FIGURE 7.19: FIRST DSC SCANS (10 K/MIN) OF N-TETRACOSANE IN; (A) AAO 60 NM, (B) AAO 25 NM,
(C) AAO 60 NM ODPA-MODIFIED AND CRYSTALLIZED AT A COOLING RATE OF −0.5 K/MIN IN THE PRESENCE OF A BULK SURFACE RESERVOIR, (D) AAO 60 NM, (E) AAO 25 NM, (F) AAO 60 NM ODPA-MODIFIED AND CRYSTALLIZED AT A COOLING RATE OF −0.5 K/MIN IN THE ABSENCE OF A BULK SURFACE RESERVOIR. HEATING SCAN (BLACK LINE), COOLING SCAN (BLUE LINE). .......................... 113
FIGURE 7.20: FIRST DSC SCANS (10 K/MIN) OF N-TETRACOSANE IN; (A) CPG 25 NM, (B) CPG 2 NM AND NON-ISOTHERMALLY CRYSTALLIZED AT A COOLING RATE OF −0.5 K/MIN IN THE PRESENCE OF A BULK SURFACE RESERVOIR, (C) CPG 25 NM, (D) CPG 2 NM AND NON-ISOTHERMALLY CRYSTALLIZED AT A
COOLING RATE OF −0.5 K/MIN IN THE ABSENCE OF A BULK SURFACE RESERVOIR. HEATING SCAN (BLACK LINE), COOLING SCAN (BLUE LINE). ..................................................................................... 115
FIGURE 7.21: LONG-TIME STORAGE OF N-TETRACOSANE IN 60 NM AAO MEMBRANES COOLED AT −0.5 K/MIN; A) IN THE PRESENCE OF A BULK SURFACE RESERVOIR, B) IN THE ABSENCE OF A BULK SURFACE RESERVOIR. NOTE FOR BETTER VISUALIZATION THE Y AXIS IS LOGARITHMIC. ................... 116
FIGURE 7.22: THE TRICLINIC UNIT CELL OF N-TETRACOSANE IN AAO MEMBRANES. THE (-111) LATTICE PLANES ARE ORIENTED NORMAL TO THE PORE AXIS, THE (002) LATTICE PLANES ARE ORIENTED PARALLEL TO THE AAO PORE AXIS. THE UNIT CELL IS VISUALIZED WITH MERCURY 3.1 BASED ON CSD ZZZOF0472. CARBON ATOMS ARE GREY AND HYDROGEN ATOMS ARE NOT SHOWN................. 118
FIGURE 7.23: N-TETRACOSANE IN AAO COOLED AT −0.5 K/MIN IN THE PRESENCE OF A BULK SURFACE
RESERVOIR. MEASURED AREAS OF THE PEAKS AT 2θ = 36.0° (RED DOTTED LINE) AND 2θ = 23.3°
(BLACK SOLID LINE) AS FUNCTIONS OF THE TEMPERATURE T. A) AAO 60 NM, B) AAO 25 NM, C) AAO 60 NM ODPA-MODIFIED. ........................................................................................................ 120
FIGURE 7.24: N-TETRACOSANE IN AAO COOLED AT −0.5 K/MIN IN THE ABSENCE OF A BULK SURFACE
RESERVOIR. MEASURED AREAS OF THE PEAKS AT 2θ = 36.0° (RED DOTTED LINE) AND 2θ = 21.4°
(BLACK SOLID LINE) AS FUNCTIONS OF THE TEMPERATURE T. A) AAO 60 NM, B) AAO 25 NM, C) AAO 60 NM ODPA-MODIFIED. THE SECOND ROW SHOWS A ZOOMED FIGURE. ................................ 121
FIGURE 7.25: CALCULATED HERMANS’ ORDER PARAMETERS F FOR THE 2θ = 36.0° REFLECTION OF N-TETRACOSANE IN AAO COOLED AT −0.5 K/MIN; (A) IN THE PRESENCE OF A BULK SURFACE
10 List of Figures and Tables
150
RESERVOIR, (B) IN THE ABSENCE OF A BULK SURFACE RESERVOIR. ─□─ AAO 60 NM, ─○─ AAO 25 NM; ─▲─ AAO 60 NM ODPA-MODIFIED. .................................................................................. 122
FIGURE 7.26: SCHEMATIC VIEW OF THE TWO REGIME MODEL OF N-TETRACOSANE IN AAO CRYSTALLIZED IN THE PRESENCE OF A BULK SURFACE RESERVOIR. (A) LAMELLAE (BLACK BARS) ARE ORIENTED
NORMAL TO THE AAO PORE AXIS CLOSE TO AAO PORE WALLS AND ARE ORIENTED PARALLEL TO THE PORE AXIS FAR FROM AAO PORE WALLS. (B) LAMELLAE (BLACK BARS) ARE ORIENTED NORMAL TO THE AAO PORE AXIS CLOSE TO AAO PORE WALLS AND NO LAYERED STRUCTURES IN THE AAO PORES. .............................................................................................................................................. 124
FIGURE 7.27: A SCHEMATIC VIEW OF LAMELLAR LAYERS IN 25 NM AAO WHERE AT 25 °C LAMELLAR
LAYERS NEARLY ORIENTED PARALLEL TO THE AAO PORE AXIS AND AT 44 °C LAMELLAR LAYERS ORIENTED NORMAL TO THE AAO PORE AXIS. ................................................................................... 125
FIGURE 7.28: SUMMARY OF PHASE TRANSITIONS OF N-TETRACOSANE IN 60 NM AAO CRYSTALLIZED IN THE PRESENCE OF A BULK SURFACE RESERVOIR. NOTE THE X-RAY MEASUREMENTS ENDS UP TO 46°C. ........................................................................................................................................ 127
TABLE 7.1: PHASE TRANSITION TEMPERATURES OF N-TETRACOSANE IN AAO MEMBRANES MEASURED WITH FIRST DSC HEATING SCANS. .................................................................................................... 126
FIGURE 8.1: SCHEMATIC VIEW OF MESOSCOPIC CRYSTAL ENGINEERING. ............................................ 133
11 Abbreviations and Symbols
151
11 Abbreviations and Symbols
11.1 Abbreviations
a, b, c Unit cell parameters, Lengths
a*, b*, c* Reciprocal lattice vector
A, a Surface area, pre-Exponential factor, Concentration
AAO Anodic Aluminum Oxide
ACE Acetaminophen
APAs Alkylphosphonic acids
Ao, At Infiltrated material at t = 0, Released material at time t
B0 Magnetic field
C Center of the Ewald sphere
CC Cold Crystallization
Ch. Chapter
Cm Molar heat capacity
Cp/Cv Heat capacity at constant pressure/at constant volume
CPG Controlled Porous Glasses
CSD Cambridge Structural Database
d Thickness
dhkl d-Spacing
DP, d Pore diameter/size, Distance
11 Abbreviations and Symbols
152
DSC Differential Scanning Calorimetry
E Attachment energy
e.g., For example Lat.: exempli grata
etc. More of the same type Lat.: etcetera
et al. And others Lat.: et alii
EPR Electron Paramagnetic Resonance
f Hermans’ order parameter
FWHM Full Width at Half Maximum
G Gibbs free energy
ge g-Value of a radical
H Enthalpy
h Plank constant
HHKL Reciprocal lattice vector
I Intensity
i.e., That is Lat.: id est
in vivo ‘within the living’
in vitro ‘in glass’
K Crystallite shape factor
k, kB Constant, Boltzmann’s constant
Mn Number Average Molecular Weight
Mw Weight Average Molecular Weight
n Integer number, Diffusional exponent
11 Abbreviations and Symbols
153
O Origin of the reciprocal lattice
ODPA Octadecylphosphonic acid
P Electrical power, Pressure, Reciprocal point
PBS Phosphate buffered saline (137 mM NaCl, 2.7 mM KCl, 10 mM
Na2HPO4, 2 mM KH2PO4, pH 7.4−7.6)
PLLA Poly(L)-Lactide
Q Heat transfer
R Rotator phases, Molar gas constant
r, r* Radius, Critical radius
S Entropy, Spreading parameter, Scattering vector
so, s Unit vectors
SEM Scanning Electron Microscopy
T Temperature
t Time
TGA Thermo Gravimetric Analysis
Tm Melting temperature
TP Pore depth
U Internal energy
V Volume
WAXS Wide Angle X-ray Scattering
XRD X-ray Diffraction
2D Two-Dimensional
11 Abbreviations and Symbols
154
(hkl) Notation for a single plane
{hkl} Set of planes
11.2 Symbols
Å Angstrom 1 Å = 0.1 nm
α, β, γ Unit cell parameters, angles
γ Surface, Interfacial tension, Activity coefficient
θ Contact angle, Bragg/scattering angle
λ Wavelength
µB Bohr magneton
ρ Density
ψ Tilting angle
Acknowledgements
155
Acknowledgements / Danksagung
Die vorliegende Arbeit entstand von Dezember 2010 bis Oktober 2014 in der
Arbeitsgruppe von Prof. Dr. Steinhart am Institut für Chemie neuer Materialien,
Abteilung Physikalische Chemie, der Universität Osnabrück.
Bei Herrn Prof. Dr. Martin Steinhart möchte ich mich für die interessante
Themenstellung, die gute Betreuung sowie für die Bereitstellung der Arbeitsmittel
bedanken.
Mein besonderer Dank gilt Herrn Prof. Dr. Mario Beiner und Frau M. Sc. Nicole
Sonnenberger von der Martin-Luther-Universität Halle-Wittenberg sowie Prof. Dr. Dirk
Enke und Frau Dipl.-Chem. Nicole Anders von der Universität Leipzig. In vielen
Projekttreffen zur Kristallisation polymorpher Arzneimittel in Nanoporen kam es zu
interessanten Diskussionen, die das schwierige Thema immer ein Stück weiter voran
gebracht haben. Herrn Prof. Dr. Mario Beiner danke ich für die Übernahme des
Zweitgutachtens.
Ich möchte mich recht herzlich bei allen Mitarbeitern der Arbeitsgruppe Physikalische
Chemie bedanken. Insbesondere bei Frau Brigitte Hartmann-Azanza für die
Unterstützung bei den Röntgenmessungen sowie bei Frau Claudia Hess für die
Aufnahme der REM-Bilder. Für die immer verfügbare benötigte Anzahl von AAO
Membranen danke ich Herrn Heinrich Tobergte und Frau Claudia Hess. Ebenso danken
möchte ich Frau Barbara Gunkel für die Bearbeitung der Reiseanträge und sonstiger
organisatorischer ‚Probleme‘. Frau M. Sc. Wajiha Akram und Frau M. Sc. Anna Volf-
Eichler möchte ich für die aufmunterten Bürogespräche danken.
Dank an Frau Kerstin Rücker im Arbeitskreis Anorganische Chemie für die TGA
Messungen. Bei Herrn Dr. Johann Klare vom Fachbereich Physik möchte ich mich
ebenfalls für die EPR Messungen bedanken.
Der größte Dank gebührt meiner Familie und Freunden. Ohne deren Unterstützung und
steten Zuspruch wären mein Studium und diese Arbeit nicht zustande gekommen. Dabei
Acknowledgements
156
möchte ich besonders Frau Brit Kockisch hervorheben und mich für das geduldige
Zuhören aber auch für das gemeinsame Lachen bedanken.
Herrn Dr. Dietrich Steinmeier und Frau Brigitte Hartmann-Azanza möchte ich
herzlichst für das Gegenlesen danken.
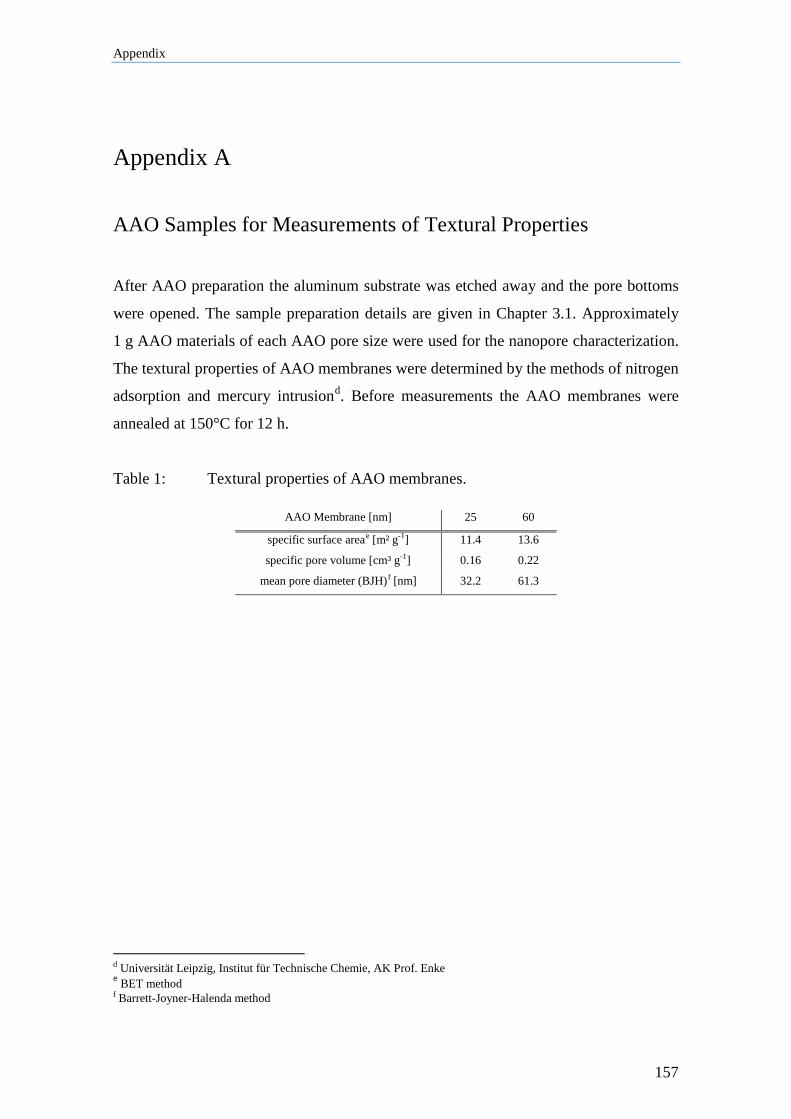
Appendix
157
Appendix A
AAO Samples for Measurements of Textural Properties
After AAO preparation the aluminum substrate was etched away and the pore bottoms
were opened. The sample preparation details are given in Chapter 3.1. Approximately
1 g AAO materials of each AAO pore size were used for the nanopore characterization.
The textural properties of AAO membranes were determined by the methods of nitrogen
adsorption and mercury intrusiond. Before measurements the AAO membranes were
annealed at 150°C for 12 h.
Table 1: Textural properties of AAO membranes.
AAO Membrane [nm] 25 60
specific surface areae [m² g-1] 11.4 13.6
specific pore volume [cm³ g-1] 0.16 0.22
mean pore diameter (BJH)f [nm] 32.2 61.3
d Universität Leipzig, Institut für Technische Chemie, AK Prof. Enke e BET method f Barrett-Joyner-Halenda method
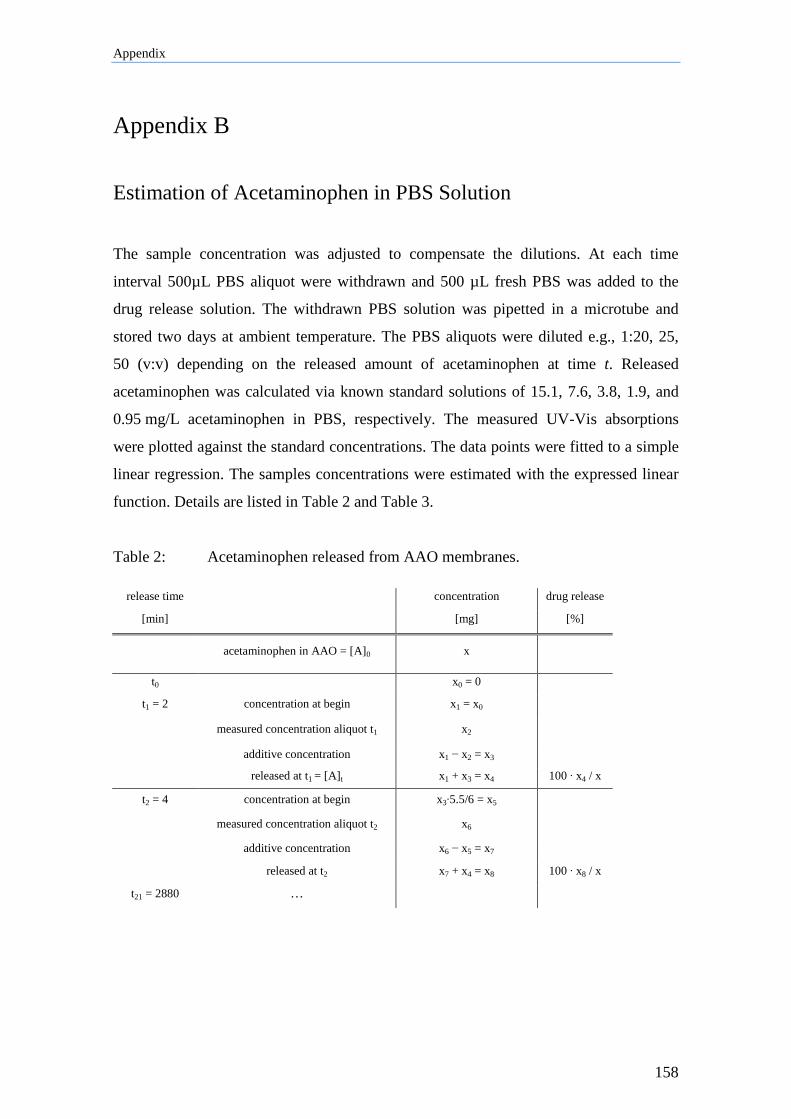
Appendix
158
Appendix B
Estimation of Acetaminophen in PBS Solution
The sample concentration was adjusted to compensate the dilutions. At each time
interval 500µL PBS aliquot were withdrawn and 500 µL fresh PBS was added to the
drug release solution. The withdrawn PBS solution was pipetted in a microtube and
stored two days at ambient temperature. The PBS aliquots were diluted e.g., 1:20, 25,
50 (v:v) depending on the released amount of acetaminophen at time t. Released
acetaminophen was calculated via known standard solutions of 15.1, 7.6, 3.8, 1.9, and
0.95 mg/L acetaminophen in PBS, respectively. The measured UV-Vis absorptions
were plotted against the standard concentrations. The data points were fitted to a simple
linear regression. The samples concentrations were estimated with the expressed linear
function. Details are listed in Table 2 and Table 3.
Table 2: Acetaminophen released from AAO membranes.
release time
concentration drug release
[min]
[mg] [%]
acetaminophen in AAO = [A]0 x
t0 x0 = 0
t1 = 2 concentration at begin x1 = x0
measured concentration aliquot t1 x2
additive concentration x1 − x2 = x3
released at t1 = [A]t x1 + x3 = x4 100 ∙ x4 / x
t2 = 4 concentration at begin x3∙5.5/6 = x5
measured concentration aliquot t2 x6
additive concentration x6 − x5 = x7
released at t2 x7 + x4 = x8 100 ∙ x8 / x
t21 = 2880 …
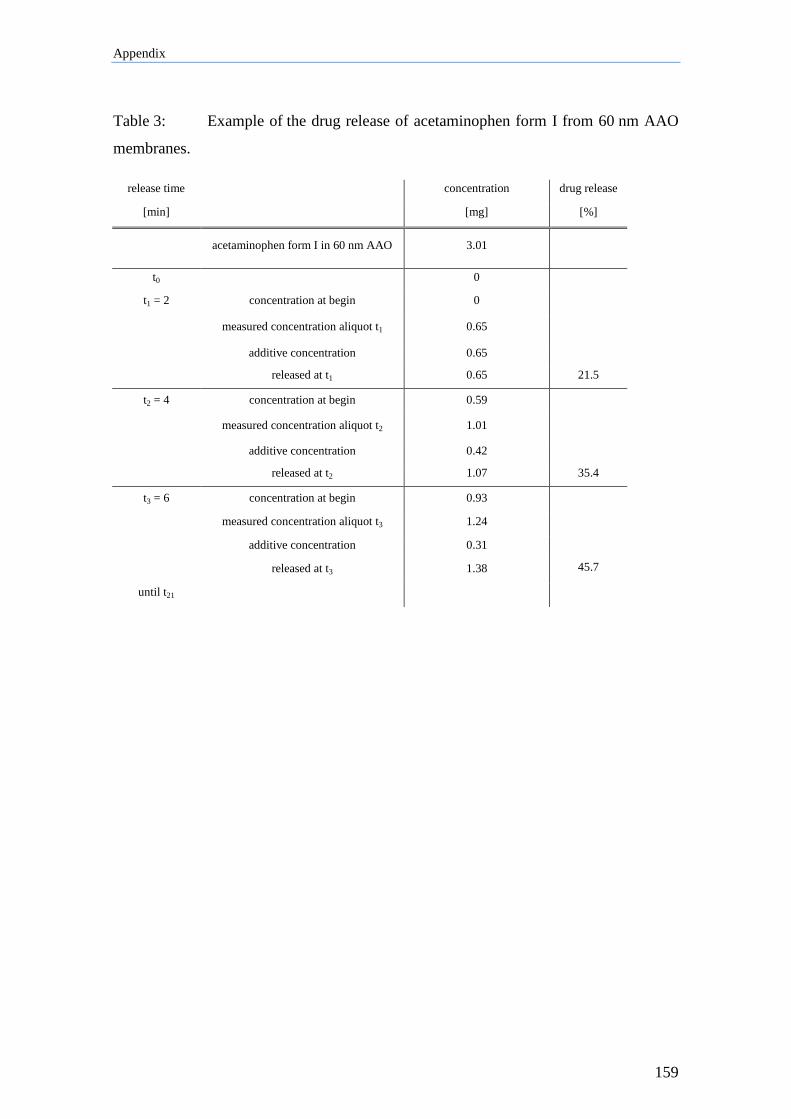
Appendix
159
Table 3: Example of the drug release of acetaminophen form I from 60 nm AAO
membranes.
release time
concentration drug release
[min]
[mg] [%]
acetaminophen form I in 60 nm AAO 3.01
t0 0
t1 = 2 concentration at begin 0
measured concentration aliquot t1 0.65
additive concentration 0.65
released at t1 0.65 21.5
t2 = 4 concentration at begin 0.59
measured concentration aliquot t2 1.01
additive concentration 0.42
released at t2 1.07 35.4
t3 = 6 concentration at begin 0.93
measured concentration aliquot t3 1.24
additive concentration 0.31
released at t3 1.38 45.7
until t21

160
161
Erklärung über die Eigenständigkeit der erbrachten
wissenschaftlichen Leistung
Ich erkläre hiermit, dass ich die vorliegende Arbeit ohne unzulässige Hilfe Dritter und
ohne Benutzung anderer als der angegebenen Hilfsmittel angefertigt habe. Die aus
anderen Quellen direkt oder indirekt übernommenen Daten und Konzepte sind unter
Angabe der Quelle gekennzeichnet.
Die Arbeit wurde bisher weder im In- noch im Ausland in gleicher oder ähnlicher Form
einer anderen Prüfungsbehörde vorgelegt.
.......................................................... ..............................................................
(Ort. Datum) (Unterschrift)