Department of Business Administration and Economics RESEARCH PAPERS
45
Department of Business Administration and Economics RESEARCH PAPERS from the Chair of Marketing R. Olbrich / T. Windbergs RESEARCH PAPER No. 4 The relationship between brand loyalty, store loyalty and performance in the retail food sector - A causal-analytical analysis using the example of premium store brands Editor Univ.-Prof. Dr. Rainer Olbrich 2006 Lehrstuhl für Betriebswirtschaftslehre, insbesondere Marketing, FernUniversität in Hagen, Universitätsstraße 11 • TGZ • 58097 Hagen / Germany http://www.fernuni-hagen.de/MARKETING/ Hagen 2006
Transcript of Department of Business Administration and Economics RESEARCH PAPERS

Department of Business Administration and Economics
RESEARCH PAPERSfrom the Chair of Marketing
R. Olbrich / T. Windbergs
RESEARCH PAPER No. 4
The relationship between brand loyalty, store loyaltyand performance in the retail food sector
- A causal-analytical analysis using the example ofpremium store brands
EditorUniv.-Prof. Dr. Rainer Olbrich
2006 Lehrstuhl für Betriebswirtschaftslehre, insbesondere Marketing, FernUniversität in Hagen,Universitätsstraße 11 • TGZ • 58097 Hagen / Germanyhttp://www.fernuni-hagen.de/MARKETING/
Hagen 2006


Table of contents
Table of figures .................................................................................................................................. III
Abstract ................................................................................................................................................ V
1. Central Concern of the Study .................................................................................................... 7
2. Framework, Theoretical Background and Constructs ........................................................... 9
2.1. Framework and Theoretical Background ............................................................................ 9
2.2. Constructs .......................................................................................................................... 13
2.2.1. Operationalizing Brand Loyalty.......................................................................... 13
2.2.2. Operationalizing Store Loyalty ........................................................................... 14
2.2.3. Operationalizing Performance............................................................................. 15
3. Hypothesis Development .......................................................................................................... 17
4. Method ....................................................................................................................................... 23
5. Results ........................................................................................................................................ 24
6. Discussion................................................................................................................................... 30
6.1. Research Issues.................................................................................................................. 30
6.2. Limitations and Managerial Implications.......................................................................... 31
7. Tables ......................................................................................................................................... 32
References ........................................................................................................................................... 35
The Authors of the research paper ................................................................................................... 39
Other research papers........................................................................................................................ 41

Table of figures
Fig. 1: Attitude and behavioural component of 'brand loyalty' ............................................................ 25
Fig. 2: Relationship between brand loyalty and store loyalty .............................................................. 27
Fig. 3: Relationship between brand loyalty, store loyalty and performance I...................................... 28
Fig. 4: Relationship between brand loyalty, store loyalty and performance II .................................... 29

Abstract
The authors of this paper examine the relationship between brand loyalty, store loyalty and performance. Although both academics and practitioners are very much interested in an analysis of the interrelations, these constructs have not as yet been examined in a closed causal model. The findings of the analysis are based on a poll of 307 consumers of a retail company. In order to show the contribution of these customers to profits, the poll data was linked with shopping basket information from the polled consumers. The study was carried out using products of a newly launched premium store brand. In this way, this study can not only be used to answer open questions on the relationship of the mentioned constructs, but also to derive statements on the success potentials of premium store brands.


1. Central Concern of the Study Brand loyalty (e. g. Copeland 1923; Churchill 1942; Brown 1952; Cunningham 1956; Frank 1967; Tucker 1964; McConnel 1968; Day 1969; Charlton and Ehrenberg 1976; Dick and Basu 1994) and store loyalty (e. g. Enis and Paul 1970; Lessig 1973; Monroe and Guiltinan 1975; Keng and Ehrenberg 1984; Uncles and Hammond 1995; East/Hamond/Lomax 2000; Sivadas and Baker-Prewitt 2000) are two frequently examined constructs in market research. Special attention is paid to these constructs from the aspect of business management in particular, because some authors suspect there is a positive correlation between the 'loyalty' of a customer and 'performance' (Reichheld/Sasser 1990; Heskett et al. 1994).
A look at the published literature shows that the greater part of the studies consists of papers that examine the above-mentioned constructs in isolation. In contrast, up to now there have only been sporadic theory-based and empirical approaches that examine the relationship of cause and effect between the constructs brand loyalty and store loyalty (Cunningham 1961; Carman 1970; Steenkamp and Dekimpe 1997; Goerdt 1999; Corstjens and Lal 2000). Research approaches that link both constructs with performance variables have not yet been seen in the literature.
The concern of this study is to make a contribution towards closing this research gap. The determinants, the interlinking of cause and effect and the profitability potentials of brand and store loyalty in the retail trade will be examined. In particular, in the framework of a causal-analytical examination a relationship of cause and effect between brand and store loyalty on the one hand and their potential for performance on the other hand will be established.
The area of study under observation arouses not only the interest of academics. On the contrary, knowledge of influence factors that affect performance can be of particular relevance for companies that are exposed to high competitive pressure. With the continuing concentration tendencies in mind leading German trading companies have stated that in future they want to place greater value in particular on the sectors of customer relations and improving returns (Ahlert/Ken-ning/Schneider 2000, p. 21 ff.).
Relationship between brand loyalty, store loyalty and performance
Research gap
Causal-analytical analysis of relationship
Economic relevance


2. Framework, Theoretical Background and Constructs
2.1. Framework and Theoretical Background The first studies in the field of loyalty research initially examined the constructs brand and store loyalty in isolation (e. g. Copeland 1923). In the publications there is to a great extent agreement that measuring loyalty is determined by two material components: the numerous publications can be subdivided into behaviouristic, attitude-oriented and combined concepts on measuring loyalty, depending on the focus on the attitude or the behavioural components. Loyalty to a brand or to a store is expressed when, because of a positive attitude, a customer repeatedly demands goods or services within a suitably defined period of time.1 In the case of brand loyalty the service offered is one brand or a limited number of brands. With store loyalty purchases are concentrated on one or a few stores.
Behaviouristic loyalty concepts can include those concepts that stress the behavioural components and that address attitudinal components marginally only, or even only implicitly. In the various approaches an attempt is made to draw conclusions with regard to a brand or a store by determining buying sequences, buying shares and buying probability. However, a criticism must be made of the implicit assumption of these measuring concepts, namely that buying behaviour is the expression of the attitude to the service offered (Day 1969, p. 29-35; Newman and Werbel 1973, p. 404-409; Monroe and Guiltinan 1975, p. 19-28). This assumption can lead to misinterpretations, if, e.g., specific services or goods are temporarily unavailable/unattainable and therefore another service or good was demanded that is otherwise not preferred. DAY 1969 refers to the form of loyalty described here as 'spurious loyalty'.
Attitude-oriented concepts focus their examination on the attitude of a buyer to a brand or a store. According to these concepts, loyalty can be derived from the attitude. In the case of brand loyalty, this is measured with the help of models of preferences, repurchasing intentions or willingness to accept substitutes. Often, 1 In their inventory of the published literature in the field of loyalty research Jacoby and
Chestnut 1978 discovered 200 studies that dealt with operationalizing the construct brand loyalty. They were able to extract 53 terminological demarcations solely on the construct of brand loyalty from these approaches.
Overview over loyalty research
Behaviouristic loyalty concepts
Criticism
Attitude-oriented concepts

2. Framework, Theoretical Background and Constructs 10
slightly modified variants of these procedures are used to measure the attitude of a consumer to a store. The criticism that can be made of attitude-oriented procedures is that the attitude does not necessarily lead to a purchase. On the contrary, intervening factors (e.g. an exorbitant price or mobility barriers) may be responsible for a service not being demanded in spite of a positive attitude.
Since the 1960s publications have increasingly taken account of both attitude and behaviour components. These combined concepts presume a functional connection between the attitude and the purchase. There are numerous publications available on the aspect of the combined measurement of brand loyalty (e. g. Day 1969, p. 29-35; Jacoby 1971; 25-31; Newman and Werbel 1973, p. 404-409; Dick and Basu 1994, p. 99-113; Chaudhuri and Holbrook 2001, p. 81-93), whereas concepts for measuring store loyalty have not been very widespread up to now (Korgaonkar/Lund/Price 1985, p. 39-60; Mazursky and Jacoby 1986, p. 145-165; Osman 1993, p. 149-166; Bloemer and Ruyter 1998, p. 499-512; Sivadas and Baker-Prewitt 2000, p. 73-82). In spite of the remarkable attempt to record brand loyalty in the framework of a two-dimensional approach, it must be criticized that the measuring concepts that were published to about the end of the 1980s do not examine a functional connection between the attitude component and the behavioural component. On the contrary, loyalty is represented with the help of an aggregated loyalty parameter, so that no conclusions can be drawn to the underlying components. It is true that the proposed loyalty parameters can be used to determine unambiguous levels of loyalty for each customer, but the fixing of a 'threshold value' from which customers are seen to be loyal/disloyal, depend on the subjective assessment of the researcher. A further weak point of these concepts is found in the one-dimensional recording of the attitude component. According to a unanimous opinion in the literature the attitude should be represented by a great number of indicators that take account in particular of the cognitive, affective and conative elements of the attitude .2 On the basis of plausibility consideration Dick and Basu 1994 are able to substantiate the relevance of the elements referred to. However, they are unable to underpin their findings empirically. Chaudhuri and Holbrook 2001 do make a connection between the behavioural and the attitude dimension, and support this
2 For a representative study see DICK/BASU 1994 or models such as the 'AIDA model'.
Criticism
Combined concepts
Criticism
Operationalizing difficulties

2. Framework, Theoretical Background and Constructs 11
empirically; however, their approach must also be criticized because it maps the attitude dimension one-dimensionally only. With regard to the combined measurement of store loyalty there are some empirical studies in existence that were carried out in department stores (Mazursky and Jacoby 1986; Osman 1993; Bloemer and Ruyter 1998; Sivadas and Baker-Prewitt 2000). These studies prove that the image of the store, the service quality and the satisfaction have a positive effect on story loyalty. However, these findings do not apply to every form of store. For example, other studies point out that choice behaviour in food retail stores is influenced by completely different factors, for example, the location or the range of products (see Huddleston/Whipple/van Auken 2004, p. 222). It can be seen that in the food retail sector attitude-relevant factors tend to move into the background. Here, too, the demarcation problem that was posed above is posed, namely when customers are seen as loyal/disloyal.
Against the background of the research deficits shown the attempt is made in the present empirical study on the interactions of the constructs to eliminate a part of the operationalizing difficulties presented. The following research question is to be answered:
Research question 1:
What indicators can be used to operationalize the constructs brand loyalty and
store loyalty?
A further research branch is occupied with the question whether there is a connection between the constructs brand loyalty and store loyalty. However, publications that make a connection between brand and store loyalty restrict themselves to a few empirical studies (Cunningham 1961; Carman 1970; Steenkamp and Dekimpe 1997; Goerdt 1999; Corstjens and Lal 2000). Under the aspect of the aim of trading companies to bind customers to their stores, the analysis of the relationships between brand loyalty and store loyalty becomes very important. Retail companies in particular hope to bring about a positive effect of brand loyalty on store loyalty through their range of services, and recently in particular through placing store brands (Corstjens/Lal 2000, p. 281-291).
That these efforts can certainly lead to the goal was already indicated in early empirical study papers (Cunningham 1961, p. 134 and Carman 1970, p. 69). These examinations confirm that customers can be bound to a store with store
Operationalizing difficulties
Elimination of operationalizing difficulties
Relationship between brand loyalty and store loyalty

2. Framework, Theoretical Background and Constructs 12
brands in particular.3 However, the database and the analysis methods that were used in the studies referred to do not permit the conclusion whether customers visited the store because of the store brand (Cunningham 1961, p. 136). A more recent study examines this question on the basis of game theory considerations (Corstjens and Lal 2000). The authors are able to show that so-called 'quality store brands' are a suitable instrument for increasing store loyalty and store profitability. However, the opinions derived in the study are based on the very restrictive assumptions of game theory models. Because of their nature, findings that are acquired on the basis of models of this type cannot simply be generalized. As far as the author is aware, there have not been any empirical studies to date that examine a connection between brand loyalty and store loyalty using a practical example. In addition, the conditions under which this connection is stronger or weaker have not yet been examined. The following, second research question is therefore to be answered in this study.
Research question 2:
Is it possible in an individual case to provide evidence of a connection between
brand loyalty and store loyalty?
Numerous research- and practice-oriented articles refer to the high performance ability potentials of loyal customers (Reichheld and Sasser 1990; Heskett et al. 1994). However, it has scarcely been possible in previous publications to support the effect of brand loyalty and store loyalty on company performances. In particular there has not been any consideration that established a closed relationship connection between brand loyalty, store loyalty and a potentially derivable effect on performance. The study will attempt to close this research gap as well.
3 Although evidence of a correlation between brand and store loyalty could not be shown for
manufacturers' brands in the study by CUNNINGHAM 1961, it was possible to ascertain a positive significant correlation between loyalty to a brand and loyalty to a store.
Relationship between brand loyalty, store loyalty and performance
2. Framework, Theoretical Background and Constructs 13
Research question 3:
In the case examined, do brand loyalty and store loyalty have an effect on the company's performance?
2.2. Constructs
2.2.1. Operationalizing Brand Loyalty
In order to explore the causes of possible changes in behaviour, brand loyalty is operationalized as a two-dimensional construct consisting of an attitude and a behavioural component. The operationalization approach suggested here assumes that buying behaviour is influenced by attitude. For some time some authors have suspected that from first becoming aware of the existence of a brand through to a purchase consumers pass through three 'successive related phases', namely a cognitive, an affective-evaluative and a conative phase (e. g. Lavidge and Steiner 1961, p. 61).
In this sense, the customer acquires knowledge of the existence of a brand in the cognitive phase. The indicator 'Familiarity of the store brand (x1)' measures whether consumers know the brand or not. The success of the newly launched brand could depend not inconsiderably on whether buying a 'brand' is a decisive criterion in the meat products sector under observation here. For this reason, 'brand awareness (x2)' on purchases of meat products is integrated in the model as a further indicator for registering cognitive elements. In the affective-evaluative phase the (now familiar) brand is subjected to an evaluation that can lead to a positive or a negative judgment. The result of this evaluation is mapped by the indicator 'Satisfaction with the store brand (x3)'. The behavioural component of 'brand loyalty' is explained with the indicators x1, x2 and x3.
The willingness of consumers to act in a way determined by the two previous phases is expressed in the conative phase. The buying behaviour that results from this intended behaviour is registered with the indicator 'Buying frequency of the
Indicators for brand loyalty

2. Framework, Theoretical Background and Constructs 14
store brand'. The behavioural component of 'brand loyalty' is operationalized with this indicator.4
2.2.2. Operationalizing Store Loyalty
The totality of the customers of a retail company can be subdivided according to various criteria into a great number of different customer groups, whereby customers would be found sometime in the same group, sometimes in different groups, depending on the criteria selected. With the objective of this study in mind, namely to demonstrate loyalty to a store, the relevance and irrelevance of differences between customers who are loyal to a store and those that are not must be clarified. In many empirical studies the 'Visiting frequency (y1)' in a set period is determined to register store loyalty and to identify regular customers (Keng and Ehrenberg 1984). If the examination were based solely on this criteria, it would not be possible to differentiate customers who bought frequently from a store, but only a small proportion of their food requirements, from those who not only buy frequently but also spend most of their money in a specific store. In spite of the resulting foreseeable problems of demarcation, the visiting frequency is used most frequently as the sole criterion to identify regular customers. Because this indicator taken by itself does not provide any information on the important circumstance of where customers spend most of their money, this study will record in addition the store in which customers acquire the greater part of their weekly food requirements. This circumstance will be registered with the indicator 'Buying focus (y2)'. In order to acquire knowledge of consumers' selection behaviour the items from the retail company in the study were subdivided first of all into ten product groups. These consisted of three groups of goods from the fresh food sector and seven groups of goods from the dry foods range. The indicator 'Number of goods groups (y3)‘ provides information on how many of the goods groups offered were actually demanded, i.e. how great is the product range cover for each customer.
4 In the first measuring model (see Fig. 1) this indicator is designated with y1 and with x4 in the
second, third and forth measuring model (see, Fig. 2, Fig. 3, and Fig. 4).
Indicators for store loyalty
2. Framework, Theoretical Background and Constructs 15
2.2.3. Operationalizing Performance
The objective of binding customers to a company is usually linked with the intention of bringing about a positive effect on the company's profits. In this study, measuring potential effects on profits is carried out using indicators that were calculated from the shopping basket information from the customers who were surveyed. Indicators of this type, which on the one hand provide an indication of sales and turnover-related performance, can be of special interest to companies. On the other hand the model takes account of indicators with which profit-oriented performance can be measured. The indicators 'Number of items per cash register slip (y4)' and 'Cash register slip turnover (y5)' were taken into account for the first case of sales and turnover-oriented performance measurement. For the second case of profit-related performance measurement the 'Cover contribution per cash register slip (y6)' was included.
Indicators for performance


3. Hypothesis Development With regard to the construct 'brand loyalty' there is an initial examination as to whether there is a connection in the present data between the attitude and the behavioural component. Not only the empirical studies that were shown in Section 2., whose home base is business administration literature, but also studies from bordering academic areas (for an overview of these theories see, e.g., Frey and Irle 1993), point to the, in the end evident, perception that customers with a positive (negative) attitude to a product will frequently (seldom) buy this product. It is therefore to be assumed that there is a connection between the attitude component and the behavioural component. The following hypothesis is to be examined in the course of the study.
Hypothesis 1: The attitude component has a positive effect on the behavioural component.
In order to obtain information on whether the assumed connection may possibly be found in the data record, the registered characteristics were examined in the framework of a characteristics cluster to see whether distinctive features appear with regard to the attitude and the behavioural component. With regard to hypothesis 1 the following would then have to apply: "the higher the characteristics attributes of the attitude component, the more frequent is the 'buying frequency of the store brand".
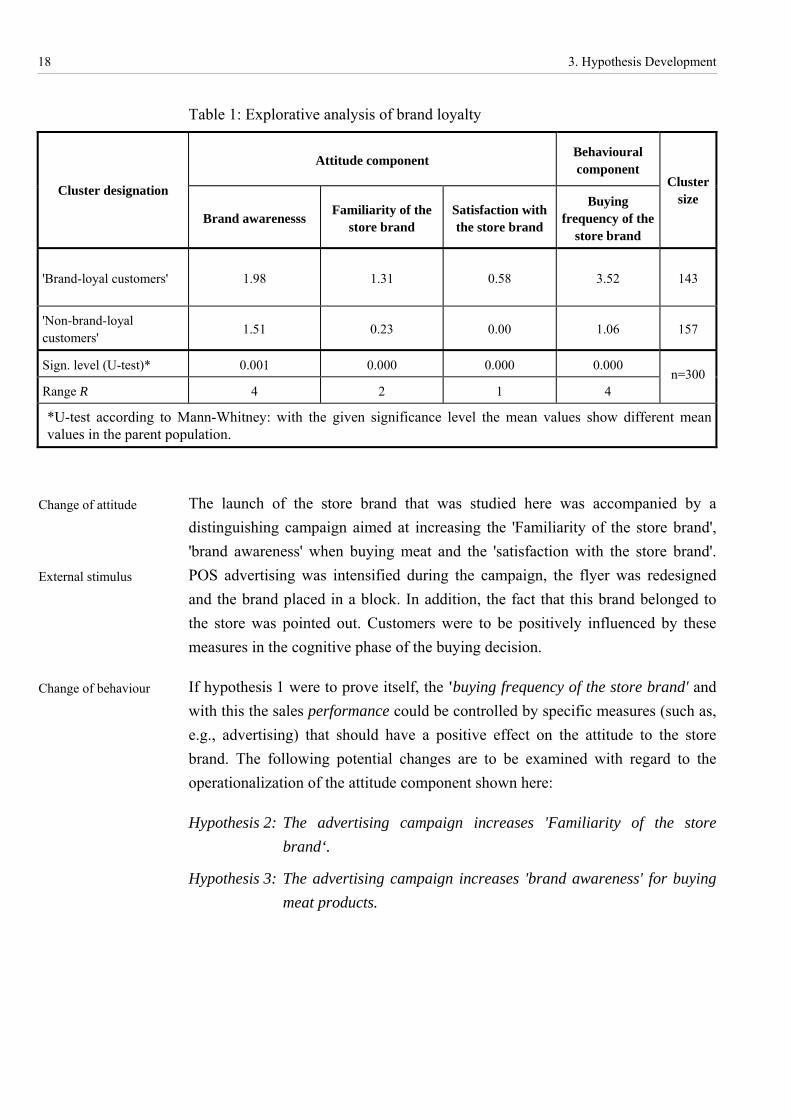
The characteristics attributes (high characteristics attributes with 'brand-loyal customers'; low characteristics attributes with 'non-brand-loyal customers') in Table 1 provide an initial indication that the presumed relationship connection can be verified in the framework of a confirmatory review as well.
Connection between attitude and behaviour
Exploration of data
3. Hypothesis Development 18
Table 1: Explorative analysis of brand loyalty
Attitude component Behavioural component
Cluster designation
Brand awarenesss Familiarity of the store brand
Satisfaction with the store brand
Buying frequency of the
store brand
Cluster size
'Brand-loyal customers' 1.98 1.31 0.58 3.52 143
'Non-brand-loyal customers' 1.51 0.23 0.00 1.06 157
Sign. level (U-test)* 0.001 0.000 0.000 0.000
Range R 4 2 1 4 n=300
*U-test according to Mann-Whitney: with the given significance level the mean values show different mean values in the parent population.
The launch of the store brand that was studied here was accompanied by a distinguishing campaign aimed at increasing the 'Familiarity of the store brand', 'brand awareness' when buying meat and the 'satisfaction with the store brand'. POS advertising was intensified during the campaign, the flyer was redesigned and the brand placed in a block. In addition, the fact that this brand belonged to the store was pointed out. Customers were to be positively influenced by these measures in the cognitive phase of the buying decision.
If hypothesis 1 were to prove itself, the 'buying frequency of the store brand' and with this the sales performance could be controlled by specific measures (such as, e.g., advertising) that should have a positive effect on the attitude to the store brand. The following potential changes are to be examined with regard to the operationalization of the attitude component shown here:
Hypothesis 2: The advertising campaign increases 'Familiarity of the store brand‘.
Hypothesis 3: The advertising campaign increases 'brand awareness' for buying meat products.
Change of attitude
External stimulus
Change of behaviour

3. Hypothesis Development 19
Hypothesis 4: The advertising campaign increases the 'satisfaction with the store brand'.
The above-mentioned communication policy measures were not employed until after a specific time-lag after the actual roll-out of the store brand. Because of this circumstance it was possible to register potential attitude and behaviour changes between t1 (before the campaign) and t2 (after the campaign).
The following developments are conceivable with regard to the direct sales performance of the store brand (Table 2):
Table 2: Effects of the advertising campaign
Change between t1 and t2 Evaluation of the advertising
campaign
Case 1 The effect of the attitude on behaviour remains the same.
Stimulus has no effect
Case 2 The effect of the attitude on behaviour increases Stimulus has positive effect
Case 3 The effect of the attitude on behaviour decreases. Stimulus has negative effect
A positive effect on the sales success can be expected if the influence of the attitude on the behavioural component develops as in case 2:
Hypothesis 5: The influence of the attitude on the behavioural component increases between t1 and t2. )
With the subsequent analysis of the relationship field between the constructs 'brand loyalty‘ and 'store loyalty‘ (cf. research question 2) the important question for the trading companies is to be answered, namely whether customers can possibly be bound to a store with a store brand. In the constructed analysis model the above-mentioned effect can be expected if a positive relationship between the constructs 'brand loyalty and store loyalty' can be verified. The assumed relationship appears to be plausible not at least because of the fact that store brands can only be asked for in the stores belonging to the retail company concerned, and customers 'inevitably' have to go to this retail company's stores to buy the store brand. The assumed relationship connection is to be examined with the following hypothesis:
Connection between brand loyalty and store loyalty

3. Hypothesis Development 20
Hypothesis 6: The greater the 'brand loyalty' the greater the 'store loyalty'.
The exploration of the characteristics concerned shows that indications can be found in the data record that the relationship connection postulated just now can be verified in the case under observation as well (Table 3): the contrast of the cluster of 'non-brand-loyal customers' and 'brand-loyal customers' with the indicators with which store loyalty was operationalized shows that brand-loyal customers have significantly greater characteristic attributes than 'non-brand-loyal customers' with regard to the indicators 'visit frequency', 'buying frequency' and 'number of goods groups demanded'.
Table 3: Relationship between brand loyalty and store loyalty
Cluster
Indicators of store loyalty 'Brand-loyal customers'
'Non-brand-loyal
customers'
Sign. level (U-test)*
Visiting frequency 3.62 2.96 0.000
Buying focus 0.70 0.44 0.000
Number of goods groups 7.58 6.09 0.000
*U-test according to Mann-Whitney: with the given significance level the mean values show different mean values in the parent population.
However, at this time it is also conceivable that the direction of the effect could also run in the other direction. In order to obtain clarity about the postulated direction of the effect the customers were asked whether the newly launched store brand is a reason for the visit to the stores in the survey. The evaluation of the question showed that with the increasing establishment of the store brand this is regarded increasingly as a reason for visiting the store. For example, in the period under observation the proportion of customers doubled who saw in the store brand an important to very important reason for buying (t1 = 10.2 %; t2 = 20.8 %). In the same period the proportion of customers who did not regard the store brand as a material reason for buying fell from 80.6 % to 56.6 %. The characteristic changes between t1 and t2 are highly significant with α = 0.002.
If hypothesis 6 stood up to an investigation, with regard to research question 3 an examination could then be carried out as to how 'brand loyalty and store loyalty' affect the customer's performance.
Discussion about direction of the effect

3. Hypothesis Development 21
The statements in the literature on the performance potentials of 'brand and store loyalty' are not very precise. While a positive effect of brand and store loyalty on performance is generally assumed, concrete measuring indicators for performance are not usually reported. In the case examined the performance indicators presented in Section 2.3 are included and placed in a relative connection with the constructs that have already been referred to:
Hypothesis 7: The greater the brand loyalty and the store loyalty the greater the performance.
Connection between brand loyalty, store loyalty and performance


4. Method In the framework of an oral survey 307 customers of a chain store were questioned on their purchasing behaviour with regard to meat products. This sector is particularly suitable for the present analysis for two reasons: firstly, a large number of articles of a premium store brand were introduced new in this category. It is therefore to be expected that the product launch will trigger changes to both attitude and behaviour in the customers. Secondly, a high level of involvement is to be expected from customers in this sensitive goods sector. This means that attitude and behaviour changes will probably appear more clearly than in other food categories. The selection of the indicators that were to be taken into account took place with the aim of solving the discussed operationalizing problems. With 300 customers it was possible to record the characteristics that were of interest uniformly and use them for further analysis. This method should guarantee that possible location-specific characteristics (e.g. the accessibility of the store) did not affect the results of the study. In order to be able to show changes with regard to the characteristics that were relevant to the study the retail company's customers were surveyed in two waves, namely in week 48 in the year 2002 (t1) and in week 5 of the year 2003 (t2). Along with the information from the consumer survey the shopping baskets of the customers in the survey were recorded in the second survey wave. In this way it was possible to link the information from the customer survey with the captured shopping basket data.
Oral survey of 307 customers

5. Results
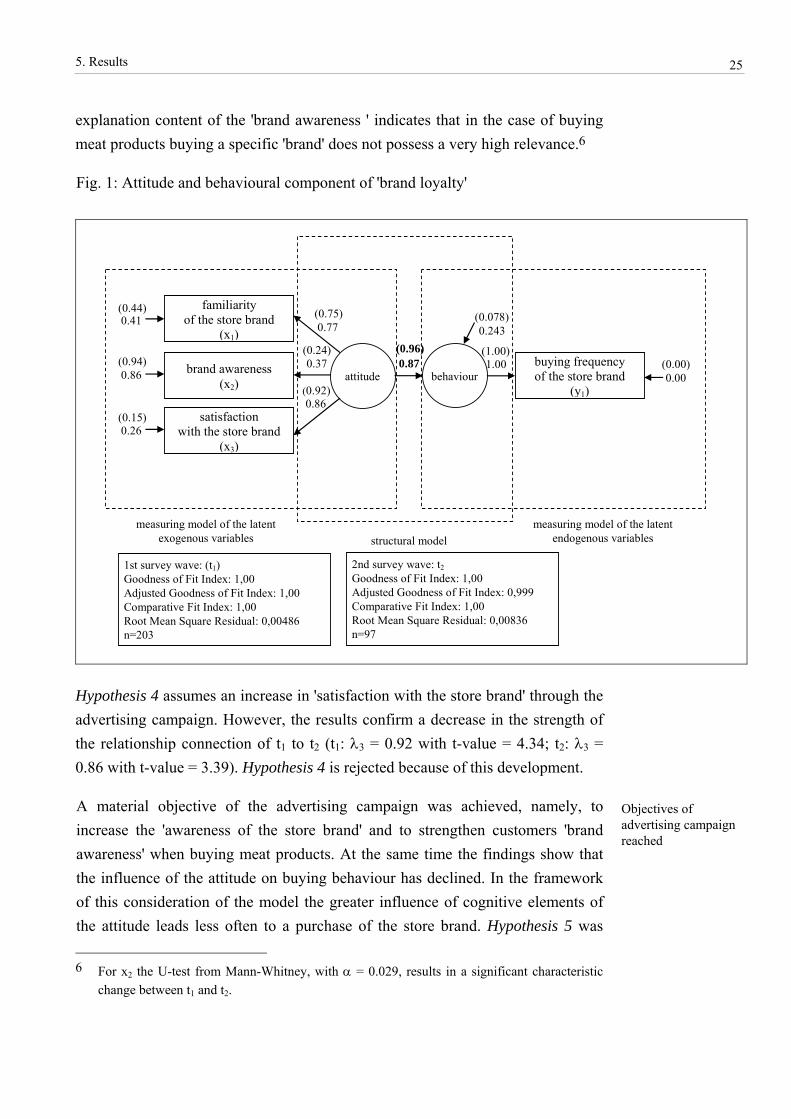
LISREL, Version 8.54, was chosen as a further method for investigating this hypothesis. Because the majority of the indicators in the database used infringe the standard deviation assumption, the model evaluations were carried out with the help of the ULS evaluation method. Hypotheses 1-7 are investigated with the help of four causal models. The assessment of the model quality is carried out on the basis of the global and detail criteria that are standard for these investigations (cf. Table A-1 to Table A-4 in the tables section). The global criteria for evaluating the model that are used to investigate hypotheses 1-5 (cf. Fig. 1) indicate a very good explanation of the fundamental covariance matrix through the model. In total, very good values (t1: GFI = 1.00; AGFI = 1.00; CFI = 1.00; RMR = 0.00486 and t2: GFI = 1.00; AGFI = 0.99; CFI = 1.00; RMR = 0.00836), which are clearly within the limits reproduced in the literature, can be ascertained with the global quality dimensions (Baumgartner and Homburg 1996; Bagozzi and Yi 1988). All paths, both the paths between the indicators and the constructs and the paths between the constructs, show highly significant attributes. Hypothesis 1, which assumes a positive relationship between the attitude and the behavioural component of brand loyalty, can be confirmed through the results (t1: γ1 = 0.96 with t-value = 5.33; t2: γ1 = 0.87 with t-value =5.33). However, in the cohort comparison the influence of the attitude on the behavioural component is reduced.
Hypothesis 2 postulates an increase of the 'familiarity of the store brand' through the advertising campaign. Here the model also indicates a slight increase between t1 and t2 (t1: λ1 = 0.75 with t-value = 5.19; t2: λ1 = 0.77 with t-value = 5.10).5
Hypothesis 3 assumes that 'brand awareness ' has increased through the external stimulus 'advertising campaign'. The values indicate that this assumption can be confirmed as well (t1: λ2 = 0.24 with t-value = 4.69; t2: λ2 = 0.37 with t-value = 5,10). However, it must be noted that the strength of the relationship connection, in spite of an increase, is not very pronounced. The 'brand awareness ' therefore contributes only conditionally to explaining the construct 'brand loyalty'. The low
5 For x1 the U-test from Mann-Whitney, with α = 0.003, results in a highly significant
characteristic change between t1 and t2.
Investigating hypothesis with Lisrel 8.54
Analysis: attitude and behaviour
Confirmation of hypothesis
5. Results 25
explanation content of the 'brand awareness ' indicates that in the case of buying meat products buying a specific 'brand' does not possess a very high relevance.6
Fig. 1: Attitude and behavioural component of 'brand loyalty'
familiarity of the store brand
(x1)
brand awareness (x2)
satisfaction with the store brand
(x3)
buying frequency of the store brand
(y1)
measuring model of the latent exogenous variables
measuring model of the latent endogenous variables structural model
attitude behaviour
(0.96) (1.00)
0.86
(0.24)
(0.75) (0.44)
(0.94)
(0.15)
(0.00)
1st survey wave: (t1) Goodness of Fit Index: 1,00 Adjusted Goodness of Fit Index: 1,00 Comparative Fit Index: 1,00 Root Mean Square Residual: 0,00486 n=203
2nd survey wave: t2 Goodness of Fit Index: 1,00 Adjusted Goodness of Fit Index: 0,999 Comparative Fit Index: 1,00 Root Mean Square Residual: 0,00836 n=97
0.87 1.00
(0.92)
0.37
0.77 0.41
0.86
0.26
0.00
(0.078) 0.243
Hypothesis 4 assumes an increase in 'satisfaction with the store brand' through the advertising campaign. However, the results confirm a decrease in the strength of the relationship connection of t1 to t2 (t1: λ3 = 0.92 with t-value = 4.34; t2: λ3 = 0.86 with t-value = 3.39). Hypothesis 4 is rejected because of this development.
A material objective of the advertising campaign was achieved, namely, to increase the 'awareness of the store brand' and to strengthen customers 'brand awareness' when buying meat products. At the same time the findings show that the influence of the attitude on buying behaviour has declined. In the framework of this consideration of the model the greater influence of cognitive elements of the attitude leads less often to a purchase of the store brand. Hypothesis 5 was 6 For x2 the U-test from Mann-Whitney, with α = 0.029, results in a significant characteristic
change between t1 and t2.
Objectives of advertising campaign reached

5. Results 26
therefore rejected. The objective of increasing sales performance by controlling the attitude was therefore not possible to achieve through the advertising drive. A reason for this development, even if it is possibly a negligible one, can be suspected in the (slight) decrease in the influence of the affective-evaluative attitude component ('satisfaction with the store brand‘) in the course of time (cf. the λ3 values).7 However, because the absolute level of the characteristic attribute of this indicator points to an overall high level of satisfaction, the reasons for the decreasing 'satisfaction' are certainly to be looked for at positions that, in certain circumstances are not covered by the model. The increase of the ζ value between t1 and t2 (ζ1 = 0.0078; ζ2 = 0.243) indicates that the described decrease in influence can be attributed to 'external' causes. It can, e.g., be presumed that the customers of the retail company increasingly regarded other product characteristics as decisive for the purchase. Against the background of the increasing competition situation in Germany many trading companies use the price and not the quality as the convincing sales argument. One consequence is that from the point of the consumers the price competitiveness of articles is gaining relevance.
The analysis of the relationship connection between the constructs brand and store loyalty (cf. hypothesis 6) is investigated with the following structural equation model (Fig. 2). The analysis is no longer carried out in two parts (t1 and t2), because this subdivision is not important for investigating hypothesis 6.
7 However, for x3 the U-test from Mann-Whitney, with α = 0.67, does not result in any
significant characteristic change between t1 and t2.
Pricing as a reason for decreasing satisfaction with product?
Analysis: brand loyalty and store loyalty

5. Results 27
Fig. 2: Relationship between brand loyalty and store loyalty
0.92
0.93
0.36
0.15
0.24
0.27
0.87
0.80
brand loyalty
ξ
0.62 0.61
number of goods groups
(y3)
buying focus (y2)
0.56
0.69
storeloyalty η
visiting frequency (y1)
0.83 0.31
brand awareness (x2)
familiarity of the store brand
(x1)
satisfaction with the store brand
(x3)
buying frequency of the store brand
(x4)
0.46
Goodness of Fit Index: 0,97 Adjusted Goodness of Fit Index: 0,93 Comparative Fit Index: 0,98 Root Mean Square Residual: 0,073 n=300
measuring model of the latent exogenous variables
measuring model of the latent endogenous variables
structural model
0.788
The model's global quality criteria indicate a good to very good explanation of the fundamental covariance matrix (GFI = 0.97; AGFI = 0.93; CFI = 0.98; RMSEA = 0.073). The paths between the indicators and the constructs and between the constructs show highly significant attributes. Hypothesis 6, which assumes a positive connection between 'brand loyalty' and 'store loyalty', can be confirmed (γ1 = 0.46 with t-value = 5.87; ζ-value: 0.788). The strong connection between the constructs should be particularly acknowledged. Empirical studies show that a great number of different determinants for the choice of store can be relevant (Korgaonkar/Lund/Price 1985; Mazursky and Jacoby 1986; Osman 1993; Bloemer and Ruyter 1998; Sivadas and Baker-Prewitt 2000). These are then 'in competition' with the determinant 'store brand'.
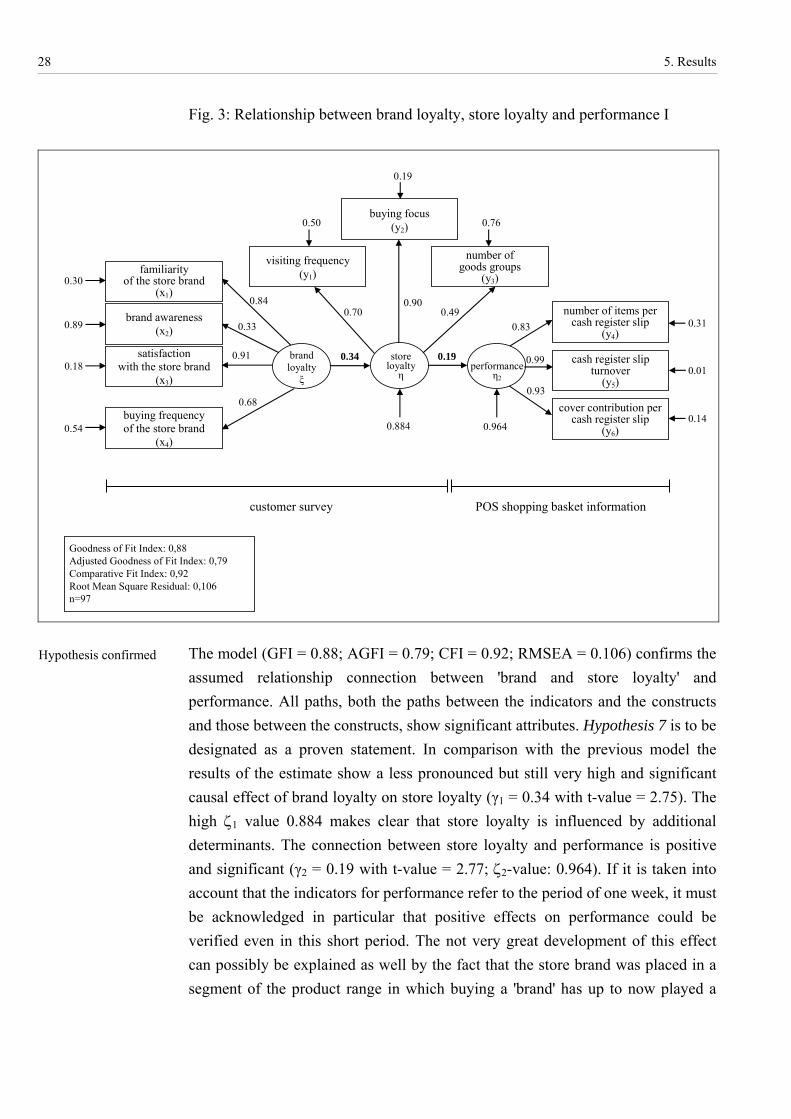
The third model looks at the performance potentials of brand and store loyalty (cf. hypothesis 7). In the framework of this consideration the constructs that have already been examined are linked with the performance indicators that are calculated from the shopping baskets of the customers in the survey registered at the POS (Fig. 3).
Confirmation of hypothesis
Analysis: brand loyalty, store loyalty and performance
5. Results 28
Fig. 3: Relationship between brand loyalty, store loyalty and performance I
0.91
0.89
0.30
0.18
0.54
0.33
0.68
0.84
brand loyalty
ξ performance
η2
0.83 0.31
cash register slip turnover
(y5) 0.93
0.14
number of items per cash register slip
(y4)
0.99 0.01
brand awareness (x2)
familiarity of the store brand
(x1)
satisfaction with the store brand
(x3)
buying frequency of the store brand
(x4)
0.34
Goodness of Fit Index: 0,88 Adjusted Goodness of Fit Index: 0,79 Comparative Fit Index: 0,92 Root Mean Square Residual: 0,106 n=97
storeloyalty η
0.19
visiting frequency (y1)
buying focus (y2)
0.19
0.76 0.50
0.70 0.90
0.49
cover contribution per cash register slip
(y6)
number of goods groups
(y3)
customer survey POS shopping basket information
0.884 0.964
The model (GFI = 0.88; AGFI = 0.79; CFI = 0.92; RMSEA = 0.106) confirms the assumed relationship connection between 'brand and store loyalty' and performance. All paths, both the paths between the indicators and the constructs and those between the constructs, show significant attributes. Hypothesis 7 is to be designated as a proven statement. In comparison with the previous model the results of the estimate show a less pronounced but still very high and significant causal effect of brand loyalty on store loyalty (γ1 = 0.34 with t-value = 2.75). The high ζ1 value 0.884 makes clear that store loyalty is influenced by additional determinants. The connection between store loyalty and performance is positive and significant (γ2 = 0.19 with t-value = 2.77; ζ2-value: 0.964). If it is taken into account that the indicators for performance refer to the period of one week, it must be acknowledged in particular that positive effects on performance could be verified even in this short period. The not very great development of this effect can possibly be explained as well by the fact that the store brand was placed in a segment of the product range in which buying a 'brand' has up to now played a
Hypothesis confirmed

5. Results 29
subordinate role. The customer group that is possibly prepared to pay higher prices for a specific 'brand' when buying food is certainly present but is not very large.
A further model (cf. Fig. 4) provides greater insight into the discussed effective relationships between the constructs 'brand loyalty', 'store loyalty' and 'performance'. This model maps not only the relationship connection 'brand loyalty→ store loyalty→ performance' that has already been examined; how heavily performance depends on brand-loyal customers ('brand loyalty→ performance') can also be examined.
Fig. 4: Relationship between brand loyalty, store loyalty and performance II
0.91
0.89
0.29
0.18
0.54
0.33
0.68
0.84
brand loyalty
ξ
brand awareness (x2)
familiarity of the store brand
(x1)
satisfaction with the store brand
(x3)
buying frequency of the store brand
(x4)
0.23
Goodness of Fit Index: 0,88 Adjusted Goodness of Fit Index: 0,80 Comparative Fit Index: 0,93 Root Mean Square Residual: 0,083 n=97
0.33
performanceη2
0.83 0.31
cash register slip turnover
(y5) 0.93
0.14
number of items per cash register slip
(y4)
0.99 0.01
cover contribution per cash register slip
(y6)
storeloyalty η1
0.70 0.51
buying focus (y2)
0.48
0.77
visiting frequency (y1)
0.91 0.17
number of goods groups
(y3) 0.11
0.89
0.92
The positive connection between the constructs 'brand loyalty' and 'store loyalty' is again confirmed by this model (γ11 = 0.33 with t-value = 2.62). In addition, a positive and significant relationship connection between 'brand loyalty' and 'performance' can be verified (γ21 = 0.23 with t-value = 2.01). This connection is stronger than the relation between the constructs 'store loyalty' and 'performance'
Deeper insight into discussed relationships
6. Discussion 30
(β1 = 0.11 with t-value = 0.95). Positive effects of 'brand loyalty' on both 'store loyalty' and on 'performance' are confirmed by this model.
6. Discussion
6.1. Research Issues Although the literature again and again points to the performance potentials of brand loyalty and store loyalty there have not yet been any empirical studies that attempt to verify this type of connection in individual cases. With the present study it was possible to make a causal connection between the constructs brand loyalty, store loyalty and performance.
With regard to research question 1 the model takes account of cognitive, affective-evaluative and conative elements to explain 'brand loyalty'. In the light of this differentiated view it was possible to explain the circumstance that buying a specific 'brand' in the meat products segment has only slight relevance. In addition, the study shows that while intensive advertising efforts exercise a positive effect on the attitude component they did not have an effect on the buying behaviour of the customers in the survey. Not at least because of the great satisfaction, on the whole, with the store brand the question arises whether other, in the first place attitude-induced causes (such as, e.g., the non-availability of goods, competition through low-priced self-service goods) are relevant for the decrease in 'satisfaction'.
With regard to research question 2 the following findings can be summarised: the connection between brand and store loyalty that is assumed in the literature but has not yet been verified was verified in the framework of this model. In view of the fact that the choice of store by consumers does not depend solely on the brand loyalty that is taken into account in the model but is also influenced by other factors, such as, e.g., the accessibility of a store, the relatively strong connection between brand and store loyalty must be particularly acknowledged: A not inconsiderable binding potential appears to emanate from (premium) store brands.
The question whether performance is influenced by brand and store loyalty, which is arguably decisive for companies, was answered with the last two causal models
Causal relationship proved for the first time
Comprehensive opera-tionalization of constructs
Binding potentials of (premium) store brands
Positive effect on com-pany performance
6. Discussion 31
(cf. research question 3). In these models the constructs referred to were placed in a relationship connection. The findings show that a positive effect on company performance can certainly be expected if customers can be bound to a company through a (premium store) brand.
In a general overview the findings support the approach of many trading companies of binding customers to their company through the placing of premium store brands in order to bring about a positive effect on performance.
6.2. Limitations and Managerial Implications The presented study can still be developed in some points. For example, in order to examine the question of which factors influence the connection between brand loyalty and store loyalty, there should be an investigation of which customer groups in particular were reached through the newly launched premium store brand. It could then be examined whether an effect on the company's performance depends possibly on which customer groups are addressed through the store brand. In a previously unpublished empirical study an attempt is made to answer these questions as well.
Furthermore, cohort examinations with POS data could represent a very promising opportunity to arrive at a deeper insight into the relationship network brand loyalty, store loyalty and performance. This present study provides initial support for the design of studies of this nature.
Customer group-specific analysis
Deeper insights with cohort examination of POS data
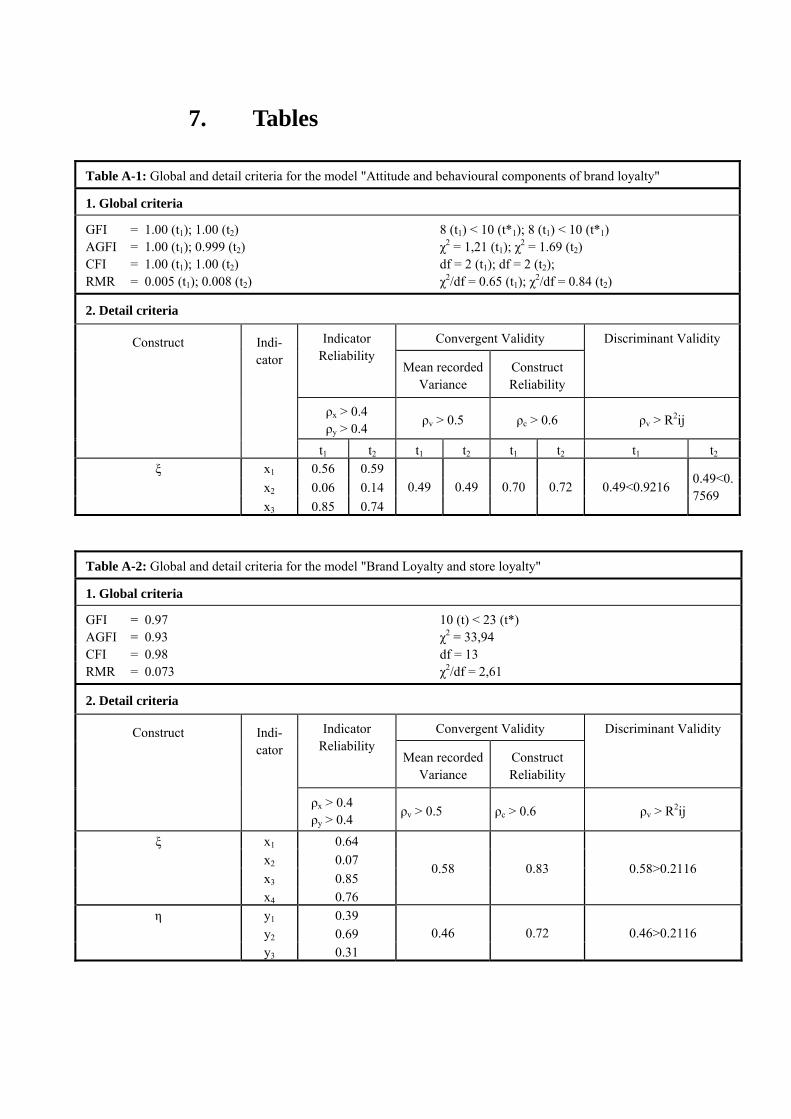
7. Tables
Table A-2: Global and detail criteria for the model "Brand Loyalty and store loyalty"
1. Global criteria
GFI = 0.97 10 (t) < 23 (t*) AGFI = 0.93 χ2 = 33,94 CFI = 0.98 df = 13 RMR = 0.073 χ2/df = 2,61
2. Detail criteria
Convergent Validity Indicator Reliability
Mean recorded Variance
Construct Reliability
Discriminant Validity Construct Indi-cator
ρx > 0.4 ρy > 0.4 ρv > 0.5 ρc > 0.6 ρv > R2ij
x1 0.64 x2 0.07 x3 0.85
ξ
x4 0.76
0.58 0.83 0.58>0.2116
y1 0.39 y2 0.69
η
y3 0.31 0.46 0.72 0.46>0.2116
Table A-1: Global and detail criteria for the model "Attitude and behavioural components of brand loyalty"
1. Global criteria
GFI = 1.00 (t1); 1.00 (t2) 8 (t1) < 10 (t*1); 8 (t1) < 10 (t*1) AGFI = 1.00 (t1); 0.999 (t2) χ2 = 1,21 (t1); χ2 = 1.69 (t2) CFI = 1.00 (t1); 1.00 (t2) df = 2 (t1); df = 2 (t2); RMR = 0.005 (t1); 0.008 (t2) χ2/df = 0.65 (t1); χ2/df = 0.84 (t2)
2. Detail criteria
Convergent Validity Indicator Reliability
Mean recorded Variance
Construct Reliability
Discriminant Validity
ρx > 0.4 ρy > 0.4 ρv > 0.5 ρc > 0.6 ρv > R2ij
Construct Indi-cator
t1 t2 t1 t2 t1 t2 t1 t2 x1 0.56 0.59 x2 0.06 0.14
ξ
x3 0.85 0.74 0.49 0.49 0.70 0.72 0.49<0.9216 0.49<0.
7569

7. Tables 33
Table A-3: Global and detail criteria for the model "Brand loyalty, store loyalty and performance I"
1. Global criteria
GFI = 0.88 22 (t) < 55 (t*) AGFI = 0.79 χ2 = 69,92 CFI = 0.92 df = 33 RMR = 0.106 χ2/df = 2,12
2. Detail criteria
Convergent Validity Indicator Reliability Mean recorded
Variance Construct Reliability
Discriminant Validity Con-struct
Indi-cator
ρx > 0.4 ρy > 0.4 ρv > 0.5 ρc > 0.6 ρv > R2ij
x1 0.70 x2 0.11 x3 0.82
ξ
x4 0.46
0.52 0.80 0.52>0.1156
y1 0.49 y2 0.81
η1
y3 0.24 0.51 0.75 0.51>0.1156
y4 0.69 y5 0.99
η2
y6 0.86 0.85 0.94 0.85>0.0361
Table A-4: Global and detail criteria for the model "Brand loyalty, store loyalty and performance II"
1. Global criteria
GFI = 0.88 23 (t) < 55 (t*) AGFI = 0.80 χ2 = 65,14 CFI = 0.93 df = 32 RMR = 0.083 χ2/df = 2,04
2. Detail criteria
Convergent Validity Indicator Reliability Mean recorded
Variance Construct Reliability
Discriminant Validity
Construct Indi-cator
ρx > 0.4 ρy > 0.4 ρv > 0.5 ρc > 0.6 ρv > R2ij
x1 0.71 x2 0.11 x3 0.82
ξ
x4 0.46
0.53 0.80 0.52>0.1156
y1 0.49 y2 0.83
η1
y3 0.23 0.52 0.75 0.51>0.1156
y4 0.69 y5 0.99
η2
y6 0.86 0.85 0.94 0.85>0.0361


References Bagozzi, Richard P. and Yi, Youjae (1988), "On the Evaluation of Structural Equation Models,"
Journal of the Academy of Marketing Science, 1 (Spring), No. 16, S. 74-94.
Baumgartner, Hans and Christian Homburg (1996), "Applications of Structural Equation Modelling in Marketing and Consumer Research: A Review," International Journal of Research in Marketing, 13 (April), No. 2, S. 139-161.
Bloemer, Josee and Ko de Ruyter (1997), "On the Relationship between Store Image, Store Satisfaction and Store Loyalty," European Journal of Marketing," Vol. 32, No. 5/6, S. 499-513.
Brown, James D. (1952), "Consumer Loyalty for Private Food Brands," Bureau of Business Research Report No. 3, Ball State University.
Carman, James M. (1970), "Correlates of brand Loyalty: Some Positive Results," Journal of Marketing Research, 7 (Februar), Issue 1, S. 67-76.
Charlton, P. and A. S. C. Ehrenberg (1976), "An experiment in brand choice," Journal of Marketing Research, 13 (May), Issue 2, S. 152-160.
Chaudhuri, Arjun and Morris B. Holbrook (2001), "The Chain of Effects from brand Trust and brand Effect to brand Performance: The Role of brand Loyalty," Journal of Marketing, 65 (April), Issue 2, S. 81-93.
Churchill, H. (1942), "How to measure brand Loyalty," Advertising and Selling, 35 (November), Issue 24, S. 11-16.
Copeland, Melvin T. (1923) "Relation of Consumer’s buying habits to marketing method," Harvard Business Review, 1 (April), Issue 3, S. 282-289.
Corstjens, Marcel and Rajiv Lal (2000), "Building Store Loyalty through Store Brands," Journal of Marketing Research, 37 (August), Issue 3, S. 281-291.
Cunningham, Ross M. (1956), "Brand Loyalty – What, Where, How much?," Harvard Business Review, 34 (January/February), Issue 1, S. 116-128.
Cunningham, Ross. M. (1961), "Customer Loyalty to Store and Brand," Harvard Business Review, 39 (November/December), Issue 6, S. 127-138.
Day, George S. (1969), "A two dimensional concept of brand loyalty," Journal of Advertising Research, 9 (September), Issue 3, S. 29-35.

References
36
Dick, Alan S. and Kunal Basu (1994), "Customer Loyalty: Towards an Integrated Conceptual Framework," Journal of the Academy of Marketing Science, 22 (Spring), Issue 2, S. 99-113.
East, Robert; Hammond, Kathy and Wendy Lomax (2000), "First-Store Loyalty and Retention," Journal of Marketing Management, 16 (May), Issue 24, S. 307-325.
Enis, Ben M. and Gordon W. Paul (1970), "„Store Loyalty“ as a Basis for Market Segmentation," Journal of Retailing, 46 (Fall), Issue 3, S. 42-56.
Frank, Ronald E. (1967), "IS brand Loyalty a Useful Basis for Market Segmentation?," Journal of Advertising Research, 7 (June), Issue 2, S. 27-33.
Goerdt, Thomas (1999), "Die Marken- und Einkaufsstättentreue der Konsumenten als Bestimmungsfaktor des vertikalen Beziehungsmarketing: Theoretische Grundlegung and empirische Analysen des Category Management," doctoral dissertation, City of Erlangen 1999.
Heskett, J.; Jones, T.; Loveman, G.; Sasser, W.; Schlesinger, L. (1994), "Putting the Service-Profit Chain to Work," Harvard Business Review, Vol. 72, No. 2, S. 164-174.
Huddleston, Patricia; Whipple, Judith and Amy van Auken (2004), "Food Store Loyalty: Application of a Consumer Loyalty Framework," Journal of Targeting, Measurement and Analysis for Marketing, 12 (March), Issue 3, S. 213-230.
Jacoby, Jacob (1971), "A Model of Multi-Brand Loyalty," Journal of Advertising Research, 13 (June), Issue 3, S. 25-31.
Jacoby, Jacob and David Mazursky (1986), "Exploring the Development of Store Images," Journal of Retailing, 62 (Summer), Issue 2, S. 145-165.
Jacoby, Jacob and Robert W. Chestnut (1978), "Brand Loyalty Measurement and Management," City of New York.
Keng, Kau, A. and A. S. C. Ehrenberg (1984), "Patterns of Store Choice," Journal of Marketing Research, 21 (November), Issue 4, S. 399-409.
Korgaonkar, Pradeep K.; Lund, Daulat and Barbara Price (1985), "A Structural Equations Approach Towards Examination of Store Attitude and Store Patronage Behaviour," Journal of Retailing, 61 (November), Issue 2, S. 3-60.
Lavidge, Robert J. and Gary A. Steiner (1961), "A Model of Predictive Measurements of Advertising Effectiveness," Journal of Marketing, 15 (October), Issue 25, S. 61.

References
37
Lessig, Parker V (1973), "Consumer Store Image and Store Loyalties," Journal of Marketing, 37 (October), Issue 4, S. 72-74.
McConnel, Douglas J. (1968), "The development of brand loyalty: An experimental Study," Journal of Marketing Research, 5 (February), Issue 1, S. 13-19.
Monroe, Kent B. and Joseph P. Guiltinan (1975), "A Path Analytic Exploration of Retail Patronage Influences," Journal of Consumer Research, 2 (July), Issue 2, S. 19-28.
Newman, Joseph W. and Richard A. Werbel (1973), "Multivariate Analysis of brand Loyalty for Major Household Appliances," Journal of Marketing Research, 10 (November), Issue 4, S. 404-209.
Osman, M. Z. (1993), "A CONCEPTUAL Model of Retail Image Influences on Loyalty Patronage Behaviour," International Review of Retail, 3 (April), Issue 2, S. 133-148.
Reichheld, Frederick. F. and Earl W. Sasser (1990), "Zero Defection: Quality comes to Service," Harvard Business Review, 68 (September/October), Issue 5, S. 105-111.
Sivadas, Eugene and Jamie L. Baker-Prewitt (2000), "An Examination of the Relationship between Service Quality, Customer Satisfaction and Store Loyalty," International Journal of Retail & Distribution Management, Vol. 28 , Issue 2/3, S. 73-82.
Steenkamp, Jan-Benedict and Mamik G. Dekimpe (1997), "The increasing power of store brands: building loyalty and market share," Long Range Planning, 30 (December), Issue 6, 917-930.
Tucker, W. T. (1964), "The development of brand loyalty," Journal of Marketing Research, 1 (August), Issue 3, S. 32-35.
Uncles, Mark and Kathy Hammond (1995), "Grocery Store Patronage," International Review of Retail, 5 (July), Issue 3, S. 287-300.


The Authors of the research paper
Univ.-Prof. Dr. rer. pol. Rainer Olbrich
born 1963, 1983-1988 Business Administration and Economics at the University of Münster, 1985-1989 freelancing consultant, 1988-1997 research assistant and assistant professor at the University of Münster (Chair of Univ.-Prof. Dr. Dieter Ahlert), 1992 doctorate, 1997 habilitation at the Universität Münster, since December 1997 full professor of the FernUniversität in Hagen.
Dipl.-Kfm. Thomas Windbergs
born 1975, 1995-2001 Business Administration at the Heinrich-Heine-University Düsseldorf, 2001-2005 research assistant at the FernUniversität in Hagen (Chair of Univ.-Prof. Dr. Rainer Olbrich), since July 2005 consultant with Droege & Comp. Unternehmer-Beratung, Düsseldorf.

Other research papers
In German Forschungsbericht Nr. 1:
OLBRICH, R. 1998: Handelskonzentration, FernUniversität in Hagen.
Forschungsbericht Nr. 2:
OLBRICH, R./BATTENFELD, D./GRÜNBLATT, M. 1999: Die Analyse von Scanningdaten – Metho-dische Grundlagen und Stand der Unternehmenspraxis, demonstriert an einem Fallbeispiel, (2., durchges. und aktual. Aufl., 2001), FernUniversität in Hagen.
Forschungsbericht Nr. 3:
OLBRICH, R./BATTENFELD, D. 2000: Komplexität aus Sicht des Marketing und der Kostenrechnung, FernUniversität in Hagen.
Forschungsbericht Nr. 4:
OLBRICH, R. 2001: Ursachen, Entwicklung und Auswirkungen der Abhängigkeitsverhältnisse zwischen Markenartikelindustrie und Handel, FernUniversität in Hagen.
Forschungsbericht Nr. 5:
GRÜNBLATT, M. 2001: Verfahren zur Analyse von Scanningdaten – Nutzenpotenziale, praktische Probleme und Entwicklungsperspektiven, FernUniversität in Hagen.
Forschungsbericht Nr. 6:
BRAUN, D. 2001: Schnittstellenmanagement zwischen Efficient Consumer Response und Handels-markenführung – Ergebnisse einer empirischen Untersuchung und Handlungsempfehlungen, FernUniversität in Hagen.
Forschungsbericht Nr. 7:
OLBRICH, R./WINDBERGS, TH. 2002: Marktbezogene Wirtschaftlichkeitsaspekte von Biogasanlagen nach der Verabschiedung des „Erneuerbare-Energien-Gesetz (EEG)“ – Konsequenzen für die deutsche Energie- und Entsorgungswirtschaft, FernUniversität in Hagen.

Forschungsbericht Nr. 8:
OLBRICH, R./GRÜNBLATT, M. 2003: – Projekt SCAFO – Stand der Nutzung von Scanningdaten in der Deutschen Konsumgüterwirtschaft – Ergebnisse einer empirischen Untersuchung, FernUniver-sität in Hagen.
Forschungsbericht Nr. 9:
OLBRICH, R./BUHR, C.-C. 2003: – Projekt SCAFO – Sortimentscontrolling im filialisierenden Han-del – dargestellt am Beispiel von Frischwaren, FernUniversität in Hagen.
Forschungsbericht Nr. 10:
PEISERT, R. 2004: Die Wahl internationaler Standorte durch europäische Handelsunternehmen – Internationalisierungspfade, Strategiemuster, empirische Befunde und Handlungsempfehlungen, FernUniversität in Hagen.
Forschungsbericht Nr. 11:
OLBRICH, R./BUHR, C.-C./GREWE, G./SCHÄFER, T. 2005: Die Folgen der zunehmenden Verbreitung von Handelsmarken für den Wettbewerb und den Verbraucher, FernUniversität in Hagen.
Forschungsbericht Nr. 12:
OLBRICH, R./WINDBERGS, TH. 2005: Zur Beziehung zwischen Markentreue, Einkaufsstättentreue und Erfolg im Lebensmittelhandel – Eine kausalanalytische Betrachtung am Beispiel von Premiumhandelsmarken, FernUniversität in Hagen.
In English Research Paper No. 1:
OLBRICH, R./BUHR, C.-C. 2005: The impact of private labels on welfare and competition – how retailers take advantage of the prohibition of resale price maintenance in European competition law, FernUniversität in Hagen.
Research Paper No. 2:
BUHR, C.-C. 2005: Regularities in aggregated consumer behaviour and prevention of stock-outs in retailing, FernUniversität in Hagen.

Other research papers
43
Research Paper No. 3:
BUHR, C.-C. 2005: Quantifying knowledge on consumers’ payment behaviour in retailing, FernUniversität in Hagen.
Research Paper No. 4:
OLBRICH, R./WINDBERGS, TH. 2006: The Relationship between Brand Loyalty, Store Loyalty and Performance in the Retail Food Sector: A causal-analytical Analysis using the Example of Premium Store Brands, FernUniversität in Hagen.