Deutscher Wein Statistik
40
’20 / ’21 Deutscher Wein Statistik
Transcript of Deutscher Wein Statistik

’20 / ’21
Deutscher WeinStatistik

2 V o r W o r t / F o r e W o r D
D e u t s c h e r We i n S t a t i s t i k 2 0 2 0 / 2 0 2 1
Weinmarkt 2019Der Weinjahrgang 2019 hat bundesweit sehr gute Qualitäten hervorgebracht. Die trauben waren insgesamt sehr gesund und reif. Probleme bereiteten aber wie bereits im Vorjahr die teils extreme trockenheit sowie vergleichsweise starke Sonnenbrandschäden an den Beeren, die auf rekordtemperaturen von bis zu 41°C im Juli zurückgingen. Dadurch fiel die bundesweite Weinmosterntemenge mit 8,3 Mio. Hektolitern um fünf Prozent niedriger aus als das zehnjährige Mittel von 8,8 Mio. Hektolitern. Die erntemenge stammt zu 63 Prozent von Weißweinsorten und zu 37 Prozent von roten trauben. Die fünf bedeutendsten rebsorten in Deutschland (riesling, Spätburgunder, Müllerthurgau, Grauburgunder und Dornfelder) haben mit fünf Millionen Hektolitern einen Anteil von 60 Prozent an der Gesamterntemenge.
HEIMISCHE WEINE BEHAUPTEN SICH IN RÜCKLÄUFIGEM WEINMARKT
Der Weinkonsum in Deutschland ist um 0,4 Liter auf 20,1 Liter pro Kopf zurückgegangen. er liegt damit auf dem Niveau der letzten 20 Jahre, das sich zwischen 20 und 21 Litern bewegt. Der Schaumweinkonsum blieb mit 3,3 Litern unverändert, daraus ergibt sich ein ProKopfVerbrauch von 23,4 Litern Wein und Sekt. Der Absatz heimischer Weine ist im Vergleich zum Vorjahr stabil geblieben, obwohl die Weineinkäufe insgesamt um 0,9 Prozent zurückgingen. Damit konnten die deutschen Weine ihren Marktanteil von 45 Prozent halten. Weine aus Italien erreichten einen Marktanteil von 16 Prozent, gefolgt von Frankreich mit zwölf Prozent und Spanien mit neun Prozent. Im Lebensmitteleinzelhandel haben die Verbraucher im Durchschnitt 3,12 euro pro Liter und damit drei Cent mehr als im Jahr zuvor ausgegeben. Weine aus deutschen regionen wurden durchschnittlich zu einem Preis von 3,31 euro je Liter angeboten. Dies entspricht einem rückgang von acht Cent pro Liter gegenüber dem Vorjahrespreis, der auf das größere Weinangebot nach dem ertragreichen Jahrgang 2018 zurückzuführen ist. Der Preis für heimische Weine direkt beim erzeuger und im Weinfachhandel ist dagegen um neun Cent auf 6,89 euro pro Liter gestiegen.eine Analyse der Weinkäufer im LeH nach Altersgruppen zeigt, dass die heimischen Weine bei den unter 30Jährigen stärker gefragt waren, was angesichts der demografischen entwicklung in Deutschland sehr positiv zu bewerten ist.
Der Lebensmitteleinzelhandel hat seine starke Marktposition für den Weinvertrieb in Deutschland behauptet. 79 Prozent aller Weine wurden 2019 dort eingekauft. Die Discountmärkte hatten konstante 50 Prozent Marktanteil. Die klassischen Supermärkte konnten ihren Marktanteil von 18 Prozent behaupten, die großen SBWarenhäuser mit elf Prozent einen Prozentpunkt hinzugewinnen. Über den onlineHandel wurden vier Prozent aller Weine verkauft.
DEUTSCHE WEINEXPORTE LEGEN ZU
Der Absatz deutscher Weine im Ausland hat sich 2019 positiv entwickelt. Die exportierten Weinmengen legten gegenüber dem Vorjahr um drei Prozent auf 1,04 Millionen Hektoliter zu. Der Wert der ausgeführten Weine ist dagegen leicht um 0,6 Prozent auf 305 Mio. euro gesunken, der Durchschnittspreis um elf Cent auf 2,93 euro pro Liter. Diese entwicklung ist in erster Linie auf den ertragreichen Weinjahrgang 2018 zurückzuführen, aufgrund des größeren Weinangebots konnte der bis dahin höchste exportdurchschnittspreis für deutsche Weine oftmals nicht gehalten werden.rückläufig entwickelte sich im vergangenen Jahr der wichtigste deutsche Weinexportmarkt USA. Dies dürfte auch an dem rückgang des Weinkonsums in dem weltweit größten Weinmarkt liegen. Für die deutschen Weinexporteure hatte dies ein Minus von vier Prozent bei den ausgeführten Weinmengen, bei einem gleichzeitigen Umsatzrückgang von neun Prozent auf 65 Mio. euro zur Folge. Die im oktober 2019 eingeführten USHandelszölle von 25 Prozent auf deutsche Weine haben sich 2019 noch nicht auf die Gesamtjahresbilanz ausgewirkt. einen positiven effekt auf die deutschen Weinexporte hatte der Wegfall der Weineinfuhrzölle in Japan. Die deutschen Weinexporteure erzielten in Japan eine 17prozentige Mengensteigerung und einen Wertzuwachs von 13 Prozent. Weiterhin positiv haben sich die Ausfuhren deutscher Weine nach Skandinavien entwickelt: 182.000 Hekto liter im Wert von 56 Millionen euro wurden exportiert. In China ist es gelungen, den Durchschnittspreis gegen den trend um 35 Cent auf 5,17 euro pro Liter zu steigern. Dadurch ist der Wert der Weinausfuhren in dem fünftwichtigsten deutschen Weinexportmarkt um zwei Prozent auf 17 Millionen euro gestiegen. Gleichzeitig ging allerdings die exportmenge um fünf Prozent auf 33.000 Hektoliter zurück.

3V o r W o r t / F o r e W o r D
D e u t s c h e r We i n S t a t i s t i k 2 0 2 0 / 2 0 2 1
Wine Market 2019the 2019 vintage displayed exceptional quality nationwide. overall, the grapes were very healthy and ripe. However, as in the previous year, problems were caused by the extremely dry conditions and comparatively severe sunburn suffered by the berries, which were subjected to record temperatures of up to 41 ° C in July. As a result, the 8.3 million hectolitres of wine must harvested was five percent lower than the tenyear average of 8.8 million hectolitres. 63 percent of the harvest comes from white grapes and 37 percent from red grapes. the five most important grape varieties in Germany (riesling, Pinot Noir, Müllerthurgau, Pinot Gris and Dornfelder), comprising five million hectolitres, make up 60 percent of the total harvest.
LOCAL WINES PREVAIL IN A DECLINING WINE MARKET
Wine consumption in Germany decreased by 0.4 litres to 20.1 litres per capita, which remains within the 20year range of 20 to 21 litres. Sparkling wine consumption remained unchanged at 3.3 litres, resulting in a per capita consumption of 23.4 litres of wine and sparkling wine.Sales of domestic wines have remained stable despite wine purchases falling by 0.9 percent overall. German wines thus maintained their market share of 45 percent, followed by Italy with 16 percent, France with twelve percent and Spain with nine percent.In the food retail sector, consumers spent an average of 3.12 €/l, which is three cents more than in the previous year. Wines from German regions averaged 3.31 €/l which corresponds to a decrease of eight cents, attributable to the larger wine offering from the abundant 2018 vintage. In contrast, the price for domestic wines purchased directly from the producer and in specialist wine shops rose by nine cents to 6.89 €/l.An analysis by age group of the wine buyers in retail supermarkets, shows that domestic wines were more in demand amongst those under 30 years old, which is a promising trend given the demographic development in Germany.the food retail sector maintained its strong market position for wine distribution in Germany, selling 79 percent of all wines in 2019. the discount stores retained their 50 percent market share and the classic supermarkets their 18 percent, whilst the hypermarkets gained an additional percentage point to claim 11 percent of the market. Four percent of all wines were sold online, as per the year prior.
GERMAN WINE EXPORTS ON THE RISE
Sales of German wines abroad developed positively in 2019. the amount of wine exported increased by three percent to 1.04 million hectolitres compared to the previous year. the value, however, fell slightly by 0.6 percent to 305 million euros in total, the average price falling by eleven cents to 2.93 €/l. this is primarily due to the high yields of the 2018 vintage and its extended wine offering. thus, the highest ever average export prices for German wines which had been achieved the preceding year, could not be attained in 2019.the most important German wine export market, the USA, saw a decline, which is probably also due to the decrease in wine consumption within the world‘s largest wine market. For German wine producers, this resulted in a four percent drop in the amount of wine exported there, with a simultaneous fall in sales of nine percent to 65 million euros. the US trade tariffs of 25 percent that were introduced in october 2019, have not yet had an impact on the overall annual balance sheet for 2019. the abolition of wine import duties in Japan had a positive impact with German wine exporters achieving a 17 percent increase in volume and a 13 percent increase in value there. German wine exports to Scandinavia continued their success with 182,000 hectolitres worth 56 million euros. China, the fifth most important market for German wine exports, bucked the trend with the average price increasing by 35 cents to 5.17 €/l. As a result, the value rose by two percent to 17 million euros despite the volume falling by five percent to 33,000 hectolitres.
4 I N H A Lt / t A B L e o F C o N t e N t S
D e u t s c h e r We i n S t a t i s t i k 2 0 2 0 / 2 0 2 1
InhaltRebflächen
Übersicht 1 rebflächen nach Ländern 1990 – 2019 6Übersicht 2 Betriebe in Deutschland mit bestockter rebfläche 2010 und 2016 7 Übersicht 3 Bestockte rebfläche rebsorten nach Anbaugebieten 2019 8 – 9Übersicht 4 Bestockte rebflächen nach rebsorten 2018 / 2019 10Übersicht 5 Bestockete rebflächen nach rebsorten 1970 – 2019 11Übersicht 6 Weltweiter Anbau wichtiger rebsorten 2015 12 – 13
Weinerzeugung Übersicht 7 Weinproduktion nach Ländern 1990 – 2019 14Übersicht 8 Mostertrag und qualitative einteilung der ernte 2019 15Übersicht 9 Flächenerträge der Weinmosternten 2009 – 2019 16Übersicht 10 Weinmosternten und Qualitätsbeurteilung 1974 – 2019 17Übersicht 11 Weinerzeugung 2014 – 2019 18Übersicht 12 Weinerzeugung 2019 nach Anbaugebieten 19
Qualitätsweinprüfung Übersicht 13 Qualitätsweinprüfung 2015 – 2019: Geprüfte Weinmengen 20Übersicht 14 Qualitätsweinprüfung 2019: Geprüfte Weinmengen nach Weinarten 21Übersicht 15 Qualitätsweinprüfung 2019: Geprüfte Weinmengen nach Geschmacksrichtungen 22Übersicht 16 Qualitätsweinprüfung 2019: Geprüfte Weinmengen nach Qualitätsstufen 23
Weinexport Übersicht 17 Wichtige Weinexportländer 1990 – 2019 24Übersicht 18 Weinexport 2000 – 2019 25Übersicht 19 Weinexport 2018 / 2019 nach Weinarten 26Übersicht 20 Weinexport 2018 / 2019 nach Ländern 27
Weinimport Übersicht 21 Weinimport nach Deutschland 2018 / 2019 28Übersicht 22 Weinimport nach Deutschland nach Lieferländern 2018 / 2019 29
Weinbilanz Übersicht 23 trinkweinbilanzen Deutschland 2013 / 2014 – 2018 / 2019 30
Weinkonsum Übersicht 24 Weinkonsum in ausgewählten Ländern 1990 – 2019 31Übersicht 25 Verbrauch an Getränken in Deutschland 2011 – 2019 32
Weineinkauf Übersicht 26 Ausgaben für alkoholische Getränke 2015 – 2019 33Übersicht 27 Marktanteile der Herkunftsländer 2015 – 2019 34Übersicht 28 Anteil der Weinarten 2015 – 2019 35Übersicht 29 Marktanteile der Weinanbaugebiete 2015 – 2019 36Übersicht 30 Anteil des Weinkonsums in Verbrauchergebieten 2019 37

5I N H A Lt / t A B L e o F C o N t e N t S
D e u t s c h e r We i n S t a t i s t i k 2 0 2 0 / 2 0 2 1
table of contentWinegrape Areas
table 1 Winegrape areas 1990 – 2019 (selected countries) 6table 2 Structure of commercial cultivation of winegrape areas in Germany 2010 and 2016 7 table 3 Winegrape areas and important grape varieties 2019 (regional overview) 8 – 9table 4 Winegrape areas 2018 / 2019 (varietal overview) 10table 5 Winegrape areas 1970 – 2019 (varietal overview) 11table 6 Global cultivation of key grape varieties (international overview) 2015 12 – 13
Wine Production table 7 Wine production 1990 – 2019 (selected countries) 14table 8 Grape must yields and potential quality categories of the 2019 harvest 15table 9 Grape must yields in hl / ha (regional and vintage overview) 2009 – 2019 16table 10 Qualitative survey of German grape must yields (statistical) 1974 – 2019 17table 11 Wine production 2014 – 2019 18table 12 Wine production 2019 by winegrowing region 19
Quality Control Tests table 13 Quality control tests: total quantity 2015 – 2019 20table 14 Quality control tests 2019: types of wine tested (regional overview) 21table 15 Quality control tests 2019: styles of wine tested (regional overview) 22table 16 Quality control tests 2019: quality categories of wine tested (regional overview) 23
Wine Exports table 17 exports by wineproducing countries 1990 – 2019 24table 18 Wine exports 2000 – 2019 25table 19 Wine exports by quality, volume and color 2018 / 2019 26table 20 Wine exports by country 2018 / 2019 27
Wine Imports table 21 Wine imports by quality, type and color 2018 / 2019 28table 22 Wine imports by country of origin 2018 / 2019 29
Stocks / Depletionstable 23 German wine production + imports vs. consumption + exports 2013 / 2014 – 2018 / 2019 30
Wine Consumption table 24 Wine consumption in selected countries 1990 – 2019 31table 25 Beverage consumption in Germany 2011 – 2019 32
Consumer Buying Trends table 26 expenditure on alcoholic beverages 2015 – 2019 33table 27 Consumer buying trends by country of origin 2015 – 2019 34table 28 Consumer buying trends by type 2015 – 2019 35table 29 Consumer buying trends by German region of origin 2015 – 2019 36table 30 Consumer buying trends in Germany 2019 37

6 r e B F L Ä C H e N / W I N e G r A P e A r e A S
D e u t s c h e r We i n S t a t i s t i k 2 0 2 0 / 2 0 2 1
Übersicht / table 1
Länder / Countries
Rebflächen / Vineyard areas in 1.000 ha
Veränderung / Change in %
1990 2000 2010 2017 2018 2019* 1990 / 2019 2018 / 2019
Spanien (eS) 1.532 1.174 1.082 968 972 966 -36,9 -0,6
China (CN) 123 283 539 830 855 855 595,1 0,0
Frankreich (Fr) 939 917 818 788 792 794 -15,4 0,3
Italien (It) 1.024 908 795 699 701 708 -30,9 1,0
türkei (tr) 581 581 514 448 448 436 -25,0 -2,7
USA (US) 301 413 404 434 408 408 35,5 0,0
Argentinien (Ar) 210 209 228 222 218 215 2,4 -1,4
Chile (CL) 120 174 200 207 203 200 66,7 -1,5
Portugal (Pt) 379 261 243 194 192 195 -48,5 1,6
rumänien (ro) 245 248 205 191 191 191 -22,0 0,0
Australien (AU) 59 140 170 145 146 146 147,5 0,0
Moldawien (MD) ** ** ** 151 147 143 ** -2,7
Südafrika (ZA) 100 117 131 128 123 122 22,0 -0,8
Griechenland (eL) 150 129 115 106 106 106 -29,3 0,0
Deutschland (DE) 95 105 102 103 103 103 8,4 0,0
russland ** ** ** 90 93 95 ** 5,6
Brasilien (Br) ** ** 92 84 82 81 ** -3,6
Ungarn (HU) 138 91 68 68 69 69 -50,0 0,0
Bulgarien ** ** ** 65 67 67 ** 3,1
Österreich (At) 58 51 50 48 49 48 -17,2 -2,0
Neuseeland (NZ) 6 13 37 39 39 39 550,0 0,0
Schweiz (CH) 15 15 15 15 15 15 -93,3 -93,3
Welt / World 8.381 7.847 7.645 7.390 7.409 7.402 -11,7 -0,1
eU / european Union 4.121 3.547 3.654 3.312 ** ** ** **
rebflächen nach Ländern 1990 – 2019Winegrape areas 1990 – 2019 (selected countries)
Gesamtrebfläche (mit erzeugung von tafeltrauben, rosinen etc.) / total vineyard area (incl. table grapes, raisins etc.) * Vorhersage / Forecast oIV ** Vergleichszahlen fehlen / no figures available
Quelle / Source: Deutsches Weininstitut, nach Angaben des office International de la Vigne et du Vin, Paris

7r e B F L Ä C H e N / W I N e G r A P e A r e A S
D e u t s c h e r We i n S t a t i s t i k 2 0 2 0 / 2 0 2 1
Übersicht / table 2Betriebe (ab 0,5 ha) mit bestockter rebfläche 2010 und 2016Structure of commercial cultivation of winegrape areas in Germany 2010 and 2016
Betriebsgröße (Rebfläche in ha) /Size (vineyard area in ha)
2010 2016Veränderung (%) /
Change (%)
Betriebe /Enterprises
Rebfläche / Vineyard area
Betriebe /Enterprises
Rebfläche / Vineyard area
Betriebe /Enterprises
Rebfläche / Vineyard area
0,5 bis 1,0 / from 0,5 to 1,0 5.660 4.039 3.316 2.371 -41,4 -41,3
1,0 bis 3,0 / from 1,0 to 3,0 6.294 11.172 4.684 8.356 -25,6 -25,2
3,0 bis 5,0 / from 3,0 to 5,0 2.620 10.285 2.073 8.090 -20,9 -21,3
5,0 bis 10,0 / from 5,0 to 10,0 3.310 23.687 2.787 20.225 -15,8 -14,6
10,0 bis 20,0 / from 10,0 to 20,0 2.057 28.092 2.181 30.149 6,0 7,3
20,0 und mehr / 20,0 and more 617 20.183 890 29.760 44,2 47,5
Insgesamt / total 20.558 97.458 15.931 98.951 -22,5 1,5
Quelle / Source: Statistisches Bundesamt / Federal Statistical office (Destatis)
8 r e B F L Ä C H e N / W I N e G r A P e A r e A S
D e u t s c h e r We i n S t a t i s t i k 2 0 2 0 / 2 0 2 1
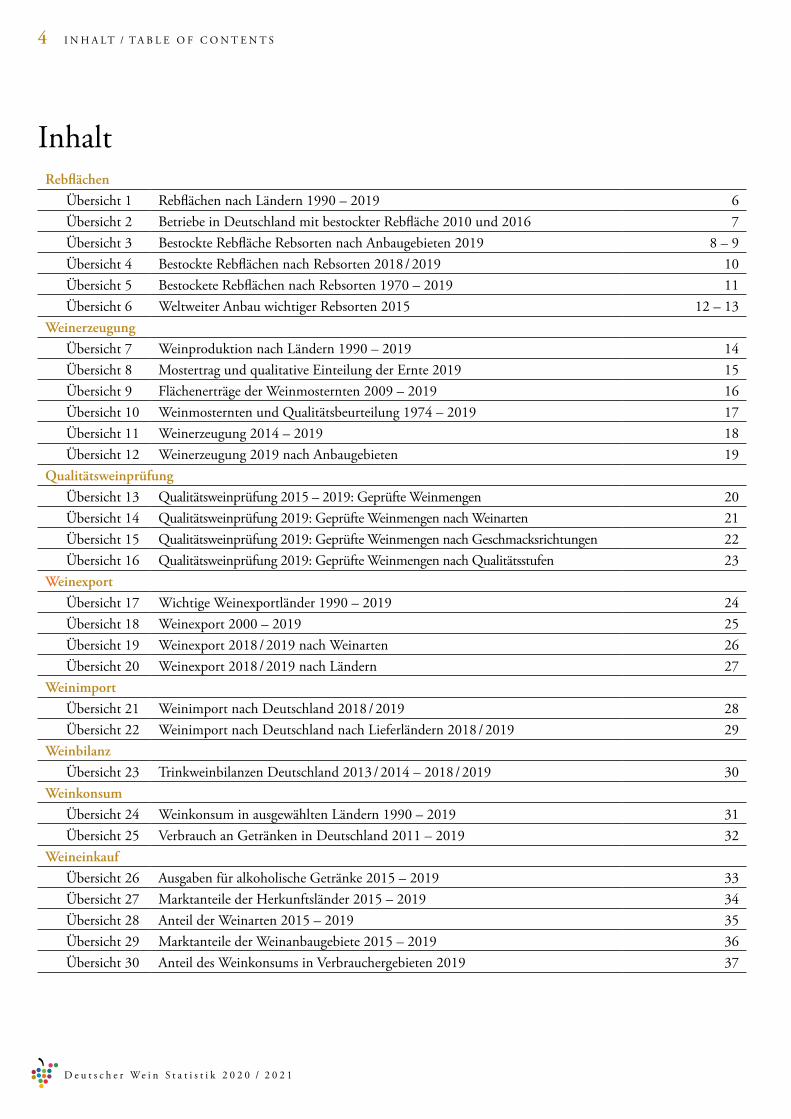
Übersicht / table 3
Anbaugebiet (ha) / Wine-growing regionAnteil weiß : rot / Proportion white : red
Rebsorten /Grape varieties
Rebfläche in ha /Vineyard area in ha
Rebfläche in % /Vineyard area in %
rheinhessen, 26.860 ha72 : 28
rieslingMüllerThurgauDornfelderSilvanerGrauer BurgunderSpätburgunderWeißer BurgunderPortugieserChardonnayKerner Scheurebe
4.8554.0843.3462.0981.9571.4711.4551.057 827 714 698
18,115,212,5 7,8 7,3 5,5 5,1 3,9 3,1 2,7 2,6
Pfalz, 23.684 ha66 : 34
rieslingDornfelderGrauer BurgunderMüllerThurgauSpätburgunderWeißer BurgunderPortugieserChardonnayKerner
5.8952.8691.8301.8081.6911.3531.280 786 730
24,912,1 7,7 7,6 7,1 5,7 5,4 3,3 3,1
Baden, 15.836 ha60 : 40
SpätburgunderMüllerThurgauGrauer BurgunderWeißer BurgunderGutedelriesling
5.3332.3572.1901.5791.088 998
33,714,913,8 10,0 6,9 6,3
Württemberg, 11.394 ha32 : 68
rieslingtrollingerLembergerSchwarzrieslingSpätburgunder
2.1252.0821.7771.3351.323
18,718,315,611,711,6
Mosel, 8.744 ha91 : 9
rieslingMüllerThurgauelblingSpätburgunderWeißer Burgunder
5.435 889 465 408 355
62,210,2 5,3 4,7 4,1
Bestockte rebflächen und wichtige rebsorten nach Anbaugebieten 2019Winegrape areas and important grape varieties 2019 (regional overview)
Quelle / Source: Statistisches Bundesamt / Federal Statistical office (Destatis) (Stand 31.07.2019)

9r e B F L Ä C H e N / W I N e G r A P e A r e A S
D e u t s c h e r We i n S t a t i s t i k 2 0 2 0 / 2 0 2 1
Übersicht / table 3
Anbaugebiet (ha) / Wine-growing regionAnteil weiß : rot / Proportion white : red
Rebsorten /Grape varieties
Rebfläche in ha /Vineyard area in ha
Rebfläche in % /Vineyard area in %
Franken, 6.137 ha82 : 18
SilvanerMüllerThurgauBacchusrieslingDomina
1.5221.493 754 337 316
24,824,312,3 5,5 5,1
Nahe, 4.239 ha76 : 24
rieslingMüllerThurgauDornfelderGrauer BurgunderWeißer Burgunder
1.227 507 413 347 313
28,912,0 9,7 8,2 7,4
rheingau, 3.185 ha86 : 14
rieslingSpätburgunder
2.475 388
77,712,2
SaaleUnstrut, 798 ha 75 : 25
MüllerThurgauWeißer BurgunderrieslingDornfelderBacchus
121 109 71 54 51
15,213,7 8,9 6,8 6,4
Ahr, 562 ha18 : 82
SpätburgunderrieslingFrühburgunderregentPortugieser
367 46 34 17 16
65,3 8,2 6,0 3,0 2,8
Sachsen, 493 ha82 : 18
MüllerThurgaurieslingWeißer BurgunderGrauer BurgunderSpätburgunder
70 62 61 47 39
14,212,612,4 9,5 7,9
Mittelrhein, 468 ha85 : 15
rieslingSpätburgunderMüllerThurgauWeißer Burgunder
304 47 23 21
65,010,0 4,9 4,5
Hessische Bergstraße, 463 ha 79 : 21
rieslingGrauer BurgunderSpätburgunder MüllerThurgau
184 56 51 25
39,712,111,0 5,4
Bestockte rebflächen und wichtige rebsorten nach Anbaugebieten 2019Winegrape areas and important grape varieties 2019 (regional overview)
Quelle / Source: Statistisches Bundesamt / Federal Statistical office (Destatis) (Stand 31.07.2019)

10 r e B F L Ä C H e N / W I N e G r A P e A r e A S
D e u t s c h e r We i n S t a t i s t i k 2 0 2 0 / 2 0 2 1
Übersicht / table 4
Rebsorten / Grape varieties
1995 2018 2019Veränderung seit 1995 / Change since 1995 (ha)
ha ha % ha % plus minusriesling 23.139 23.960 23,3 24.049 23,3 910 MüllerThurgau 23.489 12.057 11,7 11.736 11,4 -11.753 Grauburgunder 2.535 6.713 6,5 7.069 6,9 4.534 Weißburgunder 1.822 5.540 5,4 5.747 5,6 3.925 Silvaner 7.546 4.744 4,6 4.664 4,5 -2.882 Kerner 7.560 2.463 2,4 2.357 2,3 -5.203 Chardonnay 271 2.100 2,0 2.222 2,2 1.951 Bacchus 3.449 1.667 1,6 1.649 1,6 -1.800 Sauvignon Blanc - 1.324 1,3 1.498 1,5 1.498 Scheurebe 3.606 1.412 1,4 1.417 1,4 -2.189 Gutedel 1.316 1.121 1,1 1.115 1,1 -201 traminer 837 1.057 1,0 1.097 1,1 260 elbling 1.138 493 0,5 482 0,5 -656 ortega 1.246 440 0,4 415 0,4 -831 Huxelrebe 1.447 424 0,4 396 0,4 -1.051 Weißweinsorten gesamt 85.472 68.411 66,5 68.911 66,9 -16.561
Spätburgunder 7.199 11.762 11,4 11.717 11,4 4.518 Dornfelder 1.883 7.581 7,4 7.498 7,3 5.615 Portugieser 4.440 2.799 2,7 2.670 2,6 -1.770 trollinger 2.526 2.172 2,1 2.116 2,1 -410 Lemberger 919 1.912 1,9 1.934 1,9 1.015 Schwarzriesling 2.116 1.910 1,9 1.859 1,8 -257 regent - 1.784 1,7 1.754 1,7 1.754 Merlot - 696 0,7 744 0,7 744 St. Laurent 68 618 0,6 610 0,6 542 Acolon - 461 0,4 459 0,4 459 Cabernet Sauvignon - 399 0,4 424 0,4 424 Domina 109 366 0,4 360 0,3 251 Cabernet Mitos - 300 0,3 298 0,3 298 Cabernet Dorsa - 263 0,3 266 0,3 266 Frühburgunder 48 241 0,2 237 0,2 189 Dunkelfelder 197 227 0,2 215 0,2 18 Rotweinsorten gesamt 20.162 34.462 33,5 34.168 33,1 14.006 Best. Gesamtrebfläche 105.634 102.873 100,0 103.079 100,0 -2.555
Bestockte rebfläche nach rebsorten 2018 / 2019Winegrape areas 2018 / 2019 (varietal overview)
Quelle / Source: Statistisches Bundesamt / Federal Statistical office (Destatis)

11r e B F L Ä C H e N / W I N e G r A P e A r e A S
D e u t s c h e r We i n S t a t i s t i k 2 0 2 0 / 2 0 2 1
Rebsorten / Grape varieties
1970 1975 1980 1985 1990 1995 2000 2005 2010 2016 2017 2018 2019
riesling 23,6 20,9 19,9 19,7 20,8 21,9 21,1 20,4 22,1 23,1 23,2 23,3 23,3
MüllerThurgau 25,1 27,5 26,2 25,3 24,2 22,2 19,1 14,1 13,3 12,3 12,1 11,7 11,4
Grauburgunder 3,1 3,7 3,6 3,1 2,5 2,4 2,6 4,1 4,6 6,0 6,2 6,5 6,9
Weißburgunder 0,9 0,9 0,9 0,9 1,0 1,7 2,5 3,3 4,0 5,0 5,2 5,4 5,6
Silvaner 22,8 16,1 10,2 8,1 7,7 7,1 6,4 5,3 5,1 4,8 4,7 4,6 4,5
Kerner 0,1 2,4 5,7 7,0 7,5 7,2 6,2 4,2 3,4 2,6 2,5 2,4 2,3
Chardonnay 0,0 0,0 0,0 0,0 0,0 0,2 0,6 1,0 1,3 1,8 1,9 2,0 2,2
Bacchus 0,1 1,3 3,1 3,6 3,5 3,3 3,1 2,2 1,9 1,7 1,7 1,6 1,6
Sauvignon Blanc - - - - - - - 0,2 0,5 0,9 1,1 1,3 1,5
Scheurebe 1,5 2,9 4,1 4,4 3,9 3,4 2,8 1,8 1,6 1,4 1,4 1,4 1,4
Gutedel 1,5 1,4 1,3 1,3 1,3 1,2 1,1 1,1 1,1 1,1 1,1 1,1 1,1
Weißweinrebsorten gesamt 85,3 87,6 88,6 86,8 83,8 80,9 74,0 63,2 64,1 65,9 66,2 66,6 66,9
Spätburgunder 3,6 3,5 3,8 4,5 5,5 6,8 8,8 11,4 11,5 11,5 11,4 11,4 11,4
Dornfelder 0,0 0,0 0,0 0,6 1,2 1,8 4,2 8,1 7,8 7,6 7,5 7,4 7,3
Portugieser 6,7 4,6 3,2 3,2 4,0 4,2 4,8 4,7 4,0 3,0 2,9 2,7 2,6
trollinger 2,3 2,1 2,2 2,2 2,3 2,4 2,5 2,5 2,4 2,2 2,2 2,1 2,1
Lemberger 0,5 0,4 0,4 0,5 0,7 0,9 1,1 1,6 1,7 1,8 1,8 1,9 1,9
Schwarzriesling 0,9 1,0 1,1 1,5 1,8 2,0 2,3 2,4 2,2 1,9 1,9 1,9 1,8
regent 0,0 0,0 0,0 0,0 0,0 0,0 0,4 2,1 2,0 1,8 1,8 1,7 1,7
Rotweinrebsorten gesamt 14,7 12,4 11,4 13,2 16,2 19,1 26,0 36,8 35,9 34,1 33,8 33,5 33,1
Quelle / Source: Statistisches Bundesamt / Federal Statistical office (Destatis)
Übersicht / table 5Bestockte rebflächen nach rebsorten 1970 – 2019 in Deutschland in %Winegrape areas 1970 – 2019 (varietal overview)
12 r e B F L Ä C H e N / W I N e G r A P e A r e A S
D e u t s c h e r We i n S t a t i s t i k 2 0 2 0 / 2 0 2 1
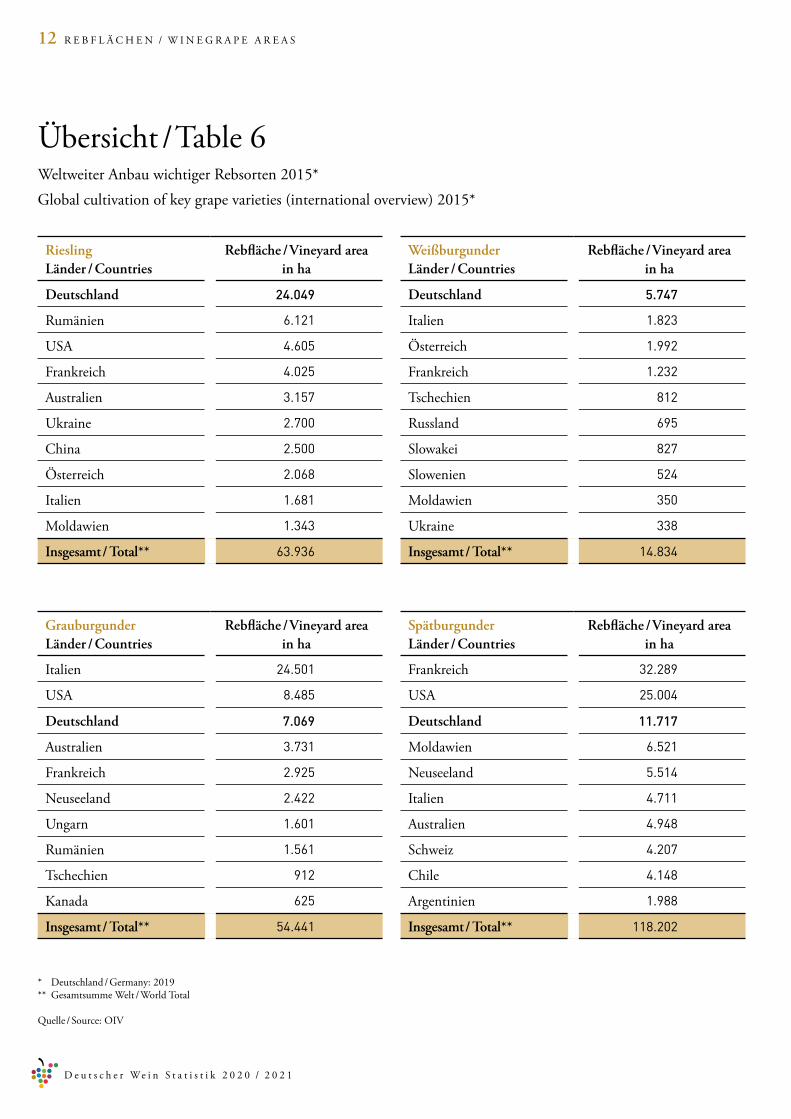
* Deutschland / Germany: 2019** Gesamtsumme Welt / World total Quelle / Source: oIV
Übersicht / table 6Weltweiter Anbau wichtiger rebsorten 2015*Global cultivation of key grape varieties (international overview) 2015*
RieslingLänder / Countries
Rebfläche / Vineyard area in ha
Deutschland 24.049
rumänien 6.121
USA 4.605
Frankreich 4.025
Australien 3.157
Ukraine 2.700
China 2.500
Österreich 2.068
Italien 1.681
Moldawien 1.343
Insgesamt / Total** 63.936
GrauburgunderLänder / Countries
Rebfläche / Vineyard area in ha
Italien 24.501
USA 8.485
Deutschland 7.069
Australien 3.731
Frankreich 2.925
Neuseeland 2.422
Ungarn 1.601
rumänien 1.561
tschechien 912
Kanada 625
Insgesamt / Total** 54.441
Weißburgunder Länder / Countries
Rebfläche / Vineyard area in ha
Deutschland 5.747
Italien 1.823
Österreich 1.992
Frankreich 1.232
tschechien 812
russland 695
Slowakei 827
Slowenien 524
Moldawien 350
Ukraine 338
Insgesamt / Total** 14.834
Spätburgunder Länder / Countries
Rebfläche / Vineyard area in ha
Frankreich 32.289
USA 25.004
Deutschland 11.717
Moldawien 6.521
Neuseeland 5.514
Italien 4.711
Australien 4.948
Schweiz 4.207
Chile 4.148
Argentinien 1.988
Insgesamt / Total** 118.202

13r e B F L Ä C H e N / W I N e G r A P e A r e A S
D e u t s c h e r We i n S t a t i s t i k 2 0 2 0 / 2 0 2 1
* Deutschland / Germany: 2019** Gesamtsumme Welt / World total Quelle / Source: oIV
Übersicht / table 6Weltweiter Anbau wichtiger rebsorten 2015*Global cultivation of key grape varieties (international overview) 2015*
Müller-ThurgauLänder / Countries
Rebfläche / Vineyard area in ha
Deutschland 11.736
Österreich 1.839
Ungarn 1.729
Slowakei 1.561
tschechien 1.546
Italien 1.421
Schweiz 464
Luxemburg 316
Moldawien 173
russland 106
Insgesamt / Total** 22.201
LembergerLänder / Countries
Rebfläche / Vineyard area in ha
Ungarn 7.229
Österreich 3.011
Deutschland 1.934
Slowakei 1.641
tschechien 1.142
rumänien 729
Slowenien 680
Kroatien 517
Serbien 268
Mazedonien 9
Insgesamt / Total** 17.075
Gewürztraminer Länder / Countries
Rebfläche / Vineyard area in ha
Frankreich 3.427
Moldawien 2.731
Deutschland 1.097
USA 1.060
Italien 1.021
Ukraine 961
Bulgarien 822
Ungarn 693
tschechien 658
rumänien 469
Insgesamt / Total** 15.654
Silvaner Länder / Countries
Rebfläche / Vineyard area in ha
Deutschland 4.664
Frankreich 1.046
Schweiz 250
Slowakei 208
tschechien 140
Insgesamt / Total** 6.693
14 W e I N e r Z e U G U N G / W I N e P r o D U C t I o N
D e u t s c h e r We i n S t a t i s t i k 2 0 2 0 / 2 0 2 1
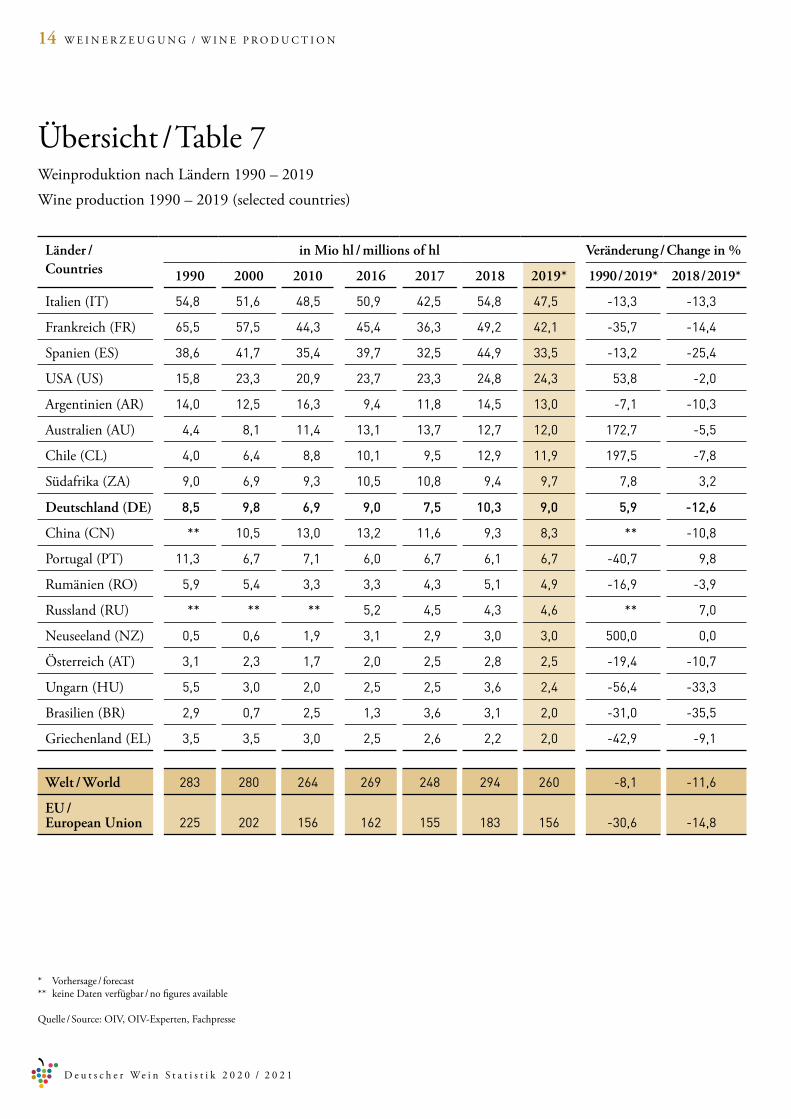
Übersicht / table 7
Länder / Countries
in Mio hl / millions of hl Veränderung / Change in %
1990 2000 2010 2016 2017 2018 2019* 1990 / 2019* 2018 / 2019*
Italien (It) 54,8 51,6 48,5 50,9 42,5 54,8 47,5 -13,3 -13,3
Frankreich (Fr) 65,5 57,5 44,3 45,4 36,3 49,2 42,1 -35,7 -14,4
Spanien (eS) 38,6 41,7 35,4 39,7 32,5 44,9 33,5 -13,2 -25,4
USA (US) 15,8 23,3 20,9 23,7 23,3 24,8 24,3 53,8 -2,0
Argentinien (Ar) 14,0 12,5 16,3 9,4 11,8 14,5 13,0 -7,1 -10,3
Australien (AU) 4,4 8,1 11,4 13,1 13,7 12,7 12,0 172,7 -5,5
Chile (CL) 4,0 6,4 8,8 10,1 9,5 12,9 11,9 197,5 -7,8
Südafrika (ZA) 9,0 6,9 9,3 10,5 10,8 9,4 9,7 7,8 3,2
Deutschland (DE) 8,5 9,8 6,9 9,0 7,5 10,3 9,0 5,9 -12,6
China (CN) ** 10,5 13,0 13,2 11,6 9,3 8,3 ** -10,8
Portugal (Pt) 11,3 6,7 7,1 6,0 6,7 6,1 6,7 -40,7 9,8
rumänien (ro) 5,9 5,4 3,3 3,3 4,3 5,1 4,9 -16,9 -3,9
russland (rU) ** ** ** 5,2 4,5 4,3 4,6 ** 7,0
Neuseeland (NZ) 0,5 0,6 1,9 3,1 2,9 3,0 3,0 500,0 0,0
Österreich (At) 3,1 2,3 1,7 2,0 2,5 2,8 2,5 -19,4 -10,7
Ungarn (HU) 5,5 3,0 2,0 2,5 2,5 3,6 2,4 -56,4 -33,3
Brasilien (Br) 2,9 0,7 2,5 1,3 3,6 3,1 2,0 -31,0 -35,5
Griechenland (eL) 3,5 3,5 3,0 2,5 2,6 2,2 2,0 -42,9 -9,1
Welt / World 283 280 264 269 248 294 260 -8,1 -11,6
EU / European Union 225 202 156 162 155 183 156 -30,6 -14,8
Weinproduktion nach Ländern 1990 – 2019Wine production 1990 – 2019 (selected countries)
* Vorhersage / forecast** keine Daten verfügbar / no figures available
Quelle / Source: oIV, oIVexperten, Fachpresse

15W e I N e r Z e U G U N G / W I N e P r o D U C t I o N
D e u t s c h e r We i n S t a t i s t i k 2 0 2 0 / 2 0 2 1
Übersicht / table 8
Anbaugebiet /Wine-growing region
Ertragsrebfläche / Vineyard area
Mostertrag / Grape must yields
Qualtätsstufen / Potential quality categories (hl)
ha hl hl / ha Dt. Wein, Landwein
Qualitätswein Prädikatswein
Ahr 553 32.652 59 1.420 30.693 540
Baden 15.537 1.235.752 80 30.473 175.321 1.029.958
Franken 6.102 343.350 56 1.658 61.003 280.689
Hessische Bergstraße 452 26.138 58 - 4.538 21.600
Mittelrhein 462 22.744 49 77 15.587 7.080
Mosel 8.556 624.302 73 1.619 384.723 237.962
Nahe 4.150 338.744 82 5.748 239.625 93.371
Pfalz 23.003 2.117.669 92 137.770 1.586.357 393.542
rheingau 3.177 199.954 63 - 38.401 161.553
rheinhessen 26.053 2.441.692 94 142.318 1.570.085 729.289
SaaleUnstrut 777 36.818 47 18 28.511 8.289
Sachsen 500 25.608 51 533 13.822 11.253
Württemberg 11.175 875.293 78 - 76.479 798.814
andere - 4.260 81 4.258 - -
Deutschland 100.516 8.324.976 83 325.892 4.225.145 3.773.940
Mostertrag und qualitative einteilung der ernte 2019Grape must yields and potential quality categories of the 2019 harvest
Quelle / Source: Statistisches Bundesamt und Deutscher Weinbauverband e.V.

16 W e I N e r Z e U G U N G / W I N e P r o D U C t I o N
D e u t s c h e r We i n S t a t i s t i k 2 0 2 0 / 2 0 2 1
Übersicht / table 9
Anbaugebiet /Wine-growing region
2009 2010 2011 2012 2013 2014 2015 2016 2017 2018 2019 Ø 2009 – 2019
Ahr 61 62 86 55 63 80 72 72 67 87 59 70
Baden 78 69 89 76 70 85 75 84 65 97 80 80
Franken 76 60 62 78 71 77 69 78 76 86 56 72
Hessische Bergstraße 72 45 73 70 50 69 70 71 66 94 58 69
Mittelrhein 63 52 81 60 53 62 64 55 50 83 49 63
Mosel 92 79 111 78 74 101 88 82 64 108 73 88
Nahe 77 67 83 76 80 82 76 75 61 95 82 79
Pfalz 102 70 95 103 97 96 99 96 91 109 92 96
rheingau 70 50 74 75 60 73 65 64 59 89 63 69
rheinhessen 99 77 101 101 98 100 97 99 76 112 94 97
SaaleUnstrut 37 46 76 35 59 56 71 73 74 62 47 60
Sachsen 25 29 53 43 32 42 53 59 53 52 51 46
Württemberg 97 71 90 102 82 93 97 103 75 103 78 91
Deutschland 91 71 93 91 85 92 89 91 75 104 83 89
Flächenerträge der Weinmosternten 2009 – 2019 (in hl / ha)Grape must yields in hl / ha 2009 – 2019 (regional and vintage overview)
Quelle / Source: Statistisches Bundesamt und Deutscher Weinbauverband e.V., eigene Berechnungen
17W e I N e r Z e U G U N G / W I N e P r o D U C t I o N
D e u t s c h e r We i n S t a t i s t i k 2 0 2 0 / 2 0 2 1
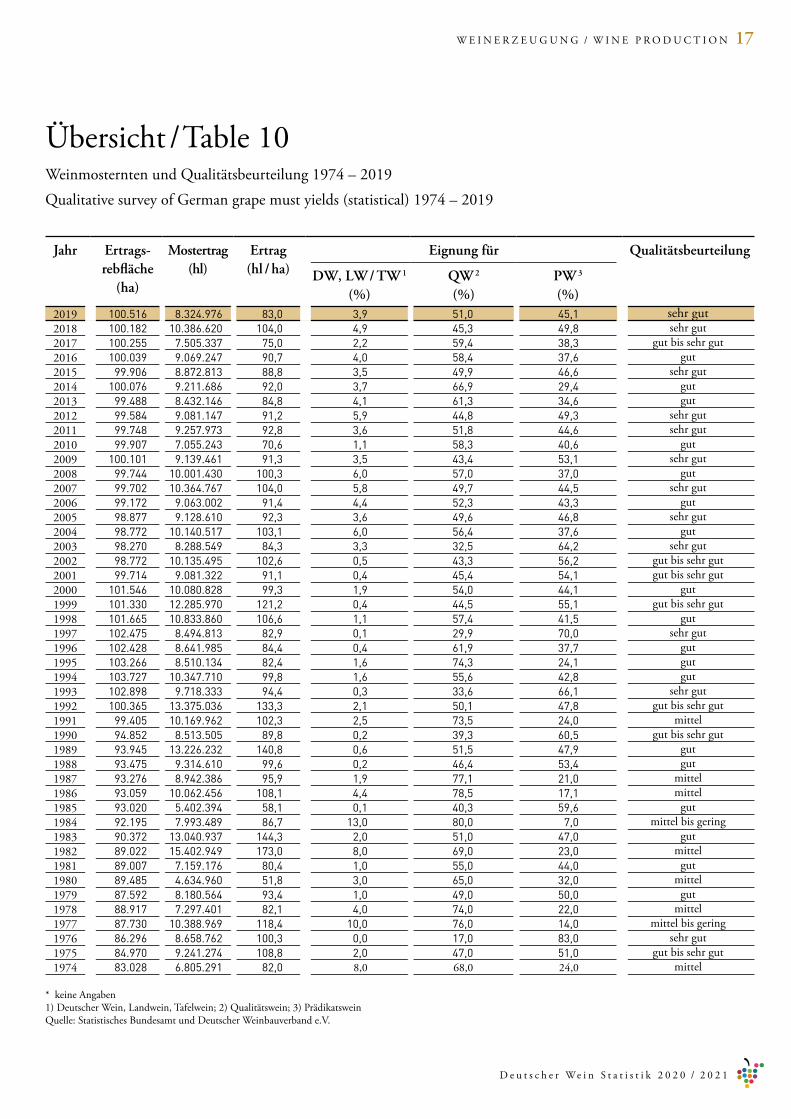
Übersicht / table 10
Jahr Ertrags-rebfläche
(ha)
Mostertrag(hl)
Ertrag(hl / ha)
Eignung für Qualitätsbeurteilung
DW, LW / TW 1
(%)QW 2
(%)PW 3
(%)2019 100.516 8.324.976 83,0 3,9 51,0 45,1 sehr gut2018 100.182 10.386.620 104,0 4,9 45,3 49,8 sehr gut2017 100.255 7.505.337 75,0 2,2 59,4 38,3 gut bis sehr gut2016 100.039 9.069.247 90,7 4,0 58,4 37,6 gut2015 99.906 8.872.813 88,8 3,5 49,9 46,6 sehr gut2014 100.076 9.211.686 92,0 3,7 66,9 29,4 gut2013 99.488 8.432.146 84,8 4,1 61,3 34,6 gut2012 99.584 9.081.147 91,2 5,9 44,8 49,3 sehr gut2011 99.748 9.257.973 92,8 3,6 51,8 44,6 sehr gut2010 99.907 7.055.243 70,6 1,1 58,3 40,6 gut2009 100.101 9.139.461 91,3 3,5 43,4 53,1 sehr gut2008 99.744 10.001.430 100,3 6,0 57,0 37,0 gut2007 99.702 10.364.767 104,0 5,8 49,7 44,5 sehr gut2006 99.172 9.063.002 91,4 4,4 52,3 43,3 gut2005 98.877 9.128.610 92,3 3,6 49,6 46,8 sehr gut2004 98.772 10.140.517 103,1 6,0 56,4 37,6 gut2003 98.270 8.288.549 84,3 3,3 32,5 64,2 sehr gut2002 98.772 10.135.495 102,6 0,5 43,3 56,2 gut bis sehr gut2001 99.714 9.081.322 91,1 0,4 45,4 54,1 gut bis sehr gut2000 101.546 10.080.828 99,3 1,9 54,0 44,1 gut1999 101.330 12.285.970 121,2 0,4 44,5 55,1 gut bis sehr gut1998 101.665 10.833.860 106,6 1,1 57,4 41,5 gut1997 102.475 8.494.813 82,9 0,1 29,9 70,0 sehr gut1996 102.428 8.641.985 84,4 0,4 61,9 37,7 gut1995 103.266 8.510.134 82,4 1,6 74,3 24,1 gut1994 103.727 10.347.710 99,8 1,6 55,6 42,8 gut1993 102.898 9.718.333 94,4 0,3 33,6 66,1 sehr gut1992 100.365 13.375.036 133,3 2,1 50,1 47,8 gut bis sehr gut1991 99.405 10.169.962 102,3 2,5 73,5 24,0 mittel1990 94.852 8.513.505 89,8 0,2 39,3 60,5 gut bis sehr gut1989 93.945 13.226.232 140,8 0,6 51,5 47,9 gut1988 93.475 9.314.610 99,6 0,2 46,4 53,4 gut1987 93.276 8.942.386 95,9 1,9 77,1 21,0 mittel1986 93.059 10.062.456 108,1 4,4 78,5 17,1 mittel1985 93.020 5.402.394 58,1 0,1 40,3 59,6 gut1984 92.195 7.993.489 86,7 13,0 80,0 7,0 mittel bis gering1983 90.372 13.040.937 144,3 2,0 51,0 47,0 gut1982 89.022 15.402.949 173,0 8,0 69,0 23,0 mittel1981 89.007 7.159.176 80,4 1,0 55,0 44,0 gut1980 89.485 4.634.960 51,8 3,0 65,0 32,0 mittel1979 87.592 8.180.564 93,4 1,0 49,0 50,0 gut1978 88.917 7.297.401 82,1 4,0 74,0 22,0 mittel1977 87.730 10.388.969 118,4 10,0 76,0 14,0 mittel bis gering1976 86.296 8.658.762 100,3 0,0 17,0 83,0 sehr gut1975 84.970 9.241.274 108,8 2,0 47,0 51,0 gut bis sehr gut1974 83.028 6.805.291 82,0 8,0 68,0 24,0 mittel
Weinmosternten und Qualitätsbeurteilung 1974 – 2019Qualitative survey of German grape must yields (statistical) 1974 – 2019
* keine Angaben1) Deutscher Wein, Landwein, tafelwein; 2) Qualitätswein; 3) PrädikatsweinQuelle: Statistisches Bundesamt und Deutscher Weinbauverband e.V.
18 W e I N e r Z e U G U N G / W I N e P r o D U C t I o N
D e u t s c h e r We i n S t a t i s t i k 2 0 2 0 / 2 0 2 1
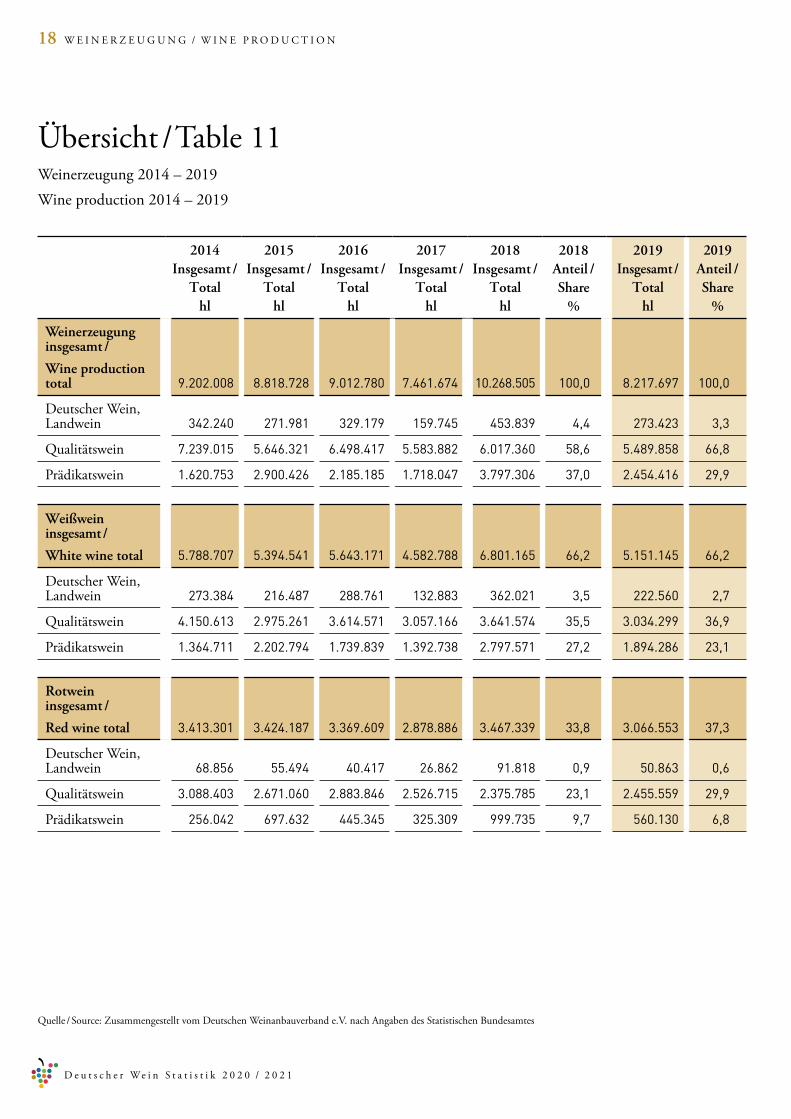
Übersicht / table 11Weinerzeugung 2014 – 2019Wine production 2014 – 2019
Quelle / Source: Zusammengestellt vom Deutschen Weinanbauverband e.V. nach Angaben des Statistischen Bundesamtes
2014 Insgesamt /
Totalhl
2015Insgesamt /
Totalhl
2016Insgesamt /
Totalhl
2017Insgesamt /
Totalhl
2018Insgesamt /
Totalhl
2018Anteil /Share
%
2019Insgesamt /
Totalhl
2019Anteil /Share
%
Weinerzeugung insgesamt /
Wine production total 9.202.008 8.818.728 9.012.780 7.461.674 10.268.505 100,0 8.217.697 100,0
Deutscher Wein, Landwein 342.240 271.981 329.179 159.745 453.839 4,4 273.423 3,3
Qualitätswein 7.239.015 5.646.321 6.498.417 5.583.882 6.017.360 58,6 5.489.858 66,8
Prädikatswein 1.620.753 2.900.426 2.185.185 1.718.047 3.797.306 37,0 2.454.416 29,9
Weißwein insgesamt /
White wine total 5.788.707 5.394.541 5.643.171 4.582.788 6.801.165 66,2 5.151.145 66,2
Deutscher Wein, Landwein 273.384 216.487 288.761 132.883 362.021 3,5 222.560 2,7
Qualitätswein 4.150.613 2.975.261 3.614.571 3.057.166 3.641.574 35,5 3.034.299 36,9
Prädikatswein 1.364.711 2.202.794 1.739.839 1.392.738 2.797.571 27,2 1.894.286 23,1
Rotwein insgesamt /
Red wine total 3.413.301 3.424.187 3.369.609 2.878.886 3.467.339 33,8 3.066.553 37,3
Deutscher Wein, Landwein 68.856 55.494 40.417 26.862 91.818 0,9 50.863 0,6
Qualitätswein 3.088.403 2.671.060 2.883.846 2.526.715 2.375.785 23,1 2.455.559 29,9
Prädikatswein 256.042 697.632 445.345 325.309 999.735 9,7 560.130 6,8
19W e I N e r Z e U G U N G / W I N e P r o D U C t I o N
D e u t s c h e r We i n S t a t i s t i k 2 0 2 0 / 2 0 2 1
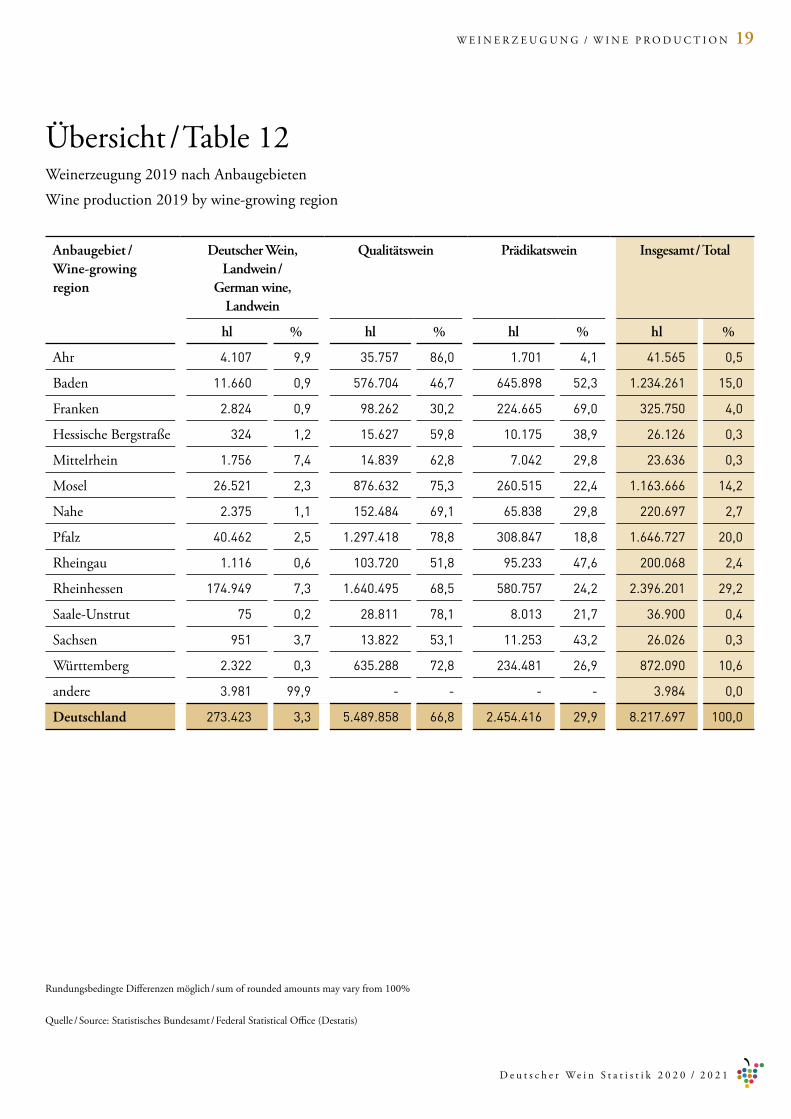
Übersicht / table 12
Anbaugebiet /Wine-growing region
Deutscher Wein, Landwein /
German wine, Landwein
Qualitätswein Prädikatswein Insgesamt / Total
hl % hl % hl % hl %
Ahr 4.107 9,9 35.757 86,0 1.701 4,1 41.565 0,5
Baden 11.660 0,9 576.704 46,7 645.898 52,3 1.234.261 15,0
Franken 2.824 0,9 98.262 30,2 224.665 69,0 325.750 4,0
Hessische Bergstraße 324 1,2 15.627 59,8 10.175 38,9 26.126 0,3
Mittelrhein 1.756 7,4 14.839 62,8 7.042 29,8 23.636 0,3
Mosel 26.521 2,3 876.632 75,3 260.515 22,4 1.163.666 14,2
Nahe 2.375 1,1 152.484 69,1 65.838 29,8 220.697 2,7
Pfalz 40.462 2,5 1.297.418 78,8 308.847 18,8 1.646.727 20,0
rheingau 1.116 0,6 103.720 51,8 95.233 47,6 200.068 2,4
rheinhessen 174.949 7,3 1.640.495 68,5 580.757 24,2 2.396.201 29,2
SaaleUnstrut 75 0,2 28.811 78,1 8.013 21,7 36.900 0,4
Sachsen 951 3,7 13.822 53,1 11.253 43,2 26.026 0,3
Württemberg 2.322 0,3 635.288 72,8 234.481 26,9 872.090 10,6
andere 3.981 99,9 - - - - 3.984 0,0
Deutschland 273.423 3,3 5.489.858 66,8 2.454.416 29,9 8.217.697 100,0
Weinerzeugung 2019 nach AnbaugebietenWine production 2019 by winegrowing region
rundungsbedingte Differenzen möglich / sum of rounded amounts may vary from 100%
Quelle / Source: Statistisches Bundesamt / Federal Statistical office (Destatis)
20 Q U A L I t Ä t S W e I N P r Ü F U N G / Q U A L I t Y C o N t r o L t e S t S
D e u t s c h e r We i n S t a t i s t i k 2 0 2 0 / 2 0 2 1
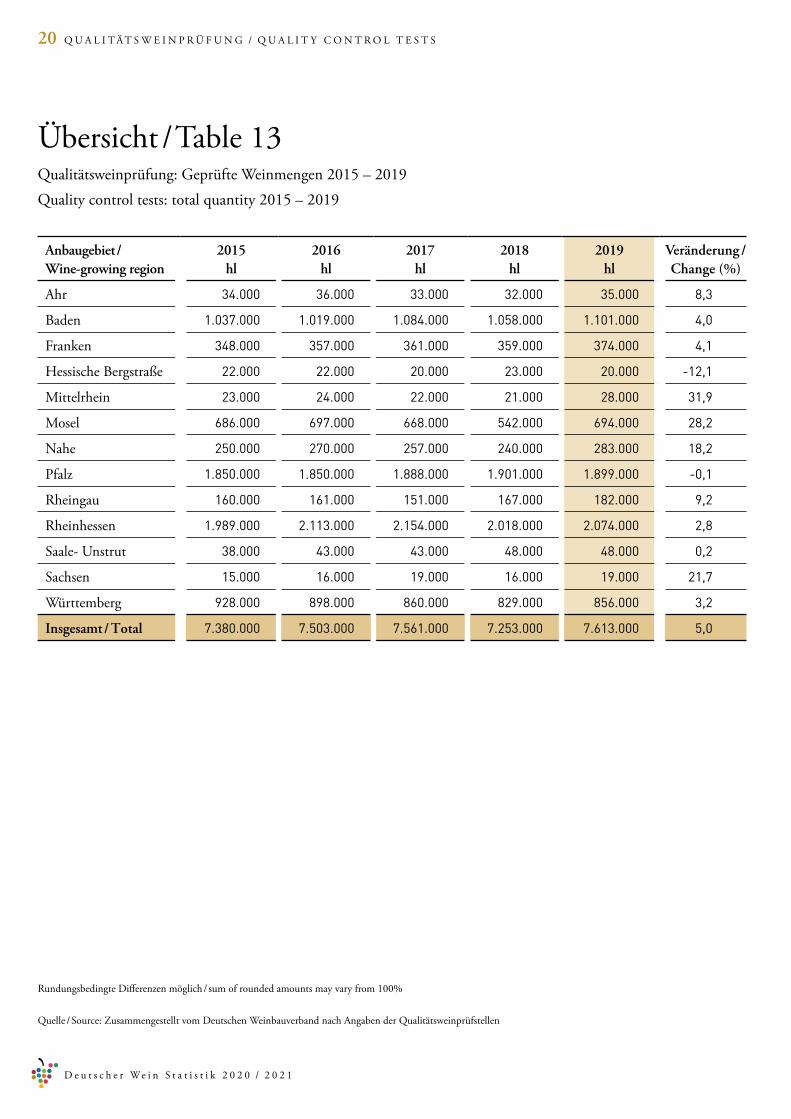
Übersicht / table 13Qualitätsweinprüfung: Geprüfte Weinmengen 2015 – 2019Quality control tests: total quantity 2015 – 2019
rundungsbedingte Differenzen möglich / sum of rounded amounts may vary from 100%
Quelle / Source: Zusammengestellt vom Deutschen Weinbauverband nach Angaben der Qualitätsweinprüfstellen
Anbaugebiet /Wine-growing region
2015hl
2016 hl
2017hl
2018 hl
2019hl
Veränderung / Change (%)
Ahr 34.000 36.000 33.000 32.000 35.000 8,3
Baden 1.037.000 1.019.000 1.084.000 1.058.000 1.101.000 4,0
Franken 348.000 357.000 361.000 359.000 374.000 4,1
Hessische Bergstraße 22.000 22.000 20.000 23.000 20.000 -12,1
Mittelrhein 23.000 24.000 22.000 21.000 28.000 31,9
Mosel 686.000 697.000 668.000 542.000 694.000 28,2
Nahe 250.000 270.000 257.000 240.000 283.000 18,2
Pfalz 1.850.000 1.850.000 1.888.000 1.901.000 1.899.000 -0,1
rheingau 160.000 161.000 151.000 167.000 182.000 9,2
rheinhessen 1.989.000 2.113.000 2.154.000 2.018.000 2.074.000 2,8
Saale Unstrut 38.000 43.000 43.000 48.000 48.000 0,2
Sachsen 15.000 16.000 19.000 16.000 19.000 21,7
Württemberg 928.000 898.000 860.000 829.000 856.000 3,2
Insgesamt / Total 7.380.000 7.503.000 7.561.000 7.253.000 7.613.000 5,0

21Q U A L I t Ä t S W e I N P r Ü F U N G / Q U A L I t Y C o N t r o L t e S t S
D e u t s c h e r We i n S t a t i s t i k 2 0 2 0 / 2 0 2 1
Übersicht / table 14
Anbaugebiet /Wine-growing region
Weißwein / White Wine
Rotwein / Red Wine Rosé / Rosé Wine* Insgesamt / Total
hl % hl % hl % hl %
Ahr 6.000 0,1 20.000 0,3 8.000 0,1 35.000 0,5
Baden 690.000 9,1 246.000 3,2 165.000 2,2 1.101.000 14,5
Franken 293.000 3,8 44.000 0,6 37.000 0,5 374.000 4,9
Hessische Bergstraße 15.000 0,2 3.000 - 2.000 - 20.000 0,3
Mittelrhein 23.000 0,3 2.000 - 2.000 - 28.000 0,4
Mosel 628.000 8,2 33.000 0,4 33.000 0,4 694.000 9,1
Nahe 210.000 2,8 41.000 0,5 33.000 0,4 283.000 3,7
Pfalz 1.159.000 15,2 497.000 6,5 243.000 3,2 1.899.000 24,9
rheingau 159.000 2,1 11.000 0,2 12.000 0,2 182.000 2,4
rheinhessen 1.388.000 18,2 482.000 6,3 204.000 2,7 2.074.000 27,2
Saale-Unstrut 35.000 0,5 8.000 0,1 4.000 0,1 48.000 0,6
Sachsen 15.000 0,2 2.000 - 2.000 - 19.000 0,3
Württemberg 229.000 3,0 478.000 6,3 149.000 2,0 856.000 11,2
Insgesamt / Total 4.851.000 63,7 1.867.000 24,5 895.000 11,8 7.613.000 100,0
Qualitätsweinprüfung 2019: Geprüfte Weinmengen nach WeinartenQuality control tests 2019: types of wine tested
rundungsbedingte Differenzen möglich / sum of rounded amounts may vary from 100%* rosé, rotling, Weißherbst
Quelle / Source: Zusammengestellt vom Deutschen Weinbauverband nach Angaben der Qualitätsweinprüfstellen

22 Q U A L I t Ä t S W e I N P r Ü F U N G / Q U A L I t Y C o N t r o L t e S t S
D e u t s c h e r We i n S t a t i s t i k 2 0 2 0 / 2 0 2 1
Übersicht / table 15
Anbaugebiet /Wine-growing region
trocken / dry halbtrocken / off-dry
lieblich, süß / mild, sweet
ohne Angaben / no declaration
Insgesamt / Total
hl hl hl hl hl
Ahr 23.000 10.000 3.000 - 35.000
Baden 727.000 222.000 152.000 - 1.101.000
Franken 230.000 116.000 28.000 - 374.000
Hessische Bergstraße 14.000 5.000 2.000 - 20.000
Mittelrhein 12.000 7.000 10.000 - 28.000
Mosel 181.000 96.000 417.000 - 694.000
Nahe 108.000 52.000 123.000 - 283.000
Pfalz 1.048.000 370.000 481.000 - 1.899.000
rheingau 101.000 60.000 21.000 - 182.000
rheinhessen 973.000 384.000 717.000 - 2.074.000
SaaleUnstrut - - - 48.000 48.000
Sachsen 15.000 3.000 - - 19.000
Württemberg 229.000 200.000 427.000 - 856.000
Insgesamt / Total 3.661.000 1.523.000 2.382.000 48.000 7.613.000
Qualitätsweinprüfung 2019: Geprüfte Weinmengen nach GeschmacksrichtungenQuality control tests 2019: styles of wine tested
rundungsbedingte Differenzen möglich / sum of rounded amounts may vary from 100%
Quelle / Source: Zusammengestellt vom Deutschen Weinbauverband nach Angaben der Qualitätsweinprüfstellen

23Q U A L I t Ä t S W e I N P r Ü F U N G / Q U A L I t Y C o N t r o L t e S t S
D e u t s c h e r We i n S t a t i s t i k 2 0 2 0 / 2 0 2 1
Übersicht / table 16Qualitätsweinprüfung 2019: Geprüfte Weinmengen nach QualitätsstufenQuality control tests 2019: quality categories of wine tested
rundungsbedingte Differenzen möglich / sum of rounded amounts may vary from 100%
Quelle / Source: Zusammengestellt vom Deutschen Weinbauverband nach Angaben der Qualitätsweinprüfstellen
Anbaugebiet /Wine-growing region
Qualitätswein / Quality wine
Kabinett Spätlese Auslese BA / TBA / Eiswein
Insgesamt / Total
hl hl hl hl hl hl
Ahr 34.000 - - - - 35.000
Baden 999.000 78.000 21.000 3.000 1.000 1.101.000
Franken 289.000 66.000 17.000 1.000 - 374.000
Hessische Bergstraße 17.000 2.000 1.000 - - 20.000
Mittelrhein 23.000 2.000 3.000 1.000 - 28.000
Mosel 570.000 52.000 53.000 19.000 1.000 694.000
Nahe 254.000 8.000 16.000 6.000 - 283.000
Pfalz 1.806.000 45.000 42.000 3.000 2.000 1.899.000
rheingau 154.000 18.000 9.000 1.000 - 182.000
rheinhessen 1.892.000 30.000 125.000 20.000 8.000 2.074.000
SaaleUnstrut 44.000 2.000 2.000 1.000 - 48.000
Sachsen 18.000 1.000 1.000 - - 19.000
Württemberg 820.000 26.000 8.000 1.000 - 856.000
Insgesamt / Total 6.919.000 328.000 297.000 56.000 13.000 7.613.000

24 W e I N e X P o r t / W I N e e X P o r t S
D e u t s c h e r We i n S t a t i s t i k 2 0 2 0 / 2 0 2 1
Übersicht / table 17Die wichtigsten Weinexportländer 1990 – 2019Wine exports 1990 – 2019 by country – top 10
* Schätzung / preliminary figures** kein Vergleich möglich / no comparison possible*** Bruttoexporte, inklusive reexporten / gross figures, reexported wines included
Quelle / Source: Deutsches Weininstitut, nach Angaben des office International de la Vigne et du Vin, Paris
Länder/Countries
in Mio hl / millions of hl Veränderung / Change in %
1990 2000 2010 2015 2016 2017 2018 2019* 1990 / 2019 2018 / 2019
Spanien 4,3 8,7 17,7 24,7 22,6 23,0 20,0 21,3 395,3 6,5
Italien 13,5 17,0 21,8 20,1 20,6 21,2 19,6 21,6 60,0 10,2
Frankreich 12,3 15,1 13,5 13,9 14,1 15,0 14,2 14,2 15,4 0,0
Chile / Argentinien 0,5 3,5 10,1 11,5 11,7 11,6 11,2 11,4 2.180,0 1,8
Australien / Neuseeland 0,4 3,1 9,2 9,5 9,4 10,4 11,1 10,1 2.425,0 -9,0
Südafrika 0,0 1,4 3,8 4,2 4,3 4,5 4,2 3,2 ** -23,8
USA 1,0 2,9 4,0 4,2 3,8 3,5 3,5 3,6 260,0 2,9
Deutschland*** 2,8 2,4 3,9 3,7 3,6 3,8 3,7 3,8 35,7 2,7
Portugal 1,6 1,6 2,6 2,8 2,8 3,0 3,0 3,0 87,5 0,0
Gesamtexport / Total 44,4 60,0 92,9 105,3 104,1 107,9 108,0 108,0 143,2 0,0

25W e I N e X P o r t / W I N e e X P o r t S
D e u t s c h e r We i n S t a t i s t i k 2 0 2 0 / 2 0 2 1
Übersicht / table 18Weinexport 2000 – 2019*Wine exports 2000 – 2019*
Jahr / Year Menge / Volume Wert / Valuehl 1.000 € € / hl
2019** 1.041.000 305.000 293
2018 1.009.000 307.000 304
2017 1.065.000 308.000 289
2016 997.000 288.000 288
2015 1.058.000 305.000 288
2014 1.191.000 318.000 267
2013 1.307.000 335.000 257
2012 1.305.000 321.000 246
2011 1.435.000 341.000 238
2010 1.715.000 355.000 207
2009 2.068.000 399.000 193
2008 2.231.000 434.000 196
2007 1.924.000 385.000 200
2006 1.865.000 361.000 194
2005 1.721.000 314.000 183
2004 1.897.000 307.000 162
2003 2.159.000 341.000 158
2002 1.932.000 294.000 152
2001 1.902.000 280.000 147
2000 1.996.000 276.000 138
rundungsbedingte Differenzen möglich / sum of rounded amounts may vary from 100%* Nettoausfuhren, ohne reexporte / net exports, without reexported wines** vorläufige Jahresdaten / preliminary figures
Quelle / Source: Verband Deutscher Weinexporteure e.V. nach Angaben des Statistischen Bundesamte

26 W e I N e X P o r t / W I N e e X P o r t S
D e u t s c h e r We i n S t a t i s t i k 2 0 2 0 / 2 0 2 1
Übersicht / table 19Weinexport nach Weinarten – vorläufige Jahresdaten 2018 / 2019*exports by quality, volume and color – preliminary figures per year 2018 / 2019*
rundungsbedingte Differenzen möglich / sum of rounded amounts may vary from 100%* Nettoausfuhren, ohne reexporte / net exports, without reexported wines
Quelle / Source: Zusammengestellt vom Deutschen Weinbauverband nach Veröffentlichungen des Statistischen Bundesamtes im Auftrag des Deutschen Weininstitutes
2018 2019 Veränderung / Change 18 / 19
Wert / Value
Menge / Volume
Wert / Value
Menge / Volume
Wert / Value
Menge / Volume
1.000 € hl € / hl 1.000 € hl € / hl % %
Qualitätswein / Quality wine 250.000 727.000 344 250.000 744.00 336 -0,3 2,3
Anderer Wein / other wine 57.000 282.000 200 55.000 297.000 187 -2,0 5,2
Flaschenware / Bottled wine 285.000 887.000 322 284.000 914.000 311 -0,4 3,1
Fassware / Bulk wine 22.000 123.000 176 21.000 127.000 166 -2,1 3,4
Weißwein / White wine 260.000 860.000 302 252.000 857.000 294 -3,2 -0,4
rotwein / red wine 47.000 149.000 313 53.000 184.000 290 14,2 23,4
Insgesamt / Total 307.000 1.009.000 304 305.000 1.041.000 293 -0,6 3,1
27W e I N e X P o r t / W I N e e X P o r t S
D e u t s c h e r We i n S t a t i s t i k 2 0 2 0 / 2 0 2 1
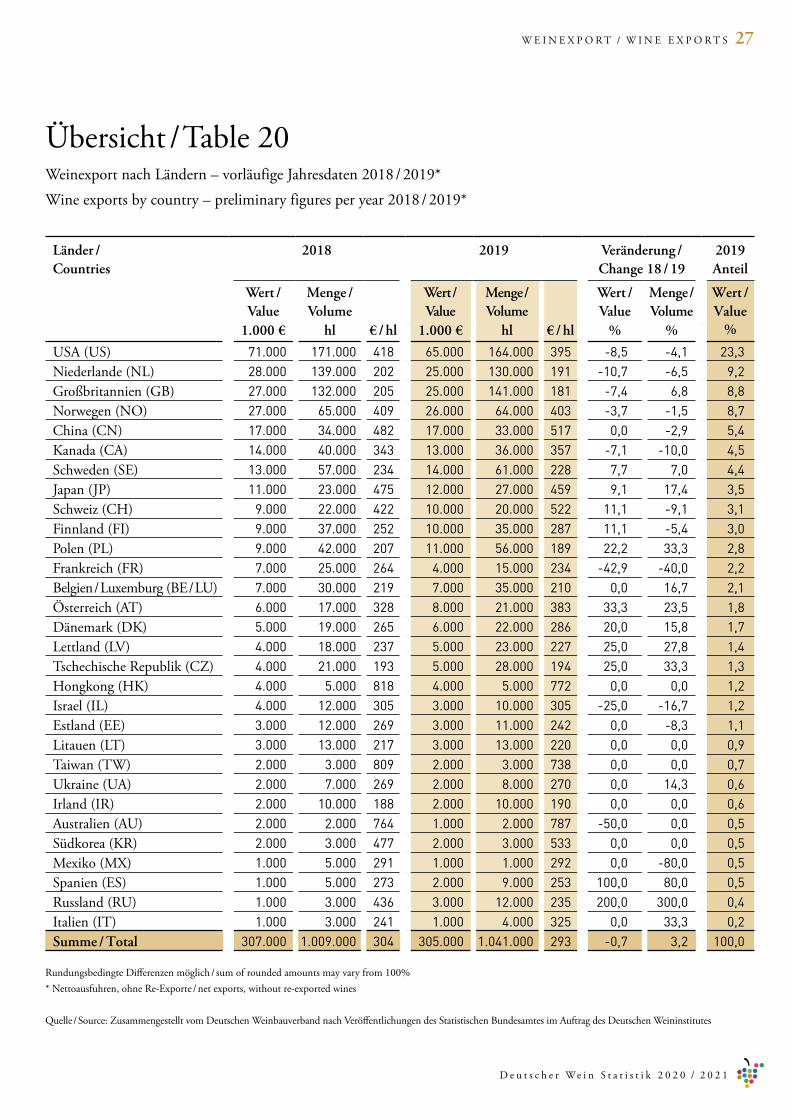
Übersicht / table 20Weinexport nach Ländern – vorläufige Jahresdaten 2018 / 2019*Wine exports by country – preliminary figures per year 2018 / 2019*
rundungsbedingte Differenzen möglich / sum of rounded amounts may vary from 100%* Nettoausfuhren, ohne reexporte / net exports, without reexported wines
Quelle / Source: Zusammengestellt vom Deutschen Weinbauverband nach Veröffentlichungen des Statistischen Bundesamtes im Auftrag des Deutschen Weininstitutes
Länder / Countries
2018 2019 Veränderung / Change 18 / 19
2019 Anteil
Wert / Value
Menge / Volume
Wert / Value
Menge / Volume
Wert / Value
Menge / Volume
Wert / Value
1.000 € hl € / hl 1.000 € hl € / hl % % %
USA (US) 71.000 171.000 418 65.000 164.000 395 -8,5 -4,1 23,3Niederlande (NL) 28.000 139.000 202 25.000 130.000 191 -10,7 -6,5 9,2Großbritannien (GB) 27.000 132.000 205 25.000 141.000 181 -7,4 6,8 8,8Norwegen (No) 27.000 65.000 409 26.000 64.000 403 -3,7 -1,5 8,7China (CN) 17.000 34.000 482 17.000 33.000 517 0,0 -2,9 5,4Kanada (CA) 14.000 40.000 343 13.000 36.000 357 -7,1 -10,0 4,5Schweden (Se) 13.000 57.000 234 14.000 61.000 228 7,7 7,0 4,4Japan (JP) 11.000 23.000 475 12.000 27.000 459 9,1 17,4 3,5Schweiz (CH) 9.000 22.000 422 10.000 20.000 522 11,1 -9,1 3,1Finnland (FI) 9.000 37.000 252 10.000 35.000 287 11,1 -5,4 3,0Polen (PL) 9.000 42.000 207 11.000 56.000 189 22,2 33,3 2,8Frankreich (Fr) 7.000 25.000 264 4.000 15.000 234 -42,9 -40,0 2,2Belgien / Luxemburg (Be / LU) 7.000 30.000 219 7.000 35.000 210 0,0 16,7 2,1Österreich (At) 6.000 17.000 328 8.000 21.000 383 33,3 23,5 1,8Dänemark (DK) 5.000 19.000 265 6.000 22.000 286 20,0 15,8 1,7Lettland (LV) 4.000 18.000 237 5.000 23.000 227 25,0 27,8 1,4tschechische republik (CZ) 4.000 21.000 193 5.000 28.000 194 25,0 33,3 1,3Hongkong (HK) 4.000 5.000 818 4.000 5.000 772 0,0 0,0 1,2Israel (IL) 4.000 12.000 305 3.000 10.000 305 -25,0 -16,7 1,2estland (ee) 3.000 12.000 269 3.000 11.000 242 0,0 -8,3 1,1Litauen (Lt) 3.000 13.000 217 3.000 13.000 220 0,0 0,0 0,9taiwan (tW) 2.000 3.000 809 2.000 3.000 738 0,0 0,0 0,7Ukraine (UA) 2.000 7.000 269 2.000 8.000 270 0,0 14,3 0,6Irland (Ir) 2.000 10.000 188 2.000 10.000 190 0,0 0,0 0,6Australien (AU) 2.000 2.000 764 1.000 2.000 787 -50,0 0,0 0,5Südkorea (Kr) 2.000 3.000 477 2.000 3.000 533 0,0 0,0 0,5Mexiko (MX) 1.000 5.000 291 1.000 1.000 292 0,0 -80,0 0,5Spanien (eS) 1.000 5.000 273 2.000 9.000 253 100,0 80,0 0,5russland (rU) 1.000 3.000 436 3.000 12.000 235 200,0 300,0 0,4Italien (It) 1.000 3.000 241 1.000 4.000 325 0,0 33,3 0,2Summe / Total 307.000 1.009.000 304 305.000 1.041.000 293 -0,7 3,2 100,0
28 W e I N I M P o r t / W I N e I M P o r t S
D e u t s c h e r We i n S t a t i s t i k 2 0 2 0 / 2 0 2 1
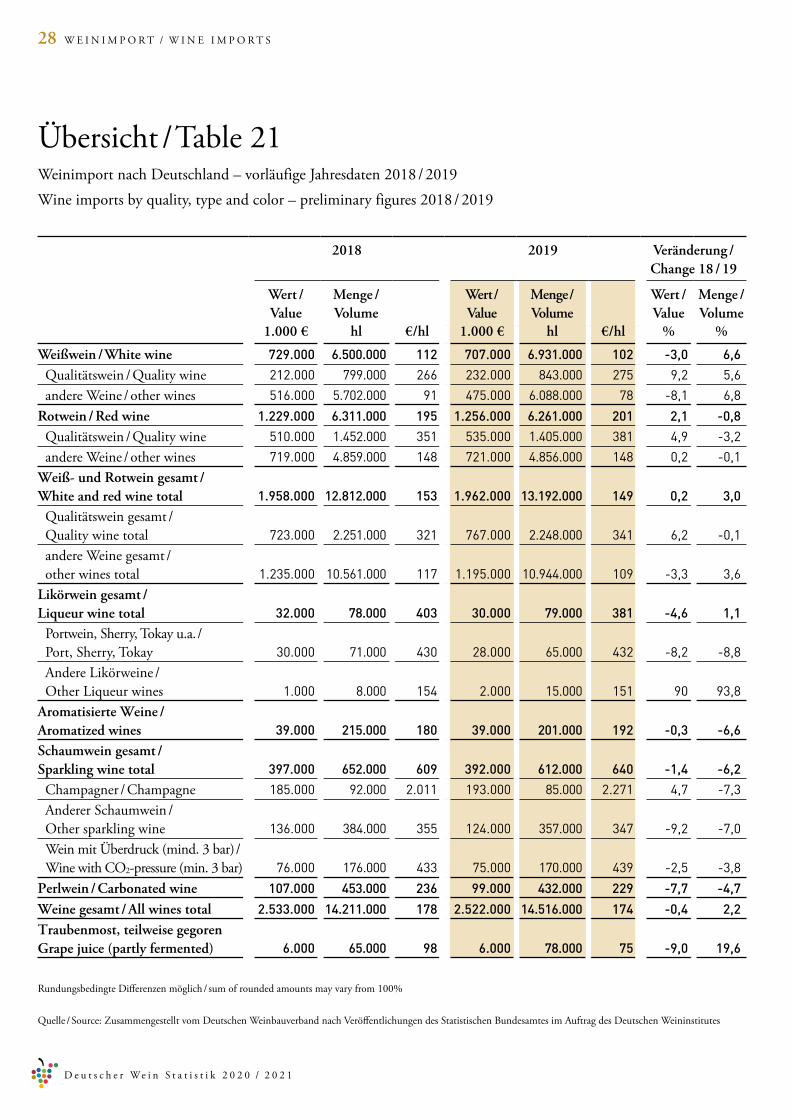
Übersicht / table 21
rundungsbedingte Differenzen möglich / sum of rounded amounts may vary from 100%
Quelle / Source: Zusammengestellt vom Deutschen Weinbauverband nach Veröffentlichungen des Statistischen Bundesamtes im Auftrag des Deutschen Weininstitutes
Weinimport nach Deutschland – vorläufige Jahresdaten 2018 / 2019Wine imports by quality, type and color – preliminary figures 2018 / 2019
2018 2019 Veränderung / Change 18 / 19
Wert / Value
Menge / Volume
Wert / Value
Menge / Volume
Wert / Value
Menge / Volume
1.000 € hl €/hl 1.000 € hl €/hl % %
Weißwein / White wine 729.000 6.500.000 112 707.000 6.931.000 102 -3,0 6,6
Qualitätswein / Quality wine 212.000 799.000 266 232.000 843.000 275 9,2 5,6andere Weine / other wines 516.000 5.702.000 91 475.000 6.088.000 78 -8,1 6,8
Rotwein / Red wine 1.229.000 6.311.000 195 1.256.000 6.261.000 201 2,1 -0,8
Qualitätswein / Quality wine 510.000 1.452.000 351 535.000 1.405.000 381 4,9 -3,2andere Weine / other wines 719.000 4.859.000 148 721.000 4.856.000 148 0,2 -0,1
Weiß- und Rotwein gesamt / White and red wine total 1.958.000 12.812.000 153 1.962.000 13.192.000 149 0,2 3,0
Qualitätswein gesamt / Quality wine total 723.000 2.251.000 321 767.000 2.248.000 341 6,2 -0,1andere Weine gesamt / other wines total 1.235.000 10.561.000 117 1.195.000 10.944.000 109 -3,3 3,6
Likörwein gesamt / Liqueur wine total 32.000 78.000 403 30.000 79.000 381 -4,6 1,1
Portwein, Sherry, tokay u.a. /Port, Sherry, tokay 30.000 71.000 430 28.000 65.000 432 -8,2 -8,8Andere Likörweine / other Liqueur wines 1.000 8.000 154 2.000 15.000 151 90 93,8
Aromatisierte Weine / Aromatized wines 39.000 215.000 180 39.000 201.000 192 -0,3 -6,6
Schaumwein gesamt / Sparkling wine total 397.000 652.000 609 392.000 612.000 640 -1,4 -6,2
Champagner / Champagne 185.000 92.000 2.011 193.000 85.000 2.271 4,7 -7,3Anderer Schaumwein / other sparkling wine 136.000 384.000 355 124.000 357.000 347 -9,2 -7,0Wein mit Überdruck (mind. 3 bar) / Wine with Co2pressure (min. 3 bar) 76.000 176.000 433 75.000 170.000 439 -2,5 -3,8
Perlwein / Carbonated wine 107.000 453.000 236 99.000 432.000 229 -7,7 -4,7
Weine gesamt / All wines total 2.533.000 14.211.000 178 2.522.000 14.516.000 174 -0,4 2,2
Traubenmost, teilweise gegoren Grape juice (partly fermented) 6.000 65.000 98 6.000 78.000 75 -9,0 19,6
29W e I N I M P o r t / W I N e I M P o r t S
D e u t s c h e r We i n S t a t i s t i k 2 0 2 0 / 2 0 2 1
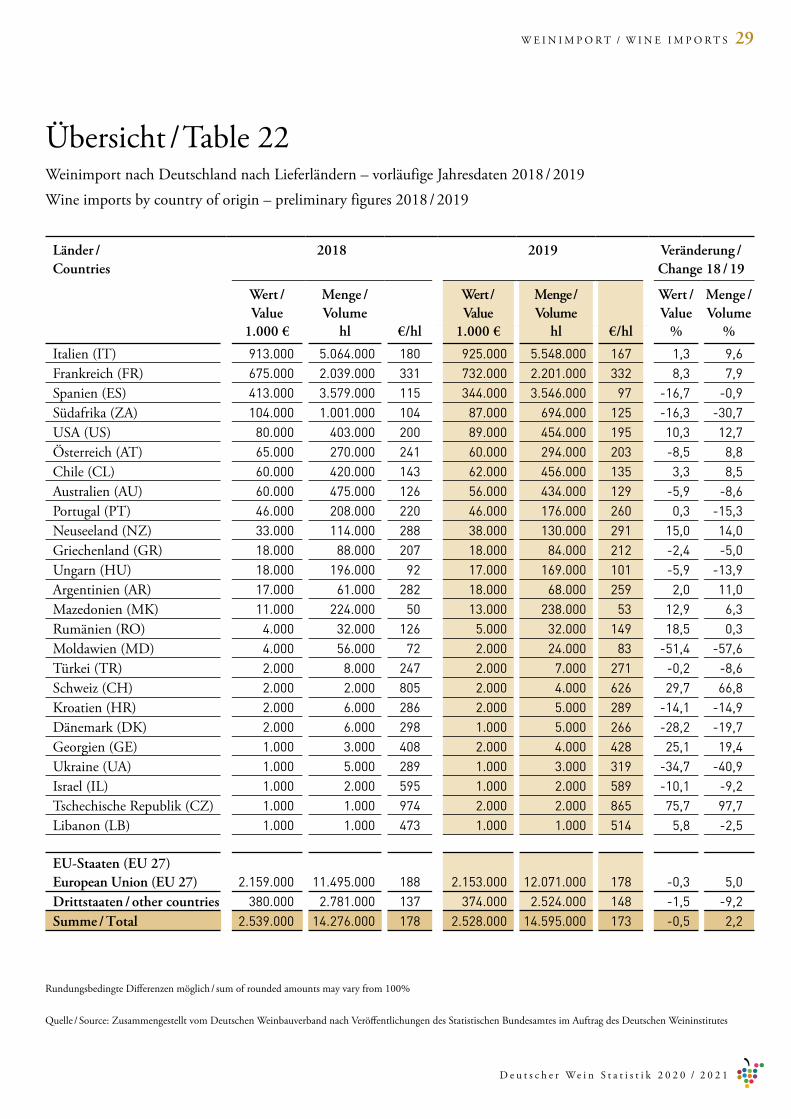
Übersicht / table 22
rundungsbedingte Differenzen möglich / sum of rounded amounts may vary from 100%
Quelle / Source: Zusammengestellt vom Deutschen Weinbauverband nach Veröffentlichungen des Statistischen Bundesamtes im Auftrag des Deutschen Weininstitutes
Länder / Countries
2018 2019 Veränderung / Change 18 / 19
Wert / Value
Menge / Volume
Wert / Value
Menge / Volume
Wert / Value
Menge / Volume
1.000 € hl €/hl 1.000 € hl €/hl % %
Italien (It) 913.000 5.064.000 180 925.000 5.548.000 167 1,3 9,6Frankreich (Fr) 675.000 2.039.000 331 732.000 2.201.000 332 8,3 7,9Spanien (eS) 413.000 3.579.000 115 344.000 3.546.000 97 -16,7 -0,9Südafrika (ZA) 104.000 1.001.000 104 87.000 694.000 125 -16,3 -30,7USA (US) 80.000 403.000 200 89.000 454.000 195 10,3 12,7Österreich (At) 65.000 270.000 241 60.000 294.000 203 -8,5 8,8Chile (CL) 60.000 420.000 143 62.000 456.000 135 3,3 8,5Australien (AU) 60.000 475.000 126 56.000 434.000 129 -5,9 -8,6Portugal (Pt) 46.000 208.000 220 46.000 176.000 260 0,3 -15,3Neuseeland (NZ) 33.000 114.000 288 38.000 130.000 291 15,0 14,0Griechenland (Gr) 18.000 88.000 207 18.000 84.000 212 -2,4 -5,0Ungarn (HU) 18.000 196.000 92 17.000 169.000 101 -5,9 -13,9Argentinien (Ar) 17.000 61.000 282 18.000 68.000 259 2,0 11,0Mazedonien (MK) 11.000 224.000 50 13.000 238.000 53 12,9 6,3rumänien (ro) 4.000 32.000 126 5.000 32.000 149 18,5 0,3Moldawien (MD) 4.000 56.000 72 2.000 24.000 83 -51,4 -57,6türkei (tr) 2.000 8.000 247 2.000 7.000 271 -0,2 -8,6Schweiz (CH) 2.000 2.000 805 2.000 4.000 626 29,7 66,8Kroatien (Hr) 2.000 6.000 286 2.000 5.000 289 -14,1 -14,9Dänemark (DK) 2.000 6.000 298 1.000 5.000 266 -28,2 -19,7Georgien (Ge) 1.000 3.000 408 2.000 4.000 428 25,1 19,4Ukraine (UA) 1.000 5.000 289 1.000 3.000 319 -34,7 -40,9Israel (IL) 1.000 2.000 595 1.000 2.000 589 -10,1 -9,2tschechische republik (CZ) 1.000 1.000 974 2.000 2.000 865 75,7 97,7Libanon (LB) 1.000 1.000 473 1.000 1.000 514 5,8 -2,5
EU-Staaten (EU 27) European Union (EU 27) 2.159.000 11.495.000 188 2.153.000 12.071.000 178 -0,3 5,0Drittstaaten / other countries 380.000 2.781.000 137 374.000 2.524.000 148 -1,5 -9,2Summe / Total 2.539.000 14.276.000 178 2.528.000 14.595.000 173 -0,5 2,2
Weinimport nach Deutschland nach Lieferländern – vorläufige Jahresdaten 2018 / 2019Wine imports by country of origin – preliminary figures 2018 / 2019

30 W e I N B I L A N Z / S t o C K S / D e P L e t I o N S
D e u t s c h e r We i n S t a t i s t i k 2 0 2 0 / 2 0 2 1
Übersicht / table 23
2013 / 2014 2014 / 2015 2015 / 2016 2016 / 2017 2017 / 2018 2018 / 2019in 1.000 hl in 1.000 hl in 1.000 hl in 1.000 hl in 1.000 hl in 1.000 hl
1. Anfangsbestand** / Initial stocks** 11.483 11.324 11.988 12.047 12.160 11.122
2. + trinkweineinfuhr ges. /+ Wine imports total 16.012 15.392 15.232 15.125 15.343 14.946
3. + Weinerzeugung /+ Wine production 8.493 9.294 8.907 9.103 7.536 10.371
4. = Summe / total 35.988 36.010 36.127 36.275 35.039 36.439
5. ./. trinkweinausfuhren /./. total wine exports -4.225 -3.956 -3.787 -3.885 -4.087 -4.083
6. ./. Verarbeitung (Destillation, essig) /./. Processing (distillation, vinegar) -750 -500 -500 -85 -85 -85
7. = zur Verfügung stehende Menge ges. / = Volume available 31.013 31.554 31.840 32.305 30.867 32.271
8. ./. endbestand (31.08.) /./. Final stocks (31.08.) 11.324 11.988 12.047 12.160 11.122 12.821
9. = vermarktete Menge an trink u. Schaumweinen ges. /
= total volume marketed (wine and sparkling wine) 19.689 19.566 19.793 20.145 19.745 19.450
10. Bevölkerung (in Mio.) / Population (millions) 80,8 81,2 82,2 82,5 82,8 83
11. theoretischer Verbrauch pro Kopf ges. (l) / Theoret. per capita consumption (l) 24,4 24,1 24,6 24,4 23,8 23,4
inländischer Herkunft / German origin 8,8 8,6 9,2 9,1 8,9 8,7
ausländischer Herkunft / Foreign origin 11,9 11,9 11,9 11,8 11,6 11,4
Schaumwein / Sparkling wine 3,7 3,6 3,5 3,5 3,3 3,3
12. ertragsfläche in ha / Productive area in ha 99.488 100.076 99.906 100.039 100.182 100.516
13. Hektarertrag in hl / ha / Yield in hl / ha 85 92 89 91 104 83
trinkweinbilanz Deutschland 2013 /2014 – 2018 / 2019*German wine production + imports vs. German wine consumption + exports 2013 /2014 – 2018 / 2019*
* Weinwirtschaftsjahr jeweils 01.08. bis 31.07. / wine industry’s fiscal year, 1 August. to 31 July** einschl. Perlwein, Schaumwein, Likör u. Dessertwein, Wermutwein sowie Grundweinen plus traubenmost / incl. sparkling wine, fortified wine, base wine + grape juice
Quelle / Source: Zusammengestellt vom Deutschen Weinbauverband e.V., Bonn, im Auftrag des Deutschen Weininstituts.
31W e I N K o N S U M / W I N e C o N S U M P t I o N
D e u t s c h e r We i n S t a t i s t i k 2 0 2 0 / 2 0 2 1
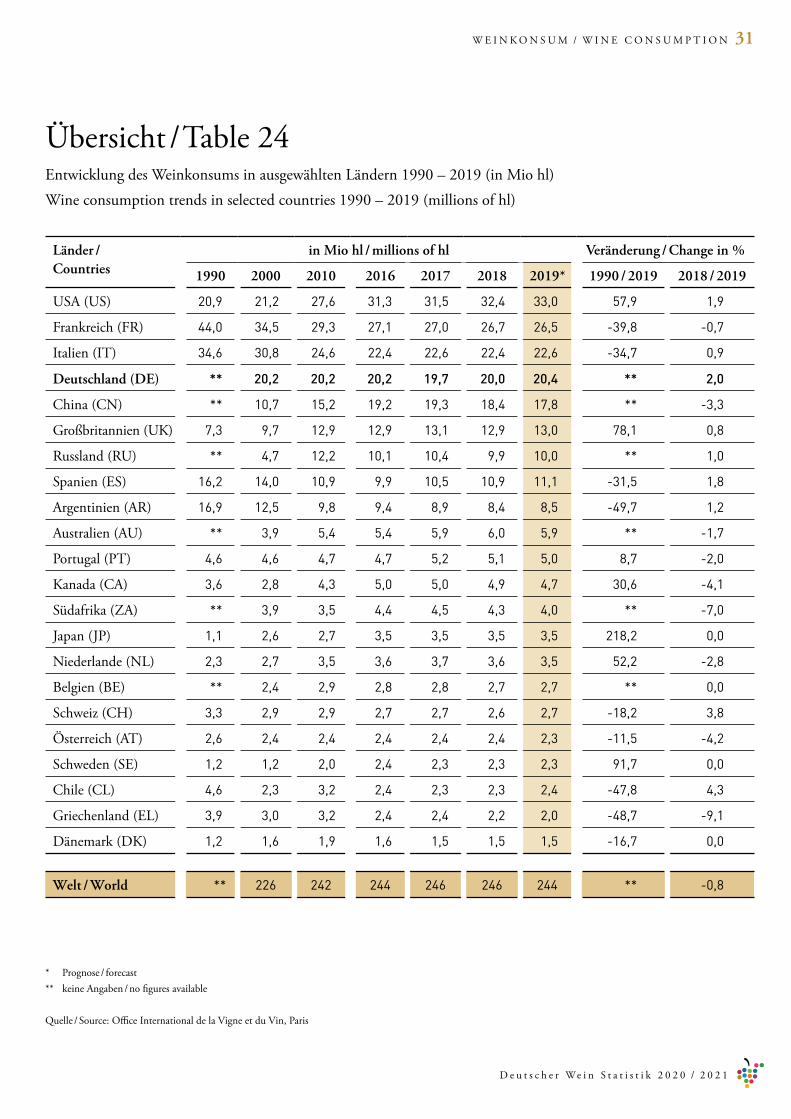
Übersicht / table 24
Länder / Countries
in Mio hl / millions of hl Veränderung / Change in %
1990 2000 2010 2016 2017 2018 2019* 1990 / 2019 2018 / 2019
USA (US) 20,9 21,2 27,6 31,3 31,5 32,4 33,0 57,9 1,9
Frankreich (Fr) 44,0 34,5 29,3 27,1 27,0 26,7 26,5 -39,8 -0,7
Italien (It) 34,6 30,8 24,6 22,4 22,6 22,4 22,6 -34,7 0,9
Deutschland (DE) ** 20,2 20,2 20,2 19,7 20,0 20,4 ** 2,0
China (CN) ** 10,7 15,2 19,2 19,3 18,4 17,8 ** -3,3
Großbritannien (UK) 7,3 9,7 12,9 12,9 13,1 12,9 13,0 78,1 0,8
russland (rU) ** 4,7 12,2 10,1 10,4 9,9 10,0 ** 1,0
Spanien (eS) 16,2 14,0 10,9 9,9 10,5 10,9 11,1 -31,5 1,8
Argentinien (Ar) 16,9 12,5 9,8 9,4 8,9 8,4 8,5 -49,7 1,2
Australien (AU) ** 3,9 5,4 5,4 5,9 6,0 5,9 ** -1,7
Portugal (Pt) 4,6 4,6 4,7 4,7 5,2 5,1 5,0 8,7 -2,0
Kanada (CA) 3,6 2,8 4,3 5,0 5,0 4,9 4,7 30,6 -4,1
Südafrika (ZA) ** 3,9 3,5 4,4 4,5 4,3 4,0 ** -7,0
Japan (JP) 1,1 2,6 2,7 3,5 3,5 3,5 3,5 218,2 0,0
Niederlande (NL) 2,3 2,7 3,5 3,6 3,7 3,6 3,5 52,2 -2,8
Belgien (Be) ** 2,4 2,9 2,8 2,8 2,7 2,7 ** 0,0
Schweiz (CH) 3,3 2,9 2,9 2,7 2,7 2,6 2,7 -18,2 3,8
Österreich (At) 2,6 2,4 2,4 2,4 2,4 2,4 2,3 -11,5 -4,2
Schweden (Se) 1,2 1,2 2,0 2,4 2,3 2,3 2,3 91,7 0,0
Chile (CL) 4,6 2,3 3,2 2,4 2,3 2,3 2,4 -47,8 4,3
Griechenland (eL) 3,9 3,0 3,2 2,4 2,4 2,2 2,0 -48,7 -9,1
Dänemark (DK) 1,2 1,6 1,9 1,6 1,5 1,5 1,5 -16,7 0,0
Welt / World ** 226 242 244 246 246 244 ** -0,8
entwicklung des Weinkonsums in ausgewählten Ländern 1990 – 2019 (in Mio hl)Wine consumption trends in selected countries 1990 – 2019 (millions of hl)
* Prognose / forecast** keine Angaben / no figures available
Quelle / Source: office International de la Vigne et du Vin, Paris

32 W e I N K o N S U M / W I N e C o N S U M P t I o N
D e u t s c h e r We i n S t a t i s t i k 2 0 2 0 / 2 0 2 1
Übersicht / table 25
Getränkeart 2011 2012 2013 2014 2015 2016 2017 2018 2019 a)
Alkoholgetränke insgesamt /All alcoholic beverages 139,6 137,8 137,2 136,9 135,5 134,3 131,0 131,3 128,5
Bier / Beer 109,3 107,3 106,6 106,9 105,9 104,1 101,2 102,0 99,7
Wein / Wine b) 20,6 20,8 21,1 20,7 20,5 21,1 20,9 20,5 20,1
Schaumwein / Sparkling wine 4,2 4,2 4,0 3,9 3,7 3,7 3,5 3,4 3,4
Spirituosen / Spirits j) 5,5 5,5 5,5 5,4 5,4 5,4 5,4 5,4 5,3
Alkoholfreie Getränke insgesamt /Non-alcoholic beverages 300,7 302,7 303,7 299,8 305,2 303,0 296,2 306,7 292,3
Wässer / table water c) 142,5 143,4 145,2 148,2 153,4 152,2 148,2 151,6 140.4
erfrischungsgetränke / Soft drinks d) 122,5 125,4 125,5 119,6 118,8 117,8 115,8 123,6 121,4
Fruchtsäfte / Fruit juice e) 35,7 33,9 33,0 32,0 33,0 33,0 32,2 31,5 30,5
Heiß- u. Hausgetränke insgesamt /Other non-alcoholic beverages 314,4 327,4 327,9 325,3 324,2 323,4 322,6 322,9 323,5
Bohnenkaffee / Coffee f) 154,6 165,4 165,0 162,0 162,0 162,0 162,0 164,0 166,0
Schwarzer tee / Black tea g) h) 25,6 26,2 26,7 26,3 26,4 26,0 25,6 24,3 25,7
Kräuter/Früchtetee / Herb tea g) 49,6 52,2 53,6 52,3 53,4 53,3 53,1 53,8 53,5
Milch / Milk i) 84,6 83,6 82,6 84,7 82,4 82,1 81,9 80,8 78,3
Insgesamt / Total 754,7 767,9 768,8 762,0 764,9 760,7 749,8 760,9 744,3
Verbrauch an Getränken in Deutschland 2011 – 2019 (Liter pro Kopf )Beverage consumption in Germany 2011 – 2019 (liters per capita)
a) Vorläufig. b) einschließlich Wermut und Kräuterwein (ohne Schaumwein); jeweils Weinwirtschaftsjahr (1.9. bis 31.8.).c) Natürliche Mineralwässer (einschl. Heilwässer), Quell und tafelwässer. d) ohne Getränke aus Konzentraten, Sirup und Getränkepulver; einschl. teeGetränke und PostmixAbsatz. e) einschließlich Fruchtnektare und Gemüsesäfte. f ) 35 Gramm röstkaffee pro Liter. g) 9 Gramm tee pro Liter. h) einschließlich Grüntee. i) Frischmilcherzeugnisse (Konsummilch ohne Industriemilch, Buttermilch, Sauermilch und Milchmischgetränke); revidierte Zahlen. j) einschließlich SpirituosenMischgetränke, umgerechnet auf einen durchschnittlichen Alkoholgehalt von 33 %.
Quelle / Source: Verbände der GetränkeIndustrie; Statistisches Bundesamt; Bundesanstalt für Landwirtschaft und ernährung; eigene Berechnungen. Zusammenstellung: Michael Breitenacher, 82152 Planegg.
33W e I N e I N K A U F / C o N S U M e r B U Y I N G t r e N D S
D e u t s c h e r We i n S t a t i s t i k 2 0 2 0 / 2 0 2 1
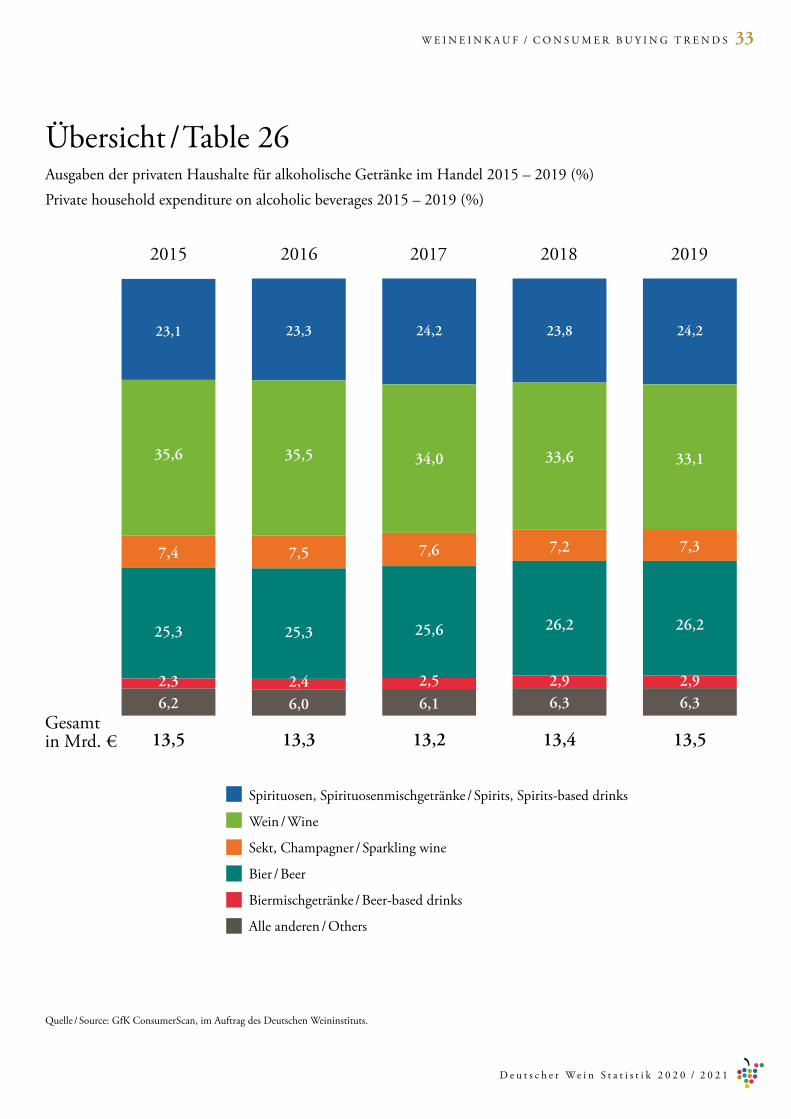
Übersicht / table 26Ausgaben der privaten Haushalte für alkoholische Getränke im Handel 2015 – 2019 (%)Private household expenditure on alcoholic beverages 2015 – 2019 (%)
Quelle / Source: GfK ConsumerScan, im Auftrag des Deutschen Weininstituts.
0
20
40
60
80
100
23,1 23,3 24,2 23,8 24,2
35,6 35,5 34,0 33,6 33,1
7,4 7,5 7,6 7,2 7,3
25,3 25,3 25,6 26,2 26,2
2,3 2,4 2,5 2,9 2,96,2 6,0 6,1 6,3 6,3
13,513,413,213,313,5
2015 2016 2017 2018 2019
Gesamt in Mrd. €
Spirituosen, Spirituosenmischgetränke / Spirits, Spiritsbased drinks
Wein / Wine
Sekt, Champagner / Sparkling wine
Bier / Beer
Biermischgetränke / Beerbased drinks
Alle anderen / others
34 W e I N e I N K A U F / C o N S U M e r B U Y I N G t r e N D S
D e u t s c h e r We i n S t a t i s t i k 2 0 2 0 / 2 0 2 1
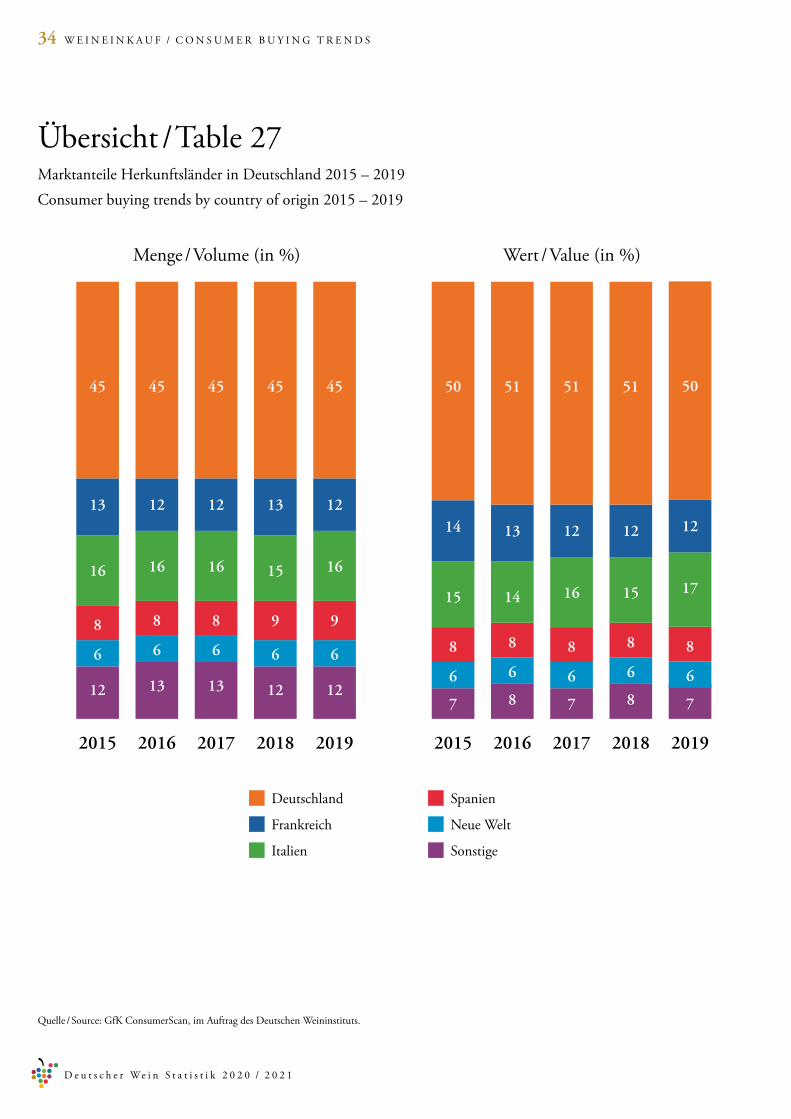
Übersicht / table 27
Menge / Volume (in %) Wert / Value (in %)
Marktanteile Herkunftsländer in Deutschland 2015 – 2019Consumer buying trends by country of origin 2015 – 2019
Quelle / Source: GfK ConsumerScan, im Auftrag des Deutschen Weininstituts.
12 13 13 12 127 8 7 8 7
6 6 6 6 66 6 6 6 6
8 8 8 9 9
8 8 8 8 8
16 16 16 15 16
15 14 16 15 17
13 12 12 13 1214 13 12 12 12
45 45 45 45 45 50 51 51 51 50
2019201820172016201520192018201720162015
Deutschland
Frankreich
Italien
Spanien
Neue Welt
Sonstige

35W e I N e I N K A U F / C o N S U M e r B U Y I N G t r e N D S
D e u t s c h e r We i n S t a t i s t i k 2 0 2 0 / 2 0 2 1
Übersicht / table 28
Deutscher Wein / German wine (in %)
Wein gesamt / Wine total (in %)
Anteile der Weinarten im Handel 2015 – 2019Consumer buying trends by type 2015 – 2019
Weißwein rotwein roséwein
49,8 50,6 53,6 55,1 53,2
37,3 36,8 35,8 33,8 37,1
12,9 12,6 10,7 11,1 9,8
20192018201720162015
39,6 40,8 42,6 43,8 44,0
50,0 48,6 47,7 46,0 46,4
10,4 10,6 9,8 10,2 9,6
20192018201720162015
Quelle / Source: GfK ConsumerScan, im Auftrag des Deutschen Weininstituts.

36 W e I N e I N K A U F / C o N S U M e r B U Y I N G t r e N D S
D e u t s c h e r We i n S t a t i s t i k 2 0 2 0 / 2 0 2 1
30 33 33 32 34
3030 28 29 28
1211
11 12 11
12 1111
12 11
5 6 7 4 43 3 3 3 4
8 6 7 8 8
20192018201720162015
Übersicht / table 29Marktanteile deutscher Weinanbaugebiete im Handel 2015 – 2019 (%)Consumer buying trends by German region of origin 2015 – 2019 (%)
Quelle / Source: GfK ConsumerScan, im Auftrag des Deutschen Weininstituts.
rheinhessen
Pfalz
Baden
Württemberg
Mosel
Franken
restliche

37W e I N e I N K A U F / C o N S U M e r B U Y I N G t r e N D S
D e u t s c h e r We i n S t a t i s t i k 2 0 2 0 / 2 0 2 1
Quelle / Source: GfK ConsumerScan, im Auftrag des Deutschen Weininstituts.
Übersicht / table 30Weinkonsum in Verbrauchergebieten 2019Consumer buying trends in Germany (regional overview) 2019
Menge / Volume (in %)
16 16 16
21 19 20
13 14 14
13 13 14
16 18 17
8 8 88 7 75 5 4
Deutscher Wein / Wine: GermanWein gesamt / Wine: totalBevölkerung / German population
Bayern / Bavaria
Nordost / Northeast Germany
Südost / Southeast Germany
Berlin
Nordwest / Northwest Germany
NrW / North rhineWestphalia
Mitte / Central Germany
BadenWürttemberg

38 K o N t A K t / C o N t A C t
D e u t s c h e r We i n S t a t i s t i k 2 0 2 0 / 2 0 2 1
Kontakt Contact
eberhard Abeletelefon: 06135 9323153telefax: 06135 9323130eMail: [email protected]
Weitere differenzierte Daten können auf individuelle Anfrage geliefert werden. Weitere Informationen über deutsche Weine, Seminarangebote und Adressen finden Sie unter:www.deutscheweine.de
eberhard AbelePhone: +49 (0)6135 9323153Fax: +49 (0)6135 9323130 eMail: [email protected]
the German Wine Institute can supply additional data upon request. Please see our website for seminar dates, addresses and additional information: www.deutscheweine.de or www.germanwines.de
Für Fragen und Anregungen steht Ihnen das DWI gerne zur Verfügung.
If you have questions or suggestions, please contact the German Wine Institute.

HERAUSGEBER / PUBLISHER:Deutsches Weininstitut GmbHPlatz des Weines 255294 Bodenheim
www.deutscheweine.dewww.germanwines.de


![Der Wein - Das [wein magazin]](https://static.fdokument.com/doc/165x107/568bd9f91a28ab2034a9088d/der-wein-das-wein-magazin.jpg)