dPOMP: An Infrastructure for Performance Monitoring of ...
15
DPOMP: OpenMP Tool Infrastructure SCICOMP10 Austin, Aug 2004 © 2004 Bernd Mohr 1 dPOMP: An Infrastructure for Performance Monitoring of OpenMP Applications Bernd Mohr Forschungszentrum Jülich (FZJ) John von Neumann - Institut für Computing (NIC) Zentralinstitut für Angewandte Mathematik (ZAM) 52425 Jülich, Germany [email protected] dPOMP Team • Luiz DeRose • IBM Research, ACTC • Yorktown Heights, NY, USA • [email protected] • Seetharami Seelam • IBM Research, ACTC • Yorktown Heights, NY, USA • [email protected] • Bernd Mohr • Forschungszentrum Jülich, ZAM • [email protected] Thomas J. Watson Research Center PO Box 218 Yorktown Heights, NY 10598
Transcript of dPOMP: An Infrastructure for Performance Monitoring of ...

DPOMP: OpenMP Tool Infrastructure SCICOMP10Austin, Aug 2004
© 2004 Bernd Mohr 1
dPOMP:An Infrastructure for Performance Monitoring of OpenMP Applications
Bernd Mohr
Forschungszentrum Jülich (FZJ)John von Neumann - Institut für Computing (NIC)
Zentralinstitut für Angewandte Mathematik (ZAM)52425 Jülich, [email protected]
dPOMP Team
• Luiz DeRose• IBM Research, ACTC• Yorktown Heights, NY, USA• [email protected]
• Seetharami Seelam• IBM Research, ACTC• Yorktown Heights, NY, USA• [email protected]
• Bernd Mohr• Forschungszentrum Jülich,
ZAM• [email protected]
Thomas J. Watson Research CenterPO Box 218Yorktown Heights, NY 10598

DPOMP: OpenMP Tool Infrastructure SCICOMP10Austin, Aug 2004
© 2004 Bernd Mohr 2
Outline
• What is POMP?
• What is DPCL?
• IBM compiler and run-time library featuresthat makes dPOMP possible
• dPOMP Implementation
• Examples of use
The Motivation: PMPI - The MPI Profiling Interface
• PMPI allows selective replacement of MPI routines at link time⇒ no re-compilation necessary
• Uses technique of “wrapper” function libraries• Used by most MPI performance tools
• Vampirtrace, MP_profiler, MPICH MPE, TAU, EPILOG, …
User program
Call MPI_Bcast
Call MPI_Send
MPI Library
MPI_Bcast
PMPI_Send
MPI_Send
MPI library
MPI_Bcast
PMPI_Send
MPI_Send
Profiling library
MPI_Send

DPOMP: OpenMP Tool Infrastructure SCICOMP10Austin, Aug 2004
© 2004 Bernd Mohr 3
“Standard” OpenMP Monitoring API?
• Problem:• OpenMP (unlike MPI) does not define
standard monitoring interface• OpenMP is defined mainly by directives/pragmas
• Solution:• POMP: OpenMP Monitoring Interface• Joint Development
– Forschungszentrum Jülich– University of Oregon
• Presented at EWOMP’01, LACSI’01 and SC’01
“The Journal of Supercomputing”, 23, Aug. 2002.
POMP Instrumentation
POMPmonitoring
library
POMPpreprocessor
POMPinstrumented
programOpenMPcompiler
POMPenabled
RTSOpenMPcompiler
OpenMPprogram
OpenMP compilerwith --pomp
POMPenabled
executable
binaryinstrumentorexecutableOpenMP
compiler
DPOMP: OpenMP Tool Infrastructure SCICOMP10Austin, Aug 2004
© 2004 Bernd Mohr 4
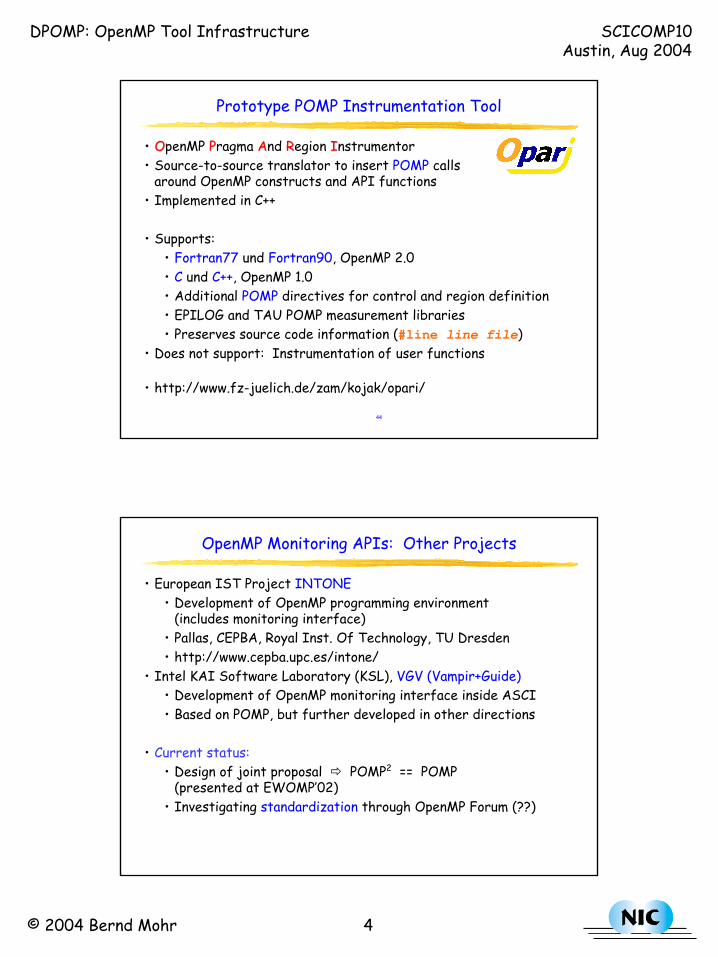
Prototype POMP Instrumentation Tool
•• OOpenMP PPragma AAnd RRegion IInstrumentor• Source-to-source translator to insert POMP calls
around OpenMP constructs and API functions• Implemented in C++
• Supports:• Fortran77 und Fortran90, OpenMP 2.0• C und C++, OpenMP 1.0• Additional POMP directives for control and region definition• EPILOG and TAU POMP measurement libraries• Preserves source code information (#line line file)
• Does not support: Instrumentation of user functions
• http://www.fz-juelich.de/zam/kojak/opari/
44
OpenMP Monitoring APIs: Other Projects
• European IST Project INTONE• Development of OpenMP programming environment
(includes monitoring interface)• Pallas, CEPBA, Royal Inst. Of Technology, TU Dresden• http://www.cepba.upc.es/intone/
• Intel KAI Software Laboratory (KSL), VGV (Vampir+Guide)• Development of OpenMP monitoring interface inside ASCI• Based on POMP, but further developed in other directions
• Current status:• Design of joint proposal POMP2 == POMP
(presented at EWOMP’02)• Investigating standardization through OpenMP Forum (??)
DPOMP: OpenMP Tool Infrastructure SCICOMP10Austin, Aug 2004
© 2004 Bernd Mohr 5
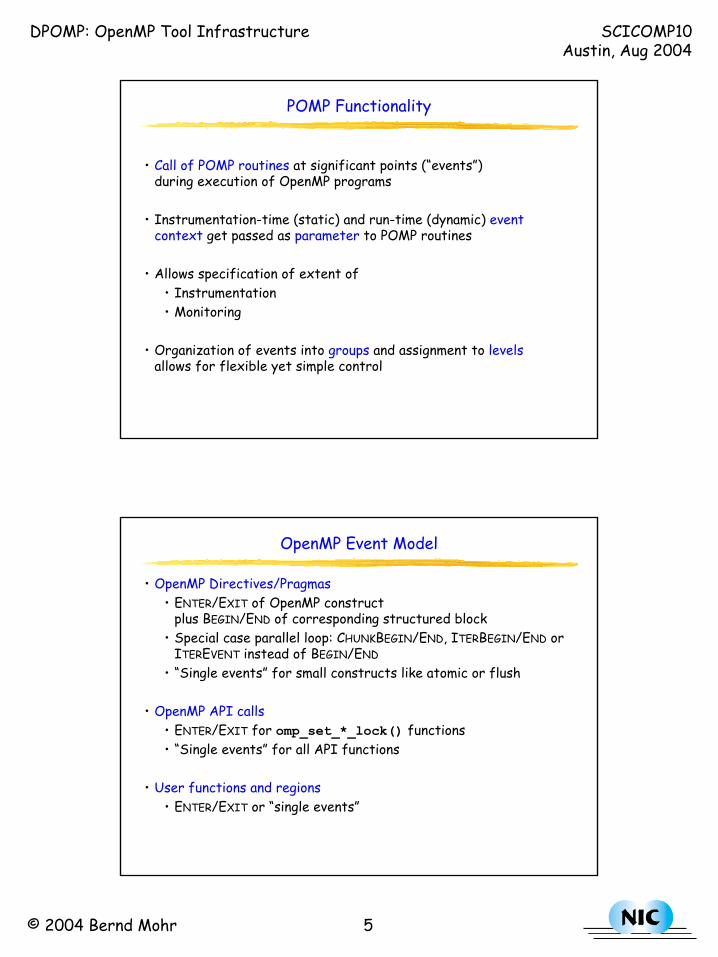
POMP Functionality
• Call of POMP routines at significant points (“events”)during execution of OpenMP programs
• Instrumentation-time (static) and run-time (dynamic) eventcontext get passed as parameter to POMP routines
• Allows specification of extent of• Instrumentation• Monitoring
• Organization of events into groups and assignment to levelsallows for flexible yet simple control
OpenMP Event Model
• OpenMP Directives/Pragmas• ENTER/EXIT of OpenMP construct
plus BEGIN/END of corresponding structured block• Special case parallel loop: CHUNKBEGIN/END, ITERBEGIN/END or
ITEREVENT instead of BEGIN/END
• “Single events” for small constructs like atomic or flush
• OpenMP API calls• ENTER/EXIT for omp_set_*_lock() functions• “Single events” for all API functions
• User functions and regions• ENTER/EXIT or “single events”

DPOMP: OpenMP Tool Infrastructure SCICOMP10Austin, Aug 2004
© 2004 Bernd Mohr 6
1: int main() {2: int id;3:4: #pragma omp parallel private(id)5: {6: id = omp_get_thread_num();7: printf("hello from %d\n", id);8: }9: }
Example: Standard Instrumentation
1: int main() {2: int id;3:
4: #pragma omp parallel private(id)5: {
6: id = omp_get_thread_num();7: printf("hello from %d\n", id);8: }
9: }
*** POMP_Init();
*** POMP_Finalize();
*** { POMP_handle_t pomp_hd1 = 0;*** int32 pomp_tid = omp_get_thread_num();
*** int32 pomp_tid = omp_get_thread_num();
*** }
*** POMP_Parallel_enter(&pomp_hd1, pomp_tid, -1, 1,*** "49*type=pregion*file=demo.c*slines=4,4*elines=8,8**");
*** POMP_Parallel_begin(pomp_hd1, pomp_tid);
*** POMP_Parallel_end(pomp_hd1, pomp_tid);*** POMP_Parallel_exit(pomp_hd1, pomp_tid);
Example: Optimized Instrumentation
1: int main() {2: int id;
*** POMP_handle_t pomp_hd1 = 0;*** POMP_Init();*** POMP_Get_handle(&pomp_hd1,*** "49*type=pregion*file=demo.c*slines=4,4*elines=8,8**");3:
*** { int32 pomp_tid = omp_get_thread_num(); *** POMP_Parallel_enter(&pomp_hd1, pomp_tid, -1, 1, NULL);4: #pragma omp parallel private(id)5: {
*** int32 pomp_tid = omp_get_thread_num();*** POMP_Parallel_begin(pomp_hd1, pomp_tid);6: id = omp_get_thread_num();7: printf("hello from %d\n", id);
*** POMP_Parallel_end(pomp_hd1, pomp_tid);8: }
*** POMP_Parallel_exit(pomp_hd1, pomp_tid);*** }*** POMP_Finalize();9: }
DPOMP: OpenMP Tool Infrastructure SCICOMP10Austin, Aug 2004
© 2004 Bernd Mohr 7
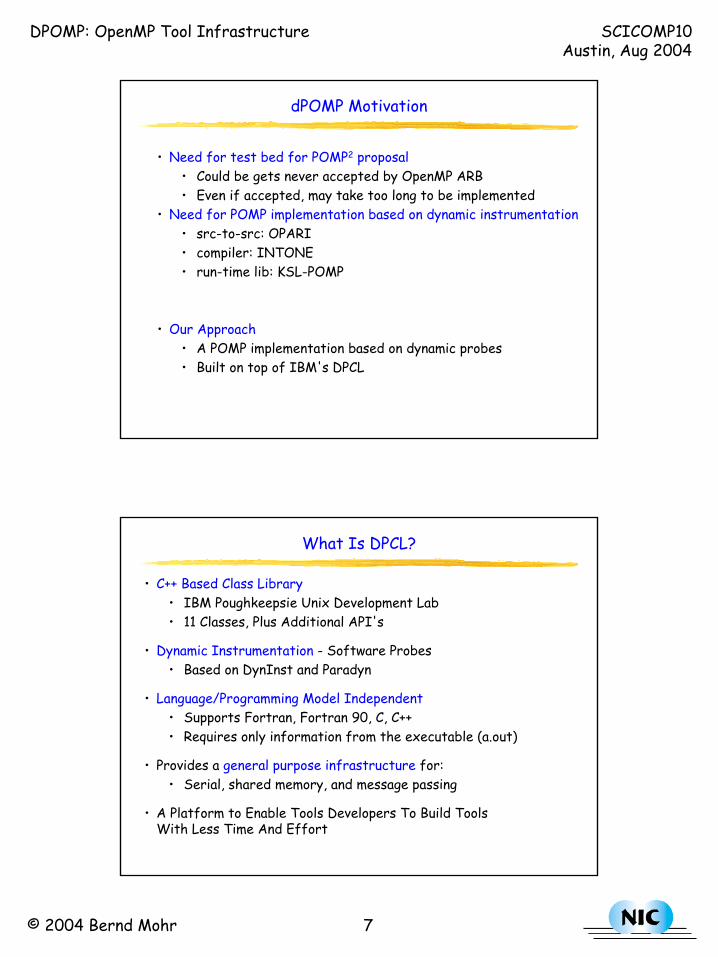
dPOMP Motivation
• Need for test bed for POMP2 proposal• Could be gets never accepted by OpenMP ARB• Even if accepted, may take too long to be implemented
• Need for POMP implementation based on dynamic instrumentation• src-to-src: OPARI• compiler: INTONE• run-time lib: KSL-POMP
• Our Approach• A POMP implementation based on dynamic probes• Built on top of IBM's DPCL
What Is DPCL?
• C++ Based Class Library• IBM Poughkeepsie Unix Development Lab• 11 Classes, Plus Additional API's
• Dynamic Instrumentation - Software Probes• Based on DynInst and Paradyn
• Language/Programming Model Independent• Supports Fortran, Fortran 90, C, C++• Requires only information from the executable (a.out)
• Provides a general purpose infrastructure for:• Serial, shared memory, and message passing
• A Platform to Enable Tools Developers To Build ToolsWith Less Time And Effort

DPOMP: OpenMP Tool Infrastructure SCICOMP10Austin, Aug 2004
© 2004 Bernd Mohr 8
DPCL Probes
• DPCL allows tools to insert data, functions, andcode patches (probes) into a program dynamically
• Call site• Call entry• Call exit
• Probes can collect and report program information, program state, or modify the program execution
• Probes may be placed at specific locations in the programand can be activated:
• Whenever execution reaches that location• By expiration of a timer• Exactly once
A() {
}
OMP loop
Source code
main() {
}
A()
OMP parallel
OMP end parallel
The IBM Compiler and Run-time Library
run-time library
Compiler generated
A() {
}
xlf_Par
main() {
}
A()
master thread
A@0L1 {
}
xlf_DoPar
all threads
do I=start,endloop body
enddo
A@0L1@OL2 {
}
POMP_Parallel_enter
POMP_Parallel_exit
POMP_Parallel_begin
POMP_Parallel_end
POMP_Loop_enter
POMP_Loop_exit
POMP_Loop_chunk_begin
POMP_Loop_chunk_end
POMP_Function_enter
POMP_Function_exit
DPOMP: OpenMP Tool Infrastructure SCICOMP10Austin, Aug 2004
© 2004 Bernd Mohr 9
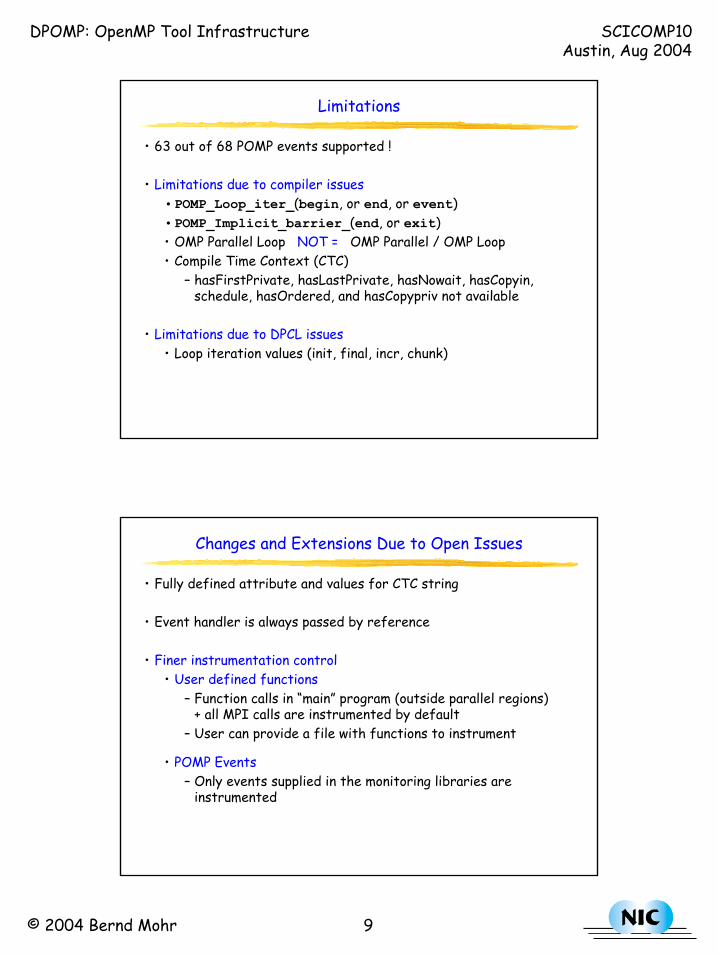
Limitations
• 63 out of 68 POMP events supported !
• Limitations due to compiler issues•POMP_Loop_iter_(begin, or end, or event)•POMP_Implicit_barrier_(end, or exit)• OMP Parallel Loop NOT = OMP Parallel / OMP Loop• Compile Time Context (CTC)
– hasFirstPrivate, hasLastPrivate, hasNowait, hasCopyin, schedule, hasOrdered, and hasCopypriv not available
• Limitations due to DPCL issues• Loop iteration values (init, final, incr, chunk)
Changes and Extensions Due to Open Issues
• Fully defined attribute and values for CTC string
• Event handler is always passed by reference
• Finer instrumentation control• User defined functions
– Function calls in “main” program (outside parallel regions)+ all MPI calls are instrumented by default
– User can provide a file with functions to instrument
• POMP Events– Only events supplied in the monitoring libraries are
instrumented
DPOMP: OpenMP Tool Infrastructure SCICOMP10Austin, Aug 2004
© 2004 Bernd Mohr 10
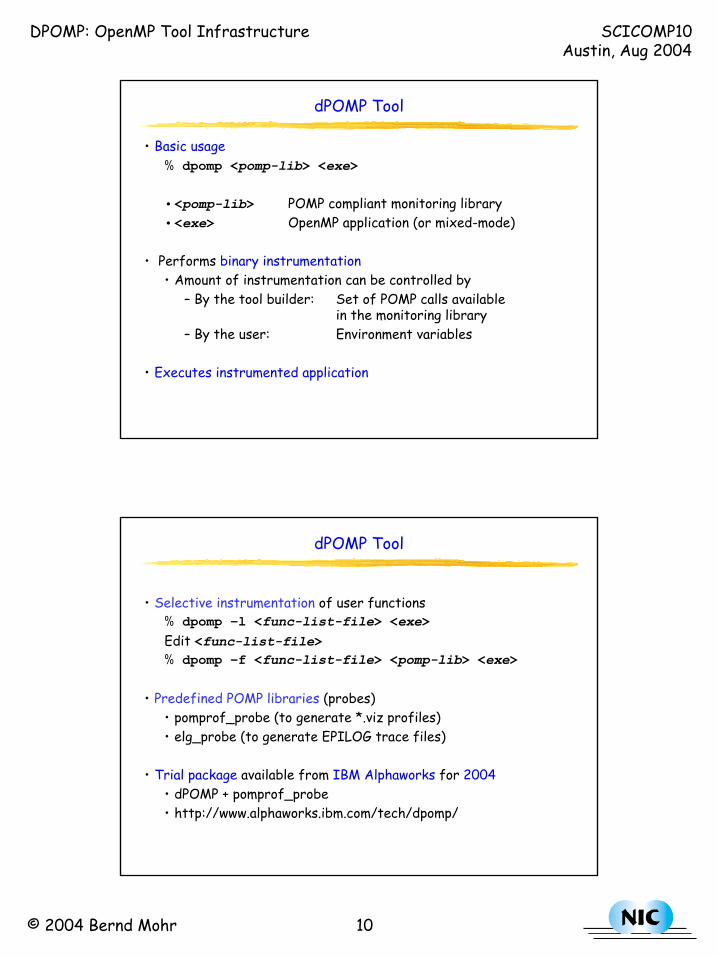
dPOMP Tool
• Basic usage% dpomp <pomp-lib> <exe>
•<pomp-lib> POMP compliant monitoring library•<exe> OpenMP application (or mixed-mode)
• Performs binary instrumentation• Amount of instrumentation can be controlled by
– By the tool builder: Set of POMP calls availablein the monitoring library
– By the user: Environment variables
• Executes instrumented application
dPOMP Tool
• Selective instrumentation of user functions% dpomp –l <func-list-file> <exe>Edit <func-list-file>% dpomp –f <func-list-file> <pomp-lib> <exe>
• Predefined POMP libraries (probes)• pomprof_probe (to generate *.viz profiles)• elg_probe (to generate EPILOG trace files)
• Trial package available from IBM Alphaworks for 2004• dPOMP + pomprof_probe• http://www.alphaworks.ibm.com/tech/dpomp/

DPOMP: OpenMP Tool Infrastructure SCICOMP10Austin, Aug 2004
© 2004 Bernd Mohr 11
POMP Profiler Library (POMPROF)
• POMP compliant library from IBM ACTC
• Generates a detailed profile describing overheads and time spent by each thread in three key regions of the parallel application:
• Parallel regions• OpenMP loops inside a parallel region• User defined functions
• Profile data• Presented in the form of an XML file• Visualized with PeekPerf
Example: PeekPerf Visualization of POMPROF Output

DPOMP: OpenMP Tool Infrastructure SCICOMP10Austin, Aug 2004
© 2004 Bernd Mohr 12
KOJAK POMP Tracing Library: elg_probe
• POMP monitoring library which generates EPILOG event traces• Processed by KOJAK’s automatic event tracer analyzer EXPERT
The KOJAK Project
•• KKit for OObjective JJudgementand AAutomatic KKnowledge-baseddetection of bottlenecks
• Long-term goals• Design and Implementation of a
Portable, Generic, and AutomaticPerformance Analysis Environment
• Current focus• Event Tracing• Parallel computers with SMP nodes• MPI, OpenMP, Hybrid (OpenMP + MPI) programming model • Development of research prototypes
• http://www.fz-juelich.de/zam/kojak/
DPOMP: OpenMP Tool Infrastructure SCICOMP10Austin, Aug 2004
© 2004 Bernd Mohr 13
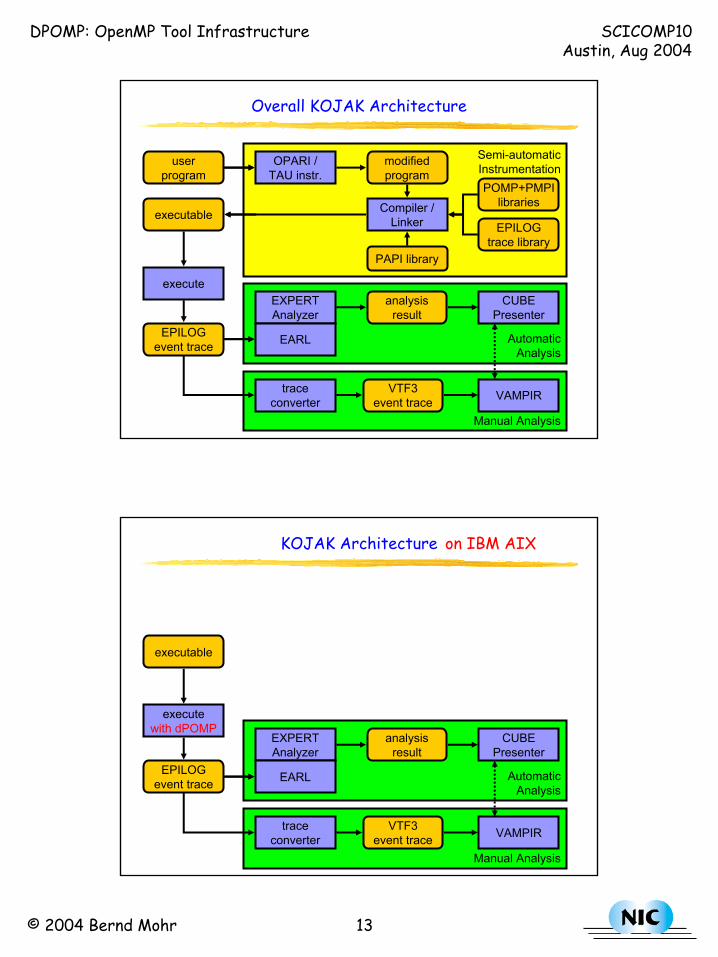
Overall KOJAK Architecture
AutomaticAnalysis
userprogram
executeEXPERTAnalyzer
EARL
analysisresult
CUBEPresenter
executable
Semi-automaticInstrumentation
OPARI /TAU instr.
modifiedprogram
Compiler /Linker
Manual Analysis
POMP+PMPIlibraries
EPILOGtrace library
VAMPIRtraceconverter
VTF3event trace
PAPI library
EPILOGevent trace
KOJAK Architecture on IBM AIX
AutomaticAnalysis
executewith dPOMP
EXPERTAnalyzer
EARL
analysisresult
CUBEPresenter
executable
Manual Analysis
VAMPIRtraceconverter
VTF3event trace
EPILOGevent trace

DPOMP: OpenMP Tool Infrastructure SCICOMP10Austin, Aug 2004
© 2004 Bernd Mohr 14
LocationHow is the
problem distributed across the machine?
Performance PropertyWhat problem?
Region TreeWhere in source code?
In what context?
Color CodingHow severe
is the problem?
EPILOG Trace Converted to VTF3
• EPILOG-to-VTF3• Maps OpenMP constructs into VAMPIR symbols and activities

DPOMP: OpenMP Tool Infrastructure SCICOMP10Austin, Aug 2004
© 2004 Bernd Mohr 15
Conclusion
• Very productive and effective collaboration with IBM ACTC
• Innovative tool infrastructure for OpenMP
• Available at IBM alphaworks
Future Work
• OPARI• Support for POMP2
• dPOMP• More extensive evaluations• Finish missing features• Remove limitations?