Energy roadmap in Ghana and Botswana
25
Emmanuel Essah PHOTO: Practical Action. CASE STUDIES Energy roadmap in Ghana and Botswana
Transcript of Energy roadmap in Ghana and Botswana
Emmanuel Essah
PHOTO: Practical Action.
CASE STUDIES
Energy roadmapin Ghana and Botswana
DL B 10735-2015 ISBN 978-84-606-7546-4
Energy roadmap in Ghana and Botswana
COORDINATED BYAgustí Pérez-Foguet, Enric Velo, Pol Arranz, Ricard Ginéand Boris Lazzarini (Universitat Politècnica de Catalunya)Manuel Sierra (Universidad Politécnica de Madrid)Alejandra Boni and Jordi Peris (Universitat Politècnica de València)Guido Zolezzi and Gabriella Trombino (Università degli Studi di Trento)Rhoda Trimingham (Loughborough University)Valentín Villarroel (ONGAWA)Neil Nobles and Meadhbh Bolger (Practical Action)Francesco Mongera (Training Center for International Cooperation)Katie Cresswell-Maynard (Engineering Without Border UK)
EDITED BY Global Dimension in Engineering Education
Citation: Essah, E. (2015) ' Energy roadmap in Ghana and Botswana', in Case studies for developing globally responsible engineers, GDEE (eds.), Global Dimension in Engineering Education, Barcelona. Available from: http://gdee.eu/index.php/resources.html
This publication is distributedunder an Attribution- Noncommercial-Share Alike License for Creative Commons
CASE STUDIES
Disclaimer: This document has been produced with the financial assistance of the European UnionThe contents of this document are the sole responsibility of the authors and can under no circumstances be regarded as reflecting the position of the European Union
Energy Roadmap in Ghana and Botswana
ENERGY ROADMAP IN GHANA AND BOTSWANA
Dr. Emmanuel Essah, University of Reading, Reading, UK.
1
Energy Roadmap in Ghana and Botswana
INDEX
1. INTRODUCTION ........................................................................................................................... 3
1.1. DISCIPLINES COVERED ............................................................................................................. 4
1.2. LEARNING OUTCOMES .............................................................................................................. 4
1.3. ACTIVITIES .............................................................................................................................. 5
2. DESCRIPTION OF THE CONTEXT ............................................................................................. 7
3. CLASS ACTIVITY ......................................................................................................................... 7
3.1. SOLUTION AND EVALUATION CRITERIA ....................................................................................... 9
4. HOMEWORK ACTIVITY ............................................................................................................... 9
4.1. SOLUTION AND EVALUATION CRITERIA ..................................................................................... 11
BIBLIOGRAPHY ................................................................................................................................. 18 FURTHER/SUGGESTED MATERIAL ................................................................................................ 19
APPENDIX - MAPS ............................................................................................................................ 20
2
Energy Roadmap in Ghana and Botswana
1. INTRODUCTION
The relationship between energy and economic development has been the centre of
debate over the past 30 years with many researchers arguing that there are
conflicting views as to the exact relationship between the two (e.g. Kraft and Kraft,
1978; Yu and Choi, 1985; Ang, 2008; Apergis and Payne, 2009). Nonetheless the
underlying argument is that, access to affordable and reliable energy services
especially electricity is a significant aid to human, social and economic development
in every country. Intermittency of supply, increasing demand and lack of access to
energy have been acknowledged to undermine energy security hence are major
challenges for policymakers and organizations all over the world. These challenges
became more prominent in the 1970’s when energy became a major concern due to
the aftermath of the oil crisis (Bhattacharyya and Timilsina, 2010). It goes without
saying that underdeveloped and developing countries suffer the most when it comes
to energy shortage and the lack of energy security. Notably, 95% of the 1.3 billion
people in the world who do not have access to electricity and 2.6 billion people who
are without clean cooking facilities reside in either sub-Saharan Africa (made up of
47 Countries most of which are either developing or underdeveloped) or developing
Asia (IEA, 2014). This is a substantial percentage which will eventually impact on the
economic development and growth of these countries. With these challenges,
energy conservation and efficient use does not only make good economic sense but
is also a matter of economic survival.
Pertaining to energy management, attention has to be paid to all sectors of the
economy. Nevertheless, the domestic (residential) sector has proven to be a
substantial consumer of energy in almost all countries (developed and developing).
Values quoted in different countries are within a range of 16-50% of the total energy
demand and averages to 30% worldwide (Saidur et al., 2007).Considering the fact
that energy forms are diverse (e.g. electricity, gas etc), for the purpose of this case
study, the main focus will be on electricity use. Here after electricity and energy may
be used interchangeably.
Ghana and Botswana (both sub-Saharan countries) are currently faced with a
widespread dearth of electricity supply. Current generation and imports are able to
3
Energy Roadmap in Ghana and Botswana
meet only 30-40% of the population’s needs. This has resulted in prolonged power
cuts that last for many hours and/or days. It is in the light of this that the aim of this
case study is to develop a critical understanding of electricity consumption in Ghana
and Botswana’s domestic sector, through the identification of household profiling and
appliance usage and its impact on national electricity use.
1.1. DISCIPLINES COVERED
The main discipline covered by this case study is the issue surrounding energy
efficiency through the profiling of domestic appliances and energy use and how that
fits into the national profile. A background of basic mathematics would be required as
well as basic Ohm’s law equations in Physics. The aim is that students would be
able to understand the demand loads from domestic energy usages’ considering
profiling of appliance. This would then be used to extrapolate to the national level
assuming all parameters stay the same in that year.
To do this it is important that research is carried out to determine how much energy
households use and which of their appliances use more energy. In this case
householders can make informed decisions towards energy management which will
contribute to reducing energy shortage.
1.2. LEARNING OUTCOMES
The main learning outcomes expected draws on the student(s):
• Understanding through literature review, the predicament of the lack of
access to electricity in sub-Sahara countries and its consequences on
human development.
• Developed learning through the development of a critical understanding of
energy use in Ghana and Botswana’s domestic sector using quantitative
methods.
• Ability to analyse the impact of household energy use and to establish the
level of understanding required for any variables (age, gender, etc) to be
integrated in the exploration of the total energy use.
4
Energy Roadmap in Ghana and Botswana
1.3. ACTIVITIES
Phase 1
Students must be set up in groups of two persons. Between them, one should opt for
Ghana (Accra) and the other Botswana (Gaborone). As a team, investigate (your
individual assigned countries) through literature review the following;
a) Location, yearly energy consumption, source of energy to meet the
country’s demand.
b) Type of energy sources and percentage configuration,
c) Population size, population percentage with or without electricity
d) Reasons for lack of electricity supply in places
e) Possible alternative energy sources to findings in “a” above
f) Any additional relevant information
Write this up as the background section of the literature review report.
Phase 2
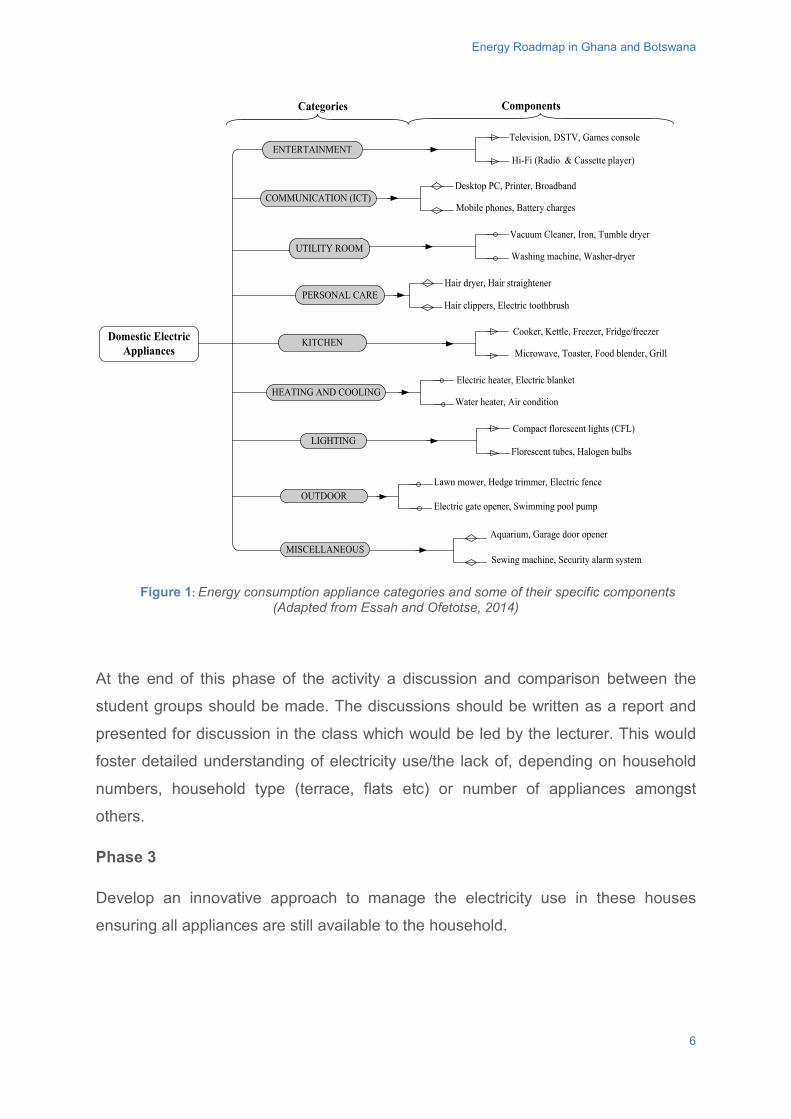
This phase would involve the design of a grid system of appliances in 3 domestic
properties ideally for varying household types (say 1 person household to a 5 person
household) should be considered (see section 2.1 of the Project design approach).
In particular, the details of home appliances must be considered in relation to the
categorization of individual components as illustrated in the figure 1. By no means is
this an exhaustive list. Preferably there should be the same groups of 2 persons; one
investigating the appliance usage for Botswana and the other for Ghana (following
on with choices from Phase 1).
5
Energy Roadmap in Ghana and Botswana
Figure 1: Energy consumption appliance categories and some of their specific components
(Adapted from Essah and Ofetotse, 2014)
At the end of this phase of the activity a discussion and comparison between the
student groups should be made. The discussions should be written as a report and
presented for discussion in the class which would be led by the lecturer. This would
foster detailed understanding of electricity use/the lack of, depending on household
numbers, household type (terrace, flats etc) or number of appliances amongst
others.
Phase 3
Develop an innovative approach to manage the electricity use in these houses
ensuring all appliances are still available to the household.
Domestic ElectricAppliances
Television, DSTV, Games console
Hi-Fi (Radio & Cassette player)ENTERTAINMENT
Categories
Hair dryer, Hair straightener
Hair clippers, Electric toothbrush
Compact florescent lights (CFL)
Florescent tubes, Halogen bulbs
Cooker, Kettle, Freezer, Fridge/freezer
Microwave, Toaster, Food blender, Grill
Vacuum Cleaner, Iron, Tumble dryer
Mobile phones, Battery chargesCOMMUNICATION (ICT)
UTILITY ROOM
PERSONAL CARE
LIGHTING
KITCHEN
Components
OUTDOOR
HEATING AND COOLING
MISCELLANEOUS
Desktop PC, Printer, Broadband
Washing machine, Washer-dryer
Electric heater, Electric blanket
Water heater, Air condition
Lawn mower, Hedge trimmer, Electric fence
Electric gate opener, Swimming pool pump
Aquarium, Garage door opener
Sewing machine, Security alarm system
6
Energy Roadmap in Ghana and Botswana
Phase 4
Assuming a linearity of percentage energy use, extrapolate the electricity use for
other sectors and hence the country as a whole. Depending on the source of
electricity generation, estimate the total carbon emission by sector in tones of CO2
equivalent. Using graphical illustrations and discussion notes, present the results as
part of the report.
2. DESCRIPTION OF THE CONTEXT
Ghana and Botswana (both sub-Saharan countries) are currently faced with a
widespread dearth of electricity supply. Current generation and imports are able to
meet only 30-40% of the population’s needs. This has resulted in prolonged power
cuts that last for many hours and/or days. It is in the light of this that the aim of this
case study is to develop a critical understanding of electricity consumption in Ghana
and Botswana’s domestic sector, through the identification of household profiling and
appliance usage and its impact on national electricity use.
3. CLASS ACTIVITY
Project Approach
In this aspect the class will be split into two main groups made up of students who
worked on Ghana in group A and those who worked on Botswana in Group B. Within
each main group are sub groups of 5 person’s maximum (depending on class size).
Phase 1
First, students are divided in their respective groups at the proposed phases in
Chapter one considered. During the first hour;
• Students would average all their domestic energy results to further reduce
any errors (that is average of the averages).
• Calculate the overall energy consumption of the domestic sector,
considering the percentage usage provided in Tables 3 & 4.
7
Energy Roadmap in Ghana and Botswana
• Assuming all sector percentages provided stays the same and are grid
connected, calculate the percentage energy consumption of the other
sectors. This is assuming the consumption percentages stay constant and
it is a linear representation of the country’s energy consumption.
This aspect would consist of a 2 hour class session each being supervised by the
lecturers. This session requirements will be explained by the lecturer(s) for clarity to
help solve the problem if required.
Phase 2
For the first hour, all sub-group members must work together as a united team (A or
B) to discuss their results and summarise the key outcomes. For instance
• What has caused the variation in energy consumptions
• Would the results change if a different city, number of household was
considered
• Etc.
Summary reports must not be more than 2-sides of an A4 sheet. Group B must
engage with the above steps as Group A Simultaneously.
The second hour must be organized as a class debate/discussion with team Group A
against team Group B. Each group must select 3 representatives and a secretary (4
members in total). Topics to be considered in the debate are;
• The relevance of location
• Domestic demand-challenges, limitations etc. Students must at this stage
make reference to the literature survey in Section 1
• How does the energy consumption compare with developed counties?
What are the main differences
• Is energy security really an issue in Ghana Vrs Botswana? If yes why, if
no why not?
• Discuss strategies that can be put in place to improve the infrastructure in
the country’s under research
8
Energy Roadmap in Ghana and Botswana
3.1. SOLUTION AND EVALUATION CRITERIA
The lecturer remains the coordinator and assessor of this session. A group summary
of key points would be submitted after the debate within a stipulated period (to be
confirmed by lecturer (s)). This does not involve any further work than such is written
by the secretary.
At the end of each session, the lecturer gathers the summary reports from each
group for their evaluation and feedback. At the end of the final group session, the
final reports are submitted within reason (as per the lectures advice) for assessment.
Most activities overlap with the Homework calculations. The only outstanding
activities in this section are;
• The report writing
• Debate/discussion
Debate/Discussions
This aspect should be assessed for coordination, coherency in storyline and
responses to arguments and counter arguments.
This session must be coordinated by the teachers and bust be aligned with points
raised in Phase 2 of Section 3.
4. HOMEWORK ACTIVITY
This activity is prepared for a dedication time of around 10 hours for each member in
the group. Its designed and prepared for both individual work (homework) and class
activities. Altogether it is estimated that there would be a total of 5 -10 hours spent
on individual home work. This would include the literature review in phase 1,
completing the home appliance grid (Table 1) analysis (Phase 1 & 2) and the writing-
up of reports (Phase 3).
9
Energy Roadmap in Ghana and Botswana
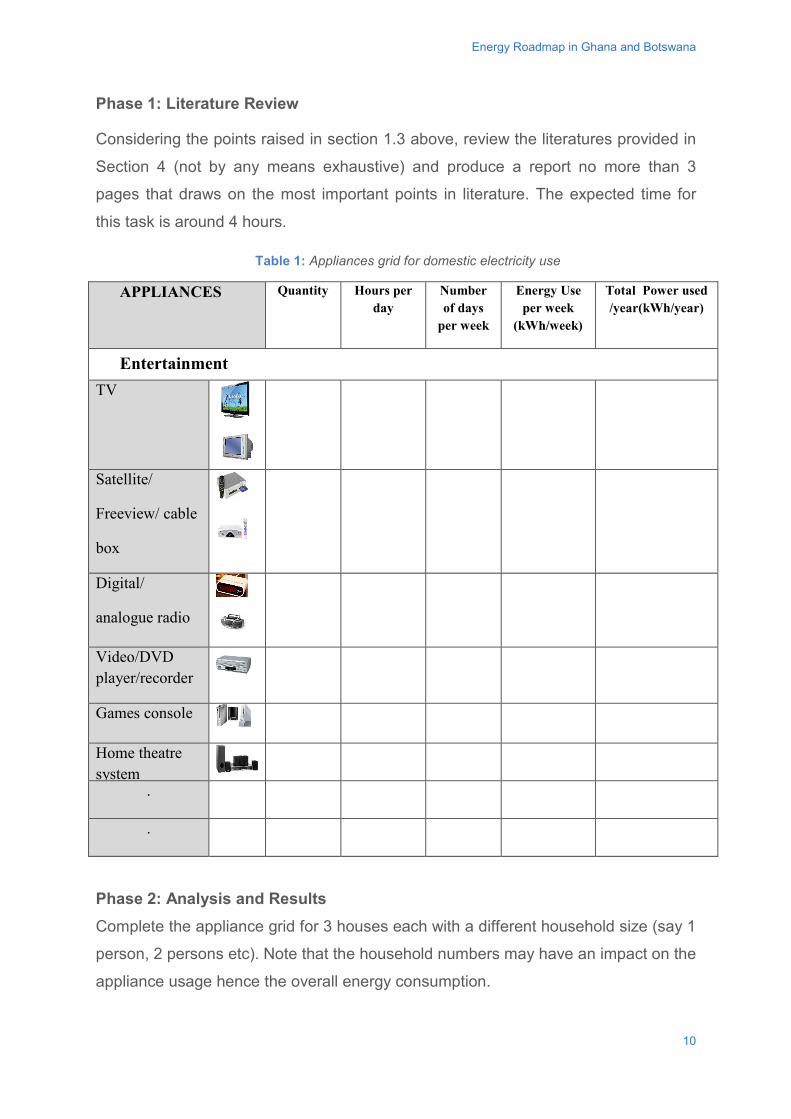
Phase 1: Literature Review
Considering the points raised in section 1.3 above, review the literatures provided in
Section 4 (not by any means exhaustive) and produce a report no more than 3
pages that draws on the most important points in literature. The expected time for
this task is around 4 hours.
Table 1: Appliances grid for domestic electricity use
APPLIANCES Quantity Hours per day
Number of days
per week
Energy Use per week
(kWh/week)
Total Power used /year(kWh/year)
Entertainment TV
Satellite/
Freeview/ cable
box
Digital/
analogue radio
Video/DVD player/recorder
Games console
Home theatre system
.
.
Phase 2: Analysis and Results Complete the appliance grid for 3 houses each with a different household size (say 1
person, 2 persons etc). Note that the household numbers may have an impact on the
appliance usage hence the overall energy consumption.
10
Energy Roadmap in Ghana and Botswana
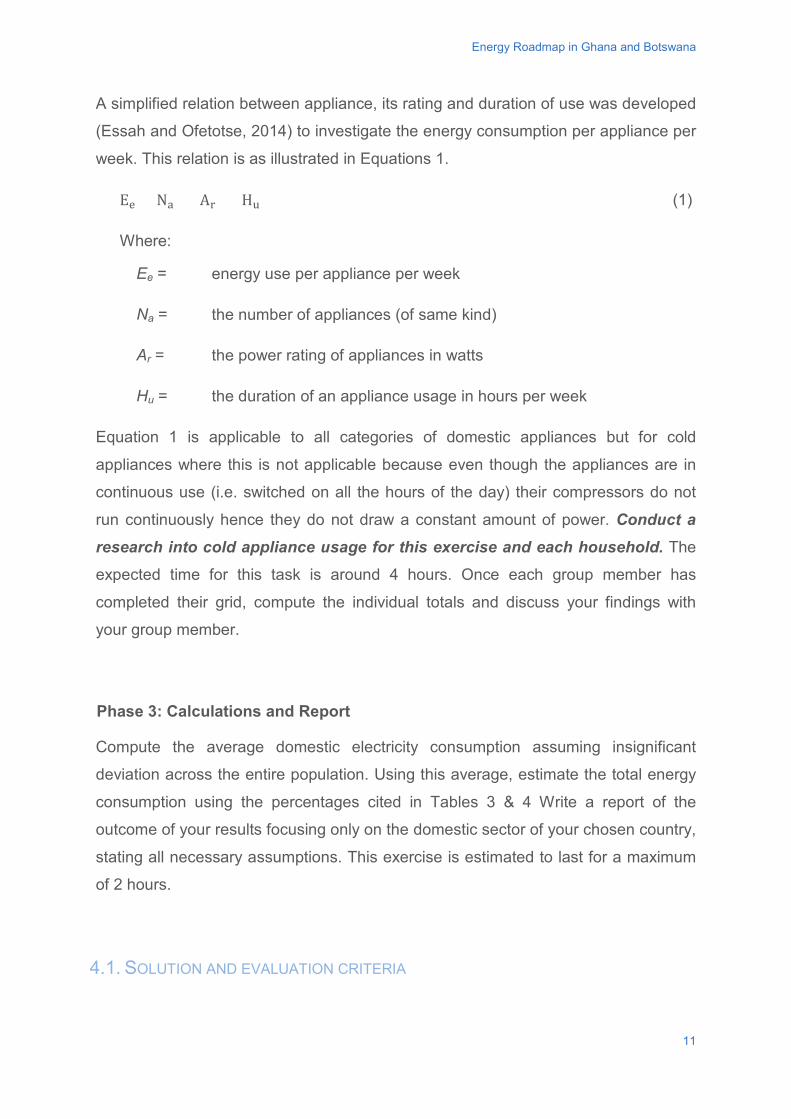
A simplified relation between appliance, its rating and duration of use was developed
(Essah and Ofetotse, 2014) to investigate the energy consumption per appliance per
week. This relation is as illustrated in Equations 1.
Ee = Na × Ar × Hu (1)
Where:
Ee = energy use per appliance per week
Na = the number of appliances (of same kind)
Ar = the power rating of appliances in watts
Hu = the duration of an appliance usage in hours per week
Equation 1 is applicable to all categories of domestic appliances but for cold
appliances where this is not applicable because even though the appliances are in
continuous use (i.e. switched on all the hours of the day) their compressors do not
run continuously hence they do not draw a constant amount of power. Conduct a research into cold appliance usage for this exercise and each household. The
expected time for this task is around 4 hours. Once each group member has
completed their grid, compute the individual totals and discuss your findings with
your group member.
Phase 3: Calculations and Report
Compute the average domestic electricity consumption assuming insignificant
deviation across the entire population. Using this average, estimate the total energy
consumption using the percentages cited in Tables 3 & 4 Write a report of the
outcome of your results focusing only on the domestic sector of your chosen country,
stating all necessary assumptions. This exercise is estimated to last for a maximum
of 2 hours.
4.1. SOLUTION AND EVALUATION CRITERIA
11
Energy Roadmap in Ghana and Botswana
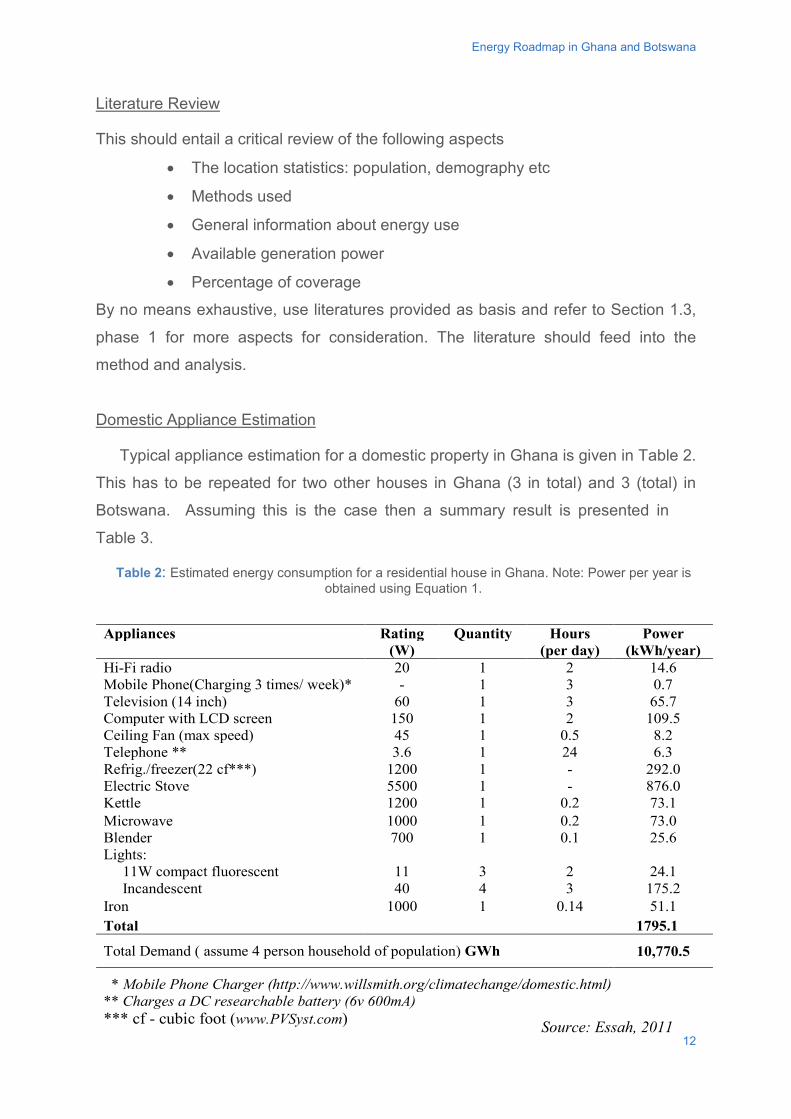
Literature Review
This should entail a critical review of the following aspects
• The location statistics: population, demography etc
• Methods used
• General information about energy use
• Available generation power
• Percentage of coverage
By no means exhaustive, use literatures provided as basis and refer to Section 1.3,
phase 1 for more aspects for consideration. The literature should feed into the
method and analysis.
Domestic Appliance Estimation
Typical appliance estimation for a domestic property in Ghana is given in Table 2.
This has to be repeated for two other houses in Ghana (3 in total) and 3 (total) in
Botswana. Assuming this is the case then a summary result is presented in
Table 3.
Source: Essah, 2011
Appliances Rating Quantity Hours Power (W) (per day) (kWh/year) Hi-Fi radio 20 1 2 14.6 Mobile Phone(Charging 3 times/ week)* - 1 3 0.7 Television (14 inch) 60 1 3 65.7 Computer with LCD screen 150 1 2 109.5 Ceiling Fan (max speed) 45 1 0.5 8.2 Telephone ** 3.6 1 24 6.3 Refrig./freezer(22 cf***) 1200 1 - 292.0 Electric Stove 5500 1 - 876.0 Kettle 1200 1 0.2 73.1 Microwave 1000 1 0.2 73.0 Blender 700 1 0.1 25.6 Lights: 11W compact fluorescent 11 3 2 24.1 Incandescent 40 4 3 175.2 Iron 1000 1 0.14 51.1 Total 1795.1
Total Demand ( assume 4 person household of population) GWh 10,770.5
* Mobile Phone Charger (http://www.willsmith.org/climatechange/domestic.html) ** Charges a DC researchable battery (6v 600mA) *** cf - cubic foot (www.PVSyst.com)
Table 2: Estimated energy consumption for a residential house in Ghana. Note: Power per year is obtained using Equation 1.
12
Energy Roadmap in Ghana and Botswana
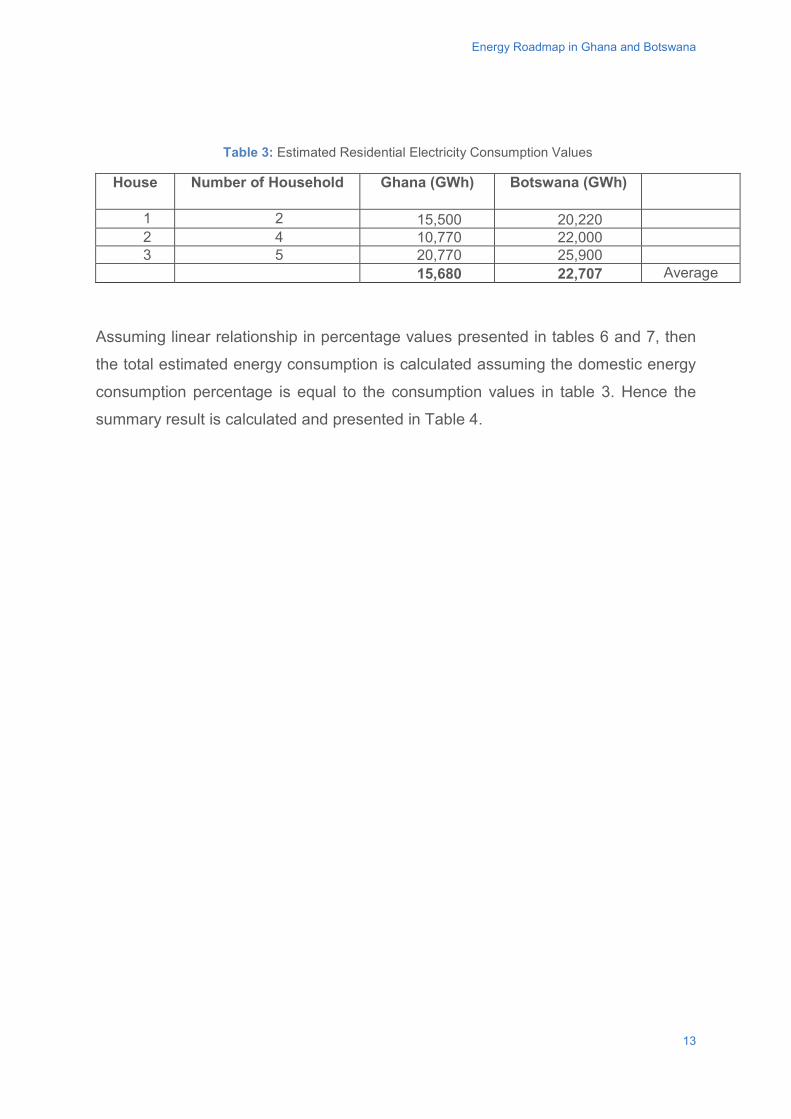
Table 3: Estimated Residential Electricity Consumption Values
House Number of Household Ghana (GWh) Botswana (GWh)
1 2 15,500 20,220 2 4 10,770 22,000 3 5 20,770 25,900 15,680 22,707 Average
Assuming linear relationship in percentage values presented in tables 6 and 7, then
the total estimated energy consumption is calculated assuming the domestic energy
consumption percentage is equal to the consumption values in table 3. Hence the
summary result is calculated and presented in Table 4.
13
Energy Roadmap in Ghana and Botswana
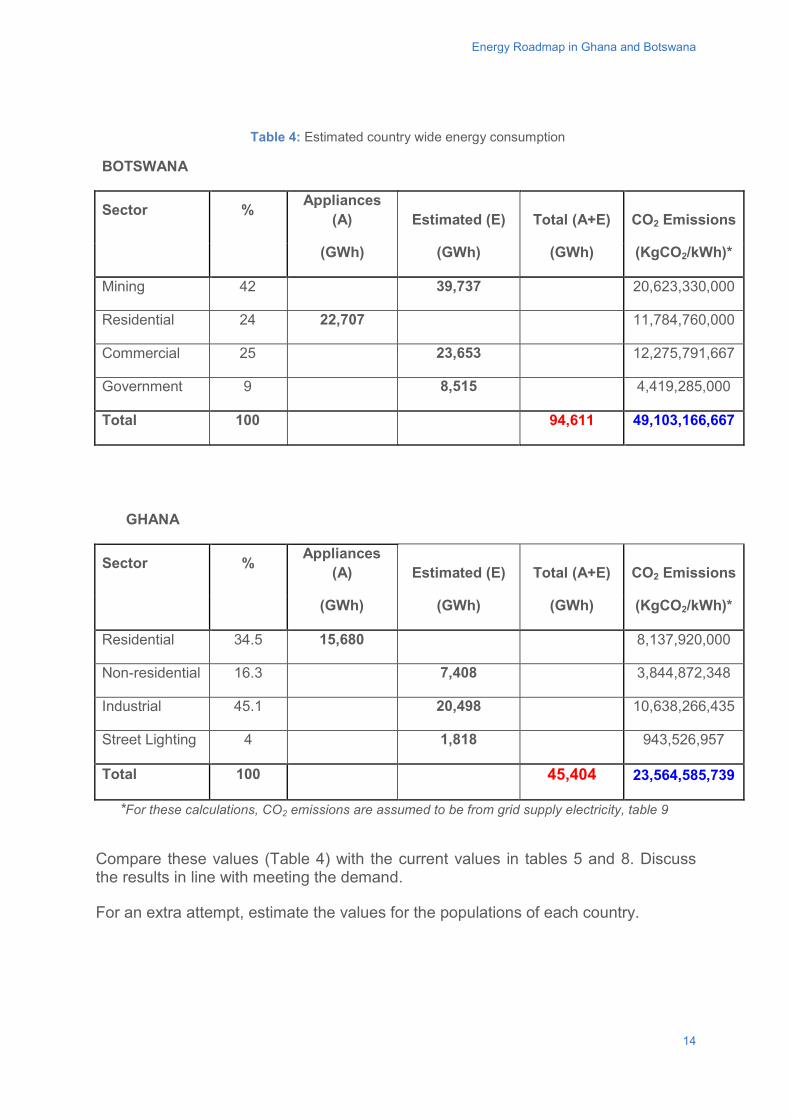
Table 4: Estimated country wide energy consumption
BOTSWANA
Sector % Appliances (A) Estimated (E) Total (A+E) CO2 Emissions
(GWh) (GWh) (GWh) (KgCO2/kWh)*
Mining 42
39,737
20,623,330,000
Residential 24 22,707
11,784,760,000
Commercial 25
23,653
12,275,791,667
Government 9
8,515
4,419,285,000
Total 100
94,611 49,103,166,667
GHANA
Sector % Appliances (A) Estimated (E) Total (A+E) CO2 Emissions
(GWh) (GWh) (GWh) (KgCO2/kWh)*
Residential 34.5 15,680
8,137,920,000
Non-residential 16.3
7,408
3,844,872,348
Industrial 45.1
20,498
10,638,266,435
Street Lighting 4
1,818
943,526,957
Total 100
45,404 23,564,585,739
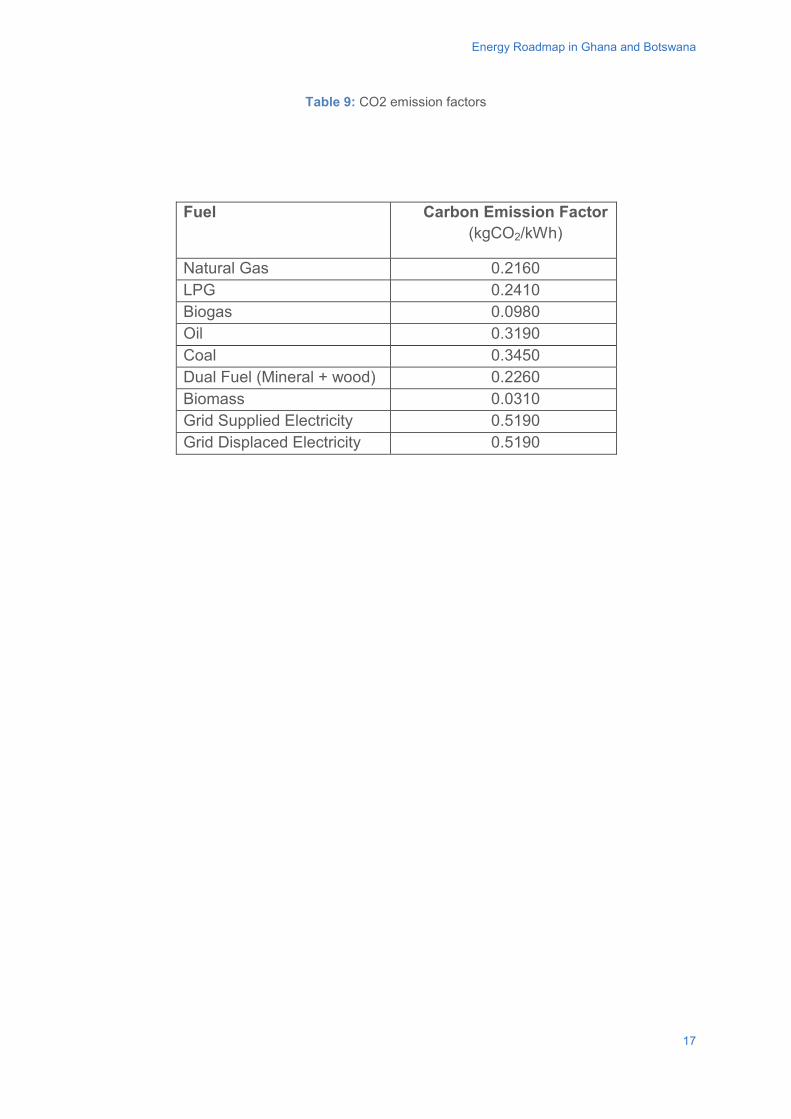
*For these calculations, CO2 emissions are assumed to be from grid supply electricity, table 9 Compare these values (Table 4) with the current values in tables 5 and 8. Discuss the results in line with meeting the demand.
For an extra attempt, estimate the values for the populations of each country.
14
Energy Roadmap in Ghana and Botswana
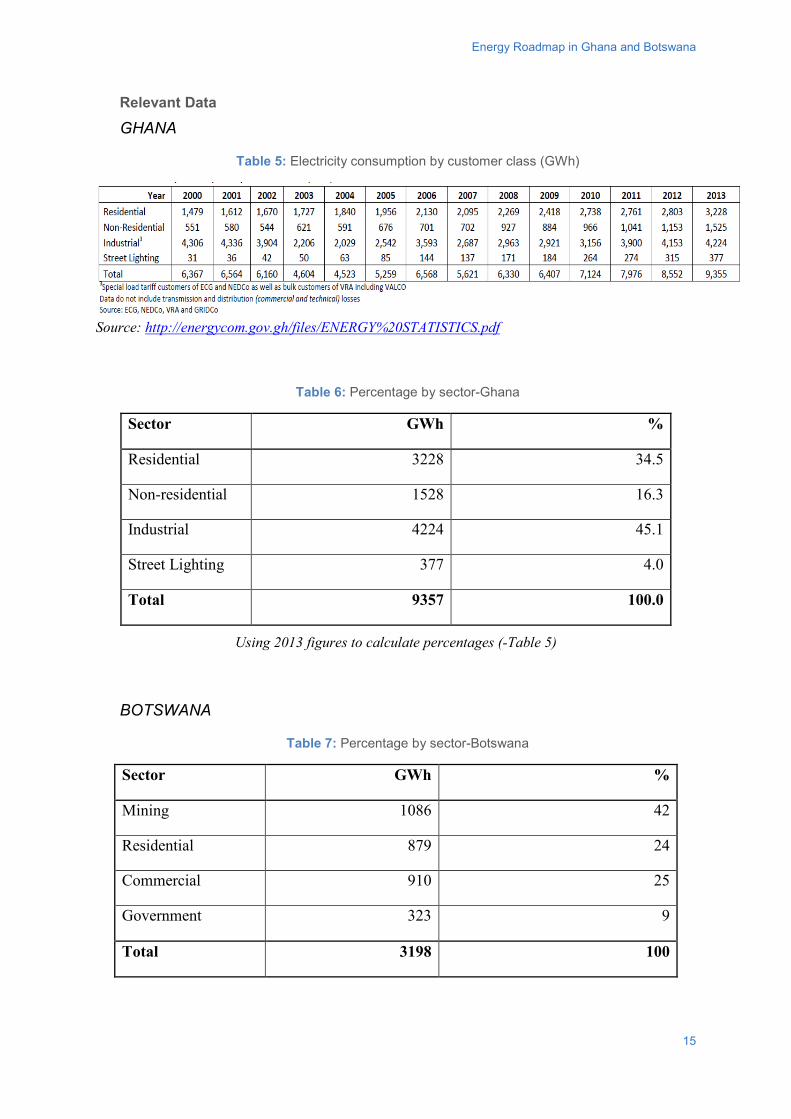
Relevant Data
GHANA
Table 5: Electricity consumption by customer class (GWh)
Source: http://energycom.gov.gh/files/ENERGY%20STATISTICS.pdf
Table 6: Percentage by sector-Ghana
Sector GWh %
Residential 3228 34.5
Non-residential 1528 16.3
Industrial 4224 45.1
Street Lighting 377 4.0
Total 9357 100.0
Using 2013 figures to calculate percentages (-Table 5)
BOTSWANA
Table 7: Percentage by sector-Botswana
Sector GWh %
Mining 1086 42
Residential 879 24
Commercial 910 25
Government 323 9
Total 3198 100
15
Energy Roadmap in Ghana and Botswana
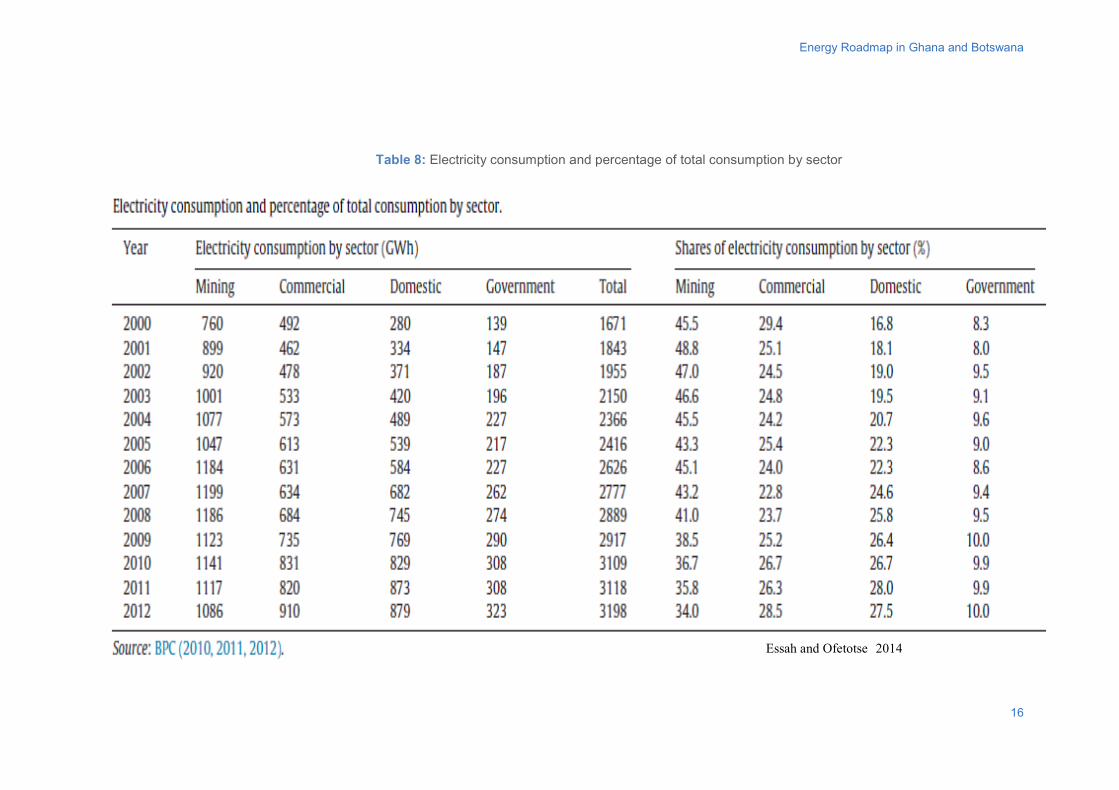
Essah and Ofetotse 2014
Table 8: Electricity consumption and percentage of total consumption by sector
16
Energy Roadmap in Ghana and Botswana
Table 9: CO2 emission factors
Fuel Carbon Emission Factor (kgCO2/kWh)
Natural Gas 0.2160 LPG 0.2410 Biogas 0.0980 Oil 0.3190 Coal 0.3450 Dual Fuel (Mineral + wood) 0.2260 Biomass 0.0310 Grid Supplied Electricity 0.5190 Grid Displaced Electricity 0.5190
17
Energy Roadmap in Ghana and Botswana
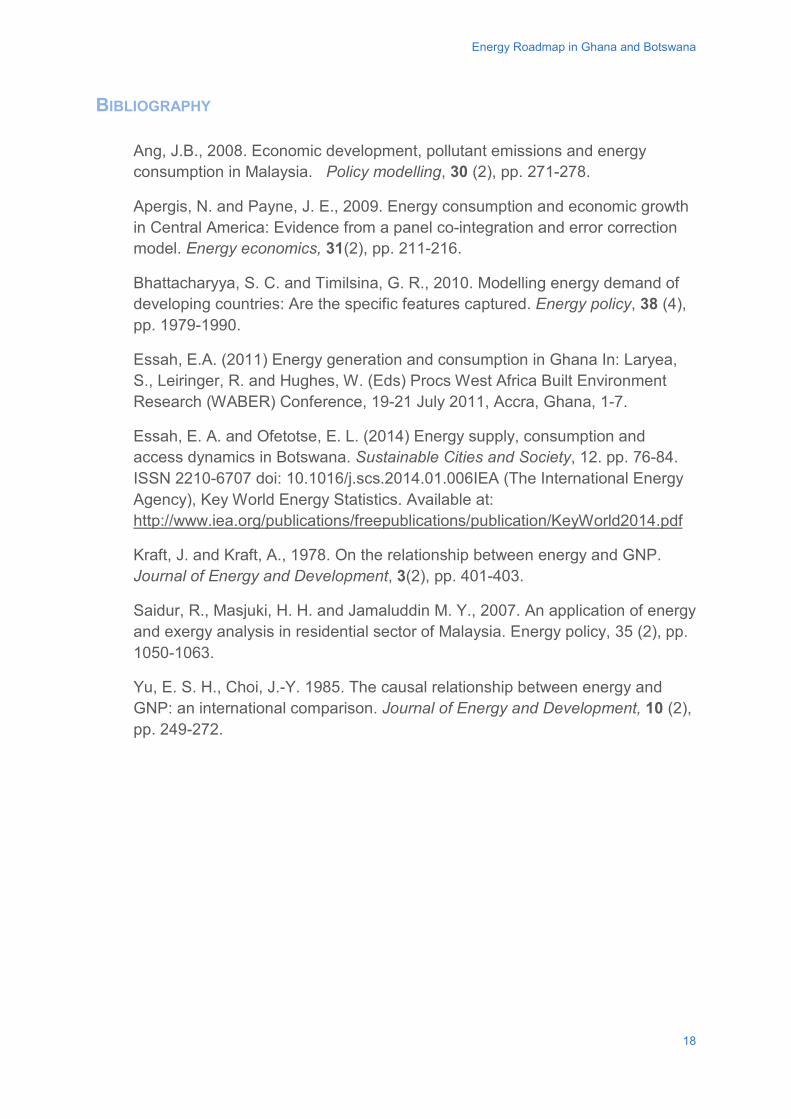
BIBLIOGRAPHY
Ang, J.B., 2008. Economic development, pollutant emissions and energy consumption in Malaysia. Policy modelling, 30 (2), pp. 271-278.
Apergis, N. and Payne, J. E., 2009. Energy consumption and economic growth in Central America: Evidence from a panel co-integration and error correction model. Energy economics, 31(2), pp. 211-216.
Bhattacharyya, S. C. and Timilsina, G. R., 2010. Modelling energy demand of developing countries: Are the specific features captured. Energy policy, 38 (4), pp. 1979-1990.
Essah, E.A. (2011) Energy generation and consumption in Ghana In: Laryea, S., Leiringer, R. and Hughes, W. (Eds) Procs West Africa Built Environment Research (WABER) Conference, 19-21 July 2011, Accra, Ghana, 1-7.
Essah, E. A. and Ofetotse, E. L. (2014) Energy supply, consumption and access dynamics in Botswana. Sustainable Cities and Society, 12. pp. 76-84. ISSN 2210-6707 doi: 10.1016/j.scs.2014.01.006IEA (The International Energy Agency), Key World Energy Statistics. Available at: http://www.iea.org/publications/freepublications/publication/KeyWorld2014.pdf
Kraft, J. and Kraft, A., 1978. On the relationship between energy and GNP. Journal of Energy and Development, 3(2), pp. 401-403.
Saidur, R., Masjuki, H. H. and Jamaluddin M. Y., 2007. An application of energy and exergy analysis in residential sector of Malaysia. Energy policy, 35 (2), pp. 1050-1063.
Yu, E. S. H., Choi, J.-Y. 1985. The causal relationship between energy and GNP: an international comparison. Journal of Energy and Development, 10 (2), pp. 249-272.
18
Energy Roadmap in Ghana and Botswana
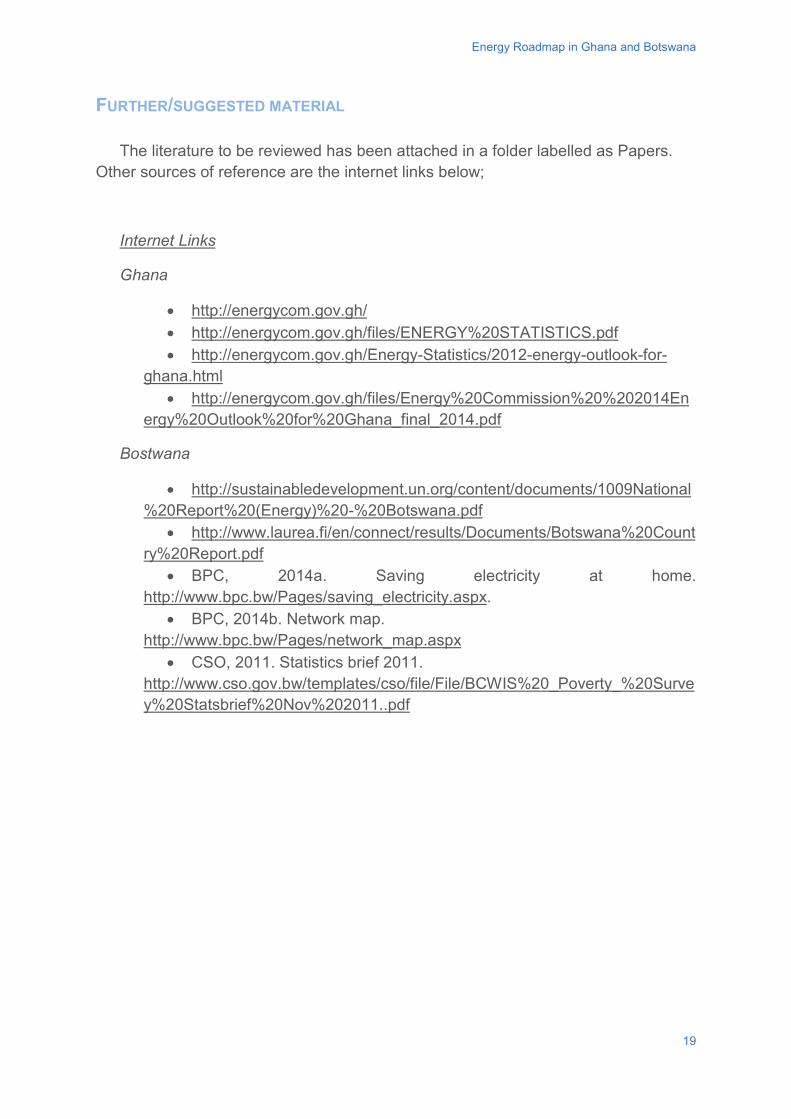
FURTHER/SUGGESTED MATERIAL The literature to be reviewed has been attached in a folder labelled as Papers.
Other sources of reference are the internet links below;
Internet Links
Ghana
• http://energycom.gov.gh/ • http://energycom.gov.gh/files/ENERGY%20STATISTICS.pdf • http://energycom.gov.gh/Energy-Statistics/2012-energy-outlook-for-
ghana.html • http://energycom.gov.gh/files/Energy%20Commission%20%202014En
ergy%20Outlook%20for%20Ghana_final_2014.pdf
Bostwana
• http://sustainabledevelopment.un.org/content/documents/1009National%20Report%20(Energy)%20-%20Botswana.pdf
• http://www.laurea.fi/en/connect/results/Documents/Botswana%20Country%20Report.pdf
• BPC, 2014a. Saving electricity at home. http://www.bpc.bw/Pages/saving_electricity.aspx.
• BPC, 2014b. Network map. http://www.bpc.bw/Pages/network_map.aspx
• CSO, 2011. Statistics brief 2011. http://www.cso.gov.bw/templates/cso/file/File/BCWIS%20_Poverty_%20Survey%20Statsbrief%20Nov%202011..pdf
19
Energy Roadmap in Ghana and Botswana
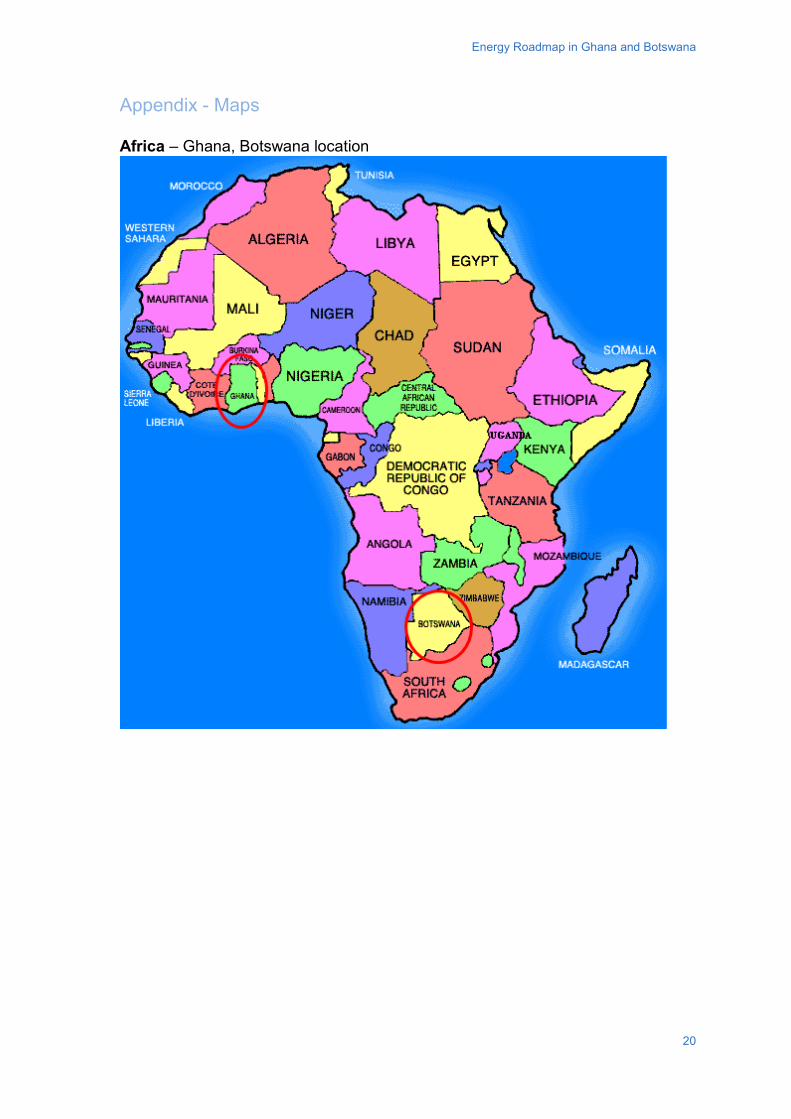
Appendix - Maps Africa – Ghana, Botswana location
20
Energy Roadmap in Ghana and Botswana
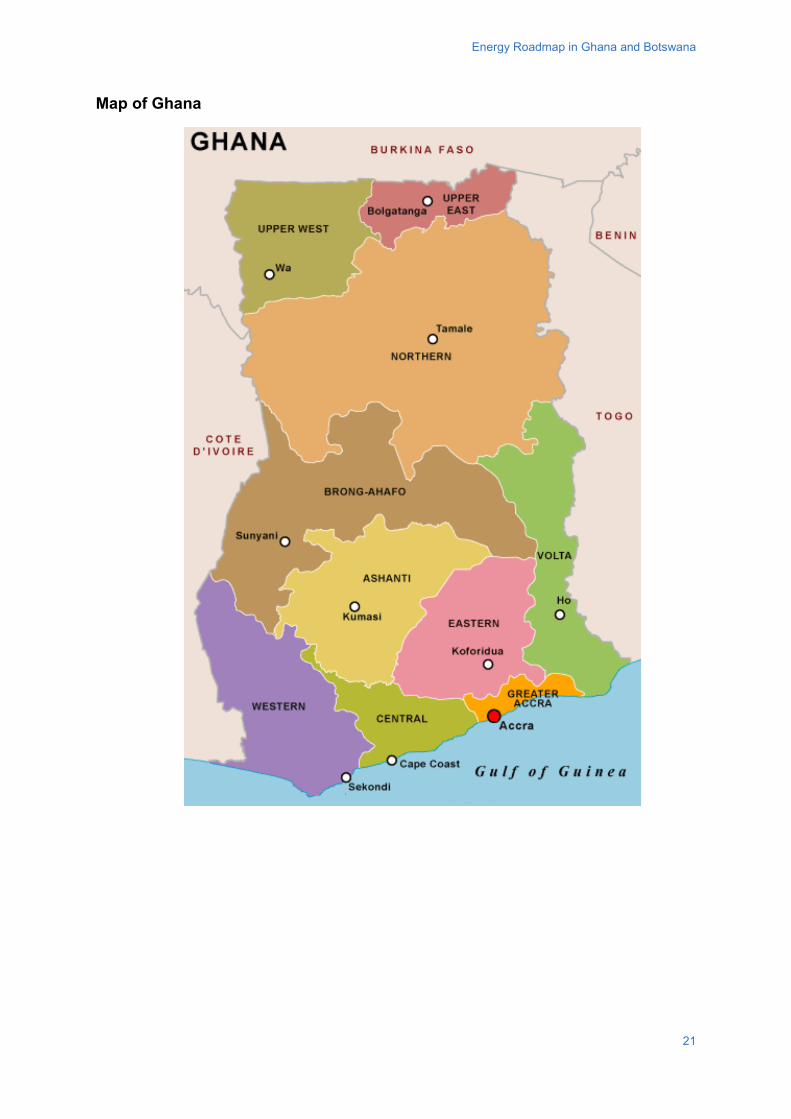
Map of Ghana
21
Energy Roadmap in Ghana and Botswana
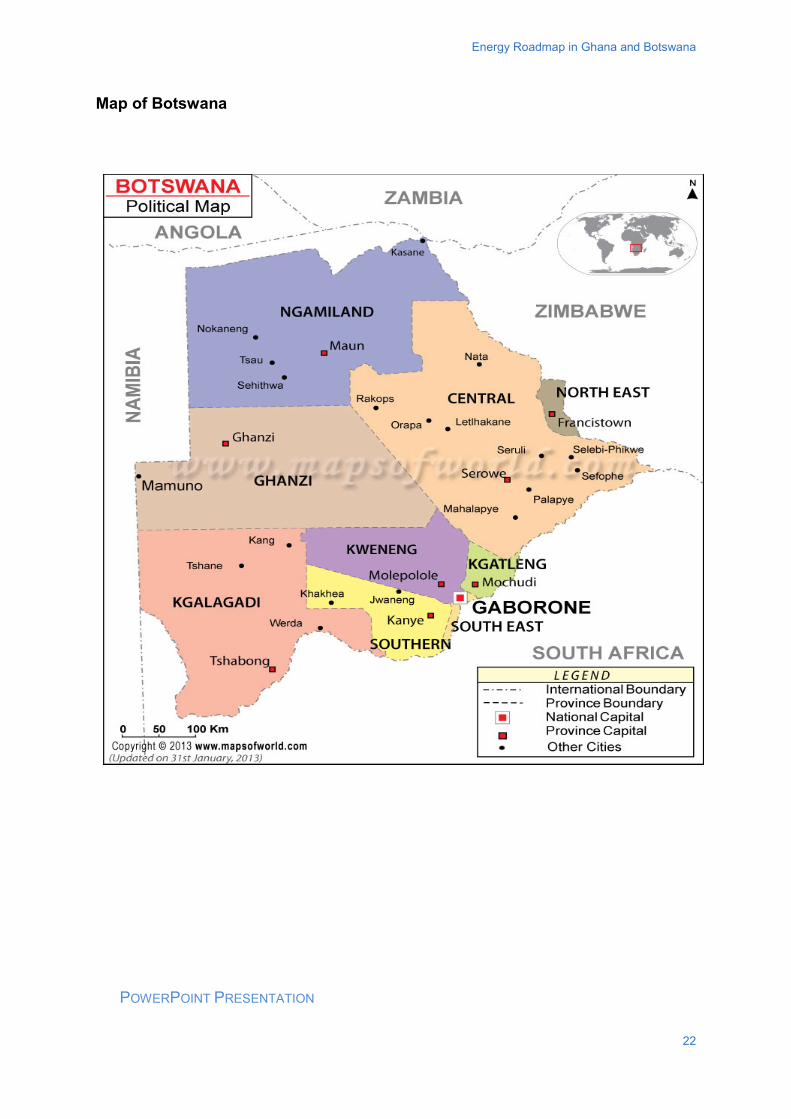
Map of Botswana
POWERPOINT PRESENTATION
22
http://www.gdee.eu
This project is funded by