Enterprise Systems and Innovations - CORE · decision-making, company-wide suites of business...
41
econstor www.econstor.eu Der Open-Access-Publikationsserver der ZBW – Leibniz-Informationszentrum Wirtschaft The Open Access Publication Server of the ZBW – Leibniz Information Centre for Economics Nutzungsbedingungen: Die ZBW räumt Ihnen als Nutzerin/Nutzer das unentgeltliche, räumlich unbeschränkte und zeitlich auf die Dauer des Schutzrechts beschränkte einfache Recht ein, das ausgewählte Werk im Rahmen der unter → http://www.econstor.eu/dspace/Nutzungsbedingungen nachzulesenden vollständigen Nutzungsbedingungen zu vervielfältigen, mit denen die Nutzerin/der Nutzer sich durch die erste Nutzung einverstanden erklärt. Terms of use: The ZBW grants you, the user, the non-exclusive right to use the selected work free of charge, territorially unrestricted and within the time limit of the term of the property rights according to the terms specified at → http://www.econstor.eu/dspace/Nutzungsbedingungen By the first use of the selected work the user agrees and declares to comply with these terms of use. zbw Leibniz-Informationszentrum Wirtschaft Leibniz Information Centre for Economics Engelstätter, Benjamin Working Paper Enterprise systems and innovations ZEW Discussion Papers, No. 09-086 Provided in cooperation with: Zentrum für Europäische Wirtschaftsforschung (ZEW) Suggested citation: Engelstätter, Benjamin (2009) : Enterprise systems and innovations, ZEW Discussion Papers, No. 09-086, http://hdl.handle.net/10419/29648
Transcript of Enterprise Systems and Innovations - CORE · decision-making, company-wide suites of business...
econstor www.econstor.eu
Der Open-Access-Publikationsserver der ZBW – Leibniz-Informationszentrum WirtschaftThe Open Access Publication Server of the ZBW – Leibniz Information Centre for Economics
Nutzungsbedingungen:Die ZBW räumt Ihnen als Nutzerin/Nutzer das unentgeltliche,räumlich unbeschränkte und zeitlich auf die Dauer des Schutzrechtsbeschränkte einfache Recht ein, das ausgewählte Werk im Rahmender unter→ http://www.econstor.eu/dspace/Nutzungsbedingungennachzulesenden vollständigen Nutzungsbedingungen zuvervielfältigen, mit denen die Nutzerin/der Nutzer sich durch dieerste Nutzung einverstanden erklärt.
Terms of use:The ZBW grants you, the user, the non-exclusive right to usethe selected work free of charge, territorially unrestricted andwithin the time limit of the term of the property rights accordingto the terms specified at→ http://www.econstor.eu/dspace/NutzungsbedingungenBy the first use of the selected work the user agrees anddeclares to comply with these terms of use.
zbw Leibniz-Informationszentrum WirtschaftLeibniz Information Centre for Economics
Engelstätter, Benjamin
Working Paper
Enterprise systems and innovations
ZEW Discussion Papers, No. 09-086
Provided in cooperation with:Zentrum für Europäische Wirtschaftsforschung (ZEW)
Suggested citation: Engelstätter, Benjamin (2009) : Enterprise systems and innovations, ZEWDiscussion Papers, No. 09-086, http://hdl.handle.net/10419/29648
Dis cus si on Paper No. 09-086
Enterprise Systems and Innovations
Benjamin Engelstätter
Dis cus si on Paper No. 09-086
Enterprise Systems and Innovations
Benjamin Engelstätter
Die Dis cus si on Pape rs die nen einer mög lichst schnel len Ver brei tung von neue ren For schungs arbei ten des ZEW. Die Bei trä ge lie gen in allei ni ger Ver ant wor tung
der Auto ren und stel len nicht not wen di ger wei se die Mei nung des ZEW dar.
Dis cus si on Papers are inten ded to make results of ZEW research prompt ly avai la ble to other eco no mists in order to encou ra ge dis cus si on and sug gesti ons for revi si ons. The aut hors are sole ly
respon si ble for the con tents which do not neces sa ri ly repre sent the opi ni on of the ZEW.
Download this ZEW Discussion Paper from our ftp server:
ftp://ftp.zew.de/pub/zew-docs/dp/dp09086.pdf
Non-technical summary
Enterprise systems, i. e. company-wide packages of enterprise software for planning, calculating
and managing business processes, are widely used in various industry branches throughout many
countries. In general employed to replace firms’ usually poorly connected legacy software,
enterprise systems might yield improvements in operational integration affecting the entire
organization. On the one hand, Enterprise Resource Planning (ERP) and Supply Chain Management
(SCM) systems may provide information for process innovations by reducing idle times, saving
data mining or identify bottlenecks and shortages. Customer Relationship Management (CRM)
systems, on the other hand, yield a database to identify customer preferences which might be a
useful source for product innovations.
This paper studies the relationship between enterprise systems and firms’ innovational performance.
The analysis is based on a knowledge production function and employs a two step estimation
procedure which takes into account the bias due to potential self selection during the firms’ decision
to innovate. The basis of the analysis builds a German enterprise data set, containing enterprises of
different industry branches from the manufacturing and service sector.
The results are twofold. On the one hand, adoption of ERP and SCM systems increases the
propensity to realize process innovations. In addition, ERP system usage positively affects the
number of realized process innovations. These impacts are not only short-term based, in fact they
remain stable during two to four years. On the other hand, only CRM influences firms’ product
innovational performance as it increases the propensity to acquire product innovations, although
this positive effect is only short-term based.

Das Wichtigste in Kürze
Unternehmensweite Softwarepakete zur Planung, Kalkulation und Steuerung betrieblicher Prozesse
sind nahezu weltweit in verschiedensten Wirtschaftszweigen verbreitet. Im Allgemeinen wird diese
sogenannte Unternehmenssoftware dazu verwendet, die üblicherweise schlecht vernetzten älteren
Softwaresysteme des Unternehmens zu ersetzen. Dabei könnte sie zu Verbesserungen in der
Verflechtung operativer Prozesse führen, die sich auf das gesamte Unternehmen auswirken.
Beispielsweise könnten Enterprise Resource Planning (ERP)- und Supply Chain Management
(SCM)-Systeme durch reduzierte Leerlaufzeiten und die Identifikation von Engpässen
Informationen für Prozessinnovationen liefern. Customer Relationship Management (CRM)-
Systeme dagegen bieten eine Datenbasis, die Auskunft über Präferenzen und Neigungen der
Kunden gibt und eine nützliche Quelle für Produktinnovationen sein könnte.
Diese Studie untersucht den Zusammenhang zwischen Unternehmenssoftware und der
Innovationstätigkeit der Unternehmen. Die Analyse basiert dabei auf einer
Wissensproduktionsfunktion und verwendet eine zweistufige Schätzmethode, welche die
Verzerrung durch mögliche Selbstselektion der Unternehmen bei der Entscheidung, Innovationen
einzuführen, berücksichtigt. Die Grundlage der Analyse bildet ein Unternehmensdatensatz, der
deutsche Unternehmen verschiedener Branchen des verarbeitenden Gewerbes und des
Dienstleistungssektors umfasst.
Die empirischen Untersuchungen zeigen zweierlei Ergebnisse. Zum einen steigert die Einführung
von ERP- und SCM-Systemen die Neigung der Unternehmen, Prozessinnovationen einzuführen.
Zusätzlich beeinflusst der Einsatz eines ERP-Systems die Anzahl der eingeführten
Prozessinnovationen positiv. Diese Wirkungen sind dabei nicht nur kurzfristiger Natur, sondern
bleiben auf lange Sicht von zwei bis vier Jahren stabil. Auf der anderen Seite beeinflusst nur ein
CRM-System die Leistungsfähigkeit der Unternehmen hinsichtlich der Produktinnovationen, indem

dessen Nutzung die Neigung der Unternehmen hin zur Einführung von Produktinnovationen erhöht.
Dieses Ergebnis ist allerdings von kurzfristiger Natur und verliert seine Gültigkeit, wenn man einen
Zeitraum von zwei Jahren und mehr betrachtet.
Enterprise Systems and Innovations§
Benjamin Engelstätter
Abstract
This paper analyzes the relationship between the three main enterprise systems (Enterprise
Resource Planning (ERP), Supply Chain Management (SCM), Customer Relationship Management
(CRM)) and firms’ innovational performance. It studies whether the enterprise systems have
impacts on process as well as product innovations. Using German firm-level data, the results show
that ERP and SCM systems foster the firms’ likelihood to generate process innovations. In addition,
ERP systems also show a positive impact on process innovation intensity. These results do not only
emerge for the short-run of two years or less but remain also stable in the long-run of two to four
years. Concerning product innovational performance only, CRM systems increase the firms’
likelihood to acquire product innovations, although the impact only emerges for the short-run and
vanishes if the long-run perspective is taken into account.
Keywords: Innovation, Product Innovation, Process Innovation, Enterprise Systems, Selectivity,
Enterprise Resource Planning, Supply Chain Management, Customer Relationship Management
JEL Classification: L10, M20, O31
§ I would like to thank Irene Bertschek, Daniel Cerquera, Francois Laisney and Pierre Mohnen for helpful comments
and suggestions. All errors are my own. ZEW, ICT Research Group, P.O. Box 103443, D-68304 Mannheim, email: [email protected]
1
1 Introduction
Covering a large range of software products supporting day-to-day business operations and
decision-making, company-wide suites of business software, namely enterprise systems in short, are
devoted to particular process integration across the value chain. The three main enterprise systems,
Enterprise Resource Planning (ERP), Supply Chain Management (SCM) and Customer
Relationship Management (CRM), are widespread throughout many industries in numerous areas
around the world. The purpose of these systems is to automate operations from supply management,
inventory control, manufacturing scheduling, sales force automation and almost any other data-
oriented management processes. SAP, the largest global enterprise software vendor, estimates the
complete market for core enterprise applications including ERP, SCM and CRM in 2008 at nearly
$39 billion [31].
In general, enterprise systems ought to replace the firms’ legacy software systems, which are
usually poorly connected and spread out all over the firm. In addition, improvements in operational
integration realized through enterprise system adoption can affect the entire organization.
Therefore, ERP and SCM systems might positively foster innovational activity as they reduce idle
times and save data mining or identify bottlenecks and shortages, thus providing information for
process enhancements. With the firm-wide database updated in real time, which both systems
provide, the effects of process innovations can be directly pictured, compared and controlled. CRM
systems, on the other hand, yield a database of customer preferences, which can be a useful source
for product innovations.
Although the usage of information and communication technology (ICT) applications in general is
suspected to enhance firms’ innovational performance [22], the potential impact of enterprise
systems on innovational performance in particular is still not investigated. The literature in this field
is scarce, offering only a few studies which examine the benefits of enterprise systems for
2
innovational activity. Empirical evidence on the basis of firm-level data covering this topic is still
lacking at present. Therefore, this study aims to provide the first empirical evidence of the impact of
adopting any of the three main enterprise systems on firms’ innovational performance. In order to
achieve useful results, the present study relies on a unique database consisting of German firms
from the manufacturing industry and from service sectors.
Using a two step approach the results provide first evidence of innovational activity fostered
through enterprise system usage. The adoption of ERP and SCM systems increases the propensity
to realize process innovations. In addition, ERP system usage has a positive impact on the amount
of acquired process innovations. These impacts are not only short-term based, in fact they stay also
stable in the long-run of two to four years. The usage of CRM systems, on the other hand, does not
have an impact on process innovations but positively impacts the propensity to realize product
innovations, although this impact only holds on a short-term basis of two years or less.
The paper proceeds as follows: Section 2 gives an overview of the appropriate literature covering
the benefits of enterprise systems in general and their potential effects on innovational performance
in particular. Section 3 pictures the estimation approach whereas section 4 presents the dataset.
Section 5 contains the estimation results. Concluding remarks are given in section 6.
2 Methodological and theoretical Framework
2.1 Benefits of Enterprise Systems in general
Replacing complex interfaces between different systems with standardized cross-functional
transaction automation, ERP systems use a source of data that integrates enterprise functions such
as sales and distribution, materials management, production planning, financial accounting, cost
control and human resource management [1]. An ERP system is expected to reduce order cycle
3
times, which in return might lead to improved throughput, customer response times and delivery
speeds [8, 25]. Due to automated financial transactions, cash-to-cash cycle times and the time
needed to reconcile financial data at the end of a quarter or year can be minimized [23, 24]. The
ERP system collects all enterprise data once during the initial transaction, stores the data centrally
and performs updates in real time. The standardized firm-wide transactions and centrally stored
enterprise data will also greatly facilitate the governance of the firm [26, 32].
IT-based SCM systems coordinate and integrate the complete flow of information, materials and
finances and improve operational as well as business planning [10]. The real-time planning
capabilities of SCM systems enable firms to react quickly to supply and demand changes [18],
serving customers in a timely and comprehensive manner [4]. By reducing inventory levels, holding
costs, spoilage and lead times, SCM systems can directly improve inventory management and
increase profitability through a reduction of costs, avoiding lost sales and improving customer
satisfaction [4]. Lower coordination, sales, general and administrative costs, improved decision-
making and forecasting are additional benefits generated through SCM system usage [10]. Based on
its ability of information sharing, collaborative planning and forecasting replenishment, a SCM
system will also lead to improvements in decisions on order quantity, lowered time and costs of
order processing or increased order frequencies combined with reduced lead time.
Providing the appropriate infrastructure, e. g. enabling effective sales force automation, centralized
customer data warehousing and data mining paired with decision support and reporting tools, CRM
systems facilitate the development of long-term relationships with customers [21, 34]. A CRM
system is also expected to lead to superior customer loyalty, reduced cost of sales and services or
improved bottom-line profits [5]. It reduces duplication in data entry and maintenance by providing
a centralized firm-wide database of customer information, capturing all their needs and wants. In
addition, this database replaces systems maintained by individual sales people, institutionalizes
4
customer relationships and prevents the loss of organizational customer knowledge, when sales staff
leaves the firm [18]. The database might also reduce costs via streamlining repetitive transactions
and sales processes [7].
2.2 Effects of Enterprise Systems on Firms’ innovational Performance
Enterprise systems might affect the firms’ innovational performance through different channels.
First of all, enterprise systems foster further innovations directly based on the benefits they provide.
The firm-wide database generated and updated by the ERP system, for example, provides every
employee with necessary data in real-time, thus making data-mining obsolete and enabling the
workers to be more innovative and flexible [9]. ERP systems are also expected to provide strategic
benefits and build additional business innovations, for example by enabling new market strategies
or building up new process chains [33]. Using a SCM system all departments receive in time
information about the resources necessary, therefore bottlenecks and idle time should be reduced to
a minimum. Both systems together generate a suitable and more flexible [10, 25] working
environment and, with product lifecycles and resource usage shown in real-time, room for process
improvements and innovations should be easy to identify. In addition, with the firm wide database
updated in real time, the results of the innovations can be directly pictured, controlled and
compared, providing even more room for improvements. A CRM system, on the other hand, might
be particularly useful for successful product innovations as its data offers a complete picture of the
customers’ wants and needs. In general, this knowledge of customers’ preferences is expected to
shape the firms’ innovation success [20]. Therefore, firms with CRM systems in use should
experience significant advantages in product enhancement and design as they can stick to a rich
database of customer information and adjust their production accordingly.
Besides direct effects, enterprise systems might also indirectly increase innovational performance as
the systems may foster the introduction of some organizational enhancements which have been
5
proven to facilitate the generation of more innovations. [36] proclaims that business units are more
innovative once they reach a more centralized network position that enables them to access new
knowledge generated by other units faster. Enterprise systems fit perfectly into this context as in
particular ERP enhances the intern network capabilities of the firms by providing a centralized
database with access for every employee and business unit and fastening connections between them.
As the communication between the units is accelerated with an ERP system in use, the innovational
activity of the firm might, according to [36], also increase. [6] show that firms generate more
innovations with established upstream, respectively downstream, contacts to suppliers and
customers. [29] support this argument as they emphasize the great value of backwards and
horizontal knowledge linkages for process innovations. With their focus on communication with
suppliers and customers, SCM and CRM systems are expected to maintain current and generate
new upstream and downstream contacts far easier, generating more knowledge linkages in the
process. Consequently, firms with SCM and CRM systems in use have access to a large pool of
knowledge, which will, according to [6] and [29], be helpful to create more innovations.
3 Research methodology
3.1 Knowledge Production Function
The present study will be based on an innovation respectively knowledge production function as
introduced by [14]. The basic assumption is that the output of the innovation process represents a
result of several inputs linked to research and ongoing knowledge accumulation, such as, e. g.,
capital, investment or human capital [13]. [30] augment this function with even more inputs like
enterprise characteristics, firm resources and organizational capabilities to take the different routes
through which knowledge might influence the firms’ innovation activities into account. In addition,
I include enterprise systems in the knowledge production function, providing first insights of the
6
relationship between enterprise system adoption and the firm’s innovational activity. To summarize,
the probability that a firm will generate either product or process innovations is given by
(1) yi* = Xi’β1 + IDi’β2 + ESi’β3 +εi yi = 1 if yi* ≥ 0; yi = 0 otherwise,
where yi stands for the ith firm’s product or process innovation respectively. Xi covers firm
characteristics expected to impact innovations activity, e. g., size, capital, ICT capital, human
capital and East German heritage. IDi includes the control dummies for industry sectors and ESi
contains the enterprise systems used by firm i.
3.2 Innovation Intensity
As the selection equation (1) shows to which extent enterprise system usage foster the firms’
innovation propensity, the next consecutive step will be to reveal the impacts of enterprise systems
on innovation intensity, measured, e. g., by the number of innovations realized in the firm. The
innovational intensity can be specified as
(2) zi* = Zi’λ1 + IDi’λ2 + ESi’λ3 +γi zi= zi* if yi = 1; zi= 0 if yi = 0
where zi* is the unobserved latent variable accounting for the ith firm’s process respectively product
innovation intensity. Zi is a set of determinants expected to affect innovation intensity and contains,
in general, the same variables as in equation (1). As above, ESi pictures enterprise system usage of
firm i and IDi contains the industry control dummies.
3.3 Estimation Procedure
Estimating equations (1) and (2) via maximum likelihood, count data methods have to be used for
inference as the innovation intensity is measured by the number of realized innovations in this
7
study. Taking the possible selection into account, I consider both the hurdle and the zero-inflated
model which allow for a separate treatment of zeros, i. e. non-innovators, and strictly positive
outcomes [38]. Comparing both model types, the zero-inflated model differs from the hurdle-model
in that, with pi=P(yi=1), zi=zi* for the full range of zi* and not just for strictly positive values. The
appropriate model for the present dataset will be chosen in section 5 based on usual model selection
criteria. Both models can either be based on the Poisson or the negative binomial distribution.
Allowing for overdispersion, frequently occurring in applied economics, the negative binomial
distribution seems to be the more reasonable choice in the present analysis. In the following, the
appropriate distribution will be selected based on a likelihood-ratio test1.
4 The Data
The dataset used in this study results from two computer-aided telephone surveys conducted in
2004 and 2007 by the Centre for European Economic Research (ZEW). These surveys laid a
specific focus on the diffusion and use of ICT in German companies. In general, the interviewee
was the chief executive officer of the firms who could also decide to pass questions on to a
corresponding employee like, e. g., the head of the ICT department. Each wave of this ICT-dataset
originally contains information of about 4,000 firms with five or more employees, representatively
chosen from important service and manufacturing sectors in Germany. The data basis for the
sample stems from the credit rating agency Creditreform. This agency provides the largest data base
on firms available in Germany. Creditreform collects some basic information like address, sector
and firm size on all enterprise that ever applied for a bank credit. The selection from the population
of German firms was stratified according to industries (seven branches of the manufacturing
1 Both proposed models assume at least conditional independence between the selection process (1) and the count
process (2). I acknowledge that this simplification can be relaxed by using the endogenous selection model proposed by [35]. However, the endogenous selection model, although theoretically identified by its functional form [27], should rely on exclusion restrictions to produce credible outcomes. As the current dataset does not provide a suitable exclusion restriction, I pass inference based on the endogenous selection model on to further research with new data and stick to the zero-inflated and hurdle models to establish a baseline.
8
industry and seven selected service sectors), to three size classes and to two regions (East/West
Germany) and. There have been asked as many firms as needed until all strata were filled.
Besides detailed information on the usage of several other ICT applications, the dataset provides the
usage level of the three main enterprise software applications ERP, SCM and CRM. The possible
level of usage in the questionnaire was none, minor or complete. For this study, I built a dummy
variable for the use of each software application which takes the value one if a firm uses the
software at least to a minor degree or completely and zero otherwise2. In addition, the surveys
contain information about the firms’ workforce, total investments and other variables, like e. g.
organizational practices.
The 2007 survey covers the product and process innovations in the time of 2004 to 2006. However,
the answers on enterprise system usage in this survey are related to the year 2007. Since the survey
is organized as a panel dataset, I use the software usage reported in 2004 to construct the needed
dummy variables. Nevertheless, the impacts of enterprise systems on the firms’ innovational
performance may to some extent still be biased upward as a few firms might have their enterprise
systems reported in 2004 not yet installed by the time they generated their innovations. As the 2004
survey began in April, this source of endogeneity bias should be rather small but despite that, the
results should be interpreted carefully. In the following section, the potential size of this bias will be
checked via auxiliary regressions. The estimation procedure using enterprise systems reported in
2004 can only capture short-term innovational effects of a time space covering two years or less
between the realized innovation and the enterprise system adoption. Therefore, the additional
auxiliary regressions will also focus on revealing any long-term innovational impacts of enterprise
systems.
2 The interpretation of an impact due to minor software use in comparison to no or complete use is impossible as the
questionnaire does not make any distinctions between the levels of usage.
9
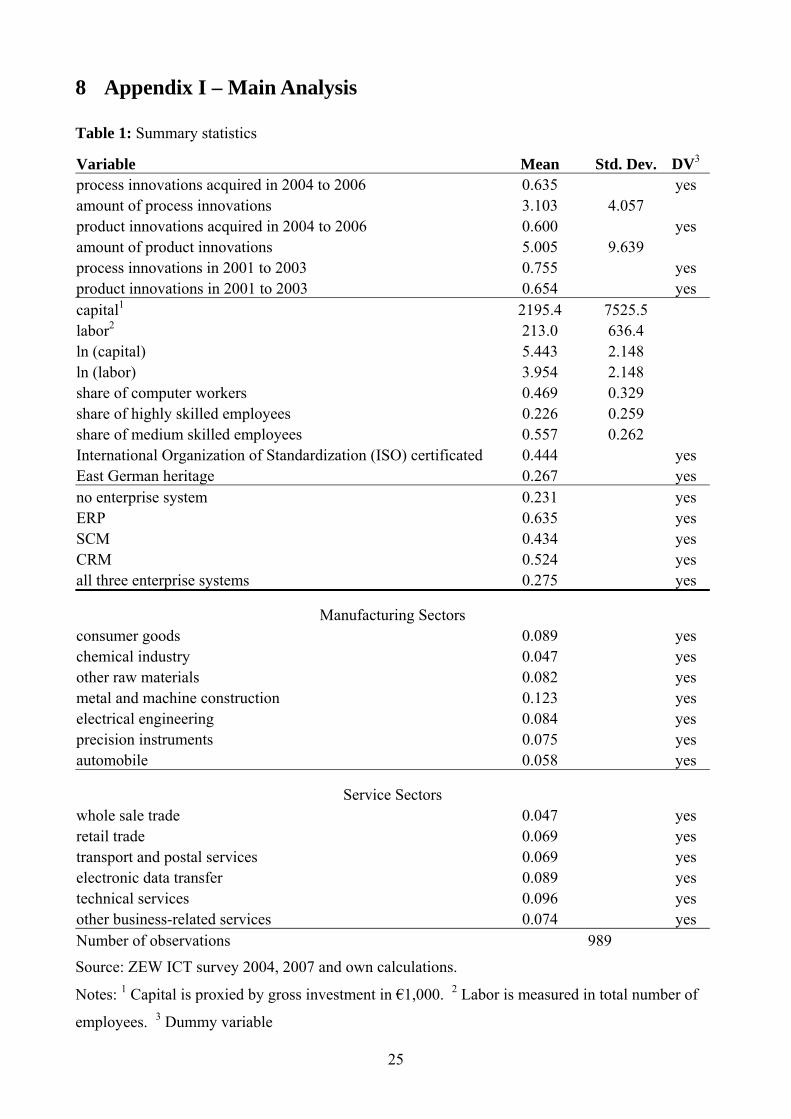
Suffering from panel mortality and a large proportion of item-nonresponse, matching the data for
the two periods returns nearly 1,100 observations. After dropping the banking sector3, I had 989
observations left for my final dataset. Table 14 shows the descriptive statistics for the variables used
in this study. To employ a well-defined temporal sequence in line with the reported enterprise
system usage, all other explanatory variables also refer to the year 2004. The innovation measures,
on the other hand, are taken from the survey of 2007, capturing the innovations in the time of 2004
to 2006. As there is no data available to measure the firms’ physical capital stock, I follow, e. g.,
[15] by using the gross investment figures as an empirical proxy for the capital stock in the
knowledge production function. In addition, Table 1 also contains the descriptive statistics for the
industry affiliations and the location in the east respectively west part of Germany for the firms in
the final sample.
------ Insert Table 1 about here ------
From 2004 to 2006, around 64 percent of the firms reported process innovations and 60 percent
reported realized product innovations. As a measure for innovation intensity, the average amount of
process innovations a firm has introduced in the mentioned time space results in 3, for product
innovations it turns out to be 55. As innovational performance is highly influenced by former
innovational experience [12, 16], the dataset also includes two dummy variables covering whether a
firm was process or product innovator in the time span of 2001 to 2003. About 75 percent of the
firms in the dataset are former process innovators, 64 percent reported former product innovations.
For 2004, the average firm size amounts to 213 employees and the mean investment is € 2,195.400.
The mean share of workers mainly using a personal computer for their work, as a proxy for the ICT
intensity of the firm which is suspected to positively affect a firms’ innovational performance, e. g.
3 As the enterprise software packages in the German banking sector seem to significantly differ from the ones used in
other sectors, I decided to drop that sector completely in order to reduce measurement errors. 4 All Tables are located in the appendix. 5 To correct for especially high outliers and to reduce potential measurement errors, I use the 95th percentile of the
reported quantities for both types of innovations.
10
[17], amounts to around 47 percent in the used sample. Human capital is measured via the share of
highly skilled workers, including degrees from university and technical college, and the share of
medium skilled workers, including finished apprenticeships, in-firm trainings or technical degrees.
The mean share of highly skilled workers amounts to around 23 percent in the given sample, for
medium skilled workers it results in about 56 percent. The certification of the International
Organization of Standardization (ISO) indicates that a firm applies an international standardized
strategy in building new products or using new processes. Being ISO certificated values the projects
of the certificated firm and, in general, makes them comparable to projects worldwide. In the
literature, ISO certification is argued to positively affect innovations to some extent, e. g. [3, 28],
making it a viable choice as a control variable in the present study. Around 44 percent of the firms
in the used dataset are ISO certificated. Nearly 27 percent of the firms are located in East Germany.
Enterprise systems are widely spread in the used sample, only around one quarter of the firms
reports no enterprise systems at all. Especially common is the use of ERP, around 64 percent of the
observed firms rely on this system. SCM systems are adopted from around 43 percent of the firms
and about one half of the firms use CRM systems. All three enterprise systems together are
employed by around 28 percent of the firms. Examining the industry affiliation of the firms, the
biggest share, of around 12 percent, conducts business in metal and machine construction, only a
few belong to the automobile or chemical industry (5 respectively 6 percent).
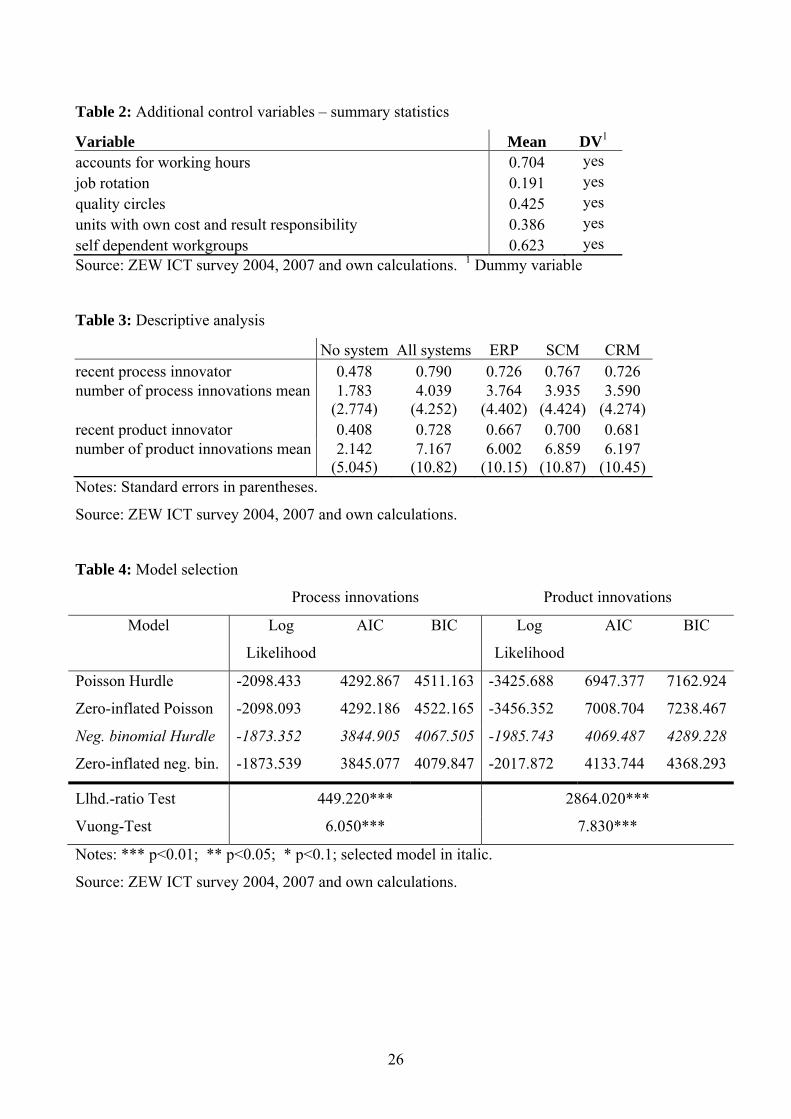
Table 2 reports the descriptives for a group of additional organizational dummy control variables
which I expect to positively influence the firms’ innovational performance. As shown in [17], the
firms’ innovation activity is not only influenced by the usage of ICT but also positively affected by
certain organizational factors which allow for more employee flexibility. To capture the potential
influence of these factors on firms’ innovational activity, I include five organizational practices as
controls in the estimation procedure. These organizational variables report if a firm has established
accounts for working hours, uses job rotation, quality circles or relies on units with own cost and
11
result responsibility or self dependent working groups. The percentage of firms which apply these
practices varies from nearly 70 percent using accounts for working hours to 19 percent using job
rotation techniques.
------ Insert Table 2 about here ------
To firstly offer descriptive evidence for potential impacts of enterprise systems on innovational
performance, Table 3 shows additional statistics of the firms using enterprise systems. In addition,
there lies a specific focus on the group of firms using no enterprise systems at all or the full suite of
the systems. Comparing the average innovational performance for each group with the entire
sample means reported in Table 1, it is easy to see that once the firms use enterprise software, every
innovation measure exceeds the sample mean slightly. Firms which use all three enterprise systems
together show the highest mean values. In contrast, using no enterprise system at all results in
values lower than the sample mean. This result may be viewed as a first clue pointing to the
suspected positive impact of enterprise systems on innovational performance. However, it does not
provide any descriptive evidence for highly different impacts of specific enterprise systems on one
type of innovations as argued in section 2. CRM users do not show higher mean values concerning
product innovations and the mean values of ERP or SCM using firms are only slightly higher than
those of CRM users in the case of process innovations.
------ Insert Table 3 about here ------
12
5 Empirical Results
5.1 Model Selection
As the first step of the estimation procedure a model which will be used in the given estimation
setup has to be chosen. In doing so, the model selection is based on the three usual criteria, the log
likelihood ratio, the Akaike and the Bayesian information criterion. According to [15], a bivariate
model should be used for process and product innovations but the hypothesis of independence of
both error terms, given the used covariates, is not rejected in the current dataset. Therefore, two
separate models will be used for inference. In the following estimations, I use two specifications,
one parsimonious specification without the mentioned additional organizational control variables
and another one capturing the impacts of these control variables as well. For the estimation of the
selection equation (1) I choose a probit6 model. Table 4 reports the criteria for the possible model
choices based on the parsimonious specification as including the additional organizational control
variables only changes the magnitude of the criteria slightly. Examining Table 4, it is easy to see
that the negative binomial hurdle model performs best in all three considered categories for process
as well as product innovations. In addition, a likelihood ratio test evaluating the Poisson model
(dispersion parameter alpha = 0) against the negative binomial distributed alternative given the
employed covariates rejects the hypothesis of Poisson distribution usage in favor of the negative
binomial distribution for all considered model types significantly at the one percent level. However,
the Vuong-Test [37] of the zero-inflated against the hurdle model favours the zero-inflated model
for process as well as product innovations with a test statistic significant at the one percent level. As
Monte Carlo experiments evaluating the test and the other selection criteria in a negative binomial
model setup are still lacking at the moment, the model choice becomes somewhat arbitrary.
6 A logit specification could also be used to estimate equation (1). However, as the results are virtually the same
compared to the ones obtained from the probit approach they are not pictured in this study.
13
However, as the zeros of the underlying count process are directly identifiable in the present
dataset, I stick to the frequently used hurdle model in the current analysis7.
------ Insert Table 4 about here ------
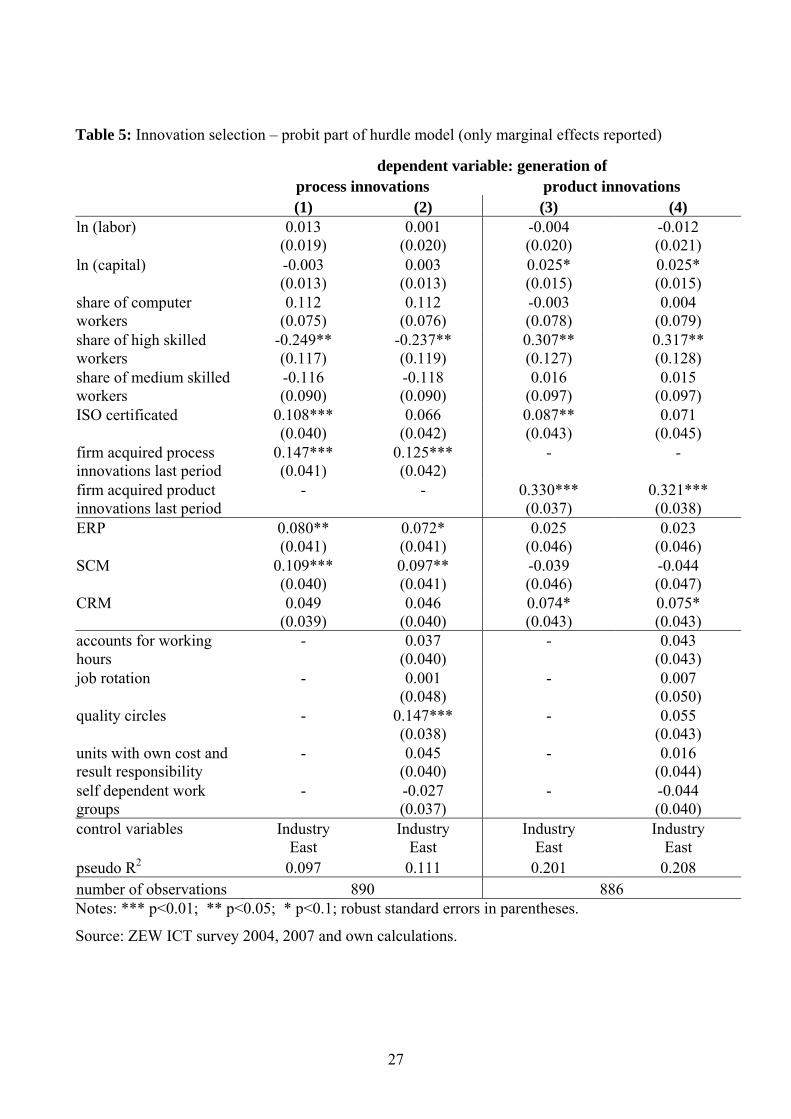
5.2 Short-Term Impacts of Enterprise Systems on Innovation Propensity
Table 5 reports the average marginal effects for the first part of the hurdle model containing the
probit estimations8 of equation (1) and pictures the mentioned short-term relation of two years or
less for both process and product innovations. Column (1) and (2) of Table 4 display both
specifications, the parsimonious one and the one including the organizational control variables, for
the propensity to generate process innovations. The last two columns picture the results for both
specifications concerning product innovations. As this study focuses especially on the impacts of
enterprise systems on innovational performance, I will discuss other factors influencing
innovational activity only briefly.
The estimation for process innovations shows that ERP and SCM system adoption, as expected,
significantly increase the probability to generate process innovations. CRM system usage, on the
other hand, shows no impact at all. These results hold also if the specification with all additional
control variables is applied, although the coefficients of ERP and SCM decrease in size and the
coefficient of SCM decreases one level in significance. For instance, the estimate of 0.109 in
Column (2) of Table 5 indicates that the probability to realize process innovations is related to an
increase of nearly 11 percentage points if the firm adopts a SCM system. For the adoption of an
ERP system, the increase amounts to around 8 percentage points. Considering the other coefficients
7 The results from the zero-inflated negative binomial model are roughly the same compared to the ones obtained from
the hurdle alternative and are available from the author upon request. 8 Only the marginal effects are discussed in the following section. The coefficients of the probit estimations can be
found in Table 7.
14
in Column (2), being a previous process innovator and using quality circles stand out in showing the
highest values and significance levels, indicating a high positive impact on the likelihood to
generate process innovations. An acquired ISO certification also seems to affect the probability to
acquire process innovations positively, although only in the parsimonious specification. The share
of highly skilled workers, on the other hand, shows a significantly negative impact on the
probability to realize process innovations. This puzzling negative impact seems to account for the
case that in contrast to product innovations, process innovations might in general not be initiated by
the highly skilled workforce but by low to medium skilled workers working directly in the
production process9.
The short-term impacts of enterprise systems on the probability to acquire new product innovations
differ completely compared to the impacts on process innovations. ERP and SCM systems, as
expected, seem to have no effect on firms’ product innovational performance. Although based on a
low significance level, CRM systems usage on the other hand shows a positive impact on the
probability to acquire product innovations. This impact stays robust even if one controls for
additional organizational practices. Considering the other coefficients in both columns, only being a
product innovator in the last period and the share of highly skilled workers show a positive and
highly significant impact on the likelihood of generating product innovations. An ISO certification
also seems to positively affect the probability for product innovations as its impact turns out to be
significant in the parsimonious specification. However, controlling for the firms’ organizational
practices, this impact vanishes. In addition, the propensity to acquire new product innovations
seems to be positively affected by increases in gross investment figures, although the coefficient is
based on a low significance level in both specifications.
------ Insert Table 5 about here ------
9 In the current dataset this relation seems to hold as the spearman correlation coefficient between product innovations
and highly skilled workers amounts to 0.25 significant at the one percent level compared to a slightly negative but non-significant coefficient between process innovations and highly skilled workers.
15
5.3 Short-Term Impacts of Enterprise Systems on Innovation Intensity
Table 6 reports the estimation results of equation (2) for both specifications and process as well as
product innovations. As in Table 5, the first two Columns (1) and (2) picture the results for process
innovations, the last two Columns capture the results for product innovations. Having in mind the
impacts from enterprise systems on the propensity to innovate pictured in Table 5, one would
suspect similar results for innovation intensity. This implies a positive impact on process innovation
intensity due to ERP and SCM system usage and a positive influence of CRM systems on product
innovation intensity. Starting out with process innovations, the results show that the adoption of an
ERP system is strongly positive related to process innovation intensity in the short-run. This holds
for the parsimonious specification as well as for the specification including additional
organizational control variables, although the coefficient decreases in size and significance in the
second specification. SCM systems, on the other hand, fail to significantly increase the number of
process innovations a firm realizes. The usage of a CRM system also does not have an impact on
the intensity of process innovations. In addition, being a former process innovator and an acquired
ISO certification show a highly significant positive influence on the intensity of process innovation
in 2004 to 2006, although both coefficients decrease in size in the second specification with
additional organizational variables included.
Having the estimates of the first part of the negative binomial hurdle model in mind, the results of
Table 6 confirm, as expected, that both process orientated enterprise systems, i. e. ERP and SCM,
have no impact on the intensity of product innovations. Surprisingly though is the non-existence of
an impact due to CRM system usage. All three enterprise system coefficients turn out to be
insignificant in both specifications, as shown in Column (3) and (4) of Table 6, indicating no impact
of enterprise systems on product innovation intensity at all. Moving on to the other coefficients,
only firm size and the usage of self dependent workgroups show a positive and significant impact
on the intensity of product innovations.
16
In addition, the dispersion coefficient alpha stays highly significant throughout all four columns of
Table 6. The magnitude of these particular coefficients indicates a high overdispersion in the data
and therefore strengthens the choice of the negative binomial distribution against the alternative of
an underlying Poisson distribution. The overdispersion turns out to be larger in the case of process
innovations.
------ Insert Table 6 about here ------
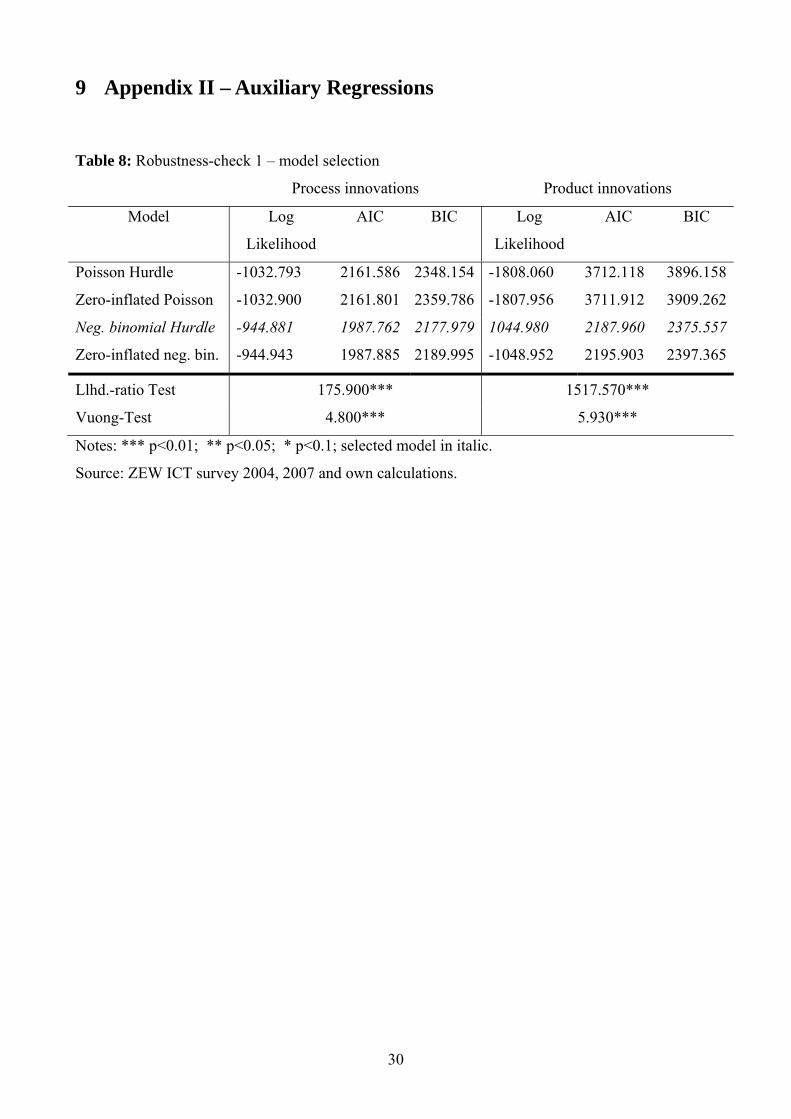
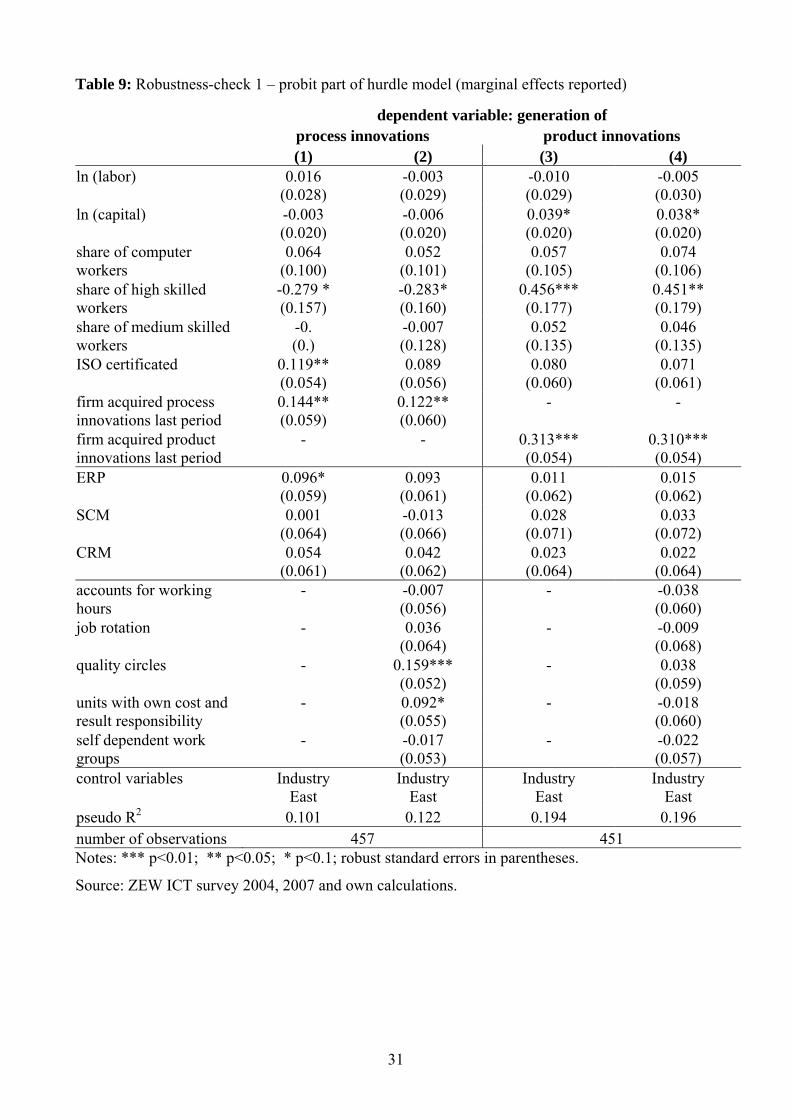
5.4 Long-Term Impacts and Robustness Checks
To identify potential long-term impacts and ensure the validity of the results so far, I apply
additional regression procedures10. Besides revealing long-term influences of enterprise systems on
innovational activities, these checks also provide information concerning the size of the possible
endogeneity bias mentioned in section 4. In the first step, the estimation procedure is completely
repeated using the enterprise software adoption reported in the 2002 survey instead of the one from
the survey in 2004, cutting the number of observation in half as now three surveys are used for
estimation. Concerning ERP, the results obtained from the selected negative binomial hurdle model
are roughly the same, i. e. show a significant impact of ERP on process innovation intensity,
although this impact is based on a weaker significance level compared to the former estimation. The
impact of ERP on process innovation propensity, on the other hand, stays significant at 10 percent
level in the parsimonious specification but exceeds this threshold slightly (12 percent) if additional
organizational practices are account for. Nevertheless, the results indicate that the size of the
mentioned bias might be negligible small in the case of ERP. These results also offer a clue of a
positive long-term impact of ERP on the firms’ process innovational performance as the time
10 The results of these auxiliary regressions are located in the second part of the appendix.
17
difference between the adoption of the ERP and the realized process innovation covers two to four
years in this regression.
The second robustness-check procedure regresses the same explanatory variables as before on the
percentage of sales spent by the firms for research and development (R&D) in 2006, using ordinary
least squares, as this variable is not obtained via a count process. In the regression is controlled for
former process as well as former product innovators. The variable covering R&D spending could
not be used as an explanatory variable in the former estimations concerning the short-term influence
of enterprise systems as its value is only available for the entire year of 2006, making it an
unsuitable choice to explain innovations in the time space of 2004 to 2006. In this robustness-check
regression R&D spending is viewed as pre-stage for innovations, indicating ongoing innovational
activity. Concerning the estimation results, SCM shows a highly significant positive impact on
R&D spending of at least two years after its adoption, providing a clue towards long-term effects of
SCM adoption on the firms’ innovational performance as increased R&D spending will in general
result in new innovations.
Based on these results it seems that the adoption of ERP as well as SCM systems positively impacts
the innovational performance of firms not only in the short- but also in the long-run. This indicates
that the impacts of ERP and SCM reported in the short-run analysis might even be underestimated
as a part of the impacts is only realized after a few years have passed and accordingly not captured
in the short-term analysis. In addition, the enterprise systems used in this study are nowadays quite
old (5 to 7 years) and there is no information about updates available. Thus, it may be the case that
up to date enterprise systems provide even more functions to improve the firms’ innovational
performance.
18
6 Conclusion
Enterprise systems are nowadays widely spread among different industries around the world.
Although it is argued that enterprise systems increase firm performance, e. g. [1, 11, 19], their
impact on innovational performance is at the moment only suspected. Empirical evidence
concerning a relationship between enterprise systems and innovational performance is still missing
at present.
The current study aims at filling this gap by empirically exploring the impact of the three main
enterprise systems ERP, SCM and CRM on the innovational performance of firms for process as
well as product innovations. Using a two step approach the results indicate a positive impact of ERP
and SCM systems on the propensity to generate process innovations. The adoption of an ERP
system also positively affects the numbers of realized process innovations. These results are not
only short-term based but remain also stable if a long-run perspective is taken into account. The
usage of CRM systems, on the other hand, does not have an impact on process innovations but
positively impacts the propensity to realize product innovations on a short-term basis.
The results reveal a new aspect of benefits through enterprise system usage as besides expected
productivity and efficiency gains enterprise systems might also foster the firms’ innovational
performance. Especially the increased process innovational performance due to ERP and SCM
adoption might, in the long run, even cut down costs for the firm in a larger amount overall
compared to the investments in enterprise systems. Therefore, managers should not only focus on
costs and potential performance benefits in general when deciding to buy or upgrade enterprise
systems.
Expected to significantly drive innovational performance, a potential short-coming of the analysis is
the absence of an R&D measure as an explanatory variable. Without controlling for R&D intensity,
19
all coefficients tend to be biased upward. Although the survey in 2007 contained R&D investment
for 2006, I decided not to include it in the estimation procedure as this variable would introduce
additional bias in the result as mentioned in section 5. However, the potential bias due to omission
of R&D should be rather small in the present study due to inclusion of the complete investments
figures of the firms in 2004, as this variable also contains the complete R&D spending in that year.
Also of concern, as the current study contains short- and long-term perspectives, is a timing issue.
The current dataset offers no way to control for the age of the enterprise systems in use as the
purchase time was not asked for. In line with that, there is also no information concerning the firms’
legacy system usage and potential implementation problems. Future availability of new data may
provide evidence even for these cases.
Although there is no suspicion, no case study evidence and neither a theoretical argument that a
complementarity relationship among the enterprise systems, as shown for their impact on labor
productivity in [11], could foster the innovational impact of enterprise systems, an effect based on
potential complementarity cannot be ruled out completely. However, as the current analysis forms a
starting point concerning the relationship between innovational performance and enterprise systems,
revealing any complementarity aspects was no aim of this study and is accordingly passed on to
future research.
20
7 References
1. Aral, S., Brynjolfsson, E. and Wu, D. J. Which came first, IT or productivity? The virtuous
cycle of investment and use in enterprise systems. In ICIS 2006 Proceedings, Paper 110, 2006.
2. Bach D. and Sallet J. The challenges of classification: emerging VoIP regulation in Europe and
the United States. IE Working Paper 05-19, 2005.
3. Benner, M. J. and Tushman, M. Process Management and Technological Innovation: A
Longitudinal Study of the Photography and Paint Industries. Administrative Science Quarterly
47 (2002), 676–706.
4. Cachon, G. and Fisher M. Supply chain inventory management and the value of shared
information. Management Science 46, 8 (2000), 1032-1048.
5. Chen, I. J. Planning for ERP systems: analysis and future trends. Business Process Management
7, 5 (2001), 374-386.
6. Criscuolo, C., Haskel, J., and Slaughter, M. Why are some firms more innovative? Knowledge
inputs, knowledge stocks and the role of global engagement. NBER working paper, No. 11479,
2005.
7. Cohen, M. A., Agrawal, N. and Agrawal, V. Winning in the Aftermarket. Harvard Business
Review 84, 5 (2006), 129-138.
21
8. Cotteleer, M. J. and Bendoly, E. Order lead-time improvement following enterprise-IT
implementation: An empirical study, Management Information Systems Quarterly 30, 3 (2006),
643-660.
9. Davenport, T. H. Putting the Enterprise into the Enterprise system, Harvard Business Review
76, 4 (1998), 121-132.
10. Dehning, B., Richardson, V. J., and Zmud, R. W. The Financial Performance Effects of IT-
Based Supply Chain Management Systems in Manufacturing Firms, Journal of Operations
Management 25, 1 (2007), 806-824.
11. Engelstätter, B. Enterprise Systems and Labor Productivity: Disentangling Combination Effects.
ZEW Discussion Paper 09-040, 2009.
12. Flaig, G., and Stadler, M. Success breeds success. The Dynamics of the Innovation Process.
Empirical Economics 19 (1994), 55-68.
13. Fritsch, M. Measuring the quality of regional innovation systems - A knowledge production
function approach. International Regional Science Review 25, 1 (2002), 86-101.
14. Griliches, Z. Issues in assessing the contribution of R&D to productivity growth. Bell Journal of
Economics 10 (1979), 92-116.
15. Hall, B. H., Lotti, F., and Mairesse, J. Innovation and productivity in SMEs: empirical evidence
for Italy. Small Business Economics 33 (2009), 13-33.
22
16. Hempell, T. Does Experience Matter? Innovations and the Productivity of ICT in German
Services. Economics of Innovation and New Technology 14, 4 (2005), 277-303.
17. Hempell, T., and Zwick, T. New Technology, Work Organisation, and Innovation. Economics
of Innovation and New Technology 17, 4 (2008), 331-354.
18. Hendricks, K. B., Singhal, V. R., and Stratman, J. K. The Impact of Enterprise Systems on
Corporate Performance: A Study of ERP, SCM and CRM System Implementations, Journal of
Operations Management 25, 1 (2007), 65-82.
19. Hitt, L. M., Wou, D. J., and Zhou, X. Investment in Enterprise Resource Planning: Business
Impact and Productivity Measures. Journal of Management Information Systems, 19, 1 (2002),
71-98.
20. Joshi, A. W., and Sharma, S.. Customer knowledge development: antecedents and impact on
new product performance. Journal of Marketing 68 (2004), 47-59.
21. Katz, H. How to embrace CRM and make it succeed in an organization. Costa Mesa: SYSPRO
White Paper, 2002.
22. Leeuwen, G. van, and Wiel, H. P. van der ICT, innovaties en productiviteit: Een analyse met
Nederlandse bedrifsgegevens, CPB memorandum, no 61, 2003.
23. Mabert, V.A., Soni, A.K., and Venkataramanan, M.A. Enterprise resource planning survey of
US manufacturing firms, Production & Inventory Management Journal 41, 20 (2000), 52-58.
24. McAfee, A. The impact of enterprise resource planning systems on company Performance, At

23
Wharton Electronic Supply Chain Conference, 1999.
25. McAfee, A. The Impact of Enterprise Information Technology Adoption on Operational
Performance: An Empirical Investigation, Productions and Operations Management 11, 1
(2002), 33-53.
26. McAfee, A., and Upton, D. Vandelay Industries. Harvard Business School Case # 9-697-037,
Boston: Harvard Business School Publishing, 1996.
27. Miranda, A., and Rabe-Hesketh, S. Maximum likelihood estimation of endogenous switching
and sample selection model for binary, count, and ordinal variables. The Stata Journal 6, 3
(2006), 285-308
28. Rehfeld, K. M., Rennings, K., and Ziegler, A. Integrated Product Policy and Environmental
Product Innovations: An Empirical Analysis. Ecological Economics 61, 1 (2007), 91-100.
29. Roper, S., Du, J., and Love, J. H. Knowledge sourcing and innovation. Aston Business School
Research Paper 0605, 2006.
30. Roper, S., Du, J., and Love, J. H. Modelling the innovation value chain. Research Policy 37
(2008), 961-977.
31. SAP. Annual Report. Mannheim: SAP; 2008.
Available at SAP: http://www.sap.com/germany/company/investor/reports/index.epx
24
32. Scott, J.E., and Vessey, I. Implementing enterprise resource planning systems: The role of
learning from failure. Information Systems Frontiers 2, 2 (2000), 213-232.
33. Shang, S., and Seddon, P.B. Assessing and managing the benefits of enterprise systems: the
business manager’s perspective. Information Systems Journal 12 (2002), 271-299.
34. Suresh, H. What is customer relationship management (CRM)? Supply Chain Planet, April
2004.
35. Terza, J. V. Estimating count data with endogenous switching: Sample selection and
endogenous treatment effects. Journal of Econometrics 84 (1998), 129-154.
36. Tsai, W. Knowledge transfer in intraorganizational networks: Effects of network position and
absorptive capacity on business unit innovation and performance. Academy of Management
Journal 44 (2001), 996–1004.
37. Vuong, Q. H. Likelihood ration tests for model selection and non-nested hypothesis.
Econometrica 57, 2 (1989), 307-333.
38. Winkelmann, R. Count Data Models with selectivity. Econometric Review 17, 4 (1998), 339-
359.
25
8 Appendix I – Main Analysis
Table 1: Summary statistics
Variable Mean Std. Dev. DV3 process innovations acquired in 2004 to 2006 0.635 yes amount of process innovations 3.103 4.057 product innovations acquired in 2004 to 2006 0.600 yes amount of product innovations 5.005 9.639 process innovations in 2001 to 2003 0.755 yes product innovations in 2001 to 2003 0.654 yes capital1 2195.4 7525.5 labor2 213.0 636.4 ln (capital) 5.443 2.148 ln (labor) 3.954 2.148 share of computer workers 0.469 0.329 share of highly skilled employees 0.226 0.259 share of medium skilled employees 0.557 0.262 International Organization of Standardization (ISO) certificated 0.444 yes East German heritage 0.267 yes no enterprise system 0.231 yes ERP 0.635 yes SCM 0.434 yes CRM 0.524 yes all three enterprise systems 0.275 yes
Manufacturing Sectors consumer goods 0.089 yes chemical industry 0.047 yes other raw materials 0.082 yes metal and machine construction 0.123 yes electrical engineering 0.084 yes precision instruments 0.075 yes automobile 0.058 yes
Service Sectors whole sale trade 0.047 yes retail trade 0.069 yes transport and postal services 0.069 yes electronic data transfer 0.089 yes technical services 0.096 yes other business-related services 0.074 yes Number of observations 989
Source: ZEW ICT survey 2004, 2007 and own calculations.
Notes: 1 Capital is proxied by gross investment in €1,000. 2 Labor is measured in total number of
employees. 3 Dummy variable
26
Table 2: Additional control variables – summary statistics
Variable Mean DV1 accounts for working hours 0.704 yes
job rotation 0.191 yes
quality circles 0.425 yes
units with own cost and result responsibility 0.386 yes
self dependent workgroups 0.623 yes Source: ZEW ICT survey 2004, 2007 and own calculations. 1 Dummy variable
Table 3: Descriptive analysis
No system All systems ERP SCM CRM recent process innovator 0.478 0.790 0.726 0.767 0.726 number of process innovations mean
1.783 (2.774)
4.039 (4.252)
3.764 (4.402)
3.935 (4.424)
3.590 (4.274)
recent product innovator 0.408 0.728 0.667 0.700 0.681 number of product innovations mean
2.142 (5.045)
7.167 (10.82)
6.002 (10.15)
6.859 (10.87)
6.197 (10.45)
Notes: Standard errors in parentheses.
Source: ZEW ICT survey 2004, 2007 and own calculations.
Table 4: Model selection
Process innovations Product innovations
Model Log
Likelihood
AIC BIC Log
Likelihood
AIC BIC
Poisson Hurdle -2098.433 4292.867 4511.163 -3425.688 6947.377 7162.924
Zero-inflated Poisson -2098.093 4292.186 4522.165 -3456.352 7008.704 7238.467
Neg. binomial Hurdle -1873.352 3844.905 4067.505 -1985.743 4069.487 4289.228
Zero-inflated neg. bin. -1873.539 3845.077 4079.847 -2017.872 4133.744 4368.293
Llhd.-ratio Test
449.220***
2864.020***
Vuong-Test 6.050*** 7.830***
Notes: *** p<0.01; ** p<0.05; * p<0.1; selected model in italic.
Source: ZEW ICT survey 2004, 2007 and own calculations.
27
Table 5: Innovation selection – probit part of hurdle model (only marginal effects reported)
dependent variable: generation of process innovations product innovations (1) (2) (3) (4) ln (labor)
0.013 (0.019)
0.001 (0.020)
-0.004 (0.020)
-0.012 (0.021)
ln (capital)
-0.003 (0.013)
0.003 (0.013)
0.025* (0.015)
0.025* (0.015)
share of computer workers
0.112 (0.075)
0.112 (0.076)
-0.003 (0.078)
0.004 (0.079)
share of high skilled workers
-0.249** (0.117)
-0.237** (0.119)
0.307** (0.127)
0.317** (0.128)
share of medium skilled workers
-0.116 (0.090)
-0.118 (0.090)
0.016 (0.097)
0.015 (0.097)
ISO certificated
0.108*** (0.040)
0.066 (0.042)
0.087** (0.043)
0.071 (0.045)
firm acquired process innovations last period
0.147*** (0.041)
0.125*** (0.042)
-
-
firm acquired product innovations last period
-
-
0.330*** (0.037)
0.321*** (0.038)
ERP
0.080** (0.041)
0.072* (0.041)
0.025 (0.046)
0.023 (0.046)
SCM
0.109*** (0.040)
0.097** (0.041)
-0.039 (0.046)
-0.044 (0.047)
CRM
0.049 (0.039)
0.046 (0.040)
0.074* (0.043)
0.075* (0.043)
accounts for working hours
-
0.037 (0.040)
-
0.043 (0.043)
job rotation
-
0.001 (0.048)
-
0.007 (0.050)
quality circles
-
0.147*** (0.038)
-
0.055 (0.043)
units with own cost and result responsibility
-
0.045 (0.040)
-
0.016 (0.044)
self dependent work groups
-
-0.027 (0.037)
-
-0.044 (0.040)
control variables
Industry East
Industry East
Industry East
Industry East
pseudo R2 0.097 0.111 0.201 0.208 number of observations 890 886 Notes: *** p<0.01; ** p<0.05; * p<0.1; robust standard errors in parentheses.
Source: ZEW ICT survey 2004, 2007 and own calculations.

28
Table 6: Innovation intensity – negative binomial part of hurdle model
dependent variable: amount of generated process innovations product innovations (1) (2) (3) (4) ln (labor)
0.057 (0.041)
0.049 (0.041)
0.135* (0.071)
0.156** (0.073)
ln (capital)
-0.012 (0.031)
-0.016 (0.032)
0.003 (0.054)
-0.011 (0.054)
share of computer workers
0.117 (0.163)
0.120 (0.167)
0.238 (0.254)
0.260 (0.252)
share of high skilled workers
-0.264 (0.270)
-0.299 (0.275)
-0.402 (0.410)
-0.449 (0.401)
share of medium skilled workers
-0.061 (0.208)
-0.086 (0.211)
0.014 (0.346)
0.083 (0.333)
ISO certificated
0.226** (0.091)
0.189** (0.092)
-0.134 (0.144)
-0.089 (0.140)
firm acquired process innovations last period
0.265*** (0.096)
0.238** (0.010)
-
-
firm acquired product innovations last period
-
-
-0.051 (0.176)
-0.084 (0.174)
ERP
0.268** (0.105)
0.265** (0.105)
0.018 (0.153)
-0.078 (0.154)
SCM
0.052 (0.089)
0.048 (0.092)
0.135 (0.141)
0.094 (0.137)
CRM
-0.065 (0.095)
-0.094 (0.095)
0.106 (0.134)
0.039 (0.132)
accounts for working hours
-
-0.050 (0.094)
-
-0.207 (0.146)
job rotation
-
-0.010 (0.097)
-
0.027 (0.134)
quality circles
-
0.077 (0.085)
-
-0.048 (0.128)
units with own cost and result responsibility
-
0.113 (0.087)
-
0.194 (0.129)
self dependent work groups
-
0.061 (0.087)
-
0.350*** (0.123)
constant
1.094*** (0.250)
1.100*** (0.257)
1.096** (0.483)
0.911** (0.466)
alpha
0.490*** (0.056)
0.484*** (0.056)
1.399*** (0.160)
1.338*** (0.151)
control variables
Industry East
Industry East
Industry East
Industry East
number of observations 890 886 Notes: *** p<0.01; ** p<0.05; * p<0.1; robust standard errors in parentheses.
Source: ZEW ICT survey 2004, 2007 and own calculations.

29
Table 7: probit part of hurdle model
dependent variable: generation of process innovations product innovations (1) (2) (3) (4) ln (labor)
0.035 (0.050)
-0.003 (0.052)
-0.011 (0.020)
-0.030 (0.054)
ln (capital)
-0.009 (0.035)
-0.009 (0.036)
0.063* (0.037)
0.064* (0.038)
share of computer workers
0.296 (0.197)
0.295 (0.200)
-0.008 (0.198)
-0.010 (0.201)
share of high skilled workers
-0.658** (0.308)
-0.628** (0.314)
0.781** (0.323)
0.805** (0.324)
share of medium skilled workers
-0.307 (0.237)
-0.312 (0.238)
0.041 (0.246)
0.039 (0.246)
ISO certificated
0.288*** (0.107)
0.176 (0.111)
0.222** (0.111)
0.180 (0.116)
firm acquired process innovations last period
0.380*** (0.104)
0.325*** (0.107)
-
-
firm acquired product innovations last period
-
-
0.853*** (0.102 )
0.829** (0.104)
ERP
0.210** (0.107)
0.191* (0.107)
0.062 (0.116)
0.059 (0.117)
SCM
0.292*** (0.109)
0.258** (0.112)
-0.100 (0.116)
-0.112 (0.118)
CRM
0.129 (0.103)
0.122 (0.105)
0.189* (0.109 )
0.190* (0.109)
accounts for working hours
-
0.096 (0.105)
-
0.110 (0.109)
job rotation
-
0.002 (0.127)
-
0.017 (0.126)
quality circles
-
0.395*** (0.106)
-
0.140 (0.109)
units with own cost and result responsibility
-
0.120 (0.107)
-
0.041 (0.112)
self dependent work groups
-
-0.071 (0.099)
-
-0.113 (0.103)
constant
-0.450 (0.284)
-0.407 (0. 293)
-1.466*** (0.301)
-1.439*** (0.310)
control variables
Industry East
Industry East
Industry East
Industry East
pseudo R2 0.097 0.111 0.201 0.208 number of observations 890 886 Notes: *** p<0.01; ** p<0.05; * p<0.1; robust standard errors in parentheses.
Source: ZEW ICT survey 2004, 2007 and own calculations.
30
9 Appendix II – Auxiliary Regressions
Table 8: Robustness-check 1 – model selection
Process innovations Product innovations
Model Log
Likelihood
AIC BIC Log
Likelihood
AIC BIC
Poisson Hurdle -1032.793 2161.586 2348.154 -1808.060 3712.118 3896.158
Zero-inflated Poisson -1032.900 2161.801 2359.786 -1807.956 3711.912 3909.262
Neg. binomial Hurdle -944.881 1987.762 2177.979 1044.980 2187.960 2375.557
Zero-inflated neg. bin. -944.943 1987.885 2189.995 -1048.952 2195.903 2397.365
Llhd.-ratio Test
175.900***
1517.570***
Vuong-Test 4.800*** 5.930***
Notes: *** p<0.01; ** p<0.05; * p<0.1; selected model in italic.
Source: ZEW ICT survey 2004, 2007 and own calculations.
31
Table 9: Robustness-check 1 – probit part of hurdle model (marginal effects reported)
dependent variable: generation of process innovations product innovations (1) (2) (3) (4) ln (labor)
0.016 (0.028)
-0.003 (0.029)
-0.010 (0.029)
-0.005 (0.030)
ln (capital)
-0.003 (0.020)
-0.006 (0.020)
0.039* (0.020)
0.038* (0.020)
share of computer workers
0.064 (0.100)
0.052 (0.101)
0.057 (0.105)
0.074 (0.106)
share of high skilled workers
-0.279 * (0.157)
-0.283* (0.160)
0.456*** (0.177)
0.451** (0.179)
share of medium skilled workers
-0. (0.)
-0.007 (0.128)
0.052 (0.135)
0.046 (0.135)
ISO certificated
0.119** (0.054)
0.089 (0.056)
0.080 (0.060)
0.071 (0.061)
firm acquired process innovations last period
0.144** (0.059)
0.122** (0.060)
-
-
firm acquired product innovations last period
-
-
0.313*** (0.054)
0.310*** (0.054)
ERP
0.096* (0.059)
0.093 (0.061)
0.011 (0.062)
0.015 (0.062)
SCM
0.001 (0.064)
-0.013 (0.066)
0.028 (0.071)
0.033 (0.072)
CRM
0.054 (0.061)
0.042 (0.062)
0.023 (0.064)
0.022 (0.064)
accounts for working hours
-
-0.007 (0.056)
-
-0.038 (0.060)
job rotation
-
0.036 (0.064)
-
-0.009 (0.068)
quality circles
-
0.159*** (0.052)
-
0.038 (0.059)
units with own cost and result responsibility
-
0.092* (0.055)
-
-0.018 (0.060)
self dependent work groups
-
-0.017 (0.053)
-
-0.022 (0.057)
control variables
Industry East
Industry East
Industry East
Industry East
pseudo R2 0.101 0.122 0.194 0.196 number of observations 457 451 Notes: *** p<0.01; ** p<0.05; * p<0.1; robust standard errors in parentheses.
Source: ZEW ICT survey 2004, 2007 and own calculations.
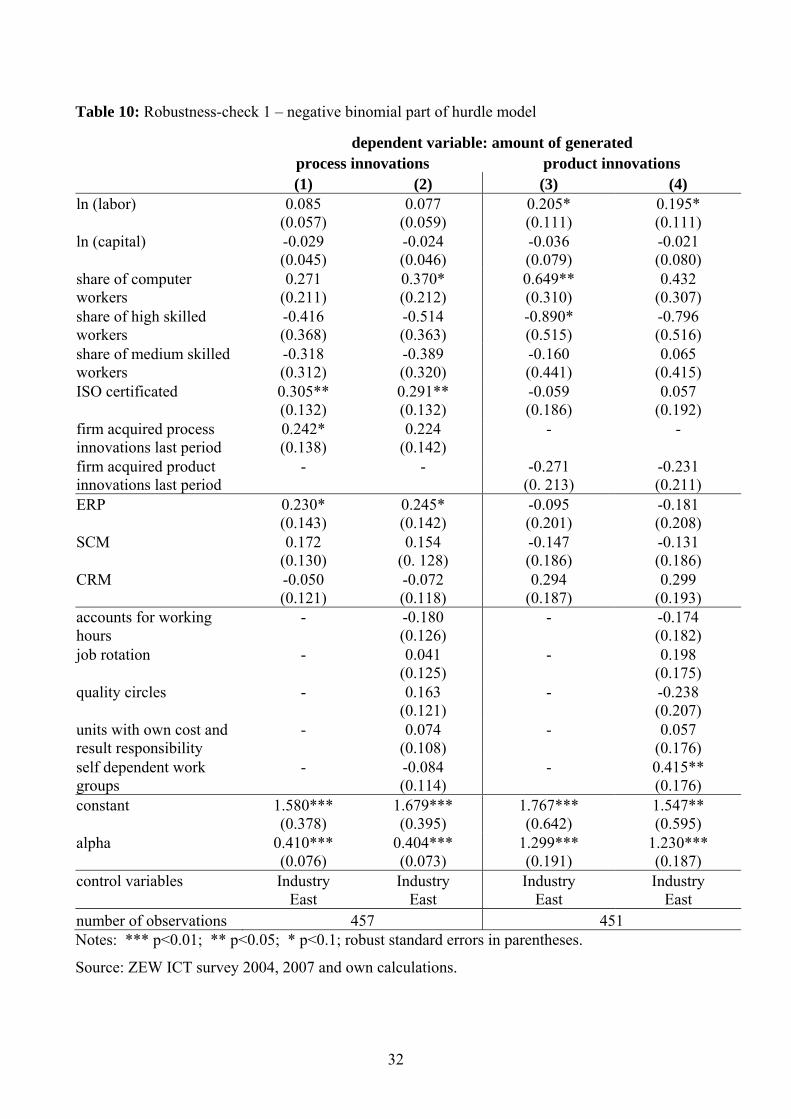
32
Table 10: Robustness-check 1 – negative binomial part of hurdle model
dependent variable: amount of generated process innovations product innovations (1) (2) (3) (4) ln (labor)
0.085 (0.057)
0.077 (0.059)
0.205* (0.111)
0.195* (0.111)
ln (capital)
-0.029 (0.045)
-0.024 (0.046)
-0.036 (0.079)
-0.021 (0.080)
share of computer workers
0.271 (0.211)
0.370* (0.212)
0.649** (0.310)
0.432 (0.307)
share of high skilled workers
-0.416 (0.368)
-0.514 (0.363)
-0.890* (0.515)
-0.796 (0.516)
share of medium skilled workers
-0.318 (0.312)
-0.389 (0.320)
-0.160 (0.441)
0.065 (0.415)
ISO certificated
0.305** (0.132)
0.291** (0.132)
-0.059 (0.186)
0.057 (0.192)
firm acquired process innovations last period
0.242* (0.138)
0.224 (0.142)
-
-
firm acquired product innovations last period
-
-
-0.271 (0. 213)
-0.231 (0.211)
ERP
0.230* (0.143)
0.245* (0.142)
-0.095 (0.201)
-0.181 (0.208)
SCM
0.172 (0.130)
0.154 (0. 128)
-0.147 (0.186)
-0.131 (0.186)
CRM
-0.050 (0.121)
-0.072 (0.118)
0.294 (0.187)
0.299 (0.193)
accounts for working hours
-
-0.180 (0.126)
-
-0.174 (0.182)
job rotation
-
0.041 (0.125)
-
0.198 (0.175)
quality circles
-
0.163 (0.121)
-
-0.238 (0.207)
units with own cost and result responsibility
-
0.074 (0.108)
-
0.057 (0.176)
self dependent work groups
-
-0.084 (0.114)
-
0.415** (0.176)
constant
1.580*** (0.378)
1.679*** (0.395)
1.767*** (0.642)
1.547** (0.595)
alpha
0.410*** (0.076)
0.404*** (0.073)
1.299*** (0.191)
1.230*** (0.187)
control variables
Industry East
Industry East
Industry East
Industry East
number of observations 457 451 Notes: *** p<0.01; ** p<0.05; * p<0.1; robust standard errors in parentheses.
Source: ZEW ICT survey 2004, 2007 and own calculations.
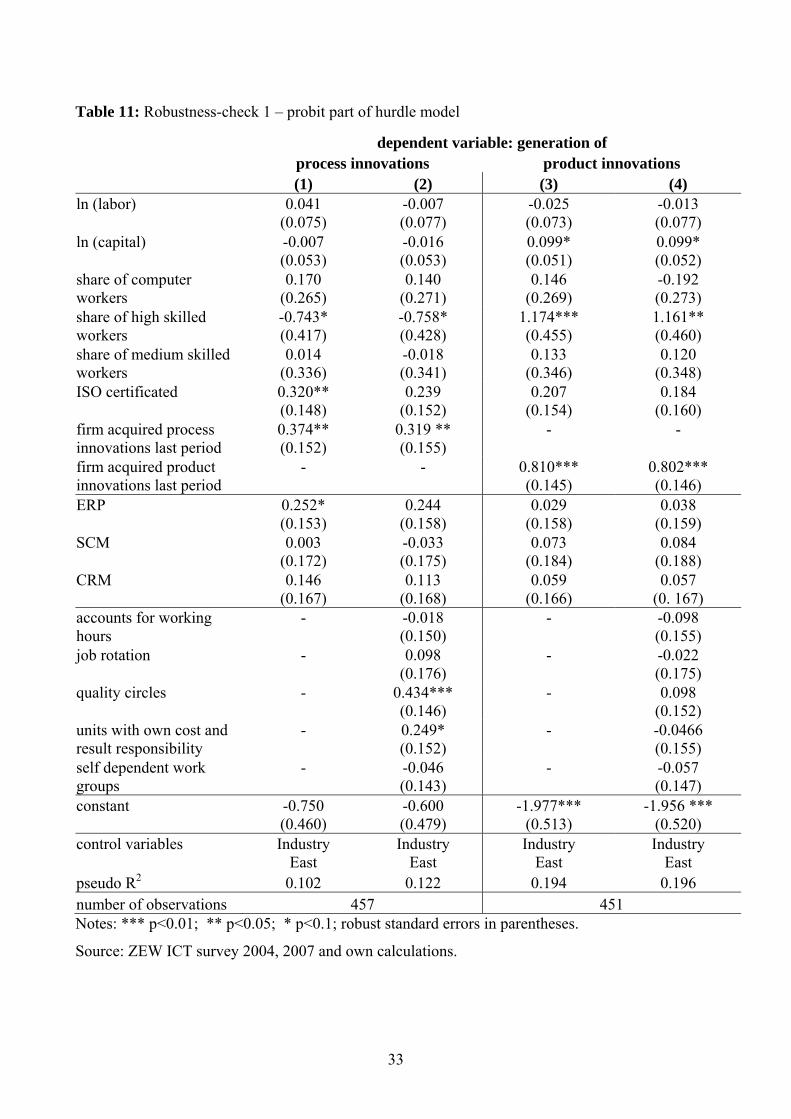
33
Table 11: Robustness-check 1 – probit part of hurdle model
dependent variable: generation of process innovations product innovations (1) (2) (3) (4) ln (labor)
0.041 (0.075)
-0.007 (0.077)
-0.025 (0.073)
-0.013 (0.077)
ln (capital)
-0.007 (0.053)
-0.016 (0.053)
0.099* (0.051)
0.099* (0.052)
share of computer workers
0.170 (0.265)
0.140 (0.271)
0.146 (0.269)
-0.192 (0.273)
share of high skilled workers
-0.743* (0.417)
-0.758* (0.428)
1.174*** (0.455)
1.161** (0.460)
share of medium skilled workers
0.014 (0.336)
-0.018 (0.341)
0.133 (0.346)
0.120 (0.348)
ISO certificated
0.320** (0.148)
0.239 (0.152)
0.207 (0.154)
0.184 (0.160)
firm acquired process innovations last period
0.374** (0.152)
0.319 ** (0.155)
-
-
firm acquired product innovations last period
-
-
0.810*** (0.145)
0.802*** (0.146)
ERP
0.252* (0.153)
0.244 (0.158)
0.029 (0.158)
0.038 (0.159)
SCM
0.003 (0.172)
-0.033 (0.175)
0.073 (0.184)
0.084 (0.188)
CRM
0.146 (0.167)
0.113 (0.168)
0.059 (0.166)
0.057 (0. 167)
accounts for working hours
-
-0.018 (0.150)
-
-0.098 (0.155)
job rotation
-
0.098 (0.176)
-
-0.022 (0.175)
quality circles
-
0.434*** (0.146)
-
0.098 (0.152)
units with own cost and result responsibility
-
0.249* (0.152)
-
-0.0466 (0.155)
self dependent work groups
-
-0.046 (0.143)
-
-0.057 (0.147)
constant
-0.750 (0.460)
-0.600 (0.479)
-1.977*** (0.513)
-1.956 *** (0.520)
control variables
Industry East
Industry East
Industry East
Industry East
pseudo R2 0.102 0.122 0.194 0.196 number of observations 457 451 Notes: *** p<0.01; ** p<0.05; * p<0.1; robust standard errors in parentheses.
Source: ZEW ICT survey 2004, 2007 and own calculations.
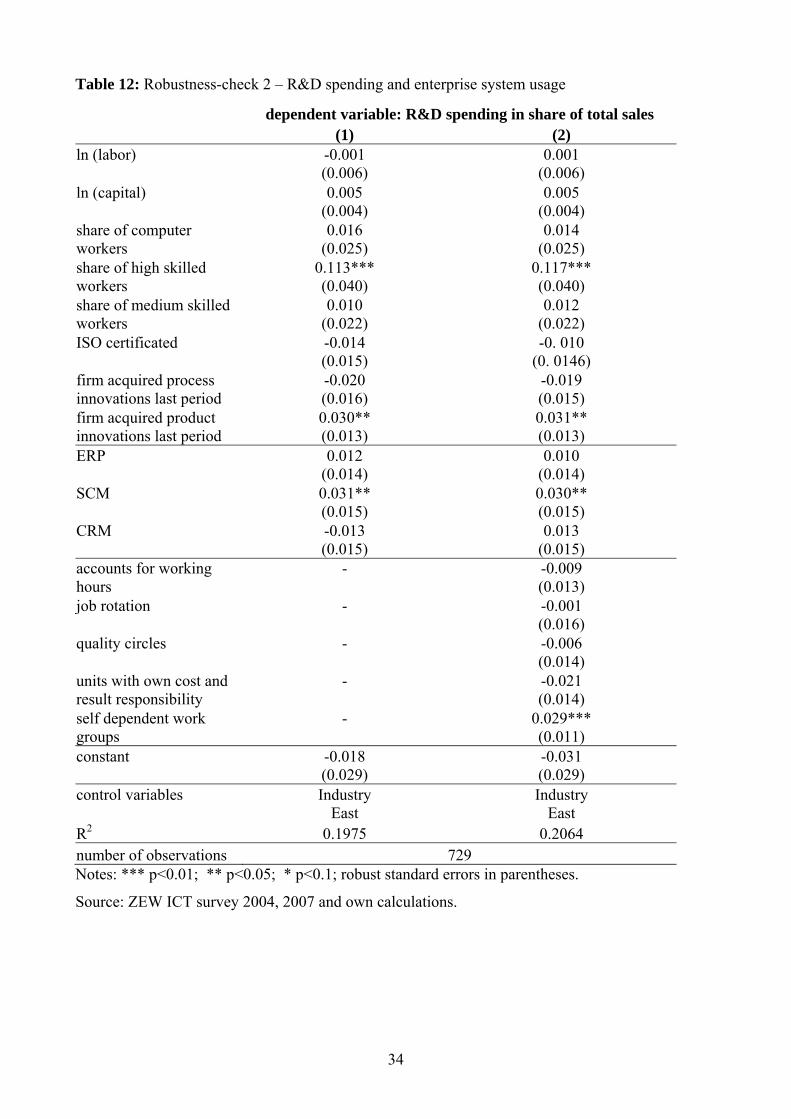
34
Table 12: Robustness-check 2 – R&D spending and enterprise system usage
dependent variable: R&D spending in share of total sales (1) (2) ln (labor)
-0.001 (0.006)
0.001 (0.006)
ln (capital)
0.005 (0.004)
0.005 (0.004)
share of computer workers
0.016 (0.025)
0.014 (0.025)
share of high skilled workers
0.113*** (0.040)
0.117*** (0.040)
share of medium skilled workers
0.010 (0.022)
0.012 (0.022)
ISO certificated
-0.014 (0.015)
-0. 010 (0. 0146)
firm acquired process innovations last period
-0.020 (0.016)
-0.019 (0.015)
firm acquired product innovations last period
0.030** (0.013)
0.031** (0.013)
ERP
0.012 (0.014)
0.010 (0.014)
SCM
0.031** (0.015)
0.030** (0.015)
CRM
-0.013 (0.015)
0.013 (0.015)
accounts for working hours
-
-0.009 (0.013)
job rotation
-
-0.001 (0.016)
quality circles
-
-0.006 (0.014)
units with own cost and result responsibility
-
-0.021 (0.014)
self dependent work groups
-
0.029*** (0.011)
constant
-0.018 (0.029)
-0.031 (0.029)
control variables
Industry East
Industry East
R2 0.1975 0.2064 number of observations 729 Notes: *** p<0.01; ** p<0.05; * p<0.1; robust standard errors in parentheses.
Source: ZEW ICT survey 2004, 2007 and own calculations.