Environmental Monitoring Programme for the Albertine ...
121
Environmental Monitoring Programme for the Albertine Graben, Uganda Results from an ecosystem indicator scoping workshop in Kasese, Uganda, April 2011 Jørn Thomassen Reidar Hindrum 706
Transcript of Environmental Monitoring Programme for the Albertine ...
EEnnvviirroonnmmeennttaall MMoonniittoorriinngg PPrrooggrraammmmee ffoorr tthhee AAllbbeerrttiinnee GGrraabbeenn,, UUggaannddaa
Results from an ecosystem indicator scoping workshop in Kasese, Uganda, April 2011
Jørn Thomassen Reidar Hindrum
706

NINA Publications NINA Report (NINA Rapport) This is a electronic series beginning in 2005, which replaces the earlier series NINA commissioned reports and NINA project reports. This will be NINA’s usual form of reporting completed research, monitoring or review work to clients. In addition, the series will include much of the institute’s other reporting, for example from seminars and conferences, results of internal research and review work and literature studies, etc. NINA report may also be issued in a second language where appropri-ate. NINA Special Report (NINA Temahefte) As the name suggests, special reports deal with special subjects. Special reports are produced as required and the series ranges widely: from systematic identification keys to information on impor-tant problem areas in society. NINA special reports are usually given a popular scientific form with more weight on illustrations than a NINA report. NINA Factsheet (NINA Fakta) Factsheets have as their goal to make NINA’s research results quickly and easily accessible to the general public. The are sent to the press, civil society organisations, nature management at all lev-els, politicians, and other special interests. Fact sheets give a short presentation of some of our most important research themes. Other publishing In addition to reporting in NINA’s own series, the institute’s employees publish a large proportion of their scientific results in international journals, popular science books and magazines.
Norwegian Institute for Nature Research
Environmental Monitoring Programme for the Albertine Graben, Uganda
Results from an ecosystem indicator scoping workshop in Kasese, Uganda, April 2011
Jørn Thomassen Reidar Hindrum

NINA Report 706
2
CONTACT DETAILS
NINA head office Postboks 5685 Sluppen NO-7485 Trondheim Norway Phone: +47 73 80 14 00 Fax: +47 73 80 14 01
NINA Oslo Gaustadalléen 21 NO-0349 Oslo Norway Phone: +47 73 80 14 00 Fax: +47 22 60 04 24
NINA TromsøFramsenteret NO-9296 Tromsø Norway Phone: +47 77 75 04 00 Fax: +47 77 75 04 01
NINA Lillehammer Fakkelgården NO-2624 Lillehammer Norway Phone: +47 73 80 14 00 Fax: +47 61 22 22 15
www.nina.no
Thomassen, J. & Hindrum, R. 2011. Environmental Monitoring Programme for the Albertine Graben, Uganda. Results from an ecosystem indicator scoping workshop in Kasese, Uganda, April 2011. - NINA Report 706. 118 pp.
Trondheim, May 2011
ISSN: 1504-3312 ISBN: 978-82-426-2293-8
COPYRIGHT
© Norwegian Institute for Nature Research The publication may be freely cited where the source is ac-knowledged
AVAILABILITY
Open
PUBLICATION TYPE
Digital document (pdf)
QUALITY CONTROLLED BY
Odd Terje Sandlund
SIGNATURE OF RESPONSIBLE PERSON
Research director Inga E. Bruteig (sign.)
CLIENT(S)
Directorate for Nature Management
CLIENTS’ CONTACT PERSON(S)
Frank Eklo
COVER PICTURE
Lake Albert in Albertine Graben. Photo: Jørn Thomassen.
KEY WORDS
Uganda, Rift Valley, Albertine Graben, oil and gas development, scoping, ecosystem indicators, monitoring NØKKELORD
Uganda, Rift Valley, Albertine Graben, olje- og gassutvinning, målfokusering, økosystemindikatorer, overvåking
NINA Report 706
3
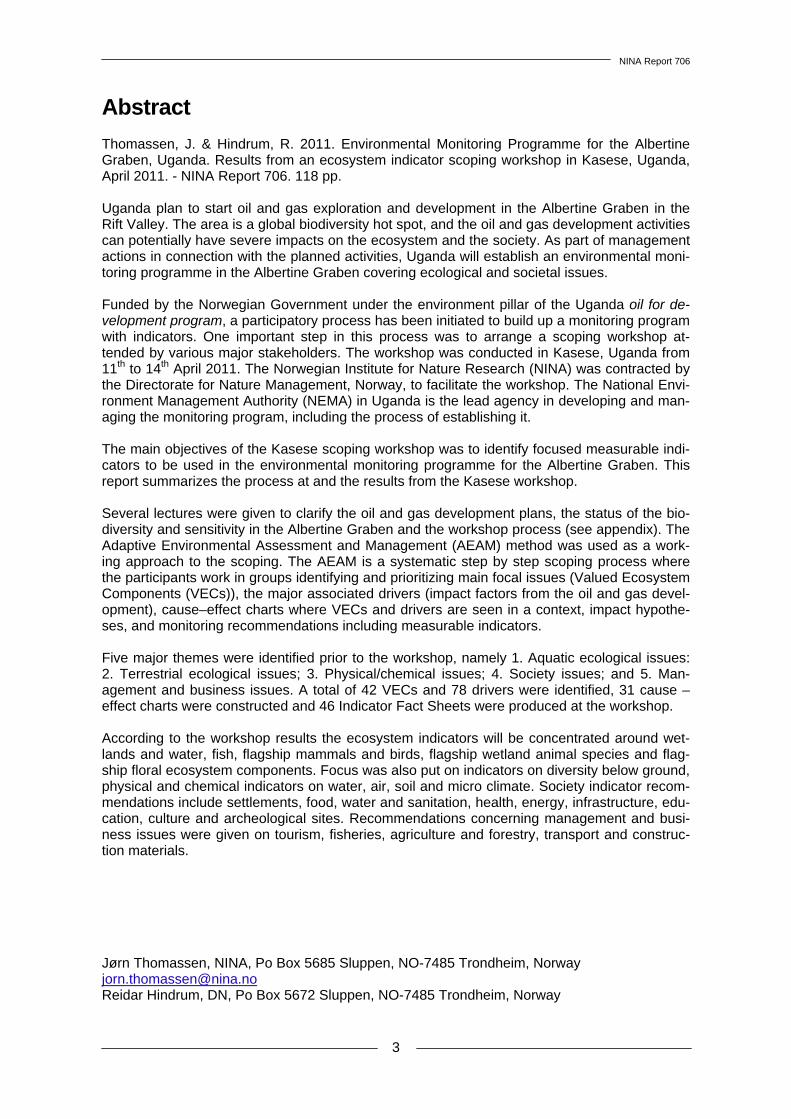
Abstract Thomassen, J. & Hindrum, R. 2011. Environmental Monitoring Programme for the Albertine Graben, Uganda. Results from an ecosystem indicator scoping workshop in Kasese, Uganda, April 2011. - NINA Report 706. 118 pp. Uganda plan to start oil and gas exploration and development in the Albertine Graben in the Rift Valley. The area is a global biodiversity hot spot, and the oil and gas development activities can potentially have severe impacts on the ecosystem and the society. As part of management actions in connection with the planned activities, Uganda will establish an environmental moni-toring programme in the Albertine Graben covering ecological and societal issues. Funded by the Norwegian Government under the environment pillar of the Uganda oil for de-velopment program, a participatory process has been initiated to build up a monitoring program with indicators. One important step in this process was to arrange a scoping workshop at-tended by various major stakeholders. The workshop was conducted in Kasese, Uganda from 11th to 14th April 2011. The Norwegian Institute for Nature Research (NINA) was contracted by the Directorate for Nature Management, Norway, to facilitate the workshop. The National Envi-ronment Management Authority (NEMA) in Uganda is the lead agency in developing and man-aging the monitoring program, including the process of establishing it. The main objectives of the Kasese scoping workshop was to identify focused measurable indi-cators to be used in the environmental monitoring programme for the Albertine Graben. This report summarizes the process at and the results from the Kasese workshop. Several lectures were given to clarify the oil and gas development plans, the status of the bio-diversity and sensitivity in the Albertine Graben and the workshop process (see appendix). The Adaptive Environmental Assessment and Management (AEAM) method was used as a work-ing approach to the scoping. The AEAM is a systematic step by step scoping process where the participants work in groups identifying and prioritizing main focal issues (Valued Ecosystem Components (VECs)), the major associated drivers (impact factors from the oil and gas devel-opment), cause–effect charts where VECs and drivers are seen in a context, impact hypothe-ses, and monitoring recommendations including measurable indicators. Five major themes were identified prior to the workshop, namely 1. Aquatic ecological issues: 2. Terrestrial ecological issues; 3. Physical/chemical issues; 4. Society issues; and 5. Man-agement and business issues. A total of 42 VECs and 78 drivers were identified, 31 cause – effect charts were constructed and 46 Indicator Fact Sheets were produced at the workshop. According to the workshop results the ecosystem indicators will be concentrated around wet-lands and water, fish, flagship mammals and birds, flagship wetland animal species and flag-ship floral ecosystem components. Focus was also put on indicators on diversity below ground, physical and chemical indicators on water, air, soil and micro climate. Society indicator recom-mendations include settlements, food, water and sanitation, health, energy, infrastructure, edu-cation, culture and archeological sites. Recommendations concerning management and busi-ness issues were given on tourism, fisheries, agriculture and forestry, transport and construc-tion materials. Jørn Thomassen, NINA, Po Box 5685 Sluppen, NO-7485 Trondheim, Norway [email protected] Reidar Hindrum, DN, Po Box 5672 Sluppen, NO-7485 Trondheim, Norway
NINA Report 706
4
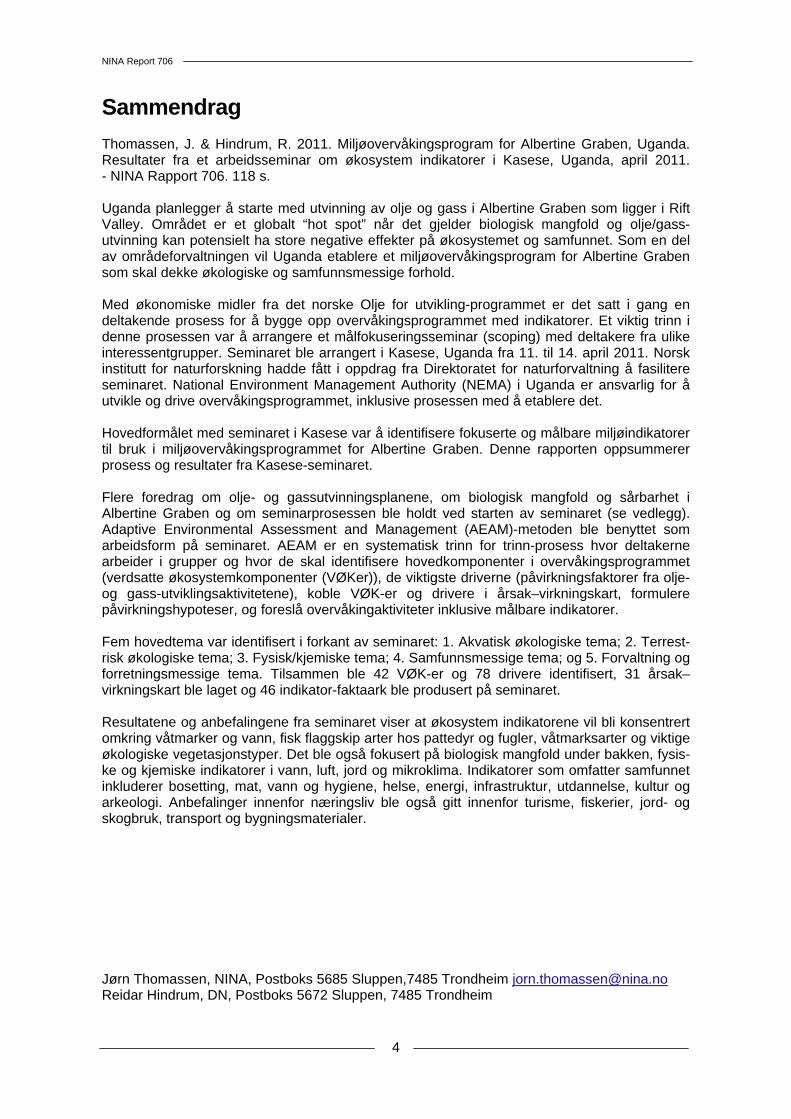
Sammendrag Thomassen, J. & Hindrum, R. 2011. Miljøovervåkingsprogram for Albertine Graben, Uganda. Resultater fra et arbeidsseminar om økosystem indikatorer i Kasese, Uganda, april 2011. - NINA Rapport 706. 118 s. Uganda planlegger å starte med utvinning av olje og gass i Albertine Graben som ligger i Rift Valley. Området er et globalt “hot spot” når det gjelder biologisk mangfold og olje/gass-utvinning kan potensielt ha store negative effekter på økosystemet og samfunnet. Som en del av områdeforvaltningen vil Uganda etablere et miljøovervåkingsprogram for Albertine Graben som skal dekke økologiske og samfunnsmessige forhold. Med økonomiske midler fra det norske Olje for utvikling-programmet er det satt i gang en deltakende prosess for å bygge opp overvåkingsprogrammet med indikatorer. Et viktig trinn i denne prosessen var å arrangere et målfokuseringsseminar (scoping) med deltakere fra ulike interessentgrupper. Seminaret ble arrangert i Kasese, Uganda fra 11. til 14. april 2011. Norsk institutt for naturforskning hadde fått i oppdrag fra Direktoratet for naturforvaltning å fasilitere seminaret. National Environment Management Authority (NEMA) i Uganda er ansvarlig for å utvikle og drive overvåkingsprogrammet, inklusive prosessen med å etablere det. Hovedformålet med seminaret i Kasese var å identifisere fokuserte og målbare miljøindikatorer til bruk i miljøovervåkingsprogrammet for Albertine Graben. Denne rapporten oppsummerer prosess og resultater fra Kasese-seminaret. Flere foredrag om olje- og gassutvinningsplanene, om biologisk mangfold og sårbarhet i Albertine Graben og om seminarprosessen ble holdt ved starten av seminaret (se vedlegg). Adaptive Environmental Assessment and Management (AEAM)-metoden ble benyttet som arbeidsform på seminaret. AEAM er en systematisk trinn for trinn-prosess hvor deltakerne arbeider i grupper og hvor de skal identifisere hovedkomponenter i overvåkingsprogrammet (verdsatte økosystemkomponenter (VØKer)), de viktigste driverne (påvirkningsfaktorer fra olje- og gass-utviklingsaktivitetene), koble VØK-er og drivere i årsak–virkningskart, formulere påvirkningshypoteser, og foreslå overvåkingaktiviteter inklusive målbare indikatorer. Fem hovedtema var identifisert i forkant av seminaret: 1. Akvatisk økologiske tema; 2. Terrest-risk økologiske tema; 3. Fysisk/kjemiske tema; 4. Samfunnsmessige tema; og 5. Forvaltning og forretningsmessige tema. Tilsammen ble 42 VØK-er og 78 drivere identifisert, 31 årsak–virkningskart ble laget og 46 indikator-faktaark ble produsert på seminaret. Resultatene og anbefalingene fra seminaret viser at økosystem indikatorene vil bli konsentrert omkring våtmarker og vann, fisk flaggskip arter hos pattedyr og fugler, våtmarksarter og viktige økologiske vegetasjonstyper. Det ble også fokusert på biologisk mangfold under bakken, fysis-ke og kjemiske indikatorer i vann, luft, jord og mikroklima. Indikatorer som omfatter samfunnet inkluderer bosetting, mat, vann og hygiene, helse, energi, infrastruktur, utdannelse, kultur og arkeologi. Anbefalinger innenfor næringsliv ble også gitt innenfor turisme, fiskerier, jord- og skogbruk, transport og bygningsmaterialer. Jørn Thomassen, NINA, Postboks 5685 Sluppen,7485 Trondheim [email protected] Reidar Hindrum, DN, Postboks 5672 Sluppen, 7485 Trondheim
NINA Report 706
5
Contents
Abstract ............................................................................................................................................. 3
Sammendrag ..................................................................................................................................... 4
Contents ............................................................................................................................................ 5
List of acronyms ............................................................................................................................... 6
Foreword ........................................................................................................................................... 8
1 Part I: Background and challenges ........................................................................................... 9 1.1 Workshop objectives ............................................................................................................. 9 1.2 What is scoping? ................................................................................................................... 9 1.3 Indicators ............................................................................................................................. 10 1.4 Methodological approach - indicator scoping ...................................................................... 10
1.4.1 Oil/gas development description .............................................................................. 10 1.4.2 Baseline studies ....................................................................................................... 11 1.4.3 The Adaptive Environmental Assessment and Management (AEAM) .................... 11
2 Part II: The Kasese scoping workshop ................................................................................... 15 2.1 Workshop participants ......................................................................................................... 15 2.2 Workshop process .............................................................................................................. 15
2.2.1 Group composition ................................................................................................... 15 2.3 Organisation of the scoping results ..................................................................................... 16 2.4 Aquatic ecological issues .................................................................................................... 18
2.4.1 Valued Ecosystem Components .............................................................................. 18 2.4.2 Drivers ...................................................................................................................... 19 2.4.3 Cause – effect charts, aquatic ecosystem ............................................................... 19 2.4.4 Indicator Fact Sheets, aquatic ecosystem ............................................................... 23
2.5 Terrestrial ecological issues ................................................................................................ 29 2.5.1 Valued Ecosystem Components .............................................................................. 29 2.5.2 Drivers ...................................................................................................................... 31 2.5.3 Cause – effect charts, terrestrial ecosystem ........................................................... 32 2.5.4 Indicator Fact Sheets ............................................................................................... 35
2.6 Physical/chemical issues .................................................................................................... 51 2.6.1 Valued Ecosystem Components .............................................................................. 51 2.6.2 Drivers ...................................................................................................................... 51 2.6.3 Cause – effect charts, physical/chemical ................................................................ 53 2.6.4 Indicator Fact Sheets ............................................................................................... 56
2.7 Society issues ..................................................................................................................... 62 2.7.1 Valued Ecosystem Components .............................................................................. 62 2.7.2 Drivers ...................................................................................................................... 62 2.7.3 Cause – effect charts, society .................................................................................. 63 2.7.4 Indicator Fact Sheets ............................................................................................... 69
2.8 Management and business issues ...................................................................................... 80 2.8.1 Valued Ecosystem Components .............................................................................. 80 2.8.2 Drivers ...................................................................................................................... 80 2.8.3 Cause – effect charts, management and business ................................................. 82 2.8.4 Indicator Fact Sheets ............................................................................................... 86
2.9 Summary of indicators ........................................................................................................ 96
3 References ................................................................................................................................. 98
4 Appendix .................................................................................................................................... 99 4.1 Workshop program .............................................................................................................. 99 4.2 Presentations at the workshop .......................................................................................... 100
NINA Report 706
6
List of acronyms AEAM Adaptive Environmental Assessment and Management BGBD Below Ground Biodiversity CSO Civil Society Organisations DFR Department of Fisheries Resources DLGs District Local Governments DN Directorate for Nature Management DoM Department of Meteorology DWRM Directorate for Water Resources Management EA Exploration Area EIA Environmental Impact Assessment GIS Geographic Information System GOV Government IH Impact Hypothesis LC1 Local Council 1 M&E Monitoring & Evaluation M&R Monitoring & Research MAAIF Ministry of Agriculture, Animal Industry and Fisheries MDA Mission Doctors Association (?) MEMD Ministry of Energy and Mineral Development MFCA Murchinson Falls Conservation Authority MFNP Murchinson Falls National Park MGLSD Ministry of Gender, Labour and Social Development MIST Management Information System Technology MoES Ministry of Education and Sports MoH Ministry of Health MoWT Ministry of Works and Transport MTTI Ministry of Tourism, Trade and Industry MUIENR Makerere University, Institute of Environment and Natural Resources MWE Ministry of Water and Environment NaFIRRI National Fisheries Resources Research Institute NARL National Agricultural Research Laboratories NARO National Agricultural Research Organization NEMA National Environment Management Authority NFA National Forestry Authority NGO Non Governmental Organisation NINA Norwegian Institute for Nature Research NP National Park OSH Occupational Safety and Health PA Protected Area PEPD Petroleum Exploration and Production Department QECA Queen Elisabeth Conservation Areas QENP Queen Elisabeth National Park QEPA Queen Elisabeth Protected Area RBDC Resource Based District Centre SEA Strategic Environmental Assessment ToR Terms of Reference
NINA Report 706
7
UBoS Uganda Bureau of Statistics UBOS-ED Uganda Bureau of Statistics EdData UNRA Uganda National Roads Authority UWA Uganda Wildlife Authority VEC Valued Ecosystem Component WCS Wildlife Conservation Society WR Wildlife Reserve WWF World Wildlife Fund
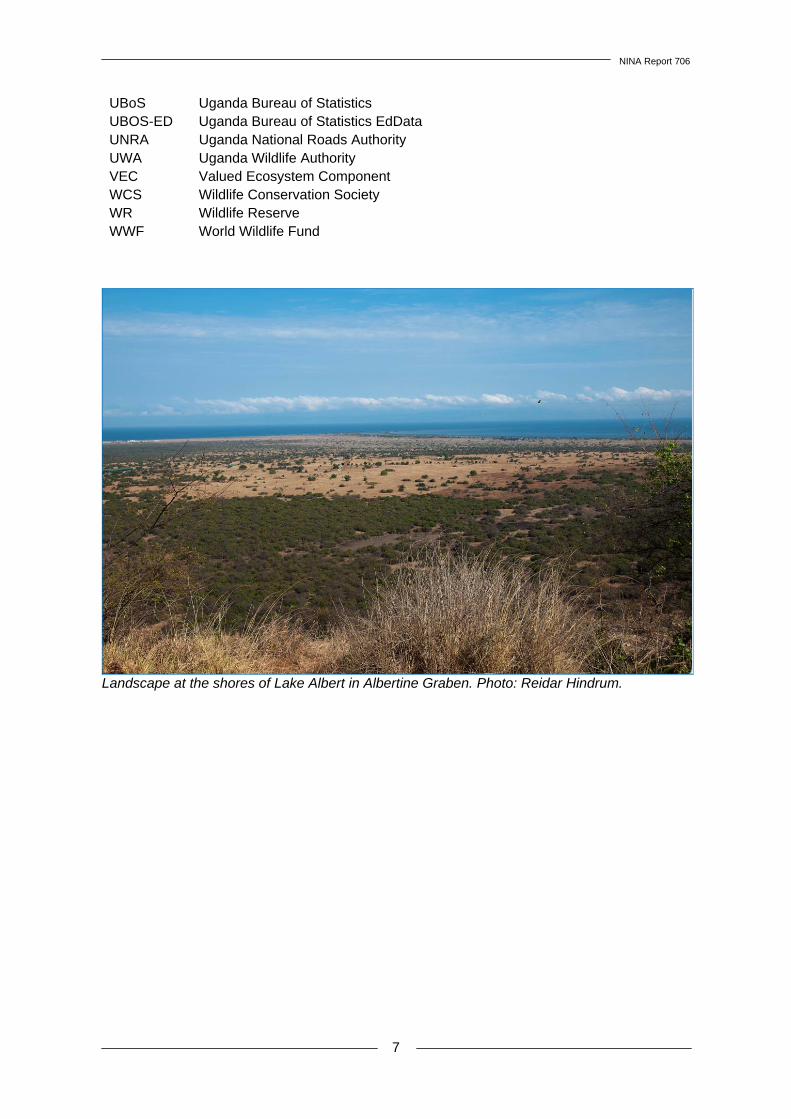
Landscape at the shores of Lake Albert in Albertine Graben. Photo: Reidar Hindrum.
NINA Report 706
8
Foreword Uganda has plans for oil and gas development in the Albertine Graben in the Rift Valley in Afri-ca. The National Environment Management Authority (NEMA) in Uganda is responsible for es-tablishing an environmental monitoring system for the Albertine Graben, with clear and agreed indicators. The Norwegian Government under the Environment Pillar of the Uganda Oil for De-velopment Program is assisting NEMA in this process. A scoping workshop was initiated with the aim to make a fundament for this process. The Environment Pillar program is administrated by the Directorate for Nature Management (DN) in Norway in close cooperation with NEMA. To secure involvement by major stakeholders in the development of the monitoring program a participatory scoping workshop was conducted in Kasese, Uganda from 11th to 14th April 2011. The Norwegian Institute for Nature Research (NINA) was contracted by DN to facilitate the workshop. This report summarizes the process at and the results from the Kasese workshop. 2nd May 2011 Jørn Thomassen (NINA)

NINA Report 706
9
1 Part I: Background and challenges From the foreword in the Environmental Sensitivity Atlas for the Albertine Graben (NEMA 2010): Oil exploration has been has been ongoing in the Albertine Graben since the 1920’s. Currently there is confirmation of commercially viable oil deposits in this area with early production sche-duled to begin 2009. Oil spills can have severe and long term ecological and socio-economic adverse impacts if not properly planned for and addressed. While it is not possible to predict the impacts of an oil spill with certainty it is possible to evaluate the vulnerability of an area to a defined spill scenario based on the environmental resources present in the area. An environmental oil spill sensitivity atlas has been prepared to provide environmental planners with tools to identify resources at risk, establish protection priorities and identify timely appro-priate response and clean-up strategies. The atlas enables oil companies and authorities to incorporate environmental consideration into exploration and contingency plans. It also pro-vides an overview of such aspects as the occurrence of biological resources, human resource use (fishing and hunting) and archaeological sites that are particularly sensitive to oil spill. Fur-thermore it contains information regarding the physical environment, lake shore and bathyme-try of Lake Albert and the climate of the area. The Albertine Graben is known for its high biodiversity spots at the same time it is now an oil rich region. Oil is a non-renewable resource meaning that at one time it will be exhausted. Therefore, care has to be taken to ensure that exploitation of oil resources is done without compromising the quality and quantity of environmental resources. The oil for development strategy should improve services such as conservation of natural resources, infrastructure, energy, education etc. Following the plans for oil and gas development in the Albertine Graben it is necessary to es-tablish an environmental monitoring program. Funded by the Norwegian Government under the environment pillar of the Uganda oil for development program, a process has been initiated to build up a monitoring program with indicators.
1.1 Workshop objectives The main objectives of the Kasese scoping workshop was to identify focused measurable indi-cators to be used in the environmental monitoring programme for the Albertine Graben.
1.2 What is scoping? Scoping refers to the process of identifying, from a broad range of potential problems, a num-ber of priority issues to be addressed by an EIA (Beanlands 1988). In connection with the establishment of the environmental monitoring programme for the Alber-tine Graben in Uganda, scoping refers to the process of identifying a limited number of issues to be addressed in the monitoring programme with the aim to measure (indicators) the existing quality and potential future changes of the environment and the society (ecosystem approach) The design of a monitoring programme must consider the final use of the data before monitor-ing starts.
NINA Report 706
10
1.3 Indicators Indicators are purpose dependent which means that they should be used for reporting potential changes in the ecosystem as a consequence of the oil/gas development, and as a basis for decisions on mitigating measures or other management actions. Consequently, it is important to determine the purpose of the indicator and the end users. Successful indicators are actually used to support policy and decision making. An indicator can provide information on several issues and there are some basic criteria for selecting indicators (box 1).
1. Policy relevance in accordance with policy documents and objectives in Uganda
2. Available and routinely collected data secure regularly update of indicator data which should be simple, but accurate
to measure and cover both lower and higher trophic levels 3. Spatial and temporal coverage of data
secure that the defined monitoring area will be covered over time and that the indicators are sensitive to ecosystem change caused by natural and anthropo-genic drivers
4. Existing monitoring data series should be continued good long term qualitative data series are essential to measure trends, and the
value of such datasets only increases over time 5. Representativeness
secure that most aspects of the ecosystem are covered, both physical as-pects, biological components and the society, and cover common species of public concern (e.g. red listed species) and of importance to local communities
6. Methodologically well founded through a clear description of the methodology to be used when measuring the
indicators 7. Understandability
secure that the indicators are clearly defined and understood by the stake-holders and end users (i.e. local community, decision makers, global public)
8. Agreed indicators indicators mutually accepted by the stakeholders and end users
Box 1. Basic criteria for selecting indicators (after EEA 2005 and Background paper (NEMA 2011)). The monitoring programme with its indicators must cover all phases of the oil/gas development and also consider direct, indirect, and cumulative impacts 1. Exploration (potential environmental impacts from exploration activities) 2. Drilling/Development (potential environmental impacts from drilling and oil or gas field de-
velopment activities) 3. Production (potential environmental impacts from production activities) 4. Decommissioning/Reclamation (potential environmental impacts from decommissioning
and reclamation activities)
1.4 Methodological approach - indicator scoping 1.4.1 Oil/gas development description To make a fundament for the scoping, detailed descriptions of the oil/gas development plans should be given. In the case of oil/gas development in the Albertine Graben, Petroleum Explo-
NINA Report 706
11
ration and Production Department (PEPD) gave an overview of existing activities and of future plans at the start of the workshop. The development plans are also described in 2 documents: The basin wide development concept for the Albertine Graben for consideration during
strategic environment assessment development. Ministry of Energy and Mineral Devel-opment, Petroleum Exploration and Production Department (PEPD), (December 2010)
Background paper for Development of indicators for monitoring environmental changes in the Albertine Graben. Compiled by an editorial group lead by Dr Kitutu K. Mary Gor-etti, National Environment Management Authority (NEMA), (March 2011).
1.4.2 Baseline studies Another important basis for the scoping process is to give a status and access of the ecosys-tem baseline information available. Ecosystem baseline information refers to the background information on the environment and socio-economic setting for a proposed development pro-ject. For the Albertine Graben area NEMA has published a Sensitive Atlas covering ecological and societal issues. NEMA presented the Sensitivity Atlas at the start of the workshop: Environmental Sensitivity Atlas for the Albertine Graben, second edition (Kitutu 2010)
1.4.3 The Adaptive Environmental Assessment and Management (AEAM) One major challenge in an M&E programme is to identify a limited number of indicators. This process is called scoping, and will normally include considerations of impact factors and poten-tial impacts, decision makers, stakeholders, alternatives, access of baseline information, time schedule and also economic frames. The scoping phase in an M&E programme (as well as in a Strategic Environmental Assessment for the Albertine Graben and later in exploration area specific Environmental Impact Assessments) is furthermore critical for an optimal use of limited resources in the perspective of personnel, time and economy, and should be accomplished as early as possible in the process. One approach is to use an adjusted form of the Adaptive Environmental Assessment and Management (AEAM) concept (Holling 1978, Hansson et al. 1990, Indian and Northern Affairs Canada 1992a, 1992b, 1993, Thomassen et al. 1996, 1998, 2003). As an M&E normally shall cover various subjects concerning environment, natural resources and society, different actors and stakeholders will be involved in different phases of the process. Obviously, communication between decision makers, authorities, management, NGOs, public, consultants and scientists should be accomplished in a very early stage in the development of an M&E, with the objective to scope on important issues. AEAM is a participatory process, based on workshops attended by different stakeholder and project holders. In AEAM the impact predictions and significance includes: 1. The selection and prioritization of a limited number of Valued Ecosystem Components
(VECs), which are focal issues potentially affected by the oil/gas development activities; 2. The identification of major drivers (impact factors from the oil/gas development); 3. Assess major linkages between the different VECs and the drivers by constructing cause-
effect charts with linkage explanations; 4. Describe potential impacts through impact hypotheses and finally; 5. Give recommendations on further needs for research, investigations and management ac-
tions including M&E programme with indicators. Key statements in every scientific work, as well as in an M&E programme, should be the trans-parency and possibilities to document and control the process and the choices done. It should be obvious that an open and well-documented process is essential when numerous subjects are rejected as not important enough.
NINA Report 706
12
Step 1. Valued Ecosystem Components (VECs) A Valued Ecosystem Component is defined as a resource or environmental feature that: is im-portant (not only economically) to a local human population, or has a national or international profile, or if altered from its existing status, will be important for the evaluation of environmental impacts of industrial developments, and the focusing of administrative efforts (Hansson et al. 1990). The selection of VECs is probably the most important and at the same time the most difficult step in the process of selection and focusing in the development of an M&E programme. The critical point is to focus on decision-making, and the VEC concept therefore also should include social, political and economical qualities. Moreover, there are only rooms for a limited number of VECs, which in turn call for high critical sense in the selection process. How to proceed:
1. Make a list of Valued Ecosystem Components (VECs) for the 4 phases: 1. Exploration; 2. Development; 3. Production and 4. Decommissioning
2. Rank the VECs according to importance for the areas affected by the oil/gas develop-ment
3. Assess and rank the most important associated drivers from group work 2 4. The monitoring programme with indicators will be anchored in the VECs
Step 2. Drivers Drivers are impact factors or driving forces which can affect the ecosystem and/or the society in one way or another.Based on the activity description of the proposed oil/gas development in the Albertine Graben, a number of drivers (or impact factors) can be identified. How to proceed:
1. Make a list of drivers in the 2 categories: From oil/gas development and others 2. Rank the drivers
• Overall rank (1, 2, 3...n), and • Rank in each phase (Exploration; Drilling; Production and Decommissioning) in cate-
gory 1-3 where 1 is least important and 3 is most important Step 3. Cause - effect charts: Linking Valued Ecosystem Components and drivers A Cause – effect chart is a diagram of boxes and arrows indicating in which context each of the VECs appears, i.e. which type of driver from the proposed activity can affect the VEC and how. Each linkage shall be explained in a brief text following the chart. Hansson et al. (1990) de-scribed the content of the flow chart to include the main categories of the physical, biological and possibly also social and political factors influencing the VEC. If all the connections between each VEC and the different components on primary, secondary, tertiary.... level should be included in the flow chart, a more or less chaotic picture would occur. Each flow chart, therefore, should only comprise the components that are in direct contact with the VEC. The flow chart will form the basis for formulating Impact Hypotheses. How to proceed
1. Select VEC 2. Select main associated drivers 3. Start constructing cause - effect chart with linkage explanations
NINA Report 706
13
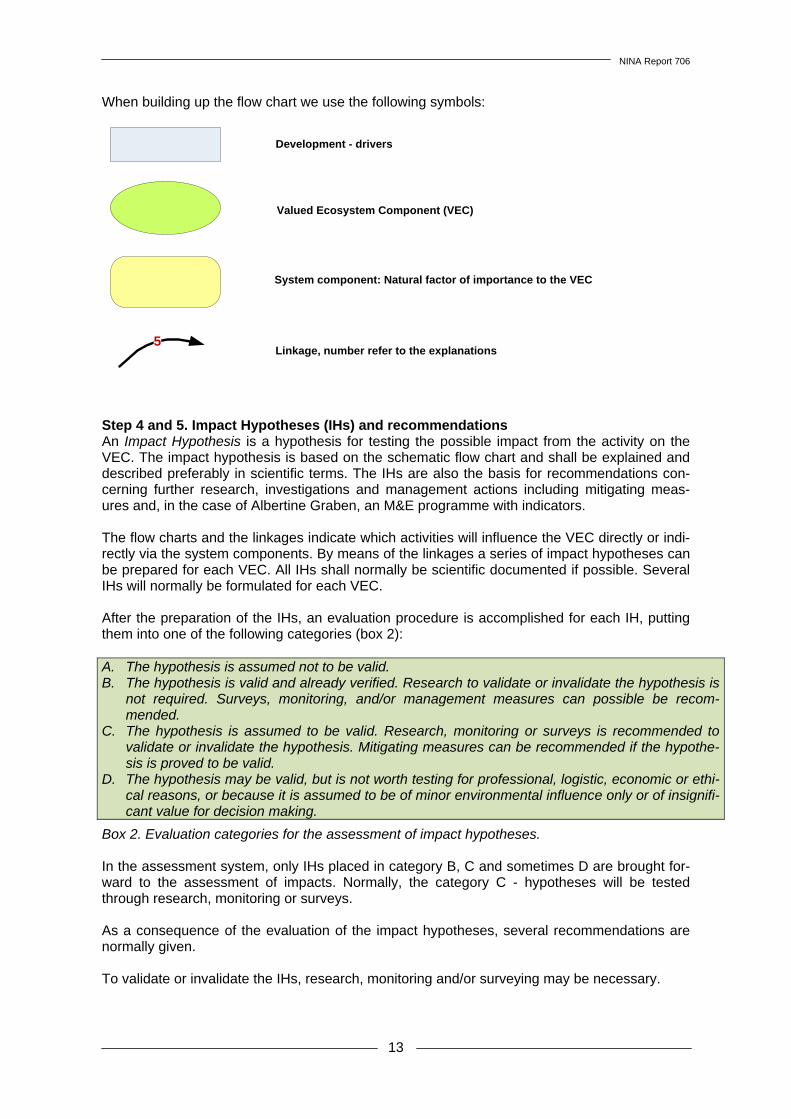
When building up the flow chart we use the following symbols:
5
Development - drivers
Valued Ecosystem Component (VEC)
System component: Natural factor of importance to the VEC
Linkage, number refer to the explanations
Step 4 and 5. Impact Hypotheses (IHs) and recommendations An Impact Hypothesis is a hypothesis for testing the possible impact from the activity on the VEC. The impact hypothesis is based on the schematic flow chart and shall be explained and described preferably in scientific terms. The IHs are also the basis for recommendations con-cerning further research, investigations and management actions including mitigating meas-ures and, in the case of Albertine Graben, an M&E programme with indicators. The flow charts and the linkages indicate which activities will influence the VEC directly or indi-rectly via the system components. By means of the linkages a series of impact hypotheses can be prepared for each VEC. All IHs shall normally be scientific documented if possible. Several IHs will normally be formulated for each VEC. After the preparation of the IHs, an evaluation procedure is accomplished for each IH, putting them into one of the following categories (box 2): A. The hypothesis is assumed not to be valid. B. The hypothesis is valid and already verified. Research to validate or invalidate the hypothesis is
not required. Surveys, monitoring, and/or management measures can possible be recom-mended.
C. The hypothesis is assumed to be valid. Research, monitoring or surveys is recommended to validate or invalidate the hypothesis. Mitigating measures can be recommended if the hypothe-sis is proved to be valid.
D. The hypothesis may be valid, but is not worth testing for professional, logistic, economic or ethi-cal reasons, or because it is assumed to be of minor environmental influence only or of insignifi-cant value for decision making.
Box 2. Evaluation categories for the assessment of impact hypotheses. In the assessment system, only IHs placed in category B, C and sometimes D are brought for-ward to the assessment of impacts. Normally, the category C - hypotheses will be tested through research, monitoring or surveys. As a consequence of the evaluation of the impact hypotheses, several recommendations are normally given. To validate or invalidate the IHs, research, monitoring and/or surveying may be necessary.
NINA Report 706
14
The needs for management actions, mitigating measures and monitoring programme. A natural part of an EIA will be to give recommendations concerning management actions and mitigating measures with respect to the proposed oil/gas activities. Based on previous steps in the scop-ing process several recommendations on an M&E programme, including indicators will be given. In section II of this publication results from the Kasese scoping workshop are given.
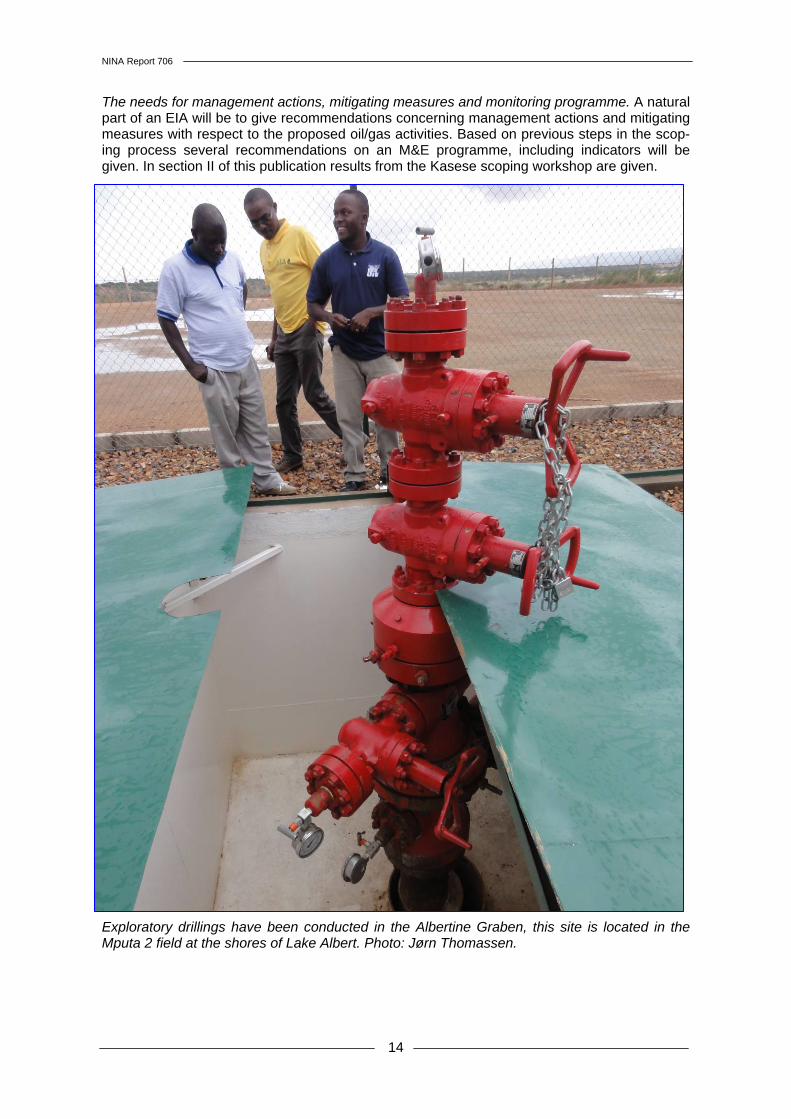
Exploratory drillings have been conducted in the Albertine Graben, this site is located in the Mputa 2 field at the shores of Lake Albert. Photo: Jørn Thomassen.
NINA Report 706
15
2 Part II: The Kasese scoping workshop The Kasese scoping workshop consisted of two parts, day 1 was allocated to various presenta-tions on core issues like existing baseline information (Background Paper), descriptions of the planned oil and gas development in the area, introduction to the methodological approach at the workshop and a more detailed step by step introduction to the process (see appendix 4.2).
2.1 Workshop participants Participants from several stakeholders attended the scoping workshop (table 1). Table 1. Participants and institutional belonging at the Kasese scoping workshop in April 2011.
Name Institution Name Institution Arinaitwe Topher MWE Kayondo Kenneth NEMA Bakunda Aventino DFR Khanzila Prossy NEMA Bbosa David Lwanga NPA Kiiza David MWE Beatrice Adimola NEMA Lwasa James NARO Bright Richard Kimuli UBOS Magezi Akiiki Meteorology Byaruhanga Jane M PEPD Margeret Driciru UWA David Mugisa DSH/MGLSD Mari Lise Sjong DN-Norway Edith Kateme Kasajja NPA Mbabazi Dismas NaFIRRI - NARO Edward Mbabazi NEMA Mpabulungi Firipo NEMA Eng. Ronald Kasozi DWD Mugisha Louis DWRM Erima Godwin MUIENR Mugume Evelyn Kasese DLG Festus Bagoora NEMA Muramira Telly NEMA Goretti Kitutu NEMA Nakalyango Caroline DWRM Grace Nangendo WCS Nurudin Njabire PEPD Guma Gerald Geology Dept Nyangoma Joseline Hoima DLG Hasahya Moses NEMA Perry I Kiza NEMA Hudson Basyomusi EIA Philip K. Ngangaha Biliisa DLG Ingunn Limstrand DN-Norway Reidar Hindrum DN-Norway Isabirye Moses Busitema University Robert Ddamulira WWF Uganda John Diisi NFA Rukundo Tom NFA Jørn Thomassen NINA-Norway Stephen Sekiranda NaFIRRI - NARO Justine Namara UWA Tiberindwa John Geology Dept, Makerere Kateregga Joseph NEMA
2.2 Workshop process Five main thematic issues were defined prior to the workshop, namely:
1. Aquatic ecological issues 2. Terrestrial ecological issues 3. Physical/chemical issues 4. Society issues 5. Management and business issues
2.2.1 Group composition The participants were divided into five groups, each group worked with one of the main the-matic issues (see above) (table 2).
NINA Report 706
16
Table 2. Group composition at the Kasese scoping workshop in April 2011. Participants in red chaired their group. Main thematic issues Group member Institution 1. Aquatic ecological issues Mbabazi Dismas NaFIRRI-NARO
Bakunda Aventino DFR Steven Sekiranda NaFIRRI-NARO Mugume Evelyn Kasese DLG Nyangoma Joseline Hoima DLG Philip K. Ngangaha Biliisa DLG Khanzila Prossy NEMA
2. Terrestrial ecological issues John Diisi NFA Grace Nangendo WCS Isabirye Moses Busitema University Arinaitwe Topher MWE Rukundo Tom NFA Margeret Driciru UWA Robert Ddamulira WWF Uganda
3. Physical/chemical issues Nakalyango Caroline DWRM Lwasa James NARO Mugisha Louis DWRM Festus Bagoora NEMA David Mugisa DSH/MGLSD Magezi Akiiki Meteorology
4. Society issues Bright Richard Kimuli UBOS Erima Godwin MUIENR Mpabulungi Firipo NEMA Goretti Kitutu NEMA Byaruhanga Jane M. PEPD Edith Kateme Kasajja NPA
5. Management and business issues Tiberindwa John Geology Dept, Makerere Justine Namara UWA Nurudin Njabire PEPD Eng. Ronald Kasozi DWD Muramira Telly NEMA
2.3 Organisation of the scoping results The results from the indicator scoping workshop in Kasese have been organised according to the main thematic issue, such that it is easier to follow the logical development of the indica-tors. Under each main thematic issue the results are organised as the stepwise work:
1. Identification and prioritization of Valued Ecosystem Components 2. Identification and prioritization of drivers 3. Construction of cause – effect charts 4. Assessing and filling in the Indicator Fact Sheets, i.e. impact hypotheses and recom-
mendations Table 3 summarizes the numbers of VECs, drivers, cause – effect charts and Indicator Fact Sheets produced in each group at the Kasese workshop. The numbers are the total and some of the VECs and especially the drivers will appear in several of the main thematic issues.
NINA Report 706
17
Table 3. The numbers of VECs, drivers, cause – effect charts and Indicator Fact Sheets pro-duced in each group at the Kasese workshop. Main thematic issues VECs Drivers Cause-effect
charts Indicator Fact
Sheets 1. Aquatic ecological issues 7 6 4 4 2. Terrestrial ecological issues 13 23 5 15 3. Physical/chemical issues 5 25 5 6 4. Society issues 11 12 11 11 5. Management and business issues 6 12 6 10 Total 42 78 31 46 The results are presented as appeared at the workshop, and due to restricted time in the group works some information may lack.
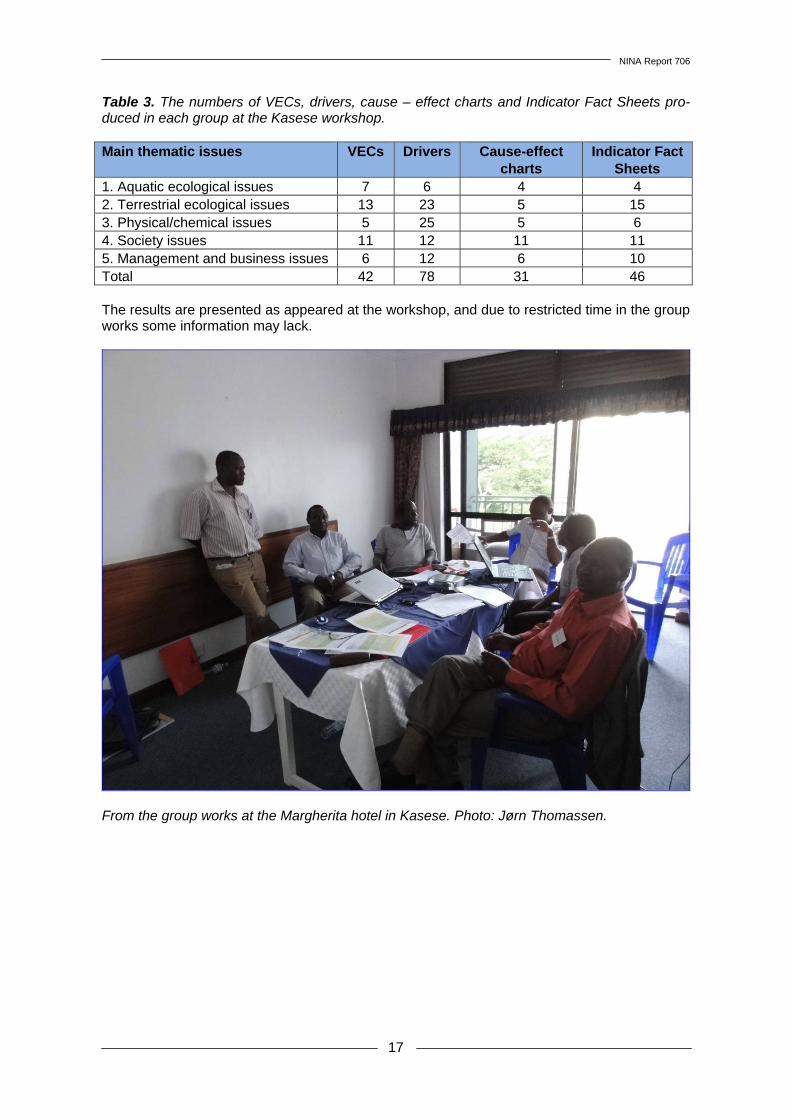
From the group works at the Margherita hotel in Kasese. Photo: Jørn Thomassen.
NINA Report 706
18
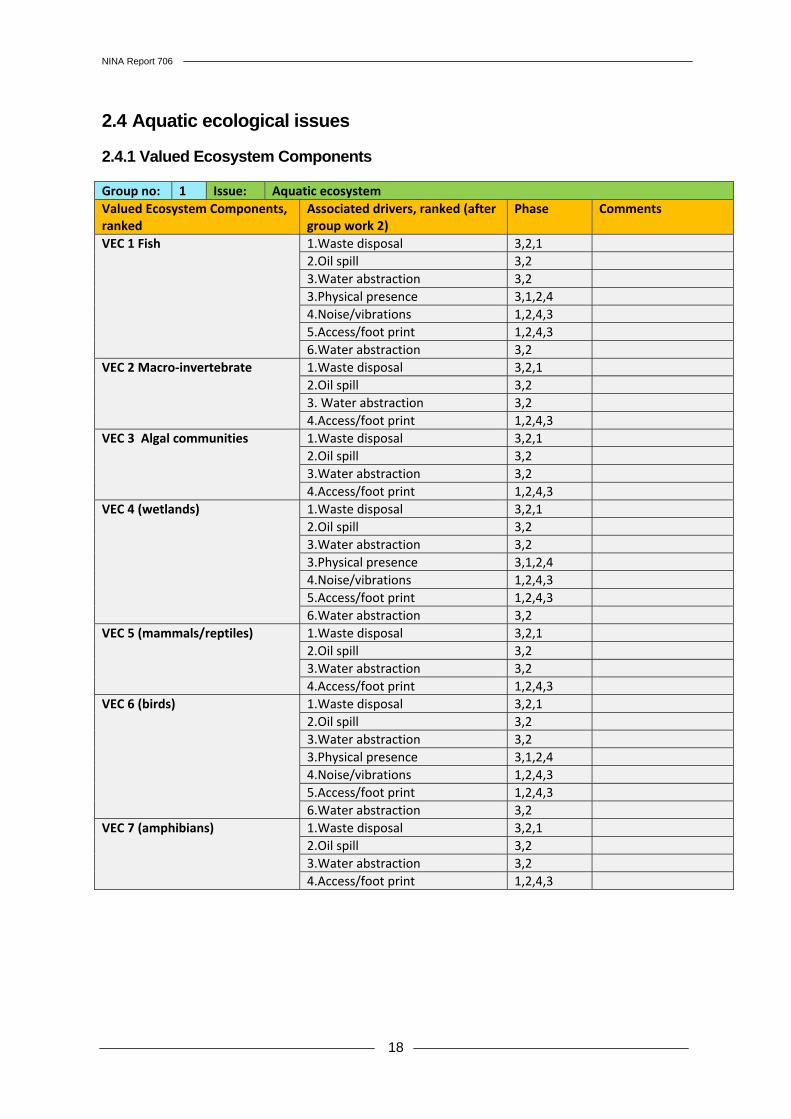
2.4 Aquatic ecological issues 2.4.1 Valued Ecosystem Components Group no: 1 Issue: Aquatic ecosystemValued Ecosystem Components, ranked
Associated drivers, ranked (after group work 2)
Phase Comments
VEC 1 Fish
1.Waste disposal 3,2,1 2.Oil spill 3,2 3.Water abstraction 3,2 3.Physical presence 3,1,2,4 4.Noise/vibrations 1,2,4,3 5.Access/foot print 1,2,4,3 6.Water abstraction 3,2
VEC 2 Macro-invertebrate 1.Waste disposal 3,2,1 2.Oil spill 3,2 3. Water abstraction 3,2 4.Access/foot print 1,2,4,3
VEC 3 Algal communities 1.Waste disposal 3,2,1 2.Oil spill 3,2 3.Water abstraction 3,2 4.Access/foot print 1,2,4,3
VEC 4 (wetlands) 1.Waste disposal 3,2,1 2.Oil spill 3,2 3.Water abstraction 3,2 3.Physical presence 3,1,2,4 4.Noise/vibrations 1,2,4,3 5.Access/foot print 1,2,4,3 6.Water abstraction 3,2
VEC 5 (mammals/reptiles) 1.Waste disposal 3,2,1 2.Oil spill 3,2 3.Water abstraction 3,2 4.Access/foot print 1,2,4,3
VEC 6 (birds) 1.Waste disposal 3,2,1 2.Oil spill 3,2 3.Water abstraction 3,2 3.Physical presence 3,1,2,4 4.Noise/vibrations 1,2,4,3 5.Access/foot print 1,2,4,3 6.Water abstraction 3,2
VEC 7 (amphibians) 1.Waste disposal 3,2,1 2.Oil spill 3,2 3.Water abstraction 3,2 4.Access/foot print 1,2,4,3
NINA Report 706
19
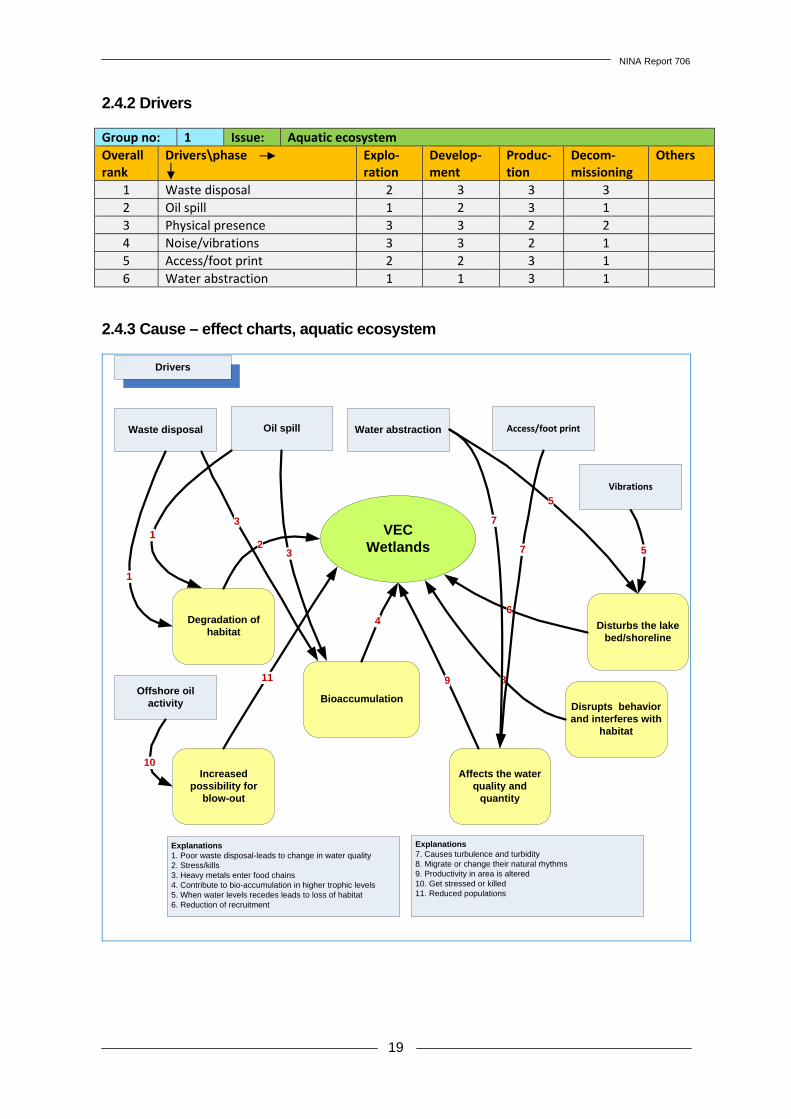
2.4.2 Drivers Group no: 1 Issue: Aquatic ecosystemOverall rank
Drivers\phase
Explo-ration
Develop-ment
Produc-tion
Decom-missioning
Others
1 Waste disposal 2 3 3 3 2 Oil spill 1 2 3 1 3 Physical presence 3 3 2 2 4 Noise/vibrations 3 3 2 1 5 Access/foot print 2 2 3 1 6 Water abstraction 1 1 3 1
2.4.3 Cause – effect charts, aquatic ecosystem
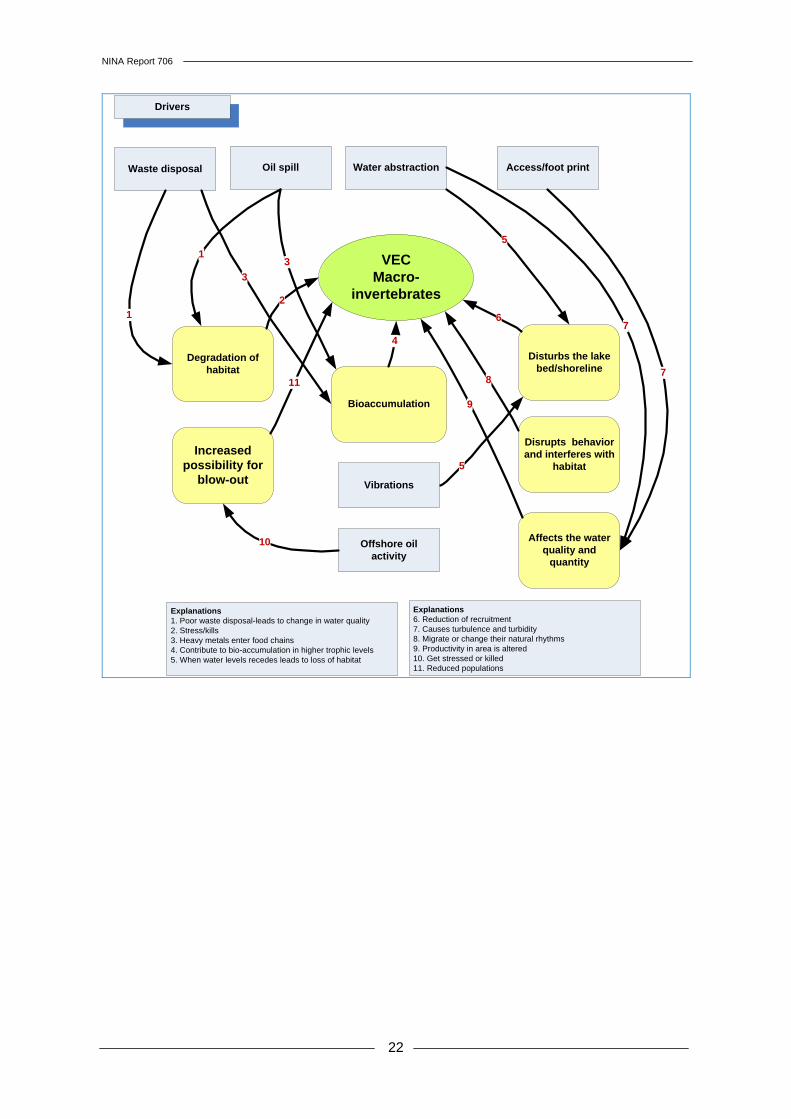
VECWetlands
Waste disposal
Drivers
Oil spill Water abstraction Access/foot print
Degradation of habitat
1
Bioaccumulation
Disturbs the lake bed/shoreline
Affects the water quality and
quantity
Increased possibility for
blow-out
Disrupts behavior and interferes with
habitat
Explanations1. Poor waste disposal-leads to change in water quality2. Stress/kills3. Heavy metals enter food chains 4. Contribute to bio-accumulation in higher trophic levels5. When water levels recedes leads to loss of habitat6. Reduction of recruitment
Explanations7. Causes turbulence and turbidity8. Migrate or change their natural rhythms9. Productivity in area is altered10. Get stressed or killed11. Reduced populations
21
3
5
3
46
8
7
9
5
Offshore oil activity
10
11
Vibrations
7
NINA Report 706
20
NINA Report 706
21
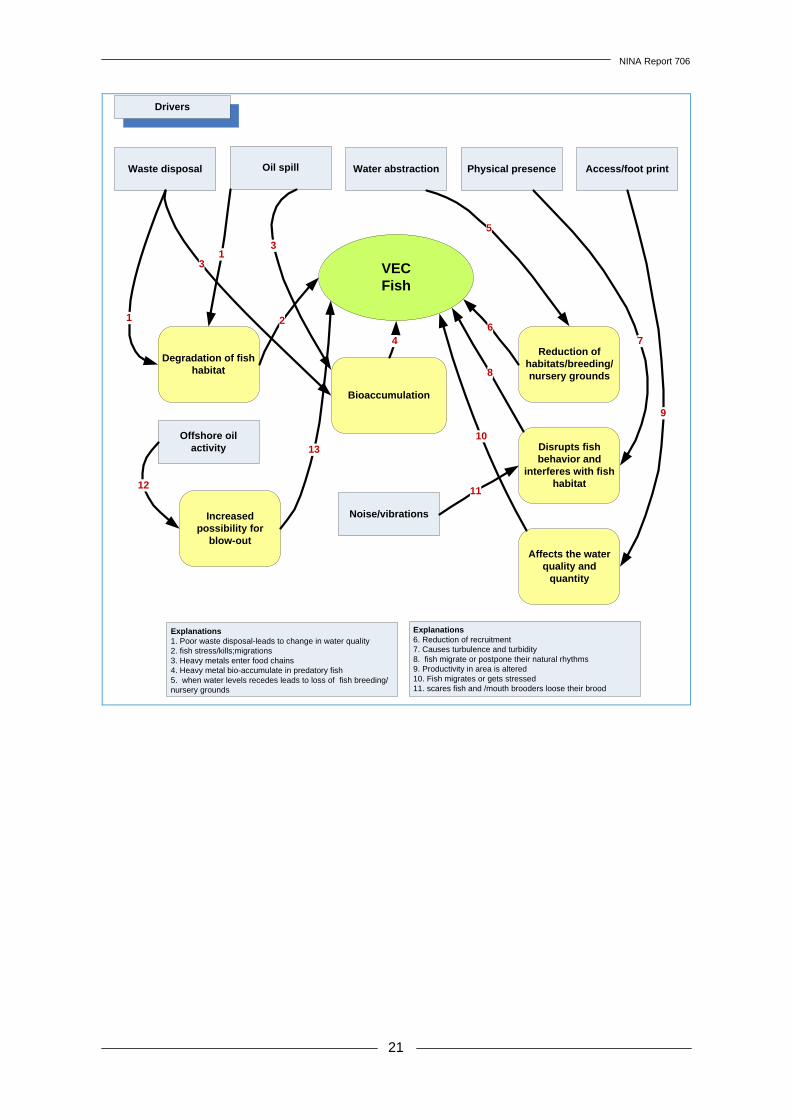
VECFish
Waste disposal
Drivers
Oil spill Water abstraction Physical presence Access/foot print
Degradation of fish habitat
1
Bioaccumulation
Reduction of habitats/breeding/nursery grounds
Affects the water quality and
quantity
Increased possibility for
blow-out
Disrupts fish behavior and
interferes with fish habitat
Explanations1. Poor waste disposal-leads to change in water quality2. fish stress/kills;migrations3. Heavy metals enter food chains 4. Heavy metal bio-accumulate in predatory fish5. when water levels recedes leads to loss of fish breeding/nursery grounds
Explanations6. Reduction of recruitment7. Causes turbulence and turbidity8. fish migrate or postpone their natural rhythms9. Productivity in area is altered10. Fish migrates or gets stressed11. scares fish and /mouth brooders loose their brood
2
Noise/vibrations
13
5
3
46
7
8
9
10
11
Offshore oil activity
12
13
NINA Report 706
22
VECMacro-
invertebrates
Waste disposal
Drivers
Oil spill Water abstraction Access/foot print
Degradation of habitat
1
Bioaccumulation
Disturbs the lake bed/shoreline
Affects the water quality and
quantity
Increased possibility for
blow-out
Disrupts behavior and interferes with
habitat
Explanations1. Poor waste disposal-leads to change in water quality2. Stress/kills3. Heavy metals enter food chains 4. Contribute to bio-accumulation in higher trophic levels5. When water levels recedes leads to loss of habitat
Explanations6. Reduction of recruitment7. Causes turbulence and turbidity8. Migrate or change their natural rhythms9. Productivity in area is altered10. Get stressed or killed11. Reduced populations
2
13
5
3
4
6
87
9
5
Offshore oil activity
10
11
Vibrations
7
NINA Report 706
23
2.4.4 Indicator Fact Sheets, aquatic ecosystem
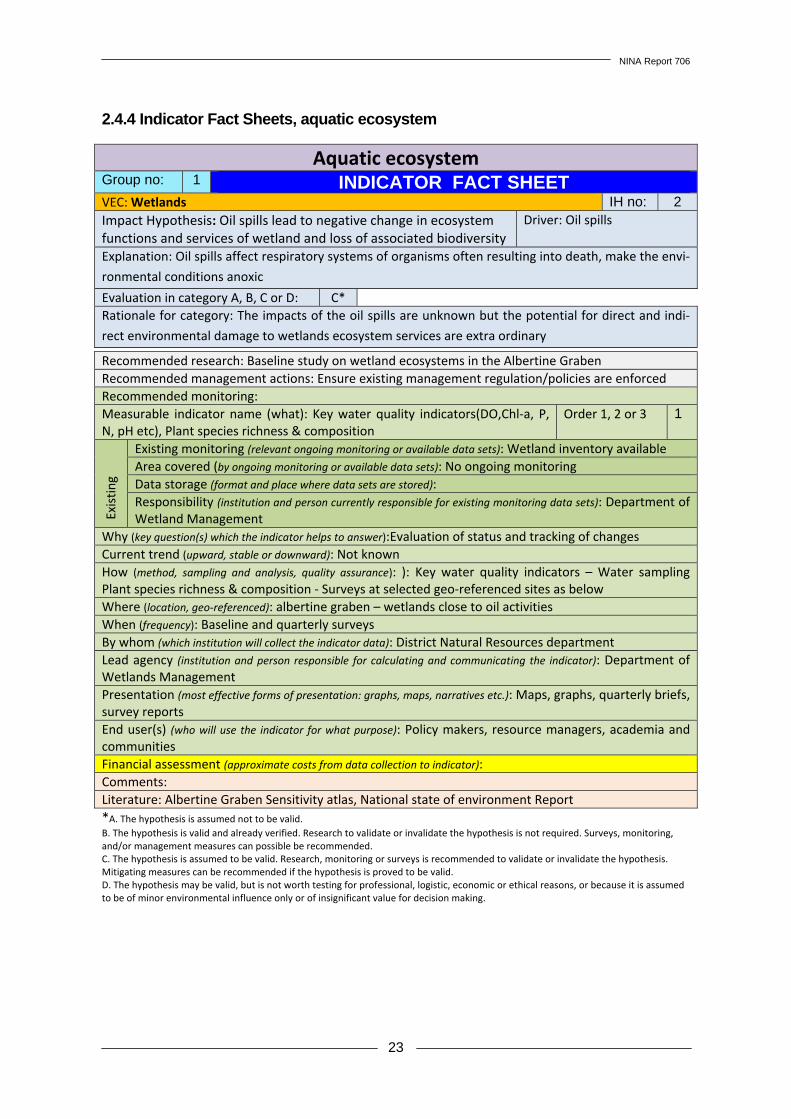
Aquatic ecosystem Group no: 1 INDICATOR FACT SHEET VEC: Wetlands IH no: 2 Impact Hypothesis: Oil spills lead to negative change in ecosystem functions and services of wetland and loss of associated biodiversity
Driver: Oil spills
Explanation: Oil spills affect respiratory systems of organisms often resulting into death, make the envi-
ronmental conditions anoxic
Evaluation in category A, B, C or D: C*Rationale for category: The impacts of the oil spills are unknown but the potential for direct and indi-
rect environmental damage to wetlands ecosystem services are extra ordinary
Recommended research: Baseline study on wetland ecosystems in the Albertine Graben Recommended management actions: Ensure existing management regulation/policies are enforcedRecommended monitoring: Measurable indicator name (what): Key water quality indicators(DO,Chl-a, P,N, pH etc), Plant species richness & composition
Order 1, 2 or 3 1
Exis
ting
Existing monitoring (relevant ongoing monitoring or available data sets): Wetland inventory availableArea covered (by ongoing monitoring or available data sets): No ongoing monitoring Data storage (format and place where data sets are stored): Responsibility (institution and person currently responsible for existing monitoring data sets): Department of Wetland Management
Why (key question(s) which the indicator helps to answer):Evaluation of status and tracking of changes Current trend (upward, stable or downward): Not knownHow (method, sampling and analysis, quality assurance): ): Key water quality indicators – Water sampling Plant species richness & composition - Surveys at selected geo-referenced sites as below Where (location, geo-referenced): albertine graben – wetlands close to oil activitiesWhen (frequency): Baseline and quarterly surveysBy whom (which institution will collect the indicator data): District Natural Resources department Lead agency (institution and person responsible for calculating and communicating the indicator): Department of Wetlands Management Presentation (most effective forms of presentation: graphs, maps, narratives etc.): Maps, graphs, quarterly briefs, survey reports End user(s) (who will use the indicator for what purpose): Policy makers, resource managers, academia and communities Financial assessment (approximate costs from data collection to indicator):Comments: Literature: Albertine Graben Sensitivity atlas, National state of environment Report *A. The hypothesis is assumed not to be valid. B. The hypothesis is valid and already verified. Research to validate or invalidate the hypothesis is not required. Surveys, monitoring, and/or management measures can possible be recommended. C. The hypothesis is assumed to be valid. Research, monitoring or surveys is recommended to validate or invalidate the hypothesis. Mitigating measures can be recommended if the hypothesis is proved to be valid. D. The hypothesis may be valid, but is not worth testing for professional, logistic, economic or ethical reasons, or because it is assumed to be of minor environmental influence only or of insignificant value for decision making.
NINA Report 706
24
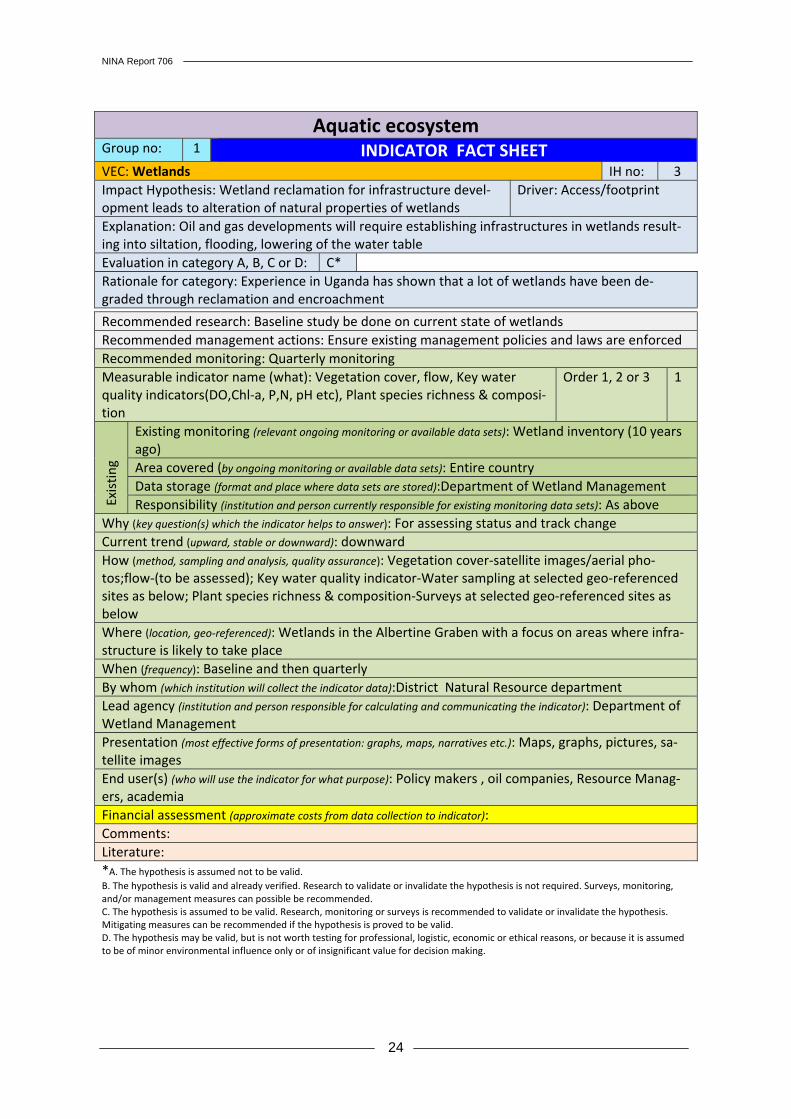
Aquatic ecosystem Group no: 1 INDICATOR FACT SHEETVEC: Wetlands IH no: 3 Impact Hypothesis: Wetland reclamation for infrastructure devel-opment leads to alteration of natural properties of wetlands
Driver: Access/footprint
Explanation: Oil and gas developments will require establishing infrastructures in wetlands result-ing into siltation, flooding, lowering of the water table Evaluation in category A, B, C or D: C* Rationale for category: Experience in Uganda has shown that a lot of wetlands have been de-graded through reclamation and encroachment
Recommended research: Baseline study be done on current state of wetlands Recommended management actions: Ensure existing management policies and laws are enforced Recommended monitoring: Quarterly monitoring Measurable indicator name (what): Vegetation cover, flow, Key water quality indicators(DO,Chl-a, P,N, pH etc), Plant species richness & composi-tion
Order 1, 2 or 3 1
Exis
ting
Existing monitoring (relevant ongoing monitoring or available data sets): Wetland inventory (10 years ago) Area covered (by ongoing monitoring or available data sets): Entire country Data storage (format and place where data sets are stored):Department of Wetland Management Responsibility (institution and person currently responsible for existing monitoring data sets): As above
Why (key question(s) which the indicator helps to answer): For assessing status and track change Current trend (upward, stable or downward): downward How (method, sampling and analysis, quality assurance): Vegetation cover-satellite images/aerial pho-tos;flow-(to be assessed); Key water quality indicator-Water sampling at selected geo-referenced sites as below; Plant species richness & composition-Surveys at selected geo-referenced sites as below Where (location, geo-referenced): Wetlands in the Albertine Graben with a focus on areas where infra-structure is likely to take place When (frequency): Baseline and then quarterly By whom (which institution will collect the indicator data):District Natural Resource department Lead agency (institution and person responsible for calculating and communicating the indicator): Department of Wetland Management Presentation (most effective forms of presentation: graphs, maps, narratives etc.): Maps, graphs, pictures, sa-tellite images End user(s) (who will use the indicator for what purpose): Policy makers , oil companies, Resource Manag-ers, academia Financial assessment (approximate costs from data collection to indicator): Comments: Literature: *A. The hypothesis is assumed not to be valid. B. The hypothesis is valid and already verified. Research to validate or invalidate the hypothesis is not required. Surveys, monitoring, and/or management measures can possible be recommended. C. The hypothesis is assumed to be valid. Research, monitoring or surveys is recommended to validate or invalidate the hypothesis. Mitigating measures can be recommended if the hypothesis is proved to be valid. D. The hypothesis may be valid, but is not worth testing for professional, logistic, economic or ethical reasons, or because it is assumed to be of minor environmental influence only or of insignificant value for decision making.

NINA Report 706
25
Aquatic ecosystem Group no: 1 INDICATOR FACT SHEETVEC: Fish IH no: 1 Impact Hypothesis: Poor waste disposal-leads to change in water quality that results into degradation of habitat, leading to fish stress/kills and migrations
Driver: Waste disposal
Explanation: Contaminated water bodies have been shown not to support fish in Europe, USA, Ja-pan Evaluation in category A, B, C or D: C* Rationale for category: No research has been done in Albertine Graben based lakes
Recommended research: Baseline on environmental factors of key fish habitats Recommended management actions: Recommended monitoring: Quarterly monitoring Measurable indicator name (what): Water quality (DO, P, N, Chl-a, PHCs, Transparency, conductivity)
Order 1, 2 or 3
Exis
ting
Existing monitoring (relevant ongoing monitoring or available data sets): Baseline 2007-09 Area covered (by ongoing monitoring or available data sets): Ngasa, Kyehoro, Kaiso-Tonya, Sebagoro to Bugoma Data storage (format and place where data sets are stored): Excel at NaFIRRI Responsibility (institution and person currently responsible for existing monitoring data sets): NaFIRRI
Why (key question(s) which the indicator helps to answer): Assess status and track changes as the oil indus-try grows Current trend (upward, stable or downward): Stable How (method, sampling and analysis, quality assurance): Water quality (DO, P, N, Chl-a, PHCs, Transparen-cy, conductivity)- Water sampling in identified fish habitat Where (location, geo-referenced): Identified fish habitat areas close to oil development enterprises When (frequency): Quarterly By whom (which institution will collect the indicator data): NaFIRRI Lead agency (institution and person responsible for calculating and communicating the indicator): NaFIRRI Presentation (most effective forms of presentation: graphs, maps, narratives etc.): maps, graphs, quarterly briefs End user(s) (who will use the indicator for what purpose): Policy makers, Department of Fisheries Man-agement, Oil companies, NEMA, communities Financial assessment (approximate costs from data collection to indicator): Comments: Literature: National state of environment Report, 2007-09 Baseline survey reports *A. The hypothesis is assumed not to be valid. B. The hypothesis is valid and already verified. Research to validate or invalidate the hypothesis is not required. Surveys, monitoring, and/or management measures can possible be recommended. C. The hypothesis is assumed to be valid. Research, monitoring or surveys is recommended to validate or invalidate the hypothesis. Mitigating measures can be recommended if the hypothesis is proved to be valid. D. The hypothesis may be valid, but is not worth testing for professional, logistic, economic or ethical reasons, or because it is assumed to be of minor environmental influence only or of insignificant value for decision making.
NINA Report 706
26
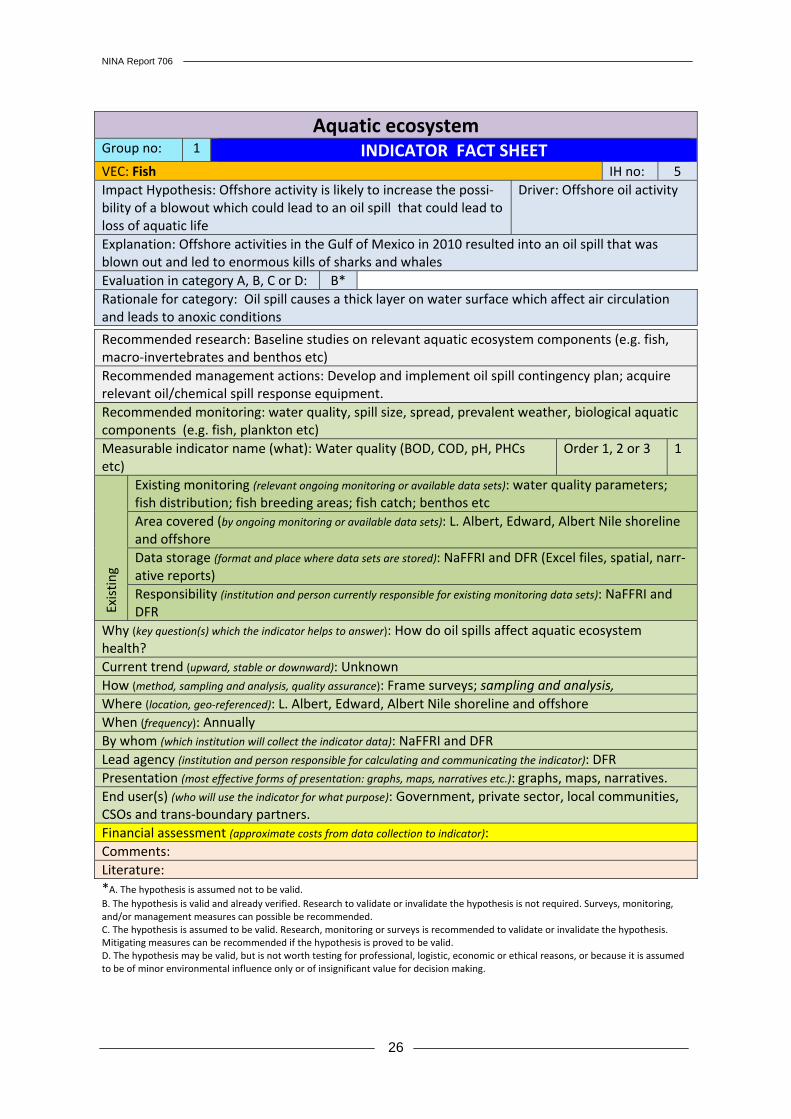
Aquatic ecosystem Group no: 1 INDICATOR FACT SHEETVEC: Fish IH no: 5 Impact Hypothesis: Offshore activity is likely to increase the possi-bility of a blowout which could lead to an oil spill that could lead to loss of aquatic life
Driver: Offshore oil activity
Explanation: Offshore activities in the Gulf of Mexico in 2010 resulted into an oil spill that was blown out and led to enormous kills of sharks and whales Evaluation in category A, B, C or D: B* Rationale for category: Oil spill causes a thick layer on water surface which affect air circulation and leads to anoxic conditions
Recommended research: Baseline studies on relevant aquatic ecosystem components (e.g. fish, macro-invertebrates and benthos etc) Recommended management actions: Develop and implement oil spill contingency plan; acquire relevant oil/chemical spill response equipment. Recommended monitoring: water quality, spill size, spread, prevalent weather, biological aquatic components (e.g. fish, plankton etc) Measurable indicator name (what): Water quality (BOD, COD, pH, PHCs etc)
Order 1, 2 or 3 1
Exis
ting
Existing monitoring (relevant ongoing monitoring or available data sets): water quality parameters; fish distribution; fish breeding areas; fish catch; benthos etc Area covered (by ongoing monitoring or available data sets): L. Albert, Edward, Albert Nile shoreline and offshore Data storage (format and place where data sets are stored): NaFFRI and DFR (Excel files, spatial, narr-ative reports) Responsibility (institution and person currently responsible for existing monitoring data sets): NaFFRI and DFR
Why (key question(s) which the indicator helps to answer): How do oil spills affect aquatic ecosystem health? Current trend (upward, stable or downward): Unknown How (method, sampling and analysis, quality assurance): Frame surveys; sampling and analysis, Where (location, geo-referenced): L. Albert, Edward, Albert Nile shoreline and offshore When (frequency): Annually By whom (which institution will collect the indicator data): NaFFRI and DFR Lead agency (institution and person responsible for calculating and communicating the indicator): DFR Presentation (most effective forms of presentation: graphs, maps, narratives etc.): graphs, maps, narratives. End user(s) (who will use the indicator for what purpose): Government, private sector, local communities, CSOs and trans-boundary partners. Financial assessment (approximate costs from data collection to indicator): Comments: Literature: *A. The hypothesis is assumed not to be valid. B. The hypothesis is valid and already verified. Research to validate or invalidate the hypothesis is not required. Surveys, monitoring, and/or management measures can possible be recommended. C. The hypothesis is assumed to be valid. Research, monitoring or surveys is recommended to validate or invalidate the hypothesis. Mitigating measures can be recommended if the hypothesis is proved to be valid. D. The hypothesis may be valid, but is not worth testing for professional, logistic, economic or ethical reasons, or because it is assumed to be of minor environmental influence only or of insignificant value for decision making.
NINA Report 706
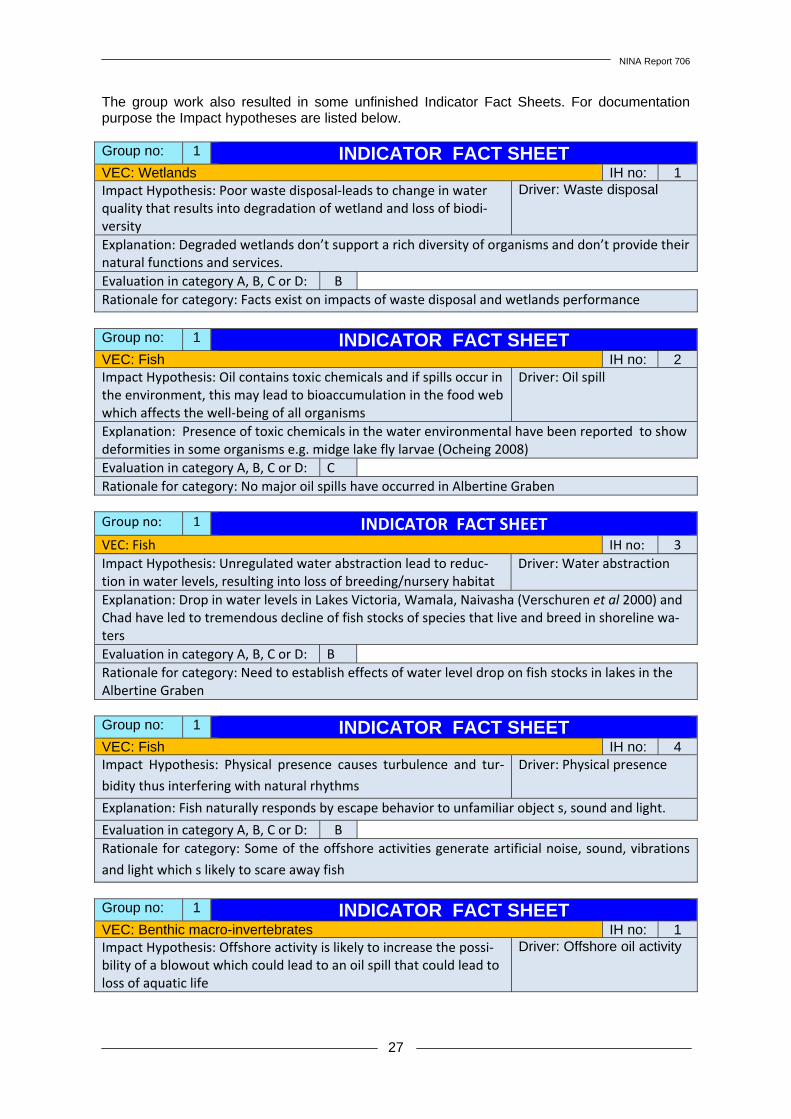
27
The group work also resulted in some unfinished Indicator Fact Sheets. For documentation purpose the Impact hypotheses are listed below. Group no: 1 INDICATOR FACT SHEET VEC: Wetlands IH no: 1 Impact Hypothesis: Poor waste disposal-leads to change in water quality that results into degradation of wetland and loss of biodi-versity
Driver: Waste disposal
Explanation: Degraded wetlands don’t support a rich diversity of organisms and don’t provide their natural functions and services. Evaluation in category A, B, C or D: B Rationale for category: Facts exist on impacts of waste disposal and wetlands performance
Group no: 1 INDICATOR FACT SHEET VEC: Fish IH no: 2 Impact Hypothesis: Oil contains toxic chemicals and if spills occur in the environment, this may lead to bioaccumulation in the food web which affects the well-being of all organisms
Driver: Oil spill
Explanation: Presence of toxic chemicals in the water environmental have been reported to show deformities in some organisms e.g. midge lake fly larvae (Ocheing 2008) Evaluation in category A, B, C or D: C Rationale for category: No major oil spills have occurred in Albertine Graben Group no: 1 INDICATOR FACT SHEETVEC: Fish IH no: 3 Impact Hypothesis: Unregulated water abstraction lead to reduc-tion in water levels, resulting into loss of breeding/nursery habitat
Driver: Water abstraction
Explanation: Drop in water levels in Lakes Victoria, Wamala, Naivasha (Verschuren et al 2000) and Chad have led to tremendous decline of fish stocks of species that live and breed in shoreline wa-ters Evaluation in category A, B, C or D: B Rationale for category: Need to establish effects of water level drop on fish stocks in lakes in the Albertine Graben Group no: 1 INDICATOR FACT SHEET VEC: Fish IH no: 4 Impact Hypothesis: Physical presence causes turbulence and tur-
bidity thus interfering with natural rhythms
Driver: Physical presence
Explanation: Fish naturally responds by escape behavior to unfamiliar object s, sound and light.
Evaluation in category A, B, C or D: B Rationale for category: Some of the offshore activities generate artificial noise, sound, vibrations
and light which s likely to scare away fish
Group no: 1 INDICATOR FACT SHEET VEC: Benthic macro-invertebrates IH no: 1 Impact Hypothesis: Offshore activity is likely to increase the possi-bility of a blowout which could lead to an oil spill that could lead to loss of aquatic life
Driver: Offshore oil activity
NINA Report 706
28
Explanation: Oil spill causes a thick layer on water surface which affect air circulation and leads to anoxic conditions. The macro-invertebrates are likely to be impacted strongly because they are sedentary. Offshore activities in the Gulf of Mexico in 2010 resulted into an oil spill that was blown out and led to enormous kills of sharks and whales. Evaluation in category A, B, C or D: B Rationale for category: Scientific facts on effects of oil spill are known and experience from regions that have had this occurrence e.g. Gulf of Mexico in 2010 and Lake Nkugute in Rubirizi District in 2008 can be adapted Group no: 1 INDICATOR FACT SHEET VEC: Benthic macro-invertebrates IH no: 2 Impact Hypothesis: Poor waste disposal-leads to change in water quality that results into degradation of habitat, leading stress and/ or death
Driver: Waste disposal
Explanation: Contaminated water bodies have been shown not to support viable macroinverte-brates populations in Europe, USA, Japan, China Evaluation in category A, B, C or D: C Rationale for category: No research has been done in Albertine Graben based lakes
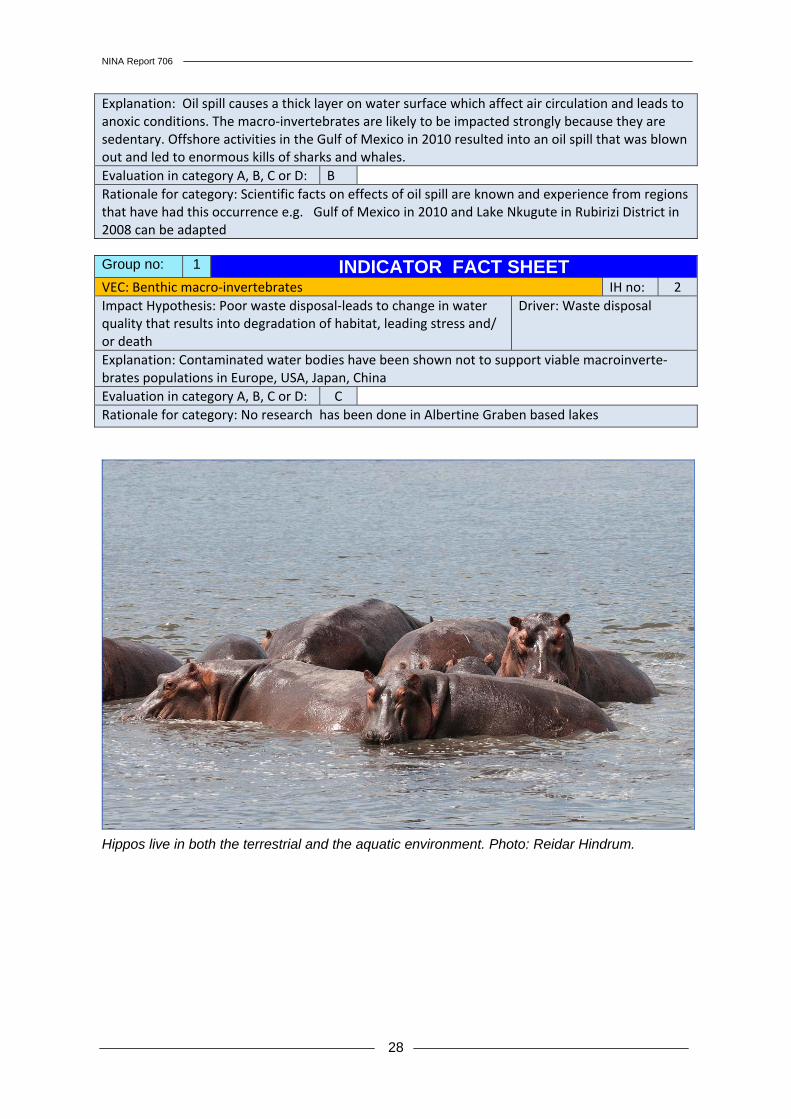
Hippos live in both the terrestrial and the aquatic environment. Photo: Reidar Hindrum.
NINA Report 706
29
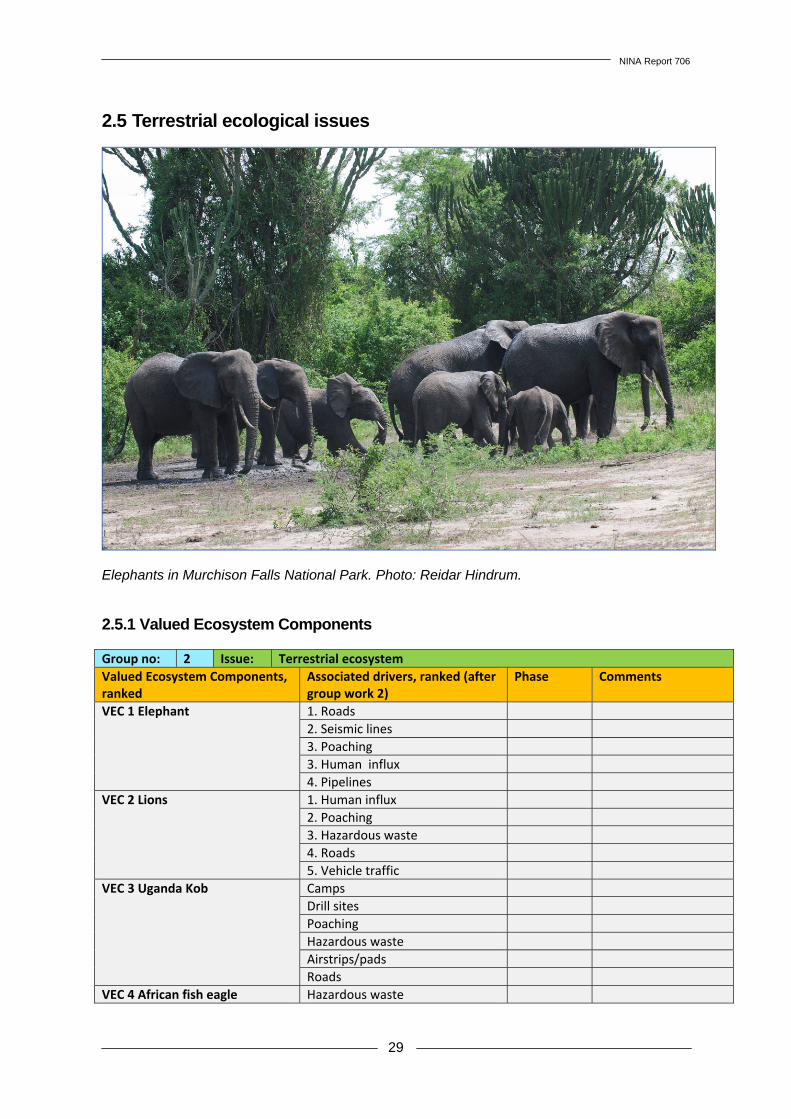
2.5 Terrestrial ecological issues
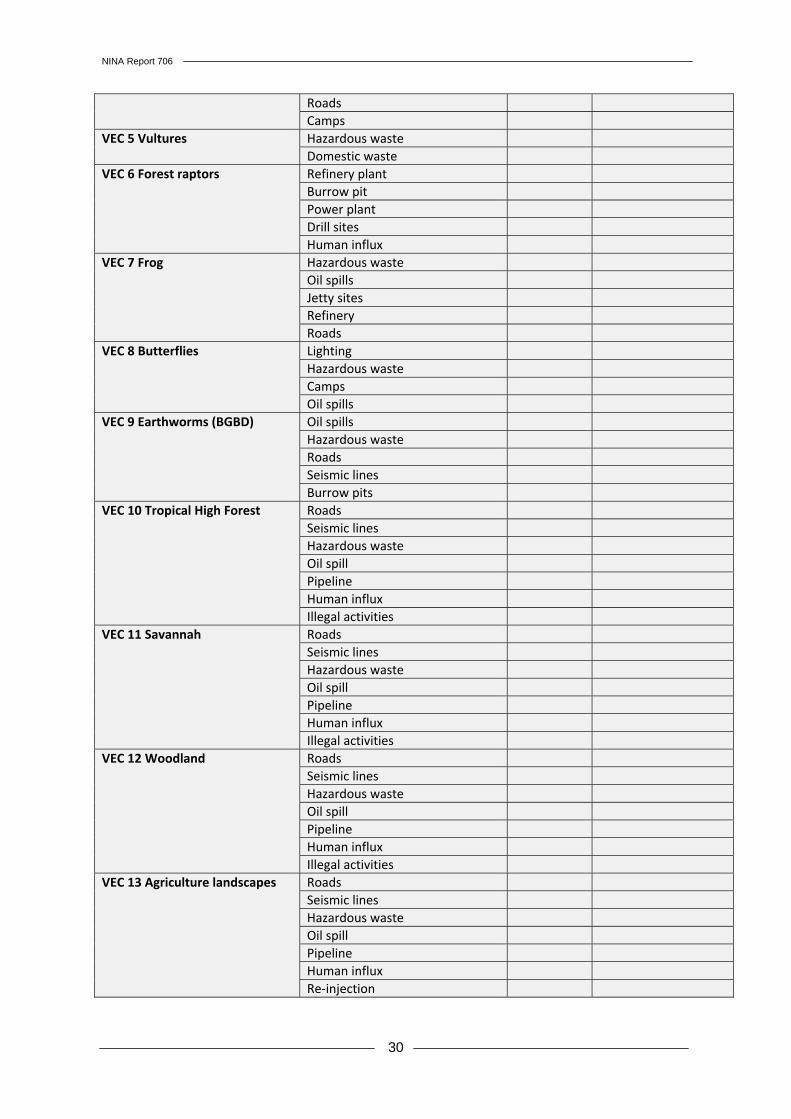
Elephants in Murchison Falls National Park. Photo: Reidar Hindrum. 2.5.1 Valued Ecosystem Components Group no: 2 Issue: Terrestrial ecosystemValued Ecosystem Components, ranked
Associated drivers, ranked (after group work 2)
Phase Comments
VEC 1 Elephant 1. Roads 2. Seismic lines 3. Poaching 3. Human influx 4. Pipelines
VEC 2 Lions 1. Human influx 2. Poaching 3. Hazardous waste 4. Roads 5. Vehicle traffic
VEC 3 Uganda Kob Camps Drill sites Poaching Hazardous waste Airstrips/pads Roads
VEC 4 African fish eagle Hazardous waste
NINA Report 706
30
Roads Camps
VEC 5 Vultures Hazardous waste Domestic waste
VEC 6 Forest raptors Refinery plant Burrow pit Power plant Drill sites Human influx
VEC 7 Frog Hazardous waste Oil spills Jetty sites Refinery Roads
VEC 8 Butterflies Lighting Hazardous waste Camps Oil spills
VEC 9 Earthworms (BGBD) Oil spills Hazardous waste Roads Seismic lines Burrow pits
VEC 10 Tropical High Forest Roads Seismic lines Hazardous waste Oil spill Pipeline Human influx Illegal activities
VEC 11 Savannah Roads Seismic lines Hazardous waste Oil spill Pipeline Human influx Illegal activities
VEC 12 Woodland Roads Seismic lines Hazardous waste Oil spill Pipeline Human influx Illegal activities
VEC 13 Agriculture landscapes Roads Seismic lines Hazardous waste Oil spill Pipeline Human influx Re-injection

NINA Report 706
31
2.5.2 Drivers Group no: 2 Issue: Terrestrial ecosystemOverall rank
Drivers\phase
Explo-ration
Develop-ment
Produc-tion
Decom-missioning
Others
Seismic lines 3 2 Camps 3 3 3 1 Blasts 3 2 Roads 3 3 3 Pipelines 2 3 Drill sites 3 3 2 Vehicle traffic 3 3 3 2 Human influx 3 3 2 1 Poaching 3 3 2 1 Spills 1 1 3 1 Hazardous waste 3 1 3 1 Domestic waste 3 3 3 1 Flaring 3 3 Lighting at facilities 3 1 2 1 Refinery plant 2 3 3 Burrow pits 3 3 2 1 Power plant 2 3 Oil storage facilities 1 1 3 1 Airstrips/pads 2 3 3 1 Jetty sites 3 2 2 Explosives magazines 3 2 Re-injection 2 3 Illegal activities
Antelopes are numerous on the Nile river bank in Murchison Falls National Park. Photo: Jørn Thomassen.
NINA Report 706
32
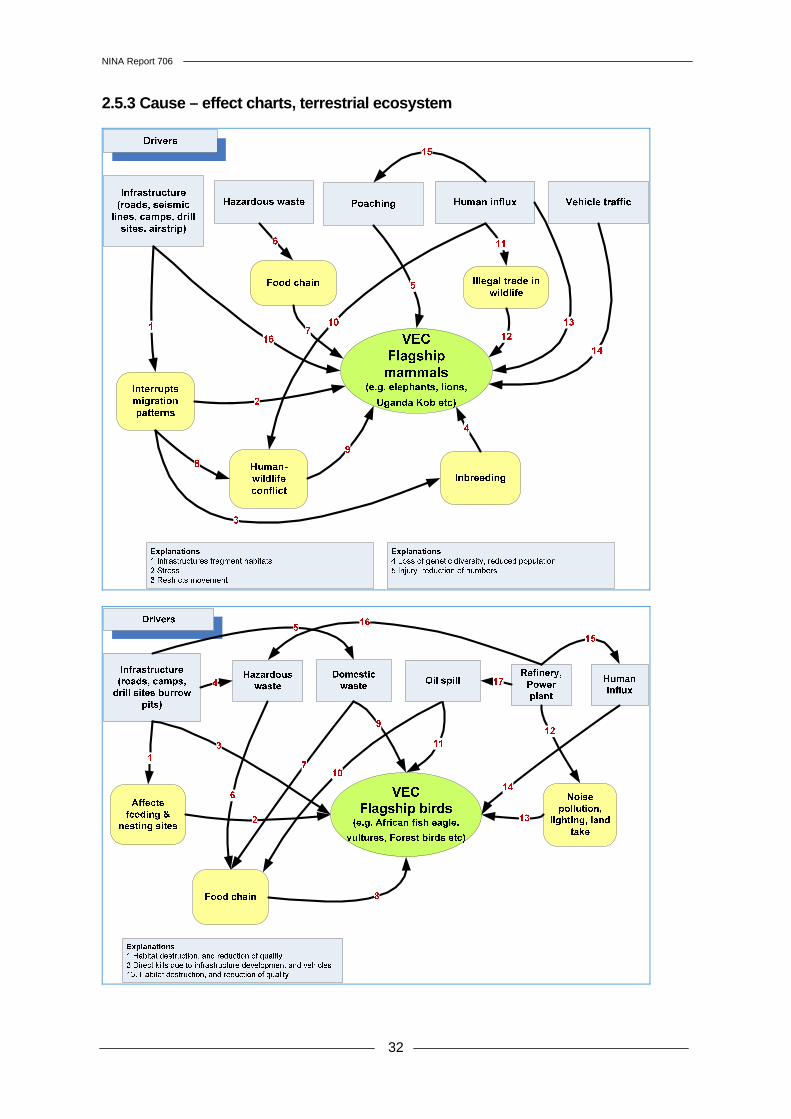
2.5.3 Cause – effect charts, terrestrial ecosystem
NINA Report 706
33
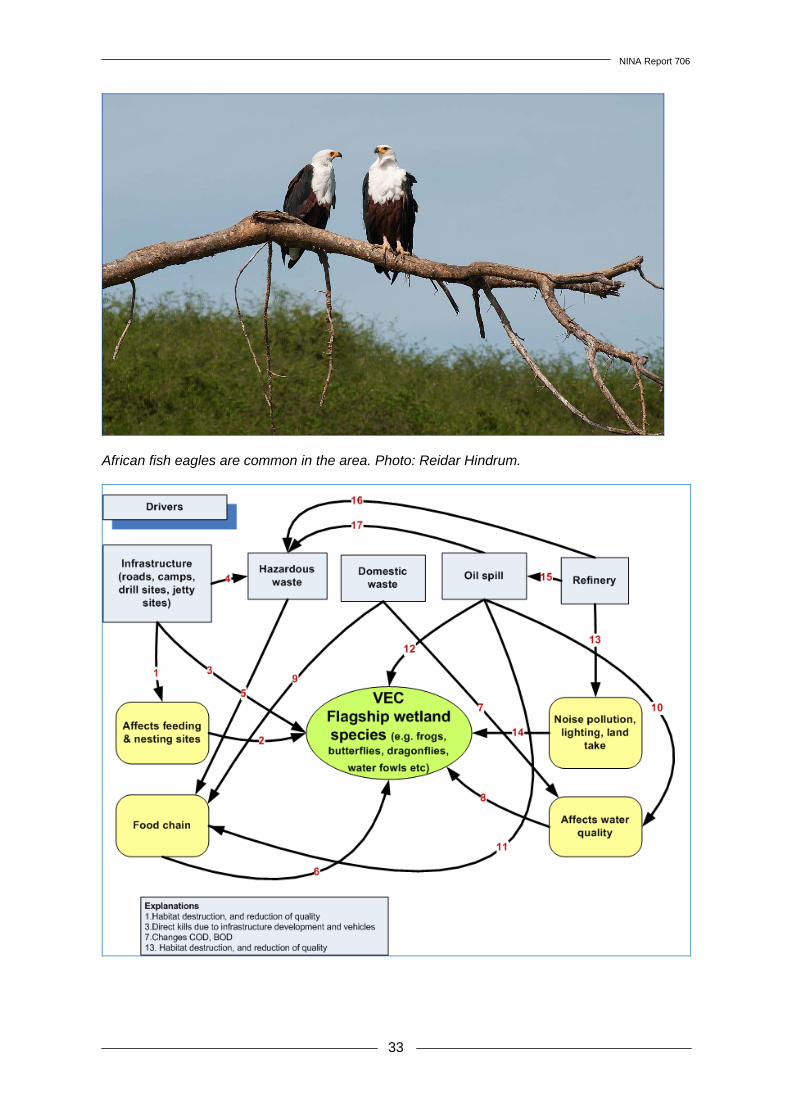
African fish eagles are common in the area. Photo: Reidar Hindrum.
NINA Report 706
34
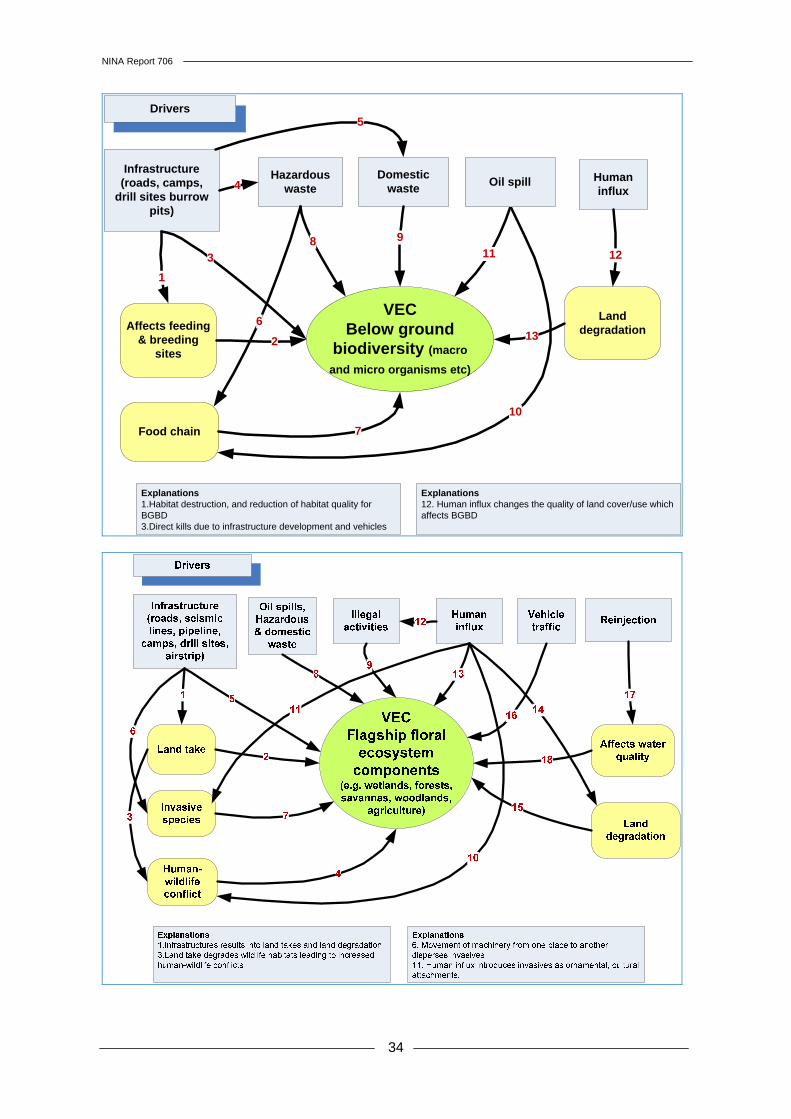
VECBelow ground
biodiversity (macro
and micro organisms etc)
Infrastructure (roads, camps,
drill sites burrow pits)
Drivers
Hazardous waste
Domestic waste
Human influx
Affects feeding & breeding
sites
1
Land degradation
Food chain
Explanations1.Habitat destruction, and reduction of habitat quality for BGBD3.Direct kills due to infrastructure development and vehicles
2
3
4
6
1211
10
9
7
Oil spill
5
8
13
Explanations12. Human influx changes the quality of land cover/use which affects BGBD
NINA Report 706
35
2.5.4 Indicator Fact Sheets
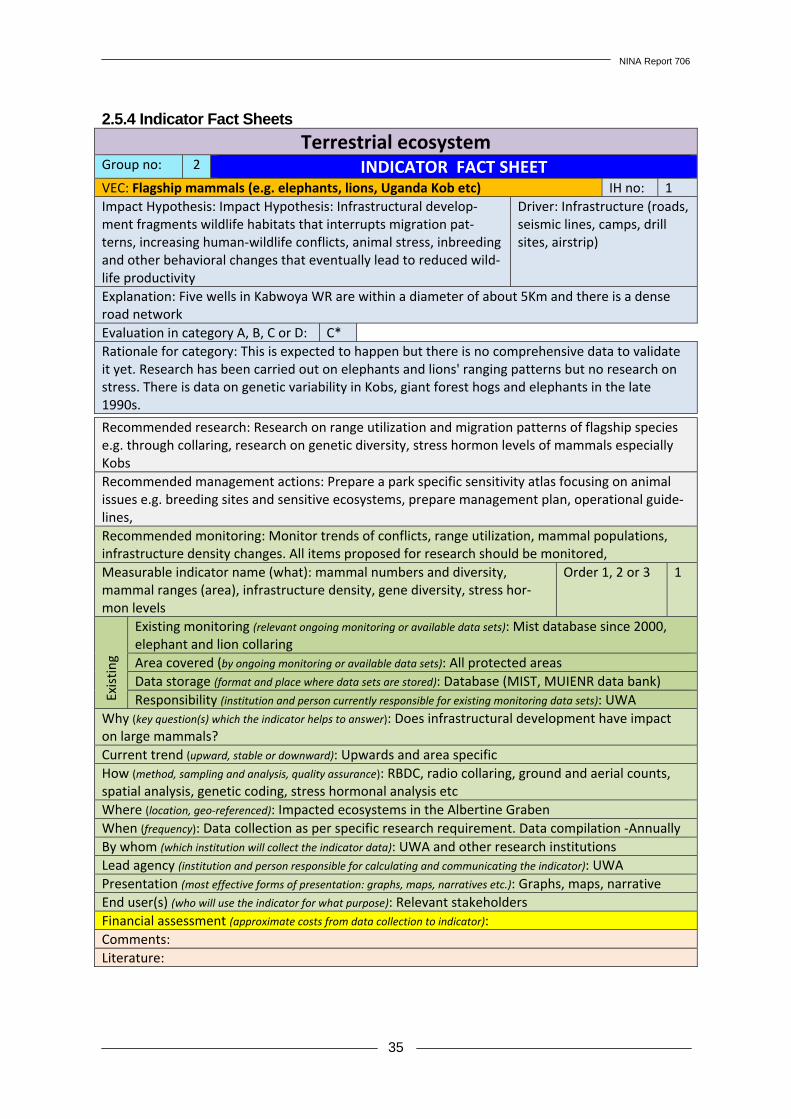
Terrestrial ecosystem Group no: 2 INDICATOR FACT SHEETVEC: Flagship mammals (e.g. elephants, lions, Uganda Kob etc) IH no: 1 Impact Hypothesis: Impact Hypothesis: Infrastructural develop-ment fragments wildlife habitats that interrupts migration pat-terns, increasing human-wildlife conflicts, animal stress, inbreeding and other behavioral changes that eventually lead to reduced wild-life productivity
Driver: Infrastructure (roads, seismic lines, camps, drill sites, airstrip)
Explanation: Five wells in Kabwoya WR are within a diameter of about 5Km and there is a dense road network Evaluation in category A, B, C or D: C* Rationale for category: This is expected to happen but there is no comprehensive data to validate it yet. Research has been carried out on elephants and lions' ranging patterns but no research on stress. There is data on genetic variability in Kobs, giant forest hogs and elephants in the late 1990s.
Recommended research: Research on range utilization and migration patterns of flagship species e.g. through collaring, research on genetic diversity, stress hormon levels of mammals especially Kobs Recommended management actions: Prepare a park specific sensitivity atlas focusing on animal issues e.g. breeding sites and sensitive ecosystems, prepare management plan, operational guide-lines, Recommended monitoring: Monitor trends of conflicts, range utilization, mammal populations, infrastructure density changes. All items proposed for research should be monitored, Measurable indicator name (what): mammal numbers and diversity, mammal ranges (area), infrastructure density, gene diversity, stress hor-mon levels
Order 1, 2 or 3 1
Exis
ting
Existing monitoring (relevant ongoing monitoring or available data sets): Mist database since 2000, elephant and lion collaring Area covered (by ongoing monitoring or available data sets): All protected areas Data storage (format and place where data sets are stored): Database (MIST, MUIENR data bank) Responsibility (institution and person currently responsible for existing monitoring data sets): UWA
Why (key question(s) which the indicator helps to answer): Does infrastructural development have impact on large mammals? Current trend (upward, stable or downward): Upwards and area specific How (method, sampling and analysis, quality assurance): RBDC, radio collaring, ground and aerial counts, spatial analysis, genetic coding, stress hormonal analysis etc Where (location, geo-referenced): Impacted ecosystems in the Albertine Graben When (frequency): Data collection as per specific research requirement. Data compilation -Annually By whom (which institution will collect the indicator data): UWA and other research institutions Lead agency (institution and person responsible for calculating and communicating the indicator): UWA Presentation (most effective forms of presentation: graphs, maps, narratives etc.): Graphs, maps, narrative End user(s) (who will use the indicator for what purpose): Relevant stakeholders Financial assessment (approximate costs from data collection to indicator): Comments: Literature:
NINA Report 706
36
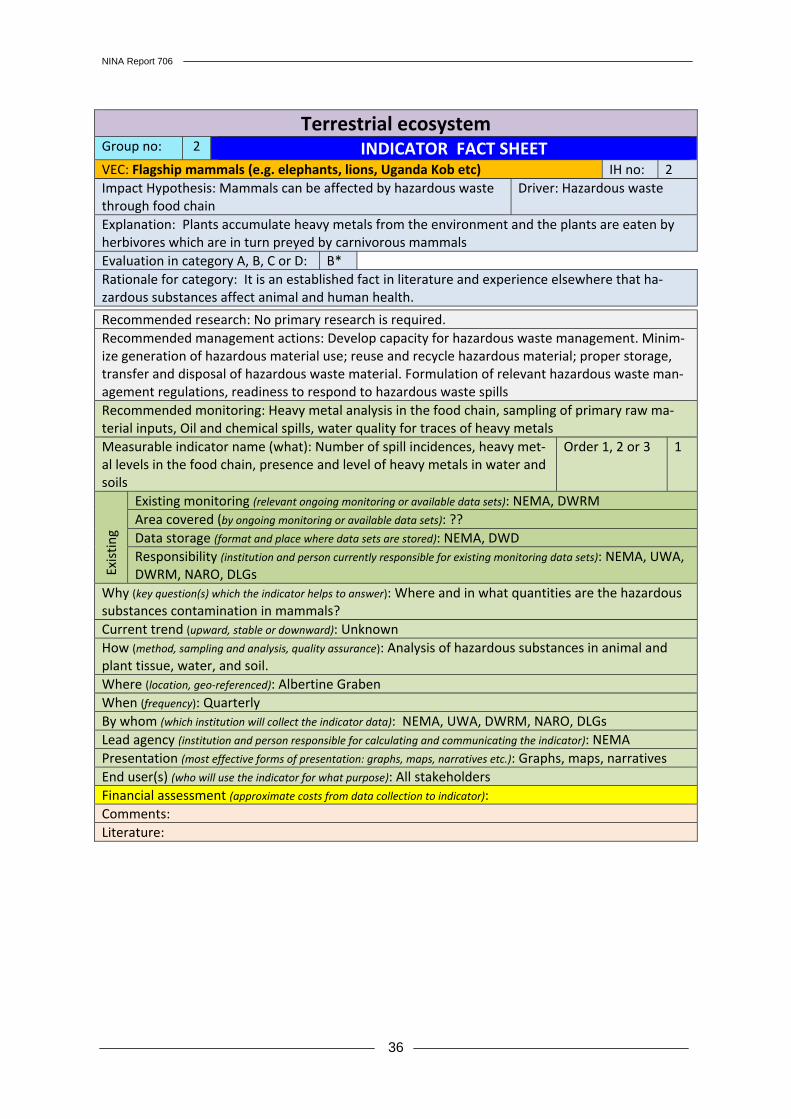
Terrestrial ecosystem Group no: 2 INDICATOR FACT SHEETVEC: Flagship mammals (e.g. elephants, lions, Uganda Kob etc) IH no: 2 Impact Hypothesis: Mammals can be affected by hazardous waste through food chain
Driver: Hazardous waste
Explanation: Plants accumulate heavy metals from the environment and the plants are eaten by herbivores which are in turn preyed by carnivorous mammals Evaluation in category A, B, C or D: B* Rationale for category: It is an established fact in literature and experience elsewhere that ha-zardous substances affect animal and human health.
Recommended research: No primary research is required. Recommended management actions: Develop capacity for hazardous waste management. Minim-ize generation of hazardous material use; reuse and recycle hazardous material; proper storage, transfer and disposal of hazardous waste material. Formulation of relevant hazardous waste man-agement regulations, readiness to respond to hazardous waste spills Recommended monitoring: Heavy metal analysis in the food chain, sampling of primary raw ma-terial inputs, Oil and chemical spills, water quality for traces of heavy metals Measurable indicator name (what): Number of spill incidences, heavy met-al levels in the food chain, presence and level of heavy metals in water and soils
Order 1, 2 or 3 1
Exis
ting
Existing monitoring (relevant ongoing monitoring or available data sets): NEMA, DWRM Area covered (by ongoing monitoring or available data sets): ?? Data storage (format and place where data sets are stored): NEMA, DWD Responsibility (institution and person currently responsible for existing monitoring data sets): NEMA, UWA, DWRM, NARO, DLGs
Why (key question(s) which the indicator helps to answer): Where and in what quantities are the hazardous substances contamination in mammals? Current trend (upward, stable or downward): Unknown How (method, sampling and analysis, quality assurance): Analysis of hazardous substances in animal and plant tissue, water, and soil. Where (location, geo-referenced): Albertine Graben When (frequency): Quarterly By whom (which institution will collect the indicator data): NEMA, UWA, DWRM, NARO, DLGs Lead agency (institution and person responsible for calculating and communicating the indicator): NEMA Presentation (most effective forms of presentation: graphs, maps, narratives etc.): Graphs, maps, narratives End user(s) (who will use the indicator for what purpose): All stakeholders Financial assessment (approximate costs from data collection to indicator): Comments: Literature:
NINA Report 706
37
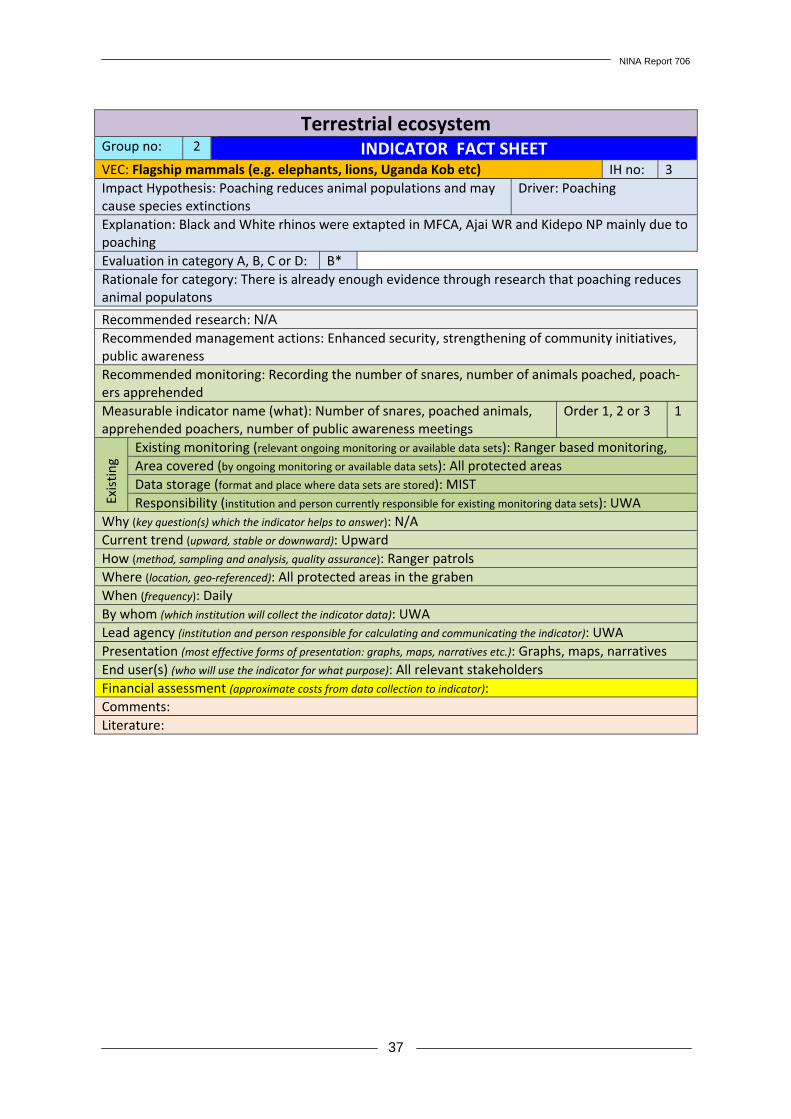
Terrestrial ecosystem Group no: 2 INDICATOR FACT SHEETVEC: Flagship mammals (e.g. elephants, lions, Uganda Kob etc) IH no: 3 Impact Hypothesis: Poaching reduces animal populations and may cause species extinctions
Driver: Poaching
Explanation: Black and White rhinos were extapted in MFCA, Ajai WR and Kidepo NP mainly due to poaching Evaluation in category A, B, C or D: B* Rationale for category: There is already enough evidence through research that poaching reduces animal populatons
Recommended research: N/A Recommended management actions: Enhanced security, strengthening of community initiatives, public awareness Recommended monitoring: Recording the number of snares, number of animals poached, poach-ers apprehended Measurable indicator name (what): Number of snares, poached animals, apprehended poachers, number of public awareness meetings
Order 1, 2 or 3 1
Exis
ting
Existing monitoring (relevant ongoing monitoring or available data sets): Ranger based monitoring, Area covered (by ongoing monitoring or available data sets): All protected areas Data storage (format and place where data sets are stored): MIST Responsibility (institution and person currently responsible for existing monitoring data sets): UWA
Why (key question(s) which the indicator helps to answer): N/A Current trend (upward, stable or downward): Upward How (method, sampling and analysis, quality assurance): Ranger patrols Where (location, geo-referenced): All protected areas in the graben When (frequency): Daily By whom (which institution will collect the indicator data): UWA Lead agency (institution and person responsible for calculating and communicating the indicator): UWA Presentation (most effective forms of presentation: graphs, maps, narratives etc.): Graphs, maps, narratives End user(s) (who will use the indicator for what purpose): All relevant stakeholders Financial assessment (approximate costs from data collection to indicator): Comments: Literature:

NINA Report 706
38
Terrestrial ecosystem Group no: 2 INDICATOR FACT SHEETVEC: Flagship mammals (e.g. elephants, lions, Uganda Kob etc) IH no: 4 Impact Hypothesis: Human influx increases human-wildlife con-flicts, poaching and illegal trade in wildlife and wildlife products
Driver: Human influx
Explanation: People have bought land around several petroleum development areas e.g. around Kabwoya WR, QEPA prospecting to be compensated at the time of petroleum production. Many people come to the petroleum areas seeking for gainful employment. Evaluation in category A, B, C or D: C* Rationale for category: Human presence is linked to illegal activities that have often contributed to wildlife population reduction
Recommended research: Human population, animal population, incidences of poaching, Recommended management actions: Enhanced security , strengthening of community initiatives, sensitization Recommended monitoring: Human and animal population changes, number of snares, number of animals poached, poachers apprehended Measurable indicator name (what): Human and animal demography, num-ber of snares, number of animals poached, poachers apprehended, num-ber of human-wildlife conflicts reported
Order 1, 2 or 3
Exis
ting
Existing monitoring (relevant ongoing monitoring or available data sets): QENP, Kabwoya WR Area covered (by ongoing monitoring or available data sets): QENP, Kabwoya WR Data storage (format and place where data sets are stored): MIST, UWA, WCS Responsibility (institution and person currently responsible for existing monitoring data sets): UWA
Why (key question(s) which the indicator helps to answer): Does human influx increase poaching of wildlife, trade in wildlife products, human-wildlife conflicts and enchroachment on the park? Current trend (upward, stable or downward): Upward How (method, sampling and analysis, quality assurance): Population census in and around protected areas, evaluation of rield reports and MIST data Where (location, geo-referenced): PAs in the Albertine graben When (frequency): Bi-annual By whom (which institution will collect the indicator data): LC1, UWA, UBOS Lead agency (institution and person responsible for calculating and communicating the indicator): UBOS Presentation (most effective forms of presentation: graphs, maps, narratives etc.): Graphs, maps, narratives End user(s) (who will use the indicator for what purpose): UBOS, UWA, Researchers, Police and other inter-ested institutions Financial assessment (approximate costs from data collection to indicator): Comments: Literature:
NINA Report 706
39
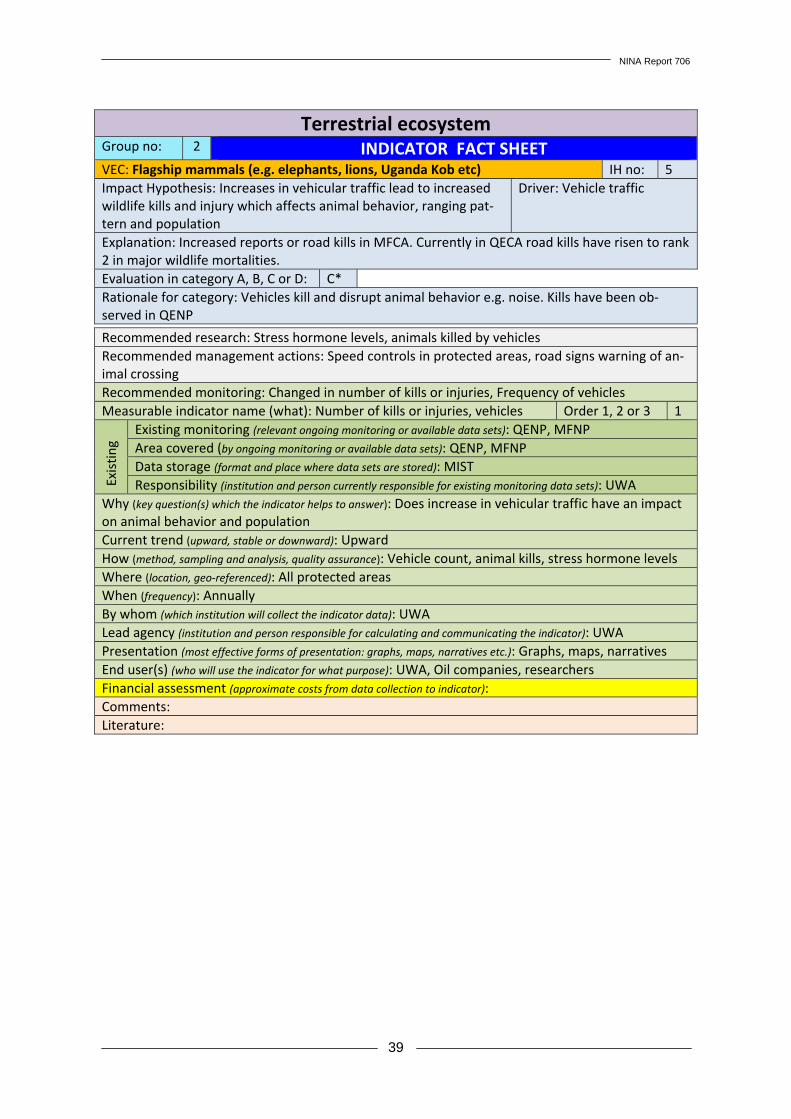
Terrestrial ecosystem Group no: 2 INDICATOR FACT SHEETVEC: Flagship mammals (e.g. elephants, lions, Uganda Kob etc) IH no: 5 Impact Hypothesis: Increases in vehicular traffic lead to increased wildlife kills and injury which affects animal behavior, ranging pat-tern and population
Driver: Vehicle traffic
Explanation: Increased reports or road kills in MFCA. Currently in QECA road kills have risen to rank 2 in major wildlife mortalities. Evaluation in category A, B, C or D: C* Rationale for category: Vehicles kill and disrupt animal behavior e.g. noise. Kills have been ob-served in QENP
Recommended research: Stress hormone levels, animals killed by vehicles Recommended management actions: Speed controls in protected areas, road signs warning of an-imal crossing Recommended monitoring: Changed in number of kills or injuries, Frequency of vehicles Measurable indicator name (what): Number of kills or injuries, vehicles Order 1, 2 or 3 1
Exis
ting
Existing monitoring (relevant ongoing monitoring or available data sets): QENP, MFNP Area covered (by ongoing monitoring or available data sets): QENP, MFNP Data storage (format and place where data sets are stored): MIST Responsibility (institution and person currently responsible for existing monitoring data sets): UWA
Why (key question(s) which the indicator helps to answer): Does increase in vehicular traffic have an impact on animal behavior and population Current trend (upward, stable or downward): Upward How (method, sampling and analysis, quality assurance): Vehicle count, animal kills, stress hormone levels Where (location, geo-referenced): All protected areas When (frequency): Annually By whom (which institution will collect the indicator data): UWA Lead agency (institution and person responsible for calculating and communicating the indicator): UWA Presentation (most effective forms of presentation: graphs, maps, narratives etc.): Graphs, maps, narratives End user(s) (who will use the indicator for what purpose): UWA, Oil companies, researchers Financial assessment (approximate costs from data collection to indicator): Comments: Literature:
NINA Report 706
40
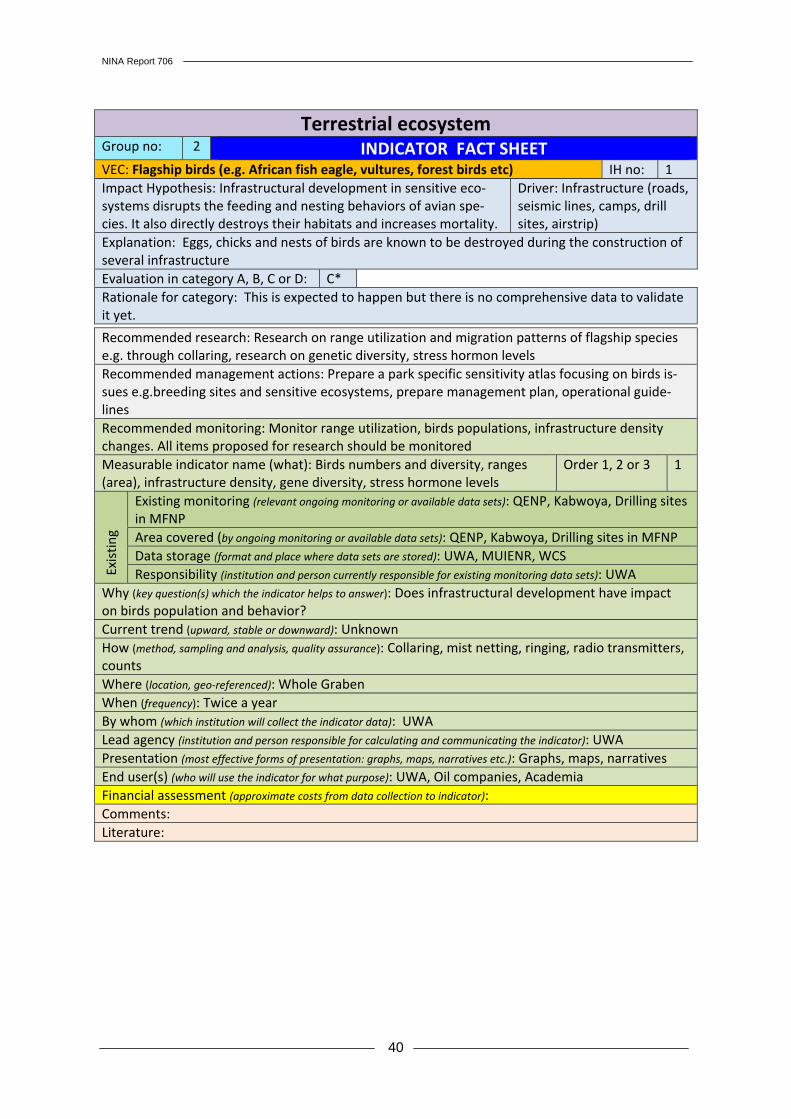
Terrestrial ecosystem Group no: 2 INDICATOR FACT SHEETVEC: Flagship birds (e.g. African fish eagle, vultures, forest birds etc) IH no: 1 Impact Hypothesis: Infrastructural development in sensitive eco-systems disrupts the feeding and nesting behaviors of avian spe-cies. It also directly destroys their habitats and increases mortality.
Driver: Infrastructure (roads, seismic lines, camps, drill sites, airstrip)
Explanation: Eggs, chicks and nests of birds are known to be destroyed during the construction of several infrastructure Evaluation in category A, B, C or D: C* Rationale for category: This is expected to happen but there is no comprehensive data to validate it yet.
Recommended research: Research on range utilization and migration patterns of flagship species e.g. through collaring, research on genetic diversity, stress hormon levels Recommended management actions: Prepare a park specific sensitivity atlas focusing on birds is-sues e.g.breeding sites and sensitive ecosystems, prepare management plan, operational guide-lines Recommended monitoring: Monitor range utilization, birds populations, infrastructure density changes. All items proposed for research should be monitored Measurable indicator name (what): Birds numbers and diversity, ranges (area), infrastructure density, gene diversity, stress hormone levels
Order 1, 2 or 3 1
Exis
ting
Existing monitoring (relevant ongoing monitoring or available data sets): QENP, Kabwoya, Drilling sites in MFNP Area covered (by ongoing monitoring or available data sets): QENP, Kabwoya, Drilling sites in MFNP Data storage (format and place where data sets are stored): UWA, MUIENR, WCS Responsibility (institution and person currently responsible for existing monitoring data sets): UWA
Why (key question(s) which the indicator helps to answer): Does infrastructural development have impact on birds population and behavior? Current trend (upward, stable or downward): Unknown How (method, sampling and analysis, quality assurance): Collaring, mist netting, ringing, radio transmitters, counts Where (location, geo-referenced): Whole Graben When (frequency): Twice a year By whom (which institution will collect the indicator data): UWA Lead agency (institution and person responsible for calculating and communicating the indicator): UWA Presentation (most effective forms of presentation: graphs, maps, narratives etc.): Graphs, maps, narratives End user(s) (who will use the indicator for what purpose): UWA, Oil companies, Academia Financial assessment (approximate costs from data collection to indicator): Comments: Literature:
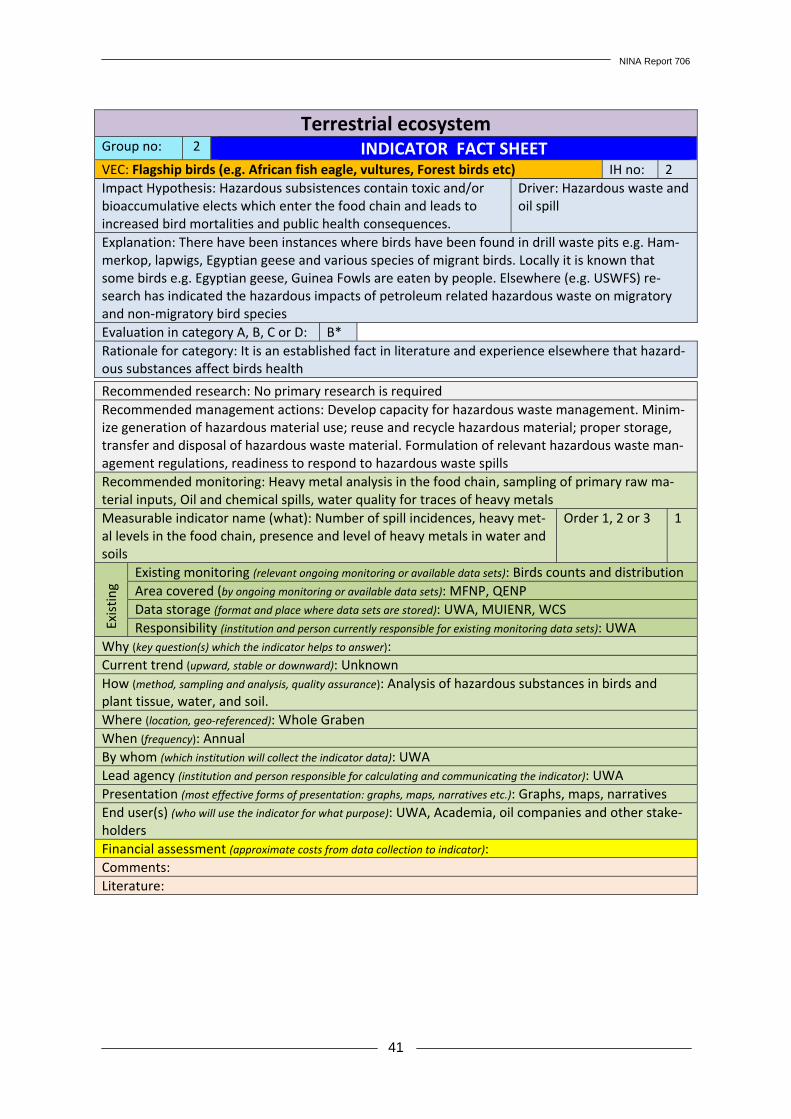
NINA Report 706
41
Terrestrial ecosystem Group no: 2 INDICATOR FACT SHEETVEC: Flagship birds (e.g. African fish eagle, vultures, Forest birds etc) IH no: 2 Impact Hypothesis: Hazardous subsistences contain toxic and/or bioaccumulative elects which enter the food chain and leads to increased bird mortalities and public health consequences.
Driver: Hazardous waste and oil spill
Explanation: There have been instances where birds have been found in drill waste pits e.g. Ham-merkop, lapwigs, Egyptian geese and various species of migrant birds. Locally it is known that some birds e.g. Egyptian geese, Guinea Fowls are eaten by people. Elsewhere (e.g. USWFS) re-search has indicated the hazardous impacts of petroleum related hazardous waste on migratory and non-migratory bird species Evaluation in category A, B, C or D: B* Rationale for category: It is an established fact in literature and experience elsewhere that hazard-ous substances affect birds health
Recommended research: No primary research is required Recommended management actions: Develop capacity for hazardous waste management. Minim-ize generation of hazardous material use; reuse and recycle hazardous material; proper storage, transfer and disposal of hazardous waste material. Formulation of relevant hazardous waste man-agement regulations, readiness to respond to hazardous waste spills Recommended monitoring: Heavy metal analysis in the food chain, sampling of primary raw ma-terial inputs, Oil and chemical spills, water quality for traces of heavy metals Measurable indicator name (what): Number of spill incidences, heavy met-al levels in the food chain, presence and level of heavy metals in water and soils
Order 1, 2 or 3 1
Exis
ting
Existing monitoring (relevant ongoing monitoring or available data sets): Birds counts and distribution Area covered (by ongoing monitoring or available data sets): MFNP, QENP Data storage (format and place where data sets are stored): UWA, MUIENR, WCS Responsibility (institution and person currently responsible for existing monitoring data sets): UWA
Why (key question(s) which the indicator helps to answer): Current trend (upward, stable or downward): Unknown How (method, sampling and analysis, quality assurance): Analysis of hazardous substances in birds and plant tissue, water, and soil. Where (location, geo-referenced): Whole Graben When (frequency): Annual By whom (which institution will collect the indicator data): UWA Lead agency (institution and person responsible for calculating and communicating the indicator): UWA Presentation (most effective forms of presentation: graphs, maps, narratives etc.): Graphs, maps, narratives End user(s) (who will use the indicator for what purpose): UWA, Academia, oil companies and other stake-holders Financial assessment (approximate costs from data collection to indicator): Comments: Literature:
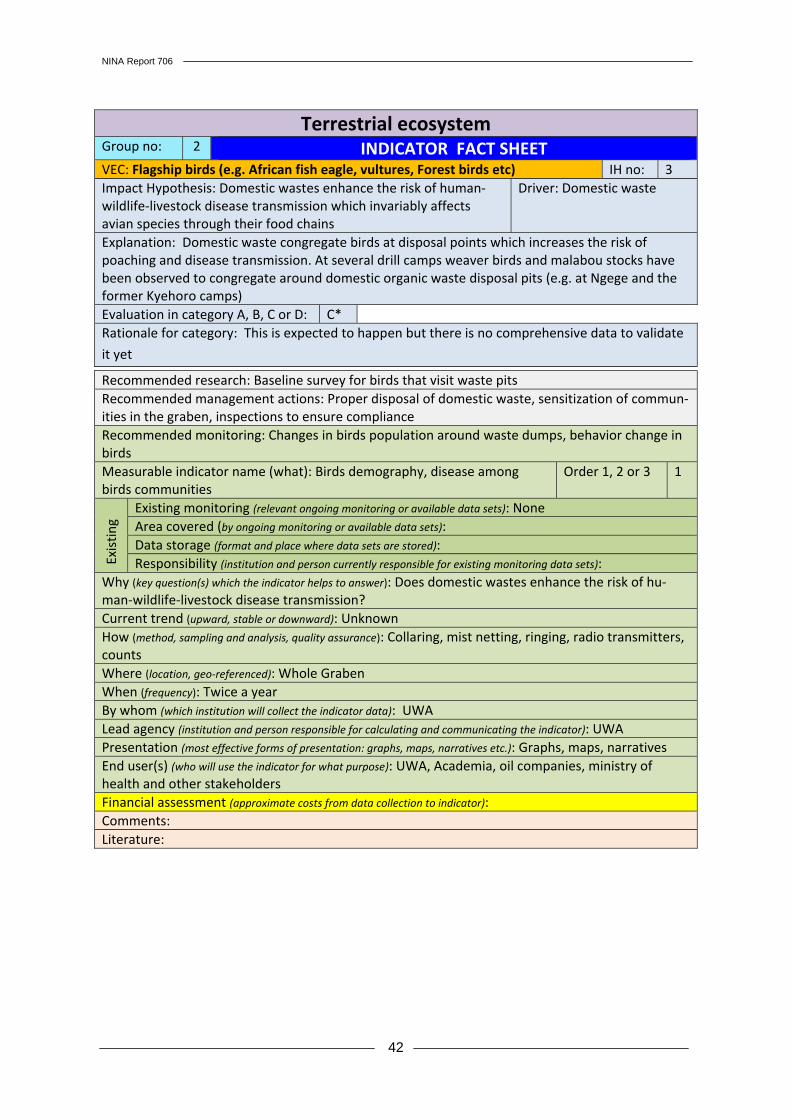
NINA Report 706
42
Terrestrial ecosystem Group no: 2 INDICATOR FACT SHEETVEC: Flagship birds (e.g. African fish eagle, vultures, Forest birds etc) IH no: 3 Impact Hypothesis: Domestic wastes enhance the risk of human-wildlife-livestock disease transmission which invariably affects avian species through their food chains
Driver: Domestic waste
Explanation: Domestic waste congregate birds at disposal points which increases the risk of poaching and disease transmission. At several drill camps weaver birds and malabou stocks have been observed to congregate around domestic organic waste disposal pits (e.g. at Ngege and the former Kyehoro camps) Evaluation in category A, B, C or D: C* Rationale for category: This is expected to happen but there is no comprehensive data to validate
it yet
Recommended research: Baseline survey for birds that visit waste pits Recommended management actions: Proper disposal of domestic waste, sensitization of commun-ities in the graben, inspections to ensure compliance Recommended monitoring: Changes in birds population around waste dumps, behavior change in birds Measurable indicator name (what): Birds demography, disease among birds communities
Order 1, 2 or 3 1
Exis
ting
Existing monitoring (relevant ongoing monitoring or available data sets): None Area covered (by ongoing monitoring or available data sets): Data storage (format and place where data sets are stored): Responsibility (institution and person currently responsible for existing monitoring data sets):
Why (key question(s) which the indicator helps to answer): Does domestic wastes enhance the risk of hu-man-wildlife-livestock disease transmission? Current trend (upward, stable or downward): Unknown How (method, sampling and analysis, quality assurance): Collaring, mist netting, ringing, radio transmitters, counts Where (location, geo-referenced): Whole Graben When (frequency): Twice a year By whom (which institution will collect the indicator data): UWA Lead agency (institution and person responsible for calculating and communicating the indicator): UWA Presentation (most effective forms of presentation: graphs, maps, narratives etc.): Graphs, maps, narratives End user(s) (who will use the indicator for what purpose): UWA, Academia, oil companies, ministry of health and other stakeholders Financial assessment (approximate costs from data collection to indicator): Comments: Literature:
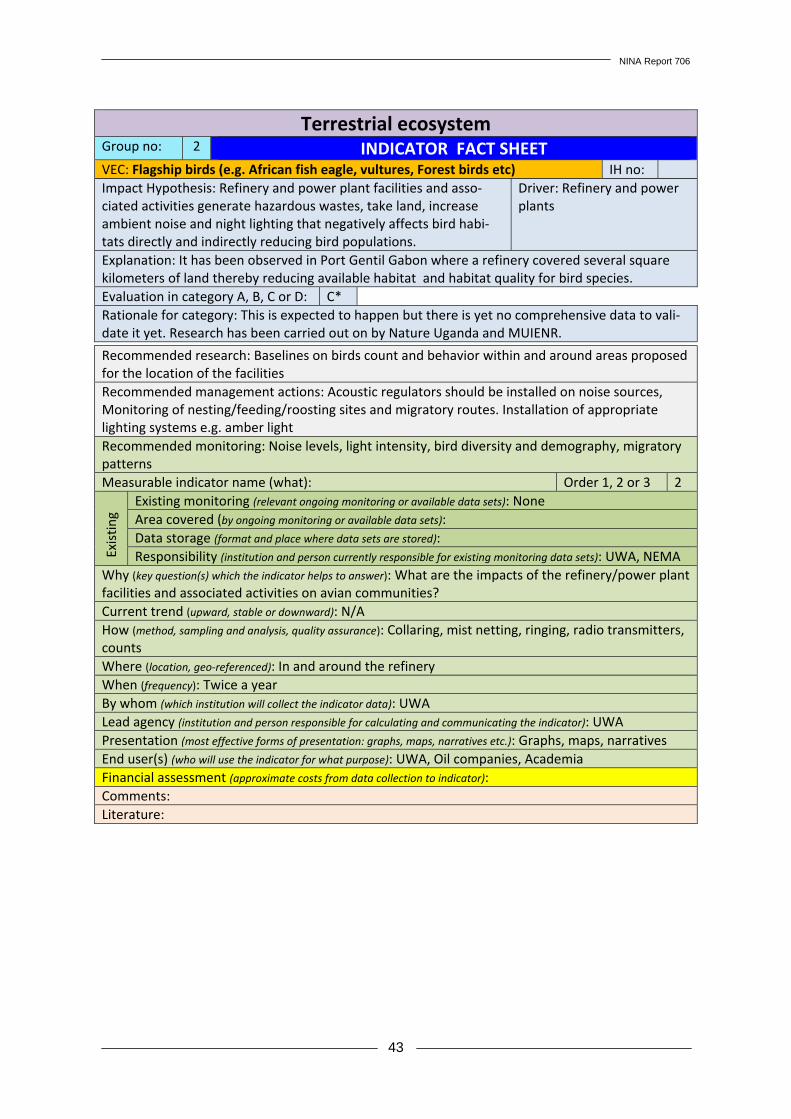
NINA Report 706
43
Terrestrial ecosystem Group no: 2 INDICATOR FACT SHEETVEC: Flagship birds (e.g. African fish eagle, vultures, Forest birds etc) IH no: Impact Hypothesis: Refinery and power plant facilities and asso-ciated activities generate hazardous wastes, take land, increase ambient noise and night lighting that negatively affects bird habi-tats directly and indirectly reducing bird populations.
Driver: Refinery and power plants
Explanation: It has been observed in Port Gentil Gabon where a refinery covered several square kilometers of land thereby reducing available habitat and habitat quality for bird species. Evaluation in category A, B, C or D: C* Rationale for category: This is expected to happen but there is yet no comprehensive data to vali-date it yet. Research has been carried out on by Nature Uganda and MUIENR.
Recommended research: Baselines on birds count and behavior within and around areas proposed for the location of the facilities Recommended management actions: Acoustic regulators should be installed on noise sources, Monitoring of nesting/feeding/roosting sites and migratory routes. Installation of appropriate lighting systems e.g. amber light Recommended monitoring: Noise levels, light intensity, bird diversity and demography, migratory patterns Measurable indicator name (what): Order 1, 2 or 3 2
Exis
ting
Existing monitoring (relevant ongoing monitoring or available data sets): None Area covered (by ongoing monitoring or available data sets): Data storage (format and place where data sets are stored): Responsibility (institution and person currently responsible for existing monitoring data sets): UWA, NEMA
Why (key question(s) which the indicator helps to answer): What are the impacts of the refinery/power plant facilities and associated activities on avian communities? Current trend (upward, stable or downward): N/A How (method, sampling and analysis, quality assurance): Collaring, mist netting, ringing, radio transmitters, counts Where (location, geo-referenced): In and around the refinery When (frequency): Twice a year By whom (which institution will collect the indicator data): UWA Lead agency (institution and person responsible for calculating and communicating the indicator): UWA Presentation (most effective forms of presentation: graphs, maps, narratives etc.): Graphs, maps, narratives End user(s) (who will use the indicator for what purpose): UWA, Oil companies, Academia Financial assessment (approximate costs from data collection to indicator): Comments: Literature:
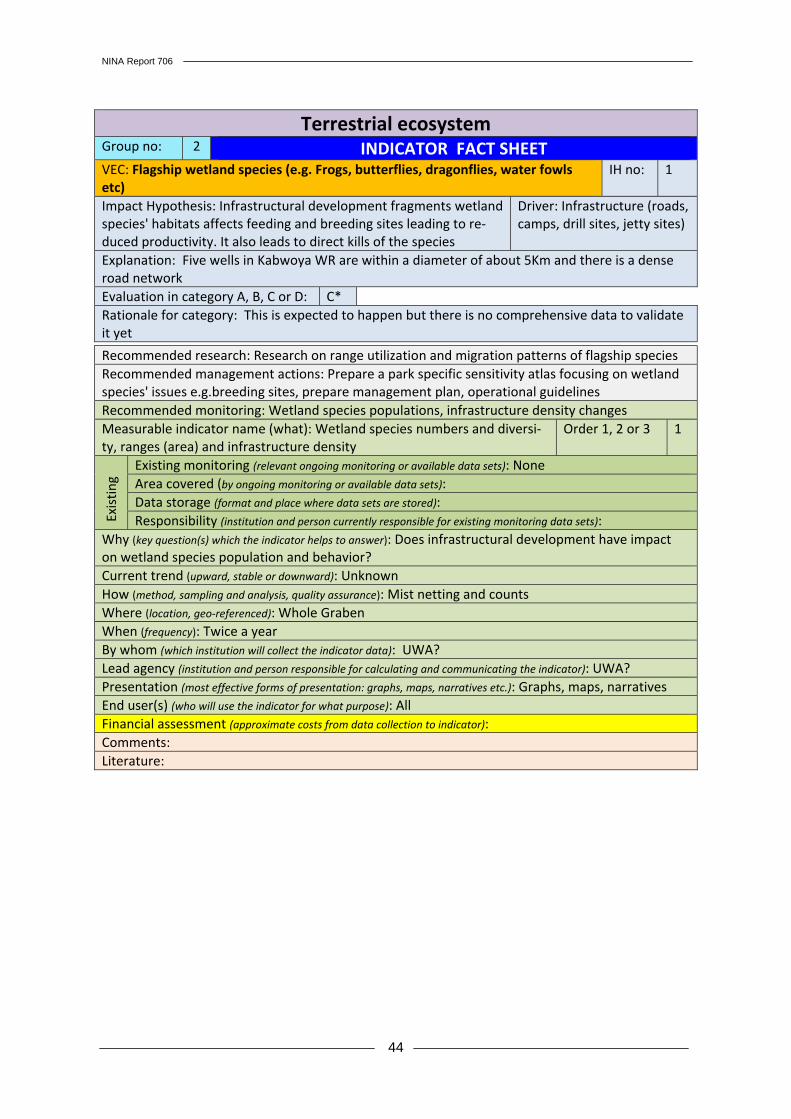
NINA Report 706
44
Terrestrial ecosystem Group no: 2 INDICATOR FACT SHEETVEC: Flagship wetland species (e.g. Frogs, butterflies, dragonflies, water fowls etc)
IH no: 1
Impact Hypothesis: Infrastructural development fragments wetland species' habitats affects feeding and breeding sites leading to re-duced productivity. It also leads to direct kills of the species
Driver: Infrastructure (roads, camps, drill sites, jetty sites)
Explanation: Five wells in Kabwoya WR are within a diameter of about 5Km and there is a dense road network Evaluation in category A, B, C or D: C* Rationale for category: This is expected to happen but there is no comprehensive data to validate it yet
Recommended research: Research on range utilization and migration patterns of flagship species Recommended management actions: Prepare a park specific sensitivity atlas focusing on wetland species' issues e.g.breeding sites, prepare management plan, operational guidelines Recommended monitoring: Wetland species populations, infrastructure density changes Measurable indicator name (what): Wetland species numbers and diversi-ty, ranges (area) and infrastructure density
Order 1, 2 or 3 1
Exis
ting
Existing monitoring (relevant ongoing monitoring or available data sets): None Area covered (by ongoing monitoring or available data sets): Data storage (format and place where data sets are stored): Responsibility (institution and person currently responsible for existing monitoring data sets):
Why (key question(s) which the indicator helps to answer): Does infrastructural development have impact on wetland species population and behavior? Current trend (upward, stable or downward): Unknown How (method, sampling and analysis, quality assurance): Mist netting and counts Where (location, geo-referenced): Whole Graben When (frequency): Twice a year By whom (which institution will collect the indicator data): UWA? Lead agency (institution and person responsible for calculating and communicating the indicator): UWA? Presentation (most effective forms of presentation: graphs, maps, narratives etc.): Graphs, maps, narratives End user(s) (who will use the indicator for what purpose): All Financial assessment (approximate costs from data collection to indicator): Comments: Literature:
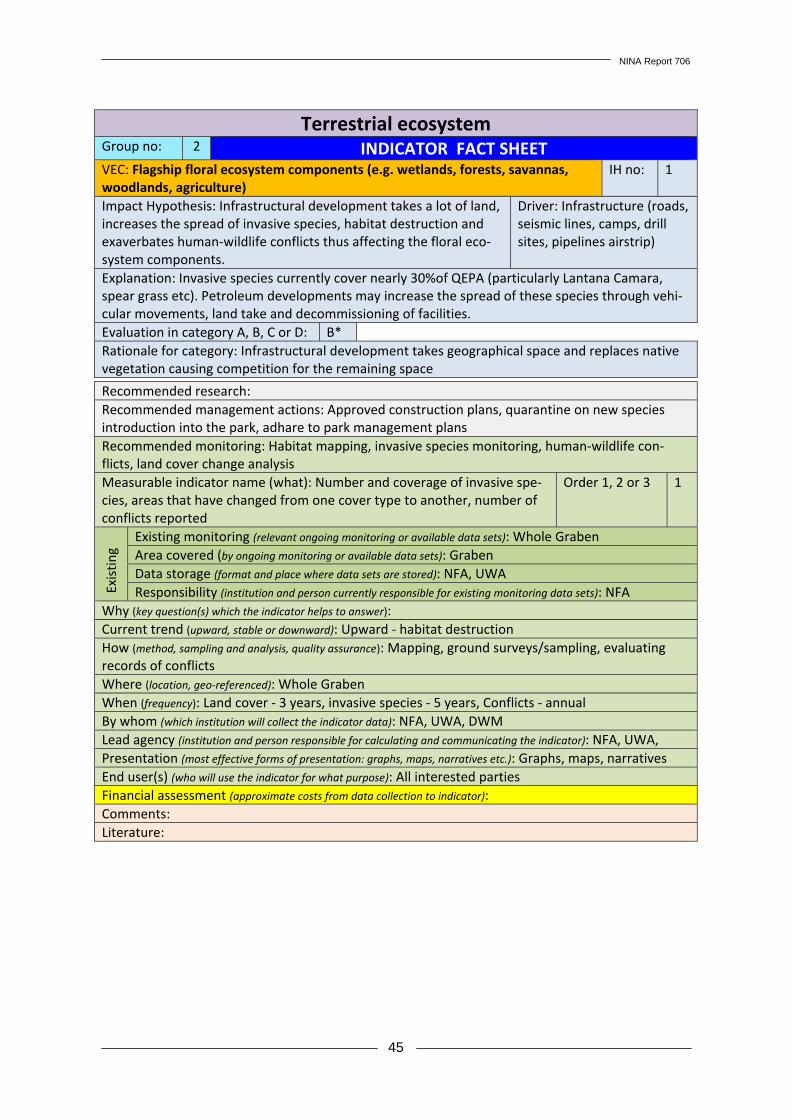
NINA Report 706
45
Terrestrial ecosystem Group no: 2 INDICATOR FACT SHEETVEC: Flagship floral ecosystem components (e.g. wetlands, forests, savannas, woodlands, agriculture)
IH no: 1
Impact Hypothesis: Infrastructural development takes a lot of land, increases the spread of invasive species, habitat destruction and exaverbates human-wildlife conflicts thus affecting the floral eco-system components.
Driver: Infrastructure (roads, seismic lines, camps, drill sites, pipelines airstrip)
Explanation: Invasive species currently cover nearly 30%of QEPA (particularly Lantana Camara, spear grass etc). Petroleum developments may increase the spread of these species through vehi-cular movements, land take and decommissioning of facilities. Evaluation in category A, B, C or D: B* Rationale for category: Infrastructural development takes geographical space and replaces native vegetation causing competition for the remaining space
Recommended research: Recommended management actions: Approved construction plans, quarantine on new species introduction into the park, adhare to park management plans Recommended monitoring: Habitat mapping, invasive species monitoring, human-wildlife con-flicts, land cover change analysis Measurable indicator name (what): Number and coverage of invasive spe-cies, areas that have changed from one cover type to another, number of conflicts reported
Order 1, 2 or 3 1
Exis
ting
Existing monitoring (relevant ongoing monitoring or available data sets): Whole Graben Area covered (by ongoing monitoring or available data sets): Graben Data storage (format and place where data sets are stored): NFA, UWA Responsibility (institution and person currently responsible for existing monitoring data sets): NFA
Why (key question(s) which the indicator helps to answer): Current trend (upward, stable or downward): Upward - habitat destruction How (method, sampling and analysis, quality assurance): Mapping, ground surveys/sampling, evaluating records of conflicts Where (location, geo-referenced): Whole Graben When (frequency): Land cover - 3 years, invasive species - 5 years, Conflicts - annual By whom (which institution will collect the indicator data): NFA, UWA, DWM Lead agency (institution and person responsible for calculating and communicating the indicator): NFA, UWA, Presentation (most effective forms of presentation: graphs, maps, narratives etc.): Graphs, maps, narratives End user(s) (who will use the indicator for what purpose): All interested parties Financial assessment (approximate costs from data collection to indicator): Comments: Literature:
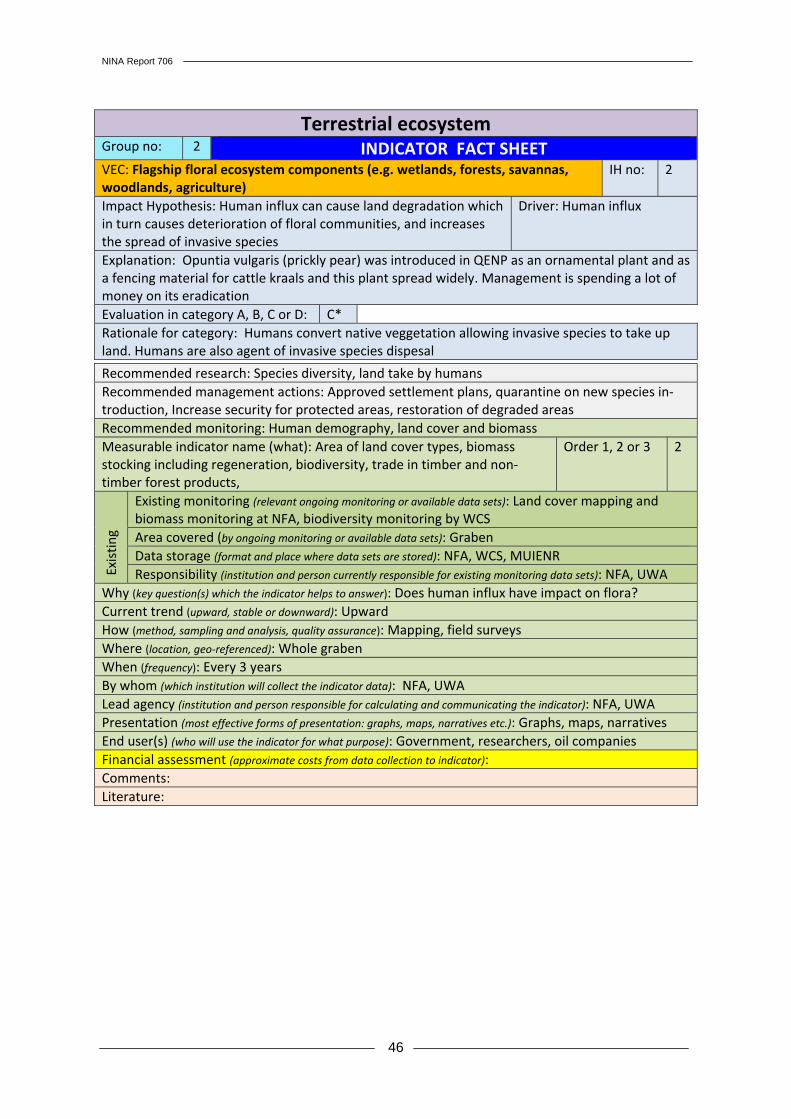
NINA Report 706
46
Terrestrial ecosystem Group no: 2 INDICATOR FACT SHEETVEC: Flagship floral ecosystem components (e.g. wetlands, forests, savannas, woodlands, agriculture)
IH no: 2
Impact Hypothesis: Human influx can cause land degradation which in turn causes deterioration of floral communities, and increases the spread of invasive species
Driver: Human influx
Explanation: Opuntia vulgaris (prickly pear) was introduced in QENP as an ornamental plant and as a fencing material for cattle kraals and this plant spread widely. Management is spending a lot of money on its eradication Evaluation in category A, B, C or D: C* Rationale for category: Humans convert native veggetation allowing invasive species to take up land. Humans are also agent of invasive species dispesal
Recommended research: Species diversity, land take by humans Recommended management actions: Approved settlement plans, quarantine on new species in-troduction, Increase security for protected areas, restoration of degraded areas Recommended monitoring: Human demography, land cover and biomass Measurable indicator name (what): Area of land cover types, biomass stocking including regeneration, biodiversity, trade in timber and non-timber forest products,
Order 1, 2 or 3 2
Exis
ting
Existing monitoring (relevant ongoing monitoring or available data sets): Land cover mapping and biomass monitoring at NFA, biodiversity monitoring by WCS Area covered (by ongoing monitoring or available data sets): Graben Data storage (format and place where data sets are stored): NFA, WCS, MUIENR Responsibility (institution and person currently responsible for existing monitoring data sets): NFA, UWA
Why (key question(s) which the indicator helps to answer): Does human influx have impact on flora? Current trend (upward, stable or downward): Upward How (method, sampling and analysis, quality assurance): Mapping, field surveys Where (location, geo-referenced): Whole graben When (frequency): Every 3 years By whom (which institution will collect the indicator data): NFA, UWA Lead agency (institution and person responsible for calculating and communicating the indicator): NFA, UWA Presentation (most effective forms of presentation: graphs, maps, narratives etc.): Graphs, maps, narratives End user(s) (who will use the indicator for what purpose): Government, researchers, oil companies Financial assessment (approximate costs from data collection to indicator): Comments: Literature:
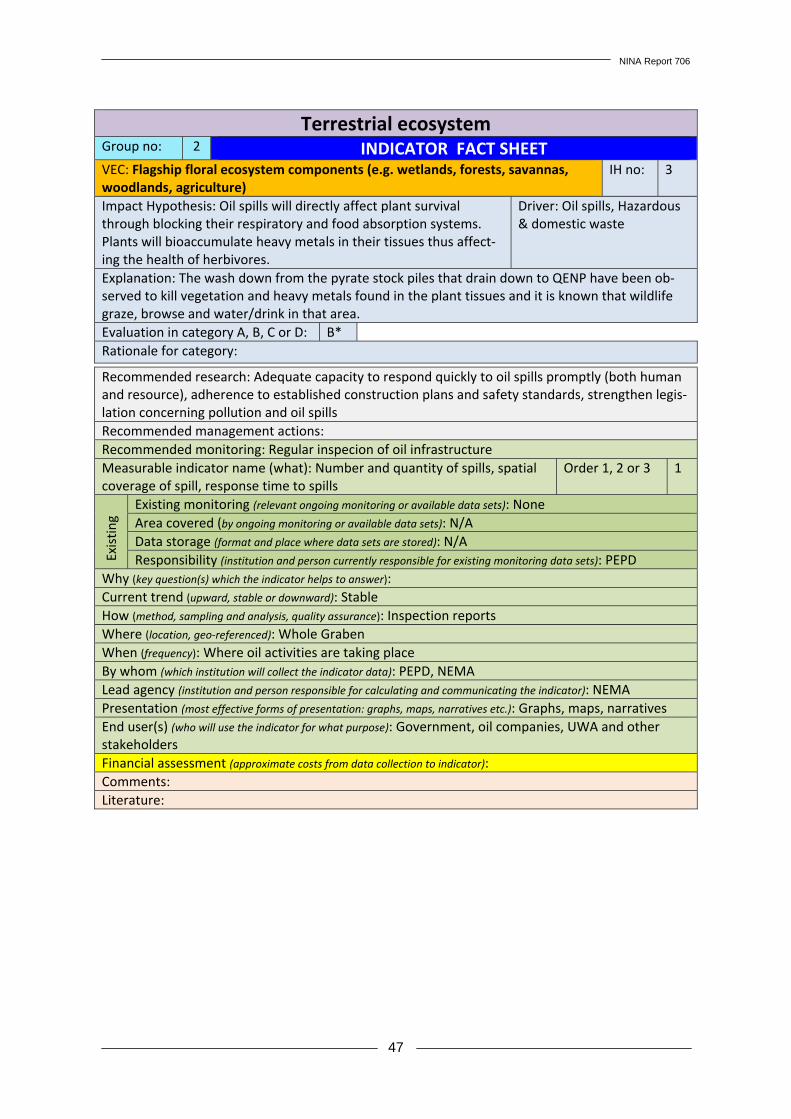
NINA Report 706
47
Terrestrial ecosystem Group no: 2 INDICATOR FACT SHEETVEC: Flagship floral ecosystem components (e.g. wetlands, forests, savannas, woodlands, agriculture)
IH no: 3
Impact Hypothesis: Oil spills will directly affect plant survival through blocking their respiratory and food absorption systems. Plants will bioaccumulate heavy metals in their tissues thus affect-ing the health of herbivores.
Driver: Oil spills, Hazardous & domestic waste
Explanation: The wash down from the pyrate stock piles that drain down to QENP have been ob-served to kill vegetation and heavy metals found in the plant tissues and it is known that wildlife graze, browse and water/drink in that area. Evaluation in category A, B, C or D: B* Rationale for category:
Recommended research: Adequate capacity to respond quickly to oil spills promptly (both human and resource), adherence to established construction plans and safety standards, strengthen legis-lation concerning pollution and oil spills Recommended management actions: Recommended monitoring: Regular inspecion of oil infrastructure Measurable indicator name (what): Number and quantity of spills, spatial coverage of spill, response time to spills
Order 1, 2 or 3 1
Exis
ting
Existing monitoring (relevant ongoing monitoring or available data sets): None Area covered (by ongoing monitoring or available data sets): N/A Data storage (format and place where data sets are stored): N/A Responsibility (institution and person currently responsible for existing monitoring data sets): PEPD
Why (key question(s) which the indicator helps to answer): Current trend (upward, stable or downward): Stable How (method, sampling and analysis, quality assurance): Inspection reports Where (location, geo-referenced): Whole Graben When (frequency): Where oil activities are taking place By whom (which institution will collect the indicator data): PEPD, NEMA Lead agency (institution and person responsible for calculating and communicating the indicator): NEMA Presentation (most effective forms of presentation: graphs, maps, narratives etc.): Graphs, maps, narratives End user(s) (who will use the indicator for what purpose): Government, oil companies, UWA and other stakeholders Financial assessment (approximate costs from data collection to indicator): Comments: Literature:
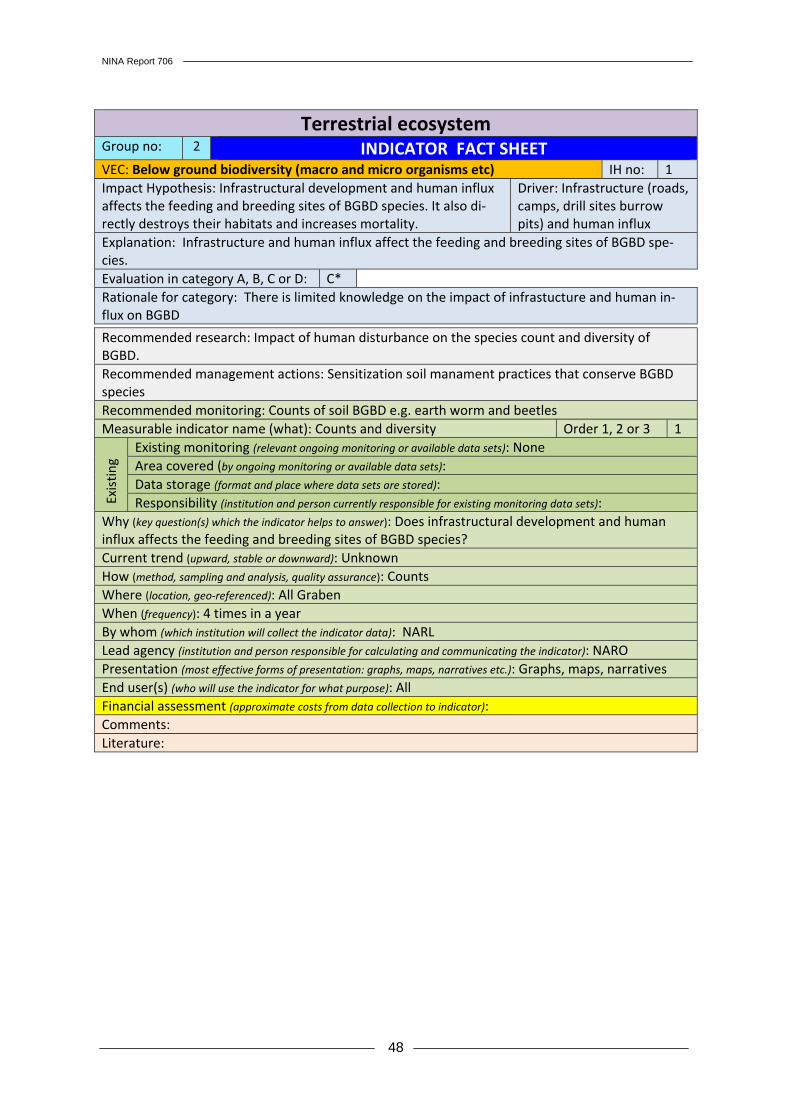
NINA Report 706
48
Terrestrial ecosystem Group no: 2 INDICATOR FACT SHEETVEC: Below ground biodiversity (macro and micro organisms etc) IH no: 1 Impact Hypothesis: Infrastructural development and human influx affects the feeding and breeding sites of BGBD species. It also di-rectly destroys their habitats and increases mortality.
Driver: Infrastructure (roads, camps, drill sites burrow pits) and human influx
Explanation: Infrastructure and human influx affect the feeding and breeding sites of BGBD spe-cies. Evaluation in category A, B, C or D: C* Rationale for category: There is limited knowledge on the impact of infrastucture and human in-flux on BGBD
Recommended research: Impact of human disturbance on the species count and diversity of BGBD. Recommended management actions: Sensitization soil manament practices that conserve BGBD species Recommended monitoring: Counts of soil BGBD e.g. earth worm and beetles Measurable indicator name (what): Counts and diversity Order 1, 2 or 3 1
Exis
ting
Existing monitoring (relevant ongoing monitoring or available data sets): None Area covered (by ongoing monitoring or available data sets): Data storage (format and place where data sets are stored): Responsibility (institution and person currently responsible for existing monitoring data sets):
Why (key question(s) which the indicator helps to answer): Does infrastructural development and human influx affects the feeding and breeding sites of BGBD species? Current trend (upward, stable or downward): Unknown How (method, sampling and analysis, quality assurance): Counts Where (location, geo-referenced): All Graben When (frequency): 4 times in a year By whom (which institution will collect the indicator data): NARL Lead agency (institution and person responsible for calculating and communicating the indicator): NARO Presentation (most effective forms of presentation: graphs, maps, narratives etc.): Graphs, maps, narratives End user(s) (who will use the indicator for what purpose): All Financial assessment (approximate costs from data collection to indicator): Comments: Literature:
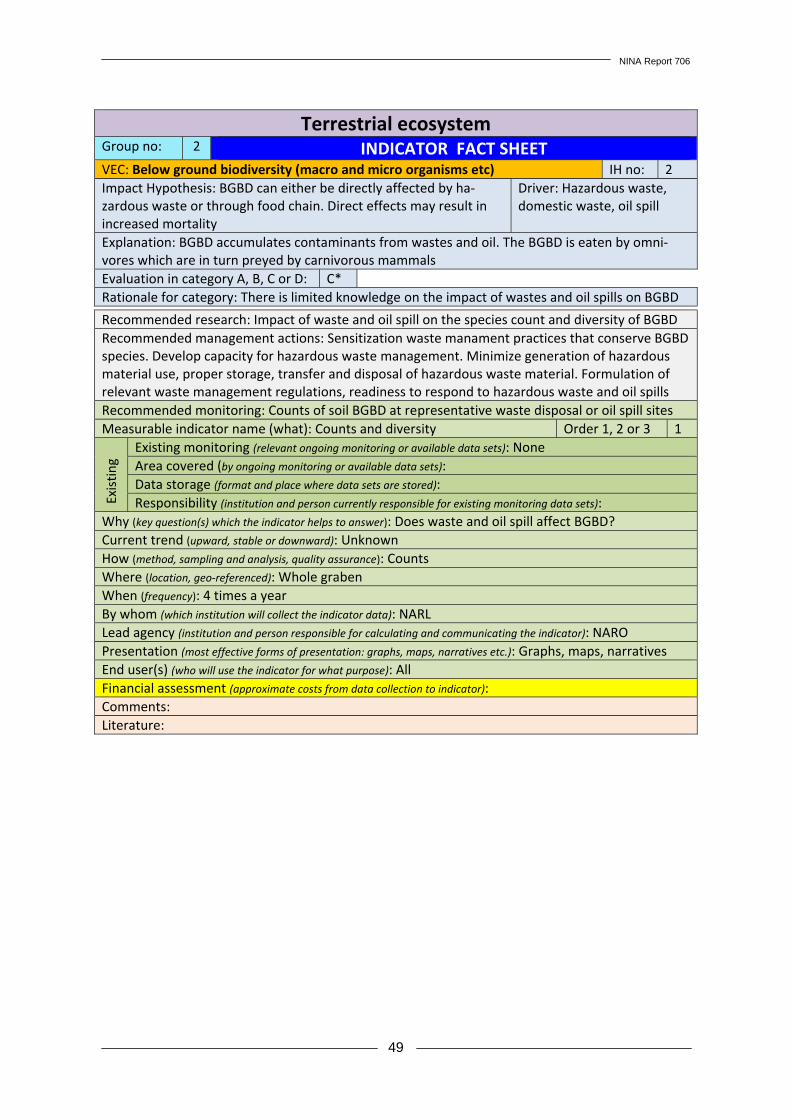
NINA Report 706
49
Terrestrial ecosystem Group no: 2 INDICATOR FACT SHEETVEC: Below ground biodiversity (macro and micro organisms etc) IH no: 2 Impact Hypothesis: BGBD can either be directly affected by ha-zardous waste or through food chain. Direct effects may result in increased mortality
Driver: Hazardous waste, domestic waste, oil spill
Explanation: BGBD accumulates contaminants from wastes and oil. The BGBD is eaten by omni-vores which are in turn preyed by carnivorous mammals Evaluation in category A, B, C or D: C* Rationale for category: There is limited knowledge on the impact of wastes and oil spills on BGBD
Recommended research: Impact of waste and oil spill on the species count and diversity of BGBD Recommended management actions: Sensitization waste manament practices that conserve BGBD species. Develop capacity for hazardous waste management. Minimize generation of hazardous material use, proper storage, transfer and disposal of hazardous waste material. Formulation of relevant waste management regulations, readiness to respond to hazardous waste and oil spills Recommended monitoring: Counts of soil BGBD at representative waste disposal or oil spill sites Measurable indicator name (what): Counts and diversity Order 1, 2 or 3 1
Exis
ting
Existing monitoring (relevant ongoing monitoring or available data sets): None Area covered (by ongoing monitoring or available data sets): Data storage (format and place where data sets are stored): Responsibility (institution and person currently responsible for existing monitoring data sets):
Why (key question(s) which the indicator helps to answer): Does waste and oil spill affect BGBD? Current trend (upward, stable or downward): Unknown How (method, sampling and analysis, quality assurance): Counts Where (location, geo-referenced): Whole graben When (frequency): 4 times a year By whom (which institution will collect the indicator data): NARL Lead agency (institution and person responsible for calculating and communicating the indicator): NARO Presentation (most effective forms of presentation: graphs, maps, narratives etc.): Graphs, maps, narratives End user(s) (who will use the indicator for what purpose): All Financial assessment (approximate costs from data collection to indicator): Comments: Literature:
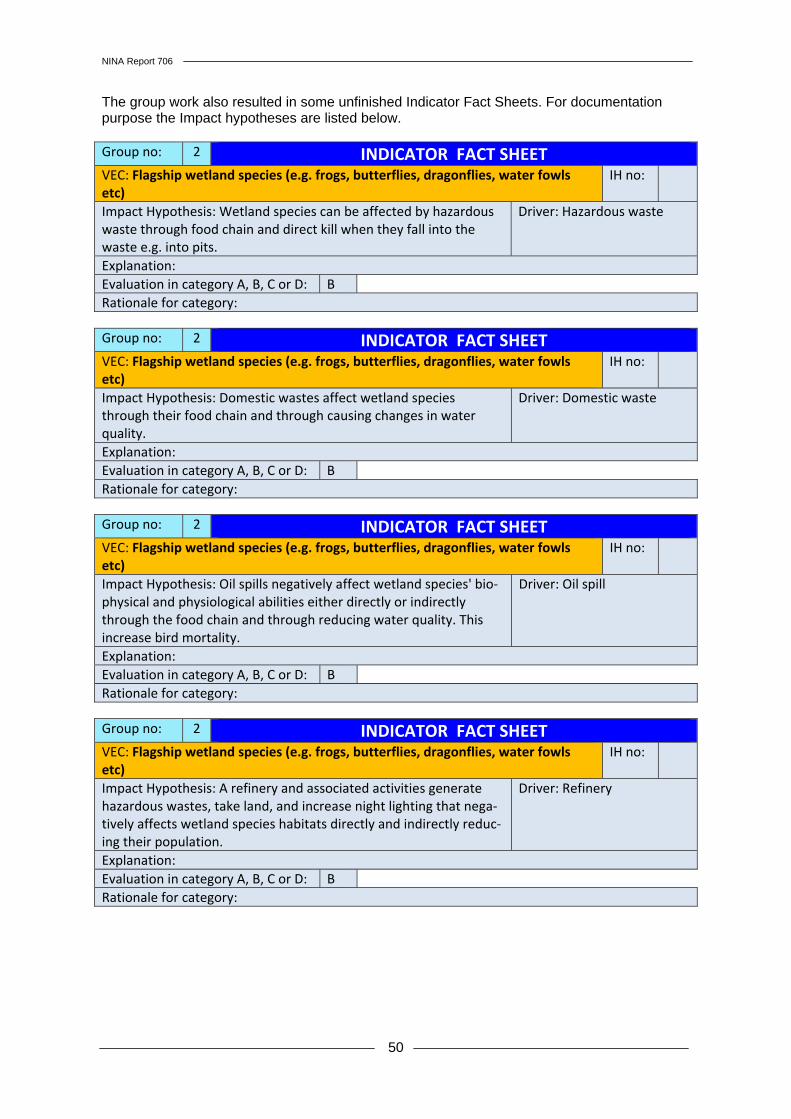
NINA Report 706
50
The group work also resulted in some unfinished Indicator Fact Sheets. For documentation purpose the Impact hypotheses are listed below. Group no: 2 INDICATOR FACT SHEETVEC: Flagship wetland species (e.g. frogs, butterflies, dragonflies, water fowls etc)
IH no:
Impact Hypothesis: Wetland species can be affected by hazardous waste through food chain and direct kill when they fall into the waste e.g. into pits.
Driver: Hazardous waste
Explanation: Evaluation in category A, B, C or D: B Rationale for category: Group no: 2 INDICATOR FACT SHEETVEC: Flagship wetland species (e.g. frogs, butterflies, dragonflies, water fowls etc)
IH no:
Impact Hypothesis: Domestic wastes affect wetland species through their food chain and through causing changes in water quality.
Driver: Domestic waste
Explanation: Evaluation in category A, B, C or D: B Rationale for category: Group no: 2 INDICATOR FACT SHEETVEC: Flagship wetland species (e.g. frogs, butterflies, dragonflies, water fowls etc)
IH no:
Impact Hypothesis: Oil spills negatively affect wetland species' bio-physical and physiological abilities either directly or indirectly through the food chain and through reducing water quality. This increase bird mortality.
Driver: Oil spill
Explanation: Evaluation in category A, B, C or D: B Rationale for category: Group no: 2 INDICATOR FACT SHEETVEC: Flagship wetland species (e.g. frogs, butterflies, dragonflies, water fowls etc)
IH no:
Impact Hypothesis: A refinery and associated activities generate hazardous wastes, take land, and increase night lighting that nega-tively affects wetland species habitats directly and indirectly reduc-ing their population.
Driver: Refinery
Explanation: Evaluation in category A, B, C or D: B Rationale for category:
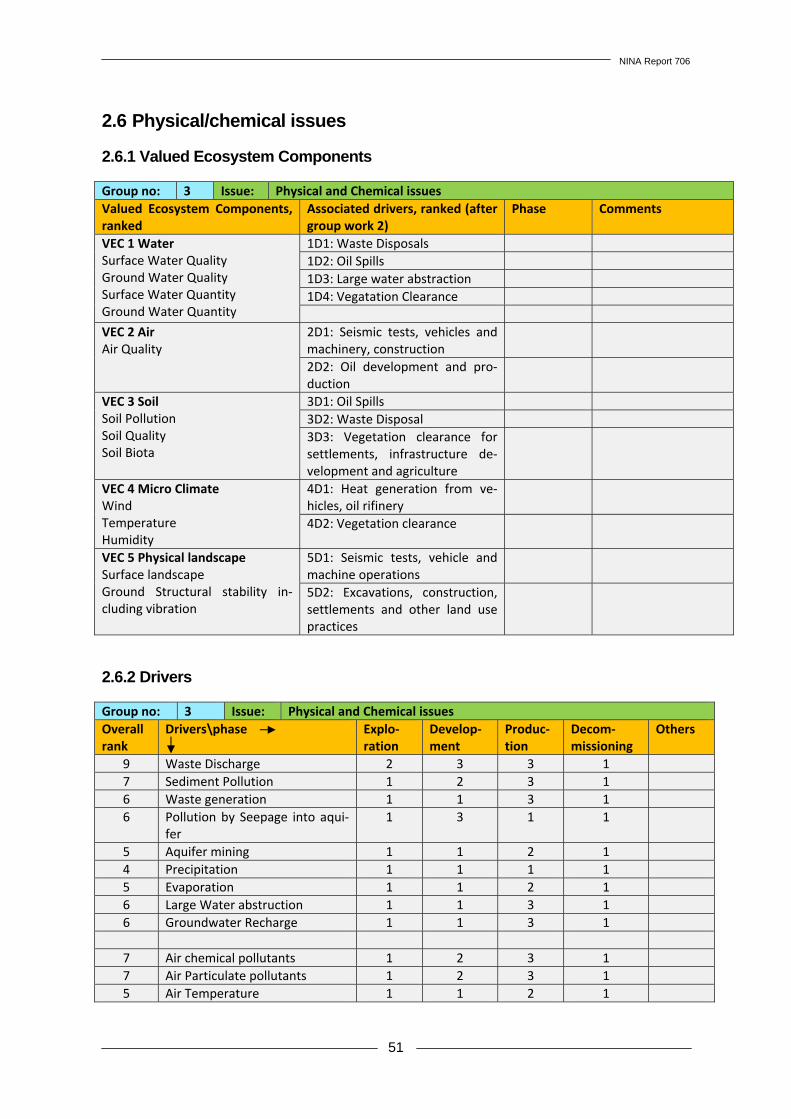
NINA Report 706
51
2.6 Physical/chemical issues 2.6.1 Valued Ecosystem Components Group no: 3 Issue: Physical and Chemical issuesValued Ecosystem Components, ranked
Associated drivers, ranked (after group work 2)
Phase Comments
VEC 1 Water Surface Water Quality Ground Water Quality Surface Water Quantity Ground Water Quantity
1D1: Waste Disposals 1D2: Oil Spills 1D3: Large water abstraction 1D4: Vegatation Clearance
VEC 2 Air Air Quality
2D1: Seismic tests, vehicles and machinery, construction
2D2: Oil development and pro-duction
VEC 3 Soil Soil Pollution Soil Quality Soil Biota
3D1: Oil Spills 3D2: Waste Disposal 3D3: Vegetation clearance for settlements, infrastructure de-velopment and agriculture
VEC 4 Micro Climate Wind Temperature Humidity
4D1: Heat generation from ve-hicles, oil rifinery
4D2: Vegetation clearance
VEC 5 Physical landscape Surface landscape Ground Structural stability in-cluding vibration
5D1: Seismic tests, vehicle and machine operations
5D2: Excavations, construction, settlements and other land use practices
2.6.2 Drivers Group no: 3 Issue: Physical and Chemical issuesOverall rank
Drivers\phase
Explo-ration
Develop-ment
Produc-tion
Decom-missioning
Others
9 Waste Discharge 2 3 3 1 7 Sediment Pollution 1 2 3 1 6 Waste generation 1 1 3 1 6 Pollution by Seepage into aqui-
fer 1 3 1 1
5 Aquifer mining 1 1 2 1 4 Precipitation 1 1 1 1 5 Evaporation 1 1 2 1 6 Large Water abstruction 1 1 3 1 6 Groundwater Recharge 1 1 3 1
7 Air chemical pollutants 1 2 3 1 7 Air Particulate pollutants 1 2 3 1 5 Air Temperature 1 1 2 1
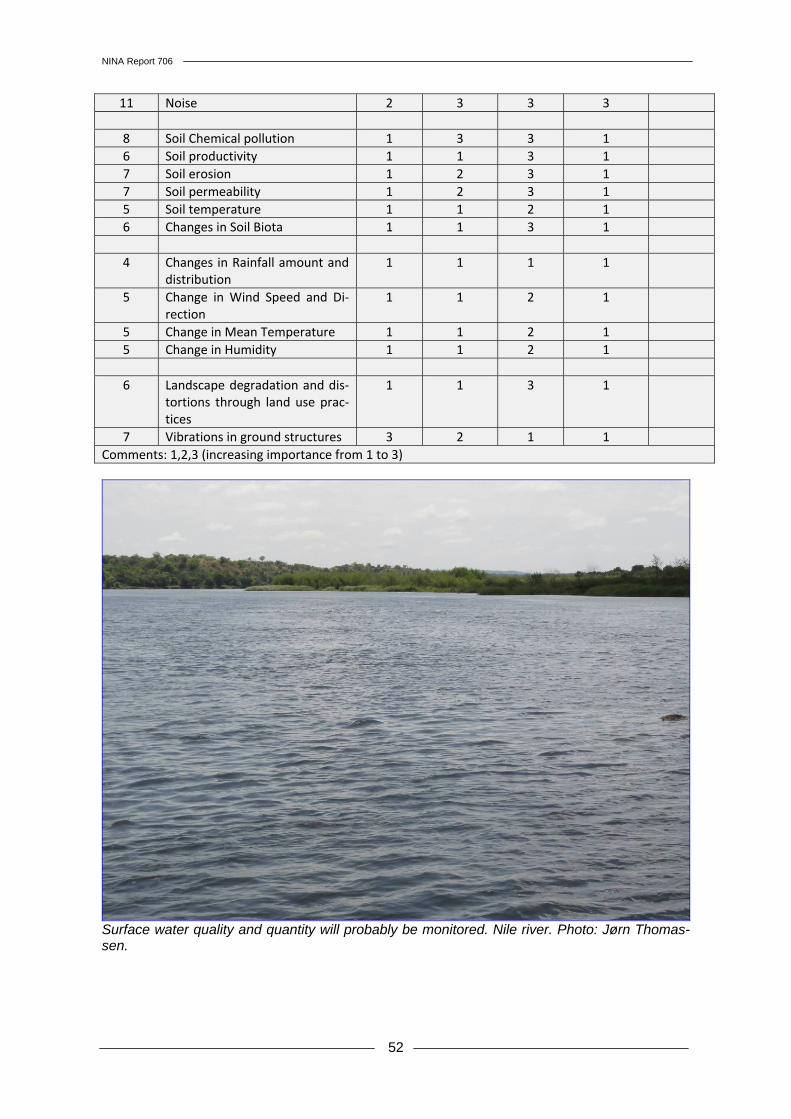
NINA Report 706
52
11 Noise 2 3 3 3
8 Soil Chemical pollution 1 3 3 1 6 Soil productivity 1 1 3 1 7 Soil erosion 1 2 3 1 7 Soil permeability 1 2 3 1 5 Soil temperature 1 1 2 1 6 Changes in Soil Biota 1 1 3 1
4 Changes in Rainfall amount and
distribution 1 1 1 1
5 Change in Wind Speed and Di-rection
1 1 2 1
5 Change in Mean Temperature 1 1 2 1 5 Change in Humidity 1 1 2 1
6 Landscape degradation and dis-tortions through land use prac-tices
1 1 3 1
7 Vibrations in ground structures 3 2 1 1 Comments: 1,2,3 (increasing importance from 1 to 3)
Surface water quality and quantity will probably be monitored. Nile river. Photo: Jørn Thomas-sen.
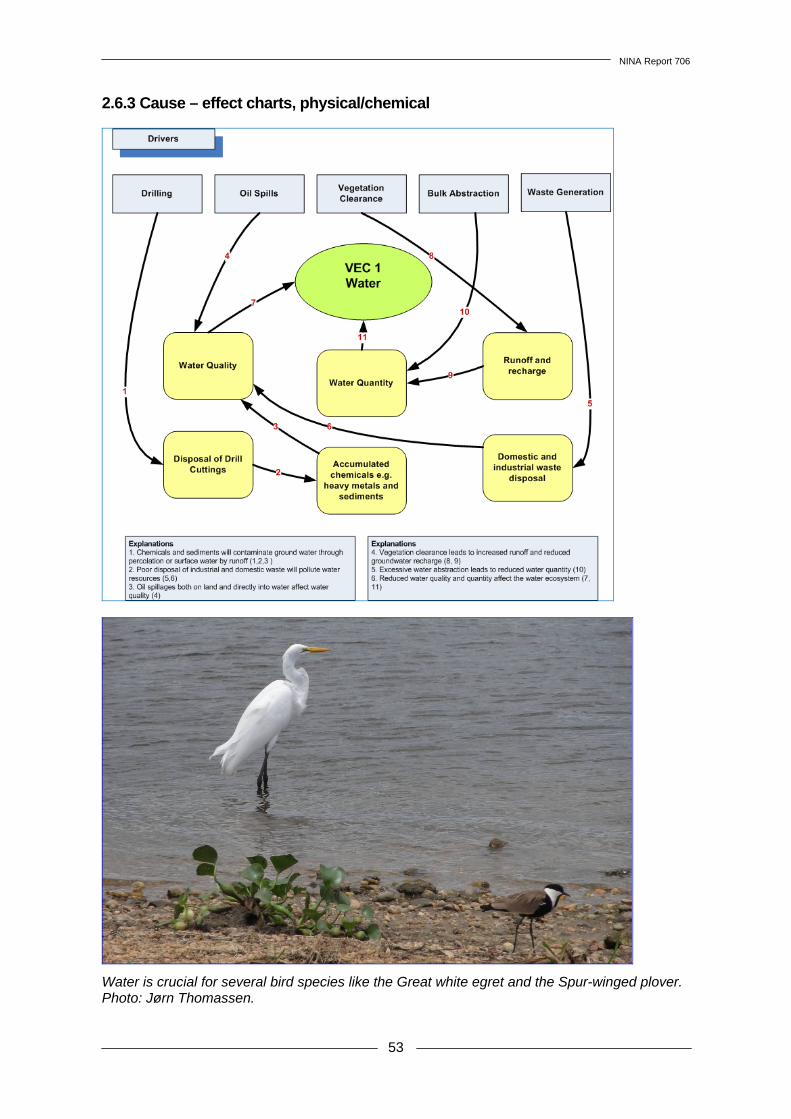
NINA Report 706
53
2.6.3 Cause – effect charts, physical/chemical
Water is crucial for several bird species like the Great white egret and the Spur-winged plover. Photo: Jørn Thomassen.
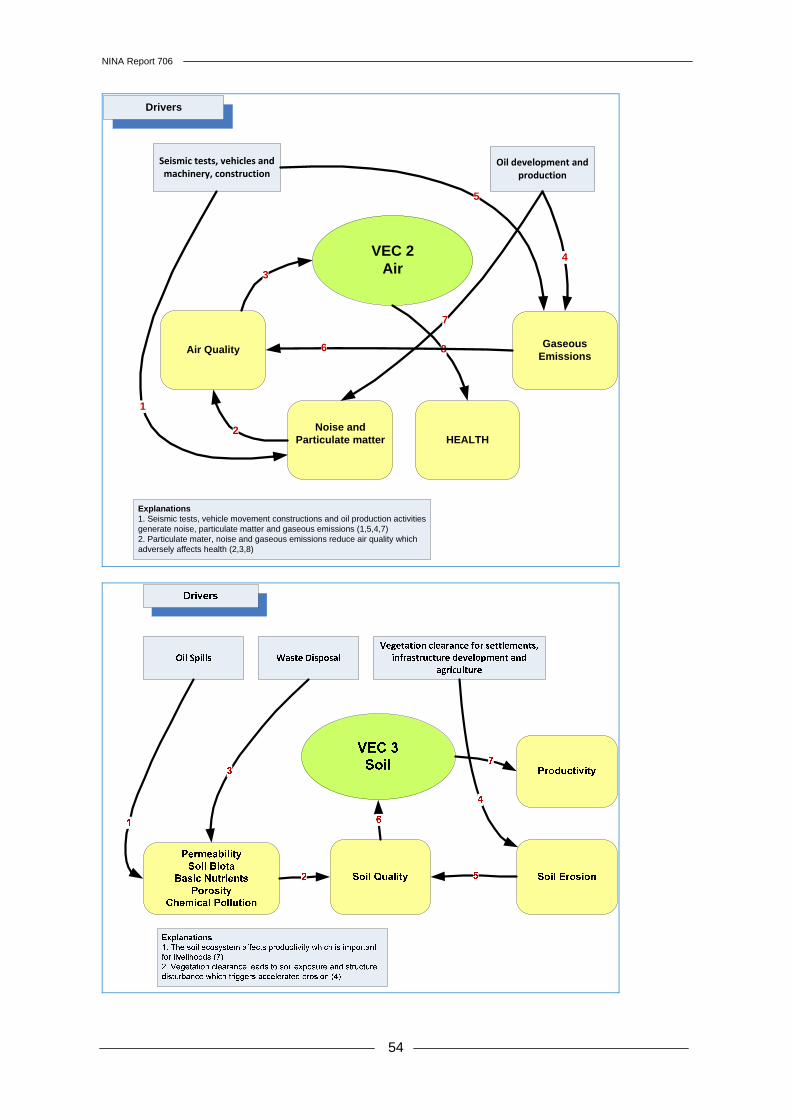
NINA Report 706
54
VEC 2Air
Seismic tests, vehicles and machinery, construction
Drivers
Oil development and production
Air Quality
1
HEALTHNoise and
Particulate matter
Gaseous Emissions
Explanations1. Seismic tests, vehicle movement constructions and oil production activities generate noise, particulate matter and gaseous emissions (1,5,4,7)2. Particulate mater, noise and gaseous emissions reduce air quality which adversely affects health (2,3,8)
2
3
8
4
5
6
7
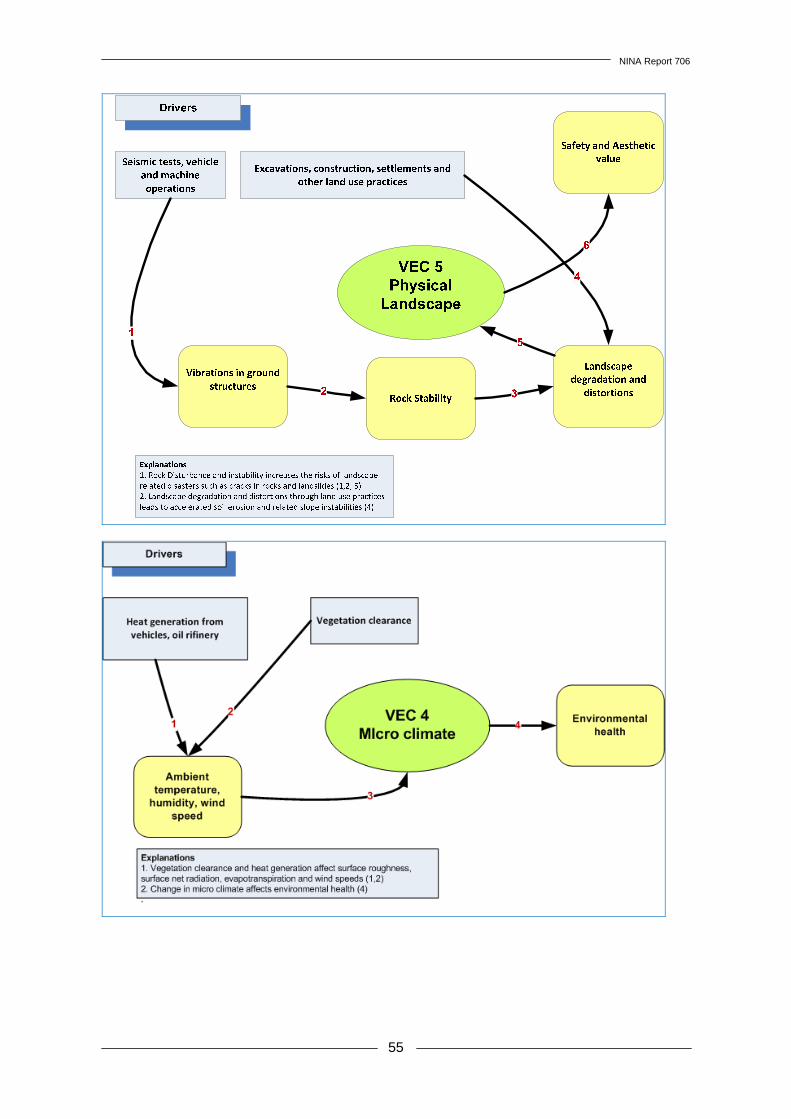
NINA Report 706
55
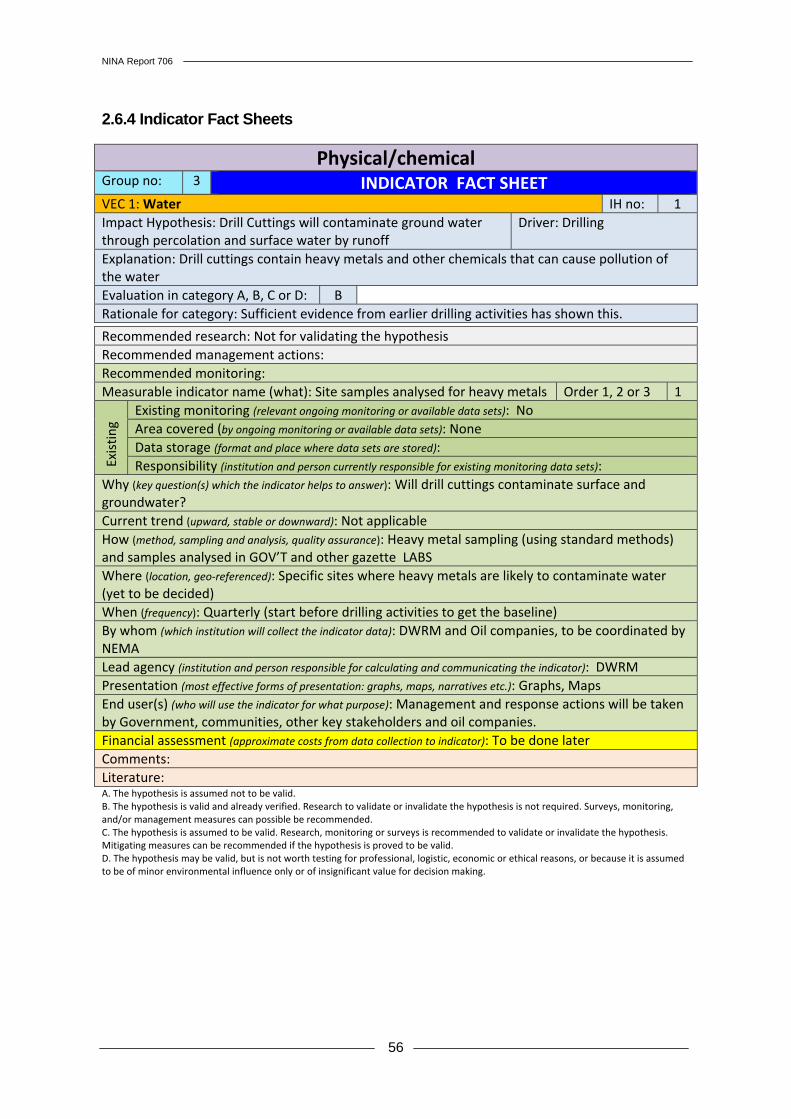
NINA Report 706
56
2.6.4 Indicator Fact Sheets
Physical/chemical Group no: 3 INDICATOR FACT SHEETVEC 1: Water IH no: 1 Impact Hypothesis: Drill Cuttings will contaminate ground water through percolation and surface water by runoff
Driver: Drilling
Explanation: Drill cuttings contain heavy metals and other chemicals that can cause pollution of the water Evaluation in category A, B, C or D: B Rationale for category: Sufficient evidence from earlier drilling activities has shown this.
Recommended research: Not for validating the hypothesis Recommended management actions: Recommended monitoring: Measurable indicator name (what): Site samples analysed for heavy metals Order 1, 2 or 3 1
Exis
ting
Existing monitoring (relevant ongoing monitoring or available data sets): No Area covered (by ongoing monitoring or available data sets): None Data storage (format and place where data sets are stored): Responsibility (institution and person currently responsible for existing monitoring data sets):
Why (key question(s) which the indicator helps to answer): Will drill cuttings contaminate surface and groundwater? Current trend (upward, stable or downward): Not applicable How (method, sampling and analysis, quality assurance): Heavy metal sampling (using standard methods) and samples analysed in GOV’T and other gazette LABS Where (location, geo-referenced): Specific sites where heavy metals are likely to contaminate water (yet to be decided) When (frequency): Quarterly (start before drilling activities to get the baseline) By whom (which institution will collect the indicator data): DWRM and Oil companies, to be coordinated by NEMA Lead agency (institution and person responsible for calculating and communicating the indicator): DWRM Presentation (most effective forms of presentation: graphs, maps, narratives etc.): Graphs, Maps End user(s) (who will use the indicator for what purpose): Management and response actions will be taken by Government, communities, other key stakeholders and oil companies. Financial assessment (approximate costs from data collection to indicator): To be done later Comments: Literature: A. The hypothesis is assumed not to be valid. B. The hypothesis is valid and already verified. Research to validate or invalidate the hypothesis is not required. Surveys, monitoring, and/or management measures can possible be recommended. C. The hypothesis is assumed to be valid. Research, monitoring or surveys is recommended to validate or invalidate the hypothesis. Mitigating measures can be recommended if the hypothesis is proved to be valid. D. The hypothesis may be valid, but is not worth testing for professional, logistic, economic or ethical reasons, or because it is assumed to be of minor environmental influence only or of insignificant value for decision making.
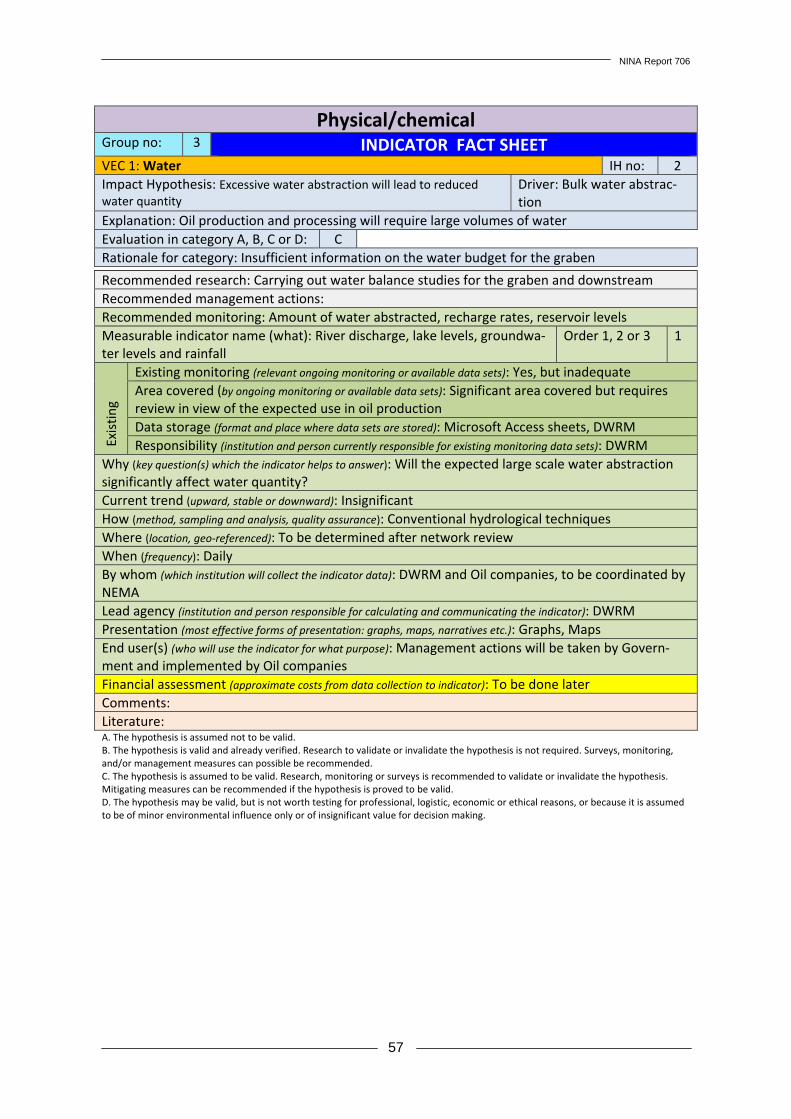
NINA Report 706
57
Physical/chemical Group no: 3 INDICATOR FACT SHEETVEC 1: Water IH no: 2 Impact Hypothesis: Excessive water abstraction will lead to reduced water quantity
Driver: Bulk water abstrac-tion
Explanation: Oil production and processing will require large volumes of water Evaluation in category A, B, C or D: C Rationale for category: Insufficient information on the water budget for the graben
Recommended research: Carrying out water balance studies for the graben and downstream Recommended management actions: Recommended monitoring: Amount of water abstracted, recharge rates, reservoir levels Measurable indicator name (what): River discharge, lake levels, groundwa-ter levels and rainfall
Order 1, 2 or 3 1
Exis
ting
Existing monitoring (relevant ongoing monitoring or available data sets): Yes, but inadequate Area covered (by ongoing monitoring or available data sets): Significant area covered but requires review in view of the expected use in oil production Data storage (format and place where data sets are stored): Microsoft Access sheets, DWRM Responsibility (institution and person currently responsible for existing monitoring data sets): DWRM
Why (key question(s) which the indicator helps to answer): Will the expected large scale water abstraction significantly affect water quantity? Current trend (upward, stable or downward): Insignificant How (method, sampling and analysis, quality assurance): Conventional hydrological techniques Where (location, geo-referenced): To be determined after network review When (frequency): Daily By whom (which institution will collect the indicator data): DWRM and Oil companies, to be coordinated by NEMA Lead agency (institution and person responsible for calculating and communicating the indicator): DWRM Presentation (most effective forms of presentation: graphs, maps, narratives etc.): Graphs, Maps End user(s) (who will use the indicator for what purpose): Management actions will be taken by Govern-ment and implemented by Oil companies Financial assessment (approximate costs from data collection to indicator): To be done later Comments: Literature: A. The hypothesis is assumed not to be valid. B. The hypothesis is valid and already verified. Research to validate or invalidate the hypothesis is not required. Surveys, monitoring, and/or management measures can possible be recommended. C. The hypothesis is assumed to be valid. Research, monitoring or surveys is recommended to validate or invalidate the hypothesis. Mitigating measures can be recommended if the hypothesis is proved to be valid. D. The hypothesis may be valid, but is not worth testing for professional, logistic, economic or ethical reasons, or because it is assumed to be of minor environmental influence only or of insignificant value for decision making.

NINA Report 706
58
Physical/chemical Group no: 3 INDICATOR FACT SHEETVEC 1: Water IH no: 3 Impact Hypothesis: Poor disposal of industrial and domestic waste will pollute water resources which may affect aquatic life
Driver: Waste
Explanation: Waste generated from domestic and industrial activities contain pollutants that will pollute water Evaluation in category A, B, C or D: B Rationale for category: Sufficient evidence is available
Recommended research: Baseline on environmental factors of key fish habitats Recommended management actions: Develop and implement a waste management plan and risk management Recommended monitoring: Effluent, Water bodies, Leachate , Sediments, Fish tissue Measurable indicator name (what): Waste water, biological indicators, leachate parameters, heavy metals, PHCs and nutrient loads
Order 1, 2 or 3
Exis
ting
Existing monitoring (relevant ongoing monitoring or available data sets): Baseline 2007 -2009 Area covered (by ongoing monitoring or available data sets): Ngasa, Kyehoro, Kaiso-Tonya, Sabagoro to Bugoma Data storage (format and place where data sets are stored): Microsoft Excel Responsibility (institution and person currently responsible for existing monitoring data sets): NaFIRRI
Why (key question(s) which the indicator helps to answer): Will poor waste disposal contaminate water? Current trend (upward, stable or downward): Not applicable How (method, sampling and analysis, quality assurance): Measurements to be undertaken using standard methods Where (location, geo-referenced): Specific sites where waste will be generated and disposed of When (frequency): Monthly but with risk evidence instant checks and compliance monitoring (start before drilling activities to get the baseline) By whom (which institution will collect the indicator data): DWRM, NAFIRRI/DFR and Oil companies, to be coordinated by NEMA Lead agency (institution and person responsible for calculating and communicating the indicator): DWRM and NAFIRRI/DFR Presentation (most effective forms of presentation: graphs, maps, narratives etc.): Tables, Graphs, Maps End user(s) (who will use the indicator for what purpose): Management and response actions will be taken by Government, other key stakeholders and oil companies Financial assessment (approximate costs from data collection to indicator): To be done later Comments: Literature: A. The hypothesis is assumed not to be valid. B. The hypothesis is valid and already verified. Research to validate or invalidate the hypothesis is not required. Surveys, monitoring, and/or management measures can possible be recommended. C. The hypothesis is assumed to be valid. Research, monitoring or surveys is recommended to validate or invalidate the hypothesis. Mitigating measures can be recommended if the hypothesis is proved to be valid. D. The hypothesis may be valid, but is not worth testing for professional, logistic, economic or ethical reasons, or because it is assumed to be of minor environmental influence only or of insignificant value for decision making.
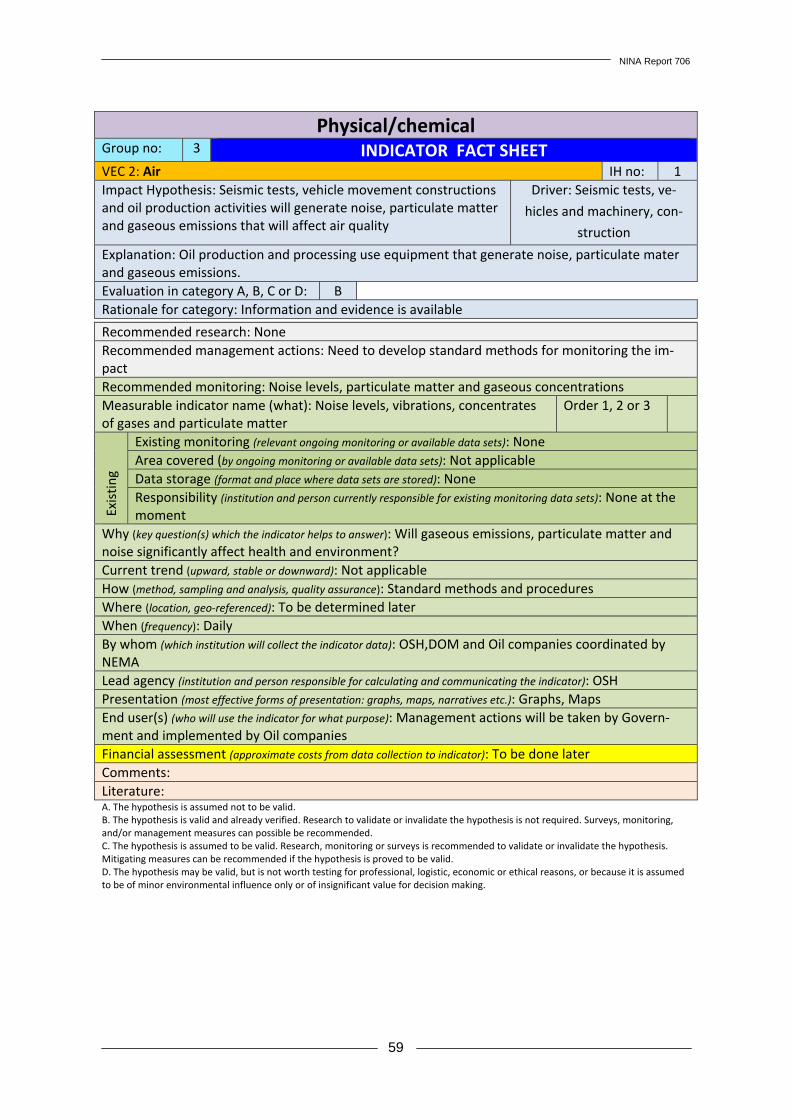
NINA Report 706
59
Physical/chemical Group no: 3 INDICATOR FACT SHEETVEC 2: Air IH no: 1 Impact Hypothesis: Seismic tests, vehicle movement constructions and oil production activities will generate noise, particulate matter and gaseous emissions that will affect air quality
Driver: Seismic tests, ve-
hicles and machinery, con-
struction Explanation: Oil production and processing use equipment that generate noise, particulate mater and gaseous emissions. Evaluation in category A, B, C or D: B Rationale for category: Information and evidence is available
Recommended research: None Recommended management actions: Need to develop standard methods for monitoring the im-pact Recommended monitoring: Noise levels, particulate matter and gaseous concentrations Measurable indicator name (what): Noise levels, vibrations, concentrates of gases and particulate matter
Order 1, 2 or 3
Exis
ting
Existing monitoring (relevant ongoing monitoring or available data sets): None Area covered (by ongoing monitoring or available data sets): Not applicable Data storage (format and place where data sets are stored): None Responsibility (institution and person currently responsible for existing monitoring data sets): None at the moment
Why (key question(s) which the indicator helps to answer): Will gaseous emissions, particulate matter and noise significantly affect health and environment? Current trend (upward, stable or downward): Not applicable How (method, sampling and analysis, quality assurance): Standard methods and procedures Where (location, geo-referenced): To be determined later When (frequency): Daily By whom (which institution will collect the indicator data): OSH,DOM and Oil companies coordinated by NEMA Lead agency (institution and person responsible for calculating and communicating the indicator): OSH Presentation (most effective forms of presentation: graphs, maps, narratives etc.): Graphs, Maps End user(s) (who will use the indicator for what purpose): Management actions will be taken by Govern-ment and implemented by Oil companies Financial assessment (approximate costs from data collection to indicator): To be done later Comments: Literature: A. The hypothesis is assumed not to be valid. B. The hypothesis is valid and already verified. Research to validate or invalidate the hypothesis is not required. Surveys, monitoring, and/or management measures can possible be recommended. C. The hypothesis is assumed to be valid. Research, monitoring or surveys is recommended to validate or invalidate the hypothesis. Mitigating measures can be recommended if the hypothesis is proved to be valid. D. The hypothesis may be valid, but is not worth testing for professional, logistic, economic or ethical reasons, or because it is assumed to be of minor environmental influence only or of insignificant value for decision making.

NINA Report 706
60
Physical/chemical Group no: 3 INDICATOR FACT SHEETVEC 3: Soil IH no: 1 Impact Hypothesis: Oil spills will alter soil permeability, Soil Biota, Basic Nutrients, Porosity which will significantly affect soil quality hence reducing soil productivity
Driver: Oil Spills
Explanation: The hydrophobic characteristic of oil obstructs water movement in the soil. Oil also contains chemicals that pollute the soil and hence affecting basic soil nutrients and soil biota. All these lead to reduced soil productivity. Evaluation in category A, B, C or D: B Rationale for category: Information and evidence is available from scientific research
Recommended research: None Recommended management actions: Develop oil spill monitoring protocols (including surveillance and emergency response) Recommended monitoring: Visual observations, Standard Laboratory tests Measurable indicator name (what): Area covered by the spill, Magnitude and extent of oil traces, results from laboratory tests for hydrocarbons and heavy metals
Order 1, 2 or 3
Exis
ting
Existing monitoring (relevant ongoing monitoring or available data sets): None Area covered (by ongoing monitoring or available data sets): Not applicable Data storage (format and place where data sets are stored): None Responsibility (institution and person currently responsible for existing monitoring data sets): None at the moment
Why (key question(s) which the indicator helps to answer): Will oil spills have an impact on the soil ecosys-tem? Current trend (upward, stable or downward): Not applicable How (method, sampling and analysis, quality assurance): Standard methods and procedures Where (location, geo-referenced): To be determined later When (frequency): Continuously By whom (which institution will collect the indicator data): Oil companies, NARO – NARL, coordinated by NEMA Lead agency (institution and person responsible for calculating and communicating the indicator): NARO - NARL Presentation (most effective forms of presentation: graphs, maps, narratives etc.): Graphs, Maps End user(s) (who will use the indicator for what purpose): Management and response actions will be taken by Government, communities, other key stakeholders and oil companies. Financial assessment (approximate costs from data collection to indicator): To be done later Comments: Literature: A. The hypothesis is assumed not to be valid. B. The hypothesis is valid and already verified. Research to validate or invalidate the hypothesis is not required. Surveys, monitoring, and/or management measures can possible be recommended. C. The hypothesis is assumed to be valid. Research, monitoring or surveys is recommended to validate or invalidate the hypothesis. Mitigating measures can be recommended if the hypothesis is proved to be valid. D. The hypothesis may be valid, but is not worth testing for professional, logistic, economic or ethical reasons, or because it is assumed to be of minor environmental influence only or of insignificant value for decision making.

NINA Report 706
61
Physical/chemical Group no: 3 INDICATOR FACT SHEETVEC 4: Micro Climate IH no: 1 Impact Hypothesis: Heat generated from vehicles and oil refinery will change the micro climate of the area
Driver: Heat generation from vehicles, oil refinery
Explanation: Operation of oil refineries and vehicular movements are known to generate signifi-cant amounts of heat which affect the temperature and wind speed of the area Evaluation in category A, B, C or D: B Rationale for category: Sufficient evidence from earlier research
Recommended research: Site based research needed Recommended management actions: Design and implement a framework for installation of an optimum network Recommended monitoring: Rainfall, wind, temperature, pressure, evapo-transpiration and solar radiation Measurable indicator name (what): Changes in; rainfall, wind, tempera-ture, pressure, evapo-transpiration and solar radiation
Order 1, 2 or 3
Exis
ting
Existing monitoring (relevant ongoing monitoring or available data sets): Yes, but needs improvement Area covered (by ongoing monitoring or available data sets): Insignificant area covered Data storage (format and place where data sets are stored): DOM Responsibility (institution and person currently responsible for existing monitoring data sets): DOM
Why (key question(s) which the indicator helps to answer): Will the operations of the oil refinery alter the micro climate of the graben? Current trend (upward, stable or downward): Not applicable How (method, sampling and analysis, quality assurance): Observations using standard instruments Where (location, geo-referenced): Specific sites to be decided later When (frequency): Daily (start before drilling activities to get the baseline) By whom (which institution will collect the indicator data): DOM, DWRM and Oil companies Lead agency (institution and person responsible for calculating and communicating the indicator): DOM Presentation (most effective forms of presentation: graphs, maps, narratives etc.): Data tables, Graphs, Maps and Advisories End user(s) (who will use the indicator for what purpose): Management and response actions will be taken by Government, communities, other key stakeholders and oil companies. Financial assessment (approximate costs from data collection to indicator): To be done later Comments: Literature: A. The hypothesis is assumed not to be valid. B. The hypothesis is valid and already verified. Research to validate or invalidate the hypothesis is not required. Surveys, monitoring, and/or management measures can possible be recommended. C. The hypothesis is assumed to be valid. Research, monitoring or surveys is recommended to validate or invalidate the hypothesis. Mitigating measures can be recommended if the hypothesis is proved to be valid. D. The hypothesis may be valid, but is not worth testing for professional, logistic, economic or ethical reasons, or because it is assumed to be of minor environmental influence only or of insignificant value for decision making.
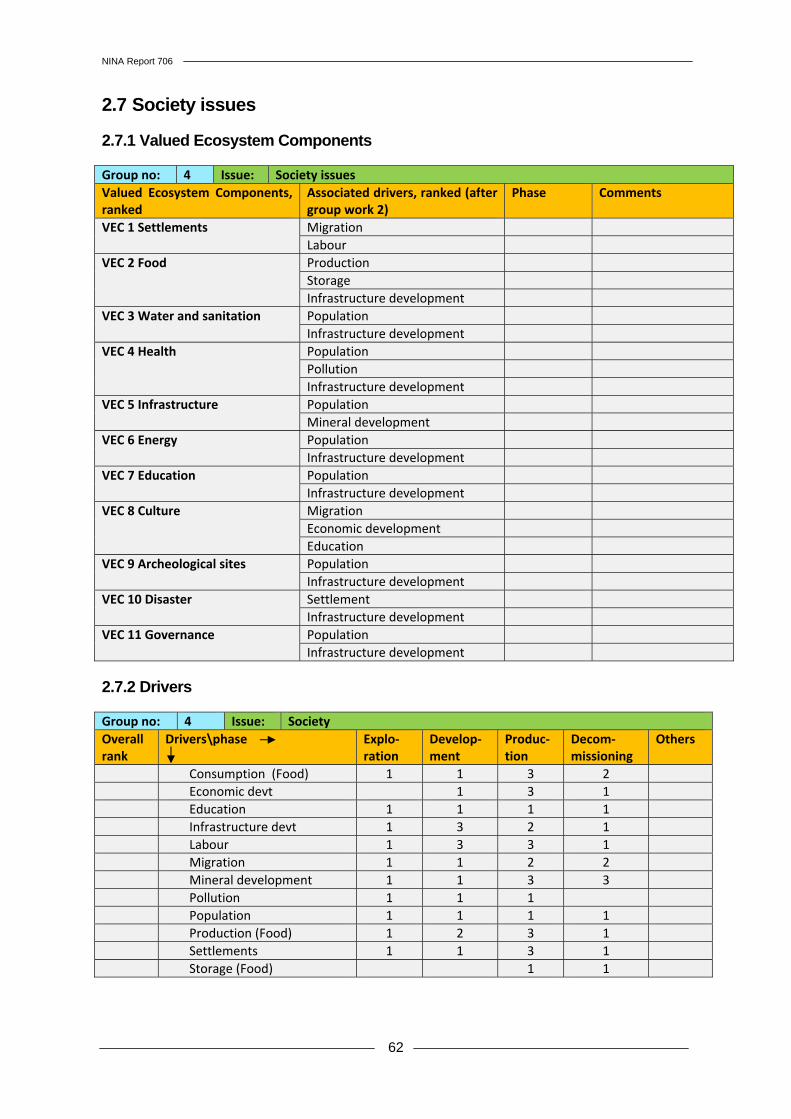
NINA Report 706
62
2.7 Society issues 2.7.1 Valued Ecosystem Components Group no: 4 Issue: Society issuesValued Ecosystem Components, ranked
Associated drivers, ranked (after group work 2)
Phase Comments
VEC 1 Settlements Migration Labour
VEC 2 Food Production Storage Infrastructure development
VEC 3 Water and sanitation Population Infrastructure development
VEC 4 Health Population Pollution Infrastructure development
VEC 5 Infrastructure Population Mineral development
VEC 6 Energy Population Infrastructure development
VEC 7 Education Population Infrastructure development
VEC 8 Culture Migration Economic development Education
VEC 9 Archeological sites Population Infrastructure development
VEC 10 Disaster Settlement Infrastructure development
VEC 11 Governance Population Infrastructure development
2.7.2 Drivers Group no: 4 Issue: SocietyOverall rank
Drivers\phase
Explo-ration
Develop-ment
Produc-tion
Decom-missioning
Others
Consumption (Food) 1 1 3 2 Economic devt 1 3 1 Education 1 1 1 1 Infrastructure devt 1 3 2 1 Labour 1 3 3 1 Migration 1 1 2 2 Mineral development 1 1 3 3 Pollution 1 1 1 Population 1 1 1 1 Production (Food) 1 2 3 1 Settlements 1 1 3 1 Storage (Food) 1 1

NINA Report 706
63
2.7.3 Cause – effect charts, society
Society and settlements will be included in the monitoring program. Photo: Jørn Thomassen.
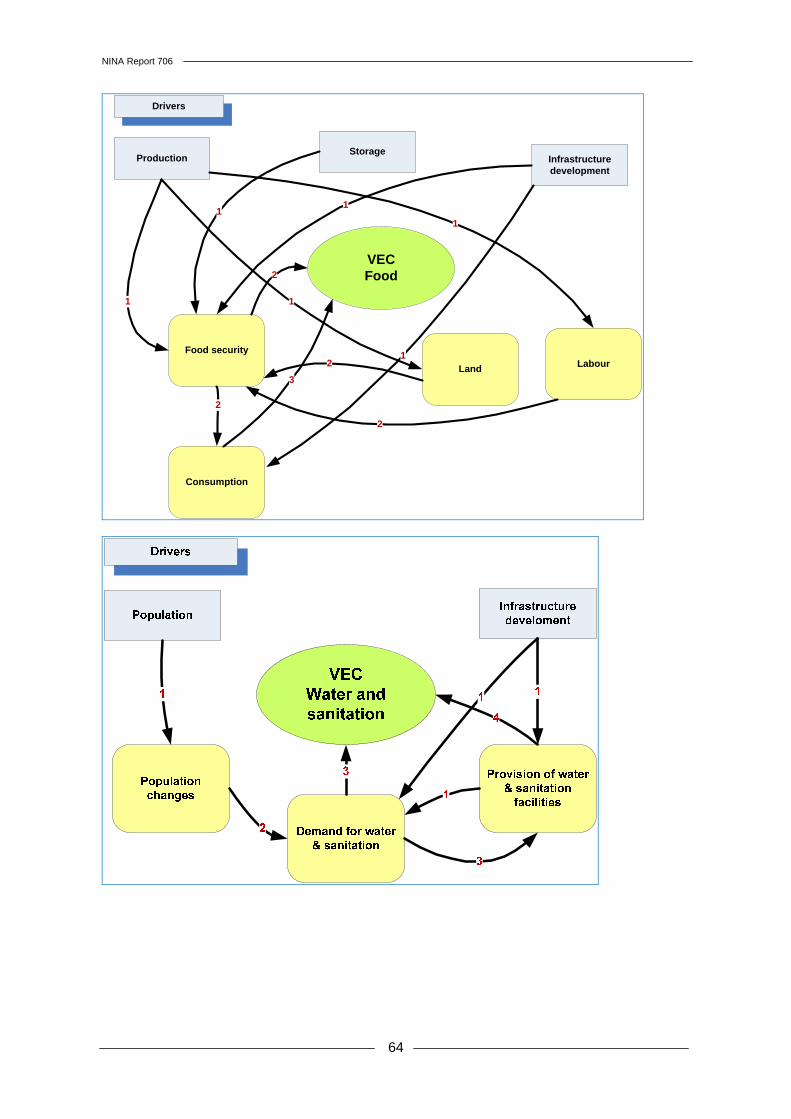
NINA Report 706
64
Production
Drivers
StorageInfrastructure development
Food security
1
Land
Consumption
2
1
2
1
1
3
Labour
1
VECFood
1
2
2

NINA Report 706
65
VECHealth
Population
Drivers
PollutionInfrastructure development
Population changes
1
Pollution
Demand for Health services
Provision of health servives
22
2
22
2
2
2
2
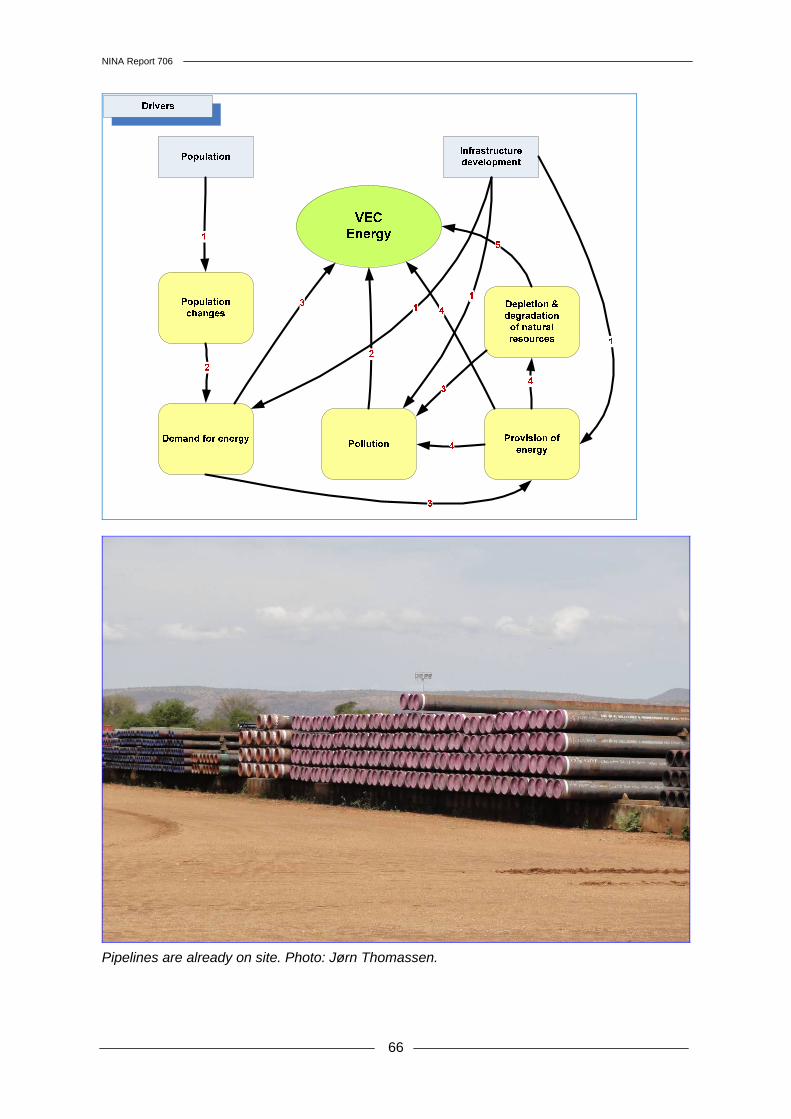
NINA Report 706
66
Pipelines are already on site. Photo: Jørn Thomassen.
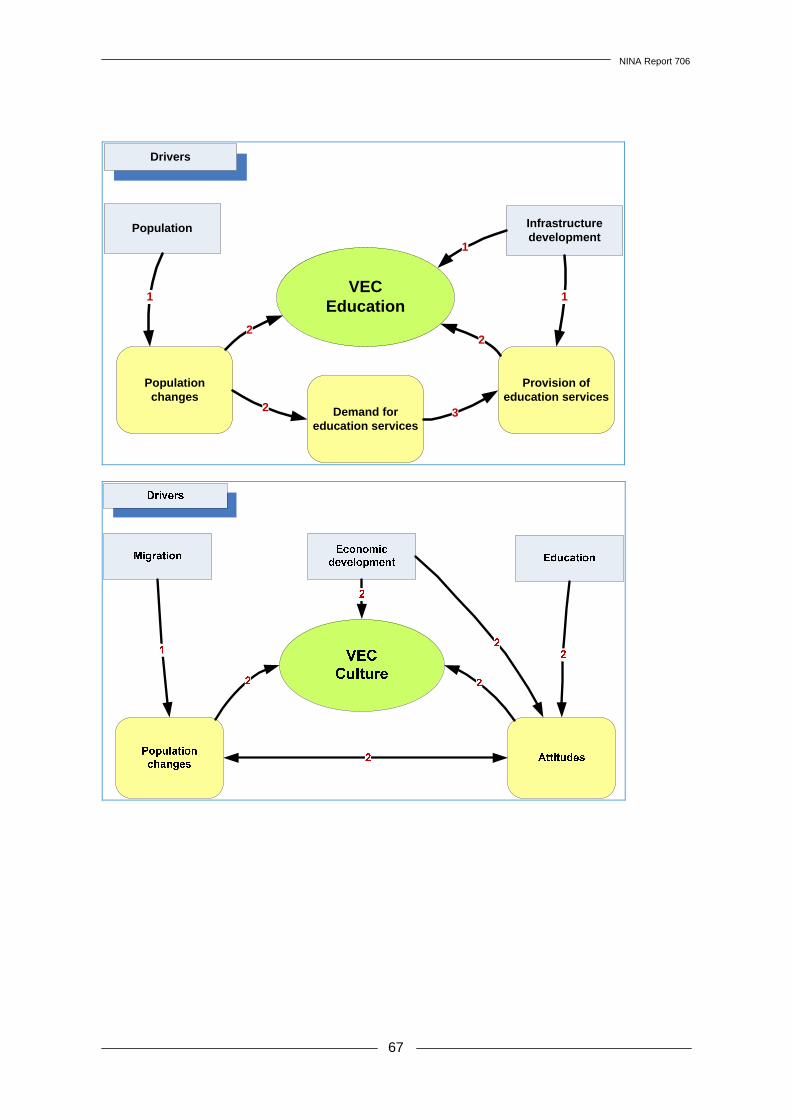
NINA Report 706
67
VECEducation
Population
Drivers
Infrastructure development
Population changes
1
Demand for education services
Provision of education services
2
1
2
2 3
1
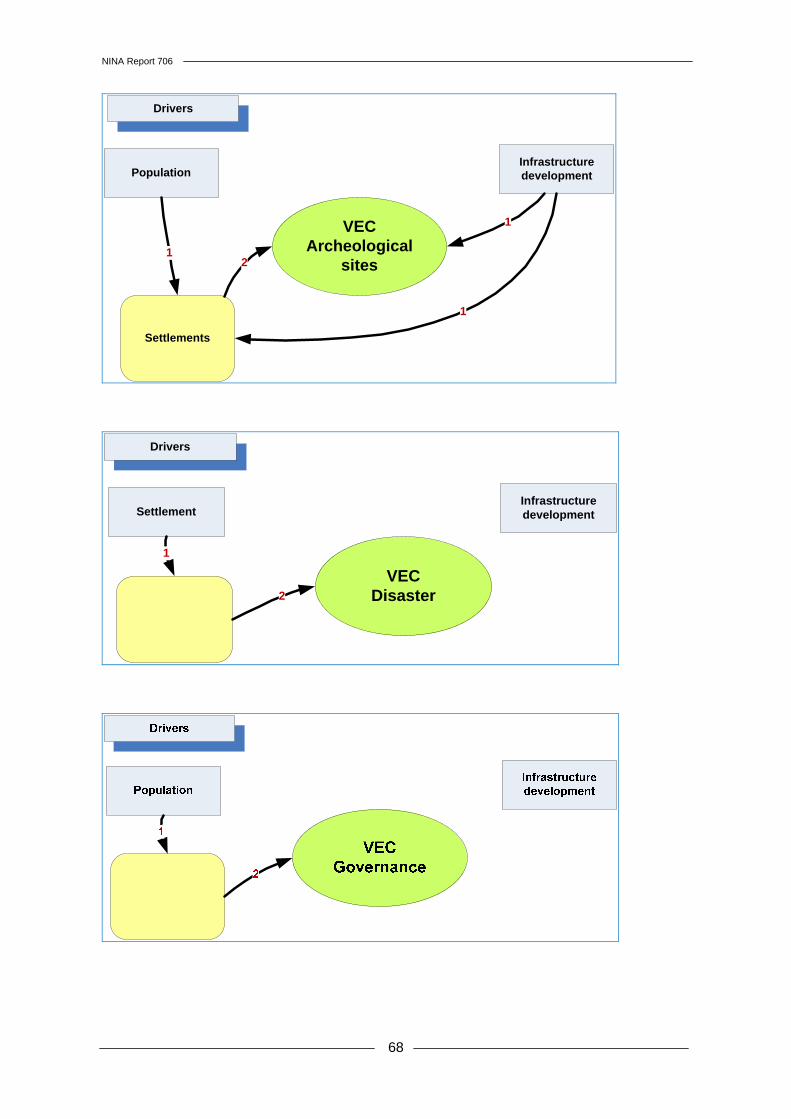
NINA Report 706
68
VECArcheological
sites
Population
Drivers
Infrastructure development
Settlements
12
1
1
VECDisaster
Settlement
Drivers
Infrastructure development
1
2
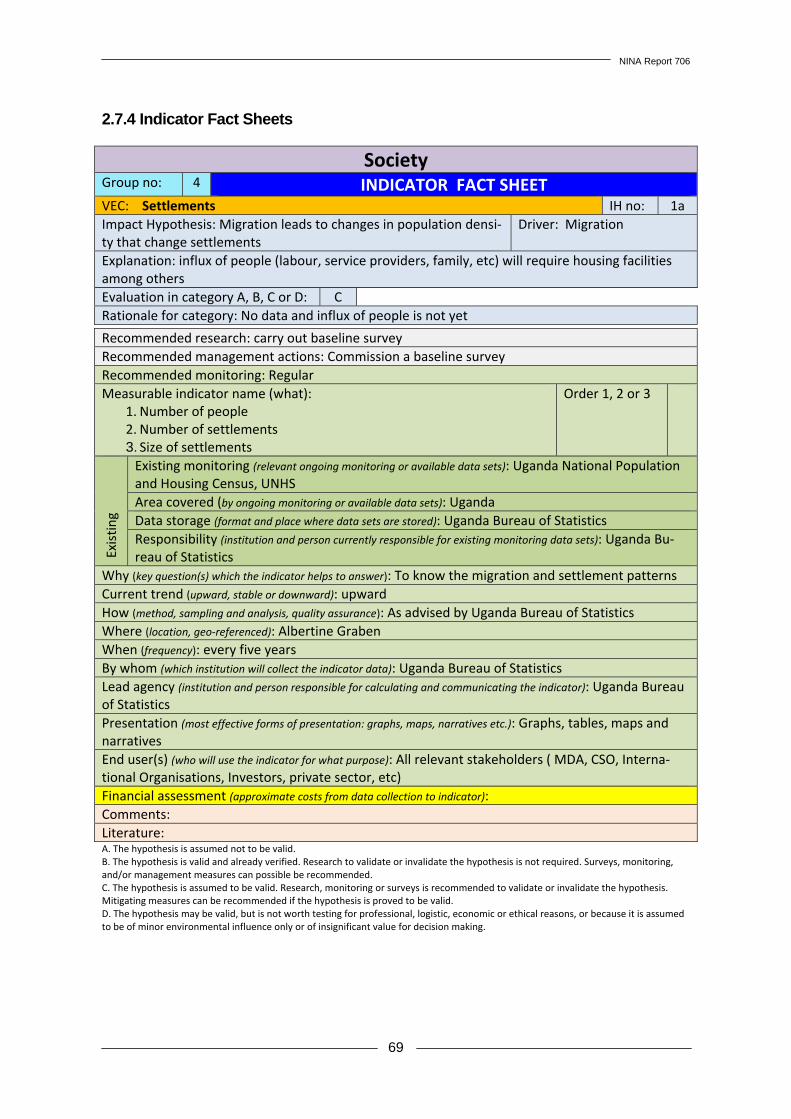
NINA Report 706
69
2.7.4 Indicator Fact Sheets
Society Group no: 4 INDICATOR FACT SHEETVEC: Settlements IH no: 1a Impact Hypothesis: Migration leads to changes in population densi-ty that change settlements
Driver: Migration
Explanation: influx of people (labour, service providers, family, etc) will require housing facilities among others Evaluation in category A, B, C or D: C Rationale for category: No data and influx of people is not yet
Recommended research: carry out baseline survey Recommended management actions: Commission a baseline survey Recommended monitoring: Regular Measurable indicator name (what):
1. Number of people 2. Number of settlements 3. Size of settlements
Order 1, 2 or 3
Exis
ting
Existing monitoring (relevant ongoing monitoring or available data sets): Uganda National Population and Housing Census, UNHS Area covered (by ongoing monitoring or available data sets): Uganda Data storage (format and place where data sets are stored): Uganda Bureau of Statistics Responsibility (institution and person currently responsible for existing monitoring data sets): Uganda Bu-reau of Statistics
Why (key question(s) which the indicator helps to answer): To know the migration and settlement patterns Current trend (upward, stable or downward): upward How (method, sampling and analysis, quality assurance): As advised by Uganda Bureau of Statistics Where (location, geo-referenced): Albertine Graben When (frequency): every five years By whom (which institution will collect the indicator data): Uganda Bureau of Statistics Lead agency (institution and person responsible for calculating and communicating the indicator): Uganda Bureau of Statistics Presentation (most effective forms of presentation: graphs, maps, narratives etc.): Graphs, tables, maps and narratives End user(s) (who will use the indicator for what purpose): All relevant stakeholders ( MDA, CSO, Interna-tional Organisations, Investors, private sector, etc) Financial assessment (approximate costs from data collection to indicator): Comments: Literature: A. The hypothesis is assumed not to be valid. B. The hypothesis is valid and already verified. Research to validate or invalidate the hypothesis is not required. Surveys, monitoring, and/or management measures can possible be recommended. C. The hypothesis is assumed to be valid. Research, monitoring or surveys is recommended to validate or invalidate the hypothesis. Mitigating measures can be recommended if the hypothesis is proved to be valid. D. The hypothesis may be valid, but is not worth testing for professional, logistic, economic or ethical reasons, or because it is assumed to be of minor environmental influence only or of insignificant value for decision making.
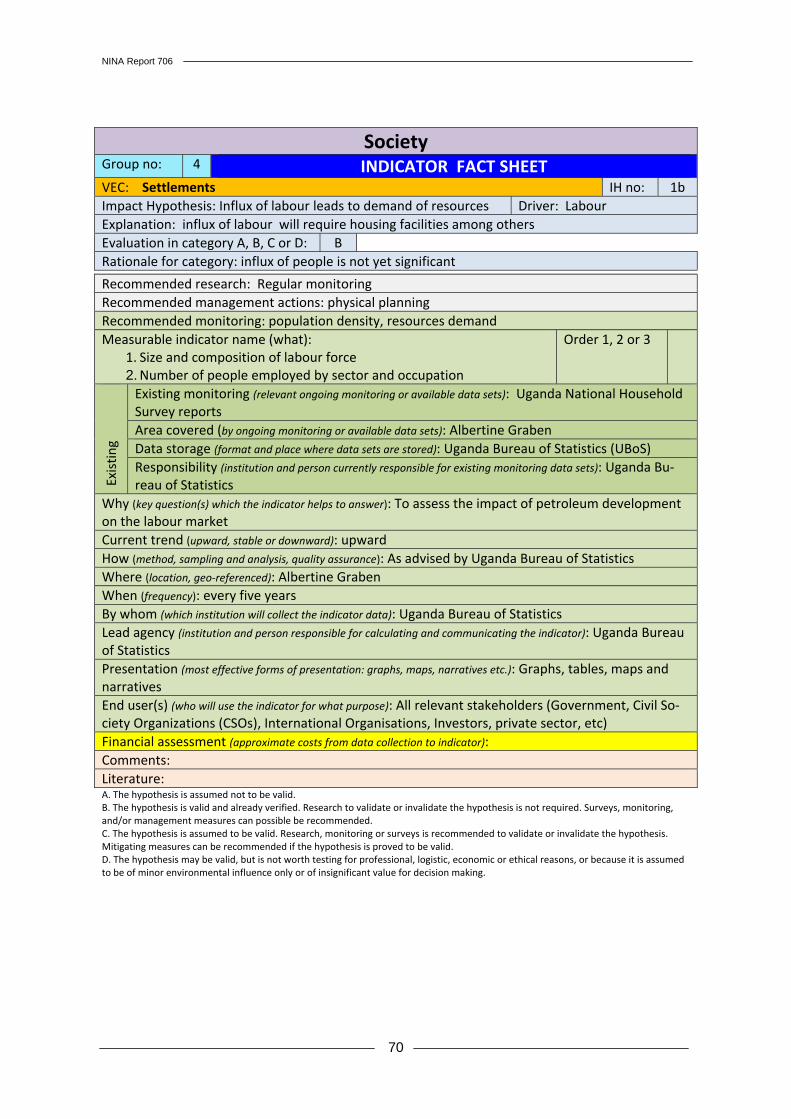
NINA Report 706
70
Society Group no: 4 INDICATOR FACT SHEETVEC: Settlements IH no: 1b Impact Hypothesis: Influx of labour leads to demand of resources Driver: Labour Explanation: influx of labour will require housing facilities among others Evaluation in category A, B, C or D: B Rationale for category: influx of people is not yet significant
Recommended research: Regular monitoring Recommended management actions: physical planning Recommended monitoring: population density, resources demand Measurable indicator name (what):
1. Size and composition of labour force 2. Number of people employed by sector and occupation
Order 1, 2 or 3
Exis
ting
Existing monitoring (relevant ongoing monitoring or available data sets): Uganda National Household Survey reports Area covered (by ongoing monitoring or available data sets): Albertine Graben Data storage (format and place where data sets are stored): Uganda Bureau of Statistics (UBoS) Responsibility (institution and person currently responsible for existing monitoring data sets): Uganda Bu-reau of Statistics
Why (key question(s) which the indicator helps to answer): To assess the impact of petroleum development on the labour market Current trend (upward, stable or downward): upward How (method, sampling and analysis, quality assurance): As advised by Uganda Bureau of Statistics Where (location, geo-referenced): Albertine Graben When (frequency): every five years By whom (which institution will collect the indicator data): Uganda Bureau of Statistics Lead agency (institution and person responsible for calculating and communicating the indicator): Uganda Bureau of Statistics Presentation (most effective forms of presentation: graphs, maps, narratives etc.): Graphs, tables, maps and narratives End user(s) (who will use the indicator for what purpose): All relevant stakeholders (Government, Civil So-ciety Organizations (CSOs), International Organisations, Investors, private sector, etc) Financial assessment (approximate costs from data collection to indicator): Comments: Literature: A. The hypothesis is assumed not to be valid. B. The hypothesis is valid and already verified. Research to validate or invalidate the hypothesis is not required. Surveys, monitoring, and/or management measures can possible be recommended. C. The hypothesis is assumed to be valid. Research, monitoring or surveys is recommended to validate or invalidate the hypothesis. Mitigating measures can be recommended if the hypothesis is proved to be valid. D. The hypothesis may be valid, but is not worth testing for professional, logistic, economic or ethical reasons, or because it is assumed to be of minor environmental influence only or of insignificant value for decision making.
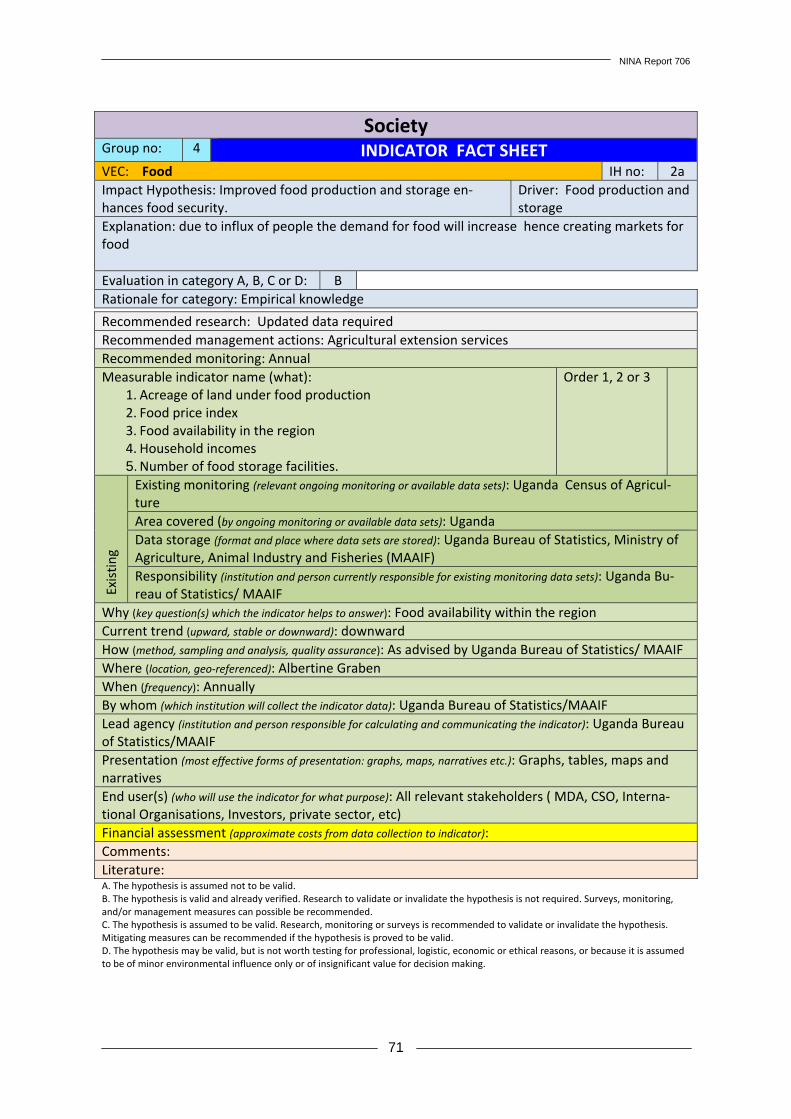
NINA Report 706
71
Society Group no: 4 INDICATOR FACT SHEETVEC: Food IH no: 2a Impact Hypothesis: Improved food production and storage en-hances food security.
Driver: Food production and storage
Explanation: due to influx of people the demand for food will increase hence creating markets for food Evaluation in category A, B, C or D: B Rationale for category: Empirical knowledge
Recommended research: Updated data required Recommended management actions: Agricultural extension services Recommended monitoring: Annual Measurable indicator name (what):
1. Acreage of land under food production 2. Food price index 3. Food availability in the region 4. Household incomes 5. Number of food storage facilities.
Order 1, 2 or 3
Exis
ting
Existing monitoring (relevant ongoing monitoring or available data sets): Uganda Census of Agricul-ture Area covered (by ongoing monitoring or available data sets): Uganda Data storage (format and place where data sets are stored): Uganda Bureau of Statistics, Ministry of Agriculture, Animal Industry and Fisheries (MAAIF) Responsibility (institution and person currently responsible for existing monitoring data sets): Uganda Bu-reau of Statistics/ MAAIF
Why (key question(s) which the indicator helps to answer): Food availability within the region Current trend (upward, stable or downward): downward How (method, sampling and analysis, quality assurance): As advised by Uganda Bureau of Statistics/ MAAIF Where (location, geo-referenced): Albertine Graben When (frequency): Annually By whom (which institution will collect the indicator data): Uganda Bureau of Statistics/MAAIF Lead agency (institution and person responsible for calculating and communicating the indicator): Uganda Bureau of Statistics/MAAIF Presentation (most effective forms of presentation: graphs, maps, narratives etc.): Graphs, tables, maps and narratives End user(s) (who will use the indicator for what purpose): All relevant stakeholders ( MDA, CSO, Interna-tional Organisations, Investors, private sector, etc) Financial assessment (approximate costs from data collection to indicator): Comments: Literature: A. The hypothesis is assumed not to be valid. B. The hypothesis is valid and already verified. Research to validate or invalidate the hypothesis is not required. Surveys, monitoring, and/or management measures can possible be recommended. C. The hypothesis is assumed to be valid. Research, monitoring or surveys is recommended to validate or invalidate the hypothesis. Mitigating measures can be recommended if the hypothesis is proved to be valid. D. The hypothesis may be valid, but is not worth testing for professional, logistic, economic or ethical reasons, or because it is assumed to be of minor environmental influence only or of insignificant value for decision making.
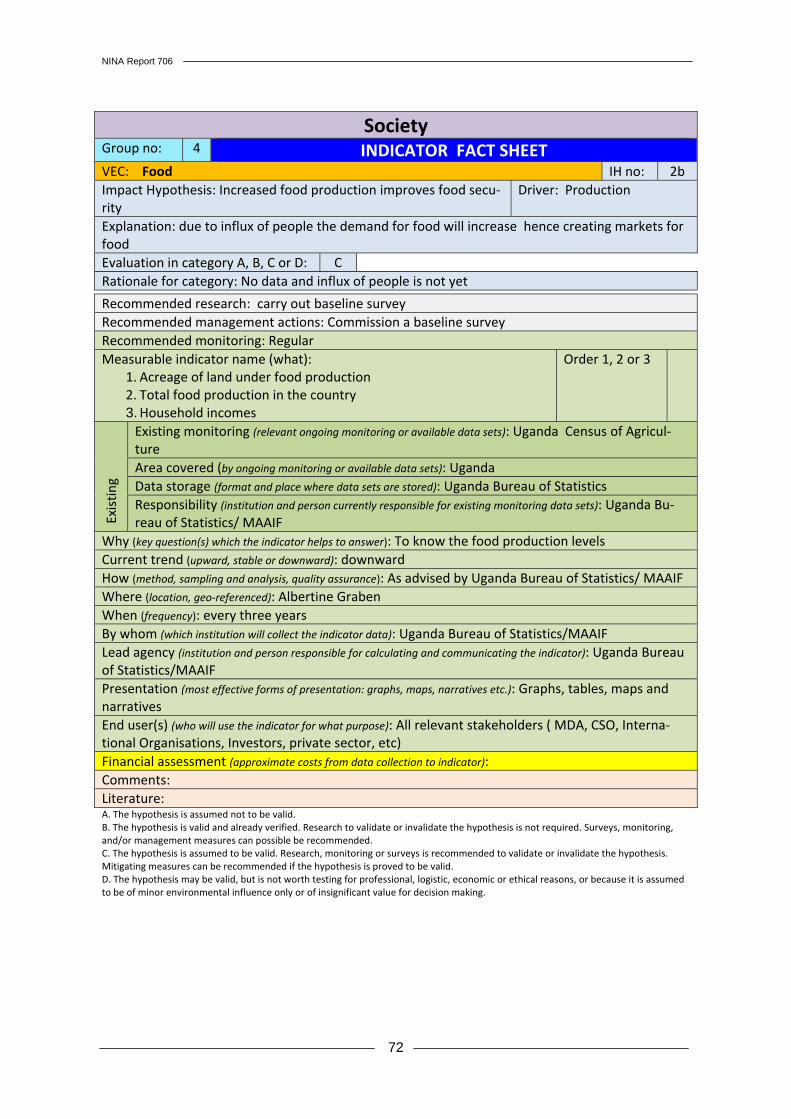
NINA Report 706
72
Society Group no: 4 INDICATOR FACT SHEETVEC: Food IH no: 2b Impact Hypothesis: Increased food production improves food secu-rity
Driver: Production
Explanation: due to influx of people the demand for food will increase hence creating markets for food Evaluation in category A, B, C or D: C Rationale for category: No data and influx of people is not yet
Recommended research: carry out baseline survey Recommended management actions: Commission a baseline survey Recommended monitoring: Regular Measurable indicator name (what):
1. Acreage of land under food production 2. Total food production in the country 3. Household incomes
Order 1, 2 or 3
Exis
ting
Existing monitoring (relevant ongoing monitoring or available data sets): Uganda Census of Agricul-ture Area covered (by ongoing monitoring or available data sets): Uganda Data storage (format and place where data sets are stored): Uganda Bureau of Statistics Responsibility (institution and person currently responsible for existing monitoring data sets): Uganda Bu-reau of Statistics/ MAAIF
Why (key question(s) which the indicator helps to answer): To know the food production levels Current trend (upward, stable or downward): downward How (method, sampling and analysis, quality assurance): As advised by Uganda Bureau of Statistics/ MAAIF Where (location, geo-referenced): Albertine Graben When (frequency): every three years By whom (which institution will collect the indicator data): Uganda Bureau of Statistics/MAAIF Lead agency (institution and person responsible for calculating and communicating the indicator): Uganda Bureau of Statistics/MAAIF Presentation (most effective forms of presentation: graphs, maps, narratives etc.): Graphs, tables, maps and narratives End user(s) (who will use the indicator for what purpose): All relevant stakeholders ( MDA, CSO, Interna-tional Organisations, Investors, private sector, etc) Financial assessment (approximate costs from data collection to indicator): Comments: Literature: A. The hypothesis is assumed not to be valid. B. The hypothesis is valid and already verified. Research to validate or invalidate the hypothesis is not required. Surveys, monitoring, and/or management measures can possible be recommended. C. The hypothesis is assumed to be valid. Research, monitoring or surveys is recommended to validate or invalidate the hypothesis. Mitigating measures can be recommended if the hypothesis is proved to be valid. D. The hypothesis may be valid, but is not worth testing for professional, logistic, economic or ethical reasons, or because it is assumed to be of minor environmental influence only or of insignificant value for decision making.
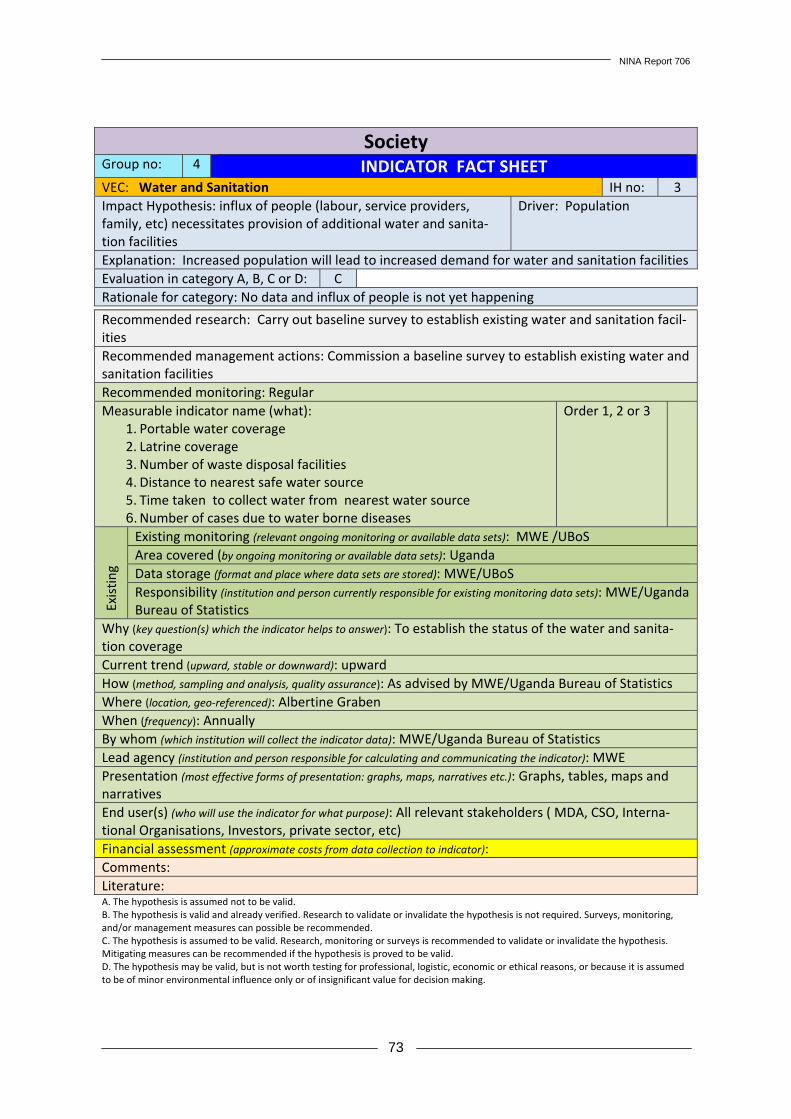
NINA Report 706
73
Society Group no: 4 INDICATOR FACT SHEETVEC: Water and Sanitation IH no: 3 Impact Hypothesis: influx of people (labour, service providers, family, etc) necessitates provision of additional water and sanita-tion facilities
Driver: Population
Explanation: Increased population will lead to increased demand for water and sanitation facilities Evaluation in category A, B, C or D: C Rationale for category: No data and influx of people is not yet happening
Recommended research: Carry out baseline survey to establish existing water and sanitation facil-ities Recommended management actions: Commission a baseline survey to establish existing water and sanitation facilities Recommended monitoring: Regular Measurable indicator name (what):
1. Portable water coverage 2. Latrine coverage 3. Number of waste disposal facilities 4. Distance to nearest safe water source 5. Time taken to collect water from nearest water source 6. Number of cases due to water borne diseases
Order 1, 2 or 3
Exis
ting
Existing monitoring (relevant ongoing monitoring or available data sets): MWE /UBoS Area covered (by ongoing monitoring or available data sets): Uganda Data storage (format and place where data sets are stored): MWE/UBoS Responsibility (institution and person currently responsible for existing monitoring data sets): MWE/Uganda Bureau of Statistics
Why (key question(s) which the indicator helps to answer): To establish the status of the water and sanita-tion coverage Current trend (upward, stable or downward): upward How (method, sampling and analysis, quality assurance): As advised by MWE/Uganda Bureau of Statistics Where (location, geo-referenced): Albertine Graben When (frequency): Annually By whom (which institution will collect the indicator data): MWE/Uganda Bureau of Statistics Lead agency (institution and person responsible for calculating and communicating the indicator): MWE Presentation (most effective forms of presentation: graphs, maps, narratives etc.): Graphs, tables, maps and narratives End user(s) (who will use the indicator for what purpose): All relevant stakeholders ( MDA, CSO, Interna-tional Organisations, Investors, private sector, etc) Financial assessment (approximate costs from data collection to indicator): Comments: Literature: A. The hypothesis is assumed not to be valid. B. The hypothesis is valid and already verified. Research to validate or invalidate the hypothesis is not required. Surveys, monitoring, and/or management measures can possible be recommended. C. The hypothesis is assumed to be valid. Research, monitoring or surveys is recommended to validate or invalidate the hypothesis. Mitigating measures can be recommended if the hypothesis is proved to be valid. D. The hypothesis may be valid, but is not worth testing for professional, logistic, economic or ethical reasons, or because it is assumed to be of minor environmental influence only or of insignificant value for decision making.
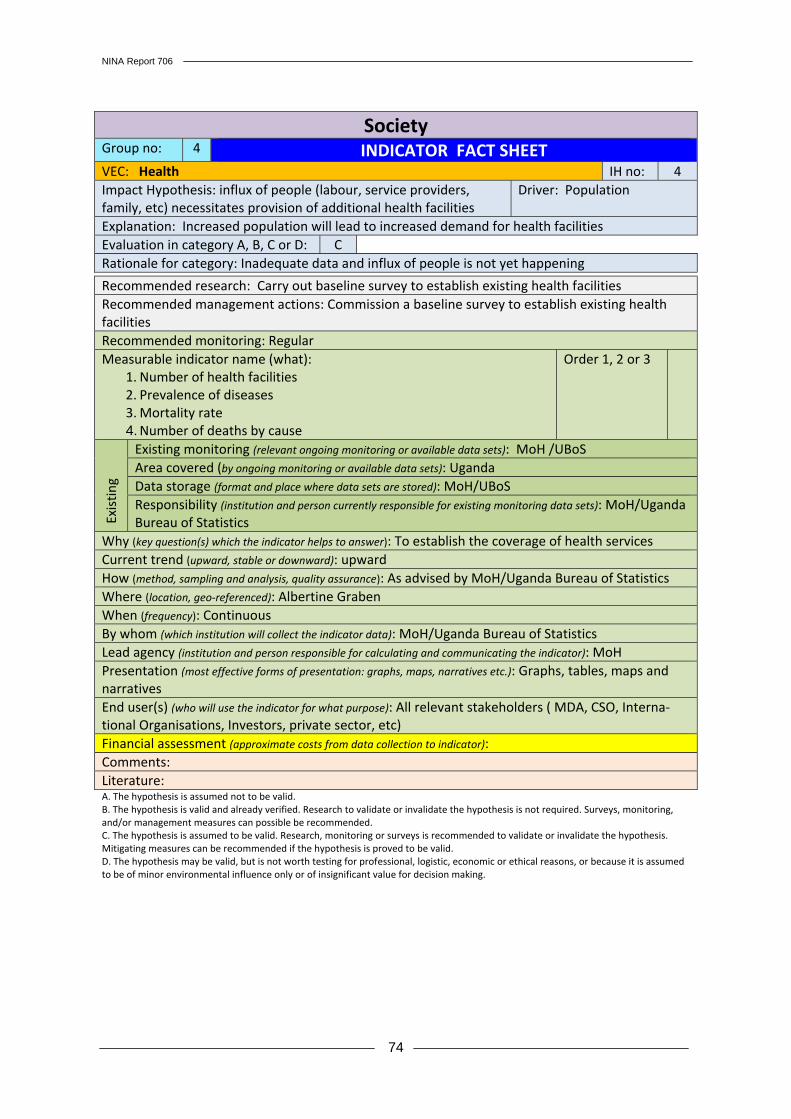
NINA Report 706
74
Society Group no: 4 INDICATOR FACT SHEETVEC: Health IH no: 4 Impact Hypothesis: influx of people (labour, service providers, family, etc) necessitates provision of additional health facilities
Driver: Population
Explanation: Increased population will lead to increased demand for health facilities Evaluation in category A, B, C or D: C Rationale for category: Inadequate data and influx of people is not yet happening
Recommended research: Carry out baseline survey to establish existing health facilities Recommended management actions: Commission a baseline survey to establish existing health facilities Recommended monitoring: Regular Measurable indicator name (what):
1. Number of health facilities 2. Prevalence of diseases 3. Mortality rate 4. Number of deaths by cause
Order 1, 2 or 3
Exis
ting
Existing monitoring (relevant ongoing monitoring or available data sets): MoH /UBoS Area covered (by ongoing monitoring or available data sets): Uganda Data storage (format and place where data sets are stored): MoH/UBoS Responsibility (institution and person currently responsible for existing monitoring data sets): MoH/Uganda Bureau of Statistics
Why (key question(s) which the indicator helps to answer): To establish the coverage of health services Current trend (upward, stable or downward): upward How (method, sampling and analysis, quality assurance): As advised by MoH/Uganda Bureau of Statistics Where (location, geo-referenced): Albertine Graben When (frequency): Continuous By whom (which institution will collect the indicator data): MoH/Uganda Bureau of Statistics Lead agency (institution and person responsible for calculating and communicating the indicator): MoH Presentation (most effective forms of presentation: graphs, maps, narratives etc.): Graphs, tables, maps and narratives End user(s) (who will use the indicator for what purpose): All relevant stakeholders ( MDA, CSO, Interna-tional Organisations, Investors, private sector, etc) Financial assessment (approximate costs from data collection to indicator): Comments: Literature: A. The hypothesis is assumed not to be valid. B. The hypothesis is valid and already verified. Research to validate or invalidate the hypothesis is not required. Surveys, monitoring, and/or management measures can possible be recommended. C. The hypothesis is assumed to be valid. Research, monitoring or surveys is recommended to validate or invalidate the hypothesis. Mitigating measures can be recommended if the hypothesis is proved to be valid. D. The hypothesis may be valid, but is not worth testing for professional, logistic, economic or ethical reasons, or because it is assumed to be of minor environmental influence only or of insignificant value for decision making.

NINA Report 706
75
Society Group no: 4 INDICATOR FACT SHEETVEC: Energy IH no: 5 Impact Hypothesis: Migration leads to changes in population densi-ty which result into increased demand for energy resources
Driver: Population
Explanation: The influx of people (labour, service providers, family, etc) people will require energy to light, cook, transport etc Evaluation in category A, B, C or D: C Rationale for category: No data and influx of people is not yet
Recommended research: carry out baseline survey to establish the energy resource demand Recommended management actions: Commission a baseline survey Recommended monitoring: Regular Measurable indicator name (what):
1. Types of energy sources 2. Number of people using energy source by type and quantity
Order 1, 2 or 3
Exis
ting
Existing monitoring (relevant ongoing monitoring or available data sets): UNHS, Bio-Mass study Area covered (by ongoing monitoring or available data sets): Uganda Data storage (format and place where data sets are stored): Uganda Bureau of Statistics Responsibility (institution and person currently responsible for existing monitoring data sets): Uganda Bu-reau of Statistics
Why (key question(s) which the indicator helps to answer): To know energy availability & consumption pat-terns Current trend (upward, stable or downward): upward How (method, sampling and analysis, quality assurance): As advised by Uganda Bureau of Statistics, NFA, MEMD Where (location, geo-referenced): Albertine Graben When (frequency): every 1-2 year By whom (which institution will collect the indicator data): Uganda Bureau of Statistics, NFA, MEMD Lead agency (institution and person responsible for calculating and communicating the indicator): MEMD Presentation (most effective forms of presentation: graphs, maps, narratives etc.): Graphs, tables, maps and narratives End user(s) (who will use the indicator for what purpose): All relevant stakeholders (MDA, CSO, Interna-tional Organizations, Investors, private sector, etc) Financial assessment (approximate costs from data collection to indicator): Comments: Literature: A. The hypothesis is assumed not to be valid. B. The hypothesis is valid and already verified. Research to validate or invalidate the hypothesis is not required. Surveys, monitoring, and/or management measures can possible be recommended. C. The hypothesis is assumed to be valid. Research, monitoring or surveys is recommended to validate or invalidate the hypothesis. Mitigating measures can be recommended if the hypothesis is proved to be valid. D. The hypothesis may be valid, but is not worth testing for professional, logistic, economic or ethical reasons, or because it is assumed to be of minor environmental influence only or of insignificant value for decision making.
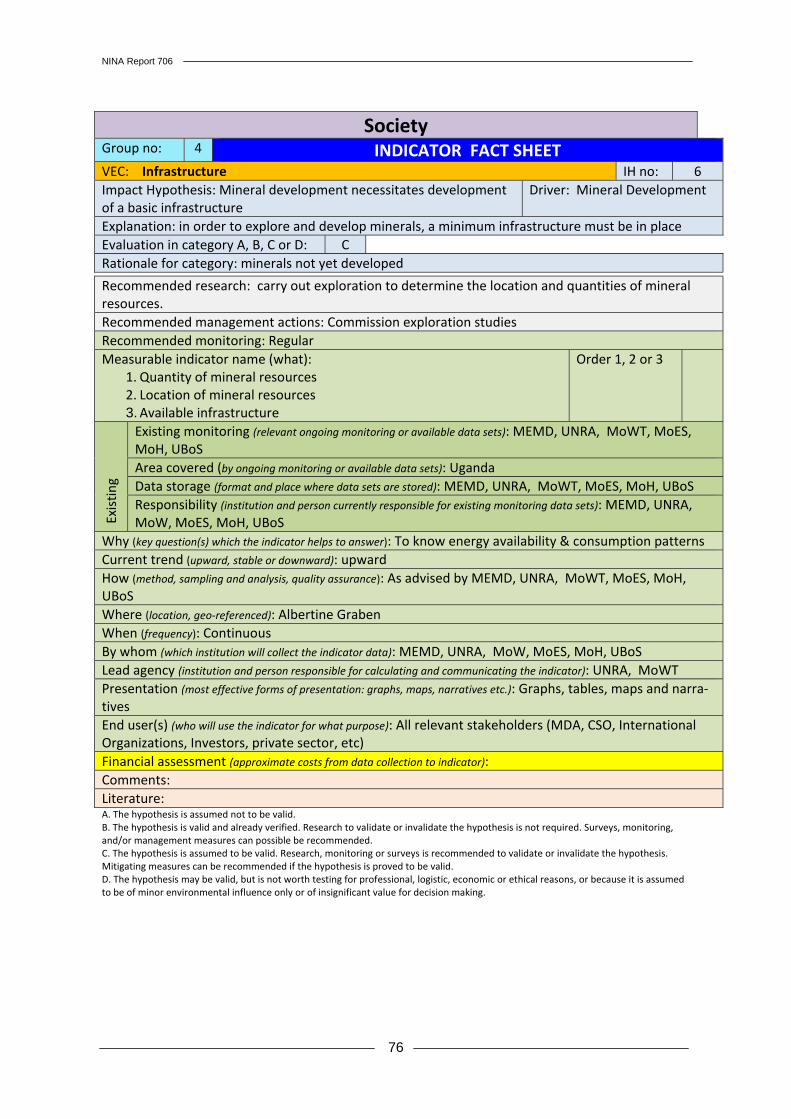
NINA Report 706
76
Society Group no: 4 INDICATOR FACT SHEET VEC: Infrastructure IH no: 6 Impact Hypothesis: Mineral development necessitates development of a basic infrastructure
Driver: Mineral Development
Explanation: in order to explore and develop minerals, a minimum infrastructure must be in place Evaluation in category A, B, C or D: C Rationale for category: minerals not yet developed
Recommended research: carry out exploration to determine the location and quantities of mineral resources. Recommended management actions: Commission exploration studies Recommended monitoring: Regular Measurable indicator name (what):
1. Quantity of mineral resources 2. Location of mineral resources 3. Available infrastructure
Order 1, 2 or 3
Exis
ting
Existing monitoring (relevant ongoing monitoring or available data sets): MEMD, UNRA, MoWT, MoES, MoH, UBoS Area covered (by ongoing monitoring or available data sets): Uganda Data storage (format and place where data sets are stored): MEMD, UNRA, MoWT, MoES, MoH, UBoS Responsibility (institution and person currently responsible for existing monitoring data sets): MEMD, UNRA, MoW, MoES, MoH, UBoS
Why (key question(s) which the indicator helps to answer): To know energy availability & consumption patterns Current trend (upward, stable or downward): upward How (method, sampling and analysis, quality assurance): As advised by MEMD, UNRA, MoWT, MoES, MoH, UBoS Where (location, geo-referenced): Albertine Graben When (frequency): Continuous By whom (which institution will collect the indicator data): MEMD, UNRA, MoW, MoES, MoH, UBoS Lead agency (institution and person responsible for calculating and communicating the indicator): UNRA, MoWT Presentation (most effective forms of presentation: graphs, maps, narratives etc.): Graphs, tables, maps and narra-tives End user(s) (who will use the indicator for what purpose): All relevant stakeholders (MDA, CSO, International Organizations, Investors, private sector, etc) Financial assessment (approximate costs from data collection to indicator): Comments: Literature: A. The hypothesis is assumed not to be valid. B. The hypothesis is valid and already verified. Research to validate or invalidate the hypothesis is not required. Surveys, monitoring, and/or management measures can possible be recommended. C. The hypothesis is assumed to be valid. Research, monitoring or surveys is recommended to validate or invalidate the hypothesis. Mitigating measures can be recommended if the hypothesis is proved to be valid. D. The hypothesis may be valid, but is not worth testing for professional, logistic, economic or ethical reasons, or because it is assumed to be of minor environmental influence only or of insignificant value for decision making.
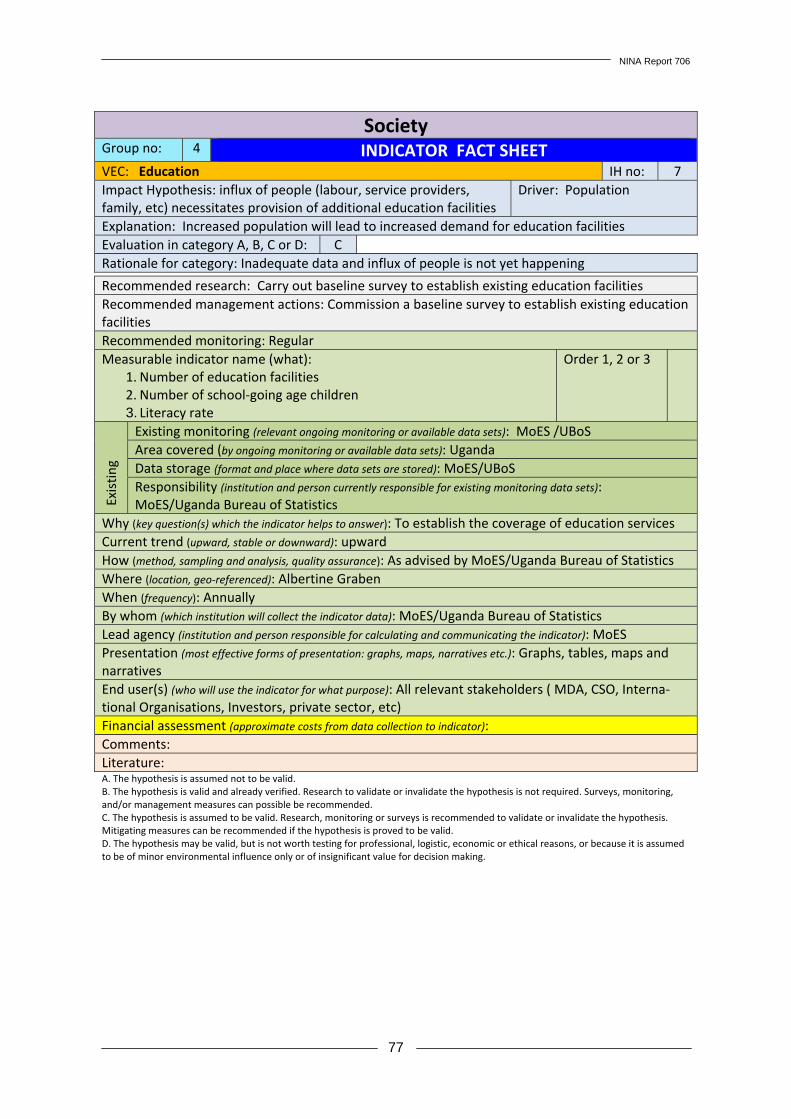
NINA Report 706
77
Society Group no: 4 INDICATOR FACT SHEETVEC: Education IH no: 7 Impact Hypothesis: influx of people (labour, service providers, family, etc) necessitates provision of additional education facilities
Driver: Population
Explanation: Increased population will lead to increased demand for education facilities Evaluation in category A, B, C or D: C Rationale for category: Inadequate data and influx of people is not yet happening
Recommended research: Carry out baseline survey to establish existing education facilities Recommended management actions: Commission a baseline survey to establish existing education facilities Recommended monitoring: Regular Measurable indicator name (what):
1. Number of education facilities 2. Number of school-going age children 3. Literacy rate
Order 1, 2 or 3
Exis
ting
Existing monitoring (relevant ongoing monitoring or available data sets): MoES /UBoS Area covered (by ongoing monitoring or available data sets): Uganda Data storage (format and place where data sets are stored): MoES/UBoS Responsibility (institution and person currently responsible for existing monitoring data sets): MoES/Uganda Bureau of Statistics
Why (key question(s) which the indicator helps to answer): To establish the coverage of education services Current trend (upward, stable or downward): upward How (method, sampling and analysis, quality assurance): As advised by MoES/Uganda Bureau of Statistics Where (location, geo-referenced): Albertine Graben When (frequency): Annually By whom (which institution will collect the indicator data): MoES/Uganda Bureau of Statistics Lead agency (institution and person responsible for calculating and communicating the indicator): MoES Presentation (most effective forms of presentation: graphs, maps, narratives etc.): Graphs, tables, maps and narratives End user(s) (who will use the indicator for what purpose): All relevant stakeholders ( MDA, CSO, Interna-tional Organisations, Investors, private sector, etc) Financial assessment (approximate costs from data collection to indicator): Comments: Literature: A. The hypothesis is assumed not to be valid. B. The hypothesis is valid and already verified. Research to validate or invalidate the hypothesis is not required. Surveys, monitoring, and/or management measures can possible be recommended. C. The hypothesis is assumed to be valid. Research, monitoring or surveys is recommended to validate or invalidate the hypothesis. Mitigating measures can be recommended if the hypothesis is proved to be valid. D. The hypothesis may be valid, but is not worth testing for professional, logistic, economic or ethical reasons, or because it is assumed to be of minor environmental influence only or of insignificant value for decision making.
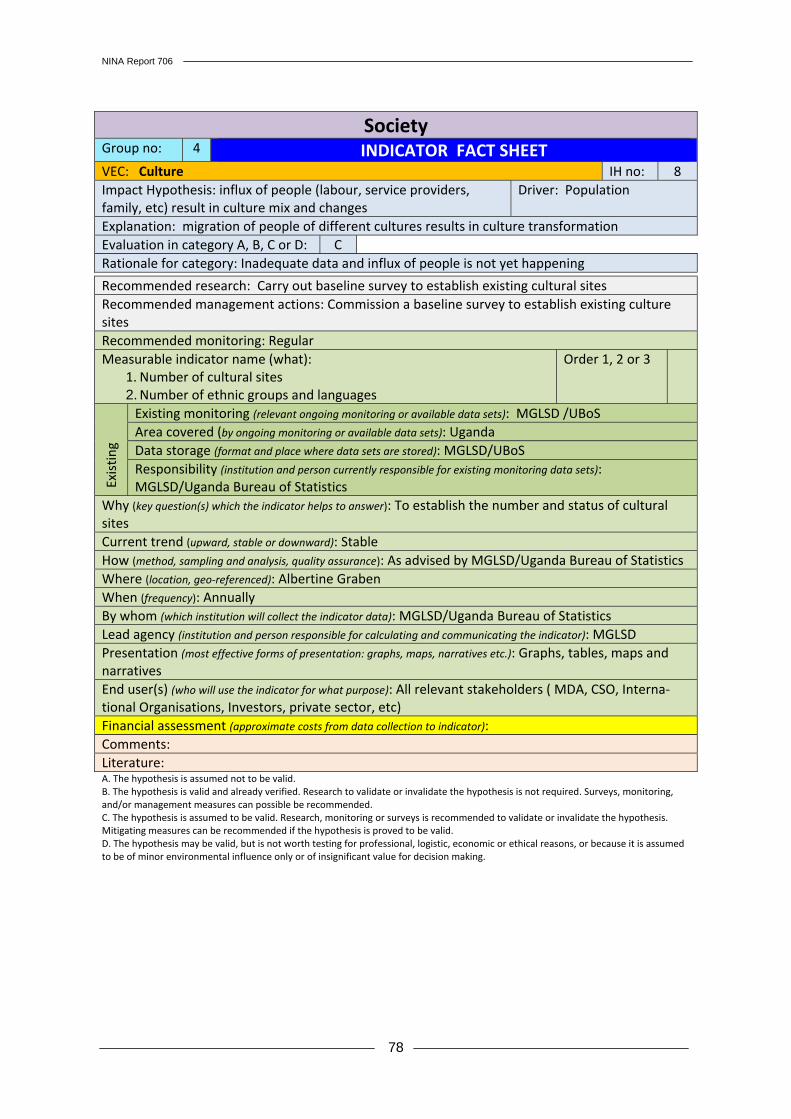
NINA Report 706
78
Society Group no: 4 INDICATOR FACT SHEETVEC: Culture IH no: 8 Impact Hypothesis: influx of people (labour, service providers, family, etc) result in culture mix and changes
Driver: Population
Explanation: migration of people of different cultures results in culture transformation Evaluation in category A, B, C or D: C Rationale for category: Inadequate data and influx of people is not yet happening
Recommended research: Carry out baseline survey to establish existing cultural sites Recommended management actions: Commission a baseline survey to establish existing culture sites Recommended monitoring: Regular Measurable indicator name (what):
1. Number of cultural sites 2. Number of ethnic groups and languages
Order 1, 2 or 3
Exis
ting
Existing monitoring (relevant ongoing monitoring or available data sets): MGLSD /UBoS Area covered (by ongoing monitoring or available data sets): Uganda Data storage (format and place where data sets are stored): MGLSD/UBoS Responsibility (institution and person currently responsible for existing monitoring data sets): MGLSD/Uganda Bureau of Statistics
Why (key question(s) which the indicator helps to answer): To establish the number and status of cultural sites Current trend (upward, stable or downward): Stable How (method, sampling and analysis, quality assurance): As advised by MGLSD/Uganda Bureau of Statistics Where (location, geo-referenced): Albertine Graben When (frequency): Annually By whom (which institution will collect the indicator data): MGLSD/Uganda Bureau of Statistics Lead agency (institution and person responsible for calculating and communicating the indicator): MGLSD Presentation (most effective forms of presentation: graphs, maps, narratives etc.): Graphs, tables, maps and narratives End user(s) (who will use the indicator for what purpose): All relevant stakeholders ( MDA, CSO, Interna-tional Organisations, Investors, private sector, etc) Financial assessment (approximate costs from data collection to indicator): Comments: Literature: A. The hypothesis is assumed not to be valid. B. The hypothesis is valid and already verified. Research to validate or invalidate the hypothesis is not required. Surveys, monitoring, and/or management measures can possible be recommended. C. The hypothesis is assumed to be valid. Research, monitoring or surveys is recommended to validate or invalidate the hypothesis. Mitigating measures can be recommended if the hypothesis is proved to be valid. D. The hypothesis may be valid, but is not worth testing for professional, logistic, economic or ethical reasons, or because it is assumed to be of minor environmental influence only or of insignificant value for decision making.
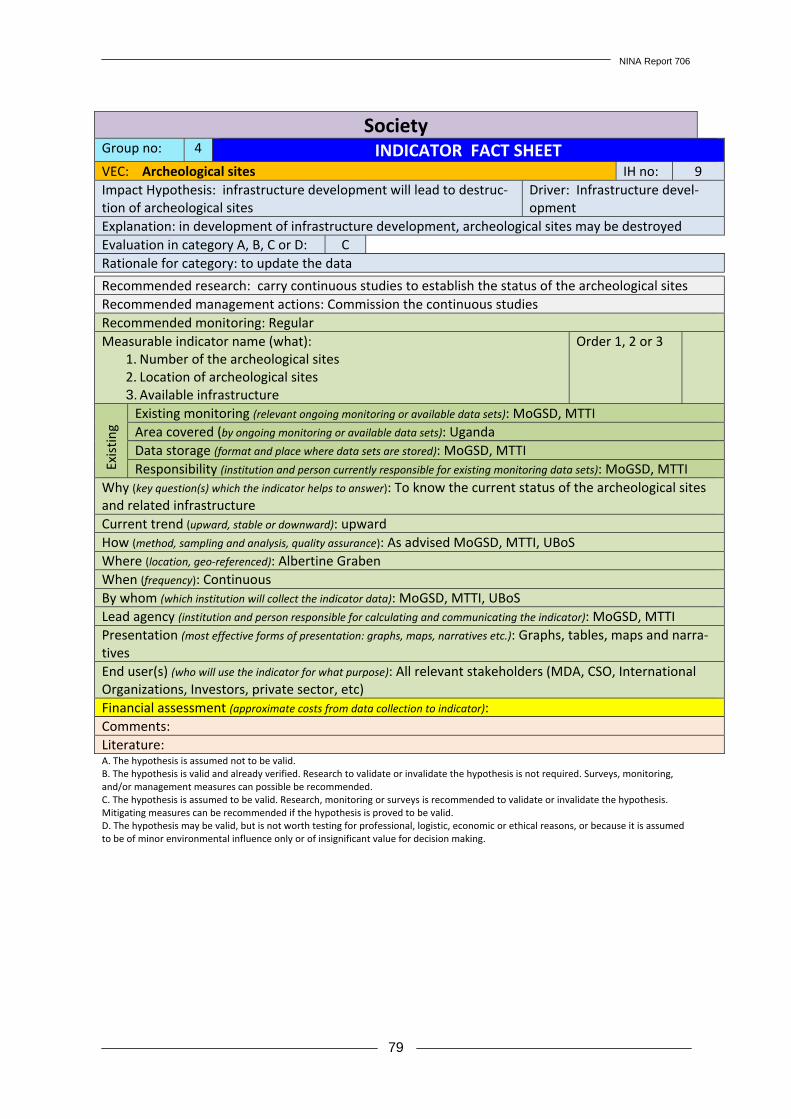
NINA Report 706
79
Society Group no: 4 INDICATOR FACT SHEET VEC: Archeological sites IH no: 9 Impact Hypothesis: infrastructure development will lead to destruc-tion of archeological sites
Driver: Infrastructure devel-opment
Explanation: in development of infrastructure development, archeological sites may be destroyed Evaluation in category A, B, C or D: C Rationale for category: to update the data
Recommended research: carry continuous studies to establish the status of the archeological sites Recommended management actions: Commission the continuous studies Recommended monitoring: Regular Measurable indicator name (what):
1. Number of the archeological sites 2. Location of archeological sites 3. Available infrastructure
Order 1, 2 or 3
Exis
ting
Existing monitoring (relevant ongoing monitoring or available data sets): MoGSD, MTTI Area covered (by ongoing monitoring or available data sets): Uganda Data storage (format and place where data sets are stored): MoGSD, MTTI Responsibility (institution and person currently responsible for existing monitoring data sets): MoGSD, MTTI
Why (key question(s) which the indicator helps to answer): To know the current status of the archeological sites and related infrastructure Current trend (upward, stable or downward): upward How (method, sampling and analysis, quality assurance): As advised MoGSD, MTTI, UBoS Where (location, geo-referenced): Albertine Graben When (frequency): Continuous By whom (which institution will collect the indicator data): MoGSD, MTTI, UBoS Lead agency (institution and person responsible for calculating and communicating the indicator): MoGSD, MTTI Presentation (most effective forms of presentation: graphs, maps, narratives etc.): Graphs, tables, maps and narra-tives End user(s) (who will use the indicator for what purpose): All relevant stakeholders (MDA, CSO, International Organizations, Investors, private sector, etc) Financial assessment (approximate costs from data collection to indicator): Comments: Literature: A. The hypothesis is assumed not to be valid. B. The hypothesis is valid and already verified. Research to validate or invalidate the hypothesis is not required. Surveys, monitoring, and/or management measures can possible be recommended. C. The hypothesis is assumed to be valid. Research, monitoring or surveys is recommended to validate or invalidate the hypothesis. Mitigating measures can be recommended if the hypothesis is proved to be valid. D. The hypothesis may be valid, but is not worth testing for professional, logistic, economic or ethical reasons, or because it is assumed to be of minor environmental influence only or of insignificant value for decision making.

NINA Report 706
80
2.8 Management and business issues 2.8.1 Valued Ecosystem Components Group no: 5 Issue: Management and business issuesValued Ecosystem Components, ranked
Associated drivers, ranked (after group work 2)
Phase Comments
VEC 1 Tourism Land take, borrow pits and roads Noise and vibrations Oil spills Visual intrusion
VEC 2 Fisheries Oil spills and blowouts Vibrations Noise Aquatic disturbance (platforms)
VEC 3 Agriculture Land take Shifts in economic activity Increased demand for food
VEC 4 Transport Traffic VEC 5 Forestry Settlements and infrastructure
development
Increased supply of oil and gas products
VEC 6 Construction materials Settlements and infrastructure development
Material source restrictions (e.g. sand)
2.8.2 Drivers Group no: 5 Issue: Management and business issuesOverall rank
Drivers\phase
Explo-ration
Develop-ment
Produc-tion
Decom-missioning
Others
Land take, borrow pits and roads
Noise and vibrations Oil spills and blow outs Visual intrusion Aquatic disturbance (platforms) Vibrations Shifts in economic activity Increased demand for food Traffic Settlements and infrastructure
development
Increased supply of oil and gas products
Material source restrictions (e.g. sand)
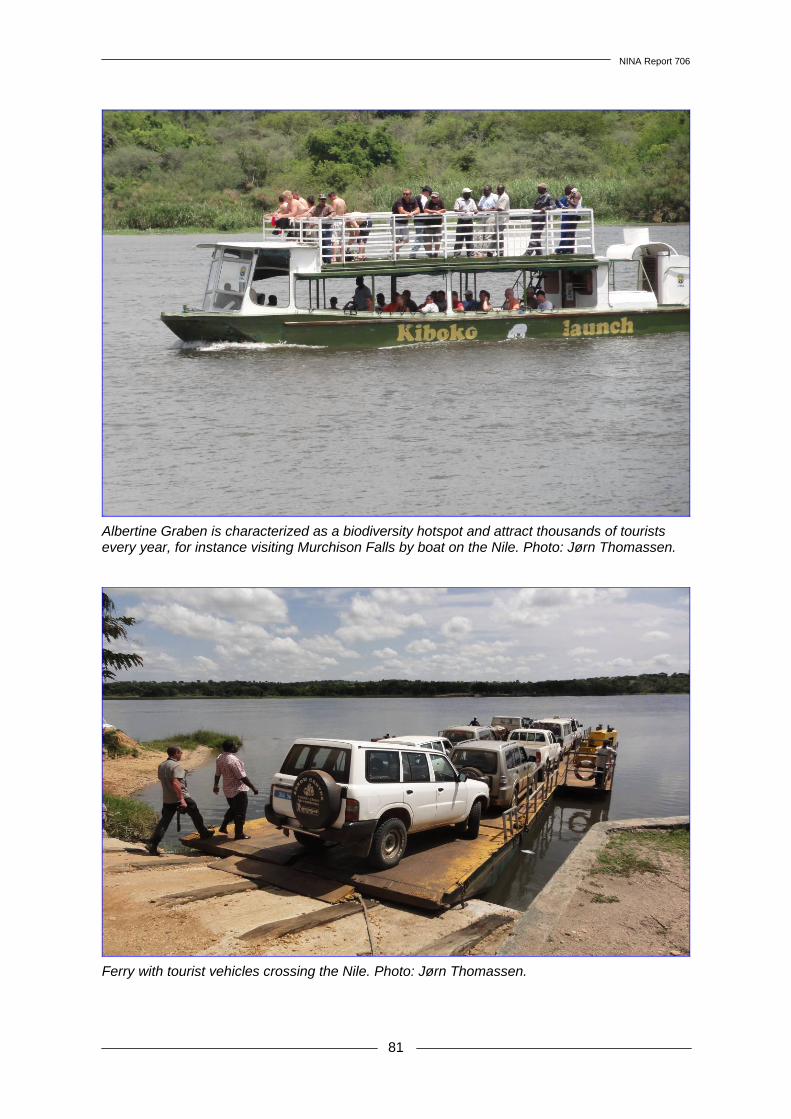
NINA Report 706
81
Albertine Graben is characterized as a biodiversity hotspot and attract thousands of tourists every year, for instance visiting Murchison Falls by boat on the Nile. Photo: Jørn Thomassen.
Ferry with tourist vehicles crossing the Nile. Photo: Jørn Thomassen.
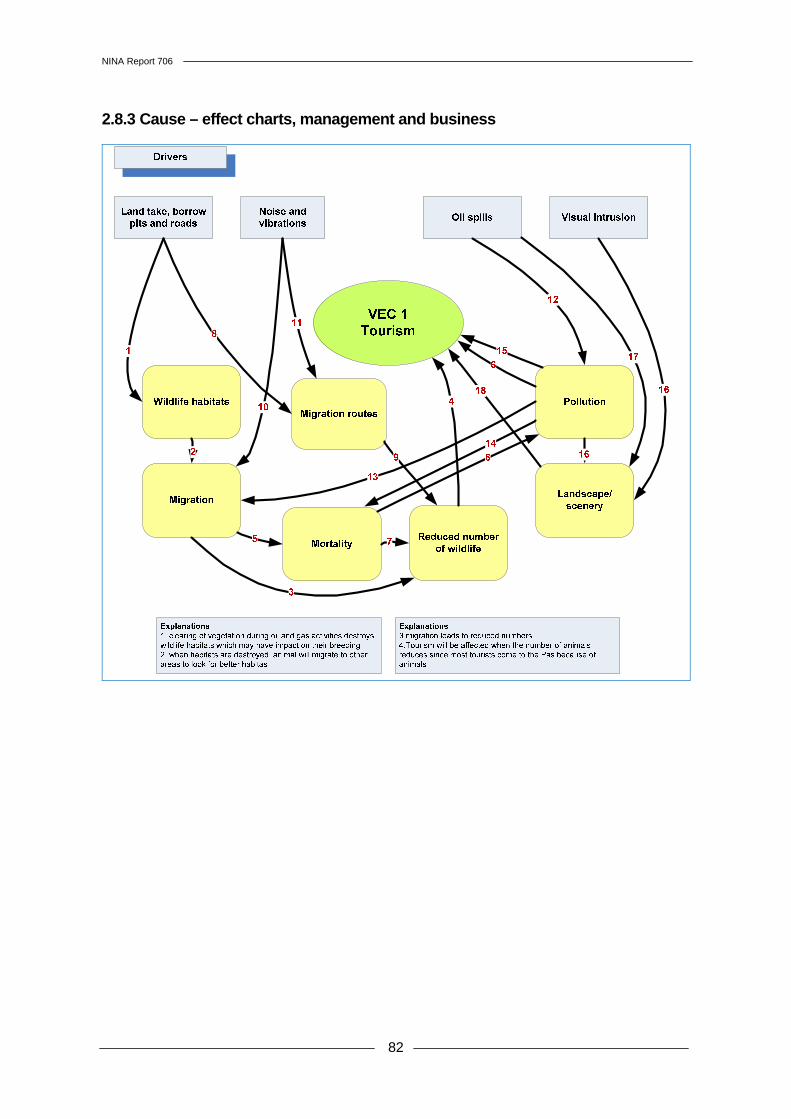
NINA Report 706
82
2.8.3 Cause – effect charts, management and business
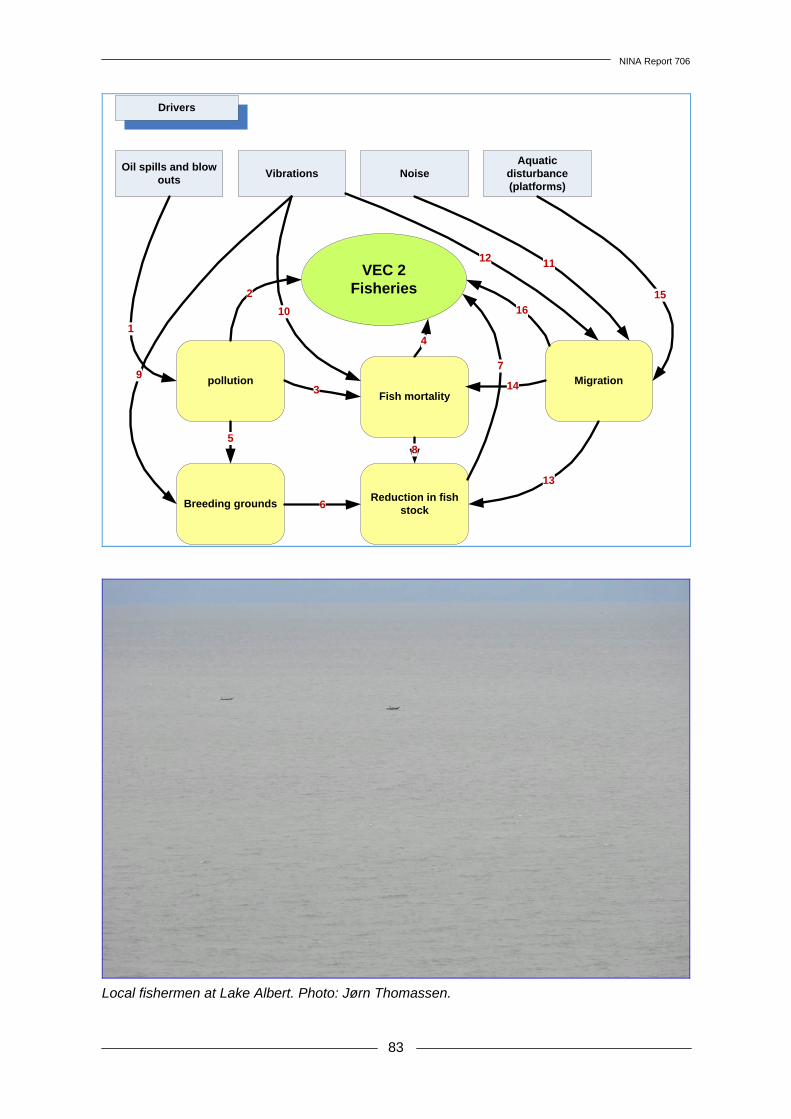
NINA Report 706
83
VEC 2Fisheries
Oil spills and blow outs
Drivers
Vibrations NoiseAquatic
disturbance (platforms)
pollution
1
Fish mortality
Migration
Breeding groundsReduction in fish
stock
2
3
4
5
6
7
8
9
10
1112
13
14
15
16
Local fishermen at Lake Albert. Photo: Jørn Thomassen.
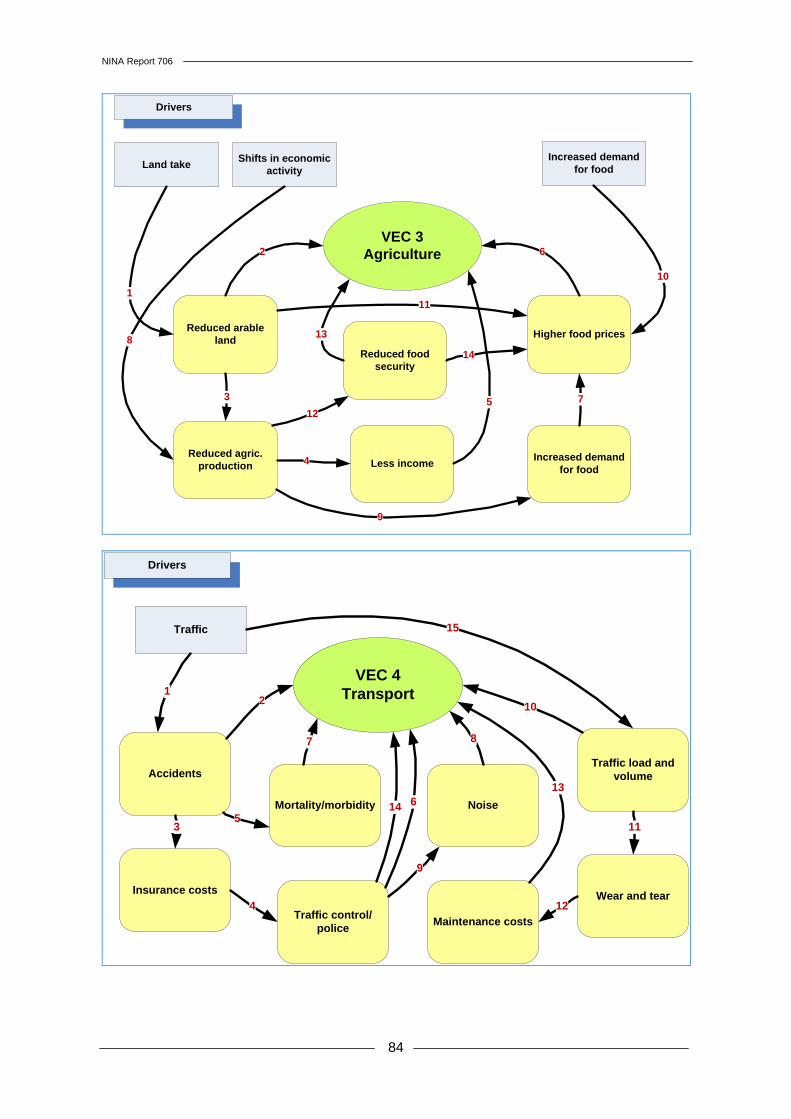
NINA Report 706
84
VEC 3Agriculture
Land take
Drivers
Shifts in economic activity
Increased demand for food
Reduced arable land
1
Higher food prices
Reduced agric. production Less income
Increased demand for food
2
3
4
5
6
7
8
9
10
11
Reduced food security
12
13
14
VEC 4Transport
Drivers
Traffic
Accidents
1
Mortality/morbidity Noise
Insurance costs
Traffic control/police
Wear and tear
Maintenance costs
2
3
4
5
6
7 8
9
Traffic load and volume
10
11
12
13
15
14
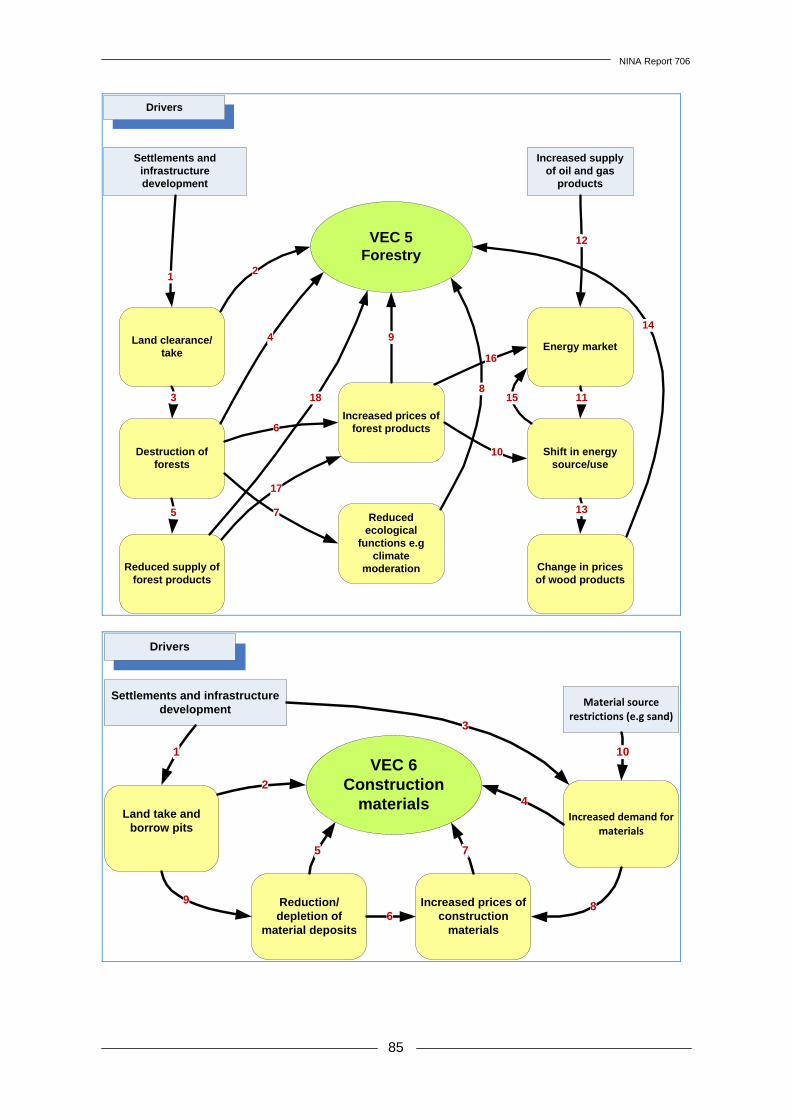
NINA Report 706
85
VEC 5Forestry
Settlements and infrastructure development
Drivers
Increased supply of oil and gas
products
Land clearance/take
1
Energy market
Destruction of forests
Increased prices of forest products
Shift in energy source/use
Reduced supply of forest products
Reduced ecological
functions e.g climate
moderation Change in prices of wood products
2
3
4
5
6
7
8
9
10
11
12
13
14
15
16
17
18
VEC 6Construction
materials
Settlements and infrastructure development
Drivers
Material source restrictions (e.g sand)
Land take and borrow pits
1
Increased demand for materials
Reduction/depletion of
material deposits
Increased prices of construction
materials
2
9
5
68
3
4
7
10
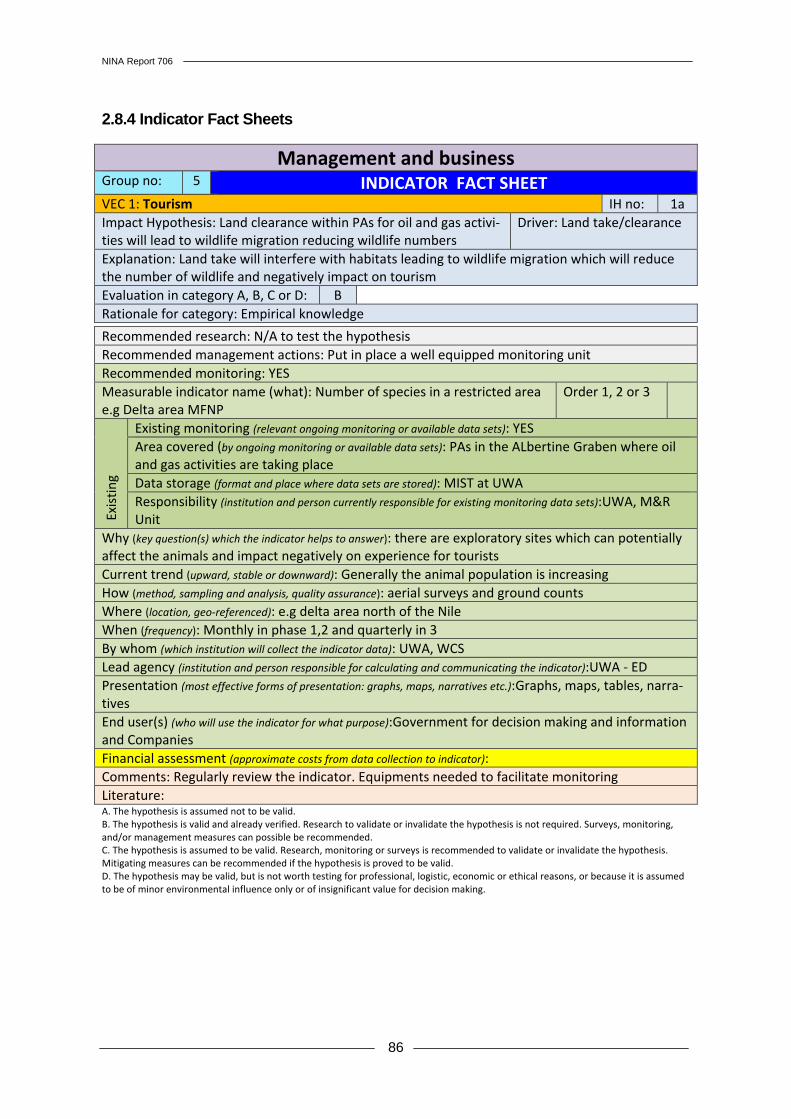
NINA Report 706
86
2.8.4 Indicator Fact Sheets
Management and business Group no: 5 INDICATOR FACT SHEETVEC 1: Tourism IH no: 1a Impact Hypothesis: Land clearance within PAs for oil and gas activi-ties will lead to wildlife migration reducing wildlife numbers
Driver: Land take/clearance
Explanation: Land take will interfere with habitats leading to wildlife migration which will reduce the number of wildlife and negatively impact on tourism Evaluation in category A, B, C or D: B Rationale for category: Empirical knowledge
Recommended research: N/A to test the hypothesis Recommended management actions: Put in place a well equipped monitoring unit Recommended monitoring: YES Measurable indicator name (what): Number of species in a restricted area e.g Delta area MFNP
Order 1, 2 or 3
Exis
ting
Existing monitoring (relevant ongoing monitoring or available data sets): YES Area covered (by ongoing monitoring or available data sets): PAs in the ALbertine Graben where oil and gas activities are taking place Data storage (format and place where data sets are stored): MIST at UWA Responsibility (institution and person currently responsible for existing monitoring data sets):UWA, M&R Unit
Why (key question(s) which the indicator helps to answer): there are exploratory sites which can potentially affect the animals and impact negatively on experience for tourists Current trend (upward, stable or downward): Generally the animal population is increasing How (method, sampling and analysis, quality assurance): aerial surveys and ground counts Where (location, geo-referenced): e.g delta area north of the Nile When (frequency): Monthly in phase 1,2 and quarterly in 3 By whom (which institution will collect the indicator data): UWA, WCS Lead agency (institution and person responsible for calculating and communicating the indicator):UWA - ED Presentation (most effective forms of presentation: graphs, maps, narratives etc.):Graphs, maps, tables, narra-tives End user(s) (who will use the indicator for what purpose):Government for decision making and information and Companies Financial assessment (approximate costs from data collection to indicator): Comments: Regularly review the indicator. Equipments needed to facilitate monitoring Literature: A. The hypothesis is assumed not to be valid. B. The hypothesis is valid and already verified. Research to validate or invalidate the hypothesis is not required. Surveys, monitoring, and/or management measures can possible be recommended. C. The hypothesis is assumed to be valid. Research, monitoring or surveys is recommended to validate or invalidate the hypothesis. Mitigating measures can be recommended if the hypothesis is proved to be valid. D. The hypothesis may be valid, but is not worth testing for professional, logistic, economic or ethical reasons, or because it is assumed to be of minor environmental influence only or of insignificant value for decision making.
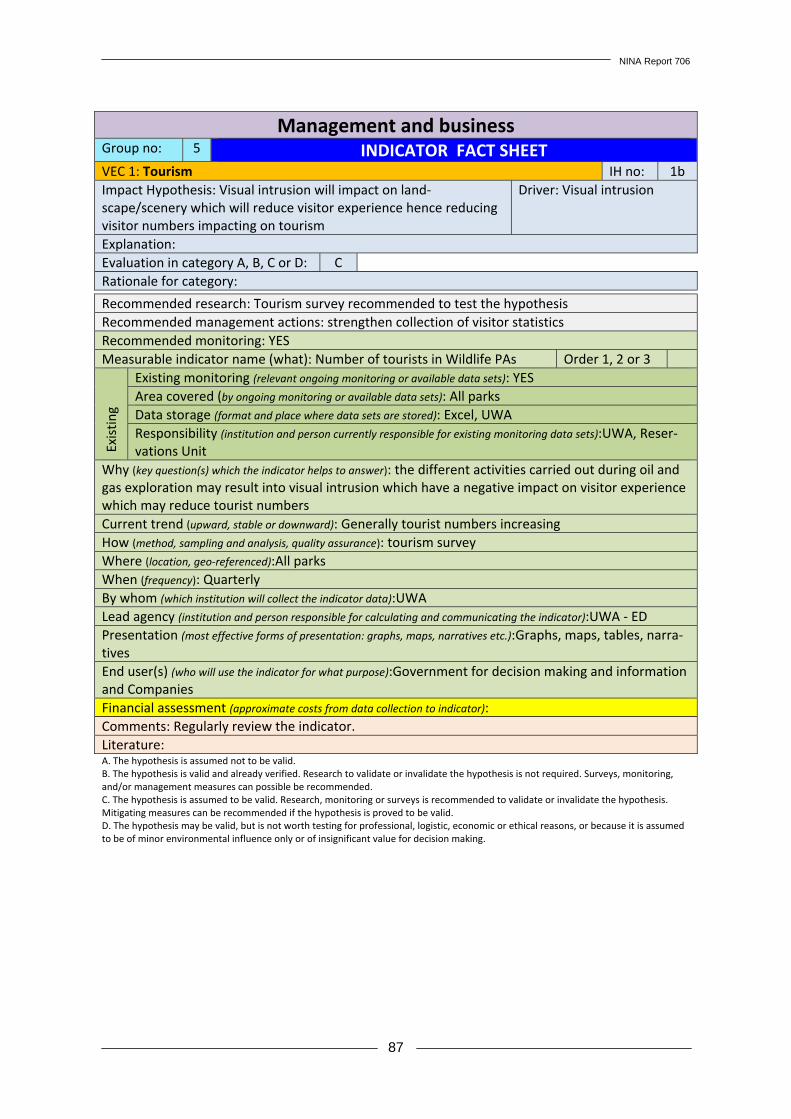
NINA Report 706
87
Management and business Group no: 5 INDICATOR FACT SHEETVEC 1: Tourism IH no: 1b Impact Hypothesis: Visual intrusion will impact on land-scape/scenery which will reduce visitor experience hence reducing visitor numbers impacting on tourism
Driver: Visual intrusion
Explanation: Evaluation in category A, B, C or D: C Rationale for category:
Recommended research: Tourism survey recommended to test the hypothesis Recommended management actions: strengthen collection of visitor statistics Recommended monitoring: YES Measurable indicator name (what): Number of tourists in Wildlife PAs Order 1, 2 or 3
Exis
ting
Existing monitoring (relevant ongoing monitoring or available data sets): YES Area covered (by ongoing monitoring or available data sets): All parks Data storage (format and place where data sets are stored): Excel, UWA Responsibility (institution and person currently responsible for existing monitoring data sets):UWA, Reser-vations Unit
Why (key question(s) which the indicator helps to answer): the different activities carried out during oil and gas exploration may result into visual intrusion which have a negative impact on visitor experience which may reduce tourist numbers Current trend (upward, stable or downward): Generally tourist numbers increasing How (method, sampling and analysis, quality assurance): tourism survey Where (location, geo-referenced):All parks When (frequency): Quarterly By whom (which institution will collect the indicator data):UWA Lead agency (institution and person responsible for calculating and communicating the indicator):UWA - ED Presentation (most effective forms of presentation: graphs, maps, narratives etc.):Graphs, maps, tables, narra-tives End user(s) (who will use the indicator for what purpose):Government for decision making and information and Companies Financial assessment (approximate costs from data collection to indicator): Comments: Regularly review the indicator. Literature: A. The hypothesis is assumed not to be valid. B. The hypothesis is valid and already verified. Research to validate or invalidate the hypothesis is not required. Surveys, monitoring, and/or management measures can possible be recommended. C. The hypothesis is assumed to be valid. Research, monitoring or surveys is recommended to validate or invalidate the hypothesis. Mitigating measures can be recommended if the hypothesis is proved to be valid. D. The hypothesis may be valid, but is not worth testing for professional, logistic, economic or ethical reasons, or because it is assumed to be of minor environmental influence only or of insignificant value for decision making.
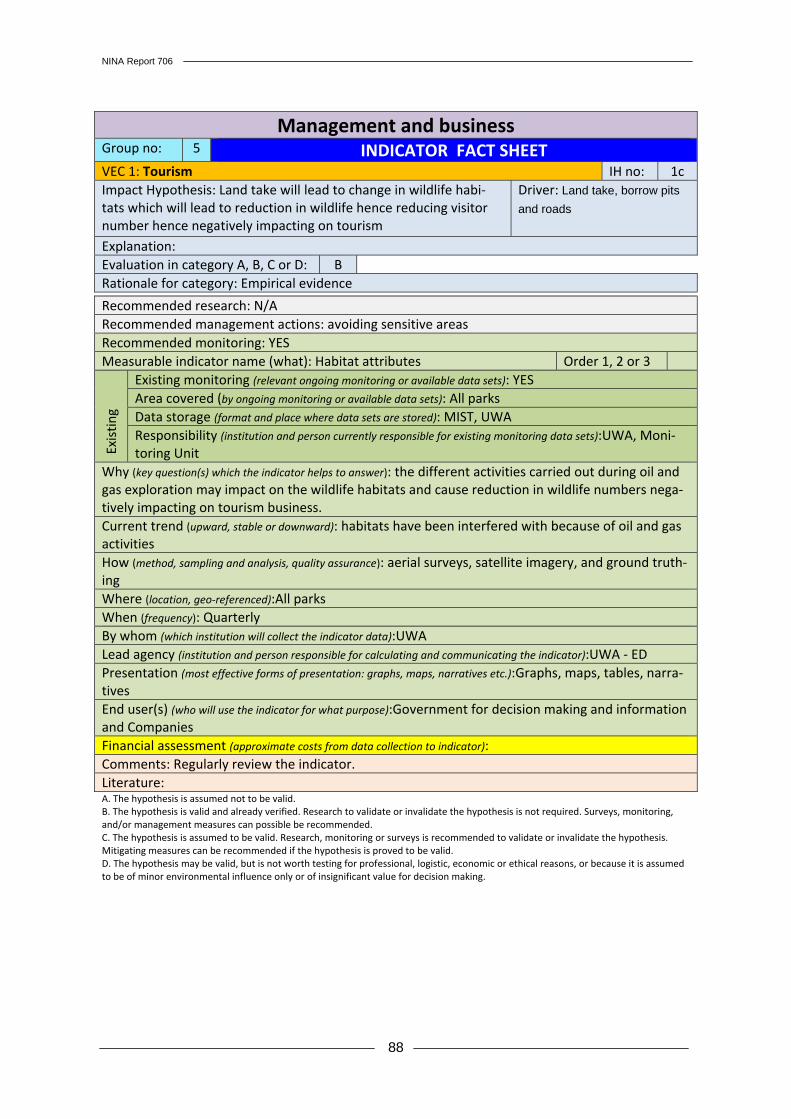
NINA Report 706
88
Management and business Group no: 5 INDICATOR FACT SHEETVEC 1: Tourism IH no: 1c Impact Hypothesis: Land take will lead to change in wildlife habi-tats which will lead to reduction in wildlife hence reducing visitor number hence negatively impacting on tourism
Driver: Land take, borrow pits
and roads
Explanation: Evaluation in category A, B, C or D: B Rationale for category: Empirical evidence
Recommended research: N/A Recommended management actions: avoiding sensitive areas Recommended monitoring: YES Measurable indicator name (what): Habitat attributes Order 1, 2 or 3
Exis
ting
Existing monitoring (relevant ongoing monitoring or available data sets): YES Area covered (by ongoing monitoring or available data sets): All parks Data storage (format and place where data sets are stored): MIST, UWA Responsibility (institution and person currently responsible for existing monitoring data sets):UWA, Moni-toring Unit
Why (key question(s) which the indicator helps to answer): the different activities carried out during oil and gas exploration may impact on the wildlife habitats and cause reduction in wildlife numbers nega-tively impacting on tourism business. Current trend (upward, stable or downward): habitats have been interfered with because of oil and gas activities How (method, sampling and analysis, quality assurance): aerial surveys, satellite imagery, and ground truth-ing Where (location, geo-referenced):All parks When (frequency): Quarterly By whom (which institution will collect the indicator data):UWA Lead agency (institution and person responsible for calculating and communicating the indicator):UWA - ED Presentation (most effective forms of presentation: graphs, maps, narratives etc.):Graphs, maps, tables, narra-tives End user(s) (who will use the indicator for what purpose):Government for decision making and information and Companies Financial assessment (approximate costs from data collection to indicator): Comments: Regularly review the indicator. Literature: A. The hypothesis is assumed not to be valid. B. The hypothesis is valid and already verified. Research to validate or invalidate the hypothesis is not required. Surveys, monitoring, and/or management measures can possible be recommended. C. The hypothesis is assumed to be valid. Research, monitoring or surveys is recommended to validate or invalidate the hypothesis. Mitigating measures can be recommended if the hypothesis is proved to be valid. D. The hypothesis may be valid, but is not worth testing for professional, logistic, economic or ethical reasons, or because it is assumed to be of minor environmental influence only or of insignificant value for decision making.
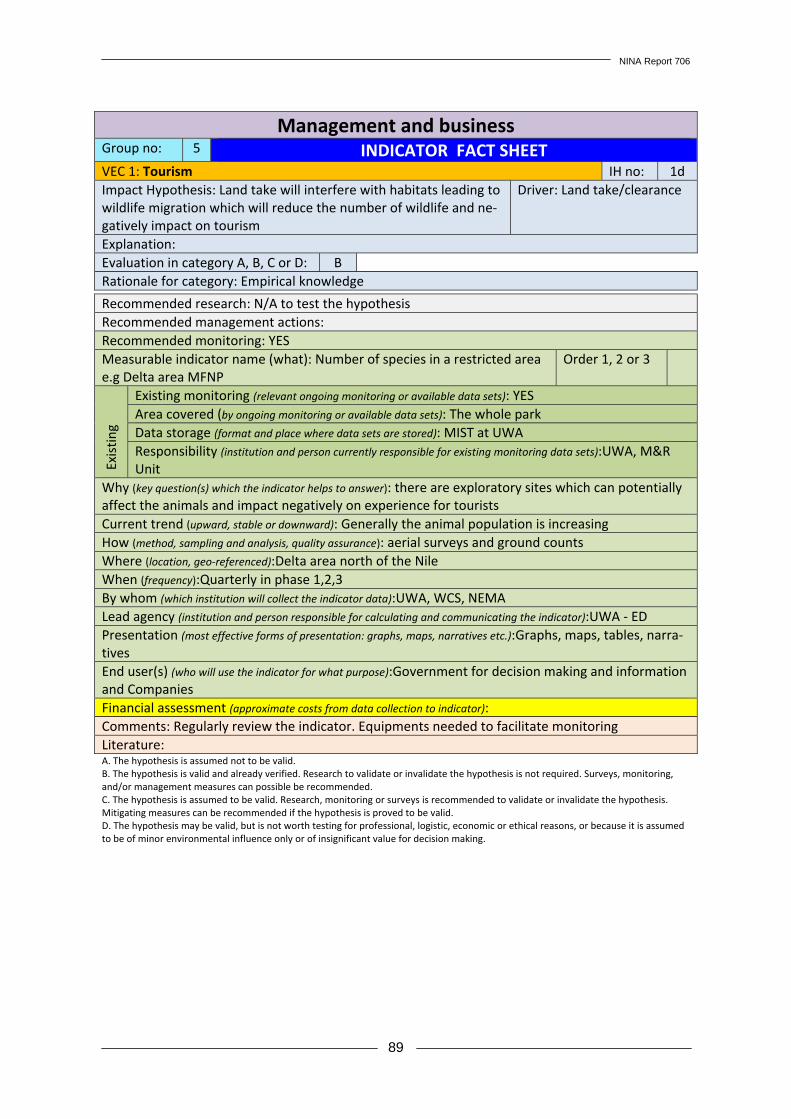
NINA Report 706
89
Management and business Group no: 5 INDICATOR FACT SHEETVEC 1: Tourism IH no: 1d Impact Hypothesis: Land take will interfere with habitats leading to wildlife migration which will reduce the number of wildlife and ne-gatively impact on tourism
Driver: Land take/clearance
Explanation: Evaluation in category A, B, C or D: B Rationale for category: Empirical knowledge
Recommended research: N/A to test the hypothesis Recommended management actions: Recommended monitoring: YES Measurable indicator name (what): Number of species in a restricted area e.g Delta area MFNP
Order 1, 2 or 3
Exis
ting
Existing monitoring (relevant ongoing monitoring or available data sets): YES Area covered (by ongoing monitoring or available data sets): The whole park Data storage (format and place where data sets are stored): MIST at UWA Responsibility (institution and person currently responsible for existing monitoring data sets):UWA, M&R Unit
Why (key question(s) which the indicator helps to answer): there are exploratory sites which can potentially affect the animals and impact negatively on experience for tourists Current trend (upward, stable or downward): Generally the animal population is increasing How (method, sampling and analysis, quality assurance): aerial surveys and ground counts Where (location, geo-referenced):Delta area north of the Nile When (frequency):Quarterly in phase 1,2,3 By whom (which institution will collect the indicator data):UWA, WCS, NEMA Lead agency (institution and person responsible for calculating and communicating the indicator):UWA - ED Presentation (most effective forms of presentation: graphs, maps, narratives etc.):Graphs, maps, tables, narra-tives End user(s) (who will use the indicator for what purpose):Government for decision making and information and Companies Financial assessment (approximate costs from data collection to indicator): Comments: Regularly review the indicator. Equipments needed to facilitate monitoring Literature: A. The hypothesis is assumed not to be valid. B. The hypothesis is valid and already verified. Research to validate or invalidate the hypothesis is not required. Surveys, monitoring, and/or management measures can possible be recommended. C. The hypothesis is assumed to be valid. Research, monitoring or surveys is recommended to validate or invalidate the hypothesis. Mitigating measures can be recommended if the hypothesis is proved to be valid. D. The hypothesis may be valid, but is not worth testing for professional, logistic, economic or ethical reasons, or because it is assumed to be of minor environmental influence only or of insignificant value for decision making.
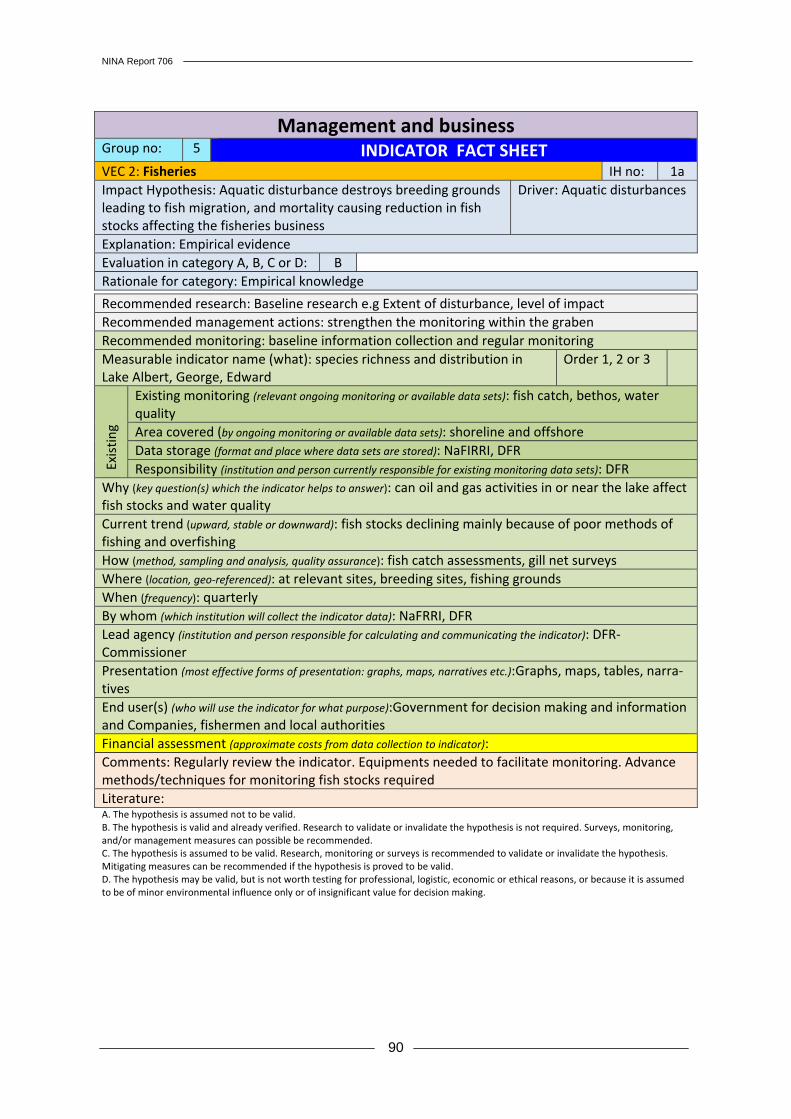
NINA Report 706
90
Management and business Group no: 5 INDICATOR FACT SHEETVEC 2: Fisheries IH no: 1a Impact Hypothesis: Aquatic disturbance destroys breeding grounds leading to fish migration, and mortality causing reduction in fish stocks affecting the fisheries business
Driver: Aquatic disturbances
Explanation: Empirical evidence Evaluation in category A, B, C or D: B Rationale for category: Empirical knowledge
Recommended research: Baseline research e.g Extent of disturbance, level of impact Recommended management actions: strengthen the monitoring within the graben Recommended monitoring: baseline information collection and regular monitoring Measurable indicator name (what): species richness and distribution in Lake Albert, George, Edward
Order 1, 2 or 3
Exis
ting
Existing monitoring (relevant ongoing monitoring or available data sets): fish catch, bethos, water quality Area covered (by ongoing monitoring or available data sets): shoreline and offshore Data storage (format and place where data sets are stored): NaFIRRI, DFR Responsibility (institution and person currently responsible for existing monitoring data sets): DFR
Why (key question(s) which the indicator helps to answer): can oil and gas activities in or near the lake affect fish stocks and water quality Current trend (upward, stable or downward): fish stocks declining mainly because of poor methods of fishing and overfishing How (method, sampling and analysis, quality assurance): fish catch assessments, gill net surveys Where (location, geo-referenced): at relevant sites, breeding sites, fishing grounds When (frequency): quarterly By whom (which institution will collect the indicator data): NaFRRI, DFR Lead agency (institution and person responsible for calculating and communicating the indicator): DFR-Commissioner Presentation (most effective forms of presentation: graphs, maps, narratives etc.):Graphs, maps, tables, narra-tives End user(s) (who will use the indicator for what purpose):Government for decision making and information and Companies, fishermen and local authorities Financial assessment (approximate costs from data collection to indicator): Comments: Regularly review the indicator. Equipments needed to facilitate monitoring. Advance methods/techniques for monitoring fish stocks required Literature: A. The hypothesis is assumed not to be valid. B. The hypothesis is valid and already verified. Research to validate or invalidate the hypothesis is not required. Surveys, monitoring, and/or management measures can possible be recommended. C. The hypothesis is assumed to be valid. Research, monitoring or surveys is recommended to validate or invalidate the hypothesis. Mitigating measures can be recommended if the hypothesis is proved to be valid. D. The hypothesis may be valid, but is not worth testing for professional, logistic, economic or ethical reasons, or because it is assumed to be of minor environmental influence only or of insignificant value for decision making.

NINA Report 706
91
Management and business Group no: 5 INDICATOR FACT SHEETVEC 2: Fisheries IH no: 1b Impact Hypothesis: oil spills and blow outs lead to water pollution which cause fish mortality reducing fish stocks hence affecting fi-sheries
Driver: Oil spills and blow outs
Explanation: Experience from other countries Evaluation in category A, B, C or D: B Rationale for category: Experience from other countries
Recommended research: N/A to test the hypothesis Recommended management actions: Develop an oil spill contingency plan and procure relevant equipments Recommended monitoring: YES Measurable indicator name (what): water quality Order 1, 2 or 3
Exis
ting
Existing monitoring (relevant ongoing monitoring or available data sets): YES Area covered (by ongoing monitoring or available data sets): Water bodies in the Albertine Graben Data storage (format and place where data sets are stored): NAFRRI, DFR Responsibility (institution and person currently responsible for existing monitoring data sets): DFR-
Why (key question(s) which the indicator helps to answer): oil spills impact on fisheries resources Current trend (upward, stable or downward): fish stocks declining How (method, sampling and analysis, quality assurance): Where (location, geo-referenced):Lake Edward, George, Albert and other water bodies within the Al-bertine Graben When (frequency):when it happens By whom (which institution will collect the indicator data): NAFRRI, DFR Lead agency (institution and person responsible for calculating and communicating the indicator): DFR-Commissioner Presentation (most effective forms of presentation: graphs, maps, narratives etc.):Graphs, maps, tables, narra-tives End user(s) (who will use the indicator for what purpose):Government for decision making and information and Companies, fishermen and local authorities Financial assessment (approximate costs from data collection to indicator): Comments: Regularly review the indicator. Literature: A. The hypothesis is assumed not to be valid. B. The hypothesis is valid and already verified. Research to validate or invalidate the hypothesis is not required. Surveys, monitoring, and/or management measures can possible be recommended. C. The hypothesis is assumed to be valid. Research, monitoring or surveys is recommended to validate or invalidate the hypothesis. Mitigating measures can be recommended if the hypothesis is proved to be valid. D. The hypothesis may be valid, but is not worth testing for professional, logistic, economic or ethical reasons, or because it is assumed to be of minor environmental influence only or of insignificant value for decision making.
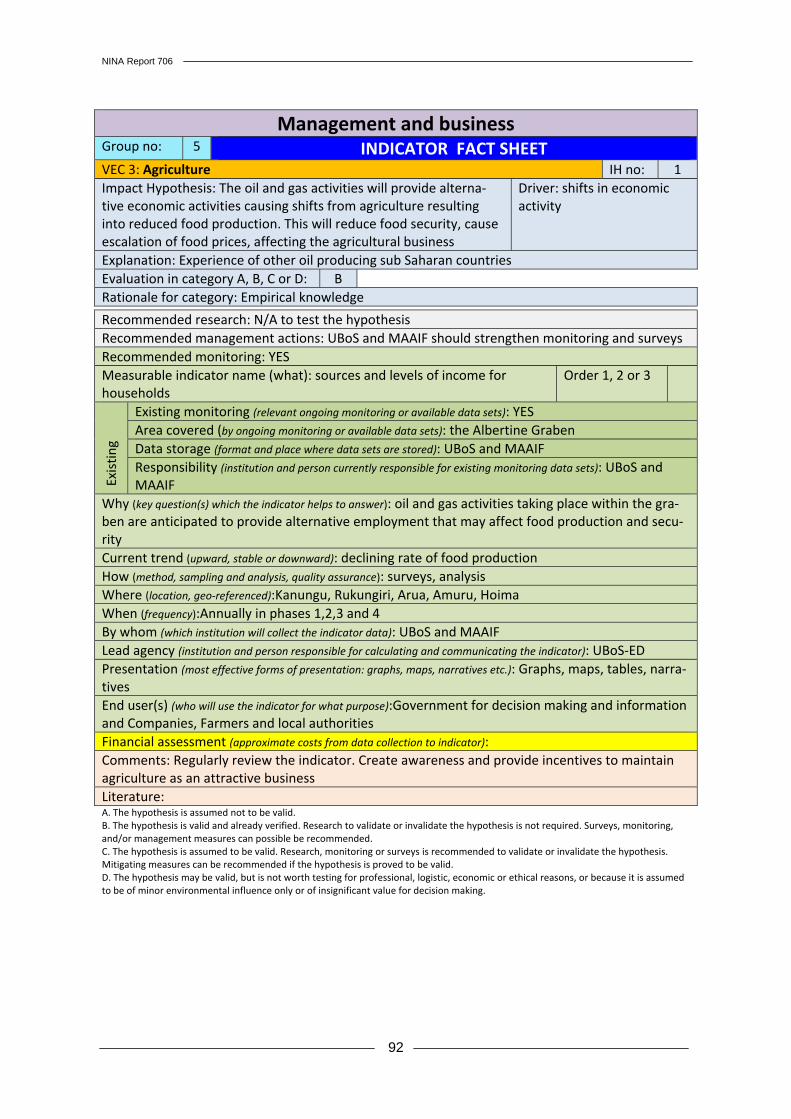
NINA Report 706
92
Management and business Group no: 5 INDICATOR FACT SHEETVEC 3: Agriculture IH no: 1 Impact Hypothesis: The oil and gas activities will provide alterna-tive economic activities causing shifts from agriculture resulting into reduced food production. This will reduce food security, cause escalation of food prices, affecting the agricultural business
Driver: shifts in economic activity
Explanation: Experience of other oil producing sub Saharan countries Evaluation in category A, B, C or D: B Rationale for category: Empirical knowledge
Recommended research: N/A to test the hypothesis Recommended management actions: UBoS and MAAIF should strengthen monitoring and surveys Recommended monitoring: YES Measurable indicator name (what): sources and levels of income for households
Order 1, 2 or 3
Exis
ting
Existing monitoring (relevant ongoing monitoring or available data sets): YES Area covered (by ongoing monitoring or available data sets): the Albertine Graben Data storage (format and place where data sets are stored): UBoS and MAAIF Responsibility (institution and person currently responsible for existing monitoring data sets): UBoS and MAAIF
Why (key question(s) which the indicator helps to answer): oil and gas activities taking place within the gra-ben are anticipated to provide alternative employment that may affect food production and secu-rity Current trend (upward, stable or downward): declining rate of food production How (method, sampling and analysis, quality assurance): surveys, analysis Where (location, geo-referenced):Kanungu, Rukungiri, Arua, Amuru, Hoima When (frequency):Annually in phases 1,2,3 and 4 By whom (which institution will collect the indicator data): UBoS and MAAIF Lead agency (institution and person responsible for calculating and communicating the indicator): UBoS-ED Presentation (most effective forms of presentation: graphs, maps, narratives etc.): Graphs, maps, tables, narra-tives End user(s) (who will use the indicator for what purpose):Government for decision making and information and Companies, Farmers and local authorities Financial assessment (approximate costs from data collection to indicator): Comments: Regularly review the indicator. Create awareness and provide incentives to maintain agriculture as an attractive business Literature: A. The hypothesis is assumed not to be valid. B. The hypothesis is valid and already verified. Research to validate or invalidate the hypothesis is not required. Surveys, monitoring, and/or management measures can possible be recommended. C. The hypothesis is assumed to be valid. Research, monitoring or surveys is recommended to validate or invalidate the hypothesis. Mitigating measures can be recommended if the hypothesis is proved to be valid. D. The hypothesis may be valid, but is not worth testing for professional, logistic, economic or ethical reasons, or because it is assumed to be of minor environmental influence only or of insignificant value for decision making.
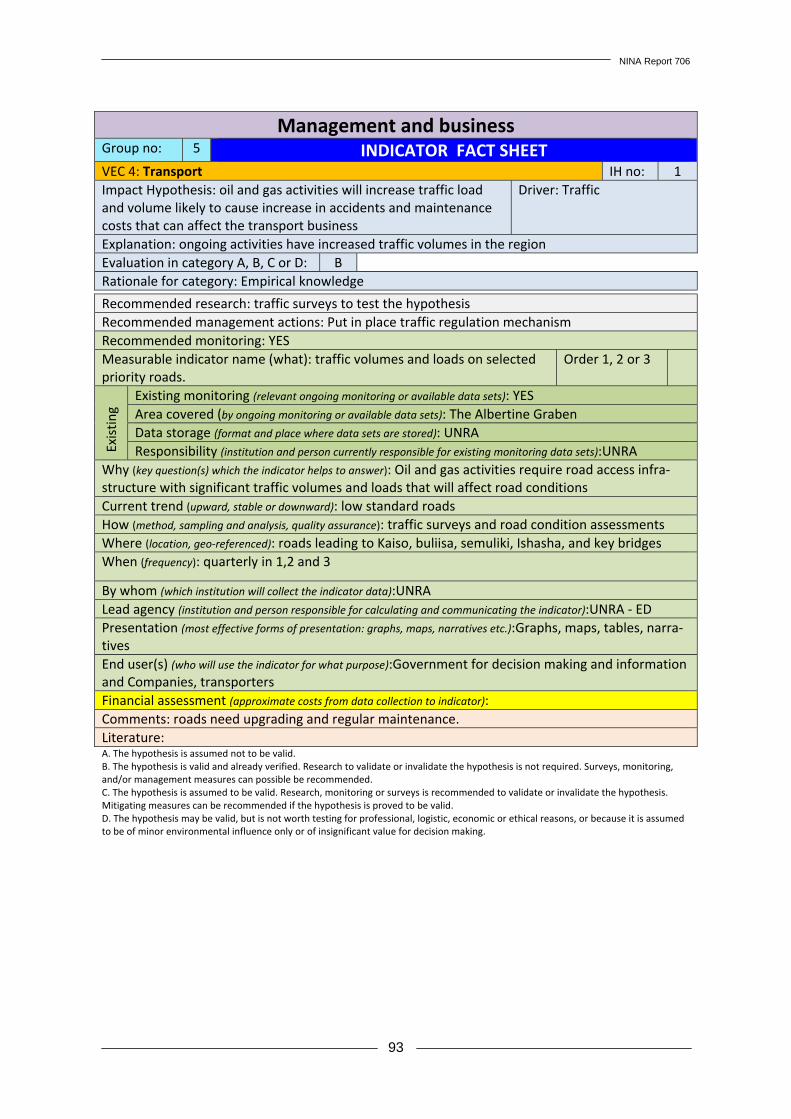
NINA Report 706
93
Management and business Group no: 5 INDICATOR FACT SHEETVEC 4: Transport IH no: 1 Impact Hypothesis: oil and gas activities will increase traffic load and volume likely to cause increase in accidents and maintenance costs that can affect the transport business
Driver: Traffic
Explanation: ongoing activities have increased traffic volumes in the region Evaluation in category A, B, C or D: B Rationale for category: Empirical knowledge
Recommended research: traffic surveys to test the hypothesis Recommended management actions: Put in place traffic regulation mechanism Recommended monitoring: YES Measurable indicator name (what): traffic volumes and loads on selected priority roads.
Order 1, 2 or 3
Exis
ting
Existing monitoring (relevant ongoing monitoring or available data sets): YES Area covered (by ongoing monitoring or available data sets): The Albertine Graben Data storage (format and place where data sets are stored): UNRA Responsibility (institution and person currently responsible for existing monitoring data sets):UNRA
Why (key question(s) which the indicator helps to answer): Oil and gas activities require road access infra-structure with significant traffic volumes and loads that will affect road conditions Current trend (upward, stable or downward): low standard roads How (method, sampling and analysis, quality assurance): traffic surveys and road condition assessments Where (location, geo-referenced): roads leading to Kaiso, buliisa, semuliki, Ishasha, and key bridges When (frequency): quarterly in 1,2 and 3
By whom (which institution will collect the indicator data):UNRA Lead agency (institution and person responsible for calculating and communicating the indicator):UNRA - ED Presentation (most effective forms of presentation: graphs, maps, narratives etc.):Graphs, maps, tables, narra-tives End user(s) (who will use the indicator for what purpose):Government for decision making and information and Companies, transporters Financial assessment (approximate costs from data collection to indicator): Comments: roads need upgrading and regular maintenance. Literature: A. The hypothesis is assumed not to be valid. B. The hypothesis is valid and already verified. Research to validate or invalidate the hypothesis is not required. Surveys, monitoring, and/or management measures can possible be recommended. C. The hypothesis is assumed to be valid. Research, monitoring or surveys is recommended to validate or invalidate the hypothesis. Mitigating measures can be recommended if the hypothesis is proved to be valid. D. The hypothesis may be valid, but is not worth testing for professional, logistic, economic or ethical reasons, or because it is assumed to be of minor environmental influence only or of insignificant value for decision making.
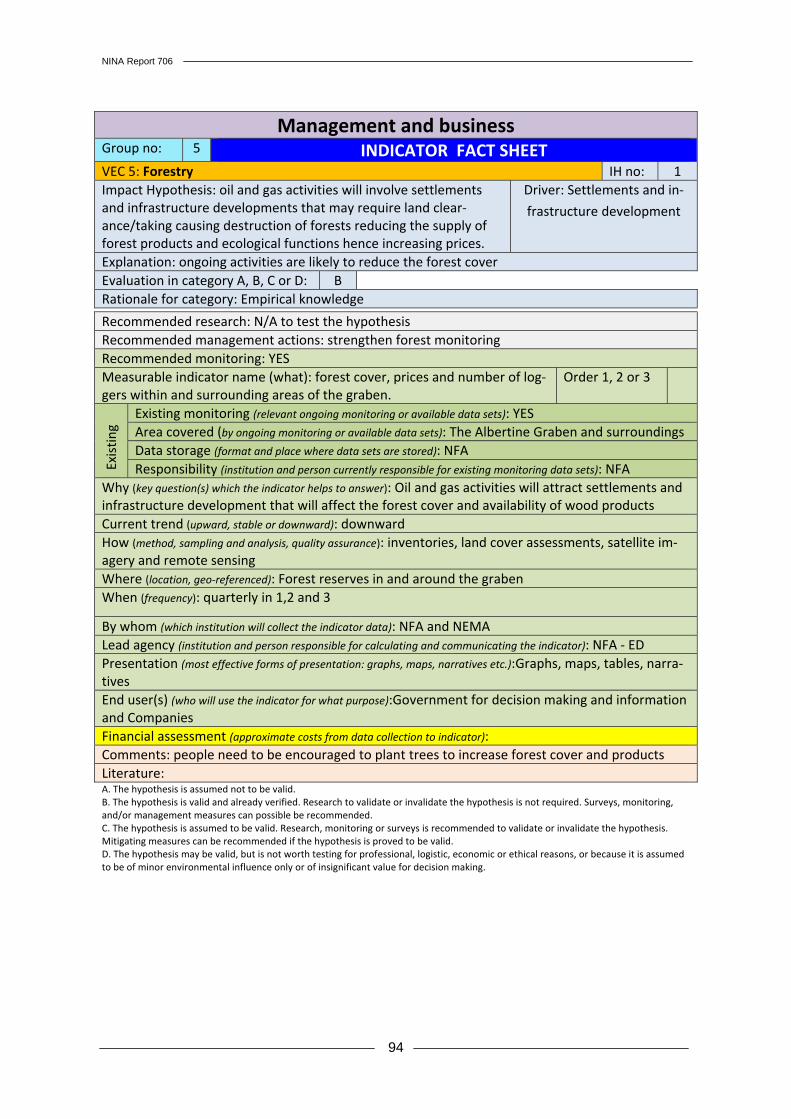
NINA Report 706
94
Management and business Group no: 5 INDICATOR FACT SHEETVEC 5: Forestry IH no: 1 Impact Hypothesis: oil and gas activities will involve settlements and infrastructure developments that may require land clear-ance/taking causing destruction of forests reducing the supply of forest products and ecological functions hence increasing prices.
Driver: Settlements and in-
frastructure development
Explanation: ongoing activities are likely to reduce the forest cover Evaluation in category A, B, C or D: B Rationale for category: Empirical knowledge
Recommended research: N/A to test the hypothesis Recommended management actions: strengthen forest monitoring Recommended monitoring: YES Measurable indicator name (what): forest cover, prices and number of log-gers within and surrounding areas of the graben.
Order 1, 2 or 3
Exis
ting
Existing monitoring (relevant ongoing monitoring or available data sets): YES Area covered (by ongoing monitoring or available data sets): The Albertine Graben and surroundings Data storage (format and place where data sets are stored): NFA Responsibility (institution and person currently responsible for existing monitoring data sets): NFA
Why (key question(s) which the indicator helps to answer): Oil and gas activities will attract settlements and infrastructure development that will affect the forest cover and availability of wood products Current trend (upward, stable or downward): downward How (method, sampling and analysis, quality assurance): inventories, land cover assessments, satellite im-agery and remote sensing Where (location, geo-referenced): Forest reserves in and around the graben When (frequency): quarterly in 1,2 and 3
By whom (which institution will collect the indicator data): NFA and NEMA Lead agency (institution and person responsible for calculating and communicating the indicator): NFA - ED Presentation (most effective forms of presentation: graphs, maps, narratives etc.):Graphs, maps, tables, narra-tives End user(s) (who will use the indicator for what purpose):Government for decision making and information and Companies Financial assessment (approximate costs from data collection to indicator): Comments: people need to be encouraged to plant trees to increase forest cover and products Literature: A. The hypothesis is assumed not to be valid. B. The hypothesis is valid and already verified. Research to validate or invalidate the hypothesis is not required. Surveys, monitoring, and/or management measures can possible be recommended. C. The hypothesis is assumed to be valid. Research, monitoring or surveys is recommended to validate or invalidate the hypothesis. Mitigating measures can be recommended if the hypothesis is proved to be valid. D. The hypothesis may be valid, but is not worth testing for professional, logistic, economic or ethical reasons, or because it is assumed to be of minor environmental influence only or of insignificant value for decision making.

NINA Report 706
95
Management and business Group no: 5 INDICATOR FACT SHEETVEC 6: Construction materials IH no: 1 Impact Hypothesis: oil and gas activities will involve settlements and infrastructure developments that may require more building materials that will deplete or reduce the availability of these mate-rials increasing the prices for these materials.
Driver: Settlements and in-
frastructure development
Explanation: ongoing activities are likely to reduce the forest cover Evaluation in category A, B, C or D: B Rationale for category: Empirical knowledge
Recommended research: N/A to test the hypothesis Recommended management actions: strengthen forest monitoring Recommended monitoring: YES Measurable indicator name (what): forest cover, prices and number of log-gers within and surrounding areas of the graben.
Order 1, 2 or 3
Exis
ting
Existing monitoring (relevant ongoing monitoring or available data sets): YES Area covered (by ongoing monitoring or available data sets): The Albertine Graben and surroundings Data storage (format and place where data sets are stored): NFA Responsibility (institution and person currently responsible for existing monitoring data sets): NFA
Why (key question(s) which the indicator helps to answer): Oil and gas activities will attract settlements and infrastructure development that will affect the forest cover and availability of wood products Current trend (upward, stable or downward): downward How (method, sampling and analysis, quality assurance): inventories, land cover assessments, satellite im-agery and remote sensing Where (location, geo-referenced): Forest reserves in and around the graben When (frequency): quarterly in 1,2 and 3
By whom (which institution will collect the indicator data): NFA and NEMA Lead agency (institution and person responsible for calculating and communicating the indicator): NFA - ED Presentation (most effective forms of presentation: graphs, maps, narratives etc.):Graphs, maps, tables, narra-tives End user(s) (who will use the indicator for what purpose):Government for decision making and information and Companies Financial assessment (approximate costs from data collection to indicator): Comments: people need to be encouraged to plant trees to increase forest cover and products Literature: A. The hypothesis is assumed not to be valid. B. The hypothesis is valid and already verified. Research to validate or invalidate the hypothesis is not required. Surveys, monitoring, and/or management measures can possible be recommended. C. The hypothesis is assumed to be valid. Research, monitoring or surveys is recommended to validate or invalidate the hypothesis. Mitigating measures can be recommended if the hypothesis is proved to be valid. D. The hypothesis may be valid, but is not worth testing for professional, logistic, economic or ethical reasons, or because it is assumed to be of minor environmental influence only or of insignificant value for decision making.
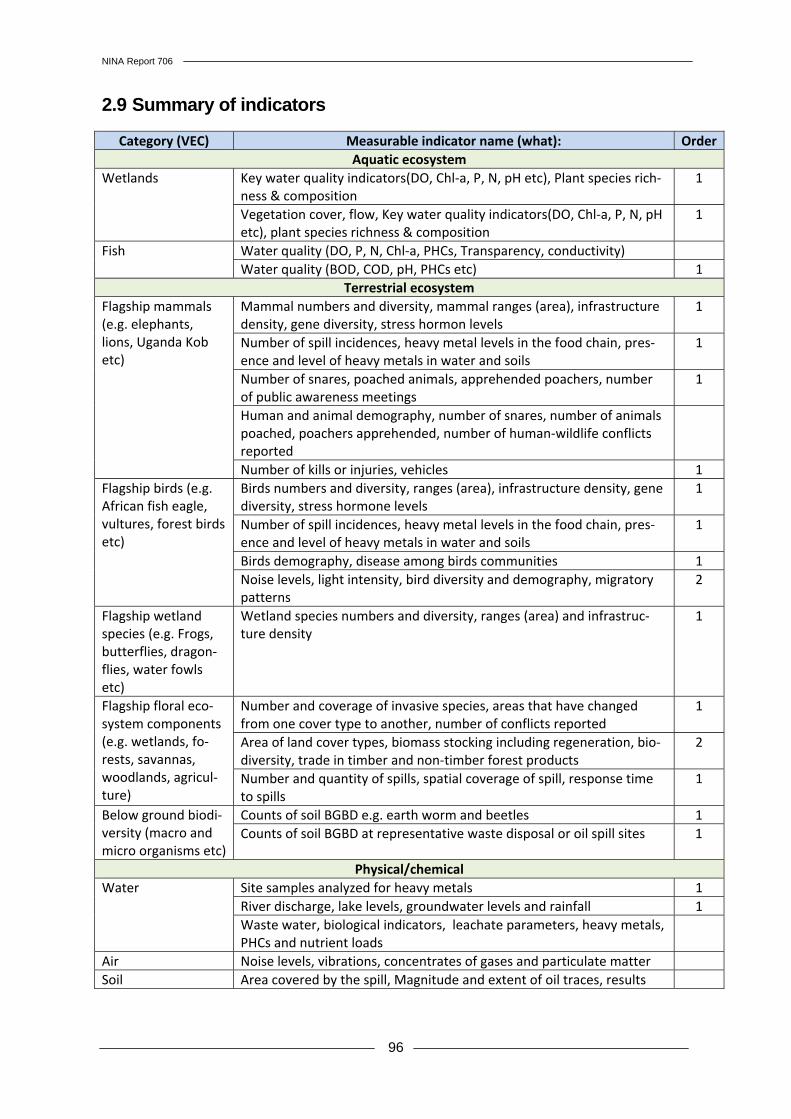
NINA Report 706
96
2.9 Summary of indicators
Category (VEC) Measurable indicator name (what): OrderAquatic ecosystem
Wetlands Key water quality indicators(DO, Chl-a, P, N, pH etc), Plant species rich-ness & composition
1
Vegetation cover, flow, Key water quality indicators(DO, Chl-a, P, N, pH etc), plant species richness & composition
1
Fish Water quality (DO, P, N, Chl-a, PHCs, Transparency, conductivity) Water quality (BOD, COD, pH, PHCs etc) 1
Terrestrial ecosystem Flagship mammals (e.g. elephants, lions, Uganda Kob etc)
Mammal numbers and diversity, mammal ranges (area), infrastructure density, gene diversity, stress hormon levels
1
Number of spill incidences, heavy metal levels in the food chain, pres-ence and level of heavy metals in water and soils
1
Number of snares, poached animals, apprehended poachers, number of public awareness meetings
1
Human and animal demography, number of snares, number of animals poached, poachers apprehended, number of human-wildlife conflicts reported
Number of kills or injuries, vehicles 1 Flagship birds (e.g. African fish eagle, vultures, forest birds etc)
Birds numbers and diversity, ranges (area), infrastructure density, gene diversity, stress hormone levels
1
Number of spill incidences, heavy metal levels in the food chain, pres-ence and level of heavy metals in water and soils
1
Birds demography, disease among birds communities 1 Noise levels, light intensity, bird diversity and demography, migratory patterns
2
Flagship wetland species (e.g. Frogs, butterflies, dragon-flies, water fowls etc)
Wetland species numbers and diversity, ranges (area) and infrastruc-ture density
1
Flagship floral eco-system components (e.g. wetlands, fo-rests, savannas, woodlands, agricul-ture)
Number and coverage of invasive species, areas that have changed from one cover type to another, number of conflicts reported
1
Area of land cover types, biomass stocking including regeneration, bio-diversity, trade in timber and non-timber forest products
2
Number and quantity of spills, spatial coverage of spill, response time to spills
1
Below ground biodi-versity (macro and micro organisms etc)
Counts of soil BGBD e.g. earth worm and beetles 1 Counts of soil BGBD at representative waste disposal or oil spill sites 1
Physical/chemical Water Site samples analyzed for heavy metals 1
River discharge, lake levels, groundwater levels and rainfall 1 Waste water, biological indicators, leachate parameters, heavy metals, PHCs and nutrient loads
Air Noise levels, vibrations, concentrates of gases and particulate matter Soil Area covered by the spill, Magnitude and extent of oil traces, results

NINA Report 706
97
from laboratory tests for hydrocarbons and heavy metals Micro climate Changes in; rainfall, wind, temperature, pressure, evapo-transpiration
and solar radiation
Society Settlements Number of people; Number of settlements; Size of settlements
Size and composition of labour force Number of people employed by sector and occupation
Food Acreage of land under food production; Food price index Food availability in the region; Household incomes Number of food storage facilities.
Acreage of land under food production; Total food production in the country; Household incomes
Water and sanita-tion
Portable water coverage; Latrine coverage; Number of waste disposal facilities; Distance to nearest safe water source Time taken to collect water from nearest water source Number of cases due to water borne diseases
Health Number of health facilities; Prevalence of diseases; Mortality rate; Number of deaths by cause
Energy Types of energy sources Number of people using energy source by type and quantity
Infrastructure Quantity of mineral resources; Location of mineral resources; Available infrastructure
Education Number of education facilities; Number of school-going age children; Literacy rate
Culture Number of cultural sites; Number of ethnic groups and languages Archeological sites Number of the archeological sites; Location of archeological sites;
Available infrastructure
Management and business Tourism Number of species in a restricted area e.g Delta area MFNP
Number of tourists in Wildlife PAs Habitat attributes Number of species in a restricted area e.g Delta area MFNP
Fisheries Species richness and distribution in Lake Albert, George, Edward Water quality Agriculture Sources and levels of income for households Transport Traffic volumes and loads on selected priority roads. Forestry Forest cover, prices and number of loggers within and surrounding
areas of the Albertine Graben
Construction mate-rials
Forest cover, prices and number of loggers within and surrounding areas of the Albertine Graben

NINA Report 706
98
3 References Beanlands, G. 1988. Scoping methods and baseline studies in EIA. - In Wathern, P (ed.). Envi-
ronmental Impact Assessment: theory and practice. Unwin Hyman Ltd. EEA 2005. EEA core set of indicators — Guide. European Environment Agency Technical re-
port No 1/2005. Luxembourg: Office for Official Publications of the European Communi-ties.38 pp.
Hansson, R., Prestrud, P. & Øritsland, N.A. 1990. Assessment system for the environment and industrial activities at Svalbard. Norw. Polar Research Institute, Report no. 68 – 1990. 267 pp.
Holling, C.S. 1978. Adaptive environmental assessment and management. John Wiley & Sons: Chichester- New York - Brisbane - Toronto. 1986.
Indian and Northern Affairs Canada 1992a. Beaufort Region Environmental Assessment and Monitoring Program (BREAM). Final Report for 1990/1991. Environmental Studies No. 67. 416 pp.
Indian and Northern Affairs Canada 1992b. Beaufort Region Environmental Assessment and Monitoring Program (BREAM). Final Report for 1991/1992. Environmental Studies No. 69. 359 pp.
Indian and Northern Affairs Canada 1993. Beaufort Region Environmental Assessment and Monitoring Program (BREAM). Final Report for 1992/1993. Environmental Studies No. 71. 298 pp.
Kitutu, K. Mary Goreti. 2010. Environmental Sensitivity Atlas for the Albertine Graben (Second Edition 2010). Republic of Uganda, National Environment Management Authority (NEMA) 2010. 96 pp.
Kitutu, K. Mary Goreti. 2011. Background Paper for Development of Indicators for Monitoring Environmental Changes in Albertine Graben. Draft report edited by a project Editorial Committee. Republic of Uganda, National Environment Management Authority (NEMA) 2011. 25 pp.
PEPD 2010. The Basin Wide Development Concept for the Albertine Graben for Consideration During Strategic Environment Assessment Development. Draft report. Ministry of Energy and Mineral Development, Petroleum Exploration and Production Department 2010. 15 pp.
Thomassen, J., Løvås, S.M. & Vefsnmo, S. 1996. The adaptive Environmental Assessment and management AEAM in INSROP - Impact Assessment Design. INSROP Working Pa-per No. 31 - 1996. 45 pp.
Thomassen, J., Moe, K.A. & Brude, O.W. 1998. A guide to EIA implementation INSROP phase II. INSROP Discussion Paper, June 1998 / INSROP Working Paper No. 142: 91 pp.
Thomassen, J., Mumbi, C. T. & Kaltenborn, B. P. (eds.) 2003. Environmental Impact Assess-ment (EIA) training course as part of the TAWIRI – NINA collaborative programme in ca-pacity building. NINA Project Report 25: 34pp.
Wathern, P. (ed.) 1988. Environmental Impact Assessment. Theory and practice. Academic Div. of Unwin Hyman Ltd.
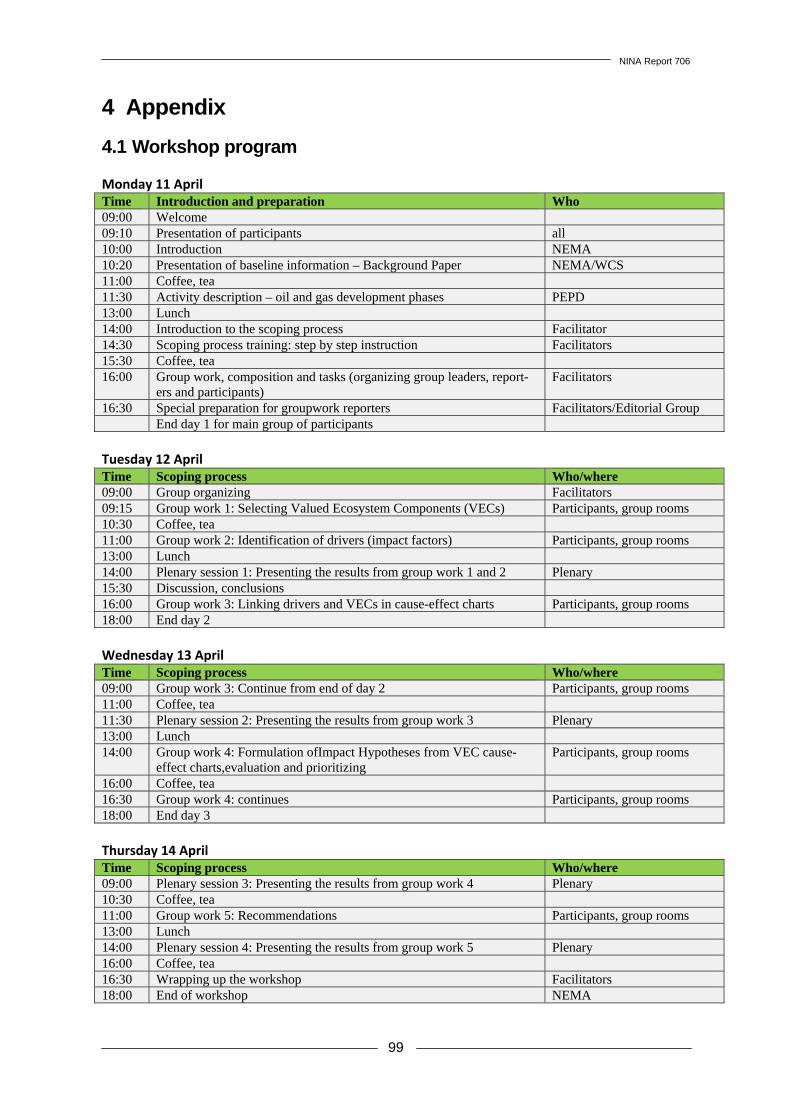
NINA Report 706
99
4 Appendix
4.1 Workshop program Monday 11 April Time Introduction and preparation Who 09:00 Welcome 09:10 Presentation of participants all 10:00 Introduction NEMA 10:20 Presentation of baseline information – Background Paper NEMA/WCS 11:00 Coffee, tea 11:30 Activity description – oil and gas development phases PEPD 13:00 Lunch 14:00 Introduction to the scoping process Facilitator 14:30 Scoping process training: step by step instruction Facilitators 15:30 Coffee, tea 16:00 Group work, composition and tasks (organizing group leaders, report-
ers and participants) Facilitators
16:30 Special preparation for groupwork reporters Facilitators/Editorial Group End day 1 for main group of participants Tuesday 12 April Time Scoping process Who/where 09:00 Group organizing Facilitators 09:15 Group work 1: Selecting Valued Ecosystem Components (VECs) Participants, group rooms 10:30 Coffee, tea 11:00 Group work 2: Identification of drivers (impact factors) Participants, group rooms 13:00 Lunch 14:00 Plenary session 1: Presenting the results from group work 1 and 2 Plenary 15:30 Discussion, conclusions 16:00 Group work 3: Linking drivers and VECs in cause-effect charts Participants, group rooms 18:00 End day 2 Wednesday 13 April Time Scoping process Who/where 09:00 Group work 3: Continue from end of day 2 Participants, group rooms 11:00 Coffee, tea 11:30 Plenary session 2: Presenting the results from group work 3 Plenary 13:00 Lunch 14:00 Group work 4: Formulation ofImpact Hypotheses from VEC cause-
effect charts,evaluation and prioritizing Participants, group rooms
16:00 Coffee, tea 16:30 Group work 4: continues Participants, group rooms 18:00 End day 3 Thursday 14 April Time Scoping process Who/where 09:00 Plenary session 3: Presenting the results from group work 4 Plenary 10:30 Coffee, tea 11:00 Group work 5: Recommendations Participants, group rooms 13:00 Lunch 14:00 Plenary session 4: Presenting the results from group work 5 Plenary 16:00 Coffee, tea 16:30 Wrapping up the workshop Facilitators 18:00 End of workshop NEMA

NINA Report 706
100
4.2 Presentations at the workshop
1. Environmental sensitivity of the Albertine GrabenPresentation of baseline in-formation – Background Paper
2. Activity description – oil and gas development phases 3. Introduction to the scoping process
23.08.2011
1
Environmental sensitivity of the Albertine Graben
Kitutu Kimono Mary Goretti ( PhD)Environment Information Systems Specialist
National Environment Management Authority.
Albertine grabeng
•The area has 14% of all African reptiles (175 species).•19% of Africa’s amphibians (119 species). 35% f Af i ’ b fli (1300 i )
Biological Hot spot in Africa.
•35% of Africa’s butterflies (1300 species). •52% of all African birds (1061 species). •39% of all African mammals (402 species of mammals), and about •128 species of fish.
Biological sensitivity
23.08.2011
2
23.08.2011
3
Murchison falls NP ( River Nile)
23.08.2011
4
Kabwoya game reserve Kabwoya Game Reserve

23.08.2011
5
8/23/2011
1
WORKSHOP FOR DEVELOPMENT OF ENVIRONMENTAL MONITORING INDICATORS
PRESENTED BY:
PEPD
MARGERITA HOTEL, KASESE11TH APRIL, 2011
PRESENTATION OUTLINE
1.1. Current status of licensingCurrent status of licensing
2.2. Resource potential of Uganda’s Albertine Resource potential of Uganda’s Albertine GrabenGraben
2
3.3. Investment in the upstream oil and gas sectorInvestment in the upstream oil and gas sector
4.4. Petroleum Value ChainPetroleum Value Chain
5.5. Petroleum environment related challengesPetroleum environment related challenges
6.6. Conclusion Conclusion
Licensed EAs are:EA1: Interim Operator is TullowPartners to come in TOTAL and
CNOOCEA2: Operator is TullowPartners to come in TOTAL and
CNOOCEA3A: Interim Operator is TullowPartners to come in TOTAL and
EA5EA5
EA1EA1
EA2EA2
STAND OF STATUS OF LICENSING IN UGANDASTAND OF STATUS OF LICENSING IN UGANDA
Partners to come in TOTAL andCNOOC
Operatorship of EA1, 2 and 3A isbeing evaluated by Governmentand after the full transfer of 33%of each of the shares in EA1, 2 and3A, the Minister will write toTullow, TOTAL and CNOOC givingoperatorship for each of the area.EA4A: Operator is Dominion (U)
LtdEA5: Operator is NeptunePetroleum (U) Ltd
3
EA3AEA3A
EA4AEA4A
3000 00
4000.00
5000.00
6000.00CREAMING CURVE FOR DISCOVERIES IN THE ALBERTINE GRABEN
INPLACE RESOURCES
Resource potential Resource potential
40.00Oct-02 Jan-06 Mar-06 Oct-06 Nov-06 May-08 Jun-08 Jun-08 Jul-08 Aug-08 Aug-08 Sep-08 Sep-08 Oct-08 Oct-08 Dec-08 Mar-09 Apr-09 Jul-09 Jul-09
0.00
1000.00
2000.00
3000.00
INPLACE RESOURCES P90 INPLACE RESOURCES P50 INPLACE RESOURCES P10
BA
RR
EL
S
4000.00
5000.00
6000.00
2009 All Discoveries P50 2.3Bbbls
2010 total estimate P50 2.8Bbbls (including
Mpyo Discovery)
CREAMING CURVE FOR DISCOVERIES IN THE ALBERTINE GRABEN
Resource potential Resource potential
5
0.00
1000.00
2000.00
3000.00
INPLACE RESOURCES P90 INPLACE RESOURCES P50 INPLACE RESOURCES P10
BA
RR
EL
S
Mputa P50 210Mbbls
Mputa, Waraga, Nzizi, Kingfisher P50 385 Mbbls
Resource Base at the end of 2010Eighteen discoveries with total estimate of over two billion barrels of oil in place
Resource potential Resource potential
6
8/23/2011
2
INVESTMENT
Foreign Direct Investments (FDI) to date
Cumulative Investment in oil and gas.
Up to 2008: in excess of US$ 509 Million
I 2009 i f
PRIVATE SECTOR INVESTMENT FOR UPSTREAM SUB-SECTOR
400
500
600
In 2009: in excess of US$ 900 Million
In 2010: Up to US$ 1.4bn invested
With the Oil and Gas giants showing interest in Uganda (e.g Total and CNOOC), this investment may double.
0
100
200
300
1998
1999
2000
2001
2002
2003
200420
0520
062007
2008
DATE
US
$
Cummulative investments Annual investments (US$)
7
PETROLEUM VALUE CHAIN
Pre-bidExploration
AndField
DevelopmentProduction Decommisioning
Find and proveCommercial hydrocarbons
Acquisition ofconcession
Restoration of sitesStartProduction
AppraisalDevelopment
Risk Assessment studies
Seismic and exploration drilling
Production drilling and construction
Production, maintenance and transportation
PETROLEUM VALUE CHAIN
LICENSING
EXPLORATION
DEVELOPMENT
PRODUCTION
UPSTREAM
TRANSPORTATION
REFINING
GAS PROCESSING
DISTRIBUTION
MARKETING
SALES
MIDSTREAM
DOWNSTREAM
p
p
p
p
p
[
[
[
[
[
[
[
[
[
[
[
[
[
[
[
[[
[
[
[
[[
[
[
[
[
[
[
[
[
[
[
[[[
[
[
[
[
[
[
[
[
[
[
[
[
[
[ [
[
[
[
[
[
[
[
[
[
[
[
1
0
11
1
1
1
ª
µ
µ
ª
'''
D.R. CONGO UGANDA
SUDAN
ITI-1
RII-1
JOBI-1
NGARA-1
NSOGA-1
AWAKA-1
NGIRI-1
NGEGE-1
KARUKA-1
WAIRINDI-1KIGOGOLE-3
KASAMENE-1
2
3
4
1
Ogur
Bobi
Orom
Nyeu
Awer
MetuMOYO
LIRA
GULU
ARUA
APAC
Orumo
Kilak
Aduku
Aboke
Nwoya
Cwero
Atiak
Vurra
Omugo
Yumbe
Aliba
Rigbo
Agwak
Owafa
NEBBI
Pajule
Palaro
Lokung
Patiko
Matidi
Ullepi
Aringa
Laropi Nimule
Pakuba
Bugana
Paidha
Offaka
Koboko
Obongi
KITGUM
Kalongo
Patongo
Wianaka
Paludar
PalabekLadonga Lomunga
Wanseko
Pakwach
Pakelle
Kamudini
Minakulu
Adjumani
Panyimur
Rhinocamp
Panyigoro
Kiryandongo
Paraa Lodge
110000 160000 210000 260000 310000 360000 410000 460000 510000
0 0
2500
00
2500
00
3000
00
3000
00
3500
00
3500
00
4000
00
4000
00
Legend
Wells
HydroCarbons
' Oil Well
* Gas Well
1 Oil and Gas Well
0 Oil and Gas Shows
+ Gas Shows
µ Oil Shows
ª Dry Well
Towns
STATUS
8/23/2011
3
• Site preparation & Camp
– Footprint
• Choice of location: loss of habitat, visual intrusion, disturbance to local population & wildlife, habitats, transport
• Vegetation clearance: topsoil removal, erosion, hydrology impacts
UPSTREAMUPSTREAM:: ExplorationExploration andand DevelopmentDevelopment
Environment related challengesEnvironment related challenges
impacts
– Physical presence
• Soil contamination, construction & drilling noise, emissions, discharges (sanitary, kitchen wastes, etc)
• Water access & supply
– Workforce
• Choppers/barges, population influx, interactions, hunting/poaching, land-use conflicts
Short-term (---> long-term?)
Source: PEPD
• Discharge, emissions, wastes– Muds re-use, then evaporation/
disposal • Water (seawater, fresh or brine)
or oil (diesel) based muds• Chemical additives
– Cuttings disposalLand spreading
UPSTREAMUPSTREAM:: ExplorationExploration andand DevelopmentDevelopment
Environment related challengesEnvironment related challenges
• Land-spreading• Offshore dumping in piles
– Waste water & Spills• Contamination• Containment (land vs water)
– Waste disposal (hazardous?) • Footprint & community• Supply of water
– Lake water – or shallow aquifer …reduces water
available at boreholes for others? Source: PEPD
Drilling wastes
• Typically 1000-5000 m3 waste per well
• Water-based muds (WBM) now most common
Environment related Environment related challengeschallenges
UPSTREAMUPSTREAM
– WBM have less toxic effect on the environment Bentonite & clays chemically inert
• Oil based muds (OBM) usually on deviated wells due to increased drilling challenges
UPSTREAM: Chemicals used in drilling• Impacts may include:• Toxicity
• Absence, to potentially lethal concentrations?
• Dilution, dispersion• Smothering
• Weighting materials (major component)
e.g. barite (+ heavy metals traces, fine particles)
• Viscosifiers
Environment related challengesEnvironment related challenges
• Smothering • Benthic & soil ecology
• Respiration/ingestion• Pelagic lake species• Benthic lake bed
• Disposal of waste hazardous substances
• Problem
Viscosifiers
e.g. bentonite, clays
• Fluid loss control agents
• Emulsifiers
• Brines
• Alkaline chemicals
• Lost circulation materials
• Shale control additives
• Lubricants & detergents
Impacts include: •noise•light •Emissions (combustion of HC’s)•Non-combusted oil dropout
UPSTREAM AND MIDSTREAM: Well testing/flaring
Environment related challengesEnvironment related challenges
Flaring in kaiso-Tonya-2007 (Waraga well test)
Flaring in using the ever green burner-2008 to date
UPSTREAM AND MIDSTREAM: Blowouts• Uncontrolled flow of of oil/gas from a
well, occurs when formation pressure exceeds the pressure applied to it by the column of drilling fluid– loss of containment = loss of
controlI dibl i i d
Environment related challengesEnvironment related challenges
• Incredible pressures in reservoir and well– Pressure and equipment viability
is maintained through a closed system
– Blow Out Preventer (BOP) hydraulic valves to shut-in well
• Risks to human safety and environment are huge if not managed effectively
Credit: API
8/23/2011
4
Credit: Simon Pedersen BBOP
Credit: BP
• Longer term & increased potential for impacts
• over producing field (25yrs+)• Site selection is vital
Onshore & offshore operations
Impacts from production
Environment related Environment related challengeschallenges
UPSTREAM AND MIDSTREAMUPSTREAM AND MIDSTREAM
Credit: US Geological Service
Site selection is vital • Long-term habitat loss
• Volume, geographical & timeframe scales all increase:
• footprint, construction, supply of materials, emissions/discharges, waste disposal, road access, product export infrastructure, …on & offsite
Impacts from production cont’d
• Camp & infrastructure
– Footprint & discharges
• Permanent addition to existing exploration footprint
– Hydrology changes & soil erosion
– Water supply, drainage, sewage
– Soil & water contamination from spillage & leakage
Habitat & wildlife
Environment related Environment related challengeschallenges
UPSTREAM AND MIDSTREAMUPSTREAM AND MIDSTREAM
– Habitat & wildlife displacement
– Community & land-use change
• Expands for additional equipment and staff e.g.
– Airstrip, roads & port facilities
– Accommodation modules, storage & safe areas
– Oil/gas/water separation equipment
– Export & storage facilities
Impacts from pipelines• Construction & access
– Potential for long linear scars– Possible barriers to wildlife
movement– Possible access through
previously closed ‘safe’ areas
Environment related Environment related challengeschallengesMIDSTREAMMIDSTREAM
– Possible wildlife corridors & incursion by humans
• Long term occupation of land, above or sub-soil– Land leasing or occupation
issues, compensation?– Conflict with land /sea users
• Security & safety issues e.g. Nigeria
Credit:Platform website (Remember Ken Sarowiwa)
Drilling mud considerations for minimal harm toenvironment
S l ti f d illi fl id h i l b d l i f
Drilling activities- mitigation of impacts
Current mitigationsCurrent mitigations
•Selection of drilling fluid chemicals based on analysis oftoxicity, biodegradation and bioaccumulation e. g use ofinert inorganic chemicals and degradable organiccompounds
•Use water based drilling fluid instead of oil based drillingfluid if possible.
•Reuse of drilling fluids
Outline of Social and Environment strategies being implemented by Government:
• Strategic Environment Assessment (SEA)
• Environment Impact Assessment
• Environment Sensitivity Atlas
Current mitigationsCurrent mitigations
• Oil Spill Contingency plans
• Use of Blow Out Preventers
• Waste collection and proper disposal
• Collaboration with other Government institutions
• Sensitization and training
TurningTurning OilOil andand GasGas intointo anan opportunityopportunityExamples of Countries with good Oil and Examples of Countries with good Oil and Gas management practicesGas management practices
Norway is the best example of countrieswhich have sustainably invested the O&G revenues
Both Nigeria and Norway produced 1.5-2mbpdbetween 1980 and 2005 but Norway’s GDP per capita has been growing steadily to over
0
5
10
15
20
25
30
35
40
1940 1960 1980 2000 2020
GD
P in
Tho
usan
ds o
f dol
lars
per
cap
ita
Norway's GDP per Capita ($)
Nigeria's GDP per Capita ($)
Period in years
$35,000 compared to Nigeria’s (constantly at less than $5000)
8/23/2011
5
ExamplesExamples ofof casescases ofof poorpoor OilOil andand GasGasmanagementmanagement practicespractices
Pipeline rupture
TurningTurning OilOil andand GasGas intointo anan opportunityopportunity
•1979 pipeline rupture Bemidji,Minnesota, US•10,700 bbls released, spray towards wetland•After clean-up, 2,500 bbls crude oil remains in sub-soil
…Nigeria
ExamplesExamples ofof CountriesCountries withwith poorpoor OilOil andandGasGas managementmanagement practicespractices
TurningTurning OilOil andand GasGas intointo anan opportunityopportunity
Angola produces more than 1 million barrels of oil per day. Valued at over US$50 million per day yet Angola is still a recipient of Foreign Aid.
Chad produces more than 160,000 barrels of oil per day yet public infrastructure are nearly nonexistent.
Oil in most of Africa is synonymous with greed, theft, mismanagement, conflict, corruption, poverty and misery in all its forms.
HaveHave wewe learntlearnt anyany lessonslessons aboutaboutwhatwhat toto avoid?avoid?
TurningTurning OilOil andand GasGas intointo anan opportunityopportunity
Reasons for why oil curse had to Reasons for why oil curse had to occur in some countriesoccur in some countries
Nigeria’s Delta Militants1. Lack of proper policies and legislation
before exploitation of resources
2. Mismanagement of resources
3. Political instabilities e.g Angola
Uganda is lucky by putting up the Uganda is lucky by putting up the necessary regulatory framework on necessary regulatory framework on management of O&G revenues and management of O&G revenues and on protection of the environment on protection of the environment ahead of production ahead of production
TurningTurning OilOil andand GasGas intointo anan opportunityopportunity
1. Implementation of international best practices
2. Use of Oil and Gas revenues for sustainable development e.gsupporting other sectors e.g Agriculture, Tourism, reduction of dependency on biomass for fuel, infrastructure and social development etc.
Our Policy goal isOur Policy goal is:: TTo use the country’s oil and gas resources to contribute to early o use the country’s oil and gas resources to contribute to early achievement of poverty eradication and create lasting value to society.achievement of poverty eradication and create lasting value to society.
3. In order to make it to the above goal among others, the National Oil and Gas Policy has guiding principles as:
To use the finite resources to create lasting benefit to society
Efficient resource management
Transparency and accountability
Protection of the environment and conservation of biodiversity
The way forward is coThe way forward is co--existence between the rich existence between the rich
biodiversity in the Albertine Graben and Obiodiversity in the Albertine Graben and O--G related G related
activities so that Ugandans can benefit from both activities so that Ugandans can benefit from both
resourcesresources
ConclusionConclusion
23.08.2011
1
Environmental monitoring in Environmental monitoring in AlbertineAlbertine GrabenGraben, Uganda, Uganda
Scoping process - indicators
Jørn ThomassenJørn ThomassenReidar HindrumReidar Hindrum
Mari Lise SjongMari Lise Sjong Directorate for Directorate for Ingunn Ingunn LimestrandLimestrand Nature ManagementNature Management
WorkshopWorkshop outputsoutputs
Focused measurable indicators to be used in the Focused measurable indicators to be used in the environmental monitoring programme for the environmental monitoring programme for the AlbertineAlbertine GrabenGraben
••
www.nina.no
Important input to the work with a Strategic Important input to the work with a Strategic Environmental Assessment for oil/gas development Environmental Assessment for oil/gas development in the in the AlbertineAlbertine GrabenGraben (both scoping and M&E (both scoping and M&E programme, ref. Pt. 9 in draft programme, ref. Pt. 9 in draft ToRToR))
An ownership for the participants to the process of An ownership for the participants to the process of selecting indicators and to the process of oil/gas selecting indicators and to the process of oil/gas development in the development in the AlbertineAlbertine GrabenGraben
IntroductionIntroduction
www.nina.no
WhatWhat is is scopingscoping??
Scoping refers to the process of identifying, from a broad Scoping refers to the process of identifying, from a broad range of potential problems, a number of priority issues to be range of potential problems, a number of priority issues to be addressed by an EIA (addressed by an EIA (BeanlandsBeanlands 1988)1988)
In connection with the establishment of the environmental In connection with the establishment of the environmental monitoring programme for the monitoring programme for the AlbertineAlbertine GrabenGraben in Uganda, in Uganda, scoping refers to the process ofscoping refers to the process of
••
www.nina.no
scoping refers to the process of scoping refers to the process of
identifying a limited number of issues to be identifying a limited number of issues to be addressed in the monitoring addressed in the monitoring programmeprogramme with the with the aim to measure (indicators) the existing quality aim to measure (indicators) the existing quality and potential future changes of the environment and potential future changes of the environment and the society (ecosystem approach)and the society (ecosystem approach)
Important: the design of a monitoring Important: the design of a monitoring programmeprogramme must must consider the consider the final usefinal use of the data before monitoring startsof the data before monitoring starts
IndicatorsIndicators
Indicators are Indicators are purpose dependentpurpose dependent, i.e. monitoring the oil/gas , i.e. monitoring the oil/gas development for reporting potential changes in the ecosystem development for reporting potential changes in the ecosystem as a basis for decisions on mitigating measures or other as a basis for decisions on mitigating measures or other management actionsmanagement actions
Consequently, it is important to determine the Consequently, it is important to determine the purposepurpose of the of the indicator and the indicator and the end usersend users
••
www.nina.no
Successful indicators are actually used to support Successful indicators are actually used to support policy and policy and decision makingdecision making
Indicators provide data about Indicators provide data about more than itselfmore than itself (ex. human (ex. human body temperature provide information about the persons body temperature provide information about the persons health)health)
An indicator can provide information on An indicator can provide information on several issuesseveral issues
IndicatorIndicator developmentdevelopment must must includeinclude
A A science basedscience based understanding of the focal issuesunderstanding of the focal issues
An understanding of the scientific and statistical An understanding of the scientific and statistical strengths and strengths and weaknessesweaknesses of the collected indicator dataof the collected indicator data
Skills to develop valid scientific and statistical Skills to develop valid scientific and statistical maps, graphs maps, graphs and narrativesand narratives
••
www.nina.no
and narrativesand narratives
Skills and routines to Skills and routines to communicatecommunicate the indicator results to the indicator results to decision makersdecision makers
An understanding that active use of indicator results are an An understanding that active use of indicator results are an important tool for important tool for adaptive management adaptive management and decision makingand decision making
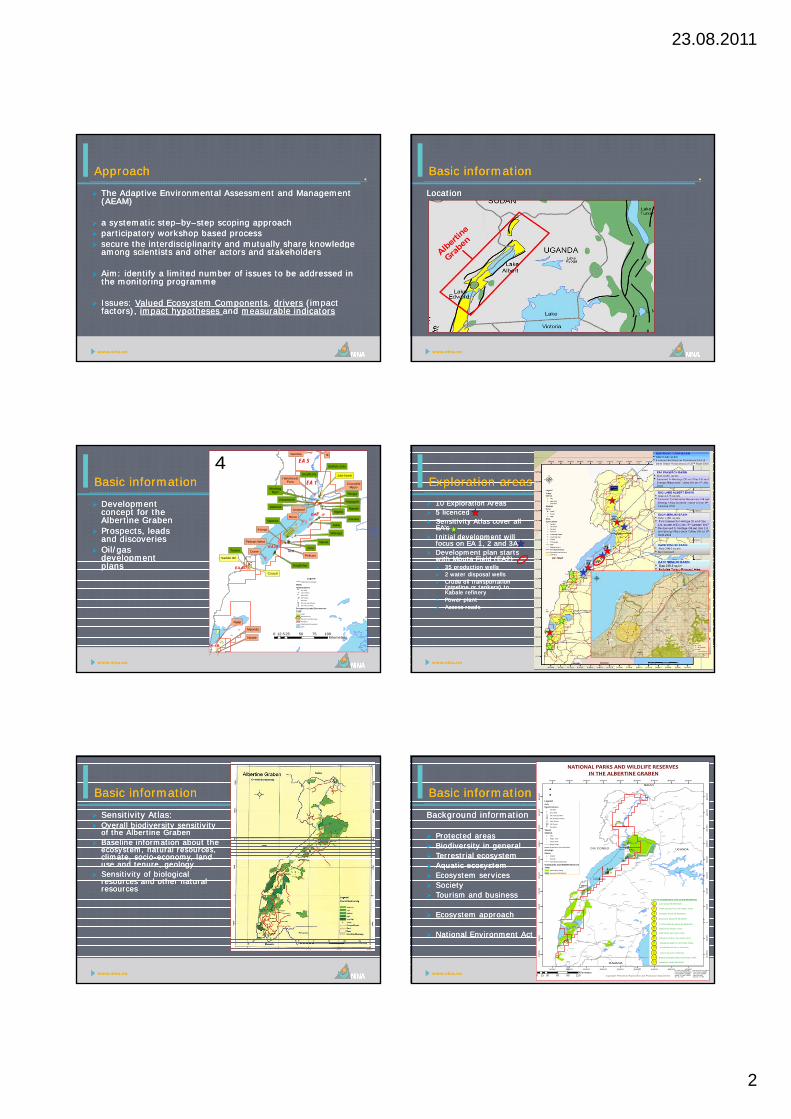
23.08.2011
2
ApproachApproach
The Adaptive Environmental Assessment and Management The Adaptive Environmental Assessment and Management (AEAM) (AEAM)
a systematic stepa systematic step––byby––step scoping approach step scoping approach participatory workshop based process participatory workshop based process secure the secure the interdisciplinarityinterdisciplinarity and mutually share knowledge and mutually share knowledge
••
www.nina.no
p yp y y gy gamong scientists and other actors and stakeholdersamong scientists and other actors and stakeholders
Aim: identify a limited number of issues to be addressed in Aim: identify a limited number of issues to be addressed in the monitoring the monitoring programmeprogramme
Issues: Issues: Valued Ecosystem ComponentsValued Ecosystem Components, , driversdrivers (impact (impact factors), factors), impact hypotheses impact hypotheses and and measurable indicatorsmeasurable indicators
Basic Basic informationinformation
LocationLocation
••
www.nina.no
Basic Basic informationinformation
DevelopmentDevelopmentconceptconcept for for thetheAlbertineAlbertine GrabenGraben
ProspectsProspects, leads , leads and and discoveriesdiscoveries
Oil/gas Oil/gas developmentdevelopment
••
µ
1
µµ
1
1
0
* 11
+
µ
!
1
0
11
1
1
1
1
1
ª
µ
1
µ!!
!
Jobi-North
CrocodileMpyo
Buffalo Jobi
Giraffe RiiHartebeest
Pura
WarthogNgiri
EA 1
Kasamene
Wairindi Ngege
Kigogole
Karuka
Waraga
Mputa
Nsoga
Taitai
Ngassa
Nzizi
Leopard
Kisinja
Ntera
NgaraEA2
Pelican
Pelican West
CraneTuraco
Saddle Bill
EA3A
ItiSambia
EA 54
Text
www.nina.no
developmentdevelopmentplansplans 0 Kingfisher
Saddle Bill
Coucal
Ngaji
Mpundu
Nkobe
EA-3C
EA-4B
Legend
Exploration boundary
Wells
HydroCarbons
ª Dry Well
+ Gas Shows
* Gas Well
µ Oil Shows
! Oil Well
0 Oil and Gas Shows
1 Oil and Gas Well
Prospects,Leads,Discoveries
TYPELead
Oil Discovery
Oil and Gas Discovery
Prospect
International boundary
Lake
0 25 50 75 10012.5Kilometers
ExplorationExploration areasareas
10 Exploration Areas10 Exploration Areas 5 5 licencedlicenced Sensitivity Atlas cover all Sensitivity Atlas cover all
EA’sEA’s Initial development will Initial development will
focus on EA 1, 2 and 3Afocus on EA 1, 2 and 3A Development plan starts Development plan starts
withwith MputaMputa Field (EA2)Field (EA2)
••
www.nina.no
with with MputaMputa Field (EA2)Field (EA2) 35 production wells35 production wells 2 water disposal wells2 water disposal wells Crude oil transportation Crude oil transportation
(pipeline or tankers) to (pipeline or tankers) to KabaleKabale refineryrefinery
Power plantPower plant Access roadsAccess roads
Basic Basic informationinformation
SensitivitySensitivity Atlas:Atlas: Overall Overall biodiversitybiodiversity sensitivitysensitivity
ofof thethe AlbertineAlbertine GrabenGraben Baseline Baseline informationinformation aboutabout thethe
ecosystemecosystem, , naturalnatural resourcesresources, , climateclimate, , sociosocio--economyeconomy, land , land useuse and and tenuretenure, , geologygeology ……
••
www.nina.no
SensitivitySensitivity ofof biologicalbiologicalresourcesresources and and otherother naturalnaturalresourcesresources
Basic Basic informationinformation
BackgroundBackground informationinformation
Protected areasProtected areas Biodiversity in generalBiodiversity in general Terrestrial ecosystemTerrestrial ecosystem Aquatic ecosystemAquatic ecosystem
••
p
p
p
p
p
p
[
[
[
[
[
[
[
[
[
[
[
[
[
[
[
[
[[
[
[
[
[
[
[
[
[
[
[
[
[
[
[
[
[
[
[
[
[
[
[
[
[[[
[
[
[
[
[
[
[
[
[
[
[
[
[
[ [
[
[
[
[
[
[
[
[
[
[
[
[
[[
µ
1+
µ
1
0
11
1
1
1
ª
µ
1
µ
ª
'''
D.R. CONGO UGANDA
SUDAN
ITI-1
RII-1
JOBI-1
NGARA-1
NSOGA-1
AWAKA-1
NGIRI-1
NGEGE-1
NGASSA-2
KARUKA 2KARUKA-1
TAITAI 1
NGASSA1
WARAGA-1
WAKI B-1
WAIRINDI-1
KIGOGOLE-3
KASAMENE-1
2
3
4
1
Ogur
Bobi
Orom
Nyeu
Awer
MetuMOYO
LIRA
GULU
ARUA
APAC
Orumo
Kilak
Aduku
Aboke
Nwoya
Cwero
Atiak
Vurra
Omugo
Yumbe
Aliba
Rigbo
Agwak
Owafa
NEBBI
Pajule
Palaro
Lokung
Patiko
Matidi
Ullepi
Aringa
Laropi Nimule
Pakuba
Bukumi
Bugana
Ihungu
Paidha
Offaka
Koboko
Obongi
KITGUM
Kigumba
Kalongo
Patongo
Wianaka
Paludar
PalabekLadonga Lomunga
Butiaba
Wanseko
Bikonzi
Kibanda
Pakwach
Pakelle
MASINDI
Bwijanga Nakitoma
Kamudini
Minakulu
Adjumani
Panyimur
Biseruka
Rhinocamp
Panyigoro
Kigorobya
Kiryandongo
Paraa Lodge
110000 160000 210000 260000 310000 360000 410000 460000 510000
2000
00
2000
00
2500
00
2500
00
3000
00
3000
00
3500
00
3500
00
4000
00
4000
00
Legend
Wells
HydroCarbons
' Oil Well
* Gas Well
1 Oil and Gas Well
0 Oil and Gas Shows
+ Gas Shows
µ Oil Shows
ª Dry Well
Towns
STATUS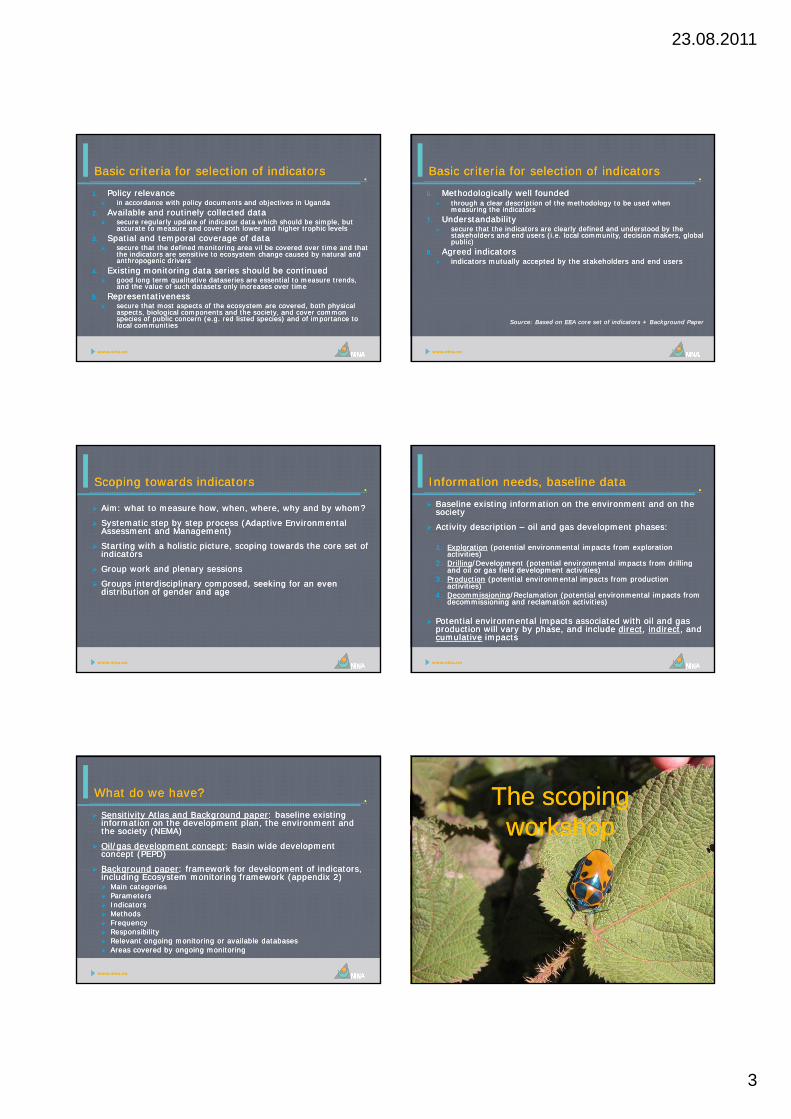
23.08.2011
3
Basic Basic criteriacriteria for for selectionselection ofof indicatorsindicators
1.1. Policy Policy relevancerelevance in in accordanceaccordance withwith policy policy documentsdocuments and and objectivesobjectives in Ugandain Uganda
2.2. AvailableAvailable and and routinelyroutinely collectedcollected data data securesecure regularlyregularly updateupdate ofof indicatorindicator data data whichwhich shouldshould be simple, be simple, butbut
accurateaccurate to to measuremeasure and cover and cover bothboth lowerlower and and higherhigher trophictrophic levelslevels
3.3. Spatial and temporal Spatial and temporal coveragecoverage ofof data data securesecure thatthat thethe defineddefined monitoringmonitoring area vil bearea vil be coveredcovered over time andover time and thatthat
••
www.nina.no
securesecure thatthat thethe defineddefined monitoringmonitoring area vil be area vil be coveredcovered over time and over time and thatthatthethe indicatorsindicators areare sensitive to sensitive to ecosystemecosystem changechange causedcaused by by naturalnatural and and anthropogenicanthropogenic driversdrivers
4.4. ExistingExisting monitoringmonitoring data series data series shouldshould be be continuedcontinued goodgood longlong term term qualitativequalitative dataseries dataseries areare essentialessential to to measuremeasure trends, trends,
and and thethe valuevalue ofof suchsuch datasetsdatasets onlyonly increasesincreases over timeover time
5.5. RepresentativenessRepresentativeness securesecure thatthat most most aspectsaspects ofof thethe ecosystemecosystem areare coveredcovered, , bothboth physicalphysical
aspectsaspects, , biologicalbiological componentscomponents and and thethe societysociety, and cover , and cover commoncommonspeciesspecies ofof publicpublic concernconcern ((e.ge.g. red . red listedlisted speciesspecies) and ) and ofof importanceimportance to to locallocal communitiescommunities
Basic Basic criteriacriteria for for selectionselection ofof indicatorsindicators
6.6. MethodologicallyMethodologically wellwell foundedfounded throughthrough a a clearclear descriptiondescription ofof thethe methodologymethodology to be used to be used whenwhen
measuringmeasuring thethe indicatorsindicators
7.7. UnderstandabilityUnderstandability securesecure thatthat thethe indicatorsindicators areare clearlyclearly defineddefined and and understoodunderstood by by thethe
stakeholders and end stakeholders and end usersusers (i.e. (i.e. locallocal communitycommunity, , decisiondecision makers, global makers, global publicpublic))
dd dd
••
www.nina.no
8.8. AgreedAgreed indicatorsindicators indicatorsindicators mutuallymutually acceptedaccepted by by thethe stakeholders and end stakeholders and end usersusers
SourceSource: : BasedBased onon EEA EEA corecore setset ofof indicatorsindicators + + BackgroundBackground PaperPaper
ScopingScoping towardstowards indicatorsindicators
AimAim: : whatwhat to to measuremeasure howhow, , whenwhen, , wherewhere, , whywhy and by and by whomwhom??
SystematicSystematic stepstep by by stepstep processprocess (Adaptive (Adaptive EnvironmentalEnvironmentalAssessmentAssessment and Management)and Management)
Starting Starting withwith a a holisticholistic picturepicture, , scopingscoping towardstowards thethe corecore setset ofofindicatorsindicators
••
www.nina.no
Group Group workwork and and plenaryplenary sessionssessions
Groups Groups interdisciplinaryinterdisciplinary composedcomposed, , seekingseeking for an for an evenevendistributiondistribution ofof gendergender and ageand age
InformationInformation needsneeds, baseline data, baseline data
Baseline Baseline existingexisting informationinformation onon thethe environmentenvironment and and onon thethesocietysociety
ActivityActivity descriptiondescription –– oiloil and gas and gas developmentdevelopment phasesphases::
1.1. ExplorationExploration (potential environmental impacts from exploration (potential environmental impacts from exploration activities)activities)
••
www.nina.no
2.2. DrillingDrilling/Development (potential environmental impacts from drilling /Development (potential environmental impacts from drilling and oil or gas field development activities)and oil or gas field development activities)
3.3. ProductionProduction (potential environmental impacts from production (potential environmental impacts from production activities)activities)
4.4. DecommissioninDecommissioning/Reclamation (potential environmental impacts from g/Reclamation (potential environmental impacts from decommissioning and reclamation activities)decommissioning and reclamation activities)
Potential environmental impacts associated with oil and gas Potential environmental impacts associated with oil and gas production will vary by phase, and include production will vary by phase, and include directdirect, , indirectindirect, and , and cumulativecumulative impactsimpacts
WhatWhat do do wewe have?have?
SensitivitySensitivity Atlas and Atlas and BackgroundBackground paperpaper: baseline : baseline existingexistinginformationinformation onon thethe developmentdevelopment plan, plan, thethe environmentenvironment and and thethe societysociety (NEMA)(NEMA)
Oil/gas Oil/gas developmentdevelopment conceptconcept: Basin : Basin widewide developmentdevelopmentconceptconcept (PEPD)(PEPD)
BackgroundBackground paperpaper:: frameworkframework forfor developmentdevelopment ofof indicatorsindicators
••
www.nina.no
BackgroundBackground paperpaper: : frameworkframework for for developmentdevelopment ofof indicatorsindicators, , includingincluding EcosystemEcosystem monitoringmonitoring frameworkframework ((appendixappendix 2)2) Main Main categoriescategories ParametersParameters IndicatorsIndicators MethodsMethods FrequencyFrequency ResponsibilityResponsibility Relevant Relevant ongoingongoing monitoringmonitoring or or availableavailable databasesdatabases Areas Areas coveredcovered by by ongoingongoing monitoringmonitoring
The The scopingscopingworkshopworkshop
www.nina.no
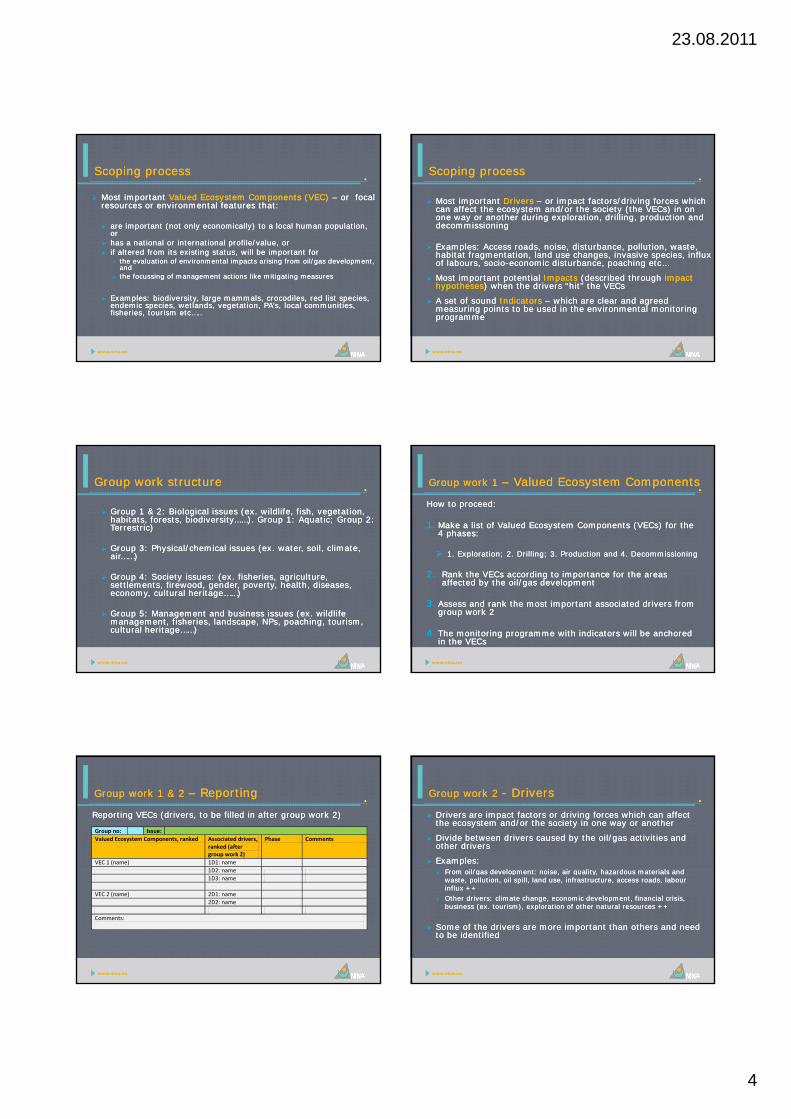
23.08.2011
4
ScopingScoping processprocess
Most Most importantimportant ValuedValued EcosystemEcosystem ComponentsComponents (VEC) (VEC) –– or or focalfocalresourcesresources or or environmentalenvironmental features features thatthat::
areare importantimportant (not (not onlyonly economicallyeconomically) to a ) to a locallocal human human populationpopulation, , oror
has a has a nationalnational or or internationalinternational profile/valueprofile/value, or, or
••
www.nina.no
ifif alteredaltered from from itsits existingexisting status, status, willwill be be importantimportant forfor thethe evaluationevaluation ofof environmentalenvironmental impactsimpacts arisingarising from from oil/gasoil/gas developmentdevelopment, ,
andand thethe focussingfocussing ofof managementmanagement actionsactions like like mitigatingmitigating measuresmeasures
ExamplesExamples: : biodiversitybiodiversity, large , large mammalsmammals, , crocodilescrocodiles, red list , red list speciesspecies, , endemicendemic speciesspecies, , wetlandswetlands, , vegetationvegetation, , PA’sPA’s, , locallocal communitiescommunities, , fisheriesfisheries, , tourismtourism etcetc…..…..
ScopingScoping processprocess
Most Most importantimportant DriversDrivers –– or or impactimpact factors/drivingfactors/driving forcesforces whichwhichcancan affectaffect thethe ecosystemecosystem and/or and/or thethe societysociety ((thethe VECsVECs) in ) in onononeone wayway or or anotheranother during during explorationexploration, drilling, , drilling, productionproduction and and decommissioningdecommissioning
ExamplesExamples: Access: Access roadsroads noisenoise disturbancedisturbance pollutionpollution wastewaste
••
www.nina.no
ExamplesExamples: Access : Access roadsroads, , noisenoise, , disturbancedisturbance, , pollutionpollution, , wastewaste, , habitat habitat fragmentationfragmentation, land , land useuse changeschanges, , invasiveinvasive speciesspecies, , influxinfluxofof labourslabours, , sociosocio--economiceconomic disturbancedisturbance, , poachingpoaching etcetc……
Most important potential Most important potential ImpactsImpacts (described through (described through impact impact hypotheseshypotheses) when the drivers “hit” the VECs) when the drivers “hit” the VECs
A set of sound A set of sound IndicatorsIndicators –– which are clear and agreed which are clear and agreed measuring points to be used in the environmental monitoring measuring points to be used in the environmental monitoring programmeprogramme
Group Group workwork structurestructure
Group 1 & 2: Biological issues (ex. wildlife, fish, vegetation, Group 1 & 2: Biological issues (ex. wildlife, fish, vegetation, habitats, forests, biodiversity……). Group 1: Aquatic; Group 2: habitats, forests, biodiversity……). Group 1: Aquatic; Group 2: TerrestricTerrestric))
Group 3: Physical/chemical issues (ex. water, soil, climate, Group 3: Physical/chemical issues (ex. water, soil, climate, air……)air……)
••
www.nina.no
air……)air……)
Group 4: Society issues: (ex. fisheries, agriculture, Group 4: Society issues: (ex. fisheries, agriculture, settlements, firewood, gender, poverty, health, diseases, settlements, firewood, gender, poverty, health, diseases, economy, cultural heritage……)economy, cultural heritage……)
Group 5: Management and business issues (ex. wildlife Group 5: Management and business issues (ex. wildlife management, fisheries, landscape, NPs, poaching, tourism, management, fisheries, landscape, NPs, poaching, tourism, cultural heritage……) cultural heritage……)
Group Group workwork 1 1 –– ValuedValued EcosystemEcosystem ComponentsComponents
HowHow to to proceedproceed: :
1.1. Make a list Make a list ofof ValuedValued EcosystemEcosystem ComponentsComponents ((VECsVECs) for ) for thethe4 4 phasesphases::
1. Exploration; 2. Drilling; 3. Production and 4. Decommissioning1. Exploration; 2. Drilling; 3. Production and 4. Decommissioning
••
www.nina.no
2.2. Rank Rank thethe VECsVECs accordingaccording to to importanceimportance for for thethe areas areas affectedaffected by by thethe oil/gasoil/gas developmentdevelopment
3.3. AssessAssess and rank and rank thethe most most importantimportant associatedassociated drivers from drivers from groupgroup workwork 22
4.4. The The monitoringmonitoring programmeprogramme withwith indicatorsindicators willwill be be anchoredanchoredin in thethe VECsVECs
Group Group workwork 1 & 2 1 & 2 –– ReportingReporting
ReportingReporting VECsVECs (drivers, to be (drivers, to be filledfilled in in afterafter groupgroup workwork 2) 2)
••
Group no: Issue: Valued Ecosystem Components, ranked Associated drivers,
ranked (after group work 2)
Phase Comments
VEC 1 (name) 1D1: name 1D2: name
www.nina.no
1D2: name 1D3: name VEC 2 (name) 2D1: name 2D2: name Comments:
Group Group workwork 2 2 -- DriversDrivers
Drivers Drivers areare impactimpact factorsfactors or driving or driving forcesforces whichwhich cancan affectaffectthethe ecosystemecosystem and/or and/or thethe societysociety in in oneone wayway or or anotheranother
DivideDivide betweenbetween drivers drivers causedcaused by by thethe oil/gasoil/gas activitiesactivities and and otherother driversdrivers
ExamplesExamples::FF il/il/ d l td l t ii ii litlit h dh d t i l dt i l d
••
www.nina.no
From From oil/gasoil/gas developmentdevelopment: : noisenoise, air , air qualityquality, , hazardoushazardous materials and materials and wastewaste, , pollutionpollution, , oiloil spill, land spill, land useuse, , infrastructureinfrastructure, , accessaccess roadsroads, , labourlabourinfluxinflux ++++
OtherOther drivers: drivers: climateclimate changechange, , economiceconomic developmentdevelopment, , financialfinancial crisiscrisis, , business (ex. business (ex. tourismtourism), ), explorationexploration ofof otherother naturalnatural resourcesresources ++++
Some of the drivers are more important than others and need Some of the drivers are more important than others and need to be identifiedto be identified
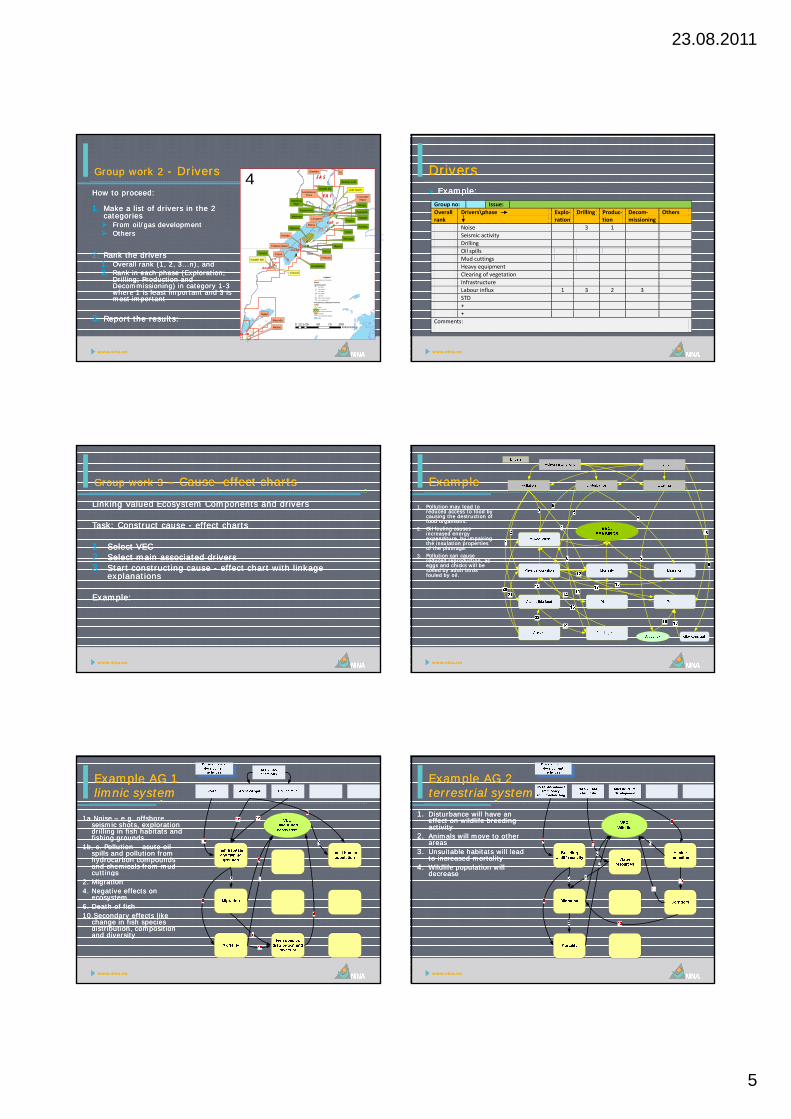
23.08.2011
5
Group Group workwork 2 2 -- DriversDrivers
How to proceed: How to proceed:
1.1. Make a list of drivers in the 2 Make a list of drivers in the 2 categories categories From oil/gas development From oil/gas development OthersOthers
••
µ
1
µµ1* 11
+
µ
1
0
11
1
1
1
1
ª
µ
1
µ!!
!
Jobi-North
CrocodileMpyo
Buffalo Jobi
Giraffe RiiHartebeest
Pura
WarthogNgiri
EA 1
Kasamene
Wairindi Ngege
Kigogole
Karuka
Waraga
Mputa
Nsoga
Taitai
Ngassa
Leopard
Kisinja
Ntera
NgaraEA2
Pelican West
ItiSambia
EA 54
www.nina.no
2.2. Rank the drivers Rank the drivers 1.1. Overall rank (1, 2, 3...n), andOverall rank (1, 2, 3...n), and2.2. Rank in each phase (Exploration; Rank in each phase (Exploration;
Drilling; Production and Drilling; Production and Decommissioning) in category 1Decommissioning) in category 1--3 3 where 1 is least important and 3 is where 1 is least important and 3 is most importantmost important
3.3. Report the results:Report the results:
0
10!1
Nzizi
PelicanCrane
Kingfisher
Turaco
Saddle Bill
Coucal
EA3A
Ngaji
Mpundu
Nkobe
EA-3C
EA-4B
Legend
Exploration boundary
Wells
HydroCarbons
ª Dry Well
+ Gas Shows
* Gas Well
µ Oil Shows
! Oil Well
0 Oil and Gas Shows
1 Oil and Gas Well
Prospects,Leads,Discoveries
TYPELead
Oil Discovery
Oil and Gas Discovery
Prospect
International boundary
Lake
0 25 50 75 10012.5Kilometers
Text
DriversDrivers Example:Example:
Group no: Issue:Overallrank
Drivers\phase
Explo-ration
Drilling Produc-tion
Decom-missioning
Others
Noise 3 1 Seismic activity Drilling
www.nina.no
Oil spills Mud cuttings Heavy equipment Clearing of vegetation Infrastructure Labour influx 1 3 2 3 STD + +
Comments:
Group Group workwork 3 3 –– CauseCause––effecteffect chartscharts
Linking Valued Ecosystem Components and driversLinking Valued Ecosystem Components and drivers
Task: Construct cause Task: Construct cause -- effect chartseffect charts
1.1. Select VECSelect VEC2.2. Select main associated driversSelect main associated drivers
••
www.nina.no
2.2. Select main associated driversSelect main associated drivers3.3. Start constructing cause Start constructing cause -- effect chart with linkage effect chart with linkage
explanationsexplanations
Example:Example:
ExampleExample
1.1. Pollution may lead to Pollution may lead to reduced access to food by reduced access to food by causing the destruction of causing the destruction of food organisms.food organisms.
2.2. Oil fouling causes Oil fouling causes increased energy increased energy expenditure, by impairing expenditure, by impairing the insulation properties the insulation properties of the plumage.of the plumage.
3.3. Pollution can cause Pollution can cause d d d tid d d ti
••
www.nina.no
reduced reproduction, as reduced reproduction, as eggs and chicks will be eggs and chicks will be soiled by adult birds soiled by adult birds fouled by oil. fouled by oil.
Example AG 1 Example AG 1 limniclimnic systemsystem
1a.Noise 1a.Noise –– e.g. offshore e.g. offshore seismic shots, exploration seismic shots, exploration drilling in fish habitats and drilling in fish habitats and fishing groundsfishing grounds
1b, c. Pollution 1b, c. Pollution –– acute oil acute oil spills and pollution from spills and pollution from hydrocarbon compounds hydrocarbon compounds and chemicals from mud and chemicals from mud
••
www.nina.no
cuttingscuttings2. Migration2. Migration4. Negative effects on 4. Negative effects on
ecosystemecosystem6. Death of fish6. Death of fish10.Secondary effects like 10.Secondary effects like
change in fish species change in fish species distribution, composition distribution, composition and diversityand diversity
Example AG 2Example AG 2terrestrial systemterrestrial system
1.1. Disturbance will have an Disturbance will have an effect on wildlife breeding effect on wildlife breeding activityactivity
2.2. Animals will move to other Animals will move to other areasareas
3.3. Unsuitable habitats will lead Unsuitable habitats will lead to increased mortalityto increased mortality
4.4. Wildlife population will Wildlife population will
••
www.nina.no
p pp pdecreasedecrease
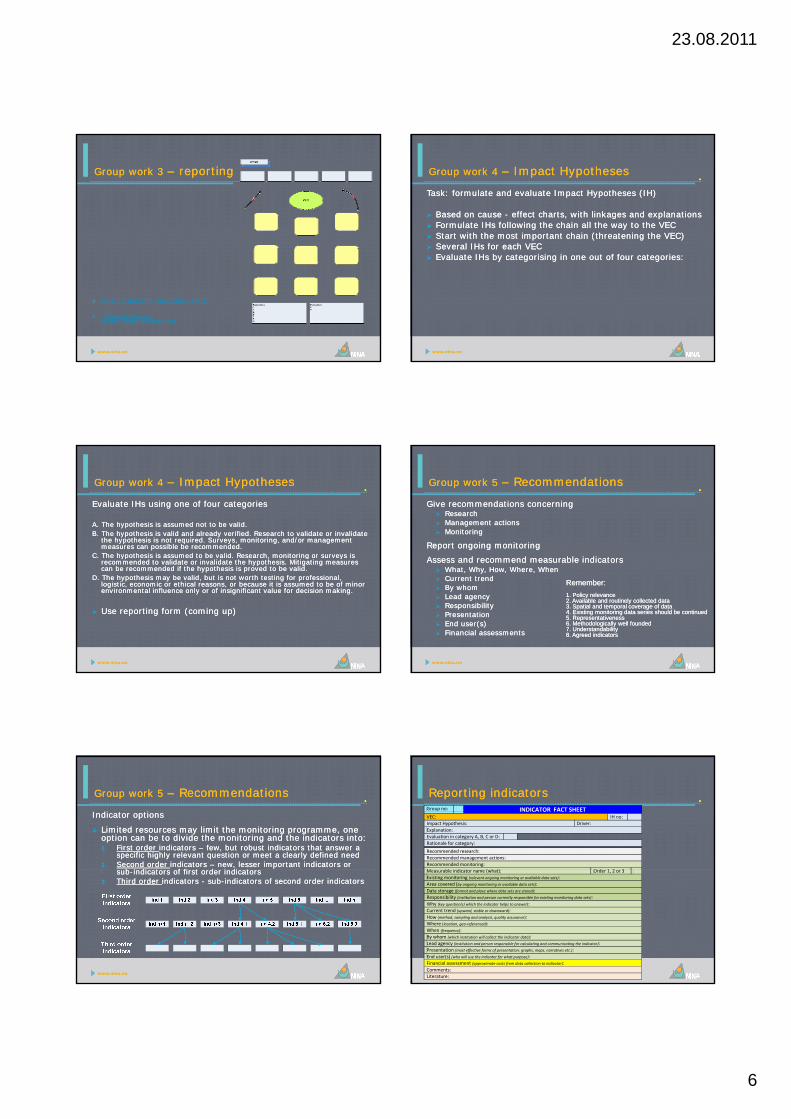
23.08.2011
6
Group Group workwork 3 3 –– reportingreporting ••
www.nina.no
HowHow to to useuse thethe reportingreporting chartchart::
....\\ReportingReporting\\CauseCause--effect%20chart%20draft.vsdeffect%20chart%20draft.vsd
Group Group workwork 4 4 –– ImpactImpact HypothesesHypotheses
Task: formulate and evaluate Impact Hypotheses (IH)Task: formulate and evaluate Impact Hypotheses (IH)
Based on cause Based on cause -- effect charts, with linkages and explanationseffect charts, with linkages and explanations Formulate IHs following the chain all the way to the VECFormulate IHs following the chain all the way to the VEC Start with the most important chain (threatening the VEC)Start with the most important chain (threatening the VEC) Several IHs for each VECSeveral IHs for each VEC
••
www.nina.no
Several IHs for each VECSeveral IHs for each VEC Evaluate IHs by Evaluate IHs by categorisingcategorising in one out of four categories:in one out of four categories:
Group Group workwork 4 4 –– ImpactImpact HypothesesHypotheses
Evaluate IHs using one of four categoriesEvaluate IHs using one of four categories
A. The hypothesis is assumed not to be valid.A. The hypothesis is assumed not to be valid.B. The hypothesis is valid and already verified. Research to validate or invalidate B. The hypothesis is valid and already verified. Research to validate or invalidate
the hypothesis is not required. Surveys, monitoring, and/or management the hypothesis is not required. Surveys, monitoring, and/or management measures can possible be recommended.measures can possible be recommended.
C. The hypothesis is assumed to be valid. Research, monitoring or surveys is C. The hypothesis is assumed to be valid. Research, monitoring or surveys is
••
www.nina.no
yp , g yyp , g yrecommended to validate or invalidate the hypothesis. Mitigating measures recommended to validate or invalidate the hypothesis. Mitigating measures can be recommended if the hypothesis is proved to be valid.can be recommended if the hypothesis is proved to be valid.
D. The hypothesis may be valid, but is not worth testing for professional, D. The hypothesis may be valid, but is not worth testing for professional, logistic, economic or ethical reasons, or because it is assumed to be of minor logistic, economic or ethical reasons, or because it is assumed to be of minor environmental influence only or of insignificant value for decision making.environmental influence only or of insignificant value for decision making.
Use reporting form (coming up)Use reporting form (coming up)
Group Group workwork 5 5 –– RecommendationsRecommendations
Give recommendations concerningGive recommendations concerning ResearchResearch Management actionsManagement actions MonitoringMonitoring
Report ongoing monitoringReport ongoing monitoring
Assess and recommend measurable indicatorsAssess and recommend measurable indicators
••
www.nina.no
Assess and recommend measurable indicators Assess and recommend measurable indicators What, Why, How, Where, WhenWhat, Why, How, Where, When Current trendCurrent trend By whomBy whom Lead agencyLead agency ResponsibilityResponsibility PresentationPresentation End user(s)End user(s) Financial assessmentsFinancial assessments
RememberRemember::
1. Policy relevance 1. Policy relevance 2. Available and routinely collected data 2. Available and routinely collected data 3. Spatial and temporal coverage of data 3. Spatial and temporal coverage of data 4. Existing monitoring data series should be continued 4. Existing monitoring data series should be continued 5. Representativeness 5. Representativeness 6. Methodologically well founded 6. Methodologically well founded 7. Understandability 7. Understandability 8. Agreed indicators 8. Agreed indicators
Group Group workwork 5 5 –– RecommendationsRecommendations
Indicator optionsIndicator options
Limited resources may limit the monitoring Limited resources may limit the monitoring programmeprogramme, one , one option can be to divide the monitoring and the indicators into:option can be to divide the monitoring and the indicators into:1.1. First order First order indicators indicators –– few, but robust indicators that answer a few, but robust indicators that answer a
specific highly relevant question or meet a clearly defined needspecific highly relevant question or meet a clearly defined need2.2. Second order Second order indicators indicators –– new, lesser important indicators or new, lesser important indicators or
bb i di t f fi t d i di ti di t f fi t d i di t
••
www.nina.no
subsub--indicators of first order indicatorsindicators of first order indicators3.3. Third order Third order indicators indicators -- subsub--indicators of second order indicators indicators of second order indicators
ReportingReporting indicatorsindicators ••
Group no: INDICATOR FACT SHEET VEC: IH no: Impact Hypothesis: Driver: Explanation: Evaluation in category A, B, C or D:Rationale for category:
Recommended research:Recommended management actions:Recommended monitoring:M bl i di t ( h t) O d 1 2 3
www.nina.no
Measurable indicator name (what): Order 1, 2 or 3 Existing monitoring (relevant ongoing monitoring or available data sets): Area covered (by ongoing monitoring or available data sets):Data storage (format and place where data sets are stored):Responsibility (institution and person currently responsible for existing monitoring data sets): Why (key question(s) which the indicator helps to answer):Current trend (upward, stable or downward):How (method, sampling and analysis, quality assurance):Where (location, geo-referenced):When (frequency):By whom (which institution will collect the indicator data):Lead agency (institution and person responsible for calculating and communicating the indicator): Presentation (most effective forms of presentation: graphs, maps, narratives etc.): End user(s) (who will use the indicator for what purpose):Financial assessment (approximate costs from data collection to indicator): Comments:Literature:
23.08.2011
7
Tentative ProgrammeTentative Programme ••
Tuesday 12 April Time Scoping process Who/where 09:00 Group organizing Facilitators 09:15 Group work 1: Selecting Valued Ecosystem Components (VECs) Participants, group rooms 10:30 Coffee, tea 11:00 Group work 2: Identification of drivers (impact factors) Participants, group rooms 13:00 Lunch 14:00 Plenary session 1: Presenting the results from group work 1 and 2 Plenary 15:30 Discussion, conclusions
www.nina.no
16:00 Group work 3: Linking drivers and VECs in cause-effect charts Participants, group rooms 18:00 End day 2 Wednesday 13 April Time Scoping process Who/where 09:00 Group work 3: Continue from end of day 2 Participants, group rooms 11:00 Coffee, tea 11:30 Plenary session 2: Presenting the results from group work 3 Plenary 13:00 Lunch 14:00 Group work 4: Formulation ofImpact Hypotheses from VEC cause-
effect charts,evaluation and prioritizing Participants, group rooms
16:00 Coffee, tea 16:30 Group work 4: continues Participants, group rooms 18:00 End day 3
Tentative ProgrammeTentative Programme ••
Thursday 14 AprilTime Scoping process Who/where 09:00 Plenary session 3: Presenting the results from group work 4 Plenary 10:30 Coffee, tea 11:00 Group work 5: Recommendations Participants, group rooms 13:00 Lunch 14:00 Plenary session 4: Presenting the results from group work 5 Plenary 16:00 Coffee, tea 16:30 Wrapping up the workshop Facilitators
www.nina.no
18:00 End of workshop NEMA
GoodGood luckluck!!


ISSN: 1504-3312
ISBN: 978-82-426-2293-8
706
![Finokalia filadio.ppt [ ])finokalia.chemistry.uoc.gr/workpages/station/pdf/handout.pdfFINOKALIA monitoring station of the Environmental ChemicalProcessesLaboratory,ChemistryDepartment,](https://static.fdokument.com/doc/165x107/5e8f8327d98eae74a326aa7c/finokalia-finokaliachemistryuocgrworkpagesstationpdfhandoutpdf-finokalia.jpg)