
Evaluation method for comparison of heat pump systems with
21
1 SEasonal PErformance factor and MOnitoring for heat pump systems in the building sector SEPEMO-Build Evaluation method for comparison of heat pump systems with conventional heating systems D4.3. Concept for evaluation of CO2-reduction potential Author(s) Andreas Zottl, Markus Lindahl, Roger Nordman, Philippe Rivière, Marek Miara Date of delivery: 2011-08-31 Contract Number IEE/08/776/SI2.529222 The sole responsibility for the content of this document lies with the authors. It does not necessarily reflect the opinion of the European Communities. The European Commission is not responsible for any use that may be made of the information contained therein.
Transcript of Evaluation method for comparison of heat pump systems with
1
SEasonal PErformance factor and MOnitoring for heat pump systems in the building sector
SEPEMO-Build
Evaluation method for comparison of heat pump systems with conventional heating systems
D4.3. Concept for evaluation of CO2-reduction potential
Author(s) Andreas Zottl, Markus Lindahl, Roger Nordman, Philippe Rivière,
Marek Miara
Date of delivery: 2011-08-31
Contract Number IEE/08/776/SI2.529222
The sole responsibility for the content of this document lies with the authors. It does not necessarily reflect the opinion of the European Communities. The European Commission is not responsible for any use that may be made of the information contained therein.
SEPEMO-Build report
2
Content 1 Foreword ............................................................................................................................. 3 2 Nomenclature ..................................................................................................................... 3 3 Calculation methodology ................................................................................................... 4 3.1 LCA life cycle assessment ..................................................................................................... 4 3.1.1 System boundary description .............................................................................................. 4 3.1.2 Use phase ........................................................................................................................... 5 3.1.3 Life time - TEWI .................................................................................................................. 6 3.2 Validation process for heating systems .................................................................................. 7 3.2.1 Final Energy Consumption .................................................................................................. 8 3.2.2 Primary Energy demand ..................................................................................................... 8 3.2.3 CO2-emissions .................................................................................................................... 8 3.2.4 TEWI ................................................................................................................................... 9 4 Parameters for calculation .............................................................................................. 10 4.1 Efficiency of the systems ..................................................................................................... 10 4.1.1 Heat pump systems - SPF ................................................................................................ 10 4.1.2 Common systems - AE ..................................................................................................... 10 4.2 Primary energy use parameter ............................................................................................. 11
4.2.1 Primary energy factor pf ................................................................................................... 11
4.2.2 CO2-emission coefficient К ................................................................................................ 12 4.2.3 Comparison of data sources ............................................................................................. 13 4.3 Technical parameters .......................................................................................................... 14 4.3.1 GWP(100) of refrigerants ..................................................................................................... 14 4.3.2 Leakage rate ..................................................................................................................... 14 4.3.3 Recovery rate ................................................................................................................... 14 5 Example calculation ......................................................................................................... 15 5.1 Input data from field measurements ..................................................................................... 15 5.2 System analysis ................................................................................................................... 16 5.3 Example diagrams ............................................................................................................... 17 6 Literature .......................................................................................................................... 20 7 Figures .............................................................................................................................. 21 8 Tables................................................................................................................................ 21
3
1 Foreword The deliverable “D4.3 Concept for evaluation of CO2-reduction potential” contains information on how to compare heat pump systems with conventional technologies like coal, oil or gas heating systems. By this comparison it is possible to calculate the CO2e1-emission and PE reduction potential from different heat pump systems compared to other heating systems. The evaluation method for comparing the heat pump system with conventional heating systems will be focused on the following three parameters:
• CO2e-emissions • Primary Energy (PE) demand • TEWI (Total Equivalent Warming Impact)
In all three methods, the effect over the lifetime of the product is chose, even if the CO2e-emisions and PE requirements of course also can be expressed per year.
2 Nomenclature AE - Annual Efficiency
fp kWh/kWh primary energy factor
GWP kg CO2-e/kg Global Warming Potential
LCA Life Cycle Assessment
SPF - Seasonal Performance Factor
TEWI kg CO2 Total Equivalent Warming Impact
К kg CO2-e/kWh CO2e-emission coefficient
m kg Refrigerant content of the heat pump
L kg refrigerant/year Leakage losses of refrigerant per year
n a Operation time of the system in years
αRecovery - Recovery factor during the disposal of the system after life time
1 CO2e, Carbon dioxide equivalent is a quantity that describes, for a given mixture and amount of greenhouse gas, the amount of CO2 that would have the same global warming potential (GWP), when measured over a specified timescale (generally, 100 years). The carbon dioxide equivalency for a gas is obtained by multiplying the mass and the GWP of the gas.
SEPEMO-Build report
4
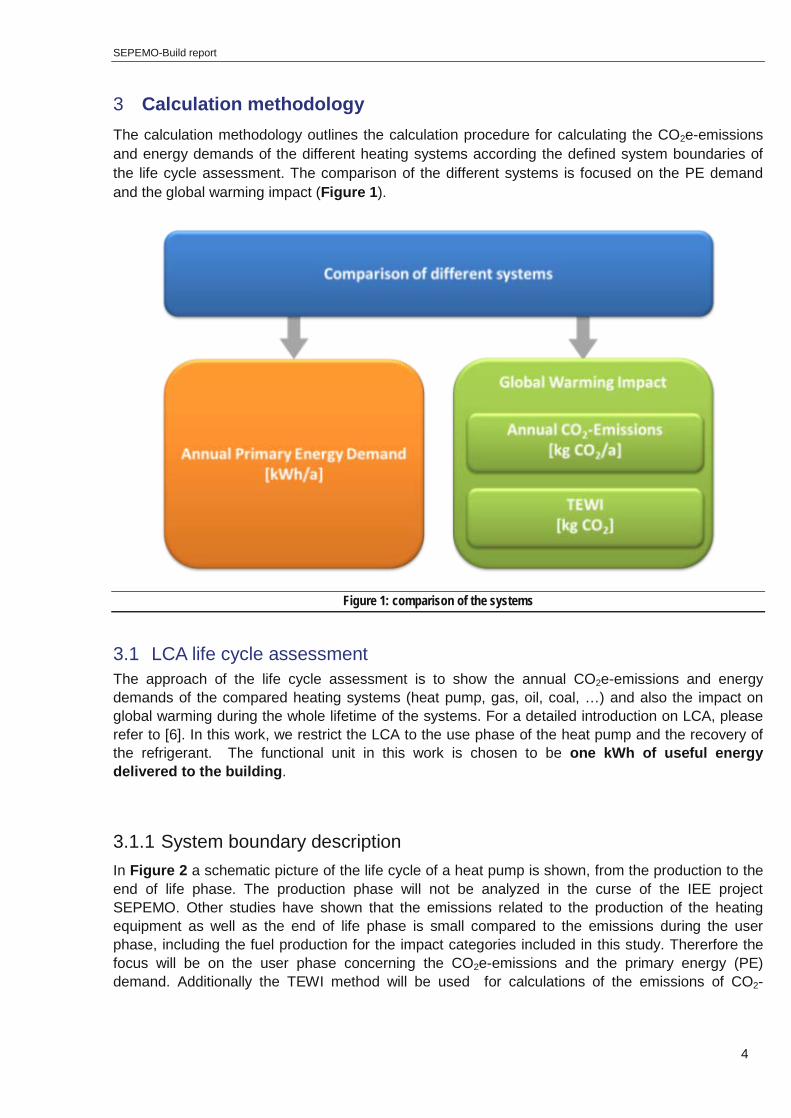
3 Calculation methodology The calculation methodology outlines the calculation procedure for calculating the CO2e-emissions and energy demands of the different heating systems according the defined system boundaries of the life cycle assessment. The comparison of the different systems is focused on the PE demand and the global warming impact (Figure 1).
Figure 1: comparison of the systems
3.1 LCA life cycle assessment The approach of the life cycle assessment is to show the annual CO2e-emissions and energy demands of the compared heating systems (heat pump, gas, oil, coal, …) and also the impact on global warming during the whole lifetime of the systems. For a detailed introduction on LCA, please refer to [6]. In this work, we restrict the LCA to the use phase of the heat pump and the recovery of the refrigerant. The functional unit in this work is chosen to be one kWh of useful energy delivered to the building.
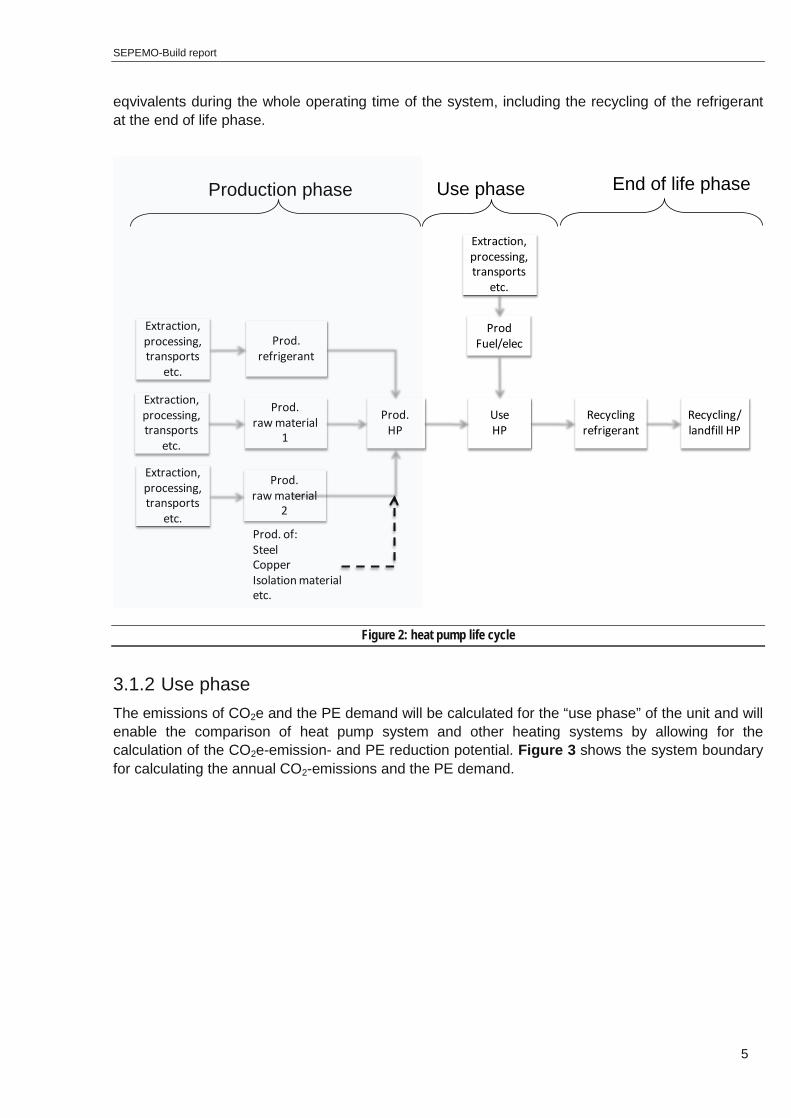
3.1.1 System boundary description In Figure 2 a schematic picture of the life cycle of a heat pump is shown, from the production to the end of life phase. The production phase will not be analyzed in the curse of the IEE project SEPEMO. Other studies have shown that the emissions related to the production of the heating equipment as well as the end of life phase is small compared to the emissions during the user phase, including the fuel production for the impact categories included in this study. Thererfore the focus will be on the user phase concerning the CO2e-emissions and the primary energy (PE) demand. Additionally the TEWI method will be used for calculations of the emissions of CO2-
SEPEMO-Build report
5
eqvivalents during the whole operating time of the system, including the recycling of the refrigerant at the end of life phase.
Figure 2: heat pump life cycle
3.1.2 Use phase The emissions of CO2e and the PE demand will be calculated for the “use phase” of the unit and will enable the comparison of heat pump system and other heating systems by allowing for the calculation of the CO2e-emission- and PE reduction potential. Figure 3 shows the system boundary for calculating the annual CO2-emissions and the PE demand.
Prod.raw material
1
Prod.HP
UseHP
Recycling/landfill HP
Recyclingrefrigerant
Prod.refrigerant
ProdFuel/elec
Extraction,processing,transports
etc.
Prod. of:SteelCopperIsolation materialetc.
Extraction,processing,transports
etc.
Extraction,processing,transports
etc.
Extraction,processing,transports
etc.
Prod.raw material
2
Production phase Use phase End of life phase

SEPEMO-Build report
6
Figure 3: system boundary – user phase
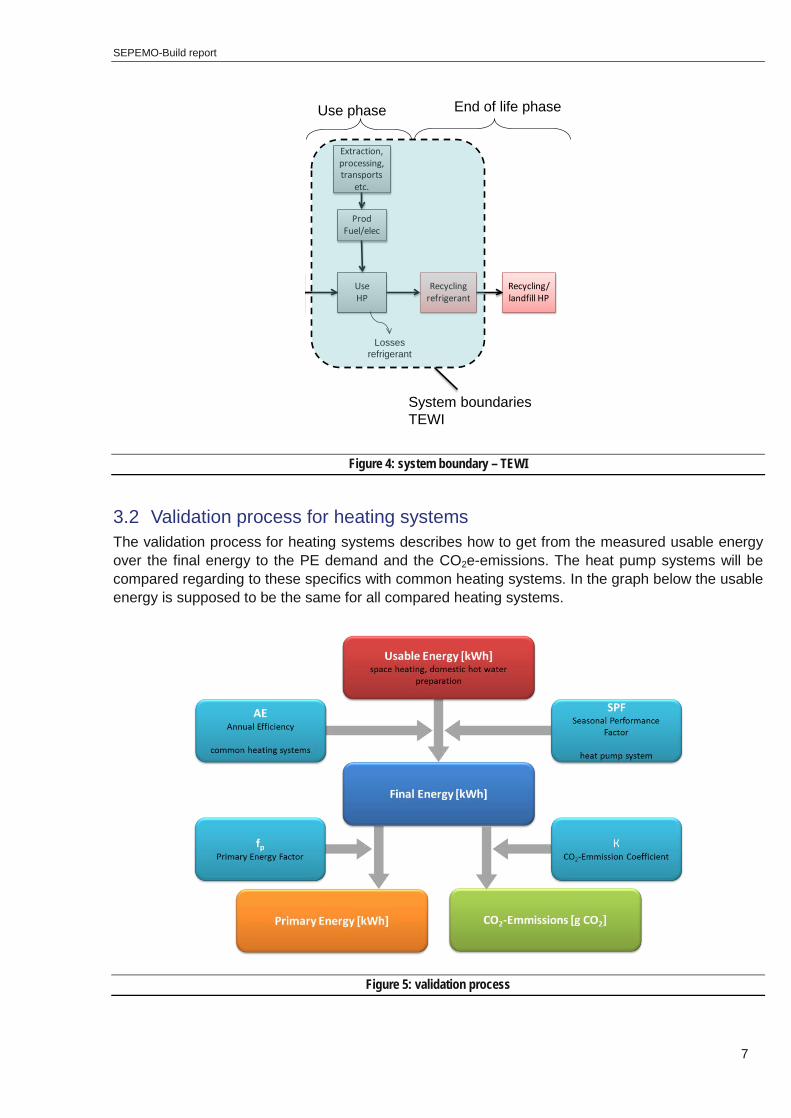
3.1.3 Life time - TEWI The concept of Total Equivalent Warming Impact, or TEWI, was developed as a comparative index of the global warming impacts of an end use application by accounting for both the direct contributions from refrigerants and blowing agents to the atmosphere and the indirect contributions from energy consumption [1]. The TEWI is normally evaluated over the lifecycle of the product. To get more information on the long term impact on CO2-emissions during the “life time” of the units, the TEWI will be calculated according to the standard EN 378-1 [3]. This shall result in an easy to handle analysis of the different systems (Figure 4). The TEWI provides an estimation of the CO2e-emissions, where the direct (by loss of refrigerant) and indirect emissions (produced during the generation of the necessary electricity for driving the system) in the life time of a heat pump are taken into account. It is used for the estimation of the total contribution of the heat pump to the greenhouse effect. This calculation procedure can be extended for gas-, oil-, and coal heating systems, as described in chapter 3.2.4.
UseHP
Recycling/landfill HP
Recyclingrefrigerant
ProdFuel/elec
Extraction,processing,transports
etc.
Use phase End of life phase
Lossesrefrigerant
System boundariesPrimary energy useand CO2e-emissions
SEPEMO-Build report
7
Figure 4: system boundary – TEWI
3.2 Validation process for heating systems The validation process for heating systems describes how to get from the measured usable energy over the final energy to the PE demand and the CO2e-emissions. The heat pump systems will be compared regarding to these specifics with common heating systems. In the graph below the usable energy is supposed to be the same for all compared heating systems.
Figure 5: validation process
UseHP
Recycling/landfill HP
Recyclingrefrigerant
ProdFuel/elec
Extraction,processing,transports
etc.
Use phase End of life phase
Lossesrefrigerant
System boundariesTEWI
SEPEMO-Build report
8
[-] AE[kWh]energy usable[kWh]energy final systemsconmon =
]-[ SPF[kWh]energy usable]kWh[energy final pumpsheat =
[kWh][kWh]f [kWh]energy final]kWh[energy primary p∗=
[kWh][g] [kWh]energy final]g[emssion -eCO2 Κ∗=
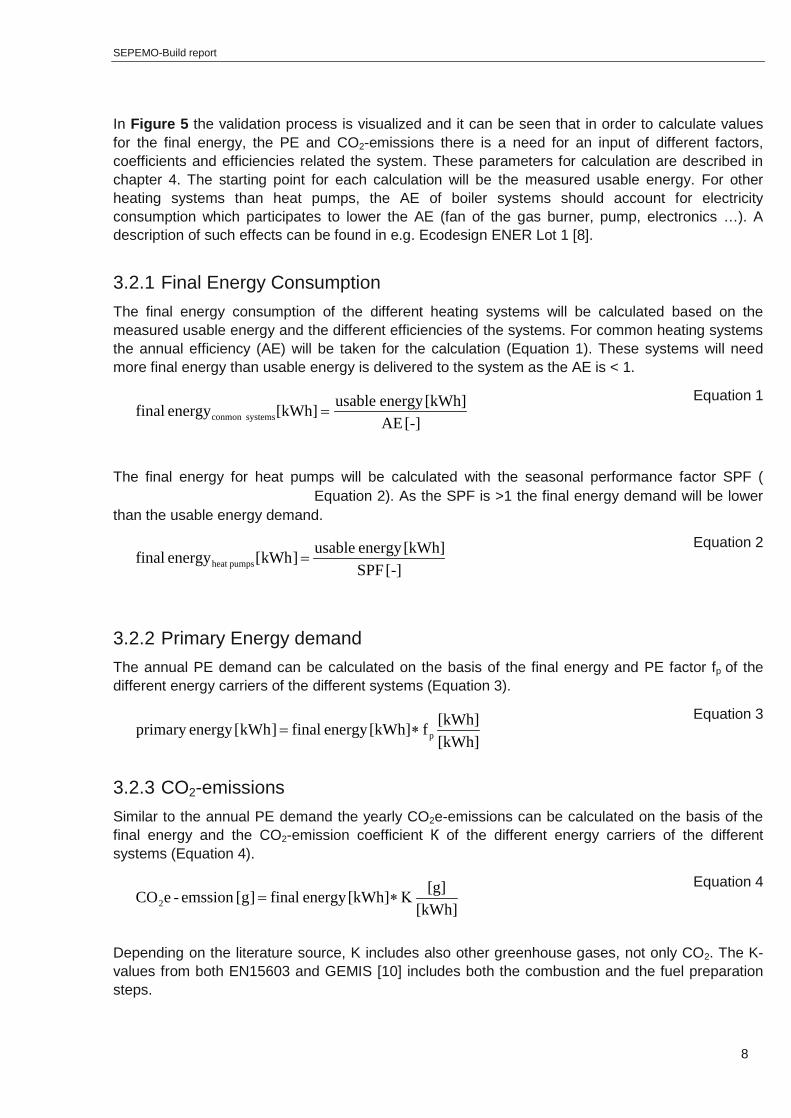
In Figure 5 the validation process is visualized and it can be seen that in order to calculate values for the final energy, the PE and CO2-emissions there is a need for an input of different factors, coefficients and efficiencies related the system. These parameters for calculation are described in chapter 4. The starting point for each calculation will be the measured usable energy. For other heating systems than heat pumps, the AE of boiler systems should account for electricity consumption which participates to lower the AE (fan of the gas burner, pump, electronics …). A description of such effects can be found in e.g. Ecodesign ENER Lot 1 [8].
3.2.1 Final Energy Consumption The final energy consumption of the different heating systems will be calculated based on the measured usable energy and the different efficiencies of the systems. For common heating systems the annual efficiency (AE) will be taken for the calculation (Equation 1). These systems will need more final energy than usable energy is delivered to the system as the AE is < 1.
Equation 1
The final energy for heat pumps will be calculated with the seasonal performance factor SPF ( Equation 2). As the SPF is >1 the final energy demand will be lower than the usable energy demand.
Equation 2
3.2.2 Primary Energy demand The annual PE demand can be calculated on the basis of the final energy and PE factor fp of the different energy carriers of the different systems (Equation 3).
Equation 3
3.2.3 CO2-emissions Similar to the annual PE demand the yearly CO2e-emissions can be calculated on the basis of the final energy and the CO2-emission coefficient К of the different energy carriers of the different systems (Equation 4).
Equation 4
Depending on the literature source, K includes also other greenhouse gases, not only CO2. The K-values from both EN15603 and GEMIS [10] includes both the combustion and the fuel preparation steps.
SEPEMO-Build report
9
indirectdirect GWPGWP TEWI +=
)α(1mGWPnLGWPGWP recoverydirect −∗∗+∗∗=
nΚ energyfinalGWPindirect ∗∗=
nΚ energyfinalGWPTEWI indirectsystemsconmon ∗∗==
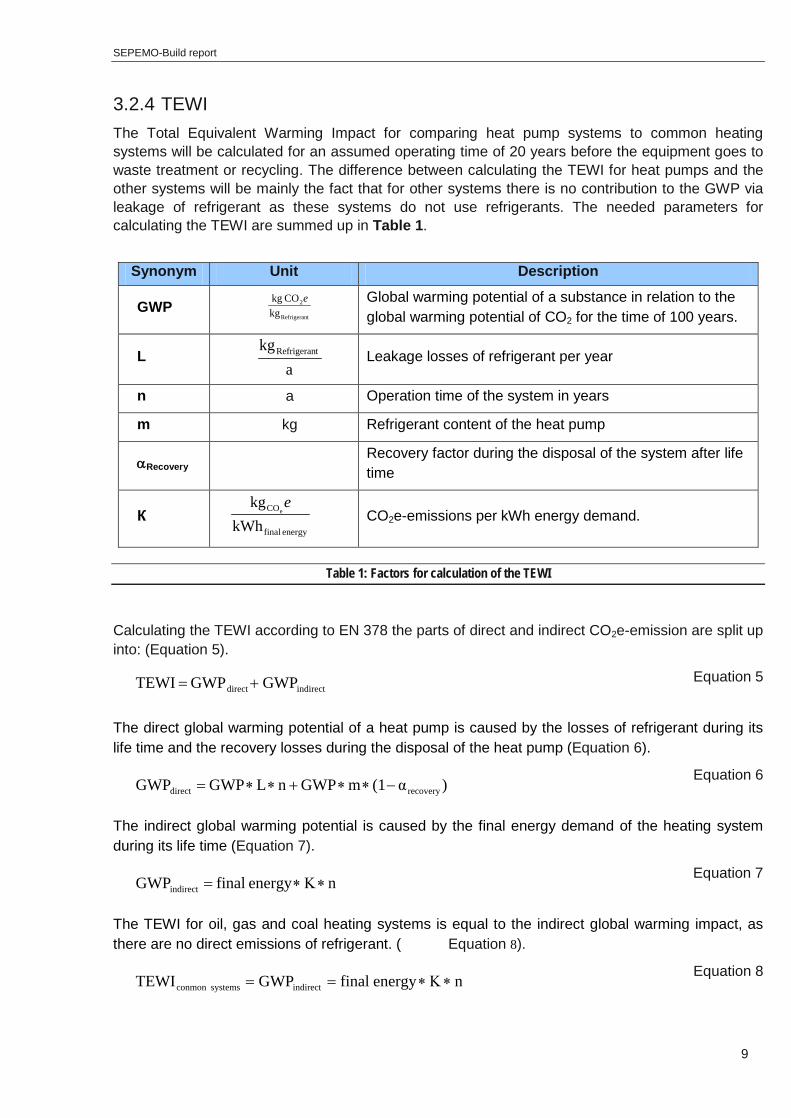
3.2.4 TEWI The Total Equivalent Warming Impact for comparing heat pump systems to common heating systems will be calculated for an assumed operating time of 20 years before the equipment goes to waste treatment or recycling. The difference between calculating the TEWI for heat pumps and the other systems will be mainly the fact that for other systems there is no contribution to the GWP via leakage of refrigerant as these systems do not use refrigerants. The needed parameters for calculating the TEWI are summed up in Table 1.
Synonym Unit Description
GWP tRefrigeran
2
kgCO kg e Global warming potential of a substance in relation to the
global warming potential of CO2 for the time of 100 years.
L a
kg tRefrigeran Leakage losses of refrigerant per year
n a Operation time of the system in years
m kg Refrigerant content of the heat pump
αRecovery Recovery factor during the disposal of the system after life time
К energy final
CO
kWhkg
ee
CO2e-emissions per kWh energy demand.
Table 1: Factors for calculation of the TEWI
Calculating the TEWI according to EN 378 the parts of direct and indirect CO2e-emission are split up into: (Equation 5).
Equation 5
The direct global warming potential of a heat pump is caused by the losses of refrigerant during its life time and the recovery losses during the disposal of the heat pump (Equation 6).
Equation 6
The indirect global warming potential is caused by the final energy demand of the heating system during its life time (Equation 7).
Equation 7
The TEWI for oil, gas and coal heating systems is equal to the indirect global warming impact, as there are no direct emissions of refrigerant. ( Equation 8).
Equation 8
SEPEMO-Build report
10
4 Parameters for calculation To analyse and compare the heat pump systems to common heating systems concerning ecological aspects the efficiency of the systems and the ecological parameters of the different energy sources have to be defined.
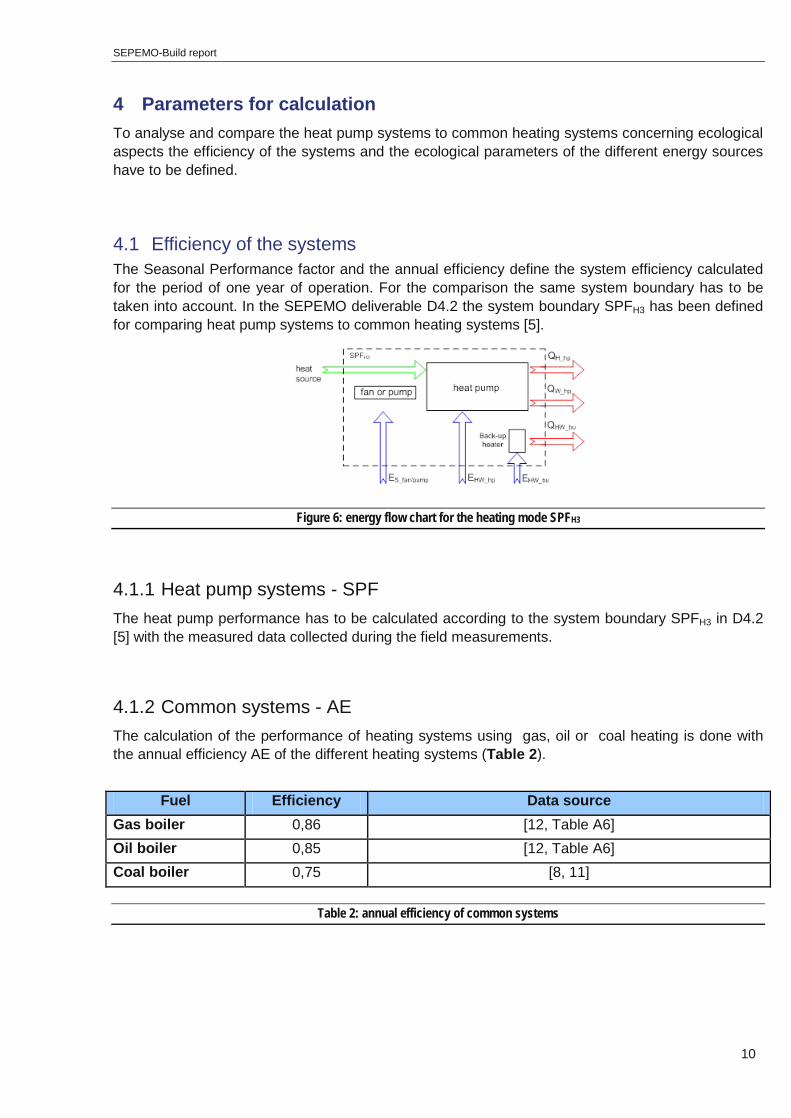
4.1 Efficiency of the systems The Seasonal Performance factor and the annual efficiency define the system efficiency calculated for the period of one year of operation. For the comparison the same system boundary has to be taken into account. In the SEPEMO deliverable D4.2 the system boundary SPFH3 has been defined for comparing heat pump systems to common heating systems [5].
Figure 6: energy flow chart for the heating mode SPFH3
4.1.1 Heat pump systems - SPF The heat pump performance has to be calculated according to the system boundary SPFH3 in D4.2 [5] with the measured data collected during the field measurements.
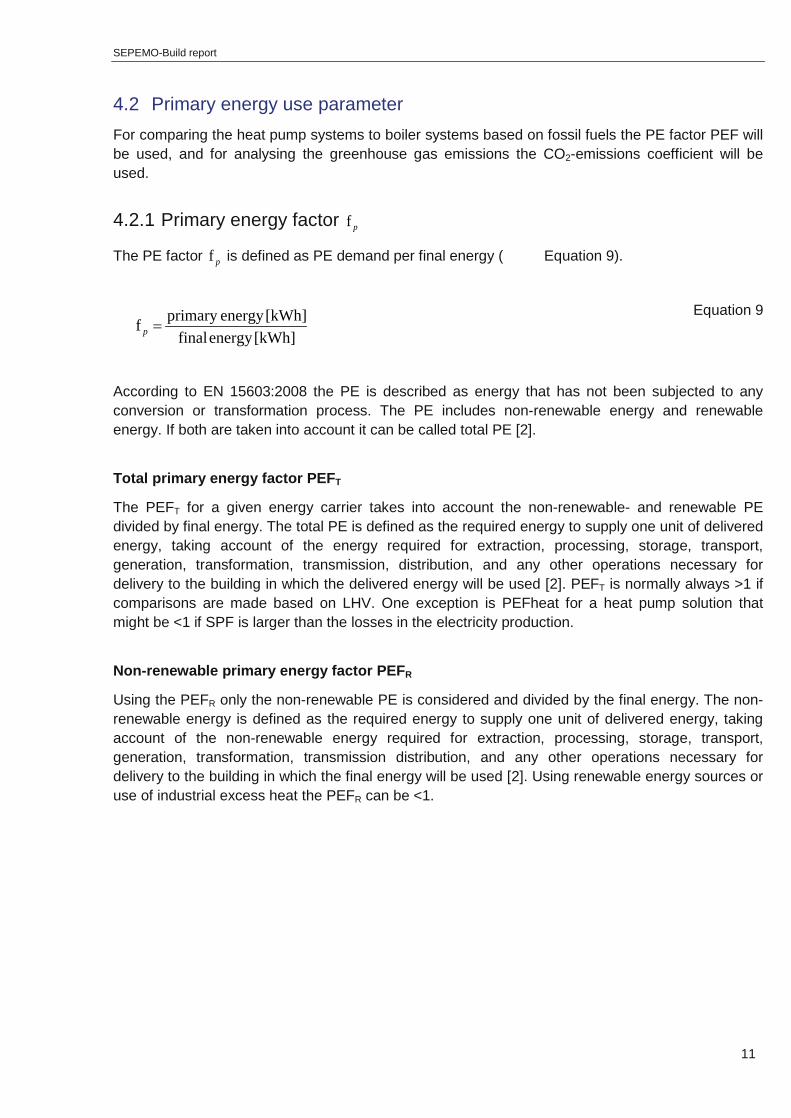
4.1.2 Common systems - AE The calculation of the performance of heating systems using gas, oil or coal heating is done with the annual efficiency AE of the different heating systems (Table 2).
Fuel Efficiency Data source Gas boiler 0,86 [12, Table A6] Oil boiler 0,85 [12, Table A6] Coal boiler 0,75 [8, 11]
Table 2: annual efficiency of common systems
SEPEMO-Build report
11
[kWh]energy final[kWh]energy primaryf =p
4.2 Primary energy use parameter For comparing the heat pump systems to boiler systems based on fossil fuels the PE factor PEF will be used, and for analysing the greenhouse gas emissions the CO2-emissions coefficient will be used.
4.2.1 Primary energy factor pf
The PE factor pf is defined as PE demand per final energy ( Equation 9).
Equation 9
According to EN 15603:2008 the PE is described as energy that has not been subjected to any conversion or transformation process. The PE includes non-renewable energy and renewable energy. If both are taken into account it can be called total PE [2].
Total primary energy factor PEFT
The PEFT for a given energy carrier takes into account the non-renewable- and renewable PE divided by final energy. The total PE is defined as the required energy to supply one unit of delivered energy, taking account of the energy required for extraction, processing, storage, transport, generation, transformation, transmission, distribution, and any other operations necessary for delivery to the building in which the delivered energy will be used [2]. PEFT is normally always >1 if comparisons are made based on LHV. One exception is PEFheat for a heat pump solution that might be <1 if SPF is larger than the losses in the electricity production.
Non-renewable primary energy factor PEFR
Using the PEFR only the non-renewable PE is considered and divided by the final energy. The non-renewable energy is defined as the required energy to supply one unit of delivered energy, taking account of the non-renewable energy required for extraction, processing, storage, transport, generation, transformation, transmission distribution, and any other operations necessary for delivery to the building in which the final energy will be used [2]. Using renewable energy sources or use of industrial excess heat the PEFR can be <1.
SEPEMO-Build report
12
[kWh]energy final[g] emissions-CO 2=Κ
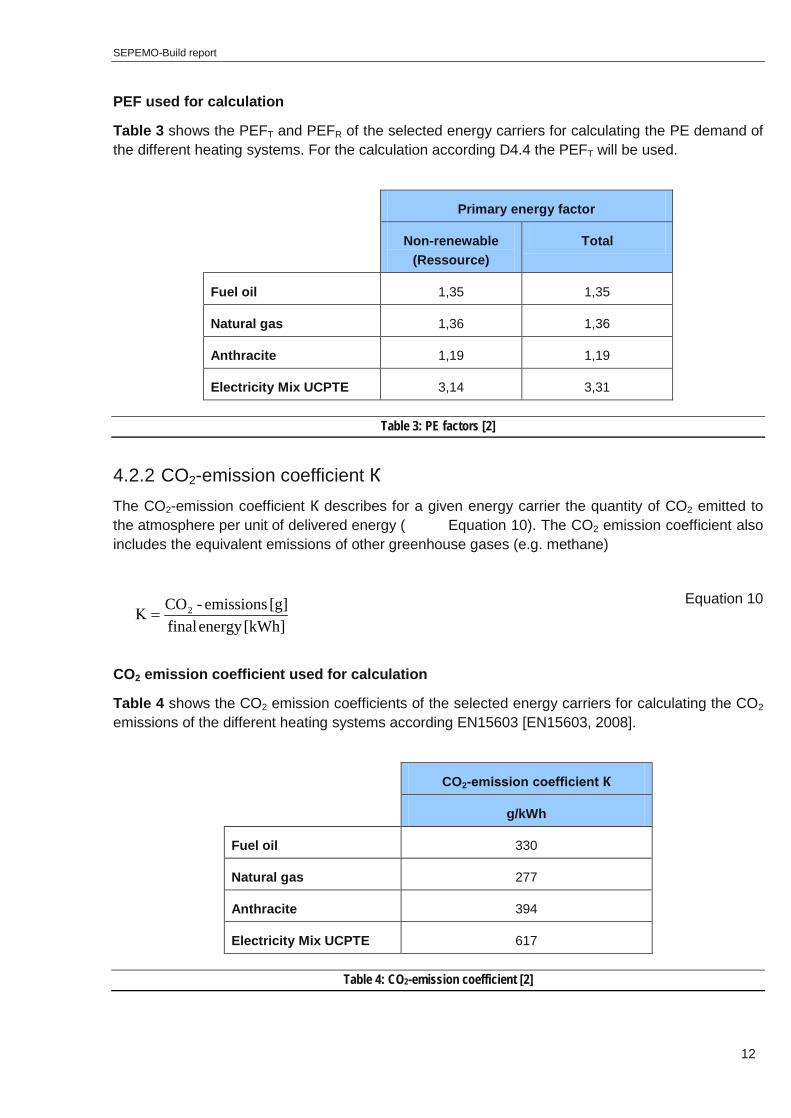
PEF used for calculation
Table 3 shows the PEFT and PEFR of the selected energy carriers for calculating the PE demand of the different heating systems. For the calculation according D4.4 the PEFT will be used.
Primary energy factor
Non-renewable (Ressource)
Total
Fuel oil 1,35 1,35
Natural gas 1,36 1,36
Anthracite 1,19 1,19
Electricity Mix UCPTE 3,14 3,31
Table 3: PE factors [2]
4.2.2 CO2-emission coefficient К The CO2-emission coefficient К describes for a given energy carrier the quantity of CO2 emitted to the atmosphere per unit of delivered energy ( Equation 10). The CO2 emission coefficient also includes the equivalent emissions of other greenhouse gases (e.g. methane)
Equation 10
CO2 emission coefficient used for calculation
Table 4 shows the CO2 emission coefficients of the selected energy carriers for calculating the CO2 emissions of the different heating systems according EN15603 [EN15603, 2008].
CO2-emission coefficient К
g/kWh
Fuel oil 330
Natural gas 277
Anthracite 394
Electricity Mix UCPTE 617
Table 4: CO2-emission coefficient [2]
SEPEMO-Build report
13
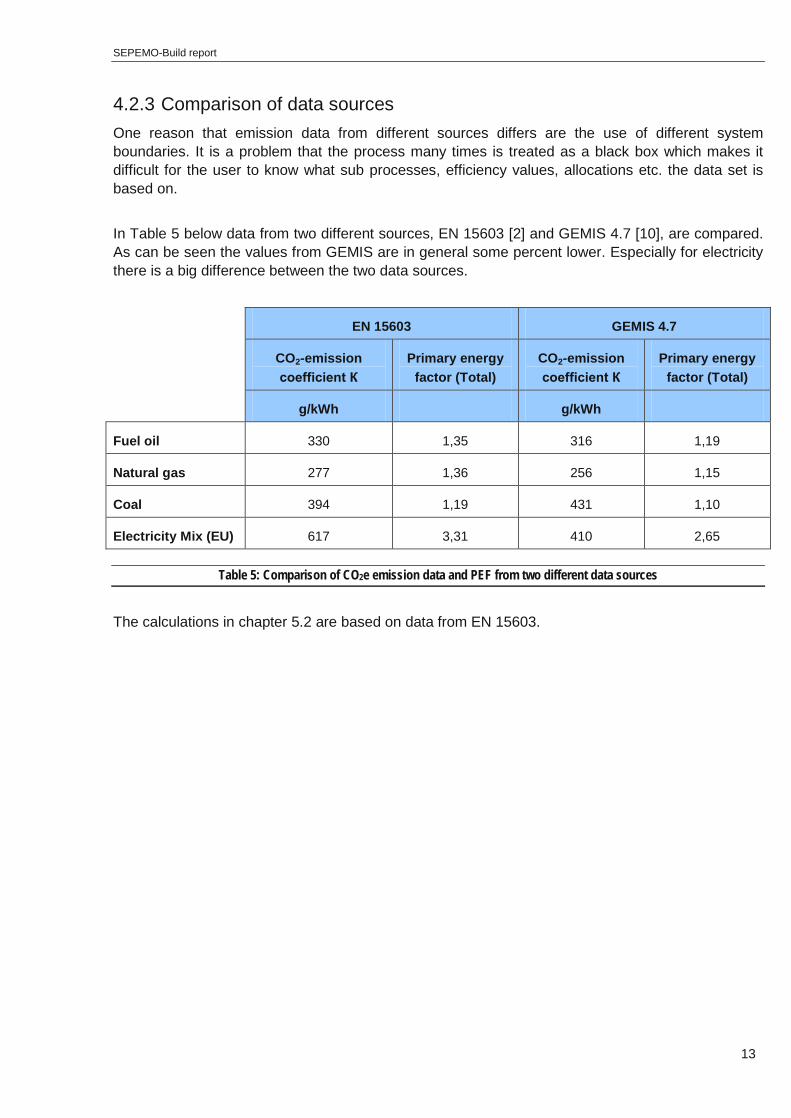
4.2.3 Comparison of data sources One reason that emission data from different sources differs are the use of different system boundaries. It is a problem that the process many times is treated as a black box which makes it difficult for the user to know what sub processes, efficiency values, allocations etc. the data set is based on. In Table 5 below data from two different sources, EN 15603 [2] and GEMIS 4.7 [10], are compared. As can be seen the values from GEMIS are in general some percent lower. Especially for electricity there is a big difference between the two data sources.
EN 15603 GEMIS 4.7
CO2-emission coefficient К
Primary energy factor (Total)
CO2-emission coefficient К
Primary energy factor (Total)
g/kWh g/kWh
Fuel oil 330 1,35 316 1,19
Natural gas 277 1,36 256 1,15
Coal 394 1,19 431 1,10
Electricity Mix (EU) 617 3,31 410 2,65
Table 5: Comparison of CO2e emission data and PEF from two different data sources
The calculations in chapter 5.2 are based on data from EN 15603.
SEPEMO-Build report
14
4.3 Technical parameters For calculating the Total Equivalent Warming Impact TEWI according to EN 378, additional technical information concerning the used refrigerant in the heat pump, the leakage rate and the recovery rate are needed.
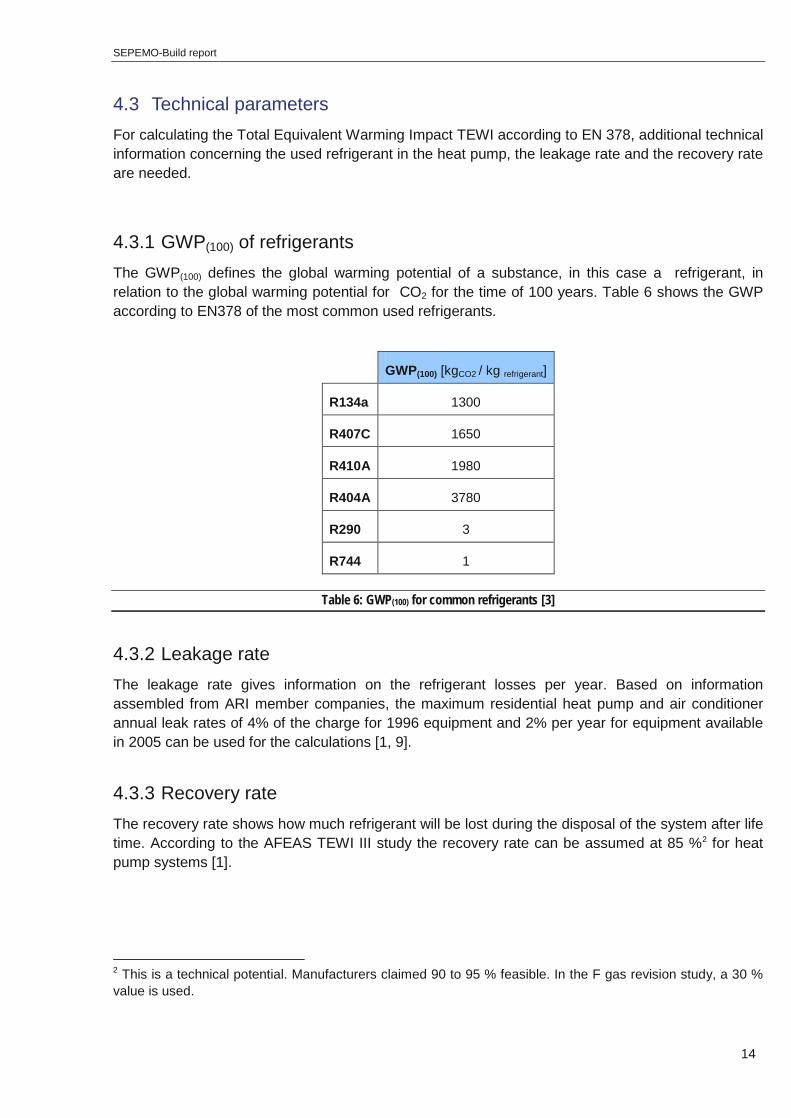
4.3.1 GWP(100) of refrigerants The GWP(100) defines the global warming potential of a substance, in this case a refrigerant, in relation to the global warming potential for CO2 for the time of 100 years. Table 6 shows the GWP according to EN378 of the most common used refrigerants.
GWP(100) [kgCO2 / kg refrigerant]
R134a 1300
R407C 1650
R410A 1980
R404A 3780
R290 3
R744 1
Table 6: GWP(100) for common refrigerants [3]
4.3.2 Leakage rate The leakage rate gives information on the refrigerant losses per year. Based on information assembled from ARI member companies, the maximum residential heat pump and air conditioner annual leak rates of 4% of the charge for 1996 equipment and 2% per year for equipment available in 2005 can be used for the calculations [1, 9].
4.3.3 Recovery rate The recovery rate shows how much refrigerant will be lost during the disposal of the system after life time. According to the AFEAS TEWI III study the recovery rate can be assumed at 85 %2 for heat pump systems [1].
2 This is a technical potential. Manufacturers claimed 90 to 95 % feasible. In the F gas revision study, a 30 % value is used.
SEPEMO-Build report
15
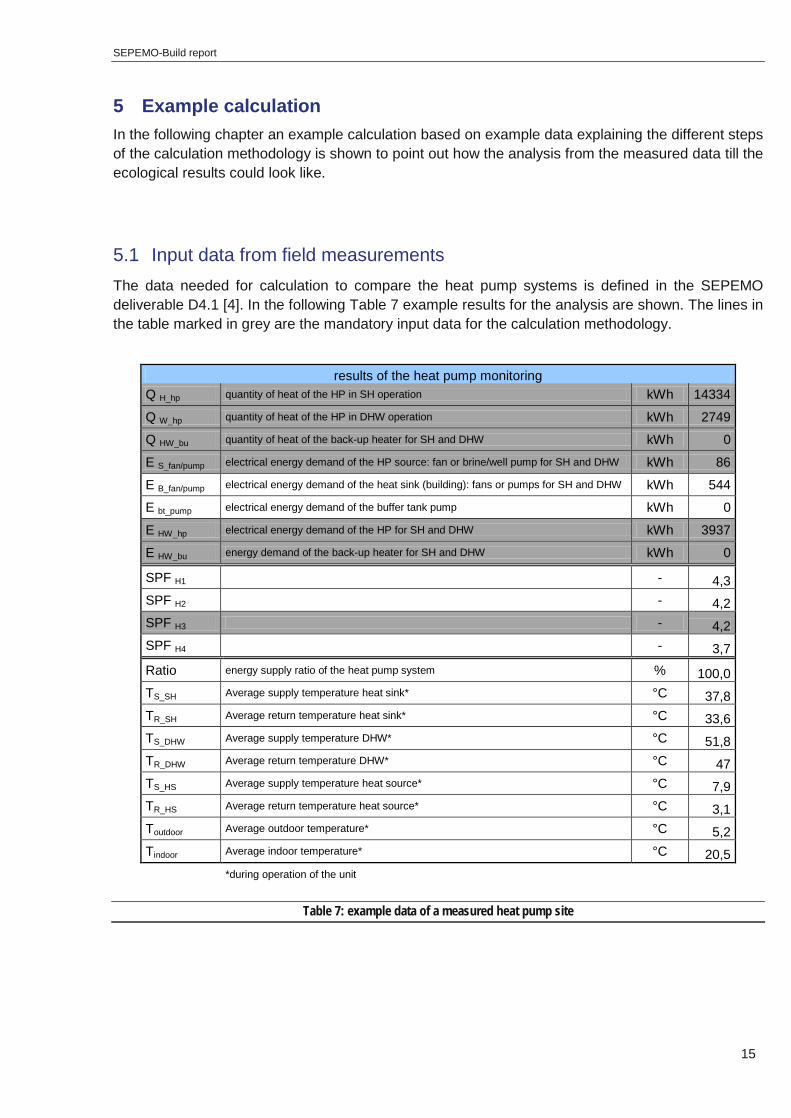
5 Example calculation In the following chapter an example calculation based on example data explaining the different steps of the calculation methodology is shown to point out how the analysis from the measured data till the ecological results could look like.
5.1 Input data from field measurements The data needed for calculation to compare the heat pump systems is defined in the SEPEMO deliverable D4.1 [4]. In the following Table 7 example results for the analysis are shown. The lines in the table marked in grey are the mandatory input data for the calculation methodology.
results of the heat pump monitoring
Q H_hp quantity of heat of the HP in SH operation kWh 14334
Q W_hp quantity of heat of the HP in DHW operation kWh 2749
Q HW_bu quantity of heat of the back-up heater for SH and DHW kWh 0
E S_fan/pump electrical energy demand of the HP source: fan or brine/well pump for SH and DHW kWh 86
E B_fan/pump electrical energy demand of the heat sink (building): fans or pumps for SH and DHW kWh 544
E bt_pump electrical energy demand of the buffer tank pump kWh 0
E HW_hp electrical energy demand of the HP for SH and DHW kWh 3937
E HW_bu energy demand of the back-up heater for SH and DHW kWh 0
SPF H1 - 4,3 SPF H2 - 4,2 SPF H3 - 4,2 SPF H4 - 3,7 Ratio energy supply ratio of the heat pump system % 100,0 TS_SH Average supply temperature heat sink* °C 37,8 TR_SH Average return temperature heat sink* °C 33,6 TS_DHW Average supply temperature DHW* °C 51,8 TR_DHW Average return temperature DHW* °C 47 TS_HS Average supply temperature heat source* °C 7,9 TR_HS Average return temperature heat source* °C 3,1 Toutdoor Average outdoor temperature* °C 5,2 Tindoor Average indoor temperature* °C 20,5
*during operation of the unit
Table 7: example data of a measured heat pump site
SEPEMO-Build report
16
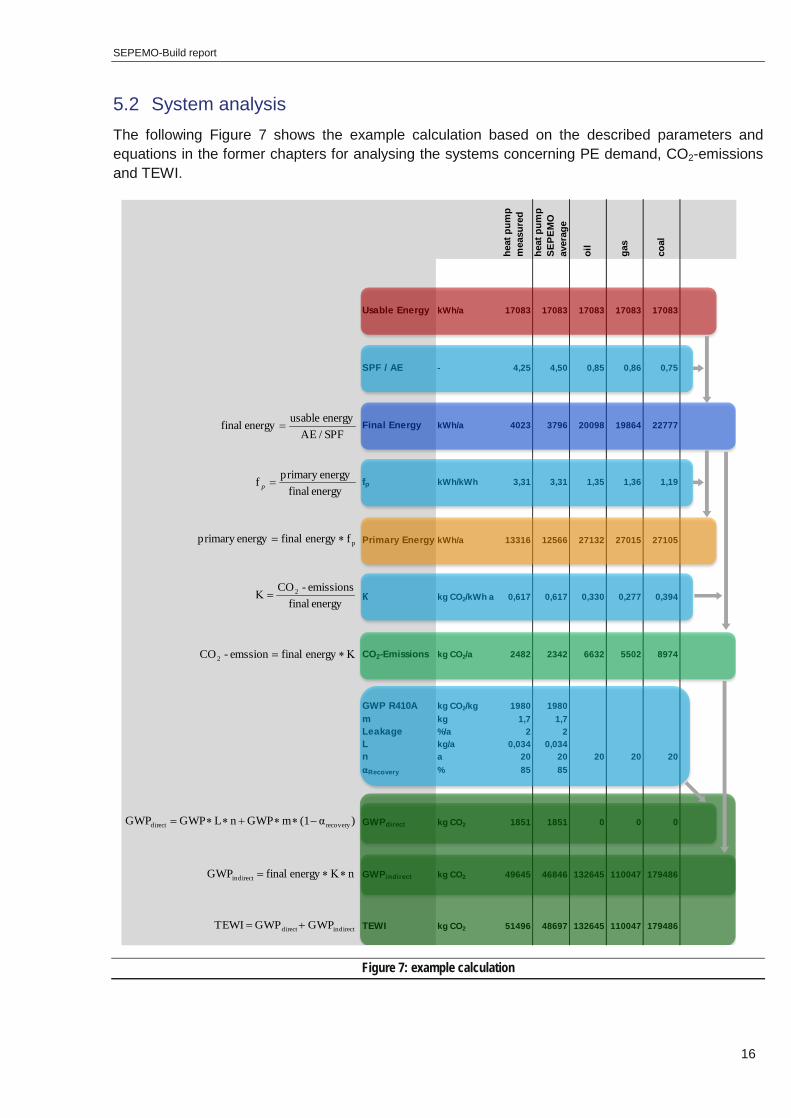
5.2 System analysis The following Figure 7 shows the example calculation based on the described parameters and equations in the former chapters for analysing the systems concerning PE demand, CO2-emissions and TEWI.
Figure 7: example calculation
heat
pum
p m
easu
red
heat
pum
p SE
PEM
O
aver
age
oil
gas
coal
Usable Energy kWh/a 17083 17083 17083 17083 17083
SPF / AE - 4,25 4,50 0,85 0,86 0,75
Final Energy kWh/a 4023 3796 20098 19864 22777
fp kWh/kWh 3,31 3,31 1,35 1,36 1,19
Primary Energy kWh/a 13316 12566 27132 27015 27105
К kg CO2/kWh a 0,617 0,617 0,330 0,277 0,394
CO2-Emissions kg CO2/a 2482 2342 6632 5502 8974
GWP R410A kg CO2/kg 1980 1980m kg 1,7 1,7Leakage %/a 2 2L kg/a 0,034 0,034n a 20 20 20 20 20αRecovery % 85 85
GWPdirect kg CO2 1851 1851 0 0 0
GWPindirect kg CO2 49645 46846 132645 110047 179486
TEWI kg CO2 51496 48697 132645 110047 179486
)α(1mGWPnLGWPGWP recoverydirect −∗∗+∗∗=
nΚ energyfinalGWPindirect ∗∗=
indirectdirect GWPGWP TEWI +=
energy finalenergy primaryf =p
energyfinalemissions-CO 2=Κ
SPF / AEenergyusableenergy final =
Κ∗= energyfinalemssion-CO2
pf energy finalenergyprimary ∗=

SEPEMO-Build report
17
Additionally to the conventional heating systems the measured heat pump system is compared to the average SEPEMO heat pump. In the curse of the IEE project SEPEMO the different heat pump technologies like A/A, A/W, B/W, W/W and DX/W will be measured. The average SPF of the different technologies can be calculated to point out the efficiency and the ecological impact of the individual measured heat pump compared to the average and the conventional systems.
5.3 Example diagrams Based on the results of the calculation in chapter xx the results can be shown as in the following figures, Figure 8 to Figure 12.
Figure 8: annual PE demand
Figure 9: annual CO2e-emissions
To point out the PE reduction potential of the different systems in Figure 10 the PE reduction potential is calculated based on the emissions of the oil heating system.
SEPEMO-Build report
18
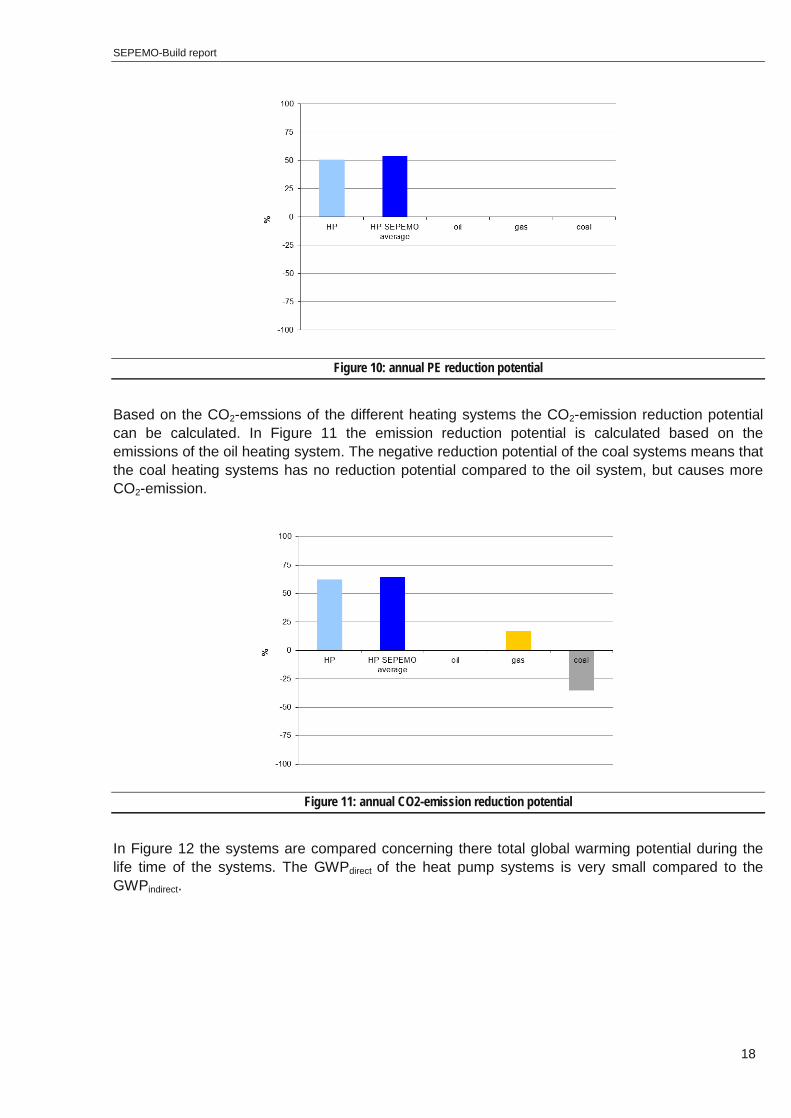
Figure 10: annual PE reduction potential
Based on the CO2-emssions of the different heating systems the CO2-emission reduction potential can be calculated. In Figure 11 the emission reduction potential is calculated based on the emissions of the oil heating system. The negative reduction potential of the coal systems means that the coal heating systems has no reduction potential compared to the oil system, but causes more CO2-emission.
Figure 11: annual CO2-emission reduction potential
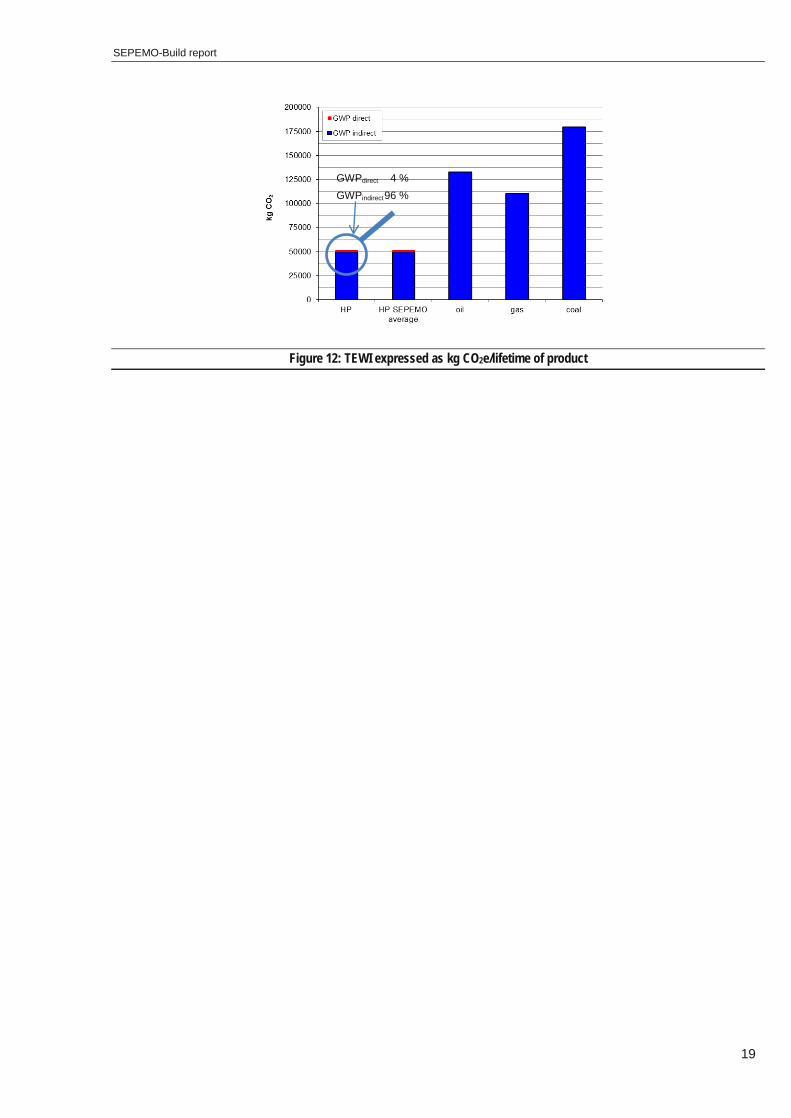
In Figure 12 the systems are compared concerning there total global warming potential during the life time of the systems. The GWPdirect of the heat pump systems is very small compared to the GWPindirect.
SEPEMO-Build report
19
Figure 12: TEWI expressed as kg CO2e/lifetime of product
GWPdirect 4 % GWPindirect 96 %
SEPEMO-Build report
20
6 Literature
1. AFEAS-TEWI, 1997: Sand, J. R.; Fischer, S. K.; Baxter, V. D., Energy and Global Warming Impacts of HFC Refrigerants and Emerging Technologies, TEWI Phase 3. Oak Ridge National Laboratory, Oak Ridge, Tennesse (USA), 1997.
2. EN 15603, 2008: Energy performance of buildings ― Overall energy use and definition of
energy ratings, 2008
3. EN 378, 2009: Refrigerating systems and heat pumps - Safety and environmental requirements, 2009
4. SEPEMO D4.1, 2011: “D4.1. guideline for heat pump field measurements for hydronic
systems – Version 1.0, The guideline contains information on what to measure in order to calculate SPF and about the required measurement quality”, IEE SEPEMO-Build, 2011
5. SEPEMO D4.2: “D4.2. Concept for evaluation of SPF - Version 1.0, A defined methodology
for calculation of the seasonal performance factor and a definition which devices of the system have to be included in this calculation”, deliverable in the Project IEE SEPEMO-Build, 2010
6. The Hitch Hiker's Guide to LCA, Henrikke Bauman, Anne-Marie Tillman, ISBN-10:
9144023642, 2004
7. ENERGY EFFICIENCY & INDUSTRIAL BOILER EFFICIENCY - An Industry Perspective, Council of Industrial Boiler Owners, 2003
8. Eco-design of CH boilers, Task 1, Definitions, Standards, Current legislation & Measures, Kemna, R., et. Al, 2007
9. CETIM, 2004, Centre d’Etudes Techniques des Industries Mécaniques, Résultats des actions collectives N° 695, Confinement des installations frigorifiques, 2004.
10. Öko-Institut e.V., Global Emission Modell for Integrated Systems (GEMIS) version 4.7, http://www.gemis.de/en/index.htm, 2011-09-20
11. ENERGY EFFICIENCY & INDUSTRIAL BOILER EFFICIENCY, CIBO, 2003, http://cibo.org/pubs/whitepaper1.pdf
12. Eco-design of CH boilers, Task 4 report, 2007, http://www.ecoboiler.org/public/ecoboiler_task4_final.pdf
SEPEMO-Build report
21
7 Figures Figure 1: comparison of the systems ............................................................................................ 4 Figure 2: heat pump life cycle ........................................................................................................ 5 Figure 3: system boundary – user phase ...................................................................................... 6 Figure 4: system boundary – TEWI ............................................................................................... 7 Figure 5: validation process .......................................................................................................... 7 Figure 6: energy flow chart for the heating mode SPFH3 ............................................................ 10 Figure 7: example calculation ...................................................................................................... 16 Figure 8: annual PE demand ........................................................................................................ 17 Figure 9: annual CO2e-emissions ................................................................................................ 17 Figure 10: annual PE reduction potential .................................................................................... 18 Figure 11: annual CO2-emission reduction potential ................................................................. 18 Figure 12: TEWI expressed as kg CO2e/lifetime of product ....................................................... 19
8 Tables Table 1: Factors for calculation of the TEWI ................................................................................. 9 Table 2: annual efficiency of common systems ......................................................................... 10 Table 3: PE factors [2] .................................................................................................................. 12 Table 4: CO2-emission coefficient [2] .......................................................................................... 12 Table 5: Comparison of CO2e emission data and PEF from two different data sources ......... 13 Table 6: GWP(100) for common refrigerants [3] ............................................................................ 14 Table 7: example data of a measured heat pump site ................................................................ 15