
Impact of Investors in People on People Management
127
© Cranfield University 2008 Investors in People The Impact of Investors in People on People Management Practices and Firm Performance Prof. Mike Bourne Dr. Monica Franco-Santos Andrey Pavlov Dr. Lorenzo Lucianetti Dr. Verónica Martinez Dr. Matteo Mura 2008 Centre for Business Performance Cranfield School of Management
Transcript of Impact of Investors in People on People Management
© Cranfield University 2008
Investors in People
The Impact of Investors in People on People Management Practices and Firm Performance
Prof. Mike Bourne Dr. Monica Franco-Santos
Andrey Pavlov Dr. Lorenzo Lucianetti Dr. Verónica Martinez
Dr. Matteo Mura
2008
Centre for Business Performance Cranfield School of Management

The Impact of Investors in People Page 2
Executive Summary
Introduction
This document reports on an extensive study into the impact of the Investors in People Standard on business performance. We started by reviewing what is already known about the Standard’s impact on business performance, before building a framework of the expected benefits of IIP from the Strategic Human Resource Management literature. This framework was tested using case studies, a survey and financial analysis to create a body of knowledge that improves our understanding of how the Investors in People Standard improves business performance.
Background
The Investors in People (IIP) Standard is a UK quality standard introduced in 1991. Currently about 31% of the workforce are employed either by organisations that are recognised as Investors in People employers or organisations working towards achieving recognition status. IIPUK’s Delivery Partners currently work with almost 40,000 organisations employing over 7.5 million people and engage with new organisations on a daily basis, which highlights its potential impact on the UK economy. The Standard’s main objective is to improve organisational performance through the management and development of people.
The Standard has been the subject of research since its inception. Much of the previous research found that the IIP Standard has a positive impact on business performance although the conclusions were not unanimous. In addition, the Standard is reviewed and revised every three to five years, so past findings cannot always be related to the current Standard.
Objective of the Research
The purpose of this study was two fold: -
(1) to investigate whether the IIP Standard affects organisational performance positively or not;
(2) to examine the key factors that explain how the IIP Standard affects organisational performance.

The Impact of Investors in People Page 3
Methodology
The research involved reviewing the existing literature, building a framework, undertaking case studies, conducting a survey, matching survey results with published accounting information and detailed statistical analysis of the data.
The study framework
Although the previous literature on the impact of IIP on performance was broadly positive, the mechanisms by which the Standard affected performance were not always clear. Our approach was to build a framework based on the Strategic Human Resources Management literature that demonstrated the expected relationship between the IIP Standard and business performance. The framework is shown in figure A with the expected relationships shown with a solid line and the possible relationships shown with a dotted line.
Figure A. The impact of IIP on organisational performance
The original framework, detailed in Chapter 3, was built on an emerging body of research that finds that companies implementing commitment based HR practices perform better than companies implementing transaction based HR practices. The former emphasise the long-term relationships between employer and employee with people development practices that encourage team working and the development of firm specific knowledge. The latter emphasise the short-term economic exchange of work for money. As commitment based practices are those which collectively demonstrate a long-term investment in employees - a philosophy which is at the heart of the IIP Standard - this approach integrates well into the study framework.
Reported Non-financial Performance
CONTROL VARIABLES Firm sizeIndustry
HR policies
IIP
Reported Financial
Performance
Financial Performance
(FAME)
Human capital
flexibility
Org. social climate
The Impact of Investors in People Page 4
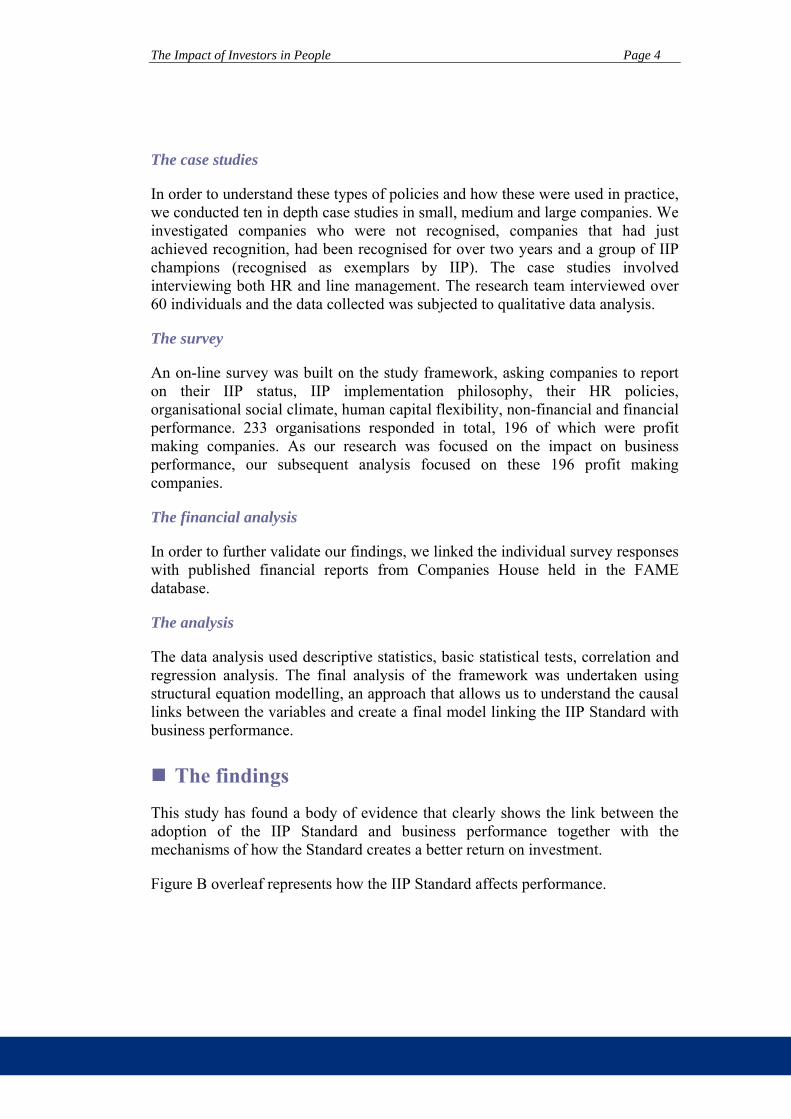
The case studies
In order to understand these types of policies and how these were used in practice, we conducted ten in depth case studies in small, medium and large companies. We investigated companies who were not recognised, companies that had just achieved recognition, had been recognised for over two years and a group of IIP champions (recognised as exemplars by IIP). The case studies involved interviewing both HR and line management. The research team interviewed over 60 individuals and the data collected was subjected to qualitative data analysis.
The survey
An on-line survey was built on the study framework, asking companies to report on their IIP status, IIP implementation philosophy, their HR policies, organisational social climate, human capital flexibility, non-financial and financial performance. 233 organisations responded in total, 196 of which were profit making companies. As our research was focused on the impact on business performance, our subsequent analysis focused on these 196 profit making companies.
The financial analysis
In order to further validate our findings, we linked the individual survey responses with published financial reports from Companies House held in the FAME database.
The analysis
The data analysis used descriptive statistics, basic statistical tests, correlation and regression analysis. The final analysis of the framework was undertaken using structural equation modelling, an approach that allows us to understand the causal links between the variables and create a final model linking the IIP Standard with business performance.
The findings
This study has found a body of evidence that clearly shows the link between the adoption of the IIP Standard and business performance together with the mechanisms of how the Standard creates a better return on investment.
Figure B overleaf represents how the IIP Standard affects performance.
The Impact of Investors in People Page 5
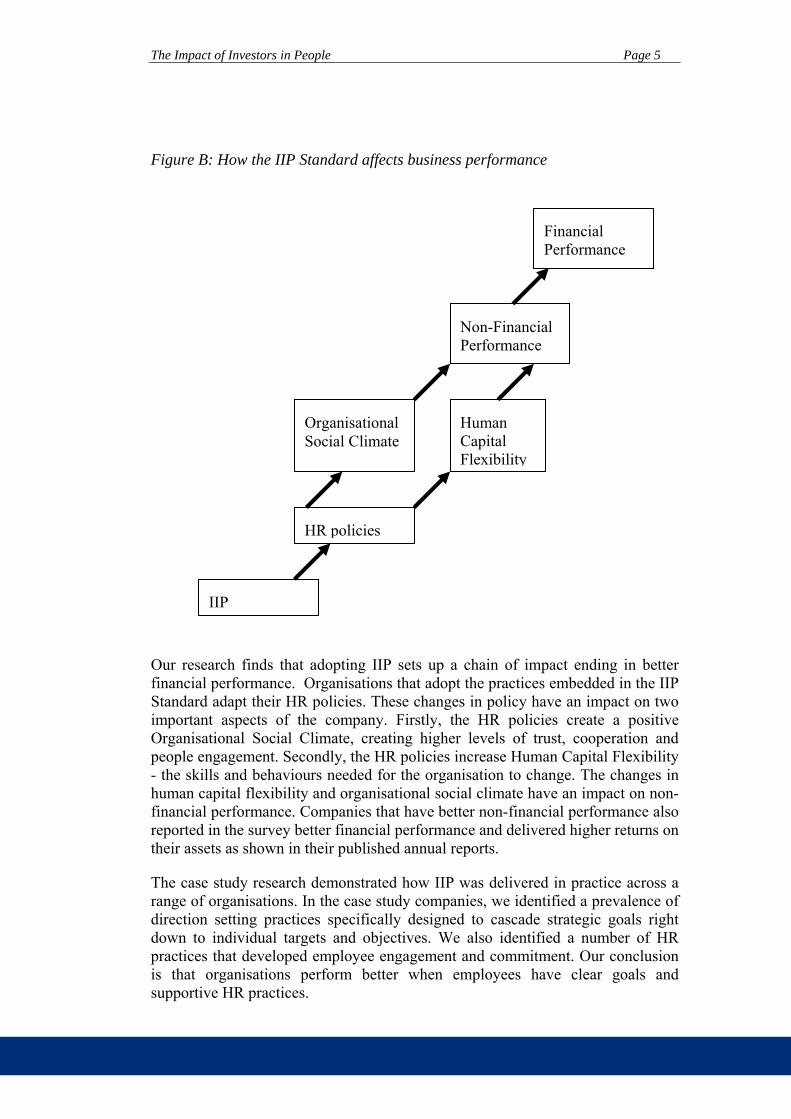
Figure B: How the IIP Standard affects business performance
Our research finds that adopting IIP sets up a chain of impact ending in better financial performance. Organisations that adopt the practices embedded in the IIP Standard adapt their HR policies. These changes in policy have an impact on two important aspects of the company. Firstly, the HR policies create a positive Organisational Social Climate, creating higher levels of trust, cooperation and people engagement. Secondly, the HR policies increase Human Capital Flexibility - the skills and behaviours needed for the organisation to change. The changes in human capital flexibility and organisational social climate have an impact on non-financial performance. Companies that have better non-financial performance also reported in the survey better financial performance and delivered higher returns on their assets as shown in their published annual reports.
The case study research demonstrated how IIP was delivered in practice across a range of organisations. In the case study companies, we identified a prevalence of direction setting practices specifically designed to cascade strategic goals right down to individual targets and objectives. We also identified a number of HR practices that developed employee engagement and commitment. Our conclusion is that organisations perform better when employees have clear goals and supportive HR practices.
IIP
HR policies
Non-Financial Performance
Human Capital Flexibility
Financial Performance
Organisational Social Climate

The Impact of Investors in People Page 6
Other findings from the survey include:
IIP recognised organisations are more likely to have commitment-based HR policies.
Those organisations that are IIP recognised are more likely to have high levels of trust, commitment and cooperation among their employees.
The IIP Standard has a positive impact on the degree of human capital flexibility (i.e. employees’ behaviour, skills and HR practices flexibility). Those organisations that are IIP recognised are more likely to have high levels of human capital flexibility.
The IIP Standard has a positive impact on the perception that employees’ have of the company’s non-financial performance (assessed by the quality of the company’s product and services, customer satisfaction, attraction and retention of employees, and employees’ relationships).
The IIP Standard has a positive impact on innovation. Those organisations that are IIP recognised are more likely to have high levels of products and service innovation.
The IIP Standard has a positive impact on the degree of achievement of company’s strategic goals. Those companies that are IIP recognised are more likely to meet their strategic objectives.
The data supports an indirect impact of the IIP Standard on return on assets. This relationship is explained as follows: IIP recognised companies are more likely to perceive benefits in their non-financial performance. Employees’ perception of good non-financial performance has a positive effect on employees’ perception of good financial performance, which in turn has a positive effect on return on assets (see table 7).
An additional analysis was conducted looking at the effect of the IIP Standard on effective communication practices as it was found that these types of practices have a positive effect on profitability –assessed by the profit margin and profit per employee figures that appear on the company annual accounting report (see Appendix F). It was found that the IIP Standard has a positive effect on effective communication practices and therefore an indirect effect on company’s profitability.
The Impact of Investors in People Page 7
Implications for Practice
Our research finds that implementing the Investors in People Standard should improve the financial performance of your business. However, we also conclude that the more your organisation embraces the Standard, the better the impact will be. There are very good reasons for that.
1. Investing in people is a commitment based HR policy and our study builds on a growing wealth of evidence from the literature that commitment based policies deliver better business performance
2. Commitment based policies create an organisational climate in which employees collaborate and perform, generating immediate benefits in business performance.
3. Commitment based policies increase human resource flexibility, which our study shows has a positive effect on performance. Furthermore, human resource flexibility is crucial in our current volatile business environment for the longer-term survival of organisations, so pursuing this goal is important for the longer term as well.
4. Focusing people’s effort and directing them towards achieving the goals of the organisation is shown to improve performance.
Investors in People is often seen as a mechanism for improving the skill base of the workforce. This study demonstrates that this is true, but a recurring theme is that IIP also creates the organisational climate that delivers performance. Engaging the workforce is one of the biggest levers you can pull to improve the performance of your business. Cascading the vision and direction can help build the right organisational social climate by giving employees a sense of purpose. It also has the advantage of channelling people’s effort to achieving the goals of the business. Linking business goals to employee objectives is key to improving business performance.

The Impact of Investors in People Page 8
Table of Contents
Introduction .............................................................................................................. 12
Previous research on the impact of the IIP Standard........................................... 15
The study framework............................................................................................... 19 3.1 The relationship between HR policies and the IIP Standard.......................... 20 3.2 The relationship between commitment-based HR policies, the
organisation’s social climate and the IIP Standard........................................ 21 3.3 The relationship between commitment-based HR policies, human capital
flexibility and the IIP Standard...................................................................... 22 3.4 The relationship between the IIP Standard and organisational performance. 23
The study methodology............................................................................................ 25 4.1 Case study research........................................................................................ 25 4.2 Survey research .............................................................................................. 26 4.3 Financial Analysis.......................................................................................... 30 4.4 Model Testing ................................................................................................ 31
Research findings ..................................................................................................... 32 5.1 Findings from the case studies ....................................................................... 32 5.2 Findings from the survey and financial analysis............................................ 42
Conclusions .............................................................................................................. 54
References .............................................................................................................. 56
Appendix A: Literature review summary ............................................................. 60
Appendix B: Case study protocol ........................................................................... 66
Appendix C: Case Studies ....................................................................................... 79
Appendix D: Case Data Summary ......................................................................... 96
Appendix E: Study questionnaire......................................................................... 107
Appendix F: Factor and reliability analyses........................................................ 113
Appendix G: Descriptive statistics........................................................................ 120
Appendix H: Effective communication ................................................................ 124
Appendix I: Correlation analysis between people management and organisational performance indicators .......................................... 126

The Impact of Investors in People Page 9
List of Figures
Figure 1. The draft model framework ................................................................... 20
Figure 2. HR policies and the IIP Standard .......................................................... 21
Figure 3. HR policies, organisational social climate and the IIP Standard........... 22
Figure 4. Commitment-based HR policies, the IIP Standard and Human capital flexibility ............................................................................................... 22
Figure 5. The IIP Standard and performance: the Proposed Framework............. 24
Figure 6. Companies that currently have the IIP accreditation or have had it in the past ........................................................................................................ 28
Figure 7. Companies that currently have the IIP accreditation ............................ 29
Figure 8. Classification of companies by UK country ......................................... 29
Figure 9. Classification of companies by size ...................................................... 29
Figure 10. Classification of companies by ownership structure .......................... 30
Figure 11. Classification of companies by industry ............................................. 30

The Impact of Investors in People Page 10
List of Tables Table 1. Summary of case studies and their selection criteria ................................... 26
Table 2. Description of survey responses .................................................................. 26
Table 3. Measurement of study variables .................................................................. 27
Table 4. Summary of case studies’ results: The HR practices and policies that are believed to positively impact on business performance ............................. 38
Table 5. The advanced practice high performing case companies............................. 39
Table 6. Results of correlation analysis (Pearson correlations) ................................. 45
Table 7. Results of regression analysis – IIP recognition during the current year as key predictor ............................................................................................... 46
Table 8. Results of regression analysis – People management as key predictor ....... 47
Table 9. Results of regression analysis – IIP implementation as key predictor......... 48
Table 10. Results of regression analysis – Impact firm performance ........................ 49
Table 11. Summary of findings from previous studies on the impact of the IIP Standard...................................................................................................... 61
Table 12. Recruitment/Selection policies: results from factor and reliability analysis ..................................................................................................... 114
Table 13. Reward policies: results from factor and reliability analysis................... 114
Table 14. Training and Development policies: results from factor and reliability analysis ..................................................................................................... 114
Table 15. Effective communication: results from factor and reliability analysis .... 115
Table 16. IIP Standard framework indicators: results from factor and reliability analysis (items ordered according to the framework) .............................. 115
Table 17. IIP implementation: results from factor and reliability analysis.............. 115
Table 18. Employees’ behaviour flexibility: results from factor and reliability analysis ..................................................................................................... 116
Table 19. Skills flexibility: results from factor and reliability analysis................... 116
Table 20. Human practices flexibility: results from factor and reliability analysis . 116

The Impact of Investors in People Page 11
Table 21. Trust: results from factor and reliability analysis .................................... 117
Table 22. Cooperation: results from factor and reliability analysis ......................... 117
Table 23. Commitment: results from factor and reliability analysis........................ 117
Table 24. Innovation: results from factor and reliability analysis ........................... 118
Table 25. Reported non-financial performance: results from factor and reliability analysis ..................................................................................................... 118
Table 26. Reported financial performance: results from factor and reliability analysis ..................................................................................................... 118
Table 27. Descriptive statistics of survey responses1.............................................. 121
Table 28. Descriptive statistics of employee turnover (extracted from survey) and other financial indicators (extracted from FAME)................................... 123
Table 29. Results of regression analysis: The relationship among the IIP Standard, effective communication and financial firm performance ....................... 125
Table 30. Results of correlation analysis – Relationships between people management and organisational performance indicators ......................... 127

The Impact of Investors in People Page 12
1. Introduction
The Investors in People (IIP) Standard is a UK quality standard introduced in 1991 and is overseen by the Department for Innovation, Universities and Skills (DIUS). Currently about 31% of the workforce are employed either by organisations that are recognised as Investors in People employers or employers working towards achieving recognition status. A further 5.6% of employees are working for organisations that had previously worked with and benefited from Investors in People since 2002. IIPUK’s Delivery Partners currently work with nearly 40,000 organisations employing over 7.5 million people and engage with new organisations on a daily basis, which highlights its potential impact on the UK economy. The Standard’s main objective is to improve organisational performance through the management and development of people.
The purpose of this study was two fold: -
(1) to investigate whether the IIP Standard affects organisational performance positively or not
(2) to examine the key factors that explain how the IIP Standard affects organisational performance
Prior to this study, we believed that the adoption of the IIP Standard had an impact on the Human Resource (HR) practices adopted by the organisation, and that these practices would influence employee behaviour and organisational performance. The aim of this study was to identify the change in practices and to assess their effect on the employment climate, product / service quality, customer satisfaction and financial performance. The study was designed to identify the links that may exist between HR practices, non-financial performance and financial performance as well as investigating whether we could confirm the validity of these links statistically.
In undertaking this study, we have conducted a review of the relevant literature, 10 case studies in selected companies (including more than 60 interviews), a survey completed by 233 organisations and an analysis of their published financial results. The final analysis involved using sophisticated statistical techniques to validate a model that explains how the IIP Standard delivers improved business performance.
The review of the literature was undertaken to establish what was already known about IIP, HR practices and their impact on organisational performance. The result of this work was an initial theoretical framework which was tested during the research.
The case studies were conducted to understand current HR practice in companies. To ensure some degree of coverage, we selected case study companies on the

The Impact of Investors in People Page 13
basis of their size and maturity in IIP. We investigated small, medium and large companies, and for each size category, companies that were not IIP recognised, just recognised, been recognised for several years and companies that were “IIP champions”. ”IIP champions” are those organisations that have been identified by IIP as being exemplar practitioners of the Standard. The intention of these case studies was to gather information on the types of practices being used, how the user believed that the practices influenced performance, whilst recognising that this may differ by the size of organisation or by if and how long they had been using IIP.
The survey was undertaken to give us quantifiable information on the practices and their impact, firstly on non-financial performance and, secondly, on financial performance. This data was then used to establish statistically whether or not the Standard had a positive impact. For the survey, organisations were selected on the basis of their size, location, ownership structure (profit and non-for profit) and industry (manufacturing and services). The study was undertaken between March and November 2007.
The next phase of the study was to link the results of the survey with published financial results. All the information on practices and performance from the survey was self-reported, providing information on how people believed that IIP had an impact on performance. This phase of the research, linked the survey results with published financial information taken from returns to companies house and available through the FAME database. Each survey result was linked to published financial results on FAME (where they were available) allowing us to test whether the reported financial performance from the survey actually matched the published results of the company.
The final stage of the research involved using Structured Equation Modelling to build a model of how the IIP Standard affects business performance. Using the data collected through the survey and financial analysis, we re-built our theoretical framework developed from the literature to create a new model.
It should be noted here that during the rest of the report, when we refer to “reported non-financial” or “reported financial” performance, we are referring to results of self-reported studies collected through surveys. When we refer to “actual financial” performance, we are referring to results captured from published financial records, which in our case were from companies house and the FAME database.
This report shows the results of the study with a special focus on the impact of the IIP Standard in profit making organisations. The report is structured as follows. Firstly, a review of the academic work previously conducted on the impact of the IIP Standard is outlined. Secondly, a framework is developed from the literature showing how the IIP Standard is believed to affect organisational performance. Thirdly, detailed information about how the Cranfield study has been developed is presented. Fourthly, the insights extracted from the case studies, the survey and

The Impact of Investors in People Page 14
financial analysis are summarised and discussed. Finally, concluding remarks together with implications for organisations and researchers are highlighted.

The Impact of Investors in People Page 15
2. Previous research on the impact of the IIP Standard
During the sixteen years of operation of the Investors in People Standard a number of research studies have been developed in order to test its effectiveness (see Appendix A). In the next paragraphs, we summarise the key findings extracted from this research and potential areas for further investigation, but first let us reflect on the literature as a whole.
As with many other standards and frameworks such as EFQM and ISO, IIP has followed a lifecycle. The first phase of the IIP lifecycle shows how IIP was designed and introduced. In this phase most research was directed toward the foundations and improvements of the framework’s elements. In the second phase, UK organisations became more engaged and began implementing IIP. In this phase the IIP community’s interests oscillated around the implementation and use of IIP in various contexts. The predominant questions were: “how can organisations better implement IIP?” and “what impact does its use have on the functioning of the organisation?” More recently, given the fact that many UK organisations have implemented IIP, it is not surprising the important questions are around “what is the value in using IIP?” and “how does adopting IIP impact organisational financial performance?”
However, it must be noted that the Standard is regularly reviewed and updated every three to five years which makes linking past studies to the current Standard difficult. We have based our research primarily on academic publications where formal and respectable methodologies were applied (i.e. studies using explicit qualitative and/or quantitative research design methodologies). Our review of the literature showed that the IIP research is not particularly extensive, with even less research performed on the impact of IIP on organisational performance and people’s development. The results of this analysis show both positive and negative effects of IIP.
We start with the body of literature, whose ultimate goal is not to test the direct impact of the IIP Standard on organisational performance but to examine its potential for improving other internal organisational processes. For example, two studies have looked at the importance of IIP as a marketing mechanism which can facilitate organisational cultural change (Bell et al, 2002; Hogg et al, 1998). Others have investigated the positive impact of the IIP Standard on internal communication processes (Down and Smith, 1998), people development and training practices (Hoque, 2003; Smith et al, 2002; O'Neill, 1996), strategic planning and implementation (Smith, 2000), or benchmarking (Emberson and Winters, 2000). Most of these studies were based on cross-sectional case studies or on single case studies with the exception of Hoque (2003) and Smith et al. (2002), which were based on survey data.

The Impact of Investors in People Page 16
Early research into the impact of IIP on performance used survey data analysed with descriptive statistics and supported by in-depth interviews analysed using qualitative data analysis. Alberga, Tyson & Parsons (1997), Hillage and Moralee (1996) and Spilsbury et al (1995) showed that IIP improved organisational performance regardless of organisational size emphasising improvements in customer service, productivity and employees turnover. They further suggested that IIP enhances employees understanding of the businesses.
More recently The Hambleden Group (2001) and Michaelis and McGuire (2004) investigated the impact on financial performance. They found that formal and consistent IIP implementation and use improved accounting-based organisational performance, organisational profitability and return on investments. These findings were from survey research, linking the survey to published accounting records. However, the conclusions were based on inspection without the use of statistical techniques that are normally found in academic studies.
Not all research has found positive results and one set of studies produced inconclusive findings. For example, Fraser, (2003) investigated the impact of the IIP Standard on growth and others (Berry and Grieves, (2003); Down and Smith, (1998)) investigated the impact on organisational performance . According to these studies, the IIP Standard might have a positive performance effect only in certain situations (for example when organisations already have the key practices that IIP promotes in place even before considering recognition) and in certain organisations (for example, only in medium and large organisations).
Finally, some studies have shown detrimental aspects of adopting IIP suggesting that:
1. acquiring the IIP Standard can be a very time consuming exercise, which requires excessive formality and bureaucracy for some organisations and SMEs in particular (Grugulis and Bevitt, 2002; Hill and Stewart, 1999; Ram, 2000), but it should be noted that the Standard has been updated since this research was undertaken;
2. the IIP Standard promotes practices that in some organisations, such as universities, may go against the “way of doing things around here”, producing critical conflicts that diminish performance in the short-term (Watson and Watson, 1999);
3. it could just be used as a career advancement tool for HR managers (Bell et al, 2001) which is not in the best interests of the Standard;
4. it can inhibit organisational learning as IIP creates tension between the hard, content-focused nature of its framework and the softer, process-focussed nature of much workplace learning (Bell et al, 2002).

The Impact of Investors in People Page 17
In conclusion, although the majority of research concludes that IIP has a positive impact and adds value to the organisation, the evidence isn’t conclusive. There is evidence that IIP has a better impact when organisations have formal implementation processes, have a strong leadership linked to strategy and policy and when review and feedback is taken into account. But it is also clear that there are specific contingent factors1 that directly affect the impact of IIP. These include organisational size, industry, pre-recognition performance, and pre-recognition HR practices.
One criticism that can be laid at past research into the impact of the IIP Standard on performance is that much of the research is purely empirical. Many of the studies simply test whether companies who have been recognised perform better than those that haven’t been recognised, without any reference to “how” the IIP Standard, or the practices and policies it engenders, delivers improvement in performance.
Those that do, take a variety of approaches. For example: -
• Alberga, Tyson & Parsons (1997) emphasise the links between training and business strategy and business strategy and performance. They also emphasise the links between training strategy and high-involvement employee relations, and the subsequent link to business performance.
• Grugulis & Bevitt (2002) emphasise the link between the IIP Standard and performance through the impact the Standard has on employees, their skill sets, satisfaction, commitment and motivation.
• Emberson & Winters (2000) emphasise the role of IIP in focusing staff on business objectives, training them to achieve those objectives and evaluating the results.
• Taylor & Thorpe (2002) emphasise the role of IIP in delivering “the learning organisation”
• Bell, Taylor & Thorpe (2001) raise the interesting concept that business performance needs both the control and consent of employees, with skilled and motivated employees working harder, better and with less wastage.
• Hoque (2003) emphasises the link between IIP and training and between training and performance.
1 We would expect the impact of IIP to be different in different situations. For example, organisation size could have a big influence on the impact of IIP on performance. These are the contingent factors and the subsequent analysis is designed to take these influences into account.
The Impact of Investors in People Page 18
Consequently, there is some consensus on the mechanisms at work. The implication is that adopting the IIP Standard changes HR practices and that some of these changes in HR practices deliver benefits that have a positive impact on organisational performance. However we need greater clarity to test this thoroughly.
To overcome this concern we have reviewed the strategic human resource management literature (SHRM) to understand the relationship between HR practices and business performance. In the next section, we have used the results of this review to create a model of how HR practices deliver business performance. We have then linked the Standard with this literature to complete the model. The approaches found in the SHRM literature are slightly different to the past IIP research, but are not incompatible. We have adopted this position to attempt to clarify the mechanisms by which the IIP Standard influences organisational performance. The model is described next.

The Impact of Investors in People Page 19
3. The study framework
In order to conduct our study we developed a theoretical framework to act as a guide to our investigation. The framework was developed from the literature capturing and clarifying what was already known. The aim of the framework was to create a testable model of how the IIP Standard affects financial performance by focusing on the intervening variables (see Figure 1). Based on a review of the Strategic Human Resources and the IIP literature, the framework suggested that the IIP Standard directly affects:
1. The type of human resources policies that companies develop.
2. The organisational social climate that companies have, which is measured by the level of trust, cooperation and commitment perceived among employees.
3. The level of human capital flexibility that companies possess, which is represented by the level of employees’ skills flexibility, employees’ behaviours flexibility and human resources practices flexibility.
4. The level of non-financial performance of the company, which is assessed by the quality of its products and services, the ability of the company to attract and retain essential employees, the degree of customer satisfaction and the quality of the employees’ relationships.
By affecting these organisational variables, the framework also suggests that the IIP Standard indirectly affects the companies’ financial performance. In the framework, financial performance was to be assessed in two ways. Firstly by the financial performance employees report (collected through the survey) and, secondly, by the financial performance that companies actually present in their annual accounting report (collected from the FAME2 database).
When we reviewed the previous research published on the IIP Standard, five contingent factors were identified; namely company sector, organisational size, industry, pre-recognition performance, and pre-recognition HR practices. The impact of sector and company size were controlled by creating control variables in our statistical analysis to allow for this effect. However, we could not control for pre-recognition performance (the fact that companies might be doing particularly well or badly for reasons not associated with the IIP Standard) or for pre-recognition HR practices (the fact that companies may have implemented the HR
2 FAME is a database that contains information on companies in the UK and Ireland. It has information on 3.4 million companies, 2.6 million of which are in a detailed format, so it includes not only information on publicly quoted companies but also on private companies as well. The Bureau Van Dijk publishes this database.

The Impact of Investors in People Page 20
practices and philosophies embedded in the IIP Standard before they obtain recognition).
Below we explore each of the original framework relationships in more detail. This is done to make explicit the elements of the original model that subsequently tested with the data.
Figure 1. The draft model framework
3.1 The relationship between HR policies and the IIP Standard
A central factor that may have an influence on the relationship between the IIP Standard and organisational performance is the type of HR practices a company develops. In the last two decades, two types of HR practices have emerged in the literature. These are: transaction-based HR practices, which emphasise individual short-term exchange relationships; and commitment-based HR practices, which emphasise mutual long-term exchange relationships (Arthur, 1992; Collins and Smith, 2006; Tsui, Pearce, Porter and Hite, 1995). A fundamental issue for organisations is the choice of the type of HR practices that will facilitate better organisational performance. A growing body of empirical evidence suggests that organisations implementing commitment-based HR practices perform better than organisations implementing transaction-based HR practices (Arthur, 1992, 1994; Batt, 2002; Collins and Smith, 2006; Youndt, Snell, Dean and Lepak, 1996).
The individual HR practices that encourage long-term exchange relationships or a commitment-based environment differ across organisations and studies. However, three HR practices seem to be critical for generating a commitment-based setting (Collins and Smith, 2006) as confirmed in their survey research. Firstly, employee recruitment and selection practices that focus on creating internal job markets and those that assess the internal fit of a candidate to the company rather than to a specific job seem to be essential in the development of long-term exchange
Reported Non-financial Performance
CONTROL VARIABLES Firm sizeIndustry
HR policies
IIP
Reported Financial
Performance
Financial Performance
(FAME)
Human capital
flexibility
Org. social climate
The Impact of Investors in People Page 21
relationships. Secondly, reward practices that focus employees’ motivation on group or organisational performance rather than on individual performance are also critical. Finally, training and performance appraisal practices that encourage long-term growth, team work and the development of firm-specific knowledge seem vital in the generation of a commitment-based organisation. This approach broadly coincides with the previous IIP research identified earlier (Alberga, Tyson & Parsons, 1997; Grugulis & Bevitt, 2002; Emberson & Winters, 2000; Bell, Taylor & Thorpe, 2001; Hoque, 2003) and enables us to focus our enquiry.
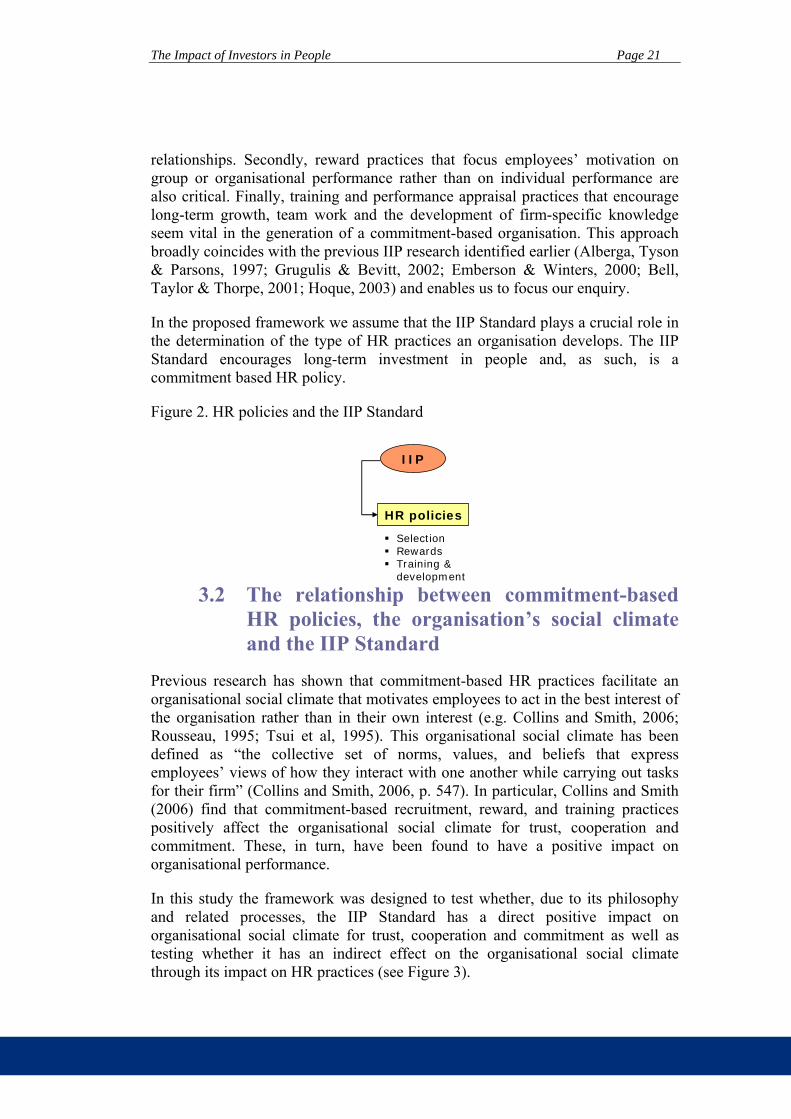
In the proposed framework we assume that the IIP Standard plays a crucial role in the determination of the type of HR practices an organisation develops. The IIP Standard encourages long-term investment in people and, as such, is a commitment based HR policy.
Figure 2. HR policies and the IIP Standard
3.2 The relationship between commitment-based HR policies, the organisation’s social climate and the IIP Standard
Previous research has shown that commitment-based HR practices facilitate an organisational social climate that motivates employees to act in the best interest of the organisation rather than in their own interest (e.g. Collins and Smith, 2006; Rousseau, 1995; Tsui et al, 1995). This organisational social climate has been defined as “the collective set of norms, values, and beliefs that express employees’ views of how they interact with one another while carrying out tasks for their firm” (Collins and Smith, 2006, p. 547). In particular, Collins and Smith (2006) find that commitment-based recruitment, reward, and training practices positively affect the organisational social climate for trust, cooperation and commitment. These, in turn, have been found to have a positive impact on organisational performance.
In this study the framework was designed to test whether, due to its philosophy and related processes, the IIP Standard has a direct positive impact on organisational social climate for trust, cooperation and commitment as well as testing whether it has an indirect effect on the organisational social climate through its impact on HR practices (see Figure 3).
SelectionRewardsTraining & development
HR policies
IIP

The Impact of Investors in People Page 22
Figure 3. HR policies, organisational social climate and the IIP Standard
3.3 The relationship between commitment-based HR policies, human capital flexibility and the IIP Standard
In today’s business environment, human capital flexibility is a central organisational capability as it facilitates the adaptation of employees to rapid changing demands and economic circumstances (Bhattacharya, Gibson and Doty, 2005). Wright and Snell (1998) state that human capital flexibility comprises three dimensions: employees’ skills flexibility, employees’ behaviour flexibility and HR practices flexibility. Employees’ skills flexibility is concerned with whether or not employees have multiple skills and are able to do different jobs in the organisation. Employees’ behaviour flexibility is concerned with whether or not people are prepared to change their ways of working. HR practices flexibility is concerned with whether or not HR practices adapt to changing business requirements. In this study we assume that both commitment-based HR policies and the IIP Standard positively affect the three dimensions that compose human capital flexibility (see Figure 4) and test this assumption.
Figure 4. Commitment-based HR policies, the IIP Standard and Human capital flexibility
SelectionRewardsTraining & development
HR policies
IIP
TrustCooperationCommitment
Org. social climate
SelectionRewardsTraining & development
HR policies
IIP
Human capital
flexibility
Skills flexibilityEmployees’behaviour flexibilityHR practices flexibility

The Impact of Investors in People Page 23
3.4 The relationship between the IIP Standard and organisational performance
Since the IIP Standard was developed in the early Nineties, several studies have found empirical evidence that shows its effects on organisational performance. As reported earlier, some studies have found that the IIP Standard has a positive impact on reported non-financial performance (e.g. Alberga et al, 1997; Bell et al, 2002; Hogg et al, 1998; Smith et al, 2002), reported financial performance (e.g. Alberga et al, 1997), and accounting financial performance (e.g. Michaelis and McGuire, 2004). However, other studies have found less satisfactory performance results (e.g. Bell et al, 2002b; Hill and Stewart, 1999; Hoque, 2003).
This particular research aimed to shed light on the conflicting results found in the literature. It specifically examines whether:
The IIP Standard has a positive effect on the non-financial performance of the organisation. Organisational non-financial performance was assessed through our survey by asking questions about quality of products and services, customer satisfaction, attraction and retention of employees, employees’ relationships, employee turnover, and innovation (taken from Kaplan and Norton 1992, 1996, 2006; Neely, Adams and Kennerley, 2002). The framework presumes that the IIP Standard positively affects non-financial performance of the company, both directly and indirectly. The indirect affect is presumed to be through the IIP Standard’s influence on HR policies, organisational social climate and human capital flexibility (Figure 5 below shows these relationships).
The framework proposes that the IIP Standard has a positive effect on the reported organisational financial performance. Reported organisational financial performance is assessed by survey questions concerning organisational turnover, profitability, growth in sales and market. The framework proposes that the effect of the IIP Standard on the reported financial performance will be indirect. That is to say that the IIP Standard influences HR policies, organisational social climate and human capital flexibility (see Figure 5), reported non-financial performance and that these influence reported financial performance.
The indicators of actual financial performance used in our study were return on assets, profit margin and profit per employee (as reported in the company annual accounts and extracted through the FAME database). The framework we developed proposed that the effect of the IIP Standard on the organisational accounting performance is indirect through the IIP Standard influence on HR policies, organisational social climate and human capital flexibility (see Figure 5).

The Impact of Investors in People Page 24
Figure 5. The IIP Standard and performance: the Proposed Framework
Reported Non-financial Performance
Quality of products & services; attraction & retention; relationships; customer satisfactionEmployees turnoverInnovation
Selection Rewards Training & development
HR policies Selection Rewards Training & development
HR policies
IIP IIP
Turnover; profitability; growth in sales; market share
Perceived Financial
Performance Turnover; profitability; growth in sales; market share
Reported Financial
Performance ROA Profit Margin Profit per employee
Accounting Financial
Performance
ROA Profit Margin Profit per employee
Accounting Financial
Performance
Trust Cooperation Commitment
Human capital
flexibility Skills flexibility Employees ’ behaviour flexibility
HR practices flexibility
Org. social climate
The Impact of Investors in People Page 25
4. The study methodology
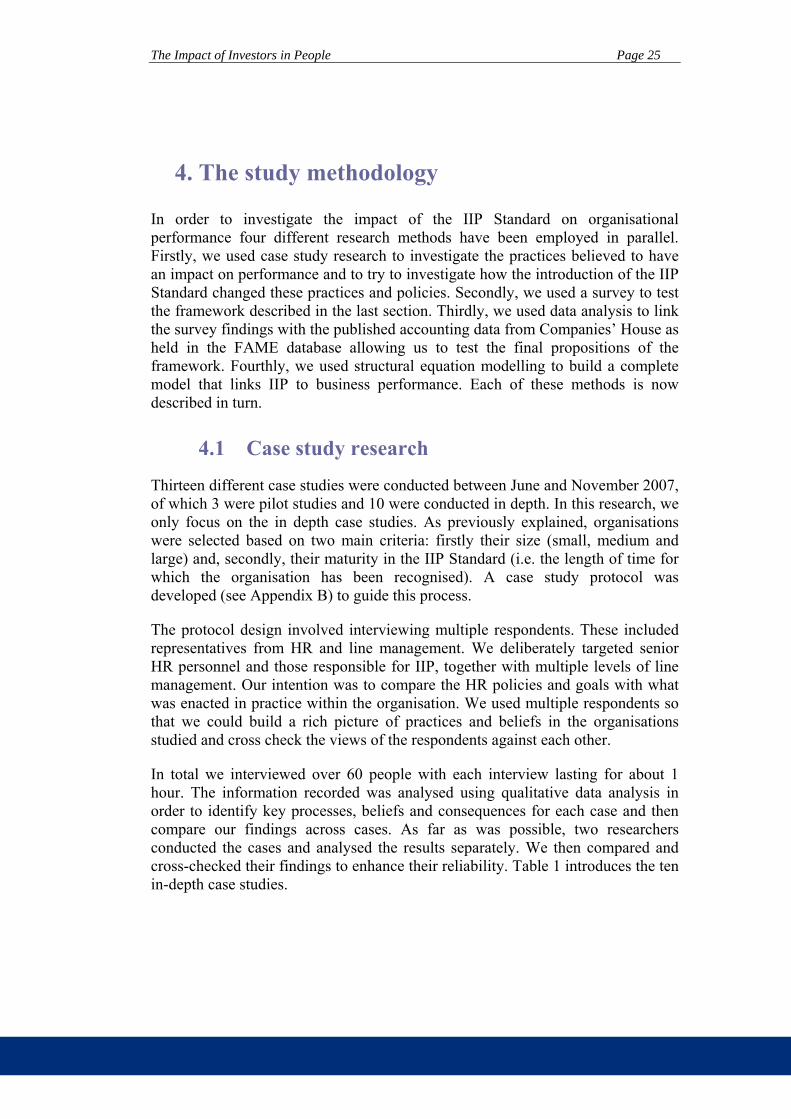
In order to investigate the impact of the IIP Standard on organisational performance four different research methods have been employed in parallel. Firstly, we used case study research to investigate the practices believed to have an impact on performance and to try to investigate how the introduction of the IIP Standard changed these practices and policies. Secondly, we used a survey to test the framework described in the last section. Thirdly, we used data analysis to link the survey findings with the published accounting data from Companies’ House as held in the FAME database allowing us to test the final propositions of the framework. Fourthly, we used structural equation modelling to build a complete model that links IIP to business performance. Each of these methods is now described in turn.
4.1 Case study research
Thirteen different case studies were conducted between June and November 2007, of which 3 were pilot studies and 10 were conducted in depth. In this research, we only focus on the in depth case studies. As previously explained, organisations were selected based on two main criteria: firstly their size (small, medium and large) and, secondly, their maturity in the IIP Standard (i.e. the length of time for which the organisation has been recognised). A case study protocol was developed (see Appendix B) to guide this process.
The protocol design involved interviewing multiple respondents. These included representatives from HR and line management. We deliberately targeted senior HR personnel and those responsible for IIP, together with multiple levels of line management. Our intention was to compare the HR policies and goals with what was enacted in practice within the organisation. We used multiple respondents so that we could build a rich picture of practices and beliefs in the organisations studied and cross check the views of the respondents against each other.
In total we interviewed over 60 people with each interview lasting for about 1 hour. The information recorded was analysed using qualitative data analysis in order to identify key processes, beliefs and consequences for each case and then compare our findings across cases. As far as was possible, two researchers conducted the cases and analysed the results separately. We then compared and cross-checked their findings to enhance their reliability. Table 1 introduces the ten in-depth case studies.
The Impact of Investors in People Page 26
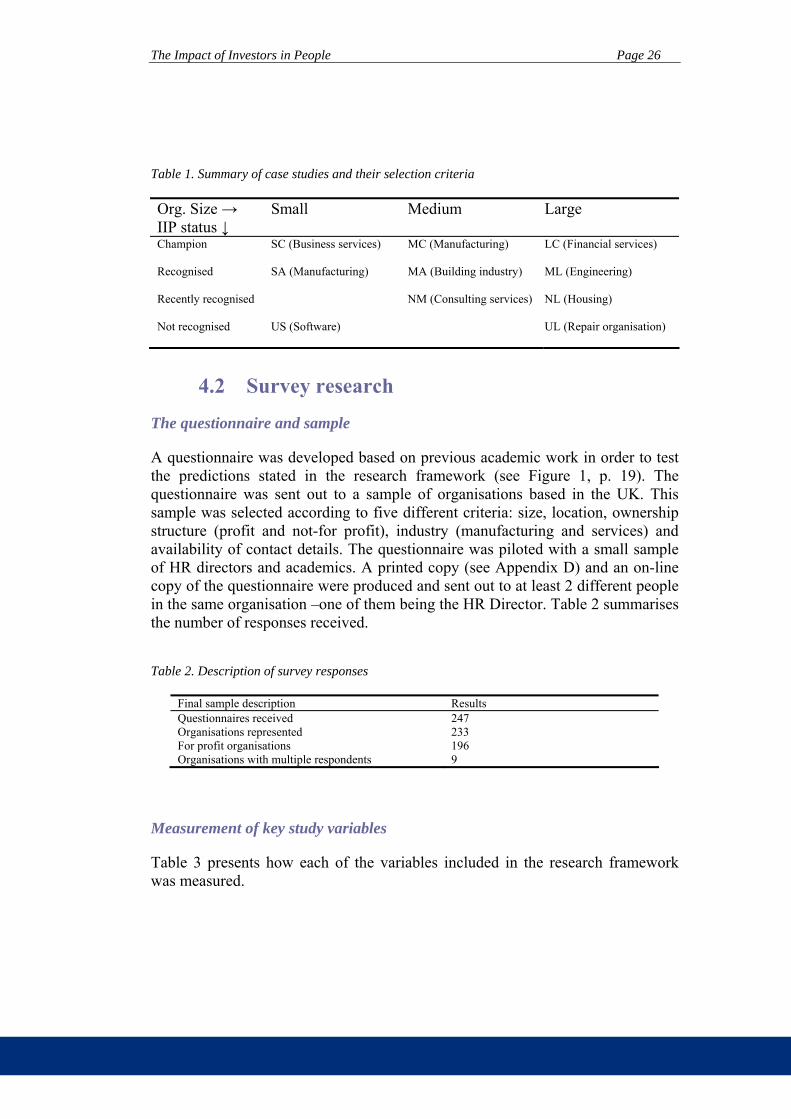
Table 1. Summary of case studies and their selection criteria
Org. Size → IIP status ↓
Small Medium Large
Champion SC (Business services)
MC (Manufacturing)
LC (Financial services)
Recognised SA (Manufacturing)
MA (Building industry)
ML (Engineering)
Recently recognised NM (Consulting services)
NL (Housing)
Not recognised US (Software)
UL (Repair organisation)
4.2 Survey research
The questionnaire and sample
A questionnaire was developed based on previous academic work in order to test the predictions stated in the research framework (see Figure 1, p. 19). The questionnaire was sent out to a sample of organisations based in the UK. This sample was selected according to five different criteria: size, location, ownership structure (profit and not-for profit), industry (manufacturing and services) and availability of contact details. The questionnaire was piloted with a small sample of HR directors and academics. A printed copy (see Appendix D) and an on-line copy of the questionnaire were produced and sent out to at least 2 different people in the same organisation –one of them being the HR Director. Table 2 summarises the number of responses received.
Table 2. Description of survey responses
Final sample description Results Questionnaires received 247 Organisations represented 233 For profit organisations 196 Organisations with multiple respondents 9
Measurement of key study variables
Table 3 presents how each of the variables included in the research framework was measured.

The Impact of Investors in People Page 27
Table 3. Measurement of study variables
Variable Survey questions Type of measure Source IIP STANDARD
Recognition Q79a Dummy IIP IIP implementation Q80 to Q86 7 point scale Cranfield Maturity Q79a(date) Date IIP People management indicators Q23 to Q27, Q20,
Q31 to Q34. 7 point scale IIP
HUMAN RESOURCES POLICIES Recruitment/selection policies Q4 to Q7 7 point scale Collins and Smith (2006) Reward policies Q8 to Q11 7 point scale Collins and Smith (2006) Training and development policies Q12 to Q19 7 point scale Collins and Smith (2006)
HUMAN CAPITAL FLEXIBILITY
Employees’ behaviour flexibility Q35 to Q38 7 point scale Bhattacharya et al (2005) Skills flexibility Q39 to Q42 7 point scale Bhattacharya et al (2005) HR practices flexibility Q43 to Q46 7 point scale Bhattacharya et al (2005)
COMPANY SOCIAL CLIMATE
Trust Q47 to Q51 7 point scale Collins and Smith (2006), Mayer, Davis, and Schoorman (1995)
Cooperation Q52 toQ56 7 point scale Collins and Smith (2006), Chatman and Flynn (2001).
Commitment Q57 to Q62 7 point scale Tsui et al (1997) PERCIEVED NON-FINANCIAL PERFORMANCE
Quality of products and services, attraction and retention of employees, customer satisfaction and employees’ relationships
Q87 to Q93 7 point scale Huselid (1996)
Innovation Q63 to Q68 7 point scale Delery and Doty (1996) Employee turnover Q98 Continuous Cranfield
REPORTED FINANCIAL PERFORMANCE
Turnover, profitability, growth in sales, market share
Q94 to Q97 7 point scale Huselid (1996)
ACCOUNTING FINANCIAL PERFORMANCE
Return on assets FAME Continuous IIP and Cranfield Profit margin FAME Continuous IIP and Cranfield Profit per employee FAME Continuous IIP and Cranfield
CONTROL VARIABLES
Organisational size: number of employees
FAME Continuous Cranfield
Industry (manufacturing vs service) FAME Dummy Cranfield OTHER variables not included in original framework
Effective communication Q21 to Q23, Q29, Q30
7 point scale Cranfield

The Impact of Investors in People Page 28
Demographic data
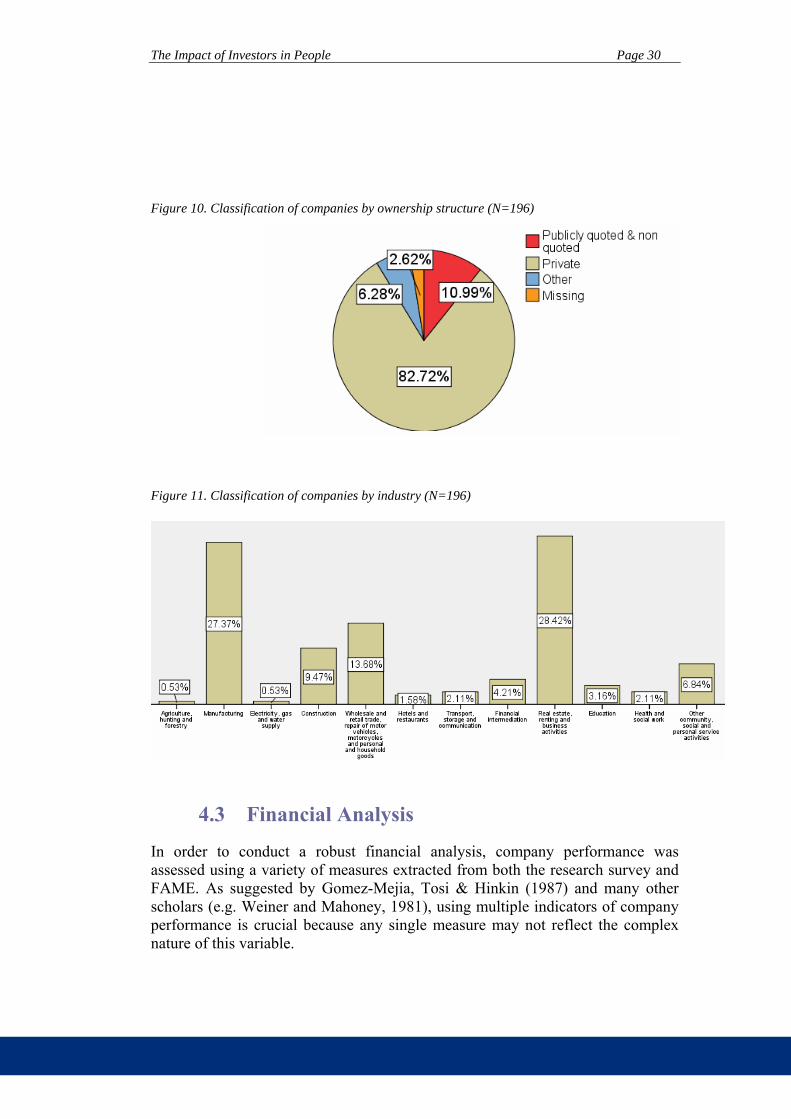
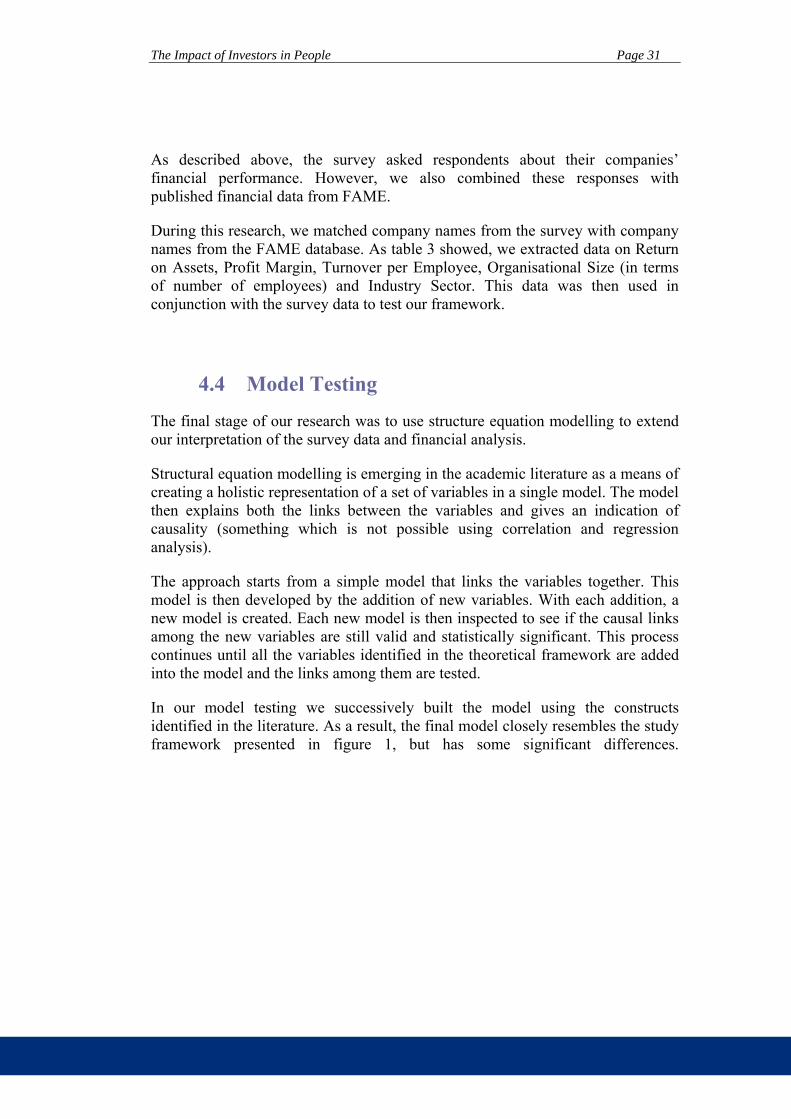
Given the requirement to match survey data with financial performance data, these results are based on the 196 for profit organisations giving us a sample large enough to be statistically significant for our analysis. The demographic data of these firms is presented in Figures 6 to 11. Figure 6 shows the percentage of companies that have been IIP recognised at one point in time – either during the current year or in the past and the percentage of companies that have never been IIP recognised. Figure 7 looks at the percentage of the study participants that are currently Investors in People companies. Figure 8 represents the classification of the study companies according to their location. Figure 9 presents the classification of the study participants according to their number of employees. Figure 10 represents the classification of study participants according to their ownership structure. Finally, Figure 11 presents a classification of the companies that have participated in this study according to their UK SIC.
Figure 6. Companies that currently have the IIP accreditation or have had it in the past (N=196)
• 8% had IIP but lapsed• 78% currently have IIP• 14% has IIP but only in
one part of the company
• 21% is working towards meeting the Standard
• 79% has never worked with IIP

The Impact of Investors in People Page 29
Figure 7. Companies that currently have the IIP accreditation (N=196)
Figure 8. Classification of companies by UK country (N=196)
Figure 9. Classification of companies by size (N=196)
IIP Maturity
The Impact of Investors in People Page 30
Figure 10. Classification of companies by ownership structure (N=196)
Figure 11. Classification of companies by industry (N=196)
4.3 Financial Analysis
In order to conduct a robust financial analysis, company performance was assessed using a variety of measures extracted from both the research survey and FAME. As suggested by Gomez-Mejia, Tosi & Hinkin (1987) and many other scholars (e.g. Weiner and Mahoney, 1981), using multiple indicators of company performance is crucial because any single measure may not reflect the complex nature of this variable.
The Impact of Investors in People Page 31
As described above, the survey asked respondents about their companies’ financial performance. However, we also combined these responses with published financial data from FAME.
During this research, we matched company names from the survey with company names from the FAME database. As table 3 showed, we extracted data on Return on Assets, Profit Margin, Turnover per Employee, Organisational Size (in terms of number of employees) and Industry Sector. This data was then used in conjunction with the survey data to test our framework.
4.4 Model Testing
The final stage of our research was to use structure equation modelling to extend our interpretation of the survey data and financial analysis.
Structural equation modelling is emerging in the academic literature as a means of creating a holistic representation of a set of variables in a single model. The model then explains both the links between the variables and gives an indication of causality (something which is not possible using correlation and regression analysis).
The approach starts from a simple model that links the variables together. This model is then developed by the addition of new variables. With each addition, a new model is created. Each new model is then inspected to see if the causal links among the new variables are still valid and statistically significant. This process continues until all the variables identified in the theoretical framework are added into the model and the links among them are tested.
In our model testing we successively built the model using the constructs identified in the literature. As a result, the final model closely resembles the study framework presented in figure 1, but has some significant differences.

The Impact of Investors in People Page 32
5. Research findings
5.1 Findings from the case studies
In this section we will present the findings from our case studies. We will start by presenting the people management practices that were identified and highlight the practices that were believed to deliver business performance. We will then reflect on the impact of IIP and these people management practices over time.
Good People Management Processes
From the cases and cross-case analysis we have identified a number of factors that were recurring themes and examples of good performance management. These are;
Goal deployment - rolling out corporate objectives to individuals Communications – both ways between the organisation and its employees Leadership role models – the management style projected in the organisation
Incentive systems – rewarding team and individual performance Recognition systems – recognising performance and values Training – opportunities for training and development
We have also identified examples of practices that are not common across all the cases but we believe are also important for delivering business performance over the medium to longer term. These are:
Resource management – ensuring that line management isn’t over stretched
Change management – a formal process allowing the organisation to develop
Learning – an attitude of mind where IIP assessments are used as learning opportunities by the organisation
Next, we will describe each of these in turn (but in the appendix C we have provided specific examples along with the case studies).
Goal deployment
Many of the organisations studied had mechanisms for involving all (or a large proportion) of their staff in the development of strategy. These organisations then cascaded the objectives down to individual staff objectives and created mechanisms that reinforced these objectives in the day-to-day working environment. The most explicit example of this was the “one-page-plan” which – for each employee - linked the business goals to the individual’s goals and summarised them on a single sheet of A4 paper. Some organisations reinforced

The Impact of Investors in People Page 33
this through their reward system; others through their recognition system, but regular one-to-ones played an important role in the goals being reviewed.
Goal deployment was supported by structured performance management systems that provided regular feedback and picked up quickly on poor performing individuals. From these cases it appeared that one of the key drivers of performance was that people knew what was expected of them, received regular feedback of their own performance and understood clearly how their endeavours fitted into the organisation achieving its goals.
Communication
One of the most highlighted processes in this study was communication. Communication with staff starts with the annual communication of the business objectives, these then are broken down by function and regular feedback occurs through briefing sessions and quarterly progress days. Individual communication occurs through regular one-to-ones and the achievement of goals is communicated through the reward systems or through formal recognition systems with monthly recognition days. Weekly team meetings and cross-functional team meetings support the process, with intranet, staff notice boards, in-house magazines and posters providing alternative media. Besides communicating performance, many of the organisations we visited espoused and communicated company-wide values using many of the same communication channels.
But communication isn’t simply from management to the employees, employee feedback is also important. The organisations studied used staff surveys, consultative committees, roundtables, managing director’s staff forum, open door policies, open plan offices and managing by walking about to facilitate both formal and informal feedback from staff.
Our observation here is that intensive two-way communication using multiple channels and media was the abiding characteristic of good practice.
Leadership role models
Being able to manage staff is an important attribute of management. The quote that “people leave their boss and not the organisation” was used more than once and for many firms the role of senior management in creating the right working environment was highlighted. A number of organisations were focusing on ensuring that line management had at least a minimum management capability for handling people but some of the best line managers appeared to be naturally undertaking the role. Line management’s commitment to listen and act when appropriate was regularly highlighted as a strength. In some of the organisations we studied, the recognition and reward processes underpinned the achievement of goals requiring less input from line management, but some of the best line management was observed when these processes were much more informal and left to the discretion of the line managers.
The Impact of Investors in People Page 34
Our observation was that role model leaders created a management style that pervaded throughout the organisation. Employees recognised the style from the role models and gave a consistent description of their attributes. It appeared that informally this became the “way of doing things round here”.
Reward systems
Six of the organisations studied had a business related reward system usually related to achievement of an overarching profit objective. These were seen as giving a “thank you” rather than driving performance per se, but four companies were using individually based performance rewards to drive individual performance and a fifth organisation was looking to introduce such a scheme.
In the four organisations using reward systems to drive performance, the primary mechanism was based on individuals achieving their appraisal objectives. However, for job roles where individual targets could be easily set and measured, such as sales staff and operator productivity, rewards were based on delivering specific performance targets.
Many organisations rely on team performance, but there was only one real example of a company endeavouring to drive team behaviour and performance through the reward system using a closely designed and interlocking set of measures and rewards. This is described later.
Our observation here is that in most situations, reward emphasised the individual targets and therefore indirectly influenced the companies’ performance.
Recognition systems
We have differentiated recognition systems from reward systems. Reward systems typically pay larger financial rewards through the payroll, whilst recognition systems are typically prize based (gift vouchers, holidays etc), of lower value and involve personal public recognition of individuals and their achievements.
Six of the companies studied identified recognition as an important people management practice. Four of these companies had formal recognition systems that were run in their own right. These involved formal systems for nominating staff for awards based on management recognition, team recommendation or customer comment. Recognition was provided both for performance and “living the organisation’s values”. All the companies had formal groups for managing the recognition, but one specially constituted a committee of employees and previous award winners to judge the month’s awards. The culmination of this activity was the monthly reward ceremony where individuals were presented with their prizes in front of management and their peers. Some rolled these up to create an annual award final.
Employee recognition was seen as an important part of good management and the formal systems were one approach to ensuring that this happened. However, one

The Impact of Investors in People Page 35
case company had a very effective informal recognition system, which is described later.
Our interpretation of these cases is that in most instances the formal recognition system promoted communication of organisational values and goals, but the informal management recognition drives performance directly.
Training
Five of the organisations were very reliant on staff having the necessary technical skills to do their job and there was significant support to ensure that this happened. Two organisations had developed their own internal training centres and one had web-based training available. The other two invested both in on-the-job training and specific offsite courses where necessary.
All the medium and large sized organisations were investing in management training in some form or another. Most of this training was focused on developing line management skills and capability, and higher-level leadership training was rarely mentioned during the interviews.
Although many training initiatives were identified, training was rarely cited as a driver of business performance. However, the availability of training was raised in many of our interviews and discussed in terms of individuals perceiving that the company were investing in them. This appeared to have a positive impact on staff morale and commitment to the business.
As training was not cited as making a direct impact on business performance, we have interpreted this as meaning that training was most probably an enabler of company performance rather than a direct driver. Our interpretation is that companies’ willingness to invest in training has a positive impact on employee and management capability and on the organisational social climate. These in turn, have a positive impact on company performance.
Resource management
In two case studies the issue of resource management was raised. We have highlighted resource management here, as we are aware from other research and experience that this is a key issue. In these two cases, management were extremely careful to ensure that staff, and managers in particular, were not overstretched. Situations occurred during the development of the business whereby managers gained direct reports. These organisations re-organised to ensure that the individual manager’s span of control didn’t exceed what was considered reasonable.
We interpreted this as a positive example of the business managing its staff and resources effectively by not asking people to deliver more than could be expected of them.

The Impact of Investors in People Page 36
Change management
One organisation had developed a change management process that allowed the organisation to change and develop naturally. This approach is described below, but such a process can be an important lever in maintaining the businesses longer-term performance.
Learning
One of the other interesting aspects of the cases studies we have conducted is that many of the case organisations were using IIP as a feedback and learning mechanism. We would not necessarily expect this to be true of the population as a whole, but all the Champions took this view and three of the other companies in this sample took the same approach. This is an indication that successful companies were using the IIP Standard as a mechanism for self-reflection and development.
Basic HR policies and procedures
Basic HR policies and procedures were mentioned in passing, but were only once cited as making a positive impact on performance. In this one situation, the business saw the basic practices and policies providing a consistent base for managing people allowing them to concentrate on the more important aspect of managing the business. If one takes a systems view of management, this is exactly what one would expect to find. Hence we have interpreted cases as showing that good basic practices and procedures in place are an enabler of business performance.
Summary of good management practices
In summarising this section, when we link our findings back to our original framework and the literature, we were surprised that our case found that recruitment and selection was mentioned infrequently. We found strong evidence of the importance of recognition and rewards. We found some evidence of training and development with aspects of appraisals being central in many organisations. However, it is possible that recruitment, like training, was seen as an enabler rather than a driver of performance.
Besides the policies in our original framework, strategy deployment, goal setting and communication were all regularly cited as being important. These are all management practices associated with coordinating and directing effort. These contrast with the HR practices, which are primarily focused on creating employee engagement. It seems logical that both employee engagement and directing effort are important, but the HR literature focuses almost exclusively on the former, whilst the performance measurement literature focuses almost exclusively on the latter. We will develop this further in the next section.

The Impact of Investors in People Page 37
Impact on performance
During our case studies, we asked about the key practices that HR, line managers and staff believed created better business performance. Table 4 summarises the results.
In many of the cases, the twin requirements of engagement and direction are identified. For example: -
• Small Champion have the one page plan (direction), but coaching and happiness are important (engagement)
• Medium Champion identified communicating objectives (direction) and motivating the team (engagement)
• Large Champion identified people engagement and discretionary effort (engagement) and performance agreements (direction)
Interestingly, although the goal cascading, communication and leadership role model dominated the discussion of practices, the engagement practices were more frequently cited in delivering performance. Also, if one summarises the findings, we can see that: -
• Five companies believed both engagement and direction practices delivered performance;
• Four companies believed engagement practices delivered performance;
• One company believed direction practices delivered performance.
Our observation from these cases is that engagement can be effective without explicit direction, but we would have to question the reliance on direction if the necessary engagement wasn’t present. Unlike the academic literature, the IIP Standard embraces both engagement and commitment, and from these cases we would strongly endorse that approach.

The Impact of Investors in People Page 38
38
Table 4. Summary of case studies’ results: The HR practices and policies that are believed to positively impact on business performance
IIP Status \ Org. Size
Small Medium Large
Champion • Performance focus - one page plan and feedback
• Coaching sessions - personal improvement
• Team happiness
• Communicating objectives and performance
• Motivating the team and people to work as a team
• People engagement, discretionary effort
• Performance agreements • If we look after our
people, they will look after the business
• People and systems Recognised • Management visibility
• Recognition • Good line management
• People engagement, discretionary effort
• Good people, mix of youth and experience
• Recognition • Strong cross- functional
working • Good line management
• Appraisals • Staff bonus
Recently recognised
• Good and predictable HR policies and practices
• People encouraged, listened to and motivated
• Fun based culture
• The performance management system
• The management conferences
• The change management process
Not recognised
• Well structured goals and targets so individuals know what is expected of them
• Individual goals • The pay and recognition
system promotes performance
• Executive team, openness leadership
• Good morale

The Impact of Investors in People Page 39
The impact of seeking IIP recognition on HR and Management Practice
In the literature, writers have recognised that there are differing reasons for companies to pursue IIP recognition (Bell et al, 2001, 2002). In our case studies the reasons for seeking IIP recognition were as follows:
Wanting the badge as a sign of competence to their customers (2) Wanting feedback from an external independent assessor (1) Supporting the development of the HR processes (1) Recognition of what they did and opportunity to learn (6)
There are three important points that should be noted about the companies involved in these case studies. Firstly, the split of why companies sought IIP recognition is probably not representative of the population at large. Secondly, there was a degree of self-selection in that companies had to be prepared for us to conduct the case studies. This resulted in many of the companies involved having exceptionally good HR practices, again not representative of the population at large. Thirdly, the two companies who wanted the badge and external IIP recognition as the primary reason for seeking IIP, were both investing time and effort in their imminent reassessment.
The seven organisations highlighted below (see Table 5) all showed examples of advanced HR management practices that aligned with the requirements of IIP. These organisations were also high performing companies in their own sectors and if one takes account of their size, they would be all described as amongst the most successful.
Table 5. The advanced practice high performing case companies
Small Medium Large Champion SC (Business services) MC (Manufacturing) LC (Financial services) Recognised MA (Building industry) Newly recognised MN (Consulting services) LN (Housing) Unrecognised LU (Repair organisation)
Given this situation, we would expect the wider survey to find that companies with IIP recognition have better people management practices and companies with better people management practices have superior business performance.
We also note that the organisations believe performance management - alignment of objectives, communication and feedback of results and how this contributes to the organisations goals – delivers business performance. As a result, we modified the survey to directly test whether this belief is true in a wider set of companies.

The Impact of Investors in People Page 40
Examples of the groups of practices used by these organisations are provided in Appendix C.
The impact of IIP and HR practices over time
The second reason for conducting case study research was to investigate the impact of IIP recognition and HR practices over time. Ideally, a set of longitudinal case studies would be used to investigate this thoroughly. We had difficulty gaining reliable information on this aspect of the research from the larger companies, mainly because of the limitations in accessing multiple informants who had the history and knowledge, but some insights can be gleaned from the interviews conducted there.
In three organisations, the HR approach proposed by IIP had a significant impact on the business. Specifically: -
• staff in one organisation didn’t believe the organisation would still be in existence if it hadn’t been for IIP;
• the chief executive of one organisation concluded that adopting IIP had modified his management style significantly and the organisation was significantly more successful as a result;
• one organisation used a strong people engagement strategy to turn round a failing business in difficult circumstances when it was losing staff and money.
This suggests that simply understanding why companies have chosen to work with the IIP framework doesn’t tell the full story. Whether companies work with IIP to gain recognition or have their own approach validated retrospectively is less of a concern than the fact that they develop the approach and apply the philosophy in their businesses.
Summarising our case study findings
If we reflect on our study framework developed from the Strategic Human Resources Management literature we find in our case studies two aspects that should be considered. Firstly, there is the issue that many of the practices raised focused on directing employees’ effort. Secondly, there is the issue that human resource flexibility was not raised or discussed.
In the case studies considerable attention was paid to the “directional” elements of people management. However, when we specifically focused on the elements that delivered better performance, commitment based practices that generate the engagement and organisational climate came to the fore. As a result, we decided to include in the survey a set of questions relating to the cascading of goals and
The Impact of Investors in People Page 41
objectives to the individual to test the importance of this aspect, but we decided not to change the model at this stage.
In our case study research we found no reference to the creation of human resource flexibility. This is a concept that may be a little academic to many practitioners. Human resource flexibility provides organisations with the ability to respond to changes in short term demand and to longer-term changes in the business environment. These benefits in themselves may not have been seen as beneficial in delivering performance. We therefore decided to leave the model unchanged to test whether human resource flexibility was important or not.
In the next section, we will present out survey findings and the results of our financial analysis.

The Impact of Investors in People Page 42
5.2 Findings from the survey and financial analysis
The research data has been analysed using descriptive statistics, basic statistical analysis, correlation analysis, regression analysis and structured equation modelling. The descriptive statistics of the survey are presented in Appendix E, but we present the correlation, regression and model testing using structural equation modelling in this section.
Correlation analysis
Correlation analysis3 is used to look at the relationships between two of the variables. Basically, we are looking to see if the variables are related or not. For example, when we see an increase in non-financial performance, do we see a corresponding increase in financial performance?
The results of the correlation analysis are shown in Table 6. From this table the following insights can be extracted.
Companies that are IIP recognised compared to those that are not recognised are more likely to: possess commitment-based training and development policies; have more effective communication practices; show evidence of higher levels of employee behaviour and skills flexibility; reveal higher levels of trust, commitment and cooperation among employees; be more innovative; exhibit higher levels of reported non-financial performance; and be better at meeting their strategic goals.
Companies that have rated highly their people management practices compared to companies that have rated low in this variable – regardless of their IIP status – are more likely to: possess commitment-based HR policies (recruitment/selection, reward, training and development); have more effective communication practices; show evidence of higher levels of human capital flexibility (i.e. employees’ behaviour, skills and HR practices flexibility); reveal higher levels of trust, commitment and cooperation among employees; be more innovative; present higher levels of reported organisational performance both financial and non-financial; and be better at meeting their strategic objectives.
3 Note about correlation analysis: Correlation is a measure of the linear relationship between variables. There are three ways in which two variables can be related: (a) positively related, (b) not related, (c) negatively related. The correlation coefficient (R2) will always be between 1 and -1. When the correlation coefficient is 0, this means that no correlation between the variables exists. When doing correlation analysis, it is necessarily to check the significance level (p). If p<0.05 this means that the probability of this correlation being a fluke is low. Correlations cannot be used to infer causal relationships.

The Impact of Investors in People Page 43
Companies that believe in IIP and have implemented IIP well are more likely to: possess commitment-based selection, and training policies; have more effective communication practices; show evidence of higher levels of employees’ behaviour, skills and HR practices flexibility; reveal higher levels of trust, commitment and cooperation among employees; be more innovative; exhibit higher levels of reported financial and non-financial performance, and be better at meeting their strategic objectives.
None of the IIP indicators used seem to be associated to either of the accounting performance measures extracted from FAME. These are: return on assets and profits. Out of all the variables studied only two seem to be positively associated to profits. These are: HR practices flexibility and trust.
An additional analysis was performed correlating the different items included in the questionnaire section titled “people management” and the organisational performance variables (see Appendix I).
Regression analysis
Regression analysis4 takes our testing to the next level by taking account of several variables in a single relationship. For example, we can use regression analysis to look at the impact of “organisational social climate” and “human capital flexibility” on the organisational non-financial performance. The models used in the regression analysis are presented in Tables 7, 8, 9 and 10. The insights extracted from this table are presented below.
HR policies are influenced by the IIP Standard. Those organisations that are IIP recognised are more likely to have commitment-based HR policies.
The IIP Standard has a positive impact on the company’s social climate (trust, commitment and cooperation). Those organisations that are IIP recognised are more likely to have high levels of trust, commitment and cooperation among their employees.
4 Note about regression analysis: Multiple regression seeks to predict an outcome from several variables (e.g. Y= α + β1 X1 + β2X2 + ε). The value of the regression coefficient α can be interpreted as meaning that when X1=0 and X2=0 , the model predicts α of Y. β1 can be interpreted as representing the change in the outcome associated with a unit change in the predictor. For example, if our X1 variable is increased by 1 unit, then our model predicts that our Y variable will increase in β1. A t-statistic is produced for each β coefficient. It should be significant (p<.05) in order to be valid. Multiple regression analysis is used for prediction purposes. It cannot be used to infer causal relationships. Regression analysis compared to correlation analysis is more robust as it can take into consideration the diverse set of variables (X) that affect a specific outcome (Y).

The Impact of Investors in People Page 44
The IIP Standard has a positive impact on the degree of human capital flexibility (i.e. employees’ behaviour, skills and HR practices flexibility). Those organisations that are IIP recognised are more likely to have high levels of human capital flexibility.
The IIP Standard has a positive impact on the perception that employees’ have of the company’s non-financial performance (assessed by the quality of the company’s product and services, customer satisfaction, attraction and retention of employees, and employees’ relationships).
The IIP Standard has no impact on the level of staff turnover.
The IIP Standard has a positive impact on innovation. Those organisations that are IIP recognised are more likely to have high levels of products and service innovation.
The IIP Standard has a positive impact on the degree of achievement of company’s strategic goals. Those companies that are IIP recognised are more likely to meet their strategic objectives.
Having IIP recognition, regardless of how well the Standard was implemented does not seem to have a direct impact on employees’ perceptions of company financial results. However, those organisations that have been strongly satisfied with their IIP implementation processes and those that have rated high on their people management indicators do seem to believe that the IIP Standard has positive effects over the company’s financial performance (assessed by reported turnover, profitability, growth in sales and market share compared to competitors).
The data supports an indirect impact of the IIP Standard on return on assets. This relationship is explained as follows: IIP recognised companies are more likely to perceive benefits in their non-financial performance. Employees’ perception of good non-financial performance has a positive effect on employees’ perception of good financial performance, which in turn has a positive effect on return on assets (see table 7).
An additional analysis was conducted looking at the effect of the IIP Standard on effective communication practices as it was found that these types of practices have a positive effect on profitability –assessed by the profit margin and profit per employee figures that appear on the company annual accounting report (see Appendix F). It was found that the IIP Standard has a positive effect on effective communication practices and therefore an indirect effect on company’s profitability.
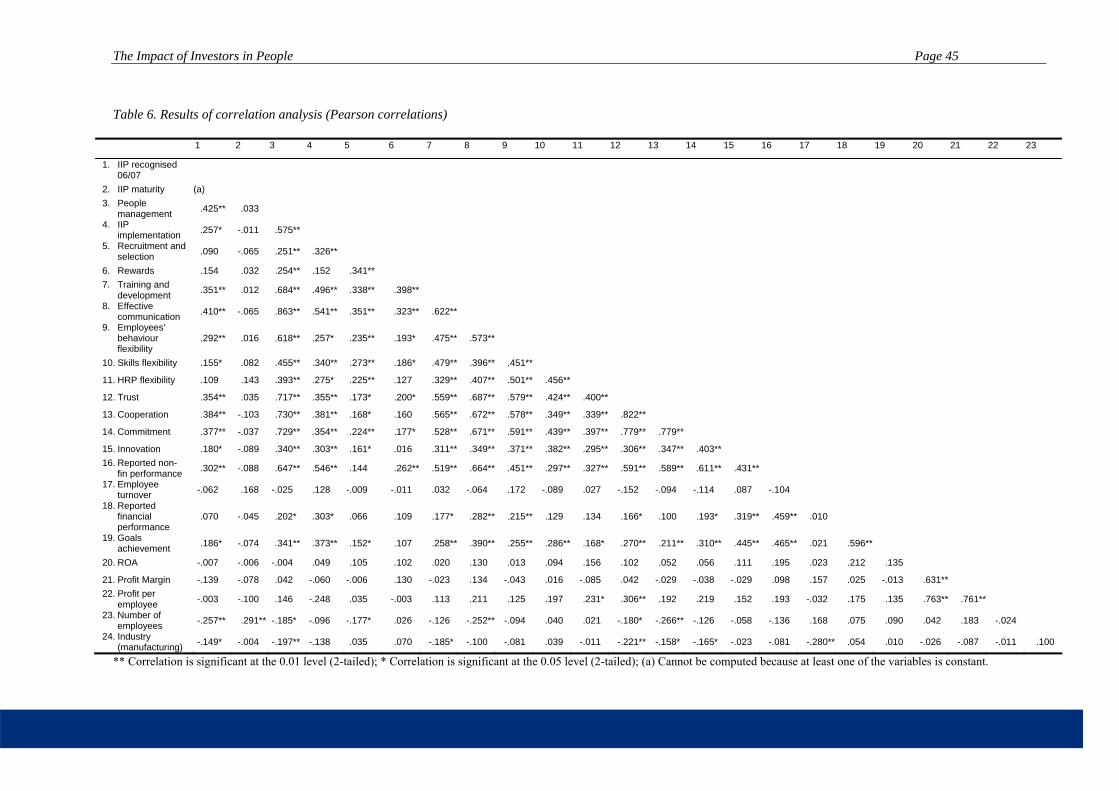
The Impact of Investors in People Page 45
45
Table 6. Results of correlation analysis (Pearson correlations)
1 2 3 4 5 6 7 8 9 10 11 12 13 14 15 16 17 18 19 20 21 22 23
1. IIP recognised 06/07
2. IIP maturity (a) 3. People
management .425** .033
4. IIP implementation .257* -.011 .575**
5. Recruitment and selection .090 -.065 .251** .326**
6. Rewards .154 .032 .254** .152 .341** 7. Training and
development .351** .012 .684** .496** .338** .398**
8. Effective communication .410** -.065 .863** .541** .351** .323** .622**
9. Employees' behaviour flexibility
.292** .016 .618** .257* .235** .193* .475** .573**
10. Skills flexibility .155* .082 .455** .340** .273** .186* .479** .396** .451**
11. HRP flexibility .109 .143 .393** .275* .225** .127 .329** .407** .501** .456**
12. Trust .354** .035 .717** .355** .173* .200* .559** .687** .579** .424** .400**
13. Cooperation .384** -.103 .730** .381** .168* .160 .565** .672** .578** .349** .339** .822**
14. Commitment .377** -.037 .729** .354** .224** .177* .528** .671** .591** .439** .397** .779** .779**
15. Innovation .180* -.089 .340** .303** .161* .016 .311** .349** .371** .382** .295** .306** .347** .403** 16. Reported non-
fin performance .302** -.088 .647** .546** .144 .262** .519** .664** .451** .297** .327** .591** .589** .611** .431**
17. Employee turnover -.062 .168 -.025 .128 -.009 -.011 .032 -.064 .172 -.089 .027 -.152 -.094 -.114 .087 -.104
18. Reported financial performance
.070 -.045 .202* .303* .066 .109 .177* .282** .215** .129 .134 .166* .100 .193* .319** .459** .010
19. Goals achievement .186* -.074 .341** .373** .152* .107 .258** .390** .255** .286** .168* .270** .211** .310** .445** .465** .021 .596**
20. ROA -.007 -.006 -.004 .049 .105 .102 .020 .130 .013 .094 .156 .102 .052 .056 .111 .195 .023 .212 .135
21. Profit Margin -.139 -.078 .042 -.060 -.006 .130 -.023 .134 -.043 .016 -.085 .042 -.029 -.038 -.029 .098 .157 .025 -.013 .631** 22. Profit per
employee -.003 -.100 .146 -.248 .035 -.003 .113 .211 .125 .197 .231* .306** .192 .219 .152 .193 -.032 .175 .135 .763** .761**
23. Number of employees -.257** .291** -.185* -.096 -.177* .026 -.126 -.252** -.094 .040 .021 -.180* -.266** -.126 -.058 -.136 .168 .075 .090 .042 .183 -.024
24. Industry (manufacturing) -.149* -.004 -.197** -.138 .035 .070 -.185* -.100 -.081 .039 -.011 -.221** -.158* -.165* -.023 -.081 -.280** .054 .010 -.026 -.087 -.011 .100
** Correlation is significant at the 0.01 level (2-tailed); * Correlation is significant at the 0.05 level (2-tailed); (a) Cannot be computed because at least one of the variables is constant.

The Impact of Investors in People Page 46
46
Table 7. Results of regression analysis – IIP recognition during the current year as key predictor
HR policies
Company social climate
Human capital flexibility Non-financial performance
Financial perform-ance Accounting financial performance
Dependent variables (Y) →
Average of recruitment/ selection, rewards and training and development
Average of trust, commitment and cooperation
Average of employees’ behaviour, skills and HR practices flexibility
Average of reported quality of products/ services, attraction/retention, customer satisfaction, employees’ relationships
Employee turnover
Innovation Strategic goals achievement
Average of reported turnover, profitability, growth in sales and market share
ROA Profit Margin Profit per employee
β values → Predictors (X)
β SE β SE β SE Β SE β SE β SE β SE β SE β SE β SE β SE
Constant (α) 4.86*** .24 5.35*** .22 4.87*** .22 5.41*** .19 1.00*** .09 4.88*** .26 4.31*** .39 4.80*** .30 2.219*** .007 1.720*** .017 4.974*** .009 Org. size (β1) -.01 .09 -.12 .09 .06 .09 -.05 .07 .07* .04 -.01 .10 .31* .15 .14 .12 .001 .003 .010 .007 -.001 .003 Industry_Man (β2) .14 .16 -.31* .15 .00 .15 -.08 .14 -.21*** .06 .00 .19 .07 .27 .14 .21 -.001 .004 -.011 .012 -.001 .005 IIP recognition (β3) .47** .15 .74*** .14 .40** .14 .46*** .12 -.03 .06 .36* .17 .78** .25 .25 .19 .000 .004 -.012 .012 .000 .005
R2= .07 .20 .05 .10 .12 .03 .07 .09 .00 .05 .00
Adj. R2= .05 .19 .03 .08 .09 .01 .05 -.02 -.02 .01 -.04
F= 3.84* 14.89*** 2.28* 6.06*** 5.153** 1.73 3.82** .92 .08 1.56 .02
N= 148 181 175 168 115 178 170 144 105 88 82
*** Significant at the 0.001 level** Significant at the 0.01 level; * Significant at the 0.05 level; Ŧ Significant at the 0.10 level

The Impact of Investors in People Page 47
47
Table 8. Results of regression analysis – People management as key predictor
HR policies
Company social climate
Human capital flexibility Non-financial performance
Financial perform ance
Accounting financial performance
Dependent variables (Y) →
Average of recruitment/ selection, rewards and training and development
Average of trust, commitment and cooperation
Average of employees’ behaviour, skills and HR practices flexibility
Average of reported quality of products/ services, attraction/retention, customer satisfaction, employees’ relationships
Employee turnover
Innovation Strategic goals achievement
Average of reported turnover, profitability, growth in sales and market share
ROA Profit Margin Profit per employee
β values → Predictors (X)
β SE β SE β SE Β SE β SE β SE β SE β SE β SE β SE β SE
Constant (α) 2.97*** .37 2.02*** .28 2.25*** .33 3.15*** .29 1.08*** .17 3.22*** .48 1.69* .72 3.57*** .53 2.219*** .012 1.696*** .033 4.959*** .014 Org. size (β1) -.02 .08 -.08 .06 .09 .07 -.03 .06 .07* .03 .02 .10 .32* .14 .16 .11 .001 .003 .012 Ŧ .007 .000 .003 Industry_Man (β2) .20 .14 -.12 .11 .18 .12 .03 .11 -.22** .06 .04 .18 .23 .27 .22 .21 -.001 .004 -.009 .013 .000 .005 People management (β3)
.40*** .06 .66*** .04 .50*** .05 .45*** .04 -.02 .03 .33*** .07 .55*** .11 .24** .08 .000 .002 .003 .005 .003 .002
R2= .27 .63 .38 .42 .13 .12 .17 .07 .00 .04 .02
Adj. R2= .26 .62 .37 .41 .10 .10 .13 .05 -.02 .00 -.02
F= 17.65*** 97.53*** 34.44*** 38.77*** 5.36** 7.20*** 9.20*** 3.42** .06 1.26 .57
N= 146 176 173 164 113 174 166 140 104 87 81
*** Significant at the 0.001 level** Significant at the 0.01 level; * Significant at the 0.05 level; Ŧ Significant at the 0.10 level

The Impact of Investors in People Page 48
48
Table 9. Results of regression analysis – IIP implementation as key predictor
HR policies
Company social climate
Human capital flexibility Non-financial performance
Financial perform ance Accounting financial performance
Dependent variables (Y) →
Average of recruitment/ selection, rewards and training and development
Average of trust, commitment and cooperation
Average of employees’ behaviour, skills and HR practices flexibility
Average of reported quality of products/ services, attraction/retention, customer satisfaction, employees’ relationships
Employee turnover
Innovation Strategic goals achievement
Average of reported turnover, profitability, growth in sales and market share
ROA Profit Margin Profit per employee
β values → Predictors (X)
β SE β SE β SE Β SE β SE β SE β SE β SE β SE β SE β SE
Constant (α) 3.36*** .58 4.47*** .58 3.59*** .64 3.84*** .44 .80** .28 3.59*** .81 2.40* 1.01 2.99** .98 Org. size (β1) -.05 .13 -.23 Ŧ .12 .02 .13 -.09 .09 .07 .06 -.24 .17 -.00 .21 .06 .20 Industry_Man (β2) .32 .23 -.24 .23 .02 .26 -.26 .17 -.28** .10 .20 .33 .190 .41 .10 .37 Not enough data available IIP implementation (β3)
.33*** .09 .30*** .09 .29** .10 .36*** .07 .03 .04 .33** .12 .53** .15 .37* .15
R2= .22 .21 .11 .34 .16 .12 .14 .10
Adj. R2= .18 .18 .08 .31 .11 .08 .11 .05
F= 5.81*** 6.79*** 3.17* 12.98*** 3.03* 3.33* 4.23** 2.11*
N= 65 83 80 80 53 81 81 64 36 30 28
*** Significant at the 0.001 level** Significant at the 0.01 level; * Significant at the 0.05 level; Ŧ Significant at the 0.10 level

The Impact of Investors in People Page 49
49
Table 10. Results of regression analysis – Impact firm performance
Company social climate
Human capital flexibility
Non-financial performance
Financial performance
Accounting financial performance Dependent variables (Y) →
Average of trust, commitment and cooperation
Average of employees’ behaviour, skills and HR practices flexibility
Average of reported quality of products/ services, attraction/retention, customer satisfaction, employees’ relationships
Average of reported turnover, profitability, growth in sales and market share
ROA Profit Margin Profit per employee
β values → Predictors (X)
β SE β SE Β SE β SE β SE β SE β SE
Constant (α) 3.41*** .51 2.39*** .51 2.49*** .37 1.24*** .63 2.200*** .012 1.702*** .034 4.957*** .014 Org. size (β1) -.13 .10 .09 .09 -.04 .06 .17 .10 .001 .003 .014 Ŧ .008 -.001 .004 Industry_Man (β2) -.37* .17 .03 .16 -.04 .12 .16 .18 .002 .005 -.009 .016 .002 .005 HR policies (β3) .45*** .09 .51*** .09 Company social climate (β4)
.46*** .07
Human capital flexibility (β5)
.12 Ŧ .07
Non-financial performance (reported) (β6)
.65*** .10
Financial performance (reported) (β7)
.004 Ŧ .002 .000 .006 .003 .002
R2= .21 .20 .42 .24 .05 .06 .04
Adj. R2= .19 .18 .40 .22 .01 .01 -.01
F= 11.99*** 11.44*** 26.56*** 14.27*** 1.28 1.27 .73
N= 143 141 154 140 83 66 63
*** Significant at the 0.001 level** Significant at the 0.01 level; * Significant at the 0.05 level; Ŧ Significant at the 0.10 level

The Impact of Investors in People Page 50
Model Testing
Our final test was to use Structural Equation Modelling (SEM)5. Structural equation modelling allows us to test the model as a whole and to interpret the causal relations among the model constructs. The results are presented in Figures 12 and 13.
The way that this is done is by creating a series of models. We start from a simple assumption and then add more detail to the model. The aim of this process is to develop a model that tests the statistical significance of the causal relations among variables as suggested both by the IIP literature and the case studies conducted. As we do this, we test whether the links among the constructs in the new model are still significant until we have a complete model that explains our data. We will show in outline how this process has been undertaken here.
We started by looking at the basic link between IIP and financial performance. For reasons of data composition, we have used the ten people management questions (taken directly from the IIP Standard) to represent “IIP” and financial performance as represented both by the survey responses and the information from published accounts (FAME database). Figure 12a shows the positive impact that people management has on employees’ perception of financial performance which, consequently, positively affects company financial performance.
However, if we insert employees’ perception of non-financial performance in the model (Figure 12b), the path coefficient linking people management to employees’ perception of financial performance becomes not significant, whilst both the coefficients from people management to employees’ perception of non-financial performance and from employees’ perception of non-financial performance to employees’ perception of financial performance are positive and highly significant.
5 Partial Least Squares (PLS) approach to structural equations modelling was used to develop the proposed models. To assess the statistical significance of the path coefficients, which are standardized betas, a bootstrap analysis was performed. The use of this as opposed to traditional t-tests allowed the testing of the significance of parameter estimates from data that were not assumed to be multivariate normal.
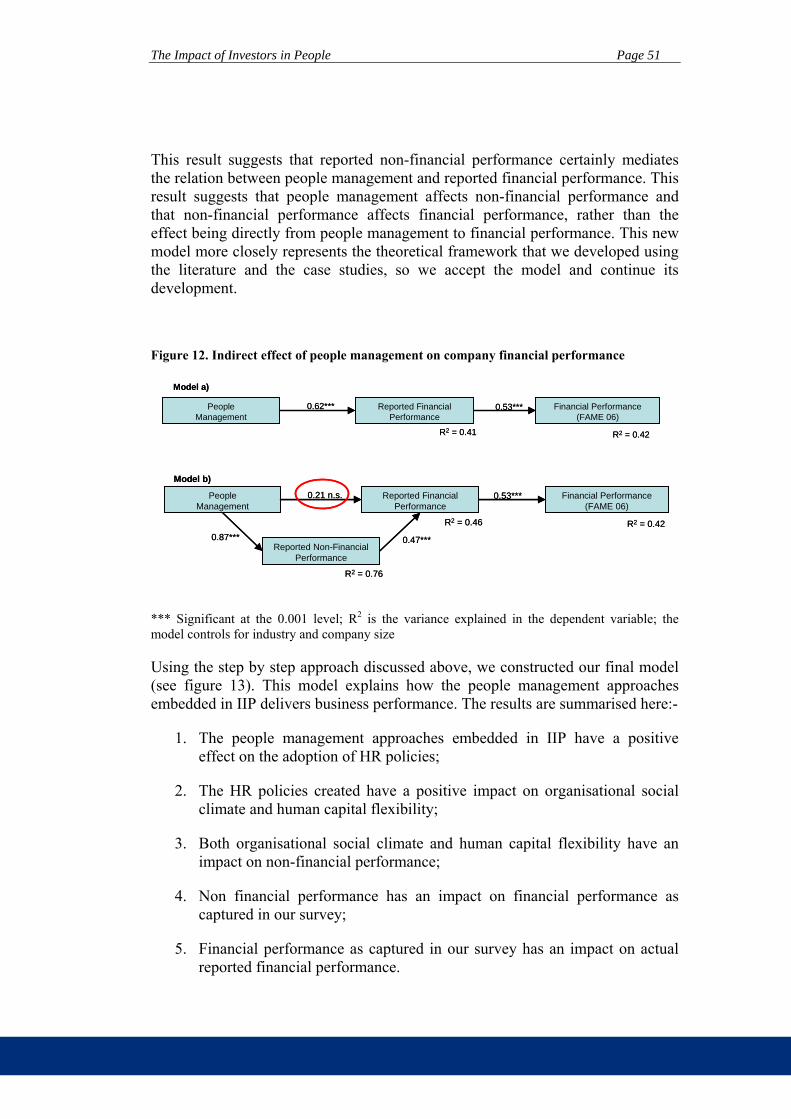
The Impact of Investors in People Page 51
This result suggests that reported non-financial performance certainly mediates the relation between people management and reported financial performance. This result suggests that people management affects non-financial performance and that non-financial performance affects financial performance, rather than the effect being directly from people management to financial performance. This new model more closely represents the theoretical framework that we developed using the literature and the case studies, so we accept the model and continue its development.
Figure 12. Indirect effect of people management on company financial performance
Model a)
Financial Performance(FAME 06)
People Management
Reported FinancialPerformance
0.53***0.62***
R2 = 0.41 R2 = 0.42
Model a)
Financial Performance(FAME 06)
People Management
Reported FinancialPerformance
0.53***0.62***
R2 = 0.41 R2 = 0.42
Financial Performance(FAME 06)
R2 = 0.42
People Management
Reported FinancialPerformance
0.53***0.21 n.s.
R2 = 0.46
Reported Non-FinancialPerformance
R2 = 0.76
0.87*** 0.47***
Model b)
Financial Performance(FAME 06)
R2 = 0.42
People Management
Reported FinancialPerformance
0.53***0.21 n.s.
R2 = 0.46
Reported Non-FinancialPerformance
R2 = 0.76
0.87*** 0.47***
Model b)
*** Significant at the 0.001 level; R2 is the variance explained in the dependent variable; the model controls for industry and company size
Using the step by step approach discussed above, we constructed our final model (see figure 13). This model explains how the people management approaches embedded in IIP delivers business performance. The results are summarised here:-
1. The people management approaches embedded in IIP have a positive effect on the adoption of HR policies;
2. The HR policies created have a positive impact on organisational social climate and human capital flexibility;
3. Both organisational social climate and human capital flexibility have an impact on non-financial performance;
4. Non financial performance has an impact on financial performance as captured in our survey;
5. Financial performance as captured in our survey has an impact on actual reported financial performance.
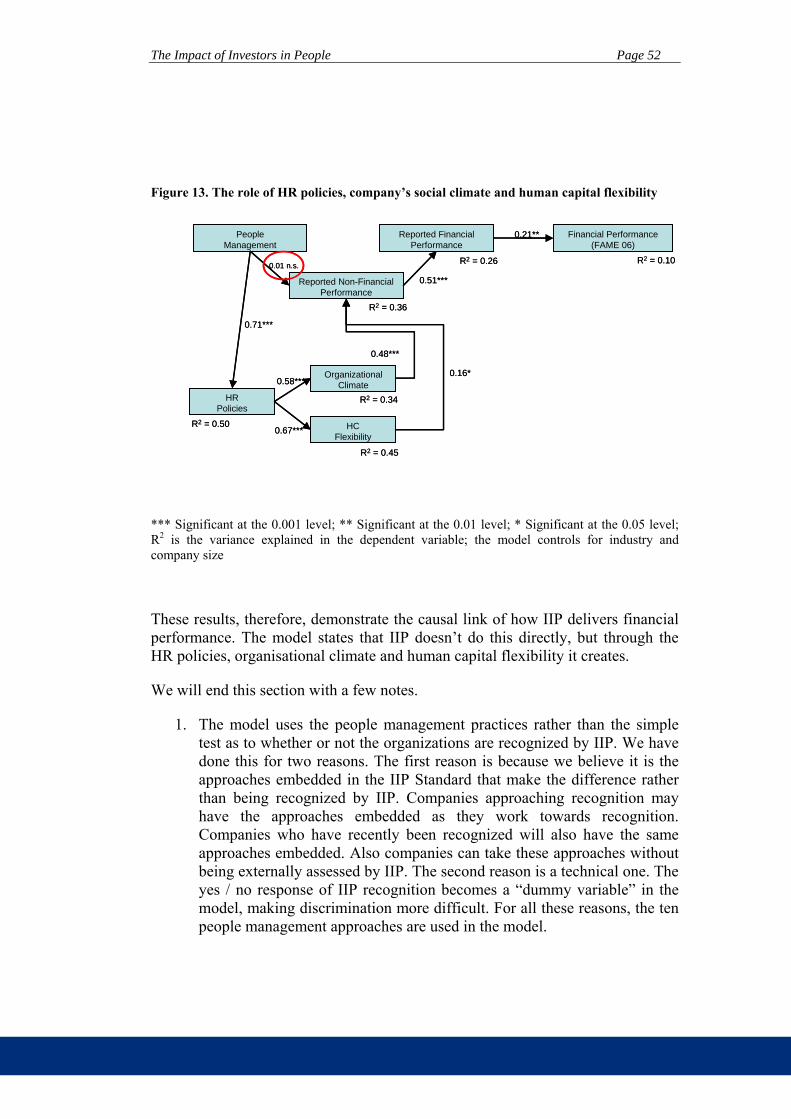
The Impact of Investors in People Page 52
Figure 13. The role of HR policies, company’s social climate and human capital flexibility
Financial Performance(FAME 06)
R2 = 0.10
People Management
Reported FinancialPerformance
0.21**
R2 = 0.26
Reported Non-FinancialPerformance
R2 = 0.36
0.01 n.s.
0.51***
HR Policies
OrganizationalClimate
HCFlexibility
0.71***
0.58***
0.67***
0.48***
0.16*
R2 = 0.34
R2 = 0.45
R2 = 0.50
Financial Performance(FAME 06)
R2 = 0.10
People Management
Reported FinancialPerformance
0.21**
R2 = 0.26
Reported Non-FinancialPerformance
R2 = 0.36
0.01 n.s.
0.51***
HR Policies
OrganizationalClimate
HCFlexibility
0.71***
0.58***
0.67***
0.48***
0.16*
R2 = 0.34
R2 = 0.45
R2 = 0.50
*** Significant at the 0.001 level; ** Significant at the 0.01 level; * Significant at the 0.05 level; R2 is the variance explained in the dependent variable; the model controls for industry and company size
These results, therefore, demonstrate the causal link of how IIP delivers financial performance. The model states that IIP doesn’t do this directly, but through the HR policies, organisational climate and human capital flexibility it creates.
We will end this section with a few notes.
1. The model uses the people management practices rather than the simple test as to whether or not the organizations are recognized by IIP. We have done this for two reasons. The first reason is because we believe it is the approaches embedded in the IIP Standard that make the difference rather than being recognized by IIP. Companies approaching recognition may have the approaches embedded as they work towards recognition. Companies who have recently been recognized will also have the same approaches embedded. Also companies can take these approaches without being externally assessed by IIP. The second reason is a technical one. The yes / no response of IIP recognition becomes a “dummy variable” in the model, making discrimination more difficult. For all these reasons, the ten people management approaches are used in the model.

The Impact of Investors in People Page 53
2. Effective communication practices were identified as being important both in the case studies and in the regression and correlation analysis. If one inspects the Standard in detail, the attributes of effective communication are all well embedded in the Standard and our analysis shows that there is a very high level of correlation between people practices and effective communication. This high level of correlation makes it difficult to extend the model by including effective communication in its own right, but it doesn’t undermine the importance of these attributes.
3. Finally, the model builds on people’s belief about how IIP works, the literature and the case studies. As such it creates a strong body of evidence that these are the mechanisms by which IIP affects business performance.
The Impact of Investors in People Page 54
6 Conclusions
In summary, the purpose of this study was to investigate whether the IIP Standard affects organisational performance positively or not, and to examine the key mechanisms that explain how the IIP Standard affects organisational performance. We conducted a review of the Strategic Human Resource Management and IIP literatures, 10 in depth case studies, and a survey completed by 233 organisations (196 of them being for profit). We developed a theoretical framework suggesting that the IIP Standard affects organisational performance through its impact on HR policies, company social climate and human capital flexibility. We assessed organisational performance in three different ways. First, we looked at how employees reported their company non-financial performance; second, we measured how employees reported their company financial performance; and third, we gathered the accounting financial information presented in company annual reports. Finally, we analysed the data using a range of statistical methods, culminating in structural equation modelling.
We have found that embedding the IIP practices in an organisation does have a positive affect on business performance, both the non-financial performance and the financial performance of the business. However, the impact is not a direct one, and there are a series of mechanisms by which IIP positively affects the performance of the organisation. Figure 14 shows these links. As a result of this study, we had to amend the study’ original framework (figure 1), as although the IIP Standard does have some effect on other aspects of performance, the structural equation model finds that the primary influence is through HR policies as described in figure 14.
This study has built on the previous theory and research found in the Strategic Human Resource Management literature. It confirms that IIP is a commitment based HR policy that delivers the benefits that we would expect from such an approach.
During the case studies we identified the importance of cascading goals and setting direction for employees. The alignment of individuals’ personal objectives with those of the organisation, the feedback provided and understanding of how their effort supports organisational success were all crucial elements and the regression analysis demonstrated how these were important for business performance. However, because of the high level of correlation between the people practices in the IIP Standard and the communication practices we cannot differentiate effectively between the two concepts and introduce this additional element into the final model.
Whilst the IIP indicators do not explicitly mention the word communication, interaction and communication across all levels of the organisation is critical to achieving the IIP Standard. Therefore it is probably not surprising that there is an extremely high level of correlation between the two factors.

The Impact of Investors in People Page 55
Figure 14. How the IIP Standard affects business performance
We would suggest that one area of further research would be to investigate more fully the interaction between goal setting and commitment based HR policies. This research could be interpreted as suggesting that commitment based policies create the employee engagement and social climate of cooperation and collaboration that delivers business performance, and that goal setting directs this effort. It could also be that goal setting in itself is important for creating that commitment, but with the data set we have created, we cannot differentiate between the two suggestions. We also suggested that commitment was more important than direction, but future research would be helpful in investigating this further.
IIP
HR policies
Non-Financial Performance
Human Capital Flexibility
Financial Performance
Organisational Social Climate

The Impact of Investors in People Page 56
References
Alberga, T., Tyson, S. and Parsons, D. (1997), 'An Evaluation of Investors in People Standard', Human Resource Management Journal, Vol. 7, No. 2, pp. 47-60.
Arthur, J. B. (1992), 'The links between business strategy and industrial relations systems in American steel minimills', Industrial and Labor Relations Review, Vol 45, pp. 488-506.
Arthur, J. B. (1994), 'Effects of human resource systems on manufacturing performance and turnover', Academy of Management Journal, Vol. 37, pp. 670-687.
Bhattacharya, M., Gibson, D.E. and Doty, H. (2005), 'The effects of flexibility in employee skills, employee behaviours, and human resource practices on firm performance', Journal of Management, Vol. 31, No. 4, pp. 622-640.
Batt, R. (2002) 'Managing customer services: Human resource practices, quit rates, and sales growth', Academy of Management Journal, Vol. 45, pp. 587-597.
Bell, E., Taylor, S. and Thorpe, R. (2001), 'Investors in People and the Standardization of Professional Knowledge in Personnel Management', Management Learning, Vol. 32, No. 2, pp. 201.
Bell, E., Taylor, S. and Thorpe, R. (2002), 'Organizational Differentiation Through Badging: Investors in People and the Value of the Sign', The Journal of Management Studies, Vol. 39, No. 8, pp. 1071.
Bell, E., Taylor, S. and Thorpe, R. (2002), 'A Step in the Right Direction? Investors in People and the Learning Organization', British Journal of Management, Vol. 13, No. 2, pp. 161.
Berry, C. and Grieves, J. (2003), 'To Change the Way We Do Things Is More Important Than the Certificate on the Wall": Does Investors in People Represent an Effective Intervention Strategy for Organisational Learning?', The Learning Organization, Vol. 10, No. 4/5, pp. 294.
Chatman, J. A., & Flynn, F. J. 2001. The influence of demographic heterogeneity on the emergence and consequences of cooperative norms in work teams. Academy of Management Journal, 44: 956–974.
The Impact of Investors in People Page 57
Collins, J.C. and Smith, K.G. (2006), 'Knowledge Exchange and Combination: The Role of Human Resource Practices in the Performance of High-Technology Firms', Academy of Management Journal, Vol. 49, No. 3, pp. 544-560.
Delery, J. E., & Doty, D. H. 1996. Modes of theorizing in strategic human resource management: Tests of universalistic, contingency, and configurational performance predictions. Academy of Management Journal, 39: 802–835.
Down, S. and Smith, D. (1998), 'It Pays to Be Nice to People Investors in People: the Search for Measurable Benefits', Personnel Review, Vol. 27, No. 2, pp. 143.
Emberson, M. and Winters, J. (2000), 'Investors in People: How a Large Public Sector Organisation in the UK Dealt With a New National Training Initiative', International Journal of Training and Development, Vol. 4, No. 4, pp. 259-271.
Fraser, S. (2003), 'The Impact of Investors in People on Small Business Growth: Who Benefits?', Environment and Planning C: Government and Policy, Vol. 21, pp. 793-812.
Gomez-Mejia, L.R., Tosi, H. and Hinkin, T. (1987), 'Managerial Control, Performance, and Executive Compensation', Academy of Management Journal, Vol. 30, No. 1, pp. 51-70.
Grugulis, I. and Bevitt, S. (2002), 'The Impact of Investors in People: A Case Study of a Hospital Trust', Human Resource Management Journal, Vol. 12, No. 3, pp. 44.
The Hambleden Group (2001), Investors in People: A Practical Tool for Business Growth, Hambleden Group, London,
Hill, R. and Stewart, J. (1999), 'Investors in People in Small Organizations: Learning to Stay the Course?', Journal of European Industrial Training, Vol. 23, No. 6, pp. 286.
Hillage, J. and Moralee, J. (1996), The Return on Investors, Report no. 314, Institute of Employment Studies, London,
Hogg, G., Carter, S. and Dunne, A. (1998), 'Investing in People: Internal Marketing and Corporate Culture', Journal of Marketing Management, Vol. 14, No. 8, Nov., pp. 879.
Hoque, K. (2003), 'All in All, It's Just Another Plaque on the Wall: The Incidence and Impact of the Investors in People Standard', The Journal of Management Studies, Vol. 40, No. 2, pp. 543.

The Impact of Investors in People Page 58
Huselid, M. A. 1996. The impact of human resource management practices on turnover, productivity, and corporate financial performance. Academy of Management Journal, 38: 635–672.
Kaplan, R.S. and Norton, D.P. (1992), 'The Balanced Scorecard - Measures That Drive Performance', Harvard Business Review, Vol. 70, No. 1, Jan-Feb, pp. 71-79.
Kaplan, R.S. and Norton, D.P. (1996), The Balanced Scorecard - Translating Strategy into Action, Harvard Business School Press, US, Boston, Mass.
Kaplan, R. and Norton, D. (2006), Alignment: Using the Balanced Scorecard to Create Corporate Synergies, Harvard Business School Press, Cambridge, MA.
Mason D. (1994): “IIP: journey to continuous development” Health Manpower Management 20(2): 8-12
Mayer, R. C., Davis, J. H., & Schoorman, F. D. 1995. An integrative model of organizational trust. Academy of Management Review, 20: 709–734.
Michaelis, C. and McGuire, M. (2004), Investors in People: Impact Assessment, Databuild: Research and Solutions, Birmingham, UK,
Neely, A.D., Adams, C. and Kennerley, M.P. (2002), The Performance Prism: the Scorecard for Measuring and Managing Business Success, Pearson Education Ltd., London, UK.
O'Neill, M.A. (1996), 'Investing in People: a Perspective from Northern Ireland Tourism - Part I', Managing Service Quality, Vol. 6, No. 4, pp. 36.
Ram, M. (2000), 'Investors in People in Small Firms Case Study Evidence From the Business Services Sector', Personnel Review, Vol. 29, No. 1, pp. 69.
Rousseau, D. M. 1995. Psychological contracts in organizations: Understanding written and unwritten agreements. Thousand Oaks, CA: Sage.
Smith, A.J., Boocock, G., Loan-Clarke, J. and Whittaker, J. (2002), 'IIP and SMEs: Awareness, Benefits and Barriers', Personnel Review, Vol. 31, No. 1/2, pp. 62.
Smith, P.J. (2000), 'Implementing Investors in People: a Case Study From the NHS', Journal of European Industrial Training, Vol. 24, No. 5, pp. 275.
Spilsbury, M., Moralee, J., Hillage, J. and Frost, D. (1995), Evaluation of Investors in People in England and Wales, Report no. 289, Institute for Employment Studies, London,

The Impact of Investors in People Page 59
Tsui, A. S., Pearce, J. L., Porter, L. W. and Hite, J. P. (1995), 'Choice of employee-organization relationship: Influence of external and internal organizational factors', In G. R. Ferris (Ed.), Research in personnel and human resource management, Vol. 13, pp. 117-151. Greenwich, CT: JAI Press.
Watson, T. and Watson, D. (1999), 'Human Resourcing in Practice: Managing Employment Issues in the University.', Journal of Management Studies, Vol. 36, No. 4, Jul, pp. 483.
Weiner, N. and Mahoney, T. (1981), 'A Model of Corporate Performance As a Function of Environmental, Organizational and Leadership Influences', Academy of Management Journal, Vol. 24, pp. 453-470.
Wright, P. M., and Snell, S. A., (1998) 'Toward a unifying framework for exploring fit and flexibility in strategic human resource management' Academy of Management Review, Vol. 23, pp. 756-772.
Youndt, M. A., Snell, S. A., Dean, J. W. and Lepak, D. P. (1996), 'Human resource management, manufacturing strategy, and performance' Academy of Management Journal, Vol. 39, pp. 836-866.

The Impact of Investors in People Page 60
Appendix A: Literature review summary

The Impact of Investors in People Page 61
61
Table 11. Summary of findings from previous studies on the impact of the IIP Standard
Author Year IIP Impact
Key Findings Location Industry Sample Size Data Collection
Data Analysis
Hillage, J.// Moralee, J.
1996 Positive reported financial impact.
They found increased productivity reported by 42% of those employers who identified any improvement since becoming involved with the Standard.
UK Various industries
Smith, Alison Jane//Boocock, Grahame//Loan-Clarke, John//Whittaker, John
2002 Positive non-financial impact.
Two clear benefits from IIP recognition: (1) a clearer link between planning and people development (81%), and (2) training more closely linked to business needs (79%).These two benefits are precisely the issues that IIP is meant to address and are fundamental components of competitiveness. Other benefits: training effectiveness, motivation and employee performance review. Respondents found that hard financial benefits were difficult to quantify.
Midlands Various industries
591 organisations (SMEs)
Survey and interviews
NE
Bell, Emma//Taylor, Scott//Thorpe, Richard
2001 Positive non-financial impact.
IIP is used by HR managers as a career advancement tool. It also helps the HR department to be legitimised within the organisation. The origins of standards of best practice, on which IIP is based, are themselves influenced by a broader socio-political process.
UK Various industries
6 org. (sizes from 60 to 2000 employees)
Case studies/ interviews
Qualitative analysis (NUD*IST)
Hogg, Gililan//Carter, Sara//Dunne, Anne
1998 Positive non-financial impact.
IIP provides a strategic framework for the application of internal marketing techniques. It can also alter the organisational culture but not in isolation.
UK Manufact. 1 firm (236 quest, 87.4% response rate)
Interviews and survey
Qualtiative analysis and descriptive statistics
O'Neill, Martin A.
1996 Positive non-financial impact.
Investors in People is seen as a way of overcoming some of the problems brought about by a lack of training in the Northern Ireland tourism sector.
Northern Ireland
Service (tourism)
NE NE NE

The Impact of Investors in People Page 62
62
Author Year IIP Impact
Key Findings Location Industry Sample Size Data Collection
Data Analysis
Bell, Emma//Taylor, Scott//Thorpe, Richard
2002a Positive non-financial impact
IIP is seen as a brand differentiator. Some companies have adopted IIP to mimic high-profile companies. However, as a greater number of organisations get the IIP badge, it becomes less exclusive to have it and some organisations may decide to opt out of this particular badging process altogether. IIP UK has two choices in order to avoid this to happen: either by specialization or by gradation.
UK Various industries
6 org. (sizes from 60 to 2000 employees) and other IIP stakeholders
77 interviews Qualitative analysis (NUD*IST)
Smith, Paul J. 2000 Positive non-financial impact
IIP recognition has led to a number of benefits for the NHS trust: (1) achieving key aims of the NHS trust's business strategy, and (2) starting to change the culture as employees recognised the importance the trust placed on developing them in line with organisational objectives.
UK Public Sector (NHS trust hospital)
1 org (no. of interviews not reported)
Case study/ Interviews
NE
Alberga, Trixy// Tyson, Shaun// Parsons, David
1997 Positive non-financial and reported financial impact.
IIP is reported to have a positive impact on organisational performance. There is also a strong influence by the IIP process on employer behaviour in respect of Human Resources Development. The study also reports strengths and weaknesses of the IIP Standard.
UK Various industries
455 org. (57% response rate)
Survey and interviews
Not explicit
Spilsbury, M.// Moralee, J.// Hillage, J.// Frost, D.
1995 Positive non-financial and reported financial impact
2/3 of organisations involved with IIP had changed their training practices since involvement with IIP, and over 90% of these employers believe that IIP had contributed to this change. 57% of IIP organisations believed that the initiative had improved the quality of the workforce. In addition, 2/3 who have experienced a change in business performance stated that IIP had contributed positively to that change. With those not noting a change believing that IIP would probably make a positive contribution in the future.
England and Wales
Various industries
1136 org. Survey Not specified

The Impact of Investors in People Page 63
63
Author Year IIP Impact
Key Findings Location Industry Sample Size Data Collection
Data Analysis
Michaelis, Charles// McGuire, Michelle
2004 Positive financial impact.
(1) Organisational changes made by IIP recognised organisations are twice as profitable as changes made by other companies. They increased profit by 7.16% of sales or £505 per employee per year, as opposed to 3.78% of sales or £197 per employee per year for other companies. This profit gap per employee, per year can be attributed to the IIP Standard. (2) By size of organisation, profit attributed to working with IIP is: Small org. £303 per employee per year, Medium org. £602 per employee per year, and Large org. £41 per employee per year. (3) Extrapolating these results, increased profit of around £756 million in IIP organisations can be attributable to IIP. (4) Finally, 94 % of IIP org. saw value in continuing to work with IIP.
UK Various industries
1600 org. Telephone survey
Descriptive statistics and other unclear statistical analysis.
The Hambleden Group
2001 Positive financial impact.
(1) IIP firms with over 200 employees were found to perform above the median for their size of company against most non-IIP companies, even before recognition; (2) IIP companies with 50-199 employees were underperforming against the median of non-IIP companies before recognition; (3) All IIP companies were performing above the median for their size of company after recognition. Furthermore, IIP seems to help medium-size companies to grow faster.
UK Various industries
1143 org. Archival data Basic statistical analysis (medians)
Hill, Rosemary//Stewart, Jim
1999 Negative reported non-financial impact.
Resistance to IIP in SMEs focuses on: issues involving time, money and resource; fear of unnecessary formality and bureaucracy; lack of clarity about the essential nature of IIP; and confusion and uncertainty about the value of IIP to small organisations. At a more profound level, resistance to IIP in SMEs was seen to be the product of a complex set of issues and influences that exist within the environments both internal and external to the organisations.
North West England
Various industries
68 org. (19.4 response rate) and 23 interviews
Survey and interviews
Descriptive statistics
Bell, Emma//Taylor,
2002b Negative non-financial impact.
IIP has the potential to inhibit organisational learning UK Various industries
6 org (sizes from 60 to 2000
In-depth interviews (5
Qualitative analysis

The Impact of Investors in People Page 64
64
Author Year IIP Impact
Key Findings Location Industry Sample Size Data Collection
Data Analysis
Scott//Thorpe, Richard
(service and manufact.)
employees) interviews in each org.)
(NUD*IST)
Ram, Monder 2000 Negative non-financial impact.
IIP was reported as irrelevant and inappropriate for their context (SMEs). Consequently it was viewed as little more that an administrative requirement for marketing purposes (i.e. for improving customer relations) rather than an important contributor to organisational performance.
West Midlands
Service (consulting)
3 org. (SMEs) Interviews (face-to-face)
NE
Watson, Tony//Watson, Diane
1999 Negative non-financial impact.
They found potential drawbacks of the adoption of IIP in universities due to the processes and systems that the IIP requires (e.g. performance evaluation).
UK Education 2 universities Participant observation and interviews
Qualitative analysis
Grugulis, Irena//Bevitt, Sheena
2002 Negative non-financial impact
(1) IIP does not necessarily increase either employee skill levels or training. (2) Staff valued the trust and appreciated good management but saw the internal marketing documents as unhelpful and meaningless. (3) The formality of IIP made it rather inflexible.
North West England
Public sector 1 org. - 124 resp. to survey (45% response rate) and 30 interviews
Interviews and survey
Descriptive statistics and qualitative analyses
Down, Simon//Smith, David
1998 Mixed reported financial impact and ositive non-financial impact.
The organisations that were recognised were those with least to change and therefore arguably least to gain. Even so the majority of these organisations (eight out of ten) have gained significant business benefits (improved training, communication and employee responsibility; reduced labour costs; increase innovation; reported improvement of competitive advantage; good branding). Organisations with the most to gain from IIP in terms of business benefits are less likely to take up the Standard.
South West of Britain
Various industries (including public sector)
10 org. Interviews NE

The Impact of Investors in People Page 65
65
Author Year IIP Impact
Key Findings Location Industry Sample Size Data Collection
Data Analysis
Emberson, M.// Winters, J.
2000 Mixed non-financial impact.
IIP is not a panacea and is no substitute for good management yet it provides a valuable discipline and framework for managers to use. It provides a useful national Standard against which organisations can benchmark themselves. In certain situations, in certain organisations, and in certain spheres IIP has value as a change agent.
UK Public sector 1 org. and 11 interviews
Interviews Not explicit
Hoque, Kim 2003 Mixed non-financial impact.
The results demonstrate considerable variation between different types of workplace with regard to the likelihood of recognition having been secured. They also demonstrate that, on average, training practice is better in recognised workplaces than in non-recognised workplaces, but a large minority of recognised workplaces are failing to engage in good practice. Among workplaces that have recognition, smaller workplaces stand out in particular as failing to engage in good training practice.
UK Various industries
1727 org. and 19,179 employees
Survey WERS (1998)
Multivariate statistical analyses
Berry, Carolyn//Grieves, Jim
2003 Mixed non-financial and reported financial impact.
The highest benefit of IIP seems to be the improvement of communication (85%) and focus on training and development (65%) ; the lowest is the reported improvement of performance (28%). Problems regarding the implementation of IIP: It was seen as a very time-consuming task. In addition, IIP seems to contribute to the process of organisational learning. As an intervention strategy it is able to deliver learning transfer. However, its ability to develop learning capability appears to be limited by its modus operandi.
UK Public sector (local authorities)
120 org. Postal survey Descriptive statistics
Fraser, S. 2003 Mixed financial impact.
Businesses that choose IIP achieve enhanced growth as a result of their investments. In contrast, the impact for an 'average' small firm is neutral.
UK Various industries

The Impact of Investors in People Page 66
Appendix B: Case study protocol

The Impact of Investors in People Page 67
Information included in this protocol
Key informants to be interviewed
Interview structure
Interview questions - Chief Executives
Interview questions - HR Director
Interview questions - Managers
Interview questions - Employees
Definitions
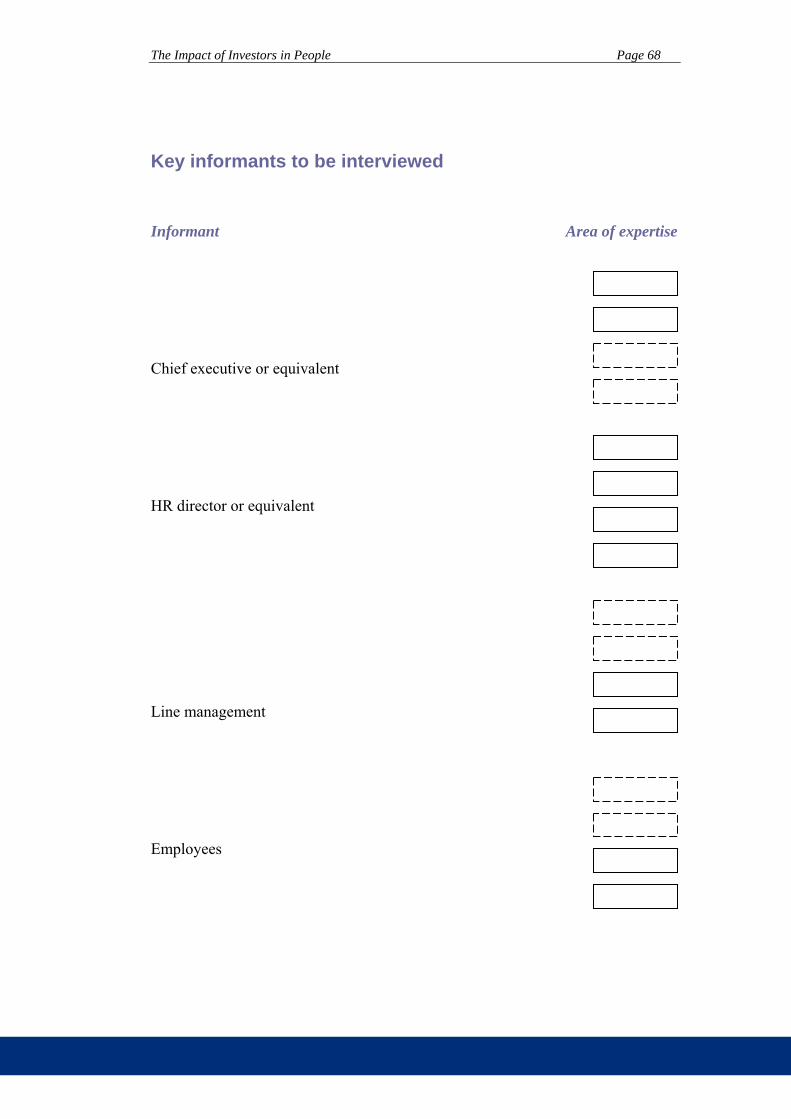
The Impact of Investors in People Page 68
Key informants to be interviewed
Informant Area of expertise
Chief executive or equivalent
HR director or equivalent
Line management
Employees

The Impact of Investors in People Page 69
Interview structure
The interview structure will be as follows:
5. Obtain pertinent information prior to the visit
6. Obtain basis organisation information from the information provided or initial interview
7. Start with the senior people and work down the organisation. The suggested interview order should be:
HR director or equivalent Chief Executive or equivalent Line managers Employees or first line supervisors
8. Each interview structure should contain
Opening explanation Opening questions Follow on questions Prompt questions Reasons for the policies, programmes and practices not being mention earlier.
9. The opening question should establish if the organisation has policies, programmes and practices. The follow on questions should focus on the policies, programmes and practices identified using the company’s own terminology
10. The prompt questions should investigate if there are policies, programmes and practices that have not been mentioned. We also need to understand why these were not mentioned un-prompted.
11. Evidence should be gathered. We don’t necessarily want to take away copies of the evidence, but it would be useful to have seen the evidence cited in response to our questions. We must record the type of evidence seen.
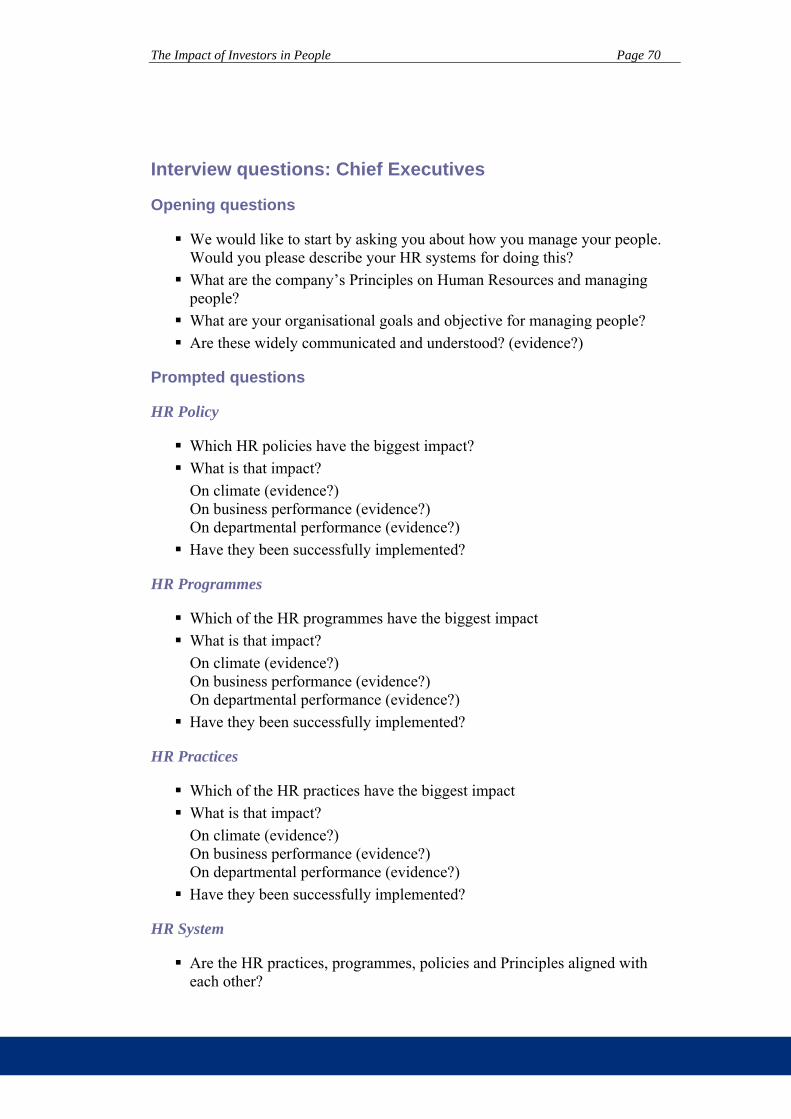
The Impact of Investors in People Page 70
Interview questions: Chief Executives
Opening questions
We would like to start by asking you about how you manage your people. Would you please describe your HR systems for doing this?
What are the company’s Principles on Human Resources and managing people?
What are your organisational goals and objective for managing people? Are these widely communicated and understood? (evidence?)
Prompted questions
HR Policy
Which HR policies have the biggest impact? What is that impact? On climate (evidence?) On business performance (evidence?) On departmental performance (evidence?)
Have they been successfully implemented?
HR Programmes
Which of the HR programmes have the biggest impact What is that impact? On climate (evidence?) On business performance (evidence?) On departmental performance (evidence?)
Have they been successfully implemented?
HR Practices
Which of the HR practices have the biggest impact What is that impact? On climate (evidence?) On business performance (evidence?) On departmental performance (evidence?)
Have they been successfully implemented?
HR System
Are the HR practices, programmes, policies and Principles aligned with each other?

The Impact of Investors in People Page 71
Do they support the delivery of the organisational goals? If so, in what way? (evidence?) If not, what are the dysfunctional consequences? (evidence?)
Implementing IIP
Why did you adopt IIP? How exactly did you go about implementing the IIP Standards What actions did you take? What changes did you make? Did adopting IIP change your idea of what the Standard was?

The Impact of Investors in People Page 72
Interview questions: HR Director
Opening questions
We would like to start by asking you about how you manage your people. Would you please describe your HR systems for doing this?
What are the company’s Principles on Human Resources and managing people?
What are your organisational goals and objective for managing people? Are these widely communicated and understood? (evidence?)
Prompted questions
HR Policy
Which HR policies have the biggest impact? What is that impact? On climate (evidence?) On business performance (evidence?) On departmental performance (evidence?)
Have they been successfully implemented?
HR Programmes
Which of the HR programmes have the biggest impact What is that impact? On climate (evidence?) On business performance (evidence?) On departmental performance (evidence?)
Have they been successfully implemented?
HR Practices
Which of the HR practices have the biggest impact What is that impact? On climate (evidence?) On business performance (evidence?) On departmental performance (evidence?)
Have they been successfully implemented?
HR System
Are the HR practices, programmes, policies and Principles aligned with each other?

The Impact of Investors in People Page 73
Do they support the delivery of the organisational goals? If so, in what way? (evidence?) If not, what are the dysfunctional consequences? (evidence?)
Implementing IIP
Why did you adopt IIP? How exactly did you go about implementing the IIP Standards? What actions did you take? What changes did you make? Did adopting IIP change your idea of what the Standard was?

The Impact of Investors in People Page 74
Interview questions: Managers
Opening questions
We would like to start by asking you about how you manage your people. Would you please describe your HR systems for doing this?
What are the company’s Principles on Human Resources and managing people?
What are your organisational goals and objective for managing people? Are these widely communicated and understood? (evidence?)
Prompted questions
HR Policy
Which HR policies have the biggest impact? What is that impact? On climate (evidence?) On business performance (evidence?) On departmental performance (evidence?)
Have they been successfully implemented?
HR Programmes
Which of the HR programmes have the biggest impact What is that impact? On climate (evidence?) On business performance (evidence?) On departmental performance (evidence?)
Have they been successfully implemented?
HR Practices
Which of the HR practices have the biggest impact What is that impact? On climate (evidence?) On business performance (evidence?) On departmental performance (evidence?)
Have they been successfully implemented?
HR System
Are the HR practices, programmes, policies and Principles aligned with each other?

The Impact of Investors in People Page 75
Do they support the delivery of the organisational goals? If so, in what way? (evidence?) If not, what are the dysfunctional consequences? (evidence?)
Implementing IIP
Are you aware of IIP? How exactly did implementing the IIP Standard impact on you? What actions did you take? What changes did you make? Did adopting IIP change your idea of what the Standard was?

The Impact of Investors in People Page 76
Interview questions: Employees
Opening questions
We would like to start by asking you about how the organisation manages its people. Would you please describe the HR systems you are aware of for doing this?
Do you know what the company’s Principles are on Human Resources and managing people?
Do you know what the organisational goals and objective are for managing people?
Are these widely communicated and understood? (evidence?)
Prompted questions
HR Policy
Are you aware of many of the HR policies? Which HR policies have the biggest impact? What is that impact? On climate (evidence?) On business performance (evidence?) On departmental performance (evidence?)
Have they been successfully implemented?
HR Programmes
Are you aware of many of the HR Programmes? Which of the HR programmes have the biggest impact What is that impact? On climate (evidence?) On business performance (evidence?) On departmental performance (evidence?)
Have they been successfully implemented?
HR Practices
Are you aware of many of the HR Practices? Which of the HR practices have the biggest impact What is that impact? On climate (evidence?) On business performance (evidence?) On departmental performance (evidence?)
Have they been successfully implemented?

The Impact of Investors in People Page 77
HR System
Do the HR practices, programmes, policies and principles appeared to be aligned with each other?
Do they support the delivery of the organisational goals? If so, in what way? (evidence?) If not, what are the dysfunctional consequences? (evidence?)
Implementing IIP
Are you aware of IIP? How exactly did implementing the IIP Standard impact on you? What actions did you take? What changes did you make? Did adopting IIP change your idea of what the Standard was?
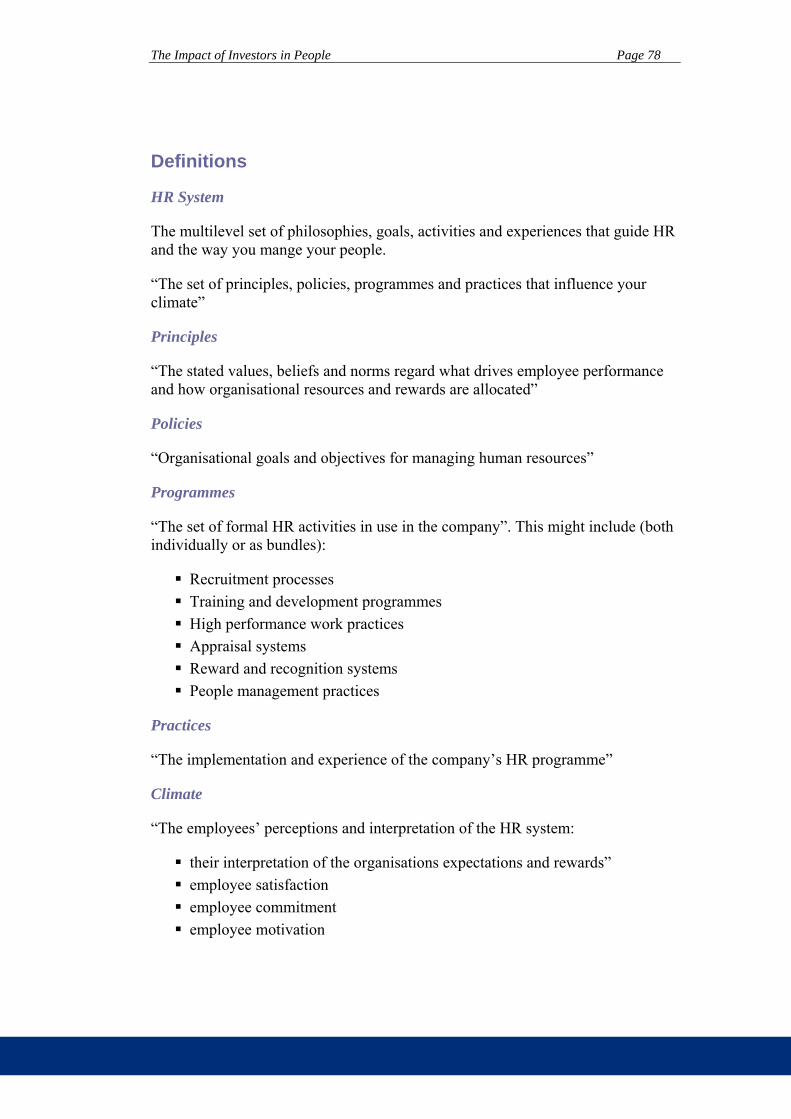
The Impact of Investors in People Page 78
Definitions
HR System
The multilevel set of philosophies, goals, activities and experiences that guide HR and the way you mange your people.
“The set of principles, policies, programmes and practices that influence your climate”
Principles
“The stated values, beliefs and norms regard what drives employee performance and how organisational resources and rewards are allocated”
Policies
“Organisational goals and objectives for managing human resources”
Programmes
“The set of formal HR activities in use in the company”. This might include (both individually or as bundles):
Recruitment processes Training and development programmes High performance work practices Appraisal systems Reward and recognition systems People management practices
Practices
“The implementation and experience of the company’s HR programme”
Climate
“The employees’ perceptions and interpretation of the HR system:
their interpretation of the organisations expectations and rewards” employee satisfaction employee commitment employee motivation

The Impact of Investors in People Page 79
Appendix C: Case Studies

The Impact of Investors in People Page 80
7 Examples of good practice
In this section we will briefly describe some of the many examples of good practice that we encountered during this study.
One page Plan (SC)
The one page plan is a document that links the mission, vision and values of the organisations; through the company’s key performance indicators to the individual’s own personal goals. The document contains all the information needed about what the company is trying to achieve and how the individual contributes to this success on one piece of A4 paper.
The one page plan is an excellent example of how to communicate objectives, provide feedback on what is being achieved and communicate how achievement of the personal goals contributes to achieving the organisation’s goals.
HR policy review team (MN)
The company has a review team selected from across the organisation, by levels and department. Before rolling out a new policy or making a major communication to all the staff, this team reviews the proposed changes and gives their reactions. This provides the company with a sounding board for new changes and announcements. The team is listened to and communication and policies are revised as a result.
This practice gives the company invaluable feedback and greatly improved employer – employee communications.
Managing director’s staff forum (LU)
Regular staff forums are run with the managing director to raise staff issues. Staff representatives attend from across the business. To facilitate the conversation, the staff raise their issues by writing on “post-it” notes. These are then taken by the HR facilitator and grouped together by theme on a board. The managing director then walks round the board and he addresses each theme in turn.
This approach has a number of benefits. Firstly, the “post-it” notes protect the identity of the individual. Secondly, grouping the “post-its” by issue provides a clear indication to the staff and the managing director of the relative weight and importance of each of the issues. Finally, the grouping activity gives the managing director just a little time to consider before he responds. Another excellent and simple example of how dialogue and communication can be improved.
Business Model (LC)
This company has identified that employee commitment leads to better customer satisfaction and business performance. Using survey data and data from the

The Impact of Investors in People Page 81
organisation’s performance measures, the links have been statistically tested so that a robust model exists to link employee behaviours to business results.
The model is used to direct management action. Knowing that longer service leads to greater employee commitment has led the company to focus on staff retention. Other people-focused initiatives can then be related to the model and used to justify expenditure on specific staff initiatives by providing an indication of the likely improvements that will occur.
Team Bonus (MC)
This company had an issue with customer service failures. These cost the company money through sending replacement product or credit notes as well as undermining customer satisfaction. The bonus scheme was deliberately targeted at solving this problem by putting the whole of the previous year’s costs in a pot to be shared by all the staff if the costs didn’t re-occur. Each month, the company reported the size of the pot remaining, after the service failure costs for the month had been deducted. At the end of the year the remaining pot was shared, as a bonus, between all the employees.
The company saw the customer service failures as a team issue. Using this approach the whole of the company was focused on reducing the cost of service errors, whilst the company was getting the benefit of better customer service at no additional cost.
Measuring team morale (SC)
Most companies do this with an annual or bi-annual survey. In this company the measure is taken weekly and acted upon very quickly if morale falls below a high threshold.
Team morale is known to be a reliable indicator of employee commitment and future staff turnover. Many well managed organisations measure this annually, but the frequent feedback from this approach allowed the company to react much more quickly.
Change management (LN)
This organisation delivered change through a sophisticated project management process. Each major project had a main board sponsor, a project manager and a board comprising all the major stakeholders. Projects involved significant engagement with staff in the change and, in one specific example, their engagement into the redesign of roles and the company structure.
Managing major change is an issue for many companies. The dialogue created by this approach helped facilitate the change. The engagement of the key stakeholders enabled careful monitoring of the project and the board were empowered to take major decisions to ensure the project succeeded.

The Impact of Investors in People Page 82
Speed dating (NM)
Getting members of different departments to have a sandwich lunch with each other so that they understand what they do and how other parts of the company work.
This is another way of communicating and breaking down departmental silos.
Informal recognition (MA)
Many of the companies we visited had a formal recognition system with sophisticated ways of obtaining nominees and choosing the winners. This company took a different approach and empowered managers to informally recognise individual or team hard work. Managers would quietly tap staff on the shoulder and thank them for their efforts and suggest that they took their partners out to dinner at the company’s expense. Alternatively, the company would arrange team dinners or activity evenings for those involved in a special project.
This approach provided staff with recognition for the work they had done. Because it was informal, it engaged the line manager directly in recognising the individual and even required them to make a personal effort to do this. The flexibility and informality of this approach was greatly appreciated by the staff and created considerable commitment and goodwill to the company.
Birthdays (MA)
Everybody gets a bottle of champagne and a box of chocolates sent to their home address! (Are your HR records well enough up to date to let this happen in your organisation?)

The Impact of Investors in People Page 83
Company SC
Company SC is a business services practice employing a handful of people. The company has a considerable local reputation and has acquired a number of awards as a small company and for customer service.
Here we will focus on three elements of good practice that the company uses to good effect.
Goal deployment
The company involves its entire staff in the creation of its strategic direction and the creation of the five-year plan, but it is how this is used and monitored on a day-to-day basis that is important.
The company has created a document called the one page plan.
This plan then ensures that everyone knows exactly what the company is trying to achieve, the specific goals and their progress towards them and how their own individual efforts fits into the larger picture and contributes to the organisations performance.
Feedback
The company uses a number of feedback mechanisms that reinforce its values and promotes performance.
Firstly, there are the normal activities one you would find in many companies, such as the regular weekly meetings where activities and performance are discussed. Secondly, the one page plan is used regularly in reviewing performance. For example, much of the company’s external promotion work is done by email, but the response rates are measured and reviewed on a daily basis to ensure that the messages are being precisely honed to the customers’ needs. By taking a very proactive approach to the feedback, the marketing can be adjusted constantly to ensure that it meets customers’ needs. Thirdly, the team weekly happiness measure is another example of immediate feedback.
The feedback in this organisation works because of two underlying factors – the company has “a no blame culture” and has fully embraced the concept of continuous improvement. This means that the feedback is used to learn and develop the people and the business rather than to apportion blame and the intense and rapid feedback can be quickly assimilated and used to change what the company is doing.

The Impact of Investors in People Page 84
Company MC
Company MC is a smaller manufacturing company employing just over a hundred people producing building materials. It is family owned with one of the family still heavily involved in the business. The company has had its performance recognised many times and boasts a set of awards any organisation would be proud of. The company has a stable and long serving workforce and is growing quickly.
The company is highly process oriented, but values its people and has developed a particularly interesting approach to delivering business performance
Here we will focus on four key inter-relating aspects for delivering business performance that were identified in this case study; the company’s ethos, the goal deployment, the incentive system and the communication system.
Company ethos
It is important to recognise, that being a manufacturing company most people play a part in bigger processes. As the Managing Director put it “it is hard delivering anything on your own here”. This has led to the company ethos of being people- focused and their belief that the team is the unit that delivers business performance. The team were therefore important and instrumental in developing the company’s goals and the incentive system was honed with teams in mind.
Goal deployment
The company had a five-year plan that was updated and discussed each year. As part of the discussion, every employee in the business was involved in the initial SWOT analysis that raised issues that they thought were important for the company and its future. The outcome of the process was a plan and a set of simple goals for each of the business functions. The goals were deployed into the individual objectives through the appraisal system with a reward element attached to achieving specific targets for management and senior staff. However, in addition, the goals were rolled out to he workforce by means for specific weekly and monthly balanced targets and rewards, reinforced by a profit sharing scheme and a bonus based on customer satisfaction.
Incentive system
The incentive system is therefore explicitly designed to build on this team approach and included:
An annual management profit bonus shared by management An annual customer satisfaction bonus shared by all employees Twice yearly management performance bonus A staff attendance bonus

The Impact of Investors in People Page 85
A weekly and monthly operations bonus based on weekly achievement of five different indicators paid to all shop floor staff
Each of these bonuses had been designed to interact with each other to support team working and collective achievement of the business goals. Here we will describe how two of these bonuses achieved the team focus.
Firstly, the customer satisfaction bonus was based on the cost of recompensing the customer for damaged goods, issues on site caused be faults in the product, etc. Each year, a multiple of small but inter-relating factors could conspire to create the customer a problem costing the organisation in the order of £200,000 in credit notes. To focus the team’s attention of this issue, the customer satisfaction bonus was created. A bonus pot, equal to the cost of the credit notes was created at the beginning of the year. Each credit note issued then reduced the amount of the bonus pot available. Finally, at the end of the year, the value of the pot remaining was split between management and employees, creating an incentive to look after the customer. The scheme had the advantage of being cost neutral, as if the company improved on the last year’s target, the cost would be the same, but the customer would benefit from better service.
Secondly, the operators in the factory were incentivised through a team performance bonus. Each week the team had to deliver across five balanced objectives, from housekeeping to meeting output targets. Each time the team met an element of the bonus it was added to the pot paid out at the end of the month. The scheme kept employees focused on what had to be delivered and rewarded teamwork for meeting the goals.
Communications
Supporting the incentive system was a communication process that used multiple channels and approaches to delivering both the company’s message to employees and feedback to management. To list the activities gives some indication of what was involved.
An annual “state of the nation” address by the MD to all employees KPIs and simple objectives cascaded to each department Appraisals for all employees An employee survey Financial performance information distributed to all by Monday morning Weekly feedback on operational goal achievement in team leader meetings Information regularly displayed on the notice board A regular employee newsletter Return to work interviews Monthly welfare committee meetings feeding back issue, with minutes reported each month
Twice annual skills appraisals

The Impact of Investors in People Page 86
In this way the company drew together its ethos, goals, incentives and communications to direct the company and deliver the business performance.

The Impact of Investors in People Page 87
Company LC
Company LC is a major financial services provider employing several thousand people and with a large high street branch network. The company is well managed, develops its people, trains its managers and communicates the goals and objectives of the organisation widely. It also exposes a set of values for dealing with its people and their behaviour in the organisation based on the beliefs of the senior management and the company’s business model.
As one manager put it “It is hard to be a bad manager in this organisation” referring to all the training, development and support mechanisms available, but the company didn’t rely solely on line management to deliver performance.
Here we will focus on three key aspects for delivering business performance that were identified in this case study; the performance management system, the communication system and the company’s business model.
Performance management system
One of the key drivers of performance for this organisation is the performance management system. The goals of the organisation are broken down into 10 key perspectives and these are cascaded to the functions in the business together with the appropriate KPIs.
Performance management of the individual is tightly managed. Besides the annual appraisals, line managers are expected to conduct monthly “one-to-one” meetings and the Standard is that there should be at least ten such meetings a year. The focus is both on the achievement of specific business objectives cascaded from the business plan as well as the employee’s embodiment of the organisation’s values. These values are widely displayed round the organisation and naturally for part of the conversation, but the individual performance and values are reinforced through the recognition system.
The company has a formal recognition system and departments have days each month when they recognise members of staff for displaying the company values, giving exceptional customer service and delivering exceptional results. Senior management are involved in these days promoting the recognition and reward of the employees.
Being a financial services company, there is stringent compliance regulation and basic training has to be completed and documented with performance being regularly scrutinised. But in addition to this process and the line management appraisals and one-to-ones there are two other mechanisms for managing performance. The first is the voluntary quarterly career review meeting, which all employees are entitled to have with their managers. The second is the “skip-level meetings” where once a year each person gets the chance to have an individual meeting with their boss of the boss.

The Impact of Investors in People Page 88
The performance management system is therefore designed to direct individuals towards the organisational goals and recognise and reward them when they do this. The company believes that harnessing discretionary effort is one of the keys to delivering good business performance and the performance measurement system with its formal recognition and reward elements is designed to do just that. Regular one-to-one meetings support this and the career meetings and skip-level meetings ensure that other aspirations or block to progress are not over looked.
Communication
Everybody recognises the importance of communication to employee engagement and motivation. What is not widely understood is the length and degree some organisations go to make this communication happen.
In this company, we have already seen that they have annual appraisals, monthly one-to-ones, career and skip-level meetings. But these are additional to the monthly team meetings that occur, the recognition days and the roadshows given by senior management.
Communication is important for telling people the direction the company is taking and the setting of the KPIs do just this, but it is important that the message is reinforced through the monthly KPI review process. Making the corporate plan simple and rolling it out through roadshows makes senior management visible, and you know that this is all being taken seriously, when re-organisations are planned if individual line managers start to get more direct reports than they can effectively support.
Business Model
One of the key elements of IIP is that organisations seek verification that their people processes and practices are delivering value for the business. Most organisation struggle with this assessment, but this company has built and statistically tested their employee model using survey and performance data.
From this business model and statistical analysis, the company knew that employee commitment increased the longer employees remained with the organisation. They also identified the drivers of commitment and assessed the impact of these drivers on business performance.
Having such a model allows the organisation to focus its efforts on the human aspect of performance that will make a difference. It also allows the company to understand the return on some of its people investments, making them easier to justify.

The Impact of Investors in People Page 89
Company MA
Company MA is involved in the building industry and initially acquired IIP for the very important reason that it believed that the recognition was important to its customers. However, this organisation has developed and has a number of interesting practices that make the company successful. In part these practices have focused on the company processes, but there has been a recent initiative to develop HR practices, partly in response to being reassessed for IIP.
One of the comments made during the visit was that the organisation was surprised that it obtained the IIP Standard. In many respects, many of the approaches you would expect were missing, but the organisation was very people orientated and this is driven primarily through the company’s management style. This we will focus on here.
Management Style
It is always difficult to judge the effectiveness of management when visiting a company as part of a case study, but having a wide access to staff at different levels made it possible to make the observation that “the further down the organisation you went the better they thought the management was”. There were a number of factors that contributed to this.
Firstly, all the managers had a sure touch when handling people and were approachable. The managing director would walk round the offices, know people’s names and talk to them about their work and what was happening to the business. Regional managers dealing with sites made sure that they regularly visited the people on the ground and talked to their direct reports, at least, on a daily basis. In this way everyone was engaged in the business and talked to those making the decisions. This created a faith in the management.
Secondly, the company promoted on merit, which was something that was not seen as happening in their part of this industry. This created a real belief that hard work and talent was recognised.
Thirdly, the company had a very flexible and personalised recognition system. Individuals and teams often worked exceptionally hard for periods when projects happened, but this wasn’t taken for granted. Teams were rewarded with social events where the company would take the whole team out to dinner or to an activity evening. Individuals were rewarded too. The examples given were when individuals were personally and quietly thanked for their efforts and the company arranged for them to take their partners out for dinner at the company’s expense. This approach was greatly valued by the staff and created a high level of commitment to the company.
This can be summed up by the quote “If you approach a manager with a problem here, you will never be told to go away”.

The Impact of Investors in People Page 90
Company MN
Company MN is a consulting firm providing services to a wide range of predominantly blue chip clients.
The company has had a chequered history including a period where the organisation was losing money and staff. The introduction of IIP coincided with a change of management, including a new Managing Director and HR director. Developing a new approach to managing people was an essential part of the turn round of the company as the organisation had to gain commitment and performance with little money to spend on increasing salaries or paying bonuses.
Here we will focus on three key aspects for delivering business performance that were identified in this case study; the communication system, the fun based culture and how people are managed.
Communication
It is often forgotten that communication is a two-way process. In this organisation, the requirement for management to communicate to staff and vice a versa is taken for granted, but the company also promotes communication between the different individuals in the company.
The company runs an annual offsite strategy meeting involving all the staff. This is reinforced by twice yearly communications meetings reporting on progress and emphasising actions that can be taken to hit the company’s goals, quarterly company meetings, a weekly Managing Director’s bulletin and a Friday round up. The Friday round ups are particularly interesting as the managing director or a colleague just gets everyone in the building together on a Friday afternoon to discuss the activities and achievements of the week.
But communication comes back from employees too. HR conducts exit interviews with all leavers, and entry interviews with all employees after an initial period of employment. Recognising that longer service staff might not fit these criteria, long service interviews were introduced. Pre and post training interviews also support the assessment of training but just a further feedback mechanism. Besides the interviews, HR runs a monthly employee conversation rotating through employees so that everyone is involved in a two to three year cycle. A formal employee committee reviews all new policies and announcements providing a sounding board before practices are changed or major announcements made. Inter-staff communication is facilitated through executive job swaps, the sales and marketing director and the main receptionist and other innovative ideas such as “speed dating”.
The success of this communication probably comes down to the fact that it is listened to. The policies committee recommendations do result in changes being made and announcement revised so that they have the desired impact on the rest of the company. As the company and staff have matured, so the benefits package has developed to meet their needs. The initial predominantly younger staff

The Impact of Investors in People Page 91
weren’t interested in pensions, childcare etc. However, as the staff and organisation have aged, changes have been made to offer childcare facilities and deals with local organisations so that staff can buy at a discount. Implementing these policies has taken time and effort, but has been relatively inexpensive in monetary terms. Simply by listening to what their employees valued the company has gained considerable commitment and trust.
Fun based culture
Creating a fun based culture where people work hard and play hard is difficult to do. In this organisation there are a number of formal processes, which have helped, we will outline just two here. The first is the volunteering policy. Staff are given time off during work time to support a local charity of their own choice. The second was a major local support project, where the whole company took a day out from work to support a local school, doing work in terms of re-decorating and tidying up the grounds and premises. There was a whole notice board given to this project showing pictures of the various teams and what they had done and achieved during the day. We didn’t specifically ask how the organisation afforded to do this, but through conversations it emerged that the individuals involved simply gave the company extra time to make sure that the work they were doing was completed on time, all part of the “work hard play hard culture”
How people are managed
The company were investing in management training and development with an 18 month programme for all managers. They supported this with a coaching and mentoring system, but there were two other key factors that were significant.
Firstly, the company’s performance management system was developed to give managers six goals that were related to the bonus scheme. For each manager, three of these goals were specifically staff related. This emphasised the importance of people to the organisation.
Secondly, there was a formal recognition system for employees, the system was specifically designed to ensure that both visible and less visible roles were recognised and relied heavily on staff nomination. The company were also mature enough to let the staff judge the nominations, so previous winners found themselves on the committee judging the next set of nominations.
Many of the company’s HR practices and policies were developed around the belief that people wanted to do well at work and were motivated by success. Providing good communication, recognition and listen to feedback were seen as ways of delivering performance in this business.
The Impact of Investors in People Page 92
Company LN
Company LN is a housing organisation running operations across the UK. The organisation had developed IIP in its subsidiaries but had just rolled IIP out across the organisation.
Given the “care” nature of the business it was a little surprising some of the approaches taken in this organisation. Here we will focus on four aspects; the performance management system, the communications system, training and the change management system.
The Performance Management System
The company had developed a strong performance management system that linked individuals’ personal objectives back to the delivery of the business plan. This was supported by a widely used one-to-one system with regular (4-6 week) review meetings. Appraisals were seen as the opportunity to have quality conversations between employees and their managers but were not centrally controlled or monitored. Having said this, there was evidence that the system was widely used on a regular basis right across the organisation.
Performance management was based around basic capabilities for meeting the Standards and then developing from this position towards further goals. The assumption was that if people weren’t performing, they either needed support or capability building. If this issue persisted, people were moved into new roles, but the organisation acted to remove people from the organisation when there was evidence that poor performance was being caused by the individual not pulling their weight or when a number of different role opportunities had failed. Taking action on poor performing employees was built into the system so action was taken before the situation persisted for too long. Managements’ span of control was monitored to ensure the one-to-one object was realistic and achievable.
Communication
Communication involved cascading the business plan and linking the goals into individual’s personal objectives. This process was helped by staff fora and team meetings being supported through a communication team. A six-monthly management conference was seen as a critical part of the process and identified as a key driver of business performance. Plain English training was used to improve communication, making policies and contracts clear for all to read.
One other innovative aspect of communication in this organisation was a personal blog produced by one of the directors. This dealt with matters as personal as her husband’s heart attack on holiday and the problems this caused in getting the family back to the UK. The blog was seen as an example of the openness and approachability of the senior management team.
The Impact of Investors in People Page 93
Training
The organisation has a good induction programme, a middle management development programme and a reputation for very good access to training and development. However, the company had also realised that there were two important aspects of most training; the technical aspect and the social aspect. As a result training courses were being designing to present the technical aspects on one day - what the law had to say on the subject, the rules and procedures, etc. - and then discuss the social aspects - how the this was to be implemented in the company – on the second day. By splitting the two aspects on the programme, the company found that they managed the education process as well as getting the new material implemented in the organisation.
Change Management
The company had just completed a restructuring project that had looked at the role of site managers across the organisation and restructured and re-organised their roles to improve delivery the business plan and service to the customer. This was a major undertaking requiring over 12 months effort, but the change had been implemented relatively seamlessly.
Part of the success of this project was the way that the organisation implemented change. Part of this was a result of a major consultation exercise, whereby a wide group of people were involved in the discussion of the requirements of the new role, the needs of the customer and how this could be implemented in practice. These conversations ensured that everyone knew what was happening and why. But there was a second important aspect, the way the projects were directed and managed. Each project had a project manager and a project board. The project board was chaired by the project sponsor, a main board director, and included the major project stakeholders. In this way, the company assured that all those directly affected were kept informed of the project progress and consulted on the development, whilst ensuring that mechanisms were in place to take the project forward.

The Impact of Investors in People Page 94
Company LU
Company LU is a well managed and success repair company operating across the UK. The company has never engaged with IIP, but has been involved in other standards and recognition schemes, such as EFQM.
The strength of the management system in this company is that they do a whole raft of people management practices well. They communicate, with senior management being involved deeply in this process but supported by a dedicated communications manager. They have a strong incentive system that has been shown to drive performance amongst the large group of operatives, whilst in the call centre operation, the recognition system is more widely used for managing the business. The recognition system is formal and driven by performance as well as company values, but also has management engagement, which makes it personal. They have an employee survey and have linked measures of engagement with the business drivers, so understand the pre-requisites for success. HR also has a seat on the board and HR initiatives are built into the business planning process.
The company believes that by being people focused and through managing the recognition and reward systems they can increase employee engagement. This will lead to higher profits and lower staff turnover, with the leadership’s role of creating the climate for this to happen.
Creating the climate
Senior management create the climate in this business through a number of activities. There openness is probably best exemplified by the office layout. The head office building is completely open plan, including the desk area used by the directors. Screening provides privacy for individuals to work, but those walking around can see what is happening throughout the building.
Regular conferences and directors’ roadshows improve communication and practices such as the Managing Director’s forum (described under examples of good practice) promote feedback and two-way communication. The management style creates the climate and the employee survey is used to monitor the impact on staff. The company has created a set of values, which are prominently displayed around the workplace, but the values are reinforced through the company’s recognition system
Reward system
The reward system for operatives is based on promoting productivity whilst ensuring good service to the customer. The approach is strongly based on piecework but there are dis-incentives for poor workmanship.
The reward system also applies to managers and to directors. Managers have their bonuses linked to local profitability and customer service and directors have the additional goal of employee engagement.

The Impact of Investors in People Page 95
Recognition system
Within the major call centre operation, there is a strong performance measurement culture. Weekly scorecards and monthly targets are widely used. Recognition is both individual and team based. Individuals are recognised for going the extra mile and for living the corporate values. There is also a team of the month award.
The result of both the recognition and reward systems is that individuals and teams know exactly what is expected of them.
People focused
People focus comes in a variety of forms, but two are worth mentioning here.
Firstly the organisation has developed a significant training centre offering externally recognised qualifications but allow the company to ensure that their staff are adequately trained in their jobs.
Secondly, the organisation recognises that people work for people and not the organisation, so despite the people management systems there is still a strong emphasis on management leadership.

The Impact of Investors in People Page 96
Appendix D: Case Data Summary
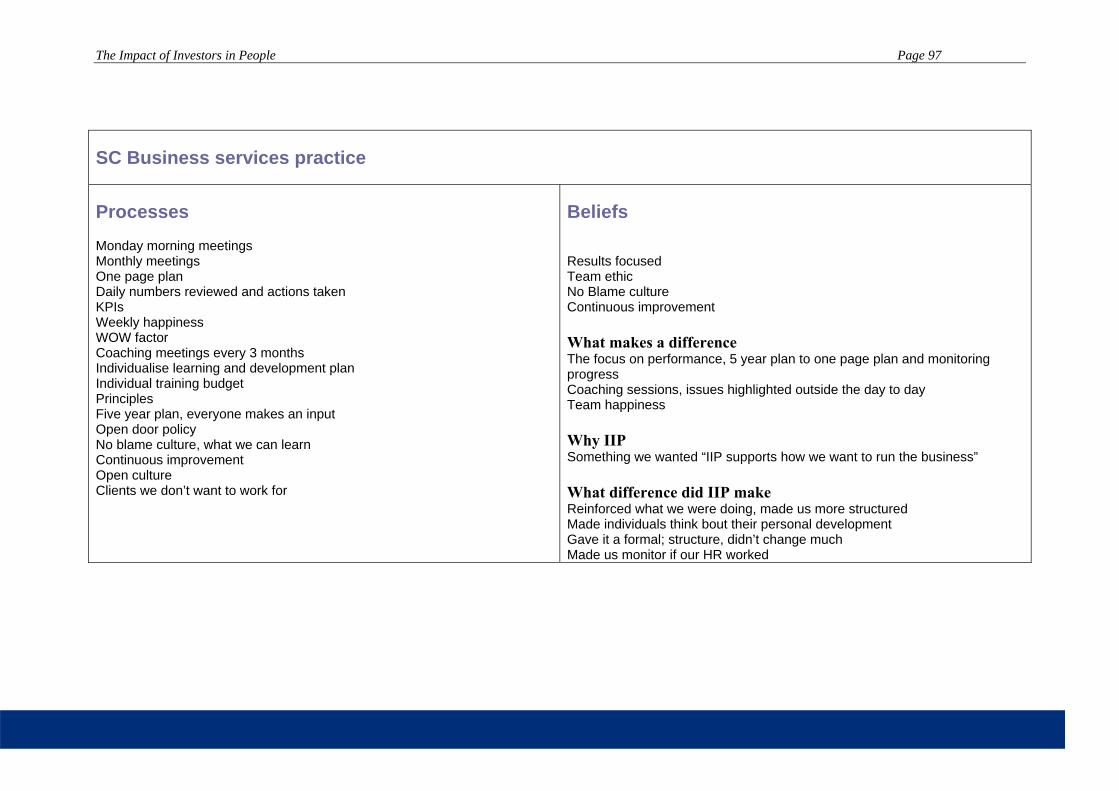
The Impact of Investors in People Page 97
97
SC Business services practice
Processes
Monday morning meetings Monthly meetings One page plan Daily numbers reviewed and actions taken KPIs Weekly happiness WOW factor Coaching meetings every 3 months Individualise learning and development plan Individual training budget Principles Five year plan, everyone makes an input Open door policy No blame culture, what we can learn Continuous improvement Open culture Clients we don’t want to work for
Beliefs
Results focused Team ethic No Blame culture Continuous improvement What makes a difference The focus on performance, 5 year plan to one page plan and monitoring progress Coaching sessions, issues highlighted outside the day to day Team happiness Why IIP Something we wanted “IIP supports how we want to run the business” What difference did IIP make Reinforced what we were doing, made us more structured Made individuals think bout their personal development Gave it a formal; structure, didn’t change much Made us monitor if our HR worked

The Impact of Investors in People Page 98
98
MC Manufacturing
Processes
Take action on poor performing employees Return to work interview Strict disciplinary Communication structure Communication suite, state of the nation, meetings, team brief reports, emails, notice boards, new letter (monthly) welfare committee, suggestion scheme Reviewed the meting structure to improve communications Values Long term relationships, both customer and employees Owner’s man management style and role model Staff survey Pushing responsibility to the team leaders – structured process Wide spread involvement in strategic plan Simple communication of goal and progress in terms employees understand Simple objectives, simply stated and cascaded Incentive systems, profit share, customer pot, meeting key objectives weekly operator, PDRs, attendance, time keeping Proper individual training Twice yearly reviews, skills assessment and pay related Integrated management Process management Learning from being an IIP assessor
Beliefs
“Motivating the team for the team to work together” “Recognition and reward” What makes a difference Motivating the team Communicating objectives and performance Why IIP “Just the right thing to do” Everything is done through people Used IIP profile to learn What difference did IIP make A benchmark, spur for continuous improvement
Comment
People treated fairly

The Impact of Investors in People Page 99
99
LC Financial services
Processes
Values Appraisals One to ones (target 10 out of 12 pa) Skip level individual meetings Compliance, want to see everything Monthly forums Front line incentives (added to salary monthly) Formal reward system incentives, regular Recognition days, awards, star of the month, client nominations, business excellence, service excellence, employee of the month, year Challenging targets Managed span of control to ensure line manages are not overstretched Employee survey, action plan following survey, collective action sign off Formal business model that measures the drivers of commitment and the relationship with employees, customers, financial performance Strategy broken down to KPIs, reviewed monthly, displayed Formal management capability development Salaries benchmarked, pay upper quartile Run road shows 10 point corporate plan cascaded Development modules on desk top Voluntary career guidance
Beliefs
How do we leverage people’s discretionary effort? Values Management development plan, leadership capabilities People commitment builds as they stay with the organisation What makes a difference People and systems People make a difference from the business model Performance agreements Get the right people and retain them, pay upper quartile If we look after our people, they will look after the business Why IIP “to create a sustainable competitive advantage through our people” “Clear strategic vision, I feel engaged, empowered in my job, I get recognised in a timely fashion” Good recruitment tool Useful evaluation tool Pushing it onto their suppliers What difference did IIP make Measured through the “Business Model” project Used as a catalyst for change
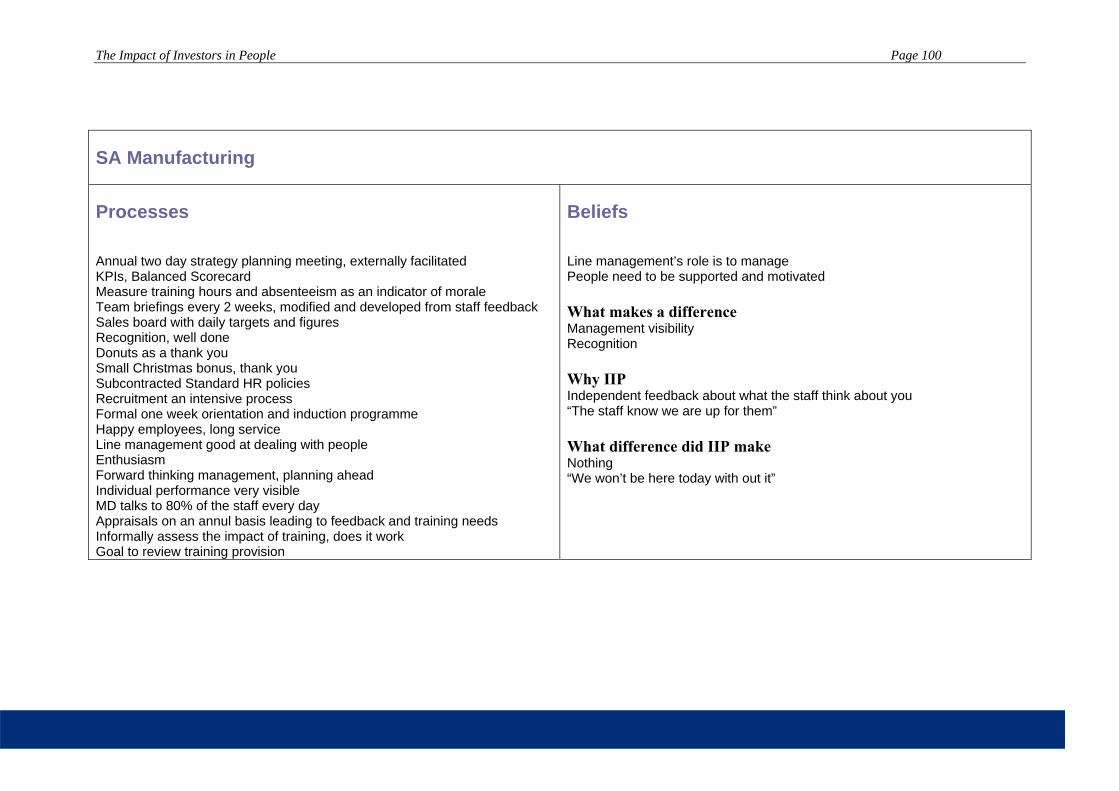
The Impact of Investors in People Page 100
100
SA Manufacturing
Processes
Annual two day strategy planning meeting, externally facilitated KPIs, Balanced Scorecard Measure training hours and absenteeism as an indicator of morale Team briefings every 2 weeks, modified and developed from staff feedback Sales board with daily targets and figures Recognition, well done Donuts as a thank you Small Christmas bonus, thank you Subcontracted Standard HR policies Recruitment an intensive process Formal one week orientation and induction programme Happy employees, long service Line management good at dealing with people Enthusiasm Forward thinking management, planning ahead Individual performance very visible MD talks to 80% of the staff every day Appraisals on an annul basis leading to feedback and training needs Informally assess the impact of training, does it work Goal to review training provision
Beliefs
Line management’s role is to manage People need to be supported and motivated What makes a difference Management visibility Recognition Why IIP Independent feedback about what the staff think about you “The staff know we are up for them” What difference did IIP make Nothing “We won’t be here today with out it”

The Impact of Investors in People Page 101
101
MA Building industry
Processes
Managers lead by example Visible managing director Good man management skills widely distributed across the company Annual bonus on business profit Social activity, reward for effort Individual tailored rewards Personal touch Birthday, everyone gets box of chocolates and champagne from the company PDRs with clear goals every six months Psychological contract (values) Road shows News letters Attitude survey Formally linked HR to business plan Management reporting structured Annual presentation Weekly progress meetings Two weekly team meetings Promotion from within Promote on merit, not on service Reputation as a good employer All basic training done and people developed to cover right down onto site, giving flexibility Recognise the skill in site jobs Management training developing
Beliefs
Two way, responsibilities and company treatment Treat people as individuals Team ethos Open communication, approachability Promoted on merit What makes a difference Good people, mix of youth and experience Recognition Strong cross functional working Why IIP The badge for our customers What difference did IIP make Initially, nothing, very surprised they got it, but a much more rigorous approach being taken to reassessment

The Impact of Investors in People Page 102
102
LA
Processes
Appraisals, copy passes through HR Training scheme started for management skills Professional training, done by function, faculties to ensure training is completed and CPD happens HR advisors scan read the appraisals and pick up issues Staff bonus Staff survey
Beliefs
People are important You can pay people to perform What makes a difference Appraisals Staff bonus Why IIP Wanted to develop our people What difference did IIP make At the time, no internal training, IIP helped develop the people processes
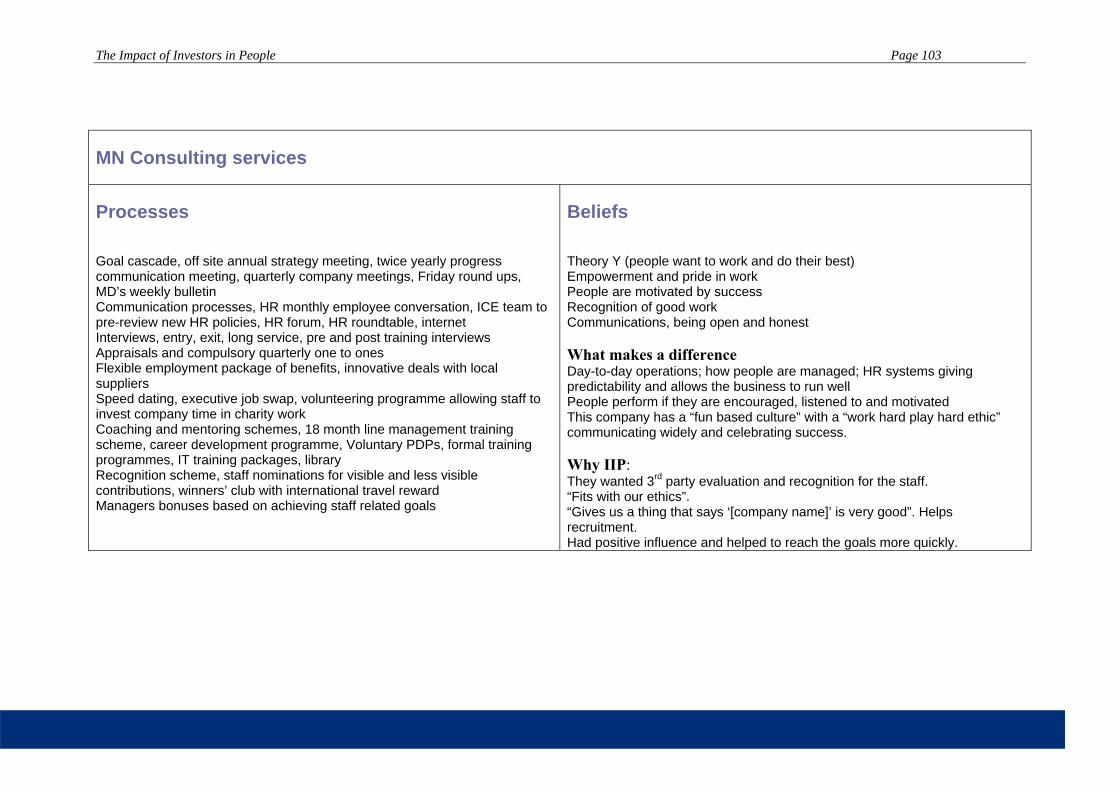
The Impact of Investors in People Page 103
103
MN Consulting services
Processes
Goal cascade, off site annual strategy meeting, twice yearly progress communication meeting, quarterly company meetings, Friday round ups, MD’s weekly bulletin Communication processes, HR monthly employee conversation, ICE team to pre-review new HR policies, HR forum, HR roundtable, internet Interviews, entry, exit, long service, pre and post training interviews Appraisals and compulsory quarterly one to ones Flexible employment package of benefits, innovative deals with local suppliers Speed dating, executive job swap, volunteering programme allowing staff to invest company time in charity work Coaching and mentoring schemes, 18 month line management training scheme, career development programme, Voluntary PDPs, formal training programmes, IT training packages, library Recognition scheme, staff nominations for visible and less visible contributions, winners’ club with international travel reward Managers bonuses based on achieving staff related goals
Beliefs
Theory Y (people want to work and do their best) Empowerment and pride in work People are motivated by success Recognition of good work Communications, being open and honest What makes a difference Day-to-day operations; how people are managed; HR systems giving predictability and allows the business to run well People perform if they are encouraged, listened to and motivated This company has a “fun based culture” with a “work hard play hard ethic” communicating widely and celebrating success. Why IIP: They wanted 3rd party evaluation and recognition for the staff. “Fits with our ethics”. “Gives us a thing that says ‘[company name]’ is very good”. Helps recruitment. Had positive influence and helped to reach the goals more quickly.

The Impact of Investors in People Page 104
104
LN Housing
Processes
“Strong performance management system that links back to the business plan” One to ones every 4 to 6 weeks – trained prior to introduction, use wide spread Appraisals, quality conversations, but not centrally controlled Capabilities process for meeting basic standards Goal setting Mission vision and values Internet Twice a year management conference Training practice, the hard and soft aspects Executive team are a role model, visible and approachable Managed span of control Plain English training for improved communication Bi-annual employee survey CEO IIP commitment Key values, widely communicated and understood Communications through staff forums and team meetings Communication structure and team to communicate Take action on poor performing employees Simple recognition and reward Very good access for employee to training and development Strong IIP internal audit system, reviewers reviewing others areas. Formal disciplinary, grieve procedures Middle management development programme Good induction programme Set of people goals including employer of choice
Beliefs
People centred Supporting people to deliver the service, transparent, fair People strategy for developing people Value conscious, what we will get out of spending money on something What makes a difference The performance management system The management conferences The people centred approach to organisational development through consultation, deep understanding and stakeholder support project teams

The Impact of Investors in People Page 105
105
SU software
Processes
Appraisals done for the first time this year (4 hours each) Action list resulted from the appraisals Monday management meetings Discipline issues Difficulty in measuring individual performance and contribution Technical company so managers tend to communicate by email Internal bit sized inputs of new developments Library of technical books External training programme offered but not taken up The owner won’t grow the company until he knows how to manage the business better.
Beliefs
Motivated people Agreed and recognised targets Celebrating success (but they feel they need to do more of this) What makes a difference Well structure goals and targets so individuals know what is expected of them Why have not engaged with IIP Not on the radar

The Impact of Investors in People Page 106
106
LU Repair services
Processes
Disciplinary and grievance procedures Exit interviews, return to work interviews Very rigorous hiring, internal recruitment and induction processes Specialised training centre for technical staff Refreshing and polishing review programmes “World class call centre” programme Formal coaching system (optional) Career management Appraisals and one to ones Communication of goals and values Values posters on display Values programme widely used Regular conferences for management Directors conducting road shows, managers accessible Internal glossy brochure, dedicated communication manger Conference calls Feedback sessions with MD forum Intranet, the use is measured Team meetings, safety meetings Incentives, recognition dinners, team nights out, “advisor of the month”, weekly scorecards, team of the month, time off bonus, value rewarded and recognised Rewards for operating staff, 20% of pay, incentive culture Managers bonuses based on local profit and customer service Directors bonuses based on profit, customer service, employee engagement Employee survey, measures of engagement and linked to drivers All open plan offices, good working environment seen as a hygiene factor Business planning, integrated HR plan, Scorecard and people measures
Beliefs
A people-focused family business, reward and recognition underpin the company; engagement will lead to higher profit and lower turnover. Leaders create climate for this What makes a difference “everybody knows what’s expected of them” People work for people The pay and recognition system promotes performance Executive team, openness and confidence in senior team Good morale Why not IIP Human resources Director considered IIP too bureaucratic for the benefits it gives.

The Impact of Investors in People Page 107
Appendix E: Study questionnaire

The Impact of Investors in People Page 108

The Impact of Investors in People Page 109

The Impact of Investors in People Page 110

The Impact of Investors in People Page 111

The Impact of Investors in People Page 112

The Impact of Investors in People Page 113
Appendix F: Factor and reliability analysis

The Impact of Investors in People Page 114
Human Resources Policies
In the questionnaire, the Human Resources Policies section comprises:
• Three different measures that aim to assess three key HR policies: Recruitment/selection, rewards and training and development
• A measure of organisational effective communication obtained from the information gathered during the case study research
• A measure that reflects the 10 key indicators included in the IIP Standard framework
The results of the factor analyses (using Varimax rotation) and reliability analyses of these measures are presented in the tables below.
Table 12. Recruitment/Selection policies: results from factor and reliability analysis
Factor 1 Q4. Internal candidates are given consideration over… Q5. We select employees based on an overall fit… .811 Q6. Our selection system focuses on the potential… .822 Q7. We ensure that all employees are made aware… .679
Kaiser-Meyer-Olkin=.599 Eigenvalues 1.822 Cronbach’s alpha .646
Table 13. Reward policies: results from factor and reliability analysis
Factor 1 Q8. Employee bonuses or incentive plans are based… .678 Q9. Salaries for employees are higher than those of… .802 Q10. Shares of stock are available to all employees… Q11. Rewards are designed to ensure equity with peers. .775
Kaiser-Meyer-Olkin=.635 Eigenvalues 1.750 Cronbach’s alpha .589
Table 14. Training and Development policies: results from factor and reliability analysis
Factor 1: Q12. We provide multiple career path opportunities… .646 Q13. We provide training focused on team-building… .719 Q14. We sponsor company social events… .499 Q15. We offer an induction programme that… .562 Q16. We use job rotation to expand the skills… .564 Q17. We have a mentoring system to help develop… .697 Q18. Performance appraisals are used to set goals… .621 Q19. Performance appraisals are used to plan skills… .709
Kaiser-Meyer-Olkin=.813
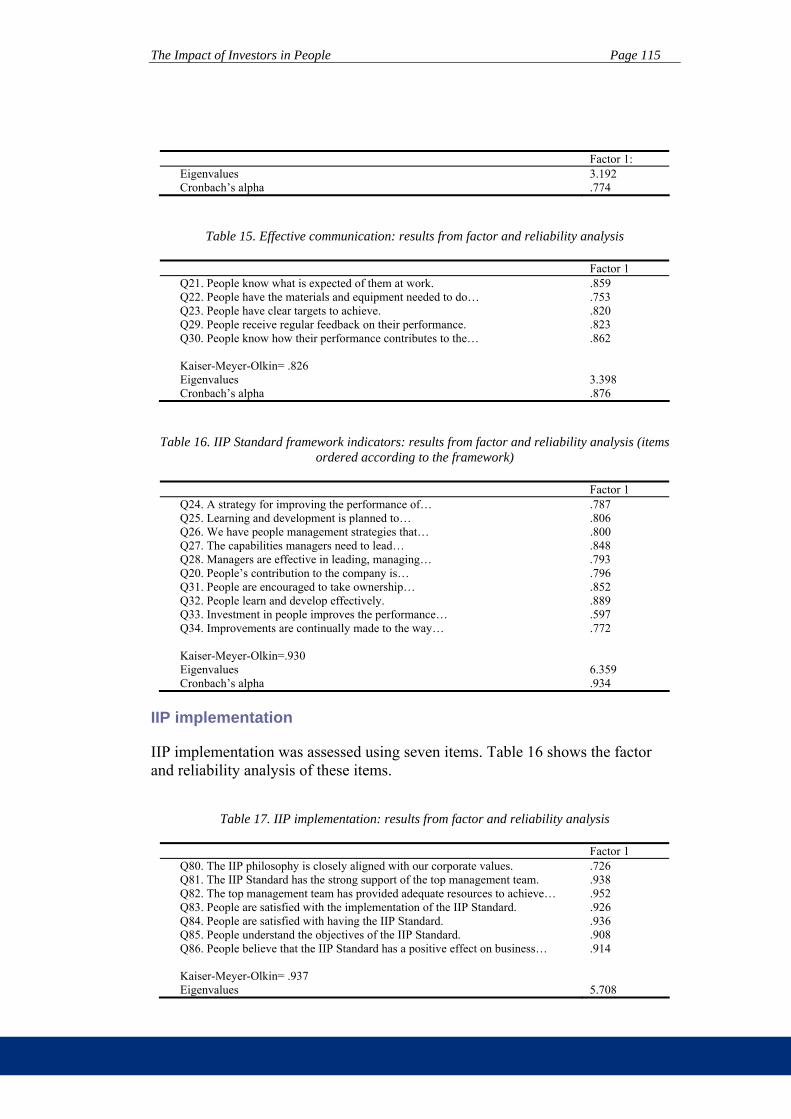
The Impact of Investors in People Page 115
Factor 1: Eigenvalues 3.192 Cronbach’s alpha .774
Table 15. Effective communication: results from factor and reliability analysis
Factor 1 Q21. People know what is expected of them at work. .859 Q22. People have the materials and equipment needed to do… .753 Q23. People have clear targets to achieve. .820 Q29. People receive regular feedback on their performance. .823 Q30. People know how their performance contributes to the… .862
Kaiser-Meyer-Olkin= .826 Eigenvalues 3.398 Cronbach’s alpha .876
Table 16. IIP Standard framework indicators: results from factor and reliability analysis (items ordered according to the framework)
Factor 1 Q24. A strategy for improving the performance of… .787 Q25. Learning and development is planned to… .806 Q26. We have people management strategies that… .800 Q27. The capabilities managers need to lead… .848 Q28. Managers are effective in leading, managing… .793 Q20. People’s contribution to the company is… .796 Q31. People are encouraged to take ownership… .852 Q32. People learn and develop effectively. .889 Q33. Investment in people improves the performance… .597 Q34. Improvements are continually made to the way… .772
Kaiser-Meyer-Olkin=.930 Eigenvalues 6.359 Cronbach’s alpha .934
IIP implementation
IIP implementation was assessed using seven items. Table 16 shows the factor and reliability analysis of these items.
Table 17. IIP implementation: results from factor and reliability analysis
Factor 1 Q80. The IIP philosophy is closely aligned with our corporate values. .726 Q81. The IIP Standard has the strong support of the top management team. .938 Q82. The top management team has provided adequate resources to achieve… .952 Q83. People are satisfied with the implementation of the IIP Standard. .926 Q84. People are satisfied with having the IIP Standard. .936 Q85. People understand the objectives of the IIP Standard. .908 Q86. People believe that the IIP Standard has a positive effect on business… .914
Kaiser-Meyer-Olkin= .937 Eigenvalues 5.708

The Impact of Investors in People Page 116
Factor 1 Cronbach’s alpha .962
Human capital flexibility
In the questionnaire, the Human Capital Flexibility section comprises three measures:
• A measure of employees’ behaviour flexibility
• A measure of skills flexibility
• A measure of human practices flexibility
The tables below present the factor and reliability analysis performed with the items that these measures comprise.
Table 18. Employees’ behaviour flexibility: results from factor and reliability analysis
Factor 1 Q35. People in our company change their work habits in response to changes… .782 Q36. Our employees respond to changing situations within a short time. .880 Q37. People in our company readily change their work habits as demanded… .893 Q38. People in our company are able to change their behaviour in response to… .801
Kaiser-Meyer-Olkin= .789 Eigenvalues 2.824 Cronbach’s alpha .859
Table 19. Skills flexibility: results from factor and reliability analysis
Factor 1 Q39. Our company can shift employees to different jobs when needed. .837 Q40. Our employees are capable of putting new skills to use within a short time. .868 Q41. We employ people with a broad variety of skills. .786 Q42. Many people in our company have multiple skills that are used… .835
Kaiser-Meyer-Olkin= .747 Eigenvalues 2.769 Cronbach’s alpha .848
Table 20. Human practices flexibility: results from factor and reliability analysis
Factor 1 Q43. Flexibility of our HR practices helps us to adjust to the changing demands… .889 Q44. Our HR practices parameters are designed so that they adjust quickly… .911 Q45. We make frequent changes to our HR practices to align the HR system… .832 Q46. Our HR practices adjust meaningfully to changed business situations. .886
Kaiser-Meyer-Olkin= .822 Eigenvalues 3.097 Cronbach’s alpha .900

The Impact of Investors in People Page 117
Company social climate
In this section of the questionnaire three measures were used:
• A measure of trust
• A measure of cooperation
• A measure of commitment
The factor and reliability analysis of these measures are presented in the following tables.
Table 21. Trust: results from factor and reliability analysis
Factor 1 Q47. Our employees feel confident about each others’ skills. .816 Q48. There is a great deal of trust among our employees. .914 Q49. The employees in this company will go out of their way to help each other… .885 Q50. Employees in this company try hard to be fair in their dealings with… .894 Q51. The needs and desires of employees are really taken into account… .791
Kaiser-Meyer-Olkin= .863 Eigenvalues 3.710 Cronbach’s alpha .911
Table 22. Cooperation: results from factor and reliability analysis
Factor 1 Q52. There is high level of cooperation between employees and teams… .895 Q53. There is high level of knowledge sharing between employees… .901 Q54. Employees here are willing to sacrifice their self-interests for the benefit… .874 Q55. In this company it is important to maintain harmony within teams and… .681 Q56. (Reverse coding). In this company there is little collaboration among… .639
Kaiser-Meyer-Olkin= .846 Eigenvalues 3.250 Cronbach’s alpha .853
Table 23. Commitment: results from factor and reliability analysis
Factor 1 Q57. People in this company are willing to put in effort beyond the norm… .787 Q58. People’s values and the company’s values are very similar. .846 Q59. Our employees really care about the fate of this company. .807 Q60. Our employees are proud to work for this company. .929 Q61. Employees here are very loyal to the company. .808 Q62. This company inspires people to perform at their best. .811
Kaiser-Meyer-Olkin= .872 Eigenvalues 4.161 Cronbach’s alpha .910

The Impact of Investors in People Page 118
Reported non-financial performance
This variable was operationalised using three different measures:
• A measure of innovation which included six items.
• A measure of reported non-financial performance which included seven items.
• A measure of employee turnover which included just one item.
The factor and reliability analysis of the first two measures are shown in the tables below.
Table 24. Innovation: results from factor and reliability analysis
This company… Factor 1 Q63. Is innovative in the way services are delivered. .782 Q64. Offers a wide variety of services. .798 Q65. Has a very diverse customer group. .645 Q66. Is innovative in terms of the number of new services offered. .883 Q67. Is innovative in terms of the novelty of new services offered. .852 Q68. Allots a large amount of resources to marketing. .604
Kaiser-Meyer-Olkin= .855 Eigenvalues 3.535 Cronbach’s alpha .846
Table 25. Reported non-financial performance: results from factor and reliability analysis
How would you compare the company’s performance over the last 3 years to that of your competitors in terms of:
Factor 1
Q87. Quality of products or services. .712 Q88. Development of new products or services. Q89. Ability to attract essential employees. .789 Q90. Ability to retain essential employees. .798 Q91. Satisfaction of customers/clients. .775 Q92. Relations between management and other employees. .792 Q93. Relations among employees in general. .777
Kaiser-Meyer-Olkin= .810 Eigenvalues 3.832 Cronbach’s alpha .870
Reported financial performance
This variable was measured using one single measure with four items. The factor and reliability analysis of this measure are presented in the next table.
Table 26. Reported financial performance: results from factor and reliability analysis

The Impact of Investors in People Page 119
How would you compare the company’s performance over the last 3 years to that of your competitors in terms of:
Factor 1
Q94. Turnover .811 Q95. Profitability .907 Q96. Growth in sales .933 Q97. Market share .874
Kaiser-Meyer-Olkin= .830 Eigenvalues 3.114 Cronbach’s alpha .904

The Impact of Investors in People Page 120
Appendix G: Descriptive statistics

The Impact of Investors in People Page 121
Table 27. Descriptive statistics of survey responses1
Quest. N Min Max Mean Std. Dev.
SD (%)
D+ (%)
D- (%)
ND/ NA (%)
A- (%)
A+ (%)
SA (%)
SECTION II. HUMAN RESOURCES POLICIES Recruitment/Selection policies Q004 191 1 7 4.66 1.658 7.85 3.14 7.33 25.65 22.51 19.37 14.14 Q005 196 1 7 5.95 1.322 1.53 2.55 1.02 6.12 16.33 27.55 44.90 Q006 196 1 7 5.58 1.332 1.53 2.04 2.55 12.24 22.96 30.10 28.57 Q007 196 1 7 5.98 1.457 1.02 5.10 2.04 6.12 9.69 24.49 51.53 Reward policies Q008 183 1 7 5.22 2.008 8.20 7.10 6.01 8.74 13.11 16.39 40.44 Q009 167 1 7 4.25 1.582 4.79 11.38 12.57 28.74 17.37 17.96 7.19 Q010 167 1 7 2.04 1.963 70.06 8.98 4.19 2.40 2.40 2.40 9.58 Q011 177 1 7 4.54 1.822 7.91 7.34 13.56 19.21 14.12 22.03 15.82 Training and development policies Q012 194 1 7 4.56 1.660 4.12 8.76 11.86 23.20 22.16 13.92 15.98 Q013 195 1 7 4.86 1.630 2.56 6.15 12.82 20.00 16.92 22.56 18.97 Q014 195 1 7 5.06 1.965 7.69 8.72 5.64 9.74 17.44 17.44 33.33 Q015 196 1 7 6.13 1.306 1.02 2.04 3.06 4.59 11.22 21.94 56.12 Q016 194 1 7 3.82 1.883 13.92 14.95 15.46 19.59 11.86 14.95 9.28 Q017 193 1 7 4.32 1.896 9.84 9.84 15.03 16.06 19.17 12.95 17.10 Q018 194 1 7 5.22 1.687 3.09 6.70 5.67 15.46 17.01 22.68 29.38 Q019 194 1 7 5.59 1.441 1.55 3.61 3.61 11.86 15.46 32.47 31.44 People management Q020 195 1 7 5.77 1.276 0.51 1.54 2.56 13.33 16.41 28.72 36.92 Q021 195 2 7 5.82 1.128 0.00 0.51 4.10 8.21 19.49 35.38 32.31 Q022 195 1 7 6.00 1.005 0.51 0.51 0.51 5.13 18.97 38.97 35.38 Q023 195 2 7 5.67 1.174 0.00 1.54 4.10 8.72 24.62 33.85 27.18 Q024 194 1 7 5.29 1.469 0.52 4.64 9.79 11.34 20.62 29.90 23.20 Q025 194 1 7 5.39 1.497 2.06 4.12 7.22 8.25 20.10 34.02 24.23 Q026 192 1 7 5.51 1.528 2.60 2.60 7.29 9.90 14.58 32.81 30.21 Q027 193 1 7 5.01 1.586 3.11 4.66 11.40 13.99 20.73 28.50 17.62 Q028 195 1 7 4.95 1.415 1.03 5.13 10.26 17.95 24.62 28.72 12.31 Q029 195 1 7 5.24 1.498 2.05 4.10 7.18 14.87 19.49 31.28 21.03 Q030 193 1 7 5.26 1.498 2.07 3.11 8.81 13.99 19.17 30.57 22.28 Q031 193 1 7 5.19 1.544 1.55 5.70 9.84 10.88 19.69 31.61 20.73 Q032 194 1 7 5.30 1.245 1.03 1.55 5.15 16.49 24.74 36.08 14.95 Q033 193 1 7 6.03 1.346 2.07 2.07 1.04 6.74 10.36 29.02 48.70 Q034 193 1 7 5.53 1.369 1.04 3.63 4.15 11.92 15.03 39.90 24.35 SECTION III. HUMAN CAPITAL FLEXIBILITY Employees’ behaviour flexibility Q035 186 1 7 4.85 1.397 2.15 5.38 6.99 21.51 27.42 27.42 9.14 Q036 192 1 7 5.22 1.309 1.04 2.08 8.33 13.54 27.08 32.81 15.10 Q037 186 1 7 5.05 1.302 0.54 3.76 8.06 17.74 29.03 29.03 11.83

The Impact of Investors in People Page 122
Quest. N Min Max Mean Std. Dev.
SD (%)
D+ (%)
D- (%)
ND/ NA (%)
A- (%)
A+ (%)
SA (%)
Q038 191 2 7 5.54 1.186 0.00 1.57 4.71 12.57 21.47 38.22 21.47 Skills flexibility Q039 194 1 7 5.06 1.514 1.55 5.67 12.37 8.25 26.80 28.87 16.49 Q040 195 1 7 5.23 1.228 1.54 2.05 3.59 14.87 33.33 31.79 12.82 Q041 194 1 7 5.46 1.320 2.06 1.55 3.61 11.86 24.23 35.05 21.65 Q042 194 1 7 5.21 1.521 2.06 4.12 9.28 11.86 22.16 28.87 21.65 HR practices flexibility Q043 189 1 7 5.28 1.246 1.59 1.06 3.70 17.99 29.10 30.69 15.87 Q044 188 1 7 5.20 1.283 0.53 2.66 6.91 16.49 28.72 29.26 15.43 Q045 187 1 7 4.94 1.382 1.60 3.74 10.16 17.11 31.02 24.06 12.30 Q046 188 1 7 5.26 1.175 0.53 0.53 6.38 16.49 31.91 29.26 14.89 SECTION IV. COMPANY SOCIAL CLIMATE Trust Q047 191 1 7 5.30 1.152 1.05 1.57 2.62 14.14 36.13 30.89 13.61 Q048 192 1 7 5.33 1.266 1.56 1.56 4.69 12.50 31.25 31.25 17.19 Q049 194 1 7 5.49 1.231 0.52 1.55 4.64 14.43 19.07 39.69 20.10 Q050 193 1 7 5.50 1.204 1.04 1.55 3.63 10.36 25.39 39.38 18.65 Q051 194 1 7 5.35 1.343 1.55 1.55 4.64 17.53 24.23 28.35 22.16 Cooperation Q052 191 1 7 5.30 1.338 1.05 2.62 5.24 16.23 26.70 27.75 20.42 Q053 194 1 7 5.19 1.300 1.03 2.58 6.19 16.49 29.38 28.87 15.46 Q054 189 1 7 4.71 1.327 1.59 5.29 11.64 19.05 31.75 25.93 4.76 Q055 192 1 7 5.72 1.234 0.52 1.04 2.60 13.02 20.83 28.65 33.33 Q056 192 1 7 2.68 1.575 23.96 33.85 18.75 7.81 7.81 5.21 2.60 Commitment Q057 195 1 7 5.61 1.290 2.05 0.51 5.13 5.64 26.67 33.85 26.15 Q058 193 1 7 5.13 1.357 2.07 2.07 7.77 16.06 26.42 32.12 13.47 Q059 194 1 7 5.61 1.288 1.55 1.55 3.09 9.28 24.74 32.47 27.32 Q060 193 1 7 5.63 1.277 1.04 3.11 2.07 7.25 25.39 34.20 26.94 Q061 195 1 7 5.81 1.197 1.03 1.03 2.56 7.18 20.00 35.90 32.31 Q062 195 1 7 5.25 1.325 1.03 4.10 4.10 15.38 25.64 34.36 15.38 SECTION V. BUSINESS STRATEGY Q063 193 1 7 5.40 1.370 1.55 2.07 3.63 16.58 25.91 24.35 25.91 Q064 191 1 7 5.43 1.304 1.57 0.52 4.71 15.18 26.18 27.75 24.08 Q065 193 1 7 5.30 1.592 3.63 3.63 6.22 11.40 23.32 24.35 27.46 Q066 189 1 7 5.03 1.358 1.06 4.23 6.88 21.16 24.87 29.10 12.70 Q067 186 1 7 4.56 1.510 2.15 7.53 15.05 23.66 19.35 23.12 9.14 Q068 191 1 7 4.28 1.721 6.81 12.04 13.09 20.42 18.32 20.42 8.90 Q069 187 1 7 5.90 1.214 0.53 1.07 3.74 6.95 16.58 32.09 39.04 Q070 181 1 7 5.73 1.256 0.55 2.76 2.21 9.39 18.23 36.46 30.39 Q071 164 1 7 4.85 1.946 6.10 12.80 7.32 9.76 19.51 17.07 27.44 Q072 175 1 7 4.39 1.803 5.71 14.86 10.86 17.71 18.29 18.86 13.71 Q073 188 1 7 5.06 1.706 3.19 9.04 7.45 11.70 18.09 28.72 21.81

The Impact of Investors in People Page 123
Quest. N Min Max Mean Std. Dev.
SD (%)
D+ (%)
D- (%)
ND/ NA (%)
A- (%)
A+ (%)
SA (%)
Q074 186 1 7 5.33 1.436 2.69 3.23 4.30 12.90 20.97 36.56 19.35 Q075 182 1 7 5.07 1.547 1.65 7.69 7.14 14.84 20.33 31.32 17.03 Q076 177 1 7 4.63 1.64 3.95 9.04 12.43 15.82 24.86 21.47 12.43 Q077 187 1 7 5.26 1.481 1.60 4.28 9.63 8.56 22.99 32.62 20.32 Q078 174 1 7 5.37 1.563 1.72 4.60 8.62 10.34 17.82 28.16 28.74 SECTION VI. INVESTORS IN PEOPLE Implementation Q080 152 1 7 5.54 1.446 1.97 3.95 3.95 8.55 19.08 34.87 27.63 Q081 148 1 7 5.15 1.946 4.73 12.16 6.08 8.78 11.49 22.30 34.46 Q082 145 1 7 4.98 1.902 6.90 8.97 7.59 11.03 11.03 30.34 24.14 Q083 131 1 7 5.14 1.813 6.11 9.16 2.29 11.45 12.21 35.88 22.90 Q084 132 1 7 5.08 1.91 6.82 9.09 6.06 10.61 7.58 34.09 25.76 Q085 135 1 7 4.99 1.795 7.41 6.67 5.93 11.85 13.33 37.78 17.04 Q086 139 1 7 4.83 1.899 7.91 10.79 5.04 10.79 17.27 28.78 19.42 SECTION VII. COMPANY PERFORMANCE Q087 175 3 7 5.82 0.910 0.00 0.00 1.14 7.43 22.86 45.71 22.86 Q088 174 1 7 5.32 1.254 1.15 2.87 3.45 13.79 27.01 37.36 14.37 Q089 180 1 7 5.13 1.193 1.67 1.67 3.89 17.22 35.00 31.11 9.44 Q090 180 1 7 5.42 1.237 1.11 0.56 5.00 15.00 25.00 33.89 19.44 Q091 178 3 7 5.71 0.994 0.00 0.00 3.37 7.87 24.16 43.82 20.79 Q092 182 1 7 5.45 1.177 0.55 1.65 2.20 18.13 19.78 41.21 16.48 Q093 181 1 7 5.55 1.067 0.55 1.10 1.10 12.71 24.86 43.65 16.02 Q094 171 1 7 5.09 1.434 1.17 5.85 6.43 18.13 20.47 33.92 14.04 Q095 168 1 7 5.12 1.432 1.19 4.76 8.33 15.48 22.02 32.74 15.48 Q096 167 1 7 5.20 1.386 1.20 4.19 5.39 16.77 24.55 30.54 17.37 Q097 157 1 7 5.06 1.438 2.55 3.18 5.73 22.93 21.02 29.30 15.29 1 SD: Strongly disagree; D+: Disagree +; D-: Disagree -; ND/NA: Neither Disagree/Neither Agree; A-: Agree -; A+: Agree +; SA: Strongly Agree.
Table 28. Descriptive statistics of employee turnover (extracted from survey) and other financial indicators (extracted from FAME)
Quest./Variable N Min Max Mean Std. Dev. Q098 Employee turnover 126 .00 46.00 12.6410 9.87303 Turnover th GBP 2006 98 165 8588100 257153.051 988583.316Return on Total Assets (%) 2006
122 -157 338.97 7.062 37.606
Profit Margin (%) 2006 94 -44.94 77.32 4.963 13.344 Number of Employees 2006 108 14.00 75871.00 1826.3241 8013.21675Profit per Employee (Unit) GBP 2006
107 -86347 1200850 23542.505 126668.047

The Impact of Investors in People Page 124
Appendix H: Effective communication

The Impact of Investors in People Page 125
Table 29. Results of regression analysis: The relationship among the IIP Standard, effective communication and financial firm performance
Effective communication
Accounting financial performance Dependent variables (Y) →
ROA Profit Margin Profit per employee
β values → Predictors (X)
β SE β SE β SE β SE
Constant (α) 5.61*** .22 2.203*** .013 1.663*** .034 4.950*** .015 Org. size (β1) -.19* .09 .002 .003 .014* .007 .000 .003 Industry_Man (β2) -.07 .16 .000 .004 -.010 .013 .000 .005 IIP recognition (β3) .79*** .14 Effective communication (β4)
.003 .002 .008 Ŧ .005 .004 Ŧ .002
R2= .20 .02 .07 .05 Adj. R2= .18 -.01 .04 .01 F= 15.43*** .73 2.12 Ŧ 1.202 N= 189 104 87 81
*** Significant at the 0.001 level ** Significant at the 0.01 level * Significant at the 0.05 level Ŧ Significant at the 0.10 level
The Impact of Investors in People Page 126
Appendix I: Correlation analysis between people management and organisational performance
indicators

The Impact of Investors in People Page 127
127
Table 30. Results of correlation analysis – Relationships between people management and organisational performance indicators
1 2 3 4 5 6 7 8 9 10 11 12 13 14 15 16 17 18 19 20 21 22
1. Q020
2. Q021 .656**
3. Q022 .518** .605**
4. Q023 .558** .648** .599**
5. Q024 .603** .653** .408** .633**
6. Q025 .563** .630** .422** .579** .726**
7. Q026 .624** .557** .407** .484** .576** .623**
8. Q027 .595** .583** .386** .502** .652** .627** .715**
9. Q028 .579** .550** .511** .503** .601** .582** .540** .709**
10. Q029 .613** .605** .449** .517** .632** .583** .637** .701** .730**
11. Q030 .700** .656** .484** .602** .718** .664** .613** .679** .738** .786**
12. Q031 .645** .557** .367** .427** .614** .613** .655** .644** .618** .712** .723**
13. Q032 .686** .615** .477** .534** .644** .678** .721** .737** .691** .710** .736** .763**
14. Q033 .486** .455** .318** .245** .320** .425** .416** .464** .387** .411** .421** .468** .515**
15. Q034 .591** .505** .322** .461** .552** .606** .496** .598** .606** .626** .648** .639** .614** .454**
16. Non-fin performance
.573** .529** .443** .529** .541** .487** .519** .559** .602** .565** .607** .568** .640** .302** .463**
17. Innovation .357** .277** .236** .309** .280** .208** .306** .288** .245** .272** .341** .297** .346** .187* .280** .431**
18. Employee turnover -.062 -.032 -.092 -.040 -.115 -.027 .045 .001 .013 .014 -.112 -.033 -.072 -.058 -.033 -.104 .087
19. Business goals achievement
.344** .246** .269** .308** .321** .257** .202** .204** .343** .331** .408** .255** .326** .217** .325** .465** .445** .021
20. Fin performance: .254** .203* .272** .281** .264** .185* .166* .060 .168* .196* .246** .181* .243** .063 .115 .459** .319** .010 .596**
21. ROA 06 .079 .110 .121 .050 .052 -.114 -.073 -.009 .015 .148 .113 .080 -.081 .003 -.018 .195 .111 .023 .135 .212
22. Profit Margin 06 .005 .135 .034 .039 .078 .095 -.037 .091 .066 .212* .141 .036 .039 -.203 .071 .098 -.029 .157 -.013 .025 .631**
23. Profit per employee .177 .182 .188 .097 .190 .097 .032 .031 .087 .157 .258* .260* .074 .081 .067 .193 .152 -.032 .135 .175 .763** .761**