
Neuerungen Office Line 3.4 Eckhardt Weinholz Produkt Manager Office Line.
In- und on-line Prozessüberwachung bei der Polymerverarbeitung und –synthese mit ATR-IR, NIR und RAMAN Spektroskopie
6. Kolloquium Arbeitskreis Prozessanalytik8. November, Waldbronn
Dieter Fischer1, Sven Kummer1, Jan Müller1, Bernd Kretzschmar1, Enrico Masarati21 Leibniz-Institut f. Polymerforschung Dresden, Germany
2 LyondellBasell R&D, Ferrara, Italy
Gliederung
1. Prozessanalytik mit spektroskopischen Methoden in derPolymersynthese und Polymerverarbeitung
2. Methoden und Gerätesysteme
3. Beispiele für Anwendungen zur in-situ Prozessanalytik mit ATR-FTIR und RAMAN Spektroskopie zur Kontrolle von Polymerreaktionen inLösungen und in Schmelzen
4. Beispiele für Anwendungen zur in-line Prozessüberwachung bei derExtrusion
5. Zusammenfassung
Prozessanalytik in der Polymersynthese und Polymerverarbeitung
- Sicherung und der Verbesserung der Qualität von Kunststoffen in der polymererzeugendenund polymerverarbeitenden Industrie
effektive Prozessführung durch Prozesskontrolle in Echtzeit notwendig
- Fokus dieses Vortrages: FTIR-, NIR- und Raman-Spektroskopie, Ultraschallgeschwindigkeits-und Ultraschalldämpfungsmessungen
schnelle, zuverlässige, robuste und zerstörungsfreie Methoden hohen Drücke (400 bar) und hohen Temperaturen (300 °C)Messungen in Reaktoren, Rohrleitungen, Mixern, ExtrudernDatenübertragung der gemessenen Daten erfolgt mit Glasfasern bzw. mit Koaxialkabeln, wobei mehrere Messstellen gleichzeitig überwacht werden können
- AnwendungenChemische Reaktionen, Polymerisationsprozesse und Extrusionsvorgänge überwachen und optimierenBestimmung der quantitativen Zusammensetzung von Mehrkomponentengemischen (Blends, Composites, Additive)Bestimmung des Umsatzverlaufes von ReaktionenAussagen zur Morphologie (Teilchengröße und Dispersion)Bestimmung von (End)Produkteigenschaften (Viskosität, mechanische Eigenschaften)Untersuchung des Einflusses der Verarbeitungsbedingungen auf DispergierprozesseMessungen entlang eines Extruders zur Verfolgung von Misch- und Verteilungsprozessen
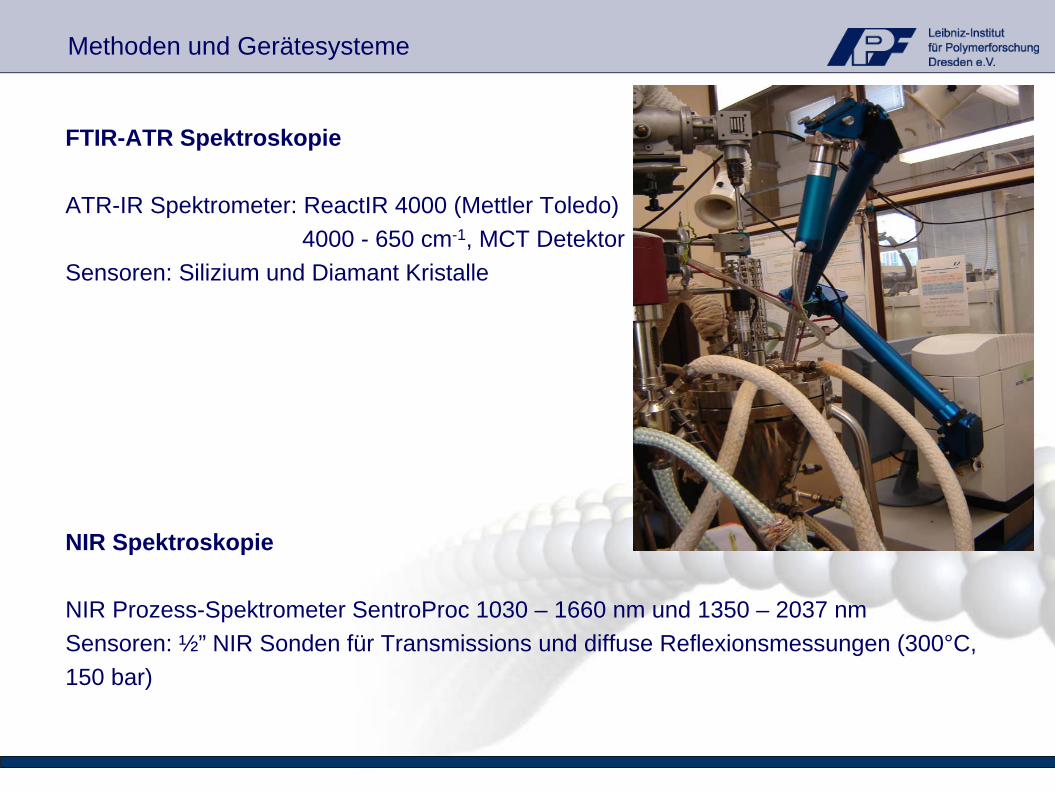
FTIR-ATR Spektroskopie
ATR-IR Spektrometer: ReactIR 4000 (Mettler Toledo)4000 - 650 cm-1, MCT Detektor
Sensoren: Silizium und Diamant Kristalle
NIR Spektroskopie
NIR Prozess-Spektrometer SentroProc 1030 – 1660 nm und 1350 – 2037 nmSensoren: ½” NIR Sonden für Transmissions und diffuse Reflexionsmessungen (300°C, 150 bar)
Methoden und Gerätesysteme
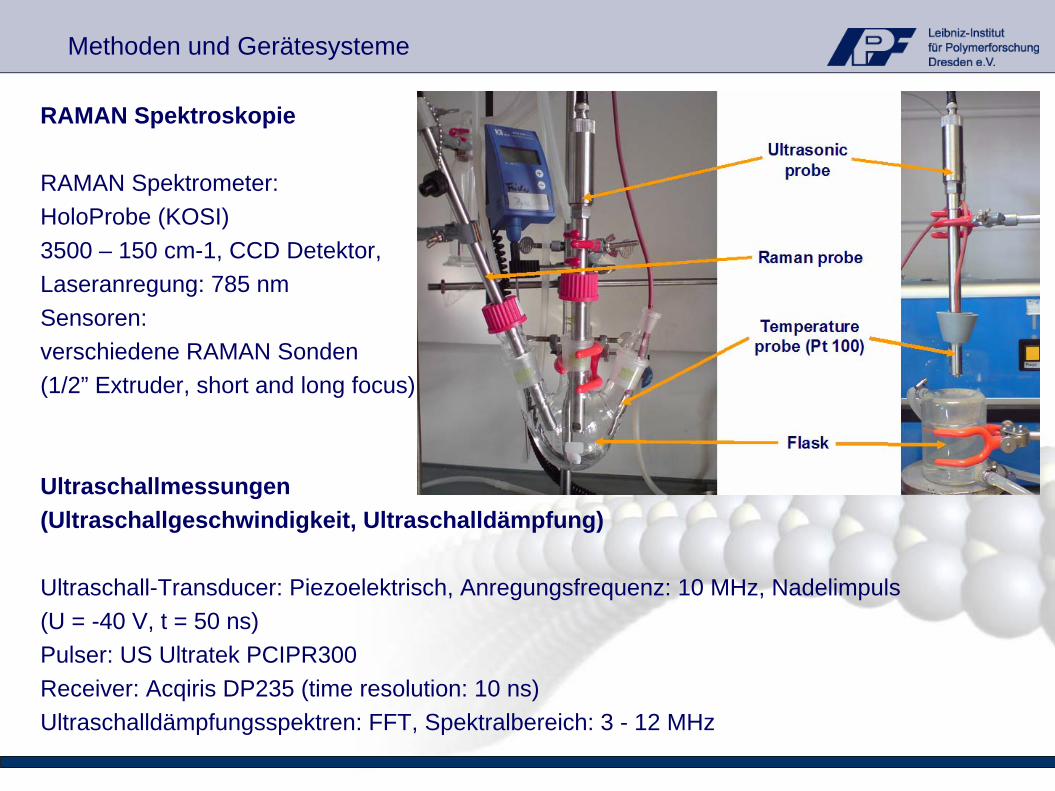
RAMAN Spektroskopie
RAMAN Spektrometer: HoloProbe (KOSI)3500 – 150 cm-1, CCD Detektor, Laseranregung: 785 nm Sensoren: verschiedene RAMAN Sonden(1/2” Extruder, short and long focus)
Ultraschallmessungen(Ultraschallgeschwindigkeit, Ultraschalldämpfung)
Ultraschall-Transducer: Piezoelektrisch, Anregungsfrequenz: 10 MHz, Nadelimpuls(U = -40 V, t = 50 ns)Pulser: US Ultratek PCIPR300Receiver: Acqiris DP235 (time resolution: 10 ns)Ultraschalldämpfungsspektren: FFT, Spektralbereich: 3 - 12 MHz
Methoden und Gerätesysteme
Methoden und Gerätesysteme
TEM- sample preparation: cryo ultracutting by Leica Ultracut UCT, layer thickness approx. 80 nm- TEM: JEM 2010, 200 keV
SEM- sample preparation: brittle fractured samples at low temperature, sputtered with 5 nm Pt - SEM: Ultra Plus Zeiss, Germany, 3kV detector: SE2
RAMAN-Imaging- Alpha300 R, Confocal Raman Microscope, WITec GmbH Ulm, Germany- Nd:YAG laser 532 nm, 100x objective- scan range xy-scan: 25 x 25 µm; 128 x 128 pixel; resolution on air 400 nm- 62 ms / spectrum
Rheology- ARES rheometer - 240 °C- dynamical frequency sweep (100 Hz … 0.05 Hz)
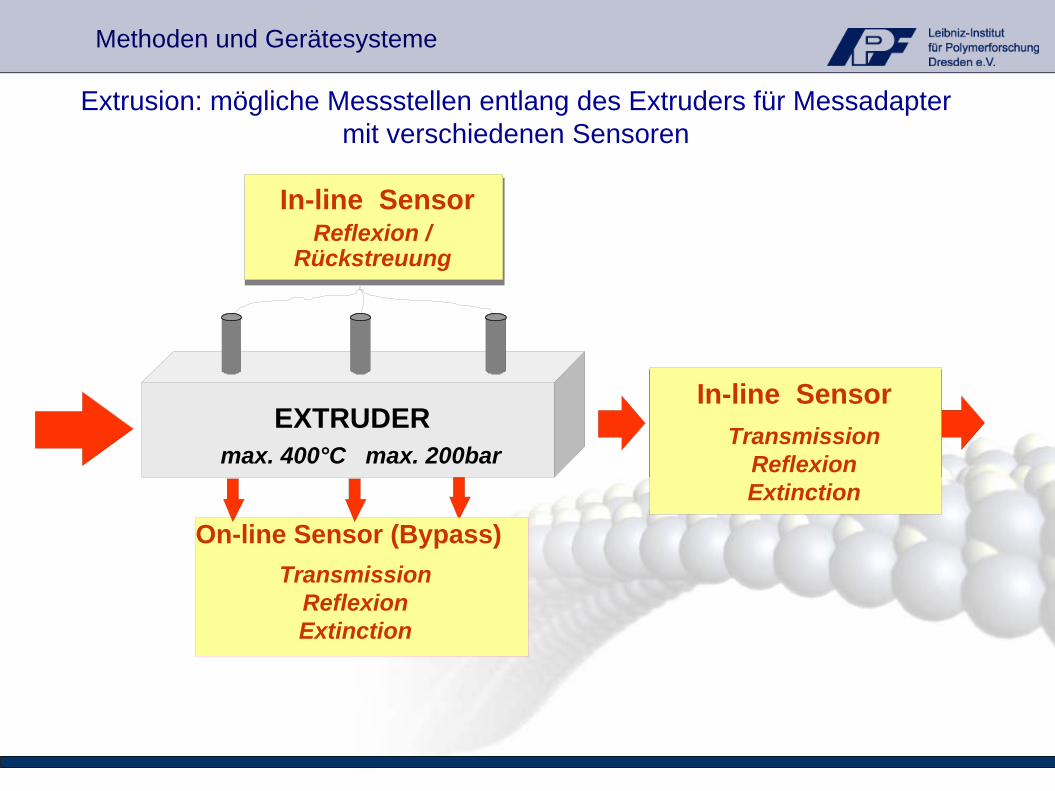
On-line Sensor (Bypass)
In-line Sensor
In-line Sensor
EXTRUDERmax. 400°C max. 200bar
Reflexion / Rückstreuung
Transmission ReflexionExtinction
Extrusion: mögliche Messstellen entlang des Extruders für Messadapter mit verschiedenen Sensoren
Methoden und Gerätesysteme
Transmission ReflexionExtinction
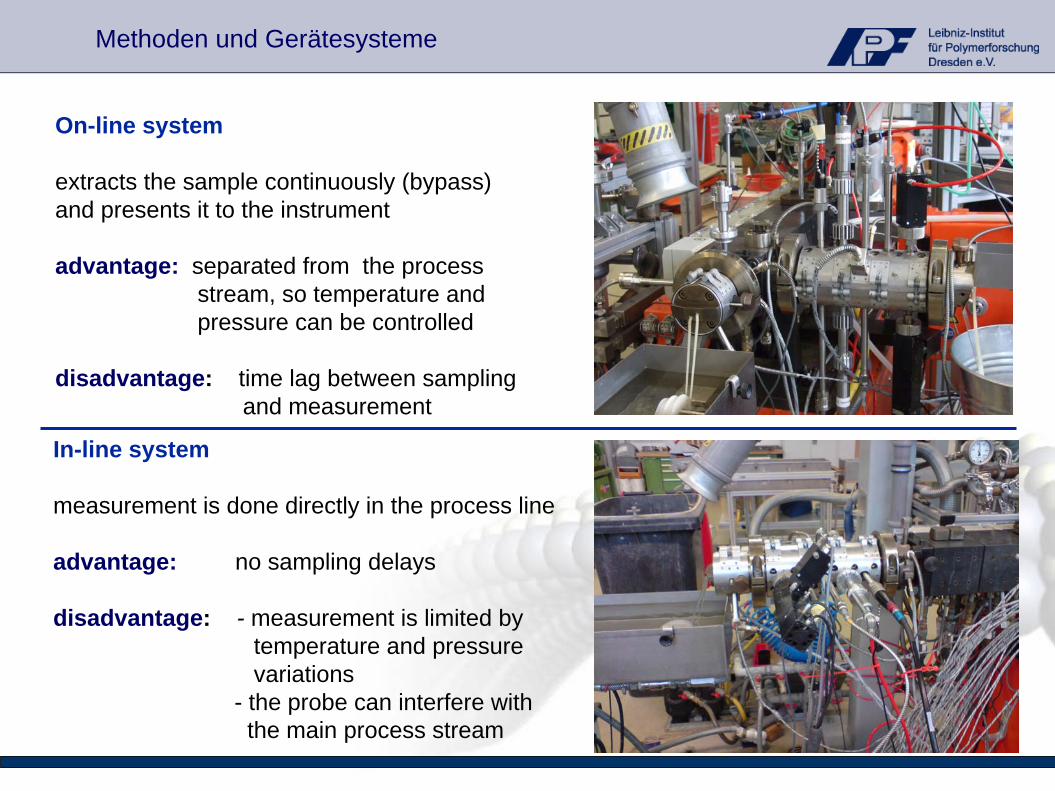
On-line system
extracts the sample continuously (bypass)and presents it to the instrument
advantage: separated from the processstream, so temperature and pressure can be controlled
disadvantage: time lag between samplingand measurement
In-line system
measurement is done directly in the process line
advantage: no sampling delays
disadvantage: - measurement is limited bytemperature and pressurevariations
- the probe can interfere withthe main process stream
Methoden und Gerätesysteme
Methoden und Gerätesysteme
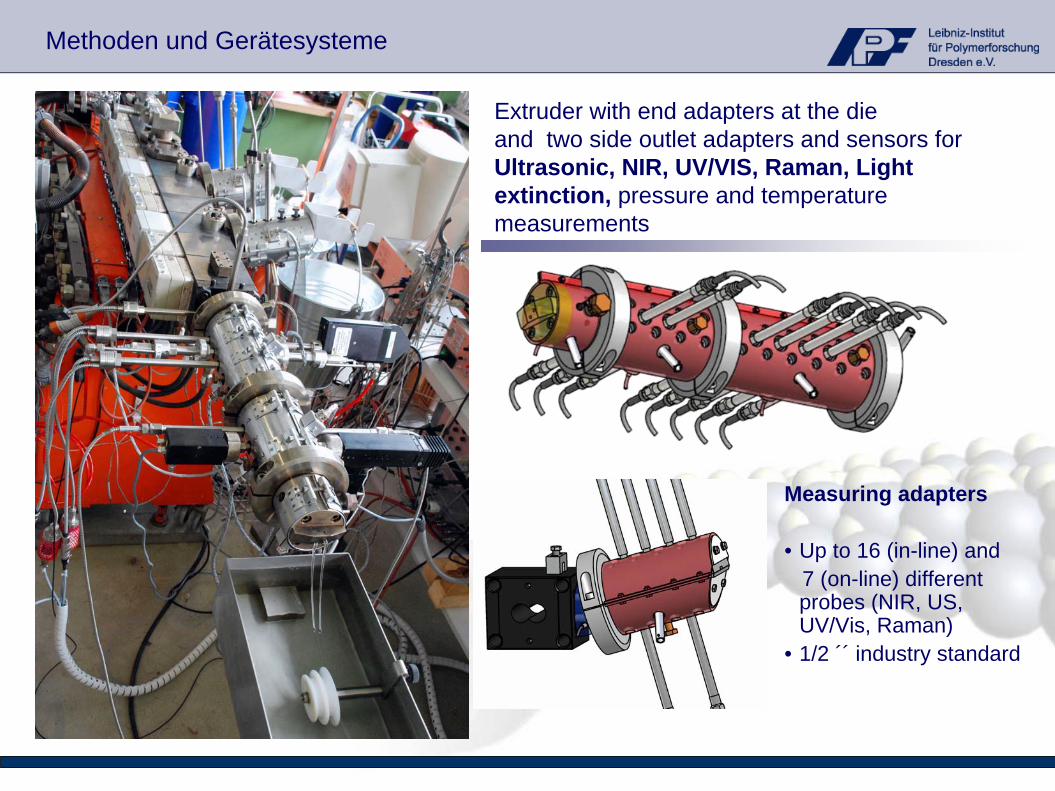
Extruder with end adapters at the die and two side outlet adapters and sensors forUltrasonic, NIR, UV/VIS, Raman, Light extinction, pressure and temperature measurements
Measuring adapters
• Up to 16 (in-line) and7 (on-line) different probes (NIR, US, UV/Vis, Raman)
• 1/2 ´´ industry standard
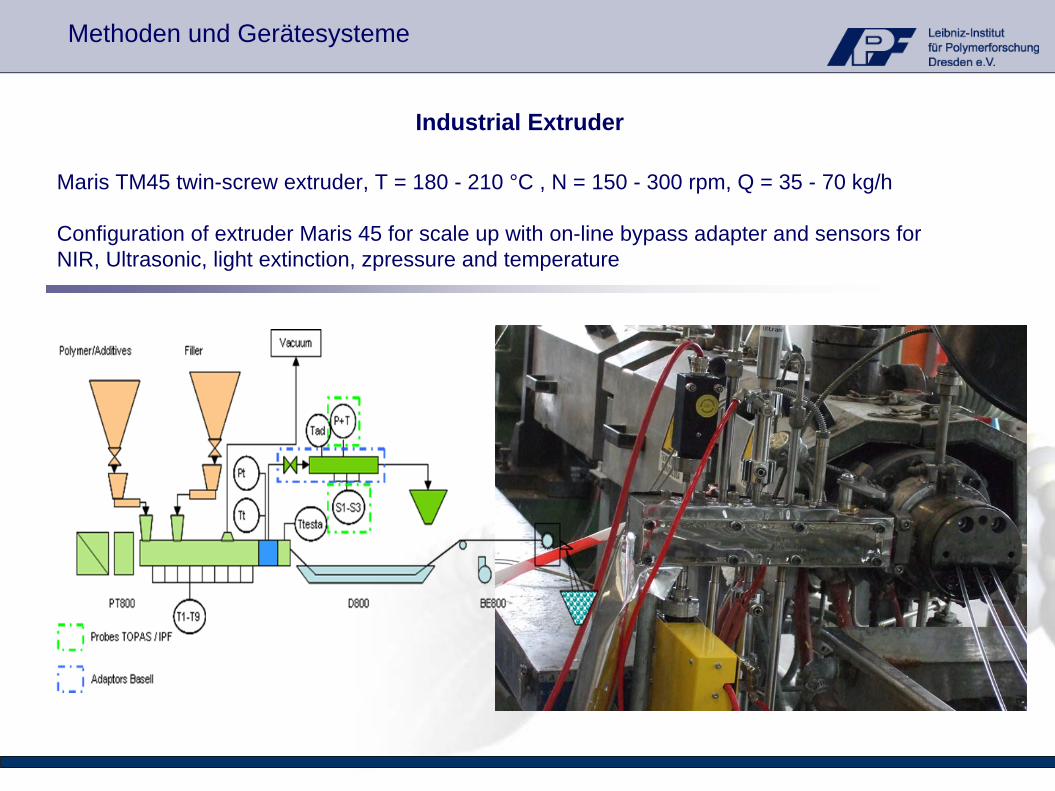
Maris TM45 twin-screw extruder, T = 180 - 210 °C , N = 150 - 300 rpm, Q = 35 - 70 kg/h
Configuration of extruder Maris 45 for scale up with on-line bypass adapter and sensors for NIR, Ultrasonic, light extinction, zpressure and temperature
Methoden und Gerätesysteme
Industrial Extruder
Methoden und Gerätesysteme
Pol
ymer
mel
tPulser Receiver
d
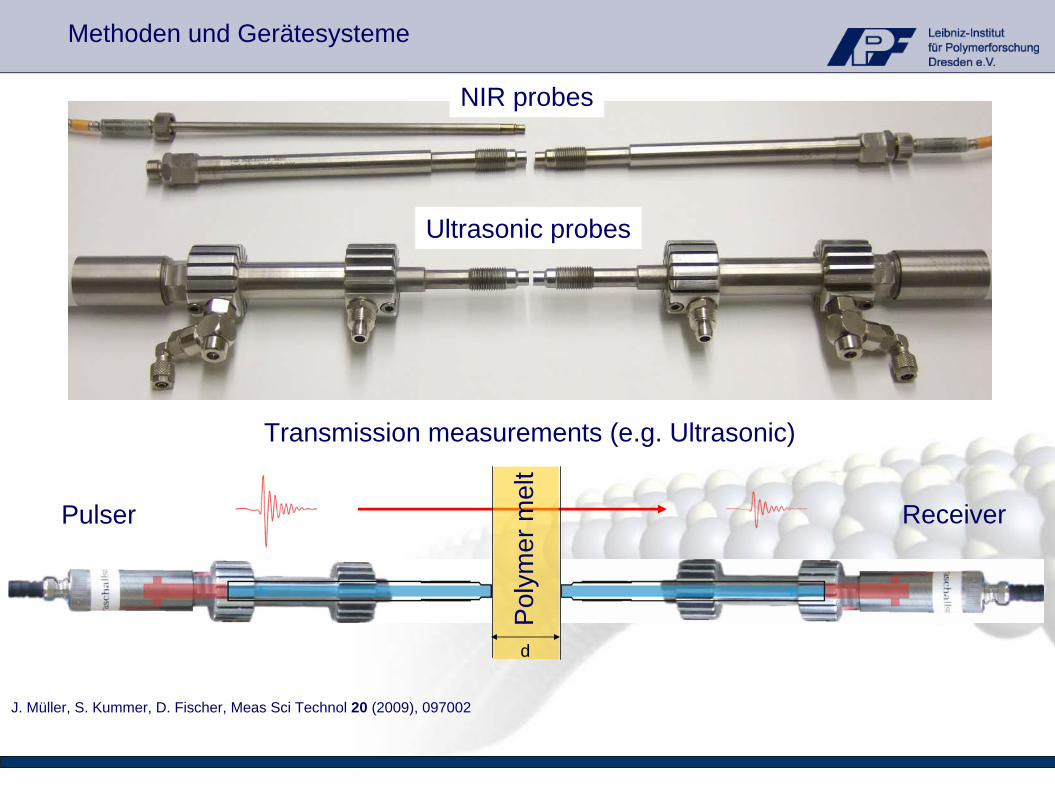
J. Müller, S. Kummer, D. Fischer, Meas Sci Technol 20 (2009), 097002
NIR probes
Ultrasonic probes
Transmission measurements (e.g. Ultrasonic)
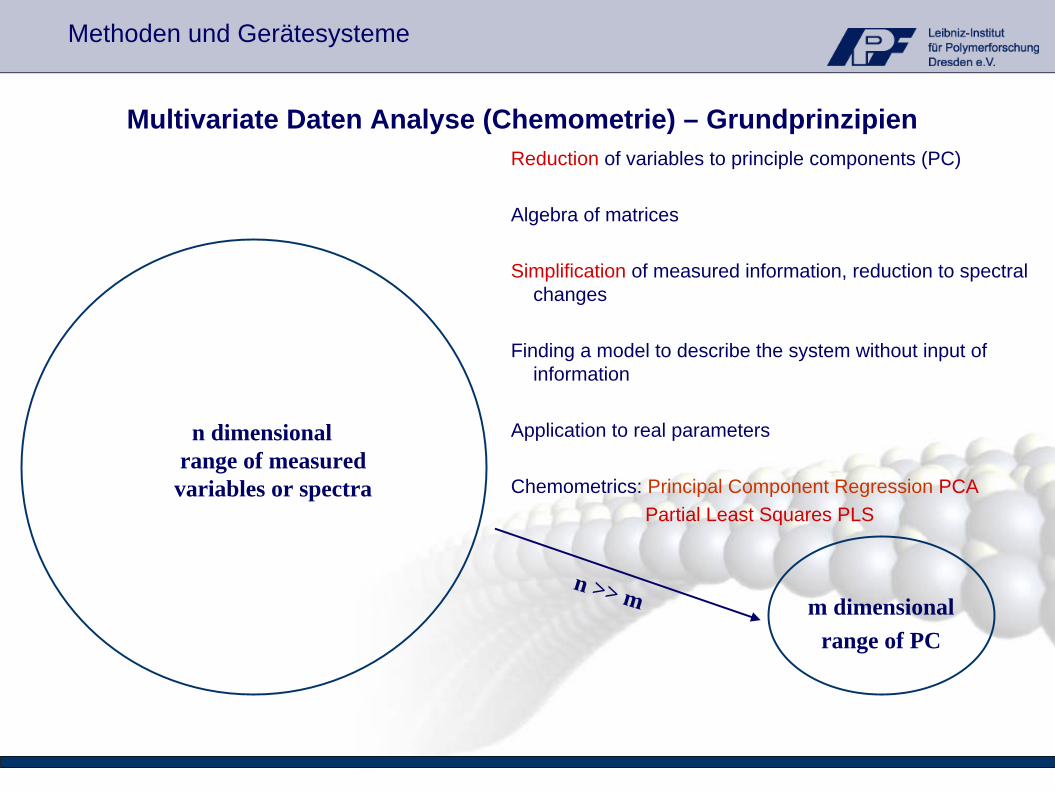
Multivariate Daten Analyse (Chemometrie) – Grundprinzipien
n dimensional range of measured variables or spectra
m dimensionalrange of PC
n >> m
Reduction of variables to principle components (PC)
Algebra of matrices
Simplification of measured information, reduction to spectral changes
Finding a model to describe the system without input of information
Application to real parameters
Chemometrics: Principal Component Regression PCA Partial Least Squares PLS
Methoden und Gerätesysteme
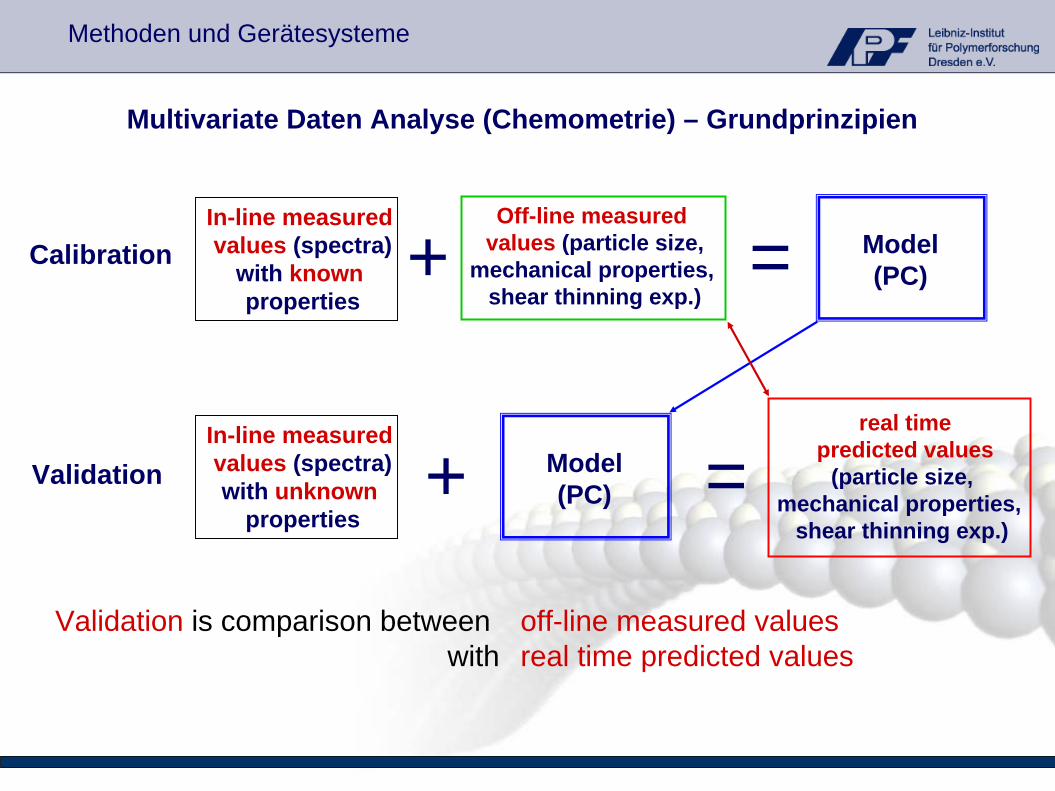
In-line measuredvalues (spectra)
with knownproperties
In-line measuredvalues (spectra)with unknown
properties+
real timepredicted values
(particle size,mechanical properties,
shear thinning exp.)
Model(PC) =Validation
Off-line measuredvalues (particle size,
mechanical properties, shear thinning exp.)
+ Model(PC)=Calibration
Validation is comparison between off-line measured valueswith real time predicted values
Methoden und Gerätesysteme
Multivariate Daten Analyse (Chemometrie) – Grundprinzipien
# Monitoring der Modifizierung von OH Endgruppen von hochverzweigten poly(urea-urethanen) mit Isocyanaten mit ATR-IR Spektroskopie (ATR-Si-Sonde)
# Überwachung der Polykondensation von Polyethylenterephthalat (PET) ineinem Rührautoklaven mit ATR-IR Spektroskopie mit dem Ziel der Optimierung der Polykondensationsbedingungen(Hochtemperatur ATR-Diamond-Sonde)
# Verfolgung der ATRP Polymerisation von amino-funktionalisiertem PMMA mitin-line RAMAN Spektroskopie
3. Beispiele für Anwendungen zur in-situ Prozessanalytik mit ATR-FTIR und RAMAN Spektroskopie zur Kontrolle von Polymerreaktionen in
Lösungen und in Schmelzen
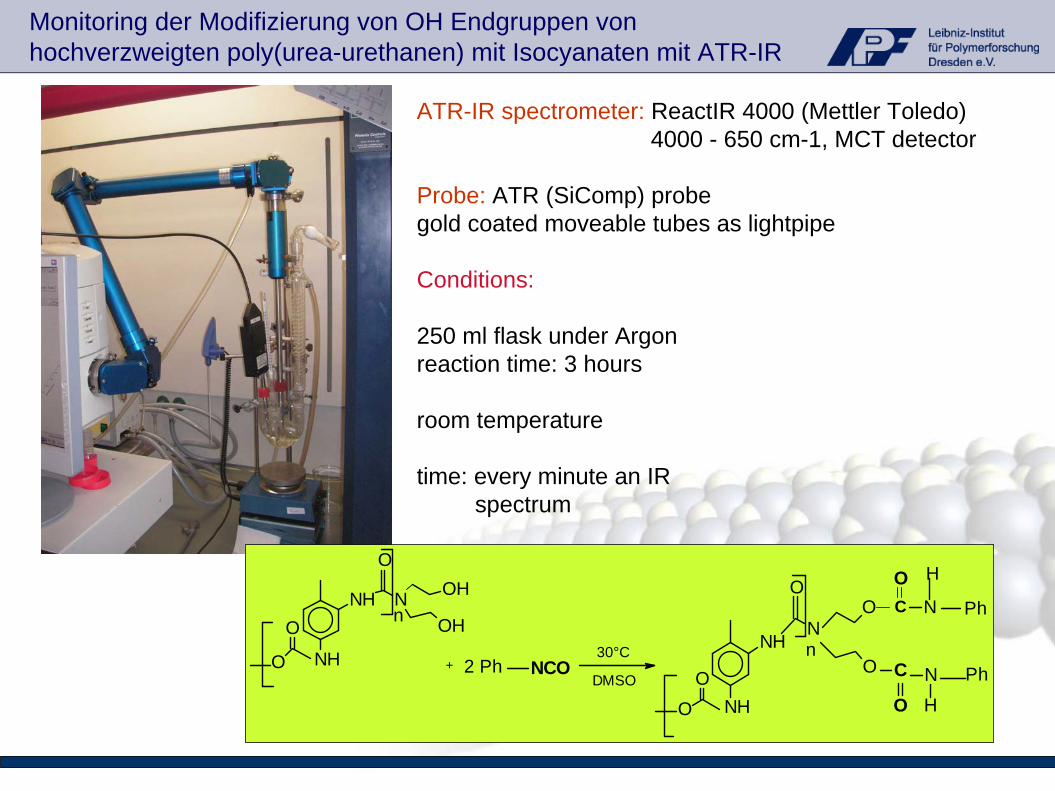
ATR-IR spectrometer: ReactIR 4000 (Mettler Toledo)4000 - 650 cm-1, MCT detector
Probe: ATR (SiComp) probegold coated moveable tubes as lightpipe
Conditions:
250 ml flask under Argon reaction time: 3 hours
room temperature
time: every minute an IR spectrum
NH
NH
NOH
OHO
n
+30°C NH
NH
N
OO
O C
O
ON
N
H
O
On
OONCO Ph
Ph
H
2 PhDMSO
C
Monitoring der Modifizierung von OH Endgruppen von hochverzweigten poly(urea-urethanen) mit Isocyanaten mit ATR-IR
22612281
1709Absorbanz
Wellenzahl [1/cm]
Zeit [h]
2400 2200 2000 1800 16000
12
Wavenumber [cm-1]
Time [hours]
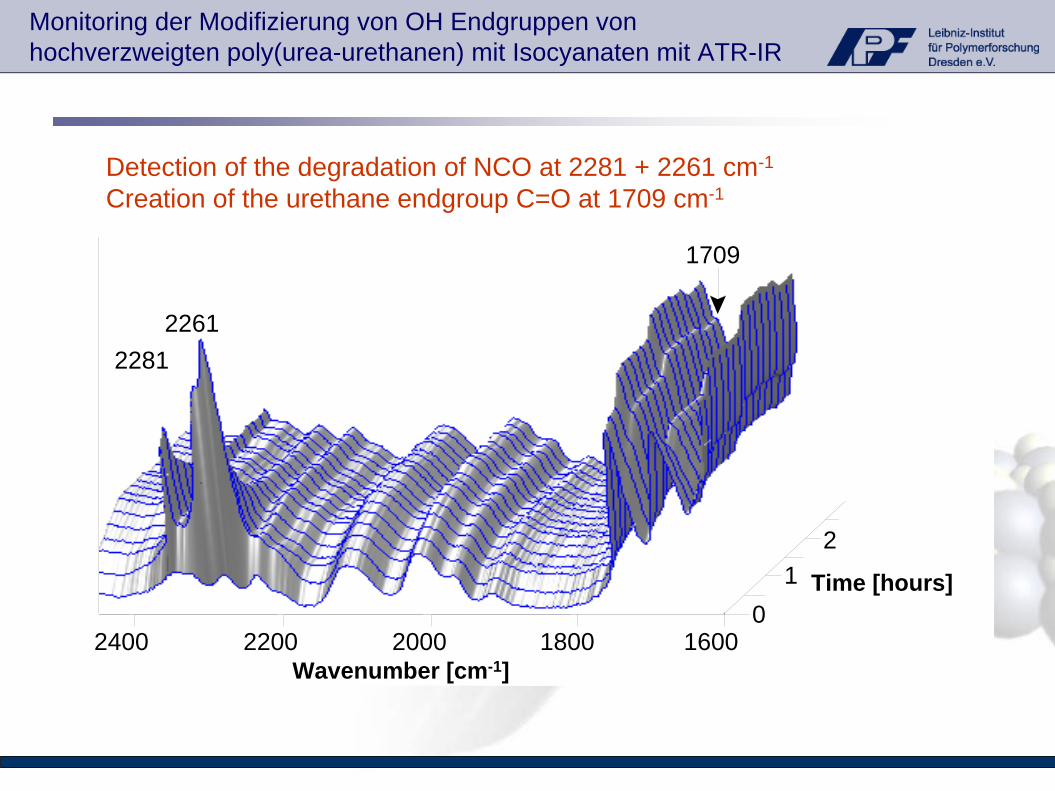
Detection of the degradation of NCO at 2281 + 2261 cm-1
Creation of the urethane endgroup C=O at 1709 cm-1
Monitoring der Modifizierung von OH Endgruppen von hochverzweigten poly(urea-urethanen) mit Isocyanaten mit ATR-IR
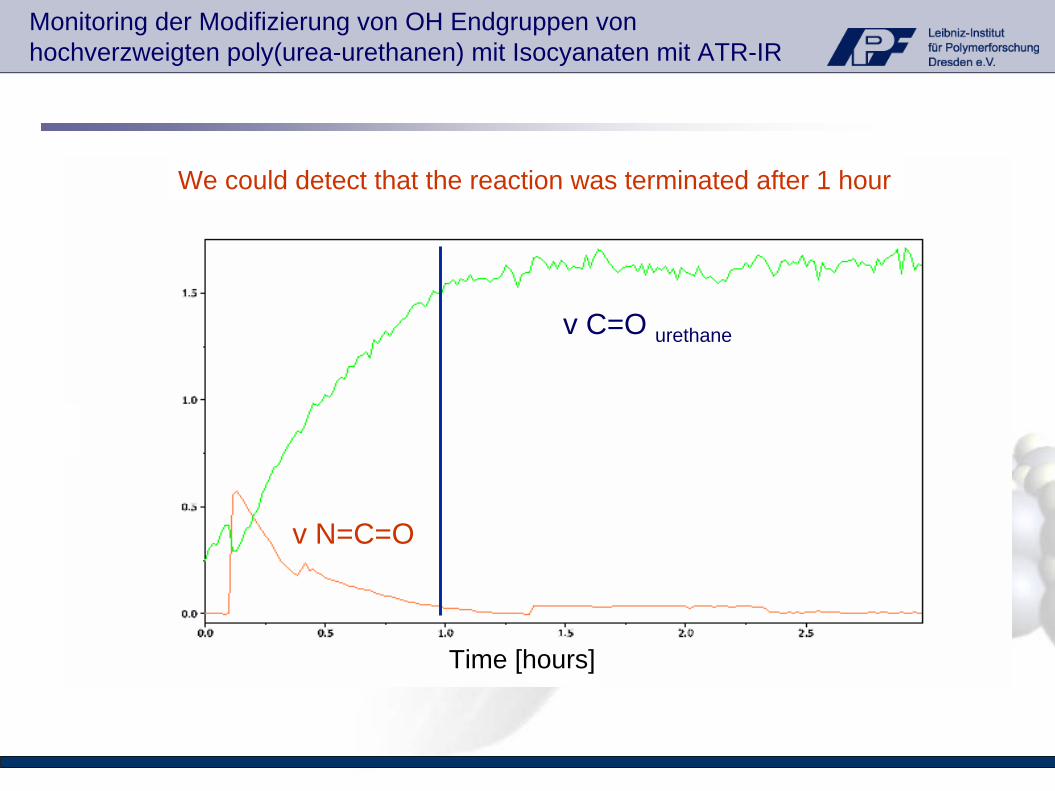
We could detect that the reaction was terminated after 1 hour
Time [hours]
v C=O urethane
v N=C=O
Monitoring der Modifizierung von OH Endgruppen von hochverzweigten poly(urea-urethanen) mit Isocyanaten mit ATR-IR
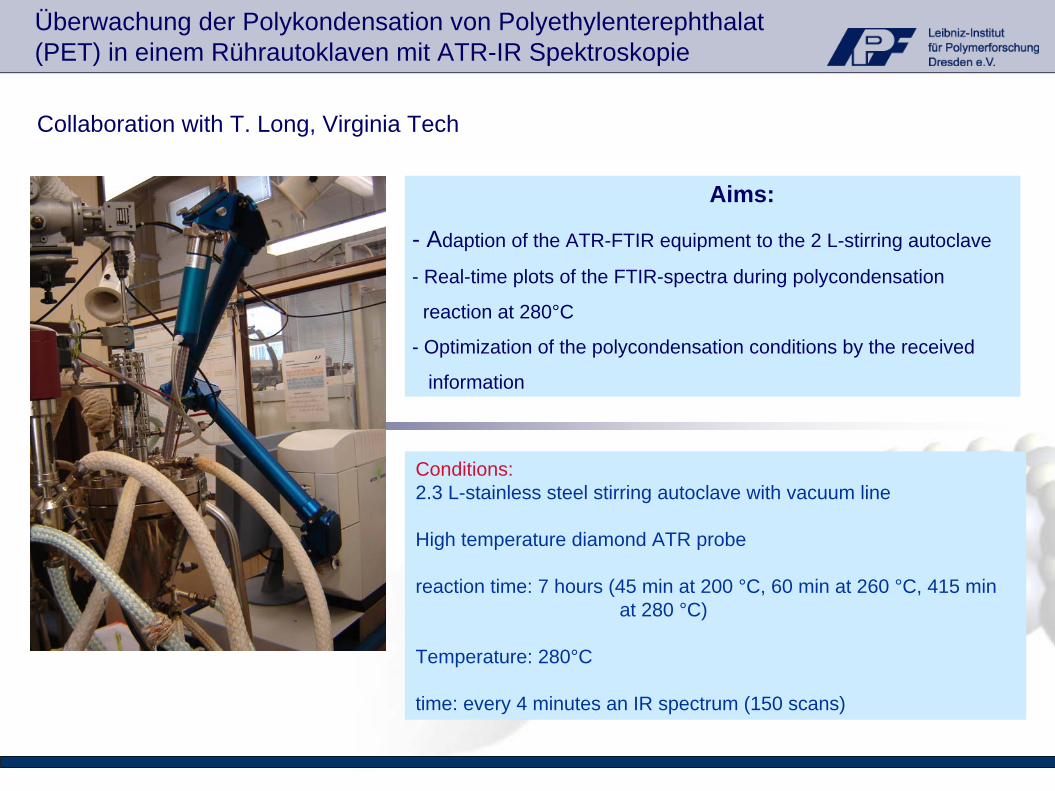
Conditions:2.3 L-stainless steel stirring autoclave with vacuum line
High temperature diamond ATR probe
reaction time: 7 hours (45 min at 200 °C, 60 min at 260 °C, 415 min at 280 °C)
Temperature: 280°C
time: every 4 minutes an IR spectrum (150 scans)
Aims:
- Adaption of the ATR-FTIR equipment to the 2 L-stirring autoclave
- Real-time plots of the FTIR-spectra during polycondensation
reaction at 280°C
- Optimization of the polycondensation conditions by the received
information
Collaboration with T. Long, Virginia Tech
Überwachung der Polykondensation von Polyethylenterephthalat (PET) in einem Rührautoklaven mit ATR-IR Spektroskopie
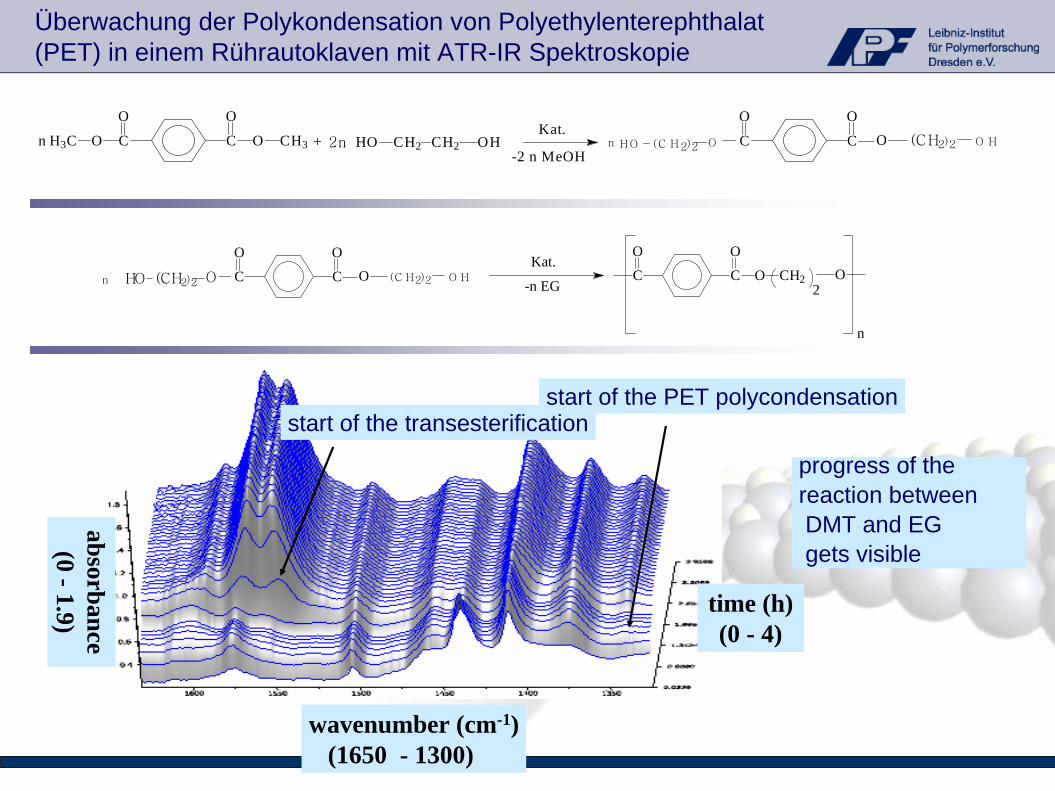
start of the transesterificationstart of the PET polycondensation
wavenumber (cm-1)(1650 - 1300)
time (h)(0 - 4)
absorbance(0 -1.9)
progress of thereaction betweenDMT and EGgets visible
C C O O O
C C
OO
O O CH3n H3C + HO CH2 CH2 OHKat.
-2 n MeOH 2n (CH2)2 OHn (CH2)2 OHO
C C O CH2
O O
2O
n
Kat.
-n EGHO O(CH2)2 OH(CH2)2C C O O O
n
Überwachung der Polykondensation von Polyethylenterephthalat (PET) in einem Rührautoklaven mit ATR-IR Spektroskopie
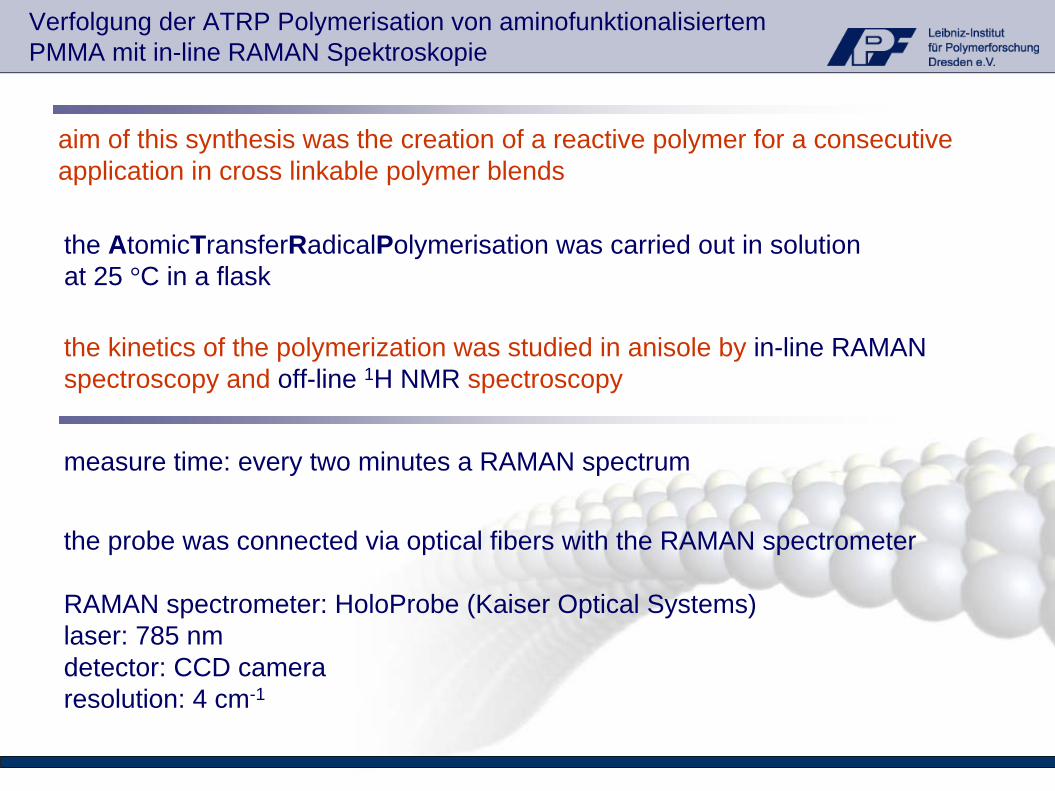
aim of this synthesis was the creation of a reactive polymer for a consecutiveapplication in cross linkable polymer blends
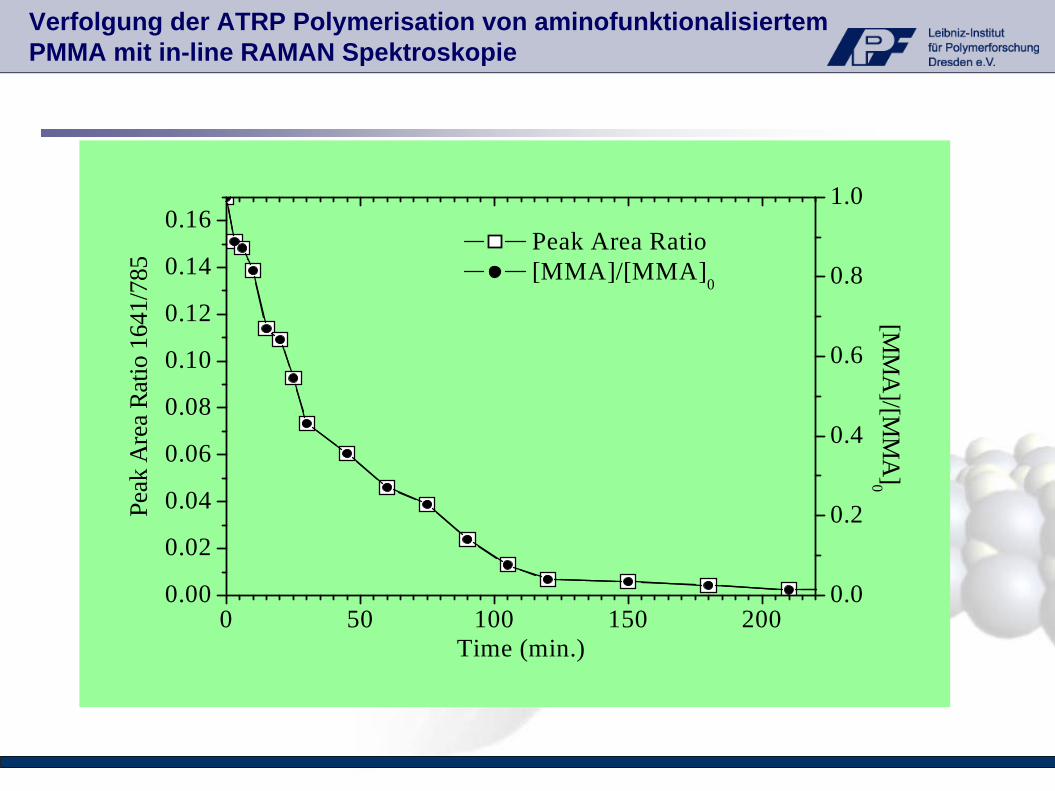
the AtomicTransferRadicalPolymerisation was carried out in solutionat 25 °C in a flask
the kinetics of the polymerization was studied in anisole by in-line RAMANspectroscopy and off-line 1H NMR spectroscopy
measure time: every two minutes a RAMAN spectrum
the probe was connected via optical fibers with the RAMAN spectrometer
RAMAN spectrometer: HoloProbe (Kaiser Optical Systems)laser: 785 nmdetector: CCD cameraresolution: 4 cm-1
Verfolgung der ATRP Polymerisation von aminofunktionalisiertemPMMA mit in-line RAMAN Spektroskopie
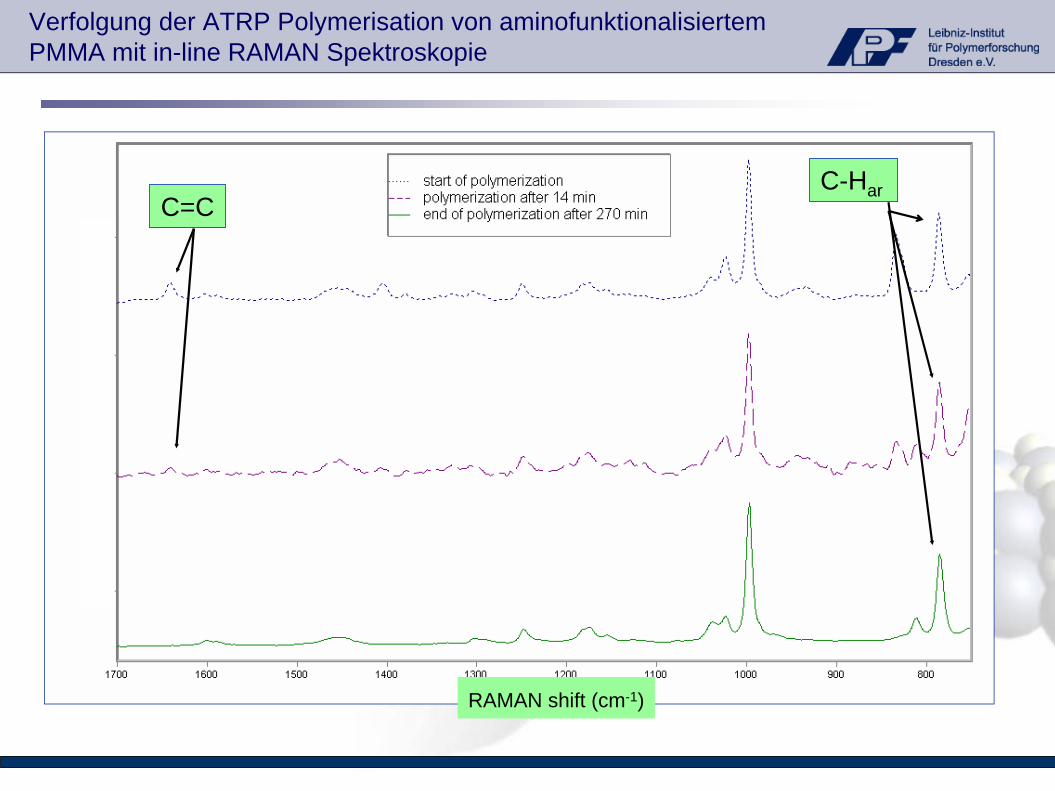
C=CC-Har
RAMAN shift (cm-1)
Verfolgung der ATRP Polymerisation von aminofunktionalisiertemPMMA mit in-line RAMAN Spektroskopie
0 50 100 150 2000.00
0.02
0.04
0.06
0.08
0.10
0.12
0.14
0.16 Peak Area Ratio [MMA]/[MMA]0
Time (min.)
Peak
Are
a Ra
tio 1
641/
785
0.0
0.2
0.4
0.6
0.8
1.0[M
MA
]/[MM
A]0
Verfolgung der ATRP Polymerisation von aminofunktionalisiertemPMMA mit in-line RAMAN Spektroskopie
0 50 100 150 200 250 300 3500
20
40
60
80
100
Time (min.)
Con
vers
ion
(%)
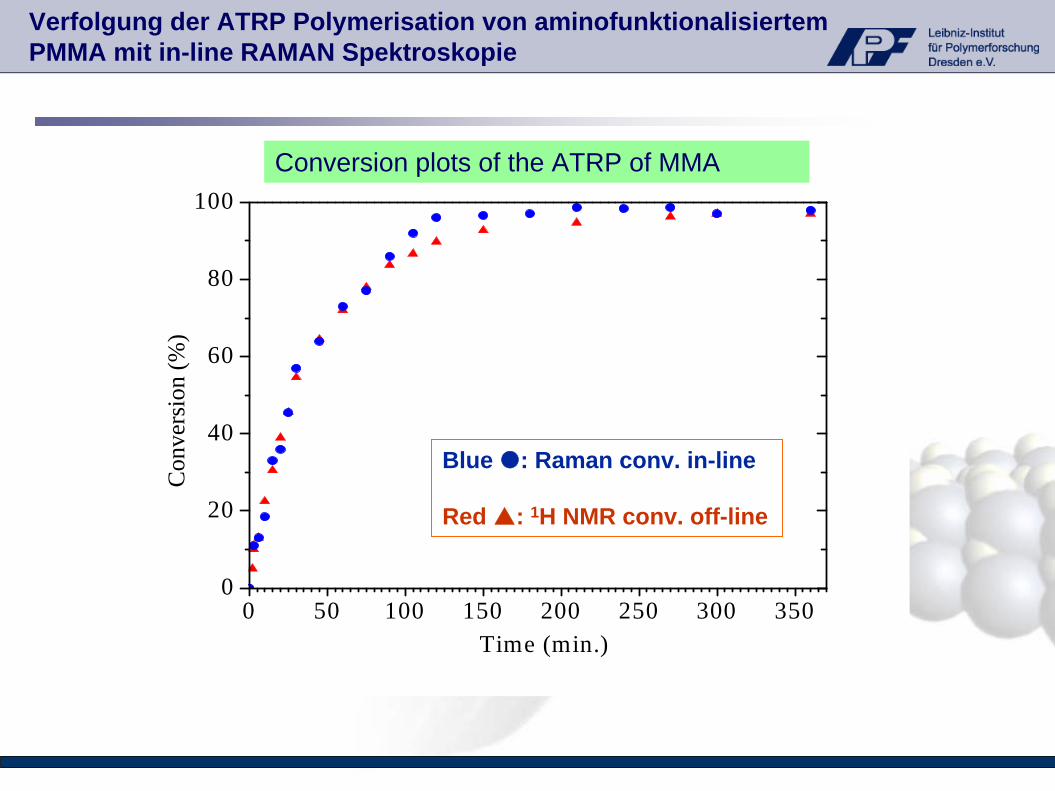
Conversion plots of the ATRP of MMA
Blue : Raman conv. in-line
Red : 1H NMR conv. off-line
Verfolgung der ATRP Polymerisation von aminofunktionalisiertemPMMA mit in-line RAMAN Spektroskopie
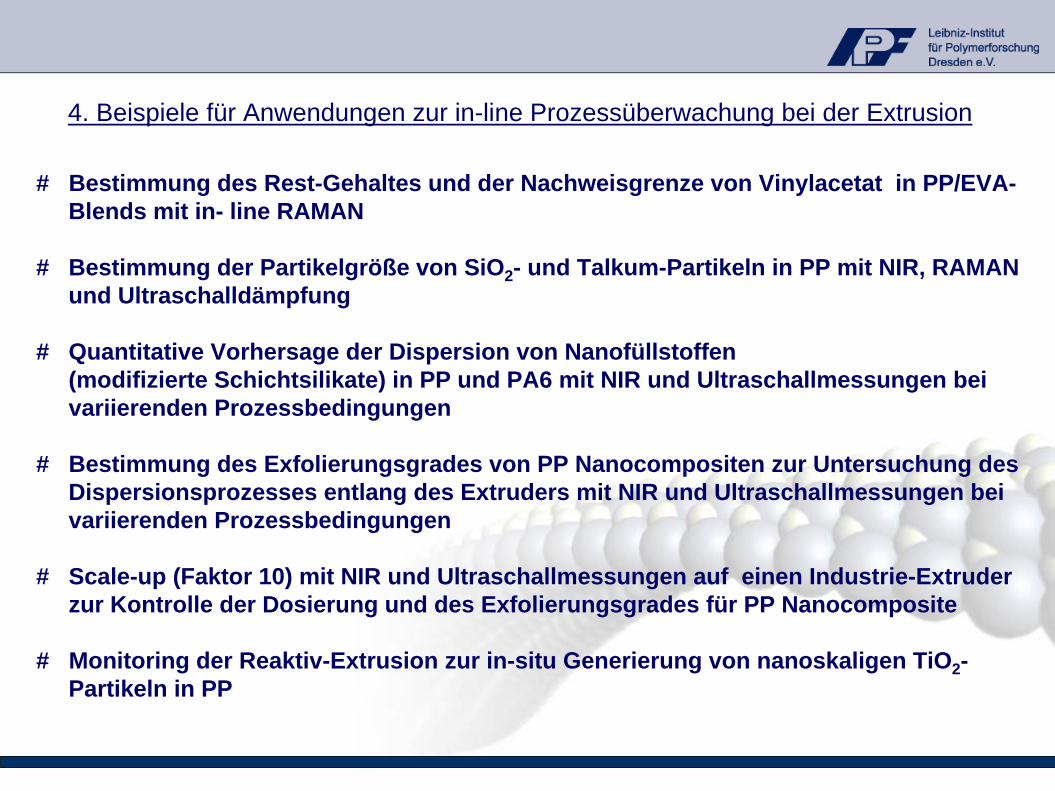
# Bestimmung des Rest-Gehaltes und der Nachweisgrenze von Vinylacetat in PP/EVA-Blends mit in- line RAMAN
# Bestimmung der Partikelgröße von SiO2 - und Talkum-Partikeln in PP mit NIR, RAMAN und Ultraschalldämpfung
# Quantitative Vorhersage der Dispersion von Nanofüllstoffen(modifizierte Schichtsilikate) in PP und PA6 mit NIR und Ultraschallmessungen beivariierenden Prozessbedingungen
# Bestimmung des Exfolierungsgrades von PP Nanocompositen zur Untersuchung des Dispersionsprozesses entlang des Extruders mit NIR und Ultraschallmessungen bei variierenden Prozessbedingungen
# Scale-up (Faktor 10) mit NIR und Ultraschallmessungen auf einen Industrie-Extruderzur Kontrolle der Dosierung und des Exfolierungsgrades für PP Nanocomposite
# Monitoring der Reaktiv-Extrusion zur in-situ Generierung von nanoskaligen TiO2 -Partikeln in PP
4. Beispiele für Anwendungen zur in-line Prozessüberwachung bei der Extrusion
Bestimmung des Rest-Gehaltes und der Nachweisgrenze von Vinylacetat in PP/EVA-Blends mit in- line RAMAN
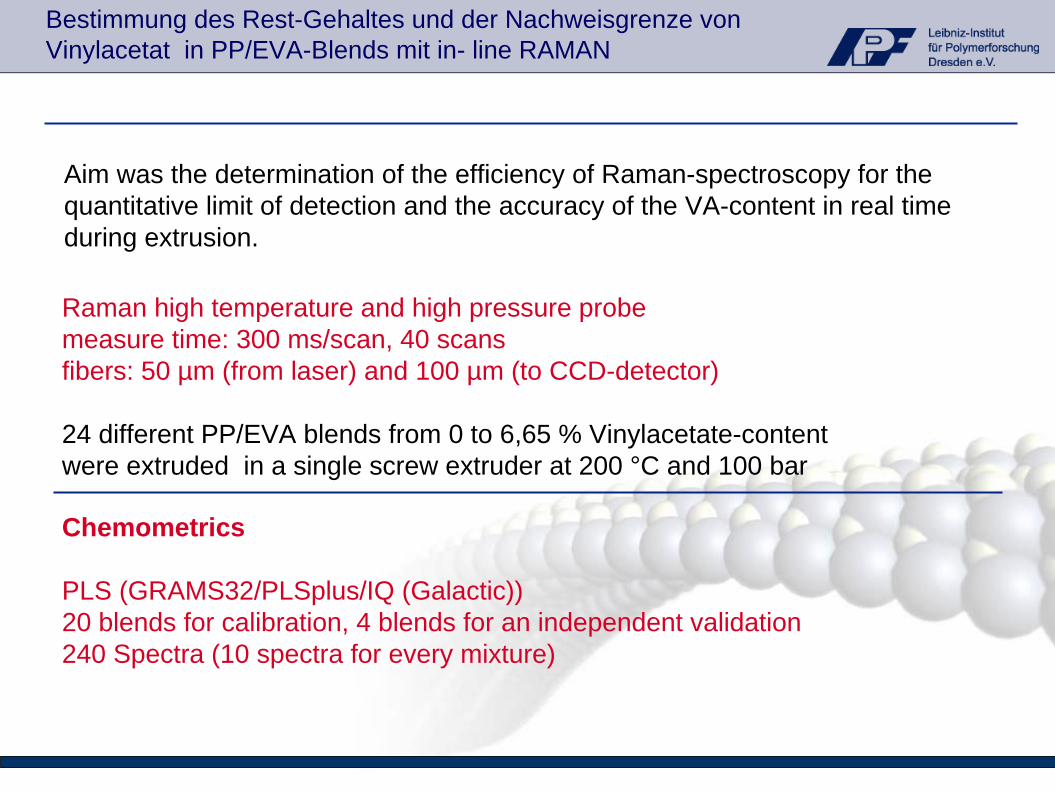
Aim was the determination of the efficiency of Raman-spectroscopy for the quantitative limit of detection and the accuracy of the VA-content in real time during extrusion.
Raman high temperature and high pressure probemeasure time: 300 ms/scan, 40 scansfibers: 50 µm (from laser) and 100 µm (to CCD-detector)
24 different PP/EVA blends from 0 to 6,65 % Vinylacetate-contentwere extruded in a single screw extruder at 200 °C and 100 bar
Chemometrics
PLS (GRAMS32/PLSplus/IQ (Galactic))20 blends for calibration, 4 blends for an independent validation240 Spectra (10 spectra for every mixture)
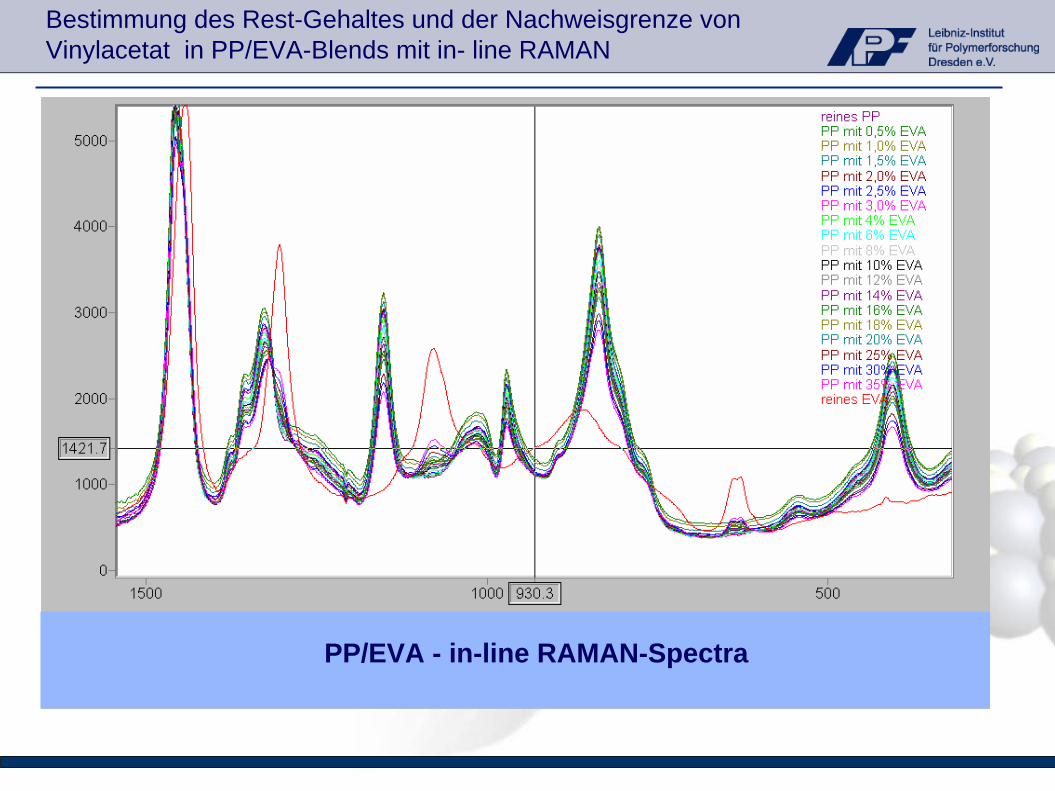
PP/EVA - in-line RAMAN-Spectra
Bestimmung des Rest-Gehaltes und der Nachweisgrenze von Vinylacetat in PP/EVA-Blends mit in- line RAMAN
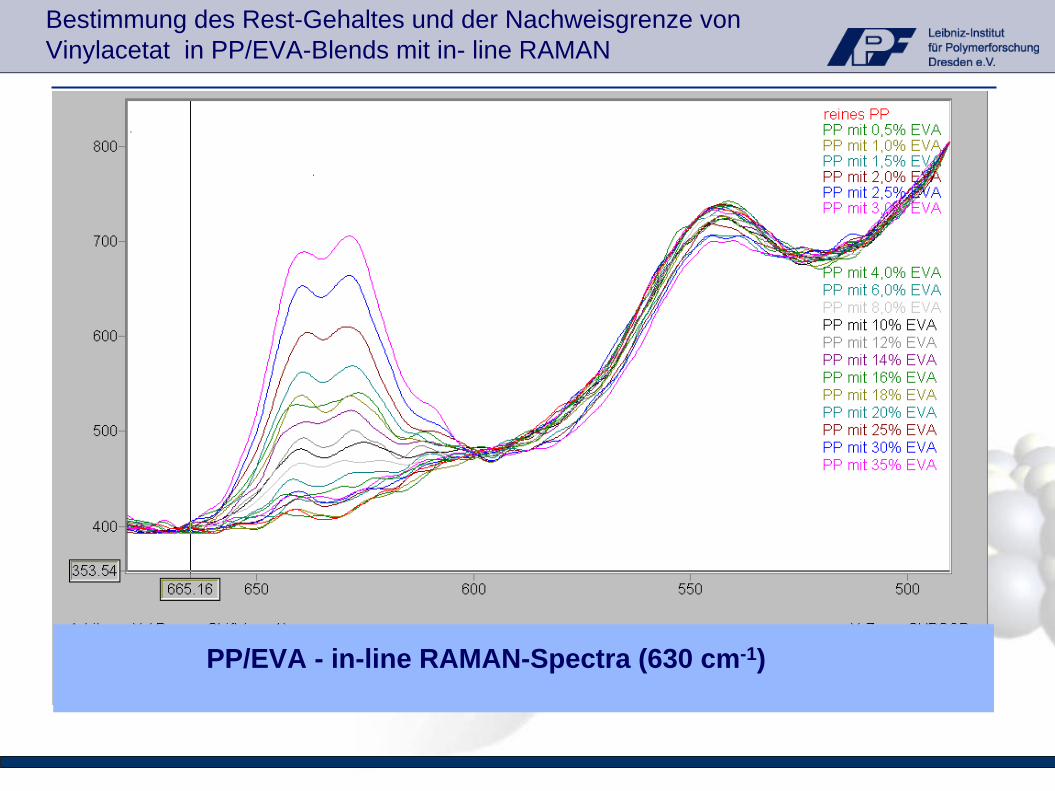
PP/EVA - in-line RAMAN-Spectra (630 cm-1)
Bestimmung des Rest-Gehaltes und der Nachweisgrenze von Vinylacetat in PP/EVA-Blends mit in- line RAMAN
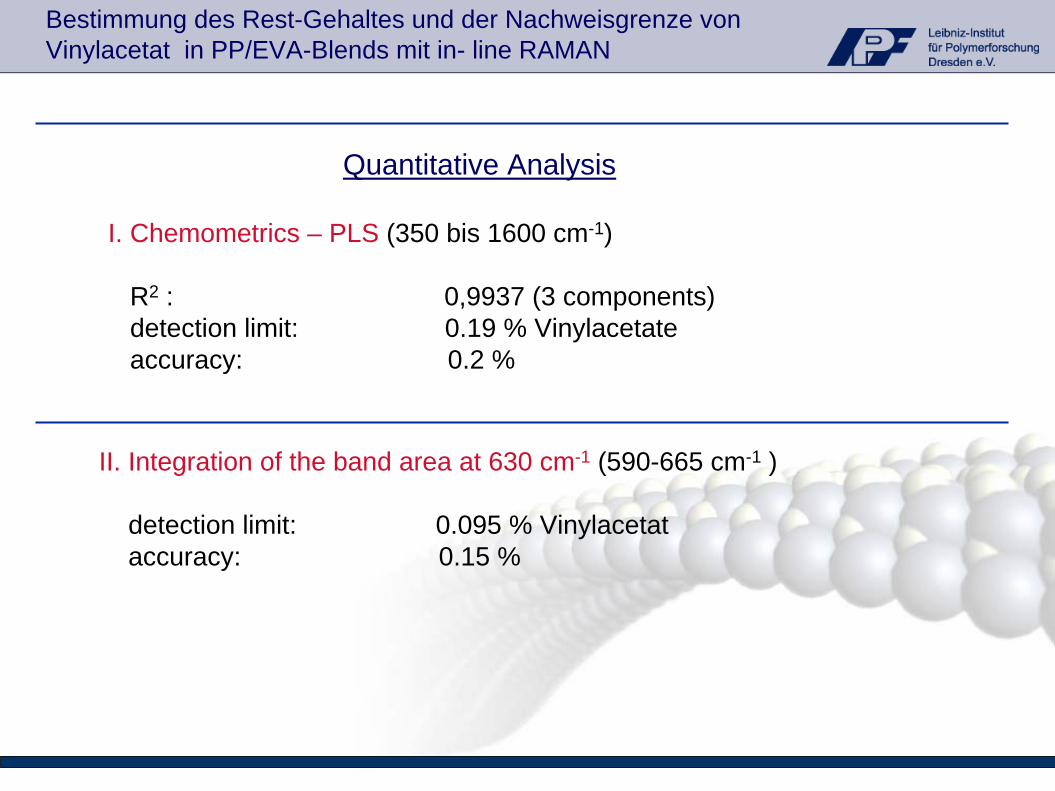
Quantitative Analysis
I. Chemometrics – PLS (350 bis 1600 cm-1)
R2 : 0,9937 (3 components)detection limit: 0.19 % Vinylacetateaccuracy: 0.2 %
II. Integration of the band area at 630 cm-1 (590-665 cm-1 )
detection limit: 0.095 % Vinylacetat accuracy: 0.15 %
Bestimmung des Rest-Gehaltes und der Nachweisgrenze von Vinylacetat in PP/EVA-Blends mit in- line RAMAN
Bestimmung der Partikelgröße von SiO2 - und Talkum-Partikelnin PP mit NIR, RAMAN und Ultraschalldämpfung
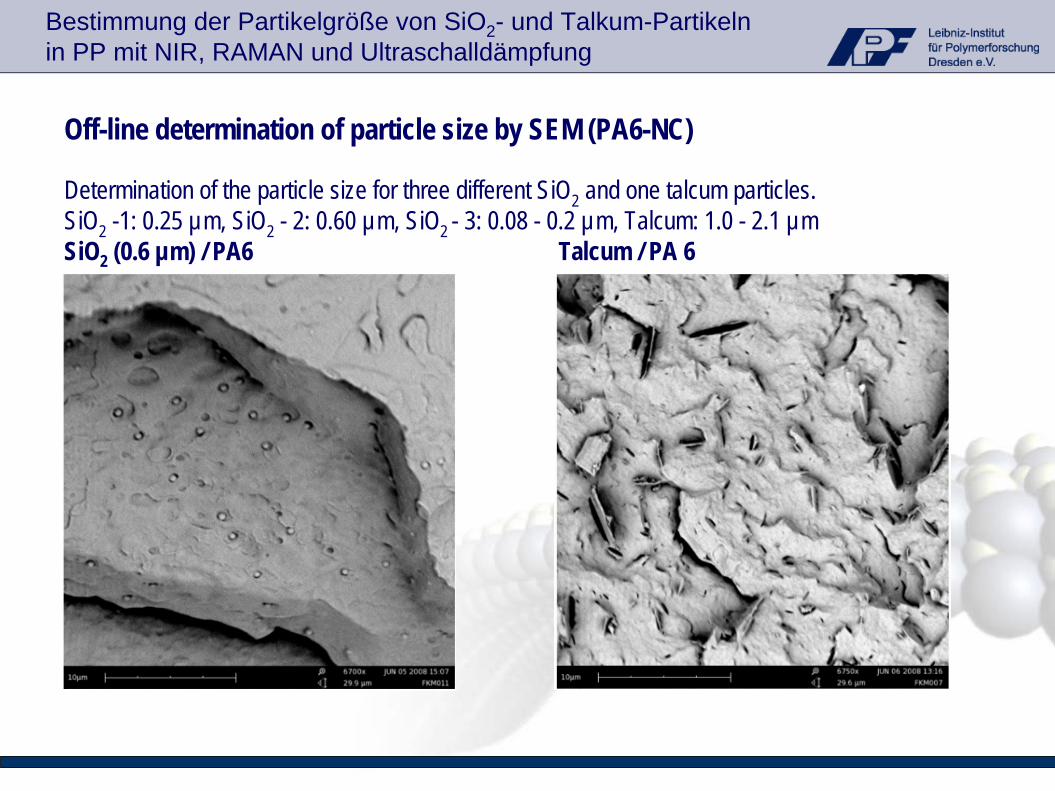
Off-line determination of particle size by SEM (PA6-NC)
Determination of the particle size for three different SiO2 and one talcum particles.SiO2 -1: 0.25 µm, SiO2 - 2: 0.60 µm, SiO2 - 3: 0.08 - 0.2 µm, Talcum: 1.0 - 2.1 µmSiO2 (0.6 µm) / PA6 Talcum / PA 6
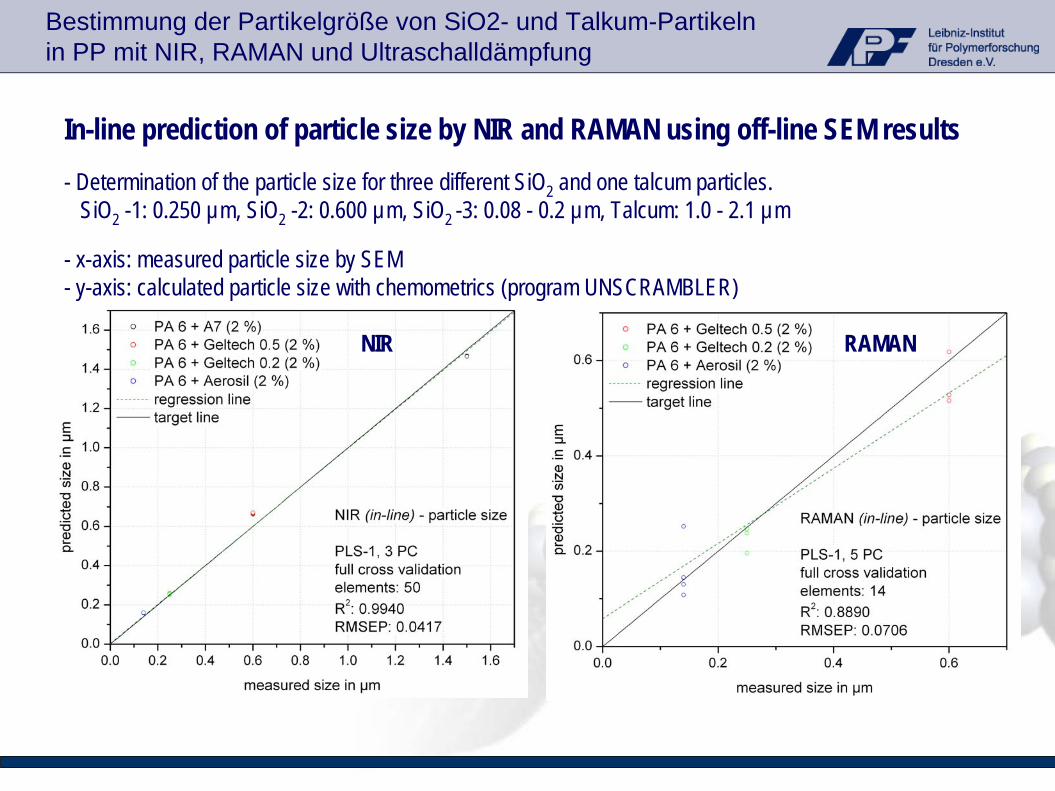
In-line prediction of particle size by NIR and RAMAN using off-line SEM results- Determination of the particle size for three different SiO2 and one talcum particles.
SiO2 -1: 0.250 µm, SiO2 -2: 0.600 µm, SiO2 -3: 0.08 - 0.2 µm, Talcum: 1.0 - 2.1 µm
- x-axis: measured particle size by SEM- y-axis: calculated particle size with chemometrics (program UNSCRAMBLER)
NIR RAMAN
Bestimmung der Partikelgröße von SiO2- und Talkum-Partikelnin PP mit NIR, RAMAN und Ultraschalldämpfung
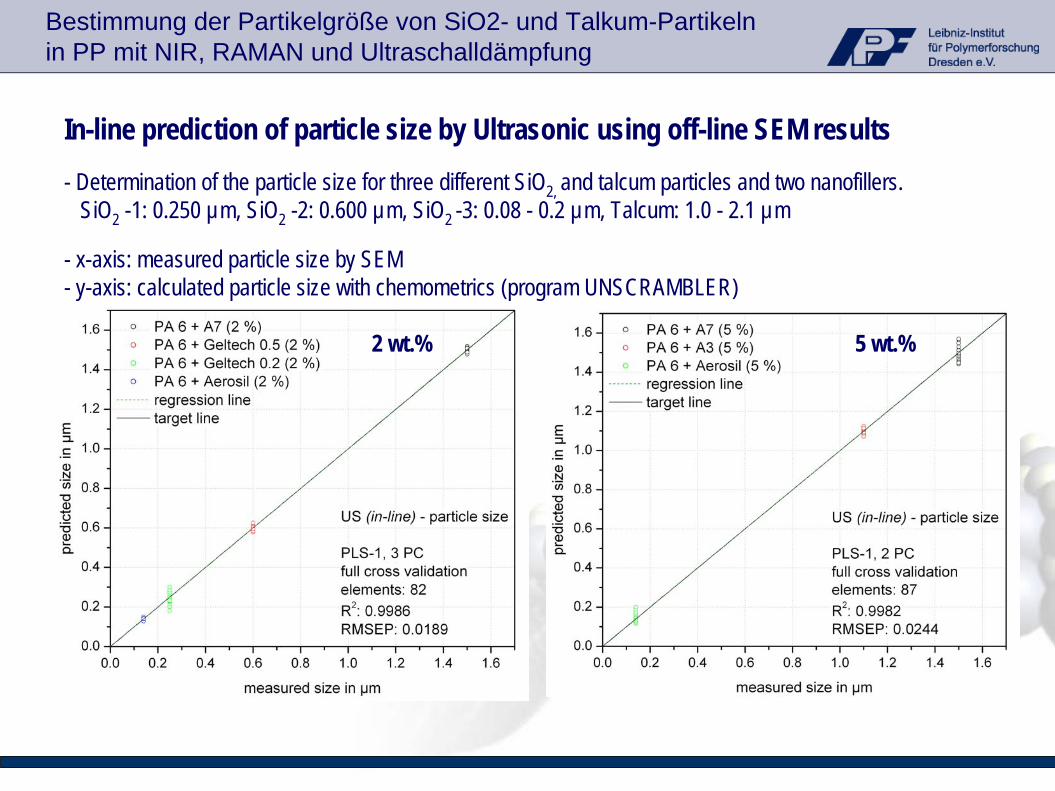
In-line prediction of particle size by Ultrasonic using off-line SEM results- Determination of the particle size for three different SiO2, and talcum particles and two nanofillers.
SiO2 -1: 0.250 µm, SiO2 -2: 0.600 µm, SiO2 -3: 0.08 - 0.2 µm, Talcum: 1.0 - 2.1 µm
- x-axis: measured particle size by SEM - y-axis: calculated particle size with chemometrics (program UNSCRAMBLER)
2 wt.% 5 wt.%
Bestimmung der Partikelgröße von SiO2- und Talkum-Partikelnin PP mit NIR, RAMAN und Ultraschalldämpfung
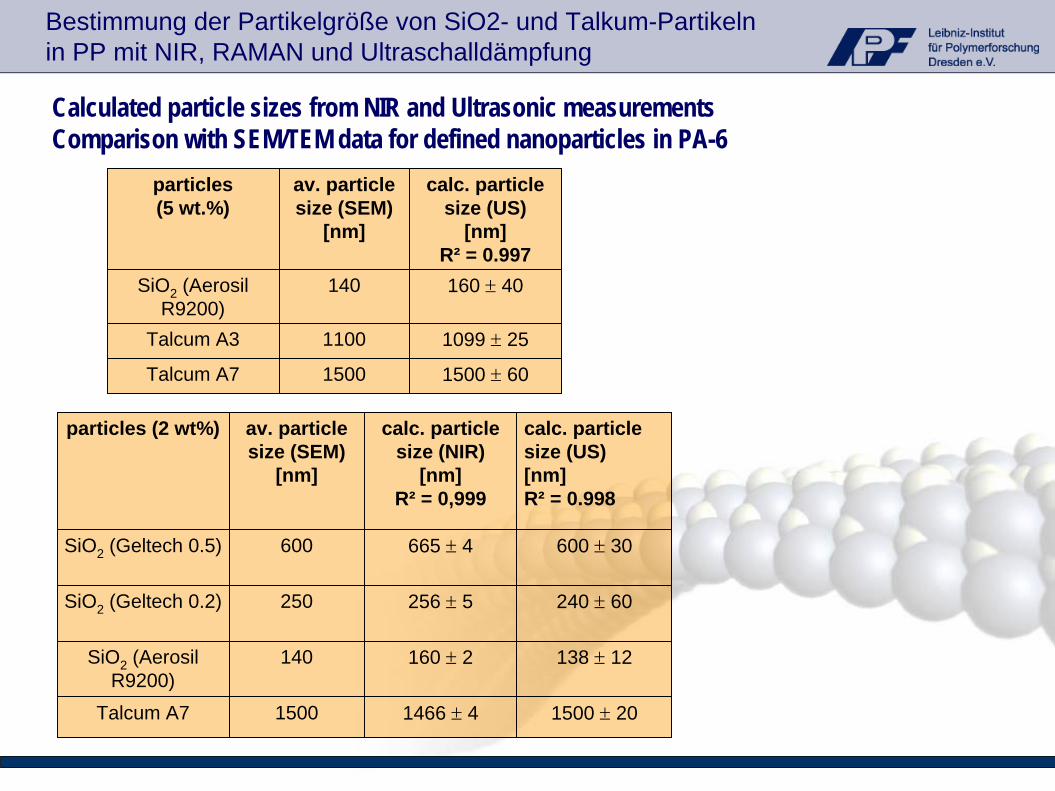
Calculated particle sizes from NIR and Ultrasonic measurements Comparison with SEM/TEM data for defined nanoparticles in PA-6
particles (5 wt.%)
av. particle size (SEM)
[nm]
calc. particle size (US)
[nm]R² = 0.997
SiO2 (Aerosil R9200)
140 160 ± 40
Talcum A3 1100 1099 ± 25
Talcum A7 1500 1500 ± 60
particles (2 wt%) av. particle size (SEM)
[nm]
calc. particle size (NIR)
[nm]R² = 0,999
calc. particle size (US) [nm]R² = 0.998
SiO2 (Geltech 0.5) 600 665 ± 4 600 ± 30
SiO2 (Geltech 0.2) 250 256 ± 5 240 ± 60
SiO2 (Aerosil R9200)
140 160 ± 2 138 ± 12
Talcum A7 1500 1466 ± 4 1500 ± 20
Bestimmung der Partikelgröße von SiO2- und Talkum-Partikelnin PP mit NIR, RAMAN und Ultraschalldämpfung
+
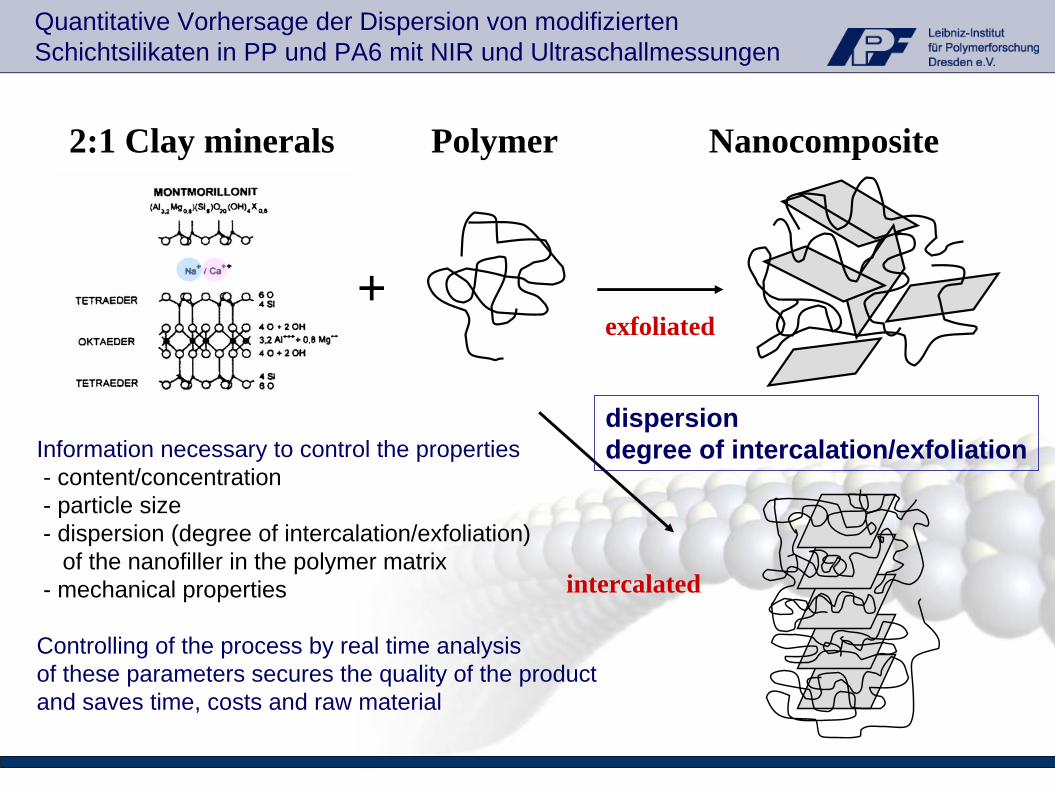
2:1 Clay minerals Polymer Nanocomposite
exfoliated
intercalated
dispersion degree of intercalation/exfoliation
Quantitative Vorhersage der Dispersion von modifizierten Schichtsilikaten in PP und PA6 mit NIR und Ultraschallmessungen
Information necessary to control the properties- content/concentration- particle size- dispersion (degree of intercalation/exfoliation)
of the nanofiller in the polymer matrix- mechanical properties
Controlling of the process by real time analysisof these parameters secures the quality of the productand saves time, costs and raw material
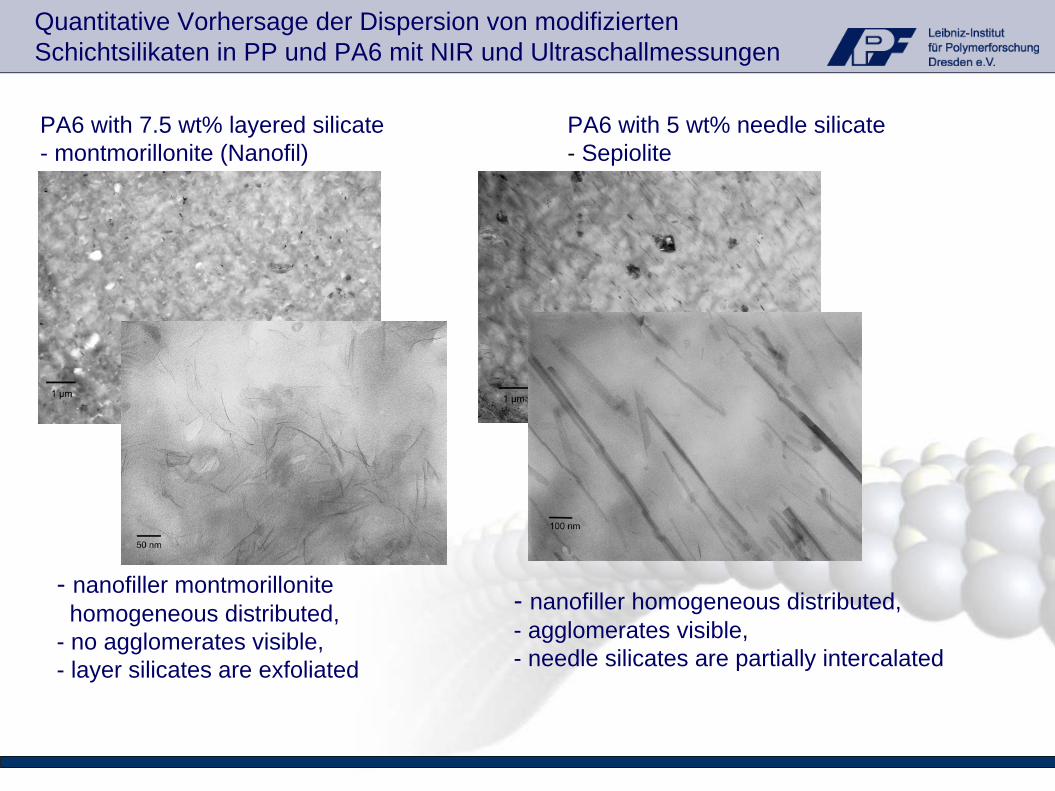
- nanofiller montmorillonitehomogeneous distributed,
- no agglomerates visible,- layer silicates are exfoliated
- nanofiller homogeneous distributed,- agglomerates visible,- needle silicates are partially intercalated
PA6 with 7.5 wt% layered silicate PA6 with 5 wt% needle silicate- montmorillonite (Nanofil) - Sepiolite
Quantitative Vorhersage der Dispersion von modifizierten Schichtsilikaten in PP und PA6 mit NIR und Ultraschallmessungen
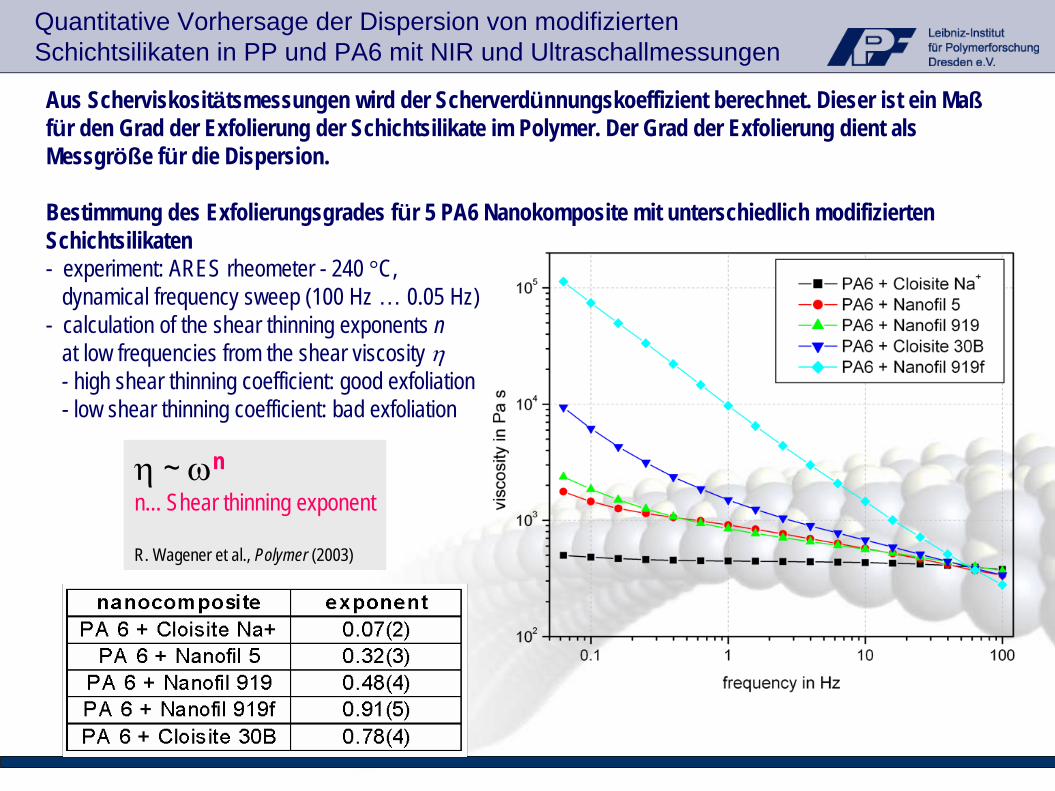
Aus Scherviskositätsmessungen wird der Scherverdünnungskoeffizient berechnet. Dieser ist ein Maß für den Grad der Exfolierung der Schichtsilikate im Polymer. Der Grad der Exfolierung dient als Messgröße für die Dispersion.
Bestimmung des Exfolierungsgrades für 5 PA6 Nanokomposite mit unterschiedlich modifizierten Schichtsilikaten- experiment: ARES rheometer - 240 °C,
dynamical frequency sweep (100 Hz … 0.05 Hz)- calculation of the shear thinning exponents n
at low frequencies from the shear viscosity η - high shear thinning coefficient: good exfoliation- low shear thinning coefficient: bad exfoliation
η ~ ωnn... Shear thinning exponent
R. Wagener et al., Polymer (2003)
Quantitative Vorhersage der Dispersion von modifizierten Schichtsilikaten in PP und PA6 mit NIR und Ultraschallmessungen
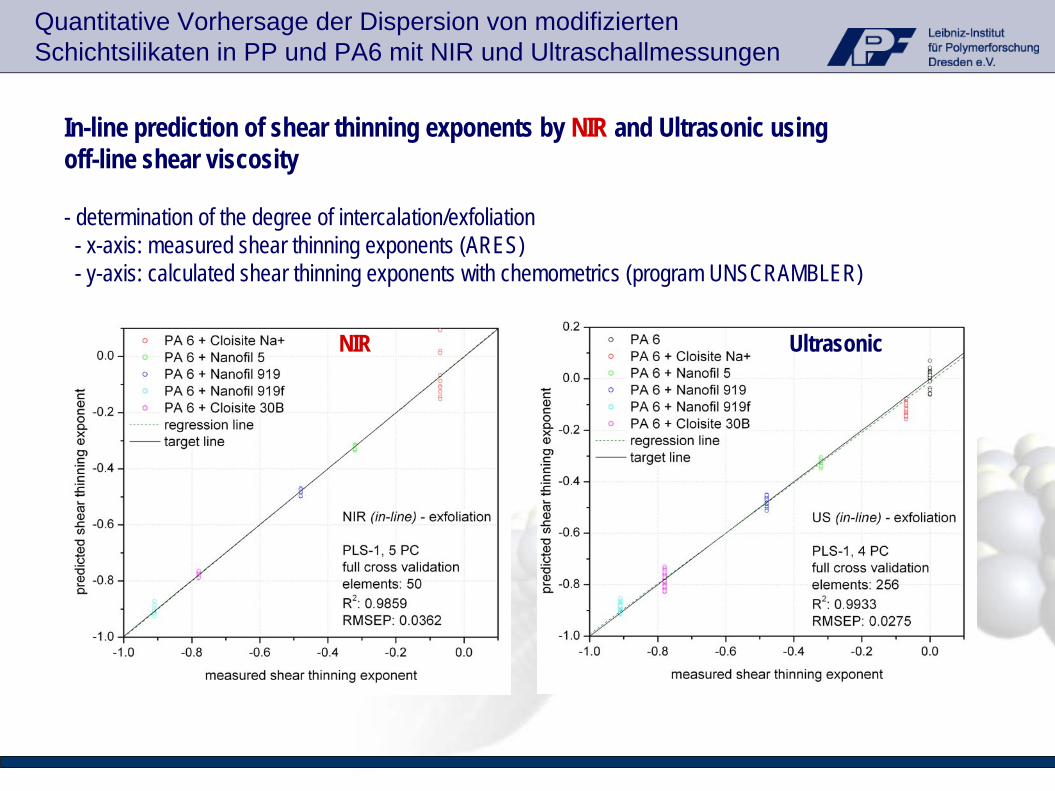
In-line prediction of shear thinning exponents by NIR and Ultrasonic using off-line shear viscosity
- determination of the degree of intercalation/exfoliation- x-axis: measured shear thinning exponents (ARES)- y-axis: calculated shear thinning exponents with chemometrics (program UNSCRAMBLER)
NIR Ultrasonic
Quantitative Vorhersage der Dispersion von modifizierten Schichtsilikaten in PP und PA6 mit NIR und Ultraschallmessungen
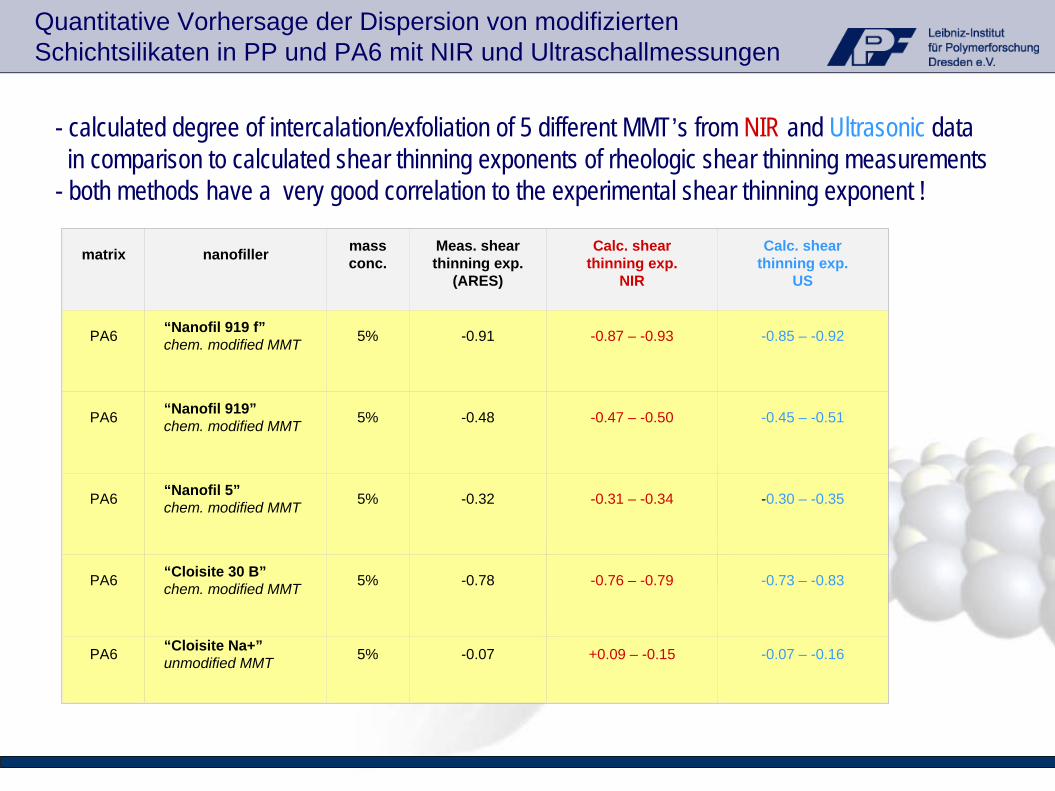
- calculated degree of intercalation/exfoliation of 5 different MMT’s from NIR and Ultrasonic data in comparison to calculated shear thinning exponents of rheologic shear thinning measurements
- both methods have a very good correlation to the experimental shear thinning exponent !
matrix nanofiller mass conc.
Meas. shear thinning exp.
(ARES)
Calc. shear thinning exp.
NIR
Calc. shear thinning exp.
US
PA6 “Nanofil 919 f”chem. modified MMT 5% -0.91 -0.87 – -0.93 -0.85 – -0.92
PA6 “Nanofil 919”chem. modified MMT 5% -0.48 -0.47 – -0.50 -0.45 – -0.51
PA6 “Nanofil 5”chem. modified MMT 5% -0.32 -0.31 – -0.34 -0.30 – -0.35
PA6 “Cloisite 30 B”chem. modified MMT 5% -0.78 -0.76 – -0.79 -0.73 – -0.83
PA6 “Cloisite Na+”unmodified MMT 5% -0.07 +0.09 – -0.15 -0.07 – -0.16
Quantitative Vorhersage der Dispersion von modifizierten Schichtsilikaten in PP und PA6 mit NIR und Ultraschallmessungen
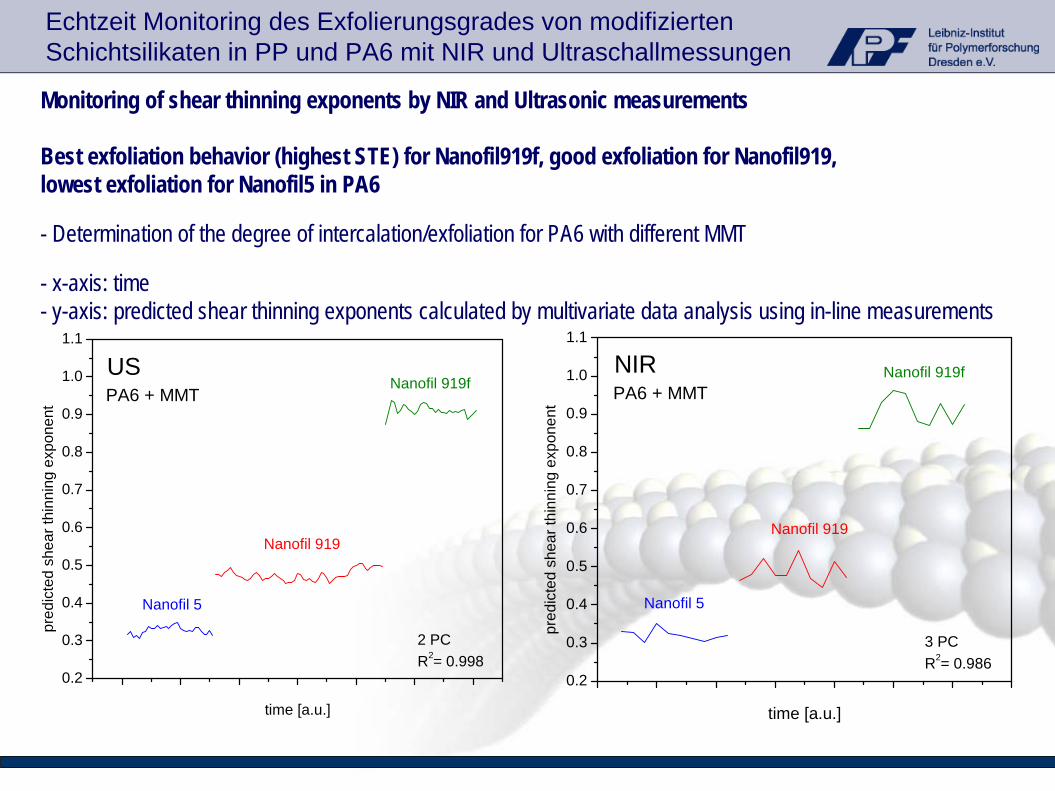
Monitoring of shear thinning exponents by NIR and Ultrasonic measurements
Best exfoliation behavior (highest STE) for Nanofil919f, good exfoliation for Nanofil919, lowest exfoliation for Nanofil5 in PA6
- Determination of the degree of intercalation/exfoliation for PA6 with different MMT
- x-axis: time- y-axis: predicted shear thinning exponents calculated by multivariate data analysis using in-line measurements
Echtzeit Monitoring des Exfolierungsgrades von modifizierten Schichtsilikaten in PP und PA6 mit NIR und Ultraschallmessungen
0.2
0.3
0.4
0.5
0.6
0.7
0.8
0.9
1.0
1.1
Nanofil 5
Nanofil 919
Nanofil 919f
2 PCR2= 0.998
pred
icte
d sh
ear t
hinn
ing
expo
nent
time [a.u.]
USPA6 + MMT
0.2
0.3
0.4
0.5
0.6
0.7
0.8
0.9
1.0
1.1
Nanofil 919f
Nanofil 919
Nanofil 5
3 PCR2= 0.986
pred
icte
d sh
ear t
hinn
ing
expo
nent
time [a.u.]
NIRPA6 + MMT

Determination of the degree of intercalation/exfoliation of mPP/C20A with 3 different screw speeds
- Experiment: ARES rheometer - 220 °C, dynamical frequency sweep (100 Hz … 0.05 Hz)- Calculation of the shear thinning exponents n at low frequencies from the shear viscosity η (precondition: same nanofiller content, 5 wt.% inorganic content)
nanocomposite exponent
PPm + Cloisite 20A (100 rpm) 0.14 ± 0.02
PPm + Cloisite 20A (200 rpm) 0.22 ± 0.03
PPm + Cloisite 20A (300 rpm) 0.40 ± 0.05
η~ ωn
n... Shear thinning exponent (STE)η... shear viscosityω... frequency
STE = 0, no exfoliation
STE = 1, good exfoliation
STE is a quantitative value for the state of exfoliation
Quantitative Vorhersage der Dispersion von modifizierten Schichtsilikaten in PP und PA6 mit NIR und Ultraschallmessungen
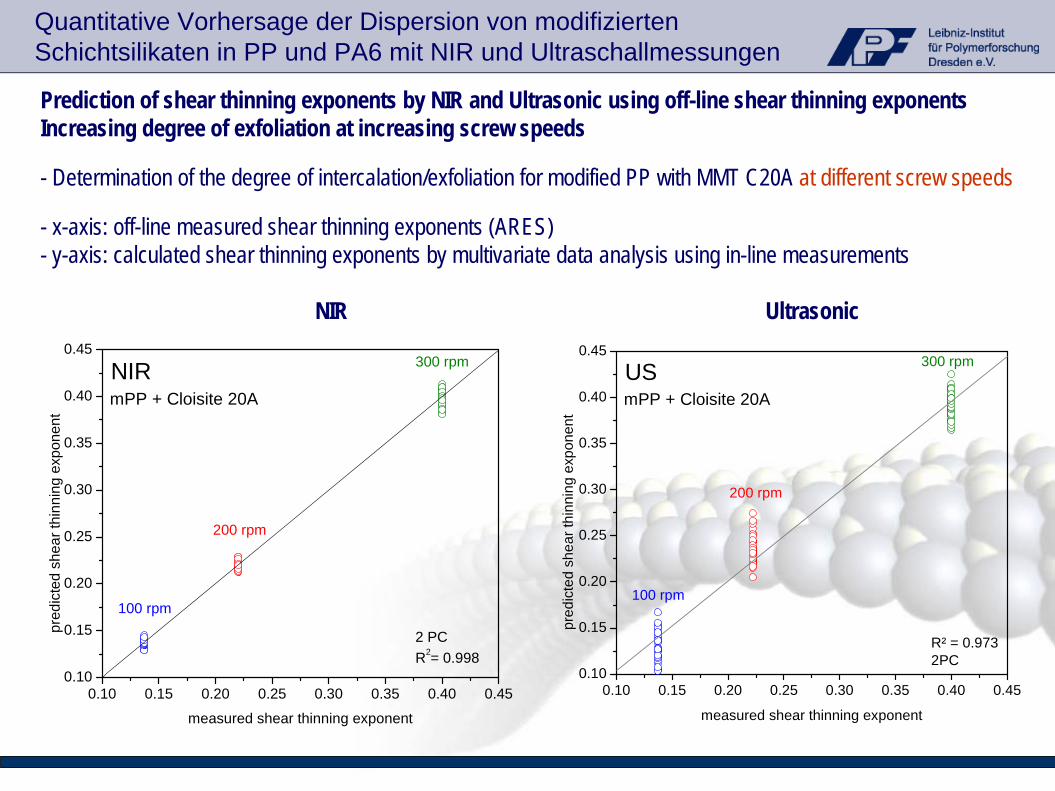
Prediction of shear thinning exponents by NIR and Ultrasonic using off-line shear thinning exponents Increasing degree of exfoliation at increasing screw speeds
- Determination of the degree of intercalation/exfoliation for modified PP with MMT C20A at different screw speeds
- x-axis: off-line measured shear thinning exponents (ARES)- y-axis: calculated shear thinning exponents by multivariate data analysis using in-line measurements
NIR Ultrasonic
0.10 0.15 0.20 0.25 0.30 0.35 0.40 0.450.10
0.15
0.20
0.25
0.30
0.35
0.40
0.45
pred
icte
d sh
ear t
hinn
ing
expo
nent
measured shear thinning exponent
2 PCR2= 0.998
300 rpm
200 rpm
100 rpm
NIRmPP + Cloisite 20A
0.10 0.15 0.20 0.25 0.30 0.35 0.40 0.450.10
0.15
0.20
0.25
0.30
0.35
0.40
0.45300 rpm
200 rpm
100 rpm
pred
icte
d sh
ear t
hinn
ing
expo
nent
measured shear thinning exponent
USmPP + Cloisite 20A
R² = 0.9732PC
Quantitative Vorhersage der Dispersion von modifizierten Schichtsilikaten in PP und PA6 mit NIR und Ultraschallmessungen
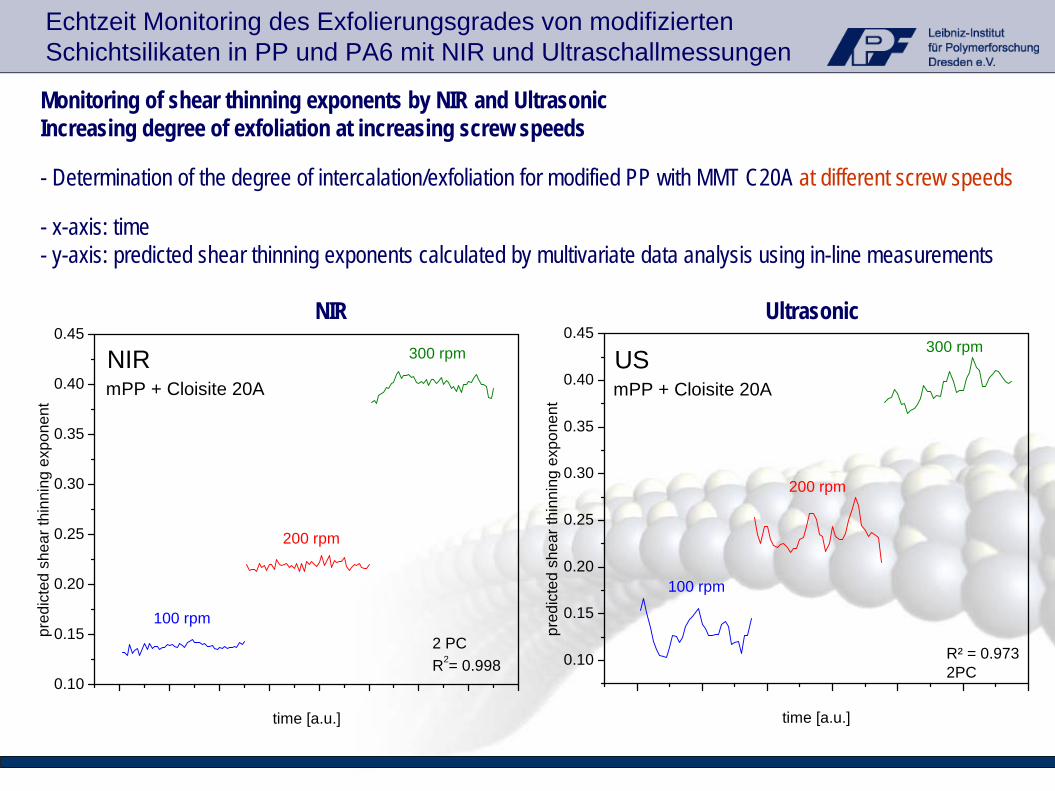
Monitoring of shear thinning exponents by NIR and UltrasonicIncreasing degree of exfoliation at increasing screw speeds
- Determination of the degree of intercalation/exfoliation for modified PP with MMT C20A at different screw speeds
- x-axis: time- y-axis: predicted shear thinning exponents calculated by multivariate data analysis using in-line measurements
NIR Ultrasonic
0.10
0.15
0.20
0.25
0.30
0.35
0.40
0.45
pred
icte
d sh
ear t
hinn
ing
expo
nent
time [a.u.]
300 rpm
200 rpm
100 rpm
USmPP + Cloisite 20A
R² = 0.9732PC
0.10
0.15
0.20
0.25
0.30
0.35
0.40
0.45
pred
icte
d sh
ear t
hinn
ing
expo
nent
time [a.u.]
2 PCR2= 0.998
300 rpm
200 rpm
100 rpm
NIRmPP + Cloisite 20A
Echtzeit Monitoring des Exfolierungsgrades von modifizierten Schichtsilikaten in PP und PA6 mit NIR und Ultraschallmessungen
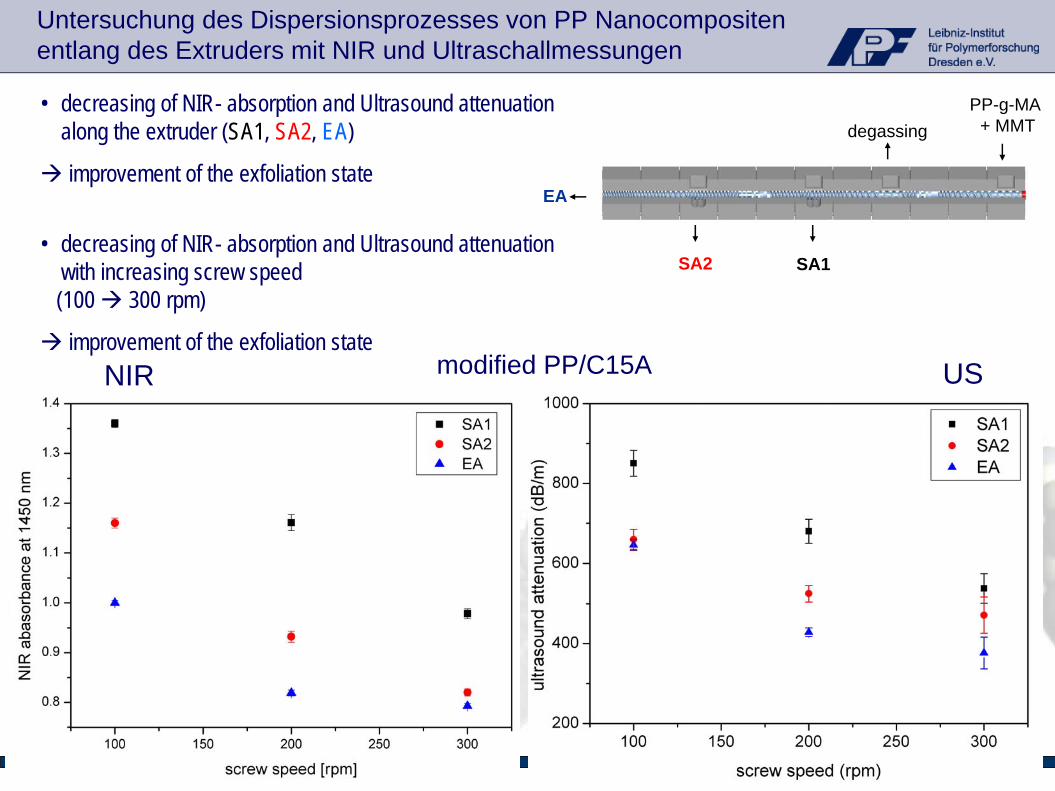
modified PP/C15A
PP-g-MA+ MMTdegassing
SA1SA2
EA
NIR US
• decreasing of NIR- absorption and Ultrasound attenuation along the extruder (SA1, SA2, EA)
improvement of the exfoliation state
• decreasing of NIR- absorption and Ultrasound attenuation with increasing screw speed(100 300 rpm)
improvement of the exfoliation state
Untersuchung des Dispersionsprozesses von PP Nanocompositen entlang des Extruders mit NIR und Ultraschallmessungen
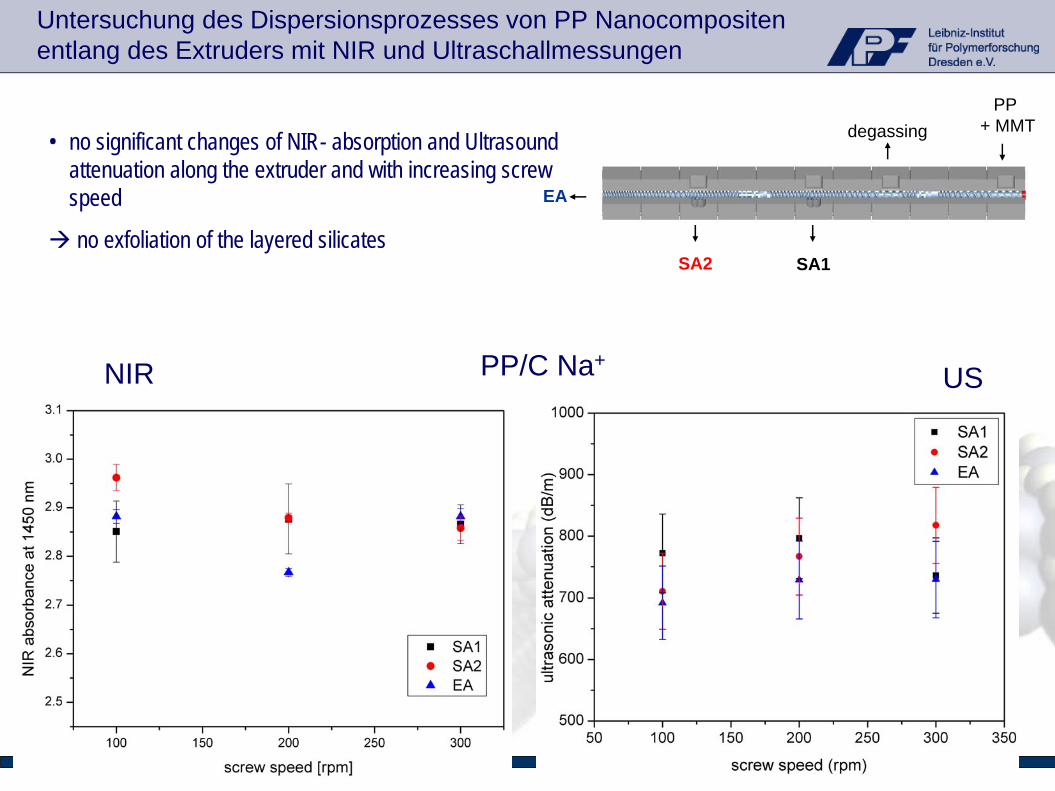
PP/C Na+NIR US
• no significant changes of NIR- absorption and Ultrasound attenuation along the extruder and with increasing screw speed
no exfoliation of the layered silicates
PP+ MMTdegassing
SA1SA2
EA
Untersuchung des Dispersionsprozesses von PP Nanocompositen entlang des Extruders mit NIR und Ultraschallmessungen
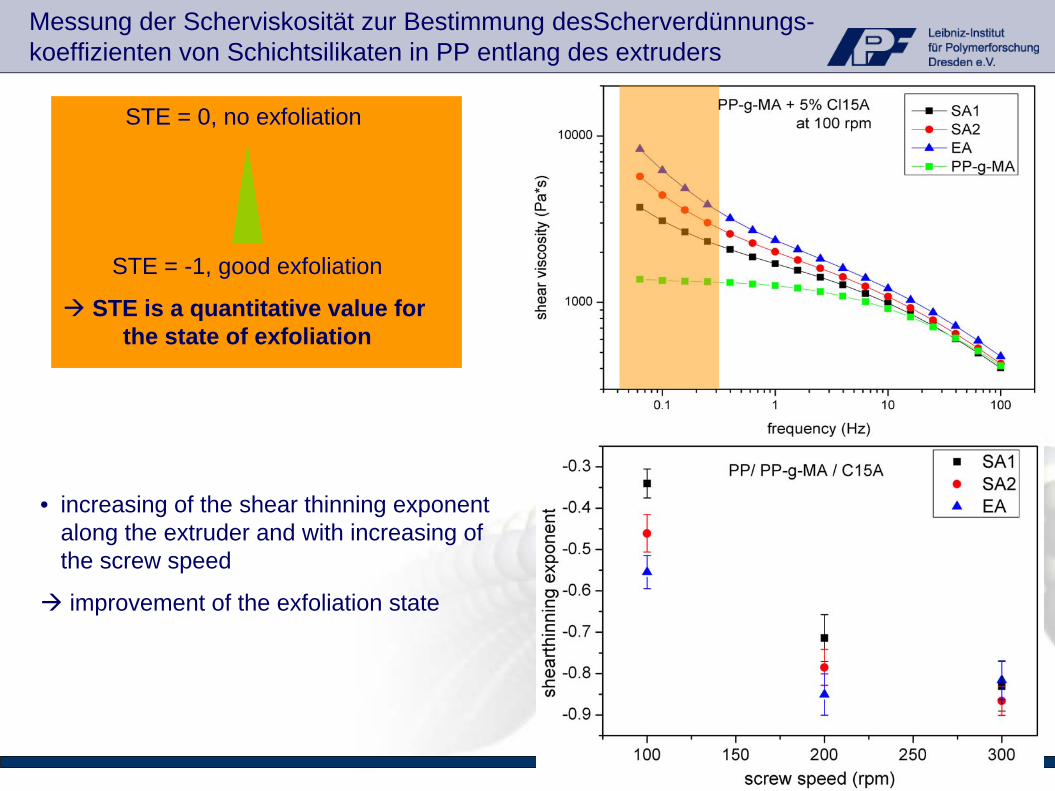
STE = 0, no exfoliation
STE = -1, good exfoliation
STE is a quantitative value for the state of exfoliation
Messung der Scherviskosität zur Bestimmung desScherverdünnungs- koeffizienten von Schichtsilikaten in PP entlang des extruders
• increasing of the shear thinning exponent along the extruder and with increasing of the screw speed
improvement of the exfoliation state
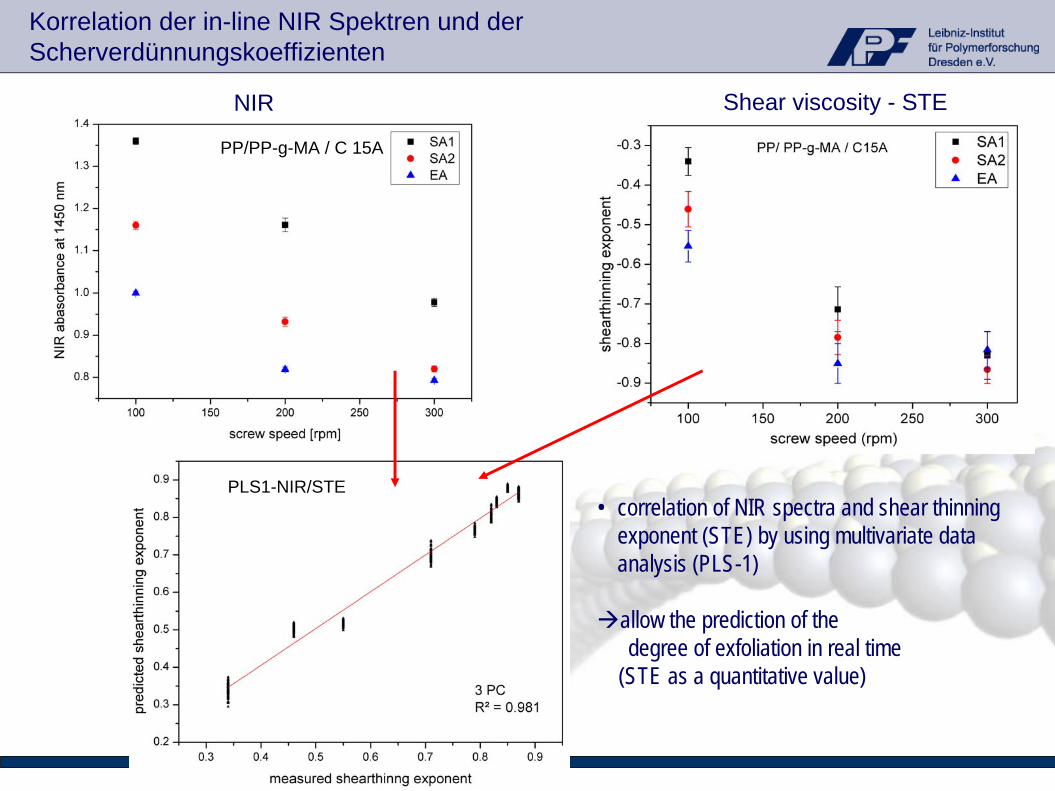
Shear viscosity - STE
PLS1-NIR/STE
NIR
PP/PP-g-MA / C 15A
• correlation of NIR spectra and shear thinning exponent (STE) by using multivariate data analysis (PLS-1)
allow the prediction of thedegree of exfoliation in real time
(STE as a quantitative value)
PLS1-NIR/STE
Korrelation der in-line NIR Spektren und der Scherverdünnungskoeffizienten
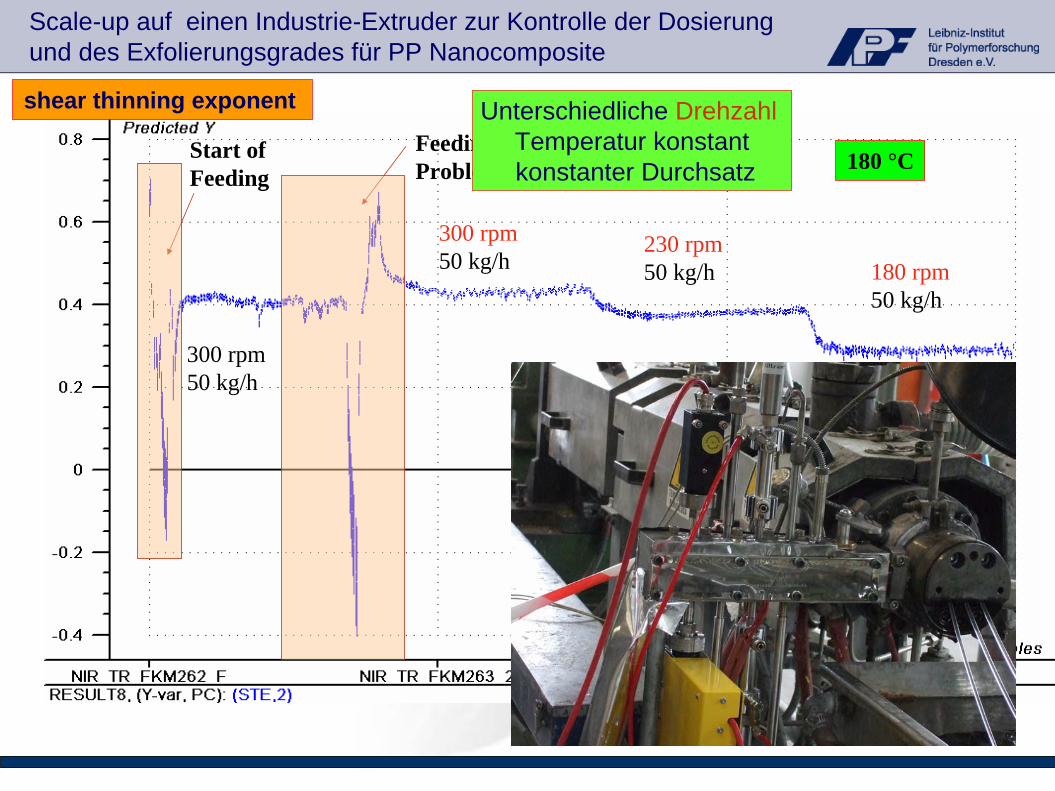
FeedingProblem
Start ofFeeding
300 rpm50 kg/h
300 rpm50 kg/h
230 rpm50 kg/h 180 rpm
50 kg/h
shear thinning exponent
180 °C
Scale-up auf einen Industrie-Extruder zur Kontrolle der Dosierung und des Exfolierungsgrades für PP Nanocomposite
Unterschiedliche Drehzahl Temperatur konstantkonstanter Durchsatz
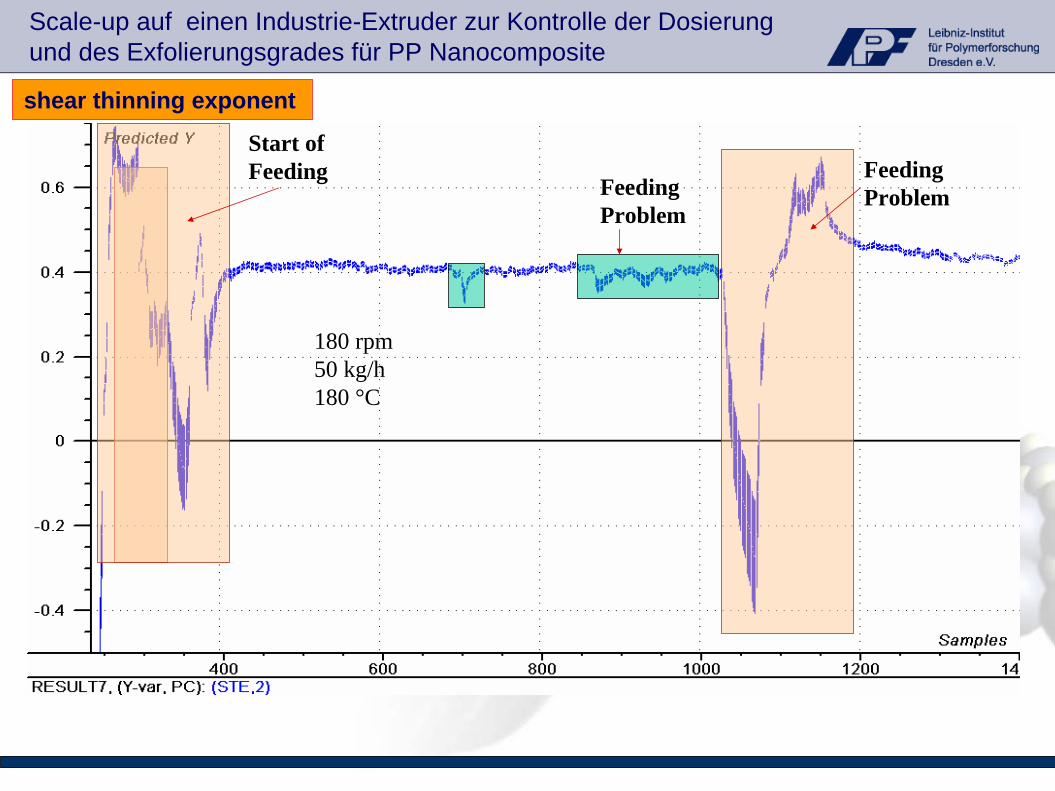
FeedingProblem
Start of Feeding
180 rpm50 kg/h180 °C
FeedingProblem
Scale-up auf einen Industrie-Extruder zur Kontrolle der Dosierung und des Exfolierungsgrades für PP Nanocomposite
shear thinning exponent
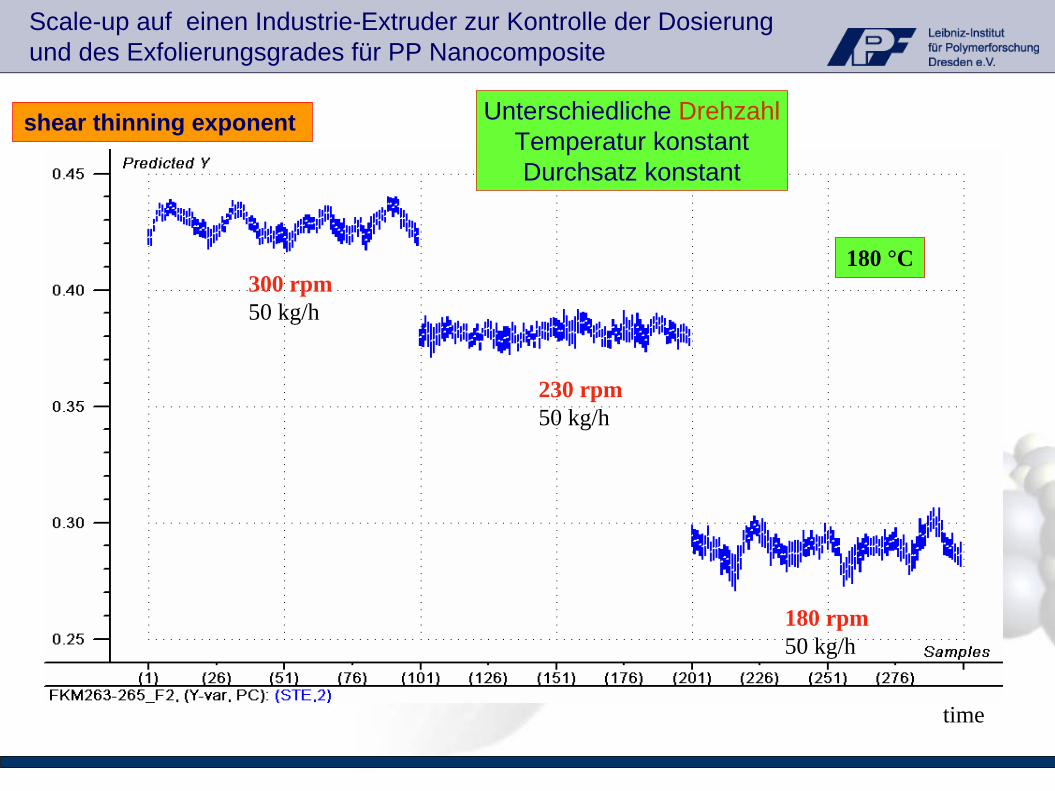
300 rpm50 kg/h
230 rpm50 kg/h
180 rpm50 kg/h
time
180 °C
Scale-up auf einen Industrie-Extruder zur Kontrolle der Dosierung und des Exfolierungsgrades für PP Nanocomposite
shear thinning exponent Unterschiedliche DrehzahlTemperatur konstantDurchsatz konstant
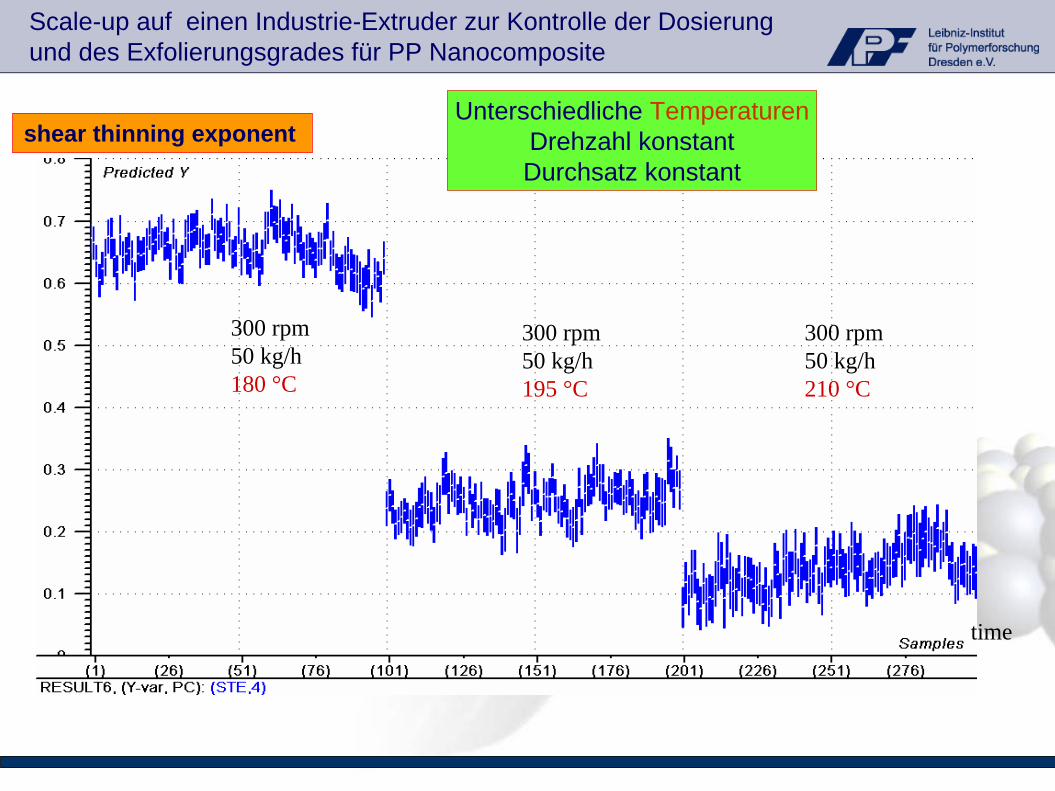
300 rpm50 kg/h180 °C
300 rpm50 kg/h195 °C
300 rpm50 kg/h210 °C
time
Scale-up auf einen Industrie-Extruder zur Kontrolle der Dosierung und des Exfolierungsgrades für PP Nanocomposite
shear thinning exponentUnterschiedliche Temperaturen
Drehzahl konstantDurchsatz konstant
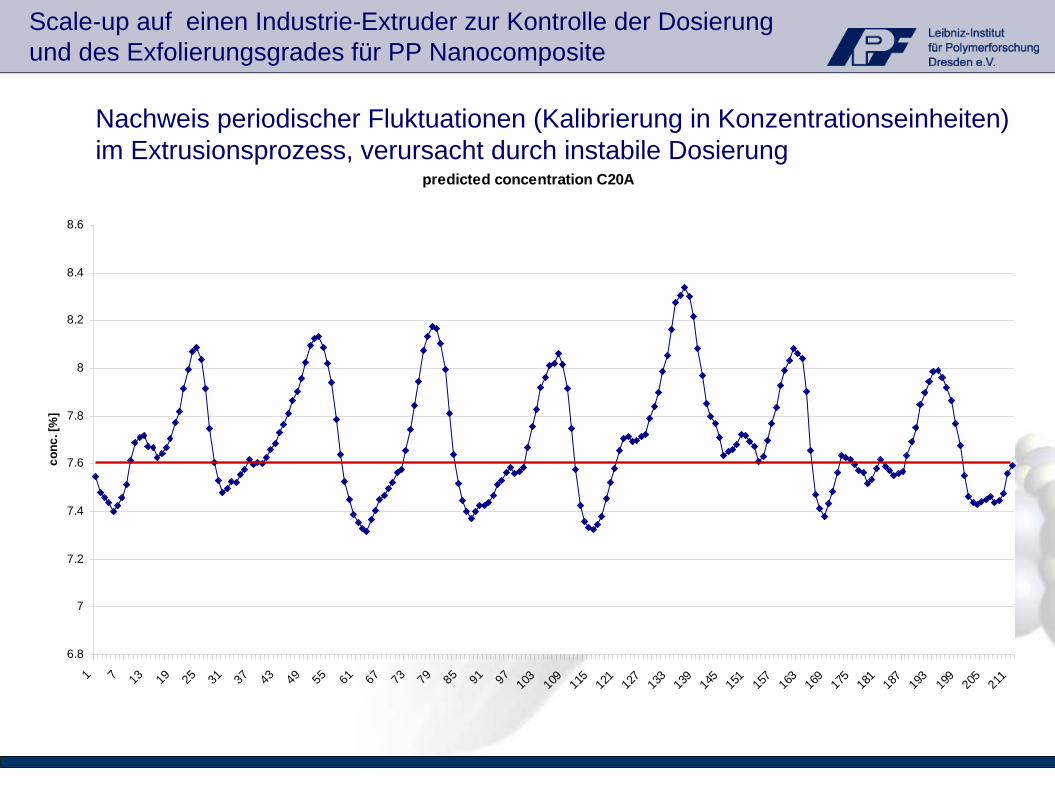
Nachweis periodischer Fluktuationen (Kalibrierung in Konzentrationseinheiten) im Extrusionsprozess, verursacht durch instabile Dosierung
predicted concentration C20A
6.8
7
7.2
7.4
7.6
7.8
8
8.2
8.4
8.6
1 7 13 19 25 31 37 43 49 55 61 67 73 79 85 91 97 103 109
115 121
127
133
139
145
151
157
163
169
175
181
187
193
199
205
211
conc
. [%
]
Scale-up auf einen Industrie-Extruder zur Kontrolle der Dosierung und des Exfolierungsgrades für PP Nanocomposite
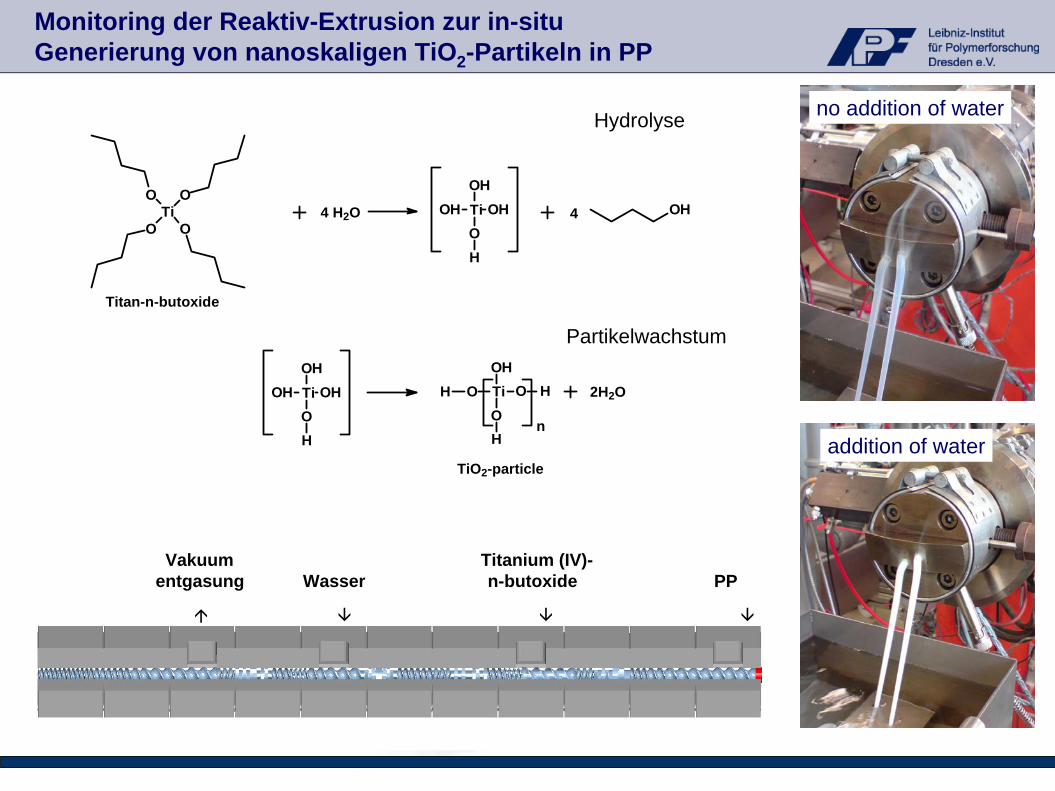
Vakuum Titanium (IV)-entgasung Wasser n-butoxide PP
Hydrolyse
Partikelwachstum
OTi
OO
OOHTiOH OH
OH
OH
4 H2O 4
n
O TiOH
OH O H
H
Titan-n-butoxide
TiO2-particle
2H2OTiOH OHOH
OH
addition of water
no addition of water
Monitoring der Reaktiv-Extrusion zur in-situ Generierung von nanoskaligen TiO2 -Partikeln in PP
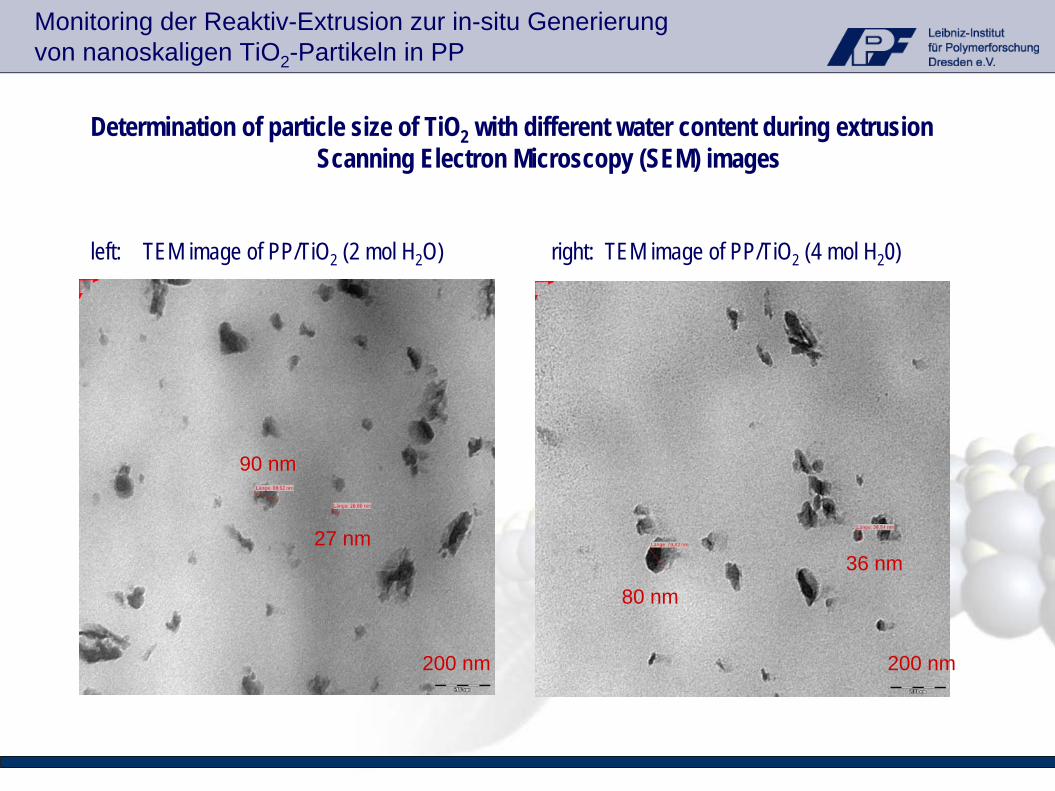
Determination of particle size of TiO2 with different water content during extrusionScanning Electron Microscopy (SEM) images
left: TEM image of PP/TiO2 (2 mol H2 O) right: TEM image of PP/TiO2 (4 mol H2 0)
27 nm
90 nm
80 nm36 nm
200 nm200 nm
Monitoring der Reaktiv-Extrusion zur in-situ Generierung von nanoskaligen TiO2 -Partikeln in PP
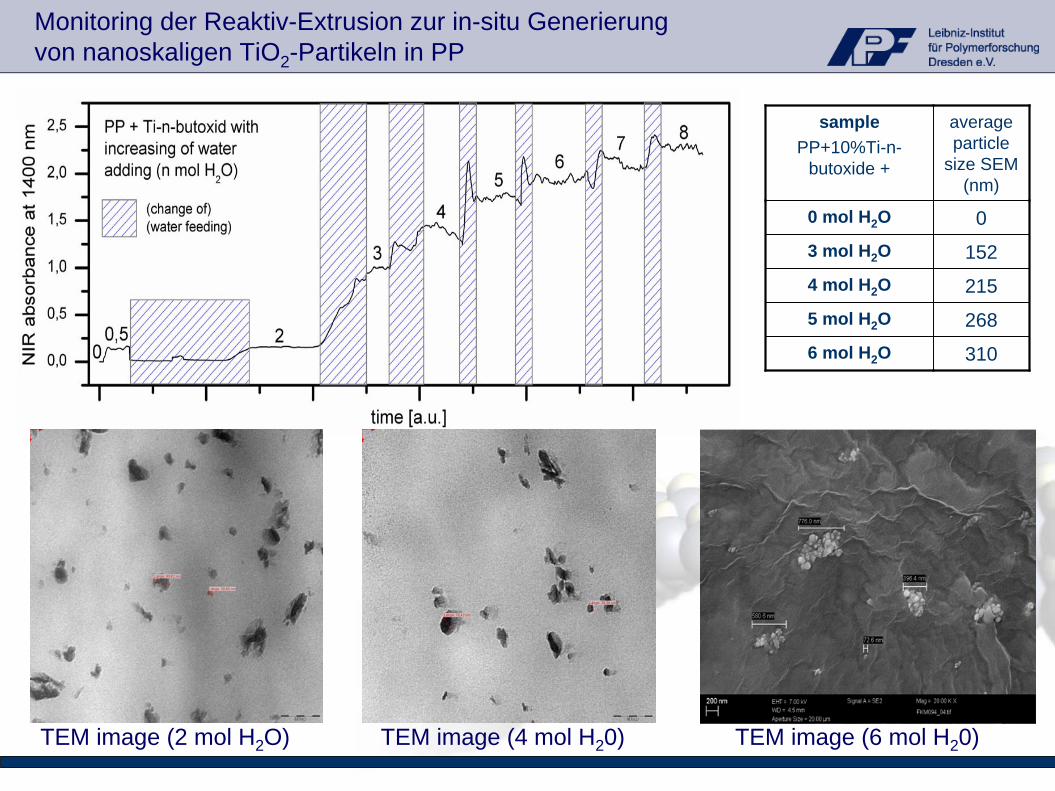
samplePP+10%Ti-n-
butoxide +
average particle
size SEM (nm)
0 mol H2 O 03 mol H2 O 1524 mol H2 O 2155 mol H2 O 2686 mol H2 O 310
TEM image (2 mol H2 O) TEM image (4 mol H2 0) TEM image (6 mol H2 0)
Monitoring der Reaktiv-Extrusion zur in-situ Generierung von nanoskaligen TiO2 -Partikeln in PP
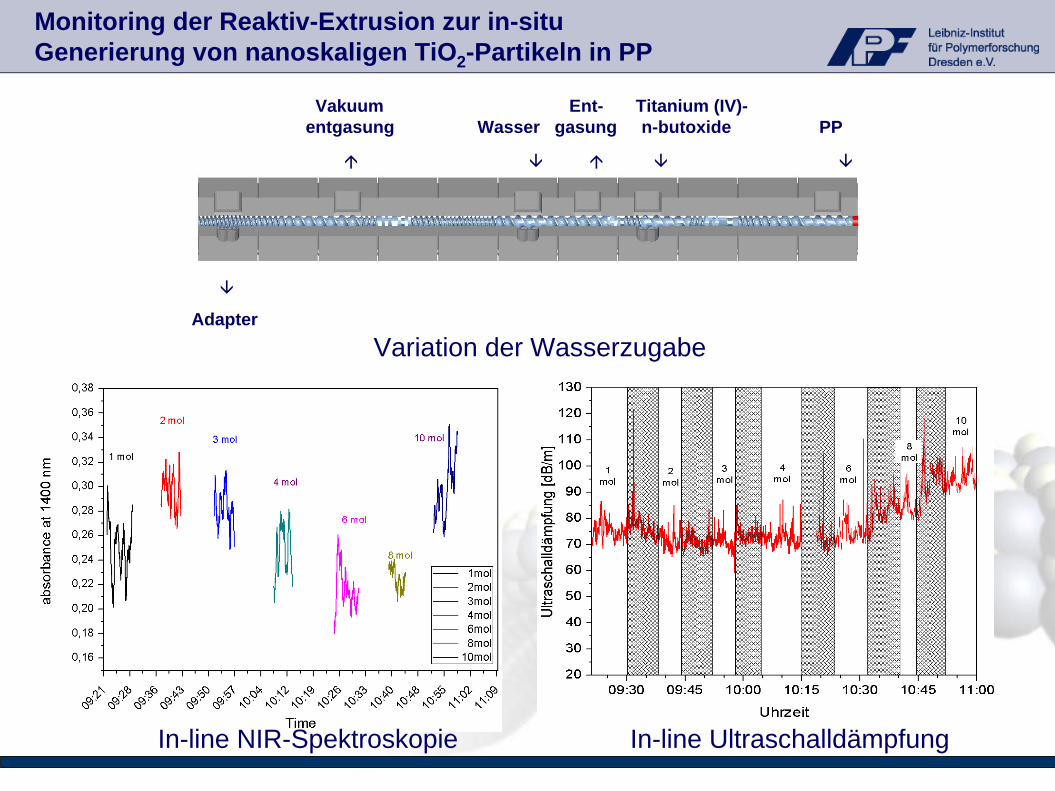
Vakuum Ent- Titanium (IV)-entgasung Wasser gasung n-butoxide PP
Adapter
Variation der Wasserzugabe
In-line NIR-Spektroskopie In-line Ultraschalldämpfung
Monitoring der Reaktiv-Extrusion zur in-situ Generierung von nanoskaligen TiO2 -Partikeln in PP
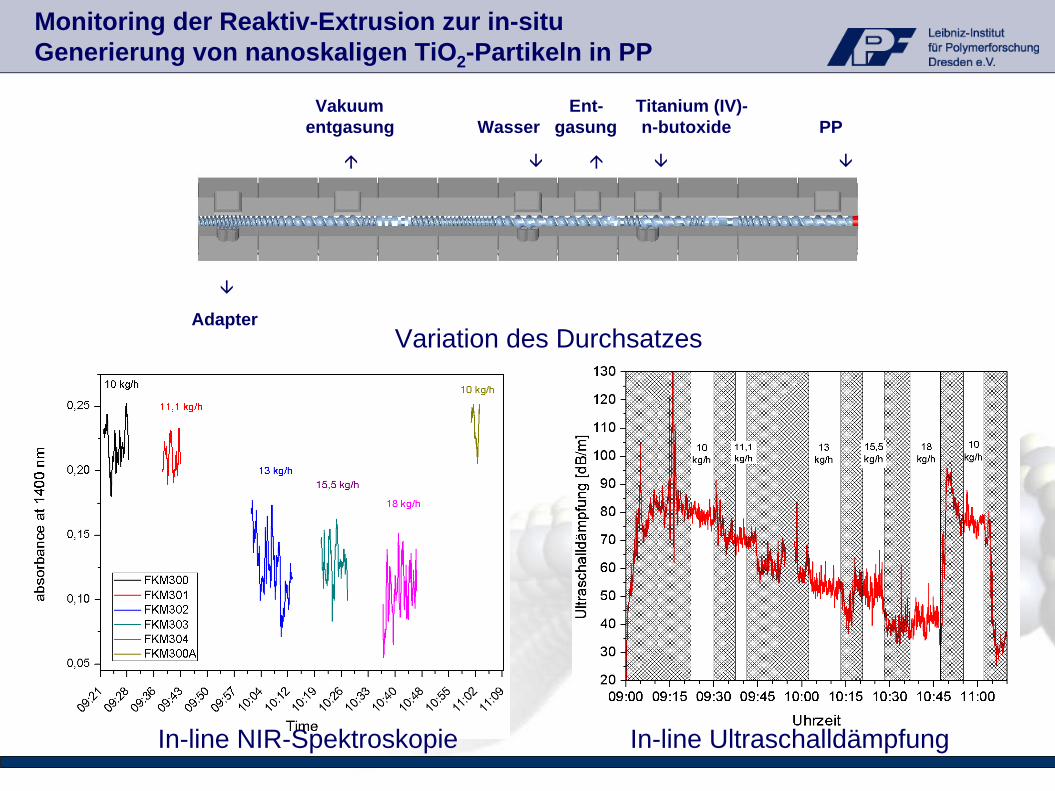
Variation des Durchsatzes
Vakuum Ent- Titanium (IV)-entgasung Wasser gasung n-butoxide PP
Adapter
In-line NIR-Spektroskopie In-line Ultraschalldämpfung
Monitoring der Reaktiv-Extrusion zur in-situ Generierung von nanoskaligen TiO2 -Partikeln in PP
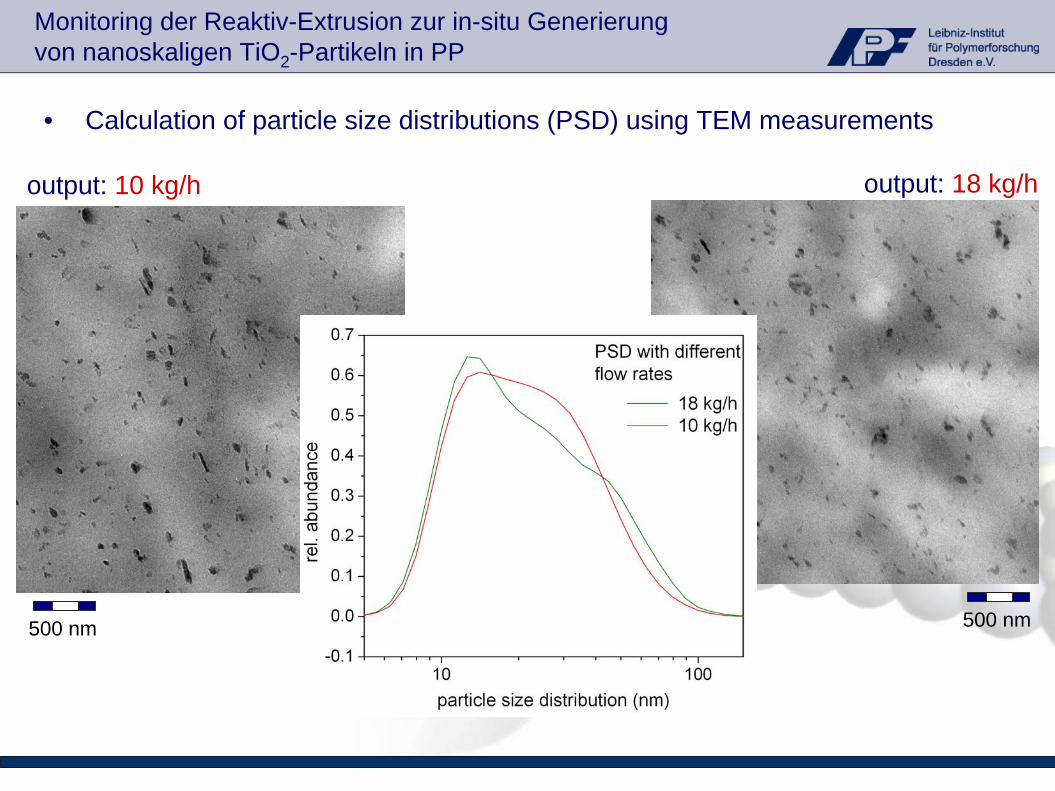
500 nm500 nm
output: 10 kg/h output: 18 kg/h
• Calculation of particle size distributions (PSD) using TEM measurements
Monitoring der Reaktiv-Extrusion zur in-situ Generierung von nanoskaligen TiO2 -Partikeln in PP
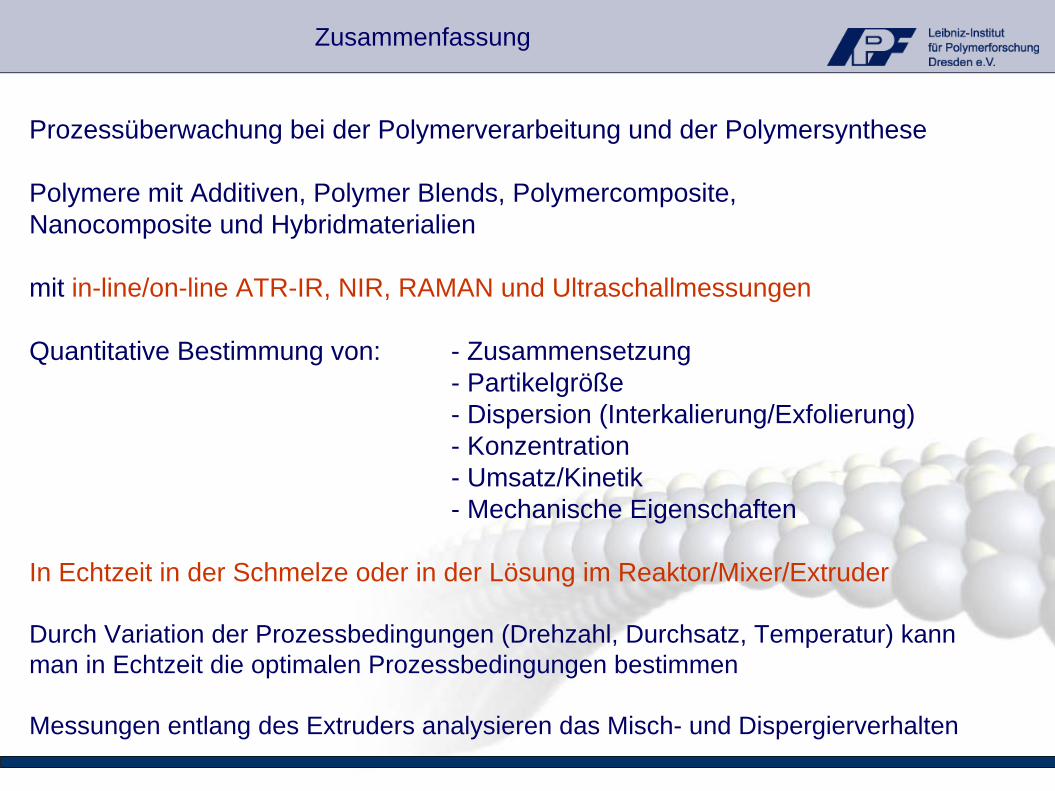
Prozessüberwachung bei der Polymerverarbeitung und der Polymersynthese
Polymere mit Additiven, Polymer Blends, Polymercomposite, Nanocomposite und Hybridmaterialien
mit in-line/on-line ATR-IR, NIR, RAMAN und Ultraschallmessungen
Quantitative Bestimmung von: - Zusammensetzung- Partikelgröße- Dispersion (Interkalierung/Exfolierung)- Konzentration- Umsatz/Kinetik- Mechanische Eigenschaften
In Echtzeit in der Schmelze oder in der Lösung im Reaktor/Mixer/Extruder
Durch Variation der Prozessbedingungen (Drehzahl, Durchsatz, Temperatur) kann man in Echtzeit die optimalen Prozessbedingungen bestimmen
Messungen entlang des Extruders analysieren das Misch- und Dispergierverhalten
Zusammenfassung
Danke für ihre Aufmerksamkeit !
Dank an Mitarbeiter und Partner:
D. Pahlitzsch, K. SahreIPF Dresden
U. Kirschner, S. SowinskiSENTRONIC GmbH Dresden(NIR)
I. Alig, D. Lellinger, B. SteinhoffDKI Darmstadt (Ultraschallmessungen)