INCORPORATION OF ENVIRONMENTAL SUSTAINABILITY IN...
199
INSTITUTE FÜR LANWIRTSCHAFTLICHE BETRIEBSLEHRE - PROJEKT- UND REGIONALPLANNUNG - DER JUSTUS-LIEBIG-UNIVERSITÄT, GIESSEN INCORPORATION OF ENVIRONMENTAL SUSTAINABILITY IN COST-BENEFIT ANALYSIS FOR DEVELOPMENT PROJECTS Inaugural Dissertation zur Erlangung des Doktorgrades im Fachbereich Agrarwissenschaften, Ökotrophologie und Umweltmanagement der Justus-Liebig-Universität, Giessen Eingereicht von: Julio Guzmán Martínez Betreut von: Prof. Dr. Siegfried Bauer Giessen, 2001
Transcript of INCORPORATION OF ENVIRONMENTAL SUSTAINABILITY IN...

INSTITUTE FÜR LANWIRTSCHAFTLICHE BETRIEBSLEHRE - PROJEKT- UND REGIONALPLANNUNG -
DER JUSTUS-LIEBIG-UNIVERSITÄT, GIESSEN
INCORPORATION OF ENVIRONMENTAL SUSTAINABILITY IN COST-BENEFIT ANALYSIS FOR DEVELOPMENT PROJECTS
Inaugural Dissertation zur Erlangung des Doktorgrades
im Fachbereich Agrarwissenschaften, Ökotrophologie und Umweltmanagement der
Justus-Liebig-Universität, Giessen Eingereicht von: Julio Guzmán Martínez Betreut von: Prof. Dr. Siegfried Bauer
Giessen, 2001

ii
ABOUT THE AUTHOR Julio Guzmán ([email protected]) was born in Costa Rica in 1963. He obtained a bachelor degree in 1986 and ”licenciatura” (postgraduate studies) in 1987 in Agricultural Economics at the University of Costa Rica; the title of his thesis was ”Technical and financial analysis of papaya production in Cañas, Costa Rica”. He completed postgraduate studies in International Development Policy in 1990 and obtained a Master of Environmental Management (resource economics/policy) in 1992 at Duke University in North Caroline; the title of his graduate project was ”Financial and economic analysis of a community-operated ecotourism project in Costa Rica”. From 1997 to 2001, he joined a Ph. D. Program at the Justus Liebig Universität Giessen. From 1986 to 1990, he performed as a national economist for the Ministry of Natural Resources and Madeleña Project (USAID/CATIE/ROCAP) in Costa Rica. From 1992 to 1993, he worked as an environmental specialist for the Organization of the American States (OAS) in Washington D.C., and 1993 through 1994 as a resource economics specialist for the Foundation of the University of Costa Rica for Research. From 1994 to 1996, he was employed as an international coordinator of an environmental project in Ecuador for the Inter-American Development Bank. He is a member of the Costa Rican Association of Agricultural Engineers and a member of the Association of Volunteers in Research and Environmental Development, in Costa Rica. ACKNOWLEDGEMENTS During this research many institutions collaborated to its success, among others the Costa Rican Electricity Institution (Instituto Costarricense de Electricidad), the Associa-tion of Volunteers in Research and Environmental Development (Asociación de Voluntarios en Investigación y Desarrollo Ambiental), the Administration of the Santa Elena Rain Forest Preserve, the Solid Waste Disposal Unit of the Ministry of Health, and the German Academic Exchange Service (Deutscher Akademischer Austauschdienst), who provided the financial support. I am thankful to my main supervisor Prof. Dr. Siegfried Bauer and the second supervisor Prof. Dr. Hermann Boland for their creative advice, and friendly and valuable comments to this study. I appreciate very much the suggestions and comments from Prof. Dr. Duncan MacRae, Prof. Dr. William Ascher, Prof. Juan Ramón Navarro, Prof. Dr. Joseph Vogel, and Prof. Dr. Robert J. Brent. I also appreciate greatly Prof. Dr. Robert J. Healy, Prof. Dr. Randy Kramer, Prof. Dr. Robert Conrad and Prof. Dr. Peter J. Parks, for the academic formation they gave me while studying at Duke University in North Caroline, which helped me throughout these year to accomplish my professional and academic goals.

iii
Much indebted am I to all my colleagues and personnel from the Institute for Project and Regional Planning, who gave me support during the years in Germany, especially to Mr. Erick Abiassi and Mr. Tamas Giorgodse. Many thanks to Dr. R. Kaufmann for his support in editing this text and to the personnel from the Center for International Development and Environmental Research. I also extend my thanks to Dr. M. Hollenhorst for his advises on using the SPSS statistical program. I am grateful to Mr. Rudy Amador for the English corrections to Chapter 4 and for giving moral support when I most needed it. And, to ”Papi”, ”Mami”, ”Tía Ana” ”Abuela Lía”, and ”Tía Loly” for the words since I have memory, which have guided my life. And, to my whole family in Costa Rica, especially my brothers and sisters and their families for believing on me. And most especially, to my wife Paula, son Esteban, and daughter Andrea for their support, belief, company, and love. Without them I would have not started this family project, which was not only valuable for my studies, but an invaluable experience for all of us. All errors of judgment and interpretation of this dissertation remain my sole responsibility.

iv
Dedicated to ”El Divino Niño”, my wife and children

x
TABLE OF CONTENTS FOREWORD...................................................................................................................v ABOUT THE AUTHOR..................................................................................................vii ACKNOWLEDGEMENTS............................. ................................................................vii DEDICATION......................... ........................................................................................ix TABLE OF CONTENTS..................................................................................................xi LIST OF TABLES...........................................................................................................xv LIST OF FIGURES.......................................................................................................xvii
1 INTRODUCTION.............................................................................................................1
1.1 Background..................................................................................................................1
1.2 Problem Statement.......................................................................................................5
1.3 Objective of the Study..................................................................................................6
1.4 Hypothesis of the Study ...............................................................................................6
1.5 Thesis’ Organization ....................................................................................................7
2 THEORETICAL BACKGROUND: THE TRADITIONAL PROJECT EVALUATION .........9
2.1 Introduction and History ...............................................................................................9
2.2 The Traditional Methodology for Project Evaluation (CBA) .......................................12
2.2.1 The cash flow or benefit-cost statement .................................................................14
2.2.2 The most common used criteria for project decision...............................................16
2.2.3 The discount rate ....................................................................................................18
2.2.4 Market failures.........................................................................................................21
2.2.4.1 Monopoly..............................................................................................................21
2.2.4.2 Public goods.........................................................................................................23
2.3 Limitations of the Traditional Methodology for Project Evaluation .............................24
2.3.1 Failure to include environmental externalities .........................................................24
2.3.2 Failure to include intra- and intergenerational considerations.................................25
2.3.3 Failure in the application of the Kaldor-Hicks compensation criterion.....................26
2.4 Conclusion .................................................................................................................28
3 THEORETICAL BACKGROUND: CURRENT CONSIDERATION OF THE KEY
ELEMENTS OF SUSTAINABILITY IN PROJECT EVALUATION ..................................29
3.1 Introduction.................................................................................................................29
3.1.1 The relationship between the economic system and the environment....................29
3.1.2 The concept of sustainable development................................................................31
xi
3.1.3 The key elements of sustainable development .......................................................32
3.2 Consideration of Environmental Externalities.............................................................35
3.2.1 Environmental impact assessment methodologies..................................................36
3.2.2 Environmental valuation techniques........................................................................39
3.2.3 Compensation .........................................................................................................42
3.3 Moral-Legal Environmental Bounds ...........................................................................45
3.4 The Social Discount Rate ..........................................................................................46
3.5 The Distributional Cost-Benefit Analysis ....................................................................49
3.5.1 Calculation of distributional weights ........................................................................52
3.5.1.1 The a priori approach...........................................................................................52
3.5.1.2 The revealed preference approach......................................................................55
3.6 Outstanding Problems of the Sustainability Based Methodologies
for Project Evaluation................................................................................................55
3.7 Conclusion .................................................................................................................57
4 PROPOSED METHODOLOGICAL ADJUSTMENTS TO CONSIDER
ENVIRONMENTAL SUSTAINABILITY IN COST-BENEFIT ANALYSIS.........................61
4.1 Methodology Overview...............................................................................................61
4.2 Management criteria for sustainability of resource use and environmental
pollution............................................................................................................................64
4.3 Procedure for the Physical Impact Identification and Evaluation................................65
4.4 Cost-benefit analysis..................................................................................................71
4.4.1 The owner perspective............................................................................................71
4.4.2 The CBA methodological approach to promote sustainability .................................71
4.4.2.1 The traditional CBA..............................................................................................73
4.4.2.2 The distributional CBA .........................................................................................75
4.4.2.3 The environmental CBA.......................................................................................76
4.5 Conclusion .................................................................................................................82
5 STUDY AREA AND DATA ANALYSIS...........................................................................85
5.1 Introduction.................................................................................................................85
5.2 Overview of Economic Indicators, Natural Resource Use, and Environmental
Degradation in Costa Rica........................................................................................87
5.2.1 Economic indicators ................................................................................................87
5.2.2 Natural resource utilization......................................................................................93
5.2.3 Environmental degradation ...................................................................................100
5.2.4 Environmental requirements for the Costa Rican project appraisal procedure .....102
xii
5.3 The Santa Elena Rain Forest Preserve Project in Costa Rica.................................104
5.3.1 The Santa Elena Project history ...........................................................................104
5.3.2 Project overview....................................................................................................106
5.3.2.1 Location of the project........................................................................................107
5.3.2.2 Climate and soil characteristics..........................................................................108
5.3.2.3 Previous studies in the research area................................................................109
5.4 Organization of the Field Study................................................................................109
5.4.1 Survey design .......................................................................................................110
5.4.2 Sample size and selection.....................................................................................111
5.4.3 The study teams....................................................................................................111
5.4.4 Problems with the field surveys.............................................................................112
5.5 Data Analysis ...........................................................................................................113
5.5.1 The surveys ..........................................................................................................113
5.5.2 Application of the criteria system to balance the use and conservation of the
environmental asset..............................................................................................113
5.5.3 Evaluation of the project impacts ..........................................................................114
5.5.4 The cost-benefit analysis ......................................................................................114
5.5.4.1 The private perspective......................................................................................115
5.5.4.2 The stepwise CBA analysis................................................................................115
5.6 Conclusion ...............................................................................................................118
6 RESULTS OF THE FIELD STUDY AND DISCUSSION .............................................121
6.1 Survey Results of the Santa Elena Rain Forest Project...........................................122
6.1.1 The Non-Resident Tourists...................................................................................122
6.1.1.1 Socioeconomic characteristics ...........................................................................122
6.1.1.2 Willingness to pay questions..............................................................................124
6.1.1.3 Sample’s opinion toward the project ..................................................................132
6.1.2 The Resident Tourists...........................................................................................134
6.1.2.1 Willingness to pay questions..............................................................................136
6.1.2.2 Opinion of respondents toward the project ........................................................140
6.1.3 The Santa Elena community .................................................................................142
6.1.3.1 Socioeconomic characteristics ...........................................................................142
6.1.3.2 Willingness to pay questions..............................................................................144
6.1.3.3 Sample’s opinion toward the project ..................................................................151
6.1.4 Surveys’ conclusions.............................................................................................156
6.2 Evaluation of the Project Impacts.............................................................................159
xiii
6.3 Technical Appraisal (costs and benefits of the project)............................................162
6.3.1 Costs of the project ...............................................................................................163
6.3.2 Revenues of the project ........................................................................................166
6.3.3 The inflation and discount rates............................................................................168
6.4 Cost-benefit Analysis (CBA) .....................................................................................169
6.4.1 Stand alone project’s perspective .........................................................................169
6.4.2 The owner perspective..........................................................................................170
6.4.3 The stepwise analysis...........................................................................................173
6.4.3.1 Traditional CBA..................................................................................................173
6.4.3.2 The distributional CBA .......................................................................................176
6.4.3.3 The environmental CBA.....................................................................................178
6.4.4 Comparison of the different analysis .....................................................................180
6.4.5 The sensitivity analysis .........................................................................................181
6.5 Conclusion ...............................................................................................................183
7 SUMMARY, CONCLUSION, AND RECOMMENDATION...........................................185
7.1 Summary of Major Findings......................................................................................185
7.1.1 The project evaluation using the cost-benefit analysis .........................................185
7.1.2 The CBA methodological adjustment toward environmental sustainability ...........186
7.1.3 Results of the case study......................................................................................187
7.1.4 General Results ....................................................................................................188
7.2 Policy Recommendations, Limitations of the Study, and Further Research.............188
8 Zusammenfassung......................................................................................................189
REFRENCES..............................................................................................................193 GLOSSARY.................................................................................................................209 ANNEXES...................................................................................................................217

xiv
LIST OF TABLES
4.1: ILLUSTRATION OF AN IMPACT ANALYSIS MATRIX FOR A HYPOTHETICAL LANDSCAPE
IMPROVEMENT PROJECT............................................................................................68
4.2: COMPARISON OF ENVIRONMENTAL STANDARD, CURRENT USE, AND PROJECT IMPACT FOR
THE CALCULATION OF THE ENVIRONMENTAL WEIGHT ....................................................82
5.1 THE SERVICE SECTOR AS PERCENTAGE FROM THE TOTAL GROSS DOMESTIC
PRODUCT (GDP)......................................................................................................92
5.2: LAND USE IN COSTA RICA (IN PERCENTAGE) ...............................................................94
5.3: TOTAL FISHING ACCORDING TO THEIR NATURE, 1998 (MT.) ........................................98
5.4: SLOPES CLASSIFICATION AND AREA OF THE SANTA ELENA PRESERVE........................108
6.1: MARITAL STATUS OF RESPONDENTS, NON-RESIDENT TOURISTS,
SANTA ELENA-COSTA RICA, 1998............................................................................122
6.2: HIGHEST EDUCATIONAL LEVEL OF RESPONDENTS, NON-RESIDENT TOURISTS,
SANTA ELENA-COSTA RICA, 1998............................................................................123
6.3 WORKING STATUS OF THE NON-RESIDENT SURVEY, SANTA ELENA, 1998...................123
6.4: NON-PARAMETRIC (SPEARMAN-RHO) CORRELATION WITH THE WILLINGNESS
TO PAY QUESTIONS, THE SANTA ELENA NON-RESIDENT SURVEY, 1998 ......................126
6.5: REGRESSION ANALYSIS FOR THE WILLINGNESS TO PAY AS AN ENTRANCE FEE QUESTION,
THE SANTA ELENA NON-RESIDENT SURVEY, 1998.....................................................129
6.6: REGRESSION ANALYSIS FOR THE WILLINGNESS TO PAY TO ENLARGE THE PRESERVE
QUESTION, THE SANTA ELENA NON-RESIDENT SURVEY, 1998....................................130
6.7: NON-RESIDENT TOURISTS SAMPLE’S RANKING OF IMPACTS DUE TO THE PROJECT, SANTA
ELENA-COSTA RICA, 1998 (IN PERCENTAGE) ...........................................................133
6.8: MARITAL STATUS, RESIDENT TOURISTS, SANTA ELENA-COSTA RICA, 1998 ................134
6.9: WORKING STATUS OF THE RESIDENT SURVEY, SANTA ELENA, 1998...........................135
6.10: HIGHEST EDUCATIONAL LEVEL, RESIDENT TOURISTS, SANTA ELENA-COSTA RICA, 1998135
6.11: REGRESSION ANALYSIS FOR THE WILLINGNESS TO PAY AS AN ENTRANCE FEE QUESTION,
THE SANTA ELENA RESIDENT SURVEY, 1998.............................................................138
6.12: REGRESSION ANALYSIS FOR THE WILLINGNESS TO PAY TO ENLARGE THE PRESERVE
QUESTION, THE SANTA ELENA RESIDENT SURVEY, 1998 ...........................................139

xv
6.13: RANKING OF IMPACTS DUE TO THE PROJECT, RESIDENT TOURISTS SAMPLE, SANTA
ELENA-COSTA RICA, 1998 (IN PERCENTAGE) ...........................................................141
6.14: MARITAL STATUS DISTRIBUTION, THE SANTA ELENA COMMUNITY-
COSTA RICA, 1998 .................................................................................................142
6.15: HIGHEST EDUCATIONAL LEVEL, THE SANTA ELENA COMMUNITY-COSTA RICA, 1998 .....143
6.16: WORKING STATUS, THE SANTA ELENA COMMUNITY-COSTA RICA,1998.......................143
6.17: NON-PARAMETRIC (SPEARMAN-RHO) CORRELATION WITH THE WILLINGNESS TO PAY AND
ACCEPT QUESTIONS, THE SANTA ELENA COMMUNITY SURVEY, 1998 ..........................146
6.18: REGRESSION ANALYSIS FOR THE WILLINGNESS TO PAY QUESTION, THE SANTA ELENA
COMMUNITY SURVEY, 1998......................................................................................149
6.19: REGRESSION ANALYSIS FOR THE WILLINGNESS TO ACCEPT QUESTION, THE SANTA ELENA
COMMUNITY SURVEY, 1998......................................................................................150
6.20: PERCEPTION WITH RESPECT TO THE PROJECT IMPACT ON EMPLOYMENT, ROADS,
EDUCATIONAL CENTERS, AND VISITATION, THE SANTA ELENA COMMUNITY-COSTA
RICA,1998 (IN PERCENTAGE)...................................................................................152
6.21: SAMPLE PERCEPTION WITH RESPECT TO THE PROJECT IMPACT ON POLLUTION, FAMILY
INCOME, AND COMMUNITY INFRASTRUCTURE, THE SANTA ELENA
COMMUNITY-COSTA RICA,1998 (IN PERCENTAGE).....................................................153
6.22: PERCEPTION WITH RESPECT TO THE PROJECT IMPACT ON POLLUTION, FAMILY INCOME,
AND COMMUNITY INFRASTRUCTURE, THE SANTA ELENA COMMUNITY-COSTA RICA,1998 (IN
PERCENTAGE) ........................................................................................................154
6.23: RANKING OF IMPACTS DUE TO THE PROJECT, THE SANTA ELENA COMMUNITY-COSTA RICA,
1998 (IN PERCENTAGE)...........................................................................................155
6.24: IMPACT ANALYSIS MATRIX FOR THE SANTA ELENA RAIN FOREST PROJECT ..................160
6.25 STAFF FROM THE SANTA ELENA RAIN FOREST PRESERVE (US$) ..............................163
6.26 INFRASTRUCTURE INFORMATION FOR THE SANTA ELENA RAIN FOREST PROJECT .......164
6.27: MONTHLY NUMBER OF VISITORS TO THE SANTA ELENA PRESERVE. MONTE VERDE-
COSTA RICA, 1992-1999........................................................................................166
6.28: COST-BENEFIT ANALYSIS FOR THE SANTA ELENA RAIN FOREST PROJECT, THE STAND
ALONE PROJECT PERSPECTIVE (US$)......................................................................171
6.29: COST-BENEFIT ANALYSIS FOR THE SANTA ELENA RAIN FOREST PROJECT, THE OWNER
PERSPECTIVE (US$)...............................................................................................172
6.30: STEPWISE CBA FOR THE SANTA ELENA RAIN FOREST PROJECT. THE SOCIETY
PERSPECTIVE (US$)...............................................................................................174

xvi
6.31: SANTA ELENA RAIN FOREST PROJECT NPV COMPARISON FROM THE DIFFERENT
PERSPECTIVES ANALYZED........................................................................................180
6.32: SANTA ELENA PROJECT’S NPV SENSITIVITY ANALYSIS FOR VARIATIONS IN NUMBER OF
VISITORS OR ENTRANCE FEE....................................................................................182
6.33: SANTA ELENA PROJECT’S NPV SENSITIVITY ANALYSIS FOR VARIATIONS IN THE N OR G
PARAMETERS..........................................................................................................183
LIST OF FIGURES
2.1: GRAPHICAL REPRESENTATION OF THE TRADITIONAL PROJECT EVALUATION
METHODOLOGY.........................................................................................................12
2.2: GRAPHICAL EXPLANATION OF THE DIFFERENT CONCEPTIONS OF THE SDR...................19
2.3: PRICE AND OUTPUT UNDER CONDITIONS OF MONOPOLY AND PERFECT COMPETITION....22
3.1 THE ECONOMIC SYSTEM AND THE ENVIRONMENT.........................................................30
3.2: GRAPHICAL REPRESENTATION OF THE SUSTAINABILITY BASED METHODOLOGY FOR
PROJECT EVALUATION ...............................................................................................57
4.1: METHODOLOGY USED FOR THE APPRAISAL OF THE CASE STUDY..................................62
4.2: CRITERIA SYSTEM TO BALANCE THE USE AND CONSERVATION OF THE ENVIRONMENTAL
ASSET ......................................................................................................................64
4.3: METHODOLOGICAL REPRESENTATION OF THE QUALITATIVE PARAMETERS USED TO
EVALUATE THE PROJECT IMPACTS ..............................................................................66
4.4: STEPWISE SUSTAINABILITY ANALYSIS ..........................................................................73
4.5: INVERSE PROPORTIONAL ENVIRONMENTAL WEIGHTING FUNCTION.................................79
5.1 LOCATION OF COSTA RICA AND THE SANTA ELENA PROJECT ......................................88
6.1: INCOME FREQUENCY AND AVERAGE, NON-RESIDENT TOURISTS,
SANTA ELENA, 1998 ...............................................................................................124
6.2: AVERAGES AND STANDARD DEVIATION FOR THE WILLINGNESS TO PAY AND ACCEPT
QUESTIONS, NON-RESIDENT SURVEY, SANTA ELENA, 1998 .......................................125
6.3: DISTRIBUTION FOR THE NON-RESIDENT SURVEY, WILLINGNESS TO PAY AND CONTRIBUTE
QUESTIONS, SANTA ELENA, 1998 ............................................................................125
6.4: SCATTERPLOT FOR THE WILLINGNESS TO PAY AS AN ENTRANCE FEE (WTPFEE) VS.
INCOME LEVEL. THE SANTA ELENA NON-RESIDENT SURVEY, 1998 .............................128
6.5: INCOME FREQUENCY AND AVERAGE, RESIDENT TOURISTS, SANTA ELENA, 1998.........136
6.6: AVERAGE AND STANDARD DEVIATION FOR THE WILLINGNESS TO PAY AND ACCEPT
QUESTIONS, THE RESIDENTS SURVEY, SANTA ELENA, 1998 ......................................137

xvii
6.7: FREQUENCY FOR THE WILLINGNESS TO PAY AND ACCEPT QUESTIONS, THE
RESIDENTS SURVEY, SANTA ELENA, 1998................................................................137
6.8: INCOME FREQUENCY AND AVERAGE FOR THE SANTA ELENA COMMUNITY, 1998...........144
6.9: AVERAGE AND STANDARD DEVIATION FOR THE WILLINGNESS TO PAY AND ACCEPT
QUESTIONS, THE SANTA ELENA COMMUNITY, 1998....................................................145
6.10: FREQUENCY FOR THE WILLINGNESS TO PAY AND ACCEPT QUESTIONS, THE SANTA ELENA
COMMUNITY, 1998...................................................................................................145
6.11: SCATTERPLOT FOR THE NATURAL LOGARITHM OF WILLINGNESS TO PAY (LNWTPCONT) VS.
INCOME LEVEL. THE SANTA ELENA COMMUNITY SURVEY, 1998 ..................................148
6.12: SCATTERPLOT FOR THE THE NATURAL LOGARITHM OF WILLINGNESS TO PAY
(LNWTPCONT) VS. YEARS OF EDUCATION. THE SANTA ELENA COMMUNITY SURVEY, 1998148
xviii
ABSTRACT
The objective of the current study is to extend cost-benefit analysis (CBA) to transform it in an instrument to evaluate environmental sustainability. To accomplish this objective, first a review of the presently most used project appraisal techniques is carried out. Until now, there exists no extensive CBA methodology, which encompasses sustainability including the three key elements: economic growth, income distribution, and environmental quality. The CBA methodology is, then, adjusted and extended to identify environmental sustainable projects and applied to a case study in Costa Rica.
The first step of the presented methodology is to identify criteria, which balance the use and conservation of the natural asset. The project impacts are defined through the use of a severity indicator, which is based on quantitative and qualitative information. In the stepwise analysis (CBA), the three key elements of sustainability are included, one after the other, by requiring a positive increment in every one. First, a positive traditional CBA, encourages economic growth. Secondly, a positive increment in the distributional CBA, with respect to the traditional one (positive distributional minus traditional), ensures the project contribution toward better income distribution. And finally, a positive increment in the environmental CBA, with respect to the distributional one (positive environmental minus distributional), indicates that the project promotes better environmental quality. The presented methodology shows the advantage of incorporating future availability of the environmental asset, the missing element of sustainability in the current CBA methodologies. The adjusted CBA could be used in a wide variety of projects with envi-ronmental effects. They could range from industrial and agricultural to environmental friendly ones.

1
1 INTRODUCTION
1.1 Background The most widely practiced analytical technique for project appraisal is cost-benefit analysis, commonly known by its acronym CBA. The concept is sufficiently simple in theory: a variety of alternative projects are compared in terms of the discounted stream of costs and benefits; the project which yields the highest net present value (NPV) is chosen. Complexity arises when one wishes to integrate CBA with the emerging paradigm of sustainability, defined in the often quoted Brundtland Report as “satisfying the needs of the present generation without compromising the satisfaction of the needs of future generations” (WCED 1987). This thesis explores the possibility of integrating “sustainability” with “cost-benefit analysis” in order to achieve a methodology relevant to the assessment of public ex-penditures in developing countries, where not only economic efficiency, but income distribution and the environment are a concern. For TERBORGH 1999, the application of sustainable development is a necessity if there is to be peace and prosperity in the world, the alternative is exhaustion of natural resources, crushing poverty, and social anarchy. The term sustainable development grew out of the “limits to growth” debate of the 1970’s, which discussed the possibility that continuing economic growth will inevitably lead to severe environmental degradation and current societal collapse (MEADOWS et al. 1972; COLE et al. 1973). By late 1970’s and after further debate, the conclusion was that economic development could be sustained indefinitely, only if development takes into account its ultimate de-pendence on the natural resources (PEZZEY 1992). The concept of sustainable development was first published by the World Conservation Strategy (IUCN 1980), and became a paradigm to the concepts of environment and development. Two examples of this situation were the reports of the World Commission on Environment and Development (the “Brundtland report” cited above) and the WORLD BANK 1987. The World Bank was compromised to promote sustainable development with the proposition that “economic growth, the alleviation of poverty, and sound environmental management are in many cases mutually consistent objectives” (WORLD BANK 1987).
2
Nowadays, most of the literature agrees with a statement of Robert Solow, Nobel lau-reate in economics: “It is very hard to be against sustainability. In fact, the more you know about it the better it sounds …sustainability is an essentially vague concept, and it would be wrong to think of it as being precise, or even capable of being made precise” (SOLOW 1993, pp. 179-180). Indeed, sustainable development is difficult to define and quantify empirically. It is a term that everybody supports, but nobody defines consistently (MÜLLER 1997; BAUER 1998). However, most authors underlie the following three components, as critical to make the concept operational: growth, distribution, and the environment (WCED 1987; VEEMAN 1989; PEARCE et al. 1990, MUNASINGHE 1990; JOHANSSON 1993; JAMES 1994; BRENT 1998). Economic growth implies higher efficiency, and therefore, a higher total and/or per-capita income within a country. Growth was traditionally viewed as the only requirement (first objective) to produce development, yet nowadays, it is a necessary, but not a sufficient condition (MÜLLER 1997). The concept of growth is now separated from development, in the sense that development refers to a better standard of living for all, which is not usually reached by an aggregate higher income of society, as measured traditionally, for example, by the gross national product (GNP) of a country. Income distribution came to the scene as a social concern and as the second objective of development, as a way to reach a better standard of living for all, more precisely in-tragenerational and intergenerational equity (BRENT 1996). Intragenerational equity refers to a better standard of living of all the constituents of the current generation (not in the aggregate, but individually), which could be achieved through a better income distribution. Intergenerational equity refers essentially to “keeping options open to the future generation”, and it is attained through conserving the means to fulfill future needs. Then, the environmental concern came to the scene as the third objective of develop-ment, in the sense of accounting for the use and degradation of the environment and natural resources through the economic activity. It is important to take it into account, because the environment - and natural resources - is the base to support economic growth and, in turn, affects the standard of living of current and future generations (TIETENBERG 1988). Furthermore, BAUER 1997 states that there is a wide social consensus about the necessity to take into consideration the environmental and natural resource protection. In conclusion, sustainable development is defined in the current study - for the purpose of applying the concept to project evaluation - as that development which accomplishes economic growth for the country, a better income distribution (especially by improving the standard of living of the poor), and a better environmental quality (especially in degraded environments). The distributional cost-benefit analysis (distributional CBA) is an improvement toward putting the concepts of sustainability into practice, using a common indicator in development project’s decision making. On it, the concept of growth is attached to eco-nomic efficiency through the maximization of the projects’ benefits. Intragenerational and

3
intergenerational equity are linked to the use of distributional weights1 (and the social discount rate). And finally, the environment is counted through the valuation of environmental impacts (ISLAM, GIGAS 1997; BRENT 1998). However, not all is optimal in the distributional CBA in order to comply with the three key elements of sustainability. The valuation of the environment does not ensure its availability (quality) in the future as the base to support development, which is not con-sistent with sustainability (ISLAM, GIGAS 1997). Therefore, there should be a way to incorporate this third aspect of sustainability - the availability (quality) concern - into project appraisal.2 The projects of interest for the current study, therefore, are those that provoke envi-ronmental effects (positive and/or negative). When using the standard project classifi-cation, used especially by the international organizations, those are generally the following (IADB 1990): type I environmental projects with a positive impact over the en-vironment, type III and IV projects with a negative impact over the environment3 (type II projects are not considered since they have neither a positive nor a negative impact over the environment, then they can be assessed by using the current efficiency and distribution approaches). Since the case study chosen to apply to proposed methodology is from Costa Rica, a brief analysis of the status quo of project appraisal in the country will be presented, in Chapter 5. In Costa Rica, there exists some governmental attempts to introduce the sustainable development concept into project evaluation. As a point of departure, it was stated through presidential decree in 1996, that the activities (projects) that affect or destroy the environment and/or generate waste should present an Environmental Impact Assessment (EIA). These EIA should be approved by the Environmental National Technical Secretary (SETENA4), a governmental institution which was created with that purpose. SETENA is able to call for public audiences depending upon the characteristics of the project, with the main objective of promoting public participation, in order to take into account the point 1 Although weights are more often invoked in textbooks than used in practice (MACRAE, WHITTINGTON 1997), their use put CBA closer to the three key elements of sustainable development already described. 2 For example, two projects are ranked at the same level if their aggregate weighted benefits (NPV) are equal, however, one could represent a detriment and the other an improvement to an already degraded environment. Therefore, if the two projects are going to provide the same growth and distribution’s results, the environmental friendly one should receive a premium to account for its positive effects. 3 Type II and III refer to different intensities of the environmental impacts. Type II are projects with low environmental impacts, while type III are projects with a high environmental impact. 4 Stands in Spanish for Secretaría Técnica Ambiental Nacional.

4
of view of society, to account mainly for distributional inequalities (project’s effects). The main points of discussion and the general opinion given by the participants of the audiences are tools used by SETENA to decide upon the implementation of a project (MINAE 1997). However, a more concrete and efficient way to incorporate these concerns in project appraisal will be presented in this study (see Chapter 4).
1.2 Problem Statement The new paradigm of development is to consider sustainability, which is an essentially vague concept. However, three key elements are necessary to put the concept into practice: economic growth, income distribution, and the environment. Since the government and/or international organizations are the ones called to look for the welfare of society and their most commonly used methodology to evaluate development projects5 is CBA, it is necessary to match it to sustainable development by including the three key elements mentioned above. The traditional CBA is essentially an economic efficiency (growth) analysis, while the so-called distributional CBA accounts not only for growth, but for income distribution.6 However, in both, the environment is only taken into account by valuing the - environ-mental - impacts of the project and introducing this value into CBA; in spite of that, it does not assure its future existence (ISLAM, GIGAS 1997), fact which does not comply with sustainability as defined before, because, at least one of its three key elements, the environment, is missing. Therefore, in order to ensure that development projects are directed toward sustainable development, this study will faced the issue of how to consider the environment in order to integrate its three key elements for a more accurate evaluation (appraisal) for decision-making.
1.3 Objective of the Study The purpose of the current study is to adjust the most widely used appraisal methodology for development projects, CBA, in order to consider environmental sustainability and, in turn, promote the integration of its three key elements: growth, distribution, and the environment. Therefore, policy makers would have a more accurate tool to decide upon the project alternatives which would best accomplish the new paradigm of - sustainable - development.
5 For example investments in roads, hydroelectric plants, regulation of the private economy, environmental and agricultural improvements, and natural resource conservation. 6 Nevertheless, Chapter 3 Section 3.5 shows that because distributional CBA allows for a trade off between efficiency and distribution, it cannot ensures the presence of the two simultaneously.

5
The specific objectives of this study include the following: a) To identify a criteria system, which constitutes the base to carry out the environ-
mental impact assessment of the project and define environmental standards; b) to identify a procedure to evaluate the significant impacts of the project; c) to adjust the CBA methodology to consider environmental sustainability and, in turn,
integrate the three key elements of sustainable development (growth, distribution, and environment) in project appraisal and specifically in the calculation of the net present value;
d) to evaluate the empirical relevance of the proposed methodology in a study in Costa Rica.
1.4 Hypothesis of the Study Projects which contribute to sustainable development are committed to fulfill the three key elements of sustainability: growth, distribution, and the environment. In other words, projects should promote the following public objectives: to encourage economic growth, to promote income distribution, and to ensure the future availability of the environment. Consequently, the current CBA methodologies do not guaranty sustainable development, because of the following reasons: • traditional CBA does not accounts for neither income distribution nor environmental
net benefits, because both could be off set by the efficiency effects (if they are sufficiently high);
• distributional CBA allows for a trade off between efficiency and distribution, which does not ensures their presence simultaneously and environmental net benefits could be off set by both efficiency and distribution effects.
1.5 Thesis’ Organization Chapter 1, which was already presented, showed the context of the study, defined its problem statement, its objectives, and hypothesis. Chapters 2 and 3 provides an overview of the development of the current project evaluation methodology, in the context of the study, and highlights its deficiencies, in order to identify the main contribution of this research. First in Chapter 2, the traditional project’s evaluation methodology is described and its main limitations explained. Then, in Chapter 3, the sustainability improved methodologies that aid to overcome some of the limitations of the traditional one are analyzed, as a departure point to identify the contribution of the present dissertation. Chapter 4 explains the proposed methodological adjustment to include the environment in CBA, in the following way: identifies a criteria system to balance the use and conser-vation of the environmental asset, proposes a procedure to identify and evaluate the significant impacts (which are to be included in CBA), and considers the inclusion of the

6
environment in order to direct project appraisal toward fulfilling the three key elements of sustainability. Chapter 5 shows the country and case study background, explains the survey methodology, and the data analysis Chapter 6 provides the results of the proposed methodology in a case study from Costa Rica: the Santa Elena community-operated preserve. The idea of the case study is to described empirically and validate the proposed methodology described in Chapter 4. Chapter 7 presents the summary, conclusion, recommendations, and international applicability of the study results.

120
2 THEORETICAL BACKGROUND: THE TRADITIONAL PROJECT
EVALUATION
2.1 Introduction and History The objective of the current chapter is to give an overview of the development of the traditional methodology for project evaluation, cost-benefit analysis (CBA), in the context of the current study and highlights its deficiencies. The main attempts of the literature to overcome these deficiencies will be also discussed in the next chapter and on these basis, the contribution of the study will be clarified. Most real world policy changes (projects) create conflicts of interest among different parties, in other words, have gainers and losers. Then, the best way to evaluate a project would be to assess how it affects social welfare - from the aggregate effects of individual utilities -, but because that is not possible7, CBA represent the best practical way to capture and express in a single dimension (monetary terms) many, but not all, of the project’s effects - utility changes -, therefore, it is used instead. The basic idea behind CBA is then, to measure in monetary terms how social welfare is affected by a particular project, hence, it is applied welfare economics (JOHANSSON 1992). The beginning of cost-benefit analysis (CBA) dates back to 1844, when Jules Dupuit was concerned with the benefits and costs of building a bridge and published “On the Utility of Public Works”. He introduced the concept of consumer surplus (JOHANSSON 1993). The idea of economic efficiency was central to welfare economics to justify a social change, therefore, the Pareto principle was introduced in the 1930’s. This principle underlain the idea that a change is desirable if someone(s) gains and no one losses, which was made through compensation from the gains - actual compensation was a strong requirement. In the 1950’s the compensation test was modified by the Kaldor-Hicks compensation criterion, which stated that the gainers should be able to compen-sate the losers, but actual compensation was not required (BRENT 1998). The first empirical attempt to put CBA into practice was made through the United States Flood Control Act of 1936, which in essence stated that a project is desired if its aggregated benefits are higher than its costs. Later, in the late fifties, sixties, seventies, and eighties, a vast literature that influences the pragmatism of CBA was developed (JOHANSSON 1993).
7 That is not possible because of the difficulty to assess how an economic change (project) affects the utility level of each household in society - in order to aggregate them into a social welfare function (JOHANSSON 1992).
121
During the late 1960’s and early 1970’s CBA became the standard appraisal methodology for public-sector investment choice (KIRKPATRICK, WEISS 1996). The theory of the second best, appeared during the early 1960’s - by Lipsey and Lan-caster -, which implied that if any other sector of the economy did not follow the efficiency rules, then the government still pricing at marginal costs could not ensure efficiency. In late 60’s DIAMOND; MIRRLEES 1971 showed that if optimal commodity taxes existed, then the public sector should continue to seek productive efficiency. This was the starting point of the pioneering manual of project appraisal for developing countries8 wrote by Little and Mirrlees in 1968 and the departure of the theory of optimal taxation9 of the 1970’s (BRENT 1998). During the 1970’s serious attempts were also made by the national and international institutions to implement some forms of shadow pricing for project appraisal (KIRKPATRICK, WEISS 1996). The problem with the application of the methodology was that the losers could be low income people, consequently, some authors (i.e. WEISBROD 1968, MARGLIN 1976) proposed that low income losses should be weighted more heavily than high income gains10, which was the departure point of development of a new project’s appraisal methodology (distributional CBA). Then, although there may be still losers, attention was focus on how the gains and losses were to be measured (BRENT 1998). The UNIDO approach of 1972 emphasized on distributional matters, which drove to a revised version of the Little and Mirrlees approach, published in 1974, which conformed the welfare economic requirement that distribution and efficiency are the twin objectives of government policy (BRENT 1998). In the 1980’s there was a decline in the use - and theoretical development - of shadow pricing, especially due to the general shift in development policy toward market liberali-zation and getting the prices right, which provoked the belief that market prices would reflect opportunity costs (KIRKPATRICK, WEISS 1996). By the end of the 1980’s a more balanced approach to project appraisal appeared. I was now accepted that CBA of projects is complementary to market liberalization and policy reform, and has a central role in achieving economically efficient investment decisions
8 It stated that the prices that determine imports and exports in a less developed country (LDC) are the world prices - shadow prices. The UNIDO approach of 1972 showed the same rationale. 9 This theory stated that the public sector can pre-empt resources for its own use, so to run its affairs efficiently. What is left over goes to the private sector. This meant that the government must use its instruments of control (income and commodity taxes) to ensure that consumer budget constraints are at the required levels. 10 The alternative compensation test was that the weighted gains should be higher than the weighted losses.

122
and a more rapid economic growth in developing countries (KIRKPATRICK, WEISS 1996). Until now, CBA has been applied to appraise a wide variety of public - and private - expenditure alternatives as water resource, pollution control and transportation projects, urban and education programs, health and nutrition policies, and endangered species preservation, as well as to assess government health, safety, and environmental regulations. Today it embodies a diverse set of valuation techniques that are available to assess a large variety of policy options in many fields. Such applications suggest the usefulness of CBA as a decision making tool, which has been developed upon a practical need to know how to assess and prioritized policy alternatives (FUGUITT, WILCOX 1999).
2.2 The Traditional Methodology for Project Evaluation (CBA) In general, the assessment of new development projects traditionally considers at least the following modules (JENKINS, HARBERGER 1990), which are represented graphi-cally in Figure 2.1: a) Marketing or demand: estimation, quantification, and justification of the demand and
prices for the goods and services provided. b) Technical or engineering: identification of the inputs and costs. c) Manpower and administrative support (technical appraisal): requirements and
sources of manpower for implementation and operation. d) Financial/Budget: evaluation of financial expenditures and revenues, and assess-
ment of alternative methods of financing. This is the owner’s of the project point of view.
e) Economic: appraisal of costs and benefits from the point of view of the economy (society).
f) Social: analysis from the point of view of who receives the benefits and pays the costs of the project.

123
Identification of outputs and benefits
Figure 2.1: Graphical representation of the traditional methodology for project evaluation
Source: The author. In general, the difference between the private and society perspectives is given by the following items (JENKINS, HARBERGER 1990; JOHANSSON 1993; JAMES 1994): a) The society perspective aggregates benefits and costs over all the country’s resi-
dents to determine if the project improves the level of economic welfare of the society as a whole, while the private perspective considers the project from the point of view of the well-being of a subgroup of the population (i.e. a firm), therefore, including only the private benefits and costs that can be measured in financial terms.
b) The society appraisal is given by the net economic benefits - shadow prices - of the investment11, while the private appraisal is constructed upon the net cash flows of the project12 - financial receipts and outlays as measured by market prices.
c) In the society perspective a social discount rate based on the social opportunity cost of capital, or the social rate of time preference, and/or a combination of both - the economic opportunity cost of public funds - is used as the discount rate, while in the private perspective the discount rate used is the market interest rate.
In addition, the idea of the social module presented in
11 Economic benefits are measured as the maximum amount that people, either individually or collectively, would be willing to pay for the project’s output (consumer surplus), and costs are the value which the country’s residents place on the resources which have to be diverted away from other productive uses in order to construct and operate the project (JENKINS, HARBERGER 1990). 12 Cash inflows (cash receipts or benefits) are obtained from either the sales of output or any budgetary allocations (government, international agency, etc.), while outflows (cash payments or costs) are the payments made to purchase all the items required to build and operate the project (JENKINS, HARBERGER 1990).
Identification of inputs and costs
Traditional project appraisal
Owner and other perspectives CBA (private perspective)
traditional CBA (society perspective)
-used for project ranking-

124
Figure 2.1 is to provide decision makers an opportunity to impute their own “welfare weights”, depending on to whom benefits or costs accrue, according to constructing private analysis from different perspectives. However, the ranking of projects was based on the traditional CBA, in other words, on the economic appraisal (JENKINS, HARBERGER 1990). The traditional project’s evaluation criteria was based on the Pareto Principle, which states that a change is desirable if everyone is made better off - the weak Pareto criterion - or at least some are made better off while no one is made worse off - the strong Pareto criterion - (JUST, HUETH, SCHMITZ 1982; JOHANSSON 1992). Consequently, the idea behind the theory of project’s approval was to make everybody (in society) better off. However, that was not always the case since projects normally have winners and losers, which makes the application of the Pareto principle difficult to carry out and useless as a criterion for ranking social choices in most real world situations13. Thus, the Kaldor-Hicks criterion (Pareto potential improvement) was later introduced. This criterion states that an economic change (project) is desirable if the beneficiaries could potentially compensate the losers, so that society in the aggregate will be better off than before (JUST, HUETH, SCHMITZ 1982; JOHANSSON 1992). Hence, project’s feasibility was accepted under these basis. Ultimately, the traditional approach for project appraisal, which rank the projects according to the net present value (NPV) of the society perspective - an economic effi-ciency approach -, was criticized because of its weaknesses, those of which most rele-vant to the current study are later explained in Section 2.3. Following, the most important principles to carry out projects’ appraisal are presented.
2.2.1 The cash flow or benefit-cost statement These statements refer to the construction of the project profile covering the project’s life time. Some of the general principles to construct them are following presented (JENKINS, HARBERGER 1990): a) Depreciation: Since depreciation is not a cash outflow, it should not be included in
the analysis. Assets are accounted whenever the cash outflow occurs.
b) Sunk versus incremental costs: Many investment projects are additions to existing on-going activities and thus, the benefits and costs which are relevant to the new project are those that are incremental to what would have occurred if the new project had not been added. The previous expenditures made are referred to as “historical costs” or “sunk costs”, and should be disregarded in the evaluation of incremental investments. Only in the case, where without the project the assets would have been sold, must be taken into account the liquidation values as an investment for the new project. Similarly, at the end of the project, the liquidation values would accrue to the project from the sale of the assets.
13 Generally, a policy change produces gainers as well as losers and the Pareto criterion cannot handle such mixed outcomes (JOHANSSON 1992).

125
c) Land: As any other asset, land has an opportunity cost (market price), which have to
be reflected in the analysis.
d) Inflation: When there is no information on how every input and output variable change over time, the analysis ignores all the effects of inflation by expressing the financial project profile in constant prices of a given year. The procedure to exclude inflation from the analysis is first to estimate the variables in the current prices of the years they are to be incurred, then deflate them - to reflect their real values and include them in the real (constant price level) cash flow of the project.
If prices include inflation, the nominal rate of discount should be used to calculate
the net present value of the project. Conversely, if prices do not include inflation
(real prices), the real rate of discount should be used (JOHANSSON 1993). e) Imports: The value of the benefits derived from a project which increases the do-
mestic production of an importable good should be based entirely on the economic value of the resources saved by the decrease in purchases of imports. On the other side, the measurement of the economic cost of the inputs produced by a project which consume exportable goods or services should be based upon the economic value of the resources foreign importers are willing to pay to the country14.
f) Estimation of costs and benefits: Besides the direct costs and benefits of a project, it
is necessary to take into account that a benefit foregone is a cost and a cost avoided is a benefit.
g) The society perspective: it eliminates the transfer payments within the economy,
such as taxes (tariffs) or subsidies, government payments (social charges), etc. It also includes shadow pricing to exclude such distortions in the economy.
2.2.2 The most common used criteria for project decision Net present value criterion15 The net present value criterion (NPV) is the difference between the discounted flow of benefits and the discounted flow of costs (Equation 2.1). It is used for both the private and social perspectives. The more general rules for using the criterion are following presented (TIETENBERG 1988; JENKINS, HARBERGER 1990; JAMES 1994): a) Only projects with positive NPV are accepted.
14 As long as the world price is not affected by the change in the domestic demand, which would promote local suppliers to produce more. 15 It is the most effective criterion, although the reasons for that will not be treated in this study. For further information please see JENKINS, HARBERGER 1990.

126
b) Within the limit of a fixed budget, choose that subset of available projects which maximize the NPV.
c) With no fixed budget constraint, choose the alternative that generates the largest NPV
d) Compare investment strategies with approximately the same length of life.
NPVB C
rt t
tt
n
=−+=
∑ ( )( )11 (2.1)
where:
NPV = net present value Bt = benefits in year t Ct = costs in year t r = discount rate
Source: Based on JENKINS, HARBERGER 1990. Benefit-cost ratio This criterion is calculated by dividing the present value of benefits by the present value of costs (Equation 2.2), using a discount rate. The main problem with this criterion is that it may provide an incorrect ranking of projects if they differ in size16. The most general rules to use this criterion are following listed: a) Accept the projects which has a ratio greater than one. b) For choices among mutually exclusive projects, choose the one with the highest ratio.
RB
rC
rt
tt
nt
tt
n
=+ += =
∑ ∑( )/
( )1 11 1 (2.2)
where:
R = benefit-cost ratio Bt = benefits in year t Ct = costs in year t r = discount rate
Source: JENKINS, HARBERGER 1990. Internal rate of return
16 For further details see JENKINS and HARBERGER 1990, cp. 4, p. 11.
127
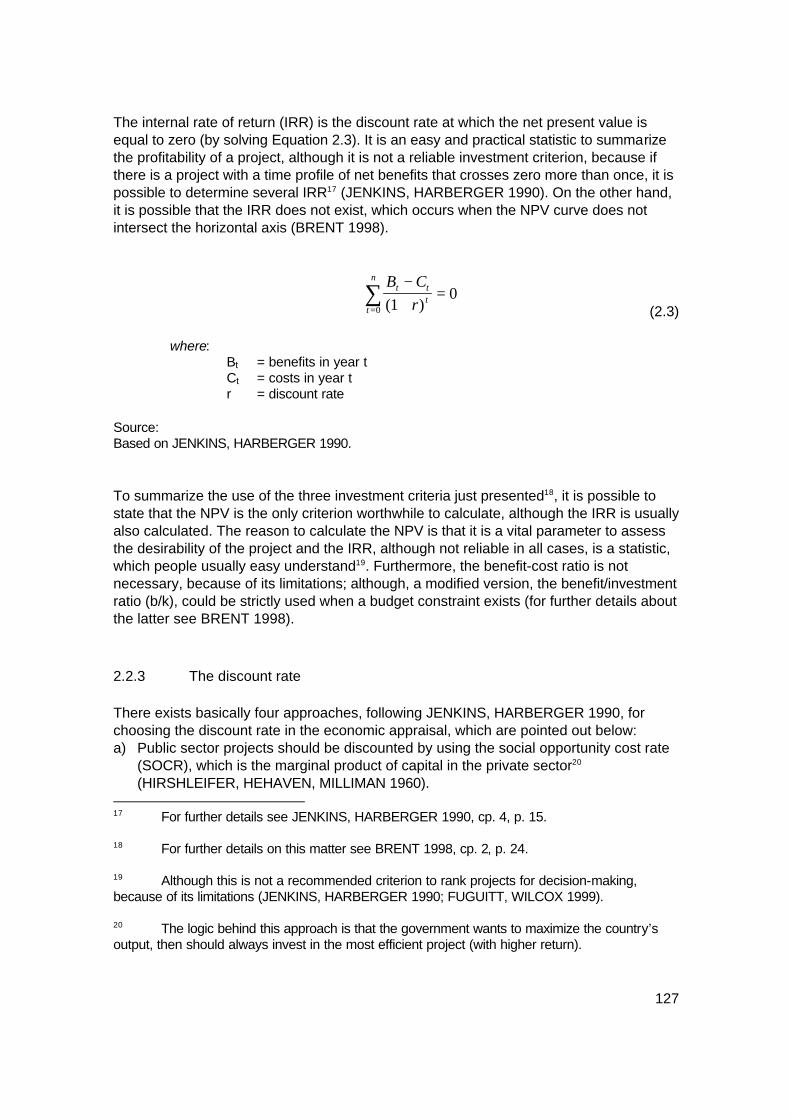
The internal rate of return (IRR) is the discount rate at which the net present value is equal to zero (by solving Equation 2.3). It is an easy and practical statistic to summarize the profitability of a project, although it is not a reliable investment criterion, because if there is a project with a time profile of net benefits that crosses zero more than once, it is possible to determine several IRR17 (JENKINS, HARBERGER 1990). On the other hand, it is possible that the IRR does not exist, which occurs when the NPV curve does not intersect the horizontal axis (BRENT 1998).
B Cr
t tt
t
n −+
==∑ ( )1
00 (2.3)
where:
Bt = benefits in year t Ct = costs in year t r = discount rate
Source: Based on JENKINS, HARBERGER 1990. To summarize the use of the three investment criteria just presented18, it is possible to state that the NPV is the only criterion worthwhile to calculate, although the IRR is usually also calculated. The reason to calculate the NPV is that it is a vital parameter to assess the desirability of the project and the IRR, although not reliable in all cases, is a statistic, which people usually easy understand19. Furthermore, the benefit-cost ratio is not necessary, because of its limitations; although, a modified version, the benefit/investment ratio (b/k), could be strictly used when a budget constraint exists (for further details about the latter see BRENT 1998).
2.2.3 The discount rate There exists basically four approaches, following JENKINS, HARBERGER 1990, for choosing the discount rate in the economic appraisal, which are pointed out below: a) Public sector projects should be discounted by using the social opportunity cost rate
(SOCR), which is the marginal product of capital in the private sector20 (HIRSHLEIFER, HEHAVEN, MILLIMAN 1960).
17 For further details see JENKINS, HARBERGER 1990, cp. 4, p. 15. 18 For further details on this matter see BRENT 1998, cp. 2, p. 24. 19 Although this is not a recommended criterion to rank projects for decision-making, because of its limitations (JENKINS, HARBERGER 1990; FUGUITT, WILCOX 1999). 20 The logic behind this approach is that the government wants to maximize the country’s output, then should always invest in the most efficient project (with higher return).

128
b) Use an accounting rate of interest (ARI), which is the estimated marginal return from public sector projects given the fixed amount of investment funds available to the government21 (LITTLE, MIRRLEES 1974; SQUIRE, VAN DER TAK 1975).
c) Discounting should use the social time preference rate for consumption22 (STPR) (FELDSTEIN 1964; DASGUPTA, MARGLIN, SEN 1972; BRADFORD 1975).
d) Use the social opportunity cost of public funds (SOCPF), which is the weighted average of the SOCR and STPR (JENKINS, HARBERGER 1990).
Figure 2.2: Graphical explanation of the different conceptions of the social discount rate (SDR)
Source: BRENT 1996. Apart from the ARI, which is to be adjusted depending on availability of public funds, and the SOCPF, which is a weighted average of two rates; following BRENT 1996’s explanation23, the different conceptions of the discount rates are graphically described in Figure 2.2. Let C0 represents current consumption and B1 future consumption. PP’ is the production possibilities curve, which shows the maximum amount of future consumption that is
21 Its rationing is that if more projects look acceptable than the available funds the ARI should be adjusted upwards and vice versa. Thus, it does not ensure that the funds are efficiently allocated between the public and the private sectors (JENKINS, HARBERGER 1990). 22 The idea behind the approach is to discount at the rate at which society is willing to forgo consumption today for consumption in the future. 23 For further details see BRENT 1996, cp. 11, p. 269.
0
M
P’ M’
P B1
C0
E1
I1 I0
E0

129
technologically feasible by reducing current consumption (holding all inputs constant). Its slope is 1+c, where c is the marginal product of capital or the social opportunity cost rate (SOCR). The social indifference (I) curves represent society’s preferences and have slope 1+i, where i is the social time preference rate (STPR), which is the rate at which society is willing to forgo consumption today for consumption in the future. Point E1 shows the equilibrium or social optimum, where the slope of the I1 equal the slope of the curve PP’, which implies that the two slopes are equal, thus, i = c. When competitive financial markets exists, their budget line MM’, with slope 1+m (m is the market rate of interest, MRI), goes through E1. Thus, in fact at point E1 all the three curves have equal slope; consequently, i = c = m. Therefore, it is of no significance which one of the three is used as the discount rate. This situation is called “first-best optimum”, where the only constraint affecting welfare maximization is the production function. However, if there is an additional constraint, the “second best” solution is applied (point E0 in Figure 2.2). The absence of competitive financial and production markets are the additional constraints in developing countries. Continuing with BRENT 1998, at point E0 the market rate of interest m is not equal to either the STPR or SOCR24; and the production possibility’s curve PP’ and the social indifference curve I0 have different slope, with PP’ > I0, thus, c > i. Then, apart from the private project assessment, where the MRI is to be used, the main choice is whether to use the STPR or the SOCR, or a combination of the two - the SOCPF. The decision is still controversial, since some authors suggest the use of every one of the three. The first two approaches, a. and b. presented at the beginning of the current section, have the common disadvantage that they do not adjust for the allocation of funds that will take place in the capital market. The discount rate should reflect the opportunity cost of using these funds to the country, not only to the public sector (JENKINS, HARBERGER 1990). In addition, the SOCR is the wrong concept to use, because using this rate implies that investment is undervalued relative to consumption, and this is a matter of determining the shadow price of capital, not the discount rate (for further explanation see BRENT 1996, p. 271). BRENT 1996 suggests using the STPR, basically because it is the right concept to use. Clearly, individuals living today make savings decisions concerning how they wish to allocate their lifetime resources, now and in the future (the use of this rate will be further discussed in Chapter 3 Section 3.2).
24 Which shows us one of the reasons why in presence of other constraints the MRI should not be used.

130
JENKINS, HARBERGER 1990, suggest using the SOCPF because it reflects the movement that takes place between private investment and private consumption when more resources are invested in the private sector25, which effect is then, a mix of the gross returns from private investment and private consumption.
2.2.4 Market failures Market failures affect the way how benefits and costs are calculated for project appraisal; then, some of the most common ones would be described following.
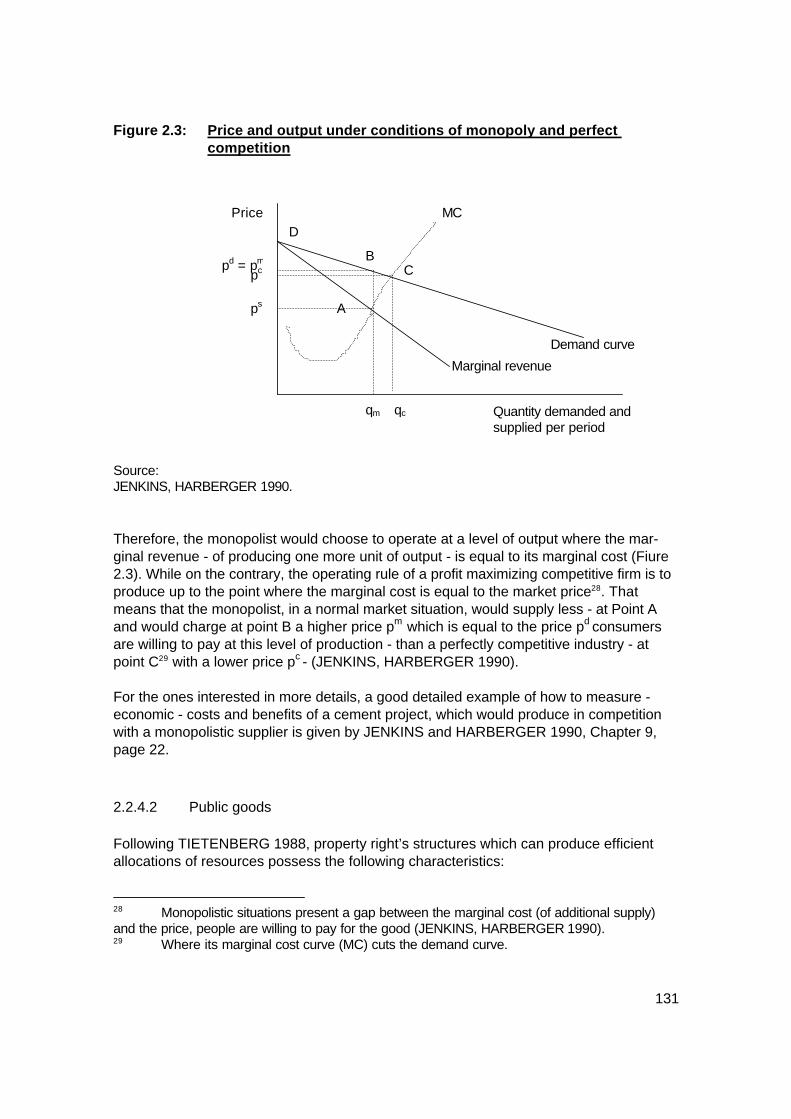
2.2.4.1 Monopoly When the supply of a good/service is dominated by only one producer, the situation is called monopoly26. In this case, the market failure is one of lack of competition, where the price is not a parameter beyond the producer’s control and if it makes the decision to produce more, then to sell the additional output the price must fall27 (TIETENBERG 1988; JENKINS, HARBERGER 1990; JOHANSSON 1992). That means that the marginal revenue from selling an extra unit falls short of the price received by the monopolistic producer, in other words, the increase in benefits (total revenue or marginal revenue) would be equal to the price obtained for the last unit sold less the loss in revenue because of the decline in price on all the other units sold (TIETENBERG 1988; JENKINS, HARBERGER 1990; JOHANSSON 1992).
25 After resources have been already optimally allocated. 26 And, when it is dominated by a small number of producers it is called oligopoly. 27 For all the units of product sold.
131
Figure 2.3: Price and output under conditions of monopoly and perfect competition
Source: JENKINS, HARBERGER 1990. Therefore, the monopolist would choose to operate at a level of output where the mar-ginal revenue - of producing one more unit of output - is equal to its marginal cost (Fiure 2.3). While on the contrary, the operating rule of a profit maximizing competitive firm is to produce up to the point where the marginal cost is equal to the market price28. That means that the monopolist, in a normal market situation, would supply less - at Point A and would charge at point B a higher price pm which is equal to the price pd consumers are willing to pay at this level of production - than a perfectly competitive industry - at point C29 with a lower price pc - (JENKINS, HARBERGER 1990). For the ones interested in more details, a good detailed example of how to measure - economic - costs and benefits of a cement project, which would produce in competition with a monopolistic supplier is given by JENKINS and HARBERGER 1990, Chapter 9, page 22.
2.2.4.2 Public goods Following TIETENBERG 1988, property right’s structures which can produce efficient allocations of resources possess the following characteristics:
28 Monopolistic situations present a gap between the marginal cost (of additional supply) and the price, people are willing to pay for the good (JENKINS, HARBERGER 1990). 29 Where its marginal cost curve (MC) cuts the demand curve.
Price
Quantity demanded and supplied per period
MC
pd = pm pc
ps
qm qc
B C
A
D
Marginal revenue Demand curve

132
a) Universality: all resources are privately owned and all entitlements completely specified.
b) Exclusivity: all benefits and costs accrued as a result of owning and using the re-sources accrue - directly or indirectly by sale to others - (only) to the owner.
c) Transferability: all property rights should be - voluntarily - transferable from one owner to another.
d) Enforceability: property rights should be secure from involuntary seizure or en-croachment by others.
On the other hand, the goods which are both non-exclusive and non-rival are called - pure - public or collective goods. Non-exclusive means that when produced no one can be excluded from its benefits30 and non-rival that additional consumers may use it at virtually zero marginal costs31 (joint supply), which violates the principles explained above (TIETENBERG 1988; JOHANSSON 1992; BRENT 1996). Therefore, the price (valuation) of these goods is not directly possible32. For private goods, the industry demand curve is derived by summing the individual demand curves horizontally, by asking at every price how many the individual demands. For a public good, social demand is derived by summing the individual ones vertically, by asking for every unit of quantity how much every individual is willing to pay33 (BRENT 1996).
2.3 Limitations of the Traditional Methodology for Project Evaluation
2.3.1 Failure to include environmental externalities “There are serious flaws in the theory that wildlife can best be conserved through pro-moting human economic development. It is a powerful myth that has made all those involve in the formulation feel good. When first formulated it seemed to provide the best of several worlds: both wildlife and people would benefit. ...” (OATES 1999). For many years the externalities caused by carrying out a project were not taken into account in CBA, simply because natural resources and the environment were considered free resources (public goods). Furthermore, until the seventies, it was believed that
30 Private markets exclude by price, if one not pays one do not receive the benefits (BRENT 1996). 31 When one person’s consumption of a good does not diminish the amount available for others (TIETENBERG 1988). 32 Prices build up in the market economy only for private marketable goods and not for public goods (BAUER 1999). 33 The reason for that is that if A and B wants 1 unit, the private market supplies 2 units, but for public markets the total demand is only 1 unit (BRENT 1996).
133
public goods or “bads34“ from projects’ implementation were very difficult or impossible to value. The reason was that on goods that are traded in markets, buyers and sellers reveal their preferences directly - through their actions. Conversely, in the case of externalities, preference revelation is not directly possible, thence, they were classified as intangibles and no methodology was developed to overcome the problem of their valuation for project appraisal. Then, the issue that provokes externalities is the lack of well defined markets for such goods or “bads”, to wit, if there were well defined property rights for projects that provoke externalities it would be possible to set up markets for them to encourage trade and achieve Pareto efficiency - in which case the externalities would disappear. Clearly, whenever there are externalities the market provision of the good need not be Pareto efficient and generally, too much of negative externalities will be produced - or consumed35 - and too little of the positive ones. Whenever a firm produces a negative externality, its private costs fall short of the social costs. And, when a firm produces a positive one, its private costs are overstated with respect to its social costs. Therefore, it is necessary to take into account the externalities in project appraisal, in order to account for the real - social - effects of the project and encourage the right provision of environmental and natural resources’ goods and services.
2.3.2 Failure to include intra- and intergenerational considerations As stated in the introduction, during the 60’s raising economic growth was the only in-dicator of development. However, during the 70’s it was clear that countries achieving fast economic growth did not necessarily expanded the economic and social opportuni-ties for all - the population. Real world economies are composed of many households, some of which gain and some of which loss from the implementation of a project36. This judgment may be also extended to the future generations37 , which means that both of these considerations should be addressed in order to decide about a project’s feasibility.
34 It refers to the negative externalities, which itself is a good, but by comparison is called a bad (JOHANSSON 1993). 35 In the case of public goods (JOHANSSON 1992). 36 It is possible to argue that this is the case of projects with significant environmental effects, where the cost are borne by the poor and the benefits by the rich (ANGELSEN, SUMAILA 1997). 37 Intra- and intergenerational equity is a public good and therefore, markets usually fail to provide the optimal amounts of it (JOHANSSON 1992; JOHANSSON 1993).
134
There are, then, two dimensions in income distribution. One has to do with the com-parison of incomes for poor and rich groups at a point in time, and the other with the comparison of incomes from a typical person today with a typical one in the future38. These issues were not taken into account in the traditional approach, therefore a methodological adjustment toward overcoming them should be made in CBA.
2.3.3 Failure in the application of the Kaldor-Hicks compensation criterion The issue of intragenerational distribution is related to the fact that the Kaldor-Hicks compensation criterion indicates only potential improvement and many economists maintain that distributional effects should be taken into account in a welfare criterion that proclaims actual improvement (See JOHANSSON 1992 for further details). In other words, “potential compensation” means that an aggregate welfare gain for society could be done “hypothetically39“ through compensation from winners to losers, although actual compensation is not required40. More specifically, following MISHAN 1981, the ethical justification of the use of the Kaldor-Kicks compensation criterion rests upon the following two premises: • each person’s welfare is to count according to his/her own valuation, • and there is a social consensus that a potential Pareto improvement’s change pro-
vides a net benefit to society. The second premise implies also that exists a consensus about whose benefits are to count - to whom is standing granted41. And clearly, theoretically, by using this criterion, it does not matter who gains or losses if there exists a net benefit for society42 - fact which does not comply with sustainability. Then, the problem with assuming this consensus - about which benefits are to count - is that the inclusion of stakeholders - and in turn, their social, economic, and environmental impacts - is very subjective and much at the first sight of the analysts of the project. In most cases, the benefits - including positive externalities - of public projects are concentrated on a relatively limited sub-segment of the population, which will be strongly in favor of it. However, the costs - including negative externalities - are bore by the poor
38 The existence of economic growth means that the comparison should be between a relatively poorer current generation with a relatively richer next generation (BRENT 1998). 39 By considering hypothetical compensation the focus is on the efficiency aspects of a policy change - project - (JOHANSSON 1992). 40 If compensation were actually required there would be no fundamental difference between the compensation principle and the Pareto principle (JOHANSSON 1992). 41 For further details see WHITTINGTON, MACRAE 1986. 42 By basing the analysis in the compensation criterion, efficiency makes it theoretically unnecessary to calculate the distributional impacts of a specific project (LONDERO 1996).

135
in some cases, or in other cases, generally paid with public funds and distributed widely over the whole society43. The result is that, although the project could be a total failure for society, the potential beneficiaries will tend to form an interest group supporting it - claiming standing -, while the potential losers are too diffuse or too politically weak to form the counterpart - no standing -, which makes the granting of standing important for decision-making. Furthermore, under the use of the second premise, empirically, it does matter who bears the costs and the benefits and potentially has an important meaning, because in most cases decision is taken under these basis, but the actual compensation does not take place. Hence, these criteria underestimate the importance of distribution effects. In reality, the losers from a project could be the most vulnerable people while the winners could be enforcing political and economic power, which would make the change not always desirable from society’s point of view44. Furthermore, unfavorable social projects could provoke sustainability problems, not only directly through opposition to the project, but indirectly by consuming the natural resources of the country as a way to provide the most basic needs of rural populations. Therefore, redistribution of income was desired, together with economic growth, in order to reach development, hence, a way to join both objectives in project appraisal was not yet applied and should be found. In addition, redistribution is not costless, hence, society may be concerned about a project’s impact on the distribution of income - welfare.
2.4 Conclusion There is no doubt that traditional project evaluation brought economic efficiency into the public - and private - decision-making process. However, the methodology had some drawbacks, which were later improved, and some other which are not yet solved, as described in the coming chapter. Then, from the sustainable development perspective, there are two dimensions, which are missing in the traditional CBA: income distribution and environmental future availability. It is also worthwhile to stress the importance of the analysis from the private as well as society perspectives. On the one side, the private perspective is important not only to know if the project is feasible for the owner, but to identify the possible way of financing it. Furthermore, the private perspective made from the point of view of other relevant
43 It could be also negative externalities bore by politically weak groups. 44 The social value of an increase in utility varies for different individuals in society. For example, a unit change in income for the poor would have a higher social value - the increment in personal utility is higher - than a unit change for the rich - the increment in personal utility is lower (JOHANSSON 1992).

136
stakeholders, gives and idea of the gainers and the losers of the project, which could be the start point of re-design and compensation, which affects decision-making. On the other side, the society perspective is vital to demonstrate if the project promote economic growth for the country, without which development cannot be carried out. The next chapter gives an idea of the methodologies developed in order to overcome some of the problems identified in the traditional project’s evaluation methodology just presented. These problems are, in turn, sustainability ones as described in the Intro-duction from Chapter 1, since they avoid society from accomplishing the three key elements of sustainable development: growth, distribution, and the environment.

137
3 THEORETICAL BACKGROUND: CURRENT CONSIDERATION OF THE
KEY ELEMENTS OF SUSTAINABILITY IN PROJECT EVALUATION
3.1 Introduction As described in Chapter 2, cost-benefit analysis (CBA) is a relatively simple methodology, which compares the discounted flow of benefits of different projects. However, complexity arises when one wishes to integrate the paradigm of sustainability into it. Since the problems identified with the traditional CBA - at the end of the last chapter 2- are in fact sustainability ones, the current chapter describes how the methodology has been improved to partly solve them and what are the gaps that still remain to accomplish sustainable development.
3.1.1 The relationship between the economic system and the environment In economic terms, following TIETENBERG 1988, the environment (or natural life support system) can be seen as an asset, which provides services to the economic system and directly to the people: resource supply, waste assimilation, and aesthetic commodity (Figure 3.1). If considering the relationship between these two systems as a close system (not taking into account the energy provided by the sun), there exist important implications which are well summarized by the first and second law of thermodynamics. The first law of thermodynamics states that “neither energy nor matter can be created or destroyed”, which implies that the mass flow extracted from the environment either accumulates in the economic system or come back to the environment as a waste. If there is no accumulation the whole is again deposited into the environment. Wastes depreciate the asset if they exceed its assimilative (absorptive) capacity and diminish the capability of the environment to provide services45. The second law of thermodynamics states that “entropy46 increases”. That means that no conversion of energy is 100 % efficient, some energy is lost during conversion and some other when used is no more available for work (no recycling). The implication of it is that the consumption of energy is an irreversible process and because energy is basic for life, if there is no energy there is no life, then, the system would die.
45 Including its assimilative capacity, yet, this capacity is also a finite resource (PEARCE, TURNER 1990). 46 Amount of energy not available for work (TIETENBERG 1988).
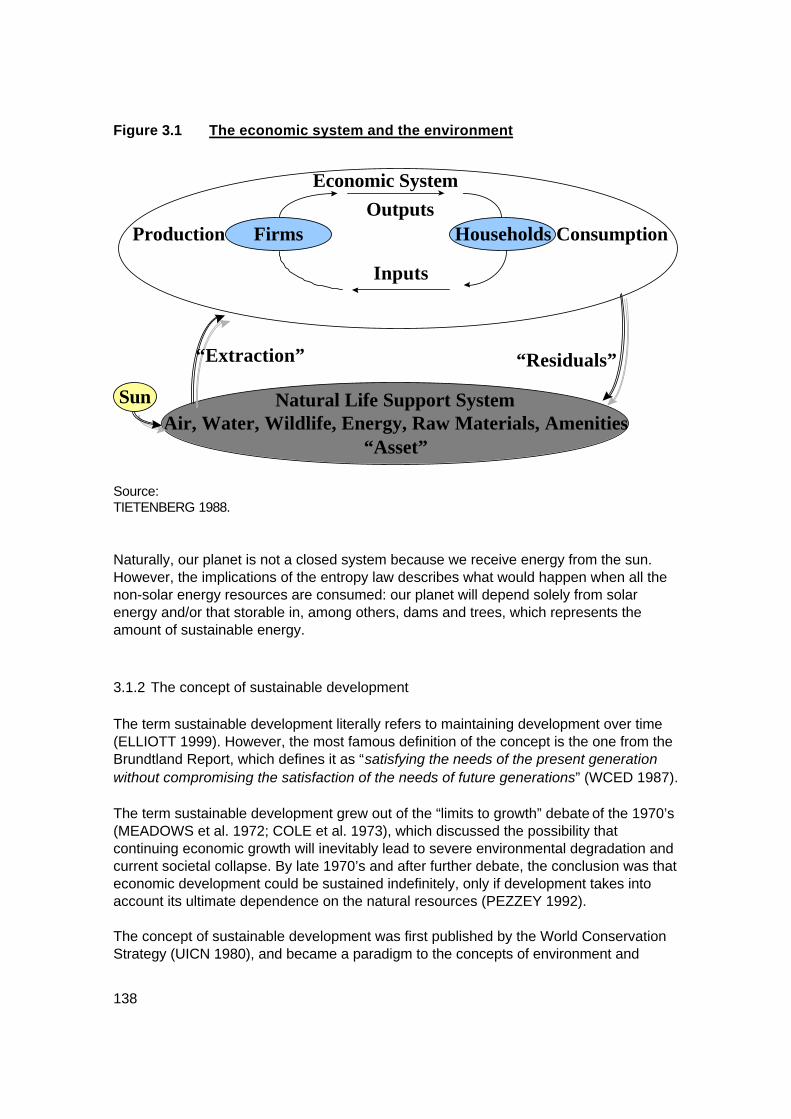
138
Figure 3.1 The economic system and the environment
Firms Households
Economic SystemOutputs
Inputs
ConsumptionProduction
Sun Natural Life Support SystemAir, Water, Wildlife, Energy, Raw Materials, Amenities
“Asset”
“Extraction” “Residuals”
Source: TIETENBERG 1988. Naturally, our planet is not a closed system because we receive energy from the sun. However, the implications of the entropy law describes what would happen when all the non-solar energy resources are consumed: our planet will depend solely from solar energy and/or that storable in, among others, dams and trees, which represents the amount of sustainable energy.
3.1.2 The concept of sustainable development The term sustainable development literally refers to maintaining development over time (ELLIOTT 1999). However, the most famous definition of the concept is the one from the Brundtland Report, which defines it as “satisfying the needs of the present generation without compromising the satisfaction of the needs of future generations” (WCED 1987). The term sustainable development grew out of the “limits to growth” debate of the 1970’s (MEADOWS et al. 1972; COLE et al. 1973), which discussed the possibility that continuing economic growth will inevitably lead to severe environmental degradation and current societal collapse. By late 1970’s and after further debate, the conclusion was that economic development could be sustained indefinitely, only if development takes into account its ultimate dependence on the natural resources (PEZZEY 1992). The concept of sustainable development was first published by the World Conservation Strategy (UICN 1980), and became a paradigm to the concepts of environment and

139
development. Two examples are the reports of the World Commission on Environment and Development (the “Brundtland report” cited above) and WORLD BANK 1987. The World Bank was compromised to promote sustainable development with the proposition that “economic growth, the alleviation of poverty, and sound environmental management are in many cases mutually consistent objectives” (WORLD BANK 1987). Nowadays, for some authors such as TERBORGH 1999, the application of sustainable development is a necessity if there is to be peace and prosperity in the world, the alter-native is exhaustion of natural resources, crushing poverty, and social anarchy. Hence, there exist many definitions and/or requirements for sustainable development that apply to different or the same scientific background. As an illustration, some others are following described below. The key elements of the concept are identified in the following section. a) In the ecological field, it refers to maintaining the resource stock constant over time
(PEARCE, TURNER 1990). Specifically, in forestry and fishery biology field, it is the maximum sustainable yield, which refers to the populations size which yields the maximum growth. However, for fishery economists, it is the static-efficient sustainable yield, which is the level of production, that if maintain perpetually, would produce the largest annual net benefit (TIETENBERG 1988).
b) In the agriculture field, sustainability refers to maintaining productivity, which spe-cifically relates to maintaining soil productivity through the use of technologies such as rotation, green manure, and mixed cropping (MÜLLER 1997). For CONWAY 1987, it is the net productivity of biomass (positive mass balance per unit area per unit time) maintained over decades to centuries.
c) In the economic field, it seeks to maintain an acceptable rate of growth in per-capita real incomes without depleting the national capital asset stock or the natural envi-ronmental asset stock (TURNER 1988).
3.1.3 The key elements of sustainable development Nowadays, most of the literature agrees with a statement from Robert Solow, Nobel laureate in economics: “It is very hard to be against sustainability. In fact, the more you know about it the better it sounds …sustainability is an essentially vague concept, and it would be wrong to think of it as being precise, or even capable of being made precise” (SOLOW 1993, pp. 179-180). Indeed, sustainable development is difficult to define and quantify empirically. It is a term that everybody supports, but nobody defines consistently (MÜLLER 1997; BAUER 1998). Therefore, a way to measure the attainment of sustainability was to be found. In con-sequence most authors underlie the following three components, as critical to make the concept operational (especially relating to CBA): growth, distribution, and environment (WCED 1987; VEEMAN 1989; MUNASINGHE 1990; PEARCE et al. 1990; JOHANSSON 1993; JAMES 1994; BRENT 1998).

140
Economic growth implies higher efficiency (within the economic system represented in Figure 3.1, and therefore, a higher total and/or per-capita income within a country. Growth was traditionally viewed as the only requirement (first objective) to produce development, yet nowadays, it is a necessary, but not a sufficient condition (MÜLLER 1997; ELLIOTT 1999). The formula of economic growth to produce development was suggested by Rostow in the 1960s; however, by the 1970s in many countries achieving a higher Gross National Product (GNP) inequality had already worsened (ELLIOTT 1999). Therefore, the concept of growth was separated from development, in the sense that development refers to a better standard of living - for all -, which is not usually reached by an aggregate higher income of society, as measured traditionally, for example, by the gross national product (GNP) of a country. In the decade of the 1970s, income distribution has come to the scene as a social con-cern and later as the second objective of development (BRENT 1996). It is a fundamental part of any development strategy and a way to reach a better standard of living for all. Then, it refers to sharing the efficiency effects among the population - within the economic system (see Figure 3.1). More precisely, distribution relates to intragenerational and intergenerational equity. Intragenerational equity refers to a better standard of living of all the constituents of the current generation (not in the aggregate, but individually), which could be achieved through a better income distribution. Intergenerational equity refers essentially to “keeping options open to the future generation”, and it is attained through conserving the means to fulfill future needs (the environmental asset). Then, by the decade of the 1980s, the environmental concern came to the scene (as the third objective of development), in the sense of reaching a balance between the use and the conservation of the environment or the way to treat the environmental asset in order to play its part in sustaining the economy as a source of improved standard of living (see Figure 3.1). In the 1960s and beginning of the 1970s development47 and conservation were con-ceived as incompatible objectives: environmental deterioration was the consequence of development. By the mid- to the end of the 1970s this conception was overcome as ideas about the environment included the lack of development of the developing world. The World Conservation Strategy (WCS) - published in 1980 by the International Union for the Conservation of Nature and Natural Resources (IUCN), the United Nations Envi-ronmental Program (UNEP), and the World Wildlife Fund (now the World Wide Fund for Nature) - recognized for the first time that development48 is required to accomplish conservation, rather than been an obstruction to it.
47 In this case development is conceived as economic growth. 48 Here it refers to economic growth.

141
The WCS identified three objectives of conservation: the maintenance of essential ecological processes and life-support systems (such as soil and forests), the preserva-tion of genetic diversity (for breeding projects in agriculture, forestry, and fisheries), and ensuring the sustainable use of species and ecosystems - use which does not exceed the productive capacity of the exploited species. These objectives encompassed many more ideas in regard to sustainable utilization and enhancement of the environment (ELLIOTT 1999). In the early 1980s the World Commission on Environment and Development formulated a proposal to deal with the critical environment and development: overcoming poverty and meeting the basic needs, and integrating the environment into economic decision-making. Furthermore, economic growth was a key factor to foster conservation. In fact the Brundtland report (cited above) extended the ideas of sustainable development far beyond the WCS, including a new kind of economic growth: less energy intensive and more equitable shared (ELLIOT 1999). In the 1990s the environment is well established in the development thinking and sus-tainable development is understood as the development based in the reality of local environments and the need of the poor. Therefore, it is important to take not only growth and distribution into account, but use and degradation of resources, because the environment is the base to support economic growth and, in turn, affects the standard of living of the current and future generations. Furthermore, BAUER 1997 states that there is now a wide social consensus about the necessity to take into consideration the environmental and natural resource protection. In conclusion, sustainable development is operationally defined in the current study - for the purpose of applying the concept to project evaluation - as that development which accomplishes economic growth for the country, a better income distribution (especially by improving the standard of living of the poor), and a balance between the use and preservation of the environment. The projects of interest for the current study are then, those that provoke environmental effects (positive and/or negative). When using the standard project classification, used especially by the international organizations, those are generally the following (IADB 1990): type I environmental projects with a positive impact over the environment, type III and IV projects with a negative impact over the environment49 (type II projects are not considered since they have neither a positive nor a negative impact over the envi-ronment, then they can be assessed using only the efficiency and distribution approach).
49 Type II and III refer to different intensities of the environmental impacts. Type II are projects with low environmental impacts, while type III are projects with a high environmental impact.

142
3.2 Consideration of Environmental Externalities An externality exists when the actions of an agent(s), either a firm or household, affects the welfare of other agent(s). There is an interdependence between the utility, or pro-duction, function of individuals. Environmental externalities could be negative or positive, depending on if the externality is a cost or a benefit to the agent who receives it (TIETENBERG 1988; JOHANSSON 1992; BRENT 1996). The most common examples of environmental externalities occur to air and water, i.e. a negative externality occurs from industrial pollution of a river which water is downstream also used for recreation and/or agricultural purposes; and a positive externality is carbon fixation from a forest project. The implementation of many projects50 provokes environmental effects, which should be taken into account in their appraisal (CBA), and that is called “internalization of envi-ronmental externalities”. This term also refers to the expression “getting the price right”, which basically means valuing the externalities and finding out their real or shadow price. The basic step to internalize the environmental externalities is to identify the project’s impacts, which is done through the application of the environmental impact assessment (EIA) techniques showed below. The environmental valuation methodologies presented later in section 3.2.2, are used to include the results from EIA into CBA by assigning them a monetary value.
3.2.1 Environmental impact assessment methodologies The content of this section shows a brief review of the different Environmental EIA methodologies, most commonly used for project appraisal. EIA is concerned with identifying and assessing the environmental consequences of development projects, plans, programs and policies to choose the best alternative for development. The main obstacles to incorporate EIA into project planning are the additional costs, the possible delay in project implementation, and the lack of manpower expertise for assessing the impacts (BISWAS, GEPING 1987). However, the first two are basically short-term views, because if the environment is not taken into account the consequences could be more long-term costs of the project, since mitigation is usually more costly than prevention, and an unbalance between the use and conservation of the environment, which is translated into a deterioration of the development means or the environmental asset.
50 This refers to the project’s type I, III, and IV explained in the introduction from Chapter I.
143
The main objective of carrying out an EIA is to identify the expected (adverse) envi-ronmental effects of the project, in order to incorporate not only the respective prevention and mitigation measures costs, but the valorization of these effects. Then, the ultimate purpose of the EIA is to identify as good as possible the real environmental benefits and costs of the project51. EIA can serve as a preventive process which avoids costly mistakes in planning and development. Therefore, it provides a description of the potential environmental conse-quences of an action, in sufficient detail to enable decision-makers to make rational decisions based on analysis and recommendations. In order to save resources for project development, two techniques for the EIA are used: • Screening: to ensure that only those projects which warrant a full EIA are assessed. • Scooping: to agree in the importance of the impact to be deeply analyzed. This sets
the scope of the EIA and it is useful for detailing the type of data to be obtained, methods and techniques to be used, and the way on which the EIA results are to be presented.
In literature, it is possible to find different methodologies to carry out Environmental Impact Assessments, which are used depending upon the characteristics of the project and the available resources. The most widely used methodologies are briefly explained below (BISWAS, GEPING 1987): a) Ad Hoc Methods: They identify a broad area of impact instead of identifying different
environmental parameters that should be investigated. These methods consist of statements of data requirements, without outlining the specific impacts on envi-ronmental parameters which may be caused by a project.
b) Checklists: They consist of a list of environmental parameters that must be checked
to identify potential impacts, avoiding to overlook at a particular environmental aspect.
c) Matrices: Consist of an horizontal list of project activities arranged against a vertical
list of environmental parameters. The cause and effect relationships between particular activities and environmental variables can be identified by placing a mark in the corresponding intersecting cells.
d) Overlays: This method relies on a set of maps depicting environmental
characteristics (physical, social, ecological, aesthetic, etc.) of the project’s area. e) Networks: A set of possible impacts (from past experiences of particular projects) is
defined and allows the users to identify likely impacts from the specific project being addressed. Primary, secondary, and tertiary impacts are identified.
51 A broader perspective could seek to identify the projects’ economic and environmental acceptability - by the community -, its critical environmental problems, which require further studies and/or monitoring, to examine and select the optimal alternative from the various relevant options available, to involve the public in the decision-making process related to the environment, and to assist all parties involved in development and overall relationships with one another.

144
f) Modeling and System Analysis: It considers multidimensional environmental problems, which often consist of multiple objectives, multiple criteria, multiple pur-poses and multiple users and interested groups. It is an analytical study that helps a decision-maker to identify and select a preferred course of action among several feasible alternatives. It is a logical and systematic approach wherein assumptions, objectives and criteria are clearly defined and specified. Modeling attempts to build a replica of a real-world system or situation, with the objective of experimenting with it to gain some insight into the real-world problem.
It is also possible to find variations of those methodologies presented and combinations, which are adapted according to the project’s conditions and necessities. The identification of environmental impacts can also give a qualitative idea of the effects of the project and serves as the base to the application of the valuation techniques which are discussed below.
3.2.2 Environmental valuation techniques Valuation techniques are useful in order to have an idea of the monetary value of the impacts of the project and due to the fact that they are usually the only way to incorpo-rate the project’s - environmental - effects into CBA. Usually more significance is given to items expressed in monetary terms, for which prices cannot be given directly, i.e. pollution, human lives, and scene destruction, among others (DE VRIES 1999). Furthermore, many of the gains (losses) from environmental improvement (deterioration) are not reflected in monetary terms, so the benefits (losses) have to be found more in the quality of life than in any increment (reduction) to a nation’s economic output. Thus, these environmental effects tend to be less “concrete”, yet, there is a tendency to downgrade them (BISWAS, GEPING 1987). Therefore, if CBA is to contribute to sustainable development, it must include the projects effects on the environmental asset. Yet, in order to make a more accurate (economic) valuation, it is important to estimate the total economic value of the asset. The total economic value embraces user and intrinsic values. User values refer to the actual use of the environment, while intrinsic values refers to the option52 to use the environment or to the value placed on the existence53 of the environmental asset (see Glossary).
52 The value of the environment as a potential benefit as opposed to actual present use value. It is essentially an expression of preference. 53 Existence value is a value placed on an environmental good, which is unrelated to any actual or potential use of the good.
145
Consequently, evaluation methodologies have been developed in order to make these environmental effects more concrete - and overcome the problem of preference revela-tion. Therefore, at this time, a great amount of literature and analytical techniques are available for dealing with their valuation; some of the most frequently used are briefly following described54. a) Surrogate market or the hedonic technique: this is a market of some other good or
service that is influenced by non-marketed environmental goods - attributes - (i.e. property market55). This technique tries to identify, through a multiple regression analysis, how much of a property value differential is due to a particular environ-mental difference between properties and infer, how much people are willing to pay for an improvement in the environmental quality and what the social value of the improvement is (BISWAS, GEPING 1987; OECD 1990; PEARCE, TURNER 1990; JAMES 1994; BRENT 1996).
The disadvantages of the technique are that it is mostly applicable to property price changes, require good quality information at least about property, neighborhood, and accessibility variables, and it is a relatively complex technique, especially when using times series56 or pooled57, instead of cross sectional data58. Furthermore, if a relevant variable is excluded from the analysis the estimated environmental effects on property value could be biased (upward or downward depending upon how the included and excluded variables relate to each other and to the property value).
b) Travel cost: it uses information about the amount of money and time that people
have spent in getting to a recreational site - from varying distances - to estimate their willingness to pay for the facilities of that site (BISWAS, GEPING 1987; OECD 1990; PEARCE, TURNER 1990; JAMES 1994; BRENT 1996).
The main disadvantage of the technique is that only applies to the measurement of
the value of recreational sites, besides the complexity of applying it. c) The contingent valuation method (CVM): it creates an artificial market by asking the
people their willingness to pay for an environmental benefit or their willingness to accept as a way of compensation to tolerate an environmental cost (see Chapter 5 for a practical application of the methodology). The approach is mostly used through a direct questionnaire/survey, which look for the personal valuations of the respondents to the supply of some good, contingent upon a hypothetical market, but
54 A more detailed review of the different economic valuation techniques available can be found in JAMES 1994. 55 Houses are bought and sold in property markets and one factor influencing this market is the level of air pollution, noise level, changes in aesthetic surroundings, etc. Given that different locations have different environmental attributes, there will be differences in property values. 56 Data taken from a (small) number of similar residential properties over a period of years. 57 Use of both cross sectional and time series data. 58 Data taken from a (large) number of diverse properties at a point in time.
146
there exists also experimental techniques, where respondents answer to several stimuli in laboratory conditions (BISWAS, GEPING 1987; OECD 1990; PEARCE, TURNER 1990; JAMES 1994; BRENT 1996).
The idea of the technique is to look for the personal valuations of the respondents
for a relative quantity (or increases or decreases) of some good in a hypothetical
market.
The objective of the CVM is to obtain valuations which are close to those revealed if
the actual market existed; then, the hypothetical market must be as close as possible
to the real one.
The most important characteristic of this technique is that it is the only one appli-
cable in all circumstances, thus, it is frequently the only technique of benefit esti-
mation and, in turn, it is applicable to most contexts of environmental policy.
However, there exist several biases, which are following presented (which constitute
the main disadvantage of the technique) and can be introduced by using this
technique: • Design bias: this is divided into three specific types. Starting point bias refers to
the effect caused by the first bid (starting point) presented to the interviewee, for example, among others, by causing the respondent to agree too readily with bids in the vicinity of the initial bid to shorten the time of the interview. Vehicle bias relates to the choice of the instrument of payment used in the approach, for example, among others, higher prices, local taxes, entrance fees, and surcharges on bills. Information bias has to do with the quality and quantity of information and the sequence in which it is provided, for example, among others, respondents must be familiar with the good or service in question and the payment vehicle used.
• Strategic bias refers to revealing the real information from the interviewees due to the fact that they can be benefited by manipulating the responses (free rider), for example, stating lower willingness to pay answers if they suspect the research looks to increase entrance fees.
• Hypothetical bias relates to the difference between actual and hypothetical markets and payments, for example, buyers could suffer a cost if they regret the purchase by having paid too much.
• Operational bias refers to the extend to which the actual operating conditions in the CVM approximate real market conditions, for example, the degree of familiarity with the good or service they are being asked to value.
d) Dose-response technique: It seeks to estimate the relationship between the dose
(pollution) and the non-monetary effect (i.e. impairment) to make,. for example, a

147
health damage valuation59, which then apply a measure of preference (WTP) for that effect (BISWAS, GEPING 1987; OECD 1990; PEARCE, TURNER 1990; JAMES 1994; BRENT 1996).
The problem with this technique is that it does not look to measure direct revealed preferences for the environmental good under study, it is instead an indirect method of estimation.
3.2.3 Compensation At this stage, it is important to remember (from Chapter 2) that the basic theoretical call of the cost-benefit criteria, applied to traditional (efficiency) project appraisal, is to approve any project which will provide a group a larger benefit than the costs to another one60. This practice is regrettable in a single case, but when the same groups, especially the poor and most vulnerable ones, are repeatedly the losers, that is deplorable and probably intolerable (JOHANSSON 1992). Although identifying and valuing the environmental impacts of the project is necessary to incorporate these effects into CBA, by itself it does not assure fairness, especially when the poor is involved. Therefore, empirically the interest should be not only in making the project itself attrac-tive61, but its whole package of consequences (externalities), which could be done through compensation; not only money transfer payments, but for example, compensation in-kind62, such as social infrastructure, hospitals, schools, roads, and/or provision of some other goods and services. Compensation, in turn, alleviates inequality63 and tend to approach the economic re-quirements (results) of the project to the Pareto efficiency criterion64 - by internalizing the 59 Measures the relationship between health and for example air pollution. 60 Even though, the new social CBA, includes an additional social objective - distribution -, there will be always losers from the project (BRENT 1996). 61 For example, in the case where there is a social consensus about building the project, but opposition about its location from the project’s direct affected people (i.e. construction of a locally noxious facility). 62 By providing in-kind compensation, society ensures that particular goods and services are received, and not some other undesirable goods such as cigarettes and alcohol, which could be bought with direct money payments (for further discussion on this subject see BRENT 1996). 63 In most cases, this problem consists of small but concentrated and large but diffuse interests. 64 Under the Pareto criterion a change is desirable if will make at least some ones better off while no one worse off than before (JOHANSSON 1992).
148
negative externalities. If such compensation is not paid, a beneficial project could be permanently or partially blocked, causing further costs or even inability to implement it65 (O’HARE 1977). The compensation process will inevitable require negotiation and knowledge of the losers preferences66. Compensating them is required by the political process if an effi-cient allocation of resources wants to be achieved. Furthermore, to the extend that in real world situations, the distribution of political power among stakeholders differs from the distribution of total costs, this bias should be recognized and accounted for at analyzing alternative projects (O’HARE 1977). In the proposed methodology presented in Chapter 4, as a result of identifying the sig-nificant impacts, those who are to be compensated67 are the ones that bear negative (significant) impacts, not necessarily to be a taking under law, from the project (losers), especially if they are the most vulnerable people in society. Losers could be potentially compensated by those who bear (significant) positive effects (gainers)68, which could be also the owners of the project itself. When impacts affects groups numerically small, say, firms or individuals, the compen-sation could take the form of a direct payment. Conversely, when the impact affects groups numerically large, compensation should be done most preferable through indirect methods, i.e. social infrastructure, more services, taxes’ reduction, and/or indirect subsidies. The reason for this is that in general when ordering the probability of individual actions, members of small groups have a lot at stake69, while members of large groups have little at stake (O’HARE 1977). Consequently, when implementing a locally noxious facility, i.e. a solid waste disposal center and/or a project with negative externalities (costs) to the surrounding communities, compensation is essential in order to diminish their individual risk and to discourage action against the project - even though the project could be socially beneficial. The idea is to change the perception against the project, even in cases where such compensation is not worth their administrative costs, because their omission may mean that a valuable project is canceled on the ground of community unwillingness to accept it70. 65 “[T]he total benefits at stake are larger for the diffuse interests who favor the project, but the per capita risk that motivates individual action is larger for the concentrated group of neighbors who oppose it” (O’HARE 1977). 66 There exist a vast literature about community participation, such as GEILFUS 1997, which could be explore for further details. 67 Assuming they do not bear significant market imperfections, such as externalities, in which case could be necessary to account for them. 68 In theory this could mean the internalization of all project’s externalities. 69 It is also true that the smaller the group, the more likely that psychological pressure can force cooperation (O’HARE 1977). 70 Such a case would empower a strong efficiency argument for such compensation.

149
Continuing with O’HARE (1977), the reasons for compensating the neighbors of noxious facilities is supported by the following group’s characteristics that can direct it to exert power out of proportion to their aggregate risk: a) its members are easy for an organizer to identify, b) know each other by sight, c) face costs that would diminish the value of their assets, and d) any resentment of government is easy to be characterized in the media as an action
from the insensitive bureaucracy on the “little people”. The compensation can be also carried out through a bidding process offering commu-nities71 the opportunity to consciously exchange the inseparable package of costs and benefits that a proposed project offers, for a package of goods and/or services that will, in practice, maintain them nearly as well off as before, which in turn reveals the true cost for the communities (for further details see O’HARE 1977). Furthermore, many natural resource and environmental economists suggest to follow the premise of “who pollutes the environment and uses the natural resources should pay”72, which reflects the concept of internalization of (negative) externalities and set up a principle to be used in order to promote sustainable development.
3.3 Moral-Legal Environmental Bounds “[S]ome kinds of natural capital are vital, irreplaceable, and beyond price. The preser-vation of such assets should be an absolute constraint on all activities…” (OECD 1995). In fact, when applying the concept of sustainability to real world projects, it is necessary to consider that some (key) natural assets are irreplaceable and no identification of impacts, valuation, and/or compensation would reestablish and keep them for future generations. MÜLLER 1997 also states that in order to promote the intergenerational equity, economic growth should respect certain environmental limits to maintain the options of future generations, a value in accordance to sustainable development. That is the case when, for policy choice, one value criterion always prevails over the others; in other words, an advantage on one criterion (i.e. preservation of irreplaceable habitats) in one alternative (project) cannot be compensated by any advantage on other criteria (i.e. a higher net present value) in other alternatives (projects). Criteria that possess this property are called “mandatory norms” or “lexical” (MACRAE, WHITTINGTON 1997).
71 When the project could be carry out in different locations. 72 The polluter pays principle (PPP) is that the cost of preventing pollution or minimizing environmental damage due to pollution should be borne by those responsible for the pollution (ELLIOTT 1999).

150
The mandatory norms (or moral/legal bounds) are limits set up by society, which render construction and operation’s restrictions to the project73. For example, OATES 1999, TERBORGH 1999, and SCULLY 2000 seem to share the view that in order to protect biodiversity, big pieces of land must be set aside and kept off of human activities. For example, in the context of the current study, these bounds would be established by law and moral restrictions - on natural resource use and environmental pollution, set up by the country and/or international community, carrying out the project, i.e. preservation of irreplaceable pristine forest.
3.4 The Social Discount Rate At one extreme, some environmentalists reason that discounting future costs and benefits may discriminate against future generations, consequently, demand a zero discount rate (MÜLLER 1997). PEARCE et al. 1990 suggest a discount rate between 2 % and 5 %. And, MUNASHINGE 1993’s position is to used the normal opportunity cost of capital discount rate of 6 % to 12 %74, but with a restriction on environmental damage75. The social discount rate (SDR) is the rate used in CBA to discount the future stream of benefits and costs of the project, a concept which deals with sustainable development. It, just as distribution weights (which will be discussed in Section 3.5.1), involves attaching coefficients to the benefits and costs, but this one rather deals with intergenerational equity76. The SDR, which focuses on the differential timing of effects, is used to discount future values to calculate the net present value of the stream of benefits and costs of the project (the r value in Equation 2.1 in Chapter 2). BRENT 1996 suggests using the social time preference rate (STPR) as the SDR, basically because it is the right concept to use77 (see Section 2.2.3 in Chapter 2). Clearly, individuals living today make savings decisions concerning how they wish to allocate their lifetime resources, now and in the future. The issue is then, to what extent the
73 In some cases, when working with bounds or constraints the economic question becomes one of cost-effectiveness - how to respect the bound at the least cost. 74 This position implies an efficiency use of capital resources. 75 When a danger of irreversible processes or difficulty on the environmental valuation exists. 76 Costs and benefits that accrue to the individuals affected by the project at different points in time. 77 The SOCR is the wrong concept to use, because by using this rate investment is undervalued relative to consumption, and this is a matter of determining the shadow price of capital, not the SDR (for further explanation see BRENT 1996, cp. 11, p. 271).

151
STPR should be based on these individual time preference rates, when the preferences of the future generations as well as those currently living should be taken into account. There are two propositions: an individualistic or an authoritarian social time preference rate. Continue with BRENT 1996’s explanation, in the former, the individualistic, the prefer-ences of the existing generation is given priority, but these preferences depend on the consumption of future generations. Individual savings may not be optimal in the presence of an externality. The problem with this approach is that no one has tried to produce (with the externality argument) an actual estimation of the STPR. In the latter, the authoritarian, the existing generation is assumed not to be able to account for the future one, therefore, government needs to intercede and replace individual time preferences with a distinct social perspective which explicitly includes the preferences of future generations. Therefore, let concentrate on the second one, the authoritarian preposition. PIGOU has argued that the individual suffers a “defective telescopic faculty78“ for inter-temporal choices, hence, the preferences of the existing generation cannot represent those in the future79. As a starting point, under authoritarism, society should be responsible for future generations as well as the current ones80. Then, there are two aspects to consider: • because of economic growth, future generations will be richer (consume more) and; • because there exists a diminishing marginal social value of increases in consumption,
the additional income going to the future generation should be valued less than the additional income going to the current one.
i = n * g + p (3.1)
where: i = social time preference rate (STPR) or consumption rate of interest (CRI), p = rate of pure time preference, g = the growth rate of per capita consumption - income over generations -, n = society’s aversion to inequality.
Source: BRENT 1998. Let explain how these two aspects are considered in Equation 3.1, to calculate the SDR. The n term is the elasticity of the social marginal utility of income (the percentage change
78 For further explanation see BRENT 1996, cp. 11, p. 276. 79 Usually, it is assumed that individual are the best judge of their own welfare. 80 It does not imply equal generational weights.

152
in the weight divided by the percentage change in income81, see next Section), which accounts for point 2 above: how important is income inequality valued. On the other hand, the g term is the growth rate of income over generations82, which account for point one: a richer future generation. The last term p is the pure rate of time preference, which is the rate that society uses to discount effects that are received by generations yet unborn. A positive rate of pure time preference puts a premium on the current generation’s consumption, because they may not live into the future. SQUIRE, VAN DER TAK 1975 recommend for p fairly low values - 0 to 5 % -, on the grounds that most governments recognize their obligation to future generations as well as to the present. Current practices fixes this rate by reference to individual survival rates, although LAYARD 1972 proposes p equals to population growth (BRENT 1996; FUGUITT, WILCOX 1999).
3.5 The Distributional Cost-Benefit Analysis “[I]f society has a more equal distribution as one of its objectives, distribution should be part of the considerations for project selection and design” (ANGELSEN, SUMAILA 1997). The distributional cost-benefit analysis (distributional CBA) is not only an analysis from who pays the costs and obtains the benefits (Chapter 2), it is more comprehensive and seeks to combine the objectives of economic efficiency and income distribution to reach development83 and ultimately make the ranking of projects (BRENT 1998). Distributional CBA can be considered an improvement toward taking into consideration the three key elements of sustainability, using a common indicator (monetary terms) in development project’s decision making. In the distributional CBA, the concept of growth is attached to economic efficiency through the maximization of the projects’ benefits. Intragenerational and intergenerational equity are linked to the use of distributional weights84 (and the social discount rate). And finally, the environment is counted through the valuation of environmental impacts (ISLAM, GIGAS 1997, BRENT 1998). 81 In mathematical terms: ( )[ ] ( )[ ]a a a Y Y Y0 1 1 1 0 0− −/ / / .
82 In mathematical terms: ( )Y Y Y1 0 0− / .
83 Comparing this new approach to the traditional one, there is no question about putting the resources to their best use, the difference is that, in the former, social benefits are defined in terms of two objectives (efficiency and distribution), not just one (efficiency) as the latter (BRENT 1998). Furthermore, distribution cannot be separated from efficiency, because the means for redistribution of income are far from perfect (ANGELSEN, SUMAILA 1997). 84 Although weights are more often invoked in textbooks than used in practice (MACRAE, WHITTINGTON 1997), their use put CBA closer to the three key elements of sustainable development already described.

153
The basic idea behind the distributional CBA model is to disaggregate the benefits and costs of the project and apply unequal weights depending on their social significance. Although whether to include weights is the most controversial subject in CBA85, it is recommended as a way to deal with intragenerational distribution86 (BRENT 1996). By doing so, then, it handles two social objectives, not just one: total income growth (effi-ciency) and distribution of income (ANGELSEN, SUMAILA 1997). Distributional weights reflect the social significance of a change in the income87 of a person. Hence, weights are used in CBA under the principle (assumption) that an income effect (benefit or cost) worth different according to the segment of the population88 to whom they accrue. Therefore, an additional unit income to the poor worth more (higher weight) than the same unit to the rich or vice versa. In other words, weights reflect the social marginal utility of income89 (BRENT 1996). Besides, government’s ability to tax in order to affect distribution of income is limited, i.e. political forces may oppose taxes on land, the main source of wealth in developing countries. This constraint means that, if there exist a distribution concern, any benefit that goes to the poor should be given a premium - weight - (BRENT 1998). In short then, distributional CBA (see Equation 3.2) should consider the following key elements (BRENT 1996): a) All benefits and costs are to be included (private and social, direct and indirect,
tangible and intangible). b) Benefits and costs are to be defined by the standard principles of welfare economics.
In other words, economic efficiency (E) is obtained by re-valuing inputs and outputs at social rather than market prices90.
c) The social discount rate91 is to be used for discounting. d) Constraints are to be included in the objective function, and are not allowed sepa-
rately92 (i.e. use of distributional weights).
85 Because of efficiency versus distributional issues. For further detail see BRENT 1996. 86 Because it deals with benefits and costs that accrue to the individuals affected by the project at the same point in time. 87 Assuming that income make individuals better off (individual’s marginal utility of income) and so increases social welfare (BRENT 1996). 88 It seems better to define groups - segments of the population - in terms of poverty, for them one would be sure that had identified a group in social need (BRENT 1998). 89 Society’s valuation of the individual’s marginal utility of income (BRENT 1996). 90 Some authors use world prices to express E (BRENT 1998, c. 1, p.10). 91 It includes the preferences of future generations (BRENT 1996). 92 For example, income distribution considerations are included by weighting the consumer’s willingness to pay according to an individual’s ability to pay (BRENT 1996).

154
( )( )
NPVa B C
s
i it iti
n
tt
T
=−
+=
=
∑∑ 1
1 1 (3.2)
where:
NPV = net present value ai = weight attached to benefits for any income level group i according to their social significance, Bit = benefits of the project for the income level group i in year t, Cit = costs of the project for the income level group i in year t, s = social discount rate, i = 1,……,n; for any income level group, t = 1,……,T; for any year.
Source: Based on BRENT 1996. Therefore, if distribution weights are applied to the calculation of the NPV criterion, which is use to rank projects in cost-benefit analysis, the Equation 3.2 is derived. This equation could be interpreted as a compensation test, for if it is positive then society is potentially better off in terms of a joint consideration for efficiency and distribution. Furthermore, due to the fact that traditional CBA was founded on the potential Pareto improvement93, and that distribution weights are applied to the efficiency effects, the Pareto principle is also fundamental to the distributional CBA (BRENT 1996).
3.5.1 Calculation of distributional weights There exist two ways of calculating weights: the “a priory approach” and “the imputa-tional or revealed preference approach”, which will be explained in the following two subsections.
93 There are essentially four Pareto value judgments that underlie the concept of Pareto principle: an individualistic conception of social welfare, non-economic causes of welfare can be ignored, consumer sovereignty, and Pareto optimality (for further details see BRENT 1996, cp. 1, p. 28).

155
3.5.1.1 The a priori approach The a priori approach specifies a parameter based on a priory judgments from the de-cision-maker, which applies to the whole income distribution and reflects society’s aversion to inequality - the n parameter in Equation 3.2 (BRENT 1996). Following SQUIRE, VAN DER TAK 1975, reasonable assumptions, such as the followings, should be set in order to determine distribution weights: • Everyone, within one income level group, has the same utility function U, therefore,
the U from one individual is equal to the welfare function of that group (W). • Let this individual U shows diminishing marginal utility with respect to income. Use
for example, the constant elasticity marginal utility function; then, the social marginal utility function of any - income level - group i is given by the following equation94:
94 When a weight to public sector revenues is to be applied another parameter has to be calculated, according to the following equation:
v Wg W q ic
= =/ ( / ) / β
where
v= social value of a unit of free foreign exchange in the hands of the government relative to the social value of consumption - to a group consuming at the average level of consumption -; in other words, it reflects the intergenerational investment/consumption dimension.
Wg = social value of a unit of government resources.
Wc= marginal social value of one unit of consumption by a person in the
group at the average level of consumption. q= estimated marginal product per year on a particular public expenditure, - which is the same for all government expenditures if considering the case where they are optimally allocated, therefore, only one marginal product must be calculated. i= discount rate. β= exchange rate.
Source: BRENT 1998.

156
a Yi in= − (3.3)
where:
ai = social marginal utility of any group i (weight to group i), Yi = income of any group i, n = positive constant signifying the elasticity of the social marginal utility - income - function (society’s aversion to inequality).
Source: BRENT 1996. • Set a value for n. SQUIRE, VAN DER TAK 1975 recommend that n= 1 should be assumed (values between 0 and 2 could be used in a sensitivity analysis), which is considered a moder-ately pro-poor aversion parameter by most analysts, although BRENT 1990 suggest using n= 0.5 as a benchmark. Usually, this version is expressed relative to a group at the average income level, which is represented in Equation 3.4 (BRENT 1996). 95
aYYii
n
=
−
(3.4)
where:
ai = social marginal utility of any group i (weight to group i), Yi = average income of any group i,
Y = average society’s income,
n = positive constant signifying the elasticity of the social marginal utility - income - function (society’s aversion to inequality).
Source: BRENT 1996; ANGELSEN, SUMAILA 1997.
Equation 3.4 means that if n= 1 then a Y Yi i= / (ANGELSEN, SUMAILA 1997; BRENT 1996). The three main disadvantages of this distributional CBA approach are the following (BRENT 1996):
95 There are no theoretically accepted procedures to deriving n, except for extreme cases: 1.- n= 0, implies that the weights are equal to one, in which case CBA relies only in the efficiency criterion (B-C); 2.- n= ∞, implies that only the effect on the worst-off individual in society matters (maximin principle associated with RAWLS 1971). Number two means that if a project benefits the worst-off individual and makes everybody else worse-off, then the weighting scheme would approve the project (BRENT 1996).

157
• there is no clear basis for selecting a value for n96; • the weights are attached to income, but a socially needy person is usually defined by
a mixture of income and non-income criteria97, and; • the weighting function gives a complete specification of weights for all income
groups, but not all are of social concern, obviously, those incomes below the poverty level is what really matters.
3.5.1.2 The revealed preference approach The revealed preference or imputational approach assumes that the decision-maker needs assistance in determining these weights, therefore, derives them from behind past society decisions. For example, the past weights used before can provide the basis for specifying new values for future distributional CBA; therefore if society approved the earlier decisions, the weights will remain so, but if society disapproved them they should change - smaller weights if lesser attention should be paid to inequality and bigger on the contrary - (BRENT 1996).
3.6 Outstanding Problems of the Sustainability Based Methodologies for Project
Evaluation An empirical problem of the distributional CBA is that although the field of environmental impact assessment and valuation has improved rapidly, there is still a lack of integration, among the environmental dimension and the already integrated social and economic dimensions98, for the approval of projects in a sustainable sound methodology99. In theory, the environmental dimension is full considered by incorporating the environ-mental costs and benefits in monetary terms (through the techniques presented in Sections 3.2.1 and 3.2.2), but in reality it is not always possible to value all of them accurately and their valuation do not ensure the quality (availability) of the resources in
96 The n value has to be estimated from a priori judgments or from past society decisions, therefore, there is no mathematical equation to calculate it. 97 The fulfillment of a person (family) basic necessities depends on six sources of welfare (BOLTVINIK 1992): a)income, b)access rights to free (subsidized) governmental services or goods, c)property, or user rights, of assets that provide basic consumption services, d)educational level, the capabilities, not as a meaning to obtain an income, but as an expression of the capacity to understand and do, e)the time available for education, resting, recreation, and housework, and f)the non basic assets and/or credit capacity of the family. 98 The social and economic dimensions are integrated in the social CBA, through the use of weights and the social discount rate. 99 In the context of the current study, a sustainable sound methodology for project evaluation is the one that includes the three key elements of sustainable development identified in Section 3.1.3: growth, distribution, and the environment.
158
the future, in order to support sustainable development (ISLAM, GIGAS 1997), because environmental benefits could be off set by efficiency - and/or distributional - effects. Furthermore, there exist limitations to identify and quantify environmental effects, such as a nice view, and its valuation is not always accurate (see Section 3.2), which means that the inclusion of the exact value of the environmental effect into CBA is not always possible. Finally, in spite of the fact that the distributional CBA includes one more social objective (distribution), the virtual Pareto improvement or Kaldor-Hicks compensation principle, explained in Chapter 2 Section 2.2, is still fundamental to it. The reason for this is that the compensation principle is the base to define efficient projects; and distribution weights are applied to the efficiency effects (BRENT 1996). Consequently, on the one hand, the approval of a project, based on the Kaldor-Hicks principle, still implies that there exist a social consensus that it represents a net benefit to society, which in turn implies a consensus about whose benefits (impacts) are to count. Therefore, as already discussed in Chapter 2 Section 2.3.3, in practice, analysts sometimes omit from their calculations stakeholders, and in turn impacts, who do not seem to belong to the “society” under consideration. They may neglect effects, espe-cially costs, bearing on recipients of pollution and/or degradation of natural resources and, politically weak groups (MACRAE, WHITTINGTON 1997). In fact, for example, a broad Overseas Development Administration (ODA) studies’ overview in a variety of countries shows, as one of its primary concerns, that evaluation has tended to be an internal process which excludes some major stakeholders (O’DONOVAN 1997). On the other hand, the use of weights addresses the issue of distributional effects, but they do not deal with the absence of compensation, which means, in modern and tradi-tional welfare economics, that there will be still losers from the project.
3.7 Conclusion Figure 3.2 is a graphical representation of the sustainability improvements in project appraisal described in the current chapter. This appraisal now introduces the assess-ment of environmental impacts and can modify the traditional cost-benefit analysis (tra-ditional CBA from the society point of view, detailed in Chapter 2 Figure 2.1) through the introduction of a new social objective: distribution.
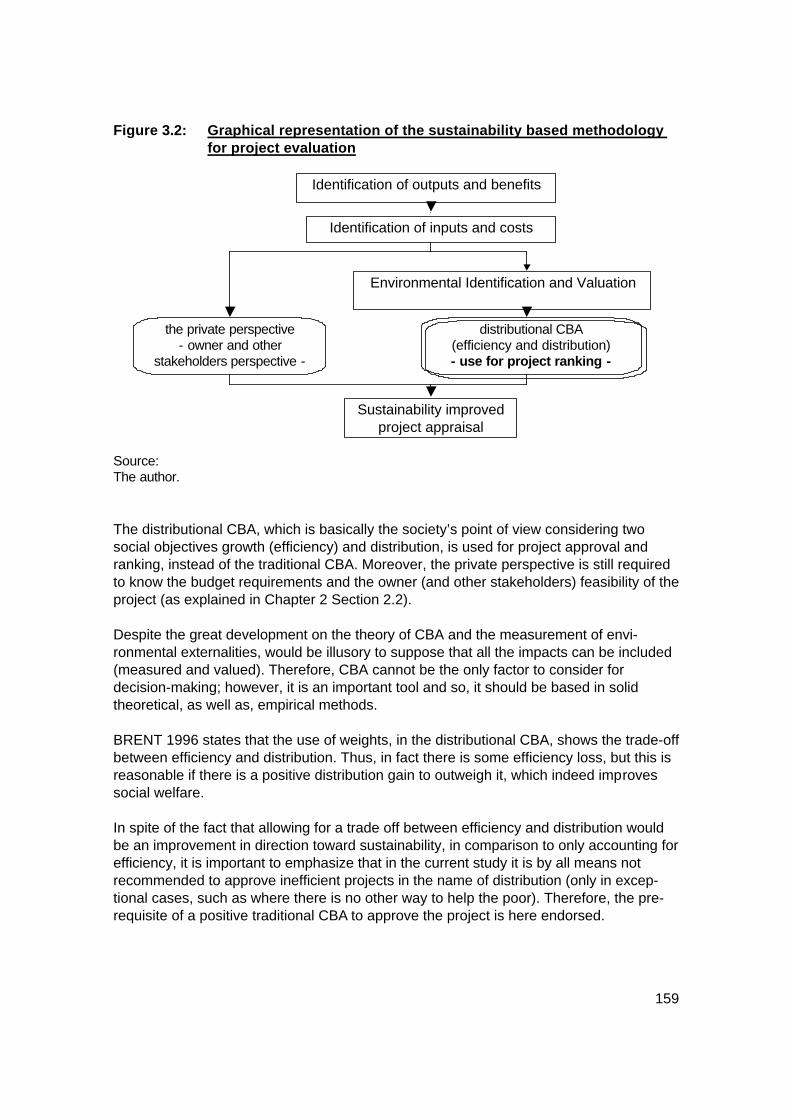
159
Identification of outputs and benefits
Identification of inputs and costs
Sustainability improved project appraisal
the private perspective - owner and other
stakeholders perspective -
Figure 3.2: Graphical representation of the sustainability based methodology for project evaluation
Source: The author. The distributional CBA, which is basically the society’s point of view considering two social objectives growth (efficiency) and distribution, is used for project approval and ranking, instead of the traditional CBA. Moreover, the private perspective is still required to know the budget requirements and the owner (and other stakeholders) feasibility of the project (as explained in Chapter 2 Section 2.2). Despite the great development on the theory of CBA and the measurement of envi-ronmental externalities, would be illusory to suppose that all the impacts can be included (measured and valued). Therefore, CBA cannot be the only factor to consider for decision-making; however, it is an important tool and so, it should be based in solid theoretical, as well as, empirical methods. BRENT 1996 states that the use of weights, in the distributional CBA, shows the trade-off between efficiency and distribution. Thus, in fact there is some efficiency loss, but this is reasonable if there is a positive distribution gain to outweigh it, which indeed improves social welfare. In spite of the fact that allowing for a trade off between efficiency and distribution would be an improvement in direction toward sustainability, in comparison to only accounting for efficiency, it is important to emphasize that in the current study it is by all means not recommended to approve inefficient projects in the name of distribution (only in excep-tional cases, such as where there is no other way to help the poor). Therefore, the pre-requisite of a positive traditional CBA to approve the project is here endorsed.
distributional CBA (efficiency and distribution) - use for project ranking -
Environmental Identification and Valuation

160
The main reason to set up this requirement is that the approval of an inefficient project would indicate that it does not comply with sustainable development100, which should include the three key elements already identified (growth, distribution, and the envi-ronment). Furthermore, even though the distribution concern is treated vastly in the literature, whose benefits and costs (and their respective impacts) are to be included in the analysis is implicitly assumed and not much direct attention is given to it. In other words, who has standing in CBA is not clearly stated. The lack of agreement on whose benefits and costs are to count is due to the fact that in practice project’s analysts do not have a systematic way to assign standing to stakeholders (and in turn the impacts upon them), so as to provide some uniformity to project analysis. For this reason, in some cases analysts could give standing to stakeholders who did not deserve so and not give to others that deserve it, which could raise opposition, higher project costs, and sustainability problems. Another gap in CBA is related to the inclusion of the environmental concern for project approval (and ranking). Just as the social aspect (income distribution) has been taken into consideration into the NPV equation, the environment should be accounted for. Moreover, a way to include technical considerations about the balance between the use and conservation of the environmental asset (future availability) in projects’ appraisal, to benefit those which especially improve damaged environments, should be sought. In this way, the integration of the environmental, social, and economic effects of the project, in an environmental CBA, would contribute to reach sustainable development, which is a more accurate approach with today’s values and expectations.
100 Following PEARCE 1997, honoring economic efficiency reflects the objective of real income growth without which the developing world will be locked into a poverty trap. In fact, an inefficient project does not contribute to accomplish the fundamental requirement of economic development for the country.
161
4 PROPOSED METHODOLOGICAL ADJUSTMENTS TO CONSIDER
ENVIRONMENTAL SUSTAINABILITY IN COST-BENEFIT ANALYSIS
4.1 Methodology Overview In the current section, a brief overview of the methodological adjustments to consider environmental sustainability, the missing element described in Chapter 3, in cost-benefit analysis (CBA) is presented. A more detailed explanation is carried out in the following sections. It is important to notice that the methodology seeks to extend and complement (adjust) the current CBA methodologies, used for project appraisal101 (described in Chapters 2 and 3), to account for the three key elements of sustainable development (growth, dis-tribution, and the environment). The methodology is described in Figure 4.1. The secondary data102 is complemented with primary data to identify the project’s benefits and costs, criteria system for environmental impact assessment (EIA), and non-monetary evaluation of the project impacts, requirements to construct the CBA.
The evaluation of the project social, economic, and environmental impacts, additionally, serves the purpose of appraising the project from a non-monetary perspective, by pro-viding a procedure to assign a value to the experts’ opinions about the severity of the impacts, based on qualitative and quantitative information (Section 4.3). The project benefits and costs’ identification serves to construct the CBA from the point of view of the owner of the project, which together with the impacts’ valuation is the base to carry out the CBA from the point of view of the society as a whole103. The more detailed steps between which these points will be developed, in subsequent sections of the current chapter, are shown in Figure 4.1 using pointed boxes.
More specifically, the CBA methodology from the society perspective, used to appraise the projects, departs from the construction of the traditional and distributional CBA and concentrates in extending them to include environmental quality.
101 Since the current CBA methodologies do not solve the balance between the use and conservation of the environmental asset for project evaluation. 102 From national statistics and the projects’ related studies described in Section 4.4. 103 The main differences between the two are explained in chapters II and III.

162
Proposed project appraisal for sustainability
Environmental CBA (efficiency, distribution,
and environment), - use for project ranking -
Identification of demand and prices for project’s
goods and services
Identification of inputs and costs
Owner perspective CBA
Traditional CBA
(efficiency)
Distributional CBA
(efficiency and distribution)
Primary and secondary data
Figure 4.1: Proposed methodology for project appraisal
104
Source: The author. Then, the idea is not to replace the traditional105, and/or distributional106 CBA, but to complement them, by making a stepwise analysis. In this manner, the traditional CBA is the base to calculate the distributional, and the distributional CBA is the base to calculate the environmental: Thus, they are complimentary analyses. The reason is that the proposed methodology does endorse the fact that, in general107, every project should contribute to sustainable development: by fulfilling its three key elements: economic growth, income distribution, and environmental quality108. Therefore,
104 The dotted boxes mean that a more detailed methodology to accomplish this item will be presented in the current chapter. 105 The traditional - as well as the owner perspective - CBA is explained in detail in Chapter II Section 2.2. 106 The distributional CBA is explained in detail in Chapter III Section 3.5. 107 There are exceptional cases where the project should not fulfill the three key elements of sustainability. An example is when the only way to help the poor is to have an economically inefficient project and/or projects type II, which are the ones with no incidence on the environment (see Chapter I Section 1.1). 108 The presence of the three key elements is ensured, in the stepwise analysis, by requiring every one to have a positive increment with respect to the latter. Therefore, by requiring this
Environmental criteria system and impact identification and
valuation

163
by making a stepwise analysis it encourages the presence of the three, with restricted trade-offs among them109. Consequently, an approved project would suggest a contribution toward the economic growth of the country by requiring a positive traditional CBA, equity considerations by requiring a positive increment in the distributional CBA, and an improvement toward environmental quality by requiring a positive increment in the environmental CBA110. The following sections describe the necessary steps to carry out the developed methodology.
4.2 Management criteria for sustainability of resource use and environmental
pollution From the point of view of the third key element of sustainability in project appraisal, the environment, and according to the sustainability definitions presented in Chapter 3 Section 3.1.1, for operational purposes the current study will assume a series of common criteria. These criteria should be met in order to balance use and preservation of the natural asset, and in turn, set the environmental standards, which are used in later stages of the project appraisal.
positive incremental analysis, the main hostility, of the so-called development first school of thought, of bringing the environmental concerns into CBA would disappear. This school argues that environmental activities are not a priority for developing countries and actually act as a drag on economic growth and on the whole process of development (PEARCE 1997). 109 The restriction is that every increment in the analysis should ensures the presence of one key element of sustainability. Then, there should exist a positive increment in every analysis. 110 The requirement of a positive incremental environmental CBA is valid only for low quality environments, which is normally the case. High quality environments could have a negative increment in the environmental CBA, as it is explained in more detail in Section 4.2.

164
Figure 4.2: Criteria system to balance the use and conservation of the environmental asset
ProjectProjectProjectExtraction(use)
ExtractionExtraction(use)(use)
Waste(pollution)
WasteWaste(pollution)(pollution)
Land UseLand Use Non-recyclableNon-recyclableEnergy ResourcesEnergy Resources
WaterWater(forest)(forest)
SoilSoilerosionerosion
WaterWater
HabitatHabitat
ToxicToxic Non-toxicNon-toxic
Preserve(non-use)PreservePreserve(non-use)(non-use)
Regenerationrate
RegenerationRegenerationraterate Substitution
rate
SubstitutionSubstitutionraterate
Absorptivecapacity
(time)
AbsorptiveAbsorptivecapacitycapacity
(time)(time)
Exposure andExposure andtreatmenttreatment
MineralsMinerals
RecyclingRecycling
Source: The author. The criteria, in the context of the current study, are presented as follows (Figure 4.2): • Renewable resources should be used in such a way to enable the use rate not to be
greater than the natural regeneration rate. • The assimilative capacity of the environment represent the maximum quantity of
pollutants (including waste) which need to be disposed. • The maximum rate of use of non-renewable resources should be the substitution rate
for renewable resources or a rate that allows for the fact that a given standard of living can be secured from the reduced stock.
The criteria are dependent upon technological progress. Natural resources could be managed in a way to improve the sustained yield (use) and the pollutant assimilative capacity of the environment, for example, fertilization of agriculture crops, treatment of toxic waste before disposal, and improvement in efficiency of fossil fuels use.
These criteria are also the base to set up environmental (and natural resource) stan-dards, which are to be accomplished in order to assure environmental quality for present and future generations. Nevertheless, the criteria present exceptions, which should be considered in setting up the standards. For example, the conservation of a representative resource stock is a pre-condition for the maintenance of basic life support functions of the environment (see Chapter 3 Section 3.3). The absorption time is to be considered, especially when dealing with human toxic pollutants, and recycling contributes to maintaining the stock of minerals (non-energy) resources.

165
The environmental standards are, in turn, the base to evaluate the severity of the envi-ronmental impacts, which occur due to the project in consideration, as described in the section below.
4.3 Procedure for the Physical Impact Identification and Evaluation In practice, project analysts sometimes omit impacts in their calculations (and in turn stakeholders) who do not seem to belong to the “society” under consideration. They may neglect effects (especially costs) bearing on recipients of pollution and/or degradation of natural resources and, politically weak groups (MACRAE, WHITTINGTON 1997). In fact, for example, a broad Overseas Development Administration (ODA) study overview in a variety of countries shows, as one of its primary concerns, that evaluation has tended to be an internal process which excludes some major stakeholders despite existence of some important impacts (O’DONOVAN 1997). Figure 4.3: Methodological representation of the qualitative parameters used to
evaluate the project impacts
where; sign severity temporality location duration reversibility stage
- = negative impact + = positive impact 1= very low 2= low 3= medium 4= high 5= very high T= temporary P= permanent L= local R= regional N= national I= international S= short-term M= medium-term Lt= long-term Rn= natural reversibility Ri= induce reversibility I= irreversible D= project design C= project construction O= project operation
Source: The author. Consequently, in the current section it is proposed to grant standing (for CBA) to those stakeholders whose social111, environmental112, and/or economic113 impacts are signifi-
111 For example, income distribution, social infrastructure, education, health, among others. 112 For example, impacts over the natural resource base and/or global impacts on climate, water, soil, among others.
severity 1 to 5
temporality T or P
location L, R, N or I
reversibility Rn, Ri or Ir
stage D, C or O
matrix of social, environmental, and economic impacts according to stakeholders
sign - or +
duration S, M, Lt

166
cant. Consequently, the purpose of the procedure presented in Figure 4.3 is to identify the qualitative properties of these impacts, which together with the quantitative infor-mation available, would, in turn, ultimately determine their severity114 (significance). This procedure is adapted from the one used by PROIGE 1999 in determining environmental impacts and based on the matrix technique describe in Chapter 3 Section 3.2.1. Figure 4.3 is the graphical representation of the key elements necessary to construct the impacts’ matrix of the project115 (taking into account the standards set up by using the criteria system described in the last section). Specifically, the impacts’ characteristics described in Figure 4.3 are explained below in more detail: a) Sign: refers to positive (+) or negative (-) impacts, which means a benefit or cost
respectively.
b) Severity: refers to the intensity (significance) of the impact using the following scale (1) very low, (2) low, (3) medium, (4) high, and (5) very high. It is important in order to understand the expectation of the expert about the impact’s influence, according to the quantitative and qualitative information available.
c) Temporality: refers to the duration of the project’s action causing the impact, which
could be (T) temporary or (P) permanent. It is important in order to take the preven-tion and mitigation measures against the impacts. For the CBA it could mean a one time cost or a permanent cost.
d) Location: refers to the spatial location (magnitude) of the impacts, which could be
local (L), regional (R), national (N), and/or (I) international (one or more items on this category could be repeated). For the CBA, the importance of the magnitude would depend on the society under consideration. For example, is the CBA done for a local government (interested in a regional scale), for a national government (interested in a national scale), and/or for an international organization (interested in a transnational scale)?
e) Duration: refers to the length of the impact (S) short-term, (M) medium-term, or (Lt)
long-term. It is important to know the duration the impact will take to disappear (or
113 For example, total income, employment, government budget, inflation, taxes, subsidies, among others. 114 The idea is then, that every expert of the team assessing the project should present his/her impact assessment - depending upon his/her background - using the procedure (matrix) following explained. The team leader would be the one in charge of compiling all the reports and making a unique matrix. 115 An interdisciplinary group of experts is usually formed to appraise development projects (especially to carry out EIAs, Environmental Impact Assessment), according to their nature and the study’s budget. This is done among other things, in order to count for different points of view in the identification, valuation, and determination of severity (significance) of the impacts.

167
loose importance), because it influences the costs of the project in order to prevent and/or mitigate the impact.
f) Reversibility: refers to if the environmental impacts are reversible (natural reversi-
bility, Rn or induced reversibility, Ri) or irreversible (Ir). This characteristic also in-fluences the prevention and/or mitigation measures and/or compensation (costs of the project).
g) Stage: refers to when the impact occurs, project’s timing, (D) design, (C) construction
and/or (O) operation. It is related to temporality and its main reason is to established the exact time when the impact occurs.
Table 4.1: Illustration of an impact analysis matrix for a hypothetical landscape improvement project
Category of Description Stakeholders Total
Impacts & quantification Local community Rest of of impacts l m h society
social better income distribution due to a higher value of land (205 families)
+4TLLtRiO +2TLLtRiO -- +1TLLtRiO + 7
environmental better view (20 000 trees)
+3TLLtRiO +3TLLtRiO -- +1TLLtRiO + 7
economic higher land value, because of a higher demand (US$ 5/ha.)
+5TLLtRiO +5TLLtRiO -- +1TLLtRiO + 11
Total + 12 + 9 -- + 3 Note: l= under average income (low), m= average income (medium), h= above average income
(high). Source: The author.
The characteristics and quantification of every impact should be described (Table 4.1), by the experts assessing the project, according to its category (social, environmental, and economic) and to whom they accrue. They should be sum vertically and horizontally in order to obtain an idea of the importance of the impacts, according to the different stakeholders and categories.

168
These vertical and horizontal additions are also the basis for evaluating the project, without monetary calculations, solely upon the relative measure of its impacts. The higher the total the better the project. Thus, a project with a high (horizontal) sum of social, environmental, and economic impacts would suggest to be a good project (or suggest the category where the project should be improved). Additionally, the vertical sums would suggest to whom the project is more beneficial (or detrimental) and the stakeholders who, for example, should be compensated (or charged). The severity and significance of the impacts are defined, according to the experts’ judgment, by the characteristics of the other elements. This procedure could assume that the significant impacts will be those whose severity is from regular to very high (from 3 to 5 in Table 4.1)116. However, small (not significant) impacts occurring many times to the same stakeholder could also determine their significance, thus, the importance of calculating the (vertical) total for every stakeholder117. Following the general project appraisal methodology, the valuation techniques (Chapter 3 Section 3.2.2) provides the way to introduce these impacts into CBA by providing a monetary value. Furthermore, in order to facilitate the construction of the distributional and environmental CBA, which is explained in Section 4.4.2, the two following recommendations are useful: • when the stakeholders are composed of heterogeneous income groups, it is im-
portant to separate them into several categories118, which could differentiate among the below average, average, and the above average citizen (according to the aver-age income of the population)119;
• the environmental impacts should also be separated according to pollutants (to air, water, and soil, among others) or resource degradation (land use, irreplaceable habitats such as forests, coral reefs, and ground water, among others) in order to facilitate the application of environmental weights in latter steps.
The importance of disaggregating the stakeholders is that the whole idea of distribution120 is to improve, firstly, the standard of living of the poor121 (and the ones below the average
116 It is important to take this assumption into account before starting the whole impact description process. Obviously, the assumption could be changed according to the experts’ opinion, for example, defining significance at a higher category; for example high (4). 117 That is in order to account for an adequate incorporation of negative impacts of unknown or low-probability effects (ASCHER 1993; DIXON et.al. 1997). 118 The analysts of the project would be the ones in charge of deciding the extent of the disaggregation. 119 The defined population would depend on the project and the characteristics of the study area. (i.e. population as the inhabitants of a country, or population as the inhabitants of a determined region, among others). 120 Distributional CBA described in Chapter III Section 3.5.

169
income level of the population and/or region). Therefore, the extent of the disaggregation would depend on the characteristics of the project itself and country or region where it is to be carried out. Additionally, this information is useful to calculate the (distributional) weights in the distributional CBA (see Chapter 3 Section 3.5). The matrix could additionally serve the purpose of analyzing the preventive and mitiga-tion measures to be taken and their respective costs, which would affect the cost flow of the project and even the significance of the impacts122. Theoretically, the impacts valuation offers the ground to take compensation measures, following the logic described in Chapter 3 Section 3.2.3, by identifying the losers in the project and the extent of their loss.
4.4 Cost-benefit analysis
4.4.1 The owner perspective The owner perspective is the one described in Chapter 2, where the market prices in-stead of the shadow prices are used and the externalities are not included, only the costs and benefits that accrue directly to the owner of the project. It is important to carry out this perspective, because it shows the private feasibility of the project, from the perspective of the owner, and in turn, promotes its acceptability. Additionally, this CBA could be carried out from any other private perspective of interest, for example the government , in the case it were important to demonstrate its ac-ceptability123.
4.4.2 The CBA methodological approach to promote sustainability Generally, when literature states that the environment is taken into account in project appraisal (CBA), it does so by valuing (partially) the environmental externalities and 121 It is important to notice that the level of income is used for practical purposes to differentiate between the poor from other groups within a country or region under the same conditions. A more detailed analysis about poverty would not depend only on the income capability, to acquire the basic food requirements, but also on the accessibility to health services, education, and shelter, among others (BOLTVINIK 1992). 122 If this step is carried out, the matrix will be corrected (or new constructed) to account for the change of the impacts. The idea behind this adjustment is to reconsider the impacts after carrying out preventive and mitigation measures, which will certainly change the characteristics of the impacts and even their significance. The corrected matrix would be the base to grant standing to stakeholders and value the significant impacts. Once again, the matrix could be adjusted after the valuation of impacts to account for further (monetary) information that could change their view about the impacts’ characteristics. 123 The “financial” acceptability of the project from the target group is a term also called auto-sustainability.

170
including them into CBA; which does not ensure its availability in the future124 (ISLAM, GIGAS 1997). This fact is not compatible with sustainable development and more spe-cifically it does not comply with - the presence of - the three key elements of sustainability (growth, distribution, and the environment). The explanation, for this noncompliance, lies in the lack of acknowledgment of the quality of the environment in the CBA methodology for project approval, which provokes the misleading of decision-making toward unsustainable development, such as carrying out projects that degrade already low quality environments. As described in chapters 2 and 3, the traditional CBA is essentially an economic effi-ciency approach and the distributional CBA uses (distributional) weights in order to ac-count not only for efficiency, but also for equity (income distribution), as the twin objective of development. Accordingly, the methodology propose to include the third missing element, the envi-ronment. To do so, it uses additionally environmental (quality based) weights in CBA in order to account not only for efficiency and equity, but for the environment as the third objective of development (see Chapter 3 Section 3.1). More specifically, the traditional CBA methodology is complemented to comply with sustainable development, by making a stepwise analysis. It starts from a positive tradi-tional CBA, then, a positive increment in the distributional CBA (traditional CBA minus distributional CBA), and finally a positive increment in the environmental CBA125 (dis-tributional CBA minus environmental CBA). Thus, one step is the basis for the following one. Therefore, a positive traditional CBA means that the project promotes economic growth (the first element of sustainability)126. A positive increment in the distributional CBA means that it encourages distribution (the second element of sustainability). And finally, a positive increment in the environmental CBA means that environmental quality is taken into account, promoting the future availability of the environment - and natural resources - (the third element of sustainability).
124 The reason for this is that the negative environmental effects could be offset by other (economic) benefits. Thus, approving projects that could damage the environment. 125 The requirement of a positive increment in the environmental CBA is valid only for low quality environments, which is normally the case. High quality environments, in theory, could have a negative increment in the environmental CBA and still indicate a sustainable project. 126 Following PEARCE 1997, not honoring economic efficiency means that there is no real (per capita) income growth, the fundamental requirement of economic development, without which developing countries would be carried into a poverty trap.
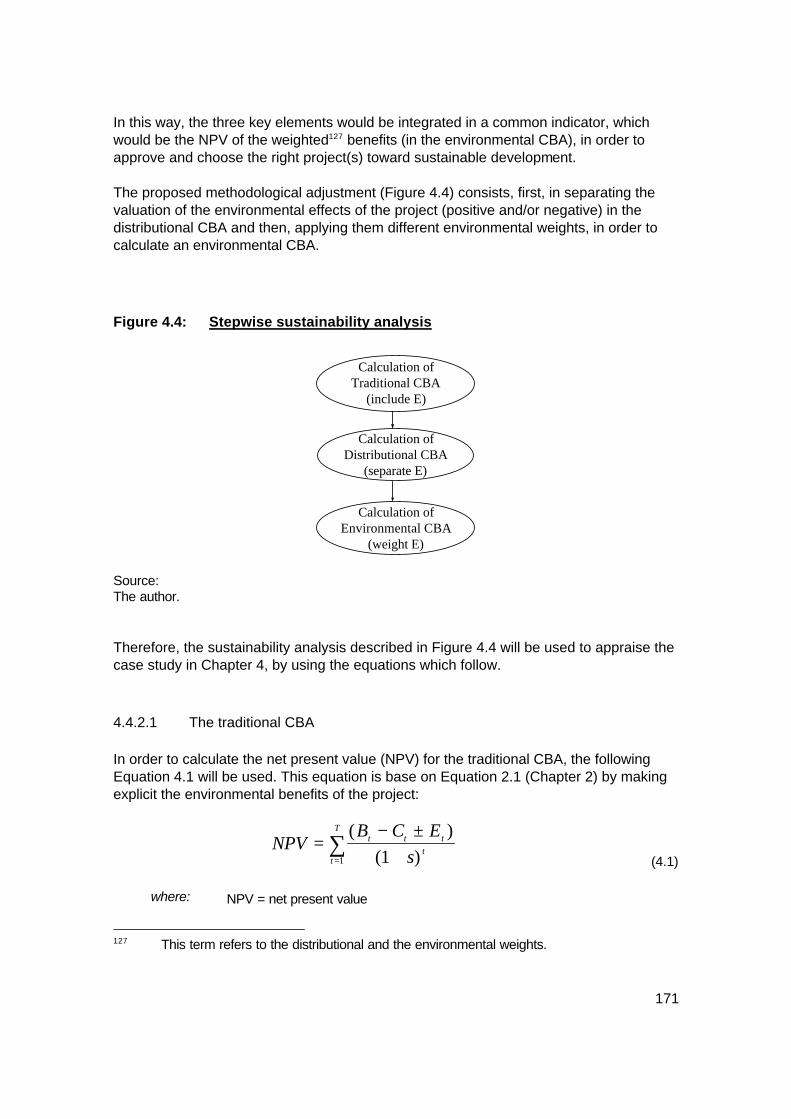
171
In this way, the three key elements would be integrated in a common indicator, which would be the NPV of the weighted127 benefits (in the environmental CBA), in order to approve and choose the right project(s) toward sustainable development. The proposed methodological adjustment (Figure 4.4) consists, first, in separating the valuation of the environmental effects of the project (positive and/or negative) in the distributional CBA and then, applying them different environmental weights, in order to calculate an environmental CBA.
Figure 4.4: Stepwise sustainability analysis
Calculation of
Traditional CBA(include E)
Calculation ofDistributional CBA
(separate E)
Calculation ofEnvironmental CBA
(weight E)
Source: The author. Therefore, the sustainability analysis described in Figure 4.4 will be used to appraise the case study in Chapter 4, by using the equations which follow.
4.4.2.1 The traditional CBA In order to calculate the net present value (NPV) for the traditional CBA, the following Equation 4.1 will be used. This equation is base on Equation 2.1 (Chapter 2) by making explicit the environmental benefits of the project:
NPVB C E
st t t
tt
T
=− ±
+=∑
( )( )11 (4.1)
where: NPV = net present value
127 This term refers to the distributional and the environmental weights.
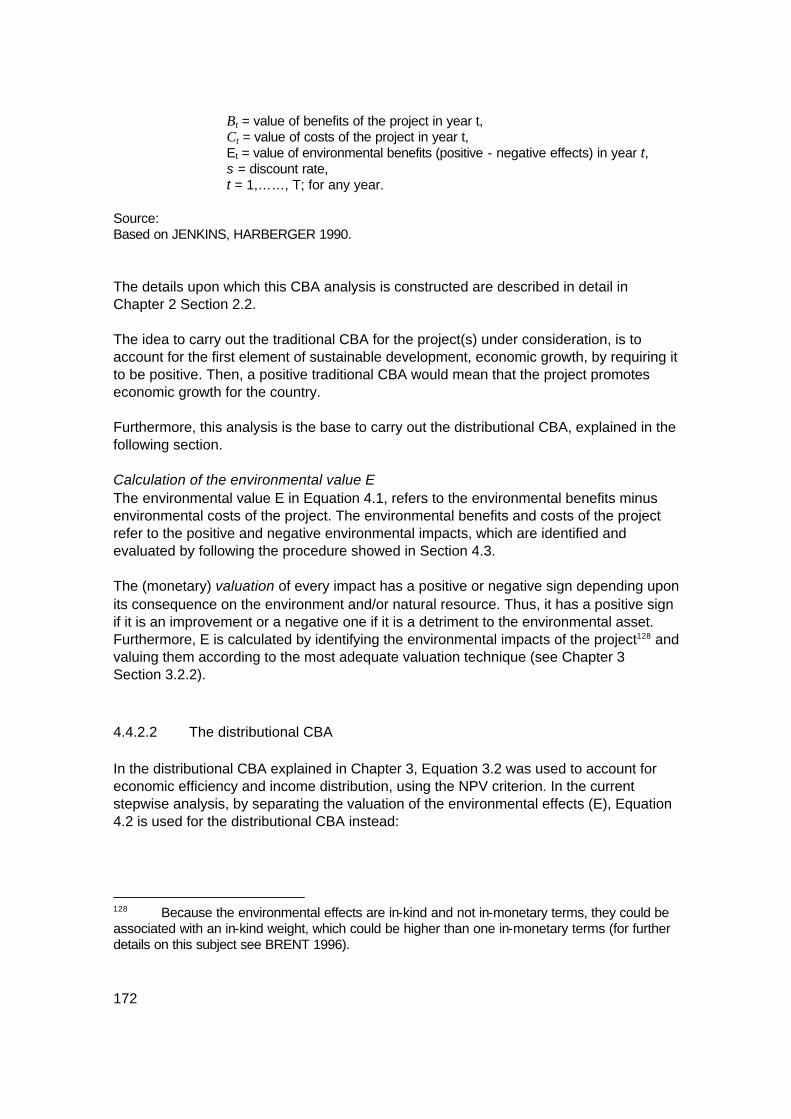
172
Bt = value of benefits of the project in year t, Ct = value of costs of the project in year t, Et = value of environmental benefits (positive - negative effects) in year t, s = discount rate, t = 1,……, T; for any year.
Source: Based on JENKINS, HARBERGER 1990. The details upon which this CBA analysis is constructed are described in detail in Chapter 2 Section 2.2. The idea to carry out the traditional CBA for the project(s) under consideration, is to account for the first element of sustainable development, economic growth, by requiring it to be positive. Then, a positive traditional CBA would mean that the project promotes economic growth for the country. Furthermore, this analysis is the base to carry out the distributional CBA, explained in the following section. Calculation of the environmental value E The environmental value E in Equation 4.1, refers to the environmental benefits minus environmental costs of the project. The environmental benefits and costs of the project refer to the positive and negative environmental impacts, which are identified and evaluated by following the procedure showed in Section 4.3. The (monetary) valuation of every impact has a positive or negative sign depending upon its consequence on the environment and/or natural resource. Thus, it has a positive sign if it is an improvement or a negative one if it is a detriment to the environmental asset. Furthermore, E is calculated by identifying the environmental impacts of the project128 and valuing them according to the most adequate valuation technique (see Chapter 3 Section 3.2.2).
4.4.2.2 The distributional CBA In the distributional CBA explained in Chapter 3, Equation 3.2 was used to account for economic efficiency and income distribution, using the NPV criterion. In the current stepwise analysis, by separating the valuation of the environmental effects (E), Equation 4.2 is used for the distributional CBA instead:
128 Because the environmental effects are in-kind and not in-monetary terms, they could be associated with an in-kind weight, which could be higher than one in-monetary terms (for further details on this subject see BRENT 1996).

173
( )( )
NPVa B C E
s
i i t iti
n
ete
q
tt
T
=− ±
+= =
=
∑ ∑∑ 1 1
1 1 (4.2)
where: NPV = net present value
a i = value of the weight attached to non-environmental benefits or costs for any income level group i according to their social significance (distributional weight),
Bit = value of benefits of the project for every income level group i in year t, Cit = value of costs of the project for every income level group i in year t, Eet value of any environmental benefit (positive-negative effects) e in year t, s = discount rate, i = 1,……,n; for any income level group, t = 1,……,T; for any year.
Source: Based on BRENT 1996. Equation 4.2 implies that the environmental effects are not weighted in the distributional CBA; in other words, distributional weights are applied to non-environmental benefits (the details to construct the distributional CBA are explained in Chapter 3 Section 3.5.1).

174
4.4.2.3 The environmental CBA And finally, in order to account for environmental sustainability, it is proposed to use quality based environmental weights (in the NPV equation) in the way presented in Equation 4.3.
( )( )
NPVa B C f E
s
i it iti
n
e ete
q
tt
T
=− ±
+= =
=
∑ ∑∑ 1 1
1 1 (4.3)
where: NPV = net present value
a i = value of weight attached to benefits or costs for any income level group i according to their social significance (distributional weight),
fe = value of weight of any environmental impact e (environmental weight), Bit = value of benefits of the project for every income level group i in year t, Cit = value of costs of the project for every income level group i in year t, Eet = value of any environmental benefit (positive-negative effects) e in year t, s = discount rate, i = 1,……,n; for any income level group, t = 1,……,T; for any year. e = 1,……,q; for any environmental effect.
Source: The author. The idea behind the approach is to encourage projects to accomplish the (regional na-tional, or international) environmental standards identified according to the criteria used in Section 4.2. This balance the use and conservation of the environmental asset, by calculating environmental weights, which are attached to the environmental impacts (E), positive and/or negative, of the project (see below a detailed explanation). Then, if the current environmental state is below the standard, the weight will be above one and vice versa. More specifically, the environmental weights are calculated, according to the project under study, for the key natural resource(s) explained in Section 4.2 (i.e. soil erosion) and/or for the pollutant(s) (i.e. CO2), according to the standard and actual state (quality) of these natural resources and/or pollutants. Therefore, a project effect (impact) over an environmental good or service in a good state will receive a lesser weight than an effect over a deteriorated one, which will receive a higher weight.
Calculation of environmental weights The idea behind the use of environmental weights is to reflect society’s significance of a change in environmental (and/or natural resources) quality. Environmental weights (fe in Equation 4.3) would be used in the environmental CBA, because it is assumed that a positive or negative effect (Ee) over the environment is worth differently (to society) depending upon its state (quality). Then, an additional unit of

175
a high quality environment is worth differently (less) than an additional unit of a low quality one129; in other words, environmental weights would reflect the social marginal utility of an environmental quality change. The same principles followed for the calculation of distributional weights in Chapter 3, Section 3.5.1.1, hold true to calculate the environmental weights; in that case, the a priori or revealed preference approaches could be used to calculated them. On the one hand, following the a priori approach, the weight attached to the environ-mental effect (cost or benefit) should be calculated, using Equation 4.4. This should be expressed relative to an environmental good or service at the average recommended quality level (standard). This is so because the idea behind its use is to approximate the current level of any environmental good or service to this standard (defined using the criteria system to balance its use and conservation and explained in Section 4.2). By reaching the standard, the future availability of the environmental good or service would be encouraged. Moreover, the following assumptions should be made in order to use the a-priori approach: • Everyone, in the society, possesses the same utility function U, therefore, the U from
one individual is equal to the welfare function of the whole economy. • Let one individual shows diminishing marginal utility with respect to natural resource
deterioration and pollution. Let us use the constant elasticity marginal utility function; then, the environmental social marginal utility function is given by the following equation:
feee
ge
=
±
(4.4)
where:
f e = value of the marginal utility of any environmental change e (weight to environmental change e), e= actual quality level of any environmental good or service, e = average recommended quality level of any environmental good or service, ge = positive or negative constant signifying the elasticity of the social marginal utility function - with respect to an environmental good or service e - (society’s aversion to environmental deterioration). e = 1,……,q; for any environmental effect.
Source: The author. • Set a value for g.
129 That is declining marginal utility.
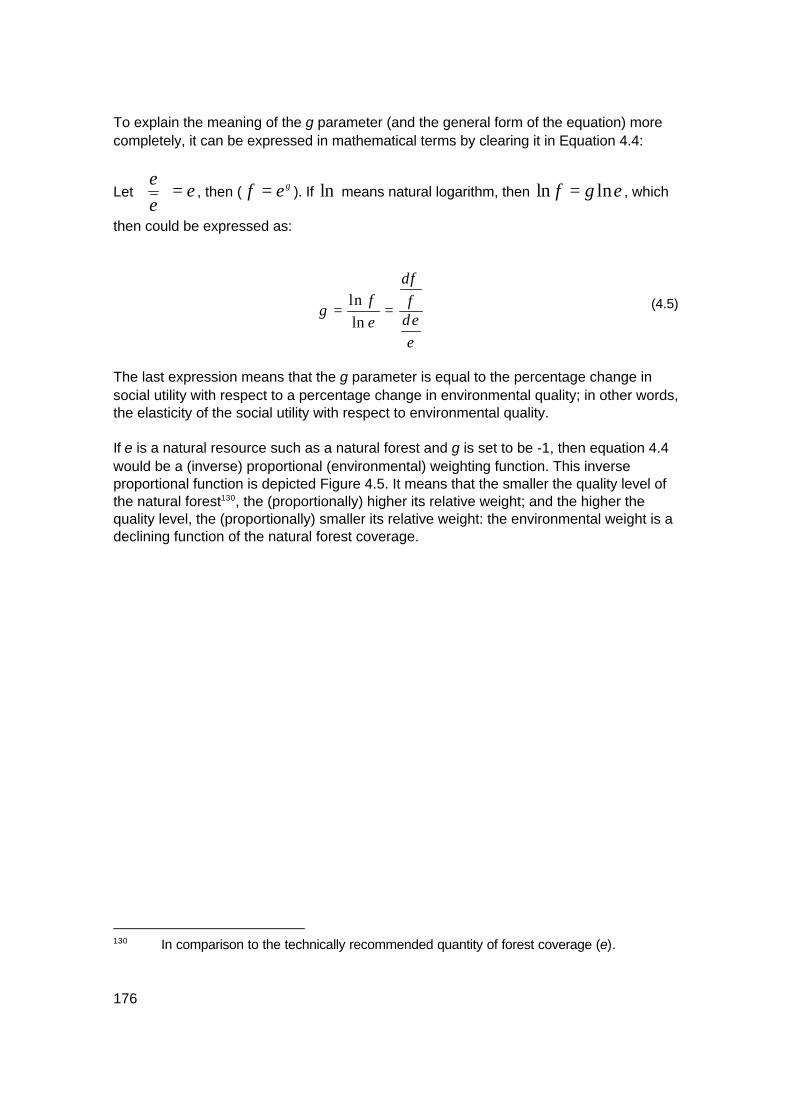
176
To explain the meaning of the g parameter (and the general form of the equation) more completely, it can be expressed in mathematical terms by clearing it in Equation 4.4:
Let ee
e
= , then ( f e g= ). If ln means natural logarithm, then ln lnf g e= , which
then could be expressed as:
gfe
dff
dee
= =lnln
(4.5)
The last expression means that the g parameter is equal to the percentage change in social utility with respect to a percentage change in environmental quality; in other words, the elasticity of the social utility with respect to environmental quality. If e is a natural resource such as a natural forest and g is set to be -1, then equation 4.4 would be a (inverse) proportional (environmental) weighting function. This inverse proportional function is depicted Figure 4.5. It means that the smaller the quality level of the natural forest130, the (proportionally) higher its relative weight; and the higher the quality level, the (proportionally) smaller its relative weight: the environmental weight is a declining function of the natural forest coverage.
130 In comparison to the technically recommended quantity of forest coverage (e).

177
Figure 4.5: Inverse proportional environmental weighting function
Source: Adjusted from BRENT 1996. The a priori approach has the main disadvantage that there is no clear basis (no formula) for selecting the value of g131. Furthermore, for some environmental goods or services it is not clear what is the technically recommended quality level to use (i.e. what is the technically recommended quantity of a nice view). Therefore, in order to choose the value of the g parameter for the proposed environ-mental CBA, the base is taken from choosing the value of the n parameter in the dis-tributional CBA described in Chapter 3; SQUIRE, VAN DER TAK 1975 recommend as-suming a value of n= 1, which is considered a fairly pro-poor parameter (BRENT 1996). Likewise, in the current study a g=1 is recommended to be assumed, as a fairly pro-environmental parameter. However, it is also recommended to carry out a sensitivity analysis between 0 and 2. Then, assuming g= 1 in the natural forest example (Figure 4.5), let the recommended (percentage) forest capacity, for a region or country, be used as the average and the (percentage) of current natural forest coverage be the quality level (see Equation 4.5). The g parameter would be negative in this case, which means diminishing marginal - environmental - utility (inverse proportionality) with respect to the stock of natural re-sources (environmental quality). Hence, the environmental weight would be higher, the more deteriorated is the natural resource. More accurately that means, if the actual natural forest coverage, for a determined region, is equal to the technically recommended
131 The same disadvantage of the n parameter in the distributional CBA methodology (see Chapter III Section 3.5.1.1 and for further details see BRENT 1996, p. 248).
2
1
0.5
f
Relative environmental weight
Natural forest coverage (quality level)
x / 2 x 2x

178
one; then, its relative weight would be 1. If the actual forest coverage is one half of the average, the weight would be 2, and if it is twice the average, the weight would be 0.5. For example, if the recommended forest capacity of the region is 35 % (450 ha.) - of the total area (1286 ha.) -, the actual natural forest coverage is 25 % (320 ha., which is below the recommended one), and the elasticity of the social marginal utility function with respect to forest is equal to one132; the following result is obtained by substituting these values in Equation 4.4:
feee
e
ge
=
=
=− −0 25
0 3514
1..
. (4.6)
For an example with a pollutant, the - average - permissible level (based on the criteria system describe in Section 4.2) could be used as denominator and the current level of pollution - or actual quality level - as the numerator (see Equation 4.4). However, in the case of pollutants, the g parameter would be positive, showing increasing marginal en-vironmental utility (proportionality) with respect to the quantity of pollution (environmental quality). As a result, the environmental weight would be higher, the more pollution there exists. Let’s assume that the permissible level of a pollutant is 10 units, but the current level of pollution is 14 units, and the elasticity of the social marginal environmental utility function is again equal to one; then, by substituting these numbers in Equation 4.4 the following result is obtained133:
fxxe
e
e
ge
=
=
=+ +14
1014
1
. (4.7)
On the other hand, as with the revealed preference approach for distributional weights (Chapter 3, Section 3.5.1.2), environmental weights could be also calculated according to past experiences on the country’s aversion to environmental degradation. However, if
132 Based on SQUIRE, VAN DER TAK 1975, who recommended n=1 to calculate social weights considering it a fairly pro-poor parameter (Chapter III, Section 3.5.1.1), here it is assumed g=1 as a fairly pro-environment parameter. This could be also checked in the future, based on the decisions already made, to determine if it fairly reflects society’s aversion to environmental degradation. 133 The units could be converted to percentages taking the permissible level as the based (100 %) - in order to calculate the weight.

179
society approved the earlier decisions the environmental weight would remain so, or otherwise further adjusted. When many different kinds of environmental impacts exist, to facilitate the calculation of the environmental weights, before constructing the CBA, it is recommended to fill out Table 4.2. The first column of this table is divided into resource extraction and disposal (according to Chapter 3, Figure 3.1): the former refers to the use of resources and the latter to the case of pollution (waste). The second column relates to the standard (quantity of ex-traction or pollution) allowed following the criteria system described in Section 4.2 and Figure 4.2. The third column concerns with the current status of the environment, quantity used or disposed. The fourth column calculates the environmental weight based on the second and third columns and using Equation 4.5. And finally, the fifth column has to do with the sign of the corresponding project impact, which should not be negative from the point of view of sustainability.
Table 4.2: Comparison of environmental standard, current use, and project impact for the calculation of the environmental weight
Resource extraction
or disposal Standard Current
Status Environmental
Weight Project
Impact (sign) Extraction
Land Use: unique habitat water protection soil erosion
Water Use Non-recyclable Resource Use
Minerals Disposal
Pollutants
Source: The author.
4.5 Conclusion The methodology proposed for the appraisal of the case study (data analysis) serves the purpose of adjusting, toward sustainability, the most widely used technique for public decision-making of development projects (CBA). This is done by including the environmental dimension in the NPV for projects’ approval by calculating environmental weights based on the identification of a criteria system, which balance the use and preservation of the environment.

180
However, the limitation of the technique lies in the impossibility of using exact formulas to calculate every step of the process. In fact, it is necessary to use value judgments and this is the case of determining standing of stakeholders and the elasticities of the social marginal income and environmental utility functions (society’s aversion to income inequality and environmental deterioration respectively). In relation to this, MACRAE, WHITTINGTON 1997 state that value judgments are at the heart of policy analysis, then, value judgments are inherent to project evaluation. This reality does not demean the fact that, on the one hand, a methodology to identify the project impacts contributes to make this part of the appraisal a more standard pro??cess. The methodology empirically partially solves the controversy about whose benefits and costs are to count, by granting standing according to well known and explicitly stated rules. Moreover, the proposed methodology provides the ground rules for deciding on com-pensation measures by identifying who are the losers and winners of the project - and by identifying and valuing their impacts. Nevertheless, the way this compensation is to be carried out should be analyzed on political grounds, based upon the characteristics and preferences of the losers. On the other hand, nowadays, the term of sustainable development is widely used and accepted. Because it reflects the global society’s development preferences, project appraisal, and specifically the NPV criterion used for project approval, should be adapted for this consideration by incorporating its three dimensions: growth, distribution, and the environment. Therefore, the incorporation of technically-based considerations of environmental quality (environmental weights) into CBA accomplishes this purpose and provides a more accurate basis for project approval in the public decision-making process. Although the use of the environmental CBA is recommended for the final approval (and ranking) of projects, the owner perspective feasibility, as well as, the society perspective feasibility using the traditional and distributional CBA, are also endorsed as a pre-requisite. The reason is to ensure not only the private acceptability of the project, but a real improvement toward sustainable development - by incorporating the three key elements mentioned above.

181
5 STUDY AREA AND DATA ANALYSIS
5.1 Introduction The objective of the current chapter is to describe the country’s framework, as well as, the main characteristics of the case study, the Santa Elena Rain Forest Project, and the methodology used for its appraisal. The country’s framework refers not only to the general economic, social, and environ-mental indicators, but to the environmental requirements to carry out a project appraisal in the country. Based on the general (adjusted) methodology presented in chapters 4, the specific methodology used to assess the Santa Elena Project is presented in the current chapter and the results discussed in Chapter 6. The hypothesis is that the project fulfill the following three key requirements to promote sustainable development: economic growth, income distribution, and environmental quality. The case study was, then, chosen, because it presents economic, as well as, social and environmental impacts. Furthermore, Costa Rica has demonstrated high national interest in sustainability and a long and strong tradition of environmental and natural resources protection. The national political constitution of Costa Rica in its article N° 50 states that the government will procure the maximum welfare of the population by organizing and promoting production and a more adequate wealth distribution. Furthermore, it states that every person has the right to a healthy and ecologically balanced environment. It provides the people the possibility to denounce the actions that demean this right and proclaim compensation for the damage caused (LA NACIÓN DIGITAL 1999). This article - of the national constitution - contains the three aspects of sustainability explained before: growth, distribution, and the environment. Growth (efficiency) and distribution are present by procuring the maximum welfare of the population through promoting production and distribution of the wealth of the country, and the environment by providing every person the right to a healthy and ecologically balanced environment. Moreover, the National Human Development Plan (Plan Nacional de Desarrollo Humano, PNDH) promoted by the government seeks economic growth, social equity, and a rational use of the natural resources as a way to increase the standard of living of the population and introduce Costa Rica to the 21st century (MIDEPLAN 1998). Consequently, there exists governmental attempts to introduce the sustainability concept into project evaluation. In the environmental site, as a point of departure, it was stated through presidential decree (Executive decree N° 25705-MINAE from 1996, articles N° 19 and 20), that the activities (projects) that affect or destroy the environment and/or

182
generate waste should present an Environmental Impact Assessment (EIA). These EIA have to be approved by the Environmental National Technical Secretary (Secretaría Técnica Ambiental Nacional, SETENA), a governmental institution which was created with this purpose (Executive Decree N° 25705-MINAE on January 16th, 1997). Then, a project must pass through a procedure in SETENA to comply with the environmental norms (standards) and obtain the permission to be carried out (this is explained in more detail in Section 5.2.4). SETENA is also able to call for public audience depending upon the characteristics of the project, with the main objective of promoting public participation, in order to take into account society’s point of view and account for distributional inequalities (project’s effects). The main points of discussion and the general opinion given by the participants of the audiences are tools used by SETENA to decide upon the implementation of the project (MINAE 1997). Although in Costa Rica many innovative initiatives exist, which deal with sustainable development and are explained in the subsequent section of the current chapter, not all is right about its framework for (public) project appraisal. Regarding CBA, in spite of the fact that projects should comply with an EIA (explained in more detail in Section 5.2.4) and should include the valuation of the environmental impacts, the only criterion finally used for project approval is the traditional CBA, explained in Chapter 2, with no consid-eration of distributional effects and future environmental availability. However, the activities of SETENA are very important in order to set up environmental limits to project development and quantify and value the environmental impacts to take into account in CBA. But, as discussed in previous chapters, in the CBA framework, the monetary valuation and inclusion of the environmental impacts does not ensure their future availability.
5.2 Overview of Economic Indicators, Natural Resource Use, and Environmental
Degradation in Costa Rica
5.2.1 Economic indicators Costa Rica is a small country of approximately 51 000 km2 and 3.7 million people, located in Central America between Panama and Nicaragua. It possesses ports in both the Atlantic and Pacific Oceans, which are 260 highway km away from each other. The average temperatures in the Central Valley are of 21 °C (70 °F) (ICT 1999). With more than 100 years’ democratic tradition and the abolishment of the army in 1949, Costa Rica was able to dedicate more resources to education, health, housing, and natural resource protection. Thereupon, the country possesses good living conditions and a well worldwide known and organized protected areas system (MIDEPLAN 1998). Nevertheless, there still exist inequalities and an inefficient natural resource use and pollution control system in order to accomplish sustainable development, as will be explained in more detail in the following sections.

183
The life expectancy is 76.1 years and the public health service covers 90.4 % of the population. The health expenditures represent 27.8 % of the total governmental expen-ditures and 92 % of the population have access to telephone service (MIDEPLAN 1998).
Costa Rica maintains an outward-oriented, export-led development, which during the period 1983-1997, allowed it to experienced an average economic growth of 4.1 %, measured by the percentage increment in Gross Domestic Product (GDP). However, during 1998 and 1999, it increased and represented respectively 6.2 % and 8.5 %. The latter was the highest national growth in the Latin American region for the respective year (IADB 1998; MIDEPLAN 1988; MESALLES 1999).
Figure 5.1 Location of Costa Rica and the Santa Elena Project
Santa Elena
N
Pacific Ocean
Atlantic Ocean.
Source: Adapted from MICROSOFT ENCARTA WELTATLAS 99. Additionally, during the 90’s, the country presented an average inflation and devaluation rate of approximately 17 % and 13 % respectively, which was reduced during 1999 to approximately 10 % both (MESALLES 1999). Economic growth was supported by exports, foreign investment, and expansion of the domestic credit. The construction, manufacture, and transport sectors showed the highest growth, as well as, communication, electricity and water services, and tourism (MIDEPLAN 1998).
184
The growth was translated into a decrease of the unemployment rate to 5.6 % during 1998134 (compared to the increasing trend of the last years, which expanded from 4.1 in 1992 to 6.2 % in 1996135) and a real growth in the average income (IADB 1998; LA NACIÓN DIGITAL 2000). The share of national wealth dedicated to social expenditures has been among the highest in the Latin America and Caribbean region at 15-18 percent of GDP over the past 20 years. As a result, Costa Rica enjoys some of the best indicators of social well-being in the developing world. For example, life expectancy for women (77.3 years) is the highest in the developing world, and life expectancy at birth of 74.9 years is as high as in the industrialized countries (WORLD BANK 1999). Concerning the educational sector, Costa Rica has one of the highest literacy rates of the American Continent (95 %). Education is compulsory until the 9th grade and lately places strong emphasis on computer use and English language (WORLD BANK 1999). This sector possesses secure financial resources, because a constitutional change carried out in 1997, which assigns to education at least 6 % of the GDP annually (in 1999 it represented 6.4 % of the total GDP). Furthermore, academic programs and technical education have been strengthened in order to improve human productivity in many areas (MIDEPLAN 1998). Because of its high level indicators, Costa Rica was located in the 45th position in the human development index (HDI) of the United Nations in 1999136 (MIDEPLAN 1998). Peace and democracy in Costa Rica contribute to reaching a high economic growth, high social indicators, and to the development of a widespread environmental consciousness. The country has also been a pioneer in finding ways to make environmental protection profitable. Today, its biodiversity attracts tourists from all over the world, resulting in a lucrative ecotourism industry. The tropical rainforests from Costa Rica possess 1 400 tree species and a wide variety of wildlife, and the Government has established the concept of bioprospecting, which means that it may bring more benefits if pharmaceutical companies are able to develop and market new products based on its biodiversity. Almost 27 percent of the country's land area is protected as forest reserves, national parks, and reservations for indigenous peoples (WORLD BANK 1999).
134 The labor force represented in 1999 1.3 million people (40.5 % of the total population are economically active), with an underemployment rate of 7.8. The percentage of total employed population by sex in 1998 was distributed in the following manner: men 69.2 % and women: 30.8 %. Furthermore, it is estimated that in 1998 the creation of employment grew 4 % (25 thousand new jobs). 135 During 1993 it was 4.1 %, 1994 4.2 %, and 1995 5.2 % (LA NACIÓN DIGITAL 2000). 136 Costa Rica was ranked in the second place among the Latin American countries. First is Chile 18th and Mexico 50th (MIDEPLAN 1998).

185
Costa Rica's current development agenda focuses on strengthening integration with the world economy and encouraging new foreign private investment, particularly high-tech businesses, such as INTEL and Microsoft (WORLD BANK 1999). The agricultural sector The agricultural sector represents 18 % of the country’s GDP and generates 20.6 % of the total employment (MIDEPLAN 1998). It is made up by three sub-sectors: crops, livestock, and others (wood, fishing, and others). The most dynamic products are coffee, banana, and the non-traditional, such as flowers, melons, pineapples, and marine products. The non-traditional products showed a high development in the last years due to governmental policies for its promotion. However, during recent years, the agricultural GDP showed a reduction of 0.4 % in 1996 and 0.7 % in 1997 in contrast to the increase of 6.2 % in 1991 and 4.1 % in 1992 (MIDEPLAN 1998). Two export products, coffee and banana, have supplied during the last 40 years 70 % of the agricultural production. Coffee, the traditional product, left its first place to banana since 1970, with an average production of 90 000 t annually for coffee and 1 300 000 t for banana during this decade (MINISTERIO DE RELACIONES EXTERIORES 1999). The livestock activity had its maximum production in the middle of l975 (with 1 722 000 cattle and 280 000 pigs, and 114 000 horses). However, since l980, it shows a non-growth tendency (MINISTERIO DE RELACIONES EXTERIORES 1999). In the fishing activity, between 30 % to 40 % of the national demand is provided by arti-san fishers, and most of the industrial fishers export most of their catching, which in 1988 reached 200 000 t (MINISTERIO DE RELACIONES EXTERIORES 1999). The most important problems of the agricultural sector are following presented: • high effective protection for some products, such as meat, chicken, milk, milk-
products, rice, and sugar cane; • lack of consolidation of producers organization, such as Community Banks, Rural
Credit Funds Committees, and Basic Agriculture Centers in different parts of the country;
• insufficient information about what products are most financially feasible and explo-ration of new markets; and
• problems in the execution of productive re-conversion programs. The industrial sector The industrial sector provides 21.5 % of the GDP and generates 15.7 % of the total employment. During 1996 and 1997, the sector’s growth rate was smaller than that of the beginning of the 1990s, and even in 1996 there was a reduction of 4.1 % (MIDEPLAN 1998). During 1950 it provided 14.2 % of the GDP and in 1974 reached 21.1 % (MINISTERIO DE RELACIONES EXTERIORES 1999).

186
From approximately 5 000 existing industries 93 % are directed toward the domestic market, which make them very sensitive to the its behavior, and generate 75 % of the sector’s total employment. The most general sector’s limitations are following listed: • excessive bureaucracy in order to open enterprises; • low linkage between the new enterprises - especially the high technology ones - and
local supply; • existence of distortions in the tariff schemes; • lack of financial support for local small and medium size enterprises; • lack of sector diagnose (with the exception of pork production and alimentary in-
dustry); • inefficiency in ruling and norm designed to regulate commercial relations. Because of this situation, the governmental policy is oriented toward the application of sector policies in order to improve competitiveness and efficiency, and form a more in-tegrated and modern industrial sector (MIDEPLAN 1998). The Service Sector The service sector represented in 60% of the GDP in 1998, as depicted in Table 5.1. Furthermore, it grew an annual average of 2.5 % during the period from 1979 to 1989 and 5.4 % from 1989 to 1999 (during 1998 this growth was of 6.7 % and during 1999 of 3.1 %), reaching a percentage of total GDP of 64.1 % in 1999.
Table 5.1 The service sector as percentage from the total gross domestic product (GDP)
year 1995 1998 1999
percentage of GDP (%) 59.5 60.5 64.1 Source: WORLD BANK 1999. The tourism Sector During the period 1990-1994, tourism had a rapid growth, which in 1993 made it to be the most important commercial activity of the country. From 1990 to 1994, the number of tourists grew about 15.3 % annually (from 431 400 in 1990 to 761 500 in 1994). Later on, there was a decrease in tourists’ visitation, which in 1996 reached -0.4 %. In 1997 there was a little growth of 0.8 %. And during the last two years there was a growth of about 31 % which reached to more than one million visitors per year (MIDEPLAN 1998). The sector’s most general drawbacks are following listed: • worsened of the citizen security; • bad infrastructure (highways, ports, and airports);

187
• competition with other tourist destinations; and • lack of overseas promotion. The governmental policy for the sector is oriented toward the promotion, expertise, re-duction of tributary charges, and infrastructure improvement (MIDEPLAN 1998). With respect to ecotourism, visitation is concentrated in few areas, such as Manuel Antonio, Poás, Cahuita, and Monteverde. During the next years, the official ecotourism policy is directed toward converting it into a source of social welfare and environmental protection, in order to maintain the natural resource base (MIDEPLAN 1998).
5.2.2 Natural resource utilization Costa Rica promotes many programs related to sustainable use of its natural resources and the environment. However, not all is optimal, because of habitat destruction, defor-estation, hunting, chemical use (especially in agriculture), illegal animal trade, and lack of environmental awareness. These factors had also provoked, a population reduction of some species to danger levels, which could make them disappear. Officially, there exist 85 bird species, 15 mammal species, 81 amphibious species, and 28 reptile species with reduced or threatened population; and 17 bird species, 13 mammal species, 2 amphibious species, and 8 reptile species, which are endangered populations (RODRÍGUEZ RAMÍREZ, HERNÁNDEZ BENAVIDES 1998). Land use Considering the economic, social, and environmental necessities of the population, as well as, the availability and rational use of the water and biodiversity resources and geophysics aspects, in Costa Rica, according to MIDEPLAN 1998, 45.3 % of the land is sub-utilized, 26.5 % is over-utilized, and only 28.2 % is adequately used. Most of this fact is due to the lack of an effective legal framework and articulation among the public institutions related to the land use planning in order to observe the country necessities in this area.
Table 5.2: Land use in Costa Rica (in percentage)
Classification Percentage
Productive agricultural areas Pasture Forests Others TOTAL
10 35 40 15
100 Source: Base on data from the COSTA RICAN MINISTRY OF FOREIGN AFFAIRS 2000.

188
In urban areas, it is evident the spontaneous growth of the cities, due to the lack of enforcement of land use plans, which brings other problems such as environmental and natural resource degradation, because of the reluctance to comply with the limits imposed on environmental and natural resource use, lack of adequate infrastructure, and difficulty to provide the basic public services. Furthermore, most of the land is under forest coverage and pasture (Table 5.2) and only 10% are productively used for agriculture. Then, the government effort is directed to review and articulate the legal framework in this subject in order to strengthen public institutional power and put into effect the dif-ferent development plans of the country (MIDEPLAN 1998). Biodiversity and protected areas The 1 284 545 hectares national protected areas system, in 132 reserves with different categories, accounts for almost one fourth of the total territory of the country. This system contains about 95 % of all the species of the country, which represent 5 % of all the species described worldwide: 8 500 plant species, 220 reptile species, 160 amphibious species, 205 mammals species, and 850 bird species (RODRÍGUEZ RAMÍREZ, HERNÁNDEZ BENAVIDES 1998). To promote protection, the government aim at improving the standard of living of the population, especially local communities surrounding protected areas, and mechanisms to pay for the use of these resources. In addition, it promotes the knowledge of the different flora and fauna species, genes, and products with a potential or real use for human beings. The idea is to maintain the quality of the system and finance it, through own sources, international cooperation, carbon fixation selling, charges for environmental services, and efficient administration mechanisms that allow the rational use of the resources (MIDEPLAN 1998). Forestry resources The forest resources are important to promote development. According to CUBERO 1994 and the land use capacity system137, Costa Rica should have 64 % of its territory under
137 According to CUBERO 1994, this system is comprised of eight types, which represent a progressive limitation to develop agricultural, livestock, and/or forestry activities. These types are chosen according to the following variables: steep, erosion grade, soil characteristics (type, texture, presence of rocks, toxicity, salinity, drainage, and overflow risk):
• Types I, II, and III, allow to develop any activity including annual crops. The selection activity depend on socioeconomic criteria.
• Types IV, V, and VI are restricted to semi-perennial and permanent crops. In type IV, annual crops are allowed only occasionally.
• Type VII had so severe limitations that only allow for primary and secondary forest. In the land without forest coverage, a natural vegetation reestablishment should be carried out.
• Type VIII does not allowed for any activity, therefore, should be solely preserved.

189
forest coverage, from which 35 % could be dedicated to commercial use and 29 % to natural protection. Currently, 40 % of the territory is under forest coverage, which means that there is a lack of approximately 24 %, which should be under plantations and/or natural regeneration. Moreover, although approximately 25 % are under protected areas, only approximately 12 % lie under the national park category, which means non-use (preservation). The loss of forest coverage for the period 1986-1996 was of 164 485 ha (7.8 % ap-proximately), an annual average of approximately 16 448 ha (0.8 %). While the recu-peration rate (reforestation) was of 126 772 ha (6.0 %) for the same period, an annual average of approximately 12 677 ha (0.6 %). In other words, a loss of 3 771 ha annually (0.2 %). Although, this amount of net annual loss does not represent a lot in comparison to the whole Costa Rican forest, the quality of the plantations is still questionable from the biodiversity point of view, referring to biodiversity from natural (pristine) forests compared to that from plantations (UCR-CCT 1998). The rate of loss of forestry coverage was reduced in the last 10 years if compared to the last decades, when the annual deforestation rate grew from 36 000 ha (1.7 %) in the 1950s to 50 000 ha (2.39 %) in the 1970s and middle 1980s. In 1996, the Forestry Law N° 7575 established the concept of environmental services, which refers to incentives to landowner who carry out activities of protection, conserva-tion, natural forest management, and plantations. These incentives cover the production of the following forest services (MIDEPLAN 1998): • carbon fixation; • water protection for human or hydroelectric consumption, and development in gen-
eral; • biodiversity protection and natural scenic beauty for tourism and scientific research. The National Fund of Forestry Financing (Fondo Nacional de Financiamiento Forestal, FONAFIFO) created by the Forestry Law possesses the following sources in order to finance the activities described above: • fossil fuels tax, • earnings from the international trade of services to mitigate the green effect (carbon
fixation), • resources from national institutions, which charge users the environmental services
(maintenance costs and mitigation of resource degradation). In 1997 the government assigned ¢ 1 789 million (US$ 7.66 million) to finance 71 000 ha (3.39 %), which were registered in this incentive program. Atmosphere protection The country promotes a National Program of Climate Change, which most important activity is a national inventory of green house gases in order to reduce emissions to the reference level of the year 1990. The economic activities with higher emissions are en-

190
ergy, industry, agriculture, land use change, and waste management. The total emission of these gases in the country is of approximately 4 million tons138 (MIDEPLAN 1998). This program also supports the National Meteorological Institute in order to promote the reduction of the green house gases in different economic sectors and make Costa Rica comply with the international agreements (MIDEPLAN 1998). Water resources Population growth, industrialization, urbanization, and the intensive agricultural devel-opment provoke a higher demand of water resources; however, they also cause a pressure on the natural resources that produce water, such as forests; which cover 40 % of the total area; crops; 10 % of the total area; and pasture, 35 % of the total area (MIDEPLAN 1998; MINISTERIO DE RELACIONES EXTERIORES 1999). Additionally, there exists problems with degradation of the water resources coming from the following activities: • solid and industrial waste disposal and sewage into rivers, • dam sedimentation and modification of water flow intensity due to deforestation, • reduction of volume and pollution of water sources and saline water, • pollution of groundwater in coastal cities, • seasonable weather that provokes water scarcity in some areas of the country, which
are worsened by “El Niño” phenomena. One weakness of the country is the sewage treatment and disposal, especially during the dry season, when the rivers loose part of their absorptive capacity, which induces sewage pollution from the collectors in the cities and industrial processes, among the more evident ones. Therefore, the government is committed to carry out the following activities in order to overcome the problems: • institutional coordination to carry out a watershed land use planning, • strengthen watersheds’ management, • assure treatment of sewage before disposal, • develop saving programs for households and institutions, • internalize the environmental cost from water resource use. Fishing For the period 1990-1997, the fishing activity shows fluctuations, for example, in 1993 it showed a tendency to decline and afterwards a modest increment, until in 1996 when it showed a high increment of 23.4 % of catching (Table 5.3).
138 Carbon dioxide, carbon monoxide, methane, nitrous oxide, other nitrogen oxides, and organic volatile compounds different to methane. However, the higher emissions come from carbon dioxide (87 %), which 60 % belongs to the energy sector and finally, the transport sector is the one that provokes more emissions (MIDEPLAN 1998).

191
Table 5.3: Total fishing according to their category, 1998 (MT)
year 1991 1992 1993 1994 1995 1996
Industrial Non-industrial
Total
3 445 10 790 14 235
3 894 9 916
13 810
2 776 9 859
12 635
2 984 10 594 13 578
6 984 10 746 17 694
7 031 13 258 20 298
Source: Costa Rican Institute for Fishing (INCOPESCA) 1998. In relation to industrial fishing, there were fluctuations between 1995 and 1997, which more important was presented in 1997 and represented a declined of -56.8 %. Although this sector generates employment, a source of high value protein, and foreign currency, the government has not paid the right attention to it. Nevertheless, Costa Rica is a world leader for tilapia production and exports, due to the support of some governmental institutions, to develop the Arenal-Tempisque Irrigation District in order to exploit the Enrique Jiménez Fishery Station in Cañas, Guanacaste (MIDEPLAN 1998). The current governmental policies toward the sector aims at promoting the right use of the national fishing resources, their commercialization and industrialization (MIDEPLAN 1998). Mineral extraction The national mineral extraction activity concentrates on, among others, metallic products (gold, silver, and cooper), non metallic ones (rocks, sulfur, and clay), and the exploitation of public rivers (MIDEPLAN 1998). There exist exploitation bounds given by the Ministry of Environment and Energy (Ministerio de Ambiente y Energía, MINAE) to control these activities, in order to promote watersheds’ protection. However, the enforcement capacity of the government is limited, then, there still exist activities with high impact on rivers and local communities. The national policy for this sector seeks to promote a better use of the mineral resources, with a better distribution of the social and economic benefits in equilibrium with nature, through the development of a National Mineral Research, Exploitation, and Monitor Program (MIDEPLAN 1998). Natural hazards vulnerability The environmental, social, and economic impacts caused by natural hazards in the last few years demonstrate the necessity to implement procedures to link all the national activities in this sector in order to reduce the country’s vulnerability (MIDEPLAN 1998). Population growth, poverty augmentation, spontaneous processes of urbanization, ten-dencies of land use, watersheds deterioration, and the development of commercial in-
192
frastructure are factors that increase vulnerability, which effects are higher due to human intervention in the natural ecosystems. The National Commission for Emergencies (Comisión Nacional de Emergencias, CNE) attempt to reduce the loss of human lives, properties, and goods through mitigating and attending disaster situations. However, it is important to incorporate prevention measures as part of the daily governmental policy in order to preserve and positively affect the standard of living of the population. In this sense, the governmental policy promotes the use of the natural hazards map of Costa Rica by national and private institutions and Municipalities related to land use planning (MIDEPLAN 1998). Energy The national energetic consumption is mainly based in three sources of energy: fossil fuels, electricity, and biomass (firewood, vegetative residues, and vegetative coal). The transport sector consumption for 1997 was of approximately 46.4 %; the residential, commercial, and public sector 26.4 %; the industrial and agricultural sector 26.1 %; and other sectors 1.1 % (MIDEPLAN 1998). The oil imports represent 64 % of the energy consumption and is mainly used for eco-nomic activities, electric generation, and transport (MINAE 1996). Due to the rapid growth of the demand for electricity (7 % annually), the government policy for this sector is directed toward foreign investment, development of a Central America electricity market, and promoting (national and international) private producers’ participation. Therefore, the strategy in based on international competitiveness related to price, high quality, and coverage (MIDEPLAN 1998).
5.2.3 Environmental degradation Solid Waste The environmental problem that most directly affects the population is soil pollution due to solid waste disposal. It is classified in three categories: industrial, domestic, and from hospitals. The waste in these categories have physical, chemical, and biologic characteristics that provoke different negative effects to human health, flora and fauna, and aesthetics. In 1996 the country produced 514 935 MT annually, an average of 0.7 Kg. per inhabitant. From it 66 % was recollected by the municipalities, 15 % by private enterprises, and the rest is not correctly disposed (MIDEPLAN 1998). The lack of technical and economic capability of the municipalities in order to carry out recollection and disposal is more evident in the metropolitan area, where all the solid waste is disposed in the Río Azul Solid Waste Disposal Center, which have already

193
worked for 20 years and which useful life is short due to the a deficient solid waste treatment. The governmental policy is directed toward putting into practice a National Plan for Solid Waste Disposal, which comprises a national education campaign and coordination mechanisms to improve the financial resources needed to cover the investments to construct technically-operated disposal centers (MIDEPLAN 1998). Chemicals in Agriculture The intensive chemical use in agriculture is one of the soil main polluting factors, for example, there is a loss of 6 000 ha (1.17 % of the country’s total productive agricultural area) in the country’s South Pacific Region caused by using chemicals against fungus with cooper content. In the country, the intensive development of agriculture provoked an excessive use of chemicals, with a per capita consumption of 6.5 kg in 1996, amount higher that of the rest of the Central American countries and approximately seven times higher than the average per capita world consumption (MIDEPLAN 1998). The national objective is to diminish physical, chemical, and biological pollution caused by toxic chemical products. This objective will be accomplish by controlling the use and manipulation of potentially toxic products through permanent training programs directed to the people involved in the different management processes, and by strengthen the hazards reduction programs, especially in areas where chemicals are mostly used, through promoting the appropriate technologies to deal with plagues, as well as, organic agriculture and a control and register program of imported chemical substances (MIDEPLAN 1998). Water pollution Generally, rivers are used for sewage, industrial, and domestic disposal, because of the lack of an efficient system of sewage-channels and inadequate operation of the existent treatment systems. The highest pollution of the country occurs, according to 1996’s data, in the Río Grande de Tárcoles’ watershed, where in a 2 169 Km2 area 55 % of the country’s total population is located and 85 % of the services, industries and commerce, 80 % of the public transport, and where 50 % of the total country’s coffee is processed (MIDEPLAN 1998). In the rivers from the metropolitan area, 300 thousand kg. of organic and industrial waste is daily deposited, from where 250 thousand kg. (83 %) per day come from the coffee industry. In other activities water pollution come from the use of agricultural chemicals and inadequate waste disposition, especially in the Atlantic Zone due to banana production (MIDEPLAN 1998). The governmental policy in this area is directed toward establishing a monitoring system to check water quality, accomplishment of norms of waste water disposition, increment of the sewage channel system, and strengthen the correct human disposal in rural areas (MIDEPLAN 1998).
194
Air pollution The transport sector emitted 70 % of the total emissions of the country in 1997. The general problem is related to the quality of motor fuels, deficient infrastructure, and in-crease in the number of vehicles (MIDEPLAN 1998). The vehicles’ situation is worse due to the fact that their national average age is 12 years, which in turn provokes more pollution and more incidence of respiratory illnesses in the population. The governmental policy is directed toward reducing the air pollution level from mobile and stationary sources to the recommended ones, putting into practice a national monitor network and air quality control, intervening critical polluted areas, reducing the national average age of vehicles - especially for public transport - and making an efficient use of the existent infrastructure (MIDEPLAN 1998).
5.2.4 Environmental requirements for the Costa Rican project appraisal procedure The cost-benefit analysis (CBA) procedure in Costa Rica is basically based on the tra-ditional criterion described in Chapter 2 Section 2.2, because projects are just approved according to their net benefits. However, strong emphasis is given to the identification and accounting of environmental impacts. Therefore, this section concentrates in explaining the environmental impact assessment (EIA139) procedure required by the National Technical Secretary (SETENA). The three main steps in order to carry out an EIA are listed below (UCR, MINAE 1997): a) The environmental administration, which includes a preliminary environmental
evaluation (Evaluación Ambiental Preliminar, EAP140) and previous studies. b) The environmental impact study (Estudio de Impacto Ambiental, EsIA), which could
be directed or strengthen. c) Implementation of the project’s environmental promotion system, which includes
among others, the declaration of environmental commitments, the warranty deposit, and the environmental promotion plan.
The EAP consists of a previous evaluation of the project and/or activity (construction requirements), and the geographical place where it is to be developed - in order to de-termine its potential environmental feasibility and the type of EsIA required. Then, the type of EsIA required is decided upon the EAP. For the directed EsIA, SETENA provides the terms of reference and for the strengthened one, it provides the conceptual
139 As explained in general Chapter II Section 2.4.1.1, the EIA was designed in Costa Rica in order to determine the environmental potential risks and impacts of a project. In this way, it identifies the measures to prevent, mitigate, and/or compensate for these impacts. 140 It is a requirement by Executive Decree N° 25705 for all projects, constructions, and/or activities carried out in the country.

195
framework which would direct the whole study (for further details see UCR, MINAE 1997). And finally, the environmental promotion system consists of a declaration of environ-mental commitments as a contract to agree with the government environmental re-quirements, the warranty deposit to be used in case of environmental damages (impacts), and the environmental promotion plan in order to account for prevention, mitigation, and/or compensation measures.
5.3 The Santa Elena Rain Forest Preserve Project in Costa Rica A case study was chosen in order to link the theoretical background described in the last chapters with the empirical facts and then, complement the country’s project appraisal methodology in order to promote sustainable development through CBA. The Santa Elena Rain Forest Preserve Project was chosen due to the presence of economic, social, and environmental impacts, which existence are essential to illustrate how to deal with them in CBA in order to comply with sustainable development.
5.3.1 The Santa Elena Project history Before 1977, children from the Santa Elena community had to travel approximately 25 km. on a road in a very bad condition and deficient transportation means, in order to attend the high school in the closest educational center in the Colorado de Abangares’ town. Due to this limitation, the Association for Community Development of Santa Elena be-came interested in and started to pledge for the construction of its own high school center, which was established in 1977 with forty students and the support of the Costa Rican Ministry of Education. Finally, the high school was converted into a technical one, which with a one more year of education provides students with a technical training, that at that time was directed toward agricultural activities, with the purpose of providing them a work opportunity. In 1983 this center started a program which claimed to provide alumni not only with a technical training, but with the means to put their capabilities into practice, by providing them agricultural land to farm. The land was provided by the high school, which at that time through a 10 years’ gov-ernment lease in a 308 hectare of pristine forest land, which was, in turn, expropriated under an executive decree-law in 1981. This project provided alumni with 10 hectare parcels to harvest crops, such as cabbage, broccoli, carrots, coriander, lettuce, beans, potatoes, and maize.
196
Although the program was at the beginning highly accepted, the land was not suitable for agricultural purposes, because of severe difficulties to cut down the natural forest, high precipitation and general unfavorable weather conditions, low soil fertility, and lack of financial resources; then, it was abandoned. But, because the Monteverde Cloud Forest Preserve, adjacent to the Santa Elena community and to this government forest land, was already worldwide known and highly visited, because of its rich biodiversity and endemic species such as the Golden Toad, the local community and the school’s director had the idea to use the land for ecotourism purposes. The Monteverde Preserve, a private preserve owned by a non-profit Costa Rican or-ganization (The Tropical Science Center, TSC), is comprised of 14 200 hectares of mostly pristine forest, which possesses six different ecological habitats, which according to Holdridge are the followings: humid sub-mountain forest, pluvial low mountain forest, pluvial sub-mountain forest, and very humid tropical forest (TOSI 1969). It is the habitat of, so far identified, 2 000 species of vascular plants distributed in 182 families - which comprise an estimated of 75 % of the flora of the region (HABER 1989) -, 106 mammals species from 30 families and 10 orders from the marsupials to the perisodactils, about 43 species of quiropters, 336 bird species in 53 families141 - 48 % of which are rare species, such as the “Resplendent Quetzal” -, 123 species of reptiles, 47 amphibians, and 259 species of butterflies142. Furthermore, although there is no discussion about the environmental value of the preservation of this land, there was a lot of questionings about the low standard of living of the Santa Elena community, which was mostly caused by the separation of the Monteverde preserve objectives and those from the community (see GUZMÁN 1992, p. 35). Therefore, because of the fact that the governmental land administrated by the Santa Elena High School is adjacent to the Monteverde Preserve and that the uniqueness of tropical forests lies in their non-homogenous character, which means that forests may contain dozens of different species in a single hectare and that each hectare that is de-stroyed is in a sense irreplaceable (TSC 1990), the project idea of opening a new pre-serve (The Santa Elena Preserve) was highly supported by some national and interna-tional organizations, which contributed to its ultimate establishment in 1992.
5.3.2 Project overview The Santa Elena Rain Forest Preserve (SERFP) is an ecotourism project carried out by a local community in Costa Rica. The idea (activity) of the project is basically to generate revenues, through charging visitors an entrance fee to a pristine forest’s private preserve, in order to promote sustainable local development.
141 These birds cover migratory continental intra-tropical and local routes’ birds. 142 In general insects have not been very much studied in Monteverde.
197
The area is comprised of 256 ha of pristine forest, which represents 83 % of the total area, and 52 ha of naturally regenerated secondary forest (BRENES, VILLALOBOS 1985). This preserve presents most of the characteristics described for the Monteverde Cloud Forest Preserve (MCFP), however, in comparison provides additionally the following services (GUZMÁN 1992): • the resplendent quetzal, which is usually a migratory bird, possesses in some of the
SERFP a permanent habitat, because it is able to find food during the whole year, which, in turn, means that tourists are able to watch it permanently;
• it is informally considered - by many tourists - as a more wild than the MCFP, be-cause its surroundings are less developed;
• the volcano and lake Arenal can be seen magnificently from some borders of the SERFP; and
• fulfill the tourists demand for community-managed projects, which simultaneously provides natural resource preservation and socio-economic benefits for local (poor) communities.
Then, the Santa Elena Rain Forest Preserve Project generates mostly positive - eco-nomic, social, and environmental - impacts by promoting a way to preserve natural for-ests and generate income to the local communities. However, there exists some direct negative impacts from tourism in the preserve, which are not very severe, such as soil degradation in the trails, and flora and fauna disturbance; and some other general im-pacts, such as the tourism residues (garbage, sewage, etc.) and cultural shock. As described briefly above, the general objective of the project is to provide an income for the Santa Elena’s high school and the specific objectives are listed following: • to expand the Santa Elena high school’s curriculum to include an ecotourism technical
training program; • to provide Costa Rican students with access to a center for practical rain forest study; • to provide employment opportunities to people within the Santa Elena community as
guides, preserve rangers, education center hosts, maintenance staff, and adminis-trators;
• to complement and support the development activities of the Santa Elena’s commu-nity;
• to look for tourism attraction alternatives for the region with direct community benefit; • to use the tourism attraction potential of the region; • to preserve and improve the region’s natural resources; • to develop a preservation behavior in children of primary and high school. The most relevant activity to fulfill the objectives is tourism visitation, since it is the source of funding for the project and the reason why the preserve was developed.
5.3.2.1 Location of the project It is located in the province of Puntarenas (the larger province in Costa Rica), close to the Santa Elena town in the Monteverde region (see Figure 5.1 in Page 183). The whole
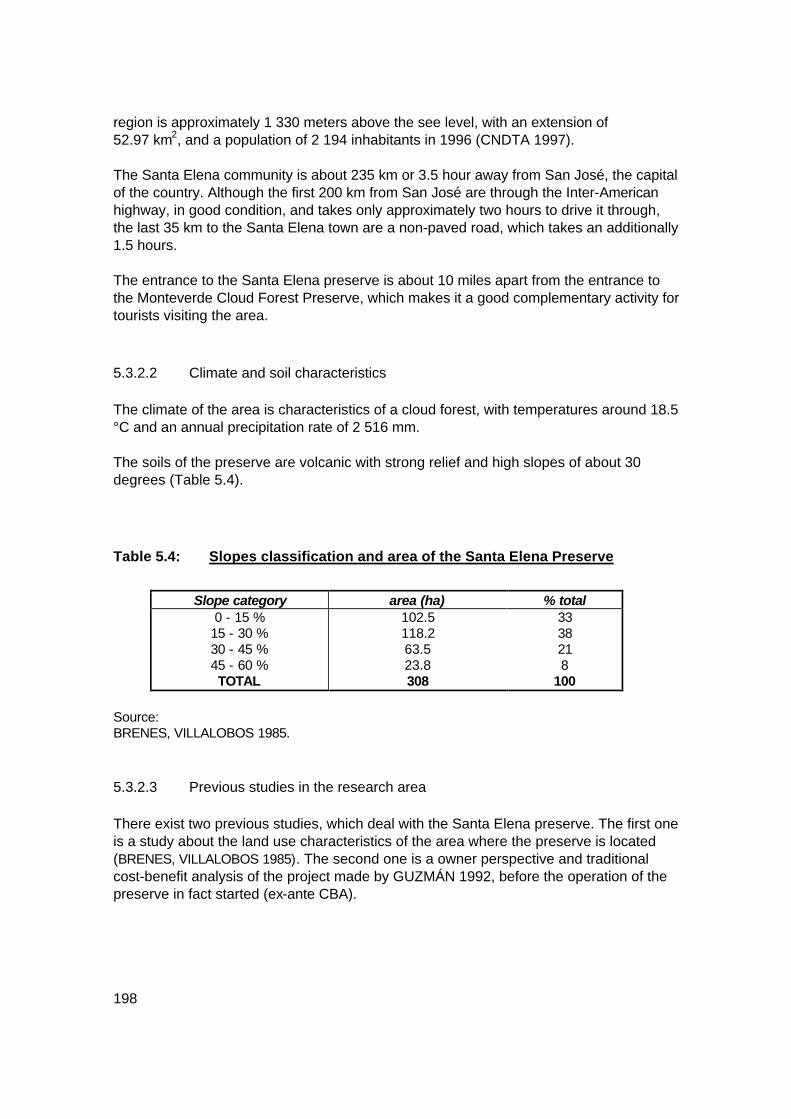
198
region is approximately 1 330 meters above the see level, with an extension of 52.97 km2, and a population of 2 194 inhabitants in 1996 (CNDTA 1997). The Santa Elena community is about 235 km or 3.5 hour away from San José, the capital of the country. Although the first 200 km from San José are through the Inter-American highway, in good condition, and takes only approximately two hours to drive it through, the last 35 km to the Santa Elena town are a non-paved road, which takes an additionally 1.5 hours. The entrance to the Santa Elena preserve is about 10 miles apart from the entrance to the Monteverde Cloud Forest Preserve, which makes it a good complementary activity for tourists visiting the area.
5.3.2.2 Climate and soil characteristics The climate of the area is characteristics of a cloud forest, with temperatures around 18.5 °C and an annual precipitation rate of 2 516 mm. The soils of the preserve are volcanic with strong relief and high slopes of about 30 degrees (Table 5.4).
Table 5.4: Slopes classification and area of the Santa Elena Preserve
Slope category area (ha) % total
0 - 15 % 15 - 30 % 30 - 45 % 45 - 60 % TOTAL
102.5 118.2 63.5 23.8 308
33 38 21 8
100 Source: BRENES, VILLALOBOS 1985.
5.3.2.3 Previous studies in the research area There exist two previous studies, which deal with the Santa Elena preserve. The first one is a study about the land use characteristics of the area where the preserve is located (BRENES, VILLALOBOS 1985). The second one is a owner perspective and traditional cost-benefit analysis of the project made by GUZMÁN 1992, before the operation of the preserve in fact started (ex-ante CBA).

199
The latter study not only provides general information about the Monteverde and Santa Elena’s preserves, but uses a questionnaire applied to the visitors to Monteverde as a way to characterize the possible tourists to the Santa Elena preserve. Finally, the study presents an efficiency based cost benefit analysis from the following perspectives: the local community (the owner of the project), stand alone project, and the society as a whole’s point of view, and concludes on the project’s feasibility. The idea of the current study is to take the previous one as a base and complement it with real information (from the current operation of the Santa Elena preserve). Then, extend the analysis to account not only economic efficiency effects, but distributional and environmental ones.
5.4 Organization of the Field Study The main purpose of the field research was to collect the necessary data to illustrate the methodology used in assessing development projects in order to promote sustainable development and accomplish the study objectives. Primary data was required because the available secondary data (previous studies de-scribed in the last section and national statistics) did not fulfill the data requirements to carry out the CBA. Therefore, the data was collected by filling out questionnaires ad-dressed to the main stakeholders of the project under study (see Annex 1). The data refer mainly to descriptive information about the community members and visitors to the preserve, opinion about the project, main project’s impacts, and valuation through willingness to pay questions (contingent valuation technique explained in Chapter 3 Section 3.2.2). Furthermore, usually projects are appraised by a team of experts, which identify and evaluate the project impacts, according to the methodology presented in Chapter 4 Section 4.3. However, the current study used the survey opinions instead. Therefore, the survey asks the community to evaluate some impacts before and after the project, which serves to construct the impacts evaluation matrix.
5.4.1 Survey design The fieldwork uses the survey method, in which formal questionnaires are used, to obtain primary data to account for the not available secondary information. The questionnaires include, in general, the following set of information (Annex 1): • survey purpose and motivation, • personal information, and • information about the project itself. The idea of the first section was to explain the main purpose of carrying out the survey, the importance of filling out the questionnaire with accurate information, and explaining

200
the confidential nature of the information provided, which would only serve academic purposes. The personal information served the purpose of providing the main socio-economic characteristics of the respondents. And, the information about the project itself basically provides information for the CBA, on the impacts before and after the project and ask the willingness to pay or accept questions. Specifically for this project, two surveys where applied. One to the preserve visitors and the other one to the local community. The first one to the preserve visitors was divided into residents and non-residents, although both questionnaires are basically the same, one (the residents) was written in English and the other one (the non-residents) in Spanish. The survey to the preserve visitors was self-administrated and composed of, in the first section (information about the project), 17 questions, which asked for the visitor prefer-ences in the Santa Elena preserve, impacts, and willingness to pay questions. The second section, personal information, is comprised of seven questions about the re-spondent socio-economic characteristics, such as the visitor country of residence, age, sex, marital status, educational level, working status, and salary. The survey to the community consists of three sections. The first one, personal infor-mation, about the socioeconomic characteristics of the respondents. The second one, the Santa Elena community, with four questions about their opinion on some of the features of the tourists, such as preferred activities in and outside the preserve, length of stay, and additional services required. The third one (the project) consist of nine questions, such as willingness to pay, impacts before and after the project, and agree-ment or not with the operation of the project (see Annex 1).
5.4.2 Sample size and selection Because of the relative small size of the target populations and the time constraint, it was decided to survey as many persons as possible. On the one side, the survey to tourists was carried out almost every day from June to November 1998, to all the visitors to the preserve who were willing to participate and on the other side, the survey to the community of Santa Elena, which is comprised of approximately 249 households, was carried out in some special events which brought the respondents together in September and October 1998.
5.4.3 The study teams Although a different team was assigned by the project administration for every survey, some similar characteristics were required as a precondition to participate in the study. For example, previous experience in survey administration and be at least university student.

201
Every team was also trained by the author by explaining every question and on-field practice. The latter refers to the fact that the author himself were doing interviews in front of the trainee to show the way they should be carried out and then, the members of every team had to pass several times the questionnaires in the presence of the author to ensure that they were administered in the right way. Furthermore, it was decided to use the self-administration technique for the tourists and community’s surveys (respondents had to fill out the questionnaire by themselves). The reason for this was, in the first case (the visitors sample), that respondents had to fill it out at the end of the visit to the preserve and most of the time they were coming in big guided groups. Therefore, one to one interviews were very difficult to carry out. Addi-tionally, this survey was passed every day, from Monday to Sunday during working hours. In the second case, because the survey was carried out during community meetings, it was also difficult to make a one to one interview. The teams in charge of these surveys were composed of, in the first case, the preserves’ sub-director, a university student volunteers from United States, and three other personal staff. In the second case, another university student volunteer from the United States and one staff person from the preserve.
5.4.4 Problems with the field surveys The main problems presented by passing the field surveys relate to timing, due to fact that the visitors surveys were carry out from June to November, which do not account for the country’s dry season (January to April), when there are more national visitors. Additionally, in order to carry out the surveys, it was indispensable to count with the approval of the preserve administration, because the visitors surveys were to be carried out inside the preserve every day and because of the sensible nature of the survey to the community, which delayed the start point. Furthermore, some other basic secondary information were required from the preserve administration, such as financial sensitive information, plus it was practically impossible for the author to carry out all the surveys by himself. Then, the best way to manage it was to work with them in every step of the fieldwork process, from survey design to survey administration and analysis.
5.5 Data Analysis
5.5.1 The surveys The survey is analyzed based on elementary statistics (averages and distributions) and regression analysis for the willingness to pay questions (against the socioeconomic characteristics of the respondents) using firstly the linear regression approach. Fur-thermore, in order to look for a significant model to predict these answers, additional

202
variables are transformed, such as employment status and marital status, or added, such as the ranking of the project impacts. Exclusion of outliers and stepwise regression are also carried out. Finally, the non-parametric (Spearman-Rho) correlation approach is tried to account for any relationship between the willingness to pay answers and the socioeconomic char-acteristics and ranking of impacts of the respondents.
5.5.2 Application of the criteria system to balance the use and conservation of the
environmental asset The Santa Elena Preserve consists of 308 hectares of natural cloud rain forest (mostly pristine), presents most of the unique biodiversity characteristics described for the Monteverde Cloud Forest Preserve (MCFP), and provides a permanent habitat for the Quetzal bird (see Section 5.3.1). Then, according to the methodology presented in Chapter 4 Section 4.2, it falls in the category of a irreplaceable habitat which should be preserved (non-use). Therefore, in order to set up the standard we have to take into account the information described in Section 5.2.2 Forestry resources: according to CUBERO 1994 and the land use capacity system143, Costa Rica should have 64 % of its territory under forest coverage, from which 35 % could be dedicated to commercial use and 29 % to natural protection. However, currently, 40 % of the territory is under forest coverage and ap-proximately 25 % are under protected areas (natural protection).
5.5.3 Evaluation of the project impacts The project impacts were identified according to primary (informal interviews to the project administrators and people related to the project) and secondary information (GUZMÁN 1992). Then, the idea to construct the impacts’ analysis matrix is to show the opinions carried out by the respondents to the community survey, when they evaluated the impacts before and after the project. More specifically, the impacts are weighted and then subtracted (after-before) in order to account for the current impact severity (see Chapter 6 Section 6.1.3.3 and Section 6.2). Furthermore, in the Santa Elena Project case study (Chapter 6), the valuation methods specifically used in order to value some of the external benefits of forest protection are following explained: • the contingent valuation method is practiced to value the non-use and direct use
values of forest protection to the local community (willingness to accept) and to es-
143 See Footnote 137 in page 200 for an explanation of the land use capacity system.

203
timate the consumer surplus of its direct use to the visitors to the preserve (willing-ness to pay); and,
• the reference value from CARRANZA 1996, which employs the productivity change (for example for agriculture and hydroelectric purposes) and cost avoidance (such as restoration, prevention, and replacement costs) methods to value the indirect use value of water production and overflow control.
5.5.4 The cost-benefit analysis The cost benefit analysis for the Santa Elena Rain Forest Project consists of the private and society perspectives. The private perspective includes the owner and stand alone project private points of view, and the society perspective includes the traditional, dis-tributional, and environmental points of view for calculating the net present value (NPV) of the project. In all the cost-benefit analyses, benefits and costs are deflated and inflated, using the, to account for the nominal prices at the corresponding year. Then, when prices are given, for example, in nominal 1998 prices, they are deflated for the earlier years and inflated for the later years.
5.5.4.1 The private perspective In the Santa Elena Rain Forest Project, two private perspectives are to be analyzed. On the one hand, the owner perspective is carried out in order to assess the project feasibility for the Santa Elena community and specifically for the High School, which include donations due the non-profit nature of the project. On the other hand, the stand alone project perspective, because it would be interesting to know if the project is fea-sible for a common entrepreneur, without considering donations.
5.5.4.2 The stepwise CBA analysis The stepwise CBA analysis presented in Chapter 4 is constructed from the society per-spective, therefore we take into account the benefits and costs of the project for the Costa Rican society. Although the proposed methodology is an ex-ante evaluation, the case study chosen started its operation in 1992. The reason for applying the methodology to this project is to compared its methodological results to its actual a-priori effects. Then, we expect the following project results: a) to be feasible for the owner, because the administration manifested to have a positive
cash balance; and b) to be feasible from the society point of view, because of the following reasons: for the
traditional CBA the project received donations, generates income, and carry positive environmental effects; for the distributional CBA, the project distributes income

204
among a rural local and remote population; and for the environmental CBA, the project is a way to conserve scarce pristine forest.
The traditional CBA In the benefit side, this analysis uses the willingness to pay as an entrance fee re-sponses in order to account not only for the entrance fee price, but for the consumer surplus. Additionally, it includes the positive environmental externalities valued for the project, international (external) donations, and the liquidation values of the project assets. Other operational benefits included are the store and café’s revenues. In the cost side, the analysis eliminates the transfer payments within the economy, such as, the sell tax from equipment purchase and social charges from personnel costs. Furthermore, it includes the opportunity cost of land, as the commercial use of the forest land, as well as, the opportunity costs of the infrastructure and equipment donations. Other costs taken into account are operational and infrastructure maintenance costs. The distributional CBA The distributional CBA is calculated based on the traditional CBA. With respect to the distributional weights (DW), on the one side, the distributional weight attached to the direct benefits of the local community (net benefits from the owner perspective) are calculated based on the deflating region and the national average salaries (to 1992 prices), according to DGEC 1994. Furthermore, it is assumed a -15 % decrease in the local real salary, before the project started (beginning of 1992). On the other side, for the distributional weight to be attached to the direct benefits of the resident visitors to the preserve (the entrance fee), is carried out in the same way, but based on the Costa Rican central region deflated price. It is worthwhile to notice that here we do not apply any distributional weight to the envi-ronmental benefits of the project, according to the methodology presented in Chapter 4. However, for the calculation of the distributional weights ( a i ), in order to set up a base
to calculate the n parameter (see Chapter 3 Section 3.5.1.1), the Costa Rican poverty indicators could be associated to it, as follows: • n = 2 if the average country salary is not higher than US$ 1 857 per year144, which is
the maximum family salary to be considered under extreme rural poverty145 (assuming that a high percentage of the families of the country depend on one salary);
• n = 1.7 if the average country salary is not higher than US$ 2 108 per year146 (and
above the last category), which is the maximum family salary to be considered under
144 This calculation is based on the maximum per person extreme poverty income in the rural area, assuming five persons per family (LA NACIÓN DIGITAL 2000). 145 Families under extreme poverty are the ones whose income is not enough to even fulfill their basis nutritional requirements (LA NACIÓN DIGITAL 2000).
205
extreme urban poverty (assuming that a high percentage of the families of the country depend on one salary);
• n = 1.3 if the average country salary is under US$ 3 658 per year147 (and above the
last category), which is the maximum rural family salary to be considered rural poor148 (assuming that a high percentage of families of the country depend only on one salary);
• n = 1 if the average country salary is under US$ 4 595 per year (and above the last
category), which is the maximum urban family salary to be considered poor (assuming that a high percentage of families of the country depend only on one salary);
• n = 0.5 if the average country salary is above the last category, but inequality is still
an issue; • n = 0 if income inequality is not an issue. The environmental CBA The environmental CBA calculation is based on the distributional CBA and apply envi-ronmental weights only to the environmental benefits - and costs - of the project. As explained in Section 5.5.2, the Santa Elena preserve falls into the category of non-use of irreplaceable assets, then, the weight is calculated based on CUBERO 1994, who states that 29 % of the national territory should stay under natural protection and on the extension of the actual protected area system, which accounts for 25 % of the national territory.
5.6 Conclusion Costa Rica shows indicators, which denote advanced national social, environmental, and economic results. For example, in the social area a life expectancy of 76.1 years, a 90.4 % of health coverage service, and a location in the 45th position in the U.N. human development index. In the environmental area an approximately 25 % of the total area natural protected area system and . And, in the economic area, a relatively high eco-nomic growth of 4.1 % during the 1990’s. However, there still exist limitations in these areas, which are to be overcome, specifi-cally, 21.1 % of the total households, although the country exhibited one of the highest
146 This calculation is based on the maximum per person extreme poverty income in the urban area, assuming five persons per family (LA NACIÓN DIGITAL 2000). 147 This calculation is based on the maximum per person poverty income in the rural area, assuming five persons per family (LA NACIÓN DIGITAL 2000). 148 Salary which is not enough to fulfill the basic human necessities - i.e. food, shelter, clothing, education, and transportation - (LA NACIÓN DIGITAL 2000).

206
annual GDP of Latin America in 1999 (8%) are under the poverty line (INEC 2000), which denote a weak link between economic and social development. Furthermore, the GDP growth for 2000 is one of the lowest in Latin America (1.1 %), which should be also taken into account from the pure economic point of view. In the environmental area, there exists a lack of approximately 24 % in total forest cov-erage according to CUBERO 1994, a 45.3 % of land sub-utilization and 26.5 % of land over-utilization according to MIDEPLAN 1998, pollution of rivers and water resources, solid waste disposal problems, and air pollution, among others. The limitations mentioned above denote that not only the economic growth concerns are a national issue, but the social (income distribution) and environmental ones (a balance between the use and conservation of the environmental asset), if taken sustainability into account. Therefore, the evaluation of development projects should take these areas into consideration, in order to direct project toward accomplishing the desire national objectives. With respect to the Santa Elena Rain Forest Preserve Project, it is a worthwhile initiative, which is operated by a local and remote community and which benefits go directly to promote a better standard of living of the native population.

207
6 RESULTS OF THE FIELD STUDY AND DISCUSSION The objective of the current chapter is to present the data analysis results and illustrate the use of the methodology in a real life project in Costa Rica: the Santa Elena Rain Forest Preserve Project. Although the appraisal of the case study do not intend to be exhaustive, it seeks to illustrate the general methodology proposed in Chapter 4, in order to incorporate environmental sustainability in CBA. Furthermore, it is worthwhile to notice that the proposed methodology is an ex-ante evaluation; however, the case study chosen started its operation in 1992. The reason for applying the methodology to this project is to compared its methodological results to its actual a-priori effects. Then, we expect the following project results: a) feasibility from the owner perspective, because the administration manifested to have
a positive cash balance; and a) feasibility from the society point of view, because of the following reasons: for the
traditional CBA the project received donations, generates income, and carry positive environmental effects; for the distributional CBA, the project distributes income among a rural local and remote population; and for the environmental CBA, the project is a way to conserve scarce pristine forest.
First of all, the questionnaires results are shown in order to identify and evaluate the main impacts of the project, describe the characteristics of the major stakeholders, and present their main perceptions toward the project. Next, the primary and secondary data are used to make the technical appraisal of the project, which is a description of the detail calculation of the benefits and costs of the project. Finally, the owner perspective CBA and the stepwise and sensitivity analysis are carried out, and the results discussed, in order to obtain relevant conclusions for the national and international empirical application of the methodology.
6.1 Survey Results of the Santa Elena Rain Forest Project The survey results for the project are following presented, first for the non-residents and residents’ tourists surveys and then, for the survey to the community of Santa Elena.
6.1.1 The Non-Resident Tourists The target population is approximately 3 277 tourists, according to the June to December 1998 actual visitation. Then, the sample is comprised of all the tourists that were willing to be interviewed, that is 201 tourists, out of which 54 % of are females and 46 % males.

208
6.1.1.1 Socioeconomic characteristics Because the average age is 29 years and the visitors come mostly from developed countries, where the average marriage age is higher, it was expected a sample formed of a high percentage of single people; in fact 77 % of the sample are single (Table 6.1).
Table 6.1: Marital status of respondents, non-resident tourists, Santa Elena-Costa Rica 1998 (N= 187)
married single free union divorced
16 % 77 % 4 % 3 % N= number of cases
Source: Field survey results 1998. The distribution of the sample according to the country of citizenship is the following: 59 % are Americans, 31 % are Europeans (mostly from Germany, England, and Holland), 4 % are Canadians, and the rest from different countries; therefore, mostly from North America and Europe; therefore, expecting also a relatively high income if compared to the nationals.
Table 6.2: Highest educational level of respondents, non-resident tourists, Santa Elena-Costa Rica 1998 (N= 179)
elementary
school high school technical
school university bachelor
post-graduate
2 % 27 % 4 % 40 % 27 % N= number of cases
Source: Field survey results 1998. The sample’s highest educational level, include mostly bachelors, postgraduates, and high school students (Table 6.2). And, about the working status ( Table 6.3), most of them are employed or have their own business (50 %), or students (44 %). And the rest are divided in the following categories: unemployed (5 %) and retired (2 %).

209
Table 6.3 Working status, non-resident survey, Santa Elena 1998 (N= 190)
own business employed unemployed housewives retired student 8 % 42 % 5 % 0 % 1 % 44 %
N= number of cases Source: Field survey results 1998. The average annual income of the sample is US$ 24 thousand (Figure 6.1b). The in-terval with a higher percentage of responds (52 %) correspond to the less than US$ 10 thousand per year (Figure 6.1a), however, 25.5 % of the respondents are also over US$ 30 thousand per year.
Figure 6.1: Income frequency and average, non-resident tourists, Santa Elena 1998 (N= 160)
a) Income frequency
0
10
20
30
40
50
60
<10 10-20 21-30 31-50 51-80 >80
thousand US$
%
b) Average income and standard deviation
0
10
20
30
40
50
Source: Field survey results 1998. They stay an average of 5 days in the region and one day in the Santa Elena Pre-serve149. Their most common transportation means are public bus (45 %), tour bus (18 %), rented car (16 %), and other like taxi, walking, or a combination of the ones men-tioned before (21 %).
149 43 % also visited the Monteverde Preserve.
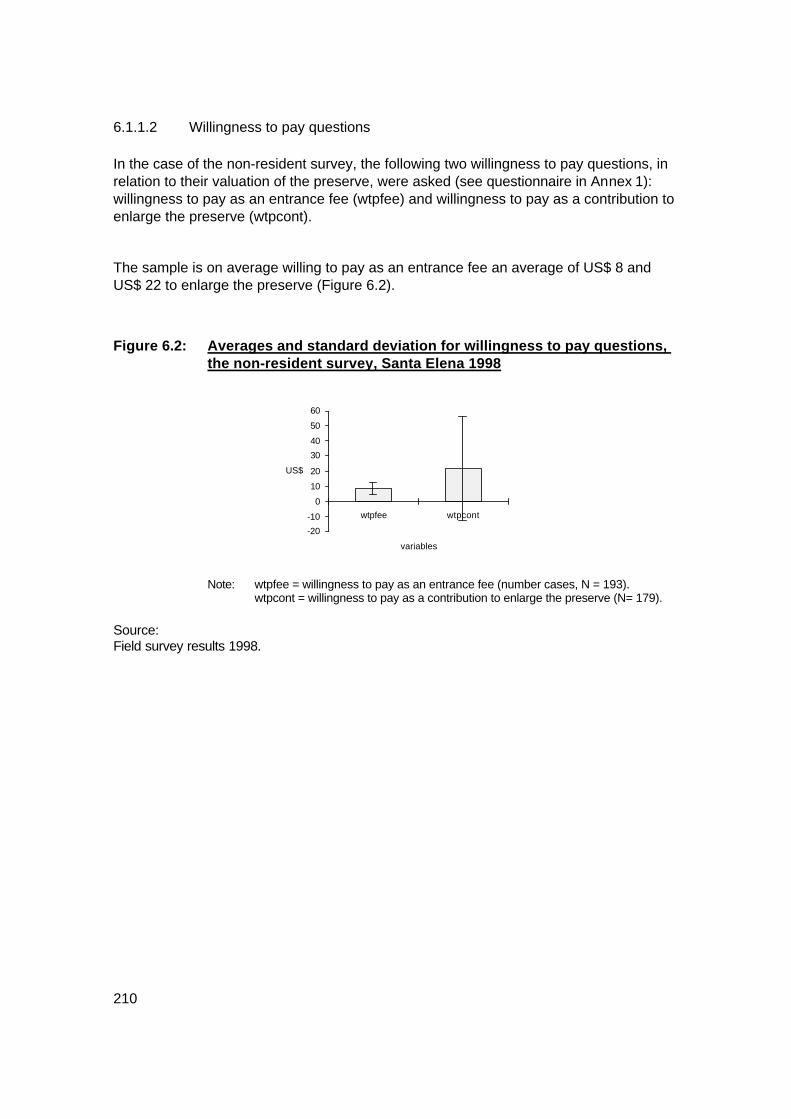
210
6.1.1.2 Willingness to pay questions In the case of the non-resident survey, the following two willingness to pay questions, in relation to their valuation of the preserve, were asked (see questionnaire in Annex 1): willingness to pay as an entrance fee (wtpfee) and willingness to pay as a contribution to enlarge the preserve (wtpcont).
The sample is on average willing to pay as an entrance fee an average of US$ 8 and US$ 22 to enlarge the preserve (Figure 6.2).
Figure 6.2: Averages and standard deviation for willingness to pay questions, the non-resident survey, Santa Elena 1998
-20
-10
0
10
20
30
40
50
60
wtpfee wtpcont
variables
US$
Note: wtpfee = willingness to pay as an entrance fee (number cases, N = 193). wtpcont = willingness to pay as a contribution to enlarge the preserve (N= 179).
Source: Field survey results 1998.

211
Figure 6.3: Distribution for the willingness to pay questions, the non-resident survey, Santa Elena 1998
a) Willingness to pay fee frequencies
05
101520253035
<2 2-5 6-7 8-10 11-12 13-15 >15US$
%
b) Willingness to pay as a contribution frequencies
0
10
20
30
40
50
<5 5-10 11-20 21-40 41-70 >70US$
%
Source: Field survey results 1998. For the willingness to pay as an entrance fee, the interval with the highest frequency of answers, from the given intervals, is between US$ 2 and US$ 5 (32 %). However, due to the fact that 28 % also lie in the interval from US$ 8 and US$ 10 and 23 % from US$ 11 to US$ 12, the result of the calculation of the average wtpfee was higher (Figure 6.3a). For the willingness to pay as a contribution to enlarge the preserve, most of the answers (49 %) lie in the interval from US$ 5 to US$ 10. However, there is a high percentage (17.3 %) of answers lying in the above US$ 40 intervals, which push the average wtpcont calculation toward a higher amount (Figure 6.3b). In order to have more reliability on the willingness to pay data (wtpfee and wtpcont), a relationship to the socioeconomic characteristics of the respondents and ranking of im-pacts (from Table 6.8) was sought. A positive result was found by the non-parametric (Spearman-Rho) correlation, after trying several approaches such as regression analy-sis, which are explained later.

212
Table 6.4: Non-parametric (Spearman-Rho) correlation with the willingness to pay questions, the Santa Elena non-resident survey 1998
Variable WTPfee
WTPcont
correlation
coefficient significance correlation
coefficient significance
Employment status .264** .000 .098 .199 Income .167* .036 -.017 .840 Citizenship USA Other
.059 -.163*
.425
.025 .198** -.124
.008
.099 Sex .158* .032 .107 .157 Student -.212** .004 -.012 .873 Age .161* .029 .059 .425
** correlation is at the .01 level of significance * correlation is at the .05 level of significance Source:
Field survey results 1998.
Specifically, we looked for a relationship of wtpfee and wtpcont with the following vari-ables: income, age, years of education, sex, employment status, country of citizenship, marital status, and the ranking of impacts (employment, forest protection, cultural shock, income generation, price of land, and trail deterioration). The non-parametric correlation significant results are shown in Table 6.4 and following interpreted: a) Non-parametric correlation to the willingness to pay as an entrance fee question
(wtpfee):
• employment status is highly significantly positively correlated, which means that the people who are employed or possess their own business are willing to pay more than the others (students or unemployed);
• income level is significantly positively correlated, which means the more
people earn the more they are willing to pay; • citizenship, specifically people from other countries than USA and Europe,
is significantly negatively correlated, then, they are willing to pay less; • sex is significantly positively correlated, which means that men are willing
to pay more;

213
• student is highly significantly negatively correlated, which means that students are willing to pay less than others (people employed and with own business); and
• age is significantly positively correlated, which means that the older the
people are the more they are willing to pay. b) For the willingness to pay as a contribution to enlarge the preserve, only citi-
zenship, specifically the tourists from USA, is highly significantly correlated, which means that they are willing to pay more than the others (including Europeans and other citizenships).
The non-parametric correlation results shown for the wtpfee were expected and are related to each other, for example, people who are willing to pay more are the ones with a higher income, which, in turn, have a permanent employment (not students), are older, and come from industrialized countries. Furthermore, it is well known that in general there is a gap between men and women salaries, in favor of the former; then, men have a higher income than women and are willing to pay more. Furthermore, the relationship between wtpfee versus income is depicted in Figure 6.4. It shows a linearly slowly increasing function, which is significant in statistical sense.
Figure 6.4: Scatterplot for the willingness to pay as an entrance fee (wtpfee) vs. income level. The Santa Elena non-resident survey 1998
income level (thousands)
120100806040200
will
ingn
ess
to p
ay a
s an
ent
ranc
e fe
e
30
28
26
24
22
20
18
16
14
12
10
8
6
4
20
Source:
Field survey results 1998.

214
From a policy perspective, these conclusions could mean that the entrance price for non-residents could be increased (currently the normal price is US$ 6, see Section 6.3.2 for more details), for example to US$ 7 without loosing even the normal person with low income (Figure 6.4). And publicity (for visiting the preserve), directed toward professionals from industrialized countries, especially from the United States and Europe, which are willing to pay more. We also found a relationship between wtpcont and the U.S. citizenship, which is probably due to a higher relative price of goods and services and to the fact that the inhabitants from this country are used to larger national parks. Moreover, there exist a more clear correlation between the wtpfee dependent variable and the independent variables, in comparison to wtpcont; because one, the former, is a more concrete variable (the payment for using the asset), while the other, the latter, is a more hypothetical one (contribution to expand the preserve).
Table 6.5: Regression analysis for the willingness to pay as an entrance fee question, the Santa Elena non-resident survey 1998
MODEL SUMMARY
R R Square Adjusted R Square Std. Error of the Estimate .177 a .031 .005 3.78
ANOVAb Source Sum of Squares df Mean Square F Sig.
Regression 66.782 4 16.696 1.169 .327a Residual 2 056.234 144 14.274 Total 2 123.016 148
COEFFICIENTSb Variable Unstandardized
Coefficients Standardized Coefficients
t Sig.
B Std. Error Beta (Constant) 6.966 1.545 4.509 .000 age 1.801E-02 .039 .48 .460 .646 sex .671 .638 .089 1.052 .295 income level 1.989E-02 .019 .109 1.039 .300 education --1.71E-02 .117 -.014 -.147 .884
a Predictors: (Constant), age, sex, income level, and years of education. b Dependent Variable: willingness to pay as an entrance fee.
Source: Field survey results 1998. The answers to both of the questions related to the preserve were also regressed against some of the socioeconomic characteristics of the respondents, to look for a model that could predict them (Table 6.5 and Table 6.6).

215
However, in both cases, the R-squared, the F-test, and the t-value show no significant relations between the predictors and the dependent variables, willingness to pay as an entrance fee (wtpfee) and willingness to pay as a contribution to enlarge the preserve (wtpcont) respectively, because the residuals show a significant deviation from a normal distribution, so that the F and T tests for non-zero coefficients were not valid and, in turn, the relation between wtpcont and age, which shows up in Table 6.6 with a significance of 0.004, cannot be regarded as significant.
Table 6.6: Regression analysis for the willingness to pay to enlarge the preserve question, the Santa Elena non-resident survey 1998
MODEL SUMMARY
R R Square Adjusted R Square Std. Error of the Estimate .540 a .263 .069 33.20
ANOVAb Source Sum of Squares df Mean Square F Sig.
Regression 11 162.679 4 2 790.670 2.535 .053 Residual 149 896.1 136 1 102.177 Total 161 068.8 140
COEFFICIENTSb Variable Unstandardized
Coefficients Standardized Coefficients
t Sig.
B Std. Error Beta (Constant) 6.596 14.318 -- -.461 .646 age 1.057 .361 .317 2.931 .004 sex -,801 5.784 -.012 -.139 .890 income -8.15E-02 .179 -.048 -.456 .649 education level -8.98 1.074 -.081 -.936 .404
a Predictors: (Constant), age, sex, income, and years of education. b Dependent Variable: willingness to pay as a contribution to enlarge the preserve.
Source: Field survey results 1998. Furthermore, after excluding the outliers, there was still not a normal distribution and significant predictors in the extended models, which additionally include the following variables: • employment status, which differentiates between the people employed and with their
own business from the others (mainly students and some unemployed); • country of citizenship, which differentiates among the tourists from the United States,
Europe, and other countries; • marital status (two variables), which differentiates between the married people and
the others, and between the single people and the others; and • the ranking of impacts from Table 6.8 (forest conservation, local employment, income
generation, trials degradation, land value, and cultural shock).

216
The natural logarithmic (ln) transformation of the dependent variable was then tried with no success; in other words, there was still no normality of the residuals. Although, the employment status was respectively significant (0.032 for the wtpfee) and weakly significant (0.065 for wtpcont). And, the stepwise regression provided the following results: • In the willingness to pay as a contribution to enlarge the preserve model, only the
variable single, which differentiate between the single people and the others, show a weakly significant (0.072) relationship150. That means that single people are willing to pay less.
• In the willingness to pay as an entrance fee, there was no significant relationship. Finally, other willingness to pay answers, not related to the valuation of the preserve, provided the following results: they spent an average of US$ 105 in total on this trip151 and will be willing to spend US$ 40 on other additional services152, such as horse rental, zoo, and a slide show, which from a policy point of view represent activities that could be provided and charged to the tourists.
6.1.1.3 Opinion toward the project The non-resident tourists, then, recommended to carry out additional activities to make tourism more attractive, for example, slide shows (33 %), museum (26 %), zoo (18 %)153, and souvenir’s shop (12 %). Furthermore, they also required the following services: more information 8 %, better bus service 4 %, maintained a more natural preserve 4 %, and more (direction) signs 2 %. These are possible investment activities, which could be considered by the preserve administration. According to the character of the preserve (protection of pristine forest), the most im-portant current visitors’ activities inside it are the following: hiking 72 %, animal watching 71 %, bird watching 42 %, rest and relaxation 21 %, and research 7 %. The questionnaire also required the respondents to rank, according to their importance, the following impacts (Table 6.8).
150 The other variables were excluded in the stepwise regression, because they are not significant predictors, in other words, their partial correlation is very small. 151 In average a total of US$ 43 for the room, US$ 19 for souvenirs, US$ 21 for transportation, US$ 28 for gasoline, US$ 40 for food, and US$ 100 for others. 152 In average: hotel US$ 22 per night, restaurant US$ 7 per meal, horse-rental US$ 9 per hour, zoo US$ 5 as an entrance fee, slide show US$ 2 as an entrance fee, others US$ 3 per day. 153 Although a zoo could be controversial issue, because some people could be opposed to animal captivity, it could be done in a natural way, like the birds’ zoo that works in Costa Rica (Zoo-Ave), which has obtained very good critics. This could also enhance the tourists experience by providing them what they are looking for in their trip to this region: animal and bird watching.
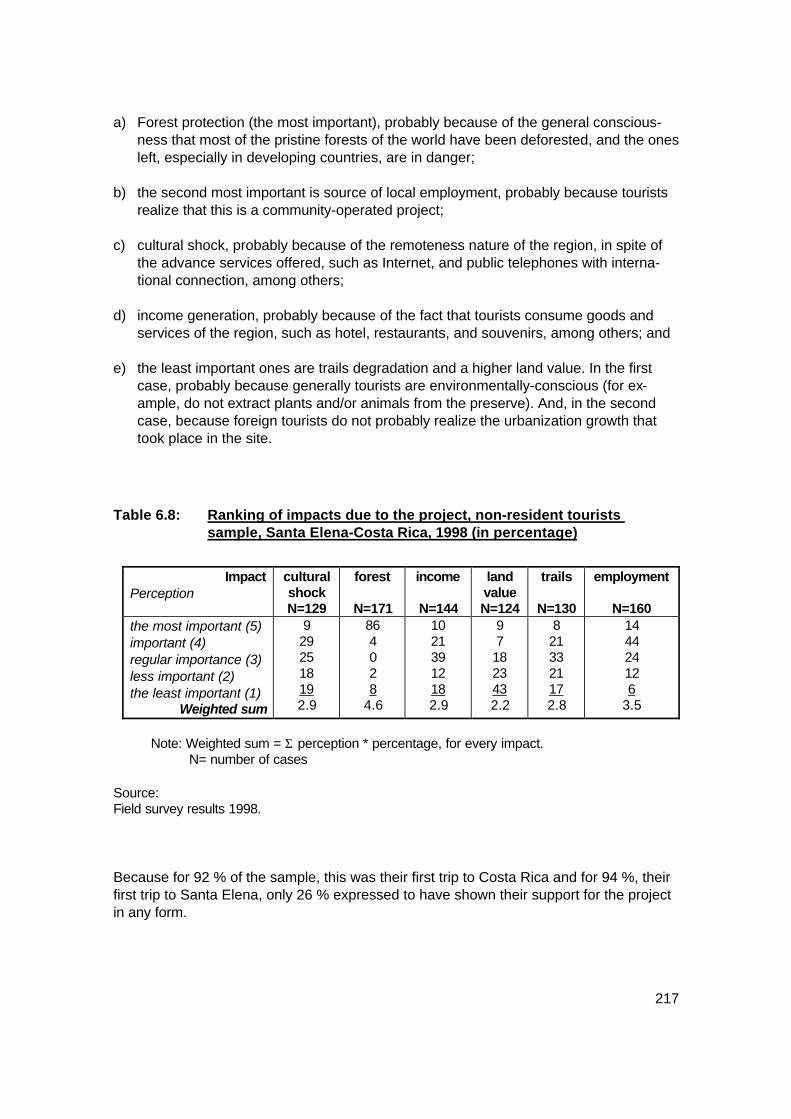
217
a) Forest protection (the most important), probably because of the general conscious-ness that most of the pristine forests of the world have been deforested, and the ones left, especially in developing countries, are in danger;
b) the second most important is source of local employment, probably because tourists
realize that this is a community-operated project; c) cultural shock, probably because of the remoteness nature of the region, in spite of
the advance services offered, such as Internet, and public telephones with interna-tional connection, among others;
d) income generation, probably because of the fact that tourists consume goods and
services of the region, such as hotel, restaurants, and souvenirs, among others; and e) the least important ones are trails degradation and a higher land value. In the first
case, probably because generally tourists are environmentally-conscious (for ex-ample, do not extract plants and/or animals from the preserve). And, in the second case, because foreign tourists do not probably realize the urbanization growth that took place in the site.
Table 6.8: Ranking of impacts due to the project, non-resident tourists sample, Santa Elena-Costa Rica, 1998 (in percentage)
Impact
Perception cultural shock N=129
forest
N=171
income
N=144
land value N=124
trails
N=130
employment
N=160 the most important (5) important (4) regular importance (3) less important (2) the least important (1)
Weighted sum
9 29 25 18 19 2.9
86 4 0 2 8
4.6
10 21 39 12 18 2.9
9 7
18 23 43 2.2
8 21 33 21 17 2.8
14 44 24 12 6
3.5
Note: Weighted sum = Σ perception * percentage, for every impact.
N= number of cases Source: Field survey results 1998.
Because for 92 % of the sample, this was their first trip to Costa Rica and for 94 %, their first trip to Santa Elena, only 26 % expressed to have shown their support for the project in any form.
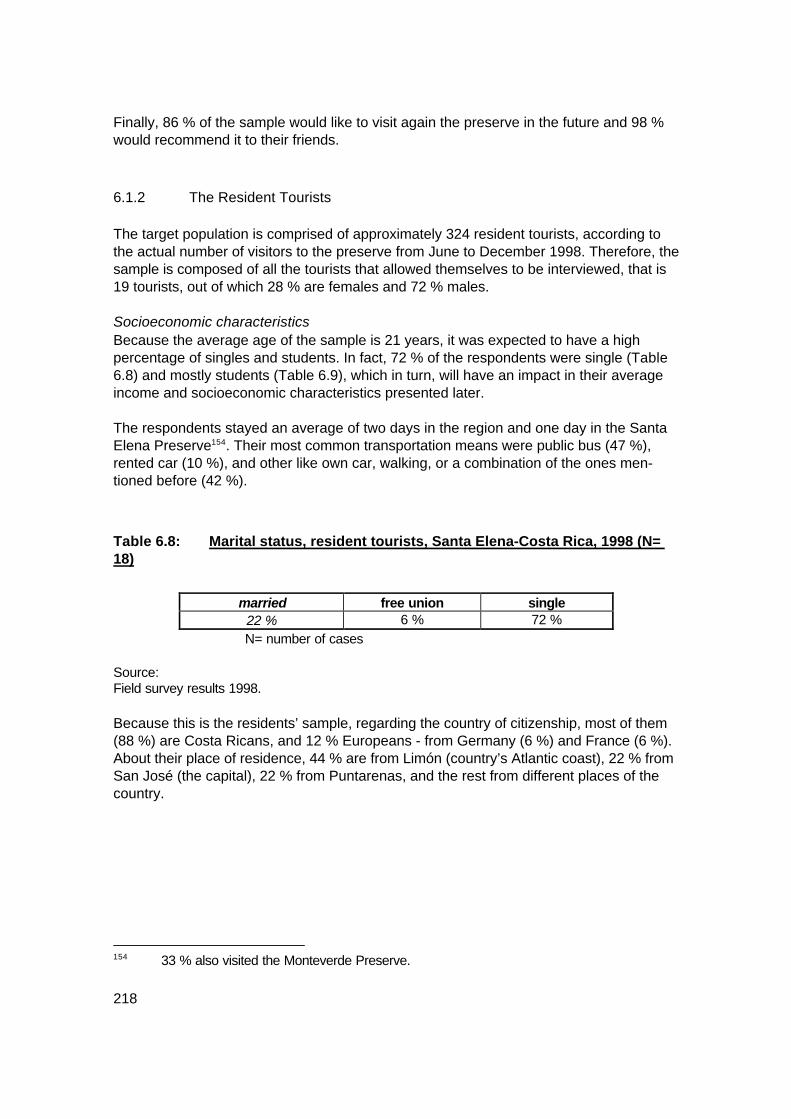
218
Finally, 86 % of the sample would like to visit again the preserve in the future and 98 % would recommend it to their friends.
6.1.2 The Resident Tourists The target population is comprised of approximately 324 resident tourists, according to the actual number of visitors to the preserve from June to December 1998. Therefore, the sample is composed of all the tourists that allowed themselves to be interviewed, that is 19 tourists, out of which 28 % are females and 72 % males. Socioeconomic characteristics Because the average age of the sample is 21 years, it was expected to have a high percentage of singles and students. In fact, 72 % of the respondents were single (Table 6.8) and mostly students (Table 6.9), which in turn, will have an impact in their average income and socioeconomic characteristics presented later. The respondents stayed an average of two days in the region and one day in the Santa Elena Preserve154. Their most common transportation means were public bus (47 %), rented car (10 %), and other like own car, walking, or a combination of the ones men-tioned before (42 %).
Table 6.8: Marital status, resident tourists, Santa Elena-Costa Rica, 1998 (N= 18)
married free union single
22 % 6 % 72 % N= number of cases
Source: Field survey results 1998. Because this is the residents’ sample, regarding the country of citizenship, most of them (88 %) are Costa Ricans, and 12 % Europeans - from Germany (6 %) and France (6 %). About their place of residence, 44 % are from Limón (country’s Atlantic coast), 22 % from San José (the capital), 22 % from Puntarenas, and the rest from different places of the country.
154 33 % also visited the Monteverde Preserve.
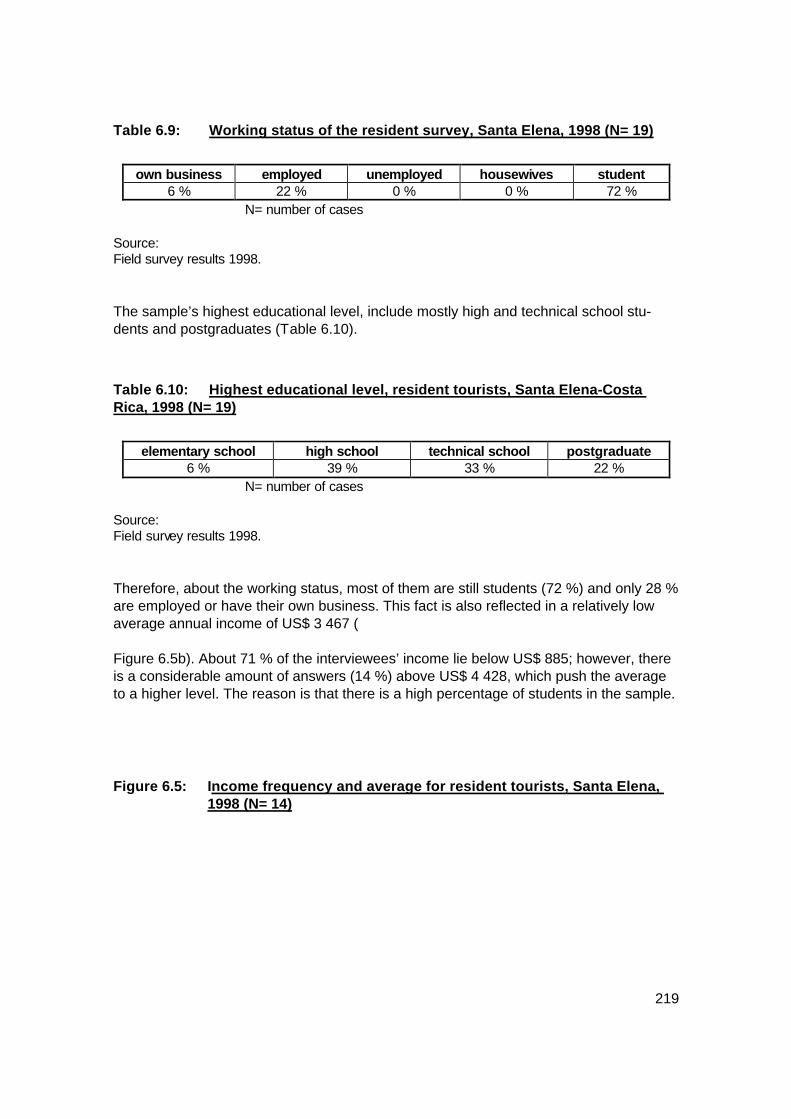
219
Table 6.9: Working status of the resident survey, Santa Elena, 1998 (N= 19)
own business employed unemployed housewives student
6 % 22 % 0 % 0 % 72 % N= number of cases
Source: Field survey results 1998. The sample’s highest educational level, include mostly high and technical school stu-dents and postgraduates (Table 6.10).
Table 6.10: Highest educational level, resident tourists, Santa Elena-Costa Rica, 1998 (N= 19)
elementary school high school technical school postgraduate
6 % 39 % 33 % 22 % N= number of cases
Source: Field survey results 1998. Therefore, about the working status, most of them are still students (72 %) and only 28 % are employed or have their own business. This fact is also reflected in a relatively low average annual income of US$ 3 467 ( Figure 6.5b). About 71 % of the interviewees’ income lie below US$ 885; however, there is a considerable amount of answers (14 %) above US$ 4 428, which push the average to a higher level. The reason is that there is a high percentage of students in the sample.
Figure 6.5: Income frequency and average for resident tourists, Santa Elena, 1998 (N= 14)
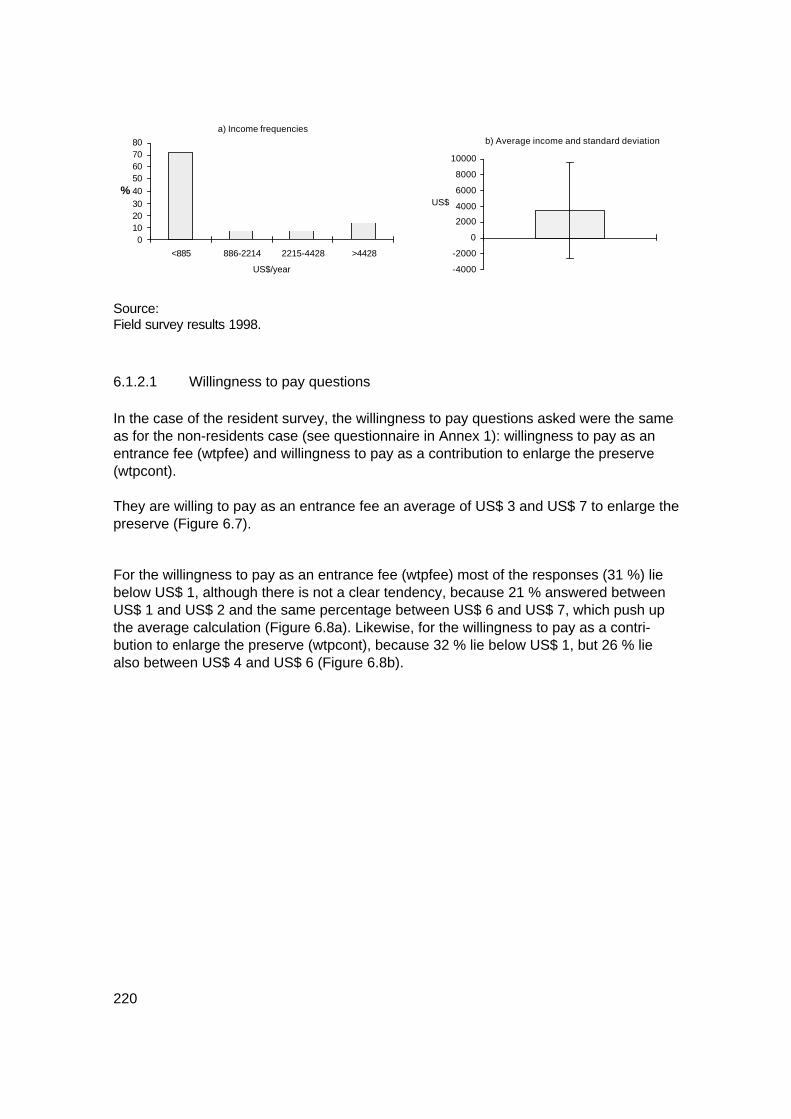
220
a) Income frequencies
01020304050607080
<885 886-2214 2215-4428 >4428
US$/year
%
b) Average income and standard deviation
-4000
-2000
0
2000
4000
6000
8000
10000
US$
Source: Field survey results 1998.
6.1.2.1 Willingness to pay questions In the case of the resident survey, the willingness to pay questions asked were the same as for the non-residents case (see questionnaire in Annex 1): willingness to pay as an entrance fee (wtpfee) and willingness to pay as a contribution to enlarge the preserve (wtpcont). They are willing to pay as an entrance fee an average of US$ 3 and US$ 7 to enlarge the preserve (Figure 6.7).
For the willingness to pay as an entrance fee (wtpfee) most of the responses (31 %) lie below US$ 1, although there is not a clear tendency, because 21 % answered between US$ 1 and US$ 2 and the same percentage between US$ 6 and US$ 7, which push up the average calculation (Figure 6.8a). Likewise, for the willingness to pay as a contri-bution to enlarge the preserve (wtpcont), because 32 % lie below US$ 1, but 26 % lie also between US$ 4 and US$ 6 (Figure 6.8b).

221
Figure 6.7: Average and standard deviation for the willingness to pay questions, the resident survey, Santa Elena, 1998 (N= 19)
-5
0
5
10
15
20
wtpfee wtpcont
variable
US$
Note: wtpfee = willingness to pay as an entrance fee. wtpcont = willingness to pay as a contribution to enlarge the preserve.
Source: Field survey results 1998.
Figure 6.8: Frequency for the willingness to pay questions, the resident survey, Santa Elena, 1998 (N= 19)
a) Willingness to pay fee frequencies
05
1015
20253035
<1 1-2 >2-4 >4-6 >6-7 >7
US$
%
b) Willingness to pay contribution frequencies
05
101520253035
<1 1-2 >2-4 >4-6 >6-11 >11-20 >20
US$
%
Source: Field survey results 1998.

222
The answers to both questions were regressed against the socioeconomic characteris-tics of the respondents, to look for a model that could predict them (Table 6.11 and Table 6.12).
Specifically, we looked for a relationship of wtpfee and wtpcont with the following vari-ables: income, age, years of education, sex, employment status, country of citizenship, marital status, and the ranking of impacts (employment, forest protection, cultural shock, income generation, price of land, and trail deterioration).
Table 6.11: Regression analysis for the willingness to pay as an entrance fee question, the Santa Elena resident survey 1998
MODEL SUMMARY
R R Square Adjusted R Square Std. Error of the Estimate .569a .324 -.063 883.33
ANOVAb Source Sum of Squares df Mean Square F Sig.a
Regression 2 613 897 4 653 474.15 .837 .543a Residual 5 461 879 7 780 268.46
Total 8075776 11 COEFFICIENTSb
Variable Unstandardized Coefficients
Standardized Coefficients
t Sig.
B Std. Error Beta (Constant) 3 762.058 1 868.683 -- 2.013 .084 income 8.220 5.715 1.048 1.438 .194 education -6.066 103.336 -.025 -.059 .955 sex 386.109 601.218 .204 642 .541 age -168.720 116.112 -1.204 -1.453 .190
a Predictors: (Constant), income, years of education, sex, and age. b Dependent Variable: willingness to pay as entrance fee.
Source: Field survey results 1998. In the wtpfee case, the R-squared, the F-test, and the t-value show no significant rela-tions between the predictors and the dependent variable. Conversely, in the wtpcont case, a significant F test (.004) for the whole model and a significant t-test for the income variable (.009) is shown. However, the residuals from both models show a significant deviation from a normal distribution - so that the F and T tests for non-zero coefficients are not valid.

223
Table 6.12: Regression analysis for the willingness to pay to enlarge the preserve question, the Santa Elena resident survey 1998
MODEL SUMMARY
R R Square Adjusted R Square Std. Error of the Estimate .908 .825 .738 1 563.39
ANOVA Source Sum of Squares df Mean Square F Sig.
Regression 9.2E+07 4 23 068 763 9.438 .004 Residual 2.0E+07 8 2 444 174.5 Total 1.1E+08 12
COEFFICIENTS Variable Unstandardized
Coefficients Standardized Coefficients
t Sig.
B Std. Error Beta (Constant) 5 053.244 3 306.862 -- 1.528 .165 income 33.540 9.818 1.556 3.416 .009 education 117.895 182.868 .150 .645 .537 sex 494.401 952.229 .078 .519 .618 age -322.997 205.261 -.815 -1.574 .154
a Predictors: (Constant), income, years of education, sex, and age. b Dependent Variable: willingness to pay as a contribution to enlarge the preserve.
Source: Field survey results 1998. In order to try to find normality of residuals, exclusion of outliers, natural logarithmic (ln) transformation of the dependent variable, and stepwise regressions were also carried out for both dependent variables with no success, in an extended model, which additionally included the following variables: • employment status, which differentiates between the people employed and with their
own business from the others (mainly students and some unemployed); • marital status (two variables), which differentiates between the married people and
the others, and between the single people and the others; and • the ranking of impacts from Table 6.13 (forest conservation, local employment, in-
come generation, trials degradation, land value, and cultural shock).
In summary, these results mean that the models are not only no significant, but cannot be further improved. Then, finally, a non-parametric (Spearman-Rho) correlation test between the respective variables in both cases was performed, with not significant re-sults155. 155 For the willingness to pay as an entrance fee and to enlarge the preserve questions no other variable showed a higher significance than income (0.178 and 0.118 respectively).

224
Furthermore, the questionnaire asked the interviewees some other willingness to pay questions, not related to the value of the preserve, with the following results: they spent on average US$ 40 on this trip156 and will be willing to spend US$ 28 on this and other additional services157, such as horse rental, zoo, and slide show.
6.1.2.2 Opinion of respondents toward the project The sample recommended to carry out some activities that will make tourism more at-tractive, which are related to the willingness to pay for services questions. These serv-ices are the following: museum (48 %), zoo (48 %)158, souvenir’s shop (24 %), and slide show (19 %). Their most important current activities in the preserve are hiking 62 %, bird and animal watching 43 %, and rest & relaxation and research 10 %. The questionnaire also require the people to rank, according to their importance, the following impacts from the preserve (Table 6.13): a) forest conservation (the most important), and rank first as in the non-resident sample,
probably because of the environmental consciousness of the people toward pristine forest areas;
a) cultural shock, because in such a remote area there exists a lot of influence of the modern world, such as a lot of advertisements of the possibility of using Internet and such a diversity of hotels - from very beautiful and expensive to typical and in-expensive -;
a) higher land value, because the price of land is high and advertised in U.S. dollars, which is not normally done in Costa Rica;
a) income generation and source of employment, because the commercial activity is evident; and
a) the least important one, trail degradation, because there is not a really impact in the preserve, if we considered that less than 5 % of it is used with this purpose159.
156 In average room US$ 24, souvenirs US$ 6, transportation US$ 12, gasoline US$ 1, food US$ 22, and others US$ 104. 157 In average hotel US$ 10, restaurant US$ 9, horse-rental US$ 1, zoo US$ 1, slide show US$ 0.37, other US$ 31. 158 Although a zoo is a controversial issue, it could be done in a natural way, like the birds’ zoo that works in Costa Rica (Zoo-ave), which a priori has obtained very good critics. This could also enhance the tourists experience by providing them what they are looking for in their trip to this region: animal and bird watching. 159 Less than 5 % according to the Preserve’s administration.

225
Table 6.13: Ranking of impacts due to the project, resident tourists, Santa Elena-Costa Rica 1998 (in percentage)
Impact
Perception cultural shock N=10
forest
N=14
income
N=13
land
N=9
trails
N=10
employment
N=12 the most important (5) important (4) regular importance (3) less important (2) the least important (1)
Weighted sum
60 20 0 0
20 4.0
93 0 0 0 7
4.7
38 23 8 8
23 3.5
56 11 22 11 0
4.1
30 0
10 10 50 2.5
33 17 25 0 25 3.3
Note: Weighted sum = Σ perception * percentage, for every impact. N= number of cases
Source: Field survey results 1998. Finally, all the resident tourists interviewed will like to visit the preserve in the future and would recommend it to their friends. And, for 81 % of the sample this was their first trip to Santa Elena. However, 38 % expressed to have shown support for the project, that means that some of them knew about it before.
6.1.3 The Santa Elena community The target population in the Santa Elena community is comprised of 249 households160 and the sample of 131 interviews, from which 52 % are males and 48 % females.
6.1.3.1 Socioeconomic characteristics Because the average age of the sample is 33 years, it was expected a high percentage of married people. In fact, 56 % of the people interviewed are married and 32 % single (Table 6.14).
160 The target population was calculated according to the number of households in the surrounding area (DGEC 1998).

226
Table 6.14: Marital status distribution, the Santa Elena community-Costa Rica 1998 (N= 131)
married single widow divorced
56 % 32 % 8 % 4 % N= number of cases
Source: Field survey results 1998. The sample’s average number of children per household is two and the average years of residence in this area is 22. Furthermore, because this is an area highly visited by foreign tourists and colonized by Quakers from the United States about 40 years ago, it was expected that not all the people living here were nationals, as confirmed by the following distribution: 91 % Costa Ricans, 2 % are Americans, and 1 % possesses both the Costa Rican and American citizenship (the rest have different countries of citizenship).
Table 6.15: Highest educational level, the Santa Elena community-Costa Rica 1998 (N= 130)
less than
elementary elementary
school high
school technical school
university bachelor
post-graduate
3 % 35 % 33 % 13 % 14 % 2 % N= number of cases
Source:
Field survey results 1998.
Most of the sample has finished elementary school or high school and only 3 % has no formal education or has not finished elementary school (Table 6.15). It is also noticeable that although this is a rural area, there is a high relative percentage of university graduates (bachelor and post-graduates) of 16 %. Regarding the working status, due to the high tourism visitation to the region and the fact that 60 % of the inhabitants worked in tourism related activities, most of the sample (73 %) are employed or have their own business (Table 6.16) and only 2 % are unemployed, which is under the national unemployment rate of 6 %.

227
Table 6.16: Working status, the Santa Elena community-Costa Rica,1998 (N=129)
own business employed unemployed housewives student
37 % 36 % 2 % 18 % 7 % Source: Field survey results 1998. Furthermore, the sample’s annual average income is US$ 4 130161 (Figure 6.9b), which is 80 % more than the national minimum yearly salary of US$ 2 292162. About 65 % of the interviewees’ income lie under US$ 4 400 per year (Figure 6.9a).
Figure 6.9: Income frequency and average for the Santa Elena community 1998 (N= 128)
a) Income frequencies
0
1020
30
40
<2.2 2.2-4.4 4.4-6.6 >6.6
thousand US$/year
%
b) Average income and standard deviation
010002000300040005000600070008000
Source: Field survey results 1998.
161 Calculated by using an exchange rate of ¢ 271 (colones) per U.S. dollar. 162 This minimum salary was calculated using as base the minimum monthly salary -minimorum- of ¢ 45 240, US$ 168 (MEIC 1997) and adjusting it with the accumulated index of minimum nominal salaries (for the period December 1997 to October 1998) from the Costa Rican Central Bank of 14.03 %.

228
6.1.3.2 Willingness to pay questions In the case of the community survey, the following two willingness to pay questions were asked (see questionnaire in the annex): willingness to pay as a contribution to enlarge the preserve (wtpcont) and willingness to accept to give it up (wta). The average willingness to pay response, in order to enlarge the preserve was of US$ 35 per year, which is relatively high (Figure 6.9). The reason is probably that the community feel the preserve as own and benefit from it - because of the tourism activi-ties. Approximately 91 % of the willingness to pay answers lie under US$ 50 (Figure 6.10b).
Figure 6.10: Average and standard deviation for the willingness to pay and accept questions, the Santa Elena community 1998 (N= 126 and N= 117 respectively)
-100
0
100
200
300
400
500
wta wtp
variable
US$
Source: Field survey results 1998.
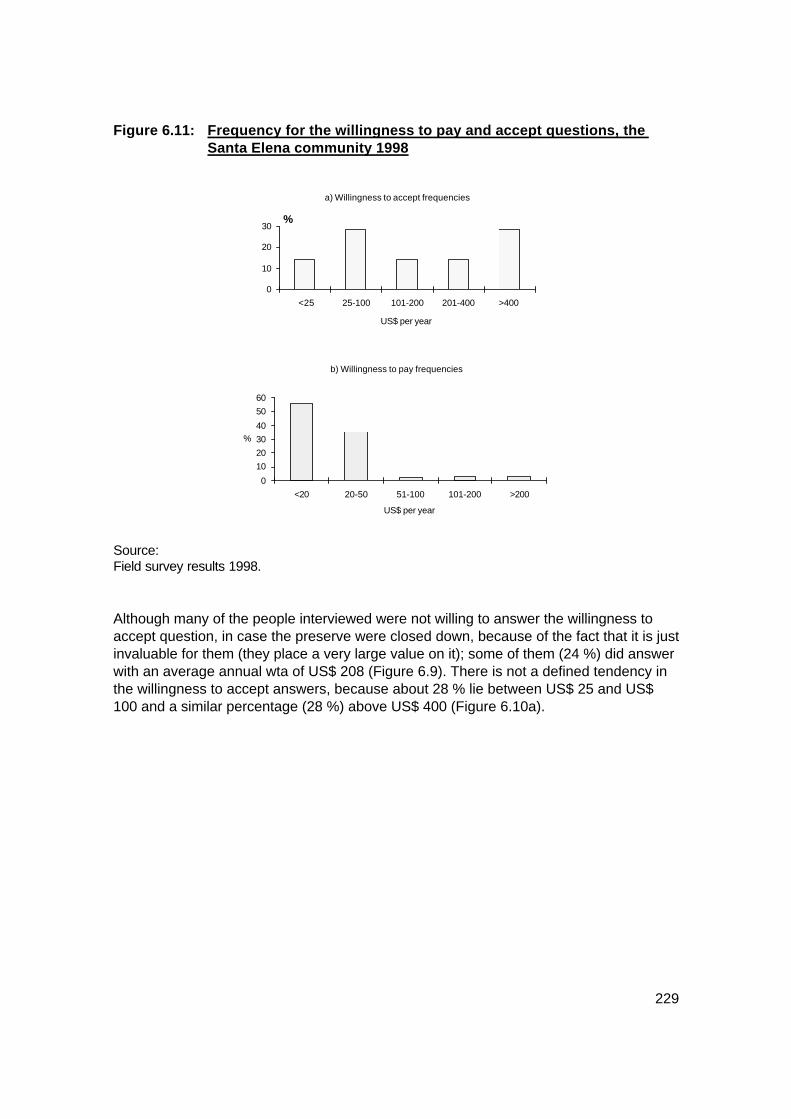
229
Figure 6.11: Frequency for the willingness to pay and accept questions, the Santa Elena community 1998
a) Willingness to accept frequencies
0
10
20
30
<25 25-100 101-200 201-400 >400
US$ per year
%
b) Willingness to pay frequencies
0
10203040
5060
<20 20-50 51-100 101-200 >200
US$ per year
%
Source: Field survey results 1998. Although many of the people interviewed were not willing to answer the willingness to accept question, in case the preserve were closed down, because of the fact that it is just invaluable for them (they place a very large value on it); some of them (24 %) did answer with an average annual wta of US$ 208 (Figure 6.9). There is not a defined tendency in the willingness to accept answers, because about 28 % lie between US$ 25 and US$ 100 and a similar percentage (28 %) above US$ 400 (Figure 6.10a).
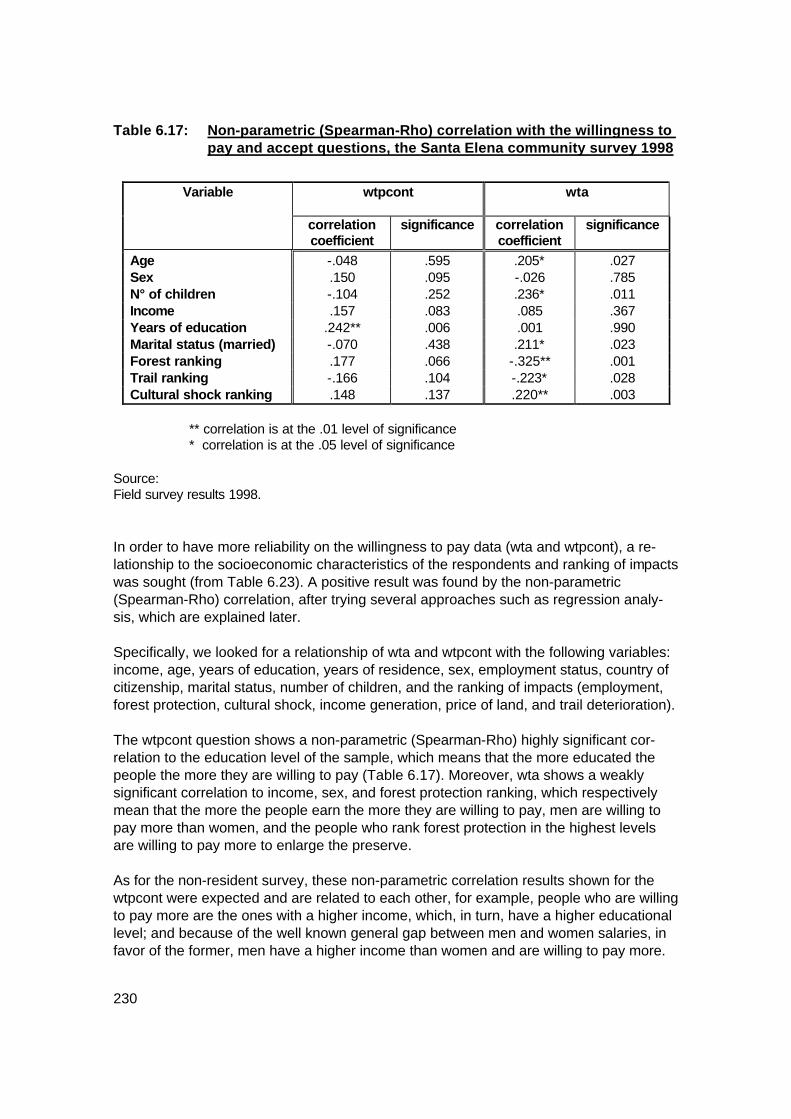
230
Table 6.17: Non-parametric (Spearman-Rho) correlation with the willingness to pay and accept questions, the Santa Elena community survey 1998
Variable wtpcont
wta
correlation
coefficient significance correlation
coefficient significance
Age -.048 .595 .205* .027 Sex .150 .095 -.026 .785 N° of children -.104 .252 .236* .011 Income .157 .083 .085 .367 Years of education .242** .006 .001 .990 Marital status (married) -.070 .438 .211* .023 Forest ranking .177 .066 -.325** .001 Trail ranking -.166 .104 -.223* .028 Cultural shock ranking .148 .137 .220** .003
** correlation is at the .01 level of significance * correlation is at the .05 level of significance Source: Field survey results 1998. In order to have more reliability on the willingness to pay data (wta and wtpcont), a re-lationship to the socioeconomic characteristics of the respondents and ranking of impacts was sought (from Table 6.23). A positive result was found by the non-parametric (Spearman-Rho) correlation, after trying several approaches such as regression analy-sis, which are explained later. Specifically, we looked for a relationship of wta and wtpcont with the following variables: income, age, years of education, years of residence, sex, employment status, country of citizenship, marital status, number of children, and the ranking of impacts (employment, forest protection, cultural shock, income generation, price of land, and trail deterioration). The wtpcont question shows a non-parametric (Spearman-Rho) highly significant cor-relation to the education level of the sample, which means that the more educated the people the more they are willing to pay (Table 6.17). Moreover, wta shows a weakly significant correlation to income, sex, and forest protection ranking, which respectively mean that the more the people earn the more they are willing to pay, men are willing to pay more than women, and the people who rank forest protection in the highest levels are willing to pay more to enlarge the preserve. As for the non-resident survey, these non-parametric correlation results shown for the wtpcont were expected and are related to each other, for example, people who are willing to pay more are the ones with a higher income, which, in turn, have a higher educational level; and because of the well known general gap between men and women salaries, in favor of the former, men have a higher income than women and are willing to pay more.

231
Additionally, people who ranked forest protection in the higher levels, show a higher environmental consciousness, which in turn, is reflected in their wtpcont. For the willingness to accept question, if we rearrange the responses according to their rank order, that means, assign the invaluable answers the highest wta response plus one (US$ 450 + 1), then we obtain the results shown in Table 6.17 from the non-parametric correlation test. Specifically, this test for the wta variable shows a non-parametric correlation to age, marital status (married), and forest, trail degradation, and cultural shock ranking of im-pacts. It means, respectively, that the older, as well as, the married people require a higher minimum wta quantity in order to account for loosing the preserve. Likewise, the lower the people ranked in the lowest levels forest protection and trail degradation the higher was the wta quantity, but, the higher the people cultural shock the higher was their wta quantity.
Figure 6.12: Scatterplot for the natural logarithm of willingness to pay (lnwtpcont) vs. income level. The Santa Elena community survey 1998
income (thousands colones per month)
5004003002001000-100
LNW
TP
6
4
2
0
-2
-4
Source: Field survey results 1998.

232
Figure 6.13: Scatterplot for the natural logarithm of willingness to pay (lnwtpcont) vs. years of education. The Santa Elena community survey 1998
EDUCYEAR
2019
1817
1615
1413
1211
109
87
65
43
21
0
LNW
TP
6
4
2
0
-2
-4
Source: Field survey results 1998. From a policy perspective, these results could mean, on the one side, that the local ef-forts toward supporting the preserve should be directed toward the less educated people in order to gain more support. On the other side, the family oriented people place a higher value on the preserve (as shown in wta), which should be count as an investment for future generations.
The relationship between the natural logarithmic function of wtpcont with income level is depicted in Figure 6.11. There exist an increasing relationship with income, but even the natural logarithmic function is lower than proportional. Likewise, on the other side, the relationship between the natural logarithmic function of wtpcont with years of education is depicted in Figure 6.12. There exist a small connection between these two variables, which is shown in a higher level after 11 years of education.

233
Table 6.18: Regression analysis for the willingness to pay question, the Santa Elena community survey 1998
MODEL SUMMARY
R R Square Adjusted R Square Std. Error of the Estimate .0163a .027 -.016 34.8357
ANOVAb Source Sum of Squares df Mean Square F Sig.
Regression 3 799.394 5 759.879 .626 .680a Residual 139 555.2 115 1 213.523 Total 143 354.6 120
COEFFICIENTSb Variable Unstandardized
Coefficients Standardized Coefficients
t Sig.
B Std. Error Beta (Constant) -2.883 15.242 -- -.189 .850 age -9.48E-02 .297 -.033 -.319 .750 sex 8.524 7.075 .124 1.205 .231 income -1.38E-02 .053 -.028 -.259 .796 years of residence .304 .248 .125 1.228 .222 education .477 .953 .053 .500 .618
a Predictors: (Constant), age, sex, income level, years of residence in the region, and years of education.
b Dependent Variable: willingness to pay as a contribution to enlarge the preserve.
Source: Field survey results 1998. Although both of these figures denote limitations in order to carry out a successful re-gression analysis, the answers to both willingness to pay questions were also regressed against some of the socioeconomic characteristics of the respondents, to look for an equation that could predict them (Table 6.18 and Table 6.19). In both cases, the R-squared, the F-test, and the t-value show no significant relation between the predictors and the dependent variables - willingness to pay and willingness to accept respectively. The residuals show a significant deviation from a normal distribution - so that the F and T tests for non-zero coefficients were not valid.

234
Table 6.19: Regression analysis for the willingness to accept question, the Santa Elena community survey 1998
MODEL SUMMARY
R R Square Adjusted R Square Std. Error of the Estimate .200 a .040 -.004 68.81
ANOVAb Source Sum of Squares df Mean Square F Sig.
Regression 21 301.387 5 4 260.277 .900 .484a Residual 511 365.6 108 4 734.866 Total 532 666.9 113
COEFFICIENTSb Variable Unstandardized
Coefficients Standardized Coefficients
t Sig.
B Std. Error Beta (Constant) 51.930 30.836 -- 1.684 .095 age -.857 .590 -.155 -1.451 .150 sex 6.451 14.490 .047 .445 657 income -.101 .106 -.106 -.954 .342 years residence -.265 .503 -.055 -.526 .600 education level .118 1.930 .007 .061 .951
a Predictors: (Constant), age, sex, income level, years of residence in the
region, and years of education. b Dependent Variable: willingness to accept.
Source: Field survey results 1998. Furthermore, in order to try to fit the data in a normal distribution, the exclusion of outliers and the natural logarithmic (ln) transformation of the dependent variables were tried with no success, in an extended model, which additionally included the following variables: • employment status, which differentiates between the people employed and with their
own business from the others (mainly students and some unemployed); • marital status (two variables), which differentiates between the married people and
the others, and between the single people and the others; and • the ranking of impacts - forest conservation, local employment, income generation,
trials degradation, and cultural shock - (see Table 6.23). In summary, these results mean that the models are not only no significant, but cannot be further improved.
6.1.3.3 Sample’s opinion toward the project The community had positive expectations about the preserve, especially related to tourism attraction, then, 69 % agreed to open it up - before the project -; but, only 40 %

235
showed effectively their approval somehow163. The reason of these positive expectations lie probably in the fact that at the time, most of the people worked in agricultural related activities and probably were not sure if to become entrepreneurs in the tourism activity. Nowadays, the survey shows that 57 % of the sample benefit directly from the existence of the preserve, and in turn, is another reason why the sample is willing to pay a relatively high average quantity of US$ 35 per year in order to enlarge the preserve. The people interviewed also believe that the average stay of the tourists in the region is three days and the tourists’ most important activities inside the preserve are bird watching (27 %), hiking (21 %), animal watching (20 %), and research (20 %); and out-side the preserve horse riding (64 %), research (21 %), rest & relaxation (18 %), and hiking (10 %). With respect the community sample’s feeling toward the positive and negative impacts due to opening of the preserve, the main results are following described.
Table 6.20: Perception with respect to the project’s impact on employment, roads, educational centers, and visitation, the Santa Elena community-Costa Rica 1998 (in percentage) (N= 131)
Perception employment
N=86
roads
N=87
educational centers N=85
visitation
N=85 before after before after before after before after
excellent (5) good (4) regular (3) bad (2) very bad (1)
Weighted sum
1 5 27 62 5
2.4
7 78 13 1 1
3.9
0 0 2
13 85 1.2
1 2 12 10 75 1.4
0 12 37 46 5
2.6
5 64 29 1 1
3.7
1 7 28 59 1
2.4
8 87 4 0 1
4.0
Impact severity 1.5 0.2 1.1 1.6 Note: Weighted sum = Σ perception * percentage, for every impact. Impact severity = Weighted sum after - Weighted sum before.
N= number of cases Source: Field survey results 1998. • The perception’s tendency is that employment and visitation have improved from bad
- before the project - to good164 - after the project - (Table 6.20), which was expected,
163 Through assisting to meetings, manifestation, or any other way.

236
because after the preserve opened up there were people interested in coming to the region and also because tourism visitation increased in the country (see Chapter 4 Section 4.2.1); furthermore, more visitation brings more employment.
• About the educational centers, the sample perceives a change from regular to good,
because the government has invested in new infrastructure for the local primary and high schools.
• While the perception about roads shows a little increment, but continue in the very
bad category, because it is noticeable that there is no improvement (no asphalt) until now.
Table 6.21: Perception with respect to the project’s impact on pollution, family income, and community infrastructure, the Santa Elena community-Costa Rica 1998 (in percentage) (N= 125)
Perception pollution
N=84
family income
N=84
other community infrastructure
N=83 before after before after before after
excellent (5) good (4) regular (3) bad (2) very bad (1)
Weighted sum
77 7 5 6 1
4.4
12 26 51 0 5
3.2
1 4
25 68 2
2.3
7 76 16 1 0
3.9
0 2
23 49 25 2.0
5 48 30 10 7
3.3
Impact severity -1.2 1.6 1.3 Note: Weighted sum = Σ perception * percentage, for every impact. Impact severity = Weighted sum after - Weighted sum before.
N= number of cases Source: Field survey results 1998. • With respect to pollution, the tendency is toward deterioration - from good to regular
(Table 6.21), mainly because the people was used to see only few cars, but now with more visitation the activity has increased (see Table 6.27 ahead); however, Santa Elena is still a rural town.
164 In order to simplified the qualitative categorization of the sum of the weighted average of the impacts, it is assumed that a decimal quantity higher than 0.5 pertains to the following higher category and lower than 0.5 to the lower one.

237
• Conversely, family income and other community infrastructure (such as the health and social centers) have improved - from bad to regular. The former because the tourism activity has increased the demand for services, such as hotels, restaurants, demand for agricultural products, entertainment activities (such as horse and bicycle riding), grocery and souvenirs shops, and banks, among others. The latter mainly because of more governmental investment.
Table 6.22: Perception with respect to the project’s impact on pollution, family income, and community infrastructure, the Santa Elena community-Costa Rica 1998 (in percentage) (N= 123)
Perception forest protection
N=83 land value
N=81 before after before after
excellent (5) good (4) regular (3) bad (2) very bad (1)
Weighted sum
5 31 36 28 0
3.1
43 34 22 1 0
4.2
6 5
27 54 8
2.5
72 20 4 2 2
4.6
Impact severity 1.1 2.1 Note: Weighted sum = Σ perception * percentage, for every impact. Impact severity = Weighted sum after - Weighted sum before.
N= number of cases Source: Field survey results 1998.
• There is a perception that both forest protection165 and land value have improved after the project, although the latter with special strength (Table 6.22). Forest pro-tection improved due to the security that the Santa Elena preserve is not for sale with commercial purposes (wood extraction); and land value because there is more demand for land, especially within the town area, due not only to the tourism activity, but to an increment in the local population.
165 In the questionnaire was called flora and fauna.

238
Table 6.23: Ranking of impacts due to the project, the Santa Elena community-Costa Rica 1998 (in percentage)
Impact
Perception employment
N=109
forest protection
N=109
cultural shock N=103
income generation
N=108
trails
N=98 the most important (5) important (4) regular importance (3) less important (2) the least important (1)
Weighted sum
27 49 16 6 2
3.9
87 4 1 2 6
4.6
66 10 6 8
10 4.1
17 34 39 4 6
3.5
22 34 24 13 7
3.5
Note: Weighted sum = Σ perception * percentage, for every impact.
Source: Field survey results 1998. The questionnaire also asked people to rank the following impacts, due to the project, according to their importance (Table 6.23). All the five impacts described are meaningful, but there is a tendency to rank first the ones which are more important to the sample: a) The most important (positive) impact is forest conservation, which was expected,
because of the high environmental consciousness of the people of the town, who would like to see more forest conservation in the area and look at the project as a good example to promote it.
b) The second most important one (positive and negative) is cultural impact due to tourism, because locals are exposed to other cultures, which make them think more openly and seek more education, but at the same time, make them loose some of the traditional, remote, and peaceful living of before (for example with the establishment of bars and a discotheque).
c) The third one (positive) with regular importance is employment, because of the rea-sons expressed before (the tourism activity).
d) And finally the last ones are income generation due to tourism-related businesses (positive), and trails degradation in the tourism areas of the preserve (negative). The last one is not considered very significant, because, although many people walk through the preserve trails, it is only a part of the whole preserve, which is used with this purpose166 and provides the mean to conserve it.
Finally, the respondents required the following services as necessities in order to im-prove the positive impacts of the project and reach a higher standard of living: a) better roads (45 %), because they have no asphalt; b) better bus service (22 %), because there is only two buses per day, which serve the
locals;
166 Less than 5 % according to the Preserve’s administration.

239
c) better administration and representatives for the preserve (15 %), because there has been administrative problems, such as difficulty to agree in the type of investments to carry out within the preserve;
d) and, more publicity and signs (9 %), in order to attract more visitors.
6.1.4 Surveys’ conclusions The average annual salary from the Santa Elena community (US$ 4 130) is higher than the Costa Rican minimum annual salary of US$ 2 292/year167 and above the maximum annual salary of US$ 3 658168 to be considered as poor in the rural area169. However, because this is an average salary for the community, that means that there may still be families under the poverty line. Most of the tourists interviewed are currently students, although in the Santa Elena community most of the sample is employed or possess their own business170. This result is closely linked to the age and, in turn, to the marital status of the samples, which shows that most of the tourists’ samples are composed of single people, while most of the sample from the community is comprised of married ones. Moreover, this is the reason why the average income for the community of Santa Elena is higher than that from the residents’ tourists, which is the opposite than expected. With respect to the willingness to pay as an entrance fee and to enhance the preserve, it is obviously higher for the non-residents’ sample, due to the different standard of living of the United States and Europe if compared to Costa Rica. However, the community of Santa Elena showed the highest willingness to pay to enhance the preserve, which is probably due to their identification with it, sense of belonging, and benefits obtained from its existence (tourism related and positive externalities). Moreover, the following relationships were found, by using the non-parametric (Spear-man-Rho) correlation test: a) For the non-resident sample: The willingness to pay as an entrance fee responses
are related to the following variables: employment status, income level, citizenship, sex, occupation, and age. And, the willingness to pay as a contribution to enlarge the preserve is related to country of citizenship.
167 This minimum annual salary was calculated using as base the minimum monthly salary - minimorum - of ¢ 45 240 - US$ 168 - (MEIC, 1997) and adjusting it with the accumulated index of minimum nominal salaries - for the period December 1997 to October 1998 - from the Costa Rican Central Bank of 14.03 %. 168 This calculation is based on the maximum per person poverty income in the rural area, assuming five persons per family (LA NACIÓN DIGITAL 2000). 169 Salary which is not enough to fulfill the basic human necessities - i.e. food, shelter, clothing, education, and transportation - (LA NACIÓN DIGITAL 2000). 170 Only a small fraction (7 %) from the community’s sample are currently students.

240
From a policy perspective, these conclusions mean that the entrance price for non-residents could be increased (from US$ 6 to US$ 7) and publicity (for visiting the preserve) directed toward professionals from industrialized countries, especially from the United States and Europe, which are willing to pay more.
b) For the resident sample: no relationship was found. c) And, for the community sample: The willingness to pay as a contribution to enlarge
the preserve is related to educational level. And, there exists weakly relationships to income, sex, and forest ranking. For the willingness to accept question a relationship to the following variables was found: age, number of children, years of education, marital status, and forest protection, trail degradation, and cultural impact ranking.
From a policy perspective, these results mean, on the one side, that the local efforts toward supporting the preserve should be directed to the less educated people in order to gain more support. On the other side, the family oriented people place a higher value on the preserve (wta), which should be count as an investment for future generations.
However, it was not possible to construct a regression model to predict the willingness to pay answers of the questionnaires, because of non-linearity and non-normality con-straints. Other willingness to pay answers, not related to the valuation of the preserve, demon-strated that there are some activities, which could be provided to the visitors and for which they would be willing to pay, such as the following: horse rental, zoo, and a slide shows. The Santa Elena community tends to perceive most of the impacts after the project ini-tiation as positive. However, there are some that still remain at a very low level of im-provement or negative, such as roads and pollution. Roads are considered almost with no change before and after the project, at the very low level, because their surface has never been with asphalt. Pollution is perceived as deteriorating after the project from excellent to regular, most probably due to a higher visitation rate and in turn more transportation activity; although Santa Elena is still a rural town, which means that this activity and the pollution related are still low. Furthermore, although in general the Santa Elena community agreed with the project’s construction (69 %), only 40 % of them feel there were asked or participated in order to carry out this project, which brings into consideration the issue of local participation, which means that the more people supporting the project the more acceptability and possibility of success it would have. Finally, the community required as necessities, better roads and better bus service within and outside the region, which would improve greatly their standard of living, by making an easier access to urban areas and would facilitate the entrance and selling of products, and health services, among others.

241
6.2 Evaluation of the Project Impacts Following the methodology presented in Chapter 4 Section 4.3.4, the impact matrix for the current project should be usually constructed based on the experts’ opinions about the impacts to occur due to the project. However, in the current case study, the ques-tionnaires’ results (Section 6.1) are taken instead. Then, the impacts’ evaluation is pre-sented in table 6.24. Most of the impacts and specifically their severity (significance) are calculated from the surveys’ results - based on Table 6.20, Table 6.21, and Table 6.22 -, by deducting the weighted sum before the project to that after the project (after-before) for every impact. Moreover, as suggested in Chapter 4, the significant impacts are defined to be those which significance are up to 3, which in Table 6.24 means medium, high, and very high. Additionally, as clarified in the same Chapter 4, “small (no significant) impacts occurring many times to the same stakeholder could also determine their significance”, then, by looking at the vertical sum of the impacts, it is possible to notice that many small (below 4) impacts could be causing a significant impact to the community171. Then, in this case, as many impacts as possible should be valued and taken into account in the NPV calculation. However, in the current study only those with available primary and/or secondary information are considered. In the case of forest protection, which impact was considered - by the community sam-ple’s perception - to be +1 (from regular to good) in Table 6.22, is re-valued to be +5, according to the sample ranking of impacts presented in Table 6.23 and reconfirmed by the opinions of the tourists’ samples (Table 6.8 and Table 6.13). The reason is that the opinions given by the community in Table 6.22 were based in a comparison of forest protection before and after the project and the pristine forest existed before the project; however, if the project would have not been carried out, the forest in its natural state would have most probably disappeared, because its alternative and most common use is wood extraction, which means that the comparison should be against no forest at all.
171 If subtracting the significant impacts (up to 3) the sum would be 9.

242
Table 6.24: Impact analysis matrix for the Santa Elena Rain Forest Project
Category of Description Stakeholder Total
Impacts Community social .Roads
.Educational centers
.Other infrastructure
.Employment
+0 LO +1 PLLtO +1 PLLtO + 2 PLLtO
+4
environmental .Forest protection .Pollution
+5 PRLtRnDCO -1 PLLtRiO
+4
economic .Visitation (entrance fee) .Income .Land Value
+ 2 PLLtO + 2 PLLtO + 2 PLLtO
+6
Total +14 where: sign severity temporality location duration reversibility stage
- = negative impact + = positive impact 1= very low 2= low 3= medium 4= high 5= very high T= temporary P= permanent L= local R= regional N= national I= international S= short-term M= medium-term Lt= long-term Rn= natural reversibility Ri= induce reversibility I= irreversible D= project design C= project construction O= project operation
Source: The author. The severity of the impact on forest protection is even higher as perceived by the community and imply many valuable aspects, which can be simultaneously present, such as existence, ecotourism, environmental services (water production, and CO2 absorption among others), sustainable agriculture, extractivism, and bioprospection172 (VOGEL 1996). In the present case study, the impacts to be taken into account in the NPV calculation according to the available primary and secondary data are then following presented. a) Forest protection (total economic value): • Non-use and direct use value (see Glossary), only partly, by considering that to the
community, calculated by multiplying the average annual willingness to accept of the community survey (a measure of the existence value of the forest) by the number of inhabitants in the Santa Elena Town (see Section 6.1.3 and the survey to the community in Annex 1 question # 15). But, not considering the existence value to the rest of the Costa Rican society.
172 The revenues obtained through the industrial (pharmaceutical) use of biodiversity.
243
• Indirect use value (see Glossary) of water production and overflow control (envi-ronmental services), by considering a US$ 5 per hectare according to CARRANZA 1996. The study considers the inverse proportionality relationship between water overflow and forest coverage, in other words, forests retain more water than pas-tures for example; and the proportionality relationship between forest coverage and water quality, which means that the domestic, agricultural, and hydroelectric uses of water receive a positive impact due to forests. Furthermore, the study uses the following valuation methodologies in order to account for the water production and overflow control impacts of forests: productivity changes (for example for agriculture and hydroelectric purposes) and cost avoidance (such as restoration, prevention, and replacement costs).
b) Visitation (ecotourism), by considering the absolute quantity of annual visits to the
preserve and their respective entrance fee for the owner and stand alone perspec-tive, and the willingness to pay of national visitors for the society perspective.
c) Employment, only partly, by considering the people directly employed in the pre-
serve, but not the additional opportunities created, in the region and/or country, due to the additional tourism due to this preserve.
d) And finally, income, partly, by considering the entrance fee, but not the one gener-
ated by its relationship to indirect employment and other tourists’ expenditures. Finally, Table 6.24 also serves the purpose of giving a non-monetary quantitative de-scription - of qualitative perceptions from the survey - of the performance of the project. The horizontal sums of impact, per category (social, environmental, and economic), suggests the relative importance of the project, which provides an idea, without monetary calculations, that the project’s effects in every category are positive. And, the vertical sums, which suggests that there is a positive impact on the community. Both, horizontal and vertical sums, suggest a project which possibly contributes to sustainable development, from the community perspective. This result is later compared to the monetary valuation of the project, the cost-benefit analysis.
6.3 Technical Appraisal (costs and benefits of the project) The reason to carry out the technical appraisal is to explain how the different items in the cost-benefit analysis are - monetarily - calculated and/or valued. Then, the detailed information is following presented, based basically on primary and secondary data, such as the accountability information from the Santa Elena Preserve’s administration, national statistics information, experts’ interviews, and the questionnaires’ results.
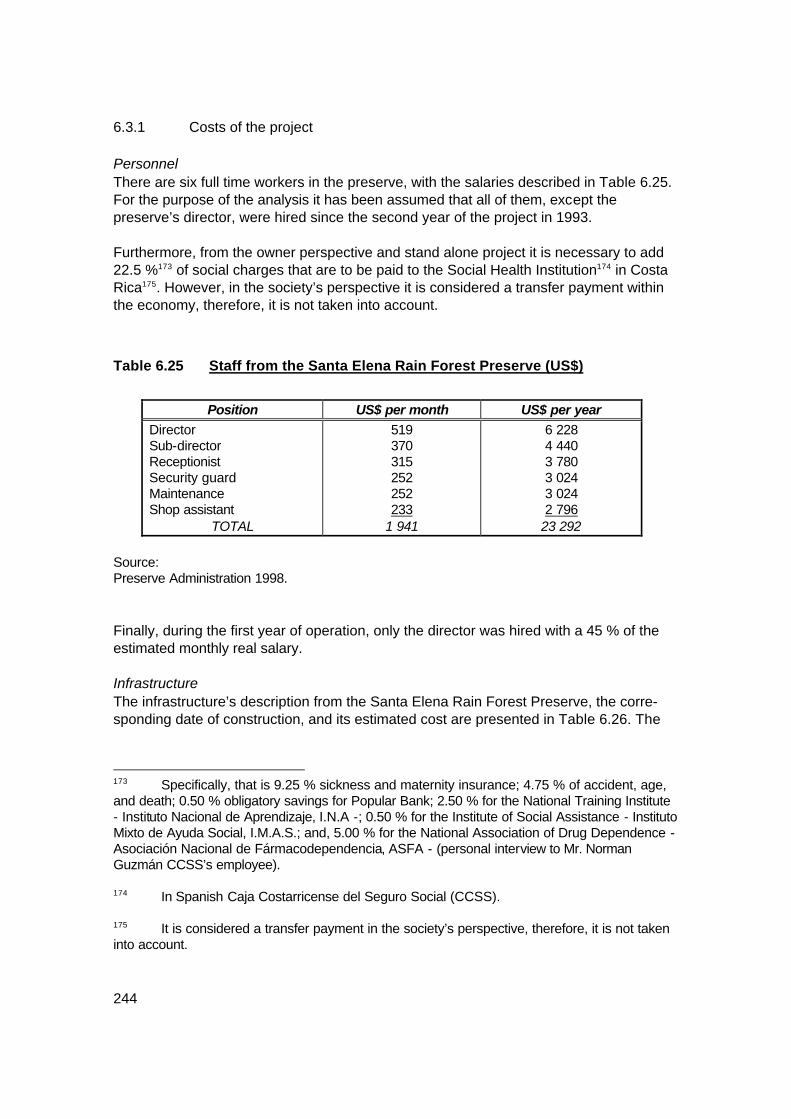
244
6.3.1 Costs of the project Personnel There are six full time workers in the preserve, with the salaries described in Table 6.25. For the purpose of the analysis it has been assumed that all of them, except the preserve’s director, were hired since the second year of the project in 1993. Furthermore, from the owner perspective and stand alone project it is necessary to add 22.5 %173 of social charges that are to be paid to the Social Health Institution174 in Costa Rica175. However, in the society’s perspective it is considered a transfer payment within the economy, therefore, it is not taken into account.
Table 6.25 Staff from the Santa Elena Rain Forest Preserve (US$)
Position US$ per month US$ per year
Director Sub-director Receptionist Security guard Maintenance Shop assistant
TOTAL
519 370 315 252 252 233
1 941
6 228 4 440 3 780 3 024 3 024 2 796
23 292 Source: Preserve Administration 1998. Finally, during the first year of operation, only the director was hired with a 45 % of the estimated monthly real salary. Infrastructure The infrastructure’s description from the Santa Elena Rain Forest Preserve, the corre-sponding date of construction, and its estimated cost are presented in Table 6.26. The
173 Specifically, that is 9.25 % sickness and maternity insurance; 4.75 % of accident, age, and death; 0.50 % obligatory savings for Popular Bank; 2.50 % for the National Training Institute - Instituto Nacional de Aprendizaje, I.N.A -; 0.50 % for the Institute of Social Assistance - Instituto Mixto de Ayuda Social, I.M.A.S.; and, 5.00 % for the National Association of Drug Dependence - Asociación Nacional de Fármacodependencia, ASFA - (personal interview to Mr. Norman Guzmán CCSS’s employee). 174 In Spanish Caja Costarricense del Seguro Social (CCSS). 175 It is considered a transfer payment in the society’s perspective, therefore, it is not taken into account.

245
costs of construction per square meter were calculated according to the construction index table176 from the Costa Rican Engineers and Architects’ Association (CFIA 1998).
Table 6.26 Infrastructure information for the Santa Elena Rain Forest Project
Type of
infrastructure description year of
construction estimated price (US$/per m2)
Storage room Visitor’s center Cabin for groups Cabin for staff Bathrooms Kiosk
7.70 m2 with fuel deposit 160 m2 with Café, handicraft and souvenirs’ store, reception, conference room, storage room, and activity room 30 m2 with 3 rooms, 10 beds, 3 closets, and washbasin 54 m2 with 4 rooms, 9 beds, 4 closets, washbasin, and kitchen 18 m2 with 4 toilettes, shower, and storage room 24 m2 with 6 wood seats and blackboard
1992
1992
1994
1994
1994
1998
163
186
200
200
200
163
Source: Preserve Administration 1998. Additionally, the infrastructure following described was also constructed or repaired by the project and their price was estimated by the project administration: • Trails: constructed in 1992, 12.2 km. of trails with an estimated cost of US$ 2 080,
which was donated by Youth Challenge International (YCI177). • A 3 miles road from Santa Elena to the preserve: repaired in 1992 to allow an easier
access, with an approximate cost of US$ 36 090 (including labor costs), which was donated by the Costa Rican Tourism Institution (ICT178).
176 This table has the approximate cost for some categories of construction depending upon their characteristics. These costs include materials, transport, workers, social charges, equipment renting, 5 % unexpected and 10 % administration expenses, and 10 % entrepreneur’s benefits. 177 A Canadian non-profit organization.

246
• Observation Tower: constructed in 1994, estimated total price US$ 3 145. Equipment The only equipment that belongs to the preserve is an electrical plant, which cost in 1992 was estimated in US$ 1 111 by the project administration, including 12 % selling tax for the owner and stand alone project perspectives. This tax is not taken into account in the society perspective, because it is a transfer payment within the economy. Opportunity cost of land The opportunity cost of forest land from the preserve was calculated through comparing it with the normal price of similar forest land, with commercial purpose (wood production), in the region, and assuming the following characteristics: rural land, with forest, without telephone connection (DGTD 1997). The preserve consist of 308 hectares of forest. The price was estimated, by the Architect Luis Alonso Flores, staff of the National Tax Bureau and the Plan of Municipal Values, to be US$ 741 per hectare. Operation expenses These expenses include office materials and equipment, food, fuel, transport, per diem, professional services, and others. The yearly real operation expenditure was estimated by the preserve’s administration to be US$ 3 244 in 1998. However, during the first year of operation it was calculated in 30 % of the real yearly estimation. Maintenance infrastructure Maintenance infrastructure refers to reparations and painting, and trails and road maintenance. Its yearly real cost was estimated by the administration in US$ 5 111 in 1998. The first year of operation of the preserve, there was no maintenance expendi-tures.
6.3.2 Revenues of the project Entrance fee The different entrance fees to the Santa Elena Preserve depending upon the visitor’s status are the following: non-residents US$ 6179, non-resident students US$ 3.5180, resi-dents US$ 1.11, and resident students US$ 0.74.
178 Stands in Spanish for Instituto Costarricense de Turismo. 179 Before 1996 it was US$ 5. 180 Before 1996 it was US$ 2.5.

247
Table 6.27: Monthly number of visitors to the Santa Elena Preserve. Monte Verde-Costa Rica, 1992-1999
Month/Year 1992 1993 1994 1995 1996 1997 1998 1999
January February March April May June July August September October November December
- -
56 486 148 152 352 298 202 263 431 711
678 795 883 701 438 480 817 668 539 537
1 015 1 304
1 670 1 800 1 710 1 612
752 850
1 115 881 432 731 775
1 456
1 716 1 398 1 820 1 587
825 1 134
932 915 622 415 789 985
1 326 1 356 1 551 1 247
651 622 671 725 319 446 795 805
1 190 1 035
890 744 390 378 768 746 465 375 585
1 106
1 237 1 493 1 324 1 011
699 664 804 616 265 217 473 562
875 1 097 1 321
- - - - - - - - -
TOTAL
3 099
8 855
13 784
13 138
10 514
8 672
9 365
3 293
Source: Santa Elena Preserve’s Administration. These prices, the number of visitors’ information showed in Table 6.27, and surveys’ information about the percentage of residents (9 %) and non-residents’ (91 %) tourists and the percentage of students respectively (72 % in the residents and 43 % in the non-residents’ samples) were used to calculate the yearly revenues through entrance fee charges. Furthermore, after 1998, it is assumed that the number of visitors do not change in the following years, but the total is adjusted for inflation. Store and café revenues The real revenues for souvenirs sales and lease of the Café are estimated by the ad-ministration in US$ 6 730 in 1998, which was adjusted for inflation for the other years (except in 1992, when the souvenirs’ shop and Café were not operating). Liquidation values It is assumed that all the infrastructure’s useful life is 30 years and the equipment’s useful life is 15 years. Therefore in order to calculate their liquidation values, the line depreciation method was used. The real value of land is assumed not to change and was only adjusted for inflation. Although, actually, the price of land is expected to increase due to a higher demand of forest and in general of land, due to urbanization, in the next years. The reason for not taking it into account is to avoid creating a feasible project just through a higher price of land.
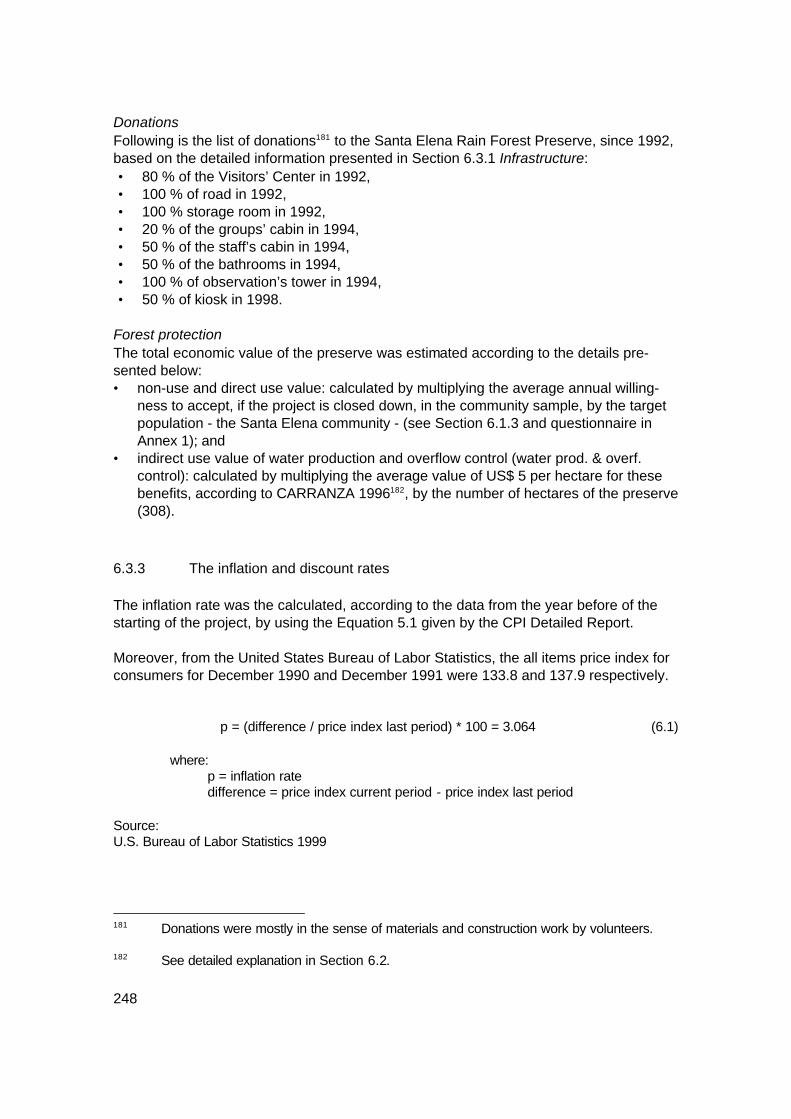
248
Donations Following is the list of donations181 to the Santa Elena Rain Forest Preserve, since 1992, based on the detailed information presented in Section 6.3.1 Infrastructure: • 80 % of the Visitors’ Center in 1992, • 100 % of road in 1992, • 100 % storage room in 1992, • 20 % of the groups’ cabin in 1994, • 50 % of the staff’s cabin in 1994, • 50 % of the bathrooms in 1994, • 100 % of observation’s tower in 1994, • 50 % of kiosk in 1998.
Forest protection The total economic value of the preserve was estimated according to the details pre-sented below: • non-use and direct use value: calculated by multiplying the average annual willing-
ness to accept, if the project is closed down, in the community sample, by the target population - the Santa Elena community - (see Section 6.1.3 and questionnaire in Annex 1); and
• indirect use value of water production and overflow control (water prod. & overf. control): calculated by multiplying the average value of US$ 5 per hectare for these benefits, according to CARRANZA 1996182, by the number of hectares of the preserve (308).
6.3.3 The inflation and discount rates The inflation rate was the calculated, according to the data from the year before of the starting of the project, by using the Equation 5.1 given by the CPI Detailed Report. Moreover, from the United States Bureau of Labor Statistics, the all items price index for consumers for December 1990 and December 1991 were 133.8 and 137.9 respectively.
p = (difference / price index last period) * 100 = 3.064 (6.1)
where: p = inflation rate difference = price index current period - price index last period
Source: U.S. Bureau of Labor Statistics 1999
181 Donations were mostly in the sense of materials and construction work by volunteers. 182 See detailed explanation in Section 6.2.

249
On the one hand, the corresponding costs and revenues of the different analysis will be adjusted in nominal terms, at the U.S. rate of inflation every year. This rate of inflation is used because it is assumed that the Costa Rican exchange rate adjusts for national inflation. In other words by using dollars instead of “colones” (the national currency), the local inflation and currency depreciation are avoid. Therefore, it is only necessary to include the U.S. inflation rate in the analysis, to reflect the nominal value of money (dollars in this case) to buy goods and services. On the other hand, the discount rate used to calculate the net present value (NPV) is calculated using Equation 5.2 and the real discounting rate for international projects (10 %) plus the U.S. rate of inflation calculated above. Then:
r = (1 + i) (1 + p) - 1 = (1+10 %) (1+3.064 %)-1 = 13.37 % (6.2)
where: r = nominal discount rate (13.37 %) i = real discount rate (10 %) p = inflation rate (3.064 %)
Source: According to JOHANSSON 1993.
6.4 Cost-benefit Analysis (CBA)
6.4.1 Stand alone project’s perspective The stand alone project perspective takes into account the revenues and costs that accrue to the project itself. Then, it analyzes the project from the perspective of a private investor, without considering donations or special treatments due to the non-profit nature of the Santa Elena Preserve. In other words, it looks if the project would be feasible for a common entrepreneur. Table 6.28 shows this perspective for the Santa Elena Rain Forest Project, which NPV is negative (US$ -121 621). This result tells that a rational entrepreneur would not invest on it. The reason is the high investments, especially during its first year of operation (1992), which make it non-feasible; although all the other years, except 1994, it shows a positive present net benefit. Therefore, the positive net benefits during the other years are not enough to compensate for the negative net benefits of years 1992 and 1994. Furthermore, on the one side, the most important operational benefit considered is the entrance fee, which for example for the year 1998 represented 86 % of the total benefits. On the other side, the most important operational cost considered is personnel expenses, which for the year 1998 represented approximately 70 % of the total costs. The gain in real land value through the years is not taken into account (only the differ-ence due to inflation in its liquidation value) in order not to make the project feasible for

250
this reason. In other words, in case the real gain in land value were significant, it would be better to buy the forest land without carrying out the project.
6.4.2 The owner perspective This perspective takes into consideration only the revenues and costs that accrue di-rectly to the owner of the project, in this case the Santa Elena community through its high school (Table 6.29). Donations and special treatments are not taken into consideration. In other words, the infrastructure donations and land are not taken into account. The land to carry out the project was given under a special condition to the Santa Elena community: a 50 years free lease contract was carried out from the Costa Rican government to the Santa Elena High School in order to manage the preserve. Therefore, land does not accrue to the owner of the project, nor its liquidation value. Likewise, infrastructure donations do not accrue to the owner, because are not a cash payment, nor its liquidation value, due to the fact that infrastructure cannot be separated from the land.

Table 6.28: Cost-benefit analysis for the Santa Elena Rain Forest Project, the stand alone project’s perspective (US$)
year 1992 1993 1994 1995 1996 1997 1998 1999 2000 2001
BENEFITS Entrance fee 11 304 32 300 50 280 47 923 47 919 39 524 42 683 43 990 45 338 46 727 Store & café's revenues 0 5 787 5 965 6 147 6 336 6 530 6 730 6 936 7 149 7 368 Liquidation values land 0 0 0 0 0 0 0 0 0 288 848 infrastructure 0 0 0 0 0 0 0 0 0 39 004 equipment 0 0 0 0 0 0 0 0 0 370
Total Benefits 11 304 38 088 56 244 54 071 54 255 46 054 49 413 50 927 52 487 382 318
COSTS Personnel 3 433 24 536 25 288 26 063 26 861 27 684 28 533 29 407 30 308 31 237 Land 220 144 0 0 0 0 0 0 0 0 0 Infrastructure 69 131 0 23 562 0 0 0 3 912 0 0 0 Equipment 1 244 0 0 0 0 0 0 0 0 0 Operation expenses 677 2 790 2 875 2 963 3 054 3 148 3 244 3 344 3 446 3 552 Maintenance infrastructure 0 4 396 4 530 4 669 4 812 4 959 5 111 5 268 5 429 5 596
Total Costs 294 629 31 722 56 256 33 695 34 728 35 792 40 800 38 019 39 184 40 384
Net Benefits -283 325 6 366 -11 20 375 19 527 10 262 8 612 12 908 13 303 341 933 Present Net Benefits -283 325 5 615 -9 13 983 11 821 5 480 4 056 5 362 4 875 110 521
NPV -121 621
Source: The author.

252
Table 6.29: Cost-benefit analysis for the Santa Elena Rain Forest Project, the Owner’s Perspective (US$)
year 1992 1993 1994 1995 1996 1997 1998 1999 2000 2001
BENEFITS Entrance fee 11 304 32 300 50 280 47 923 47 919 39 524 42 683 43 990 45 338 46 727 Store & café's revenues 0 5 787 5 965 6 147 6 336 6 530 6 730 6 936 7 149 7 368 Liquidation values equipment 0 0 0 0 0 0 0 0 0 370
Total Cash In 11 304 38 088 56244 54 071 54 255 46 054 49 413 50 927 52 487 54 466
COSTS Personnel 3 433 24 536 25 288 26 063 26 861 27 684 28 533 29 407 30 308 31 237 Equipment 1 244 0 0 0 0 0 0 0 0 0 Operation expenses 677 2 790 2 875 2 963 3 054 3 148 3 244 3 344 3 446 3 552 Maintenance infrastructure 0 4 396 4 530 4 669 4 812 4 959 5 111 5 268 5 429 5 596
Total Cash Out 5 354 31 722 32 694 33 695 34 728 35 792 36 888 38 019 39 184 40 384
Net Benefits 5 950 6 366 23 551 20 375 19 527 10 262 12 524 12 908 13 303 14 081 Present Net Benefits 5 950 5 615 18 323 13 983 11 821 5 480 5 899 5 362 4 875 4 551
NPV 81 859
Source: The author.
253
The owner perspective shows a positive NPV (US$ 81 859) and positive net benefits during all years, which means that the project was feasible for the community. However, it is important to notice the positive effect of donations and special treatments (land), which represent investment requirements, in comparison to the stand alone project perspective, due to the non-profit nature of the project. Thus, they play an important role in making the project feasible for the Santa Elena community.
6.4.3 The stepwise analysis The stepwise analysis refers to the application of the methodology described in Chapter 4, which encourages projects to accomplish economic growth, income distribution, and a better environmental quality. Therefore, the stepwise analysis for the Santa Elena Project (Table 6.30) , from the so-ciety perspective, starts with the calculation of the traditional CBA, then the distributional CBA, and finally the environmental CBA. From the sustainability position, the positive or negative increment in the latter depends on the state of the environment, which in the current case should be positive, because the current percentage of protected areas of the country is below the recommended one (see Chapter 4 Section 4.1.1 Land use and Section 4.3); then, requiring an improvement (see Chapter 4 Section 4.5.4.2).
6.4.3.1 Traditional CBA This perspective considers the project from the national economy’s standpoint. It shows if the project is feasible for the Costa Rican society (Table 6.30). The traditional evaluation of the project eliminates the transfer payments within the economy, such as taxes or subsidies, government payments (social charges), tariffs, etc. It includes, then, shadow pricing to exclude distortions in the economy and include the project’s, positive and negative, externalities (see Glossary).

Table 6.30: Stepwise CBA for the Santa Elena Rain Forest Project. The Society Perspective (US$)
year 1992 1993 1994 1995 1996 1997 1998 1999 2000 2001
BENEFITS Entrance fee 11 767 33 684 52 531 50 166 50 461 41 620 44 810 46 183 47 598 49 057 Store & café's revenues 0 5 787 5 965 6 147 6 336 6 530 6 730 6 936 7 149 7 368 Donations: infrastructure 24 393 0 11 552 0 0 0 861 0 0 0 Liquidation values: land 0 0 0 0 0 0 0 0 0 288 848 infrastructure 0 0 0 0 0 0 0 0 0 39 004 equipment 0 0 0 0 0 0 0 0 0 370 Forest protection: existence 43 482 44 814 46 187 47 602 49 061 50 564 52 113 53 710 55 356 57 052 water prod.& overf. control 1 137 1 407 1 450 1 494 1 540 1 587 1 636 1 686 1 738 1 791
Total Cash In 80 779 85 692 117 685 105 410 107 397 100 301 106 150 108 515 111 840 443 490 COSTS Personnel 2 803 20 030 20 643 21 276 21 928 22 600 23 292 24 006 24 741 25 499 Opportunity cost: land 220 144 0 0 0 0 0 0 0 0 0 infrastructure 69 131 0 23 562 0 0 0 3 912 0 0 0 Equipment 978 0 0 0 0 0 0 0 0 0 Operation expenses 677 2 790 2 875 2 963 3 054 3 148 3 244 3 344 3 446 3 552 Maintenance infrastructure 0 4 396 4 530 4 669 4 812 4 959 5 111 5 268 5 429 5 596
Total Cash Out 293 732 27 215 51 611 28 908 29 794 30 707 35 560 32 617 33 617 34 647 Net Benefits -212 953 58 477 66 074 76 501 77 603 69 594 70 590 75 898 78 224 408 843 Present Net Benefits (PNB) -212 953 51 580 51 408 52 501 46 976 37 160 33 247 31 531 28 664 132 148
(Traditional CBA) NPV 252 262 PNB with Distributional Weights (DW) -211 526 51 150 55 361 55 209 49 128 37 387 33 760 31 997 29 088 132 585
(Distributional CBA) NPV 264 139 PNB with DW and Environmental Weights -204386 57673 61 291 60 600 54 028 41 842 37 810 35 679 32 436 135 628
(Environmental CBA) NPV 312 601
Source: The author.

185
The prices used are the willingness to pay in order to reflect also the gain in consumer surplus183 of the society (economy). In other words, the economic price comprises both the price paid in the market and the user’s consumer surplus. Therefore, regarding to the entrance fee, the difference between the traditional and owner perspective CBA is that the former takes into consideration the consumer surplus, while the latter takes only its market price. Accordingly, in the traditional CBA of the Santa Elena project, the entrance fee used is the average willingness to pay, from the resident tourists’ results (see Section 6.1.2 and questionnaire in Annex 1). With respect to donations, the ones that come from outside the country are a benefit to the project; while the ones that come from within are only transfer payments and are not taken into consideration. However, the real price of infrastructure (excluding 12 % selling tax, which is a transfer payment within the economy) is considered as a cost184 to reflect its opportunity-cost value. Furthermore, in regard to personnel , the 22.5 % of the employees’ salaries to be paid by the employer to the National Social Health Institution (see Footnote 173 in page 274), is not taken into account, because it is considered a transfer payment within the economy. The land donation as such is not considered, because it is also a transfer payment (in-side the economy). However, its opportunity cost185 is considered, as well as its liquida-tion value, as a benefit. The result shows a positive traditional CBA (US$ 252 262), which suggests that the project contributes to the economic growth of the country. The yearly present net benefit show a positive result for the ten years’ period considered, only except during the first year of operation of the preserve, when there is a negative net benefit, mainly because of the high opportunity cost of the assets and lower quantity of visitors if compared to the following years. The most important operational costs and benefits, like in the private perspective, are the entrance fee and the personnel salary payments. However, in this case (the society perspective), the environmental externalities of the project play an important role in the benefits side, which for example in year 1998 reach approximately 41 % of the total benefits. Finally, if the traditional analysis includes the consumer surplus of the non-residents visitors, the NPV is even higher - US$ 676 553 - (see Annex 2). It is worthwhile to notice that this project has a positive external effects beyond the national boundaries, which could be taken into account if a broader definition of society is taken into consideration.
183 The net consumer surplus’ gain is the difference between the willingness to pay and the actual price paid. 184 Without the 12 % selling tax, which is a transfer within the economy. 185 Its use as a preserve instead its second best alternative, which in this case is considered to be the price of forest for commercial (wood extraction) purposes.

186
6.4.3.2 The distributional CBA The distributional CBA (explained in Chapter 3 Section 3.5 and modified in the proposed methodology in Chapter 4 Section 4.4.4 Equation 4.2) uses income based weights to account for the distributional effects of the project. Accordingly, this CBA used in the case study - to account for the distributional direct benefits of the project to the community and the resident visitors - shows a positive NPV (US$ 264 139) and even a higher one than the traditional CBA (US$ 252 262), which suggests that the project has a positive effect upon the income distribution of the country. The reason is that the community is the stakeholder, which is more directly benefited by the project and since the average income of the community is under the national average income, the weight is above one. On the one side, the weight attached to the direct community benefits186 was calculated by substituting, in Equation 3.4 from Chapter 3, the deflated 1992 average national income of Costa Rica (denominator), the deflated 1992 average income of the Monte-verde region, assuming a -15 % difference in real income (numerator)187, according to DGEC 1994, and n= 1 following the methodology explained in Chapter 4 Section 4.4.4 The distributional CBA.
aU S
U S1
1
1 4 3=
−
= =
U S $ 2 5 2 0
U S $ 3 5 9 8
$ 3 5 9 8
$ 2 5 2 0
. (6.3)
On the other side, the weight attached to the entrance fee from resident visitors is cal-culated by substituting in the same equation the deflated 1992 average national income of Costa Rica (denominator), the deflated 1992 average income of the central region of the country - according to DGEC 1994 -, and also n= 1.
aU S
U S2
1
0 9 0=
−
= =
U S $ 3 9 8 2
U S $ 3 5 9 8
$ 3 5 9 8
$ 3 9 8 2
. (6.4)
The reason why the 1992 year is taken as a reference for the calculation of the dis-tributional weight, is that it should be calculated ex-ante, since the idea is to measure if a project contributes to improve the status quo. 186 Net benefits from the owner perspective 187 This difference is due to the fact that the distributional weight should be calculated with the real income before the project, however, the data used is according to DGEC 1994.
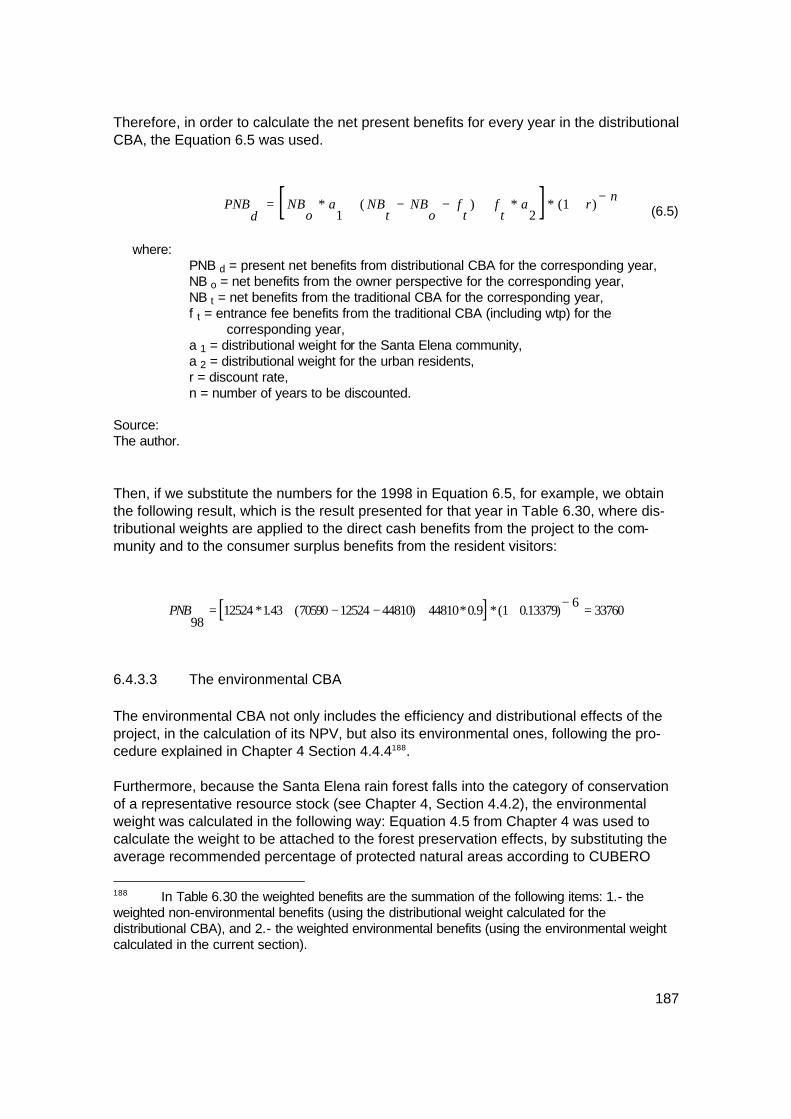
187
Therefore, in order to calculate the net present benefits for every year in the distributional CBA, the Equation 6.5 was used.
[ ]PNBd
NBo
a NBt
NBo
ft
ft
a r n= + − − + + −* ( ) * * ( )1 2
1 (6.5)
where:
PNB d = present net benefits from distributional CBA for the corresponding year, NB o = net benefits from the owner perspective for the corresponding year, NB t = net benefits from the traditional CBA for the corresponding year, f t = entrance fee benefits from the traditional CBA (including wtp) for the
corresponding year, a 1 = distributional weight for the Santa Elena community, a 2 = distributional weight for the urban residents, r = discount rate, n = number of years to be discounted.
Source: The author. Then, if we substitute the numbers for the 1998 in Equation 6.5, for example, we obtain the following result, which is the result presented for that year in Table 6.30, where dis-tributional weights are applied to the direct cash benefits from the project to the com-munity and to the consumer surplus benefits from the resident visitors:
[ ]PNB98
12524 143 70590 12524 44810 44810 0 9 1 013379 6 33760= + − − + + − =* . ( ) * . *( . )
6.4.3.3 The environmental CBA The environmental CBA not only includes the efficiency and distributional effects of the project, in the calculation of its NPV, but also its environmental ones, following the pro-cedure explained in Chapter 4 Section 4.4.4188. Furthermore, because the Santa Elena rain forest falls into the category of conservation of a representative resource stock (see Chapter 4, Section 4.4.2), the environmental weight was calculated in the following way: Equation 4.5 from Chapter 4 was used to calculate the weight to be attached to the forest preservation effects, by substituting the average recommended percentage of protected natural areas according to CUBERO
188 In Table 6.30 the weighted benefits are the summation of the following items: 1.- the weighted non-environmental benefits (using the distributional weight calculated for the distributional CBA), and 2.- the weighted environmental benefits (using the environmental weight calculated in the current section).

188
1994 (29 % of the total territory) - denominator - and the current percentage of the national protected area system according to MIDEPLAN 1998 (25 % of the national territory) - numerator -, and assuming g= 1.
fx
x
- g
11
1
= =
−
=
2 5 %
2 9 %
1
1 1 6. (6.6)
Source: The author. Since the forest protection externalities, specifically the existence value to the community and water production and overflow control, are the only environmental externalities taken into account in the environmental CBA and the environmental weight is above one, the NPV is positive (US$ 312 601) and even higher in comparison to the distributional CBA (US$ 264 139). This result suggests that the project promotes a better forest quality, and in turn, a better environmental quality.
PNBe
PNBd
Fp
rn
Fp
f rn
= − +−
+ +−
( * ( ) ) * * ( )11
1 (6.7)
where:
PNB e = present net benefits from environmental CBA for the corresponding year, PNB d = present net benefits from the distributional CBA for the corresponding year, F p = forest protection benefits for the corresponding year, f 1 = environmental weight, r = discount rate, n = number of years to be discounted.
Source: The author. Therefore, in order to calculate the net present value in the environmental CBA, Equation 6.7 was used: If we substitute these values in Equation 6.7, for example for the year 1998, we obtained the following result, which is the one shown for the year 1998 in Table 6.30 and which apply environmental weights to the environmental benefits of the project.
PNB98
35680 52113 1636 1 01337 6 52113 1636 116 1 0 1337 6 39731= − + + − + + + − =( ( ) * ( . ) ) ( ) * . * ( . )

189
6.4.4 Comparison of the different analysis The NPV comparison shows a feasible project from all perspectives (Table 6.31), except one: the stand alone project. That means that the project was not feasible for a private investor.
Table 6.31: Santa Elena Rain Forest Project NPV comparison from the different perspectives analyzed
Type of Analysis NPV
Private Perspectives Stand Alone Project The Owner
-121 621 81 859
Society Perspective Traditional CBA Distributional CBA Environmental CBA
252 262 264 139 312 601
Source: The author. This result is a typical example of the type of problems arising from environmental and natural resource projects, where a project is highly efficient for the society as a whole, but because of its long-term nature and high investments, is not feasible for private en-trepreneur. Therefore, the government and/or international organizations have an im-portant role to play in their promotion. Let’s analyze the results in more detail. The NPV calculation using the different methodologies (traditional, distributional, and environmental) show a positive incremental NPV, then a feasible project. Incremental in the sense that every part of the stepwise analysis make the NPV higher, which means that all the three components of sustainable development (efficiency, distribution, and the environment) are present in this project. Furthermore, the project is financially auto-sustainable because shows a positive (feasible) NPV from the owner perspective.
6.4.5 The sensitivity analysis The purpose of the sensitivity analysis is to show the performance of the NPV according to modifications in key variables involved, such as the n and g parameters189, inflation
189 The n parameter is used to calculate distributional weights and the g parameter environmental ones.
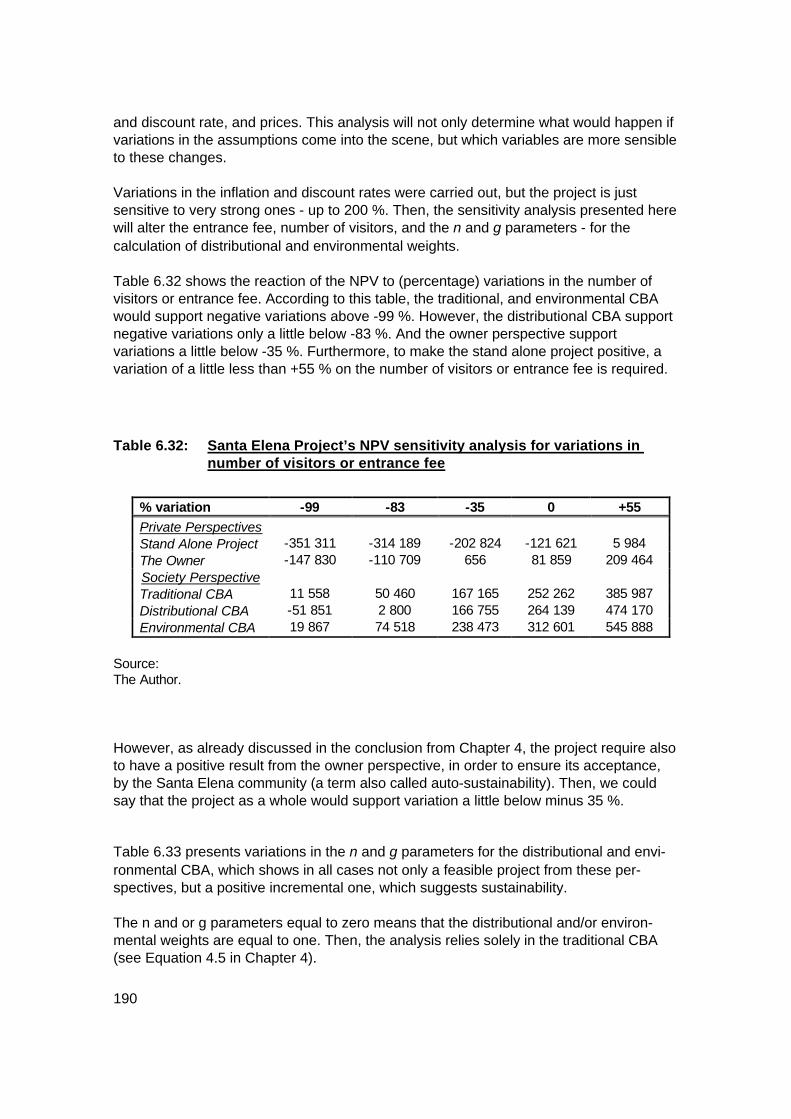
190
and discount rate, and prices. This analysis will not only determine what would happen if variations in the assumptions come into the scene, but which variables are more sensible to these changes. Variations in the inflation and discount rates were carried out, but the project is just sensitive to very strong ones - up to 200 %. Then, the sensitivity analysis presented here will alter the entrance fee, number of visitors, and the n and g parameters - for the calculation of distributional and environmental weights. Table 6.32 shows the reaction of the NPV to (percentage) variations in the number of visitors or entrance fee. According to this table, the traditional, and environmental CBA would support negative variations above -99 %. However, the distributional CBA support negative variations only a little below -83 %. And the owner perspective support variations a little below -35 %. Furthermore, to make the stand alone project positive, a variation of a little less than +55 % on the number of visitors or entrance fee is required.
Table 6.32: Santa Elena Project’s NPV sensitivity analysis for variations in number of visitors or entrance fee
% variation -99 -83 -35 0 +55 Private Perspectives Stand Alone Project -351 311 -314 189 -202 824 -121 621 5 984 The Owner -147 830 -110 709 656 81 859 209 464 Society Perspective Traditional CBA 11 558 50 460 167 165 252 262 385 987 Distributional CBA -51 851 2 800 166 755 264 139 474 170 Environmental CBA 19 867 74 518 238 473 312 601 545 888
Source: The Author.
However, as already discussed in the conclusion from Chapter 4, the project require also to have a positive result from the owner perspective, in order to ensure its acceptance, by the Santa Elena community (a term also called auto-sustainability). Then, we could say that the project as a whole would support variation a little below minus 35 %.
Table 6.33 presents variations in the n and g parameters for the distributional and envi-ronmental CBA, which shows in all cases not only a feasible project from these per-spectives, but a positive incremental one, which suggests sustainability. The n and or g parameters equal to zero means that the distributional and/or environ-mental weights are equal to one. Then, the analysis relies solely in the traditional CBA (see Equation 4.5 in Chapter 4).

191
Table 6.33: Santa Elena Project’s NPV sensitivity analysis for variations in the n or g parameters
variation 0 0.5 1 1.5 2
Society Perspective
Distributional CBA n
252 262
267 709
264 139
308 662
335 506
Environmental CBA n g
300 725 286 305
316 171 309 638
312 601 312 601
357 124 361 834
383 968 390 985
Source: The author.
6.5 Conclusion The project presented in the case study illustrates the methodology proposed in Chapter 4. Therefore, dealing not only with economic efficiency and distribution, but with the environment. By separating the valuation of the environmental effects of the project and applying them an environmental technically-based weight for the NPV calculation, this methodology shows a CBA adjustment toward promoting a better environmental quality. The inclusion of environmental quality, together with economic growth and income distribution (from the traditional and distributional CBA), would, in turn, promote sustainable development. In this way, policy makers are able to use the developed methodology as a tool to improve decision-making to promote sustainable development through CBA. The case study illustrates the calculation of an environmental weight about a natural resource as forest. The analysis presented for the Santa Elena project shows a sus-tainable feasible project, which means that it contributes to the sustainability of the country. Specifically, the impact analysis matrix, without monetary calculations, and the sustainability analysis (traditional, distributional, and environmental CBA) suggest its contribution toward sustainable development. However, the stand alone project perspective shows a non-feasible project. In fact, al-though the owner perspective is positive (because of donations) a common entrepreneur would not start such an enterprise; then, discouraging an activity, which is beneficial to the whole Costa Rican society, and in turn, to the sustainability of the country. Thus, this is a typical activity, which should be promoted by the government and/or international related organization in order to make it feasible (auto-sustainable). Moreover, the sensitivity analysis shows that the Santa Elena project as a whole would support negative variations a little below -35 % and -83 % for the society perspective

192
(traditional, distributional, and environmental), which is a relatively good sign, even more when the expectation is to have an even higher visitation rate190. A limitation of the case study, to apply the proposed methodology as exactly in the real world, is that project are usually assessed by a team of experts in different fields. This team provide the necessary information to construct the impact analysis matrix. Upon the information from the matrix impacts are valued. In the current study, this exercise was not possible. Then, the impacts analysis matrix was constructed upon primary (surveys) information.
190 Due to the fact that it increases every year. Furthermore, the visitation rate of the whole country has increased in the last years (LA NACIÓN DIGITAL 2000).
193
7 SUMMARY, CONCLUSION, AND RECOMMENDATION
7.1 Summary of Major Findings
The objective of the current study is to extend cost-benefit analysis (CBA) to transform it
in an instrument to evaluate environmental sustainability.
To accomplish this objective, first a review of the presently most used project appraisal
techniques is carried out. The CBA methodology is, then, adjusted and extended to
identify environmental sustainable projects and applied to a case study in Costa Rica.
7.1.1 Project evaluation using the cost-benefit analysis
The most widely used technique for project appraisal is CBA. The traditional version of
the methodology is based on an economic efficiency concept (society point of view).
However, economic growth does not necessarily accomplish a better standard of living
for all in society. Therefore, the traditional CBA was extended to take this consideration
into account, by using distributional weights in the distributional CBA version.
With the beginning of the discussion related to sustainable development, environmental
aspects gained more value for project appraisal. But, sustainable development is still a
vague and multifaceted concept, which considers social, economic, and environmental
aspects. Many authors underline, however, three essential elements to make the concept
operational: economic growth, income distribution, and environmental quality. These
elements are used, in the current study, to define a project that contributes to
sustainability.
Until now, there exists no extensive CBA methodology, which encompasses sustainability
including the three key elements. Despite the great advancement in the identification and
valuation of environmental impacts, CBA generally includes the environmental dimension
194
just by valuing, in monetary terms, the environmental effects of the project. Then, project
approval is still based in economic efficiency, which does not take into consideration the
future availability of the environmental asset.
Furthermore, the traditional CBA only takes into account economic growth and the dis-
tributional CBA economic growth and distribution, but, none of them take into consid-
eration future environmental availability. Then, the objective of the study is to adjust the
CBA methodology to overcome this deficiency.
7.1.2 The CBA methodological adjustment for environmental sustainability
The first step of the presented methodology is to identify (and quantify) criteria, which
balance the use and conservation of the natural asset. The project impacts are defined
through the use of a severity (significance) criteria. The severity is, in turn, determined
not only through quantitative, but also qualitative information, such as, location, duration,
and reversibility.
In the stepwise analysis, the three key elements of sustainability are included, one after
the other, by requiring a positive increment in every one. First, a positive traditional CBA,
encourages economic growth. Secondly, a positive increment in the distributional CBA,
with respect to the traditional one (positive distributional minus traditional), ensures the
project contribution toward better income distribution. And finally, a positive increment in
the environmental CBA, with respect to the distributional one (positive environmental
minus distributional), indicates that the project promotes better environmental quality.
7.1.3 Results of the empirical application of the adjusted methodology
The Santa Elena Rain Forest is a community-operated project in Costa Rica. The project
consists of 308 hectares of pristine forest. The major source of income is the entrance
fee payments of its visitors.
The fieldwork encompasses surveys to members of the community and the resident and
non-resident visitors. The main results of the surveys are presented below:

195
• The willingness to pay as an entrance fee and to enhance the preserve was higher
for the non-resident sample than for the resident one. The community of Santa Elena
showed the highest willingness to pay to enhance the preserve.
• The Santa Elena community tends to perceive most of the impacts after the project
initiation as positive, especially forest protection and land value. However, there are
some effects that still remain at a very low level of improvement or are even negative,
such as pollution. Pollution is perceived as deteriorating after the project from
excellent to regular, most probably due to a higher visitation rate.
Based on primary (surveys and interviews) and secondary data, the stepwise analysis
(society perspective) of the project was calculated. The result shows that the project
contributes to the sustainability of the country.
Because of donations and special concessions due to the non-profit nature of the project,
the result of the owner perspective (private perspective) is feasible. However, the
perspective of a normal entrepreneur (stand alone) shows non-feasible.
These results show a typical example of a project that brings positive sustainability
benefits to the whole Costa Rican society. Then, to encourage them, the government
should promote its private feasibility (from the perspective of a private entrepreneur).
7.1.4 General Results
The presented methodology shows the advantage of incorporating future availability of
the environmental asset, the missing element of sustainability in the current CBA
methodologies. The adjusted CBA could be used in a wide variety of projects with envi-
ronmental effects. They could range from industrial and agricultural to environmental
friendly ones.
Finally, the Santa Elena Case Study is the first practical test of the extended methodol-
ogy. Therefore, it should be applied in projects with different environmental effects to
evaluate its application and performance.

196
7.2 Policy Recommendations, Limitations of the Study, and Further Research
To carry out the distributional and environmental CBA is necessary to calculate the
corresponding weights. Because unequal weights could be subjectively chosen, they
should be applied consistently. Then, it is the role of the government (international or-
ganizations) to set up these weights to allow for comparisons among projects.
Information on the experience of countries with the use of weights in CBA could be the
base to extrapolate them to others with similarities and the start point of an international
effort on this direction.
It is the role of the global community to establish the international boundaries for project
evaluation (the society under consideration). In this way, projects would contribute to a
regional (global development), instead of only national, especially when talking about
environmental impacts that affect neighboring countries.
Setting up the international boundaries for regional- or world-integrated project appraisal
would also provide the basis to define the inter-countries stakeholders (and their
impacts), missed on the current national (society) perspective.
Finally, it is also recommended to carry out further research to calculate the environ-
mental standards for project evaluation. The standards are the base to estimate the
impact severity and calculate environmental weights in the stepwise analysis.

209
8 Zusammenfassung Ziel der vorliegenden Dissertation ist die Erweiterung der Kosten-Nutzen-Analyse (KNA)
zu einem umfassenden Instrument zur Beurteilung der Nachhaltigkeit von
Entwicklungsprojekten.
Zu Beginn der Studie wird ein Überblick über die am häufigsten verwendeten
Projektbewertungsmethoden gegeben. Um auf die Umweltverträglichkeit von Projekten
schließen zu können, wird die zur Projektevaluierung eingesetzte KNA modifiziert und
weiterentwickelt. Die erweiterte Kosten-Nutzen-Analyse wird anschließend zur
Bewertung des Santa Elena Regenwald Projektes in Costa Rica angewendet.
Eine zur Projektevaluierung häufig eingesetzte Bewertungsmethode ist die Kosten-
Nutzen-Analyse. Die Anwendung der herkömmlichen KNA läßt jedoch nur auf die
wirtschaftliche Rentabilität von Projekten schließen. Diese führt jedoch nicht zwingend zu
einer verbesserten Lebensqualität der in der Projektregion lebenden Bevölkerung. Um
den Allokationsaspekt berücksichtigen zu können, wurde die herkömmliche Kosten-
Nutzen-Analyse bereits von BRENT 1996 erweitert. Mit Beginn der
Nachhaltigkeitsdiskussion Anfang der 90er Jahre erfuhren Umweltgesichtspunkte bei der
Projektbewertung deutlich an Bedeutung. Autoren wie VEEMAN 1989, PEARCE et al.
1990, oder JAMES 1994 identifizieren drei Nachhaltigkeitsziele, um dieses Konzept
operationalisieren zu können: wirtschaftliche Rentabilität, eine verbesserte
Einkommensverteilung (v.a. zugunsten der Ärmsten der Gesellschaft) und ein
Gleichgewicht zwischen dem Verbrauch und der Regenerierbarkeit bzw. Substitution
natürlicher Ressourcen. Nur wenn diese drei Ziele erfüllt sind, kann auf die
Nachhaltigkeit von Projekten geschlossen werden.
Bisher liegt jedoch kein umfassendes methodisches Gerüst zur Bewertung von Projekten
unter Nachhaltigkeitsaspekten auf der Grundlage der KNA vor. Trotz großer Fortschritte
während der letzten Jahre bei der Identifizierung und Evaluierung von
Umweltwirkungszusammenhängen findet die Umweltdimension in der KNA lediglich in
210
Form einer finanziellen Bewertung von Umwelteffekten Berücksichtigung. Sie läßt jedoch
nicht auf eine dauerhafte Verfügbarkeit der Umweltressourcen schließen, da die
ökonomische Rentabilität der entscheidende Faktor bleibt.
Zur Bestimmung der Umweltwirkungen werden Kriterien identifiziert und quantifiziert. Die
Bestimmung der Wirkungsfaktoren von Projekten erfolgt jeweils mit Hilfe eines
Signifikanz-Indikators. Diese Indikatoren basieren nicht allein auf der quantitativen
Messung von Wirkungen, sondern auch auf qualitativen Parametern wie der räumlichen
Ausdehnung, Dauer und Umkehrbarkeit von Umweltwirkungen.
Bei der in drei Schritten durchgeführten KNA werden die drei Schlüsselelemente der
Nachhaltigkeit, ökonomische Rentabilität, soziale Allokation und Umweltwirkung,
nacheinander in der Berechnung berücksichtigt. Erst wenn jeder Rechenschritt einen
zunehmend positiven Betrag aufweist, kann das untersuchte Projekt als nachhaltig
eingestuft werden. Ein positives Ergebnis der herkömmlichen KNA deutet auf
ökonomische Rentabilität hin. Ein darüber hinaus positives Ergebnis der auf
Verteilungsaspekten fokussierten zweiten KNA stellt die Voraussetzung zur Erfüllung der
sozialen Dimension der Nachhaltigkeit dar. Wenn zuletzt noch die ökologisch erweiterte
KNA, bei der explizit Umwelteffekte Berücksichtigung finden, zusätzliche
Nettonutzengewinne aufweist, so kann das Projekt als ökonomisch, sozial und
ökologisch nachhaltig bezeichnet werden.
Das als Fallbeispiel untersuchte Santa Elena Regenwald-Projekt stellt ein
gemeinschaftlich durchgeführtes Projekt in Costa Rica dar. Dieses Projekt umfaßt 308
Hektar Primärwald. Haupteinnahmequelle des Projekts sind Eintrittsgelder, die von den
Besuchern gezahlt werden.
Die durchgeführte Feldstudie umfaßt eine Befragung zur Ermittlung sozio-ökonomischer
Kennziffern und der Zahlungsbereitschaft der ortsansässigen Bevölkerung sowie der
ausländischen und einheimischen Besucher. Die Befragung erfolgte auf der Grundlage
von Fragebögen.

211
Die statistische Auswertung der Befragung erbrachte folgende Erkenntnisse:
Hinsichtlich der Bereitschaft ein Eintrittsgeld und Entgeld als Beitrag zum Erhalt der Natur aufzubringen, war diese bei den ausländischen Besuchern höher als bei den einheimischen. Die Santa Elena-Kommune zeigte die höchste Zahlungsbereitschaft durch Erweiterung des Regenwaldschutzgebietes zur Naturerhaltung beizutragen. Dies kann aus ihrer traditionellen Wertschätzung natürlicher Ressourcen, ihrer Zugehörigkeit zum Projekt und dem daraus resultierenden Nutzen (Einkommen durch Tourismusaktivitäten und andere positive Effekte) erklärt werden. Die Santa-Elena Kommune beurteilte die meisten aus dem Projekt resultierenden Auswirkungen als positiv, insbesondere den Erhalt des Regenwaldes und die Wertsteigerung des Landes. Dennoch gibt es einige Faktoren, die sich mit Projektbeginn nicht gebessert haben oder sich sogar verschlechtert haben, wie z.B. die Umweltverschmutzung. Die Situation der Umweltverschmutzung hat sich von ”sehr gut” zu ”normal” verschlechtert. Hierfür ist vermutlich die gestiegene Besucherzahl verantwortlich. Die erweiterte KNA wurde für das Projekt auf der Grundlage von Datenerhebungen (primäre und sekundäre Daten) angewendet. Ergebnis war, daß das Projekt insgesamt zur nachhaltigen Entwicklung des ländlichen Raumes beiträgt. Sofern externe Unterstützungsleistungen als Kostenersparnisse in der KNA berücksichtigt werden, zeigt das Projekt auch aus betriebswirtschaftlicher Sicht ein positives Ergebnis. Doch als autonomes Projekt ohne externe Unterstützung ist es nicht zu realisieren. Tatsächlich ist dies ein typisches Ergebnis, welches die Regierung veranlassen sollte, Privatunternehmer zu unterstützen und als Träger von Ressourcenschutzprojekten zu gewinnen. Auch aus volkswirtschaftlicher Sicht bedeutet ein derartiges Projekt einen Zugewinn für Costa Rica. Nach den gewonnenen Ergebnissen bietet die vorgestellte Methode den entscheidenden Vorteil, daß die zukünftige Verfügbarkeit der natürlichen Ressourcen bei der Projektevaluierung berücksichtigt wird. In den gängigen Kosten-Nutzen-Analysen fehlte dieses Element der Nachhaltigkeit. Mit Hilfe der Berechnung der Umwelt-KNA können Projekte auch hinsichtlich ihrer Erfüllung von empfohlenen Umwelt- und Naturschutz-Standards untersucht werden. Die erweiterte und angepaßte Kosten-Nutzen-Analyse kann für eine Vielzahl von Projekten mit Umweltwirkungen verwendet werden, die von Industrieprojekten, Agrarprojekten bis hin zu umweltverbessernden Projekten reichen können. Das als Fallbeispiel gewählte Santa Elena Projekt stellt die erste praktische Anwendung der erweiterten Kosten-Nutzen-Analyse dar.

212
REFERENCES

213
ANGELSEN, A.; SUMAILA, U. R.
Hard methods for soft policies: environmental and social cost-benefit analysis. In:
Wilson, Frank A. Toward sustainable project development. Edward Elgar
Publishing Limited, United Kingdom and USA, 1997
ASCHER, W.
The ambiguous nature of forecasts in project evaluation: diagnosing the over-
optimism of rate-of-return analysis. In: International Journal of Forecasting, (9),
109-115, North Holland, 1993
BCCR
Tipos de Cambio Históricos. Banco Central de Costa Rica. Web Page, San José-
Costa Rica, 1999
BAUER, S.
Politik zur nachhaltigen Entwicklung ländlicher Räume. In: Agrarwirtschaft (46),
Giessen, 1997
BAUER, S.
Estrategias para la preservación del Medio Ambiente. Giessen, 1997
BAUER, S.
Sustainable development in agricultural landscapes. In: SCHELLNHUBER, H.J.
and WENZEL, V (Hrsg.), Earth system analysis. Integrating science for
sustainability, Giessen, 1998(a)
BAUER, S.
Integrierte Regionalentwicklung in ländlichen Räumen. In: Heiland, I. (Hrsg.),
Entvicklungsperspektiven für die ländlichen Räume, Giessen, 1998(b)

214
BAUER, S.
Honorierung ökologischer Leistungen der Landwirtschaft: was hat sich in den
letzten Jahren getan? Was ist in nächster Zeit zu erwarten?. Loggumer Protokolle,
Giessen, 1999
BAUER, S.; ABRESCH, P.
Ökonomische Ansätze für eine nachhaltige Landwirtschaft, Giessen, 1999
BAUER, S.; TRÖTSCHLER, J. P.
Zum Schwerpunktthema ”UVP und Landwirtschaft”. UVP Prüfungsreport, Giessen,
1993
BISWAS, A. K.; GEPING, Q.
Environmental impact assessment for developing countries. In: Natural Resources
and the Environment Series, Volume 19, London, 1987
BOLTVINIK, J.
El Método de Medición Integrada de la Pobreza. Una propuesta para su desarrollo.
Revista Comercio Exterior. Vol. 42 Nº 4, Banco Nacional de Comercio Exterior,
México 1992, p. 354-365
BRADFORD, D. F.
Constraints on government investment opportunities. American Economic Review,
65, p. 887-99
BRENES, F; VILLALOBOS, F.
Estudio de zonificación en la finca Santa Elena-Monteverde. Ministerio de
Agricultura y Ganadería (MAG), Costa Rica, 1985
BRENT, R. J.
The Minister of Transport social welfare function: A study of the factors behind
railway closure decisions (1963-1970), Ph. D. thesis, University of Manchester,
1976
215
BRENT, R. J.
Applied Cost-Benefit Analysis. Biddles Ltd., Guildford and King’s Lynn, London,
1996
BRENT, R. J.
Cost-Benefit Analysis for Developing Countries. Edward Elgar Publishing Limited,
Great Britain, 1998
CARRANZA, C.
La experiencia del Proyecto CREED sobre protección de cuencas hidrográficas: el
caso del Río Chiquito en Costa Rica (documento en elaboración). Proyecto
CREED, San José, Costa Rica, 1996
CFIA.
Valores de metro cuadrado de construcción de edificación para la estimación del
valor preliminar de la obra a junio de 1998. Colegio Federado de Ingenieros y
Arquitectos. San José-Costa Rica, 1998
CNE
Presupuesto ordinario 1998. Comisión Nacional de Emergencia, Unidad Ejecutora
de Desechos Sólidos. San José, Costa Rica, 1998
CNE
Reajuste tarifario para la disposición de la tonelada métrica de desechos. Relleno
Sanitario de Río Azul, Comisión Nacional de Emergencia, Unidad Ejecutora de Río
Azul, San José, Costa Rica, 1997
CNDTA
División territorial administrativa. Comisión Nacional de División Territorial
Administrativa. Imprenta Nacional. San José, Costa Rica, 1997
COLE, H.S.D. et al.
Models of doom: a critique of the limits to growth. Universe Books, New York, 1973
216
CONWAY, G.R.
The properties of agroecosystems. Agricultural Systems, 24, pp.45-52, 1987
COORMER, J. C.
The nature of the quest for a sustainable society. In: Coormer, J.C. (Ed.). Quest for
a sustainable society. Pergamon Press, New York, 1979
CUBERO, D.
Manual de Manejo y Conservación de suelos y aguas. EUNED. San José, Costa
Rica, 1994
DASGUPTA, P.; AMARTYA, S.; MARGLIN, S.
Guidelines for project evaluation. United Nations Industrial Development
Organization, Vienna, 1972
DGTD (DIRECCIÓN GENERAL DE TRIBUTACIÓN DIRECTA)
Plano de Valores Municipales de Curridabat. San José-Costa Rica, 1998
DGTD (DIRECCIÓN GENERAL DE TRIBUTACIÓN DIRECTA)
Valoración de Tierras. Administración Regional. Tributación de Puntarenas. Costa
Rica, 1997
DIAMOND, P.; MIRRLEES, J.
On Optimal Taxation and Public Production, I and II. American Economic Review,
1971
DIXON, J. A.; SCURA, L. F.; CARPENTER, R. A.; SHERMAN, P. B.
Economic analysis of environmental impacts. Asian Development Bank and the
Internatinal Bank for Reconstruction and Development, The World Bank, Earthscan
Publications Ltd., 1997
ELLIOTT, J. A.
An introduction to sustainable development. Routledge Introductions to
Development Series. New York, 1999

217
FELDSTEIN, M.
The social time preference discount rate in cost-benefit analysis. In: Economic
Journal 74, USA, 1964
FUGUITT, D.; WILCOX, S. J.
Cost-benefit analysis for public sector decision makers. Quorum Books, USA, 1999
GEILFUS, F.
80 herramientas para el desarrollo participativo: diagnóstico, planificación,
monitoreo, evaluación. Deutsche Gesellschaft für Technische Zusammenarbeit
(GTZ) and Instituto Interamericano de Cooperación para la Agricultura (IICA-
Holanda/Laderas). San Salvador, 1997
GERMAN FOUNDATION FOR INTERNATIONAL DEVELOPMENT
Environment-oriented resource planning in intensive agriculture, 1995
GITTINGER, J. P.
Economic Analysis of Agricultural Projects. EDI series in Economic Development.
World Bank Institute, Maryland, 1994
GUZMÁN MARTÍNEZ, J.
Financial and economic analysis of an ecotourism project: the community-operated
Guayabo-Siquirres Rain Forest Project in Monteverde-Costa Rica. Master Project,
Duke School of the Environment, North Carolina, 1992
HABER, W. A.
Lista provisional de las plantas de Monte Verde, Costa Rica. Missouri Botanical
Garden, Missouri, 1988
HIRSHLEIFER, J.; DEHAVEN, J. C.; MILLIMAN, J. W.
Water supply: economics, technology, and policy. University of Chicago Press,
Chicago, 1960

218
IADB (INTER AMERICAN DEVELOPMENT BANK)
Procedures for classifying and evaluating environmental impacts of bank
operations. Environmental Management Committee. Washington, D. C., 1990
IADB (INTER AMERICAN DEVELOPMENT BANK)
Statistics of Costa Rica. Web page. Washington, D.C., 1998
ICT (INSTITUO COSTARRICENSE DE TURISMO)
Tourist brochure. San José, Costa Rica, 1999
ISLAM, S.M.N.; GIGAS, J.
Economics of project appraisal and sustainable development. Pacific and Asian
Journal of Energy. New Delhi, 1997
IUCN (INTERNATIONAL UNION FOR THE CONSERVATION OF NATURE AND
NATURAL RESOURCES)
World conservation strategy: Living resources conservation for sustainable
development. IUCN-UNEP-WWF. Gland, Switzerland 1980
JAMES, D.
The application of economic techniques in environmental impact assessment.
Environment & Management, Vol. 4, Australia, 1994
JENKINS, G. P.; HARBERGER, A. C.
Manual: cost-benefit analysis of investment decisions. Program on Investment
Appraisal and Management. Harvard Institute for International Development,
Boston, 1990
JOHANSSON, P. O.
An introduction to modern welfare economics. Cambridge University Press,
Cambridge,1992
JOHANSSON, P. O.
Cost-benefit analysis of environmental change. Cambridge University Press,
Cambridge, 1993
219
JUST, R. E; HUETH, D., L.; SCHMITZ, A.
Applied Welfare Economics and Public Policy. Prentice-Hall, INC., Englewood
Cliffs, New Jersey, 1982
KIRKPATRICK, C.; WEISS, J.
Cost-benefit analysis and project appraisal in developing countries. Edward Elgar
Publishing Ltd., London, 1996
LA NACIÓN DIGITAL
Arranca el Gigante. Página de internet del Periódico La Nación. San José, Costa
Rica, 1998
LA NACIÓN DIGITAL
Constitución Política de la República de Costa Rica. Página de internet del
Periódico La Nación. San José, Costa Rica, 1999
LA NACIÓN DIGITAL (a)
Costa Rica data. Página de internet del Periódico La Nación. San José, Costa
Rica, 2000
LA NACIÓN DIGITAL (b)
156.418 hogares en pobreza. Página de internet del Periódico La Nación. San
José, Costa Rica, 2000
LAYARD, R.
Cost-benefit analysis, Middlesex: Penguin Books, 1972
LITTLE, I. M. D.; MIRRLEES, J. A.
Project Appraisal and Planning for Developing Countries, Heinemann Educational
Books Ltd., London, 1974
LONDERO, E.
Reflections on estimating distributional effects. In: KIRKPATRICK, C. and WEISS,
J. (eds.), Cost-benefit analysis and project appraisal in developing countries.
Edward Elgar Publishing Limited, London, 1996

220
MACRAE, D. Jr.; WHITTINGTON, D.
Expert advice for policy choice: analysis and discourse. Georgetown University
Press, Washington, D.C. 1997
MARGLIN, S.
Value and Price in the Labour-surplus Economy, Clarendon, Oxford, 1976
MEADOWS, D. H. et al.
The limits to growth. Universe Books, New York, 1972
MEIC (MINISTERIO DE ECONOMÍA, INDUSTRIA Y COMERCIO)
Cálculo de población por provincia, cantón y distrito. Ministerio de Economía
Industria y Comercio-Area de Estadísticas y Censos. San José-Costa Rica, 1998
MEIC (MINISTERIO DE ECONOMÍA, INDUSTRIA Y COMERCIO)
Índices de precios de los insumos básicos de la industria de la construcción.
Ministerio de Economía Industria y Comercio-Area de Estadísticas y Censos. San
José, Costa Rica, 1998
MEIC (MINISTERIO DE ECONOMÍA, INDUSTRIA Y COMERCIO)
Encuesta de Hogares de Propósitos Múltiples 1997. Ministerio de Economía
Industria y Comercio-Ministerio de Educación Pública-Ministerio de Trabajo y
Seguridad Social-Caja Costarricense del Seguro Social. San José, Costa Rica,
1998
MESALLES, L. J.
Costa Rica en 1999: Crecimiento y estabilidad condicionados. La Nación Digital.
San José, Costa Rica, 1999
MIDEPLAN (MINISTERIO DE PLANIFICACIÓN NACIONAL)
Diagnóstico ambiental, social y económico de Costa Rica. Página de internet. San
José, Costa Rica, 1998
MINAE (MINISTERIO DE AMBIENTE Y ENERGÍA)
Situación ambiental del país. Página de internet. Costa Rica, 1996

221
MINAE (MINISTERIO DE AMBIENTE Y ENERGÍA)
Reglamento sobre procedimiento de la SETENA. N° 25705-Ministerio de Ambiente
y Energía. Diario Oficial La Gaceta 16 de enero de 1997. San José, Costa Rica,
1997
MINISTERIO DE RELACIONES EXTERIORES
Estadísticas de Costa Rica. Página de internet del Ministerio de Relaciones
Exteriores y Culto. San José, Costa Rica, 1999
MISHAN, E. J.
Cost-benefit analysis. George Allen & Unwin, 3rd ed. , London, 1982, p. 323
MISHAN, E. J.
The Nature of economic expertise reconsidered. In: Economic efficiency and social
welfare-selected essays on fundamental aspects of the economic theory of social
welfare. George Allen & Unwin, London 1981, p.182
MÜLLER, S.
Evaluating the sustainability of agriculture: the case of the Reventado river
watershed in Costa Rica. European University Studies: series 5, Economics and
Management; Vol. 2194. Peter Lang GmbH Europäischer Verlag der
Wissenschaften, Frankfurt am Main, Deutschland, 1997
MUNASINGHE, M.
Comments on ”the environment and emerging development issues” by Dasgupta
and Mäler. Proceedings of the World Bank Annual Conference on Development
Economics; 1990, p. 133-141
MUNASINGHE, M.
Environmental economics and natural resource management in developing
countries. World Bank/CIDIE, Washington D. C., 1993a
MUNASINGHE, M.
Environmental economics and sustainable development. World Bank Environment
Paper N° 3, The World Bank, Washington, D. C. 1993b

222
OATES, J. F.
Myth and reality in the rain forest: how conservation strategies are failing in West
Africa. University of California Press, California, 1999
OATES, J. F.
Why a prime model for saving rain forests is a failure. The Chronicle of Higher
Education, USA, January 14, 2000
O’DONOVAN, I.
The ODA’s process approach to projects: experience in India and lessons for
project management. In: WILSON, F. A., Toward sustainable project development.
Edward Elgar Publishing Ltd., London, 1997
OECD (ORGANIZATION FOR ECONOMIC COOPERATION AND DEVELOPMENT)
Environmental Policy Benefits: monetary valuation. Organisation for Economic Co-
operation and Development, Paris, 1990
OECD (ORGANIZATION FOR ECONOMIC COOPERATION AND DEVELOPMENT)
The economic appraisal of environmental projects and policies. A practical Guide,
Paris, 1995
O’HARE, M.
Not on my block you don’t. Facility siting and the strategic importance of
compensation. Public Policy, Vol. 25, No 4, USA, 1977
PEARCE, D. W.
Economics of Natural Resources and the Environment. The Johns Hopkins
University Press. Baltimore, 1990
PEARCE, D. W.
Integrating environment into development planning: where have we got to? In:
WILSON, F. A., Toward sustainable project development. Edward Elgar Publishing
Limited, London, 1997

223
PEARCE, D. W.; TURNER, R. K.
Economics of natural resources and the environment, The Johns Hopkins
University Press, London, 1990
PEARCE, D. W., BARBIER, E.; MARKANDYA, A.
Sustainable Development. Economics and the environment in the third world,
Earthscan Publication Ltd., London, 1990
PERRINGS, C.
Ecological and Economic Values. In: Environmental Valuation. Willis, K.G. and
Corkindale, J.T. CAB International, London, 1995
PEZZEY, J.
Sustainable development concepts. An economic analysis. World Bank
Environmental Paper N° 2, The World Bank, Washington, D. C., 1992
PREST, A. R.; TURVEY, R.
Cost-Benefit Analysis: A Survey. In: Economic Journal, 75, 1968, 683-735
PROIGE et.al. (PROGRAMA DE INVESTIGACIONES GEOGRÁFICAS)
Estudio de Impacto Ambiental del Emisario Submarino para la Ciudad de Limón.
Material mimeografiado. Programa de Investigaciones Geográficas, Fundación de
la Universidad de Costa Rica para la Investigación, Universidad de Costa Rica;
Acueductos y Alcantarillados, y Banco Interamericano de Desarrollo, San José,
Costa Rica, 1999
RODRÍGUEZ RAMÍREZ, J.; HERNÁNDEZ BENAVIDES, J.
Lista oficial de especies de flora y fauna silvestre con poblaciones reducidas y en
peligro de extinsión. In: Web page from the Ministry of the Environment and Energy
(MINAE), Costa Rica, 1998
SCULLY, M. G.
The rhetoric and the reality of sustainability. The Chronicle of Higher Education,
USA, January 28, 2000

224
SOLOW, R.
Sustainability: An economist’s perspective. In: DORFMAN, R.; DORFMAN, N.S.
(eds.), Economics of the environment. Selected readings, 3rd ed., Norton, New
York and London, 1993
SQUIRE, L.; VAN DER TAK, H.G.
Economic analysis of projects. The Johns Hopkins University Press, Baltimore,
1975
TERBORGH, J.
Requiem for Nature. Island Press, USA, 1999
TIETENBERG, T.
Environmental and Natural Resource Economics. Scott, Foresman, and Company,
2° ed., Illinois-USA, 1988
TOSI, J. A. Jr.
Mapa Ecológico según la clasificación de zonas de vida del mundo de L.R.
Holdridge. Tropical Science Center (TSC), Costa Rica, 1969
TSC (TROPICAL SCIENCE CENTER)
Áreas potenciales para la conservación de recursos naturales en Costa Rica, San
José, 1982
TURNER, R. K.
Sustainable environmental management. Belhaven, London, 1988
UNIDO
Guidelines for Project Evaluation, United Nations, New York, 1972
UCR-CCT (UNIVERSIDAD DE COSTA RICA-CENTRO CIENTÍFICO TROPICAL)
Estudio de Cobertura Forestal 1996/1997 y Cambio de Cobertura para el Período
1986/87 y 1996/97 para Costa Rica". San José, 1998

225
UCR; MINAE (UNIVERSIDAD DE COSTA RICA; MINISTERIO DE AMBIENTE Y
ENERGÍA)
Seminario-taller. Procedimientos de Evaluación de Impacto ambiental. Universidad
de Costa Rica, Vicerrectoría de Acción Social, Facultad de Ingeniería, Laboratiorio
de Metrología, Normalización y Calidad. Ministerio del Ambiente y Energía,
Secretaría Técnica Nacional Ambiental, Costa Rica, 1997
VEEMAN, T.S.
Sustainable agriculture: an economist’s reaction in Canadian Journal of Agricultural
Economics, Vol. 39, 1991, p. 587-589
VEEMAN, T.S.
Sustainable development: its economic meaning and policy implications. Canadian
Journal of Agricultural Economics, Vol. 37, (4), 1989, p. 875-76
VOGEL, J. H.
El uso exitoso de instrumentos económicos para fomentar el uso sustentable de la
biodiversidad: seis estudios de caso de América Latina y el Caribe. Programa de
Apoyo a la Biodiversidad, Santa Cruz de la Sierra, Bolivia, 1996
VOGEL, J. H.
No abrir nueva carreteras: una directriz práctica para aliviar la pérdida de
biodiversidad en la Amazonia. In: PICARDI, T (ed.). La economía ecológica: una
nueva mirada a la ecología humana. CESU-UMSS/UNESCO. Plural Editores, La
Paz, Bolivia, 1999, p. 443-461
WCED (WORLD COMMISSION ON ENVIRONMENT AND DEVELOPMENT)
Our common future. Oxford University Press, New York, 1987
WEISS, C. H.
Evaluierungsforschung: Methoden zur Einschätzung von sozialen
Reformprogrammen, Westdeutscher Verlag GmbH, Opladen, Germany, 1974

226
WEISBROD, B. A.
Income Redistribution Effects and Benefit-cost Analysis, in CHASE, S.B., (ed.),
Problems in Public Expenditure Analysis, Brooking, Washington, 1968
WHITTINGTON, D.; MACRAE, D. Jr.
The issue of standing in cost-benefit analysis, In: Journal of Policy Analysis and
Management, Vol. 5, No 4, 1986, p. 665-682
WILLIS, K. G.; CORKINDALE, J. T.
Environmental valuation. New perspectives. CAB International, London, 1995
WORLD BANK
Environment, growth, and development. Washington, D. C., 1987
WORLD BANK
Economic Analysis of Agricultural Projects. EDI series in Economic Development.
Maryland, USA, 1994
WORLD BANK
EA methods and techniques. Environmental Assessment Sourcebook, Washington,
D. C., 1995
WORLD BANK
World Bank’s environmental activities. Web Page, Washington, D. C., 1996
WORLD BANK
Statistics about Costa Rica. Web Page, Washington, D. C., 1999

227
GLOSSARY Definition of Key Concepts
228
Absorptive (assimilative) capacity It is the ability of the environment to absorb pollutants (TIETENBERG 1988). Bequest value Non-use value obtain from the desire to pass the asset to future generations (PERRINGS 1995), Figure. Common property goods Those that are not exclusively controlled by a single party and which access is not restricted (TIETENBERG 1988). Cost-benefit analysis (CBA) PREST and TURVEY 1968 defined it on the following way: ”Maximize the present value of all benefits less that of all costs, subject to specified constraints”. Direct use value Value derive from the direct use of the resource (PERRINGS 1995), see Figure. Distributional cost-benefit analysis (distributional CBA) Also called in literature social CBA, it refers to the use of distributional weights in the - traditional - CBA, to account not only for economic efficiency, but for income distribution (BRENT 1996). It is constructed from the society perspective. Entropy Amount of energy not available for work (TIETENBERG 1988). Environmental cost-benefit analysis (environmental CBA) It refers to separating the environmental benefits or costs from the distributional CBA and applying them environmental quality based weights. Therefore, it refers to the calculation of the NPV of weighted benefits, using distributional and environmental weights respectively. It is also made from the society’s perspective. Existence value Non-use value derive from the pleasure of something - a resource - to exist (PERRINGS 1995).

229
Externalities They are the negative (positive) effects of an activity/project on other parties, which are not taken into account as a cost (benefit), because there exists no real market for their transaction. In other words, when the welfare of a party depends not only on his/her activities, but also on the activities of some other(s) or; when an action of one economic agent affects the utility or production possibilities of another in a way that is not reflected in the marketplace (JUST, HUETH, AND SCHMITZ 1982; TIETENBERG 1988; JAMES 1994; BRENT 1996). Figure: Categories of economic values attributed to environmental assets
Total economic
value
Personal use values
Non-use values
Direct use Values
Indirect use values
Options values
Bequest values
Existence values
Outputs that can be consumed
directly
Functional benefits
Future direct and indirect use values
Value of leaving use
and non-use values for offspring
Value from knowledge of
continued existence base on e.g. moral
conviction
• Food • Biomass • Health
• Ecological functions
• Flood control
• Storm protection
• Biodiversity • Conserved
habitats
• Habitats • Irreversible
changes
• Habitats • Endangered
species
Decreasing ”tangibility” of value to individuals Source: MUNASINGHE 1992.

230
Indirect use value Value not derive from the direct use of the resource, but from its side-products (PERRINGS 1995), see Figure. Internalization of externalities It is to impose offenders the full costs (benefits) of their actions on other parties. In other words, to assign the full costs and benefits of an action to those who undertake the action. Natural resource base Refers to the natural resources as a capital - natural or environmental - stock, which is capable of producing goods and services as support for development. When the natural resource base is degenerated, diminishes its productive capacity, which makes the owner of the resources poorer or less wealthy, in turn that is not sustainable. The owner of the resources are the present and/or future generations, therefore, the value of the natural resources should be not deteriorated in the present or restored in the long-term. It is also worth to notice that some environmental or natural assets are easy to restore, others not at all. Non-use value Value derive from knowing that something exist and not using it directly or indirectly (MÜLLER 1997). In other words, the value accorded to the resource independently of whether it is put to use (PERRINGS 1995). Option value Value derive from the option to benefit directly or indirectly from use of the asset in the future (PERRINGS 1995), see Figure. Owner’s Cost-Benefit Analysis Perspective (Owner’s CBA) Sometimes called in literature financial appraisal or financial CBA, is a private191 point of view of the development project, which measures the benefits and costs using the market prices. This project’s profile is given by the net cash flows, which are the difference between all the receipts and expenditures that are expected to occur during the project’s lifetime (JENKINS, HARBERGER 1990). Upon this net cash flow, the net present value (NPV) of the project is calculated using the market discount rate (JAMES 1994). Private and social discount rate The discount rate is used in CBA to convert the annual stream of benefits and costs to present values. The private discount rate is the market rate of interest and the social discount rate includes the preferences of future generations (BRENT 1996).
191 Generally the investor and/or owner’s of the project point of view; although it could be done from the perspective of any affected party.

231
Private benefits and costs They are the financial receipts and outlays as measured by market prices (BRENT 1996). Private goods A private good has two properties: exclusivity and rivalry. Exclusivity means that it is possible to exclude others from its consumption and rivalry that is the production of additional amounts involves extra costs of production (JOHANSSON 1993). Public goods A public good is one that is available to everyone at free cost and has two properties: non-excludable and non-divisible. Non excludable means that when the good is produced no one can be excluded from its consumption and non-divisible means that additional households may use it at virtually zero marginal costs (JOHANSSON 1993). Shadow price Real prices without market imperfections - distortions -, such as subsidies or taxes (JENKINS, HARBERGER 1990). Social or economic benefits and costs Benefits and costs given by the standard principles of welfare economics. Benefits are the consumer’s willingness to pay for the project (consumer surplus) and costs are what the losers are willing to receive as compensation for giving up the resources (BRENT 1996). Standing ”The quality (for a person or other entity) of being counted in an analysis, as embodying values” (MACRAE, WHITTINGTON 1997). For the purpose of this study, standing will be define according to the significance of the project’s impacts (see Chapter 3). Stakeholders They are the different interest/social groups or parties that are affected by or that affect a project. This definition combines ethical and political aspects (MACRAE, WHITTINGTON 1997). Sustainable development The most commonly accepted - Brundtland - definition states that sustainable development is ”satisfying the needs of the present generation without compromising the satisfaction of the needs of future generations” (WCED 1987). However, the sustainability criterion from OECD 1995, concretely states that sustainable projects should observe the following criteria: place economic values on environmental costs and benefits, avoid damage to critical natural capital so far as possible, avoid irreversible processes, limit the use of renewable natural assets to their sustainable yield (otherwise, including the costs of replacing these assets, i.e. through a ”compensatory” project), and use appraisal values to determine ”green” prices for use in the real world.

232
Furthermore, if the principle of justice for future generations means to maintain the production capacity of natural resources ”…[k]eeping options open, implies preserving biodiversity, keeping variety in representative landscapes and habitats, avoiding the extinction of species, slowing down the exploitation of scarce finite resources, collecting data and investing in information about the natural world and environmental processes” (OECD 1995). Total economic value It consists of its use value and non use value, see Figure. The economic valuation of environmental impacts is based on the concept of the total economic value of environmental assets, which tries to value the real ”shadow” effect (cost or benefit) of the environmental impact on the assets, not only what the market in some cases reflects (MÜLLER 1997). Traditional Cost-Benefit Analysis (traditional CBA) Sometimes called in literature the economic appraisal, it is the - efficiency - point of view of society, which measures the benefits and costs using the shadow ”social” prices192. The project’s profile is made up of the flow of net economic benefits generated by the investment (JENKINS, HARBERGER 1990). Upon the economic cash flow, the NPV is calculated for project ranking using the social discount rate (JAMES 1994). In short, it is a more specific variation of the - owners - CBA, which extends it to the area of government decision-making by replacing ”private” - financial - benefits and costs with economic - social - benefits and costs (BRENT 1996). Use value Refers to the value derive from using the resource, directly or indirectly (MÜLLER 1997). Or following PERRINGS 1995, the value of the services provided to the user. Willingness to pay Reflects the income that users are willing to forgo in order to obtain an (environmental) good and/or service (JOHANSSON 1992, JAMES 1994, BRENT 1996)
192 Which correct for distortions in the economy (JAMES 1994).

216
ANNEX

217
Annex 1 Questionnaire for tourists in Santa Elena (English and Spanish)
The purpose of this survey is to identify the minimum service requirements tourists demand in the Santa Elena Preserve, which is a living example of a sustainable project - operated by the local community and high school. It will also seek to identify aspects deemed important in order to make recommendations about how to improve the management of the natural resources. Because only a few from the many people who visit this region every year have been selected, your participation is extremely important. Please fill out every question. The information that you provide will be strictly confidential (for that reason we do not ask to write your name) and serve only statistical and educational purposes. Thank you very much for your time. I Information about the Santa Elena Preserve 1. Is this your first visit to Costa Rica? __ y __ n. To Santa Elena? __ y __ n. 2. Where did you spend the previous night to arrival to the Santa Elena area? ____ . 3. Was the visit to the preserve the primary reason of your trip to Costa Rica?_ y _ n. 4. How did you get to Santa Elena? a) rented car ___ b) public bus ___ c) tour bus ___ d) other ___ , please specify __________________________. 5. What activities are the most important for you in the preserve? a) hiking ___ b) bird watching ___ c) animal watching ___ d) rest & relaxation
___ e) scientific research ___ f) other ___ , please specify _____. 6. How long will your visit to the Santa Elena region be? ___ days. If more than one
day, where are you staying?_________________________________________ . 7. How many days will you visit the Santa Elena Preserve? ___ days. What other
preserves will you visit? ____________________________________________ . 8. How much do you plan to spend in total for this trip to Santa Elena (US$)? a) room $ ___ b) souvenirs $ ___ c) transportation $ ___d) gasoline $ __ e) food $ ___ f) other $ ___ , please specify ___________ g) TOTAL $_____.

218
9. What additional services would you like to see here in Santa Elena? Do you think any of the following would be desirable in the Santa Elena Preserve?
a) drugstore __ b) bus transportation __ c) slide show __ d) museum ___ e) zoo ___ f) restaurant ___ e) souvenir’s shop ___ f) hostel___ g) other ___ , please specify ______________________________________. 10. Would you like to visit the Santa Elena Preserve again in the future? ___ y ___ n. 11. Would you recommend to visit this preserve to your friends? ___ y ___ n. 12. The Santa Elena Preserve is a community-operated project in an almost entirely
pristine 308 ha. Forest (83 %), very rich in flora and fauna, which revenues finance forest conservation, - environmental - education (primary and high school), and a revolving credit fund to promote sustainable local businesses, in order to diminish pressure over the area’s natural resources. Suppose that the preserve is now on risk of bankruptcy, therefore the amount charge as an entrance fee will be changed: What is the maximum amount of money you are willing to pay as an entrance fee (in US$)? a) $ 0-3 ___ b) $ 4-6 ___ c) $ 7-9 ___ d) $ 10-12 ___
e) $ 13-15 ___ f) $ 16-20 ___ g) 20-30___ h) other $______. 13. Now suppose the community of Santa Elena is considering buying more land for the
preserve which is presently at risk of being deforested. In addition to the entrance fee and as a one time payment, what is the maximum amount of money you would be willing to contribute with to enlarge this preserve (in US$)?
a) $ 0 ___ b) $ 1-10 ___ c) $ 11-30 ___ d) $ 31-100 ___ e) $ 101-300 ___ f) $ 301-600 ___ g) $ 601-1000___ h) other ___ , please specify $___. 14. Have you shown support to the Santa Elena Project? y___ n___. How? _______ . 15. The Santa Elena Project started 7 years ago and provoke several positive and
negative social, economic, and environmental impacts. What is your opinion about the importance of these impacts? Please rank from 1 to 5 the following impacts. 1= most important, 2= second most important, …, 5= least important.
a) forest conservation ___ b) local employment ___ c)income generation ___ d) cultural shock ___ e) trials degradation __ f) higher land value __. 16. What changes would you recommend to carry out on the operation of this preserve?
__________________________________________________ . 17. How much would you be willing to pay for the following services?
Activity expected payment (US$)
a) hotel (per night) b) restaurant (per meal) c) horse-rental (per hour) d) zoo (entrance fee) e) slide show (entrance fee) f) other ( )

219
II Visitor information 18.Where do you live?: __________________ . Country of citizenship? ___________ 19. What year were you born? ______. Sex: m ___ f ___ . 20. Marital status: single ___ married ___ divorced ___ other ___ , specify __. 21. Highest educational level: Elementary ___ High school ___ Junior high__
Bachelor ___ Master ___ Ph.D. ___ .
22. Are you currently: employed ___ unemployed ___ homemaker ___ student ___ own business ___ retired ___ . If employed, please specify occupation: _____________________________ . 23. What is your individual income per year (in US$)? (check one) ___ under US$ 20,000 ___ 70,001-100,000 ___ 20,001-30,000 ___ 100,001-130,000 ___ 30,001-50,000 ___ 131,000-200,000 ___ 50,001-70,000 ___ more than US$ 200,001 24. Limitation, comments: Please use the back of this page. Thank you very much.
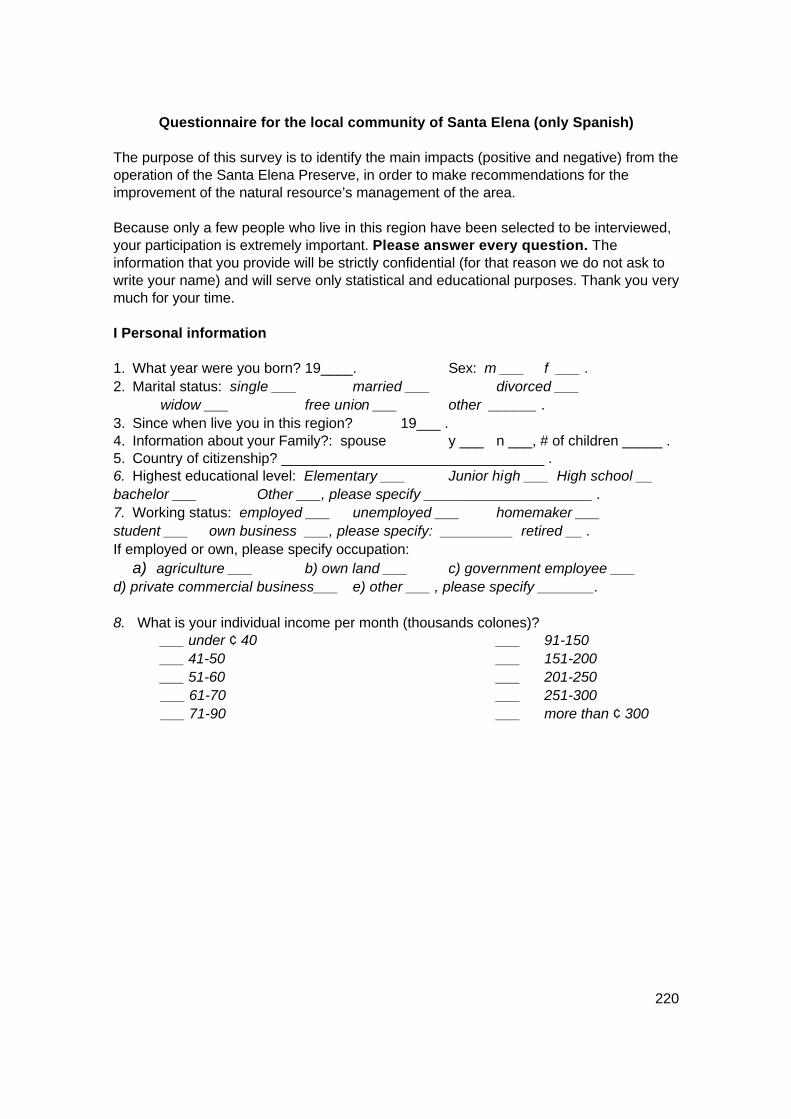
220
Questionnaire for the local community of Santa Elena (only Spanish) The purpose of this survey is to identify the main impacts (positive and negative) from the operation of the Santa Elena Preserve, in order to make recommendations for the improvement of the natural resource’s management of the area. Because only a few people who live in this region have been selected to be interviewed, your participation is extremely important. Please answer every question. The information that you provide will be strictly confidential (for that reason we do not ask to write your name) and will serve only statistical and educational purposes. Thank you very much for your time. I Personal information 1. What year were you born? 19____. Sex: m ___ f ___ . 2. Marital status: single ___ married ___ divorced ___
widow ___ free union ___ other ______ . 3. Since when live you in this region? 19___ . 4. Information about your Family?: spouse y ___ n ___, # of children _____ . 5. Country of citizenship? _________________________________ . 6. Highest educational level: Elementary ___ Junior high ___ High school __ bachelor ___ Other ___, please specify _____________________ . 7. Working status: employed ___ unemployed ___ homemaker ___ student ___ own business ___, please specify: _________ retired __ . If employed or own, please specify occupation:
a) agriculture ___ b) own land ___ c) government employee ___ d) private commercial business___ e) other ___ , please specify _______. 8. What is your individual income per month (thousands colones)?
___ under ¢ 40 ___ 91-150 ___ 41-50 ___ 151-200 ___ 51-60 ___ 201-250 ___ 61-70 ___ 251-300 ___ 71-90 ___ more than ¢ 300

221
II The Santa Elena community 9. Do you work with tourism __ y __ n. If yes, what are their most important activities
inside the preserve? a) hiking ___ b) bird watching ___ c) animal watching ___ d) rest & relaxation ___ e) scientific research ___ f) other __ , please specify __. 10. And out of the preserve, what are the main activities for tourists? hiking ___ b) horse riding ___ c) tours ___ d) rest & relaxation ___ e)
scientific research ___ f) other ___ , please specify _____________________ . 11. How long is the average tourist visit to this region? ___ days. If more than one day,
where do they stay?____________________________________________ . 12. What additional services do you think are useful here in Santa Elena? Do you think any of the following would be desirable in the Santa Elena Community? a) pharmacy ___ b) bus transportation ___ c) slide show ___ d) museum ___ e) zoo ___ f) restaurant ___ g) souvenir’s shop ___ h) hostel___ i) other ___ , please specify __________. III The Santa Elena Project 13. Do you work directly in the Santa Elena Preserve? __ y __ n please specify
how?______________________________________________________ . 14. Do you benefit directly from the existence of the Santa Elena Project? __ y __ n.
Why? _____________________________________________________. 15. Suppose the Santa Elena Project is considering selling the forest of the preserve for
wood production. What is the minimum amount of money a year you would be willing to accept as a compensation for loss of income related to the preserve (thousands colones per year)?
a) ¢ 0 ___ b) less than 50__ c) 51-100 ___ d) 101-200 ___ e) 201-300 __ f) 301-400 ___ g) ¢ 401-500 ___ h) other ___, please specify _____. 16. Now suppose the community of Santa Elena is considering buying more land for the
preserve. What is the maximum amount of money you would be willing to contribute with to enlarge this preserve (thousands colones per year)?
a) ¢ 0 ___ b) less than 1 ___ c) 1-5 ___ d) 5-10 ___ e) 10-20 ___ f) 20-40 ___ g) ¢ 40-60 ___ h) other ___ , please specify _____.

222
17. What are the effects from the operation of the Santa Elena Preserve on you? (For every effect please compared before and after the project and quantify it in accordance to the following scale: 1- very bad, 2- bad, 3- regular, 4- good, 5- excellent).
EFFECT DETAIL BEFORE AFTER
a) employment b) roads c) schools d) tourist visitation e) pollution f) income g) community infrastructure h) flora and fauna i) land value j) other, please specify
18. The Santa Elena Project started 7 years ago and provoke several positive and
negative social, economic, and environmental impacts. What is your opinion about the importance of these impacts? Please rank from 1 to 5 the following impacts. 1= most important, 2= second most important, …, 5= least important.
a) forest conservation ___ b) local employment ___ c)income generation ___ d) trials degradation ___ e) cultural shock ___. 19. Did you agree to open up the Santa Elena Preserve? y ___ n ___. a.- If yes, have you shown anyhow your approval? y ___n ___. Please specify how?
______________________________________________________ . b.- If no, have you shown anyhow your disapproval? y __ n ___. Please specify how?
______________________________________________________ . 20. What changes would you recommend to carry out on the operation of this preserve?
___________________________________________________ . 21. Limitation, comments: Please use also the back of this page when necessary. Thank
you very much.
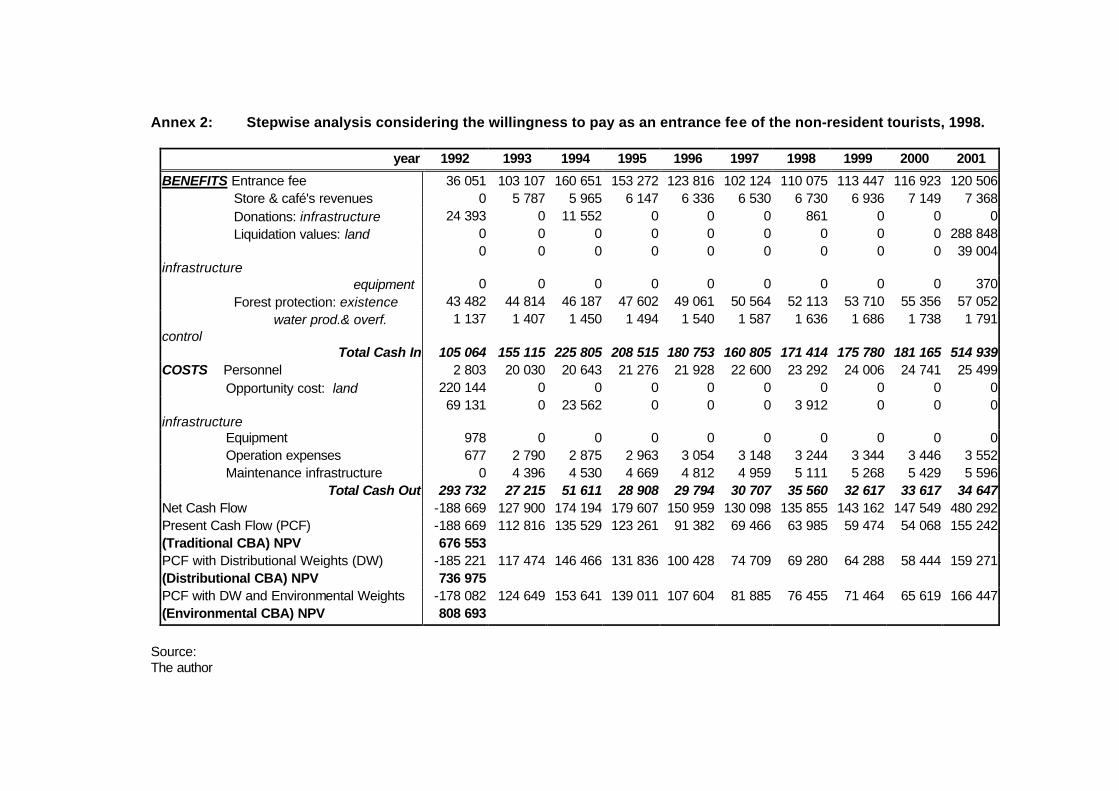
Annex 2: Stepwise analysis considering the willingness to pay as an entrance fee of the non-resident tourists, 1998.
year 1992 1993 1994 1995 1996 1997 1998 1999 2000 2001
BENEFITS Entrance fee 36 051 103 107 160 651 153 272 123 816 102 124 110 075 113 447 116 923 120 506 Store & café's revenues 0 5 787 5 965 6 147 6 336 6 530 6 730 6 936 7 149 7 368 Donations: infrastructure 24 393 0 11 552 0 0 0 861 0 0 0 Liquidation values: land 0 0 0 0 0 0 0 0 0 288 848 infrastructure
0 0 0 0 0 0 0 0 0 39 004
equipment 0 0 0 0 0 0 0 0 0 370 Forest protection: existence 43 482 44 814 46 187 47 602 49 061 50 564 52 113 53 710 55 356 57 052 water prod.& overf. control
1 137 1 407 1 450 1 494 1 540 1 587 1 636 1 686 1 738 1 791
Total Cash In 105 064 155 115 225 805 208 515 180 753 160 805 171 414 175 780 181 165 514 939 COSTS Personnel 2 803 20 030 20 643 21 276 21 928 22 600 23 292 24 006 24 741 25 499 Opportunity cost: land 220 144 0 0 0 0 0 0 0 0 0 infrastructure
69 131 0 23 562 0 0 0 3 912 0 0 0
Equipment 978 0 0 0 0 0 0 0 0 0 Operation expenses 677 2 790 2 875 2 963 3 054 3 148 3 244 3 344 3 446 3 552 Maintenance infrastructure 0 4 396 4 530 4 669 4 812 4 959 5 111 5 268 5 429 5 596
Total Cash Out 293 732 27 215 51 611 28 908 29 794 30 707 35 560 32 617 33 617 34 647 Net Cash Flow -188 669 127 900 174 194 179 607 150 959 130 098 135 855 143 162 147 549 480 292 Present Cash Flow (PCF) -188 669 112 816 135 529 123 261 91 382 69 466 63 985 59 474 54 068 155 242 (Traditional CBA) NPV 676 553 PCF with Distributional Weights (DW) -185 221 117 474 146 466 131 836 100 428 74 709 69 280 64 288 58 444 159 271 (Distributional CBA) NPV 736 975 PCF with DW and Environmental Weights -178 082 124 649 153 641 139 011 107 604 81 885 76 455 71 464 65 619 166 447 (Environmental CBA) NPV 808 693
Source: The author