Influence ofdifferent agriculturallanduse onsoil ... ofdifferent agriculturallanduse onsoil...
25
Influence of different agriculturallanduse on soil properties along the Aus tri an- Hungarian border Dedicated to Univ. Prof Dipl.-Ing. Dr. Dr. h.c. mult. Winfried E. H Blum, on the occasion o[ his 6(fh birthday N. Rampazzo and A. Mentler Einfluß unterschiedlicher landwirtschaftlicher Landnutzung auf Bodeneigen- schaften entlang der österreichisch-ungarischen Grenze Herrn o. Univ.-Prof Dipl.-Ing. Dr. DDDr. h.c. Winfried E. H Blum zum 60. Geburtstag gewidmet 1. Introduction and definition of the aims Wirh change of the landuse, alterations of the soil status can be expected. The influence of cultivation on soil properties has been studied by several scientists. EHLERS (1973) com- pared untillaged and tillaged soils with regard to their total porosiry, TISCHLER and ALTERMANN (1992) reported on increased soil microbial activities in green fallows as corn- pared with those of arable soils. Similar conclusions were drawn by SCHLEUS and BLUME (1991) and HEILMANN and BEESE (1991). The effects of different cultivation practices on the soil biology were studied byFRANK and MALKOLMES (1993), KANDELER and MURER (1993), LINN and DORAN (1984), WOLTERS andJOERGENSEN (1992). After opening of rhe border between Austria and Hun- gary and the following removal of the so-called "Iran Cur- tain", a unique opportunity was given for a pedological .cornparison between undisturbed soils from the borderland and adjacent agricultural soils of Austria and Hungary, affected ta different degradation, Mineralogieal, physical, micromorphological, chemical, microbiological and ZOQ- logical soil analyses were carried out at three cross seetions (transects), each reachingfrom the intensive cultivated Aus- trian site over the undisturbed Iron Curtain to the extensive cultivated Hungarian site, aiming at an evaluation of changes in the soil status (degradation) of the arable fields through different agricultural management, Zusammenfassung Österreichische und ungarische landwirtschaftliche Böden (3 Transekte mit unterschiedlichen Bodentypen und Nut- zungen) wurden mit früheren unbewirtschafteten Referenzböden des ehemaligen "Eisernen Vorhanges" verglichen. Die maschinelle Bewirtschaftung führte zu Verdichtungseffekten wie höhere Lagerungsdichte, Verlust an Porosität und geringere Aggregatstabilität. Die Referenzbödenhatten eine gut entwickelte Krümelstruktur, während die bearbeiteten Böden eine blockig-prismatische Struktur entwickelten. Die bewirtschafteten Böden zeigten einen Verlust an organi- scher Substanz, an Kationenaustauschkapazität, an Nährelementen, eine Abnahme der mikrobiologischen und zoolo- gischen Aktivität sowie des Wurzelwachstums. Die ungarischen Böden wiesen aufgrund hoher Applikationen an P- Düngemitteln höhere Gehalte an Schwermetallen auf, während auf österreichischerSeite höhere Cd-Gehalte gemessen wurden. Die mikrobiellen Aktivitäten (SIR, Basalrespiration. DRA) zeigten eine hohe positive Korrelation zum Gehalt an organischer Substanz sowie Gesamtstickstoff im Boden. Das Verhältnis Ergosterol/C mic bestätigte die starke Abhän- gigkeit der pilzliehen Verteilung im Boden vom pH-Wert. Der physiologische Quotient der Bodenorganismen in den bearbeiteten Böden war stark durch die Zufuhr leicht zersetzbarer organischer Substanz reguliert. Das C . je mic arg Verhältnis der Referenzböden zeigte das natürliche Gleichgewicht zwischen Zu- und Abfuhr organischer Substanz. Die- ses Gleichgewicht war in den bearbeiteten Böden verändert. Der Effekt unterschiedlicher Bodennutzung auf die Regen- wurmpopulation konnte wegen besonderer Trockenheit im Untersuchungszeitraum nicht eindeutig festgestellt werden. Schlagworte: Badendegradation, landwirtschaftliche Nutzung, Bodenstruktur, Bodennährstoffe, Bodenbiologie. Die Bodenkultur 89 52 (2) 2001
-
Upload
nguyenquynh -
Category
Documents
-
view
215 -
download
2
Transcript of Influence ofdifferent agriculturallanduse onsoil ... ofdifferent agriculturallanduse onsoil...
Influence of different agriculturallanduse on soil propertiesalong the Austrian-Hungarian border
Dedicated to Univ. Prof Dipl.-Ing. Dr. Dr. h.c. mult. Winfried E. H Blum, on the occasion o[his 6(fh birthday
N. Rampazzo and A. Mentler
Einfluß unterschiedlicher landwirtschaftlicher Landnutzung auf Bodeneigenschaften entlang der österreichisch-ungarischen Grenze
Herrn o. Univ.-Prof Dipl.-Ing. Dr. DDDr. h.c. Winfried E. H Blum zum 60. Geburtstag gewidmet
1. Introduction and definition of the aims
Wirh change ofthe landuse, alterations ofthe soil status can
be expected. The influence of cultivation on soil properties
has been studied by several scientists. EHLERS (1973) com
pared untillaged and tillaged soils with regard to their total
porosiry, TISCHLER and ALTERMANN (1992) reported on
increased soil microbial activities in green fallows as corn
pared with those of arable soils. Similar conclusions were
drawn by SCHLEUS and BLUME (1991) and HEILMANN andBEESE (1991). The effects of different cultivation practices
on the soil biology were studied byFRANK and MALKOLMES
(1993), KANDELER and MURER (1993), LINN and DORAN
(1984), WOLTERS andJOERGENSEN (1992).
After opening of rhe border between Austria and Hun
gary and the following removal of the so-called "Iran Curtain", a unique opportunity was given for a pedological
.cornparison between undisturbed soils from the borderland
and adjacent agricultural soils of Austria and Hungary,affected ta different degradation, Mineralogieal, physical,
micromorphological, chemical, microbiological and ZOQ
logical soil analyses were carried out at three cross seetions
(transects), each reachingfrom the intensive cultivated Aus
trian site over the undisturbed Iron Curtain to the extensive
cultivated Hungarian site, aiming at an evaluation of
changes in the soil status (degradation) of the arable fields
through different agricultural management,
ZusammenfassungÖsterreichische und ungarische landwirtschaftliche Böden (3 Transekte mit unterschiedlichen Bodentypen und Nut
zungen) wurden mit früheren unbewirtschafteten Referenzböden des ehemaligen "Eisernen Vorhanges" verglichen. Die
maschinelle Bewirtschaftung führte zu Verdichtungseffekten wie höhere Lagerungsdichte, Verlust an Porosität und
geringere Aggregatstabilität. Die Referenzbödenhatten eine gut entwickelte Krümelstruktur, während die bearbeiteten
Böden eine blockig-prismatische Struktur entwickelten. Die bewirtschafteten Böden zeigten einen Verlust an organi
scher Substanz, an Kationenaustauschkapazität, an Nährelementen, eine Abnahme der mikrobiologischen und zoolo
gischen Aktivität sowie des Wurzelwachstums. Die ungarischen Böden wiesen aufgrund hoher Applikationen an P
Düngemitteln höhere Gehalte an Schwermetallen auf, während aufösterreichischer Seite höhere Cd-Gehalte gemessen
wurden. Die mikrobiellen Aktivitäten (SIR, Basalrespiration. DRA) zeigten eine hohe positive Korrelation zum Gehalt
an organischer Substanz sowie Gesamtstickstoffim Boden. Das Verhältnis Ergosterol/Cmic bestätigte die starke Abhän
gigkeit der pilzliehen Verteilung im Boden vom pH-Wert. Der physiologische Quotient (~02) der Bodenorganismen
in den bearbeiteten Böden war stark durch die Zufuhr leicht zersetzbarer organischer Substanz reguliert. Das C . jemic argVerhältnis der Referenzböden zeigte das natürliche Gleichgewicht zwischen Zu- und Abfuhr organischer Substanz. Die-ses Gleichgewicht war in den bearbeiteten Böden verändert. Der Effekt unterschiedlicher Bodennutzung aufdie Regen
wurmpopulation konnte wegen besondererTrockenheit im Untersuchungszeitraum nicht eindeutig festgestellt werden.
Schlagworte: Badendegradation, landwirtschaftliche Nutzung, Bodenstruktur, Bodennährstoffe, Bodenbiologie.
Die Bodenkultur 89 52 (2) 2001

N. Rampazzo and A. Mender
SummaryAustrian and Hungarian agricultural soils (3 transects with different soil type and cultivation system) were compared with the former uncultivated "Iron Curtain" reference soils. The cornpacting effects of cultivation werereflected in the higher bulk density, the decrease of total porosity, soil aggregate srability and of coarse pores. In theuncultivated areas a more crumby structure was observed, whereas in the tilled soils a subangular, cracky microstructure was developed. The cultivated soils showed a decrease of soil organic matter, of CECeff' a loss of nutrients, areduced microbial activiry, a reduction of root growth and faunal activities in the tillaged horizons. In the Hungarian soil an enhanced content of heavy metals (As, Co, Cr, Cu, Mo, Ni, Sr, Zn) were found due to applicationofhigh dosages ofP-fertilizers. In Austria a higher Cd-content could be traced. The microbial activities (SIR, basalrespiration, DRA) were strongly positive correlated to the amount ofsoil organie matter and to the Nt content inthe soils. The ergosterollCmic-ratio, showed that the fungal distribution in the soils was mostly influenced by thepH-value. The physiological status (qC02) ofthe soil microorganisms in the arable soils was governed by the input
of easily degradable organic materials. The CmiclCor -ratio of the reference soils expressed the natural equilibriumbetween input and output of organic matter. In the ~rable soils this equilibrium was disturbed. The effects of different cultivation systems on the earthworm population could not be definitively evaluared because of the very dryconditions during analyses.
Keywords: Soil degradation, agricultural practices, soil structure, soil nutrients, CEC, soil biology.
90
2. Material and methods
2.1 General site description
The Austrian part of the studied fields is located in theOberpullendO'lfir Basin (formerly Landseer Bay) and turnseast into the Repce Terrace Miere-Region, where rhe Hungarian studied sites are located. Important rivers in rhis areaare the Rabnitz (Repce) and the Stoob. All waters drain insouth-eastern and eastern direction, The OberpullendorftrBasin was created by declination in the Tertiary Age andflooded in the Miocene Age, with different kinds of sedirnents consisting ofblock gravel, marine sands, sandy limestone and clay marl. In the Quaternary Age, the tertiarysediments were covered by loess, aeolian sand, glacialloamsand alluvials during glacial and interglacial periods. Thelandscape in the basin is distinguished by gende hills andterraces with a mean elevation of 167 m a.s.l, The continental climate is predominant all over the investigatedregion, with an annual average temperature of 9° C. Thelang vegetation period of235 till250 days between Marchand November reflects the favourable climate of this area.Typical streng N-NWwinds (2-3 rn/sec) cause high evaporation rares up to 700 mm.
Theannual mean precipitation reaches 700 mrn, 55 % ofit occuring during the vegetation period.
Die Bodenkultur
2.2 Description ofthe investigated transects and soils
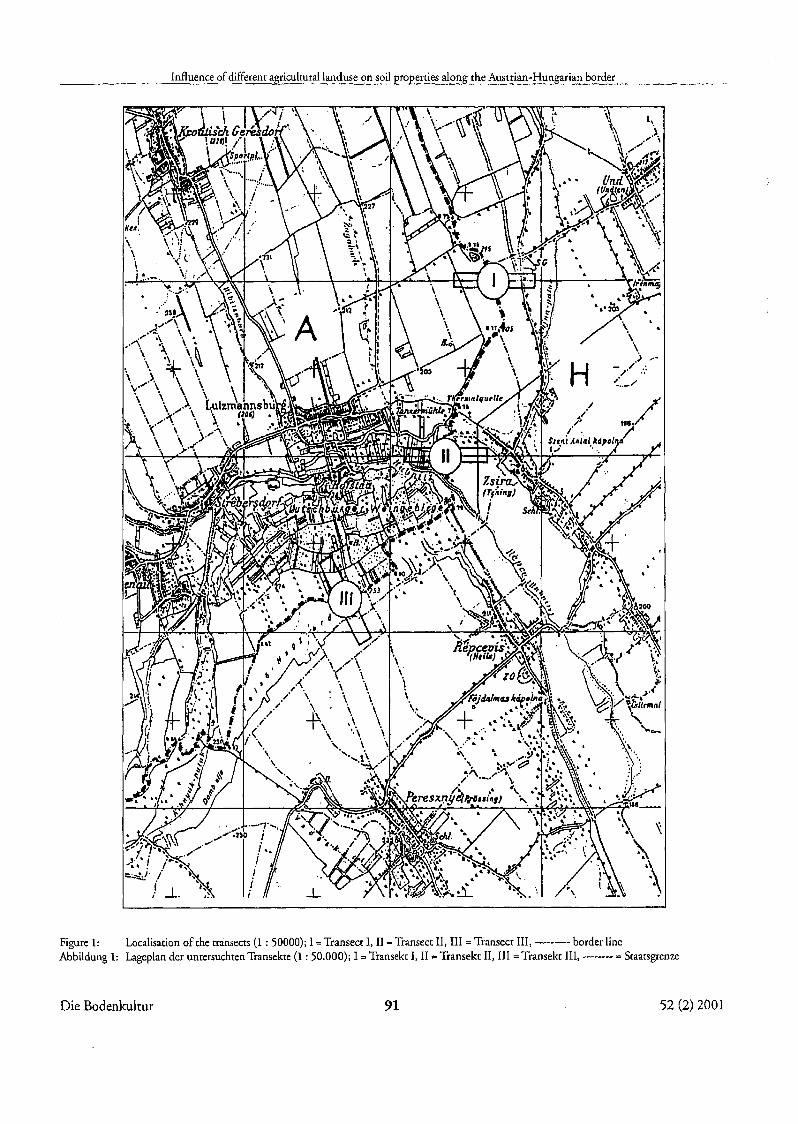
For the purpose of the study 3 transects were selected, eachofthem composed ofthe reference plot (= lron Curtainborderline), which has not been cultivated for the last 50 years,the Austrian cultivated plot, subjected to intensive smallscale farming and the Hungarian cultivated plor, subjectedto extensive large scale farming, as shown on figure 1. Inorder to get a specific variability, different soil types and cultivation managements were selected between the 3 transects, but identical along each transect. The crop andmanagement history are shown in table 2. The conventional soil management practices consist of tillage involvingmoldboard plow, followed by disking or harrowing, application of chemical fertilizers and weed control by chemicalherbicides. No tillage means no soil disturbance, weed control by herbicides.
At a distance of 100 m east and west from the border soilprofiles were dug in the adjacent Austrian and Hungarianagricultural areas. For sampling the arable soil, an area of50 mx 50 m on both sides (Austria and Hungary) of theborder was marked off. The sampies of the undisturbedborderland were taken from a defined area of10m x 10m,consequently each transeet is composed of3 investigationplots and the samples are designated as shown on table 1.
52 (2) 2001
Influenee of different agriculrural landuse on soil properties along the Austrian-Hungarian border
Figure 1: Localisationof the transects(1 : 50000); I =Transeet I, II =Transeet II, III =Transecr IIl, --------- border lineAbbildung 1: Lageplander untersuchten Transekte (l : 50.000); I = Transekt I, Il = Transekt II, III = Transekt III, ------- = Scaacsgrenze
Die Bodenkultur 91 52 (2) 2001
N. Rampazzo and A. Mentler
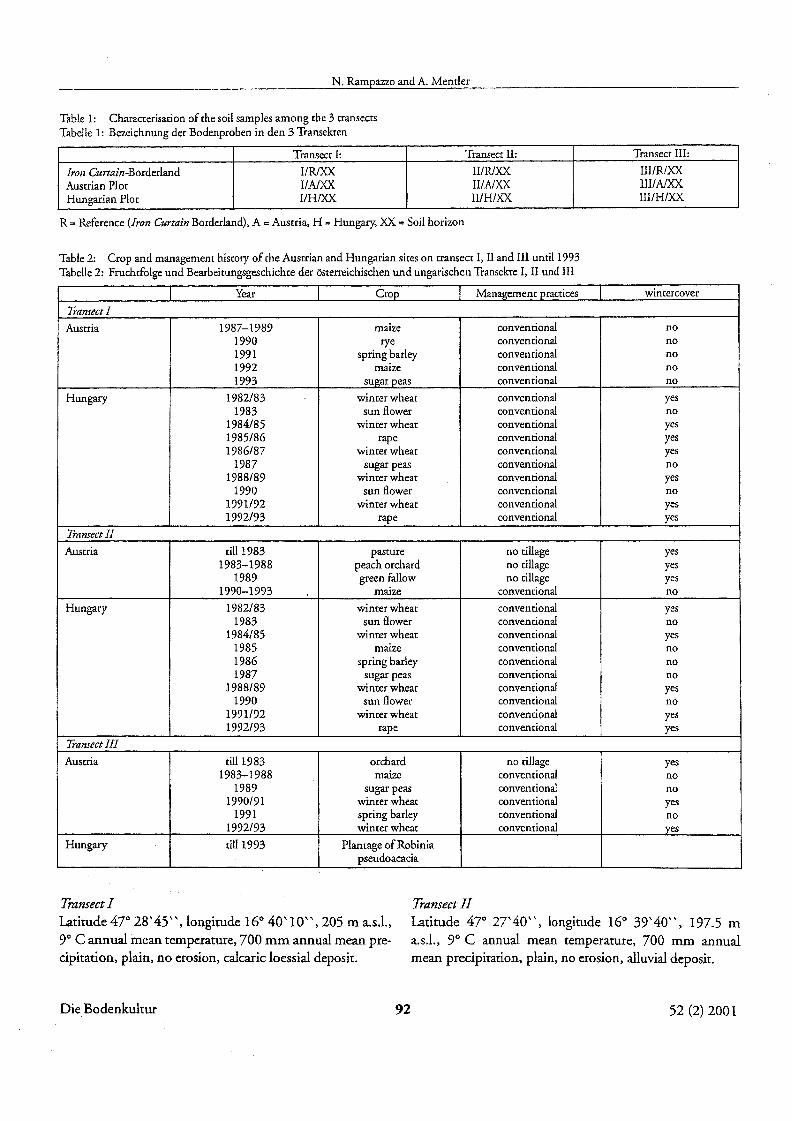
Table 1: Characterisarion ofthe soil sampies arnong the 3 transecrsTabelle 1: Bezeichnung der Bodenproben in den 3 Transekren
Transeer I: TranscerII: Transecr III:
Iron Curtain-Borderland IIR/XX IIIRJXX III/R/XXAusrrian Plor IIAIXX IIINXX IIIINXXHungarian Plor IIH/XX IIIH/XX III/H/XX
R =Referenee (Iron Curtain Bordedand), A =Austria, H =Hungary; XX =SoH horizon
Table 2: Crop and management hisrory of rhe Austrian and Hungarian sires on transecr I, 1I and III until1993Tabelle 2: Fruchtfolge und Bearbeirungsgeschichce der österreichischen und ungarischen Transekre I, II und III
Year Crop Management practices wintercover
Transees I
Ausrria 1987-1989 maize eonventionaI no1990 rye conventional no1991 spring barley conventional no1992 maize conventional no1993 sugar peas convenrional no
Hungary 1982/83 winter whear conventional yes1983 sun flower conventionaI no
1984/85 winter whear conventional yes1985/86 rape conventional yes1986/87 winter wheat conventionaI yes
1987 sugar peas conventionaI no1988/89 winrer wheat conventionaI yes
1990 sun flower convenrional no1991/92 winrer whear convenrional yes1992/93 rape convenrional yes
Transees 11Ausrria till 1983 paseure no rillage yes
1983-1988 peach orchard no rillage yes1989 green faIlow no tillage yes
1990-1993 rnaize conventional no
Hungary 1982/83 winrer whear convenrionaI yes1983 sun flower conventionaI no
1984/85 winter whear convenrional yes1985 malze conventional no1986 spring badey conventionaI no1987 sugar peas convemionaI no
1988/89 winter whear conventionaI yes1990 sunflower convenrional no
1991/92 winrer whear convenrionaI yes1992/93 rape conventionaI yes
Transect IIfAusrria till 1983 orchard no tiUage yes
1983-1988 maize convenrionaI no1989 sugar peas convenrionaI no
1990/91 winter whear conventional yes1991 spring badey conventionaI no
1992/93 winter wheat conventional ves
Hungary rill1993 Planrage ofRobiniapseudoacacia
Transect ILatirude 4]0 28'45", longitude 16° 40' 10",205 m a.s.l.,9° C annual mean ternperature, 700 mm annual mean precipitation, plain, no erosion, calcaric loessial deposit,
TransectIILaritude 4]0 27'40", longitude 16° 39'40", 197.5 ma.s.l., 9° C annual mean temperature, 700 mm annualmean precipitation, plain, no erosion, alluvial deposit,
Die Bodenkultur 92 52 (2) 2001

Influence of different agriculrurallanduse on soil properties along the Austrian-Hungarian border
Transect 111Latitude 47° 26'45", longitude 16° 38' 10", 255 m a.s.l.,
9° C annual mean ternperature, 700 mrn annual mean precipitation, plain, no erosion, calcaric loessial deposit.
The classificarion and description of the soils wirhin the
transects were made according to the " World Reference Baseflr Soil Resources" (FAO-ISRIC-ISSS, 1994).
Transect Lprofile J/R (Reference), calcaric Cambisolfrom loessialdeposits (june 1993):Ab (0-30 crn): Brown (10YRJ4/3), approximately 10 0/0
gravels, moderate very, fine crurnbstructure, silty loam,
moderate content oforganic matter, weakly acid, no effer
vescence, strongly rooted, low content ofmedium debris,
clear and straight boundary to:
Bv (30-80 cm): Reddish brownish black (5YRJ4/4) ,approximately 25 % gravel, prismatic structure, loam,
law content of organic matter, neutral pH, no efferves
cence, strongly rooted, moderate content of medium
debris, clear and straight boundary to:
BvCv (80-110 cm): Light brown (7,5YRJ6/4), approxi
mately 10 % gravel, prismatic structure, loam, no organ
ie matter, neutral pH, weak effervescence, weakly rooted,
moderate content of medium debris, clear and straight
boundary to:
Cv (110 + cm): Yellowish brown (10YRJ5/6), coherent
structure, loam, free of humus, alkaline, strong efferves
cence, no roots, high content of medium debris.
Transect 1,profile JIA (Austria), calcaric Cambisol from loessial deposits (june 1993):Ap (0-20 cm): Brown (lOYRJ4/3), approx. 5 % gravels
moderate very fine crumb structure, silty loam, no effer
vescence, moderate content of fine roots, plant residues,
clear and ondulated boundary to:
Ab (20-32 crn): Brown (7,SYRJ4/3), approx. 10 % gravel,
angular blocky structure, silry loam, no effervescence,
moderate content of fine roots, abrupt and ondulated
boundary to:Bv (32-80 cm): Reddish brown (SYRJ4/4), approx. 25%
gravel, subangular blocky structure, loam, no efferves
cence, many very fine roots, clay coatings, clear and
ondulated boundary to:BvCv (80-110 cm): Light brown (7,5YRJ6/4), approx. 10
0/0 gravel, subangular blocky structure, loam, slight effer
vescence, very few very fine roots, clear boundary to:
Cv (110+ cm): Yellowish brown (1OYRJ5/6) , coherent
Die Bodenkultur 93
structure, loam, strong effervescence, no roots, highcontent of medium debris.
TransectLprofileI/H (Hungary), calcaric Cambisoljromloessialdeposits (june 1993):Ap (0-21 cm): Brown (1OYRJ4/3) , approx. 50/0 gravel,
moderate very fine crumb structure, loam, no efferves
cence, few very fine roots, plant residues, clear and ondu
lated boundary to:
Ab (21-32 cm): Brown (7,5YRJ4/3), approx. 100/0 gravel,
coarse angular blocky structure, loam, no effervescence,
few very fine roots, abrupt and ondulated boundary to:
Bv (32-82 crn): Reddish brown (5YRJ4/4), approx. 25%
gravel, subangular blocky structure, loam, no efferves
cence, many very fine roots, clay coatings, clear and
ondulated boundary to:
BvCv (82-130 cm): Light brown (7, 5YRJ6/4) , approx.
100/0 gravel, subangular blocky structure, loam, slight
effervescence, few very fine roots, calcium carbonate coa
tings, snails, clear boundary to:
Cv (130 + cm): Yellowish brown (1OYRJS/6) , coherent
structure, loam, strong effervescence, no roots, high con
tent ofmedium debris,
Transect IL profile IJIR (Reference), eutricFluuisoljrom alluvial deposits (june 1993):Ab (0-15 cm): Brown (10YRJS/3), crumby structure, silty
loam, medium content oforganic matter, weaklyacid, no
effervescence, many very fine and coarse roots, clear and
smooth boundary to:
Bv (15-50 cm): Brown (1OYRJ4/3) , weak subangular
blacky structure, loamy silt, low content of organie mat
ter, weakly acid to neutral pH, no effervescence, few veryfine and common medium roots, organic matter coat
ings, earth warm casts, few gravels, gradual and ondulat
ed boundary to:
Abur (50-65 cm): Dark grayish brown (lOYRI4/2), weak
subangular blocky structure, silty loam, medium content
oforganic matter, weaklyacid, no effervescence, few very
fine and few coarse roots, gradual and ondulated boun
dary to:Bbur (65-95 cm): Duskyred (2,5Y/4/2), weak subangular
blocky structure, silty loarn, low content of organic mat
ter, weakly acid, no effervescence, few very fine roots andfew coarse raots. .
Cv (95+ cm): Yellowish brown (lOYRJS/6), coherent struc
ture, silty loam, no humus, weakly acid to neutral pH, no
effervescence, no roots,
52 (2) 2001
N. Rampazzo and A. Memler
Transees 11, profile lIlA (Austria), eutric Luoisolfrom alluvialdeposits (fune 1993}:Ap (0-18 cm): Brown (10YRI5/3), coarse angular blocky
structure, loam, low content of organic matter, weaklyacid, no effervescence, many fine and few coarse roots,
dear and smooth boundary to:Bv (18-45 cm): Brown (10YRI4/3), sub angular blocky
structure, silty loam, medium content oforganic matter,weakly acid, no effervescence, many fine roots, organicmatter coats, gradual and ondulated boundary to:
Abur (45-60 cm): Dark grayish brown (lOYRl4/2), subangular blocky structure, silty Ioam, medium content oforganic matter, weakly acid, no effervescence, few fineroots, few gravels, iron precipitation on peds' surface,
gradual and ondulated boundary to:Bbur (65-97 cm): Dusky red (2,5Y/4/2), medium suban
gular blocky structure, silty loam, very low content oforganic matter, weakly acid, no effervescence, few fineroots, iron coatings, gley mottles,
Cv (97+ crn): Yellowish brown (lOYRI5/6), coherent structure, silty loam, no humus, weakly acid to neutral pH, noeffervescence, no roots,
Transect IL profileJI/H (Hungary), eutricFluvisol/rom alluvialdeposits (june 1993}:Ap (0-20 cm): Brown (1OYRI5/3) , coarse angular blocky
srructure, silty loam, medium content of organic matter,weakly acid, no effervescence, many very fine and few
coarse roors, dear and smooth boundary to:Bv (20-50 cm): Brown (lOYR 4/3), medium subangular
blocky structure, silty loam, medium content of organicmatter, wealdy acid, no effervescence, many very fme
roots, organic matter coats, gradual and ondulatedboundary to:
Abur (50-65 cm): Dark grayish brown (lOYRI4/2), medium subangular blockystructure, silty loam, medium con
tent oforganic matter, weaklyacid, no effervescence, fewvery fine roors, few gravels, iron precipitation on peds'
surface, gradual and ondulated boundary to:Bbur (65-97 cm): Dusky red (2,5Y/4/2), medium suban
gular blocky structure, silty loam, low content oforganicmatter, weakly acid, no effervescence, few very fine roots,iron coatings, gley motrles.
Cv (97+ cm): Yellowish brown (lOYRl5/6), coherent structure, silty loam, no humus, weaklyacid to neutral pH, noeffervescence, no roots.
Transees IIL profile III/R {Refirence}, calcic Luaisolfrom calcaric loessial deposits (june 1993):Ab (0-10 cm): Brown (lOYRI4/3), fine subangular blocky
structure, loamy silt, high content oforganic matter, acid,no effervescence, medium and coarse roots, clear and
smooth boundary to:A(E) (10-32 cm): Brown (lOYRl5/3), weakly cemented,
very fine angular blocky structure, loamy silt, medium
content oforganic matter, acid, no effervescence, few veryfine and few coarse roots, organic matter coatings, dear
and smooth boundary to:
Bt (32-48 crn): Brown (7,5YR/4/4), moderate fine angu
lar blocky structure, day loam, low content of organicmatter, acid, no effervescence, few fine and medium
roots, organic matter coatings, slightly developed daycoatings, iron precipitation, gradual and smooth bound
ary to:BtCv (48-70cm): Darkyellowish brown (1OYRI4/4) , weak
fine angular blocky structure, day loam, no humus, weakly acid, no effervescence, few very fine and few coarseroots, earthworrn casts, organic matter coatings, slightly
developed day coatings, gradual and smooth boundaryto:
Cv (70+ cm): Very pale brown (1OYR/7/4), coherent hardstructure, silty loam, no humus, alkaline pH, strong effervescence, few coarse roots, carbonate coatings, slightly
developed day coatings, organic matter coatings.
Transect IIL profile IJJ/A {Austria}, calcic Luoisolfrom calcaric laessial deposits Oune 1993):Ap (0-15 crn): Brown (lOYRI4/3),veryfineangular blocky
strueture, loamy silr, low content oforganic matter, acid,no effervescence, many very fine roots, gradual andsmooth boundary to:
A(E) (15-32 crn): Brown (10YRI5/3), very fine angularblocky structure, loamy silt, low content oforganic matter, acid, no effervescence, many very fine roots, abruptand srnoorh boundary to:
Br (32-50 cm): Brown (7,5YR/4/4), fine angular blockystructure, day loam, no humus, acid, no effervescence,
few fine roors, slightly developed day coatings, abruptand smooth boundary to:
BtCv (50-80 crn): Dark yellowish brown (l0YR/4/4), hardcoherent structure, silty loam, no humus, alkaline pH,
strong effervescence, carbonare coatings, smooth boundaryto:
Cv (80+ cm): Very pale brown (l0YR/7/4), coherent hardstrueture, silty loam, no humus, alkaline pH, strong effer-
Die Bodenkultur 94 52 (2) 2001
Influence of different agriculturallanduse on soil properries aIong ehe Austrian-Hungarian border
vescence, few coarse roots, carbonate coatings, slightlydeveloped day coatings, organic matter coatings.
Transees IIL profile III/H (Hungary), calcic Luvisol.fom calcaric loessial deposits (fune 1993):Ah (0-18 cm): Brown (l0YR/4/3), very fine angular
blocky structure, loam, medium content oforganic matter, acid, no effervescence, many very fine and manycoarse roors, gradual and smoorh boundary to:
A(E) (18-30 cm): Brown (l0YR/5/3), very fine angularblocky structure, loam, low content of organic matter,acid, no effervescence, many very fine and coarse roots,organic matter coatings, abrupt and smooth boundary to:
Bt (30-49cm): Brown (7,5YR/4/4), fine angular blockystructure, day loam, no humus, acid, no effervescence,few very fine and coarse roots, organic matter coatings,slightly developed day coatings, abrupt and smoothboundary to:
BtCv (49-75cm): Dark yellowish brown (l0YR/4/4), coherent structure, silty loam, no humus, alkaline pH, strongeffervescence, carbonate coatings, smooth boundary to:
Cv (75+ cm): Very pale brown (l0YR/7/4), coherent hardstructure, silty loam, no humus, alkaline pH, strong effervescence, few coarse roots, carbonate coatings, slightlydeveloped day coatings, organic matter coatings,
2.3 Soil sampling
Samplingfor mineralogical analysesFor the determination of mineralogical analyses bulk samples were taken from each horizon of the reference profiles(R) and randomly (30 drill points from each plor) from rwosoil depths (0-15 cm, 15-30 cm) ofrhe Ausrrian and Hungarian plots.
SamplingforphysiealanalysesFor the deterrnination of particle size distribution and soil
aggregate stability bulk samples were raken from each horizon of the reference profiles (R) and randomly (30 drillpoints from each plot) from the rwo soil depths (0-15 cm,15-30 cm) of the Austrian and Hungarian plots. For thedetermination of the pore size distribution 3 cylinders(200 cm'') were taken from each horizon of the referenceprofiles (R) and from the A-horizon (0-15 cm) of the Austrian and Hungarian plots. For the determination of the saturated hydraulic conductivity 5 cylinders (200 cm3) weretaken from each horizon of the reference profiles (R) and
Die Bodenkultur 95
from the A-horizon (0-15 crn) of the Austrian and Hungarian plots. For the determination of the unsaturatedhydraulic conductivity 5 cylinders were taken from eachhorizon of the reference profiles (R) and from the A-horizon (0-15 cm) of the Austrian and Hungarian plots.
The C-horizon of the reference profile in transect I(I/RlC) could not be sampled because ofits extremely hardness.
Samplingfor micromorphologieal analysesFor the preparation and analyses ofsoil thin sections, undisturbed samples were taken by Kubiena-boxes (6,5 x 8 x 4 cm=208 cm-') from each horizon of the reference profiles (R),except from I/RiC because ofits hardness, and from the Ahorizon of the Austrian and Hungarian plots,
Samplingfor chemicalanalysesFor the determination of chemical analyses bulk sarnpleswere randomly taken (30 drillpoints from each plot) fromrwo soil depths (0-15 cm, 15-30 crn) of rhe reference profiles (R) and from the Austrian and Hungarian plots.
Samplingfor microbiologicalanalysesBulk samples from the A-horizon of each plot were randomly taken (30 drill points from each plot), After sampling and during transporration the soil samples werecooled at 4 "C, In the laboratory the bulk sarnples werefrozen ar -20 "C,
Samplingfor zoological analyses8 soil samples were taken from each investigation plot, Foreach sample a soil spot of 50 x 50 cm and a depth of30 cmwere digged out.
2.4 Analytical methods
Soil mineralogical analyses• Total mineral content by X-ray diffraction, using Cuka
radiation, according to SCHULTZ (1964).• Clay mineral content by X-ray diffraction, using Cuka
radiation, according to BRINDLEY and BROWN (1980) andGARCIA and CAMAZANO (1968).
• Na-dithionite-citrare-bicarbonare (DCB) soluble Feoxides, according to SCHWERTMANN (1959).
• NH4-oxalate soluble Fe-oxides according to SCHWERTMANN (1964).
• Na-pyrophosphate soluble, organically bounded Feoxides according to HERMANN and GERKE (1992).
52 (2) 2001

N. Rampazzo andA. Mender
Soilphysicalanalyses• Bulk density (dB) using 200 cm3 cylinders.
• Total porosity (TP) calculated from density values.• SoH aggregate stability (SAS), according to MURERet al.
(1993).• Particle size distribution by wet sieving and sedimenra
tion technique.• Pore size distribution using pressure chambers according
to KLUTE (1986), HARTGE and HORN (1991), HARTGE
and HORN (1992).
• Saturated hydraulic conductivity (Ksat) according toKLUTE (1986).
• Unsaturated hydraulic conductivity (Ku> using an "Instantaneous Profile Method" according to WIND (1966),
PLAGGE (1991).
Soil micromorphologicalanalysesThin sections were prepared from the undisturbed soil by
fixation of the samples with polyester resine (CHS-poly
ester 109), diluted in acetone under vacuum, aceording to
JONGERIUS (1973) and CURLIK (1977).
SoilchemicalanalysesPrior to chemical analyses the eolleeted soil samples
(0-15 cm, 15-30 em) were air dried and passed through a2 mm sieve (fine earth). The chemieal data are means of
5 replicates for each soil sample and quoted on an oven-drybasis (105 °C for 24 h). Correlation analysis (Spearman
rang eorrelation) is used to combine the chemieal, physiealand microbiological data, One way Anova (rnodified LSD
test) with a signifieance level 0.05 is used to distinguish dif
ferences berween the Austrian, Hungarian and Reference
fields. The normal disrribution ofthe data is tested with the
Kolmogorov-Smirnov Goodness ofFit test,
• pH-value in H 20 and 1 M KCI potentiometrically.• Electrical conductivity (EC) in a warer-saturared extract,
• Organic carbon (Corg) content, Tyulin-method, according to SSSA (1996).
• CaC03 content (Scheibler-rnethod).
• Soluble nitrogen fractions (NH4+, N03-, N min) contents,Bremner-method according to SSSA (1965).
• Total nitrogen (Nt) content, regular rnacro-Kijeldahlmethod, aeeording to SSSA (1965).
• Effective cation exchange capacity (CECeff) andexchangeable Ca, Mg, K, Na, Fe, Al, Mn in unbuffered
0.1 M BaCI2-extract.• P and K the Ammonium-lactare-extracr.
• Heavy metal (As, Co, Cr, Cu, Mo, Ni, Pb, Sr, Zn, Cd)
contents in aqua regia-extract.
Soil microbiological analyses• Microbial nitrogen (Nmic) by fumigation-extraction,
according to BROOKES et al. (1985), VANCE er al. (1987),
]ENKINSON and POWLSON (1976).
• Substrate-induced-respirarion-rate (SIR) and microbialcarbon (C .) accordingto HEILMANN and BEESE (1992),
rmc]ENKINSON and POWLSON (1976), ANDERSON and
DOMSCH (1978).
• Basal respiration, aeeording to HEILMANN and BEESE
(1992).
• Dimethylsulfoxide-reductase-aetivity (DRA) aceording
to A1.EF and KLEINER (1989).
• Ergosterol content, aceording to DjAjAKIRANA et al. (1993).
• Metabolie quotient (qC02)'
Soil zoological analyses (earthuiorms distribution}The soil was cut out with a eore sampler respeetively with a
spade and the earthworms picked out by hand on the spot.The worms were counred, taken to the laboratory, their bio
mass recorded and the species determined according to
ZICSI (1967).
3. Results and discussion
3.1 Mineralogical data
The mineralogical dara of the investigated soils are shown
in table 3, table 4, table 5.
Transect I:The referenee profile I/R shows the features of a moderateweathered Cambisol, where layer silicares aeeumulate on
the top, whereas quartz and chlorite increase with soil depth
(see table 3). The day mineral distribution corresponds to
this features and shows an aecumulation ofillite on the top,
and few kaolinite through the whole profile. The relatively
high amount of smectite, whieh is an expandable 2:1-clay
mineral, explains the subangular blocky strueture and the
extreme hardness of the B-horizon. No illuviated day, Fe,
and organic matter oeeurs (see table 4 and table 5). The
increasing amount ofoxalate-soluble Fe (Feo) in the eambic
horizon also explains the moderate weathering process inthis soil (see table 5).
The comparison ofthe three investigared areas over tran-
Die Bodenkultur 96 52 (2) 2001

Influence of different agriculturallanduse on soil properties along eheAustrian-Hungarian border
Table3: Serniquanrirative primary mineral concencin the fine earth of the invesrigatedsoils in weight %Tabelle 3: Semiquanritacive Gesamrmineralzusamrnenserzungim Feinboden der untersuchten Böden in Gew. %
Transecr quartz chlorite micas feldspars calcite dolomite
TransectII/RlAh 74 4 20 2 tr. rr,I/RlBv 75 11 13 1 - -I/RlBvCv 81 15 4 rr, - -I1R1Cv 80 17 2 tr, <1 -I1A(0-15) 68 10 20 2 tr, -I/A/(l5-30) 82 16 2 tr. - -I/H/(0-15) 83 14 12 1 - -I/H/(15-30) 66 7 24 3 - -Transect11II1R1Ah 62 11 19 7 <1 -II1R1Bv 44 24 26 6 - -II1R1Abur 63 15 17 5 - -II1R1Bbur 82 6 10 2 - -IIIN(0-15) 50 17 27 6 - -II1N(15-30) 35 25 30 6 <1 -II1H/(O-15) 33 35 23 8 <1 -II1H/(15-30) 50 17 29 4 - -Transect IIIIIIIRlAh 39 14 37 9 <1 -IIIIRlA(E) 85 12 3 tr. - -IIIIRlBt 71 19 9 1 - -IIIIRlBtCv 62 16 16 4 <1 <1III/A/(0-15) 88 10 1.5 0.5 - -IIIIN(l5-30) 87 7 5 I - -III/H/(0-15) 66 14 16 4 - -III/H/(l5-30) 69 15 12 4 - -
Table4: Semiquantitative day mineral conrenc in rhe fine earth of rhe invesrigated soils in weighr %Tabelle 4: SerniquantirariveTonmineralverteilung im Feinboden der untersuchten Böden in Gew. %
Transcer illire chlorire smectire vermiculire kaolinire
Transect II/RlAh 63 14 21 - 2I1R1Bv 55 13 27 - 5IIRlBvCv 58 12 26 - 2IIRlCv 45 14 39 - 2I1N(0-15) 73 14 8 - 5I/N(l5-30) 80 15 - - 5I/H/(0-15) 81 10 - - 9I1H/(l5-30) 72 10 11 - 7Transect IIII1R1Ah 60 20 18 - 2II1R1Bv 56 13 21 - 10II1R1Abur 40 14 41 - 5II1R1Bbur 45 8 43 - 4II1N(O-15) 58 12 25 - 5II1N(l5-30) 42 13 38 - 7II1H/(0-15) 43 13 40 - 4II1HI (15-30) 37 23 27 - 13Transect IIIIIIIRlAh 79 14 - - 7IIIIRlA(E) 86 7 7 - -IIIIRlBr 81 17 - - 2IIIIRlBtCv 44 16 36 - 4III/A/(0-15) 76 11 13 - -IIIIN(l5-30) 72 15 10 - 3III/H/(0-15) 51 11 38 - tr.III/H/(15-30) 64 16 16 - 4
DieBodenkultur 97 52 (2) 2001

N. Rampazzo and A. Mentler
98
Table 5: Dithionire-Id), oxalare-Iol and pyrophosphare-(p) solubleFeoxidesof the investigared soils in mg/kgfine earth
Tabelle 5: Dirhionir-Id), oxalat-Io) and pyrophosphat-(p) lösliche FeOxyde der untersuchten Bödenin mg/kgFeinboden
Transecr Pet! FenFen Fen/Ferl
Transect IlIR/Ah 11080 1290 277 0.12l/RJBv 15250 1320 10 0.09I/RJBvCv 11970 1145 533 0.10lIN(O-15) 12560 1400 233 0.11I/N(15-30) 12800 1370 237 0.11I/H/(O-15) 13630 1728 150 0.13I1H/(15-30) 13990 690 126 0.12
Transeet 11IIlR/Ah 10150 3090 596 0.30IIJRJBv 10660 3760 487 0.35IIIRlAbur 11660 5050 490 0.43II/RiBbur 9860 4975 385 0.50IIJA/(O-15) 6390 4550 650 0.71II/N(15-30) 11460 4450 634 0.39II/H/(O-IS) 11540 4275 652 0.37II/H/(IS-3D) 11560 4200 568 0.36
Transect 111III/RlAh 8200 1928 494 0.24IIIlRlA(E) 8830 1788 402 0.20lU/RlBt 14810 1160 213 0.08III/RJBtCv 10630 825 38 0.08III/N(O-15) 8540 2178 412 0.26III/N(15-30) 7580 1918 391 0.25III/H/(O-15) 11840 1468 337 0.12III/Hf(15-30) 11390 1645 278 0.14
sect I (Austria, Hungary, reference) shows the uniformity of
this soil between Austria and the reference, whereas the
Hungarian site shows a contrarily distribution in the con
tents of quartz, chlorite and layer silicates (see table 3)
which could have been caused by deeper tillaging like
ploughing. Moreover, the clay mineral distribution indi
cates that the undisturbed conditions in the reference-pro
file ledto a higher weathering of illite and formation of
smectite than in the cultivated Austrian and Hungariansites,
Transect 1I·The reference profile II/R shows the typical stratificationphenomena ofa Fluvisol, concerning the primary minerals
quartz, chlorite and layer silicates (see table 3). The same
tendency is given bythe distribution ofsmectite and kaoli
nite (see table 4). The distribution of the "free" oxides con
firms the stratification and the presence of buried horizons
within this profile, with accumulation of the dithioniteand oxalate-soluble Fein the IIIRlAb-horizon (50-65 crn),
see table 5. Like in transect I, the mineralogical distributionin the tilled horizons of the Hungarian site behaves con-
Die Bodenkultur
trarilyas compared with theAustrian and the reference site,
as a probably consequence of deep tillage practices of the
Hungarian site,
Transees IIL·The reference profile III/R shows the typical mineralogical
features ofa Luvisol, with a significant eluviated horizon (E)
and illuviated horizon (Bt and BtC). The lass of clay from
E-horizon and its accumulation in the Bt-horizon are visi
ble from the particle size distribution (see table 7). This
process leads to lass of mobile minerals (layer silicates and
chlorite) and the relative accumulation ofquartz in the elu
viated horizon (see table 3), respectively in the accumula
tion ofillite and transport downwards ofchlorite and smec
tite (see table 3). Fe-oxides are also affected by this process
and accumulate in the Bt-horizon, as shown in table 5. The
formation of a Luvisol is also manifested in other soil fea
tures like soil colours (10YR/5/3 in the E-horizon and7,5YR/4/4 in the Bt-horizon), CEC (108 meq/kg in the Ehorizon and 142 meq/kg in the Bt-horizon) and clay coat
ings in the Bt-horizon.
3.2 Physical data
Bulk density (dB) and totalporosity (TP)The bulk density and the total porosity are two descriptive
structure parameters. With their help it is possible todeduce the water balance and aeration ofsoils, but they give
no information about the geometry and continuity of the
pore system. At the reference sites (R) the bulk density
becomes higherwith soildepth (see tahle 6), except for tran
sect I, where the upper horizons (I/R/A, I/RIß) have thesame density as the I/RJBC-horizon. EHLERS (1973) indi
cated a maximum of 1,55 g/cm3 for bulk density as critical
level for plant growth, which is not reached in any horizonof the investigated soils. On the other hand, BECKMANN
and ALTEMÜllER (1989), showed, that bulk density of top
soils of tillaged sites can vary from 1,3 to 1,6 g/cm3. These
values are reached in allA-horizons of the tillaged soils. Bycomparing 311 A-horizons in Table 8, it can be seen that thebulk densities of the referencesites are much lower than at
the tillaged sites (H and A), with exception, again, of tran
sect I (I/R/A), as a consequence of their undisturbed deve
loprnent, the higher arganic matter and the high developed
rooting system.. The total porosity of the reference sites (R)
(table 6), calculated from density values, shows the decrea
sing tendency of the total porosity with the depth.
52 (2) 2001

lnfluence of different agriculturallanduse on soil properties alang the Ausrrian-Hungarian border
Table6: Bulk densiry (dß), total porosiry (TP), and soil aggregate stabiliry (SAS) of ehe investigated soils
Tabelle 6: Lagerungsdichte(dß), Gesamtporenvolumen (TP) und Aggregarstabilitär (SAS) der untersuchten Böden
Transect dB TP SASg/crn' vol0/0 0/0
Transeet Il/R/Ah 1.43 46 90I1RJBv 1.42 47 78l/RJBvCv 1.40 47 82l/R/Cv not sampled - 64l/A/(O-15) 1.27 52 68I/A/(lS-30) - - 56I/H/(O-15) 1.32 50 61I/H/(l5-30) - - 60Transect11II/RJAh 1.06 60 75II/R/Bv 1.34 49 56II/RJAbur 1.33 50 53II/R/Bbur 1.45 45 221I/A/(O-15) 1.35 57 671I/A/(15-30) - - 64II/Hf(O-15) 1.30 51 56II/H/(I5-30) - - 49Transeet IIIIlI/RJAh 1.11 58 81lII/RlA(E) 1.30 51 63lII/RlBt 1.47 45 63lII/RJBtCv 1.49 44 38IIl/N(O-15) 1.41 47 27IUfAI (15-30) - - 33IIIIHf(0-15) 1.31 50 76IIl/Hf(l5-30) - - 66
Particle sizedistributionThe particle size distribution of the investigated soils is
shown in table 7 and reflects a relativly high soil homogeni
ty between tilled (A and H) and reference soils wirhin each
transect, The effect ofclay illuviation in the Bt-horizon ofthe
Luvisol of transect 111 is evident. The content of fine pores
andthe bulk density are also increasing in the Bt-horizon oftransect 111, as shown in table 6 and table 8, thus confirrning
the illuviation process and the formation ofa LuvisoL
The amount of silt is high in each horizon, except in the
I/R/C-horizon, therefore the most horizons are loams or
silty loams, as shown in table 7. The texture class can be
used for estimating the productivity of a soil. Loamy soils
and silty soils with amiddie amount of clay have sufficient
aeration and storage capacity for available water iftheir bulk
density is not too high. Moreover, silty soils with less than
17 % clay tend to sludge in rhe crumb and erode (SCHEF
FERand SCHACHTSCHABEL, 1992).
SoilAggregate Stability (SAS)The stabiliry of soil aggregates in water is affected by vari-
aus biotic and abiotic factors and the landuse practices, The
cancept of the soil aggregate stability reflects many soilstructural parameters (BLUM and RAMpAZZO, 1993; RAM
PAZZO et al., 1994), but as a result, it is a function of
whether the cohesive forces berween particles resist theapplied disruptive force of water, Table 6 shows a general
decrease of SAS with soil depth at the reference sites (R),
which can be explained bydifferences in root density and
microbiological activity (ALEXANDER, 1977)~ SAS decrea
ses in Austrian and Hungarian soils as a consequence of til
ling, lower organic carbon content, mostly uncovered soil
surface and microbiological activity, The lower SAS can also
be caused by using chemical fertilizers (MURER et al., 1993).
Pore sizedistributionTable 8 shows the distribution of pore sizes calculated from
the values of the different water contents.
The results show that in all the top soils of each transeet
water availibility, expressed by the content of medium
pores, is guaranteed and comparable. The weathering Bhorizons in the undisturbed reference site of transect I(I/Riß) and transeet 11 (II/R/B) show, on the contrary, a significant decrease ofthe medium pores. Moreover, the result
show rhat the amount of medium pores in the A-horizons
is not distinctly affeeted bytillage practices and the coarse
pores, responsible for aeration, water and solute transport
can also be considered as sufficient. In transect I there is a
decrease of medium pores in the I/RJB-horizon (in com
parison to the I/R/A-horizon), with an increase of coarse
and fine pores at the same time. This is typical for the
weathering...horizon ofa Cambisol with shrinking cracks. Asimilar tendency is occuring in the II/R/B-horizon of tran
sect 11, in favour of the fine pores. The coarse pores
decreased. The reference soil of transect 111 (Luvisol) shows
a rapid decrease of coarse pores with soil depth till the
III/R/Bt-horizon, where the content of coarse pores is verylow, accornpanied with astrang increase of fine pores with
the highesr content in the illuvial-horizon (III/RlBt).
The tilled A-horizons (I/H/Ap and I/A/Ap) show a hig
her content of coarse pores than the reference horizon
(liRJA), in agreement with bulk density and total porosity.
The medium and fine pore contents are as high as in the re
ference site, The higher content oftotal porosity in the Austrian A-horizon than in the Hungarian A-horizon points
out the use oflight-weight machines in Austria, which maybe the contrary at the Hungarian site, where heavymachines are mostly used, leading to a higher decrease of
coarse pOIes.
Die Bodenkultur 99 52 (2) 2001
N. Rampazzo andA. Menrler
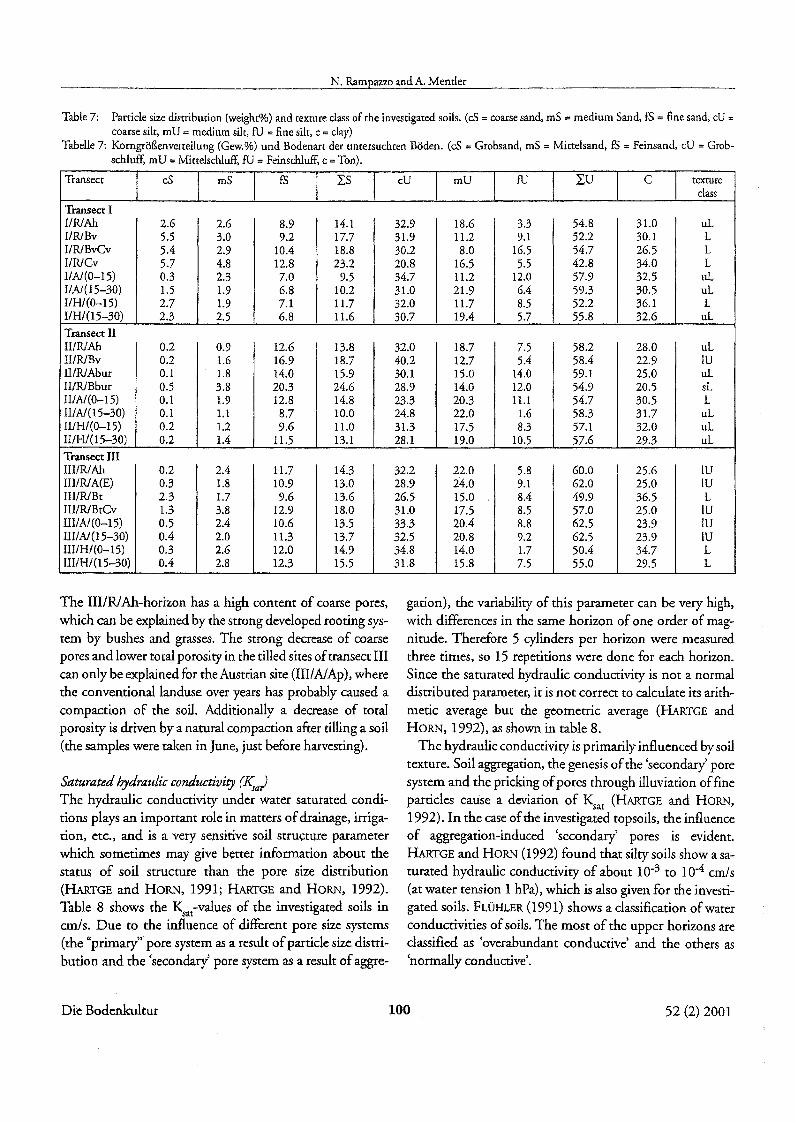
Table7: Particle sizedisrribution (weighc%) and texturedass of rhe investigated soils. (eS=coarse sand, mS =medium Sand, fS=fine sand, cU=coarsesilr, mU =medium silr,fU =fine silr, c =day)
Tabelle 7: Korngrößenverteilung (Gew.%) und Bodenart der untersuchten Böden. (cS =Grobsand, mS =Mitrelsand, fS =Peinsand. cV =Grobschluff, mU =Mirtelschluff fU =Peinschluff c =Ton).
Transecr eS mS fS LS cU mV fU LU C texturedass
TransectIIIR/Ah 2.6 2.6 8.9 14.1 32.9 18.6 3.3 54.8 31.0 uLIIR/Bv 5.5 3.0 9.2 17.7 31.9 11.2 9.1 52.2 30.1 LIIR/BvCv 5.4 2.9 10.4 18.8 30.2 8.0 16.5 54.7 26.5 LI1R/Cv 5.7 4.8 12.8 23.2 20.8 16.5 5.5 42.8 34.0 LIIN(0-15) 0.3 2.3 7.0 9.5 34.7 11.2 12.0 57.9 32.5 uLI1A/{l5-30) 1.5 1.9 6.8 10.2 31.0 21.9 6.4 59.3 30.5 uLI1H/(0-15) 2.7 1.9 7.1 11.7 32.0 11.7 8.5 52.2 36.1 LI/H/(lS-30) 2.3 2.5 6.8 11.6 30.7 19.4 5.7 55.8 32.6 uL
Transect IIIIIRJAh 0.2 0.9 12.6 13.8 32.0 18.7 7.5 58.2 28.0 uLIlIR/Bv 0.2 1.6 16.9 18.7 40.2 12.7 5.4 58.4 22.9 IVII/R/Abur 0.1 1.8 14.0 15.9 30.1 15.0 14.0 59.1 25.0 uLII/R/Bbur 0.5 3.8 20.3 24.6 28.9 14.0 12.0 54.9 205 sLIlIN(0-15) 0.1 1.9 12.8 14.8 23.3 20.3 11.1 54.7 305 LIlIN(l5-30) 0.1 1.1 8.7 10.0 24.8 22.0 1.6 58.3 31.7 uLIl/H/(0-15) 0.2 1.2 9.6 11.0 31.3 17.5 8.3 57.1 32.0 uLIlIH/(lS-30) 0.2 1.4 11.5 13.1 28.1 19.0 10.5 57.6 29.3 uL
Transect IIIIII/R/Ah 0.2 2.4 11.7 14.3 32.2 22.0 5.8 60.0 25.6 IUIII/RJA(E) 0.3 1.8 10.9 13.0 28.9 24.0 9.1 62.0 25.0 IVIII/R/Bc 2.3 1.7 9.6 13.6 26.5 15.0 8.4 49.9 36.5 LIll/R/BcCv 1.3 3.8 12.9 18.0 31.0 17.5 8.5 57.0 25.0 IVIII/N(0-15) 0.5 2.4 10.6 13.5 33.3 20.4 8.8 62.5 23.9 IUIIlIN(l5-30) 0.4 2.0 11.3 13.7 32.5 20.8 9.2 62.5 23.9 IUIIl/H/(0-15) 0.3 2.6 12.0 14.9 34.8 14.0 1.7 50.4 34.7 LIIl/H/(15-30) 0.4 2.8 12.3 15.5 31.8 15.8 7.5 55.0 29.5 L
The III/RJAh-horizon has a high content of coarse pores,which can be explained by the streng developed rooting system by bushes and grasses, The strong decrease of coarsepores and lower total porosity in the tilled sites oftransect IIIcan only be explained for the Austrian sire (III/A1Ap),wherethe conventionallanduse over years has probably caused acompaction of the soil. Additionally a decrease of totalporosity is driven by a natural compaction after ti11ing a soil(the samples were raken in June, just before harvesting).
Saturated hydraulic conductivity {I\alThe hydraulic conduetivity under water saturated conditions plays an important role in matters ofdrainage, irrigation, etc., and is a very sensitive soil structure parameterwhieh sometimes may give bettet information about thestatus of soil structure man the pore size disrribution(HARTGE and HORN, 1991; HARTGE and HORN, 1992).Table 8 shows the Ksatvalues of the investigated soils inem/s. Due ro rhe influence of different pore size systems(the "primary" pore sysrern as a result ofpartide size distribution and rhe 'seeondary' pore system as a result ofaggre-
gation), the variabiliry of rhis parameter ean be very high,wirh differences in the same horizon of one order of magnitude, Therefore 5 cylinders per horizon were measuredthree tirnes, so 15 repetitions were done for each horizon.Since the saturated hydraulic conductivity is not anormaldistributed parameter, ir is not correct to calculate its arithrnetic average but the geometrie average (HARTGE andHORN, 1992), as shown in table 8.
The hydraulic conductivity is primarily influenced by soiltexture. Soil aggregation, the genesis ofthe 'secondary' poresystem and the pricking ofpores through illuviation offineparticles eause a deviarion of Ksat (HARTGE and HORN,
1992). In the case ofthe investigated topsoils, the influenceof aggregation-induced 'secondary' pores is evident.HARTGE and HORN (1992) found that silty soils show a saturated hydraulic conductivity of about 10-3 to 10-4 cmJs
(at water tension 1 hPa), which is also given for the investigated soils. FLÜHLER (1991) shows a classification ofwarerconductivities ofsoils. The most of the upper horizons areclassified as 'overabundant conductive' and the others as'normally conductive'.
Die Bodenkultur 100 52 (2) 2001

Influence of different agriculrurallanduse on soil properties along the Austrian-Hungarian border
Table 8: Pore size disrriburion (vol %) and saturated hydraulic conductiviry (ksat) of rhe invesrigatedsoils
Tabelle 8: Porenverteilung (Vol. %) und gesättigte hydraulische Leitfähigkeit (ksat) der untersuchten Böden
Transecr coarse medium fine ksa,
pores pores pores cm/s(> 10 um) (10-0.2 pm) « 0.2 um)
Transecr II/R/Ah 11.4 17.6 17.1 7.4 x 10⁻⁴I/R/Bv 16.0 9.4 21.1 5.1 x 10⁻⁴I/R/BvCv 13.4 11.8 22.0 4,5 x 10⁻³
I/R/Cv not sampl. not sampl, not sampl. nor sampl,I/(0-15) 16.3 18.4 17.2 7.2 x 10⁻³
I/H/(0-15) 16.3 18.0 16.0 4.6 x 10⁻³
Transect IIII/R/Ah 27.4 19.2 13.4 1.5 x 10⁻³
II1R/Bv 21.8 9.8 17.7 5.0 x 10⁻⁴II/R/Abur 20.3 11.4 18.0 1.7 x 10⁻³
lI/R/Bbur 14.6 12.9 17.7 4.9 x 10⁻⁴
IIIAI(0-15) 25.6 15.0 16.1 2.8 x 10⁻³
HlH/(0-15) 19.0 17.0 15.0 1.0 x 10⁻⁴
Transect IIIIlI/R/Ah 32.2 14.8 11.1 4.1 x 10⁻³
III/R/A(E) 18.8 16.1 15.9 2.1 x 10⁻³
III/R/Bt 9.2 13.7 21.8 3.3 x 10⁻³
III/R/BtCv 12.9 10.7 20.1 5.7 x 10⁻⁴IIIIAI(0-15) 15.1 13.4 18.5 3.0 x 10⁻⁴IlI/H/(0-15) 17.6 15.2 17.7 6.1 x 10⁻³
Unsaturated hydraulic conductivity (KjIn figure 2 the curves calculated from conductivity andwater tension show that the values of the three top soils intransect I behave almost equal. The similarity of thehydraulic function in transect I isalsoconfirmed by rhe dataof the partide size distribution which are rather equal aswell. All three curves showanalmost steady course.Between 30-40 hPa and 110-130 hPa the function isdecreasing about three orders of magnitude. The course ofthe I/AIAp-curve in rhe lower range cannot be caused bydifferent day content or the content of fine pores becausethis values are almost equal in the three described horizons.
So it must be caused by a different evaporation conditionedby a different structure.
The curves in figure 3 are less steady as the ones in figure30. Only the II1R/A- and II/AIAp are almost steady in therange from 60 to 105 respectively 130 hPa. Ir cau be seenthat the valuesofthe WHIAp horizon areonly given for theseetion from 110 to 160 hPa and thar the course of thiscurve is much flater as the other ones.
10 100 1000
.8,.....,
0:I ' 'I ' , , 'I- "0
~E D"0 o
~DAVA I>,'-'..c ~ 0,01 t '" IIIH/Apl"0 .-~ .~
0,001r DWAIAplE! <:)::l ::l~"O<:l I:'" 0§ <:) 0,0001
water tension [hPa]
Figure 3: Unsaturated hydraulic conductiviey (K) of the A-hori-zons of transect II as a function of ehewater tension
Abbildung 3: Ungesättigte hydraulische Leitfähigkeit (K) der A-Horizonre in Transekt Il als Funktion des Matrixpotentials
Figure 4 shows that the curve ofthe II1/HIA2-horizon, (forest) has a lower unsaturared hydraulic conductivity thanrhe IIIIAIAl-horizon (arable land). This two curves havethe II1/R/Ab curve (rneadow) in their middle. So no tendency can be observed which would be deduced from thevalues of conductivity of disturbed horizons. An almostequal decrease of rhe curves like in the other curves oftransect I and II is observed.
10 100 1000
.~ t""""I) ---~I
- "0
~~ 0,1
~->,'-' lolWRlAll..c~
'" IIIIH/A2 i"0 .- 0,01~ of
l:I IWAlA1JE! uB ::l 0,001~'"gI:: 0::l <:) 0,0001
1 -:t--.- _._--,---;-_.~,_.............-...;.- _ ......._'...-4--'-~
O'\l
j
D"',,'"tIIID0,01
0,001
0,0001
\0 \00 \000
lo IJRIA '1'", JJß/Ap
D flA/Ap,
water tension IhPa]
Figure 4: Unsaturared hydraulic conductiviry (Ku) of rhe A-hori-zons of transecr BI as a function of the water tension
Abbildung 4: Ungesättigte hydraulische Leitfähigkeit (~) der A-Horizonte in Transekt III als Funktion des Matrixpotentials
3.3 Micromorphological datawater tension [bPa]
Figure 2: Unsarurated hydraulic conductiviey (K) of ehe A-hori-zons of rransect I as a funetion of rhe warer tension
Abbildung 2: Ungesättigte hydraulische Leitfähigkeit (Ku) der A-Horizonte in Transekt I als Funktion des Matrixpotentials
The calcaricCambisol in transect I wasformed on calcified,later decalcified alluvial deposits. There are the signs of theprimary (dastogene) and secondary (authigene) calcitesetching (depletion features). Some signes of day transloca-
Die Bodenkultur 101 52 (2) 2001

N. Rampazzo and A. Mentler
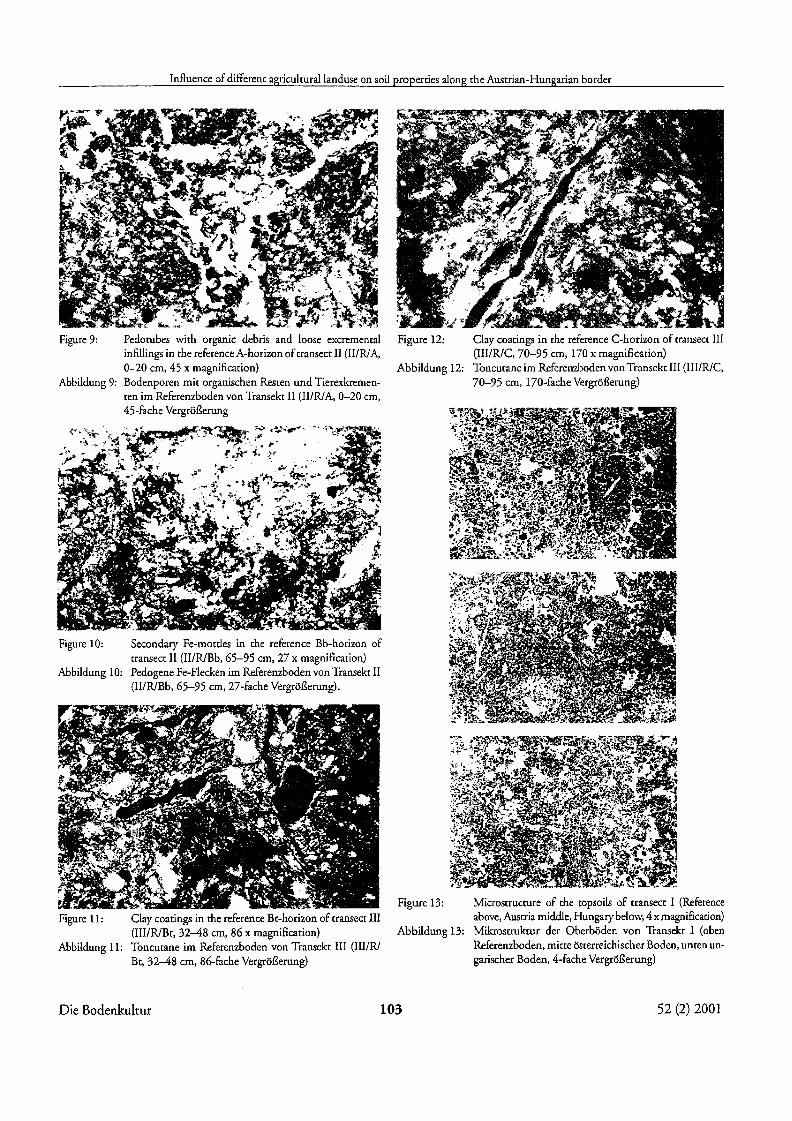
Figure 7: Organic debris in the reference A-horizon of transecr 1(I/RlA, 0-22 cm, 86 x magnification)
Abbildung 7: Organische Reste im Referenzboden von Transekt 1(lIRlA, 0-22 cm, 86-facheVergrößerung)
o
tion are visible but not enough pronouneed to imply a diagnostie "argillic" horizon, see figure 5 and figure 6.
The eutrie Fluvisol in transeet II has the signs of formerhydromorphic influence. This is clear from the bleaehedeolour and from iron spots, nodules and eoncretions. Arusty appearenee is a typical feature for this developmenr.The very high biological activity was also confirmed by thehigh C -content (= 2,17) and in the extreme high value of Iorgthe analysis ofDMS-aetivity, see figure 7, 8, 9,10.
The soil in transect III is confirmed as a LuvisoL This canbe proven from the micromorphologieal features, whichshow the presence of an "argillic" horizon. The red colour
of the day coatings gives the impression that this is an old"'!',,"'.
Figure 5: Ca-oxalatecrystalls in ehepores of rhe undisturbed A-hori-zon of transect I, (I/RlA, 0-22 cm, 86 x magnification)
Abbildung 5: Ca-Oxalarkriscalle in den Poren des Referenzbodens vonTransekt I (A-Horizonr, I1R1A, 0-22 cm, 86-fache Vergrößerung)
Figure6: Calcite, parriallyweathered, in rhe referenceBC-horizonof transecr I (I1R1BC, 40-50 cm, 27 x magnification)
Abbildung 6: Angewirrercers Kalzit im Referenzboden von Transekt I(I/RlBC, 40-50 crn, 27-fache Vergrößerung)
Figure 8: Concentric iron nodules in rhe reference B-horizon oftransect 1 (I/RlB, 22-40 cm, 27 x magnification)
Abbildung 8:, Fe-Konkrerionen im Referenzboden von Transekt 1(I/R/B, 22-40 cm, 27-fache Vergrößerung)
horizon formed under warm and more humid conditions,see figure 11 and figure 12.
The main difference berween the uncultivared referencesoils and the adjacent Hungarian and Austrian soils of alltranseets lies in the higher hiological activity in the A-horizons of rhe reference soils. This leads to main differences in
the microstructure, with mostly crumby microstructure inthe undisturbed reference soils, whereas the tilled soils tend
to form subangular, cracky mierostrueture, as shown in figures 13, 14, 15.
Die Bodenkultur 102 52 (2) 2001
Influence of different agriculcurallanduse on soil properties along the Austrian-Hungarian border
Figure 12: Clay coatings in ehe reference C-horizon of transect III(IlI/R/C, 70-95 cm, 170 x magnification)
Abbildung 12: Toneurane im Referenzboden von Transekt III (III/R/C,70-95 cm, 170-fache Vergrößerung)
!i!~'"..tl.tr~ ..·~
Figure 13: Microstrucrure of ehe ropsoils of rransect I (Referenceabove,Austriamiddle,Hungary below, 4 xmagnificarion)
Abbildung 13: Mikrostruktur der Oberböden von Transekt I (obenReferenzboden, rnitre ösrerreichischer Boden, unten ungarischer Boden, 4-fache Vergrößerung)
Figure 9: Pedocubes wirh organic debris and loose excrernentalinfillings in rhe reference A-horizon ofrransecrII (II1R/A,0-20 cm, 45 x rnagnification)
Abbildung 9: Bodenporen mit organischen Resten und Tierexkrernenren im Referenzboden von Transekt II (II1R/A, 0-20 crn,45-fache Vergrößerung
Figure 11: Clay coatings in ehe reference Bt-horizon of transect III(IlI/R/Be, 32-48 cm, 86 x magniflcarion)
Abbildung 11: Toneurane im Referenzboden von Transekt III (HIIR/Bt, 32-48 crn, 8G-facheVergrößerung)
Figure 10: Secondary Fe-mordes in the reference Bb-horizon oftransect H (II1R/Bb, 65-95 crn, 27 x magnification)
Abbildung 10: Pedogene Fe-Flecken im Referenzboden von Transekt II(II1R/Bb, 65-95 cm, 27-fache Vergrößerung).
DieBodenkultur 103 52 (2) 2001

N. Rampazzo andA. Mender
104
Figure14: Microsrrucrure of the ropsoils of transect 1I (Referenceabove, Austriamiddle, Hungarybelow, 4 xmagnificarion)
Abbildung 14: Mikrostruktur der Oberböden von Transekt II (obenReferenzboden. mitte österreichischer Boden, untenungarischerBoden)
3.4 Chemical data
pH-valueThe pl-l-values ofthe investigated soils are shown in table9. The chemical reactions of the studied soils are slightlyacidic to neutral and wirhin the transecrs rather similar.Only field I/H shows higher pl-l-values due to liming. ThepH is positively correlated with ehe amount of Ca (BaCl2)
(r =0.8, P =0.05) and with the cation exchange capadty(r = 0.75, P = 0.02). The influence of the soil acidity onthe physiological properties of the soil microflora isexpressed by the negative relationship to the cf20z (r =
- 0.7) and the positive relation to the Cmi/Corg ratio (r =
0.87).
Die Bodenkultur
Figure15: Microsrrucrure of ehe topsoils of transecc 1II (Referenceabove, Ausrria middle, Hungarybelow, 4 x magnificarion)
Abbildung 15: Mikrostruktur der Oberböden von Transekt III (obenReferenzboden. miete österreichisoher Boden, untenungarischerBoden.4-facheVergrößerung)
Electrical conductivity (Ee)The electrica1 conductivity represents the amount of soluble salts in the soil. High salt concentrations affect soilmicroorganisms by reducing their enzymatic activities. Theinvestigated soils are characterized by very low water soluble salt contents, exeept for plot I1R (15-30 cm) and I/H,which shows slightly enhanced values, see table 9. Thuscontaminarion of the investigated soils with sulphates,chlorides etc, can be exeluded.
Organic carbon (eorl' soilorganic matter(SOM)Concerning the landuse and soil management the amountof SOM can be raised by e.g. agricultural extensificationmeasures (BEYER et al., 1992), applieation oforganic fertilizers (LEITHOLD, 1992) and erop rotation (SCHEFFER and
52 (2) 2001

Table9:
Tabelle 9:
Influence of different agricuIruralianduse on soil properties along eheAustrian-Hungarian border
pH (HzO and KCI), salt conrent, electrical conductiviry(EC), organic carbon (Corg) and soil organic matter (SOM) of rhe invesrigacedsoilspH (HzO und KCI), Salzgehalt,elektrischeLeitfähigkeit (EC),organischer Kohlensroff'(C, ) und Humusgehale (SOM) der untersuchtenBöden ~
Transecr pH pH salt EC Co~ SOM CaC03H)O KCI 0/0 Ohm/cm 0/0 0/0 %
Transect IIIR! (0-15cm) 5.9 4.8 <0.02 0.40 1.9 3.3 0.25IIR! (l5-30cm) 7.0 6.0 0.02 0.47 1.2 2.1 0.42IIA (0-15cm) 5.6 4.4 <0.02 0.33 1.0 1.7 0.00IIA (l5-30cm) 6.0 4.8 <0.02 0.34 1.0 1.7 0.00IIHI (0-15cm) 7.0 6.3 0.03 0.49 1.0 1.7 0.29I/H (l5-30cm) 6.9 6.1 0.02 0.46 1.0 1.7 0.13
Transect IIIIIR! (0-15cm) 6.2 5.2 <0.02 0.34 2.2 3.7 0.15II1R! (l5-30cm) 7.1 6.4 0.03 0.47 1.0 1.7 0.89lIlA (0-15cm) 5.8 4.6 <0.02 0.40 0.9 1.6 0.00IIIA (l5-30cm) 5.6 4.5 <0.02 0.32 1.3 2.2 0.00IIIH/ (0-15cm) 5.7 4.7 <0.02 0.31 1.7 3.0 0.00II/H (l5-30cm) 5.6 4.7 <0.02 0.27 1.6 2.8 0.00
Transect IIIUIIR! (0-15cm) 5.4 4.4 <0.02 0.27 2.6 4.4 0.13IlI/R! (15-30cm) 5.3 4.0 <0.02 0.20 1.2 2.0 0.13IlI/A (0-15cm) 5.0 4.0 <0.02 0.40 1.1 1.8 0.00IlI/A (l5-30cm) 5.0 3.9 <0.02 0.32 0.9 1.5 0.00IlI/HI (0-15cm) 5.3 4.2 <0.02 0.33 2.0 3.4 0.00III/H (l5-30cm) 5.3 3.9 <0.02 0.27 1.0 1.7 0.00
SCHACHTSCHABEL, 1992). Since within the transects thenatural conditions (climate, soil type, relief) for the threesites are the sarne, changes of Corg reflecr the effects ofvarious agricultural management practices on the amount ofsoil organic matter, as shown in table 9. The Corg contentin the referencesoil I1Rindicates the natural balance ofsoilorganie matter under undisturbed grassland. The arablesoils IIA and I1H, showed a deereaseofabout 50% ofC or '
as a eonsequence of intensive landuse, applieation of arti~cial fertilizers and field clearing.
Although the Austrian arable soil IIIA was eultivated till1989 as orehard, 5 years of intensive single-erop farming(maize) eaused a deerease of Cor from 100 % (= II1R) to42 % (IIIA). The more favouratle values of Cor in theadjaeent Hungarian arable soil (WH, 79% of tte referenee) may result from the nourishing effects oferop rotation and from the eultivated erops. Also in transeet III theinfluenee of agriculturallanduse on the soil organic matter is evident. Within 10 years the deerease in Corg oHIIIAamounts to 58 % as eompared with the reference. Correlation analysisof Cor with microbiological and soil.srructural parameters of tte investigated soils show a positivecorrelation with the mierobial biomass Cmic (r = 0.76 , P= 0.01) and with the soil aggregate stability (r =0.6, P =
0.01).
Effectlve cation exchange capacity (CECe;j and exchangeablecationsDue to the variable eharges of particular soil components,rhe CEC mainly depends on the soil pH. The CEC derermined in the neutral range (pH 7-7.5) of the soil solutionrepresents the potential CEC (CECpot)' The CEC derermined at a given soil pH indicates the aetual capacity of thesoil and is ealled effective CEC (CECeff) .
The CECeff and the amount of exehangeable eations ofthe investigared soils are shown in table 10. The cation saturation in % of the CECeff and the base saturation arequoted on table 11. The data show that soils have weakacidic eharaeteristies, nevertheless, the exchangeable Fe,Mn and Al contents are neglectable. All soils have sufficientamounts of exchangeable Mg, Ca and little Na. Al inexchangeable form occurs in transect IU under forest andarable field,
Comparing the soils of transect I, rhe Hungarian arablesoil I/H (rape) showed the highest and the Austrian arablesoil IIA (peas) the lowest CECeff, in agreement with pH andCor content, Ca-saturation predominated 76 to 87 %.Thebas: saturation was very high (99%). Fe and Al are notexchangeable at this range of soil pH. A comparison ofCECeff between reference and both arable soils in transectII showed, again, a clear correlation with pH and Corg' with
Die Bodenkultur 105 52 (2) 2001

N. Rampazzo andA. Mender
CECelfand exchangeable carions of rhe invesrigared soils . . ..Effikri Kar"onenausrauschkapazitär und austauschbare Kationen In den untersuchten Boden
Table10:T:blllOa e e : e nve 1
CECeff Ca Mg K Na Fe Al MnTransecrmeq/kgmeq/kg
Transect I162.3 30.3 4.4 0.1 0.00 0.0 4.6IIIIJ (0-15cm) 202.1
IIIIJ (l5-30cm) 227.3 194.1 30.0 3.1 2.7 0.00 0.0 2.6
I/A(0-15cm) 157.0 120.6 26.3 3.9 2.2 0.00 0.0 4.1
l/A (l5-30cm) 165.5 126.3 26.4 4.4 2.6 0.00 0.0 5.8
I/HI (0-15cm) 227.5 198.1 22.2 3.8 2.0 0.00 0.0 1.3
I/H (15 30cm) 220.5 189.8 22.7 4.4 1.6 0.00 0.0 1.9
Transect II47.0 2.3 2.0 0.00 0.0 2.2Il/IIJ (0-15cm) 246.5 193.0
Il/IIJ (15-30cm) 188.1 145.6 36.1 2.0 2.3 0.00 0.0 2.2
WA (0-15cm) 213.8 164.6 42.3 2.3 2.6 0.00 0.0 2.0
II1A (15-30em) 211.1 162.4 41.9 2.3 2.3 0.00 0.0 2.1
WHI (0-15em) 206.2 164.1 33.7 3.4 2.1 0.00 0.0 2.9
WH (15 30em) 208.5 166.4 33.7 2.5 2.2 0.02 1.7 3.5
TranseetIII4.5 0.04 12.6 4.61IlIIIJ (Q-15cm) 134.9 99.3 23.4 1.7
BIIRi (I5-30cm) 104.0 75.3 17.2 2.4 1.8 0.02 34.1 3.5III/A (Q-15cm) 76.0 49.2 10.3 6.0 2.5 0.02 44.0 3.0HIlA (15-30cm) 80.7 59.3 10.9 6.3 1.7 0.00 0.0 2.7III/HI (0-15em) 169.3 133.3 25.9 3.4 1.4 0.13 11.0 4.0BIIH(15-30cm) 144.7 11.4 24.4 2.6 1.6 0.02 21.2 2.4
Table11: Basesaruration and sarurarion of exchangeable cations in % of the CECeff in the invesrigared soilsTabelle 11: Basensättigung und Sättigungan austauschbarenKationen der untersuchten Böden in % der effektivenKationenaustauschkapazirär
Transeet CECelf Base Ca Mg K Na Fe Al Mn% saturat, % % % % % % %
Transect IIIIIJ (0-15em) 100 97.5 80.3 15.0 2.2 0.0 0.0 0.0 2.3IIIIJ (I5-30cm) 100 98.9 85.4 11.0 1.4 1.1 0.0 0.0 1.1l/A (0-15cm) 100 97.4 76.8 16.7 2.5 1.4 0.0 0.0 2.6I/A (15-30cm) 100 96.5 76.3 16.0 2.6 1.6 0.0 0.0 3.5I1HI (0-15em) 100 99.4 87.1 9.8 1.6 0.9 0.0 0.0 0.6I1H (15-30cm) 100 99.1 86.1 10.3 2.0 0.7 0.0 0.0 0.9Transecr IlIIIIIJ (Q-15cm) 100 99.1 78.3 19.1 0.9 0.8 0.0 0.0 0.9IIIIIJ (l5-30cm) 100 98.8 77.4 19.2 1.0 1.2 0.0 0.0 1.2II1A(Q-15cm) 100 99.1 77.0 19.8 1.1 1.2 0.0 0.0 0.9BIA(I5-30cm) 100 99.0 77.0 19.9 1.1 1.1 0.0 0.0 1.0WHI (0-15cm) 100 98.6 79.6 16.4 1.6 1.0 0.0 0.0 1.4II1H (15-30cm) 100 98.2 79.8 16.1 1.2 1.1 0.0 0.8 1.7TransecrIIIBIIRi (0-15cm) 100 95.5 73.6 17.4 3.3 1.2 0.0 9.3 3.4HIIRi (I5-30cm) 100 93.0 72.5 16.5 2.3 1.7 0.0 32.8 3.3III/A (Q-15cm) 100 89.5 64.8 13.6 7.9 3.3 0.0 57.9 4.0III/A (l5-30cm) 100 96.7 73.4 13.5 7.7 2.1 0.0 0.0 3.3IIlIHI (Q-15cm) 100 96.8 78.7 15.3 2.0 0.8 0.1 6.5 2.4IIIIH(15-30cm) 100 96.7 77.0 16.8 1.8 1.1 0.0 14.6 1.6
strong decrease in the arable soils, In transect III the refer~nce forest soil (IIIIH) showed the highest CECeff' resultlng from the high day (35%) and C
orcontent, The base
saturation was high.The occurance of~e, Al and increasedMn valuesare due to the lowerpH values of these soils,
Nitrogen, phosphorus andpotassiumThe inorganic form of nitrogen (Nmin) constitutes a verysmall fraction (2-5 %) of the total nitrogen (Nt)' TheN min forms, however, are available to plants. NH/ andN03- are the main Nmin-compounds. The available nitro-
Die Bodenkultur 106 52 (2) 2001
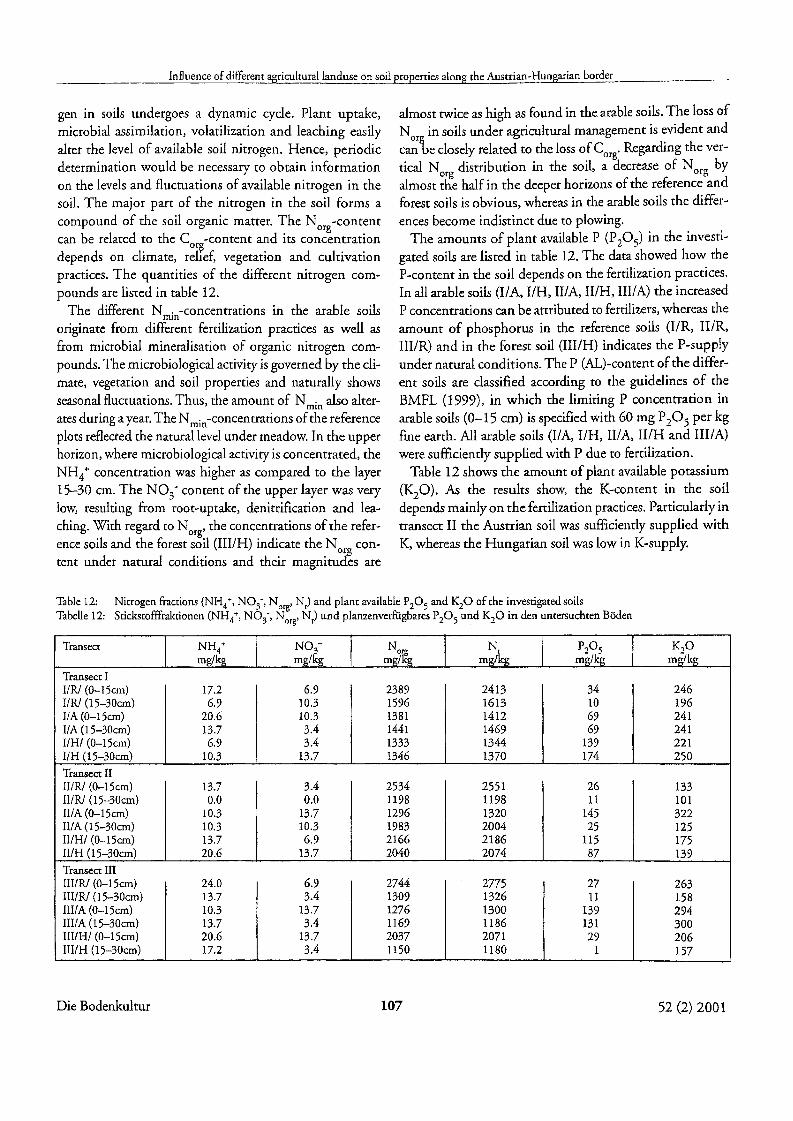
Influence of different agriculcurallanduse on soil properriesalong rhe Austrian-Hungarian border
gen in soils undergoes a dynamic eyde. Plant uptake,mierobial assimilation, volarilization and leaehing easilyalter the level of available soil nitrogen. Henee, periodiedetermination would be neeessary to obtain informationon the levels and fluetuations of available nitrogen in thesoil. The major part of the nitrogen in the soil forms a
eompound of the soil organic matter. The Norg-eonrenrean be relared to the Corg-eontenr and its eoneenrrationdepends on climate, relief, vegetation and cultivation
praetices. The quanrities of the different nitrogen cornpounds are listed in table 12.
The different N min-concentrations in the arable soilsoriginate from different fertilization practices as weH asfrom mierobial rnineralisation of organie nitrogen com
pounds. The microbiological aetivity is governed by the clirnate, vegetation and soil properties and naturally showsseasonal fluctuations. Thus, the amount of N min also alter
ates during a year. The N min-eoneenrrations ofthe referenceplots refleeted the natural level under meadow. In the upperhorizon, where microbiological aetivity is coneenrrated, theNH4+ coneenrration was higher as eompared to the layer15-30 em. The N03- eonrent of the upper layer was verylow, resulting from root-uptake, denitrifieation and leaehing. With regard to N org' the eoneentrations ofthe referenee soils and the forest soil (IWH) indicate the N con-
d al diti d hei .odrg
tent un er natur eon nons an t eir magmtu es are
almost twice as high as found in the arable soils. The lass ofN or in soils under agricultural management is evident and
can te dosely related to the lass of Corg' Regarding the vertical N org distribution in the soil, a decrease of N org byalmost die half in the deeper horizons of the referenee andforest soils is obvious, whereas in the arable soils the differ
enees become indistinet due to plowing.The amounrs of plant available P (P205) in rhe investi
gated soils are listed in table 12. The data showed how theP-contenr in the soil depends on the fertilization practices.In all arable soils (IIA, I1H, WA, WH, III/A) the increasedP concentrations can be attributed to fertilizers, whereas the
amount of phosphorus in the reference soils (I1R, IIIR,III/R) and in the forest soil (IIUH) indicates the P-supplyunder natural conditions. The P (AL)-contenr of the differenr soils are classified aceording to the guidelines of the
BMFL (1999), in which the limiting P concentration in
arable soils (0-15 crn) is specified with 60 mg P20 5 per kgfine earth. All arable soils (I/A, I1H, lIlA, II/H and III/A)were sufficiently supplied with P due to fertilization.
Table 12 shows the amount of plant available potassium(K20). As the results show, rhe K-contenr in the soildepends mainlyon the fertilization praetices. Particularly intransect 11 the Austrian soil was sufficiently supplied withK, whereas the Hungarian soil was low in K-supply.
Table 12: Nitrogen fractions (NH 4+, N03-, Norg' Nt) and plant available P205 and K20 of rhe invesrigatedsoilsTabelle 12: Stickscofffraktionen (NH/, N03' , Norg' Nt) und planzenverfügbaresP205 und K20 in den untersuchten Böden
Transecr NH4+ NO - Nom Nt PzÜ5 KlOmg/kg mg/fg mg!k'g mg/kg mgJkg mj1;/kg
Transect IIIRI (O-IScm) 17.2 6.9 2389 2413 34 246I/RJ (1S-30cm) 6.9 10.3 1596 1613 10 196I/A (0-15cm) 20.6 10.3 1381 1412 69 241I/A (15-30cm) 13.7 3.4 1441 1469 69 241IIHI (0-15cm) 6.9 3.4 1333 1344 139 221IIH (IS-30cm) 10.3 13.7 1346 1370 174 250
Transect 11Il/RJ (0-15cm) 13.7 3.4 2534 2551 26 133II/RJ (l5-30cm) 0.0 0.0 1198 1198 11 101IIIA (0-15cm) 10.3 13.7 1296 1320 145 322IIIA (15-30cm) 10.3 10.3 1983 2004 25 125IIIHI (0-15cm) 13.7 6.9 2166 2186 115 175H/H (15-30cm) 20.6 13.7 2040 2074 87 139
Transect IIIIlIlRI (0-15cm) 24.0 6.9 2744 2775 27 263HIIRI (15-30cm) l3.7 3.4 1309 1326 11 IS8III/A (O-IScm) 10.3 13.7 1276 1300 139 294III/A (15-30cm) 13.7 3.4 1169 1186 131 300III/HJ (O-IScm) 20.6 13.7 2037 2071 29 206III/H (I5-30cm) 17.2 3.4 11S0 1180 1 157
Die Bodenkultur 107 52 (2) 2001
N. Rampazzoand A. Mentler
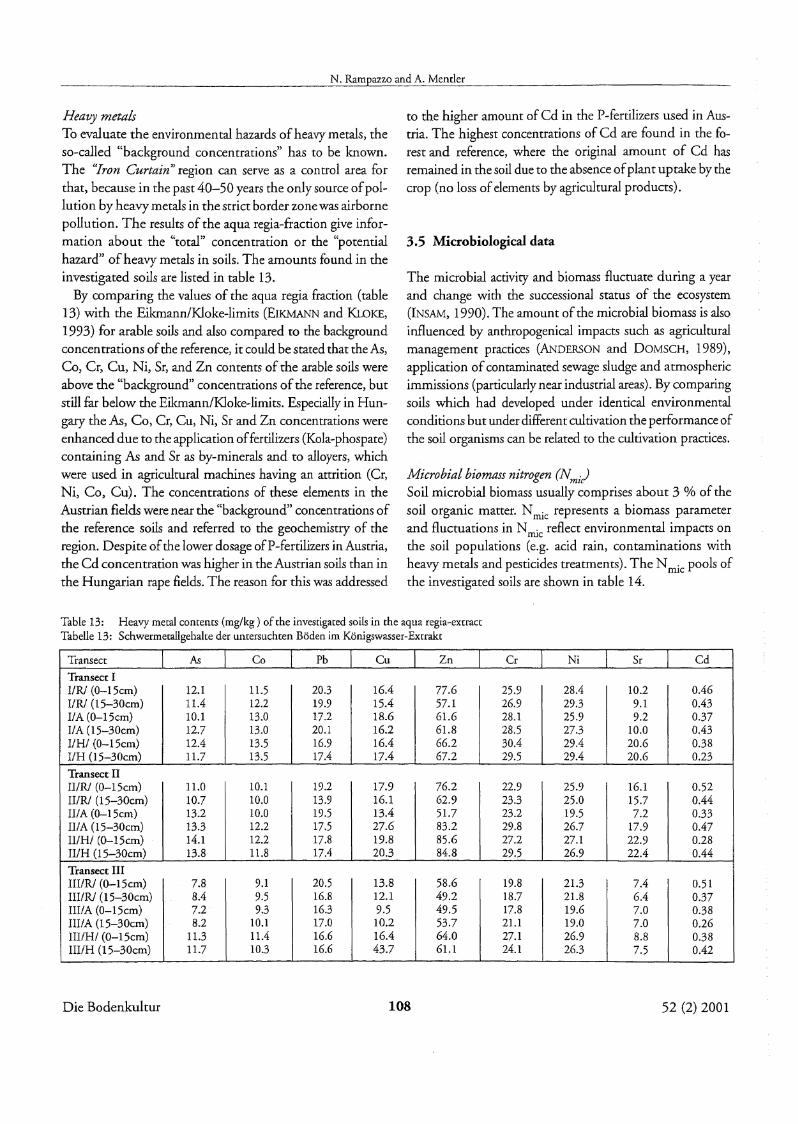
Heavy metals
Ta evaluate the environmental hazards ofheavy metals, the
so-called "background concentrations' has to be known.
The "Iran Curtain" region can serve as a control area for
that, because in the past 40-50 years the only source ofpol
lution byheavy metals in the strict border zone was airborne
pollution. The results of the aqua regia-fraction give infor
mation about the "total" concentration or the "potential
hazard" ofheavy metals in soils, The amounts found in the
investigated soils are listed in table 13.By comparing rhe values of the aqua regia fraction (table
13) with the Eikmann/Kloke-limits (EIKMANN and KLOKE,
1993) for arable soils and also compared to the backgroundconcentrations ofthe reference, it could be stated that the As,Co, Cr, Cu, Ni, Sr, and Zn contents of the arable SOllS were
above the "background" concentrations of the reference, but
still far below the Eikmann/Kloke-limirs, Especially in Hungarythe As, Co, Cr, Cu, Ni, Sr and Zn concentrations were
enhanced due to rhe application offerrilizers (Kola-phospate)
containing As and Sr as by-minerals and to alloyers, which
were used in agriculrural machines having an attrition (Cr,
Ni, Co, Cu). The concentrations of these elements in the
Austrian fields were near the "background" concentrations of
the reference soils and referred to the geochemisrry of the
region. Despite ofthe lower dosage ofP-fertilizers in Austria,
the Cd concentration was higher in the Austrian soils than in
the Hungarian rape fields, The reason for this was addressed
to the higher amounr of Cd in the P-fertilizers used in Aus
tria. The highest concentrations of Cd are found in the forest and reference, where the original amount of Cd has
remained in the soil due to the absence ofplant uptake bythe
crop (no lass ofelements byagricultural products),
3.5 Microbiological data
The microbial activity and biomass Ilucruare during a year
and change with the successional status of the ecosystem
(INSAM, 1990). The amount of the microbial biomass is also
influenced by anthropogenical impacts such as agriculrural
management practices (ANDERSON and DOMSCH, 1989),
application ofcontaminated sewage sludge and atmospheric
immissions (particularlynear industrial areas). By comparingsoils which had developed under identical environmental
conclitions but under different cultivation the performance of
the soil organisms can be relared to the cultivation practices,
Microbialbiomass nitrogen (Nmi)Soil microbial biomass usually comprises about 3 % of the
soil organie matter. N mic represents a biomass parameter
and fluctuations in N mic reflect environmental impacts on
the soil populations (e.g. acid rain, contaminations with
heavy metals and pesticides treatments). The N mic pools of
the investigated soils are shown in table 14.
Table 13: Heavymetal contents (mg/kg ) of the investigated soils in ehe aqua regia-exrractTabelle 13: Schwermetallgehalte der untersuchten Böden im Königswasser-Extrakt
Transecr As Co Pb Cu Zn Cr Ni Sr Cd
Transect II/RJ (0-15cm) 12.1 11.5 20.3 16.4 77.6 25.9 28.4 10.2 0.46I/R/ (15-30cm) 11.4 12.2 19.9 15.4 57.1 26.9 29.3 9.1 0.43I/A (O-15cm) 10.1 13.0 17.2 18.6 61.6 28.1 25.9 9.2 0.37I/A (15-30cm) 12.7 13.0 20.1 16.2 61.8 28.5 27.3 10.0 0.43I/Hf (O-15cm) 12.4 13.5 16.9 16.4 66.2 30.4 29.4 20.6 0.38I/H (15-30cm) 11.7 13.5 17.4 17.4 67.2 29.5 29.4 20.6 0.23
Transect 11IIIRI (O-15cm) 11.0 10.1 19.2 17.9 76.2 22.9 25.9 16.1 0.52II/R/ (15-30cm) 10.7 10.0 13.9 16.1 62.9 23.3 25.0 15.7 0.44Il/A (O-15cm) 13.2 10.0 19.5 13.4 51.7 23.2 19.5 7.2 0.33111A (1S-30cm) 13.3 12.2 17.5 27.6 83.2 29.8 26.7 17.9 0.47lI/Hf (O-15cm) 14.1 12.2 17.8 19.8 85.6 27.2 27.1 22.9 0.28II/H (15-30cm) 13.8 11.8 17.4 20.3 84.8 29.5 26.9 22.4 0.44Transect 111III/RJ (O-15cm) 7.8 9.1 20.5 13.8 58.6 19.8 21.3 7.4 0.51IIIIRI (15-30cm) 8.4 9.5 16.8 12.1 49.2 18.7 21.8 6.4 0.37III/A (O-15cm) 7.2 9.3 16.3 9.5 49.5 17.8 19.6 7.0 0.381111A (lS-30cm) 8.2 10.1 17.0 10.2 53.7 21.1 19.0 7.0 0.26III/HI (O-15cm) 11.3 11.4 16.6 16.4 64.0 27.1 26.9 8.8 0.38III/H (15-30cm) 11.7 10.3 16.6 43.7 61.1 24.1 26.3 7.5 0.42
Die Bodenkultur 108 52 (2) 2001

Influence of differentagriculrnrallanduse on soil properdes along the Austrian-Hungarian border
After a multiple range test a significant differenee berweenthe reference and the arable soils eould be determined onlyfor transect III, in which the referenee and forest soilshowed twice as high N mic contents as the arable soil.
Sire Nmic SIR Cmic BRmgl mgCOzl mgC0 21 IlgC°i
kgdry mass 100g soilx h 100gsoil g dry mass x h
Transecr IReference 9.6 2.79 57.22 7.8Austria 6.8 1.80 37.10 2.6Hungary 27.2 2.92 47.10 1.6
'Iransect IIReference 18.6 5.74 117.28 8.4Austria 25.7 2.40 49.32 4.3Hungary 26.1 3.52 72.11 7.3
Transect IIIReference 40.3 2.97 60.99 7.8Austria 23.3 1.41 23.62 2.7Hungary 50.8 2.41 49.42 6.5
Substrate induced respiration rate (SIR), and microbial biomass carbon (C .)
ml
The substrate indueed respiration (SIR) method is a physio-logicall~-based method, The rate of respiration (= CO2
production) by the microbial population is measured following the addition of substrate to the soil, but before population growth oeeurs. The dara obtained refleet thepotential activity of the microbial population, but are alsoused to estimate microbial biomass. The results are listed intable 14. The SIR correlated positive1y with the C con-
. orgtent (r = 0.76, P = 0.02), with the water eontent (r = 0.7, P= 0.04) and with Nt (r = 0.85, P = 0.004). The respirationrate was negative1y correlated with the bulk density (r =
0.55). No positive relation could be found with the claycontent, in centrast to VAN VEEN er al., (1985), nor to theCECeff' in contrast to KAISER et al. (1992) and to the pH.The SIR rates were positive1y corre1ated with other microbial parameters such as the basal respiration (r =0.87, P =
0.002), theDRA(r= 0.9, P = 0.001) and theergosterol content (r = 0.79, P =0.01). Adefinite corre1ation with N .
1filC
cou d only be found in transect III (r = 0.76, P =0.05).Differences berween the SIRraresand the C . data ofthe
arable soils and those of the referenee soilswe;;~ignificant.
Table14:
Tabelle14:
Microbial biornass-N (Nmic), substrate-induced-respiradon-rate (SIR), microbial biomass-C (C .) and basal res-.• () rrucplratiOn rate BR in rhe invesrigared soils
MikrobiellerBiomasse-N (N .), Substrat-Induzierte-Res-• • mlC
pirations-Rare (SIR), mikrobieller Biomasse-C (C .) undBasal RespirationsRate (BR) in den untersuchten BÖden
A signifieant differenee eould also be determined betweenthe Austrian and Hungarian fie1ds for these parameters. Thelow valuesof the Austrian soils reflected their low C con-
h . h o~tents, w ereas In t e Hungarian soils the SIR rares and theCorg contents were higher.
Basal respirationThe basal respiration, resulting from deeomposition oforganie matter, indicates the C-mineralisation rate of thesoil and is defined as CO2-release by the indigenous rnicrobial pool such as bacreria, fungi, algae and prorozoa(ANDERSONand DOMSCH, 1989). Under undisturbed conditions the eeological balance berween soil organisms andtheir aetivity is stabilized. Thus the basal respiration represents the metabolic status of the soil microbial popularionand is affeeted by environmental impacts. The basal respiration rares of the investigated soils, which strongly eorrelated to C mic' are shown in table 14. The basal respirationwas positive1yeorrelated to the SIR (r = 0.87, P = 0.002), toDRA ( r = 0.83, P = 0.005), to the C content Cr= 0 78 Porg • ,
= 0.01) and to the Nt content in the soil (r = 0.82, P =
0.007).
Dimethylsulftxid-reductase-activity (DRA)The system dimethylsulfoxide (DMSO) and dimethylsulfide (DMS) plays an importanr part in the global sulfurcyde, especially between aquatie and terrestrial ecosystems.DMS is ehiefly produeed by algae and is highly volatile. Inthe atmosphere DMS is oxidized to DMSO and gets viaprecipitation to aquatic and terrestrial systems. The reduction of dimethylsulfoxid CDMSO) to dimethylsulfid(DMS) is a widely oeeuring metabolie process and takesplace in mieroorganisms, higher plants and animals. Asreported by ALEF and KLEINER (1989), among 114 strainsof soil microorganisms only 5 strains are not capable ofreducing DMSO to DMS. Thus by the DMSO-reductionrnerhod rhe total microbial acitivity in the soil can bedescribed. The DRA dara ofthe investigated soils are listedin table 15.
The results ean be re1ated to other microbiological data.The DRA is positively correlated wirh the basal respirationrate (r = 0.8, P=0.005) and with the SIR (r = 0.9, P =0.001).A positive relation to Nmic was found in transect III (r =0.84, P = 0.05). A strang positive relation eould be foundwith the C org content (r = 0.84, P = 0.005), Nt (r = 0.8, P= 0.01) and the warer content (r = 0.87, P = 0.002). TheDRA in the arable soils eould be significantly distinguishedfrom the referenee and forest soils (significanee level =
Die Bodenkultur 109 52 (2) 2001
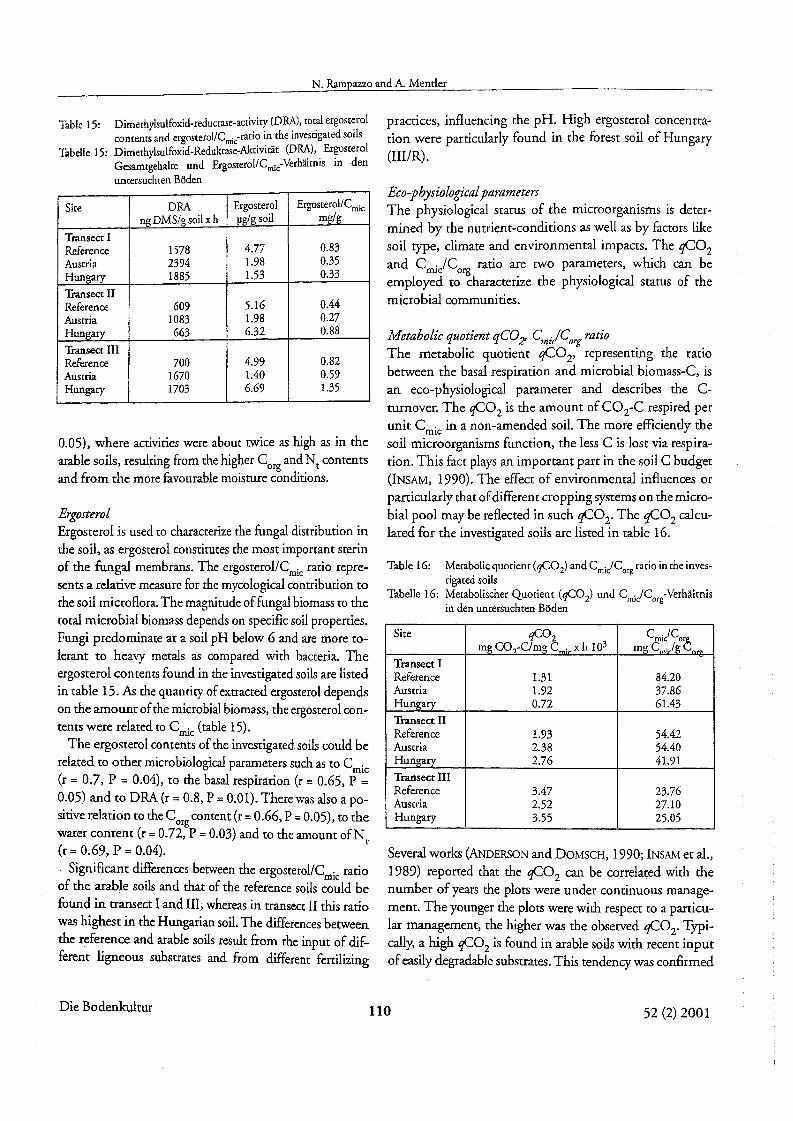
N. Rampazzo and A. Menrler
110
Table 15: Dimerhylsulfoxid-reduerase-aetivity (DRA), totalergost:rolconrenrsand ergosrerol/Cmk-ratio in ehe investigated soils
Tabelle 15: Dimethylsulfoxid-Redukrase-Aktivirär (DRA), Er?osrerolGesamtgehalte und Ergosrerol/Cmic-Verhältnis 10 denuntersuchtenBöden
Sire DRA Ergosrerol Ergosrerol/Cmicng DMS/gsoilx h pg/gsoil mg/g
Transect I0.83Reference 1578 4.77
Ausrria 2394 1.98 0.35
Hungary 1885 1.53 0.33
Transect II0.44Reference 609 5.16
Ausrria 1083 1.98 0.27
Hungary 663 6.32 0.88
Transect IIIReference 700 4.99 0.82Ausrria 1670 1.40 0.59Hungary 1703 6.69 1.35
0.05), where activities were about twice as high as in the
arable soils, resulting from the higher Corg and Nt contents
and from the more favourable moisture conditions.
ErgosterolErgosterol is used to characterize the fungal distribution in
the soil, as ergosterol constitutes the most important sterin
of the fungal membrans. The ergosterol!Cmic ratio repre
sents a relative measure for the mycological contribution tothe soil microflora, The magnitude offungal biomass to the
total microbial hiomass depends on specific soilproperties.
Fungi predominate at a soil pH below 6 and are more to
lerant to heavy metals as compared with bacteria, Theergosterol contents found in the investigated soilsare listed
in table 15. As the quantity of extracted ergosterol depends
on the amount of rhe microbial biornass, the ergosterol contents were relared to C rnic (table 15).
The ergosterol contents of the investigared soils could be
related to other microbiological parameters such as to Crnie
(r = 0.7, P =0.04), to the basal respiration (r =0.65, P =0.05) and to DRA (r = 0.8, P = 0.01). There was also a positive relation to the Corg conrent (r =0.66, P =0.05), to the
warer eontent (r = 0.72, P = 0.03) and to the amount ofN,(r = 0.69, P = 0.04).
Sig·nificant differenees between the ergosterol/C . ratiomic
of the arahle soils and that of the referenee soils eould be
found in transect I and III, whereas in transect II this ratiowas highest in the Hungarian soil. The differencesberween
the referenee and arable SOllS result from the input of different ligneous substrates and from different fertilizing
Die Bodenkultur
praetices, influencing the pH. High ergosterol concentra
tion were particularly found in the forest soil of Hungary
(III/R).
Eeo-physiologicalparametersThe physiological status of the microorganisms is derer
mined by the nutrienr-conditions as weIl as hy factors like
soil type, climate and environmental irnpacts. The qC02and C . IC ratio are rwo parameters, which can herruc orgemployed to characterize the physiological status of the
microbial communities.
Metabolie quotient qC02' Cm/Corg ratioThe metabolie quotient qC02' representing the ratiobetween the basal respiration and microbial biomass-C, is
an eeo-physiological parameter and describes the C
turnover. The qC02 is the amount of CO2-C respired per
unit C . in a non-amended soil. The more efficiently themicsoil microorganisms function, the less C is lost via respira-
tion. This fact plays an important part in the soil C budget
(lNSAM, 1990). The effect of environmental influences or
particularly that ofdifferent cropping systems on the miero
bial pool may be reflected in such qC02' The qC02 calculated for the invesrigated soils are listed in table 16.
Table 16: Metaboliequorient (qC02) and Cmi/Corg ratio in theinvesrigatedsoils
Tabelle 16: Metabolischer Quorienr (qC02) und Cmic/Corg-Verhälmisin den untersuchten Böden
Sire qC°z Cmi/Co~mg CO,-C/mg C . x h 103 mgC ./g
Transect IReference 1.31 84.20Austria 1.92 37.86Hungary 0.72 61.43
Transect IIReference 1.93 54.42Austria 2.38 54.40Hungary 2.76 41.91
Transect IIIReference 3.47 23.76Austria 2.52 27.10Hungary 3.55 25.05
Several works (ANDERSON and DOMSCH, 1990; INSAM et al.,1989) reported that the qC02 ean be correlated with thenumber of years the plots were under continuous manage
ment, The younger the plots were with respect to a particu
lar management, the higher was the observed qC02' Typi
cally, a high qC02 is found in arable soils with recent input
ofeasily degradable substrates. This tendency was confirmed
52 (2) 2001
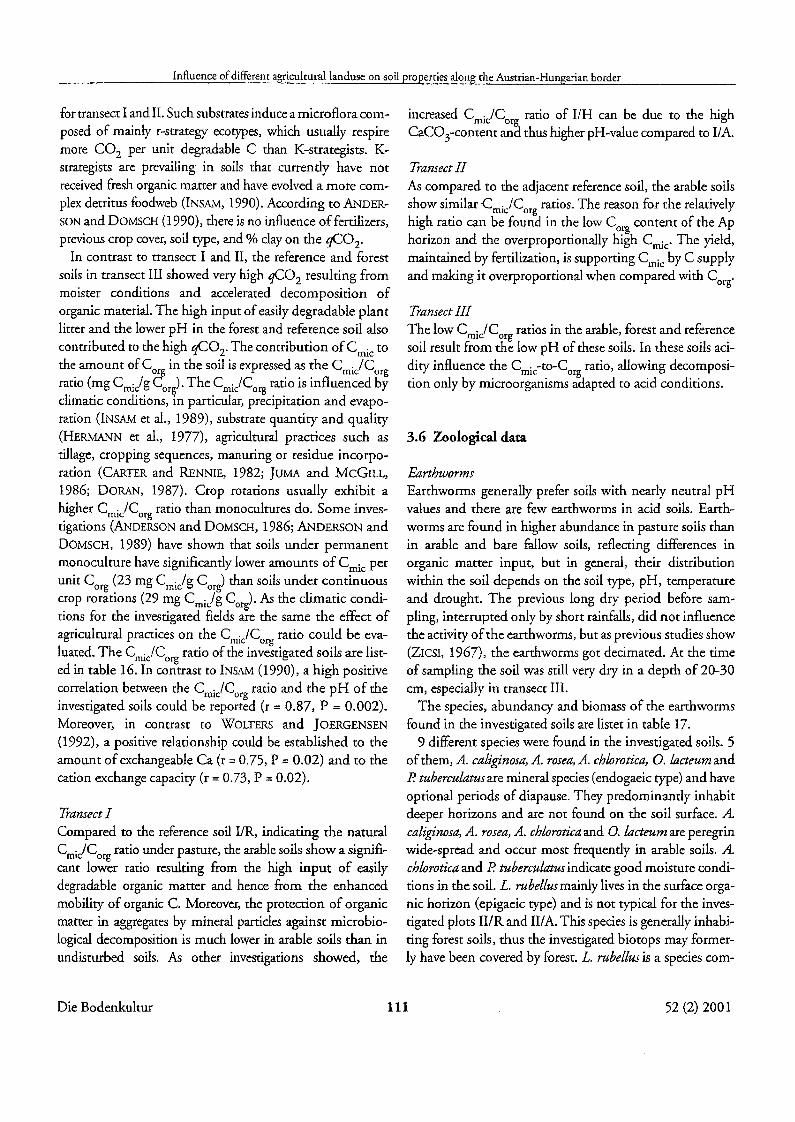
Influence of different agriculmrallanduse on soil properties along ehe Austrian-Hungarian border
for transect I and H.Such substrates induce a microflora composed of mainly r-strategy ecorypes, which usually respiremore CO2 per unit degradable C than K-strategists. Kstraregists are prevailing in soils that currently have not
received fresh organic matter and have evolved a rnore complex detritus foodweb (INSAM, 1990). According to ANDERSON and DOMSCH (1990), there is no influence offertilizers,
previous crop cover,soil type, and % day on the qC02'In centrast to transect I and H, the reference and forest
soils in transect III showed very high qC02 resulting frommoister conditions and accelerated decomposition oforganic material. The high input ofeasily degradable plantlitter and the lower pH in the forest and reference soil also
contributed to the high qC02' The contribution ofCmic to
the amount of Corg in the soil is expressed as the CmJCorgratio (mg Cmi/g Corg)' The Cmi/Corgratio is influenced byclimatic conditions, in particular, precipitation and evaporation (INSAM et al., 1989), substrate quantity and quality
(HERMANN et al., 1977), agricultural praetices such astillage, cropping sequences, manuring or residue incorporation (CARTER and RENNIE, 1982; ]UMA and MCGILL,1986; DORAN, 1987). Crop rotations usually exhibit a
higher CmjCorg ratio than monocultures do. Some investigations (ANDERSON and DOMSCH, 1986; ANDERSON and
DOMSCH, 1989) have shown that soils under permanentmonoculture have significantly lower amounts of Cmic per
unit Corg (23 mg Cmjg Corg) than soils under continuouscrop rotations (29 mg Cmi/g Corg)' As the climatic conditions for the investigared fields are the same the effect ofagrieultural practices on the Cmi/Corg ratio could be eva
luated. The CmjCorg ratio of the investigated soils are listed in table 16. In contrast to INSAM (1990), a high positive
correlation between rhe CmjCorg ratio and the pH of theinvestigated soils could be reported (r =0.87, P =0.002).Moreover, in contrast to WOLTERS and JOERGENSEN(1992), a positive relationship could be established to the
amount ofexchangeable Ca (r =0.75, P =0.02) and ro thecation exchange capacity (r =0.73, P =0.02).
Transect ICompared to the reference soil IIR, indicating the natural
Cmi/Corgratio under pasture, the arable soils show a significant lower ratio resulting from the high input of easilydegradable organic matter and hence from the enhanced
mobility of organic C. Moreover, the protection of organicmatter in aggregates by mineral particles against mierebiological decomposition is much lower in arable soils than inundisturbed soils. As other investigations showed, the
increased Cmi/Corg ratio of VH can be due to the highCaC03-content and thus higher pH-value compared to VA.
TransectIIAs compared to the adjacent reference soil, the arable soils
show similar Cmi/Corg ratios. The reason for the relativelyhigh ratio can be found in the low Corg content of the Ap
horizon and the overproportionally high Cmic' The yield,maintained by fertilizarion, is supporting Cmicby C supplyand making it overproportional when compared with Corg'
Transect 111The low Cmic/Cor ratios in the arable, forest and referencesoil result from th~ low pH of these soils. In these soils aci
dity influence the Cmic-to-Corg ratio, allowing decomposition only by microorganisms adapted ro acid conditions.
3.6 Zoological data
EarthwormsEarthworms gene rally prefer soils with nearly neutral pHvalues and there are few earthworms in acid soils. Earrhworms are found in higher abundance in pasture soils thanin arable and bare fallow soils, reflecting differences inorganic matter input, but in general, their distribution
within the soil depends on the soil type, pH, temperatureand drought. The previous long dry period before sampling, interrupted only by short rainfalls, did not influencethe activity ofthe earthworms, but as previous studies show(ZICSI, 1967), the earthworms got decimared, At the time
of sampling the soil was still very dry in a deprh of 20-30cm, especially in transect III.
The species, abundancy and biomass of the earthworms
found in rhe investigated soils are listet in table 17.9 different species were found in the investigated soils. 5
ofthern, A. caLiginosa, A. rosea, A. cblorotica, O. lacteum andP. tuberculatusare mineral species (endogaeic type) and have
optional periods of diapause. They predominantly inhabitdeeper horizons and are not found on the soil surface. A.caliginosa, A. rosea, A. cblorotica and 0. lacteumare peregrinwide-spread and occur most frequently in arable soils. A.cblorotica and P. tubereulatus indicate good moisture conditions in rhe soil, L. rubellus mainly lives in the surface orga~
nie horizon (epigaeic type) and is not typical for the investigated plots II/R and lIlA. This species is generally inhabi
ting forest soils, thus the investigated biotops may formerly have been covered by forest. L. rubellus is a species com-
Die Bodenkultur 111 52 (2) 2001

N. Rampazzo andA. Mencler
Table 17: Species, abundancy, diversiry and biomassof earrhwormsin the investigaredsoilsTabelle 17: Spezies, Abundanz, Diversirät und Biomasse von Regenwürmern in den untersuchten Böden
Species Transect I TransecrII Transcer IIII1R IIA I1H lI/R lIlA WH IIIIR IIIIA IIIIH
Alloloboforacaliginosa 40 14 64 10 10 2 0 0 0Alloloboforachlororica 0 0 2 0 0 0 0 0 0Alloloboforarosea 12 38 66 2 4 6 2 2 0Firzingeria pI. Platyura 0 0 0 8 12 0 0 4 2Firzingeria pl. Depressa 0 0 0 2 0 0 6 0 0Lumbricus polyphemus 0 0 0 0 2 2 2 0 2Lumbricus rubellus 0 0 0 2 6 0 0 0 0Lumbricussp. juv, 2 0 2 0 0 0 0 0 0Octolasium lacreum 2 0 4 2 14 2 8 0 4Procrodrilus tuberculatus 0 18 46 0 4 2 0 0 0
Abundancy (11m2) 56 70 184 26 52 14 18 6 8Diversity 0.81 1.15 1.26 1.52 1.78 1.47 1.22 0.64 1.39Biomass (g/m2) 25.1 27.9 58.1 29.6 43.0 17.4 17.2 4.5 9.2
112
mon on the whole European continent, 1.polyphemus, F. p.platyura and F p. depressa are subsurface species (anecictype), burrow deep holes into the ground and consumeplant litter. They represent typical species in Iessivatedsoilsof Querco-Carpinetum-associations and their propagation isrestricted to Central Europe.
A distinct differenee of the abundance between the reference and the adjaeent arable soil could be determinedonly for transect 111. The differences were based on smallfigures ofindividuals and so not very significant, althoughexperiences showed, that the abundance ofearthworms inundisturbed biotops (e.g. pasture) is inereased comparedto that in arable soils (ZICSI, 1967). Ir seemes possible thatthe reference soils were not thoroughly wetted by rainbefore sampling and thus the earthworms still inhabitedthe deeper horizons and were not seized with the methodapplied. Regarding the homogenity wirhin transect I theabundanee of the reference could be significantly distinguished from the adjacent arable soils. At the time ofsampling the arable soils were plowed and eovered with a winter erop. The species found in these soils indicated a goodwater supply. Within transect 11 and transeet III a significant differenee could be determined between II/R andII/H and between III1R and III/A. The earthworm populations were influenced by the cultivation practices and bythe vegetation form (Robinia pseudoakacia). The faetors,which show stronger impacts on the worm populationscould only be determined by further long-term investiga
tions.
Die Bodenkultur
4. Conclusions
In Austria and Hungary soil management praetices havebeen different in the last 50 years. Different types anddosages of fertilizers were used and the size of agriculturalfields also differed. Large plots, high inputs of mineral fertilizers, intensive tillage activities were characteristic forHungary. In Austria small scale farming was performed,especially in the neighbourhood of the border. The aim ofrhe study was, how these differences were reflected in soilmineralogical, physical and especially micromorphologicalcharaeteristics analyzed in the rwo countries and how thesewould differ from a non agriculturally utilized reference site.
The mineralogical resulrs indicated that under undisturbed eonditions in the reference zone a higher weatheringof illite and formation ofsmeetite oceured than in the cultivated Austrian and Hungarian sites, This showed alsosome influence on the genesis of the microstructure, leading to a more angular structured type in the tilled areasand to a more crumby structured type in the referenee profile. By comparing the mineral contents of the Austrian,Hungarian and reference soils it ean be presumed that inHungary more intensive and deeper tiUage praetices wereused.
The negative effects of eultivation were reflecred in anhigher bulk density and a decrease of total porosity. A general deerease of aggregate stability with soil depth could beobserved at the referencesites (R), this is normally due to differences in root density and mierobiological activity;Aggregate stability decreased in Austrian and Hungarian soils as aconsequenee oftilling , lower organie carbon content, rnostly uncovered soil surface and microbiological aetivity. The
52 (2) 2001

Influence of different agriculturallanduse on soil properties along the Austrian-Hungarian border
SSSA (SOlL SCIENCE SOCIETY OFAMERICA) (1965): Methods of Soil Analysis Nr.9, Part 2. Arnerican Society ofAgronomy, Inc, Madison, Wiseonsin, USA, 1162-1170.
SSSA (SOlL SCIENCE SOCIETY OFAMERICA) (1996): Meth
ods of Soil Analysis, Part 3. Chemical Methods, American Society of Agronomy, Inc, Madison, Wisconsin,
USA, 1001-1010.SCHULTZ, L. G. (1964): Quantitative interpretation of mi
neralogical composition from X-ray and chemical datafor the Pierre Shale.- U. S. Geol. Surv. Prof. Pap., 39I.c.
SCHWERTMANN, U. (1959): Die fraktionierte Extraktionder freien Eisenoxide in Böden, ihre mineralogischen
Formen und ihre Entstehungsweisen. Z. Pflanzenernähr.Bodenkd., 84, 194-204.
SCHWERTMANN, U. (1964): Differenzierung der Eisenoxide des Bodens durch Extraktion mit Ammoniumoxalat-Lösung, Z. Pflanzenernähr. Bodenkd., 105, 194
20I.TISCHLER, S. und M. ALTERMANN (1992): Veränderungen
der mikrobiologischen Aktivität durch Wechsel derBodennutzung - Ergebnisse aus dem ehemaligen Grenzstreifen. VDLUFA Schriftenreihe 35,559-566.
VANCE, E., P. C. BROOKEsandD. S.]ENKINSON (1987): Anextraction merhod for measuring soil microbial biornassC. Soil Biology and Biochemstry, 19,697-702.
VAN VEEN, ]. A., j. N. LAnD and M. AMATO (1985):Turnover of carbon and nitrogen through the microbialbiomass in a sandy loam and a day soil ineubated with
14C glucose and 15N(NH4)zS04 under different mois
ture regimes. Soil Biology and Biochemistry, 17,747-756.
WIND, G. P. (1966): Capillary conduetivity dara estimatedbya simple method, Proe. UNESCO/IASH Symp. Waterin the unsarurared zone, Wageningen, The Netherlands,181-191.
WOLTERS, V und R. G. ]OERGENSEN (1992): Die mikrobielle Biomasse in Böden der Sukzessionsreihe Acker,
Brache, Wald. VDLUFA Schriftenreihe, 35, 883-886.ZICSI, A. (1967): Die Auswirkung von Bodenbear
beitungsverfahren aufZustand und Besatzdichte von einheimischen Regenwürmern. In: O. GRAFF, ]. E.SATCHELL (Eds.): Progress in soil biology. Vieweg undSohn, Braunsehweig, North-Holland Publishing Corn
pany, Amsterdam, 290-298.
Address ofauthors
Univ. Prof. Dr. Nicola Rampazzo, Dr. Axel Mentler, Institut für Bodenforschung, Universität für Bodenkultur, Gregor-Mendel-Straße 33, A-1180 Wien; e-mail: h31Ot8@
edvl.boku.ac.at
Eingelangt am 30. Oktober 2000Angenommen am 12. Februar 2001
Die Bodenkultur 115 52 (2) 2001