
INSTITUT F UR INFORMATIK¨
23
INSTITUT F ¨ UR INFORMATIK Transient View Generation in Eclipse Christian Schneider, Miro Sp¨ onemann, and Reinhard von Hanxleden Bericht Nr. 1206 Juni 2012 ISSN 2192-6247 CHRISTIAN-ALBRECHTS-UNIVERSIT ¨ AT ZU KIEL
Transcript of INSTITUT F UR INFORMATIK¨

INSTITUT FUR INFORMATIK
Transient View Generation in Eclipse
Christian Schneider, Miro Sponemann,and Reinhard von Hanxleden
Bericht Nr. 1206
Juni 2012
ISSN 2192-6247
CHRISTIAN-ALBRECHTS-UNIVERSITAT
ZU KIEL

Institut fur Informatik derChristian-Albrechts-Universitat zu Kiel
Olshausenstr. 40D – 24098 Kiel
Transient View Generation in Eclipse
Christian Schneider, Miro Sponemann,and Reinhard von Hanxleden
Bericht Nr. 1206
Juni 2012
ISSN 2192-6247
e-mail: {chsch,msp,rvh}@informatik.uni-kiel.de

Abstract
Graph-based model visualizations can effectively communicate information, but theircreation and maintenance require a lot of manual effort and hence reduce productivity.In this report we build on the concept of Model Driven Visualization by presenting ameta model for graphical views and an infrastructure for configurable automatic layout.This enables the transient views approach, in which we efficiently derive and draw graphrepresentations from arbitrary models.

Contents
1 Introduction 2
2 Related Work 3
3 Towards Lightweight Graphical Modeling 53.1 Transient Graphical Views . . . . . . . . . . . . . . . . . . . . . . . . . . 53.2 Use Cases . . . . . . . . . . . . . . . . . . . . . . . . . . . . . . . . . . . 73.3 The KGraph and KRendering Meta Models . . . . . . . . . . . . . . . . 83.4 KIELER Lightweight Diagrams (KLighD) . . . . . . . . . . . . . . . . . . . 12
4 Configurable Automatic Layout 134.1 The Diagram Layout Process . . . . . . . . . . . . . . . . . . . . . . . . 134.2 Layout Configuration . . . . . . . . . . . . . . . . . . . . . . . . . . . . . 15
5 Conclusion and Future Work 17
ii

List of Figures
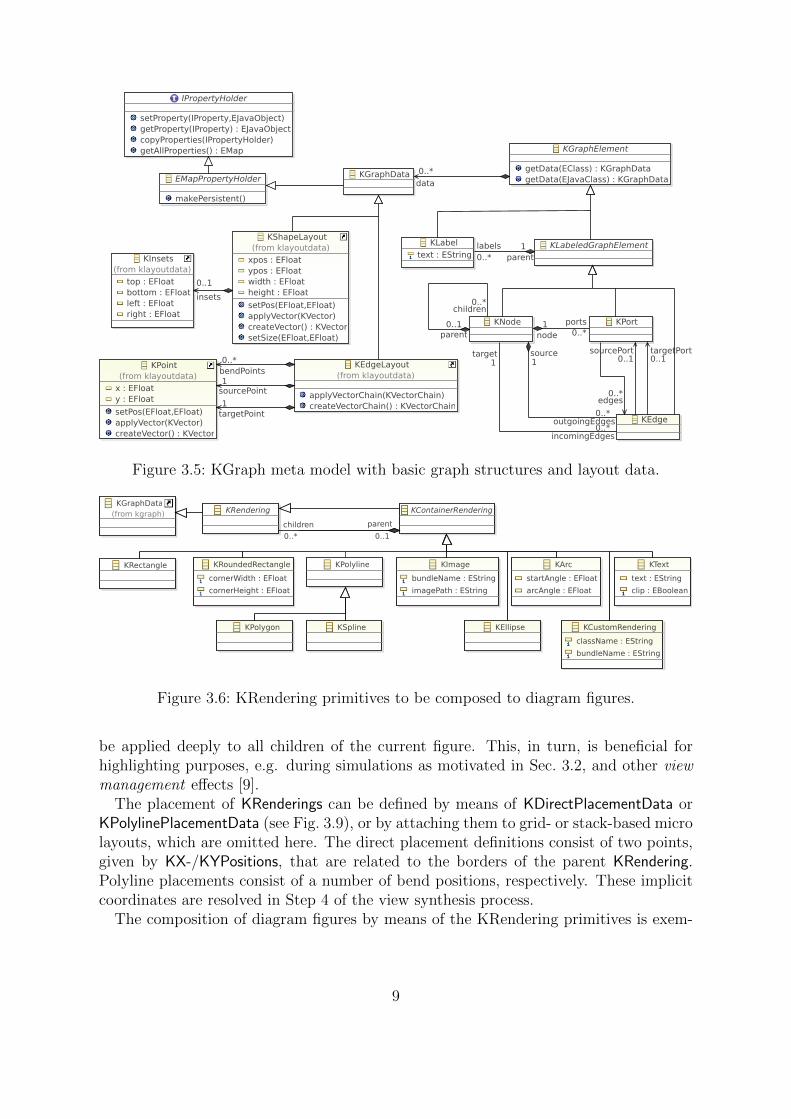
3.1 Examples of transient views . . . . . . . . . . . . . . . . . . . . . . . . . 63.2 Broken figure rendering after an update of a Statechart diagram. . . . . . 73.3 Component architectural outline of a railway signaling system. . . . . . . 73.4 Simulation of a Statechart in KIELER . . . . . . . . . . . . . . . . . . . . 83.5 KGraph meta model with basic graph structures and layout data. . . . . 93.6 KRendering primitives to be composed to diagram figures. . . . . . . . . 93.7 KRendering core elements. . . . . . . . . . . . . . . . . . . . . . . . . . . 103.8 KRendering styles for configuring diagram figures. . . . . . . . . . . . . . 103.9 KRendering placement elements for specifying micro layout directives. . . 103.10 KRendering-based specification of a diagram element. . . . . . . . . . . . 11
4.1 Overview of the layout process for typical diagram editors. . . . . . . . . 14
1

1 Introduction
Graphical modeling languages such as the UML and its dialects are established in soft-ware development and adjacent disciplines, yielding the key benefit of the abstractionof implementation details [15]. This provides stakeholders of different professions witha common language to communicate their business matters. Graphical languages arecharacterized by fixed syntaxes and well-defined semantics or at least semantics skele-tons. The so achieved advantage of effectiveness, however, is usually bought by theprice of less productivity with respect to time to formulate solutions. More precisely, animportant amount of productivity is wasted with drawing and beautification activitieswhile working with state-of-the-practice modeling environments.
For this and further reasons domain-specific textual modeling languages gain a lot ofpopularity in these days.1 Textual editors support apparently trivial operations such asinserting by typing and automatic line-wrap, which turn out to be not-so-trivial opera-tions for graphical editors. As most modelers may have experienced, inserting a nodeinto a crowded diagram can be very tedious.
Our objective is to combine the advantages of textual and graphical modeling no-tations. Building upon automatic layout technology we want to abandon the manualcreation of graphical model representations. Instead we follow the concept of ModelDriven Visualization (MDV) introduced by Bull et al. [5] by generating representationsin a lightweight and transient fashion, which means that graphical views are generatedso seamlessly that there is no need to manually edit or to persist them. This approachfacilitates the creation of multiple views and the dynamic adaption of the level of detail,which are important concepts for the visualization of complex information [18, 19].
Our main contribution is a meta model for graphs, their layout, and their graphi-cal representation. We employ this meta model both for the view model of generatedgraphical views and for the interface to layout algorithms. Furthermore, we present aninfrastructure for automatic layout that is statically or dynamically configurable andprovides the foundation for transient view synthesis. Both contributions are realizedwithin the KIELER project2 and are available via an Eclipse update site.3
This report is organized as follows. We discuss previous work on view synthesis andlayout integration in Chapter 2. The meta models and basic approaches for transientviews are presented in Chapter 3. The integration of layout algorithms and graph viewersin Eclipse is described in Chapter 4, after which we conclude.
1Examples are mentioned on http://www.eclipse.org/Xtext/community/2http://www.informatik.uni-kiel.de/rtsys/kieler/3http://rtsys.informatik.uni-kiel.de/~kieler/updatesite/
2

2 Related Work
The work presented here builds on Model Driven Visualization as proposed by Bull etal. [5, 3], which is an extension of the Model Driven Engineering (MDE) approach to thecreation of views. This helps to lift the development of graphical tools to a more abstractlevel. However, Bull et al. focus on view models for different kinds of data visualization,which does not only include graphs, but also tables and charts. The Zest toolkit1 [4]employed in their contribution mainly addresses the SWT integration of graph viewersand offers only few graph layout algorithms. In our approach we go one step furtherand add rendering specification as well as layout directives to the graph view model andhence allow to express all details of the generated view using MDE methods.
A very simple tool for visualizing EMF models is offered by the EMF To Graphvizproject.2 Being restricted to drawing boxes with lists of attributes and using Graphvizas layout engine [10], this tool it is very limited in terms of rendering and layout, whichmakes it useful for debugging and rapid prototyping, but insufficient for more complexvisualizations.
The established graphical modeling frameworks GMF and Graphiti are not well suitedfor transient model visualization in the sense of this paper. Both are designed for com-posing models by dragging and dropping figures onto a diagram canvas. They require afully-fledged editor setup in order to simply show diagrams, which is a waste of resourcesthat is felt bitterly for large diagrams. Although Graphiti maintains the description offigures in a view model (the Pictogram model), some characteristics, such as the bendpoint rendering of edges (angular or rounded), are configured in the editor code. GMF’sNotation model has no means for specifying rendering primitives at all, but points topredefined edit part classes using integer identifiers. The arrangement of figures (microlayout) must be realized in Java code in both frameworks. While GMF relies on the lay-out manager concept of Draw2D, Graphiti requires to implement layout features. Thisinconsistent use of view models for the specification of graphics impedes the applica-tion of model transformations and other model-based techniques for full-automatic viewgeneration.
Although editor code generation front-ends such as GMF Tooling3 and Spray4 offermeans for model-based view specification, the generated code suffers from the sameproblems as described above. The additional level of abstraction makes it even harder tocustomize and fine-tune the views. Furthermore, GMF Tooling requires a tight couplingof model and view. This imposes strong requirements on the structure of the meta
1http://www.eclipse.org/gef/zest/2http://sourceforge.net/projects/emf2gv/3http://www.eclipse.org/modeling/gmp/?project=gmf-tooling4http://code.google.com/a/eclipselabs.org/p/spray/
3

model, i. e. the abstract syntax of the language, which is not acceptable, since we donot want to impose restrictions on the abstract syntax and aim for miscellaneous viewson the same model.
Modeling tools such as GME [14] and VMTS [16], which are built on Windows insteadof Eclipse, allow the creation of graphical editors with custom graphics, but the graphicsmust be created by either using a specific API or editing a visualization model in theUI. The focus of these projects is on meta-modeling and model transformations, andthey do not cover automatic view generation and layout. Although mapping betweenEMF and GME models is possible [2], this does not cover the mapping of graphical viewsbetween the frameworks.
4

3 Towards Lightweight GraphicalModeling
The common graphical modeling approaches require the modeler to manually put eachsingle element on the canvas. If an element shall be characterized with respect to differentfacets, e. g. a class as part of a software system, multiple diagrams must be drawn,each representing that element from different points of view. Those diagrams are oftenpersisted in separate files, which may lead to consistency issues if elements are reorderedor deleted. Regarding this dissatisfying situation we believe that there is significantadvantage by exploiting the ability to automatically arrange diagram elements.
3.1 Transient Graphical Views
We propose to employ the transient views approach, which consists of the direct synthesisof graphical views out of existing models. This inverts the traditional graphical editingapproach, in which a model is constructed using a graphical view. In our vision a modelerworks with an arbitrary editor, e. g. based on a textual DSL, and requests and dismissesgraphical views like Java programmers hit ctrl+T to see the inheritance hierarchy ofa class, see Fig. 3.1. This way the benefits of graphical modeling are preserved, whiledisadvantages such as time consuming composition are avoided.
The transient graphical view synthesis process comprises the following steps.
1. Select models to be represented, possibly with manual or automatic filtering.
2. Construct a view model according to mapping rules from the domain model.
a. Identify the essential graph elements (nodes, edges, labels, ports).
b. Create each element’s graphics by composing rendering primitives.
c. Arrange the rendering primitives (micro layout).
3. Arrange the graph structure of the view model (macro layout).
a. Analyze the view model and derive a layout graph.
b. Configure the layout by choosing layout algorithms and setting options.
c. Execute the layout algorithms.
d. Transfer the computed layout back to the view model.
4. Render the view model by means of a 2D graphics framework.
5

(a) Inheritance hierarchy of a class. (b) Proposal: transient Statechart diagram.
Figure 3.1: Examples of transient views
In our approach we aim to optimize the synthesis process in terms of performance andsimplicity in order to justify the predicate “lightweight”. This would enable truly tran-sient views, eliminating the necessity of persisting the view models. We achieve this byemploying the same meta model for layout algorithms and for the view model, and ex-tending it with annotations for expression of rendering primitives and their arrangement.This yields the following benefits:
• The view model is based on EMF and thus allows to use model transformationas well as other model-based techniques, which is the basic idea of MDV [5]. Forinstance, this enables the employment of interpreted transformations that couldbe formulated by the tool user. This advantage applies to all three parts of Step2 in the view synthesis process.
• In common graphical editors the micro layout (Step 2.c) is implemented in Java(see Sect. 2). By including the micro layout specification in the rendering modelwe are able to express it on an abstract level. While this may seem like a trivialmatter, it turns out to be crucial for the consistent use of automatic layout: asillustrated in Fig. 3.2, changes of the macro layout may require recomputation ofthe micro layout. Therefore a close coupling of both levels of layout is beneficial.
• Step 3.a is often an intricate task, which concerns the extraction of the graphstructure as well as the initial macro layout. We obtain the simplest possiblesolution by using the same graph structure for the view model and the layoutprocess, hence no transformation or adaption is needed. This also applies to Step3.d, since the concrete layout attached to the graph instance during execution oflayout algorithms directly affects the view model.
6

On
OpenTray
ClosedTray
PAUSE
Playing
PLAY
PLAY PLAY
PLAY
PLAY PLAY
PLAY PLAY
OpenTray
ClosedTray
PAUSE
Playing
PLAY
EJECTPLAY PLAY
PLAY
EJECT
EJECT
EJECT
PLAY PLAY
PLAY PLAY
On
Figure 3.2: Broken figure rendering after an update of the Statechart diagram: insert-ing labels on the transitions between the OpenTray and ClosedTray statescauses the On state to be enlarged; afterwards the state label is not centeredanymore and the line below is too short.
Figure 3.3: Component architectural outline on a specification excerpt of a complex rail-way signaling system. It has been composed of multiple description parts.
3.2 Use Cases
Applications of transient views are manifold. As motivated in Sect. 3.1, modelers maywant to get certain information on their system under development. Similarly, modelerscontinuously want to check the correctness of their work, e. g. the reachability of statesin Statecharts, by reviewing it in an alternative notation. In case of an error a fix shallbe performable directly in the view.
In practice, specifications of large systems are usually created in a component-basedway. This often occurs in form of declaring and referencing elements separately. Anexample, found in the railway signaling domain, looks as follows (simplified). There arethree types of components, each of them specified in a separate document: a MainCon-troller, SwitchControllers, and SwitchDrivers. The components communicate via dedicatedinterfaces described in further specification parts. Finally, instances of the componentsare introduced and connected in an additional statement. Although those particular de-scriptions may be simple, the resulting networks can become quite complex and difficultto browse, understand, and maintain. By means of transient views the tool can offer spe-cific compound representations, which are built upon multiple parts of the specification,and provide a component architectural outline as shown in Fig. 3.3.
The third use case of transient graphical views addresses the simulation of DSLs-basedspecifications. It is evident that highlighting elements in diagrams, e. g. active states,improves humans’ ability to perceive the simulated system’s progress and to identifymistakes in the execution and, hence, mistakes in the specification. This principle is
7

Figure 3.4: Simulation of a Statechart in KIELER (from Motika et al. [17]).
outlined by means of Fig. 3.4, showing a Statechart being simulated on the right, andtables with input and output data as well as the simulation steering on the left. Besidesmarking active states, assignments of variables or metrics of statements can also bevisualized in diagrams. This enables the feedback of results of complex analyses, e. g.performance estimations discovering shortest and longest execution paths.
3.3 The KGraph and KRendering Meta Models
The KGraph meta model describes the graph as used in steps 2.a and 3.a of the viewsynthesis process. Its class diagram, derived from an EMF Ecore model, is shown inFig. 3.5. The graph structure is represented by the classes KNode, KEdge, KPort, andKLabel. Each instance of these graph elements contains an attached KEdgeLayout (foredges) or KShapeLayout (for other elements), which are both able to hold concrete layoutdata as well as abstract layout data represented by layout options (see Sect. 4). A graphis represented by a KNode instance with its content stored in the children reference.
Fig. 3.6 depicts an excerpt of the KRendering notation meta model, which is anextension of KGraph. Basic figure shapes are instances of KRendering, which inheritsfrom KGraphData and thus can be attached to KGraphElements. KRenderings can beconfigured in terms of KStyles and KPlacementData for specification of properties suchas line width or foreground and background color and the micro layout (see Fig. 3.7).Given KRenderings can be reused by means of KRenderingRefs, which refer to otherrendering definitions, templates of KRenderings may be stored in a KRenderingLibrary.
As indicated by Fig. 3.8 properties of KRendering figures are not determined by meansof attributes of the KRendering class, but by attaching KStyles on them. This allows usto define the propagateToChildren flag meaning the style with the flag set to true will
8
KLabeledGraphElement
KGraphData
KNode KPort
KLabel
text : EString
EMapPropertyHolder
makePersistent()
KShapeLayout(from klayoutdata)
xpos : EFloatypos : EFloatwidth : EFloatheight : EFloat
setPos(EFloat,EFloat)applyVector(KVector)createVector() : KVectorsetSize(EFloat,EFloat)
KEdgeLayout(from klayoutdata)
applyVectorChain(KVectorChain)createVectorChain() : KVectorChain
KPoint(from klayoutdata)
x : EFloaty : EFloat
setPos(EFloat,EFloat)applyVector(KVector)createVector() : KVector
KInsets(from klayoutdata)
top : EFloatbottom : EFloatleft : EFloatright : EFloat
IPropertyHolder
setProperty(IProperty,EJavaObject)getProperty(IProperty) : EJavaObjectcopyProperties(IPropertyHolder)getAllProperties() : EMap
KEdge
KGraphElement
getData(EClass) : KGraphDatagetData(EJavaClass) : KGraphData
labels0..*
children0..*
parent0..1 ports
0..*node1
parent1
bendPoints0..*
sourcePoint1
targetPoint1
insets
0..1
source1
target1 0..1
targetPort0..1
outgoingEdges0..*
incomingEdges0..*
sourcePort
edges0..*
data
0..*
Figure 3.5: KGraph meta model with basic graph structures and layout data.
KRendering
KRectangle KRoundedRectangle
cornerWidth : EFloat
cornerHeight : EFloat
KPolyline
KPolygon
KImage
bundleName : EString
imagePath : EString
KContainerRendering
KArc
startAngle : EFloat
arcAngle : EFloat
KText
text : EString
clip : EBoolean
KSpline KEllipse KCustomRendering
className : EString
bundleName : EString
KGraphData(from kgraph)
parent
0..1
children
0..*
Figure 3.6: KRendering primitives to be composed to diagram figures.
be applied deeply to all children of the current figure. This, in turn, is beneficial forhighlighting purposes, e.g. during simulations as motivated in Sec. 3.2, and other viewmanagement effects [9].
The placement of KRenderings can be defined by means of KDirectPlacementData orKPolylinePlacementData (see Fig. 3.9), or by attaching them to grid- or stack-based microlayouts, which are omitted here. The direct placement definitions consist of two points,given by KX-/KYPositions, that are related to the borders of the parent KRendering.Polyline placements consist of a number of bend positions, respectively. These implicitcoordinates are resolved in Step 4 of the view synthesis process.
The composition of diagram figures by means of the KRendering primitives is exem-
9

KRendering
KContainerRendering
KStyle
propagateToChildren : EBoolean
KRenderingLibrary
KRenderingRef KChildArea KPlacement
KPlacementDataKGraphData(from kgraph)
parent0..1references0..*
placementData0..1 styles0..*
children0..*
childPlacement
0..1
rendering0..1renderings
0..*
rendering1
Figure 3.7: KRendering core elements.
KRendering KStyle
propagateToChildren : EBoolean
KForegroundColor KColor
red : EInt
green : EInt
blue : EIntKBackgroundColor
KLineWidth
lineWidth : EInt
KLineStyle
lineStyle : LineStyle
KVerticalAlignment
verticalAlignment : VerticalAlignment
KHorizontalAlignment
horizontalAlignment : HorizontalAlignment
KForegroundVisibility
KVisibility
visible : EBoolean
KBackgroundVisibilityKFontBold
bold : EBoolean
KFontItalic
italic : EBoolean
KFontSize
size : EInt
KFontName
name : EString
styles
0..*rendering
0..1
Figure 3.8: KRendering styles for configuring diagram figures.
plified in Fig. 3.10, showing a description of the SwitchController diagram node fromFig. 3.3. The figure consists of a KNode comprising a KShapeLayout defining its size anda layouter hint, a KRectangle, and a bunch of KPorts. The rectangle covers the wholefigure, since no placement data are given, and contains two horizontally centered textfields showing the type and instance name of the depicted element. They are modifiedin terms of the text’s vertical alignment and the transparency of the their bounding
KPosition
KRendering KPlacementData
KDirectPlacementData
KXPosition
absolute : EFloat
relative : EFloat
KYPosition
absolute : EFloat
relative : EFloat
KTopPosition
KBottomPosition
KRightPosition
KLeftPosition KPolylinePlacementData
x
1
y
1
placementData
0..1
topLeft1
bottomRight1
points1..*
detailPlacementData
0..1
Figure 3.9: KRendering placement elements for specifying micro layout directives.
10

KNode {
KShapeLayout { /∗ size constraint, layout data ∗/width 200 height 100
"de.cau.cs.kieler.portConstraints"
= "FIXED_POS"
}
KRectangle { /∗ box figure ∗/KBackgroundColor 255 250 205
KText "SwitchController" { /∗ label 1 ∗/KVerticalAlignment TOP
KBackgroundVisibility false
KDirectPlacementData {
topLeft KLeftPosition abs 0.0 rel 0.0
/ KTopPosition abs 0.0 rel 0.0
bottomRight KRightPosition abs 0.0 rel 0.0
/ KTopPosition abs 12.0 rel 0.0
}
}
KText "SC01" { /∗ label 2 ∗/KFontBold true
KVerticalAlignment TOP
KBackgroundVisibility false
KDirectPlacementData {
topLeft KLeftPosition abs 0.0 rel 0.0
/ KTopPosition abs 12.0 rel 0.0
bottomRight KRightPosition abs 0.0 rel 0.0
/ KTopPosition abs 24.0 rel 0.0
}
}
}
KPort {
KShapeLayout { /∗ size constraint, layout data ∗/xpos -8 ypos 31 width 9 height 9
}
KRectangle { /∗ port figure (black) ∗/KBackgroundColor 0 0 0
KText "turn" { /∗ port label ∗/KFontSize 9,
KHorizontalAlignment LEFT
KBackgroundVisibility false
KDirectPlacementData {
topLeft KLeftPosition abs 12.0 rel 0.0
/ KTopPosition abs 0.0 rel 0.0
bottomRight KLeftPosition abs 0.0 rel 0.0
/ KBottomPosition abs 0.0 rel 0.0
}
}
}
}
KPort {
KShapeLayout { /∗ size constraint, layout data ∗/xpos 200 ypos 31 width 9 height 9
}
KRectangle { /∗ port figure (black) ∗/KBackgroundColor 0 0 0
KText "result" { /∗ port label ∗/KFontSize 9,
KHorizontalAlignment RIGHT
KBackgroundVisibility false
KDirectPlacementData {
topLeft KLeftPosition abs 0.0 rel 0.0
/ KTopPosition abs 0.0 rel 0.0,
bottomRight KLeftPosition abs -3.0 rel 0.0
/ KBottomPosition abs 0.0 rel 0.0
}
}
}
}
...
} --> "<<the master node>>" { /∗ 1st edge ∗/sourcePort "<<SC01::result>>"
targetPort "<<master::switchControl[0]_result>>"
KEdgeLayout {} /∗ layout data place holder ∗/KPolyline {
KLineWidth 2
KForegroundColor 0 0 255! /∗ propagated to children ∗/KPolygon { /∗ arrow decorator ∗/KBackgroundColor 0 0 255
KPolylinePlacementData {
pointsKLeftPosition abs 0.0 rel 0.0
/ KTopPosition abs 0.0 rel 0.0,
KRightPosition abs 0.0 rel 0.0
/ KTopPosition abs 0.0 rel 0.5,
KLeftPosition abs 0.0 rel 0.0
/ KBottomPosition abs 0.0 rel 0.0,
KLeftPosition abs 0.0 rel 0.3
/ KTopPosition abs 0.0 rel 0.0
KDecoratorPlacementData {
relativelocation 1.0
xOffset -9 yOffset -4 width 8 height 7
}
}
}
}
} --> "<<the SD01 node>>" { /∗ 2nd edge ∗/...
}
Figure 3.10: Shortened KRendering-based specification of the SwitchController diagramelement depicted in Fig. 3.3.
boxes’ backgrounds. Their size and position in the figure is characterized by the KDi-rectPlacementData entry. Thus, the first text field spans a rectangle ranging from theleft to the right and from the top to 12pt below the top border of the diagram figure,the second one is placed below in the same way. The horizontally centered alignment isset by default.
The ports and their figures are basically constructed in the same way, apart from the
11

horizontal alignment of the port label text field. Due to their similarity the definitionsof the second highest ones et seq. are omitted on both sides. One observes that KTextelements determine their minimal size by their font size and text length. Hence, thehorizontal part of the bottomRight position does not matter for the left aligned label”turn” of first-mentioned port. The same holds for the topLeft position of the secondport’s right aligned ”result” label, respectively. Observe furthermore that child KRen-derings need not to be placed within the bounds of its parent, which is the case for theport labels.
Connections are related to the KNodes they are leaving. They are declared by KEdgestatements, in Fig. 3.10 abbreviated with -->. Such KEdges have to be equipped withKEdgeLayouts and a rendering, e. g., KPolyline. Decorators, such as arrow heads, areadded as usual child renderings. In the current example the decorator is formed by aKPolygon, a specialization of KPolyline whose only difference is the consideration of thepath given by a list of KPositions as a circuit. Since KEdges are not characterized by anycovered area, the KPolylinePlacementData statement defining the path of our arrow hasto be augmented with special a KDecoratorPlacementData element that defines the sizeof the decorator’s bounding box, its location on the edge in terms of a value of [0.0, 1.0],and the flag relative indicating whether the decorator shall be rotated according to thelayout of the edge.
3.4 KIELER Lightweight Diagrams (KLighD)
The view synthesis process is realized in the KLighD project, our test bed for investigatingthe topic of transient graphical representations. It provides infrastructure to managethe mapping rules needed in Step 2, which currently have to be provided by the tooldeveloper. Step 3, the macro layout, is delegated to the KIELER Infrastructure for MetaLayout (KIML), see Sec. 4, and Step 4, the rendering of the representation, is performedby the graphics framework Piccolo2D [1], which is based on the Java2D API but alsooffers an SWT wrapper. The resulting diagrams can be displayed in Eclipse views orother UI elements. Since the view model (KGraph + KRendering) does not rely on anyspecific graphics framework, we will add support for other frameworks such as Draw2Din the future.
The prototype is employed in MENGES1 [11], a conjoint research project of industryand academia that aims at improving the software development process for safety-criticalrailway signaling systems.
Besides being able to draw view models, KLighD provides infrastructure to registerimplementations of mapping that synthesize view descriptions based on arbitrary input.
KLighD integrates with the KIELER Infrastructure for View Management (KIVi) [9],which triggers the view synthesis either full-automatically or on the modelers’ demand.In addition to the pure extraction of certain model content, views obtained this waymaintain links between model elements and their figures and form a navigation meansfor exploring models.
1http://menges.informatik.uni-kiel.de/
12

4 Configurable Automatic Layout
Research on graph drawing algorithms has led to a rich variety of methods over thepast 30 years [7, 12]. In theory, these layout methods should equip users of graphicalmodeling tools adequately to satisfy their need for automatic diagram layout. However,today’s modeling tools are still quite far from the point where diagram layout would beavailable with the same flexibility as textual formatting such as the Java code formatterof Eclipse JDT. The problem is not the lack of appropriate algorithms or libraries forgraph layout, but rather their integration.
Two examples of excellent libraries are OGDF [6] and Graphviz [10], both of whichoffer several layout methods with plenty of options for customization. The former offersa C++ API and support for GML and OGML graph formats, while the latter offers a CAPI and support for the DOT graph format. Connecting one of these tools to a Javaapplication is a costly task, since it consists either in the intricacy of directly executingnative code or in the communication with a separate process using one of the supportedgraph formats. Even if both libraries are connected to a modeling environment, furtherquestions arise on the details of their integration. How could a suitable layout algorithmbe selected and configured? How could such a configuration be linked to a specificdiagram or application, either statically or dynamically? What if users would like to geta good layout for their specific diagram without the need to understand the concepts ofthe available algorithms? The KIELER Infrastructure for Meta Layout (KIML) addressesthese questions by providing a bridge between diagram viewers and layout algorithms andby offering interfaces for layout configuration. The concepts behind this infrastructureare described in the following.
4.1 The Diagram Layout Process
We consider two levels of automatic layout: concrete layout and abstract layout. A con-crete layout determines the exact position and size of all elements of a graph, includingnodes, labels, and edge bend points, whereas an abstract layout consists of hints for theselection and configuration of layout algorithms. When an algorithm is executed on aninput graph, it reads these hints and considers them in the calculation of graph elementpositions, therefore layout algorithms convert abstract layouts into concrete layouts.
The main class for coordination of the layout process in KIML is DiagramLayoutEngine.This process involves the following steps, as illustrated in Fig. 4.1.
1. The selected diagram is analyzed by a specialized DiagramLayoutManager. De-pending on the type of diagram viewer, the required information is drawn from
13

S0
S1
S2
S3
Direction:RIGHT Layout Data
width: 25height: 20xpos: 345ypos: 117
Spacing:16.0Routing:SPLINES
Edit Parts (Control)
Notation Model
Domain ModelKGraph
File System
LayoutAlgorithms
DiagramLayoutEngine
Diagram Editor (View)
1. analyzediagram
2. creategraph
4. execute
6. transfer concretelayout
3. set abstractlayout
5. set concretelayout
LayoutOption
Manager
DiagramLayout
Manager
Recursive GraphLayout Engine
Figure 4.1: Overview of the layout process for typical diagram editors.
the viewer’s model, control, or view component. Each of these components typi-cally represents the structure of the diagram by a specialized data structure. Forinstance, the GMF uses Draw2D figures as views, edit parts as controllers, a nota-tional model for storing the concrete layout and customized styles, and a domainmodel defined by the DSL.
2. The DiagramLayoutManager creates an instance of the KGraph data structure (seeFig. 3.5 on p. 9 and step 3.a on p. 5) based on the analysis of Step 1.
3. The class LayoutOptionManager configures an abstract layout and attaches thisinformation to the elements of the graph in form of a mapping of layout optionsto specific values (see step 3.b on p. 5). There is a special layout option used toselect the layout algorithm that shall be executed.
4. The selected algorithm is executed on the input graph (see step 3.c on p. 5). Thegraph is represented by a KNode instance with its content stored in the childrenreference. Each child node may itself contain a nested subgraph, thus allowinghierarchically structured graphs, which are also called compound graphs. The Re-cursiveGraphLayoutEngine, which is responsible for executing layout algorithms,processes each hierarchy level of a compound graph separately, starting with theinnermost nodes.
5. The executed algorithms set concrete layout information on the input graph.
14

6. The computed layout information is transferred back to the diagram by the Dia-gramLayoutManager (see step 3.d on p. 5). Usually this information is written tothe notational model, so it is stored persistently with the diagram.
The KIELER project provides integrations of the OGDF and Graphviz layout algorithmlibraries. Their configuration options are made available in KIML such that both librariescan be configured using the same interface. Furthermore, KIELER contains new layoutalgorithms written in Java, which makes their integration more efficient compared to Cor C++ libraries. The most important of these Java algorithms is KLay Layered [13],which is able to process normal graphs as well as port based graphs such as data flowdiagrams and has a special mode for compound graphs.
Connecting the KIML layout process to Eclipse based diagram editors or viewers re-quires the implementation of specialized DiagramLayoutManagers. This has already beendone generically for GMF and Graphiti such that layout can be done in most editors thatare based on these frameworks without the need of adding or changing any code.
4.2 Layout Configuration
Layout options, which are used to control how layouts are computed, can be set for eachgraph element independently. This allows to modify general settings of an algorithm, toset constraints for specific graph elements, or even to apply different layout algorithms fordifferent hierarchy levels of a compound graph. These layout options are set in Step 3 ofFig. 4.1 by iterating over all graph elements and executing a set of layout configuratorson each element. Such configurators analyze the context in which a graph elementwas created and derive specific layout option values from that context. If multipleconfigurators affect the same layout option, the one of highest priority is taken. The mostimportant layout configurators are described in the following, with ascending priority.
• The Default configurator has the lowest priority and returns default layout set-tings that are acceptable for most graphs.
• The Eclipse configurator manages an extension point and a preference page, whichcan both be used to override default values for specific element types. The editpart class or the domain model class can be used to specify the type of a graphelement.
• The Semantic configurator is an extensible mechanism for deriving layout settingsfrom the domain model. This is used when different layout option values are chosendepending on properties of the domain model instance.
• The GMF / Graphiti configurators allow to customize the layout for a singlediagram, which can be done through an Eclipse view named Layout. For GMF
diagrams the options are stored as Style annotations in the Notation model, whilefor Graphiti the options are stored as Property annotations in the Pictogram model.
15

• The Volatile configurator applies a key-value mapping for one single layout com-putation. This is very useful when the layout process is triggered from someapplication specific control logic and needs to be adapted to the current state ofthe application, e. g. by using a view management system [9].
The KIML allows to plug in other layout configurators, which may employ more com-plex methods for finding an appropriate abstract layout. There are two approaches inthe focus of current research which are both based on analysis of the input graph. Thefirst approach uses graph structure analysis to determine which type of layout algorithmis most suitable for a graph. This decision depends on structural properties such asplanarity, connectivity, or number of cycles. The second approach uses graph drawinganalysis to assess the layout produced by the previous configuration and derive a newconfiguration with the aim of improving measurable criteria such as the number of edgecrossings and bends or the total area and aspect ratio. Deriving new configurations fromexisting ones may involve evolutionary methods [8], which may be driven by automaticanalysis, user feedback, or a mixture of both.
16

5 Conclusion and Future Work
We presented a continuation of the MDV approach by allowing the view model to ex-press graph structure as well as rendering and layout directives. The KGraph metamodel includes structural information that is relevant for layout algorithms, propertiesfor abstract layout specification, and concrete layout data calculated by algorithms.The KRendering meta model adds rendering primitives with style and micro layoutannotations. The system is backed by a flexible and configurable automatic layout in-frastructure. Putting these building blocks together yields a tool that is well suited forthe visualization of complex models.
Our future work will target various aspects. Diagram specifications shall be expressedin a textual language, similarly to Kohnlein’s Generic Graph View.1 This involvesdescribing the rendering of elements, as well as composing diagrams, which may beunderstood as queries on a model base. The synthesized diagrams shall be equippedwith semantic zoom, i. e. the ability to change their amount of detail according to theuser’s focus. Finally, intuitive means for modifying the abstract layout, e. g. in form ofsliders or gestures, shall be investigated.
1http://koehnlein.blogspot.de/2012/01/discovery-diagrams-for-generic.html
17

Bibliography
[1] Benjamin B. Bederson, Jesse Grosjean, and Jon Meyer. Toolkit design for interac-tive structured graphics. IEEE Transactions on Software Engineering, 30(8):535–546, August 2004.
[2] Jean Bezivin, Christian Brunette, Regis Chevrel, Frederic Jouault, and Ivan Kurtev.Bridging the Generic Modeling Environment (GME) and the Eclipse ModelingFramework. In Proceedings of the OOPSLA Workshop on Best Practices for ModelDriven Software Development, 2005.
[3] Robert Ian Bull. Model Driven Visualization: Towards A Model Driven EngineeringApproach For Information Visualization. PhD thesis, University of Victoria, BC,Canada, 2008.
[4] Robert Ian Bull, Casey Best, and Margaret-Anne Storey. Advanced widgets forEclipse. In Proceedings of the 2004 OOPSLA Workshop on Eclipse TechnologyExchange, pages 6–11, New York, NY, USA, 2004. ACM.
[5] Robert Ian Bull, Margaret-Anne Storey, Marin Litoiu, and Jean-Marie Favre. Anarchitecture to support model driven software visualization. In Proceedings of the14th IEEE International Conference on Program Comprehension (ICPC’06), pages100–106. IEEE, 2006.
[6] Markus Chimani, Carsten Gutwenger, Michael Junger, Karsten Klein, PetraMutzel, and Michael Schulz. The Open Graph Drawing Framework. Poster atthe 15th International Symposium on Graph Drawing (GD07), 2007.
[7] Giuseppe Di Battista, Peter Eades, Roberto Tamassia, and Ioannis G. Tollis. GraphDrawing: Algorithms for the Visualization of Graphs. Prentice Hall, 1998.
[8] Bjorn Duderstadt. Evolutionary meta layout for KIELER. Student research project,Christian-Albrechts-Universitat zu Kiel, Department of Computer Science, May2011.
[9] Hauke Fuhrmann and Reinhard von Hanxleden. Taming graphical modeling. InProceedings of the ACM/IEEE 13th International Conference on Model Driven En-gineering Languages and Systems (MoDELS’10), volume 6394 of LNCS, pages 196–210. Springer, October 2010.
18

[10] Emden R. Gansner and Stephen C. North. An open graph visualization systemand its applications to software engineering. Software—Practice and Experience,30(11):1203–1234, 2000.
[11] Wolfgang Goerigk, Reinhard von Hanxleden, Wilhelm Hasselbring, Gregor Hen-nings, Reiner Jung, Holger Neustock, Heiko Schaefer, Christian Schneider,Elferik Schultz, Thomas Stahl, Steffen Weik, and Stefan Zeug. Entwurf einerdomanenspezifischen Sprache fur elektronische Stellwerke. In Software Engineer-ing 2012 – Lecture Notes in Informatics. Gesellschaft fur Informatik, 2012.
[12] Michael Kaufmann and Dorothea Wagner, editors. Drawing Graphs: Methods andModels. Number 2025 in LNCS. Springer-Verlag, Berlin, Germany, 2001.
[13] Lars Kristian Klauske, Christoph Daniel Schulze, Miro Sponemann, and Reinhardvon Hanxleden. Improved layout for data flow diagrams with port constraints. InProceedings of the 7th International Conference on Diagrammatic Representationand Inference (DIAGRAMS’12), volume 7352 of LNAI, pages 65–79. Springer, 2012.
[14] Akos Ledeczi, Miklos Maroti, Arpad Bakay, Gabor Karsai, Jason Garrett, CharlesThomason, Greg Nordstrom, Jonathan Sprinkle, and Peter Volgyesi. The genericmodeling environment. In Workshop on Intelligent Signal Processing, 2001.
[15] Marjan Mernik, Jan Heering, and Anthony M. Sloane. When and how to developdomain-specific languages. ACM Computing Surveys, 37(4):316–344, December2005.
[16] Gergely Mezei, Tihamer Levendovszky, and Hassan Charaf. Visual presentationsolutions for domain specific languages. In Proceedings of the IASTED InternationalConference on Software Engineering, Innsbruck, Austria, 2006.
[17] Christian Motika, Hauke Fuhrmann, and Reinhard von Hanxleden. Semantics andexecution of domain specific models. In 2nd Workshop Methodische Entwicklungvon Modellierungswerkzeugen (MEMWe 2010) INFORMATIK 2010, GI-Edition –Lecture Notes in Informatics (LNI), pages 891–896, Leipzig, Germany, September2010. Bonner Kollen Verlag.
[18] Manojit Sarkar and Marc H. Brown. Graphical fisheye views of graphs. In Proceed-ings of the SIGCHI Conference on Human Factors in Computing Systems, pages83–91. ACM, 1992.
[19] Doug Schaffer, Zhengping Zuo, Saul Greenberg, Lyn Bartram, John Dill, ShelliDubs, and Mark Roseman. Navigating hierarchically clustered networks throughfisheye and full-zoom methods. ACM Transactions on Computer-Human Interac-tion, 3:162–188, 1996.
19