INSTITUT FœR Universit¤t Stuttgart UND RECHNERSYSTEME Prof
13
Universität Stuttgart INSTITUT FÜR KOMMUNIKATIONSNETZE UND RECHNERSYSTEME Prof. Dr.-Ing. Dr. h. c. mult. P. J. Kühn Copyright Notice c Springer-Verlag Berlin Heidelberg 2008. This is the author’s version of the work. It is posted here for your personal use, not for redistribution. The definitive version was published in: Proceedings of the 3rd International Workshop on Self-Organizing Systems (IWSOS), Lecture Notes in Computer Science (LNCS) 5348/2008, Vienna, Austria (December 2008), DOI 10.1007/978-3-540-92157-8 Institute of Communication Networks and Computer Engineering University of Stuttgart Pfaffenwaldring 47, D-70569 Stuttgart, Germany Phone: ++49-711-685-68026, Fax: ++49-711-685-67983 email: [email protected], http://www.ikr.uni-stuttgart.de
Transcript of INSTITUT FœR Universit¤t Stuttgart UND RECHNERSYSTEME Prof

Universität StuttgartINSTITUT FÜR
KOMMUNIKATIONSNETZEUND RECHNERSYSTEME
Prof. Dr.-Ing. Dr. h. c. mult. P. J. Kühn
Copyright Noticec©Springer-Verlag Berlin Heidelberg 2008. This is the author’s version of the
work. It is posted here for your personal use, not for redistribution. Thedefinitive version was published in: Proceedings of the 3rd International
Workshop on Self-Organizing Systems (IWSOS), Lecture Notes in ComputerScience (LNCS) 5348/2008, Vienna, Austria (December 2008), DOI
10.1007/978-3-540-92157-8
Institute of Communication Networks and Computer EngineeringUniversity of Stuttgart
Pfaffenwaldring 47, D-70569 Stuttgart, GermanyPhone: ++49-711-685-68026, Fax: ++49-711-685-67983
email: [email protected], http://www.ikr.uni-stuttgart.de

A Cell Outage Detection Algorithm usingNeighbor Cell List Reports
Christian M. Mueller, Matthias Kaschub, Christian Blankenhorn, and StephanWanke
Universitat StuttgartInstitute of Communication Networks and Computer Engineering
Pfaffenwaldring 47, 70569 Stuttgart, Germany[firstname.lastname]@ikr.uni-stuttgart.de, [email protected]
Abstract. Base stations experiencing hardware or software failures havenegative impact on network performance and customer satisfaction. Thetimely detection of such so-called outage or sleeping cells can be a dif-ficult and costly task, depending on the type of the error. As a firststep towards self-healing capabilities of mobile communication networks,operators have formulated a need for an automated cell outage detec-tion. This paper presents and evaluates a novel cell outage detectionalgorithm, which is based on the neighbor cell list reporting of mobileterminals. Using statistical classification techniques as well as a manu-ally designed heuristic, the algorithm is able to detect most of the outagesituations in our simulations.
1 Introduction
1.1 Self-Organizing Networks
The configuration, operation and maintenance of mobile communication net-works becomes increasingly complex, due to a number of different reasons. First,the continuous demand for bandwidth and coverage, driven by more and morewidespread mobile Internet usage and new applications, urges operators to up-grade their backhaul networks and invest in new backhaul and air interfacetechnologies. These need to be integrated into an existing infrastructure, whichincreases heterogeneity and in-turn complicates the management of these net-works. Second, more sophisticated algorithms are implemented at the radio layersto exploit various physical effects of a wireless communications channel in orderto increase system capacity. Third, more and more optimizations are conductedat cell-individual level to better exploit the particularities of a site. Given thatnowadays, UMTS networks provide around 105 operator-configurable parame-ters [1], manual optimization already is a tedious and costly task.
Facing the challenge of increasingly complex network management, operatorsare at the same time under a tremendous cost pressure, driven by a strong com-petition among existing players and new entrants to the mobile communicationssector. In this situation, the ability to efficiently manage their internal resources
and the ability to cut down capital and operational expenditure becomes a com-petitive edge.
These constraints currently foster a trend towards a higher degree of automa-tion in mobile communication networks. Under the term Self-Organizing Net-works (SON), the Next Generation Mobile Networks (NGMN) alliance has pub-lished a set of use cases for the application of self-configuration, self-optimizationand self-healing concepts in deployment, planning and maintenance of mobilecommunication networks [2, 3]. The 3GPP has also recognized the need for moreautomation and cognitive functions in future wireless networks and has there-fore started to work on concepts, requirements and solutions [4, 5] In addition,research projects are underway to develop solutions to these requirements [6, 7].
1.2 SON Use Case: Cell Outage Detection
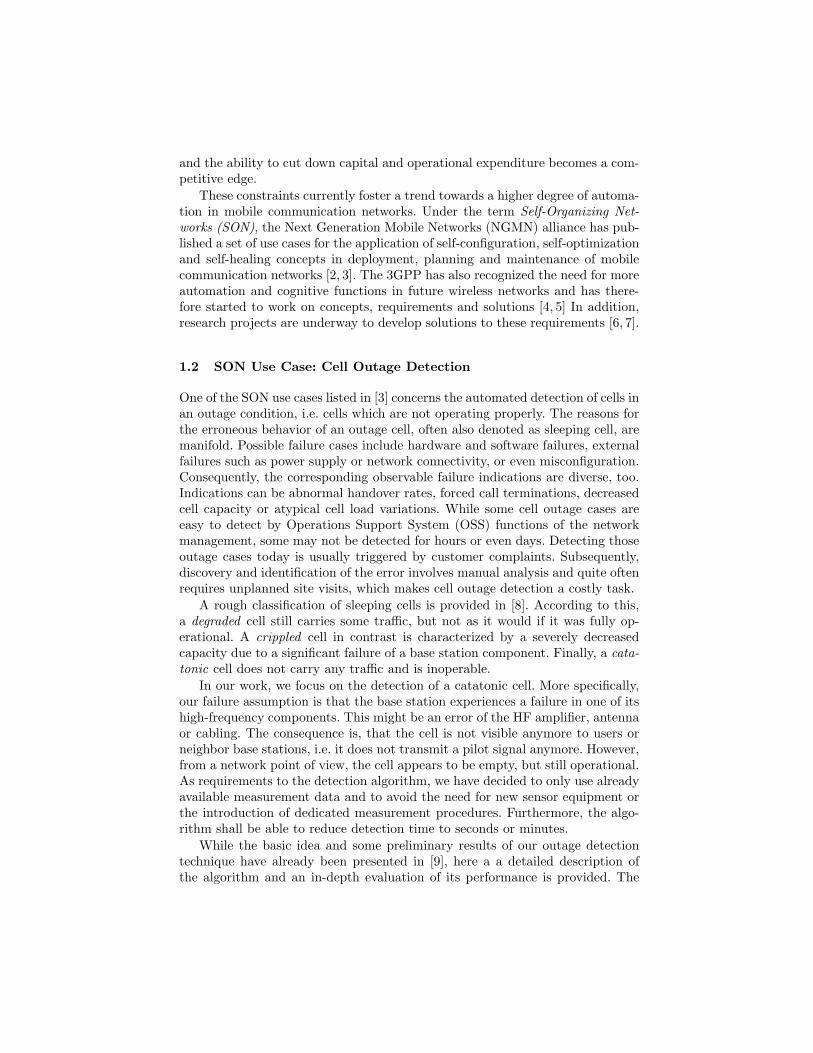
One of the SON use cases listed in [3] concerns the automated detection of cells inan outage condition, i.e. cells which are not operating properly. The reasons forthe erroneous behavior of an outage cell, often also denoted as sleeping cell, aremanifold. Possible failure cases include hardware and software failures, externalfailures such as power supply or network connectivity, or even misconfiguration.Consequently, the corresponding observable failure indications are diverse, too.Indications can be abnormal handover rates, forced call terminations, decreasedcell capacity or atypical cell load variations. While some cell outage cases areeasy to detect by Operations Support System (OSS) functions of the networkmanagement, some may not be detected for hours or even days. Detecting thoseoutage cases today is usually triggered by customer complaints. Subsequently,discovery and identification of the error involves manual analysis and quite oftenrequires unplanned site visits, which makes cell outage detection a costly task.
A rough classification of sleeping cells is provided in [8]. According to this,a degraded cell still carries some traffic, but not as it would if it was fully op-erational. A crippled cell in contrast is characterized by a severely decreasedcapacity due to a significant failure of a base station component. Finally, a cata-tonic cell does not carry any traffic and is inoperable.
In our work, we focus on the detection of a catatonic cell. More specifically,our failure assumption is that the base station experiences a failure in one of itshigh-frequency components. This might be an error of the HF amplifier, antennaor cabling. The consequence is, that the cell is not visible anymore to users orneighbor base stations, i.e. it does not transmit a pilot signal anymore. However,from a network point of view, the cell appears to be empty, but still operational.As requirements to the detection algorithm, we have decided to only use alreadyavailable measurement data and to avoid the need for new sensor equipment orthe introduction of dedicated measurement procedures. Furthermore, the algo-rithm shall be able to reduce detection time to seconds or minutes.
While the basic idea and some preliminary results of our outage detectiontechnique have already been presented in [9], here a a detailed description ofthe algorithm and an in-depth evaluation of its performance is provided. The
remainder of this paper is structured as follows: Section 2 presents the outage de-tection algorithm. The evaluation methodology and system model are describedin section 3. Section 4 examines the performance of the detection algorithm andpresents simulation results. Section 5 finally summarizes and draws conclusions.
2 Cell Outage Detection Algorithm
The idea behind our outage detection algorithm is to use Neighbor Cell List(NCL) reports to create a graph of visibility relations, where vertices of thegraph represent cells or sectors. Edges of the graph are generated according tothe received NCL reports, where an edge weight determines the number of mobileterminals that have reported a certain neighbor relation. More details on howthe graph is constructed will be given in section 2.1.
Neighbor Cell List reports are always generated during active connections,when mobile terminals continuously measure the signal strength and quality ofthe radio channel of the cell it is currently connected to. They also measure thesignals of several neighbor cells, which constitute candidate cells for potentialhandovers. These measurements are transmitted to the current cell to decidewhether a handover might have to be performed. In GSM, for example, a termi-nal in an ongoing connection measures up to 16 base stations within its visibilityrange and sends NCL reports at 480 ms intervals, containing the best 6 mea-surement results [10]. The NCL reports of different terminals are retrieved by asubordinated network entity, e.g. a radio network controller in UMTS, respec-tively a base station controller in GSM. While measurement reporting detailsdiffer from GSM to UMTS or LTE, we only assume that lists of neighbor cellsare reported at regular intervals, which can be realized in all the different radioaccess technologies.
2.1 Monitoring the Visibility Graph
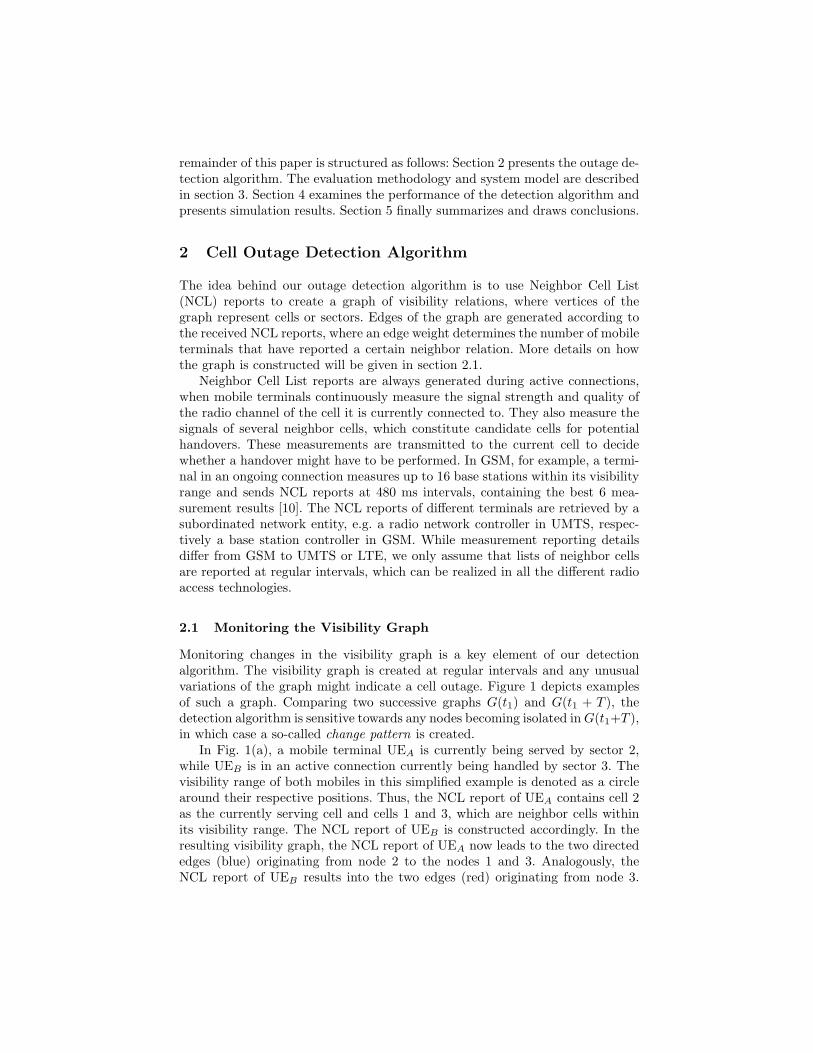
Monitoring changes in the visibility graph is a key element of our detectionalgorithm. The visibility graph is created at regular intervals and any unusualvariations of the graph might indicate a cell outage. Figure 1 depicts examplesof such a graph. Comparing two successive graphs G(t1) and G(t1 + T ), thedetection algorithm is sensitive towards any nodes becoming isolated in G(t1+T ),in which case a so-called change pattern is created.
In Fig. 1(a), a mobile terminal UEA is currently being served by sector 2,while UEB is in an active connection currently being handled by sector 3. Thevisibility range of both mobiles in this simplified example is denoted as a circlearound their respective positions. Thus, the NCL report of UEA contains cell 2as the currently serving cell and cells 1 and 3, which are neighbor cells withinits visibility range. The NCL report of UEB is constructed accordingly. In theresulting visibility graph, the NCL report of UEA now leads to the two directededges (blue) originating from node 2 to the nodes 1 and 3. Analogously, theNCL report of UEB results into the two edges (red) originating from node 3.

(a) G(t1): Initial state (b) G(t1 + T ): NCL change
(c) G(t1 + T ): Call end (d) G(t1 + T ): Outage case
Fig. 1. Visibility Graph examples with two terminals being served by cells 2, respec-tively 3
Every edge in the graph has a certain weight, representing the number of UEswhich have reported a neighbor relation between a pair of cells. In the examplein Fig. 1, all edge weights equal one and are therefore not shown.
During normal operation of the network, the visibility graph is subject tofrequent changes, caused by starting and ending calls, user mobility, changes inradio propagation and changes in the NCL reporting itself. Figures 1(b) and 1(c)show typical examples of graph variations. In Fig. 1(b), UEB has changed itsposition such that cell 2 is no longer in its visibility range. The correspondingNCL reports are depicted on the right hand side of Fig. 1(b), together withthe resulting topology of the visibility graph. Another variation of the graph isdepicted in Fig. 1(c), where UEB has terminated its connection and does notsend NCL reports anymore. Consequently, the visibility graph now only containsthe neighbor relations reported by UEA.
Figure 1(d) finally depicts the resulting visibility graph if cell 3 experiencesa failure and becomes catatonic. The NCL reports of UEB are not receivedanymore. At the same time, cell 3 disappears from the candidate set of UEA.The resulting graph now only contains a single edge from node 2 to node 1. Notethat every outage situation results into an isolated node in the visibility graph.
Figure 1(d) shows the change pattern of the graph variation compared to theinitial state of the graph in Fig. 1(a). A change pattern is a 7-tuple with thefollowing attributes, that is created for every isolated node:
– number of disappeared edges to the isolated node– number of disappeared edges from the isolated node

– sum of the edge weights to the isolated node– sum of the edge weights from the isolated node– number of UEs of which no reports are received anymore– number of UEs with changed neighbor cell list reports– load as sum of the number of active calls of the direct neighbor cells
The respective elements of the 7-tuple are the features or input parameters ofthe classification step described in the following section 2.2.
The change patterns that are created when nodes become isolated are notnecessarily unique. In the sample scenario in Fig. 1, the same pattern wouldhave been created if a movement of UEA and the end of a connection of UEB
occurred within a single monitoring interval. Thus, an isolated node pattern inthe visibility graph is a necessary condition for an outage situation, but not asufficient one. However, our assumption is that cell outages create characteristicchange patterns which, in many cases, can be distinguished from normal fluctu-ations of the visibility graph. The outage detection problem thus translates intoa classification problem on change patterns of the visibility graph.
2.2 Outage Detection as a Binary Classification Problem
The classification of a set of items is the assignment of similar items to one outof several distinct categories. The task of separating change patterns into outageand non-outage situations can be regarded as a binary classification problemwith a set of predefined classes.
Classification algorithms are widely used in the field of automatic patternrecognition [11]. A classifier can either be knowledge-based (e.g., expert systems,neural networks, genetic algorithms) or make use of mathematical techniquesfrom multivariate statistics (e.g. cluster analysis, classification and regressiontrees). We applied three different classification techniques, a manually designedexpert system and two others using statistical classification techniques. In sta-tistical classification, the n-dimensional tuple space is separated according tostatistical measures, which allows to automatically construct a classifier from agiven training set of patterns. A large number of statistical methods exist toinfer the classification rules, of which an iterative decision-tree algorithm and alinear discriminant analysis have been applied here and will be further detailedin the following:
Expert System. From the class of knowledge-based classifiers, an expert sys-tem has been applied to the outage detection problem. A set of rules has beenmanually constructed, based on the observation of the change patterns of thevisibility graph. The rules are expressed as a sequence of if . . . then statements,with threshold values tailored to our evaluation scenario. The expert system hasbeen designed such that it performs a conservative classification, i.e., the numberof false alarms shall be minimized.
Decision-Tree (DT). A tree of binary decisions on the attributes of the re-spective patterns is automatically created from a training set. The decision aboutwhen to split into separate branches is thereby determined by the Gini impurity
function, which is used by the classification and regression tree (CART) algo-rithm [12]. Similar to the expert system, the outcome of the DT algorithm canbe regarded as a sequence of if . . . then statements, with the difference that nowthese rules are being determined automatically.
Linear-Discriminant Function (LDF). The LDF classifier belongs to the classof linear classification algorithms. The discriminant function is a linear combi-nation of the pattern’s attributes, whose coefficients are determined from thetraining set using a least square estimation [13].
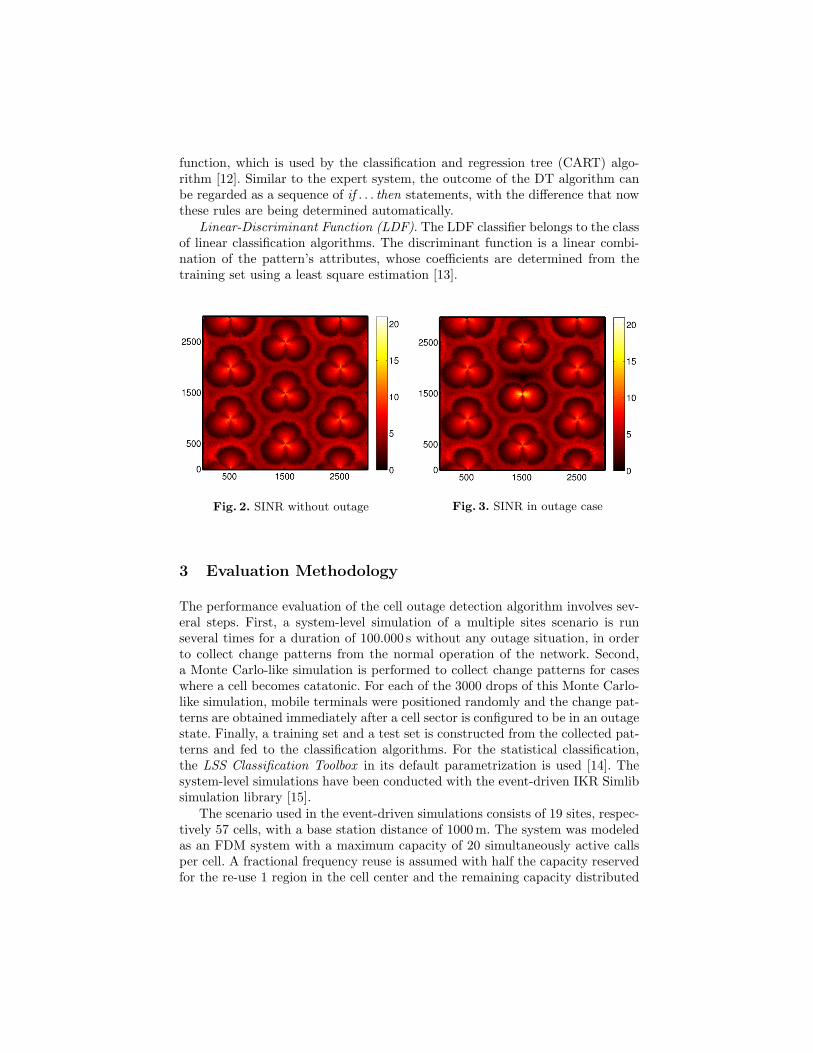
Fig. 2. SINR without outage Fig. 3. SINR in outage case
3 Evaluation Methodology
The performance evaluation of the cell outage detection algorithm involves sev-eral steps. First, a system-level simulation of a multiple sites scenario is runseveral times for a duration of 100.000 s without any outage situation, in orderto collect change patterns from the normal operation of the network. Second,a Monte Carlo-like simulation is performed to collect change patterns for caseswhere a cell becomes catatonic. For each of the 3000 drops of this Monte Carlo-like simulation, mobile terminals were positioned randomly and the change pat-terns are obtained immediately after a cell sector is configured to be in an outagestate. Finally, a training set and a test set is constructed from the collected pat-terns and fed to the classification algorithms. For the statistical classification,the LSS Classification Toolbox in its default parametrization is used [14]. Thesystem-level simulations have been conducted with the event-driven IKR Simlibsimulation library [15].
The scenario used in the event-driven simulations consists of 19 sites, respec-tively 57 cells, with a base station distance of 1000m. The system was modeledas an FDM system with a maximum capacity of 20 simultaneously active callsper cell. A fractional frequency reuse is assumed with half the capacity reservedfor the re-use 1 region in the cell center and the remaining capacity distributed

over the re-use 3 regions at the cell border. Inter-cell interference is consideredas proportional to the actual load in the corresponding re-use areas of neigh-bor cells. The Walfish-Ikegami model (non-LOS) determines the path loss andspatially correlated shadowing planes similar to [16] are used. A global shadow-ing plane models the influence of buildings and other common obstructions toradio propagation, while local shadowing planes for each base station accountfor the different antenna locations. The 3-sector antenna pattern correspondsto [17]. A handover algorithm is implemented which is sensitive towards SINRand RSSI (Received Signal Strength Indicator) values. The measurement report-ing of neighbor cell lists is assumed to be GSM-like with a reporting period of480 ms, which in our setting corresponds to the graph update period. Furtherparameters are given in Table 1. SINR plots extracted from the simulation foran outage and a non-outage case for an average cell load of 25% are given inFigures 2 and 3, respectively.
Table 1. Scenario and simulation parameters
Parameter Value
Base station distance 1000mShadowing std. dev. (global) 7.0 dBShadowing std. dev. (local) 1.0 dBShadowing correlation length 50mBS power to individual UE 35 dBmSignal detection threshold at UE -96 dBmTraffic model (Poisson arrivals) λ = 1
100 s
Call holding time (neg.-exp.) h = 35 sUser movement Random DirectionUser speed v = 1− 5m
s
Segment length (uniform) l = 20− 800mDirection angle (uniform) 0− 360
4 Analysis and Results
4.1 Outage Observability
The quality of the outage detection is largely determined by the performanceof the classification algorithm. However, even with perfect classification, someoutage cases might still not be detected. In particular in low load situationswhen user density is scarce, a cell might not serve any users and might not bemeasured by any of the UEs of the surrounding cells. A cell outages thus doesnot result into changes of the visibility graph. In this case, the outage would notbe detectable at all.
0 1 2 3 4average number of active users per sector
0%
20%
40%
60%
80%
100%
Detection limitUnique patterns
Fig. 4. Upper bound of cell outage observ-ability and ratio of unique patterns
Actual class
Cla
ss
ifie
r o
utc
om
e
1 0
1False
Positive(FP)
True Negative
(TN)
True Positive
(TP)
False Negative
(FN)0
Fig. 5. Confusion Matrix
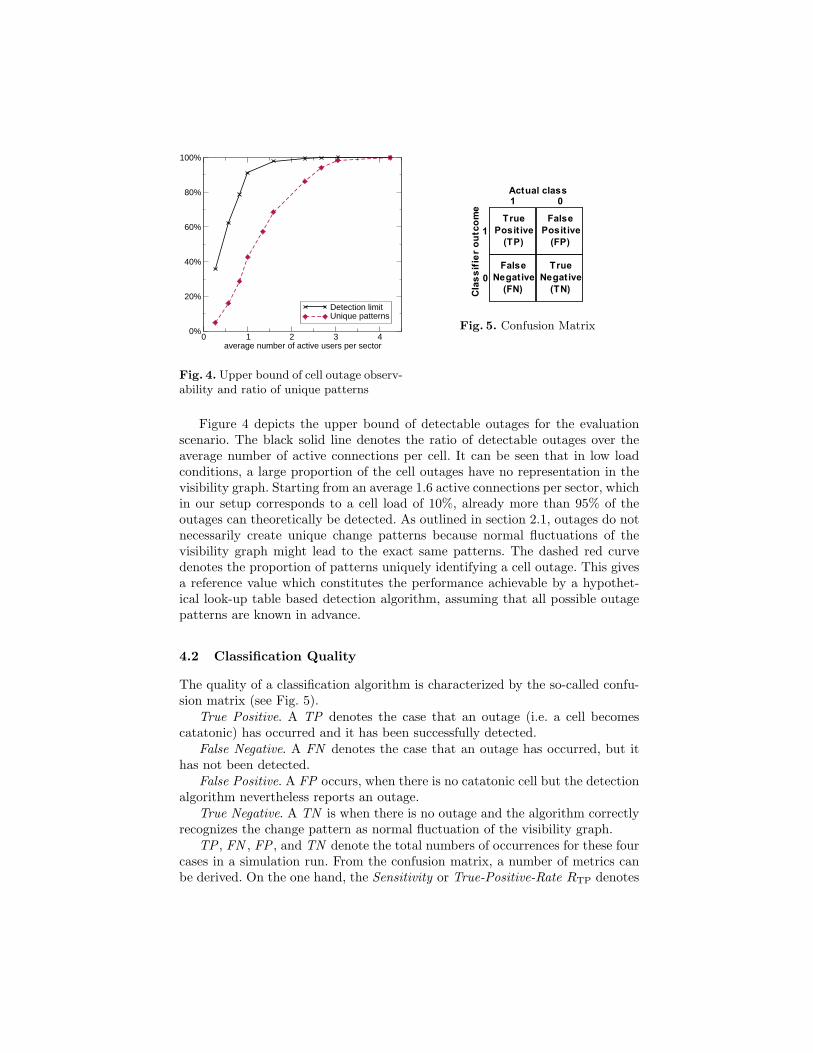
Figure 4 depicts the upper bound of detectable outages for the evaluationscenario. The black solid line denotes the ratio of detectable outages over theaverage number of active connections per cell. It can be seen that in low loadconditions, a large proportion of the cell outages have no representation in thevisibility graph. Starting from an average 1.6 active connections per sector, whichin our setup corresponds to a cell load of 10%, already more than 95% of theoutages can theoretically be detected. As outlined in section 2.1, outages do notnecessarily create unique change patterns because normal fluctuations of thevisibility graph might lead to the exact same patterns. The dashed red curvedenotes the proportion of patterns uniquely identifying a cell outage. This givesa reference value which constitutes the performance achievable by a hypothet-ical look-up table based detection algorithm, assuming that all possible outagepatterns are known in advance.
4.2 Classification Quality
The quality of a classification algorithm is characterized by the so-called confu-sion matrix (see Fig. 5).
True Positive. A TP denotes the case that an outage (i.e. a cell becomescatatonic) has occurred and it has been successfully detected.
False Negative. A FN denotes the case that an outage has occurred, but ithas not been detected.
False Positive. A FP occurs, when there is no catatonic cell but the detectionalgorithm nevertheless reports an outage.
True Negative. A TN is when there is no outage and the algorithm correctlyrecognizes the change pattern as normal fluctuation of the visibility graph.
TP , FN , FP , and TN denote the total numbers of occurrences for these fourcases in a simulation run. From the confusion matrix, a number of metrics canbe derived. On the one hand, the Sensitivity or True-Positive-Rate RTP denotes

whether a classifier is able to correctly detect the outage patterns from the setof all patterns:
RTP =TP
TP + FN(1)
On the other hand, the Fall-out or False-Positive-Rate RFP gives the ten-dency of a classification algorithm to create false alarms:
RFP =FP
FP + TN(2)
Achieving a high sensitivity generally comes with an increase in the rate offalse alarms. The two metrics can therefore be regarded as complementary. Aso-called Receiver-Operating-Characteristics (ROC) plot is a way to visualize theperformance of binary classification algorithms regarding these two metrics andis primarily used in signal detection theory [18]. In a ROC plot, the sensitivityis drawn over the false-positive-rate. A perfect classification would thus result ina mark in the upper left corner of the plot. The line through the origin gives thereference values for a random decision, where each of the classes is chosen withprobability one half.
0 0.2 0.4 0.6 0.8 1False-Positive Rate FP/(FP+TN)
0
0.2
0.4
0.6
0.8
1
Tru
e-P
ositi
ve R
ate
TP
/(T
P+
FN
)
Expert SystemLDF classifierDT classifier
better than
worse than
higher load
random
random
Fig. 6. ROC plot of the classification algorithms
Figure 6 shows a ROC plot of the classification algorithms applied here,for the range of cell load values also used in the other figures. After havingbeen trained with a training set, the classifiers had to determine the correctmapping for test sets, where each of the patterns is tested only once. In doingso, Fig. 6 is independent of the frequency of occurrence of the different patternsin the outage detection scenario. It thus solely gives the performance of theclassification algorithms, which is not identical to the resulting performance ofthe outage detection algorithm. It can be observed that the Expert System andthe Decision Tree classifiers are able to achieve a high sensitivity, especially forhigher load scenarios, which is consistent with the results from Fig. 4. The Expert
System has been designed to perform a conservative detection. In other words,the Expert System is more likely to indicate False Negatives than False Positives.Compared to this, the DT classifier is characterized by a much higher risk tocreate false alarms. Finally, the LDF classifier has high false alarm probabilityand, in contrast to the other algorithms, does not show any improvement withincreasing system load.
0 1 2 3 4average number of active users per sector
0%
20%
40%
60%
80%
100%
Detection limitExpert SystemLDF classifierDT classifierDT* classifier
Fig. 7. Sensitivity of the classification al-gorithms
0 1 2 3 4average number of active users per sector
10 h
100 h
1000 h
LDF classifierDT classifierDT* classifier
Fig. 8. Mean time between false alarmsper cell sector
4.3 Outage Detection Performance
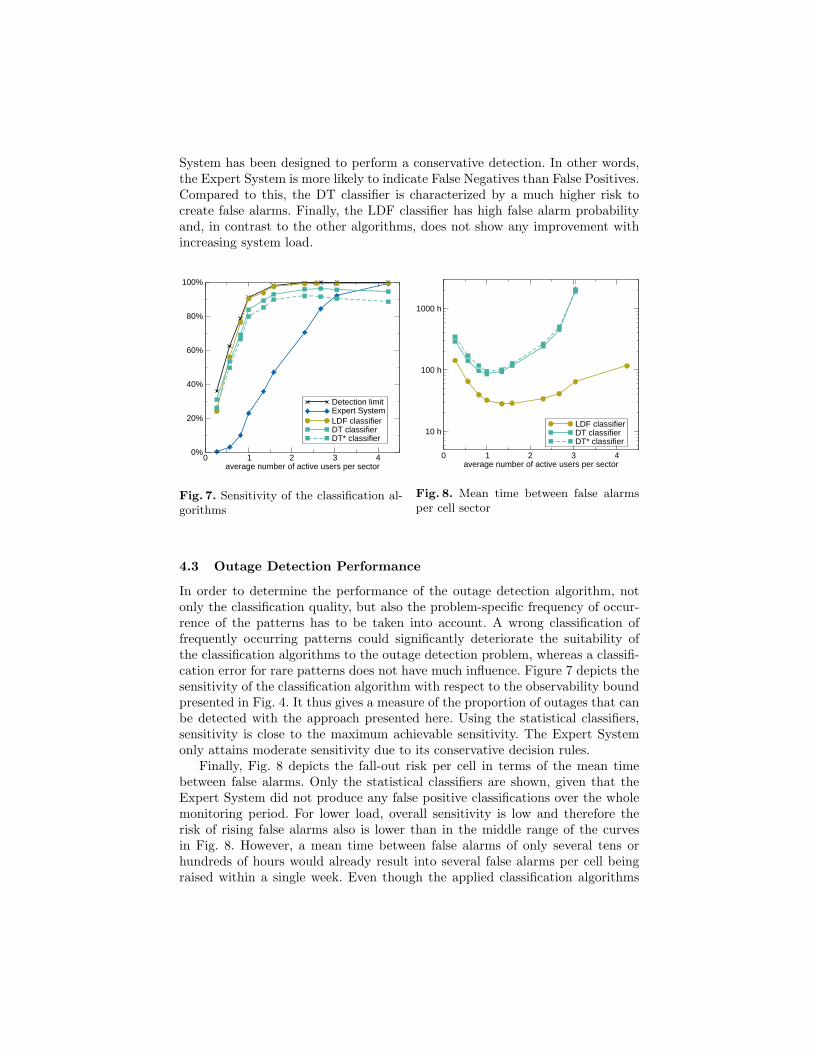
In order to determine the performance of the outage detection algorithm, notonly the classification quality, but also the problem-specific frequency of occur-rence of the patterns has to be taken into account. A wrong classification offrequently occurring patterns could significantly deteriorate the suitability ofthe classification algorithms to the outage detection problem, whereas a classifi-cation error for rare patterns does not have much influence. Figure 7 depicts thesensitivity of the classification algorithm with respect to the observability boundpresented in Fig. 4. It thus gives a measure of the proportion of outages that canbe detected with the approach presented here. Using the statistical classifiers,sensitivity is close to the maximum achievable sensitivity. The Expert Systemonly attains moderate sensitivity due to its conservative decision rules.
Finally, Fig. 8 depicts the fall-out risk per cell in terms of the mean timebetween false alarms. Only the statistical classifiers are shown, given that theExpert System did not produce any false positive classifications over the wholemonitoring period. For lower load, overall sensitivity is low and therefore therisk of rising false alarms also is lower than in the middle range of the curvesin Fig. 8. However, a mean time between false alarms of only several tens orhundreds of hours would already result into several false alarms per cell beingraised within a single week. Even though the applied classification algorithms

here provide means to mitigate this problem by giving higher penalty to falsepositive classification, the results do not differ significantly. An example is shownin Figures 7 and 8 for a modified decision tree classifier (denoted as DT∗), whichhas given a ten times higher penalty for false positive classifications.
4.4 Discussion
From the previous subsections, it can be summarized that although the sta-tistical classifiers show an overall good detection sensitivity, tendency towardsgeneration of false alarms is still far too high for practical applications. Thisis mainly due to the partly ambiguous change patterns and the non-linearityof the problem. The expert system achieves much better performance here, butgenerally suffers from the need to manually tune its threshold parameters to thescenario under investigation. These observations motivate further work, employ-ing more flexible classification algorithms such as fuzzy classifiers or SupportVector Machines [19].
From a network operation point of view, a detection algorithm as describedhere can be applied to whole or parts of a network. That is, collection of NCLreports and its interpretation can be done in an RNC or BSC, without the needfor additional signaling. For LTE, the scope of a single eNodeB is too small anda master eNodeB or another management device would have to monitor thevisibility graph. Although this results in additional signaling, the NCL reportsof each terminal in a cell can be aggregated by the eNodeB over one monitoringperiod, which results in one signaling message per monitoring interval being sentto the respective management device.
5 Conclusion
Automated detection of base station failures or sleeping cells is a prerequisitefor future self-healing capabilities in mobile communication networks. The de-tection of some failure conditions still imposes a challenge to network operatorsand demands for additional means to observe base station behavior from the out-side. An algorithmic detection without the need for additional sensor equipmentthereby represents the most cost effective way of improving outage detectioncapabilities in existing networks.
The presented approach of using neighbor cell measurement reports of mobileterminals to determine outage situation showed good performance, even in mod-erate cell load conditions. However, the relatively high risk of false alarms stillprevents from practical application. Although the algorithm is able to quicklydetect a large proportion of the outages in a certain cell load range, it has beenshown that there is no possibility to detect outages when no active users are closeto the respective cell. In this case, the presented algorithm may be combined withother detection mechanisms operating on a longer time scale.
References
1. Lehser, F.: Self Organising LTE/SAE Network: Operator Requirements and Ex-amples. 20th workshop of the ITG group 5.2.4, Ulm, Germany, available online athttp://www.ikr.uni-stuttgart.de/Content/itg/fg524/ (September 2006)
2. NGMN Alliance: Use cases related to self organising network: Overall description.www.ngmn.org (April 2007)
3. NGMN Alliance: Annex A (informative) of use cases related to self organisingnetwork: Overall description. www.ngmn.org (April 2007)
4. 3GPP: Telecommunication management; Self-Organizing Networks (SON); Con-cepts and requirements. TS 32.500 (2008)
5. 3GPP: Evolved Universal Terrestrial Radio Access Network (E-UTRAN); Self-configuring and self-optimizing network (SON) use cases and solutions. TR 36.902(2008)
6. FP7 Socrates: Self-optimisation & self-configuration in wireless networks.http://www.fp7-socrates.org/
7. FP7 E3: End-to-end efficiency (e3). http://ict-e3.eu8. Cheung, B., Fishkin, S.G., Kumar, G.N., Rao, S.: Method of monitoring wireless
network performance. USPTO Patent Application 20060063521 (March 2006)9. Mueller, C.M., Kaschub, M., Blankenhorn, C., Wanke, S.: Design and evalua-
tion of detection algorithms for base stations outages. In: 11th COST 290 MCM,TD(08)003, Tampere, Finland (2008)
10. Eberspacher, J., Vogel, H.J., Bettstetter, C.: GSM Global System for MobileCommunication. B.G. Teubner Stuttgart, Leipzig, Wiesbaden (2001)
11. Jain, A., Duin, R., Mao, J.: Statistical pattern recognition: a review. IEEE Trans-actions on Pattern Analysis and Machine Intelligence 22(1) (2000) 4–37
12. Breiman, L., Friedman, J., Stone, C.J., Olshen, R.: Classification and RegressionTrees. Chapman & Hall/CRC; 1 edition (1984)
13. Duda, R.O., Hartr, P.E.: Pattern Classification and Scene Analysis. John Wileyand Sons Ltd. (1973)
14. Uhlich, S.: Classification Toolbox V1.2. available online at http://www.lss.uni-stuttgart.de (March 2008)
15. IKR: Simulation library v2.6. available online at: http://www.ikr.uni-stuttgart.de16. Forkel, I., Schinnenburg, M., Ang, M.: Generation of two-dimensional correlated
shadowing for mobile radio network simulation. In: Proceedings of the WirelessPersonal Multimedia Communications (WPMC). (2004)
17. NGMN Alliance: Radio access performance evaluation methodology.www.ngmn.org (June 2007)
18. Fawcett, T.: ROC Graphs: Notes and Practical Considerations for Researchers.Technical report, Palo Alto, USA: HP Laboratories (2004)
19. Wang, L., ed.: Support Vector Machines: Theory and Applications. Studies inFuzziness and Soft Computing. Springer Berlin (2005)