
Investigation of Novel Process Analytical Technology (PAT ...€¦ · Investigation of Novel...
208
Investigation of Novel Process Analytical Technology (PAT) Tools for Use in Freeze-Drying Processes Der Naturwissenschaftlichen Fakultät der Friedrich-Alexander-Universität Erlangen-Nürnberg zur Erlangung des Doktorgrades vorgelegt von Stefan Christian Schneid aus München
Transcript of Investigation of Novel Process Analytical Technology (PAT ...€¦ · Investigation of Novel...
Investigation of Novel Process Analytical Technology (PAT) Tools for Use in Freeze-Drying Processes
Der Naturwissenschaftlichen Fakultät
der Friedrich-Alexander-Universität Erlangen-Nürnberg
zur
Erlangung des Doktorgrades
vorgelegt von
Stefan Christian Schneid
aus München
Als Dissertation genehmigt von der Naturwissen-
schaftlichen Fakultät der Universität Erlangen-Nürnberg
Tag der mündlichen Prüfung: 8. 12. 2009
Vorsitzender der
Promotionskomission: Prof. Dr. Eberhard Bänsch
Erstberichterstatter: Prof. Dr. Geoffrey Lee
Zweitberichterstatter: Prof. Dr. Gerhard Winter

Dedicated to my parents
The important thing in science is not so much to obtain new facts as to discover new ways of thinking about them. Sir William Bragg (1862 - 1942)
Science is facts; just as houses are made of stones, so is science made of facts; but a pile of stones is not a house and a collection of facts is not necessarily science. Henri Poincare (1854 - 1912)
Acknowledgements The research work presented in this thesis has been performed between April 2006 and April
2007 at the Department of Pharmaceutical Sciences, University of Connecticut, Storrs, USA,
and between April 2007 and July 2009 at the Division of Pharmaceutics, University of
Erlangen-Nuremberg, Erlangen, Germany.
Prof. Dr. Geoffrey Lee is gratefully acknowledged for offering me the opportunity to work in
the Division of Pharmaceutics, for serving as my doctoral advisor, and for refereeing this
thesis.
Many thanks go to Dr. Henning Gieseler for choosing the fascinating topic of this research,
for many fruitful and interesting discussions and for his continuous support throughout my
work. It was really inspiring to work with you, and I am positive that that we will maintain our
creative, productive and constructive relationship in future cooperations.
Prof. Dr. Michael Pikal is greatly acknowledged for letting me work in his lab for the first year
of my thesis work. My stay at UConn was valuable to me both professionally and personally,
I feel that I gained a lot of knowledge and experience from the discussions with Dr. Pikal and
my lab-mates, and will always treasure the time I spent at UConn.
Prof. Dr. Gerhard Winter, chair at the Department of Pharmaceutical Sciences at the Ludwig-
Maximilians-University, Munich, is gratefully acknowledged for co-refereeing this thesis.
Sebastian „Simeon“ Vonhoff is kindly acknowledged for thoroughly proof-reading this work,
for the welcoming and friendly atmosphere in our lab and for many scientific and personal
discussions. It was great having you as a labmate.
Many thanks to my present and former colleagues in the Freeze Drying Focus Group,
particularly Eva Meister, Silja von Graberg, Jakob Beirowski, Susanne Rutzinger and Anas al
Hussein. I gained a lot of additional insights from your presentations and comments, and
always enjoyed the working atmosphere.
Simone Reismann, Georg Straller, Elke Lorenzen, Anne Mundstock, Harald Pudritz, Anke
Sass, Eva Wulsten and all former colleagues at the University of Erlangen, Division of
Pharmaceutics, are kindly acknowledged for creating a friendly and productive environment
and for the good company during the student lab courses and the daily lunch.

I would like to thank Petra Neubarth for taking care of administrative issues and some nice
chats and Josef Hubert for his efforts in fixing all the equipment and machines and for
helping in installing new items. Luise Schedl is gratefully acknowledged for taking excellent
SEM pictures of various lyophiles. Thanks to Stefan Seyferth for his assistance in IT issues
and his input on freeze dryer performance and potential improvements. I thank Christiane
Blaha for the fast and reliable ordering of supplies and support of new equipment.
During my time at the University of Connecticut, I had the pleasure of working with a lot of
knowledgeable and supportive advisors and colleagues. I would especially like to
acknowledge Prof. Dr. Robin Bogner, Prof. Dr. Diane Burgess, Prof. Dr. Devandra Kalonia
and Leslie LeBel of the UConn faculty and staff, and Sajal Patel, Chandan Bhugra, Adora
Padilla, Stuart Wang, Ahmed Abdul-Fattah, Takayuki Doen, Suman and Sumit Luthra from
Dr. Pikal’s lab. I thank Shumet Hailu, Deepak Bahl, Archana Rawat, Atul Saluja, Upkar
Bhardwaj, Bakul Bhatnagar, Kristyn Greco, Piyush Gupta, Vineet Kumar, Ken Qian,
Jacqueline Moreira de Morais and Georgina Pujals for their friendly and welcoming way and
their support during my time in Storrs.
Leslie Mather, Cindy Reiter, Hung Lee and Tim LaDuc of SP Industries are greatly
acknowledged for their help with our freeze drying equipment and teaching me a lot about
the technical operations in a lyophilizer. I thank Paul Coiteux and Ian Whitehall for their good
company during our seminar trip through India. Bill Kessler of Physical Sciences Inc. is
gratefully acknowledged for his help with the TDLAS system and support of publications.
Anton Mangold of IQ mobil solutions is kindly acknowledged for providing us with the latest
generation of TEMPRIS sensors and the continuous improvements.
Andrea Weiland, Birgit Hettinger and Willi Hartwich are acknowledged for their passion for
research and development of new pharmaceuticals and their excellent support and
motivation during our cooperations.
Many thanks to my former and current students and co-workers, especially Peter Stärtzel,
Xenia Riegger, Manuel Bilke and Stefanie Waller. Ari Kauppinen from the University of
Kuopio is also acknowledged for his interesting research work during his stay in Erlangen.
Last but not least I want to express my gratitude to my girlfriend Tina, my sister Patrizia and
my parents Ursula and Karl for supporting and motivating me throughout this work and for
helping me to become the person I am today.
Parts of this work have been presented or published:
Journal Articles:
S. Schneid, H. Gieseler: Evaluation of a New Wireless Temperature Remote Interrogation
System (TEMPRIS) to Measure Product Temperature during Freeze Drying. AAPS
PharmSciTech, 2008
S. Schneid, H. Gieseler, W. Kessler, M. Pikal: Non-Invasive Product Temperature
Determination during Primary Drying using Tunable Diode Laser Absorption Spectroscopy.
Journal of Pharmaceutical Sciences, 2008
H. Gieseler, T. Kramer, S. Schneid: Quality by Design in Freeze-Drying: Cycle Design and
Robustness Testing in the Laboratory Using Advanced Process Analytical Technology.
Pharmaceutical Technology, 2008
S. Schneid, H. Gieseler: Process Analytical Technology (PAT) in Freeze drying: Tunable
Diode Laser Absorption Spectroscopy as an Evolving Tool for Cycle Monitoring; European
Pharmaceutical Review, Accepted for Publication
Poster Presentations:
S. Schneid, H. Gieseler, W. Kessler, M. Pikal: The Determination of Position Dependent
Vial Heat Transfer Coefficients: A Comparison of Tunable Diode Laser Absorption
Spectroscopy and Gravimetric Measurements; Freeze Drying of Pharmaceuticals and
Biologicals, Garmisch-Partenkirchen, Germany, 2006
S. Schneid, H. Gieseler, W. Kessler, M. Pikal: Process Analytical Technology in Freeze
Drying: Accuracy of Mass Balance Determination using Tunable Diode Laser Absorption
Spectroscopy (TDLAS); AAPS Annual Meeting, San Antonio, TX, 2006
S. Schneid, H. Gieseler, W. Kessler, M. Pikal: PAT in Freeze Drying: Non-Invasive Product
Temperature Determination based on Tunable Diode Laser Absorption Spectroscopy
(TDLAS); AAPS Annual Meeting, San Diego, CA, 2007
S. Schneid, H. Gieseler, W. Kessler, M. Pikal: Tunable Diode Laser Absorption
Spectroscopy (TDLAS) as a Residual Moisture Monitor for the Secondary Drying Stage of
Freeze Drying; AAPS Annual Meeting, San Diego, CA, 2007
T. Kramer, S. Luthra, S. Graunke, S. Schneid, H. Gieseler: Dry Layer Resistance of
Freeze-Dried Amorphous Formulations Determined by SMART Freeze Dryer TechnologyTM;
AAPS Annual Meeting, San Diego, CA, 2007
S. Schneid, H. Gieseler: Effect of Concentration, Vial Size and Fill Depth on Product
Resistance of Sucrose Solutions during Freeze Drying; 6th World Meeting on
Pharmaceutics, Biopharmaceutics and Pharmaceutical Technology, Barcelona, Spain, 2008
S. Schneid, E. Meister, H. Gieseler: Design Space in Freeze Drying: A Robustness Testing
Procedure in the Laboratory to Delineate the Impact of Product Temperature Variability on
Product Quality Attributes; CPPR Freeze Drying of Pharmaceuticals and Biologicals
Conference, Breckenridge, CO, 2008
S. Schneid, H. Gieseler: A New Generation of Battery-Free Wireless Temperature Probes
as an Alternative to Thermocouples for Vial Freeze Drying; CPPR Freeze Drying of
Pharmaceuticals and Biologicals Conference, Breckenridge, CO, 2008
List of Abbreviations
Ap: Product Area (calculated from inner diameter)
API: Active Pharmaceutical Ingredient
Av: Vial Area (calculated from outer diameter)
BSA: Bovine Serum Albumin
BTM: Barometric Temperature Measurements
CM: Capacitance Manometer
dm/dt: Mass Flow Rate
DPE: Dynamic Parameters Estimation
DSC: Differential Scanning Calorimetry
EST: Entire Sublimation Time
FDA: Food and Drug Administration
FDM: Freeze Dry Microscopy
GLP: Good Laboratory Practice
GMP: Good Manufacturing Practice
ICH: International Conference on Harmonisation of Technical Requirements for Registration of Pharmaceuticals for Human Use
KF: Karl Fischer
Kv: Vial Heat Transfer Coefficient
MDSC: Modulated Differential Scanning Calorimetry
MTM: Manometric Temperature Measurements
NIR: Near Infrared
P: Chamber Pressure
PAT: Process Analytical Technology
PCA: Principal Component Analysis
Pice: Vapor Pressure of Ice at the Sublimation Interface
QbD: Quality by Design
RGA: Residual Gas Analysis
RM: Residual Moisture
Rp: Product Resistance
Rs: Stopper Resistance
RTD: Resistance Thermal Detector
SEM: Scanning Electron Microscopy
Tb: Product Temperature at the Vial Bottom
Tb-MTM: Product Temperature at the Vial Bottom measured by MTM
Tc: Collapse Temperature
TC: Thermocouple
TDLAS: Tunable Diode Laser Absorption Spectroscopy
TE: Eutectic Temperature
TEMPRIS: Temperature Remote Interrogation System
Tg: Glass Transition Temperature
Tg’: Glass Transition Temperature of the maximally freeze-concentrated solute
Tice: Ice Temperature
TLC: Thermodynamic Lyophilization Control
Tp: Product Temperature at the Sublimation Front
Tp-MTM: Product Temperature at the Sublimation Interface measured by MTM
Tp-TDLAS: TDLAS-based Product Temperature
Ts: Shelf Temperature
Throughout this work, units consistent with those used on laboratory and commercial freeze-
drying equipment in the USA are used. Thus, the pressure unit used is Torr (or mTorr), rather
than the SI unit of Pascal (Pa). The reader is reminded that 0.1 Torr is 100 mTorr and 13.3 Pa.

Table of Content I
Table of Content
1. Introduction 1
1.1. General Introduction 1
1.2. The Concept of Freeze Drying 4
1.2.1. Design of a Freeze Dryer 4
1.2.2. Process Steps 6
1.2.2.1. Freezing 6
1.2.2.2. Primary Drying 7
1.2.2.3. Secondary Drying 9
1.2.3. Heat and Mass Transfer 10
1.2.3.1. Coupling between Heat and Mass Transfer 10
1.2.3.2. Resistances to Mass Transfer 11
1.2.3.3. Product Temperature 12
1.2.3.4. Contributions to Heat Transfer 13
1.2.3.5. Heat Transfer Coefficients 14
1.3. PAT Tools: Integral Part of a Quality by Design Concept 16
1.3.1. Regulatory Perspective and Definitions 16
1.3.2. QbD, Design Space and PAT for Freeze Drying 16
1.4. Traditional Monitoring Technology used for Freeze-Drying 23
1.4.1. Single Vial Approaches 23
1.4.1.1. Thermocouples 23
1.4.1.2. Resistance Thermal Detectors 24
1.4.1.3. General Problems with Invasive Measurements 24
1.4.2. Batch Methods 25
1.4.2.1. Pirani / Capacitance Comparative Pressure Control 25
1.4.2.2. Dewpoint Sensor 27
1.4.2.3. Pressure Rise Technology – Traditional Use 28
1.4.2.4. Mass spectrometry 29
1.5. Novel PAT for Freeze-Drying 30
1.5.1. Single Vial Approaches 30
Table of Content II
1.5.1.1. TEMPRIS 30
1.5.1.2. TrackSense Pro 31
1.5.1.3. Weighing Systems 31
1.5.1.4. NIR Probes 32
1.5.1.5. Raman Probes 34
1.5.2. Batch Methods 35
1.5.2.1. Innovative Pressure Rise Concepts 35
1.5.2.1.1. Manometric Temperature Measurement and SMARTTM
Freeze Dryer
35
1.5.2.1.2. Thermodynamic Lyophilization Control (TLC) 40
1.5.2.1.3. Dynamic Parameters Estimation (DPE) Model 41
1.5.2.2. Spectroscopy-Based Methods 42
1.5.2.2.1. Tunable Diode Laser Absorption Spectroscopy (TDLAS) 42
1.5.2.2.2. Lyotrack 47
1.6. Objectives of this thesis 49
2. Materials and Methods 51
2.1. List of Materials and Equipment used in the experiments 51
2.2. PAT and Freeze Drying Equipment 53
2.2.1. Freeze Dryer 53
2.2.2. Sample Thief 53
2.2.3. MTM and SMARTTM 54
2.2.4. TDLAS 56
2.2.5. TEMPRIS 57
2.2.6. Vials 57
2.2.7. Stoppers 58
2.2.8. Thermocouples 58
2.3. Analytical 59
2.3.1. Karl Fischer Titrator 59
2.3.2. Differential Scanning Calorimetry 59
2.3.3. Freeze Dry Microscopy 59
Table of Content III
2.3.4. Scanning Electron Microscopy 60
2.4. Experimental Procedures 61
2.4.1. Measurement of Vial Heat Transfer Coefficients 61
2.4.2. TDLAS Product Temperature Calculation 62
2.4.3. TDLAS Secondary Drying Analytics 63
2.4.4. MTM Product Resistance 65
2.4.5. MTM Robustness Testing 66
2.4.6. TEMPRIS Evaluation 67
3. Results and Discussion 70
3.1. Determination of Kv values using different methodologies 70
3.1.1. Gravimetric Measurements 70
3.1.1.1. Calculation from Process Data 70
3.1.1.2. Evaluation of Individual Contributions to Kv 72
3.1.1.3. Impact of Vial Position on Kv 75
3.1.2. TDLAS Measurements 78
3.1.2.1. Method 1: Calculation over the Entire Sublimation Time 78
3.1.2.2. Method 2: Calculation during Steady State 82
3.2. TDLAS Product Temperature Calculation 86
3.2.1. Batch Temperature Calculation 86
3.2.2. Comparison to MTM Temperature Data 90
3.2.3. Effect of High Mass Flow Rates 92
3.2.4. Limitations and Future Research Needs 94
3.3. TDLAS Product Resistance Calculation 96
3.4. Secondary Drying Analytics using TDLAS 100
3.4.1. Characterization of the Formulation 100
3.4.2. Applicability of TDLAS during Secondary Drying 101
3.4.3. Equilibration Procedure 106
3.4.4. Isothermal Secondary Drying Experiments 108
3.4.5. Correlation between Residual Moisture and Mass Flow Rates 112
3.4.6. Comparison of Calculated Values with Karl Fischer Measurements 118
Table of Content IV
3.4.7. Confirmation of the Mass Flow / Moisture Correlation 120
3.5. Monitoring of the Critical Product Parameter Product Resistance using MTM
124
3.5.1. Influence of Vial Type 124
3.5.2. Influence of Solute Concentration 126
3.5.3. Impact of Annealing 128
3.5.4. Effect of Fill Depth 130
3.6. Use of MTM in QbD: Robustness Testing 136
3.6.1. Collapse Temperatures of the Model Excipients 136
3.6.2. Effect of Elevated Shelf Temperature on Tp 137
3.6.3. Consequences for Product Appearance 141
3.6.4. Consequences for Product Resistance 143
3.6.5. Differences in Cake Structure 146
3.7. Investigation of TEMPRIS as a novel PAT tool 150
3.7.1. Technical Aspects 150
3.7.2. Measurement of Product Temperature 151
3.7.3. Sensor Positioning 152
3.7.4. Evaluation of Edge Effects 155
3.7.5. Endpoint Detection: TEMPRIS vs. Other Common Technologies 158
3.7.6. Impact on Nucleation and Freezing Behavior 160
3.7.7. Comparison to MTM Measurements 162
3.7.8. Outlook: The Next Generation of TEMPRIS Sensors 164
3.8. Merits and Demerits of the Investigated PAT Tools 166
4. Conclusion 168
5. Zusammenfassung 172
6. References 179
7. Curriculum Vitae 193

Table of Content V
Introduction 1
1. Introduction 1.1. General Introduction
Freeze drying is the method of choice to stabilize labile active pharmaceutical ingredients
such as peptides, proteins and numerous small molecules that are not sufficiently stable in
solution1,2. The removal of water as a reactant for degradation reactions (such as hydrolysis
or oxidations as well as de-amidations and β-eliminations specifically for proteins3,4) in
combination with the exponential increase of viscosity results in substantial improvement of
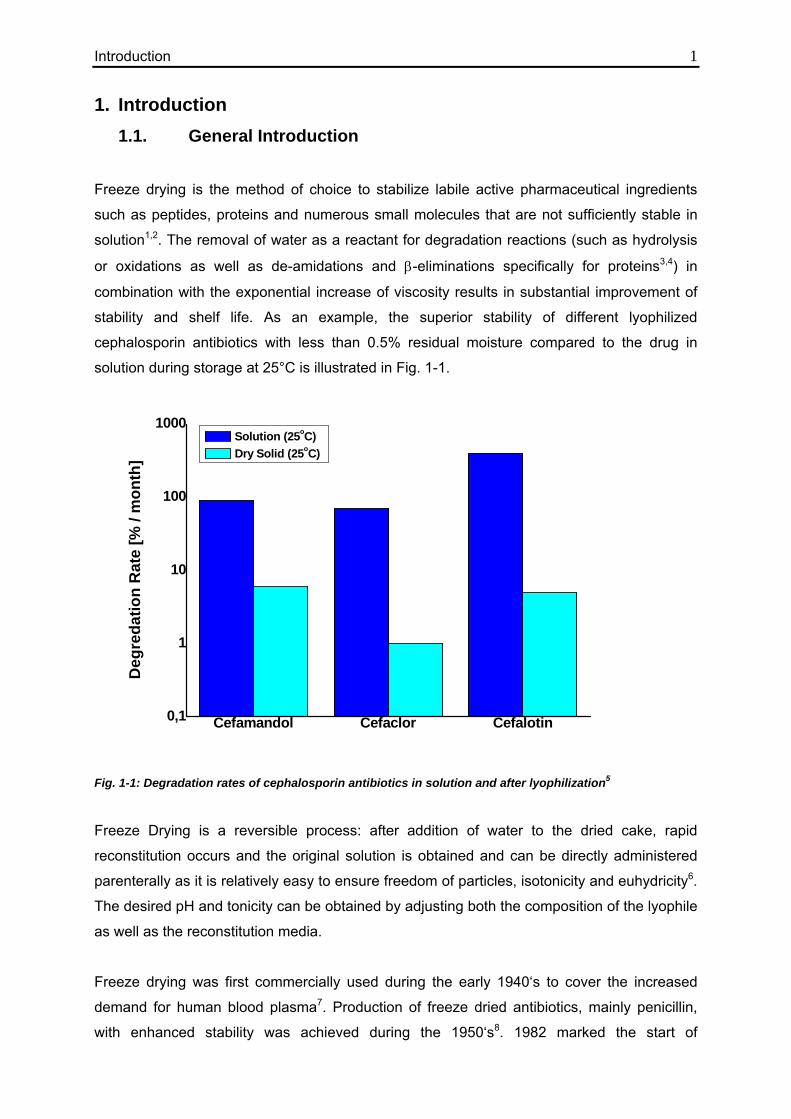
stability and shelf life. As an example, the superior stability of different lyophilized
cephalosporin antibiotics with less than 0.5% residual moisture compared to the drug in
solution during storage at 25°C is illustrated in Fig. 1-1.
Cefamandol Cefaclor Cefalotin0,1
1
10
100
1000
Deg
reda
tion
Rat
e [%
/ m
onth
]
Solution (25oC) Dry Solid (25oC)
Fig. 1-1: Degradation rates of cephalosporin antibiotics in solution and after lyophilization5
Freeze Drying is a reversible process: after addition of water to the dried cake, rapid
reconstitution occurs and the original solution is obtained and can be directly administered
parenterally as it is relatively easy to ensure freedom of particles, isotonicity and euhydricity6.
The desired pH and tonicity can be obtained by adjusting both the composition of the lyophile
as well as the reconstitution media.
Freeze drying was first commercially used during the early 1940‘s to cover the increased
demand for human blood plasma7. Production of freeze dried antibiotics, mainly penicillin,
with enhanced stability was achieved during the 1950‘s8. 1982 marked the start of
Introduction 2 development of biotechnologically manufactured drugs, many of which are produced and
stabilized through freeze drying. The biotech revolution in the 1990’s lead to an increasing
demand for lyophilized products as well as further investigation and optimization of the freeze
drying process. Costantino recently reported that 46% of the FDA approved protein, peptide,
vaccine, oligonucleotide and cell-based products are produced by lyophilization2.
Typical biopharmaceutical products that are manufactured by freeze drying are peptides and
proteins such as antibodies, enzymes or hormones. Other important lyophilized
pharmaceuticals are vaccines, antibiotics and vitamins9. The conservation of blood plasma of
rare blood groups is also an important area. Besides pharmaceutical applications,
lyophilization is mainly used for stabilization of food products such as coffee, herbs and fruits.
Freeze drying of water-sensitive chemicals, flowers and water damaged documents and
artifacts has been described in the literature as well.
Newly developed drugs often show poor solubility and require novel dosage forms such as
liposomes, microparticles or nanoparticles to minimize solubility problems and side effects
due to toxicity10. These dosage forms are often inherently labile due to agglomeration,
sedimentation etc., and can be stabilized and manufactured by freeze drying. Other
innovative classes of drugs that can be produced by lyophilization are DNA or RNA carriers
or complexes11,12.
Advantages of lyophilized products are multifold: Lyophilized cakes have a high internal
surface area which makes fast and complete reconstitution of the dried product possible and
facilitates use in emergency medicine and safe application in hospitals. It is much easier to
achieve sterility assurance and freedom of particles than using other drying methods or
handling of dry powders13. Accurate and sterile dosage adaptation is possible, and products
sensitive to oxidation can be stoppered and sealed within an inert atmosphere (i.e. nitrogen)
to minimize detrimental effects. Pharmaceutical freeze drying is not limited to products for
parenteral use, but can also be used for e.g. fast dissolving sublingual tablets.
The main disadvantage of freeze drying is the long and cost-intensive process and the
limited amount of vials processed in each run which restricts the overall production capacity.
Typical cycle times reach from less than one day up to more than one week in extreme
cases1. Since constant cooling and/or heating is required, the energy requirements are very
high. The high investment and maintenance costs for a freeze dryer and the limited
production capacity are additional disadvantages. The number of freeze-dried products as
well as energy costs have steadily increased over the last years, causing a growing need to

Introduction 3 shorten freeze drying cycles and optimize production throughput while maintaining optimal
product quality14. This can be achieved using Process Analytical Technologies to gain more
insight into the process, make lyophilization recipes more efficient and reduce the risk of
failure batches. Novel methods and applications of Process Analytical Technology for freeze
drying are recommended and demanded by regulatory agencies15 and were investigated in
the scope of this thesis.
Introduction 4
1.2. The Concept of Freeze Drying
Freeze drying is a dehydration process in which a usually aqueous solution is first frozen and
subsequently dried by sublimation under vacuum. The remaining solid undergoes additional
drying at elevated temperatures and forms a porous cake with high internal surface area. By
reconstituting the lyophile with water for injection, it is easy to achieve a sterile, particle-free
and accurately-dosed solution that can be directly administered parenterally.
The term freeze drying is used synonymously to lyophilization, i.e. making the solute more
affine to a solvent by removal of frozen water through sublimation and formation of a sponge-
like cake structure16.
1.2.1. Design of a Freeze Dryer
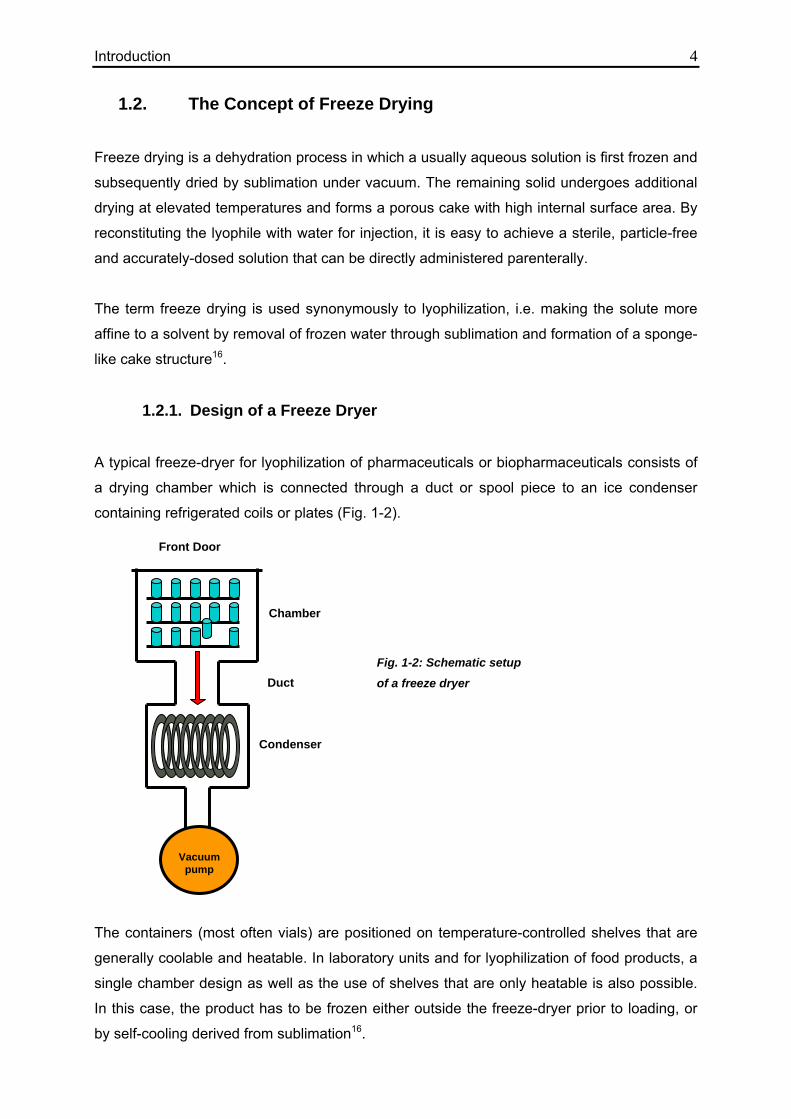
A typical freeze-dryer for lyophilization of pharmaceuticals or biopharmaceuticals consists of
a drying chamber which is connected through a duct or spool piece to an ice condenser
containing refrigerated coils or plates (Fig. 1-2).
Fig. 1-2: Schematic setup
of a freeze dryer
The containers (most often vials) are positioned on temperature-controlled shelves that are
generally coolable and heatable. In laboratory units and for lyophilization of food products, a
single chamber design as well as the use of shelves that are only heatable is also possible.
In this case, the product has to be frozen either outside the freeze-dryer prior to loading, or
by self-cooling derived from sublimation16.
Vacuum
pump
Chamber
Condenser
Duct
Front Door
Introduction 5 A vacuum pump is used to evacuate the system and remove non-condensable gases (i.e.
air); the desired chamber pressure is maintained via a controlled leak of nitrogen in many
systems. Alternative options for chamber pressure control are temperature-controlled
condensers, intermittent opening and closing of a valve in the vacuum line between
condenser and pump, and restriction of water vapor flow by a partially closed valve in the
spool piece connecting chamber and condenser2. Water vapor from the product is
transported to the condenser and deposited there, forming a layer of ice. The driving force for
water vapor transport is the gradient in vapor pressure between the ice interface in the
product and the ice surface on the condenser coils17. Therefore the condenser temperature
needs to be significantly lower than the product temperature during the drying phase, usually
between -55°C and -85°C.
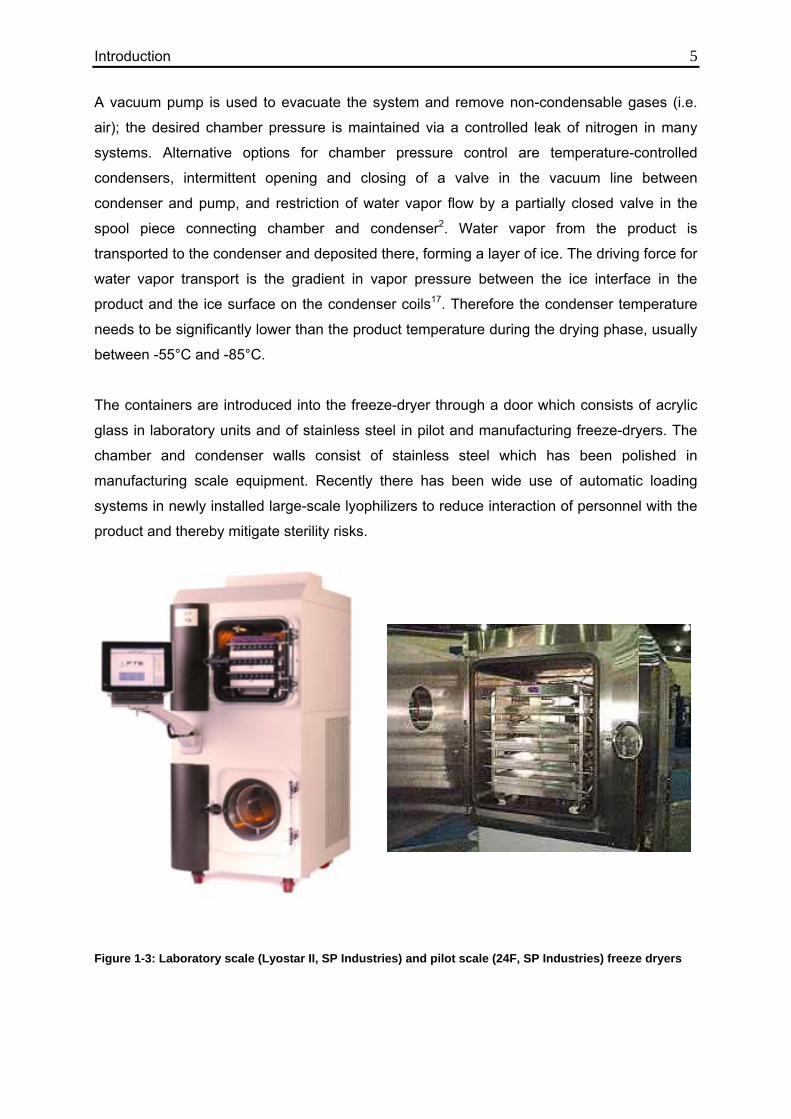
The containers are introduced into the freeze-dryer through a door which consists of acrylic
glass in laboratory units and of stainless steel in pilot and manufacturing freeze-dryers. The
chamber and condenser walls consist of stainless steel which has been polished in
manufacturing scale equipment. Recently there has been wide use of automatic loading
systems in newly installed large-scale lyophilizers to reduce interaction of personnel with the
product and thereby mitigate sterility risks.
Figure 1-3: Laboratory scale (Lyostar II, SP Industries) and pilot scale (24F, SP Industries) freeze dryers
Introduction 6
1.2.2. Process Steps 1.2.2.1. Freezing
A freeze-drying process consists of three phases. First, the product solution is filled into
container systems, mostly serum tubing or molded vials, and positioned on the temperature-
controlled shelves of the freeze-dryer. The shelf temperature is subsequently reduced to
a temperature between -30°C to -50°C, resulting in formation of ice nuclei and subsequent
growth of ice crystals (“Freezing Step”). Nucleation of ice usually occurs on surfaces such as
the vial wall, foreign particles in the solution or thermal probes (heterogeneous nucleation).
The difference between nucleation temperature and the equilibrium freezing point of the
solution (supercooling) depends on the number of particles in the solution, which is much
higher in the laboratory than in a GMP area. This difference also limits the
representativeness of invasive temperature monitoring technologies for all other vials with no
sensors.
After nucleation, the remaining solution is continuously concentrated until the maximally
freeze-concentrated solute is obtained. At this point, both concentration and viscosity of the
solution have substantially increased, resulting in a rubber-like amorphous state that is a
discrete phase adjacent to the crystalline ice. The most important characteristic of this
concentrated rubbery solute phase is the temperature of transformation to a glassy state with
substantially elevated rigidity and viscosity, the so-called glass transition temperature of the
maximally freeze-concentrated solute, Tg’18. The product temperature needs to be reduced
below this temperature during the freezing step and maintained lower throughout the primary
drying phase to prevent loss of the dried cake structure. If the solute is crystallizable,
formation of a discrete crystalline solute phase may take place during the freezing or the
drying phase19. In this case, the product temperature needs to be maintained below the
eutectic temperature of the crystalline mixture, TE 20.
Upon completion of the freezing step, the solution is completely solidified, i.e. the majority of
water has been separated from the solute and is bound in ice crystals, and the solute has
formed a vitreous glass or crystallized. The concentration of solute within the amorphous
phase is widely independent of the initial concentration in the liquid solution and mainly
determined by the type of dissolved components. As an example, both a 50 mg/mL solution
and a 200 mg/mL solution of sucrose will form a vitreous glass with roughly 19% equilibrium
water content at the end of the freezing step21. The vast majority of water has been
converted to ice crystals and thereby removed from the solute phase. These considerations
Introduction 7 make it obvious that most of the water removal from the solute takes place during the
freezing step.
The cooling rate during freezing determines the size and structure of ice crystals and pores
in the lyophilized product. Fast freezing leads to a large number of small ice crystals,
resulting in high product resistance to vapor flow and therefore extensive primary drying
times22. This effect can be at least partially compensated by performing thermal treatment
following the freezing step, also referred to as “Annealing”. The frozen product is heated up
to a temperature below the eutectic melting point but above the Tg’ of the amorphous phase,
resulting in growth of ice crystals and formation of an extended pore structure23. Additionally,
quantitative crystallization of crystallizable solutes is facilitated, which is especially important
in the case of mannitol to avoid vial breakage24,25. Alternatively the nucleation temperature
can be controlled using nucleation agents (i.e. deliberately added foreign particles) or an
electric field22,26. Another possibility is the ice fog technique which includes purging of the
chamber with very cold nitrogen, causing moisture in the air to crystallize and initiate
nucleation of ice at a specified product temperature27.
1.2.2.2. Primary Drying
After the freezing step has been completed, the pressure within the freeze-dryer is reduced
using a vacuum pump. Typical chamber pressures in the lyophilization of pharmaceuticals
range from 30 and 300 mTorr1 and depend on the desired product temperature and the
characteristics of the container system. The chamber pressure needs to be lower than the
vapor pressure of ice at the sublimation interface in the product to facilitate sublimation of ice
and transport of water vapor to the condenser where it is deposited as ice. Very high
chamber pressures decrease the sublimation rate by reducing the pressure gradient between
sublimation interface and chamber, thereby mitigating the driving force for sublimation and
continuing removal of ice. If the chamber pressure exceeds the vapor pressure at the
sublimation interface, no mass transfer is possible. On the other hand, very low pressures
(< 50 mTorr) are also counterproductive for fast sublimation rates since they greatly limit the
rate of heat transfer to the product2,28. The mechanisms of heat transfer are discussed in
detail in section 1.1.3.
The ice at the sublimation interface shows a vapor pressure that is directly correlated to the
product temperature (Table 1-1)29. Once the chamber pressure decreases below the vapor
pressure of ice in the product, sublimation can occur, i.e. ice is removed from the top of the
frozen layer and directly converted to water vapor. Water vapor is transported to the ice
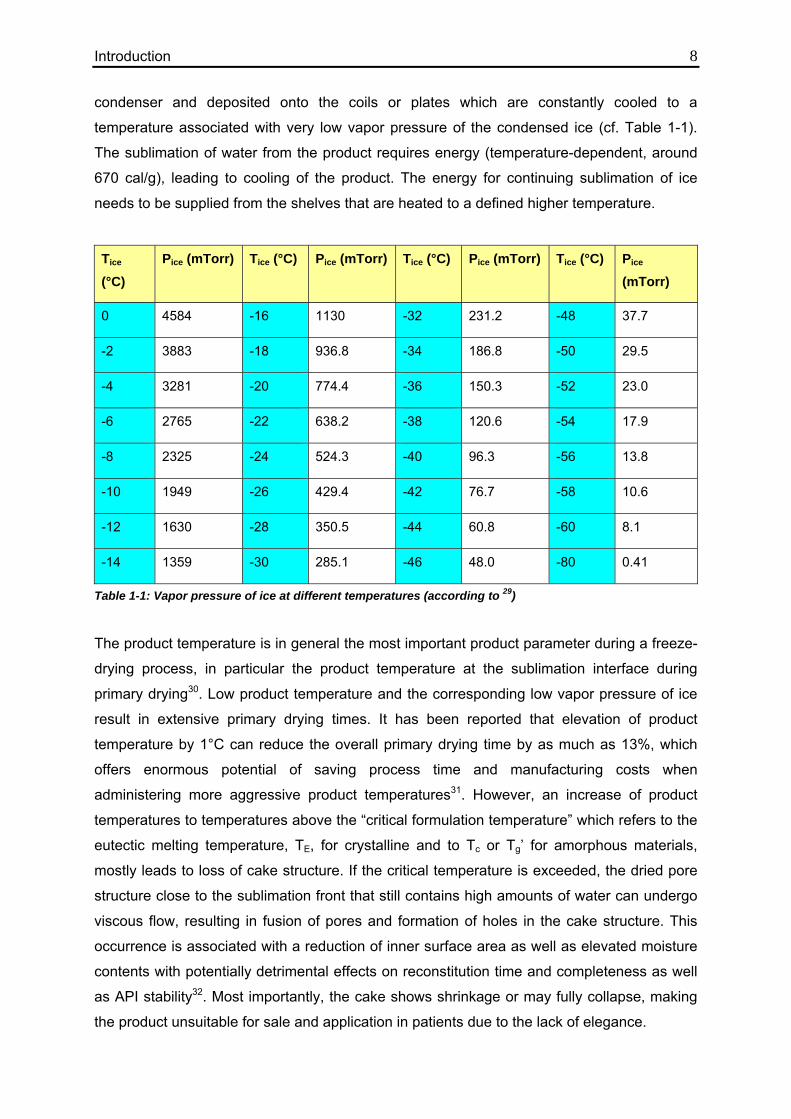
Introduction 8 condenser and deposited onto the coils or plates which are constantly cooled to a
temperature associated with very low vapor pressure of the condensed ice (cf. Table 1-1).
The sublimation of water from the product requires energy (temperature-dependent, around
670 cal/g), leading to cooling of the product. The energy for continuing sublimation of ice
needs to be supplied from the shelves that are heated to a defined higher temperature.
Tice (°C)
Pice (mTorr) Tice (°C) Pice (mTorr) Tice (°C) Pice (mTorr) Tice (°C) Pice (mTorr)
0 4584 -16 1130 -32 231.2 -48 37.7
-2 3883 -18 936.8 -34 186.8 -50 29.5
-4 3281 -20 774.4 -36 150.3 -52 23.0
-6 2765 -22 638.2 -38 120.6 -54 17.9
-8 2325 -24 524.3 -40 96.3 -56 13.8
-10 1949 -26 429.4 -42 76.7 -58 10.6
-12 1630 -28 350.5 -44 60.8 -60 8.1
-14 1359 -30 285.1 -46 48.0 -80 0.41
Table 1-1: Vapor pressure of ice at different temperatures (according to 29)
The product temperature is in general the most important product parameter during a freeze-
drying process, in particular the product temperature at the sublimation interface during
primary drying30. Low product temperature and the corresponding low vapor pressure of ice
result in extensive primary drying times. It has been reported that elevation of product
temperature by 1°C can reduce the overall primary drying time by as much as 13%, which
offers enormous potential of saving process time and manufacturing costs when
administering more aggressive product temperatures31. However, an increase of product
temperatures to temperatures above the “critical formulation temperature” which refers to the
eutectic melting temperature, TE, for crystalline and to Tc or Tg’ for amorphous materials,
mostly leads to loss of cake structure. If the critical temperature is exceeded, the dried pore
structure close to the sublimation front that still contains high amounts of water can undergo
viscous flow, resulting in fusion of pores and formation of holes in the cake structure. This
occurrence is associated with a reduction of inner surface area as well as elevated moisture
contents with potentially detrimental effects on reconstitution time and completeness as well
as API stability32. Most importantly, the cake shows shrinkage or may fully collapse, making
the product unsuitable for sale and application in patients due to the lack of elegance.
Introduction 9 The critical formulation temperature can be determined using Freeze-Dry Microscopy (FDM)
which allows observation of the drying cake structure under vacuum at varying
temperatures33-35. Once the collapse temperature is reached it is possible to observe
formation of holes in the dried cake structure. Since the sample is being dried during the
experiment, the conditions are more similar to lyophilization than alternative methods,
making the results more representative for a vial freeze-drying process36. A different
approach to determine the critical formulation temperature is Differential Scanning
Calorimetry (DSC) which measures the heat flow and thermal properties of the frozen
sample37-39. This way it is possible to determine the glass transition temperature of the
maximally freeze-concentrated solute, Tg’, which is indicative for molecular mobility in the
amorphous matrix40,41. Since no removal of water is involved, the critical temperature is not
as representative for vial freeze-drying as the collapse temperature determined using
FDM33,42.
It is possible to increase the critical temperature by crystallizing salts (i.e. buffers etc.)
quantitatively during freezing, or by adding amorphous excipients with high Tg’ values such
as dextran or cyclodextrines43. If formulations with high contents of crystallizing solutes are
lyophilized, a crystalline lattice is formed that is stable up to product temperatures equivalent
to the eutectic melting point TE which is much higher than common Tg’ values6. Therefore it is
possible to create formulations with a high ratio of crystallizing substances and freeze-dry at
temperatures above the Tg’ of the amorphous ingredients which then collapse onto the
crystalline matrix. Thus no global loss of structure occurs and the cake appearance is still
elegant. It is important to pay close attention to API stability and choice of stabilizers to
obtain a product stable over the shelf life when following such an approach, but it offers huge
benefits for process optimization44.
1.2.2.3. Secondary Drying
In the area where the ice has already been removed, desorption of water from the cake
occurs; this process is referred to as secondary drying and already starts in the primary
drying phase. Once all ice has been removed from all product containers, the shelf
temperature is elevated and typically maintained at a temperature between 20°C and 40°C
for several hours. The rate of desorption and the obtainable moisture level is controlled by
diffusion within the solute phase and desorption from the surface and therefore depends
mostly on product temperature; further reduction of chamber pressure is not required45. The
ramp rate to the secondary drying temperature needs to be moderate (0.1°C/min to
0.3°C/min) for amorphous substances to avoid surpassing the glass transition of the
Introduction 10 lyophilized cake and pertaining cake shrinkage. Secondary drying times are usually designed
to achieve a reduction of moisture content within the cake to less than 1%. For most
lyophilized API’s the stability increases with the reduction of moisture, so it is beneficial to
reduce the residual moisture as much as possible46,47. However, thermal stresses to the API
due to the elevated product temperature need to be considered. Especially for proteins it is
necessary to determine optimal secondary drying conditions which result in an optimum
moisture content without detrimental effects from heating. For some protein formulations, the
stability optimum has been found at intermediate moisture contents, i.e. between 1-3% RM48.
Targeting of such moisture contents for all vials in the batch is often difficult and hard to
monitor. A new analytical approach was investigated in the scope of this work and will be
discussed later on.
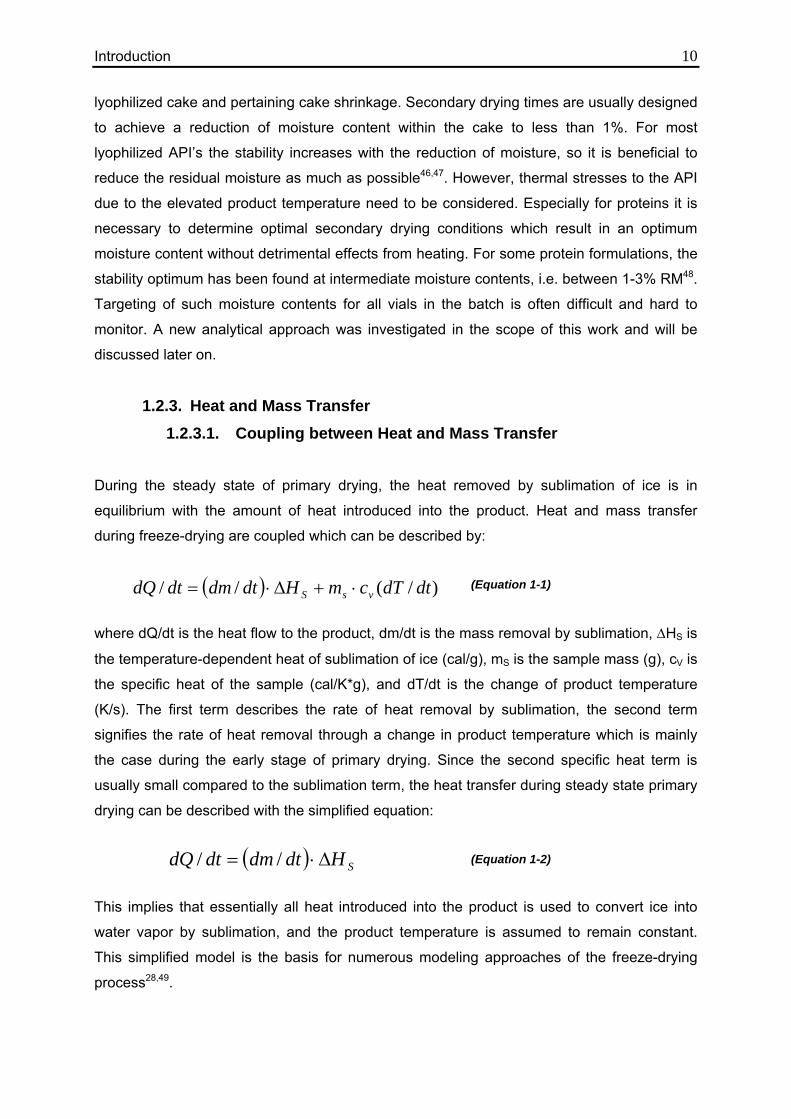
1.2.3. Heat and Mass Transfer 1.2.3.1. Coupling between Heat and Mass Transfer
During the steady state of primary drying, the heat removed by sublimation of ice is in
equilibrium with the amount of heat introduced into the product. Heat and mass transfer
during freeze-drying are coupled which can be described by:
(Equation 1-1)
where dQ/dt is the heat flow to the product, dm/dt is the mass removal by sublimation, ΔHS is
the temperature-dependent heat of sublimation of ice (cal/g), mS is the sample mass (g), cV is
the specific heat of the sample (cal/K*g), and dT/dt is the change of product temperature
(K/s). The first term describes the rate of heat removal by sublimation, the second term
signifies the rate of heat removal through a change in product temperature which is mainly
the case during the early stage of primary drying. Since the second specific heat term is
usually small compared to the sublimation term, the heat transfer during steady state primary
drying can be described with the simplified equation:
(Equation 1-2)
This implies that essentially all heat introduced into the product is used to convert ice into
water vapor by sublimation, and the product temperature is assumed to remain constant.
This simplified model is the basis for numerous modeling approaches of the freeze-drying
process28,49.
( ) )/(// dtdTcmHdtdmdtdQ vsS ⋅+Δ⋅=
( ) SHdtdmdtdQ Δ⋅= //
Introduction 11
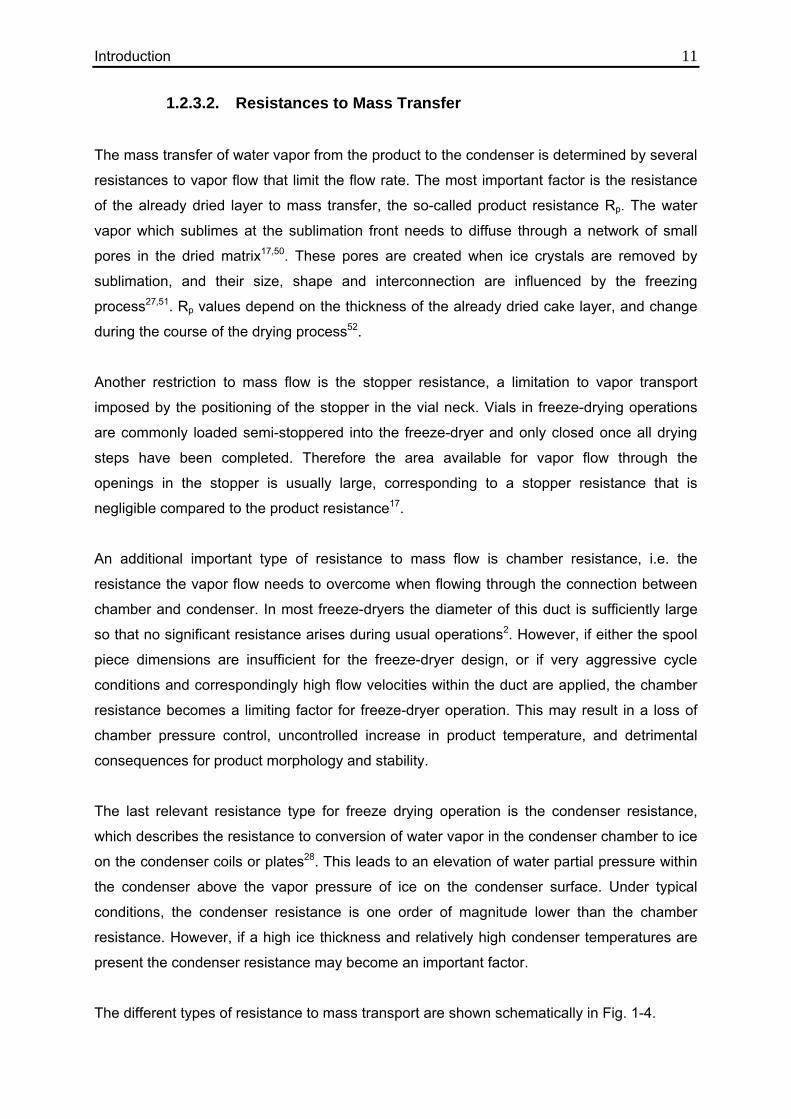
1.2.3.2. Resistances to Mass Transfer
The mass transfer of water vapor from the product to the condenser is determined by several
resistances to vapor flow that limit the flow rate. The most important factor is the resistance
of the already dried layer to mass transfer, the so-called product resistance Rp. The water
vapor which sublimes at the sublimation front needs to diffuse through a network of small
pores in the dried matrix17,50. These pores are created when ice crystals are removed by
sublimation, and their size, shape and interconnection are influenced by the freezing
process27,51. Rp values depend on the thickness of the already dried cake layer, and change
during the course of the drying process52.
Another restriction to mass flow is the stopper resistance, a limitation to vapor transport
imposed by the positioning of the stopper in the vial neck. Vials in freeze-drying operations
are commonly loaded semi-stoppered into the freeze-dryer and only closed once all drying
steps have been completed. Therefore the area available for vapor flow through the
openings in the stopper is usually large, corresponding to a stopper resistance that is
negligible compared to the product resistance17.
An additional important type of resistance to mass flow is chamber resistance, i.e. the
resistance the vapor flow needs to overcome when flowing through the connection between
chamber and condenser. In most freeze-dryers the diameter of this duct is sufficiently large
so that no significant resistance arises during usual operations2. However, if either the spool
piece dimensions are insufficient for the freeze-dryer design, or if very aggressive cycle
conditions and correspondingly high flow velocities within the duct are applied, the chamber
resistance becomes a limiting factor for freeze-dryer operation. This may result in a loss of
chamber pressure control, uncontrolled increase in product temperature, and detrimental
consequences for product morphology and stability.
The last relevant resistance type for freeze drying operation is the condenser resistance,
which describes the resistance to conversion of water vapor in the condenser chamber to ice
on the condenser coils or plates28. This leads to an elevation of water partial pressure within
the condenser above the vapor pressure of ice on the condenser surface. Under typical
conditions, the condenser resistance is one order of magnitude lower than the chamber
resistance. However, if a high ice thickness and relatively high condenser temperatures are
present the condenser resistance may become an important factor.
The different types of resistance to mass transport are shown schematically in Fig. 1-4.
Introduction 12
Figure 1-4: Resistances to water vapor flow in freeze drying28
The impact of resistance for the mass transfer rate is usually expressed as a pressure
difference divided by resistance. For the description of mass flow in freeze-drying operations,
usually the pressure difference between the sublimation front (place of highest vapor
pressure of ice) and the chamber (constant and controlled lower pressure) are considered.
Resistances that need to be regarded are the product resistance created by the dried cake
layer, and the stopper resistance. The common equation for the description is:
(Equation 1-3)
where dm/dt is the mass flow rate (g/h per Vial), P0 is the vapor pressure of ice at the
sublimation interface (mTorr), Pc is the chamber pressure (mTorr), Rp is the product
resistance (cm2*Torr*h/g), Rs is the stopper resistance (cm2*Torr*h/g), and Ap is the inner
cross-sectional area of the vial (cm2), i.e. the surface area of the product. It is obvious that
mass flow increases directly with the pressure gradient between sublimation front and
chamber, and decreases with growing resistance to vapor flow.
1.2.3.3. Product Temperature
The vapor pressure at the sublimation interface (Pice in Torr) is directly related to the ice
temperature (Tp in K) at this position, which can be described by30:
psp
c ARRPPdtdm ⋅
+−
= 0/
Introduction 13
(Equation 1-4)
Product temperatures at the sublimation front lower than -40°C result in a vapor pressure of
less than 100 mTorr (cf. Table 1-1). The chamber pressure needs to be reduced to facilitate
any sublimation at low vapor pressures, and heat transfer to the product is greatly reduced.
Conduction of primary drying at product temperatures below -40°C leads, depending on
product concentration and fill volume, to extensively long drying times which is extremely
inefficient and expensive. In contrast, elevated product temperatures during primary drying
substantially reduce the process time. The implications of product resistance for the freeze-
drying process and the value of monitoring this parameter is discussed in following chapters
of this work.
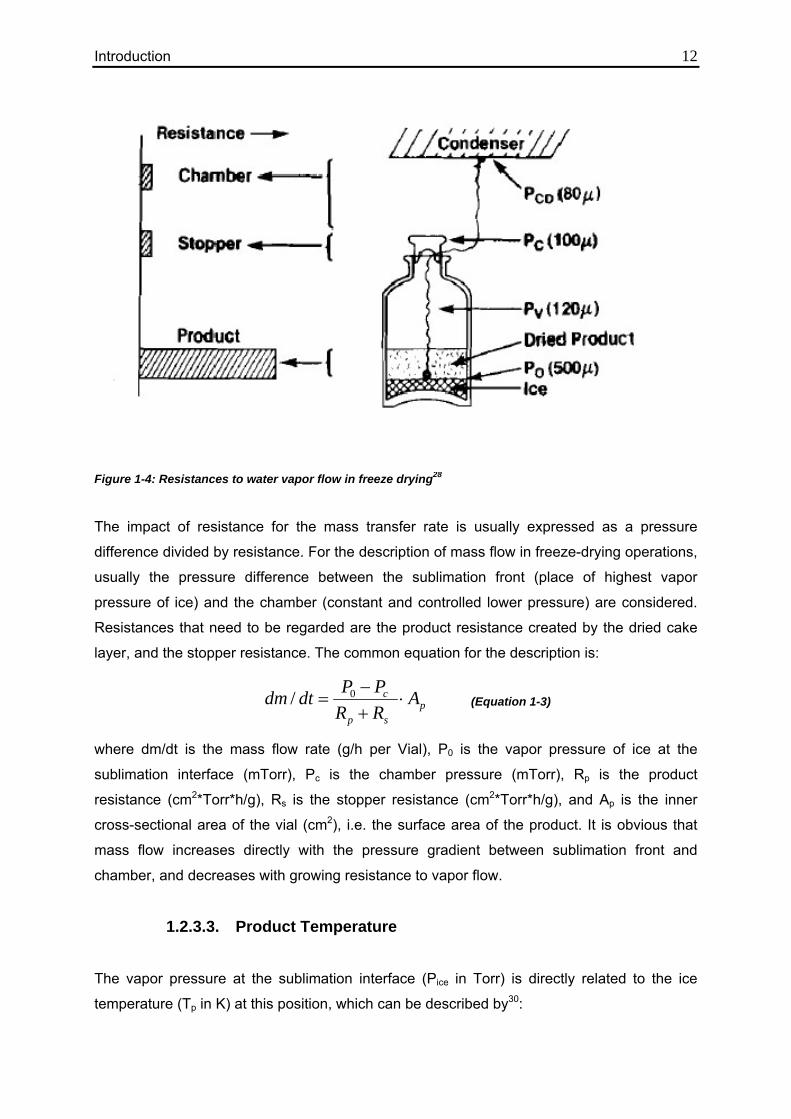
1.2.3.4. Contributions to Heat Transfer
Heat transfer to the product can be divided into three components: direct conduction, gas
conduction and radiation17,53. The pathways for transfer of energy through these three
mechanisms are illustrated in Fig. 1-4.
Direct conduction represents the heat energy transmitted from the shelf to the vial at the
area where both are in direct contact. This area depends on the container type used, is
especially low for wellplates or molded vials, and only covers a fraction of the total vial
bottom even for tubing vials designed for lyophilization54,55. The amount of heat conveyed is
proportional to the temperature difference between the cold vial and the warmer shelf.
Figure 1-5: Types of heat transfer to the product; adapted from 56
( ) 01849.2496.6144ln +−
=p
ice TP
Introduction 14 In heat transfer by gas conduction, heat is conveyed from the shelf to gas molecules. The
gas molecules need to traverse the distance to the vial and convey heat energy to the vial.
This mechanism is highly dependent on the chamber pressure and the vial geometry:
increases in chamber pressure results in a higher amount of energy transported to the
product by gas conduction, while large separation distances between vial bottom and shelf
(especially in the case of molded vials) reduce the number of gas molecules that reach the
vial without losing their heat energy on the way due to collisions between gas molecules. The
distance that an average gas molecule can travel between two collisions is referred to as the
Mean Free Path, L, which depends on the size and number of molecules (i.e. pressure)5,9. If
the mean free path is small compared to pore or tube dimensions, collisions between gas
molecules are more frequent than collisions between gas molecules and pore walls, thereby
limiting the heat transfer to the product28.
Heat transfer by radiation takes place between two surfaces with different temperatures, i.e.
the cold vial and the shelf, the top shelf, as well as chamber door and walls57. The warmer
surface radiates electromagnetic energy which is absorbed by the colder surface. Although
this pathway also depends on the distance between the surfaces, the most important
parameter is the temperature difference. Radiative heat transfer can be described by the
Stefan Boltzmann equation:
(Equation 1-5)
where dQr/dt represents the amount of energy per time transmitted by radiation, Av is the vial
area (top or bottom5), ē is the effective emissivity for exchange of radiation (between 0 and
1), σ is the Boltzmann constant (1,3806504 · 10−23 J/K), and (T24-T1
4) is the difference
between the temperature of the two surfaces to the fourth power. The effective emissivity is
an important parameter for surface materials used in the construction of a freeze-dryer.
While acrylic glass shows especially high emissivity (0.95), the radiation of polished stainless
steel is much lower (0.4)54. This difference needs to be regarded during transfer and scale-up
of lyophilization cycles between freeze-dryers with different radiation characteristics.
1.2.3.5. Heat Transfer Coefficients
The coupling between mass transfer by sublimation and heat transfer into the product shown
in Equation 1-2 can be transformed to:
(Equation 1-6)
( ) ( )bSVVS TTKAHdtdmdtdQ −⋅⋅=Δ⋅= //
)( 41
42 TTeA
dtdQ
vr −= σ
Introduction 15 In this equation, Kv is the vial heat transfer coefficient which is defined as the ratio of the area
normalized heat flow to the temperature difference between the shelf and the frozen product.
Kv is a measure for the total amount of heat transmitted to the product at different chamber
pressures58. This value can be used to describe the heat transfer characteristics of a specific
vial type. Kv is usually determined by sublimation tests with pure water in the vial of interest.
Product temperature at the vial bottom (Tb) and shelf surface temperature (Ts) need to be
measured, and the mass flow (dm/dt) is deducted from weighing the vials before and after
the experiment59. After measuring the outer vial diameter and calculating the outer vial cross-
sectional area (Av), Kv can be determined:
(Equation 1-7)
After performing sublimation tests at several chamber pressures and calculating the
respective results, a curve of Kv against chamber pressure can be plotted and fitted to a
model function to allow interpolation of data between measurement points. The intercept of
the fitted curve can also be used to determine the extent of pressure independent heat
transfer to the product (i.e. direct conduction and radiation) and relate this to the amount of
pressure-dependent heat transfer (i.e. via gas conduction)60. This procedure and other uses
of Kv data are discussed in later parts of this thesis.
( )( )bSV
SV TTA
HdtdmK−⋅Δ⋅
=/
Introduction 16
1.3. PAT Tools: Integral Part of a Quality by Design Concept 1.3.1. Regulatory Perspective and Definitions
The critical importance of high quality standards of pharmaceutical product for individuals
and the public health has lead to intensive regulation of the pharmaceutical industry in
practically all business aspects. Close monitoring and requirements for testing of new drugs
have been implemented and enforced after the first fatal consequences of broad application
of new drugs with detrimental effects. One example is the Contergan incident in the early
1960’s that resulted in numerous limb disfigurements in newborns due to use of the API
Thalidomid by pregnant women61,62. This led to a paradigm-shift concerning pre-requirements
for registration and testing of new pharmaceutical products which is not limited to new API’s
but also applies to development and manufacturing of pharmaceutical products.
The introduction of Good Manufacturing Practice (GMP) and the associated Good Laboratory
Practice (GLP) in the 1990’s led to very rigid organizational structures for the development
and manufacturing of pharmaceutical products63,64. For each drug, the production process
had to be established, all important process parameters had to be defined and specified65,
and the process needed to be reproduced identical to the submitted cycle for each
manufacturing run.
In freeze-drying, this implies designing a specific process for one product with identical
preparation steps and a fixed shelf temperature over time and chamber pressure over time
profile that will result in a pharmaceutically acceptable product1,2. However, there are
inherent sources of variability in any kind of manufacturing process, especially due to
different quality characteristics of excipients and API raw materials and primary packaging
(i.e. vials, syringes, …)66. To ensure an acceptable product, the cycle conditions need to be
designed very conservatively, which also leads to long, inefficient and costly processes14.
Continuous adaptation and optimization of process conditions or formulation was not
possible, deviations from the designated parameters during the run most often lead to lot
rejection, and permanent changes to a process or formulation required prior acceptance by
the regulatory agencies and possibly extensive additional testing.
1.3.2. QbD, Design Space and PAT for Freeze Drying
The traditional GMP approach was focused on rigorous testing of the final product. This
procedure, in turn, supported an omnipresent lack of proper understanding of the process
itself, i.e. a proper control of the critical parameters during manufacturing. In combination
Introduction 17 with the inflexibility of adjusting process conditions, this became limiting for the introduction
of new drugs, causing the US Food and Drug Administration (FDA) to introduce a new
legislative aimed at altering the pharmaceutical development and production process. The
framework of this initiative is the 2002 guideline: “Pharmaceutical CGMPs for the 21st
century - A risk based approach“67, and the 2004 pertaining guideline „Guidance for industry:
PAT - A frame-work for innovative pharmaceutical development, manufacturing and quality
assurance“68. Additional information can be found in the guidelines of the International
Conference on Harmonisation of Technical Requirements for Registration of
Pharmaceuticals for Human Use (ICH), especially the documents Q8, Q9 and Q1069-71.
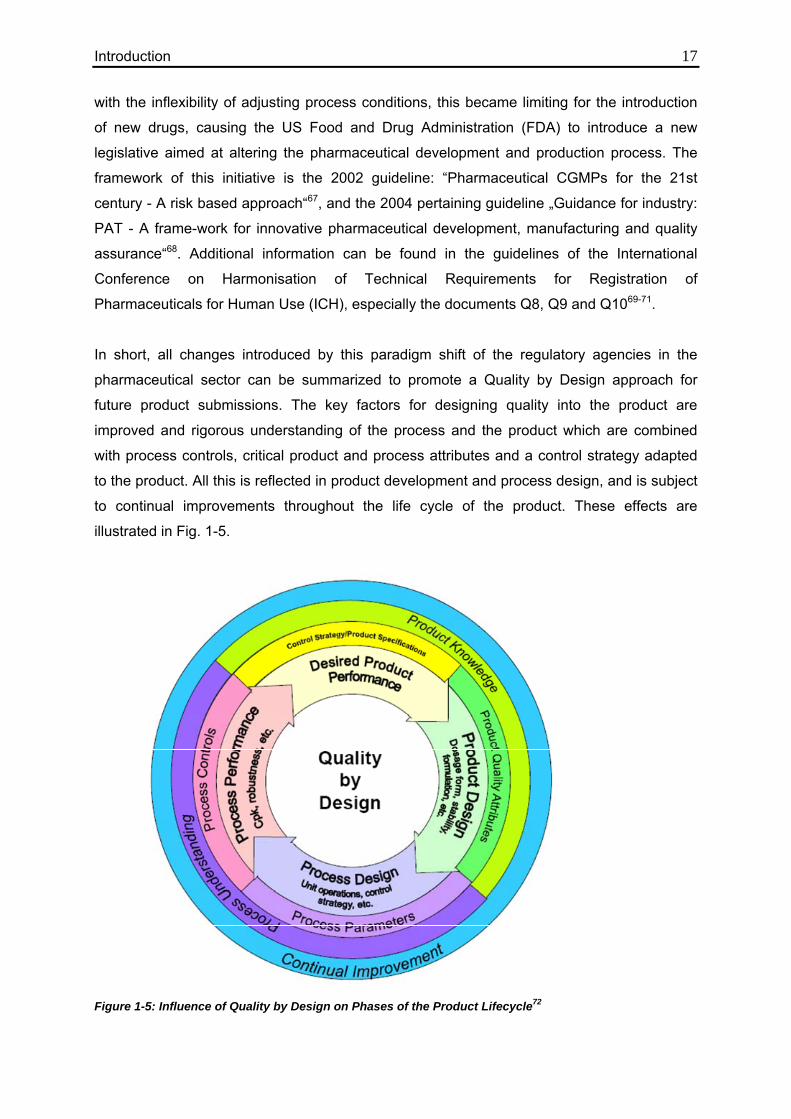
In short, all changes introduced by this paradigm shift of the regulatory agencies in the
pharmaceutical sector can be summarized to promote a Quality by Design approach for
future product submissions. The key factors for designing quality into the product are
improved and rigorous understanding of the process and the product which are combined
with process controls, critical product and process attributes and a control strategy adapted
to the product. All this is reflected in product development and process design, and is subject
to continual improvements throughout the life cycle of the product. These effects are
illustrated in Fig. 1-5.
Figure 1-5: Influence of Quality by Design on Phases of the Product Lifecycle72
Introduction 18 The major change in comparison to the previous regulatory documents is the demand for
process understanding and evaluation of the factors that present risks for the product quality
and ultimately for the patient. In particular, critical parameters need to be identified for both
process and product which can be measured during or after the manufacturing process, and
their influence on product quality and performance (i.e. product temperature, product
resistance, residual moisture content, specific surface area and other parameters in
lyophilization). Process control strategies are introduced to prevent or mitigate the risk of
producing a poor quality product. An additional goal is to optimize production cycles and
reduce costs, and to reduce the time between production and release up to the “Real-Time
Release” directly after manufacturing if the quality can be assured based on data obtained
during manufacturing. A main tool for measurement of the critical parameters is Process
Analytical Technology, PAT. The goal of PAT is to build pharmaceutical quality into the
product by design instead of trying to test quality into the final product.
The FDA defines PAT as:
A system for designing, analyzing and controlling manufacturing through timely
measurements (i.e., during processing) of critical quality and performance attributes
of raw and in-process materials and processes with the goal of ensuring final product
quality.73
The term “analytical” in PAT refers to chemical, physical, microbiological, mathematical and
risk analysis conducted in an integrated manner. The desired improvements from application
of PAT are gains in quality, safety and efficiency due to reduced production cycle time,
increasing automation and prevention of rejection or re-processing due to improved process
understanding. Another major advantage is the possibility for real time release, which means
that the product quality can be ensured by data generated during production, and the batch
can be released for sale directly after completion of production without extensive additional
final testing procedures.
The PAT tools specified by the FDA15 are:
1. Multivariate data acquisition and analysis tools to determine multiple critical factors
and their effects on product quality at the same time in combination with multivariate
mathematical approaches such as statistical design of experiments, process simulation in
conjunction with knowledge management systems (cf. tool 4.). This procedure is important to
identify and address interactions of product and process variables. Information from
Introduction 19 structured experiments at a small scale can be used to develop a knowledge system which is
useful at larger scales and for more complex problems encountered during manufacturing.
2. Modern process analyzers or process analytical chemistry tools, which can be
conventional systems measuring one variable (e.g. temperature, pressure), as well as
advanced tools that determine biological or chemical attributes. The place where these
measurements are obtained can be separated into at-line (removal of samples and analysis
close to the process), on-line (diversion of samples from the process, measurement and
return to the process) and in-line (invasive or non-invasive measurement in the process
stream without removal of samples). The most important capability of these systems is
determination of relative differences and changes of process attributes. Variability of the
materials processed can be compensated by adjusting the process if quality attributes and
real time process information are used to control the process via feed-back and/or feed
forward mechanisms.
3. Process and endpoint monitoring and control tools intended to monitor the state of a
process and actively manipulate it to maintain a desired state. This strategy relies on
identification of critical material and process attributes and process measurement systems
that can determine all critical parameters in real time. Information from these sensors can be
used to adjust the process, account for material variability and control the product quality by
mathematical relationships between critical material and process attributes. The end point of
a process is not a fixed time, but the achievement of the desired material attribute within a
reasonable process time. Validation can be demonstrated by continuous quality assurance
for a continually monitored and adjusted process using validated in-process measurements
and process end points.
4. Continuous improvement and knowledge management tools over the life cycle of a
product are required for post-approval changes and additional understanding of the process
and potential problems or variations. The possibility to process large amounts of data with
modern computer systems is the basis for such continuous analytical methods, and the large
amounts of data need to be processed thoroughly in order to establish the multi-factorial
relationships and the applicability of the generated knowledge in different scenarios.
The FDA considers a process as well understood when all sources of variability are identified
and explained, variability is managed by the process, and product quality attributed can be
accurately and reliably predicted over the design space. The design space in this respect
refers to the materials and process parameters used as well as to manufacturing,
Introduction 20 environmental and other conditions. In lyophilization, the critical product parameters are
mainly product temperature and product resistance6,74, while shelf temperature and chamber
pressure are the most important critical process parameters. Additional factors that are
critical for the release and acceptance of a freeze-dried product are lack of collapse or
meltback75. The user is encouraged to employ structured product and process development
on a small scale during development to provide insight and understanding for process
development, optimization, scale-up, technology transfer and control. Additionally, the
improvement of process understanding should be continued in the production phase to
compensate differences from the small scale. This approach of continuous learning is to be
followed throughout the life cycle of the product.
The Design Space is the multidimensional combination and interaction of input variables
and process parameters that have been demonstrated to provide assurance of quality69.
Working within the Design Space is not considered as a change in a regulatory sense69. The
critical process parameters are typically controlled at a target level during a production cycle.
During development of a process, the robustness of a process needs to be evaluated by
studying the impact of deviations from these target control parameters. These data are
interpreted to obtain a multidimensional Design Space of critical factors. As long as the
process parameters are controlled within the Design Space, the critical product
characteristics are also within the desired range. Adjustments during a manufacturing
process can be made without additional submission to the regulatory agencies as long as
they remain in the Design Space. The consequences of critical parameters lying outside the
Design Space also need to be evaluated to allow assessment of the effect of process
deviations during production and avoid extensive additional testing after such occurrences in
Manufacturing. Potentially critical events that could lead to process deviations in
lyophilization are loss of pressure control, insufficient cooling of the condenser, product
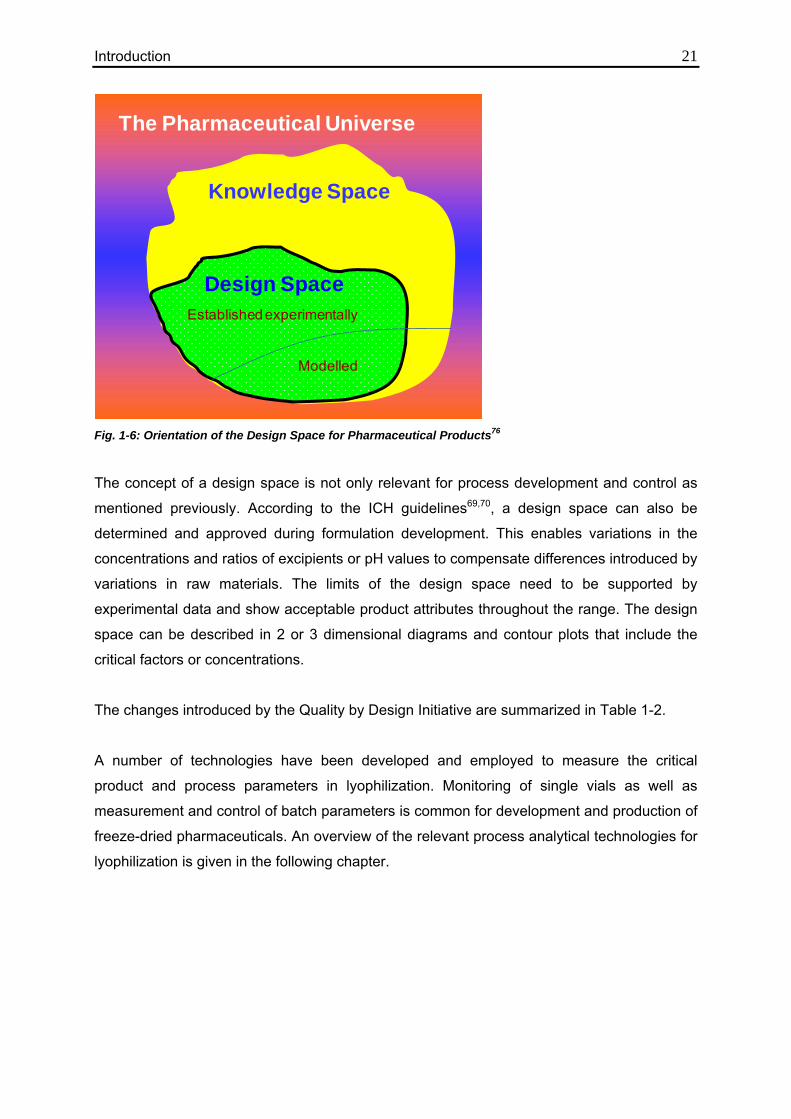
temperature variations. An illustration of the Design Space is provided in Fig 1-6.
Introduction 21
The Pharmaceutical Universe
Knowledge Space
Design Space
Modelled
Established experimentally
Fig. 1-6: Orientation of the Design Space for Pharmaceutical Products76
The concept of a design space is not only relevant for process development and control as
mentioned previously. According to the ICH guidelines69,70, a design space can also be
determined and approved during formulation development. This enables variations in the
concentrations and ratios of excipients or pH values to compensate differences introduced by
variations in raw materials. The limits of the design space need to be supported by
experimental data and show acceptable product attributes throughout the range. The design
space can be described in 2 or 3 dimensional diagrams and contour plots that include the
critical factors or concentrations.
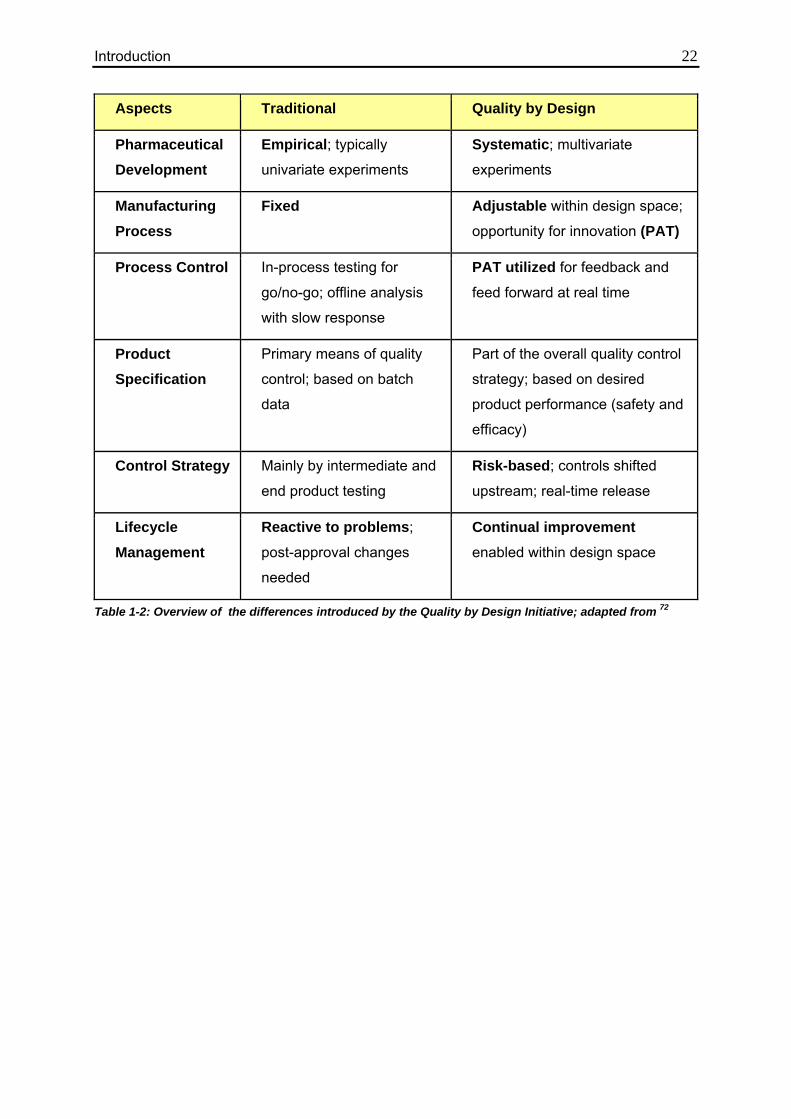
The changes introduced by the Quality by Design Initiative are summarized in Table 1-2.
A number of technologies have been developed and employed to measure the critical
product and process parameters in lyophilization. Monitoring of single vials as well as
measurement and control of batch parameters is common for development and production of
freeze-dried pharmaceuticals. An overview of the relevant process analytical technologies for
lyophilization is given in the following chapter.
Introduction 22
Aspects Traditional Quality by Design
Pharmaceutical Development
Empirical; typically
univariate experiments
Systematic; multivariate
experiments
Manufacturing Process
Fixed Adjustable within design space;
opportunity for innovation (PAT)
Process Control In-process testing for
go/no-go; offline analysis
with slow response
PAT utilized for feedback and
feed forward at real time
Product Specification
Primary means of quality
control; based on batch
data
Part of the overall quality control
strategy; based on desired
product performance (safety and
efficacy)
Control Strategy Mainly by intermediate and
end product testing
Risk-based; controls shifted
upstream; real-time release
Lifecycle Management
Reactive to problems;
post-approval changes
needed
Continual improvement enabled within design space
Table 1-2: Overview of the differences introduced by the Quality by Design Initiative; adapted from 72
Stefan Schneid
Linien
Introduction 23
1.4. Traditional Monitoring Technology used for Freeze-Drying 1.4.1. Single Vial Approaches
1.4.1.1. Thermocouples
Product temperature monitoring during a freeze-drying cycle in laboratory scale is commonly
performed using thin wire thermocouples (TC’s)9. A thermocouple typically consists of two
thin wires composed of dissimilar metals that are joined at the tip. The scientific basis for
temperature measurements using thermocouples is the Seebeck effect which describes the
electric potential difference that results from nonuniform temperature distribution in
conducting materials not subject to a magnetic field77. For thermocouples it states that two
wires that are joined at both ends and show different temperatures at both junctions lead to a
continuous flow of electric current around the circuit. If there is only one junction between the
two wires, as is the case with thermocouples, then a voltage can be measured at both open
ends of the wires. This voltage can be correlated to the temperature at the fusion point
through a non-linear relationship, and is also dependent on the length of both wires.
Thermocouples can be used over a wide temperature range but usually show an accuracy of
only ±1K78.
Special care has to be taken for exact placement in the vial: as stated above the ice is
removed from top to bottom and to a lesser extent from the edge to the center of the vial,
therefore the last remainder of ice is usually expected at the bottom center of the vial1. To
obtain an exact indication of the endpoint of primary drying, i.e. the time at which the ice has
been completely removed from the product, it is essential to position the thermocouple in the
center of the vial with the temperature-sensitive tip touching the bottom79. The thermocouple
wire should be under a slight tension to avoid misplacement during loading or freezing. There
are some devices that facilitate positioning of thermocouples by integrating the wire in a
special cap that is simply put on the vial instead of the stopper80. However, there is still a
necessity to manually introduce the monitored vials into the chamber and to place the wires
inside the freeze-dryer chamber to reach the thermocouple port. Since thermocouples are
difficult to sterilize and user interaction is required, use of such tools is a substantial sterility
risk especially in manufacturing scale. In addition, TC’s cannot be used in combination with
automatic loading systems. If temperature sensors are employed in a production
environment, they are frequently introduced into vials next to the chamber door to minimize
sterility risks.
Introduction 24
1.4.1.2. Resistance Thermal Detectors
Resistance thermal detectors (RTD’s) are the second class of widely used temperature
probes in freeze-drying. The measurement principle is based on the temperature
dependence of the electrical resistance of metals: the resistance increases linearly with the
temperature of the metal probe. RTD’s are usually constructed from Platinum due to its
relatively high electrical resistance and resistance to corrosion. Standard Platinum RTD’s
(PT-100) show a resistance of 100 Ω at 0°C, and a resistance increase of 0.39Ω/°C 9. Since
modern RTD’s are encased in sterilizable material, the use of other less noble metals is also
possible. To determine the temperature of the probe, the resistance is measured using a
Wheatstone bridge with the other resistances in the bridge positioned remote from the
Platinum element to avoid temperature changes.
RTD’s are robust and very accurate (0.1K) due to the linear relationship between
temperature and resistance. They are also easy to sterilize and can be used in sterile
processes if the placement of wires can be solved. However, the thermo-sensitive region of
RTD’s is much larger than that of thermocouples which makes temperature measurements at
one point in the vial impossible16. One-point measurements are essential for accurate
endpoint determination and temperature monitoring when most ice has already been
removed. If low fill depths are used the RTD may even extend above the solution and
measure a mixture of product and gas headspace temperature. Another disadvantage is the
fact that they require a power source that introduces an electrical current, and also produce
heat during the measurement which is introduced into the product and changes the heat
transfer characteristics in the monitored vial.
1.4.1.3. General Problems with Invasive Measurements
There are several issues with temperature data obtained from invasive temperature
measurements in a single vial as is the case for TC’s, RTD’s and other sensor types: they
are generally not representative for the average batch temperature due to variations in
nucleation and freezing behavior of the solution in the monitored vial (cf. 1.2.2.1). Vials with
temperature sensors tend to show less supercooling than the surrounding vials and therefore
form fewer but larger ice crystals27. This behavior results in larger pores in the dried cake,
lower product resistance and shorter drying time relative to the rest of the batch81. While this
difference has little implications in the laboratory, the sterile and particle-free environment in
manufacturing causes substantially higher supercooling of the solution, resulting in larger
differences between vials with and vials without temperature sensors.
Introduction 25
Another problem is the comparison of temperature data generated using different
technologies. Temperature data during cycle development in the laboratory are mostly
recorded with thermocouples, while temperatures during the transfer to pilot or production
scale are commonly measured using RTD’s to facilitate sterile processing. The fundamental
difference in sensor size and measurement principle leads to systematic discrepancies in the
measured product temperatures which may result in poor agreement of critical product
parameters and false cycle adjustments.
1.4.2. Batch Methods 1.4.2.1. Pirani / Capacitance Comparative Pressure Control
There are three different types of pressure measurement systems used on freeze-dryers:
Pirani gauges, capacitance manometers, and thermocouple gauges, with the first two
becoming predominant over the last decade2,9.
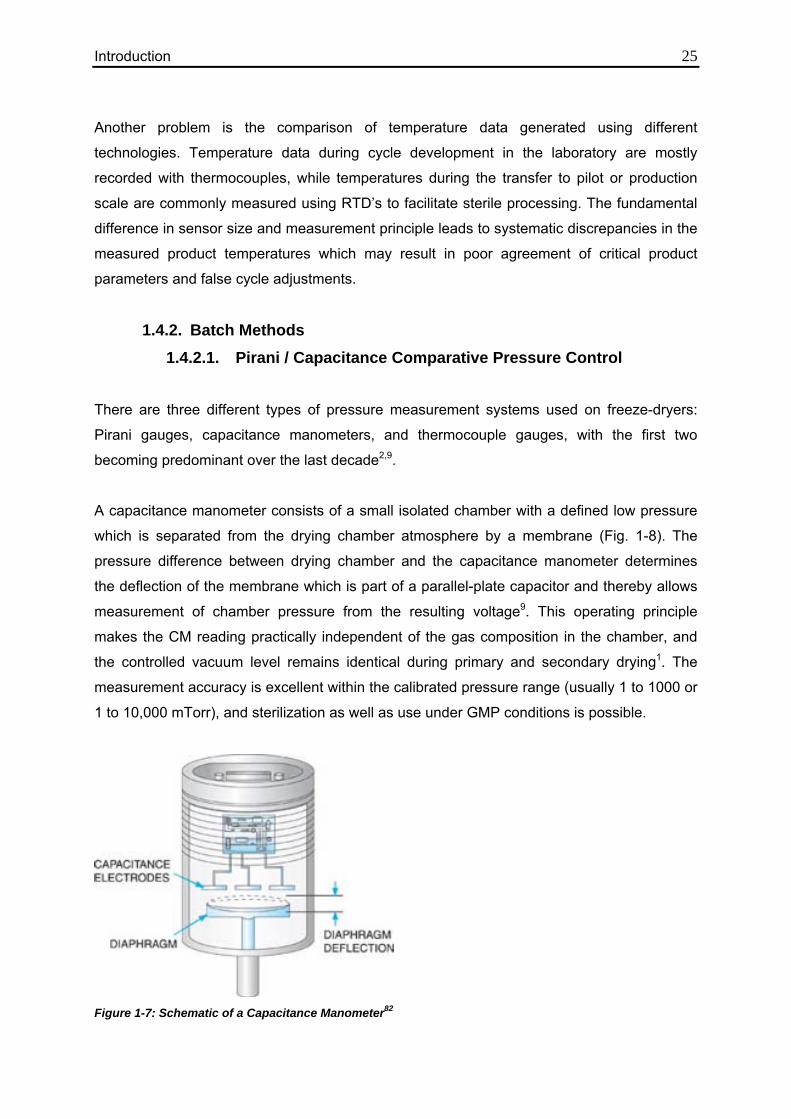
A capacitance manometer consists of a small isolated chamber with a defined low pressure
which is separated from the drying chamber atmosphere by a membrane (Fig. 1-8). The
pressure difference between drying chamber and the capacitance manometer determines
the deflection of the membrane which is part of a parallel-plate capacitor and thereby allows
measurement of chamber pressure from the resulting voltage9. This operating principle
makes the CM reading practically independent of the gas composition in the chamber, and
the controlled vacuum level remains identical during primary and secondary drying1. The
measurement accuracy is excellent within the calibrated pressure range (usually 1 to 1000 or
1 to 10,000 mTorr), and sterilization as well as use under GMP conditions is possible.
Figure 1-7: Schematic of a Capacitance Manometer82
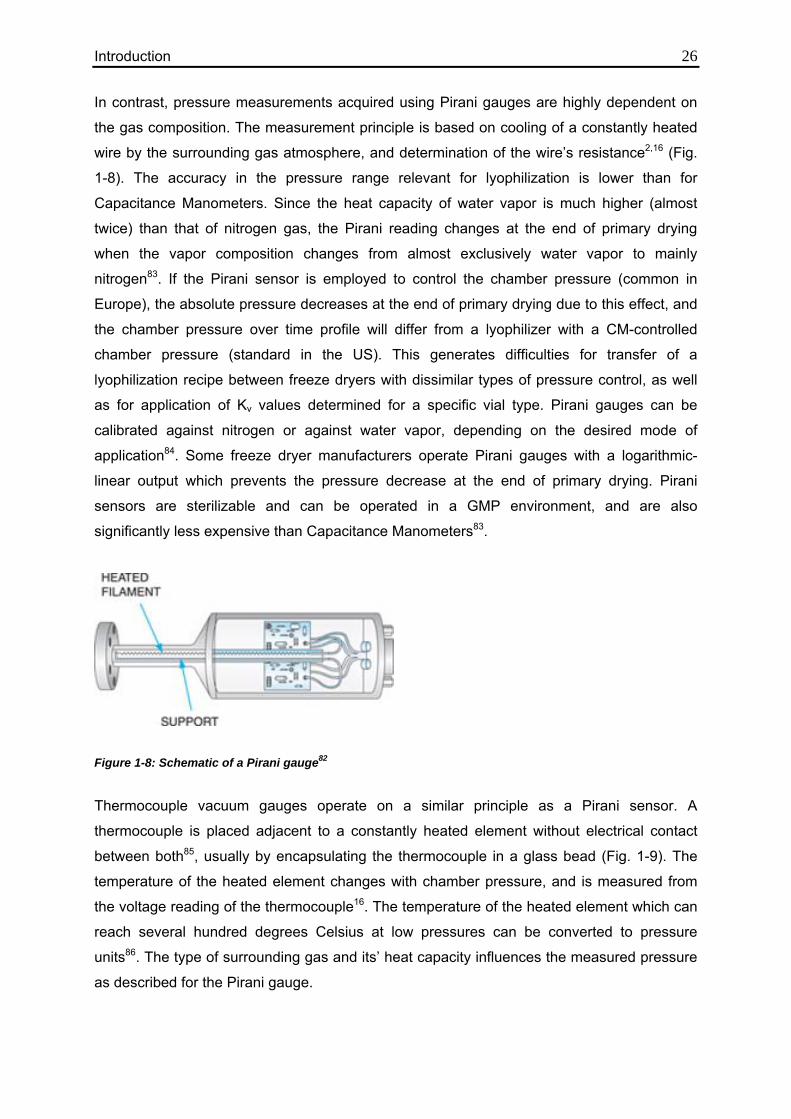
Introduction 26 In contrast, pressure measurements acquired using Pirani gauges are highly dependent on
the gas composition. The measurement principle is based on cooling of a constantly heated
wire by the surrounding gas atmosphere, and determination of the wire’s resistance2,16 (Fig.
1-8). The accuracy in the pressure range relevant for lyophilization is lower than for
Capacitance Manometers. Since the heat capacity of water vapor is much higher (almost
twice) than that of nitrogen gas, the Pirani reading changes at the end of primary drying
when the vapor composition changes from almost exclusively water vapor to mainly
nitrogen83. If the Pirani sensor is employed to control the chamber pressure (common in
Europe), the absolute pressure decreases at the end of primary drying due to this effect, and
the chamber pressure over time profile will differ from a lyophilizer with a CM-controlled
chamber pressure (standard in the US). This generates difficulties for transfer of a
lyophilization recipe between freeze dryers with dissimilar types of pressure control, as well
as for application of Kv values determined for a specific vial type. Pirani gauges can be
calibrated against nitrogen or against water vapor, depending on the desired mode of
application84. Some freeze dryer manufacturers operate Pirani gauges with a logarithmic-
linear output which prevents the pressure decrease at the end of primary drying. Pirani
sensors are sterilizable and can be operated in a GMP environment, and are also
significantly less expensive than Capacitance Manometers83.
Figure 1-8: Schematic of a Pirani gauge82
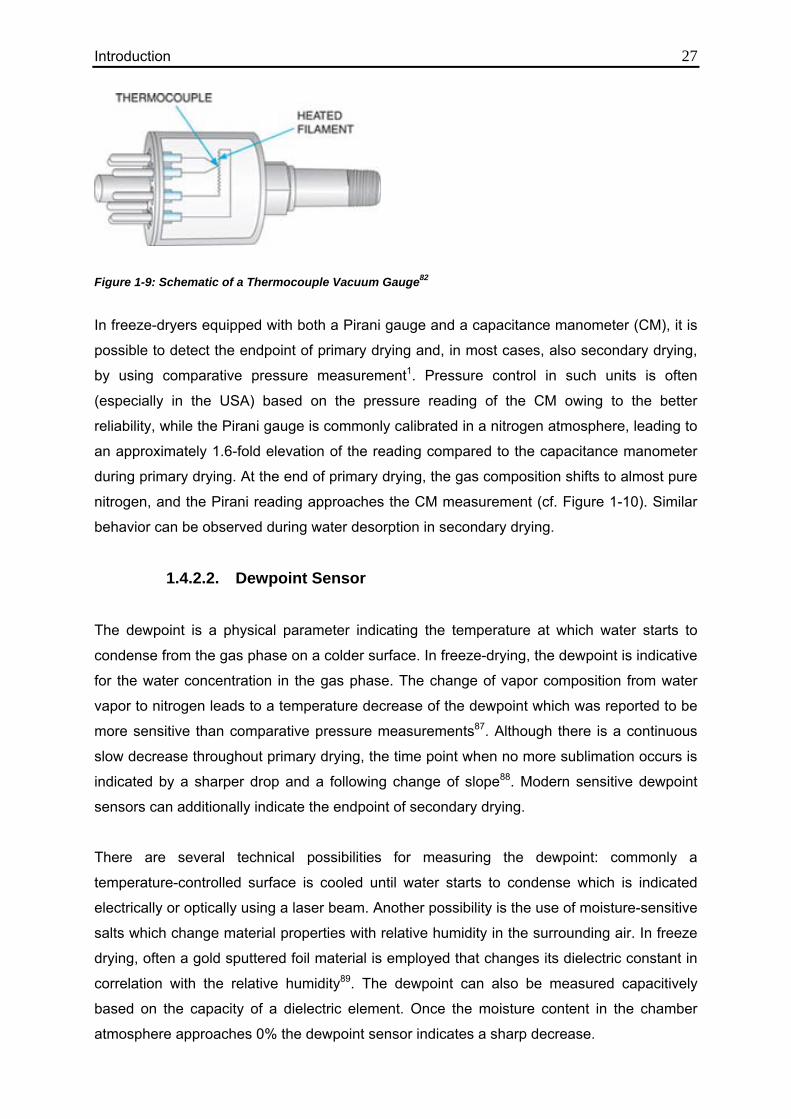
Thermocouple vacuum gauges operate on a similar principle as a Pirani sensor. A
thermocouple is placed adjacent to a constantly heated element without electrical contact
between both85, usually by encapsulating the thermocouple in a glass bead (Fig. 1-9). The
temperature of the heated element changes with chamber pressure, and is measured from
the voltage reading of the thermocouple16. The temperature of the heated element which can
reach several hundred degrees Celsius at low pressures can be converted to pressure
units86. The type of surrounding gas and its’ heat capacity influences the measured pressure
as described for the Pirani gauge.
Introduction 27
Figure 1-9: Schematic of a Thermocouple Vacuum Gauge82
In freeze-dryers equipped with both a Pirani gauge and a capacitance manometer (CM), it is
possible to detect the endpoint of primary drying and, in most cases, also secondary drying,
by using comparative pressure measurement1. Pressure control in such units is often
(especially in the USA) based on the pressure reading of the CM owing to the better
reliability, while the Pirani gauge is commonly calibrated in a nitrogen atmosphere, leading to
an approximately 1.6-fold elevation of the reading compared to the capacitance manometer
during primary drying. At the end of primary drying, the gas composition shifts to almost pure
nitrogen, and the Pirani reading approaches the CM measurement (cf. Figure 1-10). Similar
behavior can be observed during water desorption in secondary drying.
1.4.2.2. Dewpoint Sensor
The dewpoint is a physical parameter indicating the temperature at which water starts to
condense from the gas phase on a colder surface. In freeze-drying, the dewpoint is indicative
for the water concentration in the gas phase. The change of vapor composition from water
vapor to nitrogen leads to a temperature decrease of the dewpoint which was reported to be
more sensitive than comparative pressure measurements87. Although there is a continuous
slow decrease throughout primary drying, the time point when no more sublimation occurs is
indicated by a sharper drop and a following change of slope88. Modern sensitive dewpoint
sensors can additionally indicate the endpoint of secondary drying.
There are several technical possibilities for measuring the dewpoint: commonly a
temperature-controlled surface is cooled until water starts to condense which is indicated
electrically or optically using a laser beam. Another possibility is the use of moisture-sensitive
salts which change material properties with relative humidity in the surrounding air. In freeze
drying, often a gold sputtered foil material is employed that changes its dielectric constant in
correlation with the relative humidity89. The dewpoint can also be measured capacitively
based on the capacity of a dielectric element. Once the moisture content in the chamber
atmosphere approaches 0% the dewpoint sensor indicates a sharp decrease.
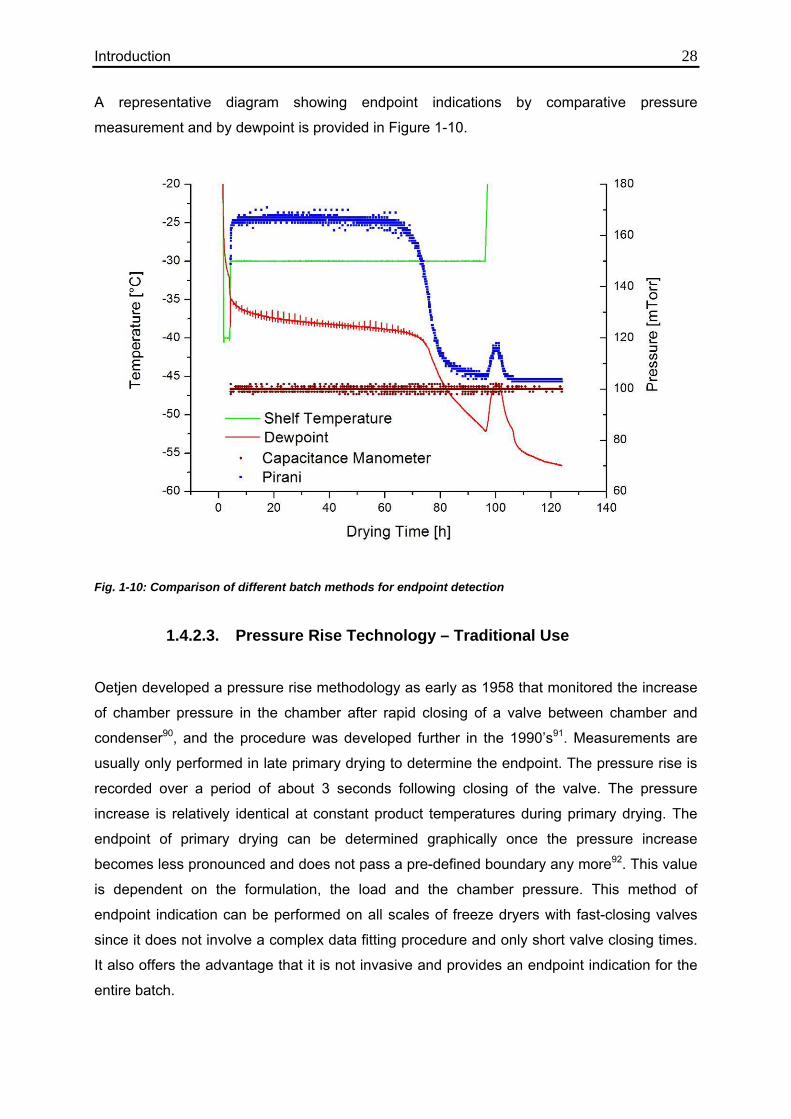
Introduction 28 A representative diagram showing endpoint indications by comparative pressure
measurement and by dewpoint is provided in Figure 1-10.
Fig. 1-10: Comparison of different batch methods for endpoint detection
1.4.2.3. Pressure Rise Technology – Traditional Use
Oetjen developed a pressure rise methodology as early as 1958 that monitored the increase
of chamber pressure in the chamber after rapid closing of a valve between chamber and
condenser90, and the procedure was developed further in the 1990’s91. Measurements are
usually only performed in late primary drying to determine the endpoint. The pressure rise is
recorded over a period of about 3 seconds following closing of the valve. The pressure
increase is relatively identical at constant product temperatures during primary drying. The
endpoint of primary drying can be determined graphically once the pressure increase
becomes less pronounced and does not pass a pre-defined boundary any more92. This value
is dependent on the formulation, the load and the chamber pressure. This method of
endpoint indication can be performed on all scales of freeze dryers with fast-closing valves
since it does not involve a complex data fitting procedure and only short valve closing times.
It also offers the advantage that it is not invasive and provides an endpoint indication for the
entire batch.
Introduction 29
1.4.2.4. Mass spectrometry
Mass spectrometry or Residual Gas Analysis (RGA) was first applied in lyophilization by
Jennings in 198093 for detection of pump oil and residual solvents in the chamber. Additional
studies in 1981 and 1993 described the potential of this technology for process endpoint
indications compared to other monitoring technologies94,95. Recently, a mass spectrometer
was directly connected to the drying chamber via a sterile filter to allow application in a sterile
environment, and the mass spectrum signal of water at 18 g/mol was monitored. Presser96
extensively demonstrated the application of RGA for endpoint detection of primary and
secondary drying by monitoring both water and nitrogen concentrations in the chamber
atmosphere. It was also possible to correlate the water concentration in the chamber during
secondary drying to the residual moisture for sucrose cakes and to detect differences for
various product loads. Mass spectrometry can also be employed for scale-up and transfer of
freeze-drying cycles as well as for process optimization. The application is limited by the lack
of data concerning mass flow rates or flow velocities.
Mass spectrometry can be applied for additional purposes relevant to lyophilization, such as
detection of extractables from stoppers or formulation components94, identification of leaks in
chamber or condenser, as well as checking for back diffusion of pump oil to the product
which may be detrimental for protein stability. This makes mass spectrometry a powerful
diagnostic tool for complicated issues observed during freeze drying cycles. Since only
concentrations can be measured, the additional value for process monitoring compared to
conventional and much less expensive methodologies is limited.
Introduction 30
1.5. Novel PAT for Freeze-Drying 1.5.1. Single Vial Approaches
1.5.1.1. TEMPRIS
The Temperature Remote Interrogation System (TEMPRIS) was recently introduced by IQ
Mobil Solutions, Germany, as a wireless and battery-free tool for measurement of product
temperatures in freeze-drying79,97. The TEMPRIS system consists of 8 to 16 sensors that are
introduced into the product solution and communicate with an interrogation unit via the
transmitter. Temperature is monitored in real-time and displayed and recorded on a
computer system. The original application of this wireless and passive measurement
technology was remote pressure measurement in car tires which is used in racing or
automotive testing. While the operation principle is relatively similar, the sensors had to be
substantially re-designed for application in freeze-drying. Main factors were reduction of
sensor size, use of sterilizable and FDA-compliant materials, and measurement accuracy.
Since freeze-drying is a very long process compared to racing with few sudden changes in
temperature, the focus is to obtain exact measurements with a reduced number of data
points.
The fundamentally new feature of the TEMPRIS sensors is the fact that they are operated
passively, i.e. do not require an active power supply such as a battery or a wire. The
operation principle is based on the temperature-dependence of the resonance of a quartz
crystal. The crystal is encased in a sterilizable cover consisting of a polymer or stainless
steel. The quartz is connected to the tip of the sensor through thermally conductive material,
and shows the same temperature as the environment of the sensor tip, i.e. ice or dried cake.
The software provides approximately 25 temperature measurements per minute that are
instantaneously available during the run, allowing early reactions to potential process
deviations and adaption of process parameters. The number of data points can also be
reduced and averaged in the CarLog software.
The TEMPRIS system was tested and evaluated within the scope of this work79,97. Based on
these results the system was optimized and recently introduced as a commercial product.
The performed experiments and results are discussed in section 3.6.
Introduction 31
1.5.1.2. TrackSense Pro
The TrackSense Pro sensors (Ellab Inc.) are invasive wireless sensors which are operated
actively using a battery. Temperature data are measured and transmitted on the ISM band to
a data collector in the freeze dryer. The sensors need to be activated prior to the run, and
have a reported accuracy of 0.05 K98. They are relatively large and measure average
temperatures over the fill depth, and introduce small amounts of heat to the product due to
the active principle of operation. The operation time depends on the life time of the battery
(up to 1000 hours). Additionally the recorded data is not available in real-time but is saved
using a data logger and can only be accessed following the run. Therefore no instantaneous
reactions to process deviations or adaptations of process conditions for cycle optimization
are possible.
1.5.1.3. Weighing Systems
A microbalance determines the loss of weight of a sample during freeze drying by
intermittent or continuous weighing. Since the actual sample weight might be low and weight
differences over time are typically rather small, the construction of a suitable balance is a
difficult task. Additional problems are the wide range of temperatures in freeze drying,
commonly between -50°C and +40°C, and the high vacuum required for sublimation.
Microbalances are exclusively used for research and development and cannot be applied for
monitoring of manufacturing cycles or under GMP conditions.
The first application of a microbalance for investigation of freeze drying behavior involved
isothermal drying of small samples (microliters) suspended from a balance arm in a high
vacuum cold stage. Pikal et al52 studied in 1983 sublimation rates and resistance behaviors
of different materials during freeze drying, classified four different classes of product
resistance behavior from the results and also obtained evaporation coefficients for ice which
were in good agreement with literature data. He also employed microbalance measurements
for investigation of the sublimation rate during secondary drying45 and the delineation of
drying kinetics and influencing factors. Additionally, he already used temperature
compensation by introducing a thermocouple into the microbalance.
Modern microbalances can be introduced into the freeze dryer and measure weight loss in
one vial during the usual freeze drying recipe. An example is the Christ microbalance (CWS-
4099) that weighs a single commercial vial (2R - 20R) product vial attached to a lifting arm at
specified time intervals during primary drying. One weighing step requires approximately 10
Introduction 32 seconds, and the data can be monitored online via a computer system. This system is
relatively robust to changes in vacuum and temperature due to an internal temperature
compensation mechanism. The endpoint of primary drying can be observed during
development cycles, but the mass loss during secondary drying cannot be reliably
quantified.96
Momentary sublimation rates as well as differences in drying rate due to variation of freezing
rates could be measured using a microbalance by Roth et al in 2001100 who also studied the
importance of temperature compensation and the impact of physical properties of the freeze
dried material. Presser96 found significant radiation effects from the balance to the
surrounding vials, thereby accelerating the drying process and mitigating the
representativeness for runs without a balance. This was mainly the case for cycles with a
high load. He also found a clear endpoint indication after primary drying, and saw good
potential for expedited process optimization in a small scale using the microbalance.
Gieseler89 employed microbalance measurements for evaluation of the effects of vial packing
density on drying rate and cycle time101, and also studied the impact of different materials102
on product resistance. He additionally measured heat transfer coefficients and conducted
experiments with spray freeze dried materials. These substances showed large differences
for both amorphous and crystalline excipients compared to the commonly observed drying
rate profile in freeze drying103. Barresi recently reported the construction of a balance system
that is capable of weighing up to 15 vials within the array at the same time and did not alter
heat transfer coefficients, according to the author104. This balance system was used in
combination with a pressure rise method and is discussed in chapter 1.5.2.1.3.
1.5.1.4. NIR Probes
The near-infrared (NIR) region of the electromagnetic spectrum is located at wave numbers
from 14000-4000 cm-1 (2.5–0.8 μm wave length). NIR spectroscopy exploits the fact that
molecules can be excited by IR radiation at specific frequencies, introducing molecular
vibrations at a higher energy level. For a compound to be IR-active, the vibrational mode in
the target molecules needs to lead to a change in the permanent dipole. Since the water
molecule is a permanent dipole it can easily be monitored using NIR technology. The
reduction of water absorption in the NIR spectra can also be used as an endpoint monitor (cf.
TDLAS). NIR spectroscopy has been successfully employed in the pharmaceutical sector
since the mid-1980’s105,106.

Introduction 33 Several studies have shown the applicability of NIR probes in freeze drying or for the
characterization of freeze dried materials107-109. In most cases the lyophilized cake was
measured directly non-invasively without additional sample preparation through the vial
bottom108,110. The measured spectrum is often transformed mathematically, and the moisture
content of the sample is estimated. Since NIR spectra are highly dependent on the
formulation, the method has to be adapted to the formulation including major calibration
efforts, and a correlation between moisture content and spectrum needs to be established.
Presser attached a NIR sensor adjacent to a vial to monitor the progress of secondary drying
by comparing the absorption spectra96. With this setup he was able to monitor the moisture
decrease during the secondary drying stage and directly target specific moisture contents. It
was also possible to show local differences of residual moisture content within the monitored
vial. The calculated moisture value was systematically too low, likely because the radiation
did not reach the innermost core of the cake111. Due to the relatively large size of the sensor
and the placement adjacent to the vial, the usual array needed to be changed, and the
monitored vial may be subjected to higher atypical radiation effects and heat introduction
from the NIR tip. The modified array also leads to a atypical drying behavior in the monitored
vial and reduced representativeness for the rest of the batch. This setup is mostly viable as a
development tool in laboratory scale freeze dryers and for troubleshooting during transfer to
pilot scale for optimization of the secondary drying step112. However, since use under GMP
conditions is not possible, such a setup cannot be applied for monitoring of production scale
lyophilization cycles.
A recent study employed NIR measurements from a probe placed adjacent to a vial in the
array throughout the drying phase. The data were evaluated in combination with Raman
measurements on a different vial in the same batch113. NIR data was more valuable for
determination of the primary drying endpoint as well as for monitoring of release of hydrate
water during storage114. NIR measurements also confirmed observations made by Raman
spectroscopy such as crystallization of ice and excipients as well as by solid state
characterization of the dried cake. This setup is an interesting approach since multifactorial
monitoring of process and product parameters is possible with non-invasive technology, at
least in the development stage. Since introduction of the sensors into the freeze-dryer
chamber and placement of the probe in a modified array (non-hexagonal packing of the
monitored vial) is required, this system would greatly interfere with operations on a larger
scale. Additionally, an implementation of the NIR sensor into a sterile GMP is currently not
available.

Introduction 34
1.5.1.5. Raman Probes
Raman is a spectroscopic method similar to IR spectroscopy, but yielding complementary
results. Various vibrational and rotational modes in molecules can be studied by inelastic
scattering of monochromatic light from a laser beam, resulting in a shift of the energy level of
the photons in the beam. Photons are absorbed by the molecule, exciting electrons to higher
energy levels which then relax to an excited vibrational state. The molecular polarization
potential needs to change during this reaction for a molecule to be Raman active. The
intensity of the Raman scattering depends on the polarizability change.
The use of Raman spectroscopy for monitoring of pharmaceutical processes has been
demonstrated, for example in tablet coating115,116. In freeze drying, Raman spectra could be
employed to indicate critical product and process aspects, such as water to ice conversion,
product crystallization, annealing steps and solid state characteristics of end products113,117.
Several studies involved Raman sensors for monitoring of lyophilization cycles. The probe
was mostly positioned non-invasively on top of one vial over the cake113,114 while maintaining
the hexagonal packing of the array. Typical measurement times were on the order of 30
seconds per measurements, thereby providing several thousand data sets during one run.
These extensive results were then analyzed using Principal Component Analysis
(PCA)118,119. PCA results are commonly displayed in two-dimensional diagrams that allow
monitoring of phase transformations over time which can be used for optimization of process
conditions e.g. during freezing or annealing steps.
De Beer et al113 investigated in 2009 changes in the physical solid state of mannitol during
the process and several critical process step endpoints, such as excipient crystallization
during freezing and primary drying and the endpoint of primary drying. Water and ice
produce very weak signals in Raman spectra114, therefore NIR proved to be a more sensitive
tool for monitoring of sublimation and endpoint detection of primary drying. Both systems
supply complementary data which can be used either in combination after data merging, or
separately to mutually confirm observations based on the independency of the two
measurement principles. The combination of NIR and Raman measurements is a valuable
tool for supportive information during process development and optimization of complex
formulations.
Introduction 35
1.5.2. Batch Methods 1.5.2.1. Innovative Pressure Rise Concepts
1.5.2.1.1. Manometric Temperature Measurement and SMARTTM Freeze Dryer
Manometric Temperature Measurement (MTM) is a sophisticated process analytical
technology which performs pressure rise experiments at defined time intervals (typically 60
minutes, not instantaneous) and fits the recorded data during a closing interval of 25 seconds
to the MTM equation that includes all important factors contributing to the pressure increase
and allows determination of several critical product and process parameters. MTM is based
on a model first published by Milton et al120 in 1997 and further improved by Tang81,121,122 in
2006. His experiments in combination with the expert algorithm led to the development of the
SMARTTM Freeze Dryer concept30 which became a commercial product in 2006.
The pressure increase after closing the valve is influenced by several factors (Fig. 1-11). The
initial increase during the first 5 seconds of the measurement constituting the major
increment is due to continuing sublimation from the vials until the equilibrium vapor pressure
is reached, and controlled by the product resistance. The slower increase from about 5 to 25
seconds can be divided into two mechanisms: relatively fast temperature equilibration across
the ice layer leading to temperature increase at the sublimation front, and continuous heating
of ice by the shelves since less heat is removed via sublimation which leads to a constant
pressure increase. Another part of the linear contribution is air leaks into the chamber.
However, the leak rate specification for freeze-dryers equipped with MTM systems is less
than 30 mTorr/h, so the contribution from air leaks is negligible during primary drying.
An exemplary pressure rise and the various contributing factors are shown in Fig. 1-11.
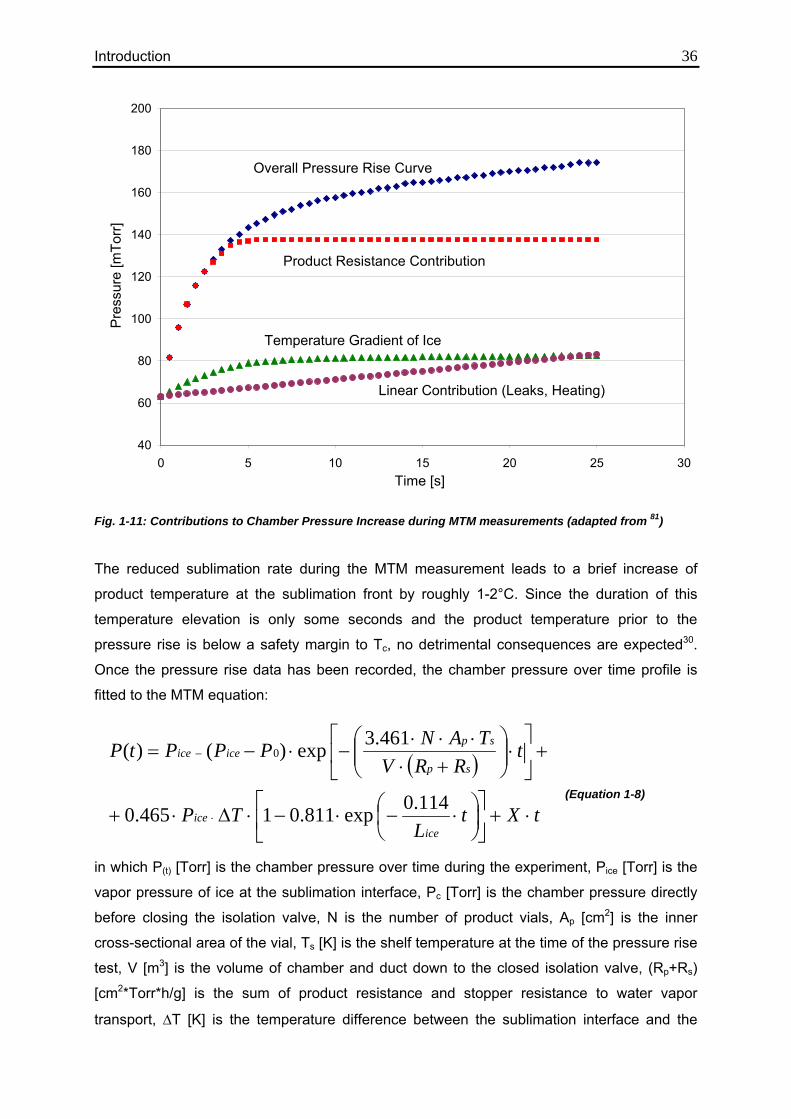
Introduction 36
40
60
80
100
120
140
160
180
200
0 5 10 15 20 25 30Time [s]
Pre
ssur
e [m
Torr]
Overall Pressure Rise Curve
Product Resistance Contribution
Temperature Gradient of Ice
Linear Contribution (Leaks, Heating)
Fig. 1-11: Contributions to Chamber Pressure Increase during MTM measurements (adapted from 81)
The reduced sublimation rate during the MTM measurement leads to a brief increase of
product temperature at the sublimation front by roughly 1-2°C. Since the duration of this
temperature elevation is only some seconds and the product temperature prior to the
pressure rise is below a safety margin to Tc, no detrimental consequences are expected30.
Once the pressure rise data has been recorded, the chamber pressure over time profile is
fitted to the MTM equation:
(Equation 1-8)
in which P(t) [Torr] is the chamber pressure over time during the experiment, Pice [Torr] is the
vapor pressure of ice at the sublimation interface, Pc [Torr] is the chamber pressure directly
before closing the isolation valve, N is the number of product vials, Ap [cm2] is the inner
cross-sectional area of the vial, Ts [K] is the shelf temperature at the time of the pressure rise
test, V [m3] is the volume of chamber and duct down to the closed isolation valve, (Rp+Rs)
[cm2*Torr*h/g] is the sum of product resistance and stopper resistance to water vapor
transport, ΔT [K] is the temperature difference between the sublimation interface and the
( )
tXtL
TP
tRRV
TANPPPtP
iceice
sp
spiceice
⋅+⎥⎦
⎤⎢⎣
⎡⎟⎠⎞
⎜⎝⎛ ⋅−⋅−⋅Δ⋅+
+⎥⎦
⎤⎢⎣
⎡⋅⎟⎟⎠
⎞⎜⎜⎝
⎛+⋅
⋅⋅⋅−⋅−=
⋅
−
114.0 exp811.01465.0
461.3 exp)()( 0
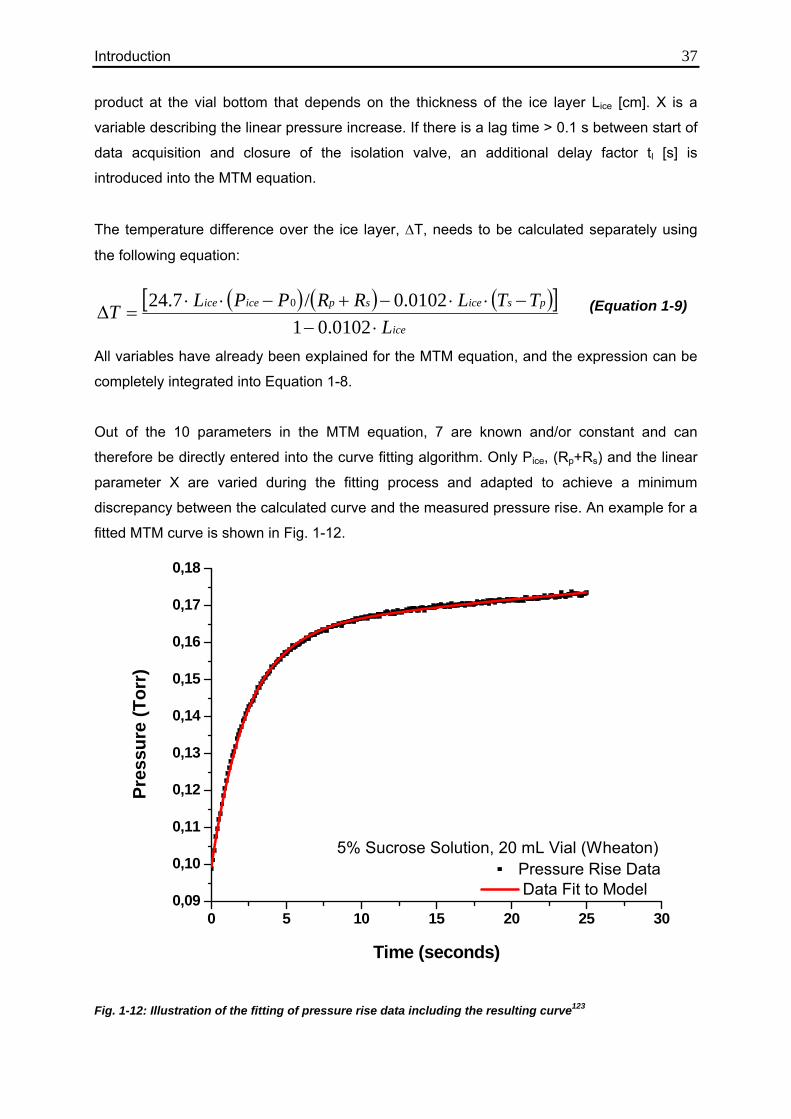
Introduction 37 product at the vial bottom that depends on the thickness of the ice layer Lice [cm]. X is a
variable describing the linear pressure increase. If there is a lag time > 0.1 s between start of
data acquisition and closure of the isolation valve, an additional delay factor tl [s] is
introduced into the MTM equation.
The temperature difference over the ice layer, ΔT, needs to be calculated separately using
the following equation:
(Equation 1-9)
All variables have already been explained for the MTM equation, and the expression can be
completely integrated into Equation 1-8.
Out of the 10 parameters in the MTM equation, 7 are known and/or constant and can
therefore be directly entered into the curve fitting algorithm. Only Pice, (Rp+Rs) and the linear
parameter X are varied during the fitting process and adapted to achieve a minimum
discrepancy between the calculated curve and the measured pressure rise. An example for a
fitted MTM curve is shown in Fig. 1-12.
Fig. 1-12: Illustration of the fitting of pressure rise data including the resulting curve123
( ) ( ) ( )[ ]ice
psicespiceice
LTTLRRPPLT
⋅−−⋅⋅−+−⋅⋅
=Δ0102.01
0102.0/7.24 0
0 5 10 15 20 25 300,09
0,10
0,11
0,12
0,13
0,14
0,15
0,16
0,17
0,18
Pressure Rise Data Data Fit to Model
Pres
sure
(Tor
r)
Time (seconds)
5% Sucrose Solution, 20 mL Vial (Wheaton)
Introduction 38 As stated earlier, the product temperature at the sublimation front is directly related to the
vapor pressure of ice. From the results of the fitting procedure, Tp can be calculated by a re-
arrangement of equation 1-481:
(Equation 1-10)
Using equation 1-9, it is also possible to account for the temperature gradient over the ice
layer and calculate the temperature at the bottom of the vial. This value is important for
comparisons to data from thermocouples which typically measure temperatures at the vial
bottom. Basic steady state heat and mass transfer equations make calculation of additional
parameters possible.
If the mass flow rate is integrated between the measurements, the amount of water that has
been removed from the product as well as the remaining primary drying time can be
estimated. Additional derivative parameters that can be calculated are the vial heat transfer
coefficient Kv, and the heat transmitted to the product, dQ/dt.
One limitation of MTM is the fact that the vapor pressure in the coldest vials is the lowest, so
the pressure during MTM measurements only increases up to this level81. From there on
additional water vapor sublimed from warmer edge vials re-condenses in the colder vials. If
substantial heterogeneity is present within the batch, this will lead to a significant bias in
product temperature and most other parameters in favor of the coldest vials81, and may also
affect the integrated mass flow values.
MTM measurements only yield correct results until approximately two thirds of the total
amount of ice has been removed74. After about 2/3rds the first vials finish primary drying
(typically the edge vials due to edge effects) which, in turn, changes the parameter N
(number of vials) and therefore the assumption of the total ice sublimation interface (N*Ap).
However, Pice data are still valuable beyond this point as they serve as an endpoint indication
for primary drying. Once the calculated Pice approaches the chamber pressure (i.e.
decreases below a pre-defined boundary), it can be assumed that all ice has been removed
from the vials, and secondary drying can be initiated30. In contrast, Rp data and all derivative
calculated parameters cannot be used as a quantitative measure after two thirds of the ice
has been removed.
MTM technology also allows calculation of desorption rates during secondary drying which
can be integrated to monitor the reduction of residual moisture124. The extent of pressure rise
is considerably lower than during primary drying, and the pressure rise curve follows a linear
01849.24)ln(96.6144
−−
=ice
p PT
Introduction 39 relationship. This makes calculation of the desorption rate and of the mass of water removed
between two measurement points relatively easy using equations 1-11 and 1-12 derived from
the ideal gas law30,124:
(Equation 1-11)
(Equation 1-12)
where P is the partial pressure of water [Torr] in the chamber with a volume V [L], M is the
molecular weight of water [g/mol], R is the gas constant (J*K-1*kmol-1), T is the water vapor
temperature [K], Δwi is the mass of water removed during the time interval [g] and Δti is the
time interval between measurements [h].
For targeting of intermediate moisture contents, a sample needs to be extracted at the end of
primary drying as an anchorpoint. From this value the integrated mass of water calculated
from MTM measurements can be subtracted, and the process can be stopped once the
desired moisture content is obtained.
MTM measurement technology is combined with optimization algorithms in the SMARTTM
Freeze-Dryer, available commercially from SP Industries on a Lyostar II platform. Once all
necessary input parameters have been determined and entered, the lyophilizer develops a
freeze-drying recipe and optimizes it within one run based on feedback from pressure rise
experiments30. The most important input parameter is the critical formulation temperature, i.e.
Tc or Tg’, that must not be exceeded during the primary drying step.
MTM has been used for the investigation of heat and mass transfer parameters during
primary drying121. Rambhatla et al. studied the influence of the degree of supercooling on the
product resistance using ice fog technique during lyophilization runs27, and also used MTM
Rp-data to evaluate various factors relevant for cake shrinkage21. Gieseler et al.74 presented
their experiences with the SMARTTM freeze dryer in 2007, showing reliability and robustness
of the method as well as limitations regarding batch heterogeneity and high content of
amorphous solutes.
Further experimental data and practical applications which focused on evaluation of the MTM
product resistance measurements as a critical product parameter and their application for
indication of internal structural changes are discussed later in this thesis.
dtdP
TRVMdtdw ⋅⋅⋅
=/
ii tdtdww Δ=Δ
Introduction 40 An additional approach for the analysis of pressure rise data is the Pressure Rise Analysis
(PRA) Model proposed by Obert and Chouvenc125, which includes calculation of product
temperature, resistance of the dried cake layer and heat transfer coefficients as MTM.
However, the way of calculating these parameters from pressure rise measurements is
fundamentally different from MTM methodology. The method is based on heat and mass flux
balance equations and includes all contributions to the pressure rise discussed in the MTM
section. This is reflected in a complicated four-term equation which not only includes most
parameters in the MTM equation but also takes desorption of moisture from the dried cake
matrix and accumulation on the glass wall of the vial into account. An addition to the original
method also compensated delays in the pressure rise due to slower closing of the isolation
valve126 and included calculation of Rp data127.
1.5.2.1.2. Thermodynamic Lyophilization Control (TLC)
TLC is based on the pressure rise analytic method developed by Oetjen (cf. 1.4.2.3) and a
commercial product offered by GEA Lyophilizers. In contrast to the SMARTTM freeze dryer
and MTM technology it does not fit pressure rise data to determine product temperature and
product resistance data. Instead, several other parameters are used for optimization of the
lyophilization cycle based on a derivation of the pressure rise profile. The freezing step time
is controlled depending on the energy consumption required for freezing of the product,
calculated from the temperature difference between shelf inlet and outlet temperatures.
During primary drying, the main control variable is the operating pressure which is adjusted
to obtain the desired temperature at the sublimation interface while keeping the shelf
temperature constant. It is not possible to determine product resistance or mass flow.
As mentioned in the heat transfer section, the vapor pressure of ice depends directly on the
ice temperature. The pressure rise shows a plateau behavior within the measurement time if
either a high load or aggressive cycle conditions are employed. In this case, estimation of the
product temperature at the sublimation interface is possible91. The calculation includes
adaptation to the chamber volume, load conditions and correction for leak rate. Shortly
before the endpoint of primary drying, the sublimation rate decreases substantially, and the
calculated temperature decreases which serves as an indication of the approaching
endpoint. The calculated temperature can also be used as a feedback for automatic
adaptation of the cycle conditions to optimize the process time.
Pressure rise measurements with a valve closing time of only 3 seconds are performed at
frequent intervals (15 to 20 min) and evaluated using Barometric Temperature
Introduction 41 Measurement128. Essentially, only the pressure in the chamber after 3 seconds is measured
and (after subtraction of leak rate) employed as the vapor pressure of ice. This approach
allows direct calculation of the product temperature at the sublimation interface. Depending
on the load conditions the plateau phase of the pressure rise is commonly not reached within
3 seconds which is a limiting factor for the methodology. Once the calculated product
temperature starts to decrease correlated with a lower amount of pressure increase,
secondary drying is initiated. The secondary drying step is also analyzed with pressure rise
experiments to estimate desorption rate and the amount of desorbable water at a given
product temperature.
TLC is a relatively simple system for analysis of pressure rise data on freeze dryers of
different scales. The derived data are not as extensive and multivariate as for the MTM
procedure, but the current application range is larger and allows estimation of the most
critical product parameter, the temperature at the sublimation front. Also the process can be
adapted to shorten drying time, although less process steps are optimized than using the
SMARTTM freeze dryer system, and possibilities for variation of chamber pressure while
maintaining constant shelf temperature is limited depending on the pre-selected shelf
temperature.
1.5.2.1.3. Dynamic Parameters Estimation (DPE) Model
Several recent studies by Barresi and co-workers suggested a new non-steady state model
for the interpretation of pressure rise data that is claimed to be more accurate in the late
stage of primary drying129. It is a combination of pressure rise experiments with so-called
“soft observers”, i.e. a micro-balance which weighs a group of vials, and thermocouples
which are attached on the outside of a vial (“smart vial”). This way the observations of both
batch and single vial measurements are combined and employed for cycle optimization. The
goal of this approach is to develop a cycle based on pressure rise measurements and still
obtain data during the process steps where pressure rise measurements are not reliable or
possible.
The DPE algorithm is based on a non-linear regression method which determines the best
fitting between the pressure rise data observed in the experiment and a simulated set of
pressure rise data. Either 2 or 3 parameters are varied during the fitting procedure, and the
results are used for a re-iterative approach that involves adaption of several derivative
parameters that need to be guessed initially. The model provides product temperatures as
Introduction 42 well as product resistance data and Kv values. Also the thickness of the frozen layer is
calculated from the mass removed.
The fitting procedure yields, according to the vendor, accurate results for resistance and
temperature over a longer interval than is the case for MTM data, but also show the typical
decrease of product temperature and elevation of product resistance at the end of primary
drying which is not indicative for the actual conditions130. The DPE model offers some
compensation for the reducing product area by adapting the calculated product temperature
and the heat transfer coefficient129. The model also provides ice temperatures at different
positions in the vial during the pressure rise experiment. Like all pressure rise models, it
relies on relatively low heterogeneity and radiation effects within the batch. The version
currently commercially available is not yet able to indicate the end point of primary drying, but
relies on comparative pressure measurement.
The DPE methodology has recently been installed in a Telstar freeze dryer (Lyobeta 35,
2009) as part of a complex control and optimization system, the LyoDriver130,131. The
information from pressure rise measurements and other technologies is used to adapt shelf
temperature during primary drying. The Lyodriver additionally anticipates the temperature
increase during the pressure rise experiment and attempts to keep the product temperature
below the critical temperature during the closure time.
1.5.2.2. Spectroscopy-Based Methods 1.5.2.2.1. Tunable Diode Laser Absorption Spectroscopy (TDLAS)
Tunable Diode Laser Absorption Spectroscopy (TDLAS) is a spectroscopic method which
allows detection and quantification of trace concentrations of a gas or gas component. The
measurement is based on absorption of electromagnetic energy by gas molecules at a
specific wavelength in the electromagnetic spectrum (“absorption line”)132. The intensity of a
near infrared (NIR) diode laser beam is transmitted through a sample containing the target
gas at the absorption wavelength. The intensity of the transmitted beam is reduced according
to the Beer-Lambert relation133:
(Equation 1-13)
where 0,νI is the input intensity, νI is the transmitted intensity after traversing the pathlength
L, ν is the laser frequency, S(T) is the temperature-dependent absorption linestrength, N is the
gas concentration of target molecules, and g(ν) is the spectral line shape function which
])()(exp[0, NLgTSII ννν −=
Introduction 43 describes the frequency dependency of the absorption strength. Using the measured
transmission intensity, the number of target gas molecules in the sample can be directly
calculated. The laser wavelength can be tuned through a narrow wavelength range (“band”,
~5 nm in the near infrared spectral region) very rapidly by varying the voltage, and is capable
of measuring multiple spectra per second in the area of the absorption peak which can be
averaged to provide more reliable data. A great advantage of TDLAS technology is the high
sensitivity for the target molecule, the measurement specificity, and the exact concentration
measurements134.
Traditional application of TDLAS technology is focused on measurement of gas
concentrations in the atmosphere and in the chemical industry. Some examples are leak
detectors for natural gas pipelines and process control in petrochemical manufacturing to
measure concentrations of methane, ethane and other gas components135. Fried et al.
described a TDLAS-based system in 1999 that was installed in an aircraft and measured
concentration of formaldehyde136. D’Amato used a TDLAS system for monitoring of HCl
concentrations in chemical processing and industrial emissions137. Röpcke et al recently
reported a TDLAS method to monitor concentrations of various organic molecules in cold
plasma138. TDLAS technology has also been used for monitoring organic solvent
concentrations such as hydrogen peroxide, acetone, methanol or isopropanol in
pharmaceutical equipment. Riris et al. applied a TDLAS system for measuring oxygen, water
and carbon dioxide and also reported the sensitivity for ten additional molecules118. An
additional overview is given in by Werle where detection limits for ammonia, formic acid,
ozone and other molecules are provided139,140. Use of TDLAS technology in the
pharmaceutical field was first reported by Wyeth for monitoring of coating processes141. The
aforementioned applications generally only determine the concentration of the gas
component in question, without information about velocity and mass flow.
TDLAS has been available for monitoring of freeze-drying cycles for several years. The
optical pathway is installed within the spool piece connecting chamber and condenser
(Figure 1-13)142. A diode laser beam is launched through a coated window in the spool piece
wall at a certain angle to the direction of vapor flow, usually 45°, and detected on the
opposite side of the spool piece by a detector.
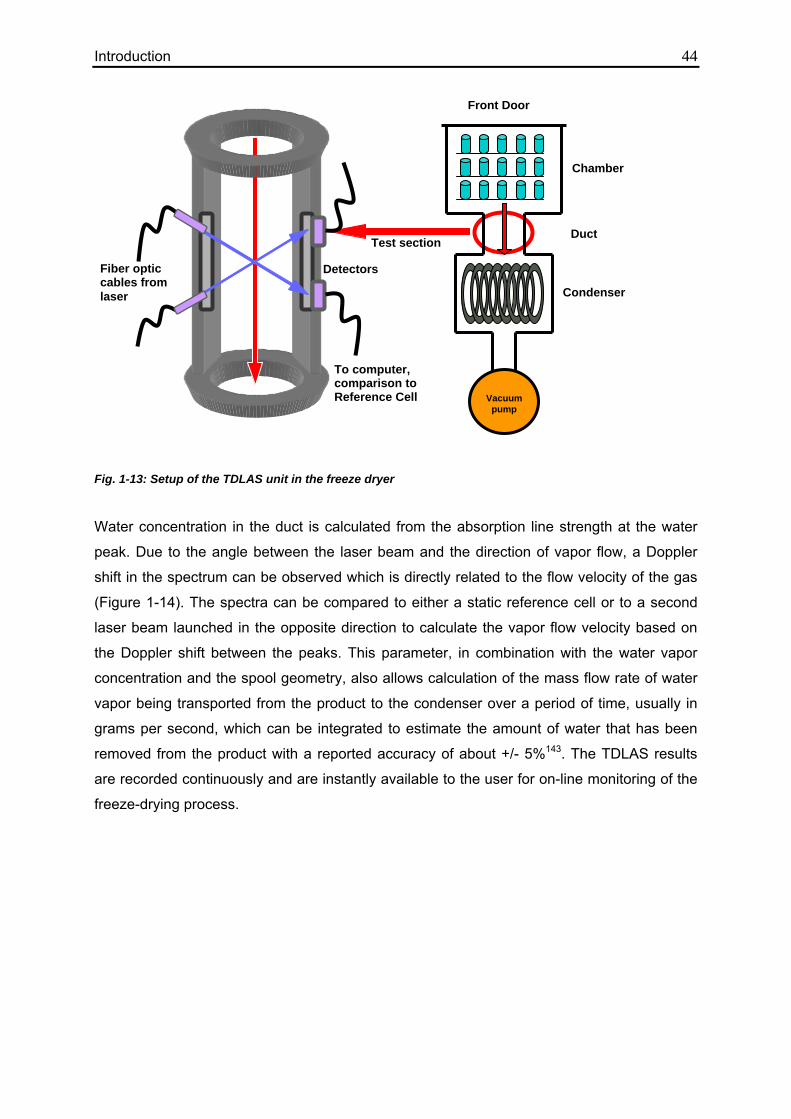
Introduction 44
Fig. 1-13: Setup of the TDLAS unit in the freeze dryer
Water concentration in the duct is calculated from the absorption line strength at the water
peak. Due to the angle between the laser beam and the direction of vapor flow, a Doppler
shift in the spectrum can be observed which is directly related to the flow velocity of the gas
(Figure 1-14). The spectra can be compared to either a static reference cell or to a second
laser beam launched in the opposite direction to calculate the vapor flow velocity based on
the Doppler shift between the peaks. This parameter, in combination with the water vapor
concentration and the spool geometry, also allows calculation of the mass flow rate of water
vapor being transported from the product to the condenser over a period of time, usually in
grams per second, which can be integrated to estimate the amount of water that has been
removed from the product with a reported accuracy of about +/- 5%143. The TDLAS results
are recorded continuously and are instantly available to the user for on-line monitoring of the
freeze-drying process.
Test section
Fiber optic cables from laser
Detectors
To computer, comparison to Reference Cell
Vacuum
pump
Chamber
Condenser
Duct
Front Door
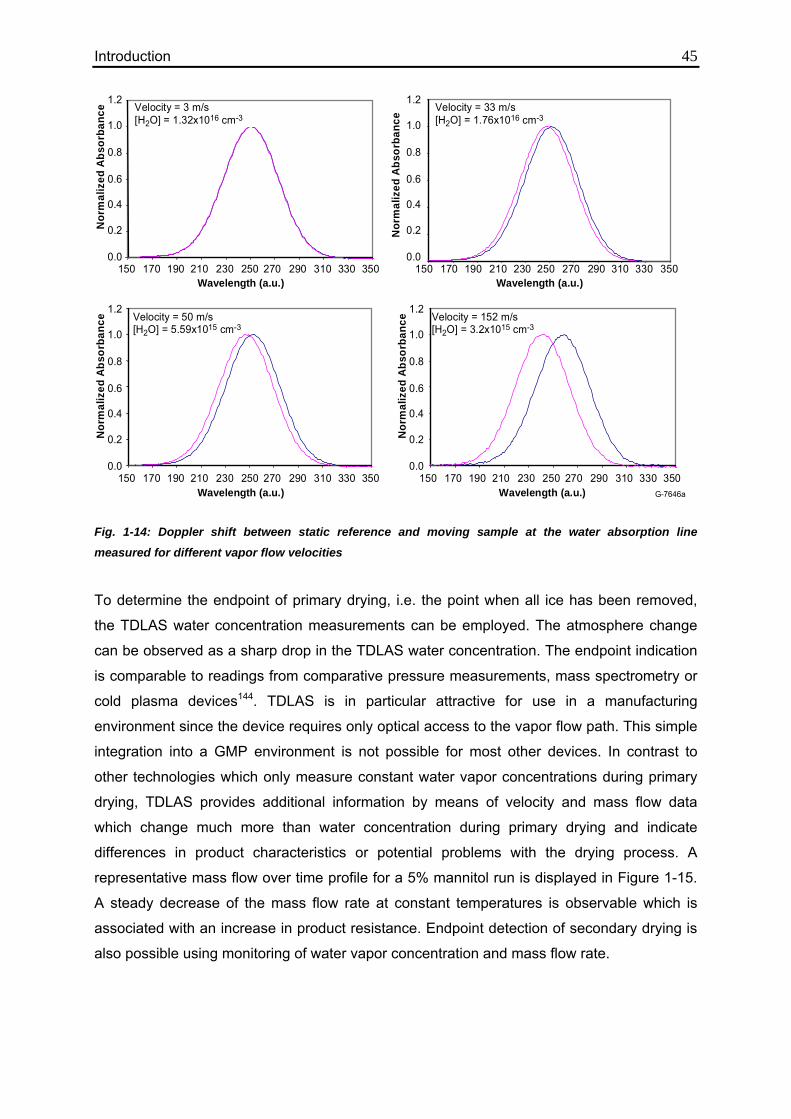
Introduction 45
Fig. 1-14: Doppler shift between static reference and moving sample at the water absorption line
measured for different vapor flow velocities
To determine the endpoint of primary drying, i.e. the point when all ice has been removed,
the TDLAS water concentration measurements can be employed. The atmosphere change
can be observed as a sharp drop in the TDLAS water concentration. The endpoint indication
is comparable to readings from comparative pressure measurements, mass spectrometry or
cold plasma devices144. TDLAS is in particular attractive for use in a manufacturing
environment since the device requires only optical access to the vapor flow path. This simple
integration into a GMP environment is not possible for most other devices. In contrast to
other technologies which only measure constant water vapor concentrations during primary
drying, TDLAS provides additional information by means of velocity and mass flow data
which change much more than water concentration during primary drying and indicate
differences in product characteristics or potential problems with the drying process. A
representative mass flow over time profile for a 5% mannitol run is displayed in Figure 1-15.
A steady decrease of the mass flow rate at constant temperatures is observable which is
associated with an increase in product resistance. Endpoint detection of secondary drying is
also possible using monitoring of water vapor concentration and mass flow rate.
0.0
0.2
0.4
0.6
0.8
1.0
1.2
150 170 190 210 230 250 270 290 310 330 350Wavelength (a.u.)
Velocity = 3 m/s[H2O] = 1.32x1016 cm-3
0.0
0.2
0.4
0.6
0.8
1.0
1.2
150 170 190 210 230 250 270 290 310 330 350Wavelength (a.u.)
Nor
mal
ized
Abs
orba
nce
Nor
mal
ized
Abs
orba
nce Velocity = 33 m/s
[H2O] = 1.76x1016 cm-3
0.0
0.2
0.4
0.6
0.8
1.0
1.2
150 170 190 210 230 250 270 290 310 330 350Wavelength (a.u.)
Nor
mal
ized
Abs
orba
nce
0.0
0.2
0.4
0.6
0.8
1.0
1.2
150 170 190 210 230 250 270 290 310 330 350Wavelength (a.u.)
Nor
mal
ized
Abs
orba
nceVelocity = 50 m/s
[H2O] = 5.59x1015 cm-3Velocity = 152 m/s[H2O] = 3.2x1015 cm-3
G-7646a
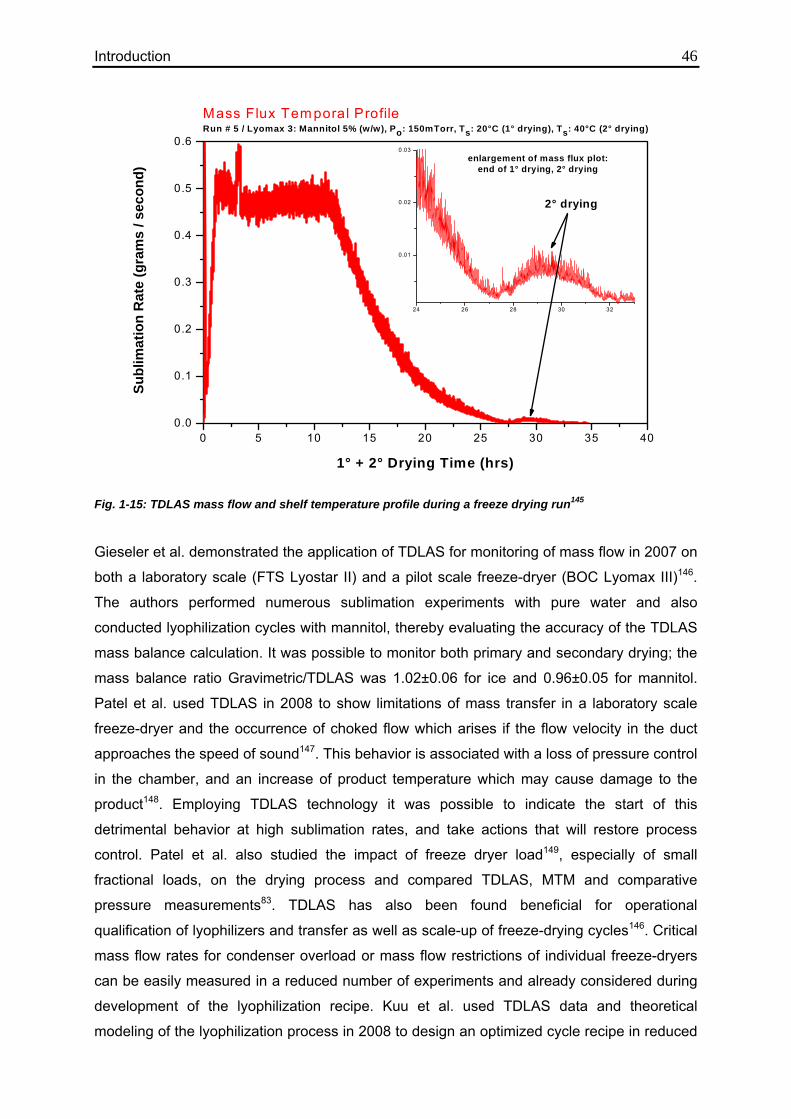
Introduction 46
Fig. 1-15: TDLAS mass flow and shelf temperature profile during a freeze drying run145
Gieseler et al. demonstrated the application of TDLAS for monitoring of mass flow in 2007 on
both a laboratory scale (FTS Lyostar II) and a pilot scale freeze-dryer (BOC Lyomax III)146.
The authors performed numerous sublimation experiments with pure water and also
conducted lyophilization cycles with mannitol, thereby evaluating the accuracy of the TDLAS
mass balance calculation. It was possible to monitor both primary and secondary drying; the
mass balance ratio Gravimetric/TDLAS was 1.02±0.06 for ice and 0.96±0.05 for mannitol.
Patel et al. used TDLAS in 2008 to show limitations of mass transfer in a laboratory scale
freeze-dryer and the occurrence of choked flow which arises if the flow velocity in the duct
approaches the speed of sound147. This behavior is associated with a loss of pressure control
in the chamber, and an increase of product temperature which may cause damage to the
product148. Employing TDLAS technology it was possible to indicate the start of this
detrimental behavior at high sublimation rates, and take actions that will restore process
control. Patel et al. also studied the impact of freeze dryer load149, especially of small
fractional loads, on the drying process and compared TDLAS, MTM and comparative
pressure measurements83. TDLAS has also been found beneficial for operational
qualification of lyophilizers and transfer as well as scale-up of freeze-drying cycles146. Critical
mass flow rates for condenser overload or mass flow restrictions of individual freeze-dryers
can be easily measured in a reduced number of experiments and already considered during
development of the lyophilization recipe. Kuu et al. used TDLAS data and theoretical
modeling of the lyophilization process in 2008 to design an optimized cycle recipe in reduced
0 5 10 15 20 25 30 35 400.0
0.1
0.2
0.3
0.4
0.5
0.6
24 26 28 30 32
0.01
0.02
0.03
Mass Flux Tem poral ProfileRun # 5 / Lyomax 3: Mannitol 5% (w/w), Po: 150mTorr, Ts: 20°C (1° drying), Ts: 40°C (2° drying)
Subl
imat
ion
Rat
e (g
ram
s / s
econ
d)
1° + 2° Drying Time (hrs)
enlargement of mass flux plot:end of 1° drying, 2° drying
2° drying
Introduction 47 time in connection with a cascading shelf temperature method150. In cycle transfer, shelf
temperature and chamber pressure can be characterized and adjusted to produce identical
mass flow profiles and thereby imitate the drying conditions151. This approach saves both
time and valuable API, thereby facilitating the transfer or scale-up process.
The vial heat transfer coefficient is an important parameter to describe the transport of heat
to the product as a function of chamber pressure, as was discussed in chapter 1.2.3.5. Kv
values are conventionally determined in a series of sublimation experiments with pure ice at
different chamber pressure, measuring the amount of ice removed by weighing. Kuu et al.
employed TDLAS measurements in 2009 to determine vial heat transfer coefficients at
various pressures during one single sublimation experiment55. In combination with computer
simulation and a reiterative algorithm, Kv values and separation distances 142 were calculated
for several vial types and showed mostly good agreement with previously measured data.
The authors were also able to delineate the pressure-independent contributions to heat
transfer, radiation and direct conduction (Kcs), from the total vial heat transfer coefficient.
1.5.2.2.2. Lyotrack
The Lyotrack humidity sensor was introduced by Adixen in 2007 for monitoring of
Lyophilization. The system employs a cold plasma source to determine the ratio of water
vapor to nitrogen gas in the drying chamber at pressures ranging from 4 to 400 mTorr. The
manufacturer suggests installation of the Lyotrack in the spool piece between chamber and
condenser to prevent introduction of radicals produced during the measurement into the
product. However, most freeze dryers do not have the required ports on the duct, making
attachment of the sensor at the top of the freeze dryer necessary. Mayeresse et al tested the
Lyotrack system in comparison to thermocouples, comparative pressure measurement, a
dewpoint sensor and a microbalance, and observed comparable endpoint indications for the
plasma device as for the other systems152. It was also possible to observe changes in the
gas composition during secondary drying. A major advantage of the Lyotrack sensor is the
fact that it can be easily calibrated against a reference system, and readily implemented into
existing freeze dryers. The system is robust and has a good sensitivity that allows detection
of ice in less than 1% of the vials.
There are also drawbacks, especially the fact that the cold plasma which is required for gas
concentration measurements generates radicals which may cause degradation in the
product. This is especially problematic for protein formulations when using freeze dryers in
which the sensor can only be installed on top of the chamber due to the positioning of the

Introduction 48 vacuum ports. This limitation restricts the use of Lyotrack sensors in manufacturing and GMP
environments even though the sensor is sterilizable and compatible with Sterilize in Place /
Clean in Place. While the sensor could be successfully employed for scale-up and transfer of
cycles to adjust the primary drying time, it is not possible to employ it during production runs.
The information provided to the user also only describes the gas composition comparable to
Pirani or mass spectrometry data without additional parameters that are provided by e.g.
MTM or TDLAS technology.
Introduction 49
1.6. Objectives of this thesis
The research presented in this thesis focused on studying novel and innovative Process
Analytical Technology (PAT) tools for monitoring and control of pharmaceutical freeze drying,
and developing new applications for existing PAT tools. The results of this investigation
should offer new or improved possibilities for development and control of freeze drying
cycles. The PAT tools employed for this thesis were Tunable Diode Laser Absorption
Spectroscopy, Manometric Temperature Measurement, and TEMPRIS sensors.
Tunable Diode Laser Absorption Spectroscopy was applied for the following purposes:
(1) Evaluation of TDLAS for the determination of Kv values in sublimation tests using two
different methods, and comparison of the results to a traditional gravimetric method
including position-dependence of heat transfer
(2) Derivation of a model from steady state heat and mass transfer theory that allows
calculation of batch product temperature and product resistance from TDLAS mass
flow measurements during primary drying
(3) Application of TDLAS for monitoring of secondary drying to target intermediate
moisture contents, as well as development of a correlation between residual moisture
content and mass flow rate at several product temperatures
The new applications of Manometric Temperature Measurement were:
(1) Monitoring of product resistance depending on product type and concentration with
regard to reproducibility and effects of the container system as well as effects of
annealing and variation of fill depth
(2) Assessment of cycle robustness and the effect of different process conditions for
model excipients using MTM measurements in context of SMARTTM runs
The novel TEMPRIS sensors were investigated in the following respects:
(1) Determination of the agreement between TEMPRIS, thermocouple and MTM data
with evaluation of the effect of positioning in the vial for differently concentrated
solutions
(2) Delineation of edge effects and heterogeneous heat transfer to the product as well
as determination of effects of the sensor size on supercooling and freezing behavior

Introduction 50 The results of these experiments will be summarized to facilitate the development and
transfer of freeze drying cycles and to obtain additional information about critical process
parameters from the technologies investigated. Using the new approaches and
methodologies developed in the course of this work, the improved process analytical
technology tools will provide the user with more knowledge about critical product and
process parameters which, in turn, can be applied for definition of Design Space and
implementation of Quality by Design.
Materials and Methods 51
2. Materials and Methods 2.1 List of Materials and Equipment used in the experiments
Excipients:
Sucrose Sigma Chemical Company (Munich, Germany and St. Louis,
MO, USA) with a purity > 99.5% (S9378)
Mannitol Sigma-Aldrich Chemical Company (Munich, Germany and St.
Louis, MO, USA) with a purity >98% (M4125)
Trehalose Sigma Chemical Company (Munich, Germany) D(+)-Trehalose
Dihydrate from Corn Starch (T9449)
Glycine Sigma Chemical Company (Munich, Germany and St. Louis,
MO, USA) with a purity > 98% (G620)
BSA Sigma Chemical Company (Munich, Germany) Albumin from
bovine serum pH 5.2 with a purity >98% (A3912)
Packaging: Vials WEST Pharmaceutical Services (Lionville, PA, USA) Wheaton
5 mL 20 mm Serum Tubing (68000677)
WEST Pharmaceutical Services (Lionville, PA, USA) Wheaton
20 mL Serum Tubing (68000321)
Pfizer Global R&D (Groton, CT, USA) Wheaton 5 mL 20 mm
Serum Tubing (RM8383)
Pfizer Global R&D (Groton, CT, USA) Wheaton 20 mL 20 mm
Serum Tubing (RM8808)
Lutz GmbH (Wertheim, Germany) 20 mL 20 mm Dumpy Serum
Tubing (20093201)
Stoppers WEST Pharmaceutical Services (Lionville, PA, USA) 20 mm
Bromobutyl Igloo Flurotec (7001-6499)
Seals WEST Pharmaceutical Services (Lionville, PA, USA) Al-Seals
20 mm Flip-Off (5921-2831)
Fisher Scientific (Pittsburgh, PA, USA) Al-Seals 20 mm Tear Off
(06-406-15)

Materials and Methods 52
Reagents: Nitrogen Linde (Munich, Germany) Grade 5.0 for Lyostar, Karl Fischer
Nitrogen Linde (Murray Hill, NJ, USA) Grade Extra Dry for TDLAS, Glove
Bag
Karl Fischer Riedel-de Haёn (Seelze, Germany) Hydranal-Coulomat AG
Oven (34739)
Riedel-de Haёn (Seelze, Germany) Hydranal-Coulomat CG
(34840)
Riedel-de Haёn (Seelze, Germany) Hydranal Humidity
Absorber (34788)
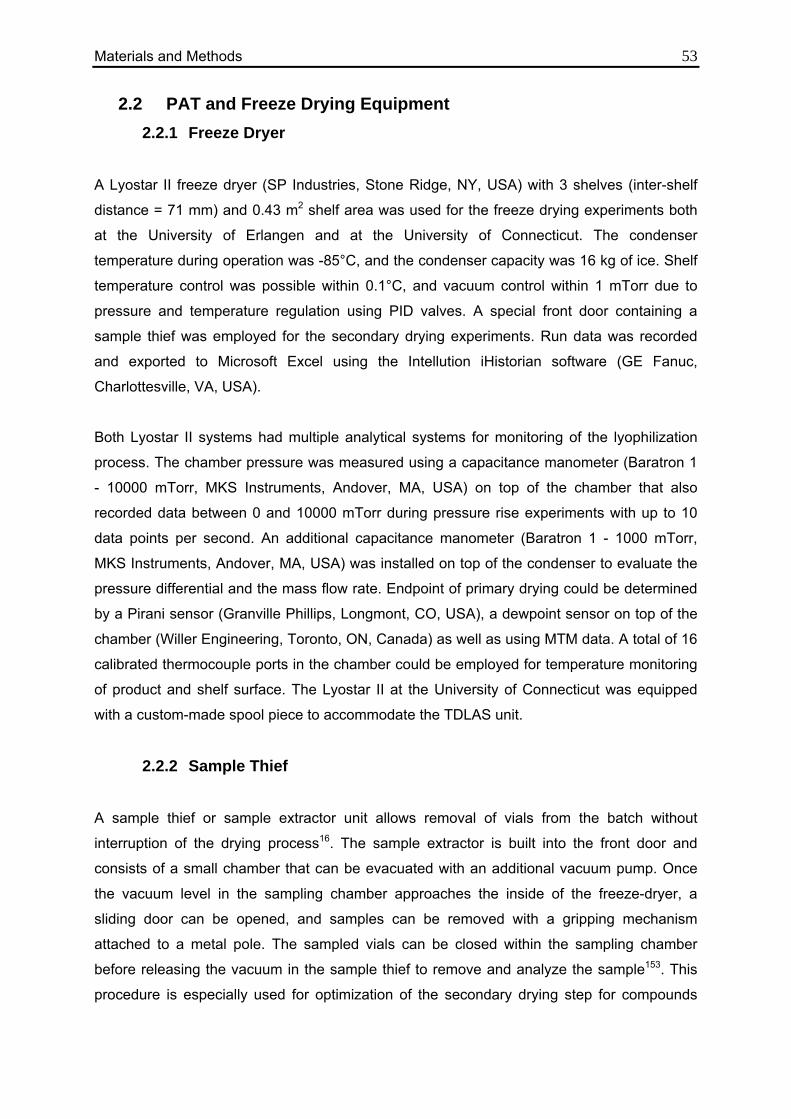
Materials and Methods 53
2.2 PAT and Freeze Drying Equipment 2.2.1 Freeze Dryer
A Lyostar II freeze dryer (SP Industries, Stone Ridge, NY, USA) with 3 shelves (inter-shelf
distance = 71 mm) and 0.43 m2 shelf area was used for the freeze drying experiments both
at the University of Erlangen and at the University of Connecticut. The condenser
temperature during operation was -85°C, and the condenser capacity was 16 kg of ice. Shelf
temperature control was possible within 0.1°C, and vacuum control within 1 mTorr due to
pressure and temperature regulation using PID valves. A special front door containing a
sample thief was employed for the secondary drying experiments. Run data was recorded
and exported to Microsoft Excel using the Intellution iHistorian software (GE Fanuc,
Charlottesville, VA, USA).
Both Lyostar II systems had multiple analytical systems for monitoring of the lyophilization
process. The chamber pressure was measured using a capacitance manometer (Baratron 1
- 10000 mTorr, MKS Instruments, Andover, MA, USA) on top of the chamber that also
recorded data between 0 and 10000 mTorr during pressure rise experiments with up to 10
data points per second. An additional capacitance manometer (Baratron 1 - 1000 mTorr,
MKS Instruments, Andover, MA, USA) was installed on top of the condenser to evaluate the
pressure differential and the mass flow rate. Endpoint of primary drying could be determined
by a Pirani sensor (Granville Phillips, Longmont, CO, USA), a dewpoint sensor on top of the
chamber (Willer Engineering, Toronto, ON, Canada) as well as using MTM data. A total of 16
calibrated thermocouple ports in the chamber could be employed for temperature monitoring
of product and shelf surface. The Lyostar II at the University of Connecticut was equipped
with a custom-made spool piece to accommodate the TDLAS unit.
2.2.2 Sample Thief
A sample thief or sample extractor unit allows removal of vials from the batch without
interruption of the drying process16. The sample extractor is built into the front door and
consists of a small chamber that can be evacuated with an additional vacuum pump. Once
the vacuum level in the sampling chamber approaches the inside of the freeze-dryer, a
sliding door can be opened, and samples can be removed with a gripping mechanism
attached to a metal pole. The sampled vials can be closed within the sampling chamber
before releasing the vacuum in the sample thief to remove and analyze the sample153. This
procedure is especially used for optimization of the secondary drying step for compounds
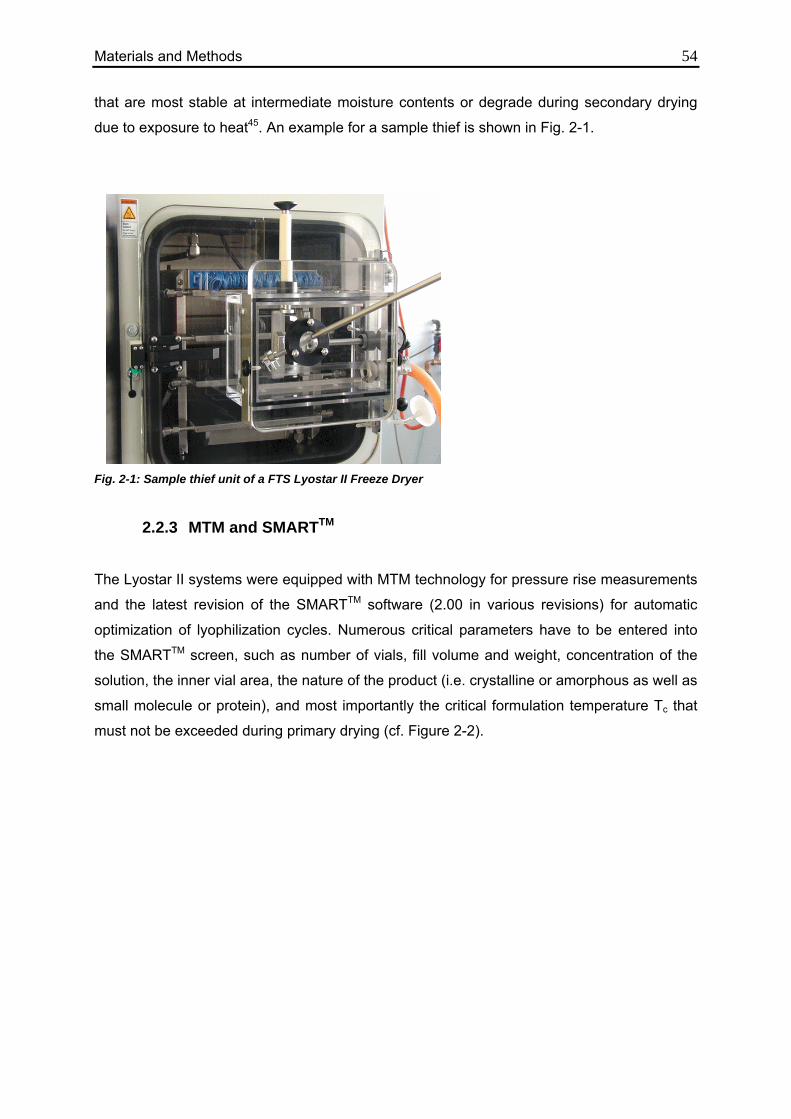
Materials and Methods 54 that are most stable at intermediate moisture contents or degrade during secondary drying
due to exposure to heat45. An example for a sample thief is shown in Fig. 2-1.
Fig. 2-1: Sample thief unit of a FTS Lyostar II Freeze Dryer
2.2.3 MTM and SMARTTM
The Lyostar II systems were equipped with MTM technology for pressure rise measurements
and the latest revision of the SMARTTM software (2.00 in various revisions) for automatic
optimization of lyophilization cycles. Numerous critical parameters have to be entered into
the SMARTTM screen, such as number of vials, fill volume and weight, concentration of the
solution, the inner vial area, the nature of the product (i.e. crystalline or amorphous as well as
small molecule or protein), and most importantly the critical formulation temperature Tc that
must not be exceeded during primary drying (cf. Figure 2-2).
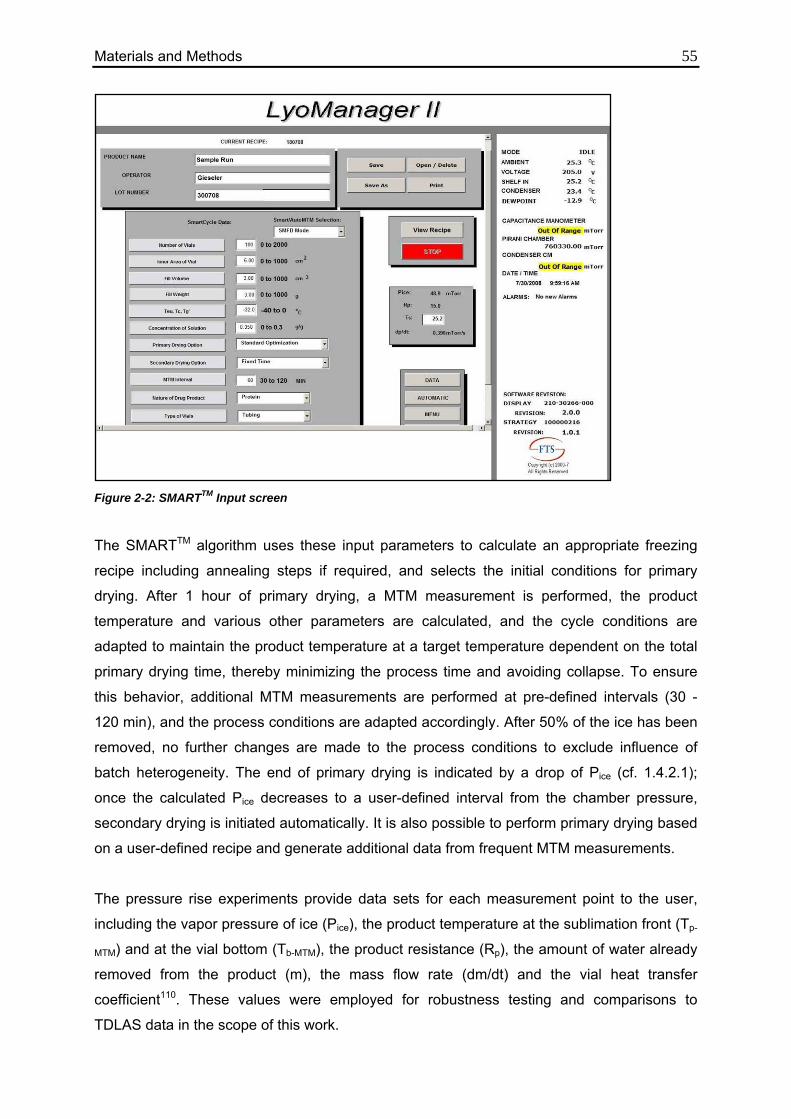
Materials and Methods 55
Figure 2-2: SMARTTM Input screen
The SMARTTM algorithm uses these input parameters to calculate an appropriate freezing
recipe including annealing steps if required, and selects the initial conditions for primary
drying. After 1 hour of primary drying, a MTM measurement is performed, the product
temperature and various other parameters are calculated, and the cycle conditions are
adapted to maintain the product temperature at a target temperature dependent on the total
primary drying time, thereby minimizing the process time and avoiding collapse. To ensure
this behavior, additional MTM measurements are performed at pre-defined intervals (30 -
120 min), and the process conditions are adapted accordingly. After 50% of the ice has been
removed, no further changes are made to the process conditions to exclude influence of
batch heterogeneity. The end of primary drying is indicated by a drop of Pice (cf. 1.4.2.1);
once the calculated Pice decreases to a user-defined interval from the chamber pressure,
secondary drying is initiated automatically. It is also possible to perform primary drying based
on a user-defined recipe and generate additional data from frequent MTM measurements.
The pressure rise experiments provide data sets for each measurement point to the user,
including the vapor pressure of ice (Pice), the product temperature at the sublimation front (Tp-
MTM) and at the vial bottom (Tb-MTM), the product resistance (Rp), the amount of water already
removed from the product (m), the mass flow rate (dm/dt) and the vial heat transfer
coefficient110. These values were employed for robustness testing and comparisons to
TDLAS data in the scope of this work.
Materials and Methods 56 Secondary drying can be performed according to a user-defined shelf temperature and
chamber pressure over time program. Alternatively, the secondary drying option can be
employed: a sample is removed at the end of primary drying, the moisture content is
determined and entered into the SMARTTM software, and the expert algorithm develops a
program appropriate to reach a target moisture content specified by the user.
The recent software version also supplies an Auto-MTM function that allows performance of
a pre-defined cycle recipe with additional MTM measurements. The calculated product data
is available to the user, but no adaptations are made to the cycle conditions. This way it is
possible to obtain additional information about established cycles and identify potential
problems and potential for optimization.
2.2.4 TDLAS
The freeze-dryer was equipped with a LyoFluxTM 100 (Physical Sciences Inc., Andover, MA,
USA) Tunable Diode Laser Absorption Spectroscopy based mass flow monitor. A fiber optic
collimator transmitter and photodiode receiver were mounted to the freeze dryer duct
connecting the product chamber and the condenser. The near infrared diode laser beam was
launched across the duct at a 45° angle to the gas flow axis through an anti-reflection coated
window. The transmitted beam was detected by the photodiode detector, and the
photocurrent signal was transmitted to the LyoFlux™ 100 sensor control unit. The detector
was purged with nitrogen (Extra Dry) to avoid condensation of humidity.
Water vapor concentration (N) was directly measured by integrating the water absorption
lineshape. The peak of the absorption spectrum is shifted relative to the original spectrum
proportional to the gas flow velocity due to the Doppler shift. The gas flow velocity was
determined by measuring the Doppler shift in the frequency wavelength position of the water
absorption spectrum as compared to a spectrum simultaneously recorded with the same
sensor in a sealed reference absorption cell. The mass flow was then calculated by the
product of the measured water vapor number density (N, molecules/cm3), the gas flow
velocity (v, m/s), and the cross-sectional area of the flow duct (A, cm2).
TDLAS velocity measurements require previous determination of a velocity offset, a
parameter that defines a certain basis level of shift between the absorption peaks. The
velocity offset can be measured after evacuating the system to the desired chamber
pressure setpoint and closing the isolation valve. This way no mass flow can occur between
chamber and condenser, and the zero velocity value can be determined. The measurement
Materials and Methods 57 was performed in triplicate, and the average was entered as velocity offset. Another input
factor required for correct operation of the TDLAS sensor is the chamber pressure during the
run.
2.2.5 TEMPRIS
The TEMPRIS wireless temperature system (IQ Mobil Solutions GmbH, Wolfratshausen,
Germany) consisted of 8 sensors, the interrogation unit (incl. transmitter) and a computer
system to record the data to file. The battery-free sensors receive their power by excitation of
the passive transponder by means of an amplitude-modulated microwave signal in the
internationally available 2.4-Ghz ISM band, with evaluation of the back-scatter response. The
signal is demodulated in the transponder by means of a diode detector and used to stimulate
a quartz-based resonance circuit. The resonator itself is used as an energy storage device.
In the second step the amplitude modulation is switched off and the carrier signal alone is
radiated. The stimulated resonant circuit continues to oscillate at its characteristic frequency
which depends on the measured temperature. This free oscillation is mixed with the carrier
and re-transmitted to the interrogation unit 154. The IRU measures the modulation frequency
of the response and also the exponential drop in amplitude. In combination with statistical
parameters of several consecutive responses the required measured variable is derived. In
order to avoid possible interferences, the system changes automatically to a new carrier
frequency within the ISM band after each interrogation cycle. As a result, the duration of the
usable oscillations depends directly on the resonant frequency and the Q value of the
resonant circuit used. The software provides approximately 25 temperature measurements
per minute that are instantaneously available during the run, allowing early reactions to
potential process deviations.
2.2.6 Vials
5 mL and 20 mL clear glass serum tubing lyophilization vials were used for the TDLAS
experiments. The product area (calculated from inner diameter, relevant for calculation of
mass flow rates and ice surface area) was 2.91 cm2 for the 5 mL and 5.74 cm2 for the 20 mL
vials. The vial area (calculated from outer diameter, relevant for calculation of heat transfer
coefficients) was 6.72 cm2 for the 20 mL vials (not determined for the 5 mL vials).
The MTM studies and three of the TEMPRIS experiments were performed with 5 mL and 20
mL serum tubing lyophilization vials provided by Pfizer. The product area was calculated as
3.4 cm2 for the 5 mL and as 6.7 cm2 for the 20 mL vials.
Materials and Methods 58 Two of the TEMPRIS runs were conducted with 10 mL dumpy vials (Lutz Pharma, Wertheim,
Germany) with a product area of 5.6 cm2. Dumpy vials have a reduced height compared to
common vials with the same diameter. Additional experiments for data validation were
performed using the vials provided by Pfizer. All vials used in this research had a 20 mm
finish.
2.2.7 Stoppers
20 mm Bromobutyl igloo stoppers coated with a fluoro-silan layer were used.
The vials used for the Kv determination were completely stoppered with 20 mm stoppers
containing a fixed-length precision-bore stainless steel tube (SWS Edelstahl GmbH,
Emmingen, Germany; dimensions: 2.5 x 0.15 x 15 mm, 983037) to obtain identical
resistance to mass transfer for all vials in order to measure only differences introduced by the
heat transfer characteristics of the vials.
2.2.8 Thermocouples
Calibrated T-Type Copper/Constantan thermocouples with 30 and 36 gauge thickness
(equivalent to 0.25 and 0.13 mm, 5SRTC-TT-TI-30-1M and 5SRTC-TT-TI-36-1M) from
Omega (Omega Engineering, Stamford, CT) were used for temperature monitoring. Each
thermocouple was introduced through the stopper and carefully positioned in the bottom
center of the vial. This procedure is necessary to achieve both representative temperature
data throughout the primary drying phase, as well as an accurate detection of the time point
when no ice is left in the product. The Lyostar II thermocouple ports were calibrated using a
high precision voltage generator.
Materials and Methods 59
2.3 Analytical 2.3.1 Karl Fischer Titrator
Residual moisture contents of freeze dried cakes at the University of Erlangen were
measured using a Mitsubishi Moisture Meter CA-06 Coulometric connected to a Mitsubishi
Water Vaporizer VA-06. Samples of typically 20 – 200 mg were weighed into a glass sample
holder in a glove box purged with dry air (relative humidity < 1%). The sample was inserted
into the oven unit after purging the sample vessel with dry nitrogen. The sample was first
heated to 140°C for 3 minutes and the water vapor was accumulated in the titration solvent
before the start of titration. The baseline drift was below 0.1 μg water per minute, the
sensitivity was also 0.1 μg water per minute with a nitrogen gas stream of 200 ml/min.
Following the titration, the empty weight of the sample holder was determined and the
residual moisture content was calculated. The precision was ± 3 μg for water contents
between 10 and 1000 μg, and 0.3% for > 1 mg155.
Residual moisture contents of sample vials at the University of Connecticut were determined
using a Methrohm Karl Fischer Coulometer 756 KF with titration solvent Hydranal Coulamat.
3 mL water-free Methanol were added to the weighed sample, and 0.5 mL of the solution
were injected into the titration cell using a syringe. A blank value of pure Methanol solvent
was used as an offset and subtracted from each result. The sample was titrated
coulometrically, and the moisture content was calculated. The accuracy was identical as for
the Mitsubishi system156.
2.3.2 Differential Scanning Calorimetry
Lyophilized cakes were analyzed by modulated DSC using a TA Instruments Q1000 DSC.
The system was calibrated for baseline as well as cell constant. Approximately 10 μl of liquid
sample was hermetically sealed in aluminum DSC pans, frozen to -60°C at 5°C/min, heated
at 2°C/min with modulation of +/- 0.5°C every 100s to 0°C. The reversing heat flow was
analyzed for glass transitions while the non-reversing heat flow was analyzed for the melting
peak of ice.
2.3.3 Freeze Dry Microscopy
The collapse temperature of frozen solutions was determined using Freeze Dry Microscopy.
FDM was performed on a freeze drying cryostage (FDCS-196) from Linkam Scientific in
conjunction with a Zeiss Optical Microscope equipped with a Color Video Camera. The
Materials and Methods 60 sample was prepared by dissolving the materials in water for injection. Approximately 2 μL
were used for the measurement. The sample was frozen with 10°C/min to -50°C and held for
several minutes. Vacuum was initiated, and the temperature was slowly increased with
1°C/min through the collapse temperature. Tc was determined from images displaying the
first signs of structural changes within the dried layer.
2.3.4 Scanning Electron Microscopy
Freeze dried cakes were investigated using Scanning Electron Microscopy (SEM). The
lyophilized samples were broken into pieces, fixed on Al stubs and then carefully gold-
sputtered at 20mA/5kV (Hummer JR Technics) for about 1 min. Cake morphology was then
examined using an Amray 1810 T Scanning Electron Microscope at 20 kV with
magnifications between 7.5x and 500x.
Materials and Methods 61
2.4 Experimental Procedures 2.4.1 Measurement of Vial Heat Transfer Coefficients
Sublimation tests were conducted at chamber pressures ranging from 65 to 500 mTorr and
shelf inlet temperatures of -10°C or -5°C. The individual conditions are provided in the
Results and Discussion section. One tray containing 112 of 20 mL vials was loaded into the
freeze dryer with each vial filled with 3 mL of pure water. A row of empty "dummy vials" was
placed around the water-filled vials, and aluminum foil attached on the interior side of the
front door was employed to partially shield the product vials from radiation effects from
chamber door and walls. Product vials were capped with custom-made stoppers containing a
fixed-length, precision bore stainless-steel tube to ensure a uniform rate of mass transfer.
This procedure was reported before in the literature17,57 and used to ensure identical mass
transfer characteristics and exclusively detect differences in heat transfer.
The weight of each individual product vial was determined empty, after filling with 3 ml water,
and after the sublimation test on a calibrated analytical balance (LA 120 S, Sartorius,
Switzerland) to determine the total amount of water sublimed. The error of this procedure
was evaluated to be roughly 0.3 %, using the same method reported by Gieseler et al. The
gravimetric mass flow was then evaluated as the total amount of water removed divided by
the drying time. Product temperatures during each run were measured with seven calibrated,
fine wire thermocouples (0.13 mm diameter, Omega Engineering, Stamford, CT). Four
thermocouples were located in “edge” positions, three thermocouples in “center” positions to
obtain representative temperature profiles and quantify atypical radiation effects.
The shelf surface temperature was determined using two adhesive thermocouples that were
attached on the product shelf close to fluid inlet and outlet, respectively. The thermocouples
were shielded with a thin layer of isolation material; the measured shelf surface temperature
was mostly 0.5-1°C below the shelf fluid inlet temperature. After loading the vials onto the
freeze-dryer shelf, they were frozen by cooling at 1°C/min to -40°C and kept for 60 min.
Following the freezing step, vacuum was applied, and the shelf temperature was rapidly
(2.5°C/min) increased to the setpoint for the sublimation step. Note that this ramping period
was not excluded in the calculations17,57 (e.g. by performing separate experiments to
determine the total amount of water removed during this phase157). The expected mass flow
during the pumpdown phase and ramping period is below 20 mg per vial, so the error caused
by not performing an offset experiment would be less than 1%158. Shelf and product
temperature as well as TDLAS data were monitored and recorded. Each sublimation test
Materials and Methods 62 was performed until 30 to maximally 50% of the total mass of ice in each vial had been
removed. All vials were weighed again, and the gravimetric Kv was calculated from Equation
1-7.
The TDLAS data based Kv was calculated using the same principle of data analysis. Average
thermocouple product temperature measurements over the entire run and integrated mass
flow results over the experiment time were used for the calculation to obtain data comparable
to the gravimetric results.
Additionally, the continuous TDLAS measurement principle makes it possible to calculate the
vial heat transfer coefficient at each point of the run from real-time mass flow rates. This way,
ramping periods with changing product temperatures as well as time intervals with non-
steady state temperature data can be omitted, and the resulting Kv should be a more
accurate representation of real-time conditions in steady state.
2.4.2 TDLAS Product Temperature Calculation
The product temperature is influenced by heat input from the shelf and by heat removal from
ice sublimation. Therefore Equation 1-3 can be used when the system achieves steady state
conditions and thus heat transfer is in equilibrium. Since the mass flow rate through the spool
piece, dm/dt, is directly measured by the TDLAS system, separate determination of these
variables is not required for the product temperature calculation. Using TDLAS mass flow
data, it is possible to calculate the average product temperature from Equation 2-1:
Equation 2-1
All parameters have been defined in Equation 1-3. Ts was measured by the adhesive
thermocouples attached to the shelf surface. ΔHs generally depends on the ice temperature
but is essentially constant in the temperature range used for these experiments17,159.
Therefore, a constant value of 660 cal/g was used for the calculations independent of the
exact product temperature as suggested by Pikal et al.52.
Batch average product temperatures were calculated for eight freeze-drying runs using
sucrose, mannitol or glycine in concentrations of 50 mg/mL, 75 mg/mL and 100 mg/mL. The
fill volume was 3 mL per vial. The same set of vials as used in the Kv determination runs was
employed during the product runs. The vial heat transfer coefficient was calculated for the
individual chamber pressures from the fitting function of the TDLAS one point measurements
( )( )⎥⎦
⎤⎢⎣
⎡⋅
⋅Δ−=
vv
ssb KA
dtdmHTT /
Materials and Methods 63 curve. The TDLAS “one point” measurement represents an instantaneous measure of mass
flow at a given point of time during the primary drying phase when the heat consumed by the
product and the heat removed by sublimation is fully balanced (steady state conditions). The
corresponding product and shelf surface temperature data are then utilized to evaluate Kv.
Seven of the runs were performed using the SMARTTM Freeze-Dryer algorithm which
automatically creates a cycle recipe; additional information about average product
temperature and other parameters were obtained from MTM measurements. These runs do
not have a pre-programmed temperature / time profile but show several adjustments of shelf
temperature. Details about the cycle conditions are provided in the respective section. The
calculated TDLAS temperature data (Tp-TDLAS) were compared to thermocouple
measurements of edge and center vials, as well as to product temperature calculated by
MTM. The calculation of product resistance from TDLAS mass flow data is derived in the
Results and Discussions chapter.
2.4.3 TDLAS Secondary Drying Analytics
A mixture of 50 mg/mL sucrose and 20 mg/mL BSA was used as model formulation and
characterized using Freeze Dry Microscopy and Differential Scanning Calorimetry. The
methods were already described above. The solution was pipetted into 480 vials (5 mL
serum tubing), placed onto two shelves of the freeze dryer and lyophilized using the following
recipe:
Cool to 5°C with 1°C/min, equilibrate for 15 min, cool to -5°C with 1°C/min, equilibrate for 15
min, freeze to -40°C with 0.5°C/min and hold for 60 min. Decrease pressure to 65 mTorr,
ramp up shelf temperature to -22°C, monitor drying progress. The end of primary drying was
indicated after ca. 50 hours by a drop of the Pirani sensor (steady state 108 mTorr during
primary drying). In the first runs primary drying was continued until the Pirani sensor
decreased below 75 mTorr, then secondary drying was initiated by ramping at 0.3°C to 40°C.
This temperature was maintained for 4 hours, samples were removed every hour using the
sample thief and analyzed by Karl Fischer residual moisture measurements. TDLAS mass
flow rate was recorded and integrated to monitor the amount of moisture removed from the
vials and the remaining residual moisture.
Only designated vials (marked with X in Figure 2-3) that had been weighed before the run
were taken as samples. The vial array as well as positions of thermocouples and weighed
vials for one shelf is shown in Figure 2-3.
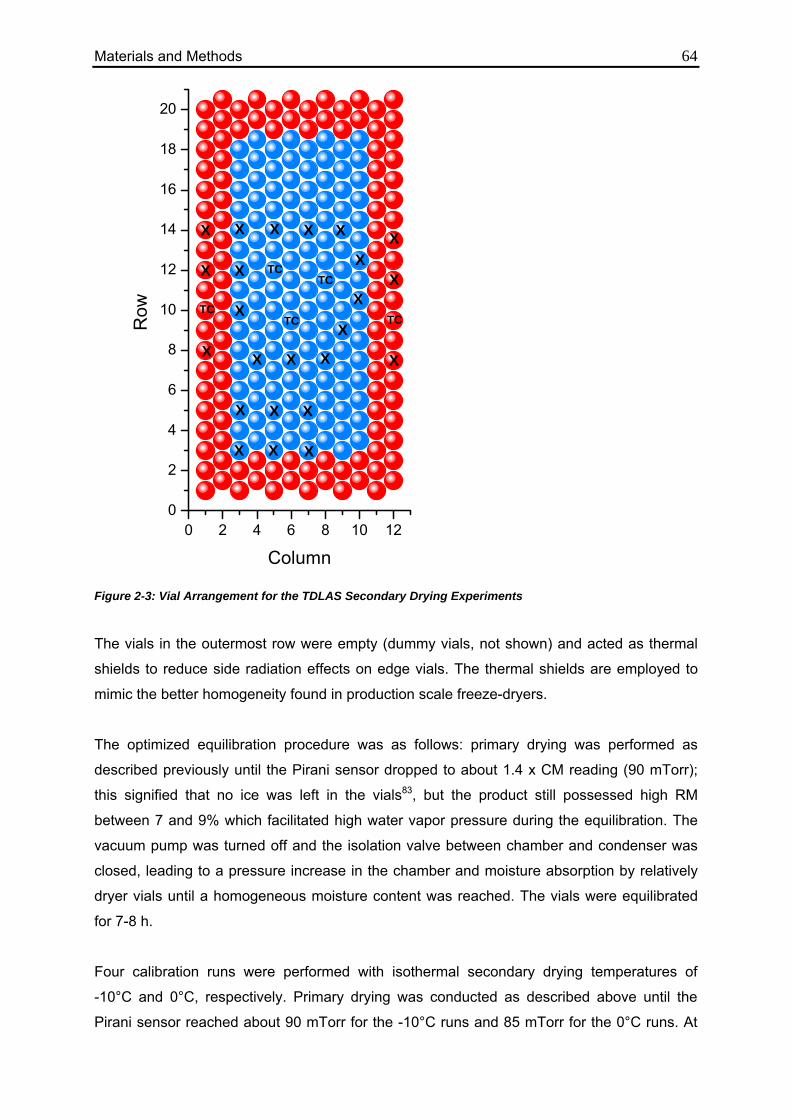
Materials and Methods 64
Figure 2-3: Vial Arrangement for the TDLAS Secondary Drying Experiments
The vials in the outermost row were empty (dummy vials, not shown) and acted as thermal
shields to reduce side radiation effects on edge vials. The thermal shields are employed to
mimic the better homogeneity found in production scale freeze-dryers.
The optimized equilibration procedure was as follows: primary drying was performed as
described previously until the Pirani sensor dropped to about 1.4 x CM reading (90 mTorr);
this signified that no ice was left in the vials83, but the product still possessed high RM
between 7 and 9% which facilitated high water vapor pressure during the equilibration. The
vacuum pump was turned off and the isolation valve between chamber and condenser was
closed, leading to a pressure increase in the chamber and moisture absorption by relatively
dryer vials until a homogeneous moisture content was reached. The vials were equilibrated
for 7-8 h.
Four calibration runs were performed with isothermal secondary drying temperatures of
-10°C and 0°C, respectively. Primary drying was conducted as described above until the
Pirani sensor reached about 90 mTorr for the -10°C runs and 85 mTorr for the 0°C runs. At
0 2 4 6 8 10 120
2
4
6
8
10
12
14
16
18
20
X
X
XX
X X X
X
X
X
XXXX
X
X
X
X
X
X
XXX
TC
TC
TC
TC
Row
Column
TC
X
Materials and Methods 65 this point the equilibration step was initiated and performed for 7-8 h (average RM for -10°C
runs 9%, for 0°C runs 7%). 3-4 vials were removed to determine the start RM value (anchor
point); in the moisture targeting runs the anchor point was determined from TDLAS mass
flow data and the correlation curve. The shelf temperature was increased rapidly (2.5°C/min)
to -10°C or 0°C, respectively, and samples were taken every 60-75 min and analyzed using
Karl Fischer titration.
Following the correlation runs the developed relationship between mass flow rate and
product temperature was evaluated in one confirmation experiment. The same number and
array of vials was freeze dried using the standard freezing and primary drying procedure
described above. After primary drying no equilibration was performed, but the shelf
temperature was rapidly increased to 0°C and kept constant for 1 hour to determine mass
flow rate and the corresponding residual moisture content. After the time at 0°C a sample
was removed for KF analysis and comparison, and the shelf temperature was increased with
0.3°C/min to 50°C. Samples were removed at hourly intervals and analyzed using Karl
Fischer titration.
2.4.4 MTM Product Resistance
An overview of the runs including vial size, fill depth and number of vials is provided in Table
2-1. One row of empty vials was used to reduce radiation effects. Thermocouples (30-gauge)
were placed at the bottom center of product vials located in center and edge position.
The freeze drying cycle was designed with the following steps: during the freezing step Ts
was ramped with 1°C/min to -40°C and held for 180 min. If an annealing step was conducted
Ts was increased subsequently to -15°C, maintained there for 240 minutes, and lowered
again to -40°C for additional freezing for 3 hours. The ramp rate during freezing and primary
drying was 1°C/min. Primary (1°) drying was initiated by ramping Ts up to -25°C and
controlling the chamber pressure at 100 mTorr. Secondary drying was optional; if 2° drying
was conducted, Ts was increased at 0.2°C/min to 40°C, held for 4 h, and lowered to +15°C
until unloading.
MTM measurements were performed in 60 min intervals during 1° drying, pressure data were
collected at a rate of 10 points/sec. MTM analysis was performed by the SMART™ Freeze
Dryer software. All equations concerning mass and heat transfer were already reported in the
literature (cf. chapter 1.2.3).
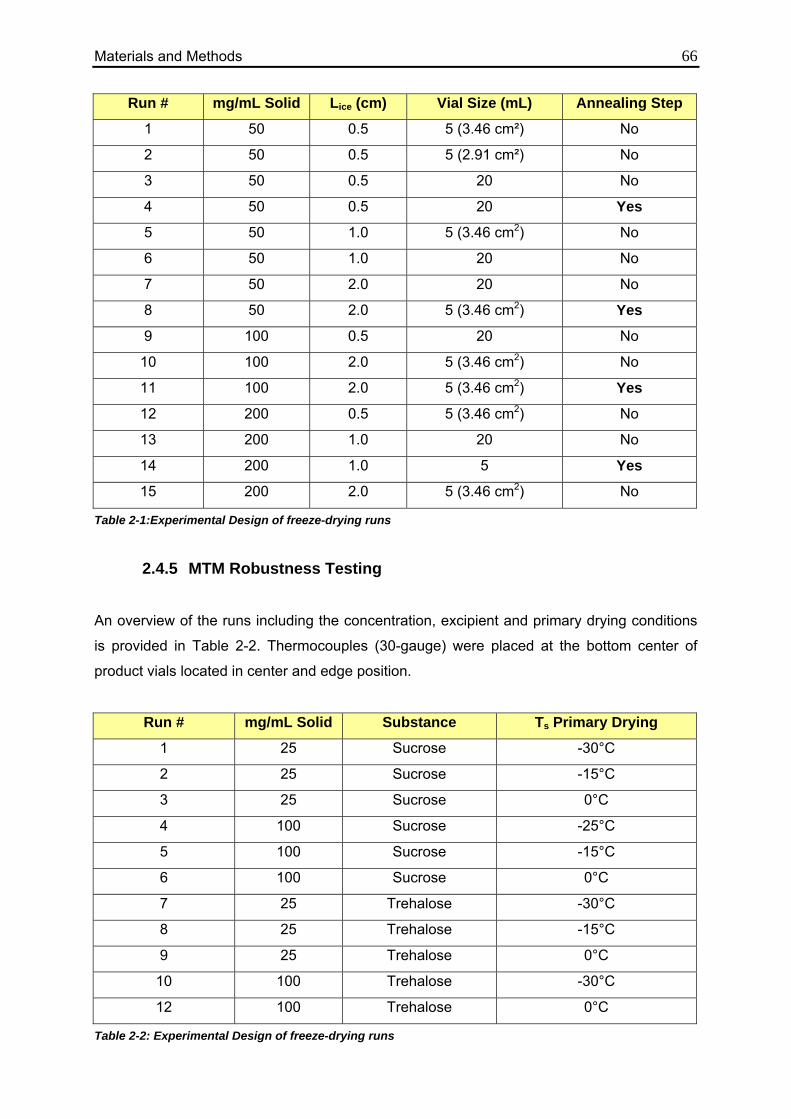
Materials and Methods 66
Run # mg/mL Solid Lice (cm) Vial Size (mL) Annealing Step
1 50 0.5 5 (3.46 cm²) No
2 50 0.5 5 (2.91 cm²) No
3 50 0.5 20 No
4 50 0.5 20 Yes
5 50 1.0 5 (3.46 cm2) No
6 50 1.0 20 No
7 50 2.0 20 No
8 50 2.0 5 (3.46 cm2) Yes
9 100 0.5 20 No
10 100 2.0 5 (3.46 cm2) No
11 100 2.0 5 (3.46 cm2) Yes
12 200 0.5 5 (3.46 cm2) No
13 200 1.0 20 No
14 200 1.0 5 Yes
15 200 2.0 5 (3.46 cm2) No
Table 2-1:Experimental Design of freeze-drying runs
2.4.5 MTM Robustness Testing
An overview of the runs including the concentration, excipient and primary drying conditions
is provided in Table 2-2. Thermocouples (30-gauge) were placed at the bottom center of
product vials located in center and edge position.
Run # mg/mL Solid Substance Ts Primary Drying
1 25 Sucrose -30°C
2 25 Sucrose -15°C
3 25 Sucrose 0°C
4 100 Sucrose -25°C
5 100 Sucrose -15°C
6 100 Sucrose 0°C
7 25 Trehalose -30°C
8 25 Trehalose -15°C
9 25 Trehalose 0°C
10 100 Trehalose -30°C
12 100 Trehalose 0°C
Table 2-2: Experimental Design of freeze-drying runs
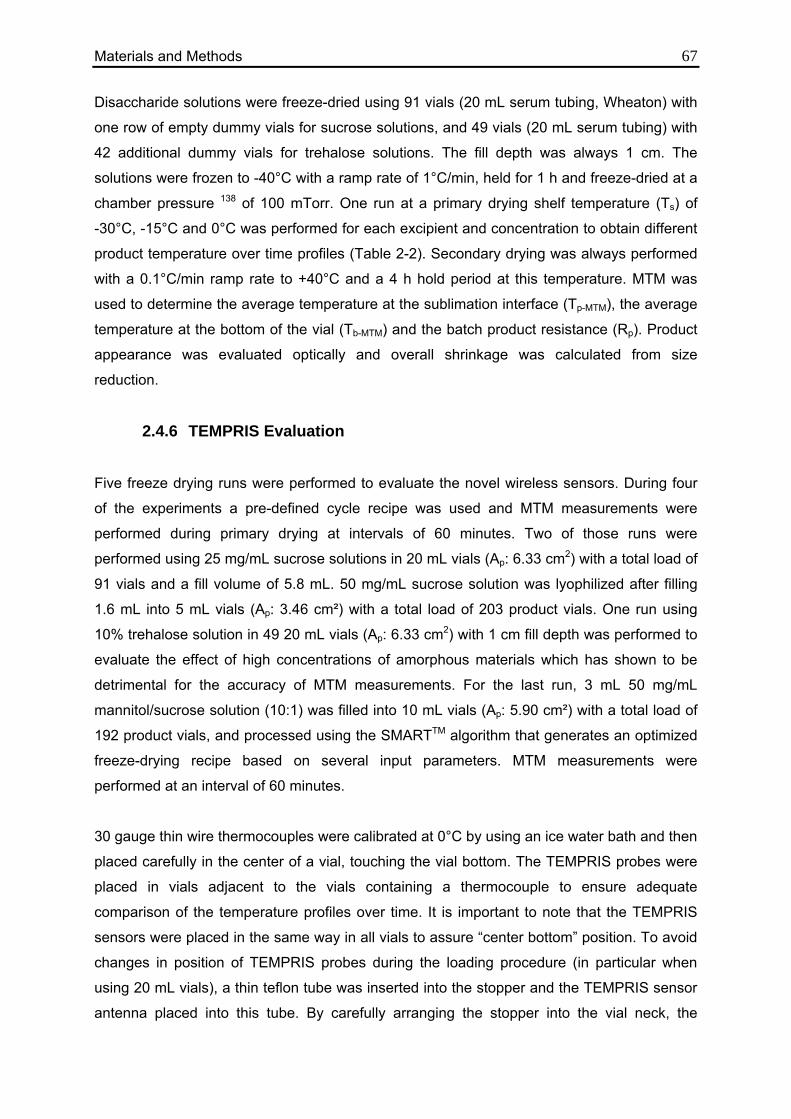
Materials and Methods 67 Disaccharide solutions were freeze-dried using 91 vials (20 mL serum tubing, Wheaton) with
one row of empty dummy vials for sucrose solutions, and 49 vials (20 mL serum tubing) with
42 additional dummy vials for trehalose solutions. The fill depth was always 1 cm. The
solutions were frozen to -40°C with a ramp rate of 1°C/min, held for 1 h and freeze-dried at a
chamber pressure 138 of 100 mTorr. One run at a primary drying shelf temperature (Ts) of
-30°C, -15°C and 0°C was performed for each excipient and concentration to obtain different
product temperature over time profiles (Table 2-2). Secondary drying was always performed
with a 0.1°C/min ramp rate to +40°C and a 4 h hold period at this temperature. MTM was
used to determine the average temperature at the sublimation interface (Tp-MTM), the average
temperature at the bottom of the vial (Tb-MTM) and the batch product resistance (Rp). Product
appearance was evaluated optically and overall shrinkage was calculated from size
reduction.
2.4.6 TEMPRIS Evaluation
Five freeze drying runs were performed to evaluate the novel wireless sensors. During four
of the experiments a pre-defined cycle recipe was used and MTM measurements were
performed during primary drying at intervals of 60 minutes. Two of those runs were
performed using 25 mg/mL sucrose solutions in 20 mL vials (Ap: 6.33 cm2) with a total load of
91 vials and a fill volume of 5.8 mL. 50 mg/mL sucrose solution was lyophilized after filling
1.6 mL into 5 mL vials (Ap: 3.46 cm²) with a total load of 203 product vials. One run using
10% trehalose solution in 49 20 mL vials (Ap: 6.33 cm2) with 1 cm fill depth was performed to
evaluate the effect of high concentrations of amorphous materials which has shown to be
detrimental for the accuracy of MTM measurements. For the last run, 3 mL 50 mg/mL
mannitol/sucrose solution (10:1) was filled into 10 mL vials (Ap: 5.90 cm²) with a total load of
192 product vials, and processed using the SMARTTM algorithm that generates an optimized
freeze-drying recipe based on several input parameters. MTM measurements were
performed at an interval of 60 minutes.
30 gauge thin wire thermocouples were calibrated at 0°C by using an ice water bath and then
placed carefully in the center of a vial, touching the vial bottom. The TEMPRIS probes were
placed in vials adjacent to the vials containing a thermocouple to ensure adequate
comparison of the temperature profiles over time. It is important to note that the TEMPRIS
sensors were placed in the same way in all vials to assure “center bottom” position. To avoid
changes in position of TEMPRIS probes during the loading procedure (in particular when
using 20 mL vials), a thin teflon tube was inserted into the stopper and the TEMPRIS sensor
antenna placed into this tube. By carefully arranging the stopper into the vial neck, the
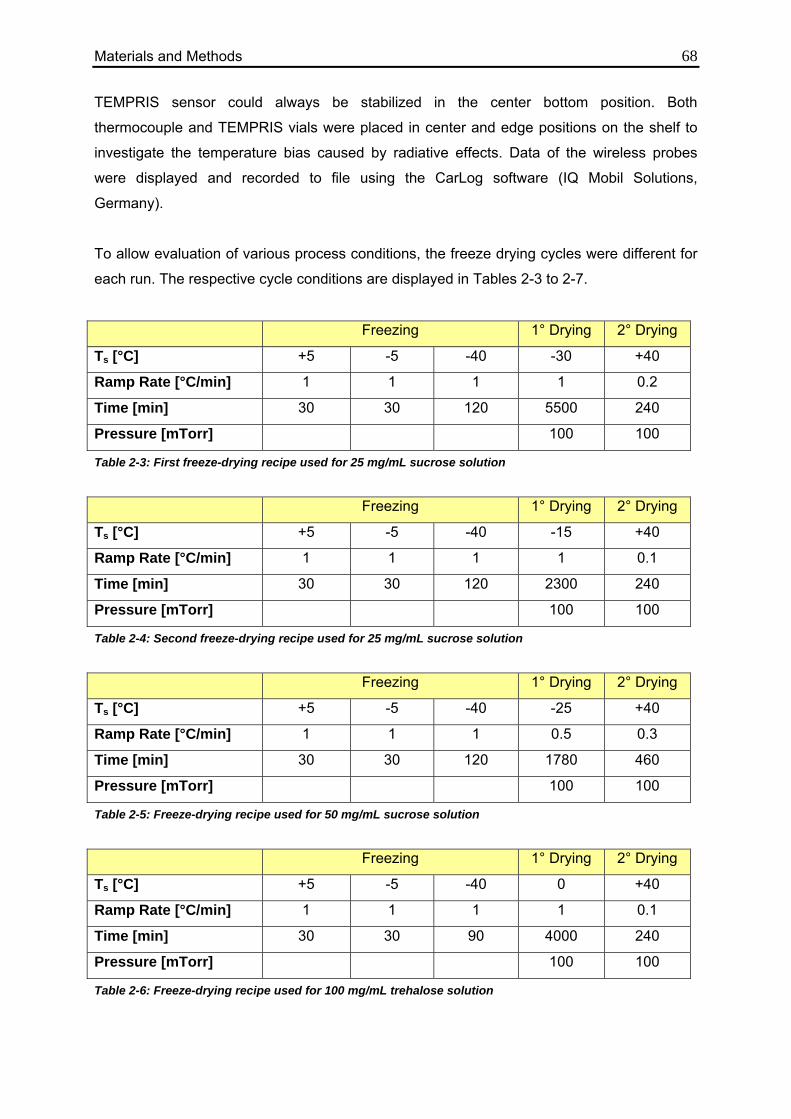
Materials and Methods 68 TEMPRIS sensor could always be stabilized in the center bottom position. Both
thermocouple and TEMPRIS vials were placed in center and edge positions on the shelf to
investigate the temperature bias caused by radiative effects. Data of the wireless probes
were displayed and recorded to file using the CarLog software (IQ Mobil Solutions,
Germany).
To allow evaluation of various process conditions, the freeze drying cycles were different for
each run. The respective cycle conditions are displayed in Tables 2-3 to 2-7.
Freezing 1° Drying 2° Drying
Ts [°C] +5 -5 -40 -30 +40
Ramp Rate [°C/min] 1 1 1 1 0.2
Time [min] 30 30 120 5500 240
Pressure [mTorr] 100 100
Table 2-3: First freeze-drying recipe used for 25 mg/mL sucrose solution
Freezing 1° Drying 2° Drying
Ts [°C] +5 -5 -40 -15 +40
Ramp Rate [°C/min] 1 1 1 1 0.1
Time [min] 30 30 120 2300 240
Pressure [mTorr] 100 100
Table 2-4: Second freeze-drying recipe used for 25 mg/mL sucrose solution
Freezing 1° Drying 2° Drying
Ts [°C] +5 -5 -40 -25 +40
Ramp Rate [°C/min] 1 1 1 0.5 0.3
Time [min] 30 30 120 1780 460
Pressure [mTorr] 100 100
Table 2-5: Freeze-drying recipe used for 50 mg/mL sucrose solution
Freezing 1° Drying 2° Drying
Ts [°C] +5 -5 -40 0 +40
Ramp Rate [°C/min] 1 1 1 1 0.1
Time [min] 30 30 90 4000 240
Pressure [mTorr] 100 100
Table 2-6: Freeze-drying recipe used for 100 mg/mL trehalose solution
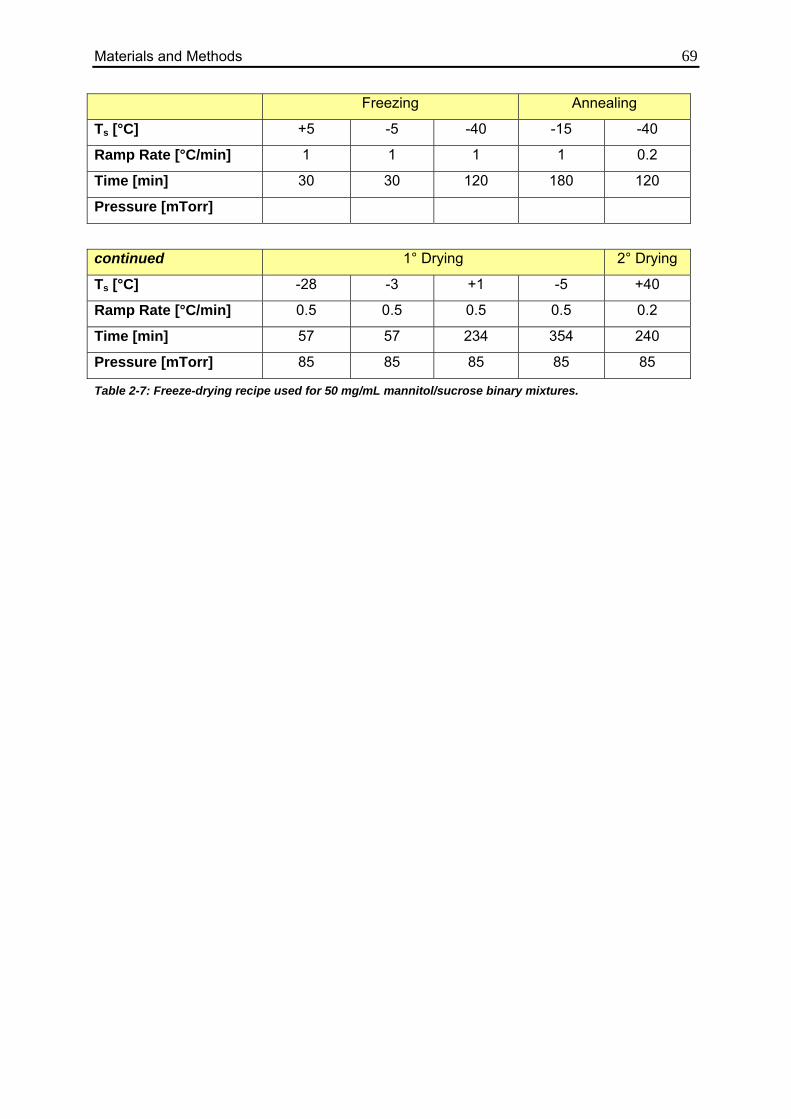
Materials and Methods 69 Freezing Annealing
Ts [°C] +5 -5 -40 -15 -40
Ramp Rate [°C/min] 1 1 1 1 0.2
Time [min] 30 30 120 180 120
Pressure [mTorr]
continued 1° Drying 2° Drying
Ts [°C] -28 -3 +1 -5 +40
Ramp Rate [°C/min] 0.5 0.5 0.5 0.5 0.2
Time [min] 57 57 234 354 240
Pressure [mTorr] 85 85 85 85 85
Table 2-7: Freeze-drying recipe used for 50 mg/mL mannitol/sucrose binary mixtures.
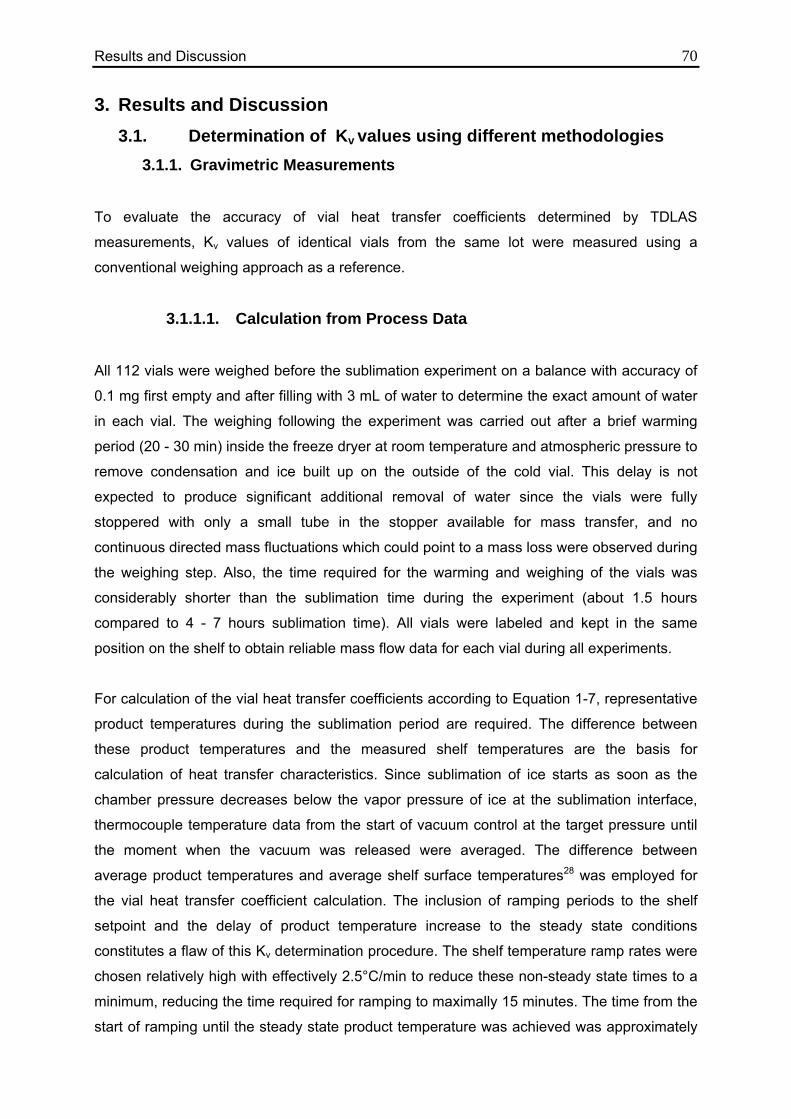
Results and Discussion 70
3. Results and Discussion 3.1. Determination of Kv values using different methodologies
3.1.1. Gravimetric Measurements
To evaluate the accuracy of vial heat transfer coefficients determined by TDLAS
measurements, Kv values of identical vials from the same lot were measured using a
conventional weighing approach as a reference.
3.1.1.1. Calculation from Process Data
All 112 vials were weighed before the sublimation experiment on a balance with accuracy of
0.1 mg first empty and after filling with 3 mL of water to determine the exact amount of water
in each vial. The weighing following the experiment was carried out after a brief warming
period (20 - 30 min) inside the freeze dryer at room temperature and atmospheric pressure to
remove condensation and ice built up on the outside of the cold vial. This delay is not
expected to produce significant additional removal of water since the vials were fully
stoppered with only a small tube in the stopper available for mass transfer, and no
continuous directed mass fluctuations which could point to a mass loss were observed during
the weighing step. Also, the time required for the warming and weighing of the vials was
considerably shorter than the sublimation time during the experiment (about 1.5 hours
compared to 4 - 7 hours sublimation time). All vials were labeled and kept in the same
position on the shelf to obtain reliable mass flow data for each vial during all experiments.
For calculation of the vial heat transfer coefficients according to Equation 1-7, representative
product temperatures during the sublimation period are required. The difference between
these product temperatures and the measured shelf temperatures are the basis for
calculation of heat transfer characteristics. Since sublimation of ice starts as soon as the
chamber pressure decreases below the vapor pressure of ice at the sublimation interface,
thermocouple temperature data from the start of vacuum control at the target pressure until
the moment when the vacuum was released were averaged. The difference between
average product temperatures and average shelf surface temperatures28 was employed for
the vial heat transfer coefficient calculation. The inclusion of ramping periods to the shelf
setpoint and the delay of product temperature increase to the steady state conditions
constitutes a flaw of this Kv determination procedure. The shelf temperature ramp rates were
chosen relatively high with effectively 2.5°C/min to reduce these non-steady state times to a
minimum, reducing the time required for ramping to maximally 15 minutes. The time from the
start of ramping until the steady state product temperature was achieved was approximately
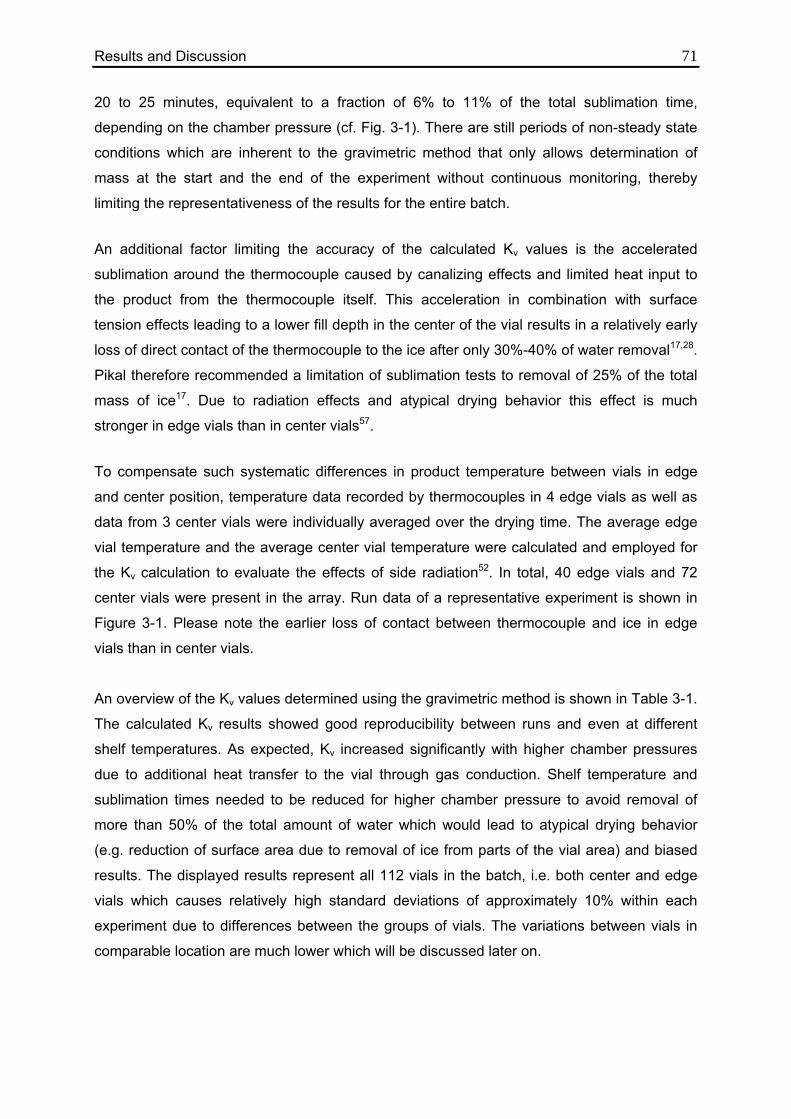
Results and Discussion 71 20 to 25 minutes, equivalent to a fraction of 6% to 11% of the total sublimation time,
depending on the chamber pressure (cf. Fig. 3-1). There are still periods of non-steady state
conditions which are inherent to the gravimetric method that only allows determination of
mass at the start and the end of the experiment without continuous monitoring, thereby
limiting the representativeness of the results for the entire batch.
An additional factor limiting the accuracy of the calculated Kv values is the accelerated
sublimation around the thermocouple caused by canalizing effects and limited heat input to
the product from the thermocouple itself. This acceleration in combination with surface
tension effects leading to a lower fill depth in the center of the vial results in a relatively early
loss of direct contact of the thermocouple to the ice after only 30%-40% of water removal17,28.
Pikal therefore recommended a limitation of sublimation tests to removal of 25% of the total
mass of ice17. Due to radiation effects and atypical drying behavior this effect is much
stronger in edge vials than in center vials57.
To compensate such systematic differences in product temperature between vials in edge
and center position, temperature data recorded by thermocouples in 4 edge vials as well as
data from 3 center vials were individually averaged over the drying time. The average edge
vial temperature and the average center vial temperature were calculated and employed for
the Kv calculation to evaluate the effects of side radiation52. In total, 40 edge vials and 72
center vials were present in the array. Run data of a representative experiment is shown in
Figure 3-1. Please note the earlier loss of contact between thermocouple and ice in edge
vials than in center vials.
An overview of the Kv values determined using the gravimetric method is shown in Table 3-1.
The calculated Kv results showed good reproducibility between runs and even at different
shelf temperatures. As expected, Kv increased significantly with higher chamber pressures
due to additional heat transfer to the vial through gas conduction. Shelf temperature and
sublimation times needed to be reduced for higher chamber pressure to avoid removal of
more than 50% of the total amount of water which would lead to atypical drying behavior
(e.g. reduction of surface area due to removal of ice from parts of the vial area) and biased
results. The displayed results represent all 112 vials in the batch, i.e. both center and edge
vials which causes relatively high standard deviations of approximately 10% within each
experiment due to differences between the groups of vials. The variations between vials in
comparable location are much lower which will be discussed later on.
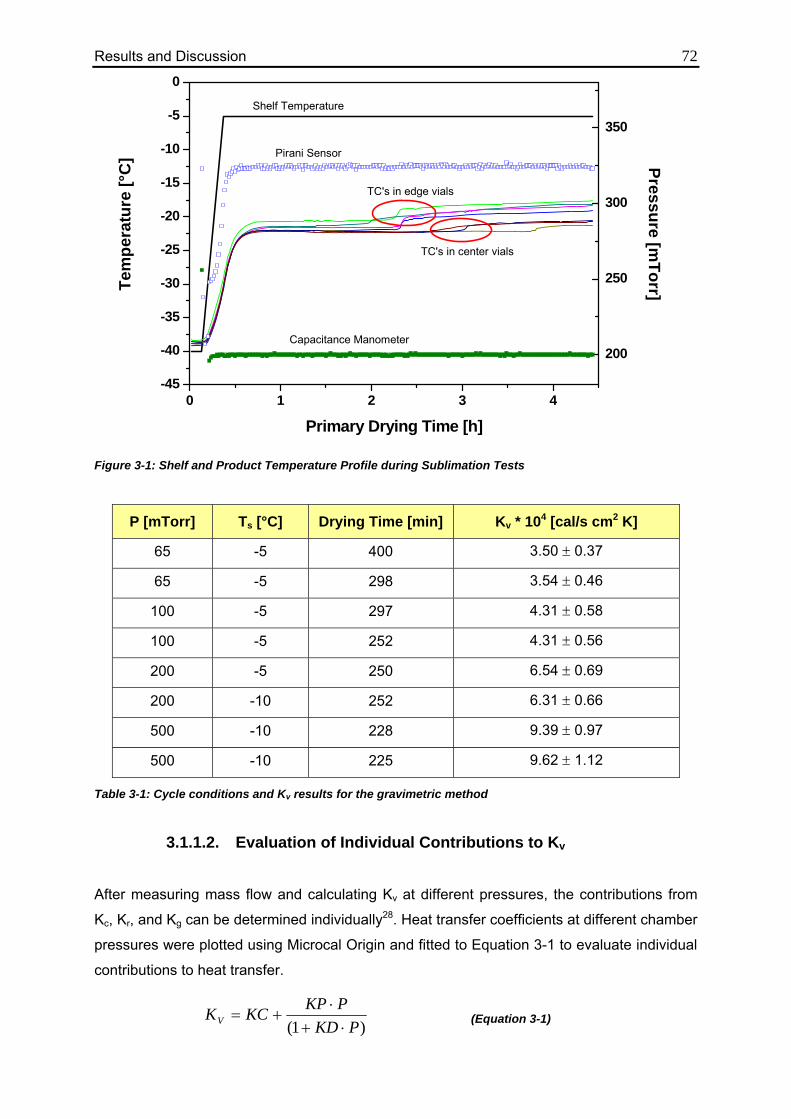
Results and Discussion 72
Figure 3-1: Shelf and Product Temperature Profile during Sublimation Tests
P [mTorr] Ts [°C] Drying Time [min] Kv * 104 [cal/s cm2 K]
65 -5 400 3.50 ± 0.37
65 -5 298 3.54 ± 0.46
100 -5 297 4.31 ± 0.58
100 -5 252 4.31 ± 0.56
200 -5 250 6.54 ± 0.69
200 -10 252 6.31 ± 0.66
500 -10 228 9.39 ± 0.97
500 -10 225 9.62 ± 1.12
Table 3-1: Cycle conditions and Kv results for the gravimetric method
3.1.1.2. Evaluation of Individual Contributions to Kv
After measuring mass flow and calculating Kv at different pressures, the contributions from
Kc, Kr, and Kg can be determined individually28. Heat transfer coefficients at different chamber
pressures were plotted using Microcal Origin and fitted to Equation 3-1 to evaluate individual
contributions to heat transfer.
(Equation 3-1) )1( PKD
PKPKCKV ⋅+⋅
+=
0 1 2 3 4-45
-40
-35
-30
-25
-20
-15
-10
-5
0
200
250
300
350
Capacitance Manometer
Pirani Sensor Pressure [mTorr]
Tem
pera
ture
[°C
]
Primary Drying Time [h]
TC's in center vials
TC's in edge vials
Shelf Temperature
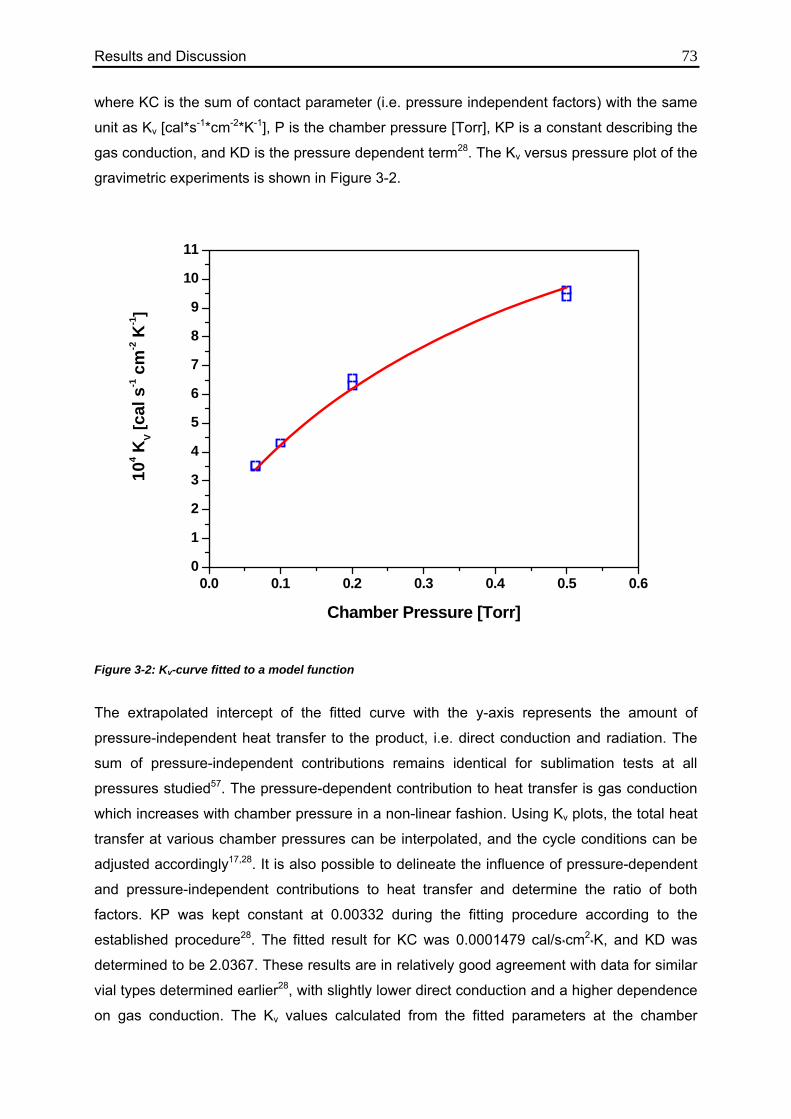
Results and Discussion 73 where KC is the sum of contact parameter (i.e. pressure independent factors) with the same
unit as Kv [cal*s-1*cm-2*K-1], P is the chamber pressure [Torr], KP is a constant describing the
gas conduction, and KD is the pressure dependent term28. The Kv versus pressure plot of the
gravimetric experiments is shown in Figure 3-2.
0.0 0.1 0.2 0.3 0.4 0.5 0.60
1
2
3
4
5
6
7
8
9
10
11
104 K
V [cal
s-1 c
m-2 K
-1]
Chamber Pressure [Torr]
Figure 3-2: Kv-curve fitted to a model function
The extrapolated intercept of the fitted curve with the y-axis represents the amount of
pressure-independent heat transfer to the product, i.e. direct conduction and radiation. The
sum of pressure-independent contributions remains identical for sublimation tests at all
pressures studied57. The pressure-dependent contribution to heat transfer is gas conduction
which increases with chamber pressure in a non-linear fashion. Using Kv plots, the total heat
transfer at various chamber pressures can be interpolated, and the cycle conditions can be
adjusted accordingly17,28. It is also possible to delineate the influence of pressure-dependent
and pressure-independent contributions to heat transfer and determine the ratio of both
factors. KP was kept constant at 0.00332 during the fitting procedure according to the
established procedure28. The fitted result for KC was 0.0001479 cal/s*cm2*K, and KD was
determined to be 2.0367. These results are in relatively good agreement with data for similar
vial types determined earlier28, with slightly lower direct conduction and a higher dependence
on gas conduction. The Kv values calculated from the fitted parameters at the chamber
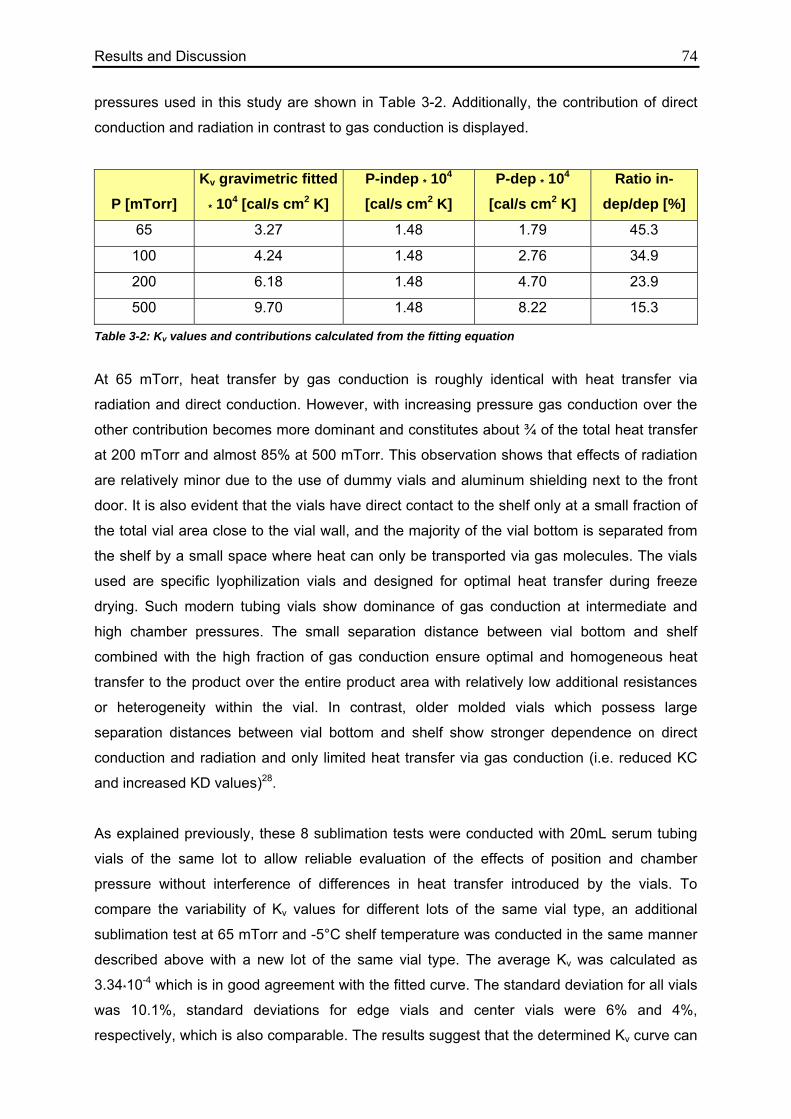
Results and Discussion 74 pressures used in this study are shown in Table 3-2. Additionally, the contribution of direct
conduction and radiation in contrast to gas conduction is displayed.
P [mTorr] Kv gravimetric fitted
* 104 [cal/s cm2 K] P-indep * 104 [cal/s cm2 K]
P-dep * 104 [cal/s cm2 K]
Ratio in-dep/dep [%]
65 3.27 1.48 1.79 45.3
100 4.24 1.48 2.76 34.9
200 6.18 1.48 4.70 23.9
500 9.70 1.48 8.22 15.3
Table 3-2: Kv values and contributions calculated from the fitting equation
At 65 mTorr, heat transfer by gas conduction is roughly identical with heat transfer via
radiation and direct conduction. However, with increasing pressure gas conduction over the
other contribution becomes more dominant and constitutes about ¾ of the total heat transfer
at 200 mTorr and almost 85% at 500 mTorr. This observation shows that effects of radiation
are relatively minor due to the use of dummy vials and aluminum shielding next to the front
door. It is also evident that the vials have direct contact to the shelf only at a small fraction of
the total vial area close to the vial wall, and the majority of the vial bottom is separated from
the shelf by a small space where heat can only be transported via gas molecules. The vials
used are specific lyophilization vials and designed for optimal heat transfer during freeze
drying. Such modern tubing vials show dominance of gas conduction at intermediate and
high chamber pressures. The small separation distance between vial bottom and shelf
combined with the high fraction of gas conduction ensure optimal and homogeneous heat
transfer to the product over the entire product area with relatively low additional resistances
or heterogeneity within the vial. In contrast, older molded vials which possess large
separation distances between vial bottom and shelf show stronger dependence on direct
conduction and radiation and only limited heat transfer via gas conduction (i.e. reduced KC
and increased KD values)28.
As explained previously, these 8 sublimation tests were conducted with 20mL serum tubing
vials of the same lot to allow reliable evaluation of the effects of position and chamber
pressure without interference of differences in heat transfer introduced by the vials. To
compare the variability of Kv values for different lots of the same vial type, an additional
sublimation test at 65 mTorr and -5°C shelf temperature was conducted in the same manner
described above with a new lot of the same vial type. The average Kv was calculated as
3.34*10-4 which is in good agreement with the fitted curve. The standard deviation for all vials
was 10.1%, standard deviations for edge vials and center vials were 6% and 4%,
respectively, which is also comparable. The results suggest that the determined Kv curve can
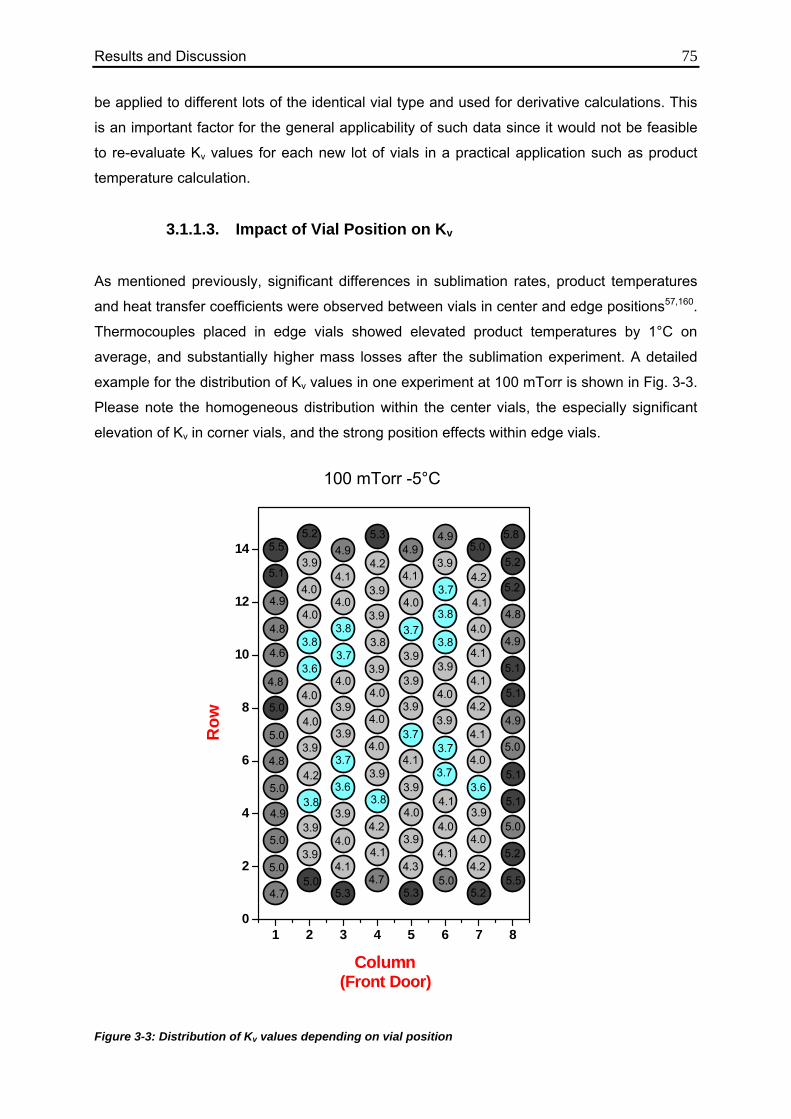
Results and Discussion 75 be applied to different lots of the identical vial type and used for derivative calculations. This
is an important factor for the general applicability of such data since it would not be feasible
to re-evaluate Kv values for each new lot of vials in a practical application such as product
temperature calculation.
3.1.1.3. Impact of Vial Position on Kv
As mentioned previously, significant differences in sublimation rates, product temperatures
and heat transfer coefficients were observed between vials in center and edge positions57,160.
Thermocouples placed in edge vials showed elevated product temperatures by 1°C on
average, and substantially higher mass losses after the sublimation experiment. A detailed
example for the distribution of Kv values in one experiment at 100 mTorr is shown in Fig. 3-3.
Please note the homogeneous distribution within the center vials, the especially significant
elevation of Kv in corner vials, and the strong position effects within edge vials.
Figure 3-3: Distribution of Kv values depending on vial position
1 2 3 4 5 6 7 80
2
4
6
8
10
12
14
3.7
4.94.9
3.9
3.74.1
4.0
5.3
3.73.8
3.8
3.9
3.9
3.9
4.0
3.9
3.9
3.9
3.7
3.8
3.9
3.93.7
3.9
4.0
4.0
4.0
3.8
3.7
3.93.6
4.2
4.7
4.1
3.94.1
4.0
4.0
4.1
5.3
4.03.9
4.1
5.04.3
Row
Column
4.1
5.3
4.24.9
3.9
3.9
4.1
4.0
4.7
3.8
4.04.0
4.0
3.7
4.8
5.0
5.03.9
4.25.0
3.84.9
3.95.0
3.9
5.05.0
4.8
5.8
5.25.0
5.2
4.8
4.2
4.1
5.2
4.04.9
5.1
5.1
4.9
4.1
4.1
4.2
4.15.0
5.13.6
5.13.9
5.04.0
5.2
5.54.2
4.0
5.2
3.95.5
4.0
4.0
5.1
4.9
4.83.8
3.64.6
(Front Door)
100 mTorr -5°C
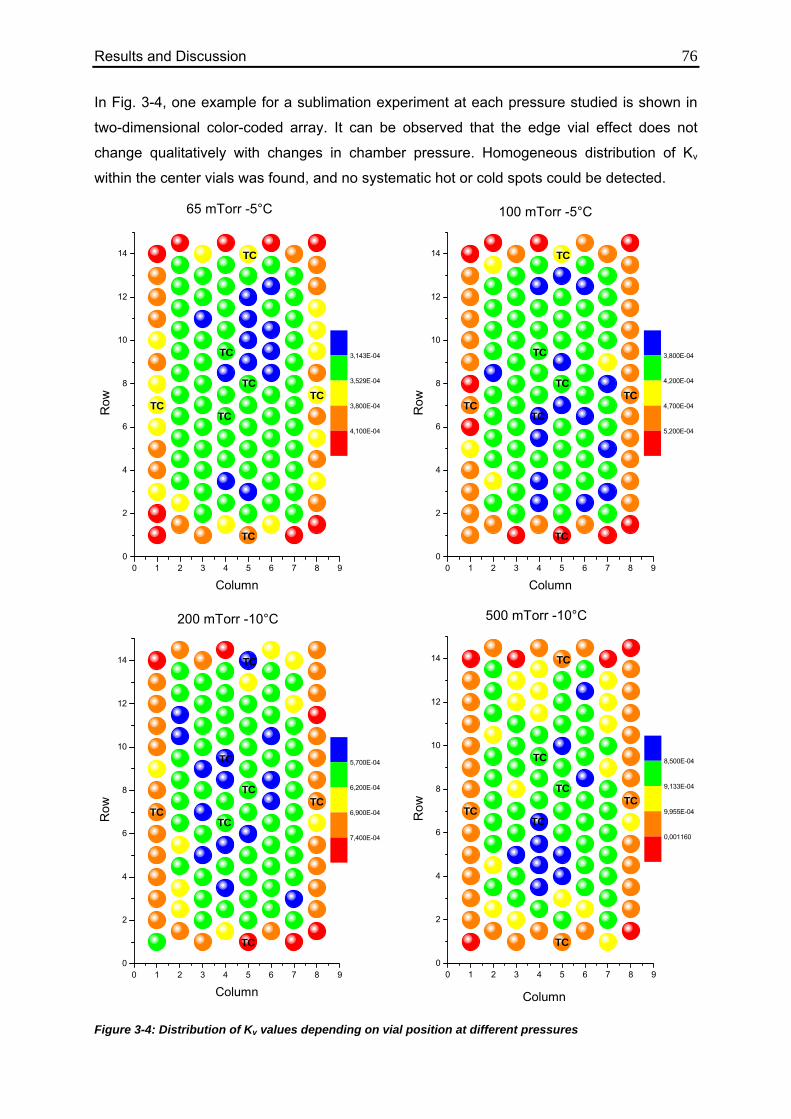
Results and Discussion 76 In Fig. 3-4, one example for a sublimation experiment at each pressure studied is shown in
two-dimensional color-coded array. It can be observed that the edge vial effect does not
change qualitatively with changes in chamber pressure. Homogeneous distribution of Kv
within the center vials was found, and no systematic hot or cold spots could be detected.
Figure 3-4: Distribution of Kv values depending on vial position at different pressures
0 1 2 3 4 5 6 7 8 90
2
4
6
8
10
12
14
65 mTorr -5°C
Row
Column
3,143E-04
3,529E-04
3,800E-04
4,100E-04
TC
TC
TC
TCTC
TC
TC
0 1 2 3 4 5 6 7 8 90
2
4
6
8
10
12
14
100 mTorr -5°C
Row
Column
3,800E-04
4,200E-04
4,700E-04
5,200E-04
TC
TC
TC
TCTC
TC
TC
0 1 2 3 4 5 6 7 8 90
2
4
6
8
10
12
14
200 mTorr -10°C
Row
Column
5,700E-04
6,200E-04
6,900E-04
7,400E-04
TC
TC
TC
TCTC
TC
TC
0 1 2 3 4 5 6 7 8 90
2
4
6
8
10
12
14
500 mTorr -10°C
Row
Column
8,500E-04
9,133E-04
9,955E-04
0,001160
TC
TC
TC
TCTC
TC
TC
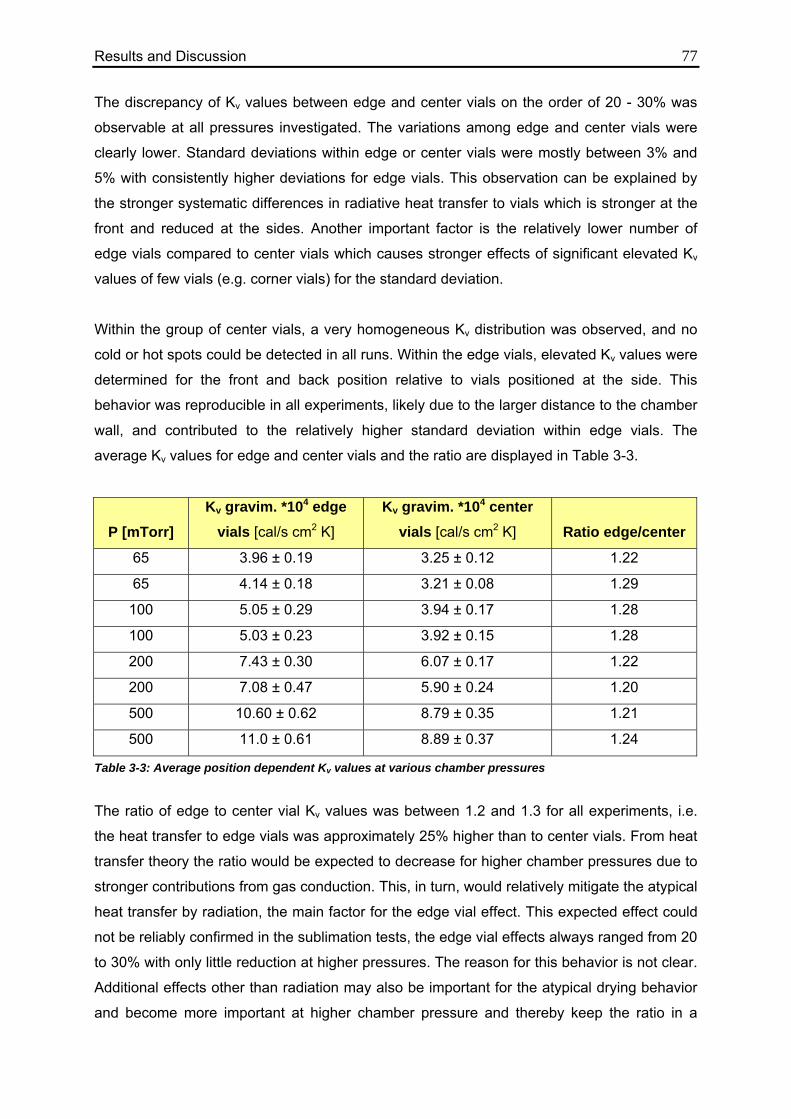
Results and Discussion 77 The discrepancy of Kv values between edge and center vials on the order of 20 - 30% was
observable at all pressures investigated. The variations among edge and center vials were
clearly lower. Standard deviations within edge or center vials were mostly between 3% and
5% with consistently higher deviations for edge vials. This observation can be explained by
the stronger systematic differences in radiative heat transfer to vials which is stronger at the
front and reduced at the sides. Another important factor is the relatively lower number of
edge vials compared to center vials which causes stronger effects of significant elevated Kv
values of few vials (e.g. corner vials) for the standard deviation.
Within the group of center vials, a very homogeneous Kv distribution was observed, and no
cold or hot spots could be detected in all runs. Within the edge vials, elevated Kv values were
determined for the front and back position relative to vials positioned at the side. This
behavior was reproducible in all experiments, likely due to the larger distance to the chamber
wall, and contributed to the relatively higher standard deviation within edge vials. The
average Kv values for edge and center vials and the ratio are displayed in Table 3-3.
P [mTorr] Kv gravim. *104 edge
vials [cal/s cm2 K] Kv gravim. *104 center
vials [cal/s cm2 K] Ratio edge/center
65 3.96 ± 0.19 3.25 ± 0.12 1.22
65 4.14 ± 0.18 3.21 ± 0.08 1.29
100 5.05 ± 0.29 3.94 ± 0.17 1.28
100 5.03 ± 0.23 3.92 ± 0.15 1.28
200 7.43 ± 0.30 6.07 ± 0.17 1.22
200 7.08 ± 0.47 5.90 ± 0.24 1.20
500 10.60 ± 0.62 8.79 ± 0.35 1.21
500 11.0 ± 0.61 8.89 ± 0.37 1.24
Table 3-3: Average position dependent Kv values at various chamber pressures
The ratio of edge to center vial Kv values was between 1.2 and 1.3 for all experiments, i.e.
the heat transfer to edge vials was approximately 25% higher than to center vials. From heat
transfer theory the ratio would be expected to decrease for higher chamber pressures due to
stronger contributions from gas conduction. This, in turn, would relatively mitigate the atypical
heat transfer by radiation, the main factor for the edge vial effect. This expected effect could
not be reliably confirmed in the sublimation tests, the edge vial effects always ranged from 20
to 30% with only little reduction at higher pressures. The reason for this behavior is not clear.
Additional effects other than radiation may also be important for the atypical drying behavior
and become more important at higher chamber pressure and thereby keep the ratio in a
Results and Discussion 78 similar range57,160. The delineation of these contributions was beyond the scope of this study
and needs to be evaluated with additional experiments.
The significant differences determined between edge and center vials in these experiments
make it clear that for a reliable evaluation of vial heat transfer behavior it is imperative to
study the collective of vials and not only a small group or even isolated vials on the shelf.
Exact and representative Kv measurements require placement in the desired array and in
different positions to evaluate atypical drying effects, especially when monitoring of the entire
batch will be performed, or changes introduced by scale-up or transfer of cycles need to be
considered. Also, purely theoretical modeling approaches which calculate Kv as a function of
Kc, Kg and Kr may be misleading if they do not include atypical drying effects such as side
radiation as well as contact to neighboring vials. In this study, batch average product
temperatures were to be calculated from mass flow measurements. Since the mass flow
reflects vials in all positions, it is important to obtain information about vials in all positions
and use this information for the Kv calculation. However, the representativeness of average
Kv values is reduced by the inclusion of ramping phases and non-steady state periods. This
problem can be overcome by measuring batch Kv values directly from TDLAS data which is
discussed in the following chapter.
3.1.2. TDLAS Measurements 3.1.2.1. Method 1: Calculation over the Entire Sublimation Time
The theoretical basis for calculation of Kv data based on TDLAS mass flow measurements is
comparable to the gravimetric approach described above. The mass of water removed from
the product was recorded during the entire sublimation time (EST), and product temperatures
as well as shelf temperature were measured using thermocouples. Since only mass flow
from all vials in the batch can be measured without discrimination of position, it was not
possible to evaluate individual radiation effects and thus the extent of elevated heat transfer
to edge vials. However, it is possible to establish a Kv against chamber pressure curve as
described above with significantly reduced effort and without the time-intensive weighing
procedure.
To validate the comparability of this novel approach and its ability to generate Kv values
comparable to the traditional weighing method, Kv data was first calculated from average
thermocouple data and integrated mass flow readings over the entire sublimation time from
TDLAS measurements generated during the 8 sublimation experiments described above.
This way the temperature data used for the calculations is identical, and the integrated total
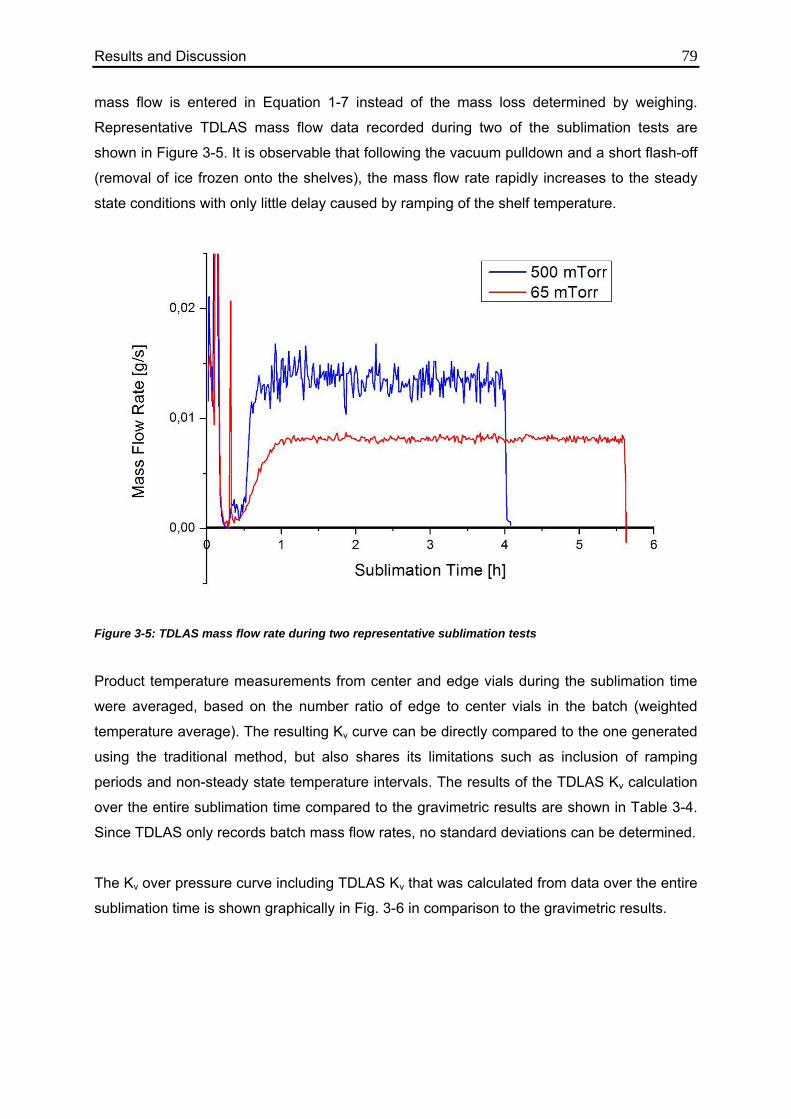
Results and Discussion 79 mass flow is entered in Equation 1-7 instead of the mass loss determined by weighing.
Representative TDLAS mass flow data recorded during two of the sublimation tests are
shown in Figure 3-5. It is observable that following the vacuum pulldown and a short flash-off
(removal of ice frozen onto the shelves), the mass flow rate rapidly increases to the steady
state conditions with only little delay caused by ramping of the shelf temperature.
Figure 3-5: TDLAS mass flow rate during two representative sublimation tests
Product temperature measurements from center and edge vials during the sublimation time
were averaged, based on the number ratio of edge to center vials in the batch (weighted
temperature average). The resulting Kv curve can be directly compared to the one generated
using the traditional method, but also shares its limitations such as inclusion of ramping
periods and non-steady state temperature intervals. The results of the TDLAS Kv calculation
over the entire sublimation time compared to the gravimetric results are shown in Table 3-4.
Since TDLAS only records batch mass flow rates, no standard deviations can be determined.
The Kv over pressure curve including TDLAS Kv that was calculated from data over the entire
sublimation time is shown graphically in Fig. 3-6 in comparison to the gravimetric results.
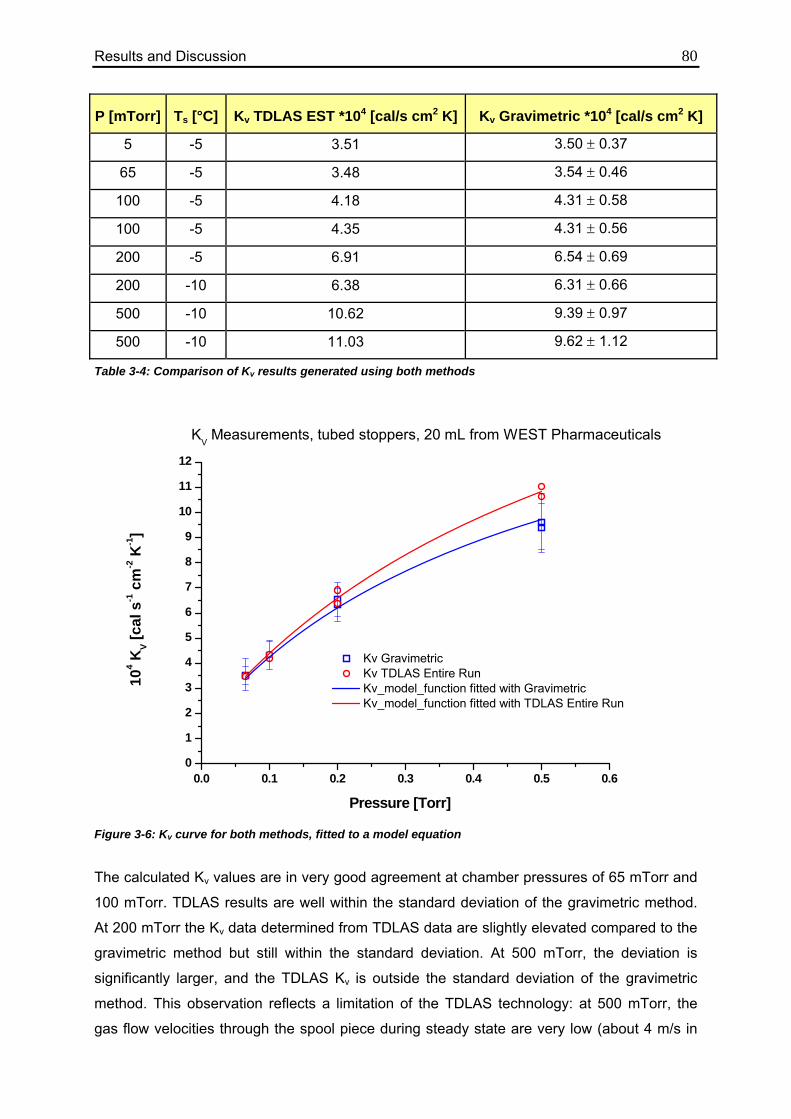
Results and Discussion 80
P [mTorr] Ts [°C] Kv TDLAS EST *104 [cal/s cm2 K] Kv Gravimetric *104 [cal/s cm2 K]
5 -5 3.51 3.50 ± 0.37
65 -5 3.48 3.54 ± 0.46
100 -5 4.18 4.31 ± 0.58
100 -5 4.35 4.31 ± 0.56
200 -5 6.91 6.54 ± 0.69
200 -10 6.38 6.31 ± 0.66
500 -10 10.62 9.39 ± 0.97
500 -10 11.03 9.62 ± 1.12
Table 3-4: Comparison of Kv results generated using both methods
0.0 0.1 0.2 0.3 0.4 0.5 0.60
1
2
3
4
5
6
7
8
9
10
11
12
Kv Gravimetric Kv TDLAS Entire Run Kv_model_function fitted with Gravimetric Kv_model_function fitted with TDLAS Entire Run
104 K
V [cal
s-1 c
m-2 K
-1]
Pressure [Torr]
KV Measurements, tubed stoppers, 20 mL from WEST Pharmaceuticals
Figure 3-6: Kv curve for both methods, fitted to a model equation
The calculated Kv values are in very good agreement at chamber pressures of 65 mTorr and
100 mTorr. TDLAS results are well within the standard deviation of the gravimetric method.
At 200 mTorr the Kv data determined from TDLAS data are slightly elevated compared to the
gravimetric method but still within the standard deviation. At 500 mTorr, the deviation is
significantly larger, and the TDLAS Kv is outside the standard deviation of the gravimetric
method. This observation reflects a limitation of the TDLAS technology: at 500 mTorr, the
gas flow velocities through the spool piece during steady state are very low (about 4 m/s in
Stefan Schneid
Linien
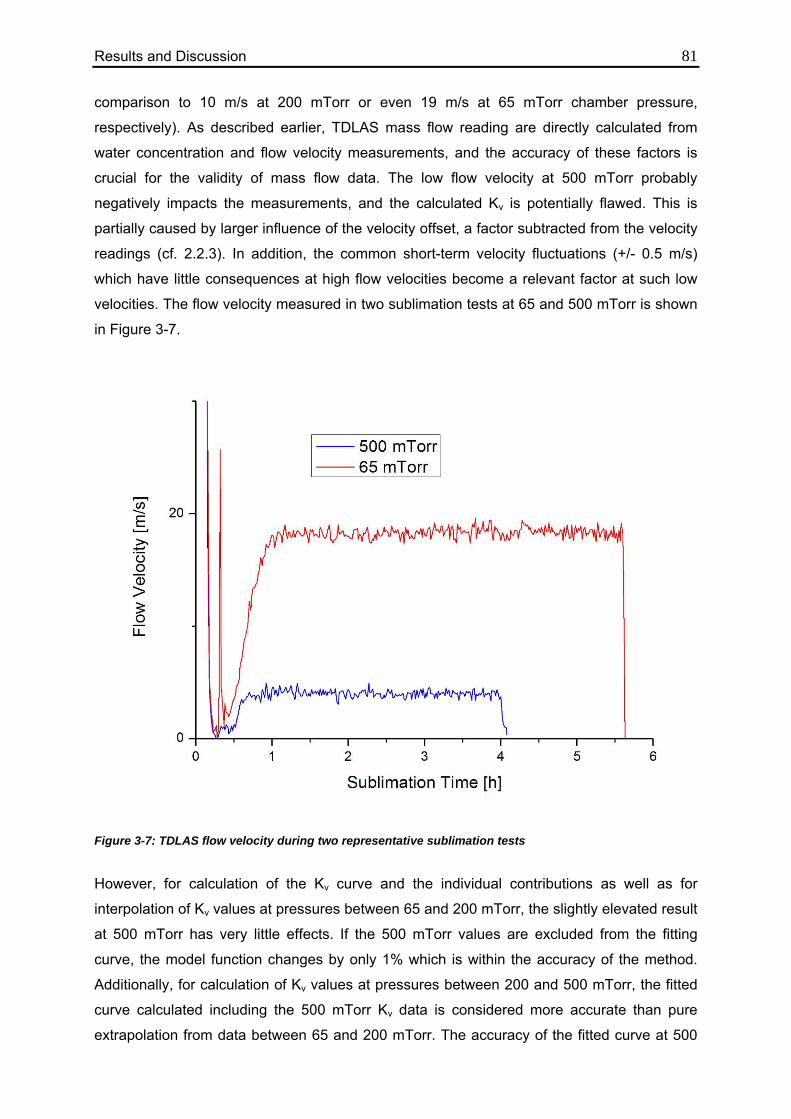
Results and Discussion 81 comparison to 10 m/s at 200 mTorr or even 19 m/s at 65 mTorr chamber pressure,
respectively). As described earlier, TDLAS mass flow reading are directly calculated from
water concentration and flow velocity measurements, and the accuracy of these factors is
crucial for the validity of mass flow data. The low flow velocity at 500 mTorr probably
negatively impacts the measurements, and the calculated Kv is potentially flawed. This is
partially caused by larger influence of the velocity offset, a factor subtracted from the velocity
readings (cf. 2.2.3). In addition, the common short-term velocity fluctuations (+/- 0.5 m/s)
which have little consequences at high flow velocities become a relevant factor at such low
velocities. The flow velocity measured in two sublimation tests at 65 and 500 mTorr is shown
in Figure 3-7.
Figure 3-7: TDLAS flow velocity during two representative sublimation tests
However, for calculation of the Kv curve and the individual contributions as well as for
interpolation of Kv values at pressures between 65 and 200 mTorr, the slightly elevated result
at 500 mTorr has very little effects. If the 500 mTorr values are excluded from the fitting
curve, the model function changes by only 1% which is within the accuracy of the method.
Additionally, for calculation of Kv values at pressures between 200 and 500 mTorr, the fitted
curve calculated including the 500 mTorr Kv data is considered more accurate than pure
extrapolation from data between 65 and 200 mTorr. The accuracy of the fitted curve at 500
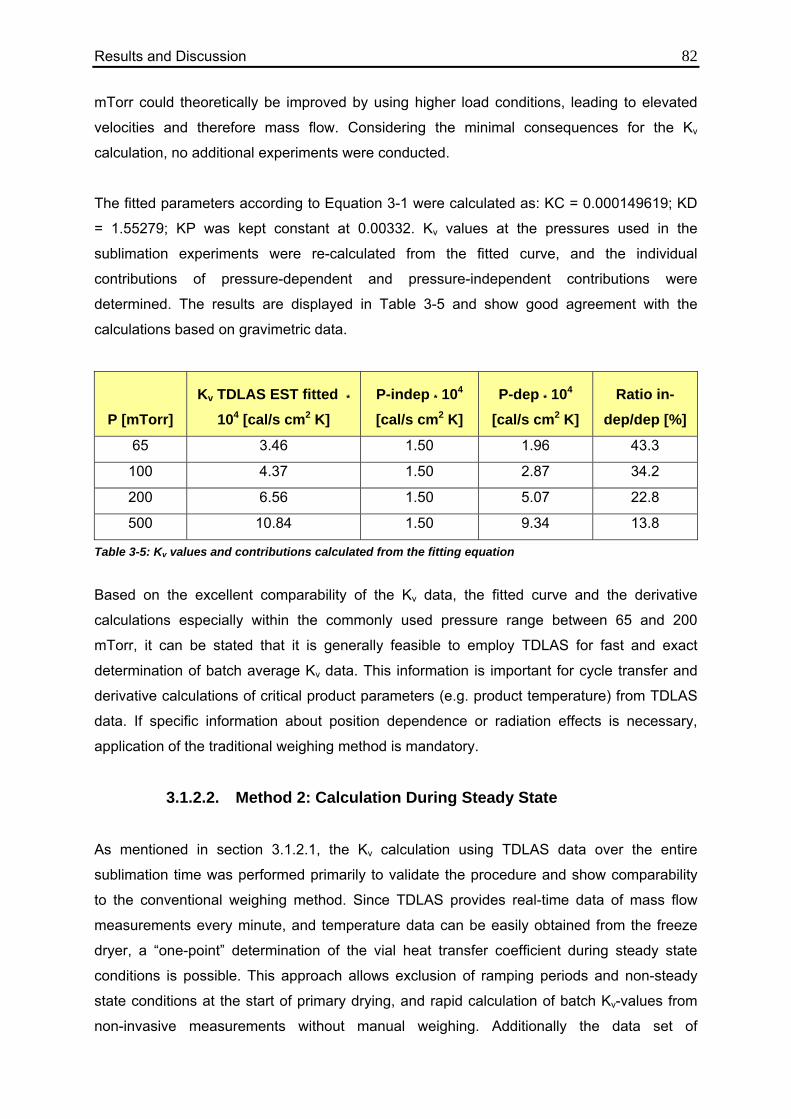
Results and Discussion 82 mTorr could theoretically be improved by using higher load conditions, leading to elevated
velocities and therefore mass flow. Considering the minimal consequences for the Kv
calculation, no additional experiments were conducted.
The fitted parameters according to Equation 3-1 were calculated as: KC = 0.000149619; KD
= 1.55279; KP was kept constant at 0.00332. Kv values at the pressures used in the
sublimation experiments were re-calculated from the fitted curve, and the individual
contributions of pressure-dependent and pressure-independent contributions were
determined. The results are displayed in Table 3-5 and show good agreement with the
calculations based on gravimetric data.
P [mTorr]
Kv TDLAS EST fitted * 104 [cal/s cm2 K]
P-indep * 104 [cal/s cm2 K]
P-dep * 104 [cal/s cm2 K]
Ratio in-dep/dep [%]
65 3.46 1.50 1.96 43.3
100 4.37 1.50 2.87 34.2
200 6.56 1.50 5.07 22.8
500 10.84 1.50 9.34 13.8
Table 3-5: Kv values and contributions calculated from the fitting equation
Based on the excellent comparability of the Kv data, the fitted curve and the derivative
calculations especially within the commonly used pressure range between 65 and 200
mTorr, it can be stated that it is generally feasible to employ TDLAS for fast and exact
determination of batch average Kv data. This information is important for cycle transfer and
derivative calculations of critical product parameters (e.g. product temperature) from TDLAS
data. If specific information about position dependence or radiation effects is necessary,
application of the traditional weighing method is mandatory.
3.1.2.2. Method 2: Calculation During Steady State
As mentioned in section 3.1.2.1, the Kv calculation using TDLAS data over the entire
sublimation time was performed primarily to validate the procedure and show comparability
to the conventional weighing method. Since TDLAS provides real-time data of mass flow
measurements every minute, and temperature data can be easily obtained from the freeze
dryer, a “one-point” determination of the vial heat transfer coefficient during steady state
conditions is possible. This approach allows exclusion of ramping periods and non-steady
state conditions at the start of primary drying, and rapid calculation of batch Kv-values from
non-invasive measurements without manual weighing. Additionally the data set of
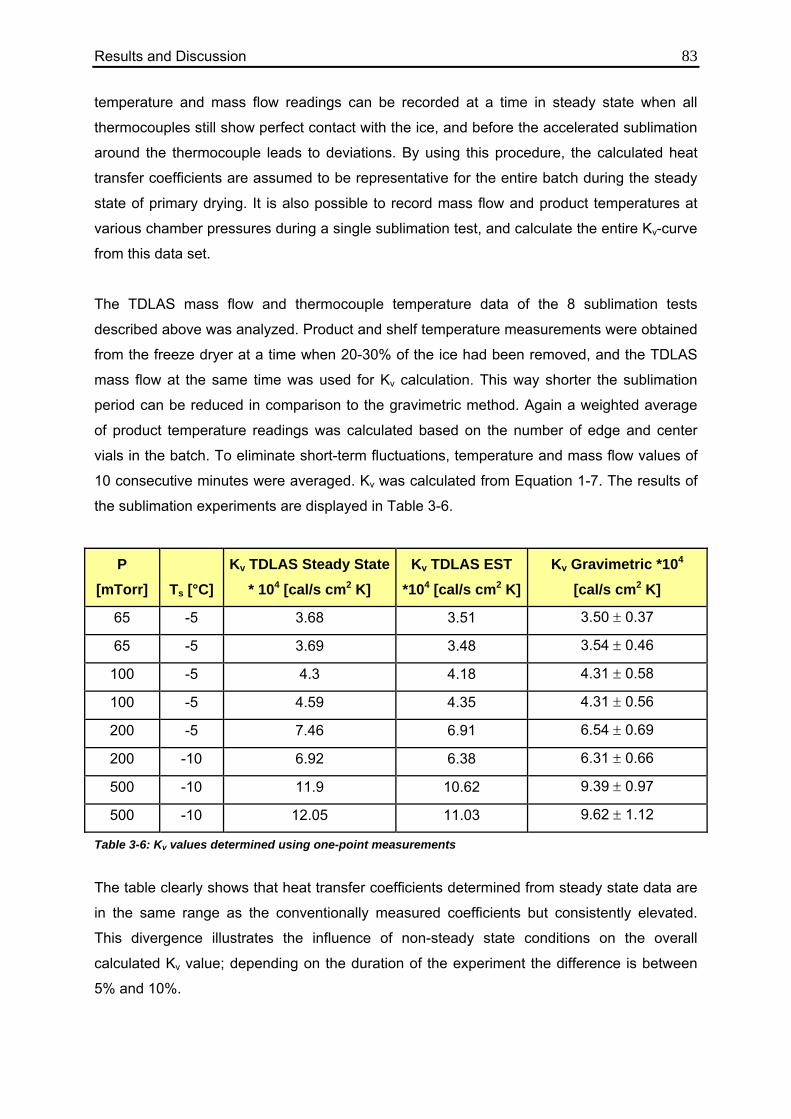
Results and Discussion 83 temperature and mass flow readings can be recorded at a time in steady state when all
thermocouples still show perfect contact with the ice, and before the accelerated sublimation
around the thermocouple leads to deviations. By using this procedure, the calculated heat
transfer coefficients are assumed to be representative for the entire batch during the steady
state of primary drying. It is also possible to record mass flow and product temperatures at
various chamber pressures during a single sublimation test, and calculate the entire Kv-curve
from this data set.
The TDLAS mass flow and thermocouple temperature data of the 8 sublimation tests
described above was analyzed. Product and shelf temperature measurements were obtained
from the freeze dryer at a time when 20-30% of the ice had been removed, and the TDLAS
mass flow at the same time was used for Kv calculation. This way shorter the sublimation
period can be reduced in comparison to the gravimetric method. Again a weighted average
of product temperature readings was calculated based on the number of edge and center
vials in the batch. To eliminate short-term fluctuations, temperature and mass flow values of
10 consecutive minutes were averaged. Kv was calculated from Equation 1-7. The results of
the sublimation experiments are displayed in Table 3-6.
P [mTorr] Ts [°C]
Kv TDLAS Steady State * 104 [cal/s cm2 K]
Kv TDLAS EST *104 [cal/s cm2 K]
Kv Gravimetric *104 [cal/s cm2 K]
65 -5 3.68 3.51 3.50 ± 0.37
65 -5 3.69 3.48 3.54 ± 0.46
100 -5 4.3 4.18 4.31 ± 0.58
100 -5 4.59 4.35 4.31 ± 0.56
200 -5 7.46 6.91 6.54 ± 0.69
200 -10 6.92 6.38 6.31 ± 0.66
500 -10 11.9 10.62 9.39 ± 0.97
500 -10 12.05 11.03 9.62 ± 1.12
Table 3-6: Kv values determined using one-point measurements
The table clearly shows that heat transfer coefficients determined from steady state data are
in the same range as the conventionally measured coefficients but consistently elevated.
This divergence illustrates the influence of non-steady state conditions on the overall
calculated Kv value; depending on the duration of the experiment the difference is between
5% and 10%.
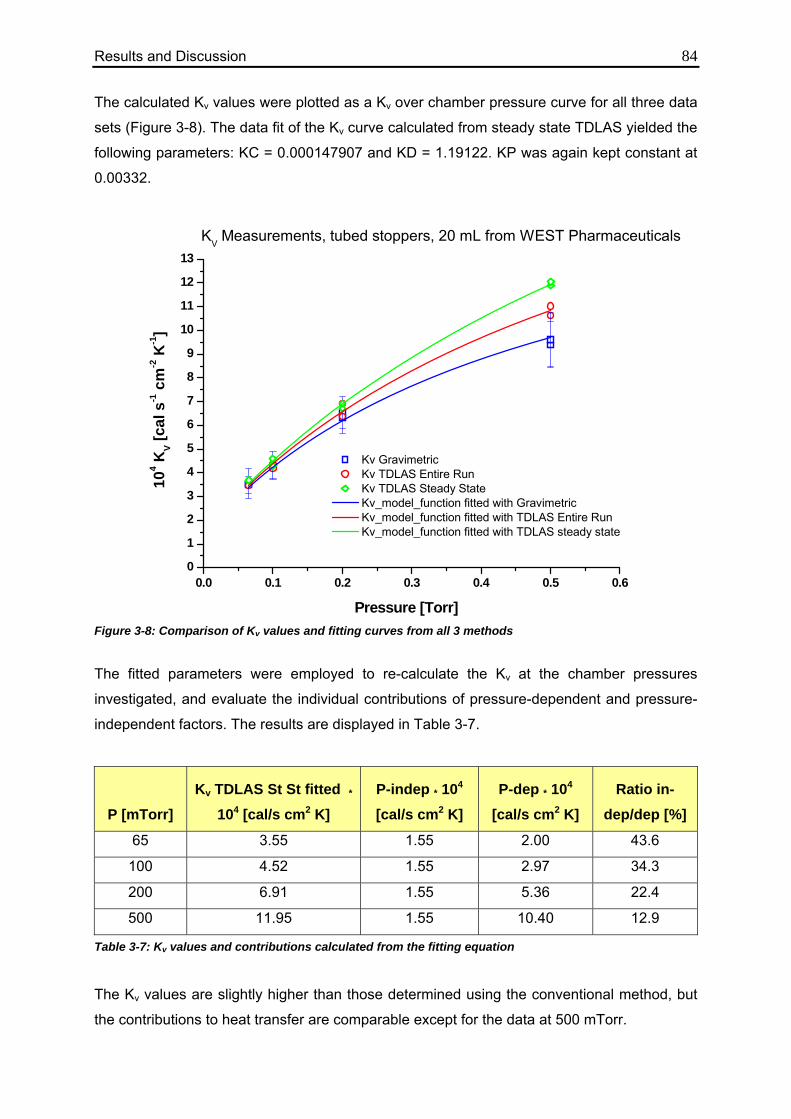
Results and Discussion 84 The calculated Kv values were plotted as a Kv over chamber pressure curve for all three data
sets (Figure 3-8). The data fit of the Kv curve calculated from steady state TDLAS yielded the
following parameters: KC = 0.000147907 and KD = 1.19122. KP was again kept constant at
0.00332.
0.0 0.1 0.2 0.3 0.4 0.5 0.60
1
2
3
4
5
6
7
8
9
10
11
12
13
Kv Gravimetric Kv TDLAS Entire Run Kv TDLAS Steady State Kv_model_function fitted with Gravimetric Kv_model_function fitted with TDLAS Entire Run Kv_model_function fitted with TDLAS steady state
104 K
V [cal
s-1 c
m-2 K
-1]
Pressure [Torr]
KV Measurements, tubed stoppers, 20 mL from WEST Pharmaceuticals
Figure 3-8: Comparison of Kv values and fitting curves from all 3 methods
The fitted parameters were employed to re-calculate the Kv at the chamber pressures
investigated, and evaluate the individual contributions of pressure-dependent and pressure-
independent factors. The results are displayed in Table 3-7.
P [mTorr]
Kv TDLAS St St fitted * 104 [cal/s cm2 K]
P-indep * 104 [cal/s cm2 K]
P-dep * 104 [cal/s cm2 K]
Ratio in-dep/dep [%]
65 3.55 1.55 2.00 43.6
100 4.52 1.55 2.97 34.3
200 6.91 1.55 5.36 22.4
500 11.95 1.55 10.40 12.9
Table 3-7: Kv values and contributions calculated from the fitting equation
The Kv values are slightly higher than those determined using the conventional method, but
the contributions to heat transfer are comparable except for the data at 500 mTorr.
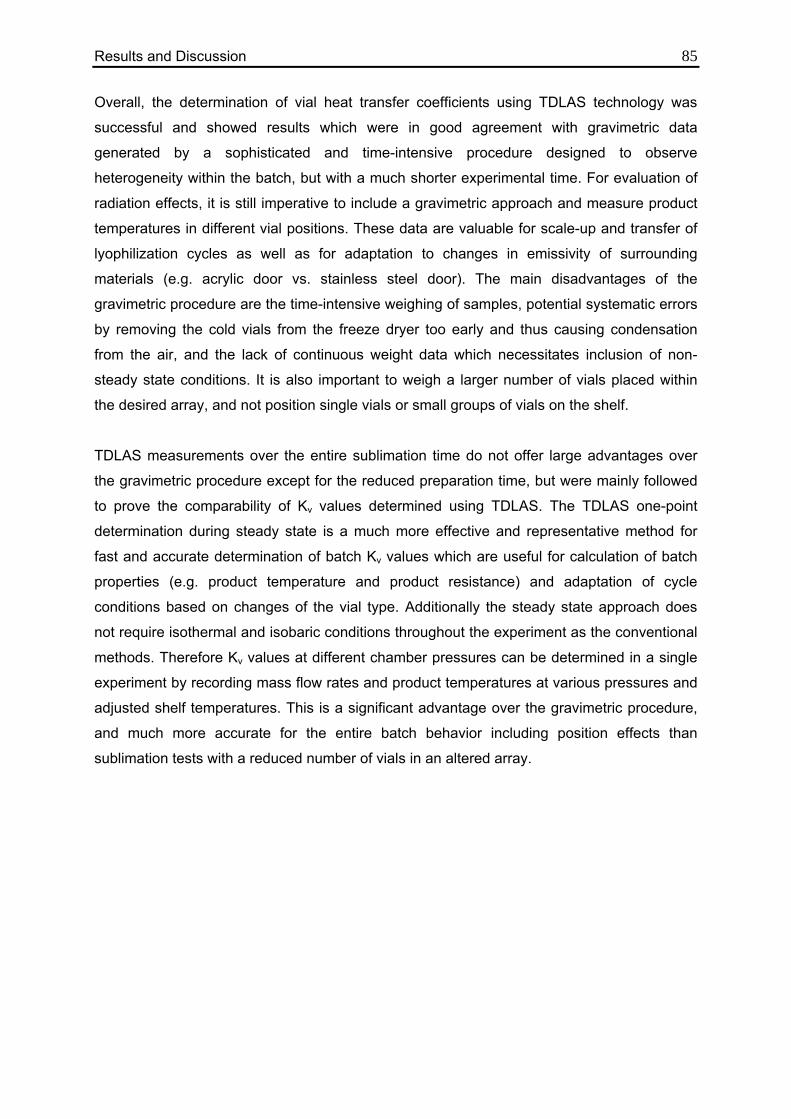
Results and Discussion 85 Overall, the determination of vial heat transfer coefficients using TDLAS technology was
successful and showed results which were in good agreement with gravimetric data
generated by a sophisticated and time-intensive procedure designed to observe
heterogeneity within the batch, but with a much shorter experimental time. For evaluation of
radiation effects, it is still imperative to include a gravimetric approach and measure product
temperatures in different vial positions. These data are valuable for scale-up and transfer of
lyophilization cycles as well as for adaptation to changes in emissivity of surrounding
materials (e.g. acrylic door vs. stainless steel door). The main disadvantages of the
gravimetric procedure are the time-intensive weighing of samples, potential systematic errors
by removing the cold vials from the freeze dryer too early and thus causing condensation
from the air, and the lack of continuous weight data which necessitates inclusion of non-
steady state conditions. It is also important to weigh a larger number of vials placed within
the desired array, and not position single vials or small groups of vials on the shelf.
TDLAS measurements over the entire sublimation time do not offer large advantages over
the gravimetric procedure except for the reduced preparation time, but were mainly followed
to prove the comparability of Kv values determined using TDLAS. The TDLAS one-point
determination during steady state is a much more effective and representative method for
fast and accurate determination of batch Kv values which are useful for calculation of batch
properties (e.g. product temperature and product resistance) and adaptation of cycle
conditions based on changes of the vial type. Additionally the steady state approach does
not require isothermal and isobaric conditions throughout the experiment as the conventional
methods. Therefore Kv values at different chamber pressures can be determined in a single
experiment by recording mass flow rates and product temperatures at various pressures and
adjusted shelf temperatures. This is a significant advantage over the gravimetric procedure,
and much more accurate for the entire batch behavior including position effects than
sublimation tests with a reduced number of vials in an altered array.
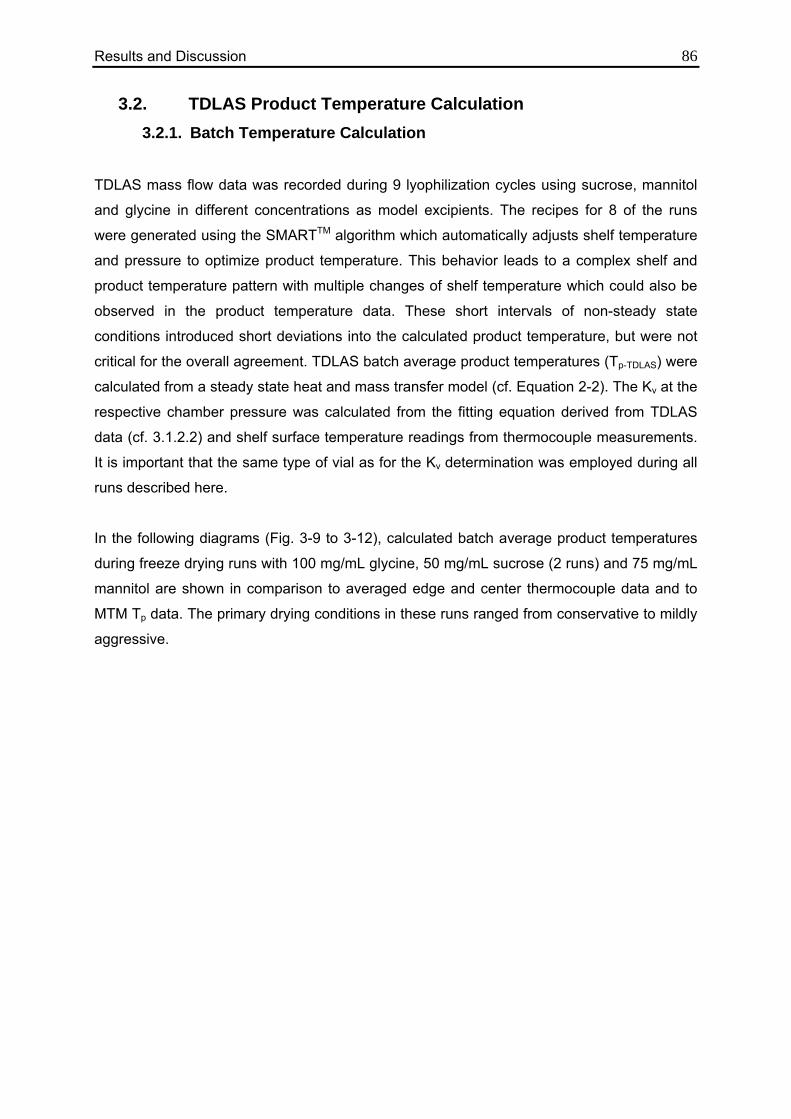
Results and Discussion 86
3.2. TDLAS Product Temperature Calculation 3.2.1. Batch Temperature Calculation
TDLAS mass flow data was recorded during 9 lyophilization cycles using sucrose, mannitol
and glycine in different concentrations as model excipients. The recipes for 8 of the runs
were generated using the SMARTTM algorithm which automatically adjusts shelf temperature
and pressure to optimize product temperature. This behavior leads to a complex shelf and
product temperature pattern with multiple changes of shelf temperature which could also be
observed in the product temperature data. These short intervals of non-steady state
conditions introduced short deviations into the calculated product temperature, but were not
critical for the overall agreement. TDLAS batch average product temperatures (Tp-TDLAS) were
calculated from a steady state heat and mass transfer model (cf. Equation 2-2). The Kv at the
respective chamber pressure was calculated from the fitting equation derived from TDLAS
data (cf. 3.1.2.2) and shelf surface temperature readings from thermocouple measurements.
It is important that the same type of vial as for the Kv determination was employed during all
runs described here.
In the following diagrams (Fig. 3-9 to 3-12), calculated batch average product temperatures
during freeze drying runs with 100 mg/mL glycine, 50 mg/mL sucrose (2 runs) and 75 mg/mL
mannitol are shown in comparison to averaged edge and center thermocouple data and to
MTM Tp data. The primary drying conditions in these runs ranged from conservative to mildly
aggressive.
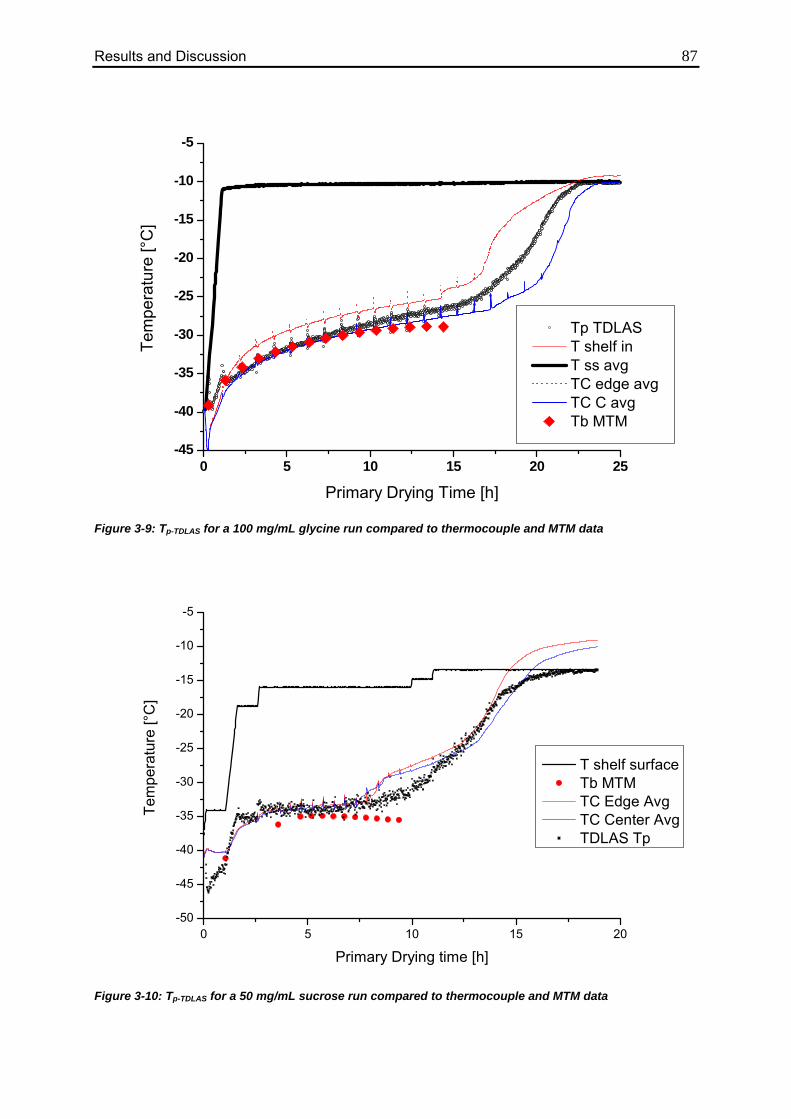
Results and Discussion 87
0 5 10 15 20 25-45
-40
-35
-30
-25
-20
-15
-10
-5
Tp TDLAS T shelf in T ss avg TC edge avg TC C avg Tb MTM
Tem
pera
ture
[°C
]
Primary Drying Time [h]
Figure 3-9: Tp-TDLAS for a 100 mg/mL glycine run compared to thermocouple and MTM data
0 5 10 15 20-50
-45
-40
-35
-30
-25
-20
-15
-10
-5
Tem
pera
ture
[°C
]
Primary Drying time [h]
T shelf surface Tb MTM TC Edge Avg TC Center Avg TDLAS Tp
Figure 3-10: Tp-TDLAS for a 50 mg/mL sucrose run compared to thermocouple and MTM data
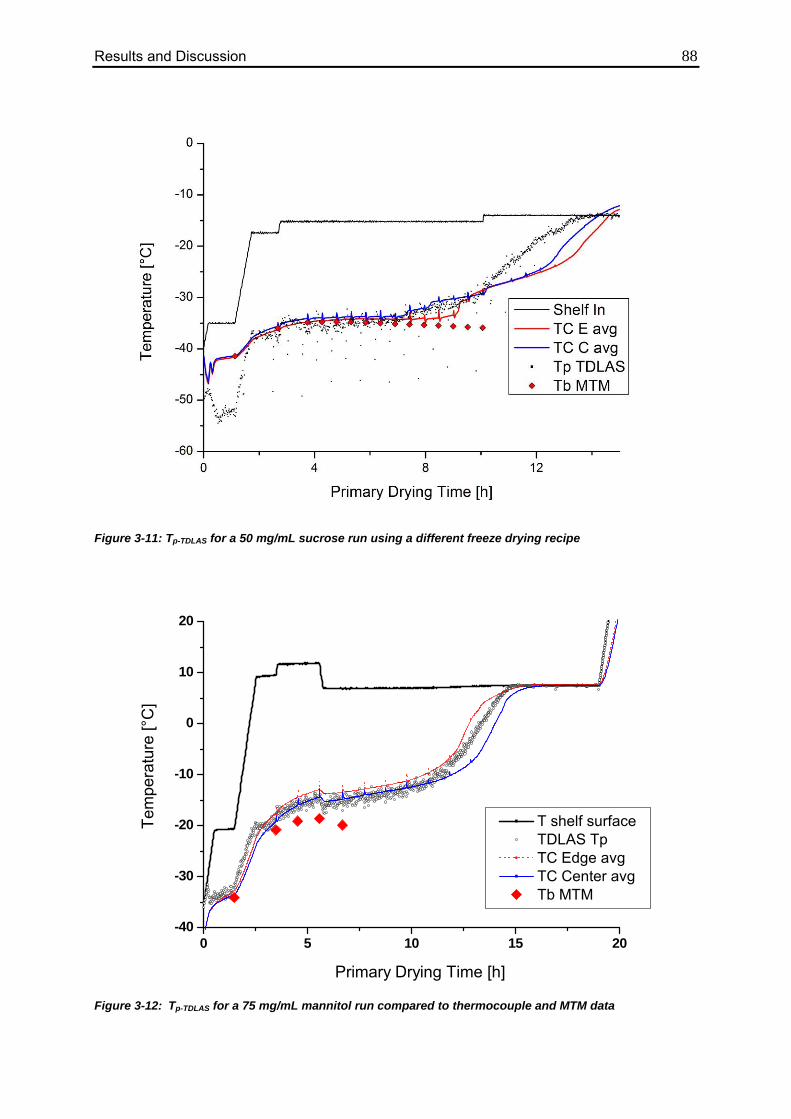
Results and Discussion 88
Figure 3-11: Tp-TDLAS for a 50 mg/mL sucrose run using a different freeze drying recipe
0 5 10 15 20-40
-30
-20
-10
0
10
20
T shelf surface TDLAS Tp TC Edge avg TC Center avg Tb MTM
Tem
pera
ture
[°C
]
Primary Drying Time [h]
Figure 3-12: Tp-TDLAS for a 75 mg/mL mannitol run compared to thermocouple and MTM data
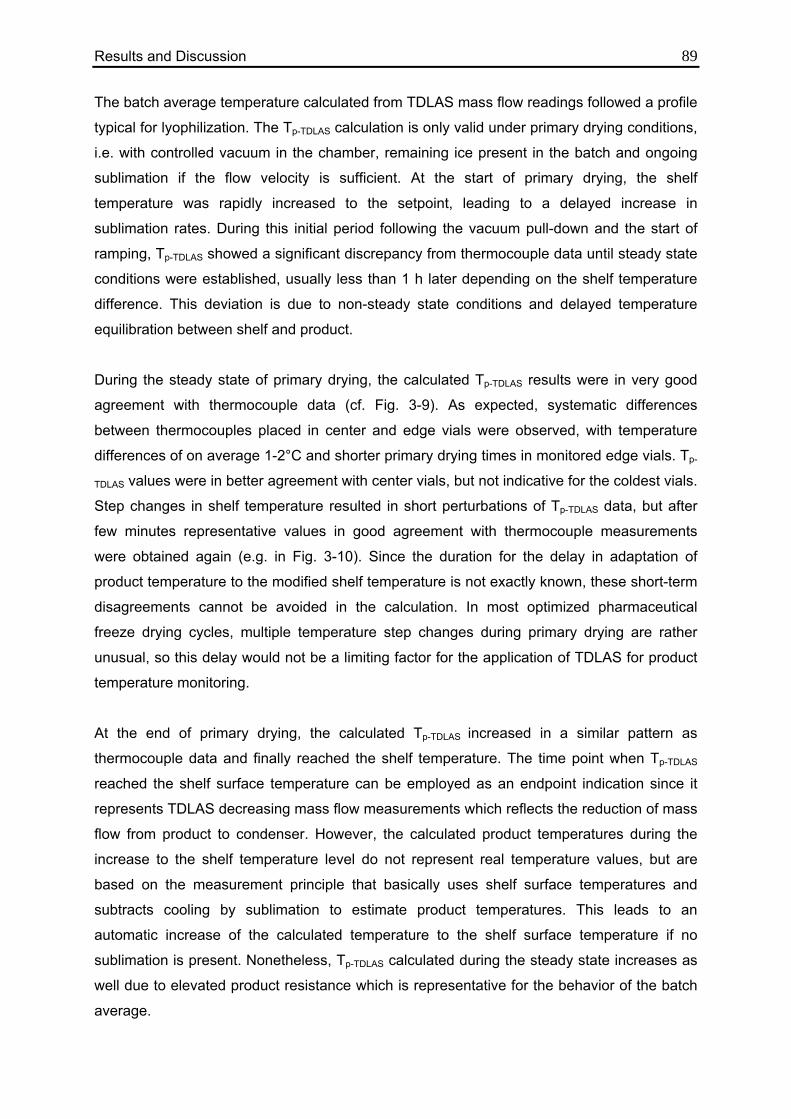
Results and Discussion 89 The batch average temperature calculated from TDLAS mass flow readings followed a profile
typical for lyophilization. The Tp-TDLAS calculation is only valid under primary drying conditions,
i.e. with controlled vacuum in the chamber, remaining ice present in the batch and ongoing
sublimation if the flow velocity is sufficient. At the start of primary drying, the shelf
temperature was rapidly increased to the setpoint, leading to a delayed increase in
sublimation rates. During this initial period following the vacuum pull-down and the start of
ramping, Tp-TDLAS showed a significant discrepancy from thermocouple data until steady state
conditions were established, usually less than 1 h later depending on the shelf temperature
difference. This deviation is due to non-steady state conditions and delayed temperature
equilibration between shelf and product.
During the steady state of primary drying, the calculated Tp-TDLAS results were in very good
agreement with thermocouple data (cf. Fig. 3-9). As expected, systematic differences
between thermocouples placed in center and edge vials were observed, with temperature
differences of on average 1-2°C and shorter primary drying times in monitored edge vials. Tp-
TDLAS values were in better agreement with center vials, but not indicative for the coldest vials.
Step changes in shelf temperature resulted in short perturbations of Tp-TDLAS data, but after
few minutes representative values in good agreement with thermocouple measurements
were obtained again (e.g. in Fig. 3-10). Since the duration for the delay in adaptation of
product temperature to the modified shelf temperature is not exactly known, these short-term
disagreements cannot be avoided in the calculation. In most optimized pharmaceutical
freeze drying cycles, multiple temperature step changes during primary drying are rather
unusual, so this delay would not be a limiting factor for the application of TDLAS for product
temperature monitoring.
At the end of primary drying, the calculated Tp-TDLAS increased in a similar pattern as
thermocouple data and finally reached the shelf temperature. The time point when Tp-TDLAS
reached the shelf surface temperature can be employed as an endpoint indication since it
represents TDLAS decreasing mass flow measurements which reflects the reduction of mass
flow from product to condenser. However, the calculated product temperatures during the
increase to the shelf temperature level do not represent real temperature values, but are
based on the measurement principle that basically uses shelf surface temperatures and
subtracts cooling by sublimation to estimate product temperatures. This leads to an
automatic increase of the calculated temperature to the shelf surface temperature if no
sublimation is present. Nonetheless, Tp-TDLAS calculated during the steady state increases as
well due to elevated product resistance which is representative for the behavior of the batch
average.

Results and Discussion 90 This glycine lyophilization run shows a simple temperature profile with constant shelf
temperature throughout primary drying. This approach was used to maintain steady state
conditions during primary drying and verify the validity of the calculated temperatures. The
Tp-TDLAS is in good agreement with thermocouples placed in center vials and about 2°C below
temperatures in edge vials. The endpoint indication lies between the two thermocouple
averages, illustrating the lower bias of TDLAS measurements towards center vials.
Additionally, the calculated temperature is in excellent agreement with temperature data at
the bottom of the vial calculated from MTM measurements in the first half of primary drying.
In contrast, the shelf temperature profile in the 50 mg/mL sucrose runs was variable, and
shelf temperature was increased several times to optimize product temperatures. Increases
of shelf temperature lead to a short initial increase of Tp-TDLAS, followed by a slow drop while
the mass flow rate adjusted to the higher product temperature until steady state conditions
were re-obtained. In the first run, the TDLAS temperature profile followed the thermocouple
average well in the first half of primary drying. After 8 hours of primary drying, the first
thermocouples lose contact with the ice and cause the thermocouple average to increase.
However, it can be assumed that the Tp-TDLAS reading in this phase was more representative
for the majority of vials than the thermocouple measurements. The final endpoint indication
was in good agreement with thermocouples.
Comparably good agreement was observed in the second run with 50 mg/mL sucrose.
Isolated measurements at significantly lower temperatures indicate perturbations caused by
pressure rise measurements and are inconsequential for the general temperature
calculation.
During the 75 mg/mL mannitol run, good agreement between thermocouple measurements
and batch average temperature calculated from TDLAS data was observed. Although the
cycle conditions were more aggressive than the previous ones, Tp-TDLAS again followed the
center thermocouples closely and indicated slight changes in shelf and product temperature.
Due to the relatively high solid content and more aggressive conditions, the MTM Tb
measurements in mid-primary drying were significantly lower than thermocouple data which
reflects higher batch heterogeneity and rapid sublimation.
3.2.2. Comparison to MTM Temperature Data
While both MTM and TDLAS are batch methods that determine properties of all vials, there
are significant differences in the way the measurements are performed. This, in turn, may
Results and Discussion 91 affect the results obtained. During Manometric Temperature Measurements, the transport of
water vapor from chamber to condenser is interrupted, and the chamber pressure increases
until the vapor pressure of ice in the coldest vials is reached. From this point, additional water
vapor re-condenses on the surface of the coldest product, and no additional pressure rise
due to sublimation is observed30,81. As a consequence, temperature data are more
representative for the cold center vials, and the measurement relies on low heterogeneity
within the batch. This is not the case for TDLAS temperature calculations which are based on
continuous mass flow measurements without interruptions of the lyophilization process. The
results indicated to be more representative for the batch average and less biased toward the
coldest vials. MTM measurements are only performed on an hourly basis while TDLAS
records datasets every minute in real time during the run, so the possibility for rapid reactions
to process feedback is improved.
An additional difference between both technologies is the position of the calculated
temperature. While MTM directly determines the temperature at the sublimation interface
(Tp-MTM), the calculated Tp-TDLAS theoretically represents the ice temperature at the bottom of
the vial which is commonly slightly higher than temperatures at the sublimation interface. The
measurement accuracy of flow velocity using the TDLAS system is not yet good enough to
allow reliable conclusions about this systematic difference which usually amounts to less
than 1°C during primary drying. Since it is relatively easy to calculate the temperature at the
bottom of the vial from MTM data, these values were compared to the measured TDLAS and
thermocouple temperatures to reduce systematic errors.
Although MTM and TDLAS are capable of providing similar derivative parameters such as
mass flow rate and product temperature, the data employed for the calculation is generated
with inherently different methods. The primary dataset obtained by MTM is vapor pressure
and product resistance during a pressure rise test, and all other parameters are calculated
from these values. TDLAS continuously measures water concentration and flow velocity and
uses these data for calculation of mass flow. This leads to differences of the benefits and
restrictions of both technologies. As mentioned above, use of MTM is problematic for
products with high solid contents, high heterogeneity in the batch, and for non-vial container
systems. In contrast, all these parameters are not critical for the general application of the
TDLAS system. However, TDLAS is limited by low flow velocities, i.e. low sublimation rates
or high chamber pressures. Both systems are currently not able to monitor lyophilization of
organic solvent systems30.
Results and Discussion 92 As expected, MTM Tb data were in good agreement with Tp-TDLAS calculations in runs with
relatively conservative cycle conditions and low or intermediate solid contents. TDLAS data
showed good agreement with thermocouple measurements for a longer time than MTM
results which are only valid until 2/3 of the ice have been removed. While the Tp-TDLAS does
not represent actual product temperatures in the late part of primary drying, the calculated
temperatures are more indicative of the product conditions than the MTM data.
The 50 mg/mL sucrose runs in Figures 3-10 and 3-11 show a corresponding increase of
product temperatures at constant shelf temperature caused by increasing product resistance.
At the start of primary drying, the Tp-TDLAS is significantly too low until the process reaches
steady state conditions. In the following period, product temperature measurements from
MTM, TDLAS and thermocouples are in good agreement. Once the first vials are free of ice
which can be observed in the step increase of the edge thermocouple average reading, the
temperature at the bottom of the vial calculated from MTM data starts to decrease which
does not represent actual process conditions but is due to a reduction of pressure increase
as less vials still contain ice. In contrast, the TDLAS product temperature increases in good
agreement with the thermocouple data until primary drying finishes and sublimation stops.
During cycles with more aggressive drying conditions and higher product temperatures,
larger differences between Tp-TDLAS and Tb-MTM data were observed. The Mannitol run shown
in Figure 3-12 illustrates that MTM temperature data was only in good agreement with
TDLAS during the first few hours of the lyophilization cycle, and also significantly lower than
both center and edge vial thermocouple data. The reason for these MTM inaccuracies were
likely increased batch heterogeneity and faster drying of the outer vials, leading to poorer
representativeness of the coldest vials measured by MTM for the entire batch74. As the
TDLAS temperature calculation is based on mass flow of the entire batch, it is the more
accurate method under such conditions to estimate batch product temperature. The impact
of very high mass flow rates on TDLAS is discussed in the next section.
3.2.3. Effect of High Mass Flow Rates
In freeze drying cycles with very aggressive conditions (Ts > +10°C), larger discrepancies
between thermocouple data and calculated Tp-TDLAS values were apparent. An example is
shown in Figure 3-13 for 50 mg/mL glycine and an aggressive shelf temperature profile, and
in Figure 3-14 for 75 mg/mL Mannitol using a shelf temperature of almost +20°C. The first
example shows larger discrepancies between thermocouple and Tp-TDLAS data in the high
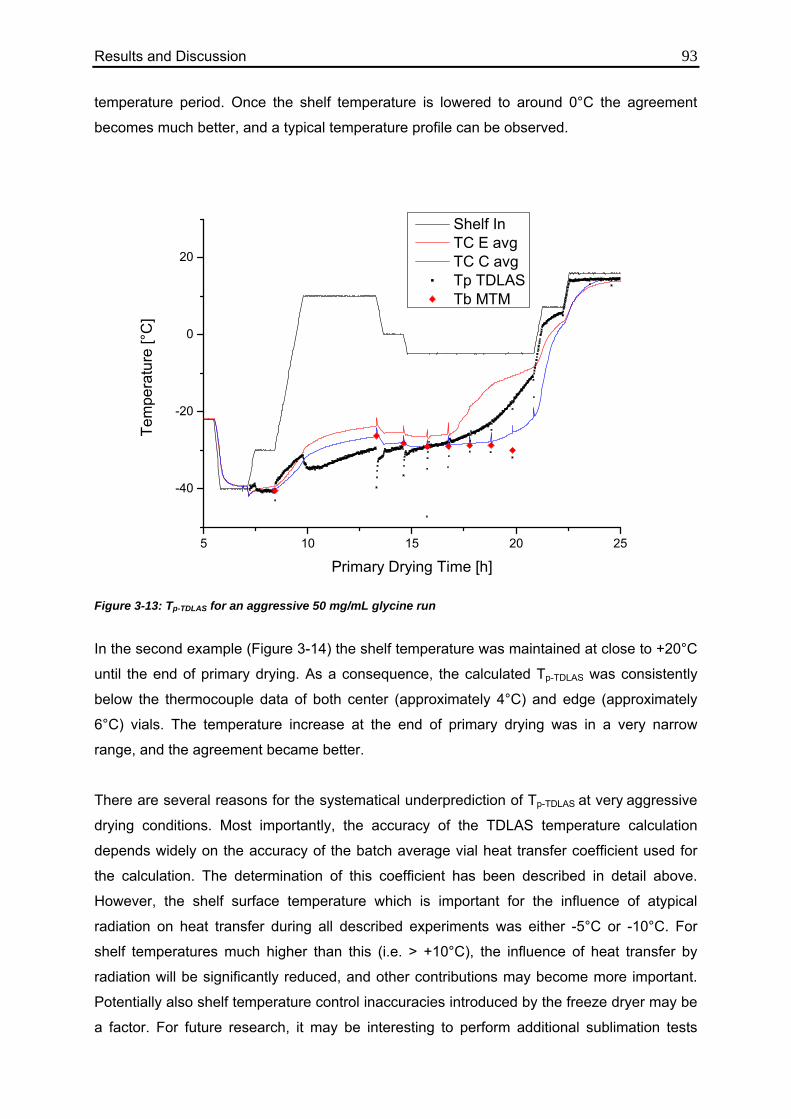
Results and Discussion 93 temperature period. Once the shelf temperature is lowered to around 0°C the agreement
becomes much better, and a typical temperature profile can be observed.
5 10 15 20 25
-40
-20
0
20
Tem
pera
ture
[°C
]
Primary Drying Time [h]
Shelf In TC E avg TC C avg Tp TDLAS Tb MTM
Figure 3-13: Tp-TDLAS for an aggressive 50 mg/mL glycine run
In the second example (Figure 3-14) the shelf temperature was maintained at close to +20°C
until the end of primary drying. As a consequence, the calculated Tp-TDLAS was consistently
below the thermocouple data of both center (approximately 4°C) and edge (approximately
6°C) vials. The temperature increase at the end of primary drying was in a very narrow
range, and the agreement became better.
There are several reasons for the systematical underprediction of Tp-TDLAS at very aggressive
drying conditions. Most importantly, the accuracy of the TDLAS temperature calculation
depends widely on the accuracy of the batch average vial heat transfer coefficient used for
the calculation. The determination of this coefficient has been described in detail above.
However, the shelf surface temperature which is important for the influence of atypical
radiation on heat transfer during all described experiments was either -5°C or -10°C. For
shelf temperatures much higher than this (i.e. > +10°C), the influence of heat transfer by
radiation will be significantly reduced, and other contributions may become more important.
Potentially also shelf temperature control inaccuracies introduced by the freeze dryer may be
a factor. For future research, it may be interesting to perform additional sublimation tests
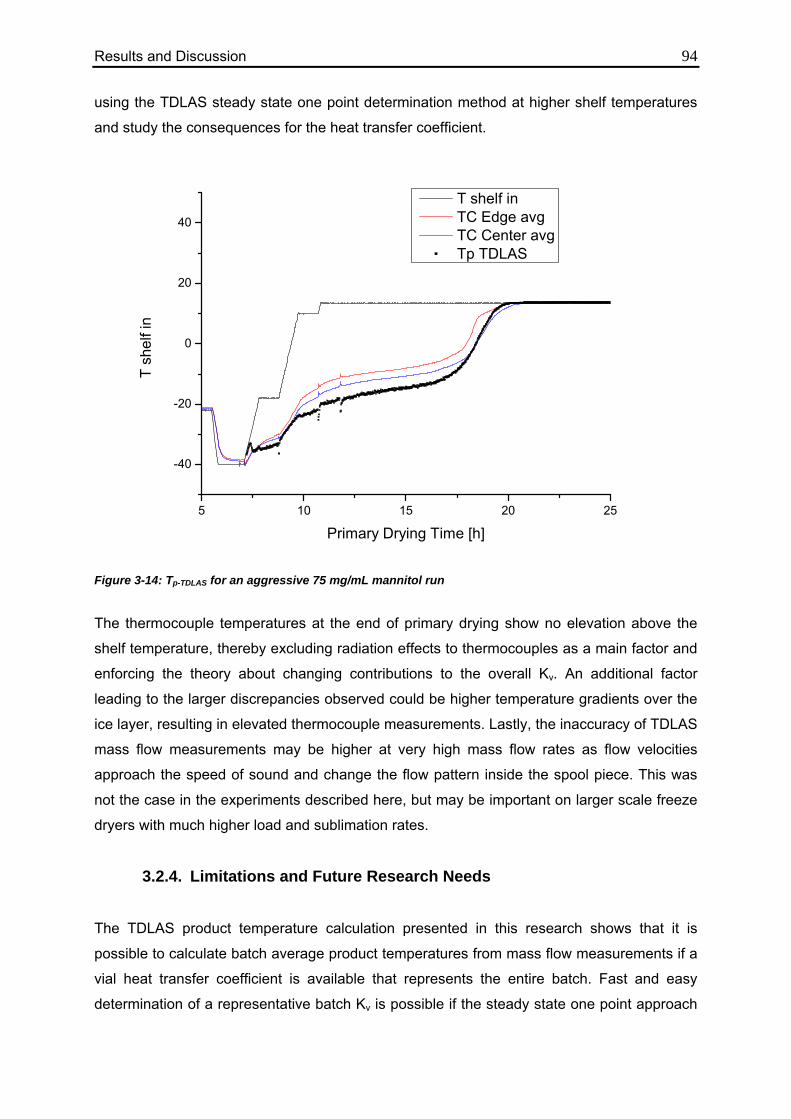
Results and Discussion 94 using the TDLAS steady state one point determination method at higher shelf temperatures
and study the consequences for the heat transfer coefficient.
5 10 15 20 25
-40
-20
0
20
40
T sh
elf i
n
Primary Drying Time [h]
T shelf in TC Edge avg TC Center avg Tp TDLAS
Figure 3-14: Tp-TDLAS for an aggressive 75 mg/mL mannitol run
The thermocouple temperatures at the end of primary drying show no elevation above the
shelf temperature, thereby excluding radiation effects to thermocouples as a main factor and
enforcing the theory about changing contributions to the overall Kv. An additional factor
leading to the larger discrepancies observed could be higher temperature gradients over the
ice layer, resulting in elevated thermocouple measurements. Lastly, the inaccuracy of TDLAS
mass flow measurements may be higher at very high mass flow rates as flow velocities
approach the speed of sound and change the flow pattern inside the spool piece. This was
not the case in the experiments described here, but may be important on larger scale freeze
dryers with much higher load and sublimation rates.
3.2.4. Limitations and Future Research Needs
The TDLAS product temperature calculation presented in this research shows that it is
possible to calculate batch average product temperatures from mass flow measurements if a
vial heat transfer coefficient is available that represents the entire batch. Fast and easy
determination of a representative batch Kv is possible if the steady state one point approach
Results and Discussion 95 is used at different pressures in one run for one vial type55,150. If this is not possible the Kv
determination is much more complex and bothersome.
The theoretical model that is the basis for the Tp-TDLAS calculation is only applicable in the
steady state of primary drying. This leads to a phase early in primary drying before steady
state conditions are achieved where no reliable temperature data can be obtained. More
importantly, as soon as the sublimation is completed, i.e. once the ice has been removed
from the product, the calculated temperature only follows the shelf temperature and is not
suitable for process monitoring. Commonly the water removal by desorption (not by
sublimation!) during secondary drying is relatively slow, and the cooling effect from
desorption is too low to influence the product temperature. If temperature measurements
during secondary drying would be desired, the heat of sublimation of ice in Equation 2-2
would need to be replaced with a parameter representing the heat of water desorption. Since
the most critical and potentially variable part of a freeze drying run is primary drying, the
application in this step should be the first target.
Results and Discussion 96
3.3 TDLAS Product Resistance Calculation
To obtain additional information about the critical product parameters, the calculated TDLAS
product temperature and mass flow rate of the 9 runs described above were used to estimate
the product resistance. For this purpose, the TDLAS mass flow readout (all vials in grams per
second) was converted to mass flow per vial and hour. Product resistance was calculated
using the following re-arrangement of Equation 1-3:
Equation 3-2
Pice can be directly calculated from the TDLAS product temperature using equation 1-4, and
dm/dtvial was directly measured by TDLAS. The results were compared to Rp data obtained
from MTM pressure rise fits. In contrast to the common method, Rp was plotted against time
and not against dry layer thickness. This approach is legitimate since the data is compared to
MTM data recorded in the same run at identical times, and not to data from other runs with
different conditions. Due to the large amount of data generated by the TDLAS sensor the
calculation of mass removed for each data set would be extremely complex, and the
comparison to MTM data might be impaired if the dry layer thickness calculation is not
identical. A comparison of Rp data in a 50 mg/mL sucrose run, a 50 mg/mL glycine run and a
71 mg/mL mannitol run is shown in Figure 3-15 to 3-17.
The comparability between TDLAS and MTM product resistance data is best in runs with
conservative drying conditions, i.e. relatively low shelf temperatures. The 50 mg/mL sucrose
run shows excellent agreement of Rp for the first 8 hours of primary drying which equals
about 50-60% of the total primary drying time. The product resistance profile of sucrose is
mostly characterized by a short increase followed by a plateau phase until the heterogeneity
within the batch starts to increase when the first vials finish primary drying. This behavior is
reflected in both MTM and TDLAS measurements, and the value during the plateau phase is
practically identical. When the first edge vials finish primary drying the mass flow rate starts
to drop, and the Rp calculation rapidly becomes inaccurate. Another limiting factor for the
TDLAS Rp calculation is the accuracy of the Tp-TDLAS measurements since they are the basis
for the Pice determination. The MTM technology which is more representative for the coldest
vials appears to be reliable for a longer period of time, but also stops producing reliable
results after 2/3 of primary drying.
vial
cicepp dtdm
PPAR
/)( −⋅
=

Results and Discussion 97
0 2 4 6 8 10 12 14-5
0
5
10
15
20
25
MTM Rp TDLAS Rp
Pro
duct
Res
ista
nce
[cm
2 *Tor
r*h/
g]
Primary Drying Time [h]
Figure 3-15: Rp-TDLAS data calculated for a 50 mg/mL sucrose run compared to MTM data
8 10 12 14 16 18 20 22 24-5
0
5
10
15
20
25
MTM Rp TDLAS Rp
Pro
duct
Res
ista
nce
[cm
2 *Tor
r*h/
g]
Primary Drying Time [h]
Figure 3-16: Rp-TDLAS data calculated for a 50 mg/mL glycine run compared to MTM data
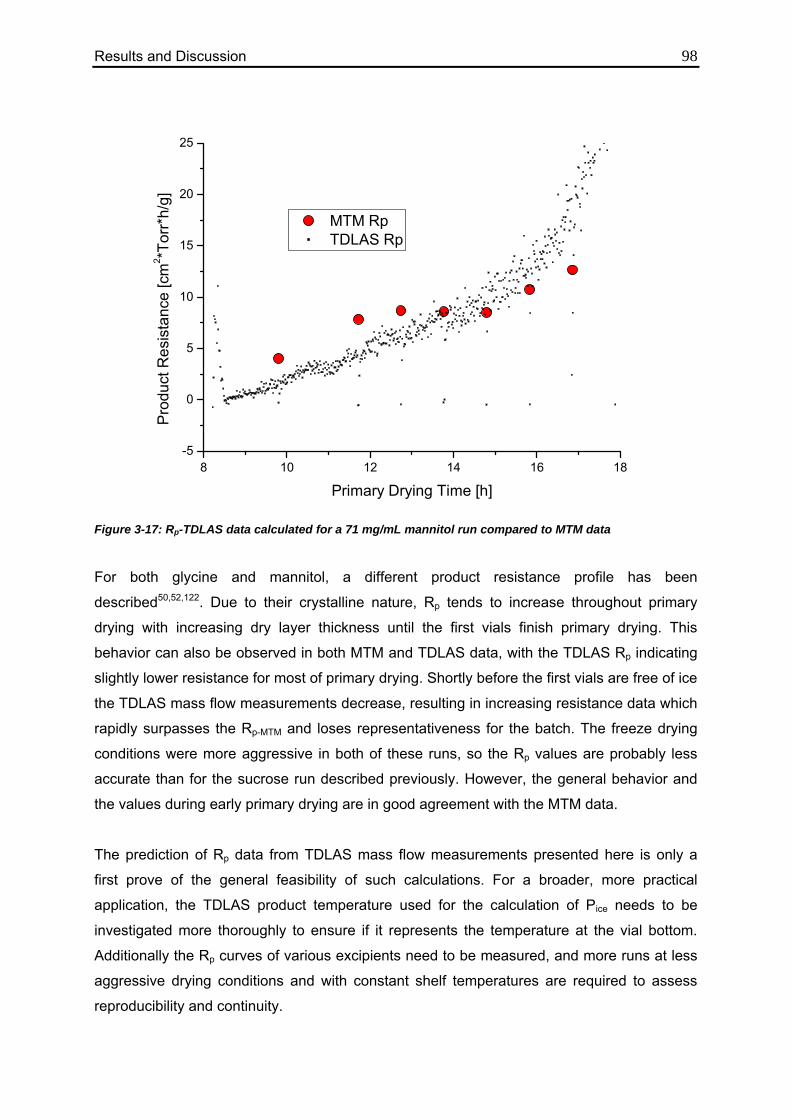
Results and Discussion 98
8 10 12 14 16 18-5
0
5
10
15
20
25
MTM Rp TDLAS Rp
Pro
duct
Res
ista
nce
[cm
2 *Tor
r*h/
g]
Primary Drying Time [h]
Figure 3-17: Rp-TDLAS data calculated for a 71 mg/mL mannitol run compared to MTM data
For both glycine and mannitol, a different product resistance profile has been
described50,52,122. Due to their crystalline nature, Rp tends to increase throughout primary
drying with increasing dry layer thickness until the first vials finish primary drying. This
behavior can also be observed in both MTM and TDLAS data, with the TDLAS Rp indicating
slightly lower resistance for most of primary drying. Shortly before the first vials are free of ice
the TDLAS mass flow measurements decrease, resulting in increasing resistance data which
rapidly surpasses the Rp-MTM and loses representativeness for the batch. The freeze drying
conditions were more aggressive in both of these runs, so the Rp values are probably less
accurate than for the sucrose run described previously. However, the general behavior and
the values during early primary drying are in good agreement with the MTM data.
The prediction of Rp data from TDLAS mass flow measurements presented here is only a
first prove of the general feasibility of such calculations. For a broader, more practical
application, the TDLAS product temperature used for the calculation of Pice needs to be
investigated more thoroughly to ensure if it represents the temperature at the vial bottom.
Additionally the Rp curves of various excipients need to be measured, and more runs at less
aggressive drying conditions and with constant shelf temperatures are required to assess
reproducibility and continuity.
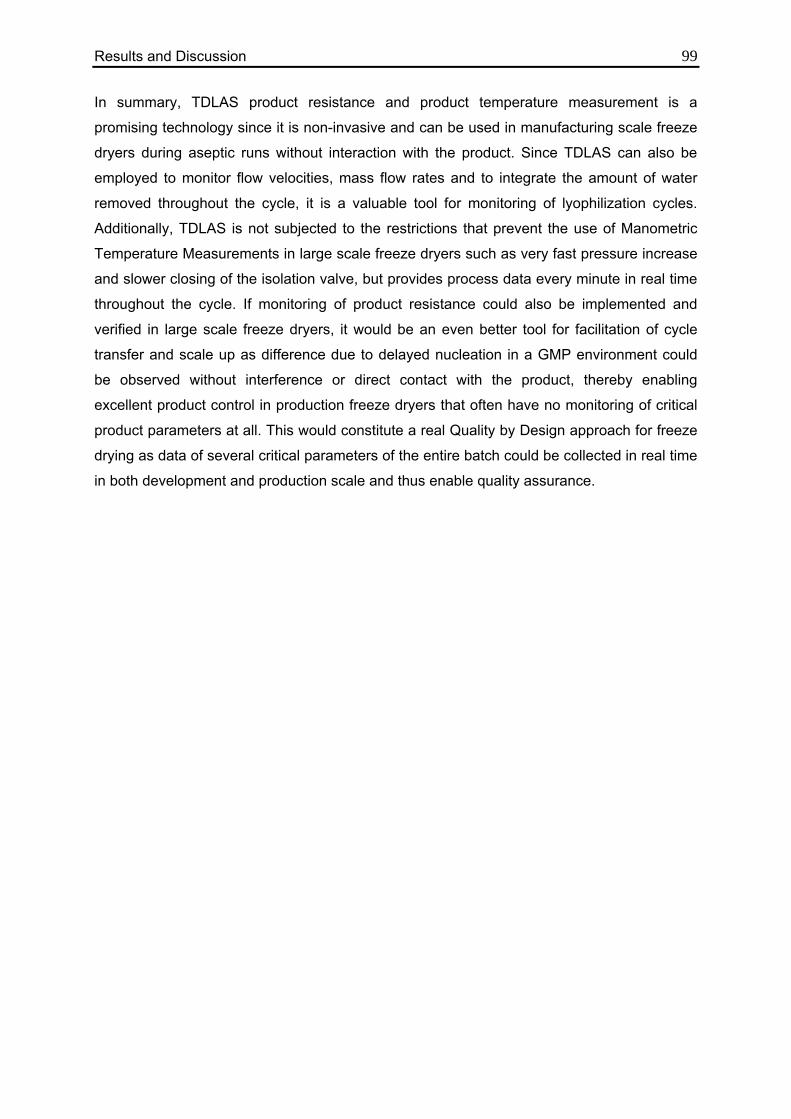
Results and Discussion 99 In summary, TDLAS product resistance and product temperature measurement is a
promising technology since it is non-invasive and can be used in manufacturing scale freeze
dryers during aseptic runs without interaction with the product. Since TDLAS can also be
employed to monitor flow velocities, mass flow rates and to integrate the amount of water
removed throughout the cycle, it is a valuable tool for monitoring of lyophilization cycles.
Additionally, TDLAS is not subjected to the restrictions that prevent the use of Manometric
Temperature Measurements in large scale freeze dryers such as very fast pressure increase
and slower closing of the isolation valve, but provides process data every minute in real time
throughout the cycle. If monitoring of product resistance could also be implemented and
verified in large scale freeze dryers, it would be an even better tool for facilitation of cycle
transfer and scale up as difference due to delayed nucleation in a GMP environment could
be observed without interference or direct contact with the product, thereby enabling
excellent product control in production freeze dryers that often have no monitoring of critical
product parameters at all. This would constitute a real Quality by Design approach for freeze
drying as data of several critical parameters of the entire batch could be collected in real time
in both development and production scale and thus enable quality assurance.
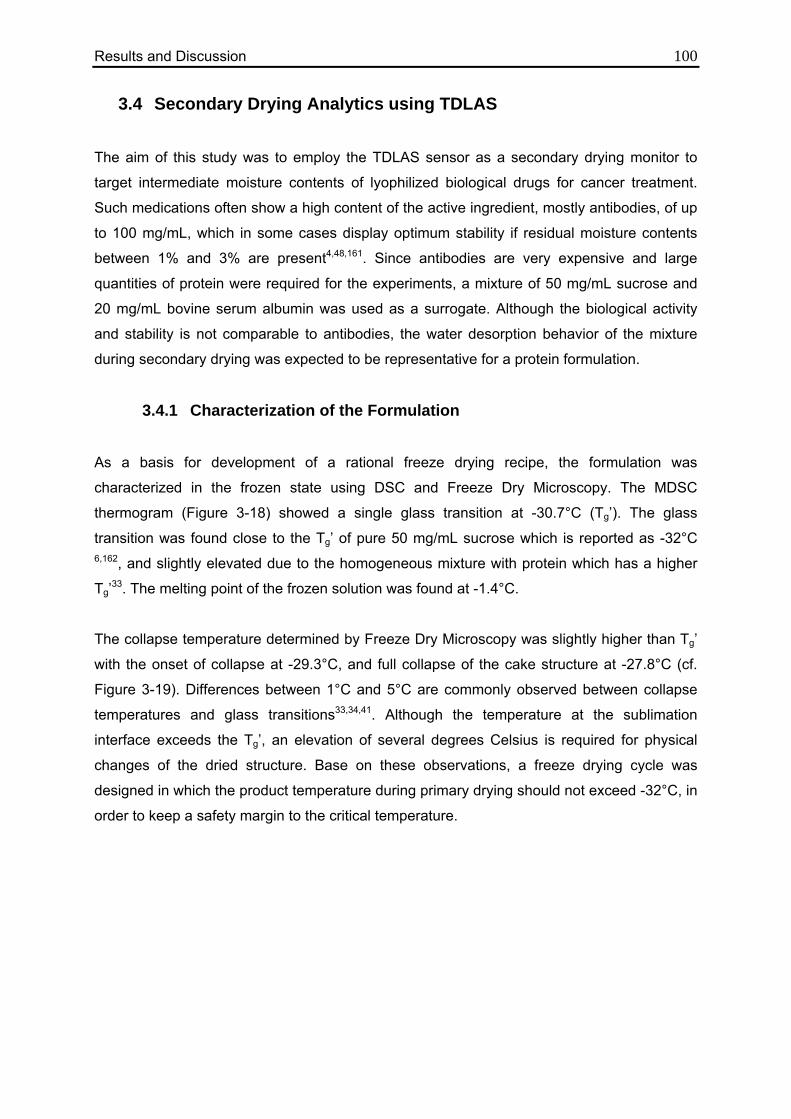
Results and Discussion 100
3.4 Secondary Drying Analytics using TDLAS
The aim of this study was to employ the TDLAS sensor as a secondary drying monitor to
target intermediate moisture contents of lyophilized biological drugs for cancer treatment.
Such medications often show a high content of the active ingredient, mostly antibodies, of up
to 100 mg/mL, which in some cases display optimum stability if residual moisture contents
between 1% and 3% are present4,48,161. Since antibodies are very expensive and large
quantities of protein were required for the experiments, a mixture of 50 mg/mL sucrose and
20 mg/mL bovine serum albumin was used as a surrogate. Although the biological activity
and stability is not comparable to antibodies, the water desorption behavior of the mixture
during secondary drying was expected to be representative for a protein formulation.
3.4.1 Characterization of the Formulation
As a basis for development of a rational freeze drying recipe, the formulation was
characterized in the frozen state using DSC and Freeze Dry Microscopy. The MDSC
thermogram (Figure 3-18) showed a single glass transition at -30.7°C (Tg’). The glass
transition was found close to the Tg’ of pure 50 mg/mL sucrose which is reported as -32°C 6,162, and slightly elevated due to the homogeneous mixture with protein which has a higher
Tg’33. The melting point of the frozen solution was found at -1.4°C.
The collapse temperature determined by Freeze Dry Microscopy was slightly higher than Tg’
with the onset of collapse at -29.3°C, and full collapse of the cake structure at -27.8°C (cf.
Figure 3-19). Differences between 1°C and 5°C are commonly observed between collapse
temperatures and glass transitions33,34,41. Although the temperature at the sublimation
interface exceeds the Tg’, an elevation of several degrees Celsius is required for physical
changes of the dried structure. Base on these observations, a freeze drying cycle was
designed in which the product temperature during primary drying should not exceed -32°C, in
order to keep a safety margin to the critical temperature.
Results and Discussion 101
Figure 3-18: MDSC Thermogram of the 50 mg/mL sucrose 20 mg/mL BSA solution
Figure 3-19: FDM onset of collapse (-29.3°C) and of full collapse (-27.8°C)
3.4.2 Applicability of TDLAS during Secondary Drying
As mentioned before, it is not possible to solely integrate the continuous mass flow
measured by TDLAS and estimate the amount of water remaining in the product for targeting
of moisture contents. This is due to the very low amount of water remaining in the product
even at the start of secondary drying (3 - 8%, depending on product and process
characteristics). To illustrate the measurement accuracy required to obtain a reliable mass of
water at the end of primary drying, a short calculation based on the experimental setup is
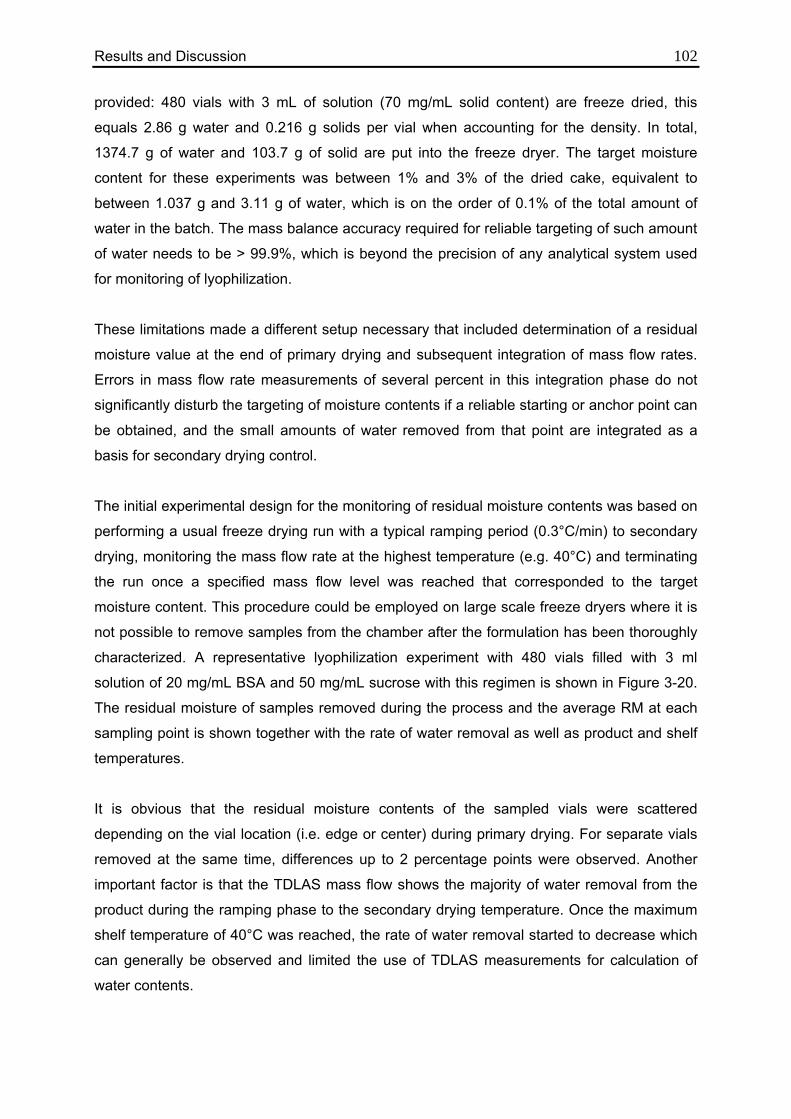
Results and Discussion 102 provided: 480 vials with 3 mL of solution (70 mg/mL solid content) are freeze dried, this
equals 2.86 g water and 0.216 g solids per vial when accounting for the density. In total,
1374.7 g of water and 103.7 g of solid are put into the freeze dryer. The target moisture
content for these experiments was between 1% and 3% of the dried cake, equivalent to
between 1.037 g and 3.11 g of water, which is on the order of 0.1% of the total amount of
water in the batch. The mass balance accuracy required for reliable targeting of such amount
of water needs to be > 99.9%, which is beyond the precision of any analytical system used
for monitoring of lyophilization.
These limitations made a different setup necessary that included determination of a residual
moisture value at the end of primary drying and subsequent integration of mass flow rates.
Errors in mass flow rate measurements of several percent in this integration phase do not
significantly disturb the targeting of moisture contents if a reliable starting or anchor point can
be obtained, and the small amounts of water removed from that point are integrated as a
basis for secondary drying control.
The initial experimental design for the monitoring of residual moisture contents was based on
performing a usual freeze drying run with a typical ramping period (0.3°C/min) to secondary
drying, monitoring the mass flow rate at the highest temperature (e.g. 40°C) and terminating
the run once a specified mass flow level was reached that corresponded to the target
moisture content. This procedure could be employed on large scale freeze dryers where it is
not possible to remove samples from the chamber after the formulation has been thoroughly
characterized. A representative lyophilization experiment with 480 vials filled with 3 ml
solution of 20 mg/mL BSA and 50 mg/mL sucrose with this regimen is shown in Figure 3-20.
The residual moisture of samples removed during the process and the average RM at each
sampling point is shown together with the rate of water removal as well as product and shelf
temperatures.
It is obvious that the residual moisture contents of the sampled vials were scattered
depending on the vial location (i.e. edge or center) during primary drying. For separate vials
removed at the same time, differences up to 2 percentage points were observed. Another
important factor is that the TDLAS mass flow shows the majority of water removal from the
product during the ramping phase to the secondary drying temperature. Once the maximum
shelf temperature of 40°C was reached, the rate of water removal started to decrease which
can generally be observed and limited the use of TDLAS measurements for calculation of
water contents.
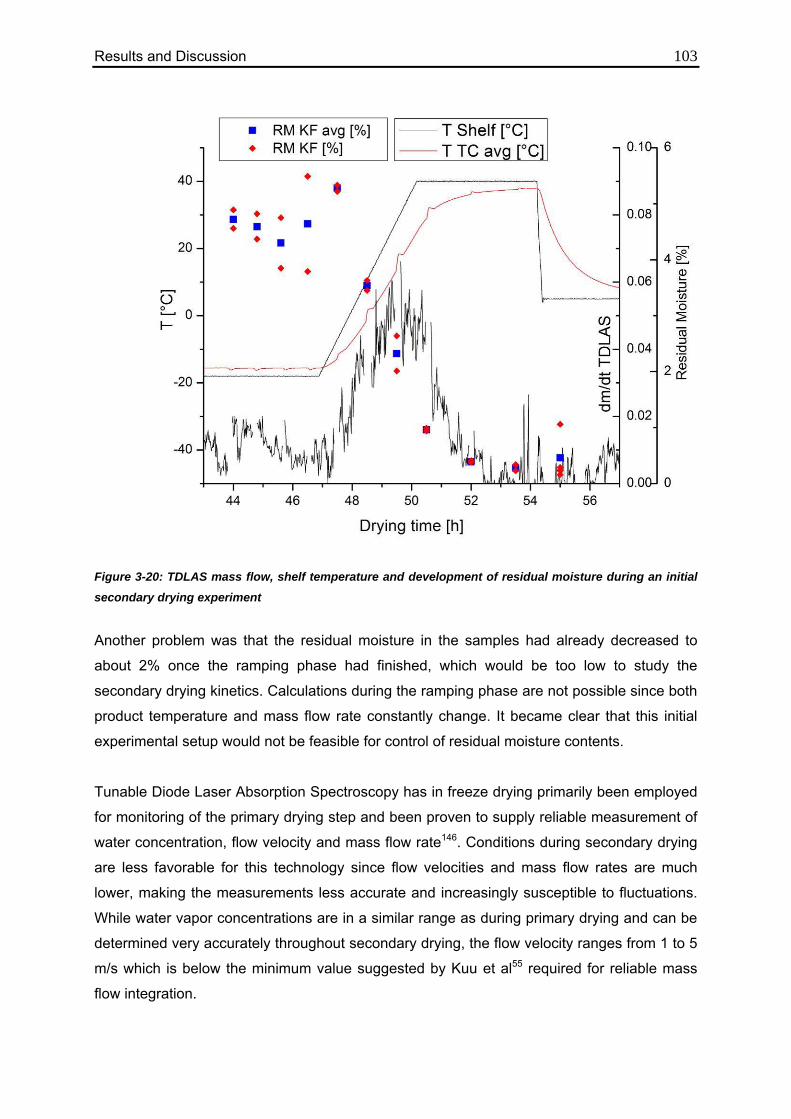
Results and Discussion 103
Figure 3-20: TDLAS mass flow, shelf temperature and development of residual moisture during an initial
secondary drying experiment
Another problem was that the residual moisture in the samples had already decreased to
about 2% once the ramping phase had finished, which would be too low to study the
secondary drying kinetics. Calculations during the ramping phase are not possible since both
product temperature and mass flow rate constantly change. It became clear that this initial
experimental setup would not be feasible for control of residual moisture contents.
Tunable Diode Laser Absorption Spectroscopy has in freeze drying primarily been employed
for monitoring of the primary drying step and been proven to supply reliable measurement of
water concentration, flow velocity and mass flow rate146. Conditions during secondary drying
are less favorable for this technology since flow velocities and mass flow rates are much
lower, making the measurements less accurate and increasingly susceptible to fluctuations.
While water vapor concentrations are in a similar range as during primary drying and can be
determined very accurately throughout secondary drying, the flow velocity ranges from 1 to 5
m/s which is below the minimum value suggested by Kuu et al55 required for reliable mass
flow integration.
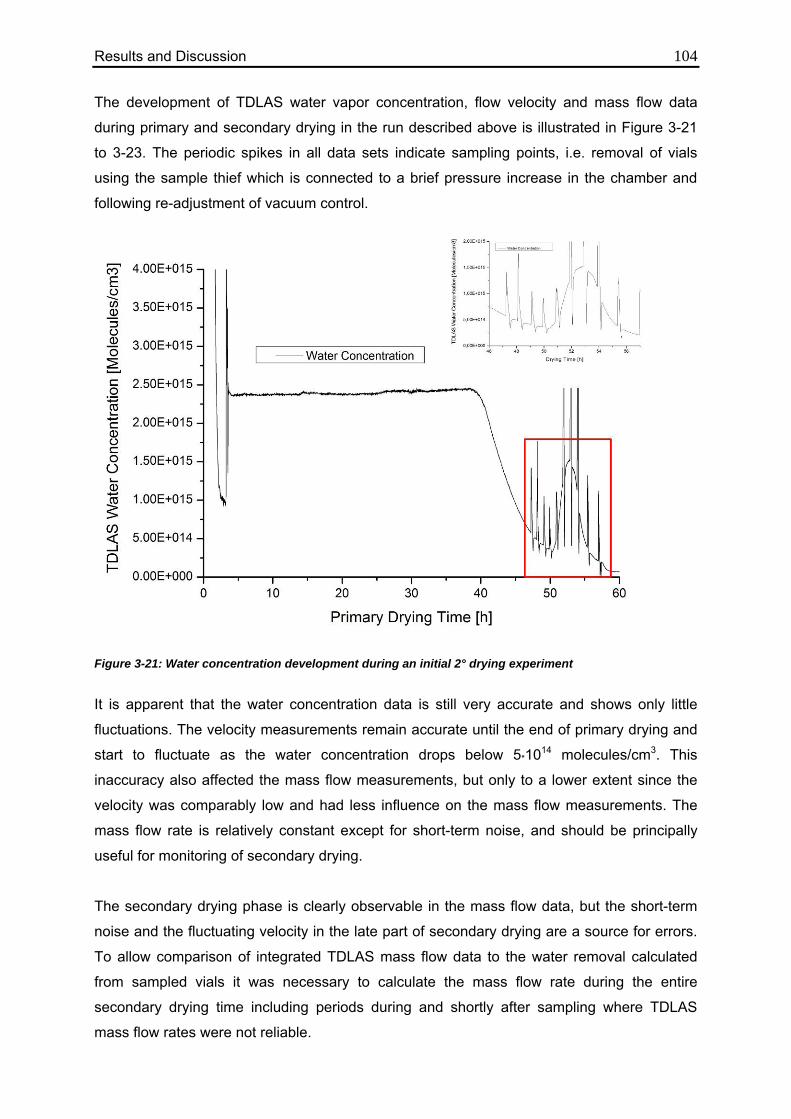
Results and Discussion 104 The development of TDLAS water vapor concentration, flow velocity and mass flow data
during primary and secondary drying in the run described above is illustrated in Figure 3-21
to 3-23. The periodic spikes in all data sets indicate sampling points, i.e. removal of vials
using the sample thief which is connected to a brief pressure increase in the chamber and
following re-adjustment of vacuum control.
Figure 3-21: Water concentration development during an initial 2° drying experiment
It is apparent that the water concentration data is still very accurate and shows only little
fluctuations. The velocity measurements remain accurate until the end of primary drying and
start to fluctuate as the water concentration drops below 5*1014 molecules/cm3. This
inaccuracy also affected the mass flow measurements, but only to a lower extent since the
velocity was comparably low and had less influence on the mass flow measurements. The
mass flow rate is relatively constant except for short-term noise, and should be principally
useful for monitoring of secondary drying.
The secondary drying phase is clearly observable in the mass flow data, but the short-term
noise and the fluctuating velocity in the late part of secondary drying are a source for errors.
To allow comparison of integrated TDLAS mass flow data to the water removal calculated
from sampled vials it was necessary to calculate the mass flow rate during the entire
secondary drying time including periods during and shortly after sampling where TDLAS
mass flow rates were not reliable.
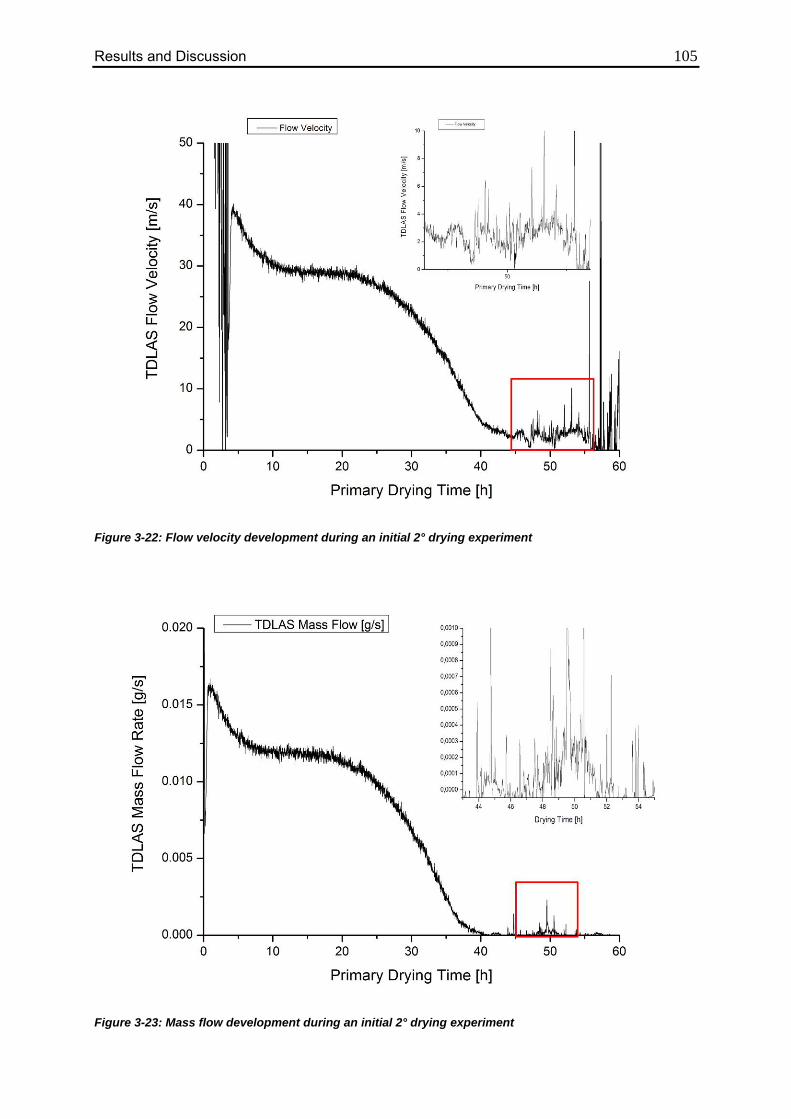
Results and Discussion 105
Figure 3-22: Flow velocity development during an initial 2° drying experiment
Figure 3-23: Mass flow development during an initial 2° drying experiment
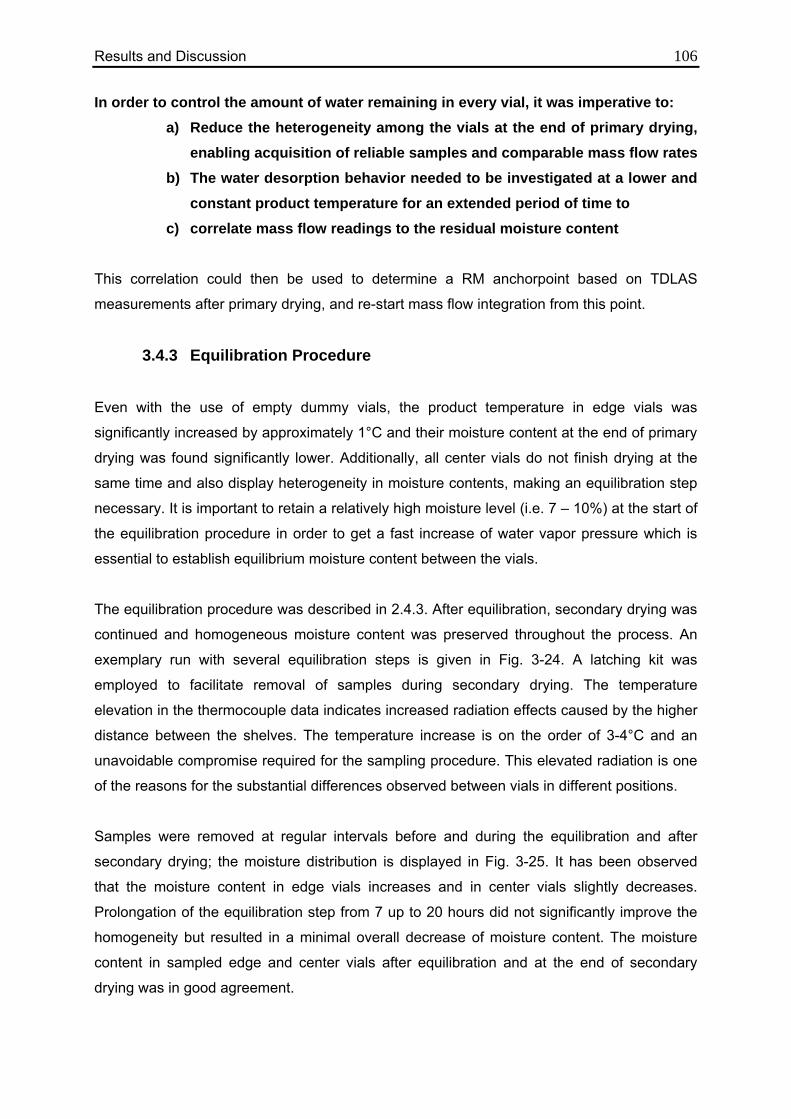
Results and Discussion 106 In order to control the amount of water remaining in every vial, it was imperative to:
a) Reduce the heterogeneity among the vials at the end of primary drying, enabling acquisition of reliable samples and comparable mass flow rates
b) The water desorption behavior needed to be investigated at a lower and constant product temperature for an extended period of time to
c) correlate mass flow readings to the residual moisture content
This correlation could then be used to determine a RM anchorpoint based on TDLAS
measurements after primary drying, and re-start mass flow integration from this point.
3.4.3 Equilibration Procedure
Even with the use of empty dummy vials, the product temperature in edge vials was
significantly increased by approximately 1°C and their moisture content at the end of primary
drying was found significantly lower. Additionally, all center vials do not finish drying at the
same time and also display heterogeneity in moisture contents, making an equilibration step
necessary. It is important to retain a relatively high moisture level (i.e. 7 – 10%) at the start of
the equilibration procedure in order to get a fast increase of water vapor pressure which is
essential to establish equilibrium moisture content between the vials.
The equilibration procedure was described in 2.4.3. After equilibration, secondary drying was
continued and homogeneous moisture content was preserved throughout the process. An
exemplary run with several equilibration steps is given in Fig. 3-24. A latching kit was
employed to facilitate removal of samples during secondary drying. The temperature
elevation in the thermocouple data indicates increased radiation effects caused by the higher
distance between the shelves. The temperature increase is on the order of 3-4°C and an
unavoidable compromise required for the sampling procedure. This elevated radiation is one
of the reasons for the substantial differences observed between vials in different positions.
Samples were removed at regular intervals before and during the equilibration and after
secondary drying; the moisture distribution is displayed in Fig. 3-25. It has been observed
that the moisture content in edge vials increases and in center vials slightly decreases.
Prolongation of the equilibration step from 7 up to 20 hours did not significantly improve the
homogeneity but resulted in a minimal overall decrease of moisture content. The moisture
content in sampled edge and center vials after equilibration and at the end of secondary
drying was in good agreement.
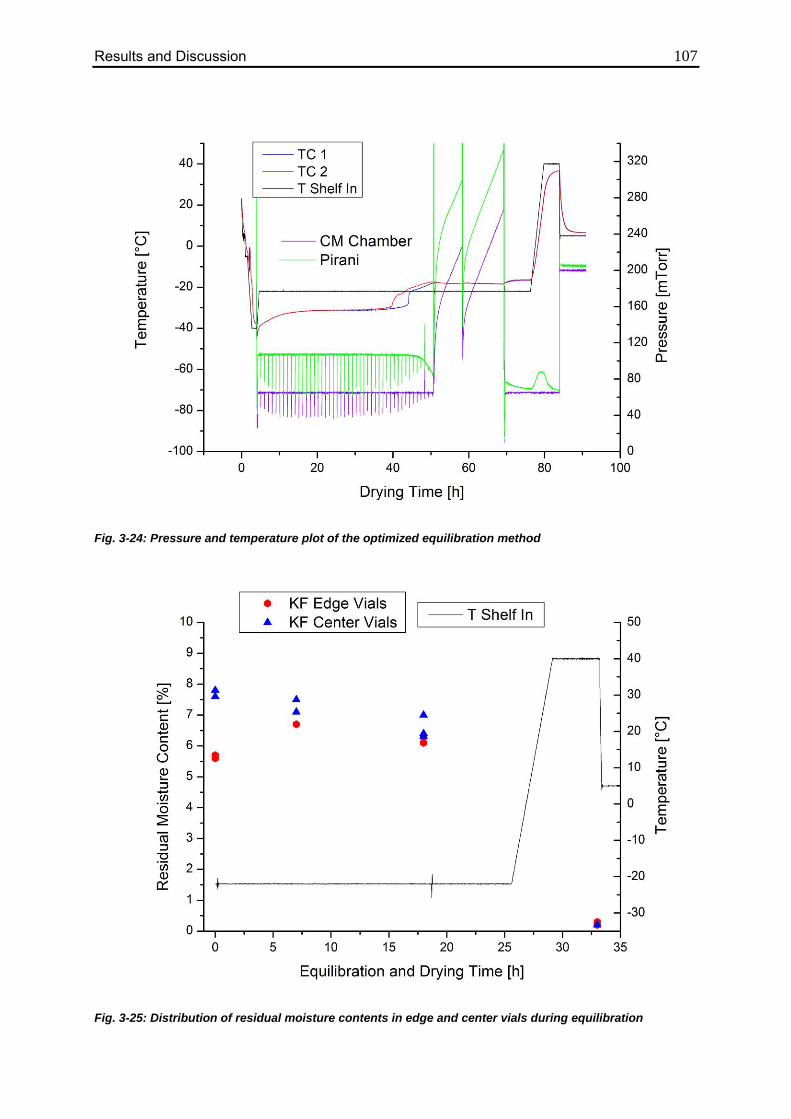
Results and Discussion 107
Fig. 3-24: Pressure and temperature plot of the optimized equilibration method
Fig. 3-25: Distribution of residual moisture contents in edge and center vials during equilibration
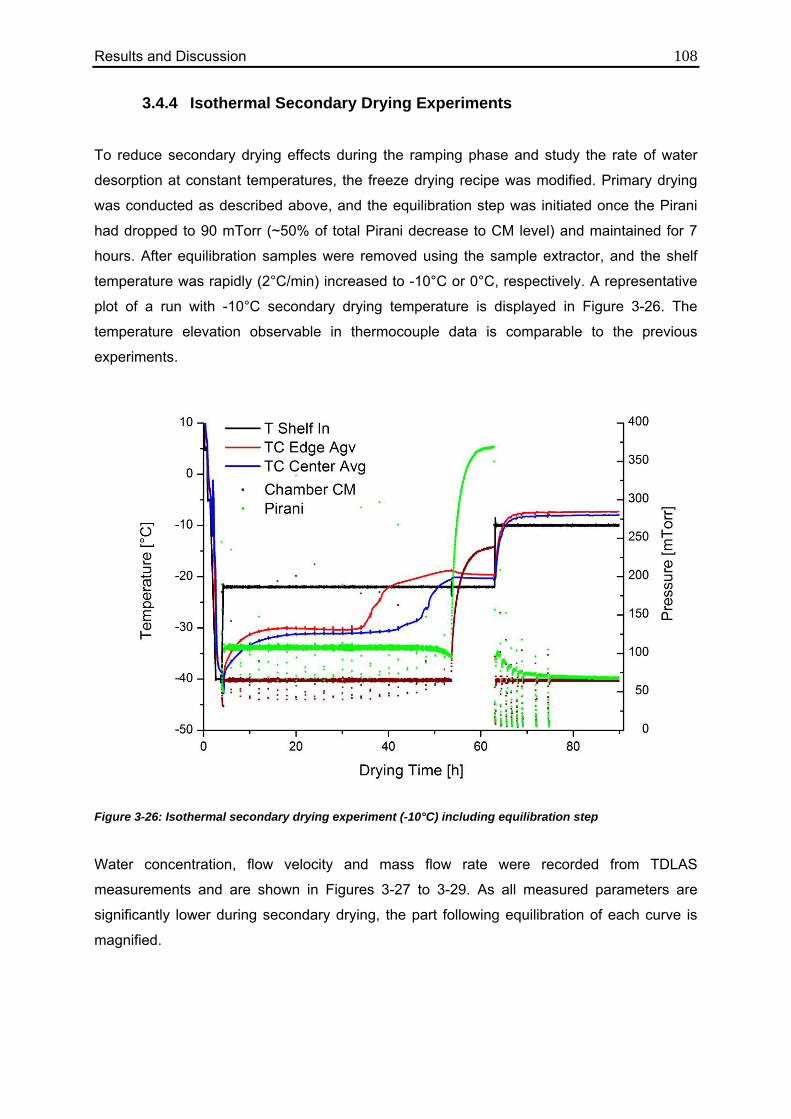
Results and Discussion 108
3.4.4 Isothermal Secondary Drying Experiments
To reduce secondary drying effects during the ramping phase and study the rate of water
desorption at constant temperatures, the freeze drying recipe was modified. Primary drying
was conducted as described above, and the equilibration step was initiated once the Pirani
had dropped to 90 mTorr (~50% of total Pirani decrease to CM level) and maintained for 7
hours. After equilibration samples were removed using the sample extractor, and the shelf
temperature was rapidly (2°C/min) increased to -10°C or 0°C, respectively. A representative
plot of a run with -10°C secondary drying temperature is displayed in Figure 3-26. The
temperature elevation observable in thermocouple data is comparable to the previous
experiments.
Figure 3-26: Isothermal secondary drying experiment (-10°C) including equilibration step
Water concentration, flow velocity and mass flow rate were recorded from TDLAS
measurements and are shown in Figures 3-27 to 3-29. As all measured parameters are
significantly lower during secondary drying, the part following equilibration of each curve is
magnified.
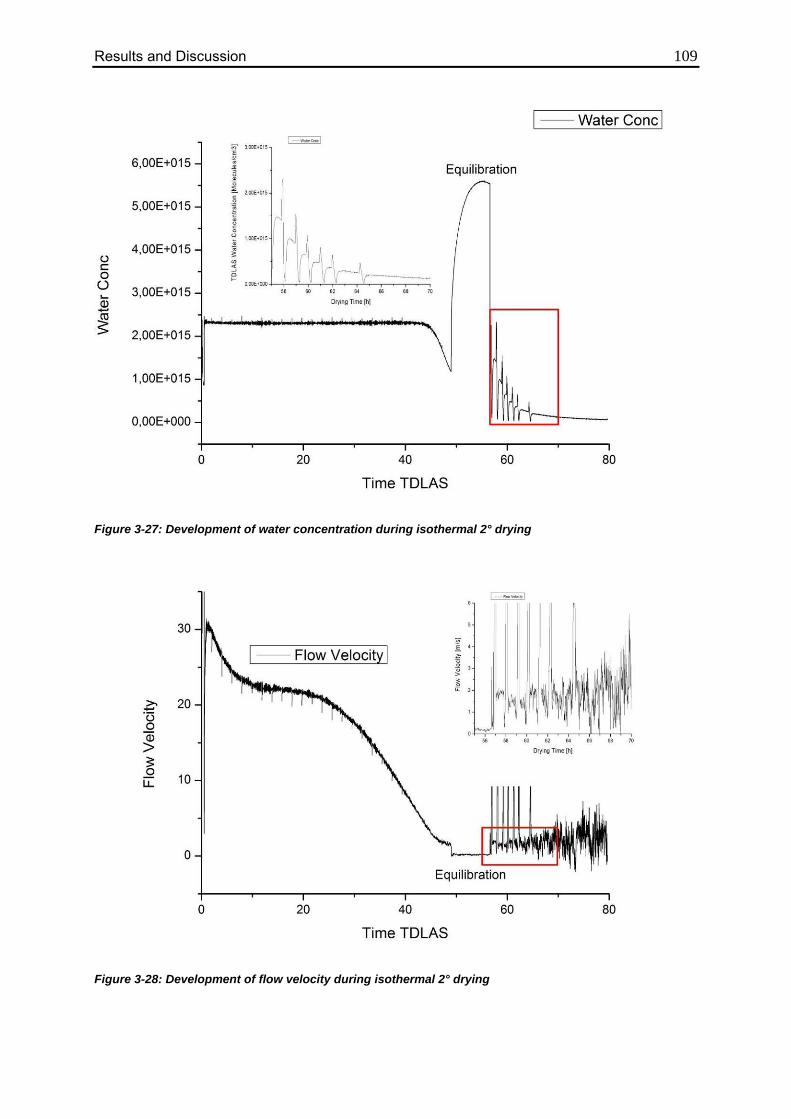
Results and Discussion 109
Figure 3-27: Development of water concentration during isothermal 2° drying
Figure 3-28: Development of flow velocity during isothermal 2° drying
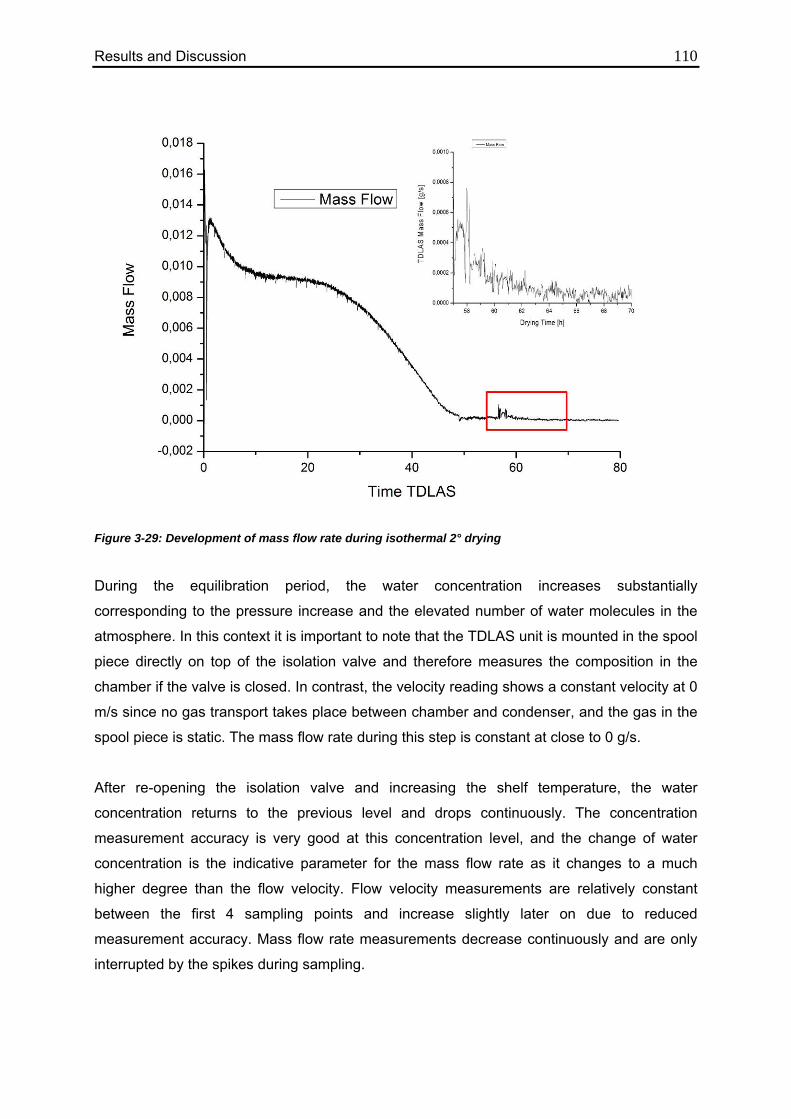
Results and Discussion 110
Figure 3-29: Development of mass flow rate during isothermal 2° drying
During the equilibration period, the water concentration increases substantially
corresponding to the pressure increase and the elevated number of water molecules in the
atmosphere. In this context it is important to note that the TDLAS unit is mounted in the spool
piece directly on top of the isolation valve and therefore measures the composition in the
chamber if the valve is closed. In contrast, the velocity reading shows a constant velocity at 0
m/s since no gas transport takes place between chamber and condenser, and the gas in the
spool piece is static. The mass flow rate during this step is constant at close to 0 g/s.
After re-opening the isolation valve and increasing the shelf temperature, the water
concentration returns to the previous level and drops continuously. The concentration
measurement accuracy is very good at this concentration level, and the change of water
concentration is the indicative parameter for the mass flow rate as it changes to a much
higher degree than the flow velocity. Flow velocity measurements are relatively constant
between the first 4 sampling points and increase slightly later on due to reduced
measurement accuracy. Mass flow rate measurements decrease continuously and are only
interrupted by the spikes during sampling.
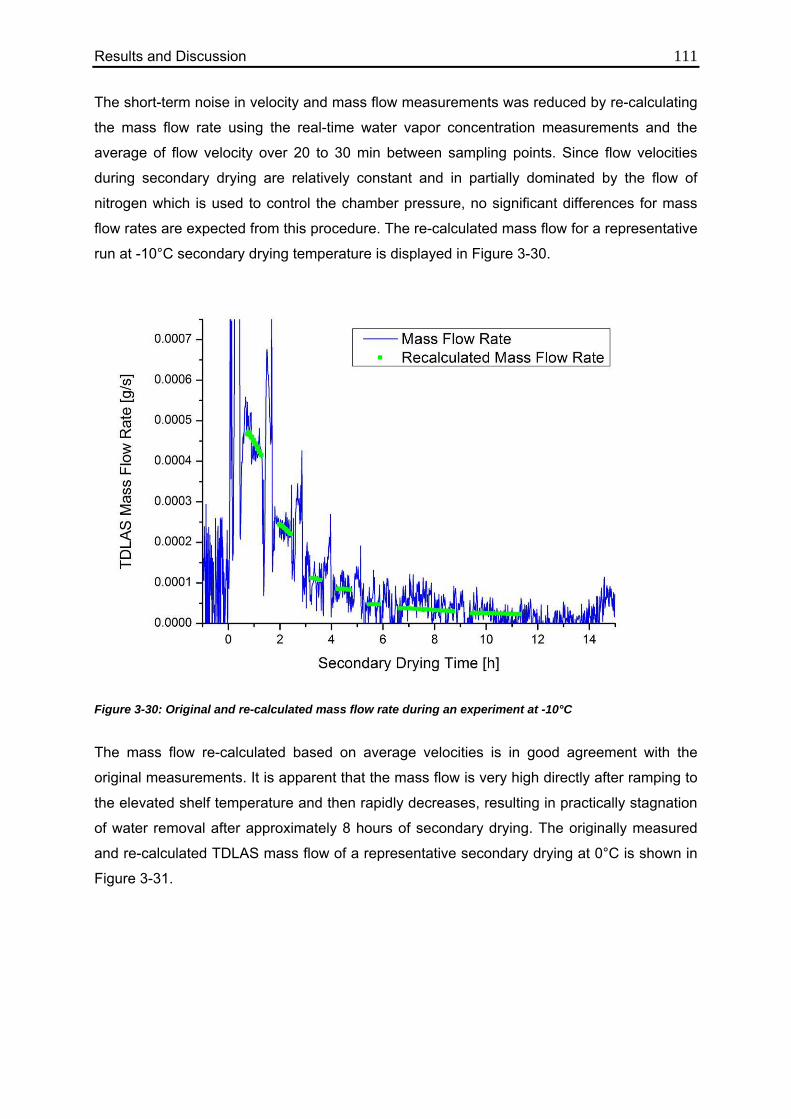
Results and Discussion 111 The short-term noise in velocity and mass flow measurements was reduced by re-calculating
the mass flow rate using the real-time water vapor concentration measurements and the
average of flow velocity over 20 to 30 min between sampling points. Since flow velocities
during secondary drying are relatively constant and in partially dominated by the flow of
nitrogen which is used to control the chamber pressure, no significant differences for mass
flow rates are expected from this procedure. The re-calculated mass flow for a representative
run at -10°C secondary drying temperature is displayed in Figure 3-30.
Figure 3-30: Original and re-calculated mass flow rate during an experiment at -10°C
The mass flow re-calculated based on average velocities is in good agreement with the
original measurements. It is apparent that the mass flow is very high directly after ramping to
the elevated shelf temperature and then rapidly decreases, resulting in practically stagnation
of water removal after approximately 8 hours of secondary drying. The originally measured
and re-calculated TDLAS mass flow of a representative secondary drying at 0°C is shown in
Figure 3-31.
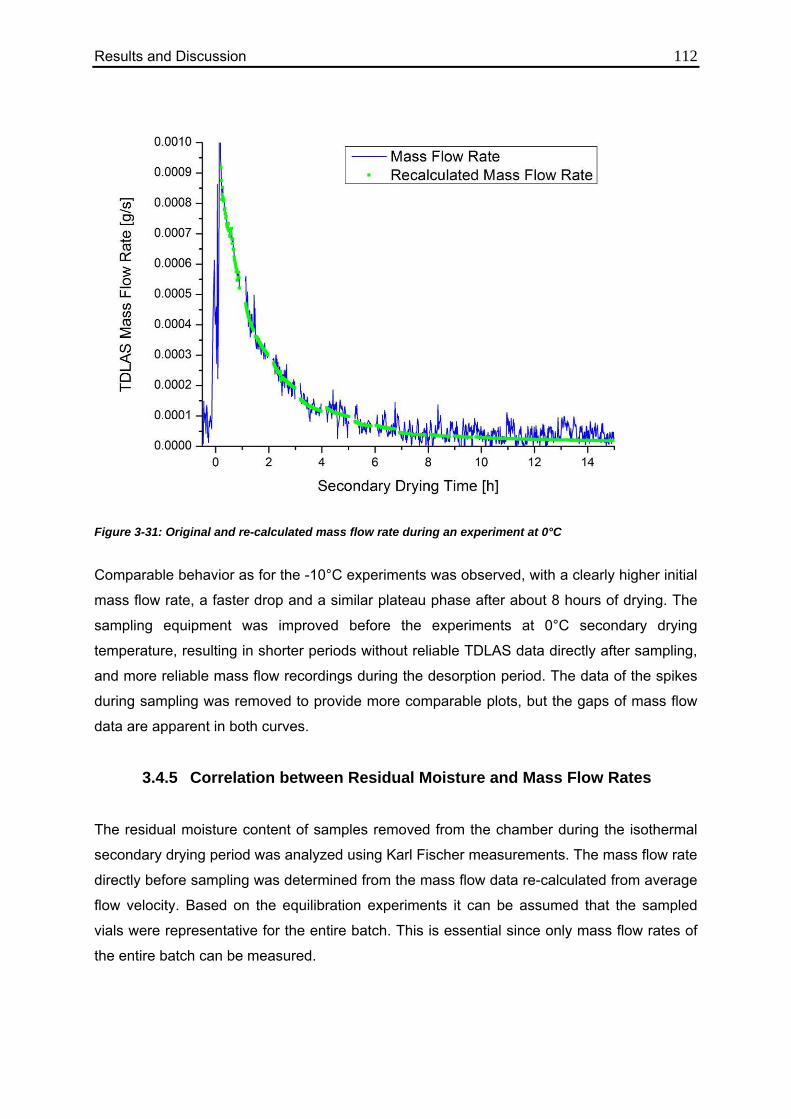
Results and Discussion 112
Figure 3-31: Original and re-calculated mass flow rate during an experiment at 0°C
Comparable behavior as for the -10°C experiments was observed, with a clearly higher initial
mass flow rate, a faster drop and a similar plateau phase after about 8 hours of drying. The
sampling equipment was improved before the experiments at 0°C secondary drying
temperature, resulting in shorter periods without reliable TDLAS data directly after sampling,
and more reliable mass flow recordings during the desorption period. The data of the spikes
during sampling was removed to provide more comparable plots, but the gaps of mass flow
data are apparent in both curves.
3.4.5 Correlation between Residual Moisture and Mass Flow Rates
The residual moisture content of samples removed from the chamber during the isothermal
secondary drying period was analyzed using Karl Fischer measurements. The mass flow rate
directly before sampling was determined from the mass flow data re-calculated from average
flow velocity. Based on the equilibration experiments it can be assumed that the sampled
vials were representative for the entire batch. This is essential since only mass flow rates of
the entire batch can be measured.
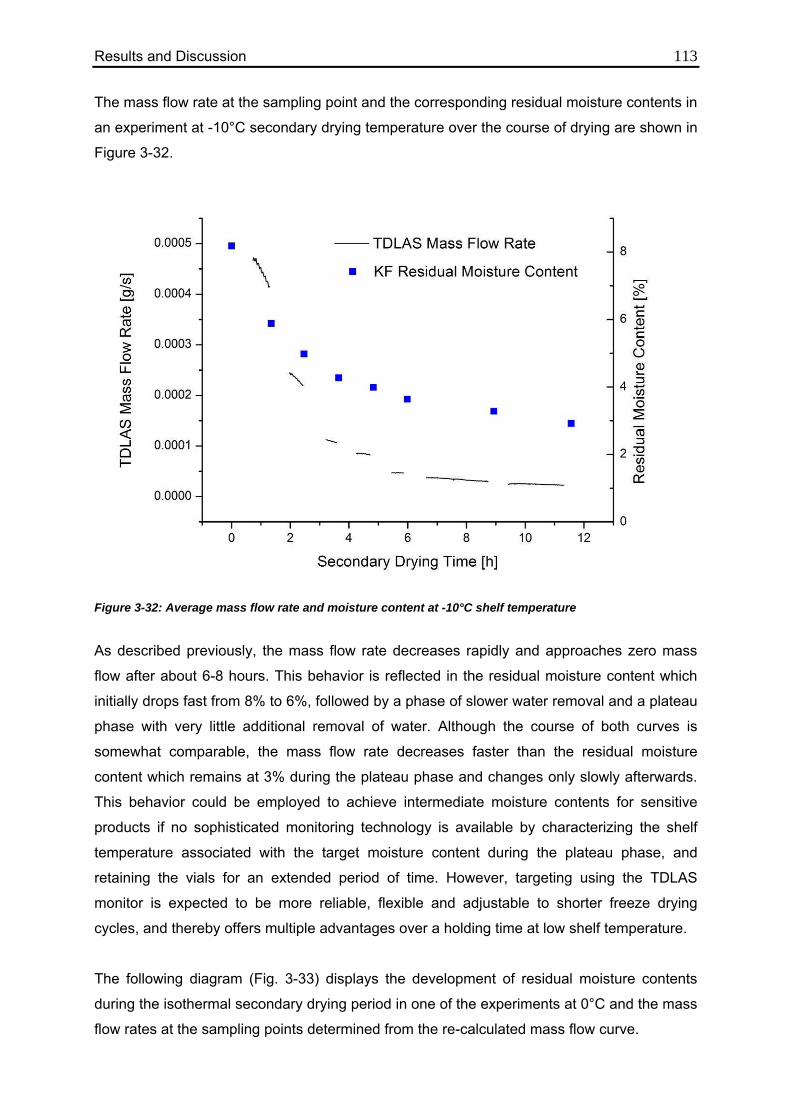
Results and Discussion 113 The mass flow rate at the sampling point and the corresponding residual moisture contents in
an experiment at -10°C secondary drying temperature over the course of drying are shown in
Figure 3-32.
Figure 3-32: Average mass flow rate and moisture content at -10°C shelf temperature
As described previously, the mass flow rate decreases rapidly and approaches zero mass
flow after about 6-8 hours. This behavior is reflected in the residual moisture content which
initially drops fast from 8% to 6%, followed by a phase of slower water removal and a plateau
phase with very little additional removal of water. Although the course of both curves is
somewhat comparable, the mass flow rate decreases faster than the residual moisture
content which remains at 3% during the plateau phase and changes only slowly afterwards.
This behavior could be employed to achieve intermediate moisture contents for sensitive
products if no sophisticated monitoring technology is available by characterizing the shelf
temperature associated with the target moisture content during the plateau phase, and
retaining the vials for an extended period of time. However, targeting using the TDLAS
monitor is expected to be more reliable, flexible and adjustable to shorter freeze drying
cycles, and thereby offers multiple advantages over a holding time at low shelf temperature.
The following diagram (Fig. 3-33) displays the development of residual moisture contents
during the isothermal secondary drying period in one of the experiments at 0°C and the mass
flow rates at the sampling points determined from the re-calculated mass flow curve.
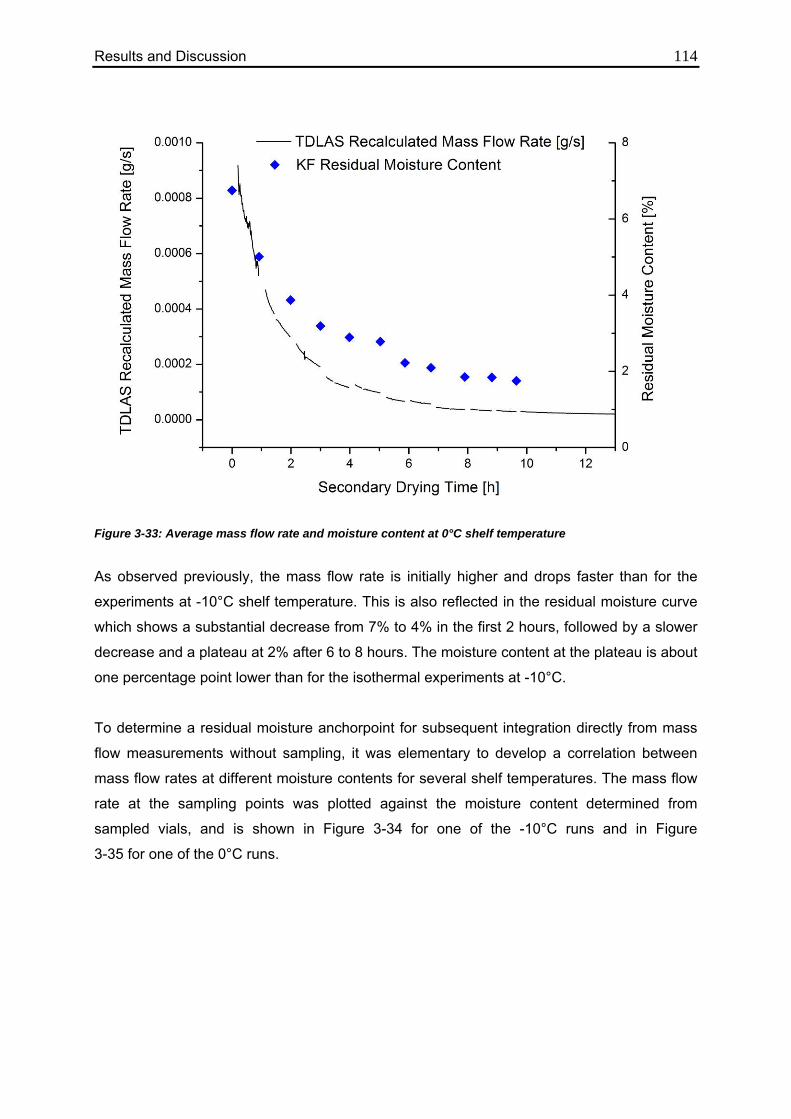
Results and Discussion 114
Figure 3-33: Average mass flow rate and moisture content at 0°C shelf temperature
As observed previously, the mass flow rate is initially higher and drops faster than for the
experiments at -10°C shelf temperature. This is also reflected in the residual moisture curve
which shows a substantial decrease from 7% to 4% in the first 2 hours, followed by a slower
decrease and a plateau at 2% after 6 to 8 hours. The moisture content at the plateau is about
one percentage point lower than for the isothermal experiments at -10°C.
To determine a residual moisture anchorpoint for subsequent integration directly from mass
flow measurements without sampling, it was elementary to develop a correlation between
mass flow rates at different moisture contents for several shelf temperatures. The mass flow
rate at the sampling points was plotted against the moisture content determined from
sampled vials, and is shown in Figure 3-34 for one of the -10°C runs and in Figure
3-35 for one of the 0°C runs.
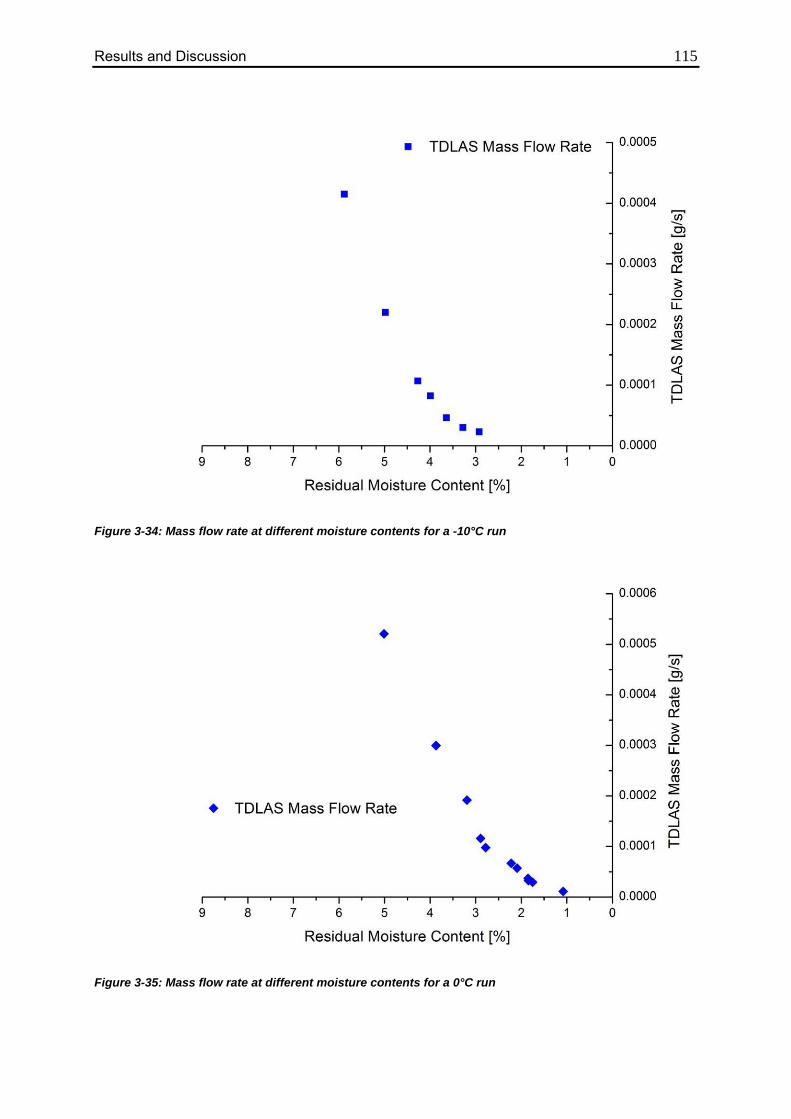
Results and Discussion 115
Figure 3-34: Mass flow rate at different moisture contents for a -10°C run
Figure 3-35: Mass flow rate at different moisture contents for a 0°C run
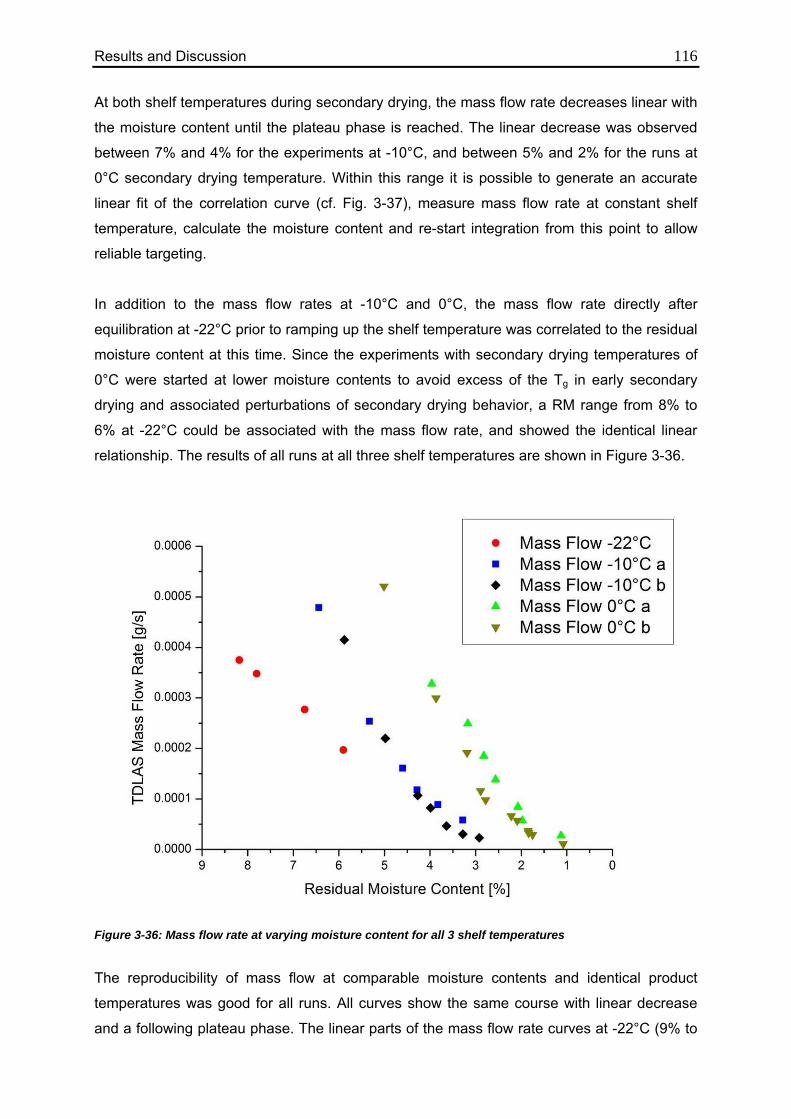
Results and Discussion 116 At both shelf temperatures during secondary drying, the mass flow rate decreases linear with
the moisture content until the plateau phase is reached. The linear decrease was observed
between 7% and 4% for the experiments at -10°C, and between 5% and 2% for the runs at
0°C secondary drying temperature. Within this range it is possible to generate an accurate
linear fit of the correlation curve (cf. Fig. 3-37), measure mass flow rate at constant shelf
temperature, calculate the moisture content and re-start integration from this point to allow
reliable targeting.
In addition to the mass flow rates at -10°C and 0°C, the mass flow rate directly after
equilibration at -22°C prior to ramping up the shelf temperature was correlated to the residual
moisture content at this time. Since the experiments with secondary drying temperatures of
0°C were started at lower moisture contents to avoid excess of the Tg in early secondary
drying and associated perturbations of secondary drying behavior, a RM range from 8% to
6% at -22°C could be associated with the mass flow rate, and showed the identical linear
relationship. The results of all runs at all three shelf temperatures are shown in Figure 3-36.
Figure 3-36: Mass flow rate at varying moisture content for all 3 shelf temperatures
The reproducibility of mass flow at comparable moisture contents and identical product
temperatures was good for all runs. All curves show the same course with linear decrease
and a following plateau phase. The linear parts of the mass flow rate curves at -22°C (9% to
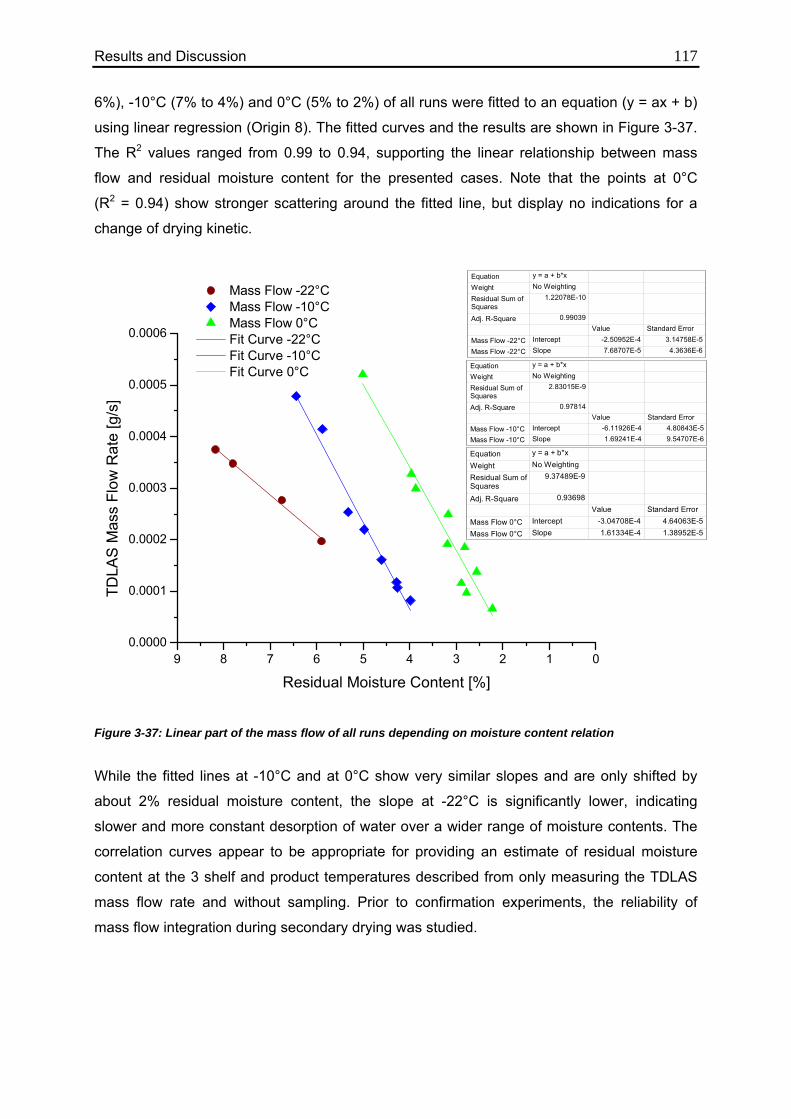
Results and Discussion 117 6%), -10°C (7% to 4%) and 0°C (5% to 2%) of all runs were fitted to an equation (y = ax + b)
using linear regression (Origin 8). The fitted curves and the results are shown in Figure 3-37.
The R2 values ranged from 0.99 to 0.94, supporting the linear relationship between mass
flow and residual moisture content for the presented cases. Note that the points at 0°C
(R2 = 0.94) show stronger scattering around the fitted line, but display no indications for a
change of drying kinetic.
9 8 7 6 5 4 3 2 1 00.0000
0.0001
0.0002
0.0003
0.0004
0.0005
0.0006
Mass Flow -22°C Mass Flow -10°C Mass Flow 0°C Fit Curve -22°C Fit Curve -10°C Fit Curve 0°C
TDLA
S M
ass
Flow
Rat
e [g
/s]
Residual Moisture Content [%]
Equation y = a + b*x
Weight No Weighting
Residual Sum of Squares
1.22078E-10
Adj. R-Square 0.99039Value Standard Error
Mass Flow -22°C Intercept -2.50952E-4 3.14758E-5
Mass Flow -22°C Slope 7.68707E-5 4.3636E-6
Equation y = a + b*x
Weight No Weighting
Residual Sum of Squares
2.83015E-9
Adj. R-Square 0.97814Value Standard Error
Mass Flow -10°C Intercept -6.11926E-4 4.80843E-5Mass Flow -10°C Slope 1.69241E-4 9.54707E-6
Equation y = a + b*x
Weight No Weighting
Residual Sum of Squares
9.37489E-9
Adj. R-Square 0.93698Value Standard Error
Mass Flow 0°C Intercept -3.04708E-4 4.64063E-5
Mass Flow 0°C Slope 1.61334E-4 1.38952E-5
Figure 3-37: Linear part of the mass flow of all runs depending on moisture content relation
While the fitted lines at -10°C and at 0°C show very similar slopes and are only shifted by
about 2% residual moisture content, the slope at -22°C is significantly lower, indicating
slower and more constant desorption of water over a wider range of moisture contents. The
correlation curves appear to be appropriate for providing an estimate of residual moisture
content at the 3 shelf and product temperatures described from only measuring the TDLAS
mass flow rate and without sampling. Prior to confirmation experiments, the reliability of
mass flow integration during secondary drying was studied.
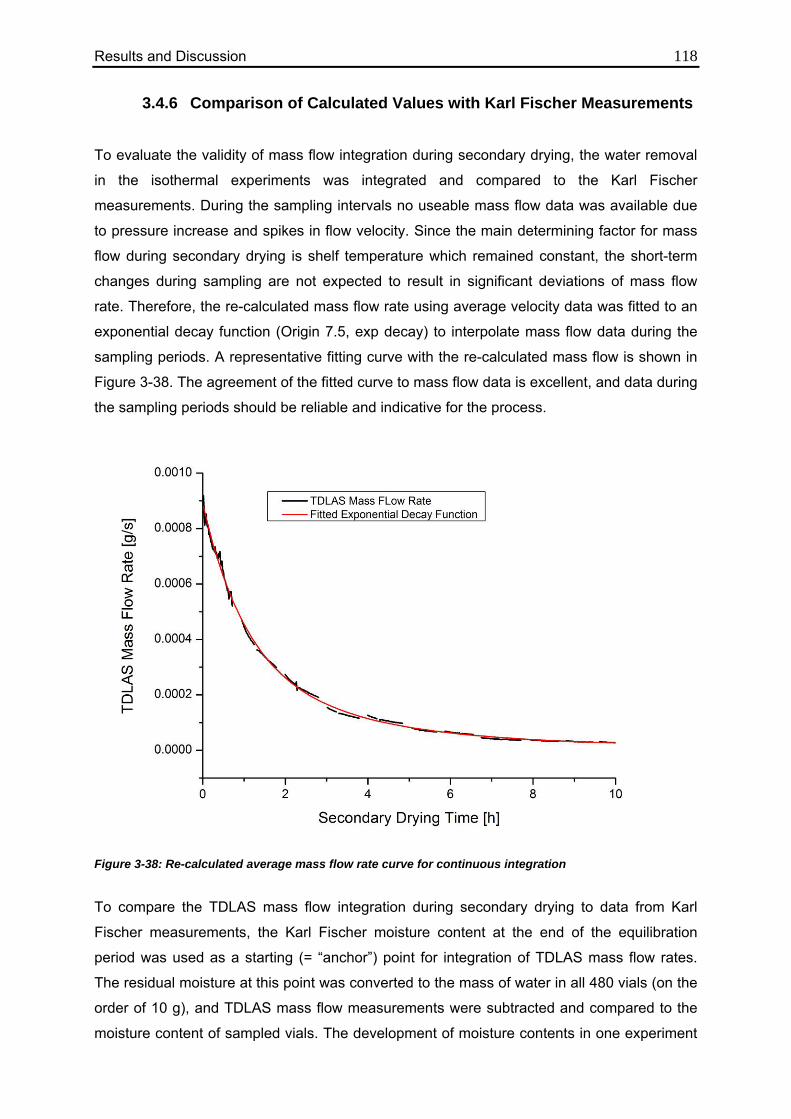
Results and Discussion 118
3.4.6 Comparison of Calculated Values with Karl Fischer Measurements
To evaluate the validity of mass flow integration during secondary drying, the water removal
in the isothermal experiments was integrated and compared to the Karl Fischer
measurements. During the sampling intervals no useable mass flow data was available due
to pressure increase and spikes in flow velocity. Since the main determining factor for mass
flow during secondary drying is shelf temperature which remained constant, the short-term
changes during sampling are not expected to result in significant deviations of mass flow
rate. Therefore, the re-calculated mass flow rate using average velocity data was fitted to an
exponential decay function (Origin 7.5, exp decay) to interpolate mass flow data during the
sampling periods. A representative fitting curve with the re-calculated mass flow is shown in
Figure 3-38. The agreement of the fitted curve to mass flow data is excellent, and data during
the sampling periods should be reliable and indicative for the process.
Figure 3-38: Re-calculated average mass flow rate curve for continuous integration
To compare the TDLAS mass flow integration during secondary drying to data from Karl
Fischer measurements, the Karl Fischer moisture content at the end of the equilibration
period was used as a starting (= “anchor”) point for integration of TDLAS mass flow rates.
The residual moisture at this point was converted to the mass of water in all 480 vials (on the
order of 10 g), and TDLAS mass flow measurements were subtracted and compared to the
moisture content of sampled vials. The development of moisture contents in one experiment
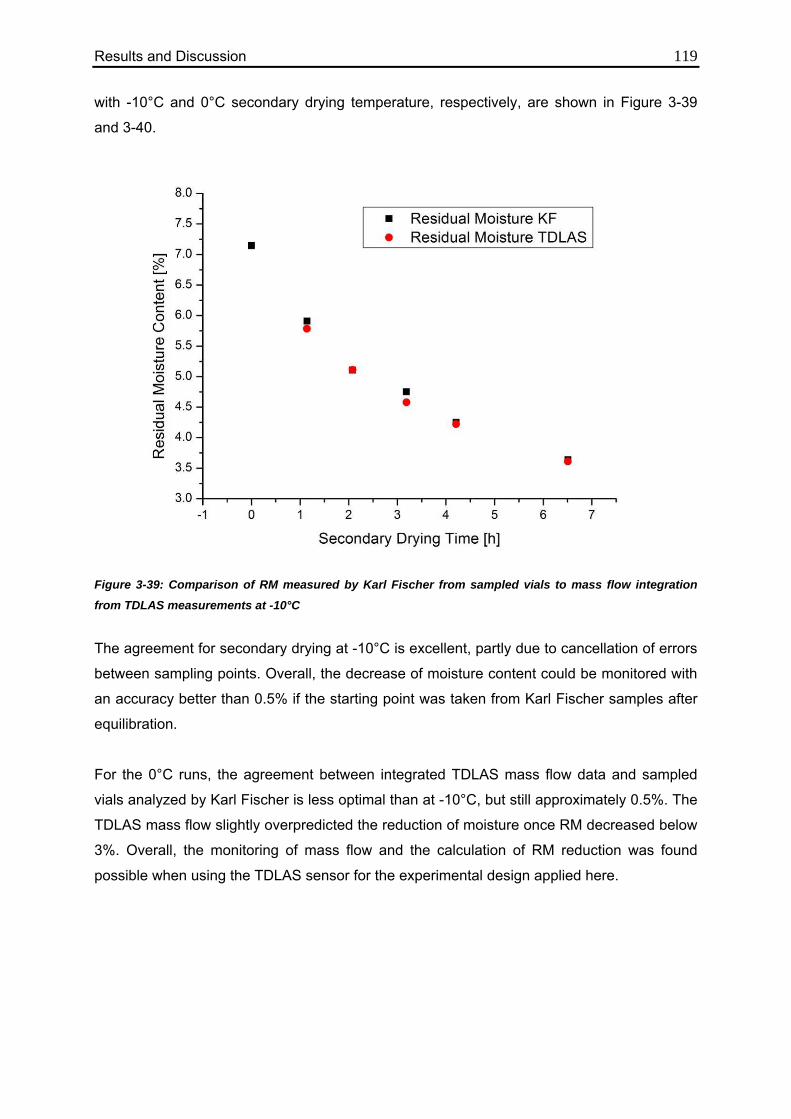
Results and Discussion 119 with -10°C and 0°C secondary drying temperature, respectively, are shown in Figure 3-39
and 3-40.
Figure 3-39: Comparison of RM measured by Karl Fischer from sampled vials to mass flow integration
from TDLAS measurements at -10°C
The agreement for secondary drying at -10°C is excellent, partly due to cancellation of errors
between sampling points. Overall, the decrease of moisture content could be monitored with
an accuracy better than 0.5% if the starting point was taken from Karl Fischer samples after
equilibration.
For the 0°C runs, the agreement between integrated TDLAS mass flow data and sampled
vials analyzed by Karl Fischer is less optimal than at -10°C, but still approximately 0.5%. The
TDLAS mass flow slightly overpredicted the reduction of moisture once RM decreased below
3%. Overall, the monitoring of mass flow and the calculation of RM reduction was found
possible when using the TDLAS sensor for the experimental design applied here.
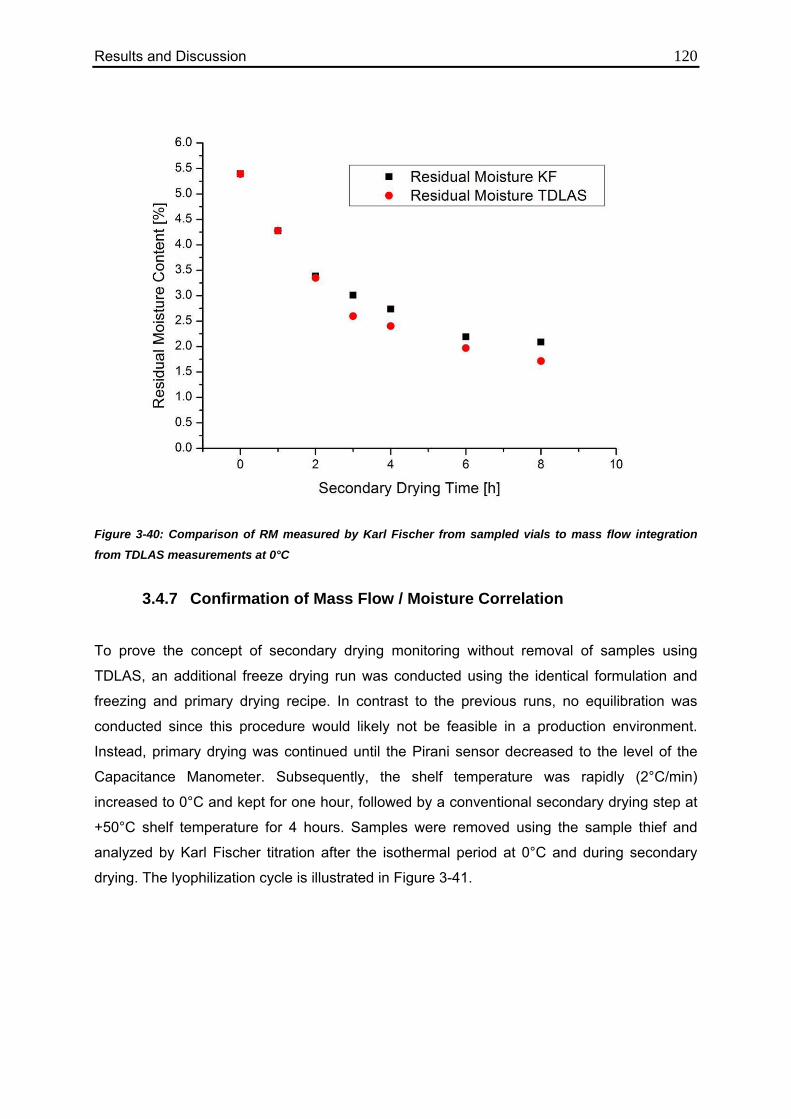
Results and Discussion 120
Figure 3-40: Comparison of RM measured by Karl Fischer from sampled vials to mass flow integration
from TDLAS measurements at 0°C
3.4.7 Confirmation of Mass Flow / Moisture Correlation
To prove the concept of secondary drying monitoring without removal of samples using
TDLAS, an additional freeze drying run was conducted using the identical formulation and
freezing and primary drying recipe. In contrast to the previous runs, no equilibration was
conducted since this procedure would likely not be feasible in a production environment.
Instead, primary drying was continued until the Pirani sensor decreased to the level of the
Capacitance Manometer. Subsequently, the shelf temperature was rapidly (2°C/min)
increased to 0°C and kept for one hour, followed by a conventional secondary drying step at
+50°C shelf temperature for 4 hours. Samples were removed using the sample thief and
analyzed by Karl Fischer titration after the isothermal period at 0°C and during secondary
drying. The lyophilization cycle is illustrated in Figure 3-41.
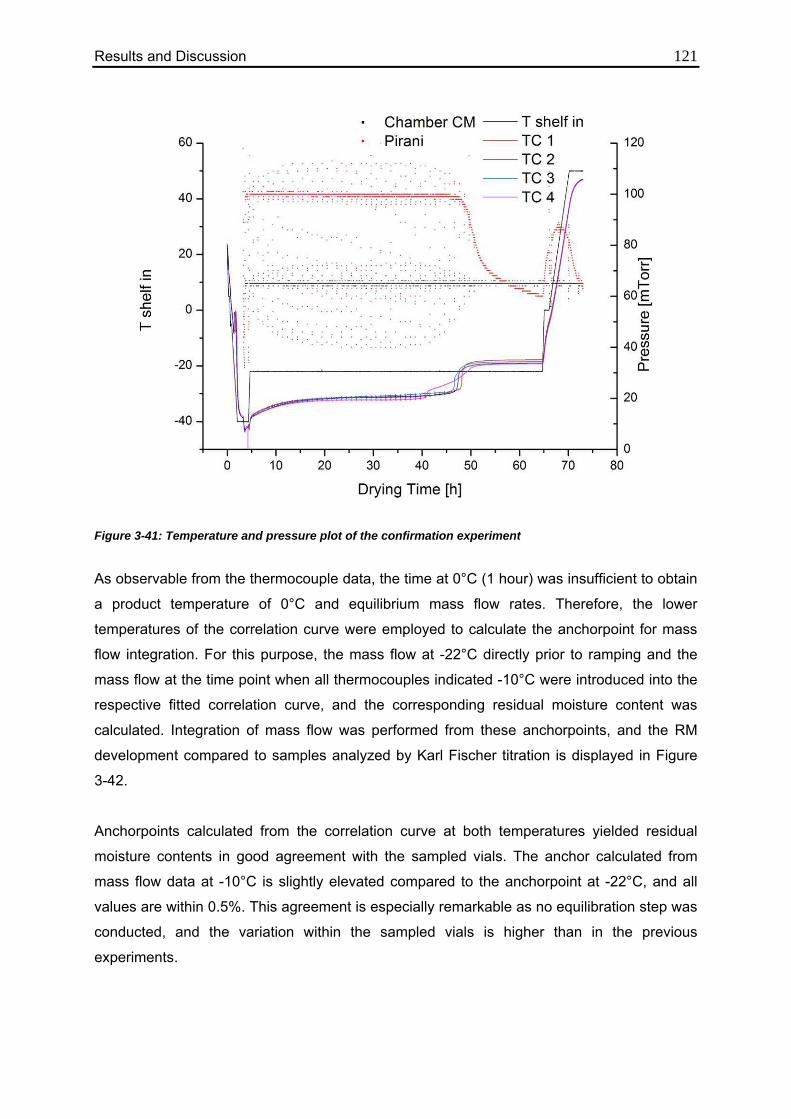
Results and Discussion 121
Figure 3-41: Temperature and pressure plot of the confirmation experiment
As observable from the thermocouple data, the time at 0°C (1 hour) was insufficient to obtain
a product temperature of 0°C and equilibrium mass flow rates. Therefore, the lower
temperatures of the correlation curve were employed to calculate the anchorpoint for mass
flow integration. For this purpose, the mass flow at -22°C directly prior to ramping and the
mass flow at the time point when all thermocouples indicated -10°C were introduced into the
respective fitted correlation curve, and the corresponding residual moisture content was
calculated. Integration of mass flow was performed from these anchorpoints, and the RM
development compared to samples analyzed by Karl Fischer titration is displayed in Figure
3-42.
Anchorpoints calculated from the correlation curve at both temperatures yielded residual
moisture contents in good agreement with the sampled vials. The anchor calculated from
mass flow data at -10°C is slightly elevated compared to the anchorpoint at -22°C, and all
values are within 0.5%. This agreement is especially remarkable as no equilibration step was
conducted, and the variation within the sampled vials is higher than in the previous
experiments.
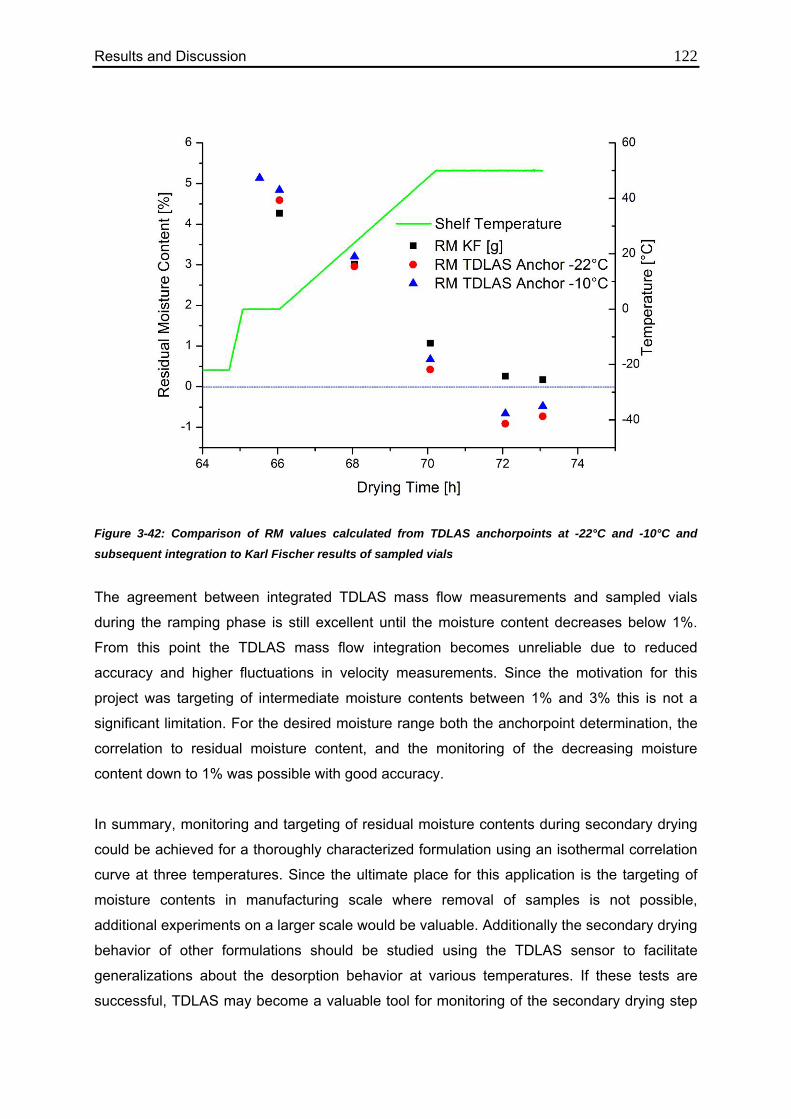
Results and Discussion 122
Figure 3-42: Comparison of RM values calculated from TDLAS anchorpoints at -22°C and -10°C and
subsequent integration to Karl Fischer results of sampled vials
The agreement between integrated TDLAS mass flow measurements and sampled vials
during the ramping phase is still excellent until the moisture content decreases below 1%.
From this point the TDLAS mass flow integration becomes unreliable due to reduced
accuracy and higher fluctuations in velocity measurements. Since the motivation for this
project was targeting of intermediate moisture contents between 1% and 3% this is not a
significant limitation. For the desired moisture range both the anchorpoint determination, the
correlation to residual moisture content, and the monitoring of the decreasing moisture
content down to 1% was possible with good accuracy.
In summary, monitoring and targeting of residual moisture contents during secondary drying
could be achieved for a thoroughly characterized formulation using an isothermal correlation
curve at three temperatures. Since the ultimate place for this application is the targeting of
moisture contents in manufacturing scale where removal of samples is not possible,
additional experiments on a larger scale would be valuable. Additionally the secondary drying
behavior of other formulations should be studied using the TDLAS sensor to facilitate
generalizations about the desorption behavior at various temperatures. If these tests are
successful, TDLAS may become a valuable tool for monitoring of the secondary drying step

Results and Discussion 123 and targeting of intermediate moisture contents in lyophilization of sensitive and complex
formulations.
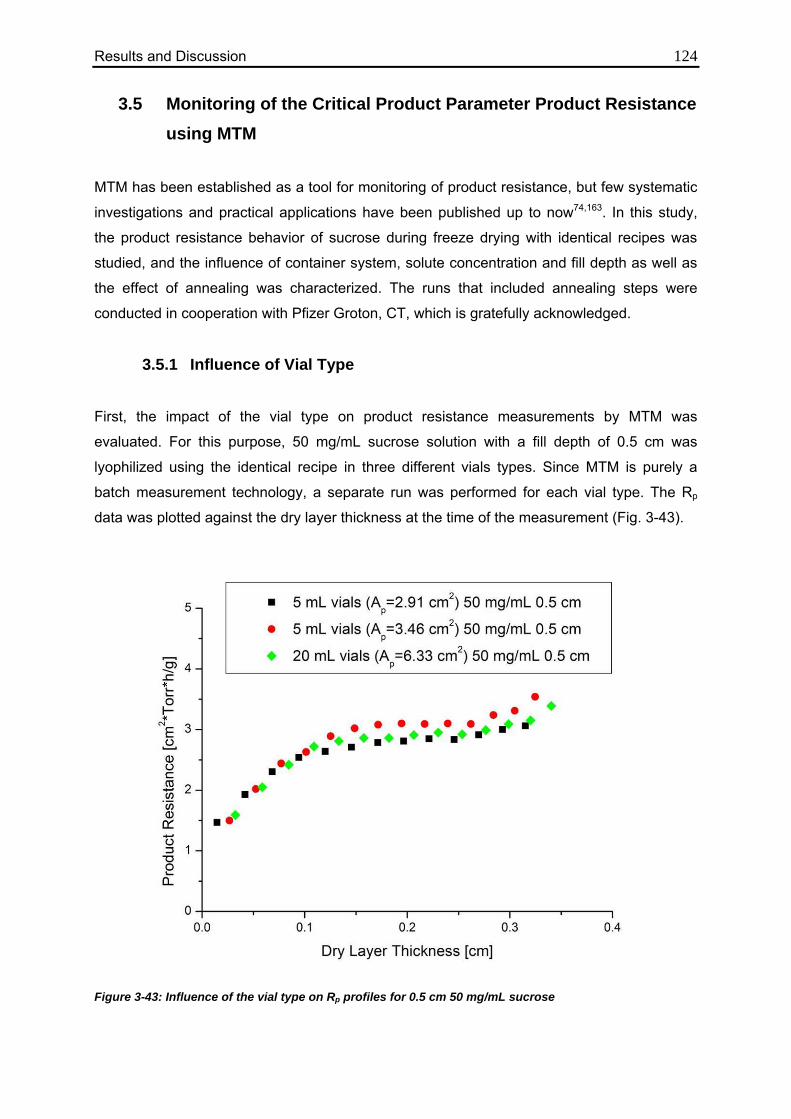
Results and Discussion 124
3.5 Monitoring of the Critical Product Parameter Product Resistance using MTM
MTM has been established as a tool for monitoring of product resistance, but few systematic
investigations and practical applications have been published up to now74,163. In this study,
the product resistance behavior of sucrose during freeze drying with identical recipes was
studied, and the influence of container system, solute concentration and fill depth as well as
the effect of annealing was characterized. The runs that included annealing steps were
conducted in cooperation with Pfizer Groton, CT, which is gratefully acknowledged.
3.5.1 Influence of Vial Type
First, the impact of the vial type on product resistance measurements by MTM was
evaluated. For this purpose, 50 mg/mL sucrose solution with a fill depth of 0.5 cm was
lyophilized using the identical recipe in three different vials types. Since MTM is purely a
batch measurement technology, a separate run was performed for each vial type. The Rp
data was plotted against the dry layer thickness at the time of the measurement (Fig. 3-43).
Figure 3-43: Influence of the vial type on Rp profiles for 0.5 cm 50 mg/mL sucrose
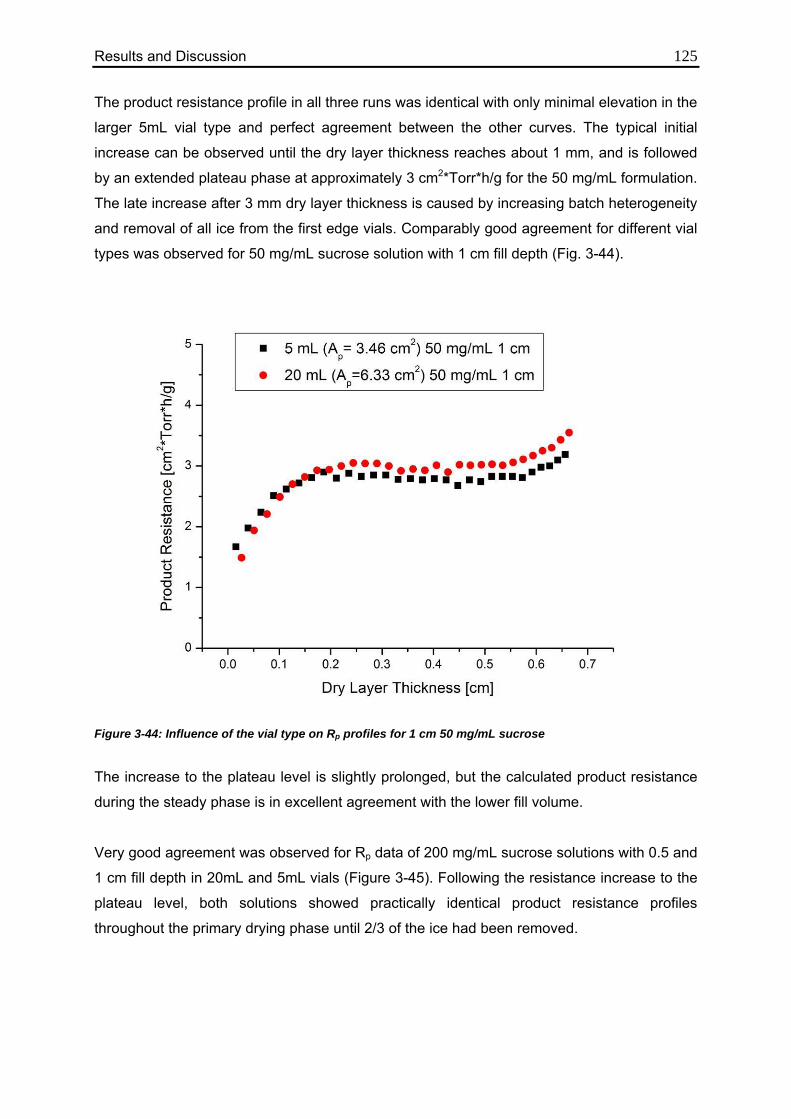
Results and Discussion 125 The product resistance profile in all three runs was identical with only minimal elevation in the
larger 5mL vial type and perfect agreement between the other curves. The typical initial
increase can be observed until the dry layer thickness reaches about 1 mm, and is followed
by an extended plateau phase at approximately 3 cm2*Torr*h/g for the 50 mg/mL formulation.
The late increase after 3 mm dry layer thickness is caused by increasing batch heterogeneity
and removal of all ice from the first edge vials. Comparably good agreement for different vial
types was observed for 50 mg/mL sucrose solution with 1 cm fill depth (Fig. 3-44).
Figure 3-44: Influence of the vial type on Rp profiles for 1 cm 50 mg/mL sucrose
The increase to the plateau level is slightly prolonged, but the calculated product resistance
during the steady phase is in excellent agreement with the lower fill volume.
Very good agreement was observed for Rp data of 200 mg/mL sucrose solutions with 0.5 and
1 cm fill depth in 20mL and 5mL vials (Figure 3-45). Following the resistance increase to the
plateau level, both solutions showed practically identical product resistance profiles
throughout the primary drying phase until 2/3 of the ice had been removed.
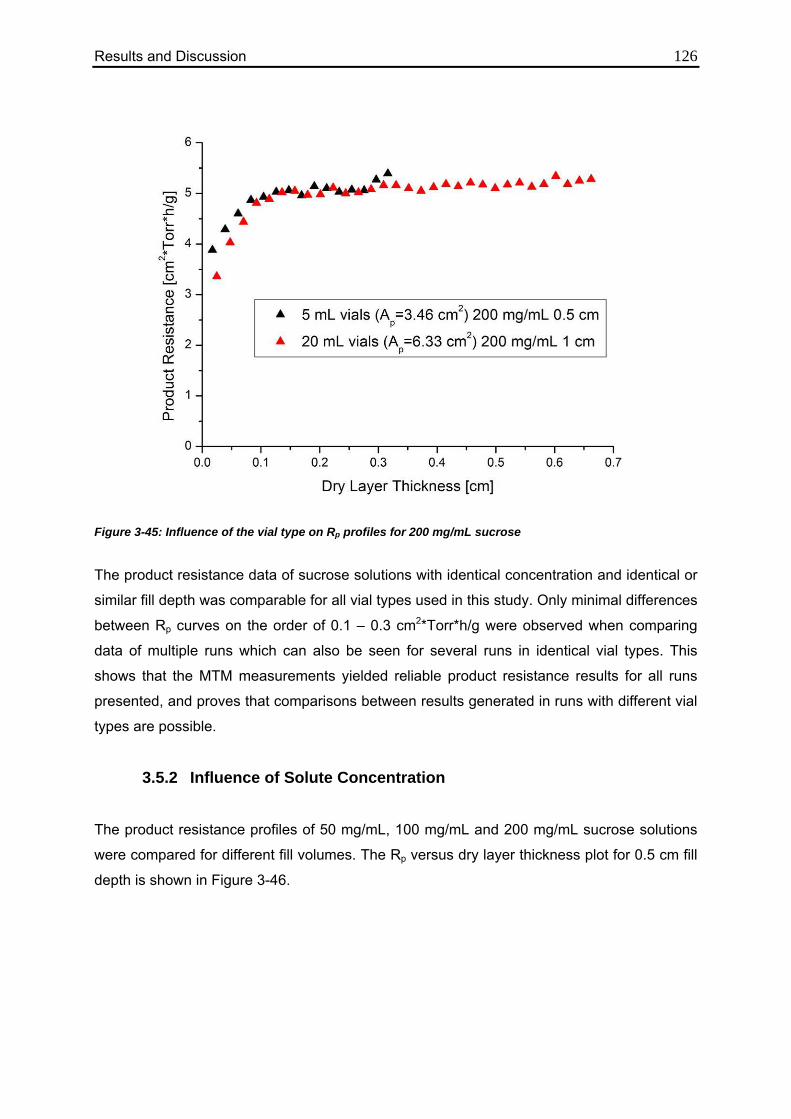
Results and Discussion 126
Figure 3-45: Influence of the vial type on Rp profiles for 200 mg/mL sucrose
The product resistance data of sucrose solutions with identical concentration and identical or
similar fill depth was comparable for all vial types used in this study. Only minimal differences
between Rp curves on the order of 0.1 – 0.3 cm2*Torr*h/g were observed when comparing
data of multiple runs which can also be seen for several runs in identical vial types. This
shows that the MTM measurements yielded reliable product resistance results for all runs
presented, and proves that comparisons between results generated in runs with different vial
types are possible.
3.5.2 Influence of Solute Concentration The product resistance profiles of 50 mg/mL, 100 mg/mL and 200 mg/mL sucrose solutions
were compared for different fill volumes. The Rp versus dry layer thickness plot for 0.5 cm fill
depth is shown in Figure 3-46.
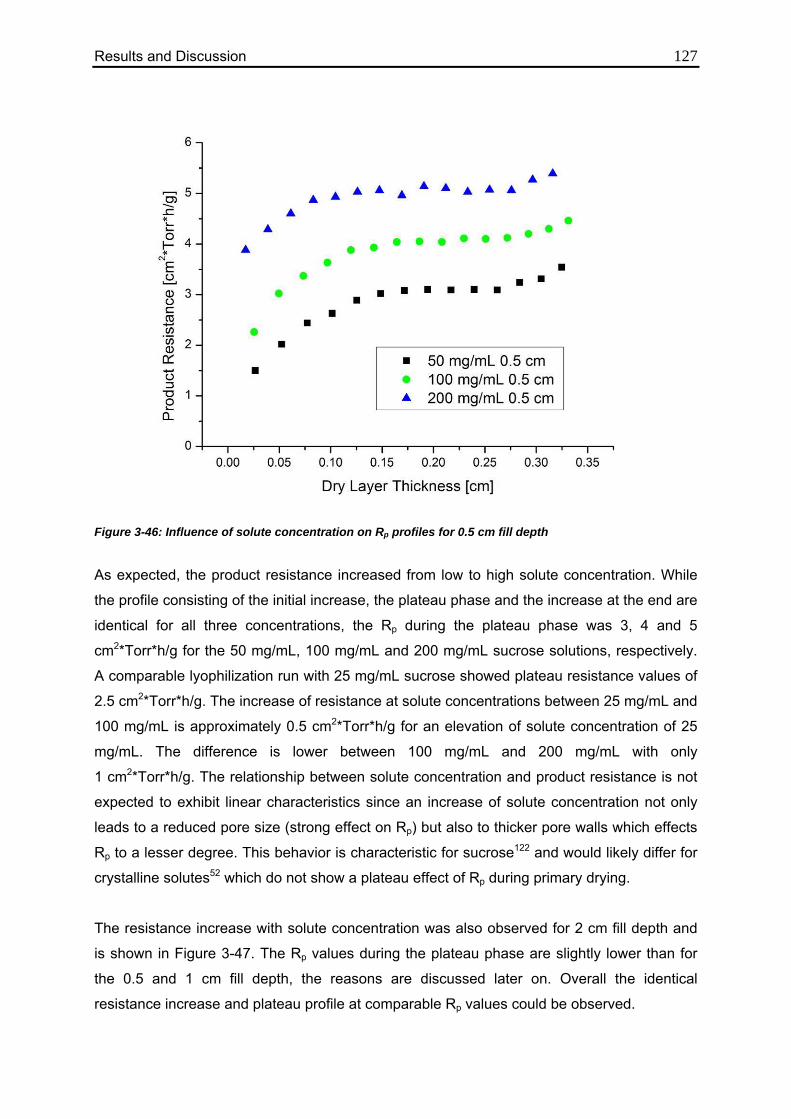
Results and Discussion 127
Figure 3-46: Influence of solute concentration on Rp profiles for 0.5 cm fill depth
As expected, the product resistance increased from low to high solute concentration. While
the profile consisting of the initial increase, the plateau phase and the increase at the end are
identical for all three concentrations, the Rp during the plateau phase was 3, 4 and 5
cm2*Torr*h/g for the 50 mg/mL, 100 mg/mL and 200 mg/mL sucrose solutions, respectively.
A comparable lyophilization run with 25 mg/mL sucrose showed plateau resistance values of
2.5 cm2*Torr*h/g. The increase of resistance at solute concentrations between 25 mg/mL and
100 mg/mL is approximately 0.5 cm2*Torr*h/g for an elevation of solute concentration of 25
mg/mL. The difference is lower between 100 mg/mL and 200 mg/mL with only
1 cm2*Torr*h/g. The relationship between solute concentration and product resistance is not
expected to exhibit linear characteristics since an increase of solute concentration not only
leads to a reduced pore size (strong effect on Rp) but also to thicker pore walls which effects
Rp to a lesser degree. This behavior is characteristic for sucrose122 and would likely differ for
crystalline solutes52 which do not show a plateau effect of Rp during primary drying.
The resistance increase with solute concentration was also observed for 2 cm fill depth and
is shown in Figure 3-47. The Rp values during the plateau phase are slightly lower than for
the 0.5 and 1 cm fill depth, the reasons are discussed later on. Overall the identical
resistance increase and plateau profile at comparable Rp values could be observed.
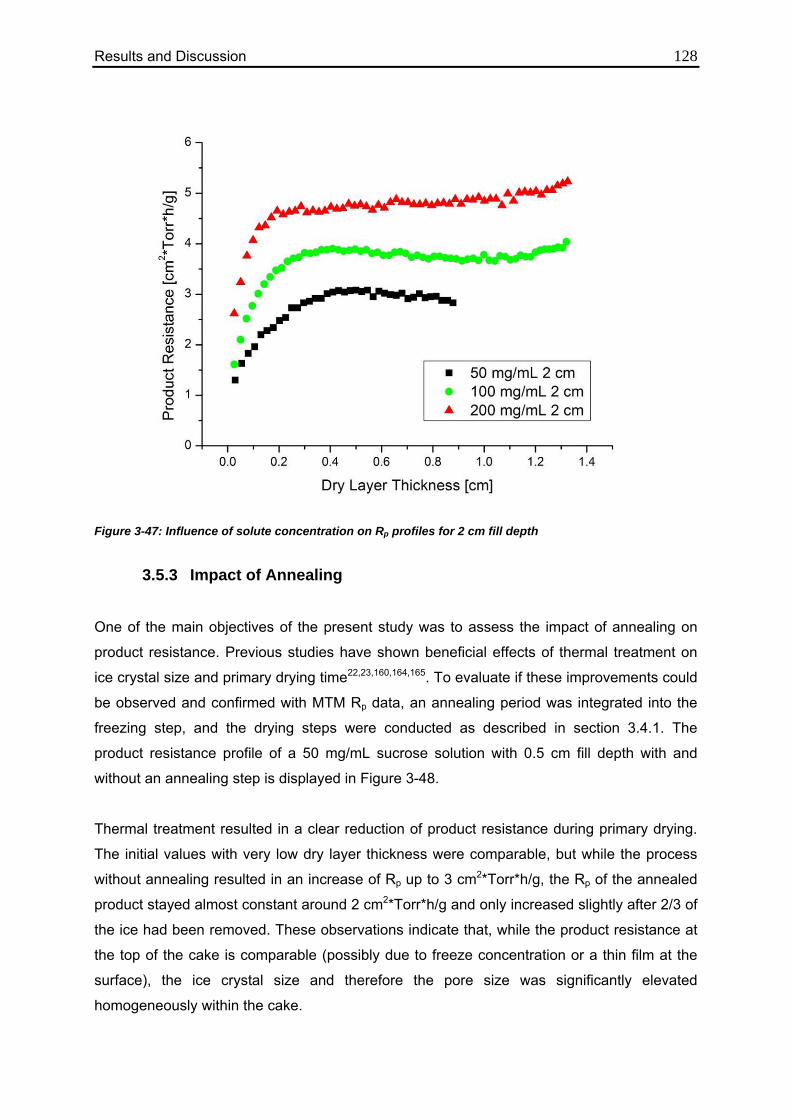
Results and Discussion 128
Figure 3-47: Influence of solute concentration on Rp profiles for 2 cm fill depth
3.5.3 Impact of Annealing
One of the main objectives of the present study was to assess the impact of annealing on
product resistance. Previous studies have shown beneficial effects of thermal treatment on
ice crystal size and primary drying time22,23,160,164,165. To evaluate if these improvements could
be observed and confirmed with MTM Rp data, an annealing period was integrated into the
freezing step, and the drying steps were conducted as described in section 3.4.1. The
product resistance profile of a 50 mg/mL sucrose solution with 0.5 cm fill depth with and
without an annealing step is displayed in Figure 3-48.
Thermal treatment resulted in a clear reduction of product resistance during primary drying.
The initial values with very low dry layer thickness were comparable, but while the process
without annealing resulted in an increase of Rp up to 3 cm2*Torr*h/g, the Rp of the annealed
product stayed almost constant around 2 cm2*Torr*h/g and only increased slightly after 2/3 of
the ice had been removed. These observations indicate that, while the product resistance at
the top of the cake is comparable (possibly due to freeze concentration or a thin film at the
surface), the ice crystal size and therefore the pore size was significantly elevated
homogeneously within the cake.
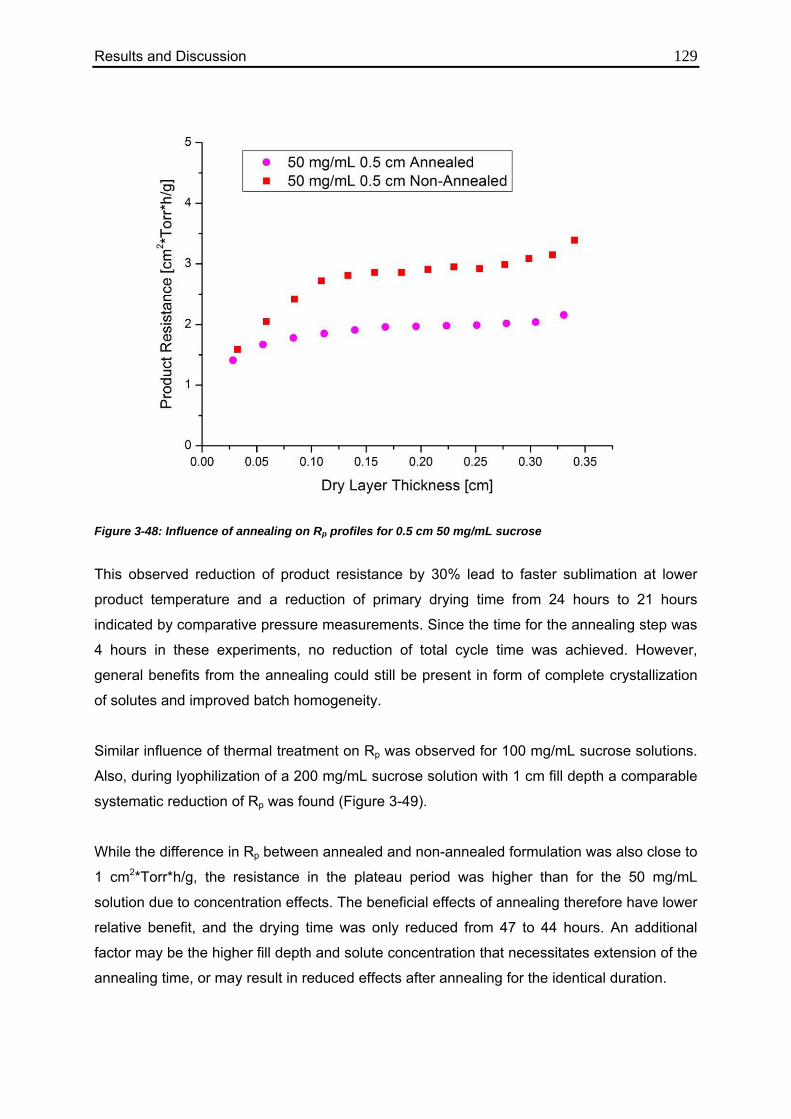
Results and Discussion 129
Figure 3-48: Influence of annealing on Rp profiles for 0.5 cm 50 mg/mL sucrose
This observed reduction of product resistance by 30% lead to faster sublimation at lower
product temperature and a reduction of primary drying time from 24 hours to 21 hours
indicated by comparative pressure measurements. Since the time for the annealing step was
4 hours in these experiments, no reduction of total cycle time was achieved. However,
general benefits from the annealing could still be present in form of complete crystallization
of solutes and improved batch homogeneity.
Similar influence of thermal treatment on Rp was observed for 100 mg/mL sucrose solutions.
Also, during lyophilization of a 200 mg/mL sucrose solution with 1 cm fill depth a comparable
systematic reduction of Rp was found (Figure 3-49).
While the difference in Rp between annealed and non-annealed formulation was also close to
1 cm2*Torr*h/g, the resistance in the plateau period was higher than for the 50 mg/mL
solution due to concentration effects. The beneficial effects of annealing therefore have lower
relative benefit, and the drying time was only reduced from 47 to 44 hours. An additional
factor may be the higher fill depth and solute concentration that necessitates extension of the
annealing time, or may result in reduced effects after annealing for the identical duration.
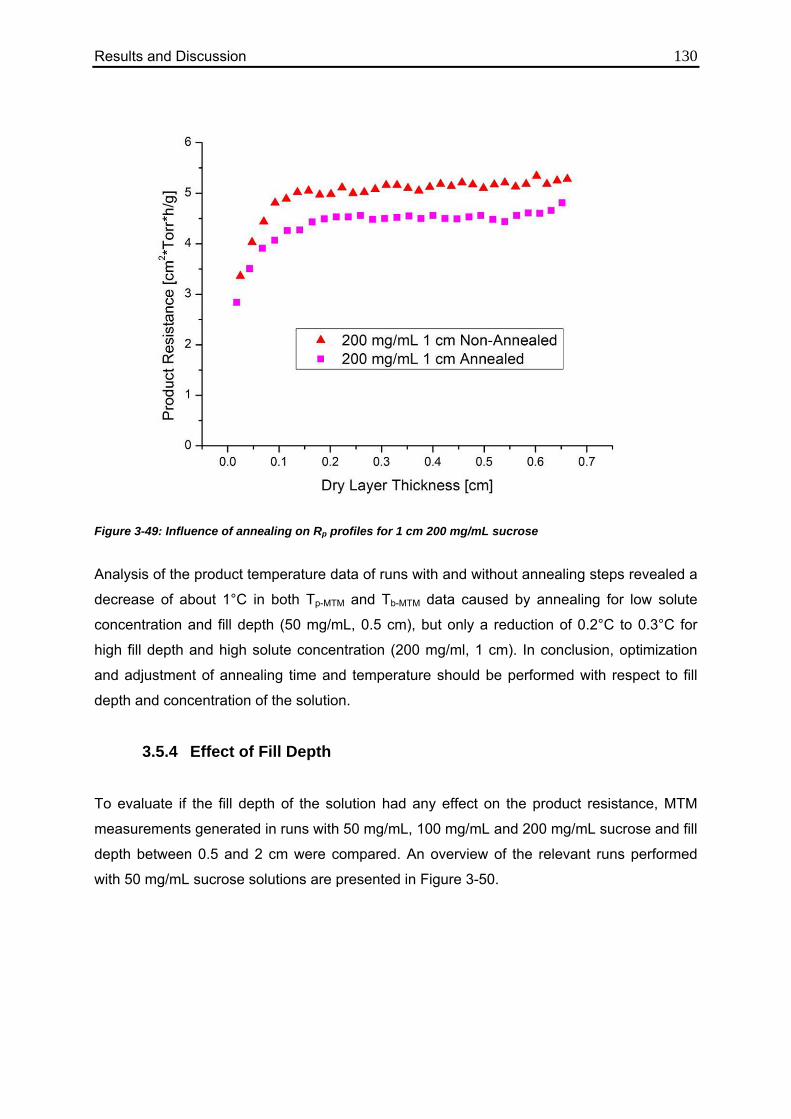
Results and Discussion 130
Figure 3-49: Influence of annealing on Rp profiles for 1 cm 200 mg/mL sucrose
Analysis of the product temperature data of runs with and without annealing steps revealed a
decrease of about 1°C in both Tp-MTM and Tb-MTM data caused by annealing for low solute
concentration and fill depth (50 mg/mL, 0.5 cm), but only a reduction of 0.2°C to 0.3°C for
high fill depth and high solute concentration (200 mg/ml, 1 cm). In conclusion, optimization
and adjustment of annealing time and temperature should be performed with respect to fill
depth and concentration of the solution.
3.5.4 Effect of Fill Depth
To evaluate if the fill depth of the solution had any effect on the product resistance, MTM
measurements generated in runs with 50 mg/mL, 100 mg/mL and 200 mg/mL sucrose and fill
depth between 0.5 and 2 cm were compared. An overview of the relevant runs performed
with 50 mg/mL sucrose solutions are presented in Figure 3-50.
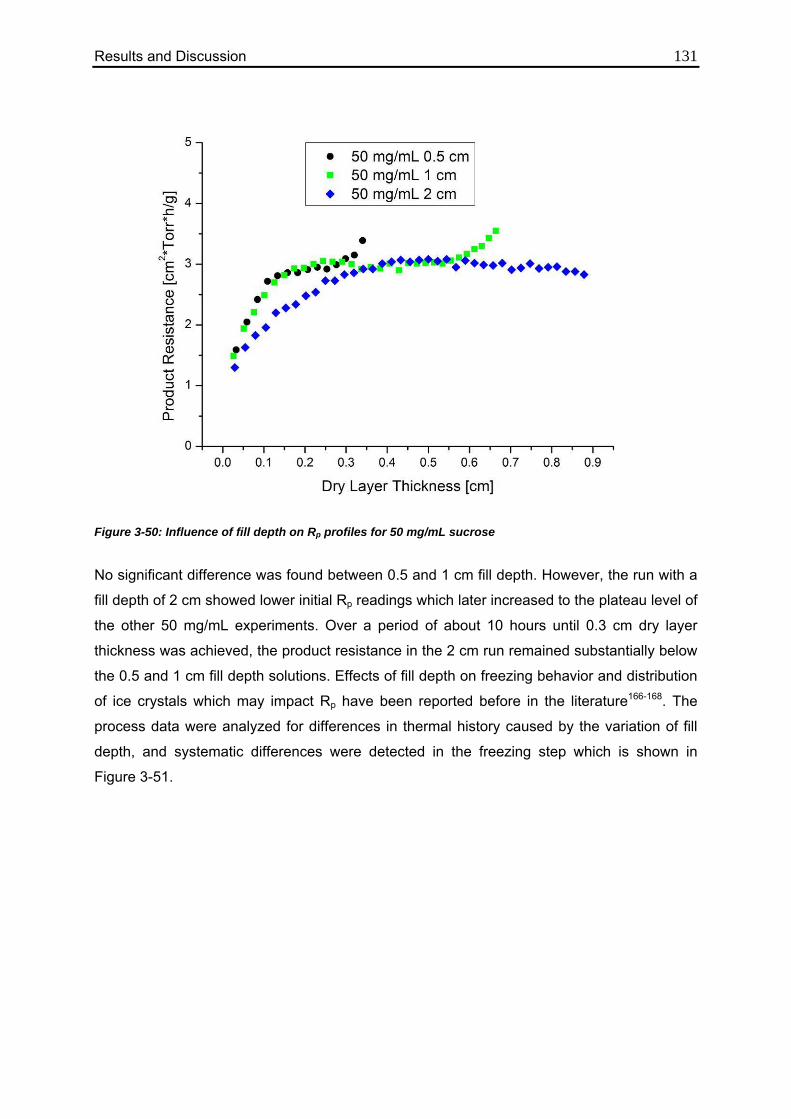
Results and Discussion 131
Figure 3-50: Influence of fill depth on Rp profiles for 50 mg/mL sucrose
No significant difference was found between 0.5 and 1 cm fill depth. However, the run with a
fill depth of 2 cm showed lower initial Rp readings which later increased to the plateau level of
the other 50 mg/mL experiments. Over a period of about 10 hours until 0.3 cm dry layer
thickness was achieved, the product resistance in the 2 cm run remained substantially below
the 0.5 and 1 cm fill depth solutions. Effects of fill depth on freezing behavior and distribution
of ice crystals which may impact Rp have been reported before in the literature166-168. The
process data were analyzed for differences in thermal history caused by the variation of fill
depth, and systematic differences were detected in the freezing step which is shown in
Figure 3-51.
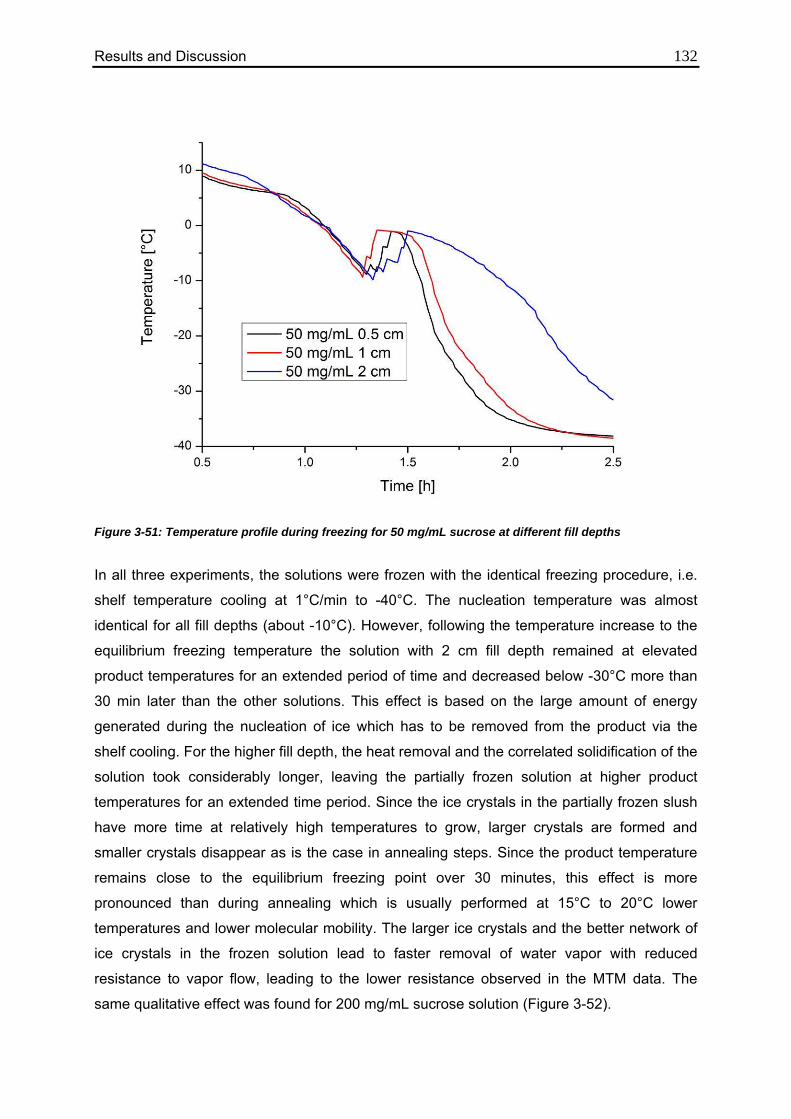
Results and Discussion 132
Figure 3-51: Temperature profile during freezing for 50 mg/mL sucrose at different fill depths
In all three experiments, the solutions were frozen with the identical freezing procedure, i.e.
shelf temperature cooling at 1°C/min to -40°C. The nucleation temperature was almost
identical for all fill depths (about -10°C). However, following the temperature increase to the
equilibrium freezing temperature the solution with 2 cm fill depth remained at elevated
product temperatures for an extended period of time and decreased below -30°C more than
30 min later than the other solutions. This effect is based on the large amount of energy
generated during the nucleation of ice which has to be removed from the product via the
shelf cooling. For the higher fill depth, the heat removal and the correlated solidification of the
solution took considerably longer, leaving the partially frozen solution at higher product
temperatures for an extended time period. Since the ice crystals in the partially frozen slush
have more time at relatively high temperatures to grow, larger crystals are formed and
smaller crystals disappear as is the case in annealing steps. Since the product temperature
remains close to the equilibrium freezing point over 30 minutes, this effect is more
pronounced than during annealing which is usually performed at 15°C to 20°C lower
temperatures and lower molecular mobility. The larger ice crystals and the better network of
ice crystals in the frozen solution lead to faster removal of water vapor with reduced
resistance to vapor flow, leading to the lower resistance observed in the MTM data. The
same qualitative effect was found for 200 mg/mL sucrose solution (Figure 3-52).

Results and Discussion 133
Figure 3-52: Influence of fill depth on Rp profiles for 200 mg/mL sucrose
The experiment with 2 cm fill depth shows a consistent reduction of Rp throughout primary
drying and a very late increase to the resistance level of the lower fill depth after 1 cm of dry
layer thickness had been generated. The solution with 1 cm fill depth that was subjected to
an annealing step showed a slightly higher reduction of Rp in parts of the experiment, but
was in the same range as the 2 cm fill depth solution. This shows that the effect of the
delayed freezing leads to faster consequences for crystal ripening and size distribution than
annealing which needed to be performed for 4 hours to achieve the same results.
Figure 3-53 illustrates the differences between 100 mg/mL sucrose solution with 0.5 cm fill
depth and 2 cm fill depth with and without thermal treatment. As expected from the previous
observations, the solution with 2 cm fill depth showed reduced Rp values compared to the 0.5
cm experiment. Interestingly, annealing of the solution with 2 cm fill depth resulted in an
additional reduction of product resistance throughout primary drying. The reduction was
lower than the reduction observed at lower fill depth, on average 0.6 cm2*Torr*h/g compared
to 1.0 cm2*Torr*h/g. Annealing appeared to cause additional growth and connection of ice
crystals and thereby further lowered the product resistance.
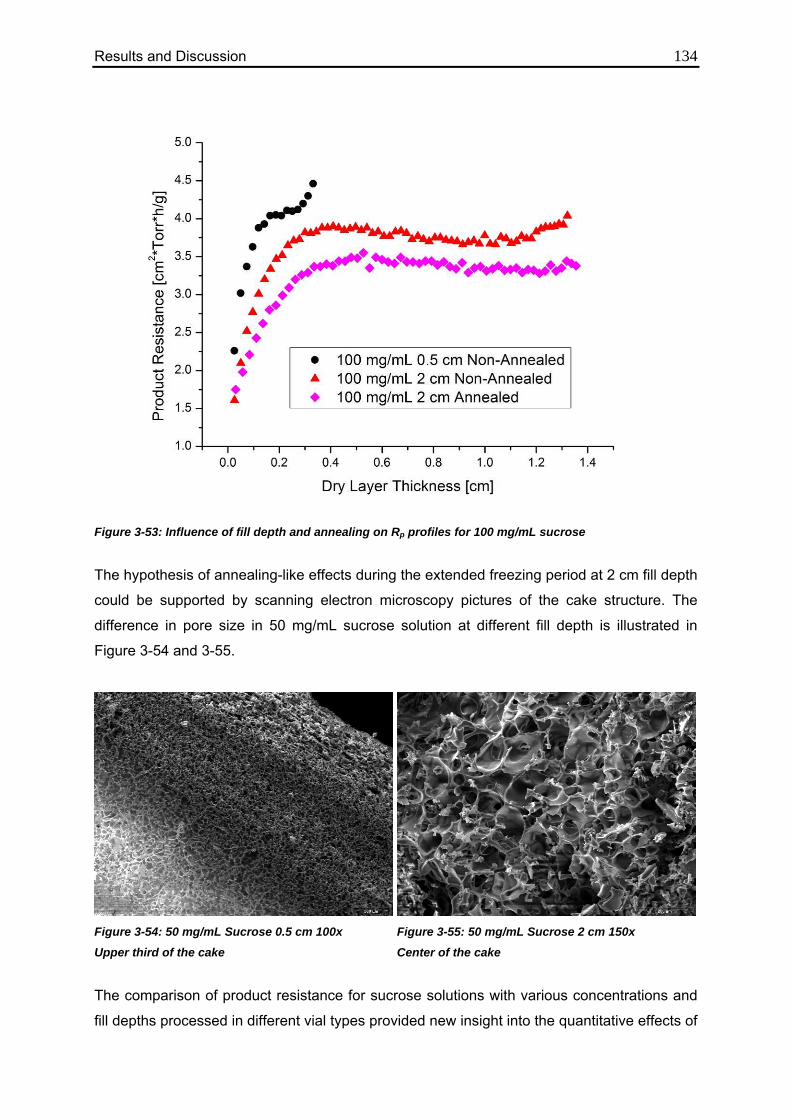
Results and Discussion 134
Figure 3-53: Influence of fill depth and annealing on Rp profiles for 100 mg/mL sucrose
The hypothesis of annealing-like effects during the extended freezing period at 2 cm fill depth
could be supported by scanning electron microscopy pictures of the cake structure. The
difference in pore size in 50 mg/mL sucrose solution at different fill depth is illustrated in
Figure 3-54 and 3-55.
Figure 3-54: 50 mg/mL Sucrose 0.5 cm 100x Figure 3-55: 50 mg/mL Sucrose 2 cm 150x
Upper third of the cake Center of the cake
The comparison of product resistance for sucrose solutions with various concentrations and
fill depths processed in different vial types provided new insight into the quantitative effects of

Results and Discussion 135 annealing and extended freezing. Additionally changes with increasing solute concentration
and robustness of the measurements to different vial types could be observed. The MTM Rp
data was very reliable and comparable for all experiments. The reduction of Rp at high fill
depth could be confirmed with temperature profiles during freezing and SEM pictures of the
lyophilized cake.
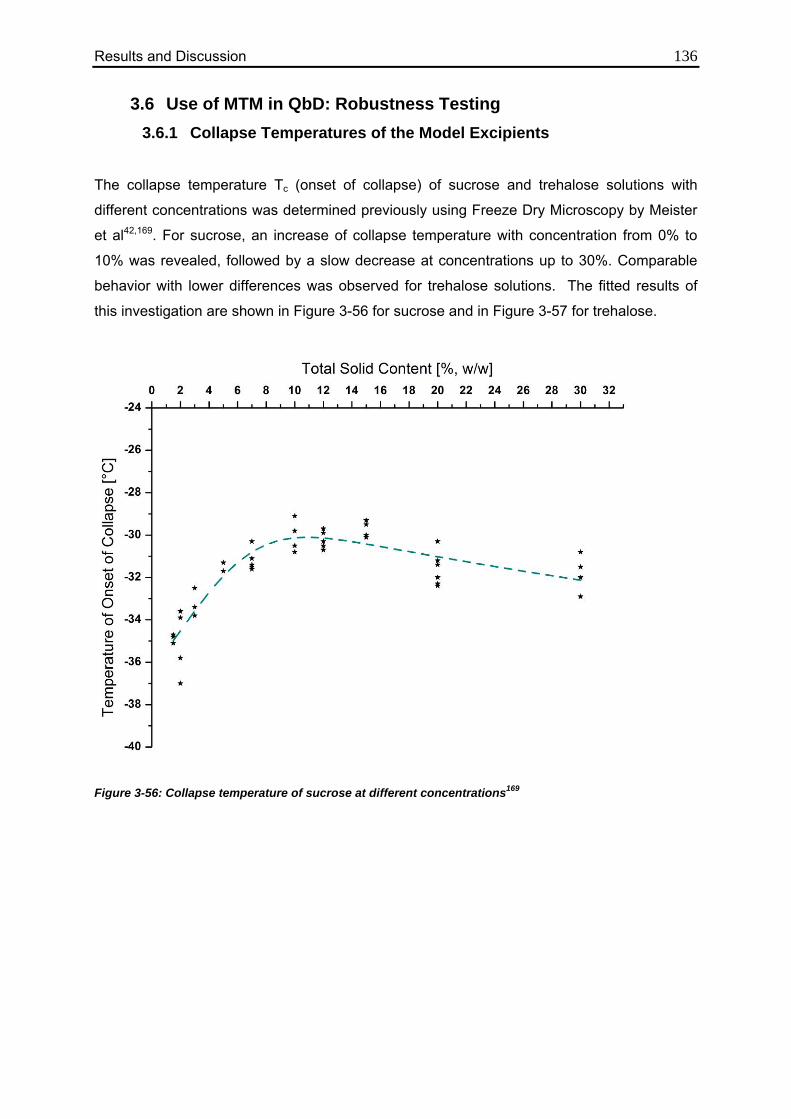
Results and Discussion 136
3.6 Use of MTM in QbD: Robustness Testing 3.6.1 Collapse Temperatures of the Model Excipients
The collapse temperature Tc (onset of collapse) of sucrose and trehalose solutions with
different concentrations was determined previously using Freeze Dry Microscopy by Meister
et al42,169. For sucrose, an increase of collapse temperature with concentration from 0% to
10% was revealed, followed by a slow decrease at concentrations up to 30%. Comparable
behavior with lower differences was observed for trehalose solutions. The fitted results of
this investigation are shown in Figure 3-56 for sucrose and in Figure 3-57 for trehalose.
Figure 3-56: Collapse temperature of sucrose at different concentrations169
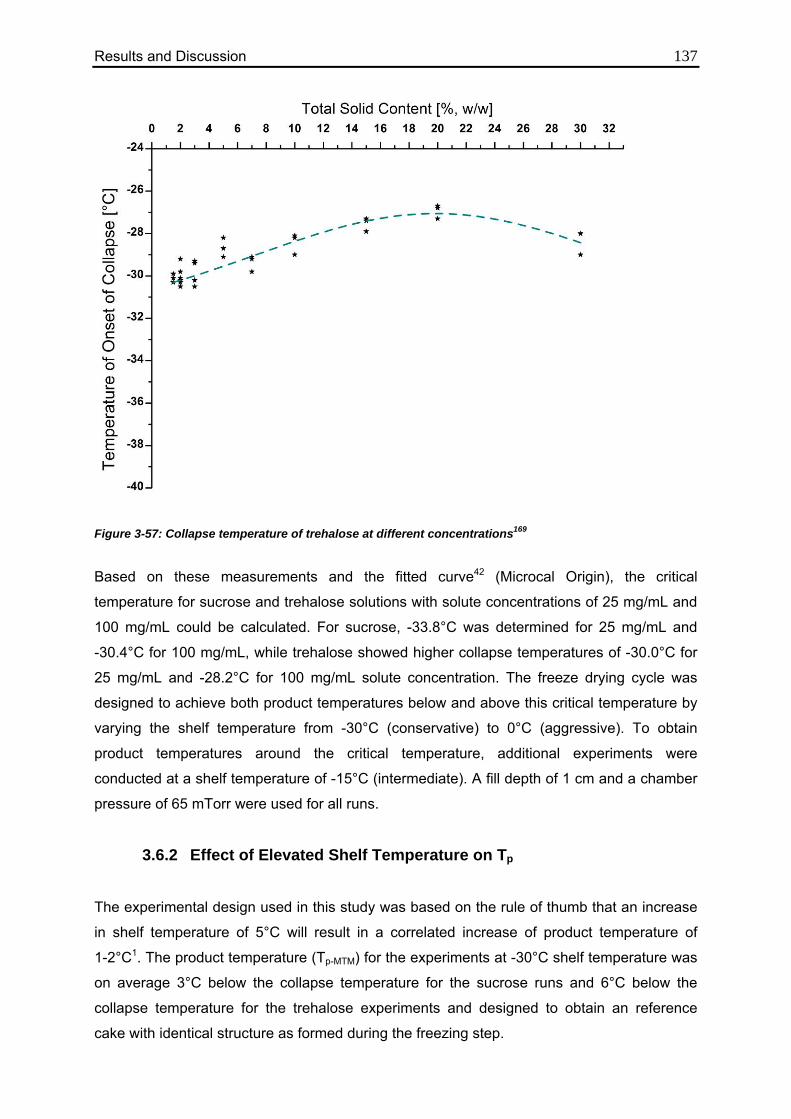
Results and Discussion 137
Figure 3-57: Collapse temperature of trehalose at different concentrations169
Based on these measurements and the fitted curve42 (Microcal Origin), the critical
temperature for sucrose and trehalose solutions with solute concentrations of 25 mg/mL and
100 mg/mL could be calculated. For sucrose, -33.8°C was determined for 25 mg/mL and
-30.4°C for 100 mg/mL, while trehalose showed higher collapse temperatures of -30.0°C for
25 mg/mL and -28.2°C for 100 mg/mL solute concentration. The freeze drying cycle was
designed to achieve both product temperatures below and above this critical temperature by
varying the shelf temperature from -30°C (conservative) to 0°C (aggressive). To obtain
product temperatures around the critical temperature, additional experiments were
conducted at a shelf temperature of -15°C (intermediate). A fill depth of 1 cm and a chamber
pressure of 65 mTorr were used for all runs.
3.6.2 Effect of Elevated Shelf Temperature on Tp
The experimental design used in this study was based on the rule of thumb that an increase
in shelf temperature of 5°C will result in a correlated increase of product temperature of
1-2°C1. The product temperature (Tp-MTM) for the experiments at -30°C shelf temperature was
on average 3°C below the collapse temperature for the sucrose runs and 6°C below the
collapse temperature for the trehalose experiments and designed to obtain an reference
cake with identical structure as formed during the freezing step.
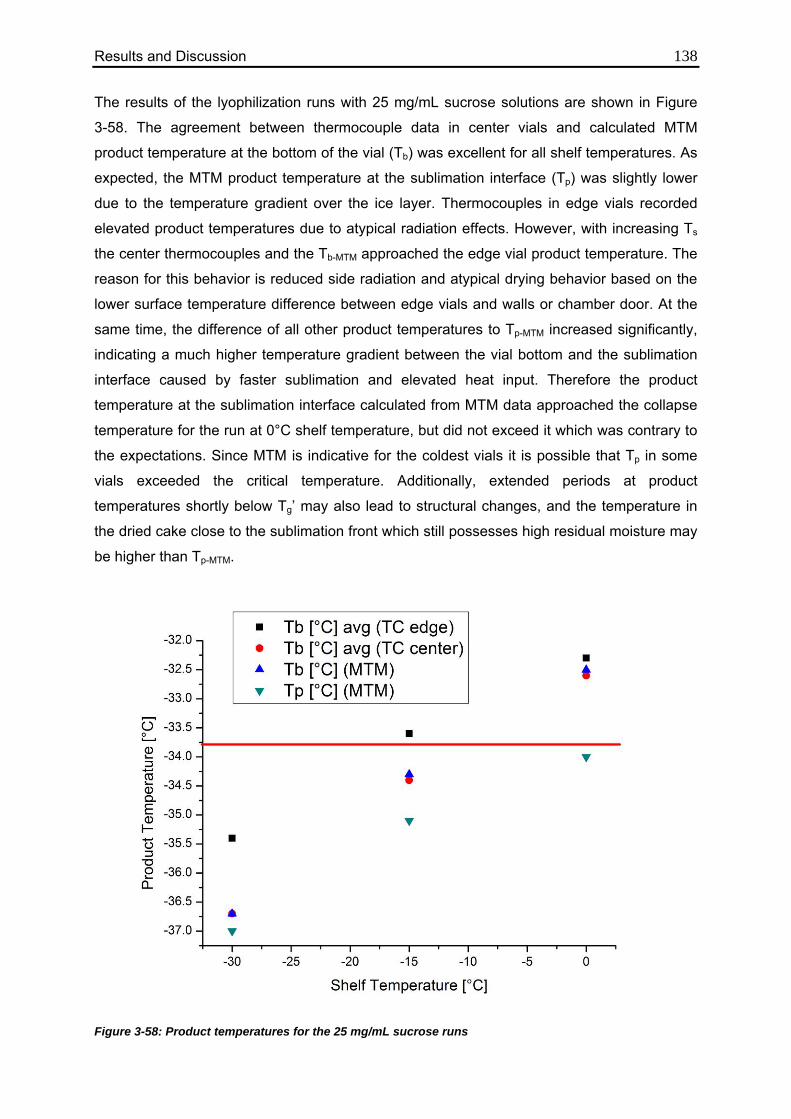
Results and Discussion 138 The results of the lyophilization runs with 25 mg/mL sucrose solutions are shown in Figure
3-58. The agreement between thermocouple data in center vials and calculated MTM
product temperature at the bottom of the vial (Tb) was excellent for all shelf temperatures. As
expected, the MTM product temperature at the sublimation interface (Tp) was slightly lower
due to the temperature gradient over the ice layer. Thermocouples in edge vials recorded
elevated product temperatures due to atypical radiation effects. However, with increasing Ts
the center thermocouples and the Tb-MTM approached the edge vial product temperature. The
reason for this behavior is reduced side radiation and atypical drying behavior based on the
lower surface temperature difference between edge vials and walls or chamber door. At the
same time, the difference of all other product temperatures to Tp-MTM increased significantly,
indicating a much higher temperature gradient between the vial bottom and the sublimation
interface caused by faster sublimation and elevated heat input. Therefore the product
temperature at the sublimation interface calculated from MTM data approached the collapse
temperature for the run at 0°C shelf temperature, but did not exceed it which was contrary to
the expectations. Since MTM is indicative for the coldest vials it is possible that Tp in some
vials exceeded the critical temperature. Additionally, extended periods at product
temperatures shortly below Tg’ may also lead to structural changes, and the temperature in
the dried cake close to the sublimation front which still possesses high residual moisture may
be higher than Tp-MTM.
Figure 3-58: Product temperatures for the 25 mg/mL sucrose runs
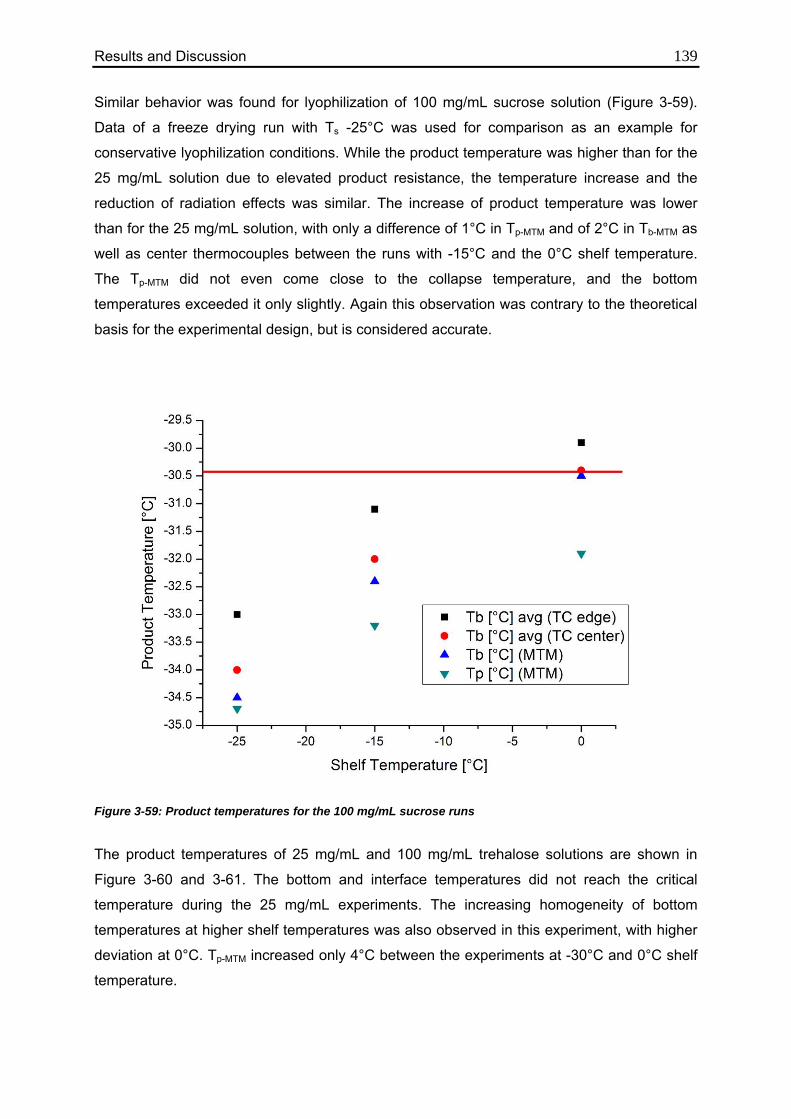
Results and Discussion 139 Similar behavior was found for lyophilization of 100 mg/mL sucrose solution (Figure 3-59).
Data of a freeze drying run with Ts -25°C was used for comparison as an example for
conservative lyophilization conditions. While the product temperature was higher than for the
25 mg/mL solution due to elevated product resistance, the temperature increase and the
reduction of radiation effects was similar. The increase of product temperature was lower
than for the 25 mg/mL solution, with only a difference of 1°C in Tp-MTM and of 2°C in Tb-MTM as
well as center thermocouples between the runs with -15°C and the 0°C shelf temperature.
The Tp-MTM did not even come close to the collapse temperature, and the bottom
temperatures exceeded it only slightly. Again this observation was contrary to the theoretical
basis for the experimental design, but is considered accurate.
Figure 3-59: Product temperatures for the 100 mg/mL sucrose runs
The product temperatures of 25 mg/mL and 100 mg/mL trehalose solutions are shown in
Figure 3-60 and 3-61. The bottom and interface temperatures did not reach the critical
temperature during the 25 mg/mL experiments. The increasing homogeneity of bottom
temperatures at higher shelf temperatures was also observed in this experiment, with higher
deviation at 0°C. Tp-MTM increased only 4°C between the experiments at -30°C and 0°C shelf
temperature.
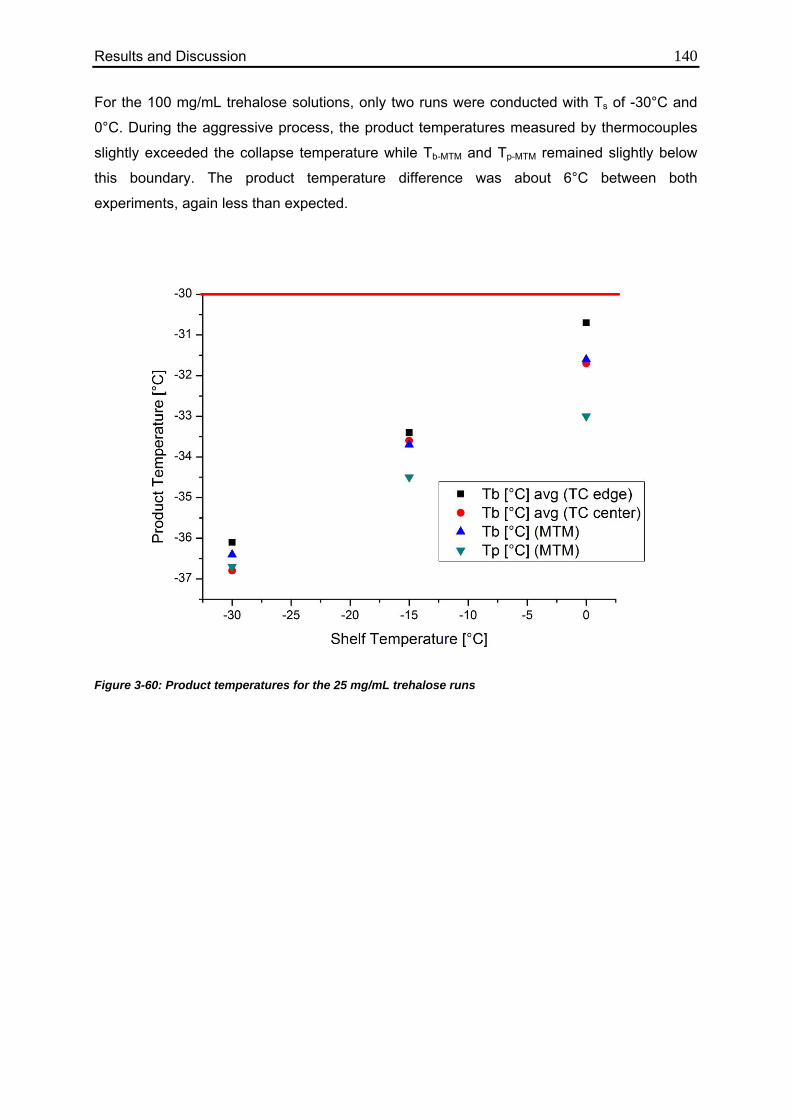
Results and Discussion 140 For the 100 mg/mL trehalose solutions, only two runs were conducted with Ts of -30°C and
0°C. During the aggressive process, the product temperatures measured by thermocouples
slightly exceeded the collapse temperature while Tb-MTM and Tp-MTM remained slightly below
this boundary. The product temperature difference was about 6°C between both
experiments, again less than expected.
Figure 3-60: Product temperatures for the 25 mg/mL trehalose runs
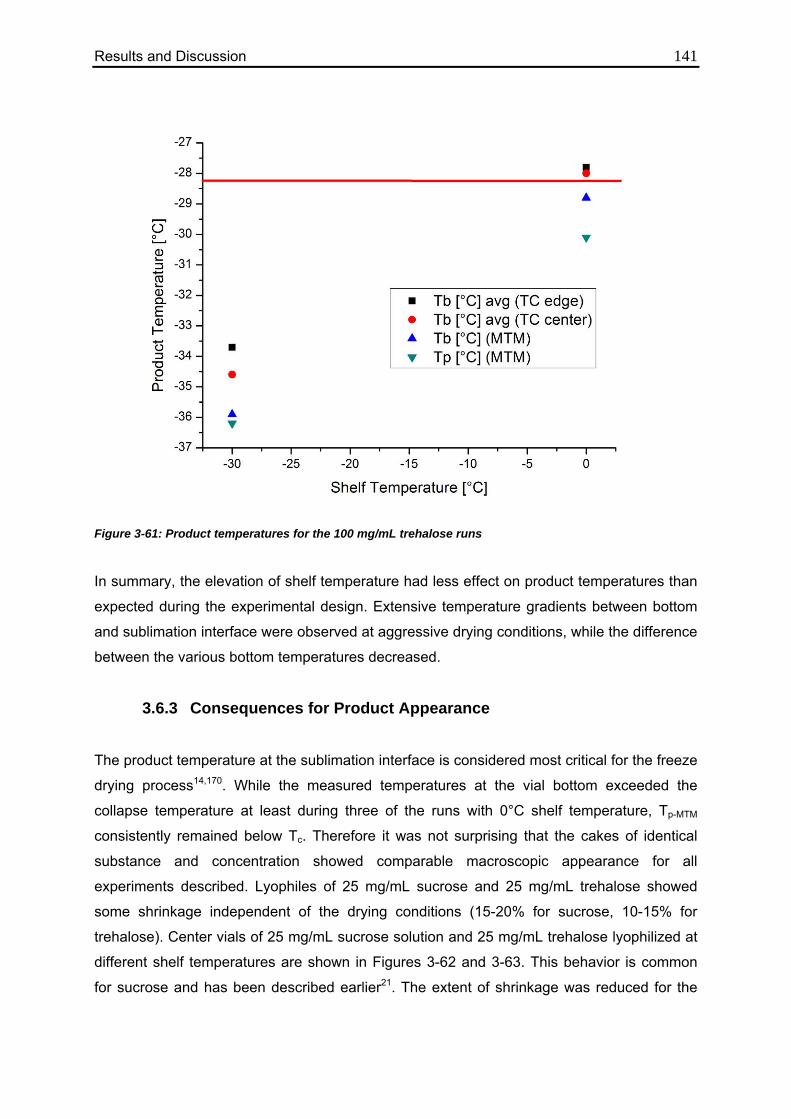
Results and Discussion 141
Figure 3-61: Product temperatures for the 100 mg/mL trehalose runs
In summary, the elevation of shelf temperature had less effect on product temperatures than
expected during the experimental design. Extensive temperature gradients between bottom
and sublimation interface were observed at aggressive drying conditions, while the difference
between the various bottom temperatures decreased.
3.6.3 Consequences for Product Appearance
The product temperature at the sublimation interface is considered most critical for the freeze
drying process14,170. While the measured temperatures at the vial bottom exceeded the
collapse temperature at least during three of the runs with 0°C shelf temperature, Tp-MTM
consistently remained below Tc. Therefore it was not surprising that the cakes of identical
substance and concentration showed comparable macroscopic appearance for all
experiments described. Lyophiles of 25 mg/mL sucrose and 25 mg/mL trehalose showed
some shrinkage independent of the drying conditions (15-20% for sucrose, 10-15% for
trehalose). Center vials of 25 mg/mL sucrose solution and 25 mg/mL trehalose lyophilized at
different shelf temperatures are shown in Figures 3-62 and 3-63. This behavior is common
for sucrose and has been described earlier21. The extent of shrinkage was reduced for the
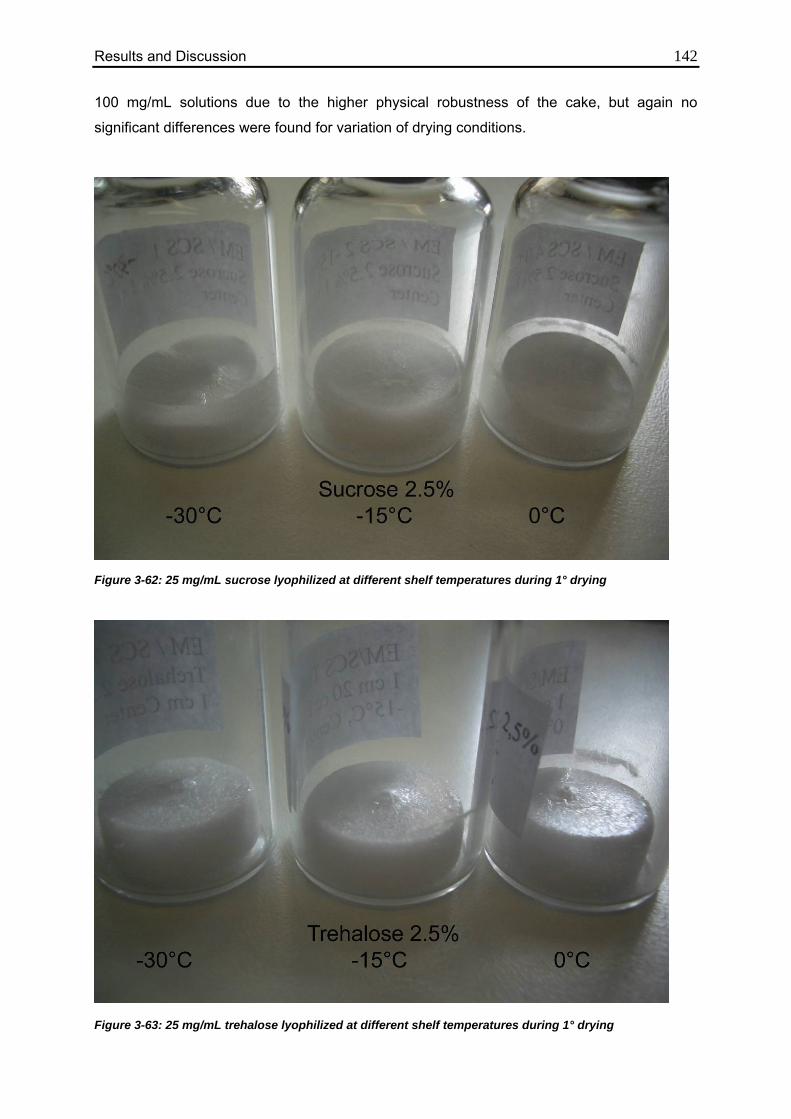
Results and Discussion 142 100 mg/mL solutions due to the higher physical robustness of the cake, but again no
significant differences were found for variation of drying conditions.
Figure 3-62: 25 mg/mL sucrose lyophilized at different shelf temperatures during 1° drying
Figure 3-63: 25 mg/mL trehalose lyophilized at different shelf temperatures during 1° drying
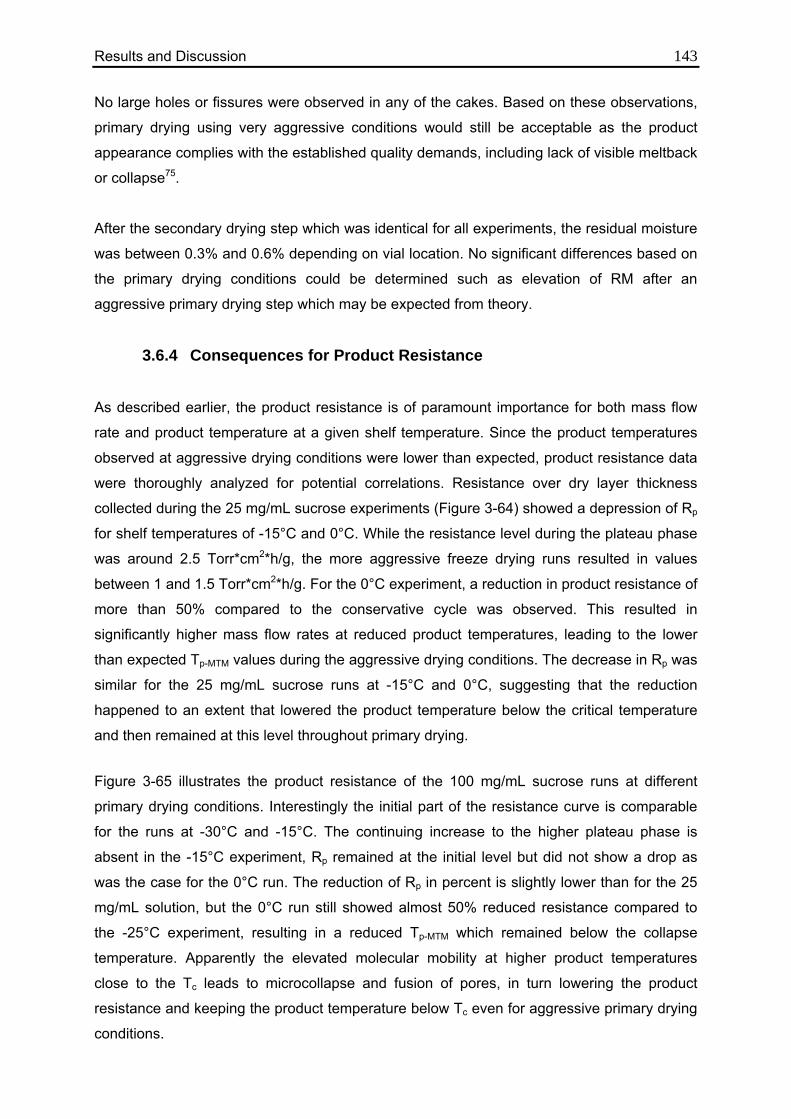
Results and Discussion 143 No large holes or fissures were observed in any of the cakes. Based on these observations,
primary drying using very aggressive conditions would still be acceptable as the product
appearance complies with the established quality demands, including lack of visible meltback
or collapse75.
After the secondary drying step which was identical for all experiments, the residual moisture
was between 0.3% and 0.6% depending on vial location. No significant differences based on
the primary drying conditions could be determined such as elevation of RM after an
aggressive primary drying step which may be expected from theory.
3.6.4 Consequences for Product Resistance
As described earlier, the product resistance is of paramount importance for both mass flow
rate and product temperature at a given shelf temperature. Since the product temperatures
observed at aggressive drying conditions were lower than expected, product resistance data
were thoroughly analyzed for potential correlations. Resistance over dry layer thickness
collected during the 25 mg/mL sucrose experiments (Figure 3-64) showed a depression of Rp
for shelf temperatures of -15°C and 0°C. While the resistance level during the plateau phase
was around 2.5 Torr*cm2*h/g, the more aggressive freeze drying runs resulted in values
between 1 and 1.5 Torr*cm2*h/g. For the 0°C experiment, a reduction in product resistance of
more than 50% compared to the conservative cycle was observed. This resulted in
significantly higher mass flow rates at reduced product temperatures, leading to the lower
than expected Tp-MTM values during the aggressive drying conditions. The decrease in Rp was
similar for the 25 mg/mL sucrose runs at -15°C and 0°C, suggesting that the reduction
happened to an extent that lowered the product temperature below the critical temperature
and then remained at this level throughout primary drying.
Figure 3-65 illustrates the product resistance of the 100 mg/mL sucrose runs at different
primary drying conditions. Interestingly the initial part of the resistance curve is comparable
for the runs at -30°C and -15°C. The continuing increase to the higher plateau phase is
absent in the -15°C experiment, Rp remained at the initial level but did not show a drop as
was the case for the 0°C run. The reduction of Rp in percent is slightly lower than for the 25
mg/mL solution, but the 0°C run still showed almost 50% reduced resistance compared to
the -25°C experiment, resulting in a reduced Tp-MTM which remained below the collapse
temperature. Apparently the elevated molecular mobility at higher product temperatures
close to the Tc leads to microcollapse and fusion of pores, in turn lowering the product
resistance and keeping the product temperature below Tc even for aggressive primary drying
conditions.
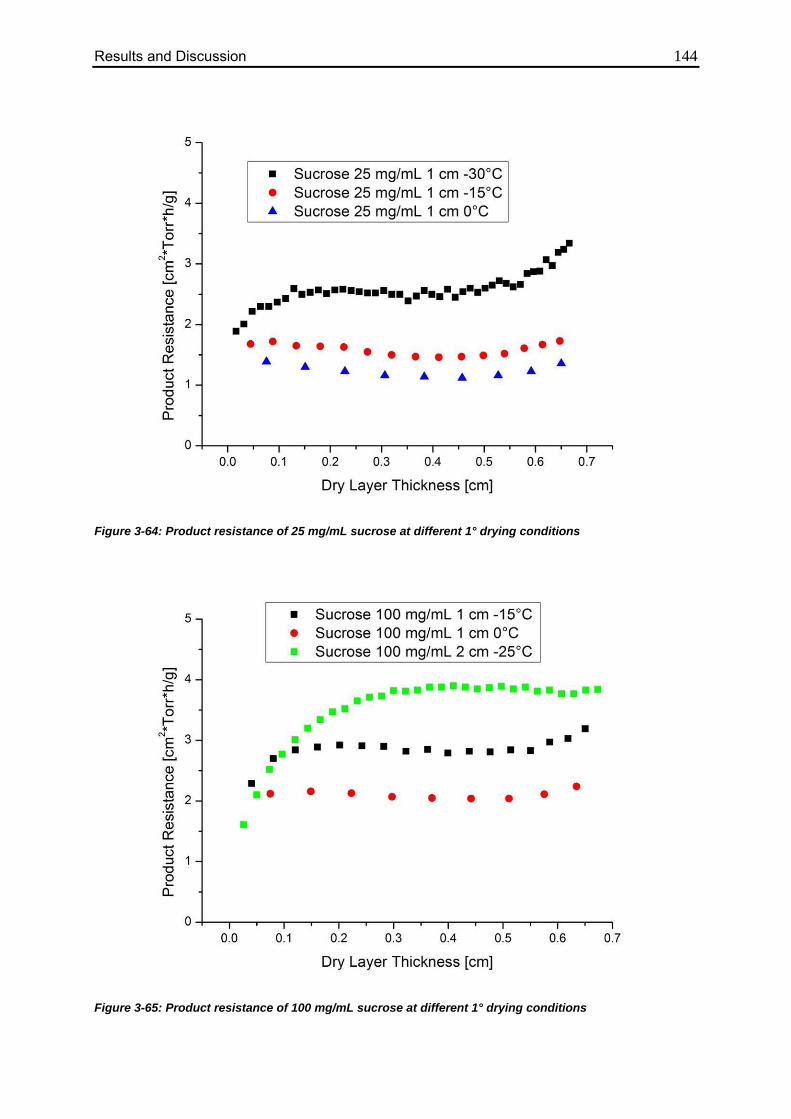
Results and Discussion 144
Figure 3-64: Product resistance of 25 mg/mL sucrose at different 1° drying conditions
Figure 3-65: Product resistance of 100 mg/mL sucrose at different 1° drying conditions
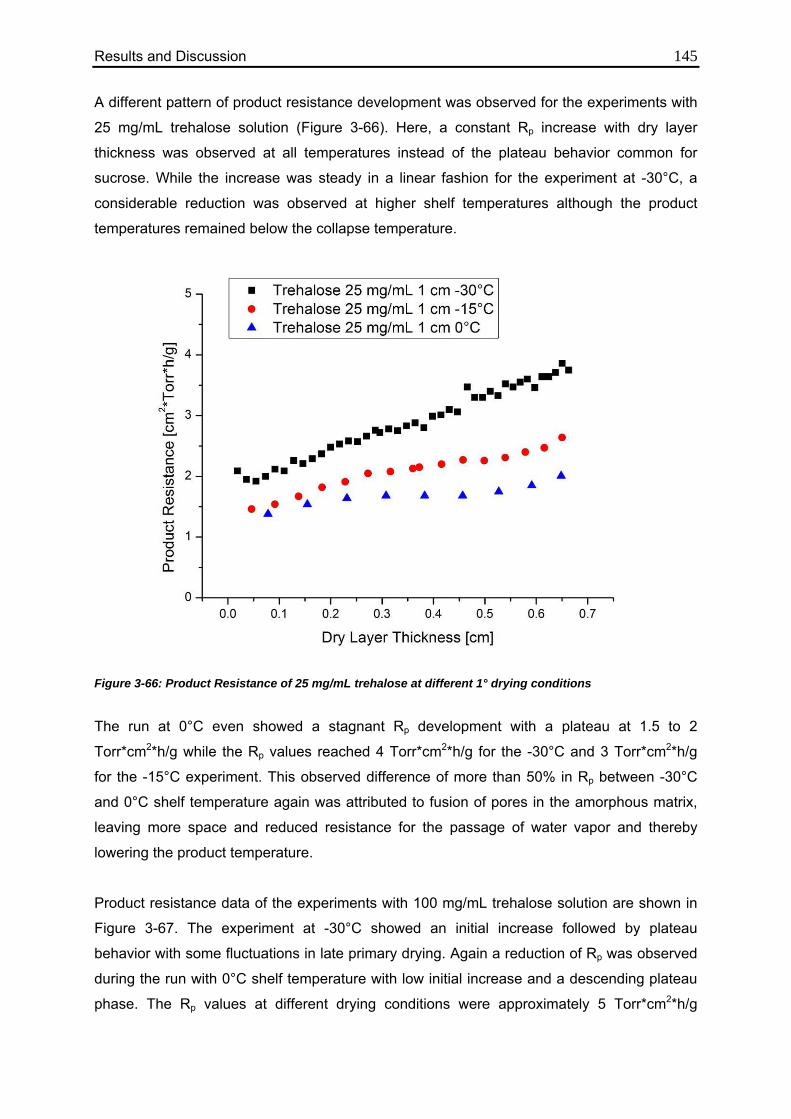
Results and Discussion 145 A different pattern of product resistance development was observed for the experiments with
25 mg/mL trehalose solution (Figure 3-66). Here, a constant Rp increase with dry layer
thickness was observed at all temperatures instead of the plateau behavior common for
sucrose. While the increase was steady in a linear fashion for the experiment at -30°C, a
considerable reduction was observed at higher shelf temperatures although the product
temperatures remained below the collapse temperature.
Figure 3-66: Product Resistance of 25 mg/mL trehalose at different 1° drying conditions
The run at 0°C even showed a stagnant Rp development with a plateau at 1.5 to 2
Torr*cm2*h/g while the Rp values reached 4 Torr*cm2*h/g for the -30°C and 3 Torr*cm2*h/g
for the -15°C experiment. This observed difference of more than 50% in Rp between -30°C
and 0°C shelf temperature again was attributed to fusion of pores in the amorphous matrix,
leaving more space and reduced resistance for the passage of water vapor and thereby
lowering the product temperature.
Product resistance data of the experiments with 100 mg/mL trehalose solution are shown in
Figure 3-67. The experiment at -30°C showed an initial increase followed by plateau
behavior with some fluctuations in late primary drying. Again a reduction of Rp was observed
during the run with 0°C shelf temperature with low initial increase and a descending plateau
phase. The Rp values at different drying conditions were approximately 5 Torr*cm2*h/g
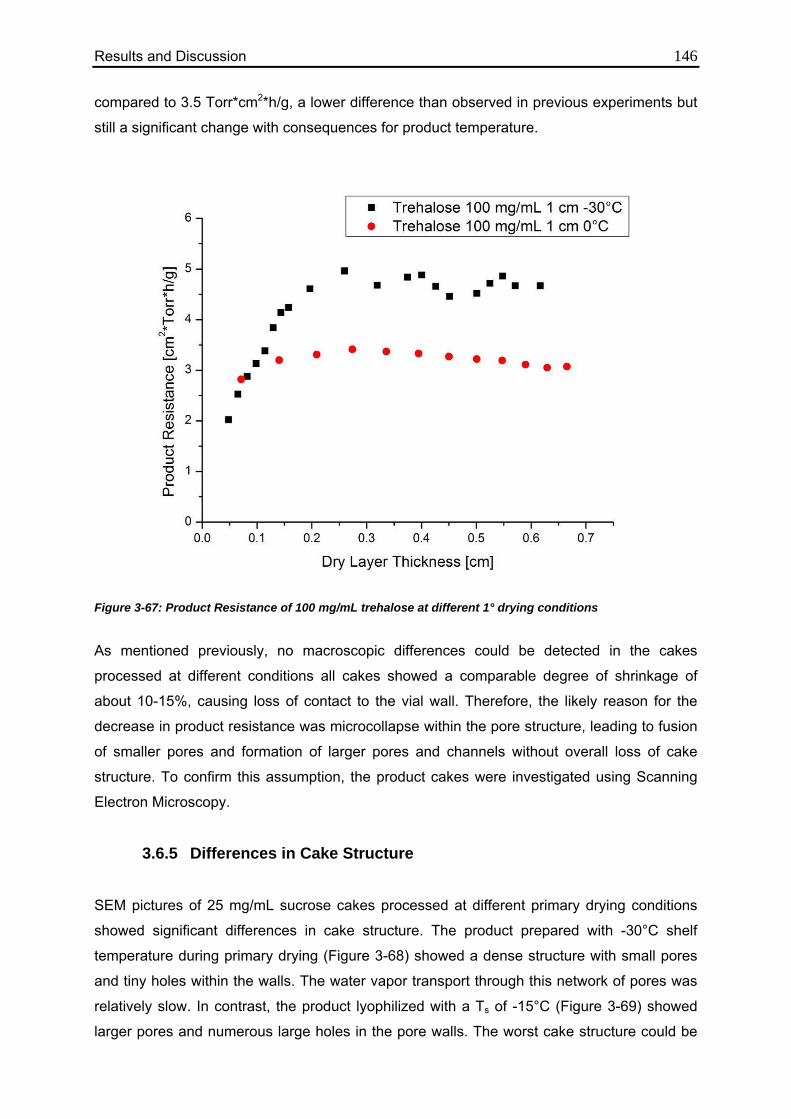
Results and Discussion 146 compared to 3.5 Torr*cm2*h/g, a lower difference than observed in previous experiments but
still a significant change with consequences for product temperature.
Figure 3-67: Product Resistance of 100 mg/mL trehalose at different 1° drying conditions
As mentioned previously, no macroscopic differences could be detected in the cakes
processed at different conditions all cakes showed a comparable degree of shrinkage of
about 10-15%, causing loss of contact to the vial wall. Therefore, the likely reason for the
decrease in product resistance was microcollapse within the pore structure, leading to fusion
of smaller pores and formation of larger pores and channels without overall loss of cake
structure. To confirm this assumption, the product cakes were investigated using Scanning
Electron Microscopy.
3.6.5 Differences in Cake Structure
SEM pictures of 25 mg/mL sucrose cakes processed at different primary drying conditions
showed significant differences in cake structure. The product prepared with -30°C shelf
temperature during primary drying (Figure 3-68) showed a dense structure with small pores
and tiny holes within the walls. The water vapor transport through this network of pores was
relatively slow. In contrast, the product lyophilized with a Ts of -15°C (Figure 3-69) showed
larger pores and numerous large holes in the pore walls. The worst cake structure could be
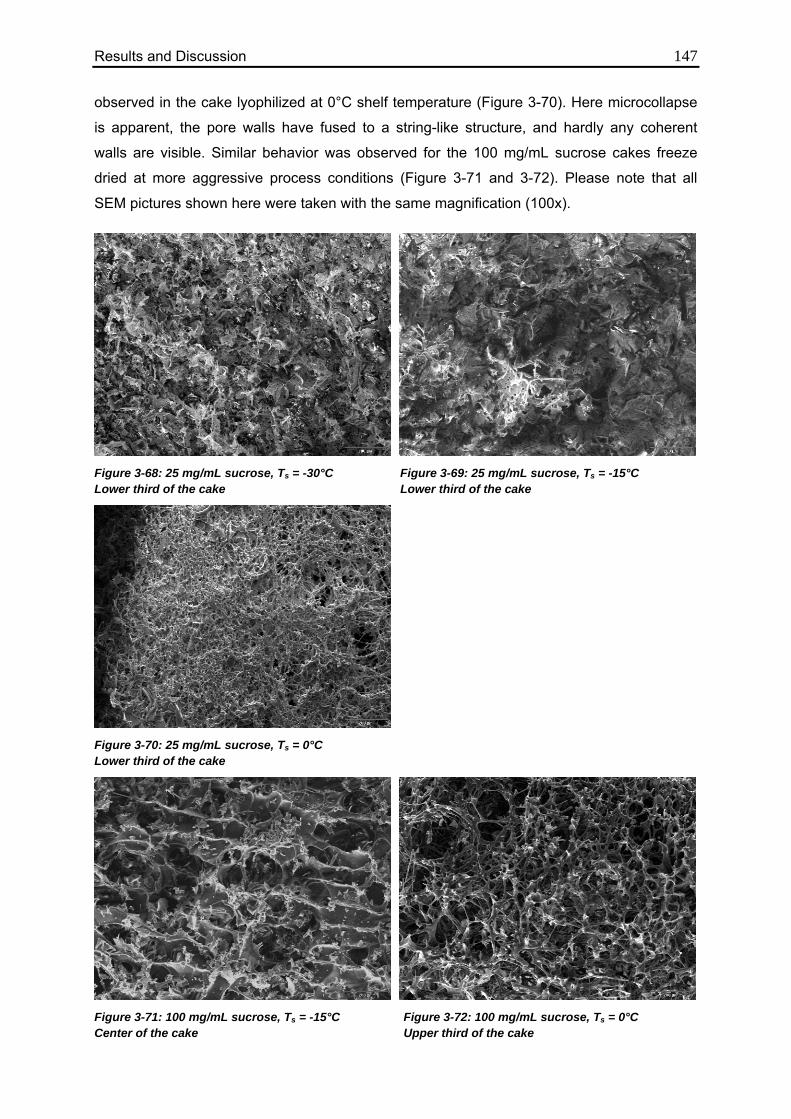
Results and Discussion 147 observed in the cake lyophilized at 0°C shelf temperature (Figure 3-70). Here microcollapse
is apparent, the pore walls have fused to a string-like structure, and hardly any coherent
walls are visible. Similar behavior was observed for the 100 mg/mL sucrose cakes freeze
dried at more aggressive process conditions (Figure 3-71 and 3-72). Please note that all
SEM pictures shown here were taken with the same magnification (100x).
Figure 3-68: 25 mg/mL sucrose, Ts = -30°C Figure 3-69: 25 mg/mL sucrose, Ts = -15°C Lower third of the cake Lower third of the cake
Figure 3-70: 25 mg/mL sucrose, Ts = 0°C Lower third of the cake
Figure 3-71: 100 mg/mL sucrose, Ts = -15°C Figure 3-72: 100 mg/mL sucrose, Ts = 0°C Center of the cake Upper third of the cake
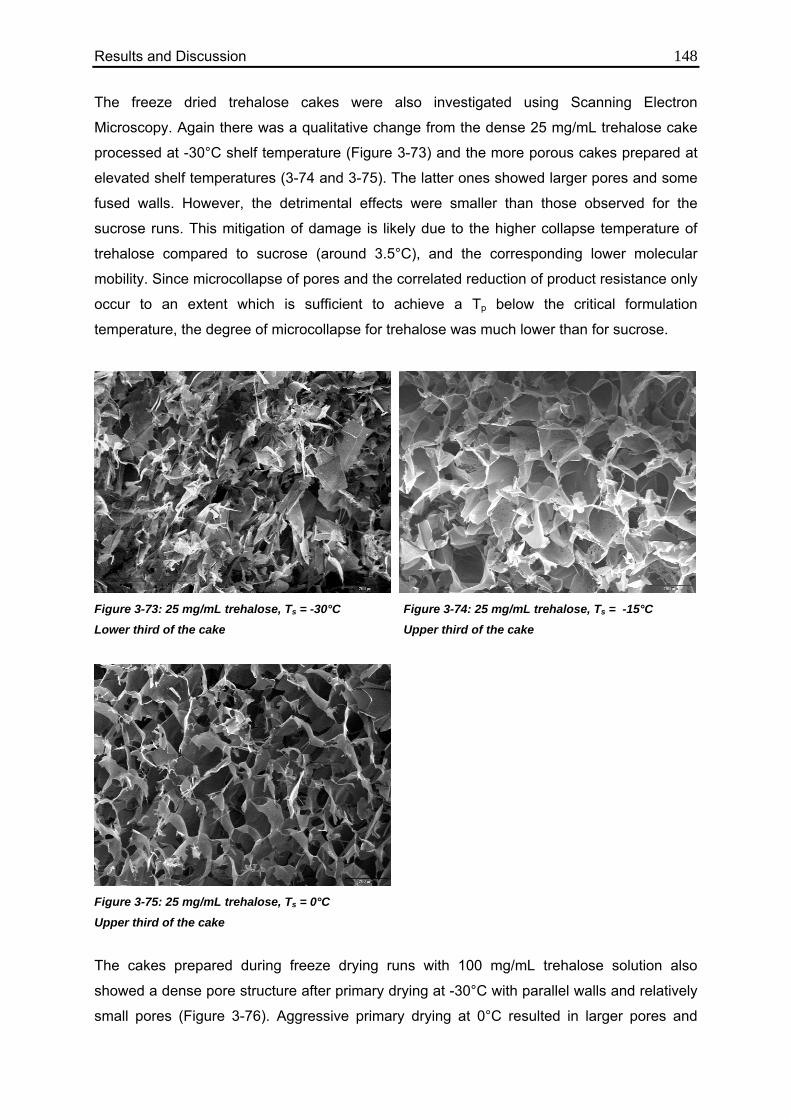
Results and Discussion 148 The freeze dried trehalose cakes were also investigated using Scanning Electron
Microscopy. Again there was a qualitative change from the dense 25 mg/mL trehalose cake
processed at -30°C shelf temperature (Figure 3-73) and the more porous cakes prepared at
elevated shelf temperatures (3-74 and 3-75). The latter ones showed larger pores and some
fused walls. However, the detrimental effects were smaller than those observed for the
sucrose runs. This mitigation of damage is likely due to the higher collapse temperature of
trehalose compared to sucrose (around 3.5°C), and the corresponding lower molecular
mobility. Since microcollapse of pores and the correlated reduction of product resistance only
occur to an extent which is sufficient to achieve a Tp below the critical formulation
temperature, the degree of microcollapse for trehalose was much lower than for sucrose.
Figure 3-73: 25 mg/mL trehalose, Ts = -30°C Figure 3-74: 25 mg/mL trehalose, Ts = -15°C
Lower third of the cake Upper third of the cake
Figure 3-75: 25 mg/mL trehalose, Ts = 0°C
Upper third of the cake
The cakes prepared during freeze drying runs with 100 mg/mL trehalose solution also
showed a dense pore structure after primary drying at -30°C with parallel walls and relatively
small pores (Figure 3-76). Aggressive primary drying at 0°C resulted in larger pores and

Results and Discussion 149 visible gaps between adjacent walls (3-77). Additionally large holes were observed in the
walls as well as some strings that resulted from microcollapse of pores.
Figure 3-76: 100 mg/mL trehalose, Ts = -30°C Figure 3-77: 100 mg/mL trehalose, Ts = 0°C
Center of the cake Center of the cake
In summary, “aggressive” lyophilization cycles with shelf temperatures up to 0°C at a
chamber pressure of 65 mTorr still yielded sucrose and trehalose cakes with acceptable
macroscopic structure. The product temperature at the sublimation interface calculated from
MTM measurements did not exceed the critical formulation temperature. However, the
elevated product temperatures resulted in microcollapse of pores and corresponding
reduction of product resistance which is the main reason the product temperature at the
sublimation front remained below the collapse temperature. This shows that it is in some
cases not sufficient to exclusively monitor product temperature, especially if an aggressive
recipe is followed. Determination of additional critical product parameters, such as product
resistance, and characterization of the lyophilized cake is required to assess potential
negative effects on the product.
Recent studies have shown that microcollapse due to aggressive primary drying may have
detrimental effects on stability of proteins even if an optically acceptable cake is
obtained34,171. The results presented here provide additional insight into the mechanisms
responsible for this instability, and show that primary drying conditions are important for the
structure of the lyophile even if the cake appearance does not visual show differences. The
changes in cake morphology and inner structure were clearly influenced by the different
drying conditions and may impact degradation reactions and storage stability of the product
(e.g. crystallization of sucrose172-174). The relationship between the critical formulation
temperature determined by FDM and freeze drying with product temperatures close to or
above Tc will be investigated in detail to further assess this topic.
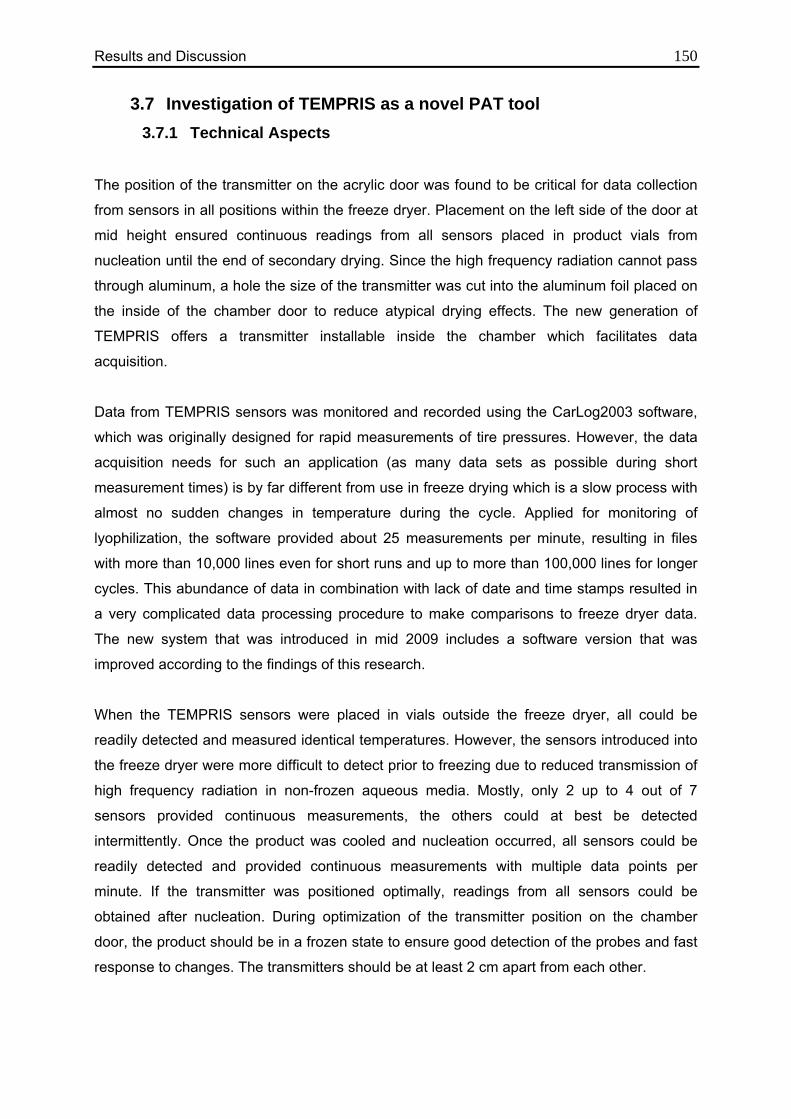
Results and Discussion 150
3.7 Investigation of TEMPRIS as a novel PAT tool 3.7.1 Technical Aspects
The position of the transmitter on the acrylic door was found to be critical for data collection
from sensors in all positions within the freeze dryer. Placement on the left side of the door at
mid height ensured continuous readings from all sensors placed in product vials from
nucleation until the end of secondary drying. Since the high frequency radiation cannot pass
through aluminum, a hole the size of the transmitter was cut into the aluminum foil placed on
the inside of the chamber door to reduce atypical drying effects. The new generation of
TEMPRIS offers a transmitter installable inside the chamber which facilitates data
acquisition.
Data from TEMPRIS sensors was monitored and recorded using the CarLog2003 software,
which was originally designed for rapid measurements of tire pressures. However, the data
acquisition needs for such an application (as many data sets as possible during short
measurement times) is by far different from use in freeze drying which is a slow process with
almost no sudden changes in temperature during the cycle. Applied for monitoring of
lyophilization, the software provided about 25 measurements per minute, resulting in files
with more than 10,000 lines even for short runs and up to more than 100,000 lines for longer
cycles. This abundance of data in combination with lack of date and time stamps resulted in
a very complicated data processing procedure to make comparisons to freeze dryer data.
The new system that was introduced in mid 2009 includes a software version that was
improved according to the findings of this research.
When the TEMPRIS sensors were placed in vials outside the freeze dryer, all could be
readily detected and measured identical temperatures. However, the sensors introduced into
the freeze dryer were more difficult to detect prior to freezing due to reduced transmission of
high frequency radiation in non-frozen aqueous media. Mostly, only 2 up to 4 out of 7
sensors provided continuous measurements, the others could at best be detected
intermittently. Once the product was cooled and nucleation occurred, all sensors could be
readily detected and provided continuous measurements with multiple data points per
minute. If the transmitter was positioned optimally, readings from all sensors could be
obtained after nucleation. During optimization of the transmitter position on the chamber
door, the product should be in a frozen state to ensure good detection of the probes and fast
response to changes. The transmitters should be at least 2 cm apart from each other.
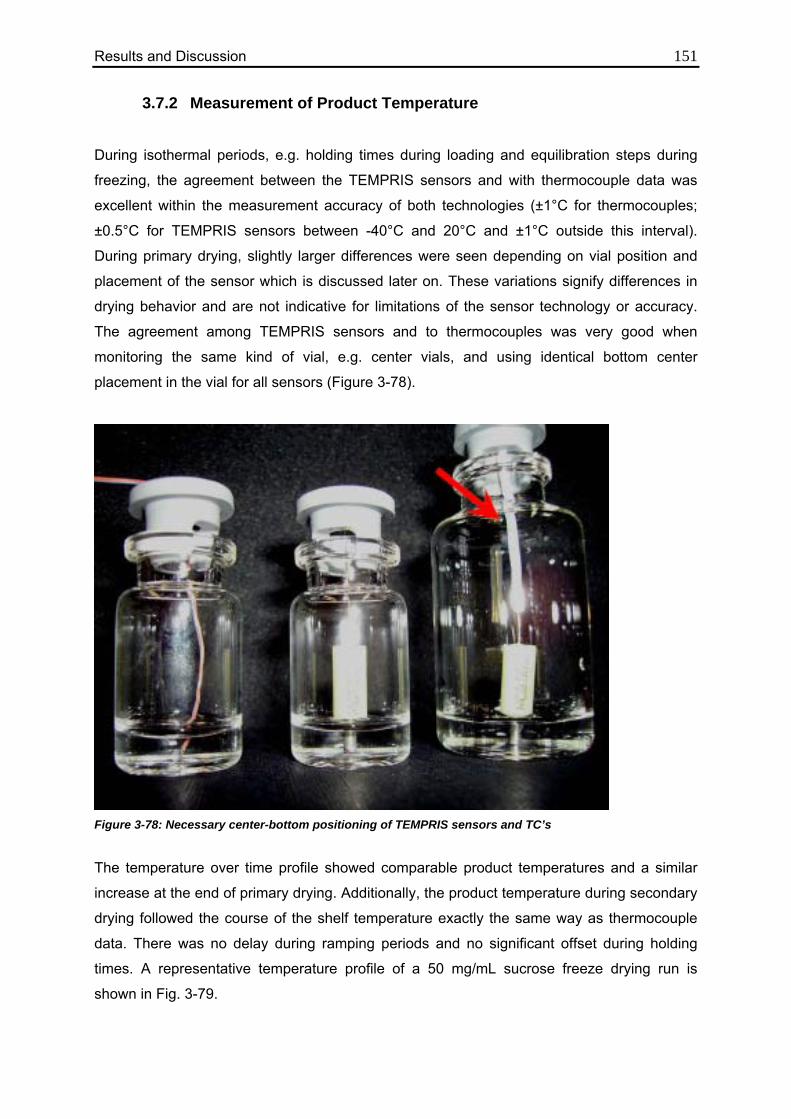
Results and Discussion 151
3.7.2 Measurement of Product Temperature
During isothermal periods, e.g. holding times during loading and equilibration steps during
freezing, the agreement between the TEMPRIS sensors and with thermocouple data was
excellent within the measurement accuracy of both technologies (±1°C for thermocouples;
±0.5°C for TEMPRIS sensors between -40°C and 20°C and ±1°C outside this interval).
During primary drying, slightly larger differences were seen depending on vial position and
placement of the sensor which is discussed later on. These variations signify differences in
drying behavior and are not indicative for limitations of the sensor technology or accuracy.
The agreement among TEMPRIS sensors and to thermocouples was very good when
monitoring the same kind of vial, e.g. center vials, and using identical bottom center
placement in the vial for all sensors (Figure 3-78).
Figure 3-78: Necessary center-bottom positioning of TEMPRIS sensors and TC’s
The temperature over time profile showed comparable product temperatures and a similar
increase at the end of primary drying. Additionally, the product temperature during secondary
drying followed the course of the shelf temperature exactly the same way as thermocouple
data. There was no delay during ramping periods and no significant offset during holding
times. A representative temperature profile of a 50 mg/mL sucrose freeze drying run is
shown in Fig. 3-79.
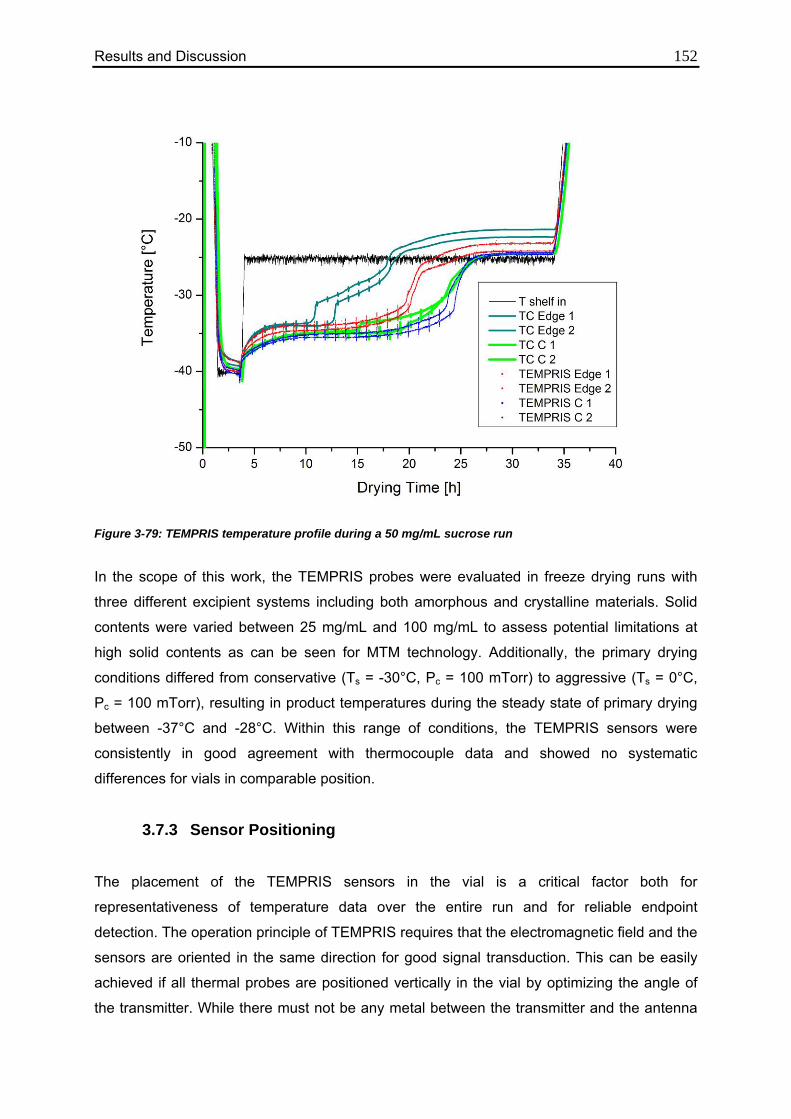
Results and Discussion 152
Figure 3-79: TEMPRIS temperature profile during a 50 mg/mL sucrose run
In the scope of this work, the TEMPRIS probes were evaluated in freeze drying runs with
three different excipient systems including both amorphous and crystalline materials. Solid
contents were varied between 25 mg/mL and 100 mg/mL to assess potential limitations at
high solid contents as can be seen for MTM technology. Additionally, the primary drying
conditions differed from conservative (Ts = -30°C, Pc = 100 mTorr) to aggressive (Ts = 0°C,
Pc = 100 mTorr), resulting in product temperatures during the steady state of primary drying
between -37°C and -28°C. Within this range of conditions, the TEMPRIS sensors were
consistently in good agreement with thermocouple data and showed no systematic
differences for vials in comparable position.
3.7.3 Sensor Positioning
The placement of the TEMPRIS sensors in the vial is a critical factor both for
representativeness of temperature data over the entire run and for reliable endpoint
detection. The operation principle of TEMPRIS requires that the electromagnetic field and the
sensors are oriented in the same direction for good signal transduction. This can be easily
achieved if all thermal probes are positioned vertically in the vial by optimizing the angle of
the transmitter. While there must not be any metal between the transmitter and the antenna
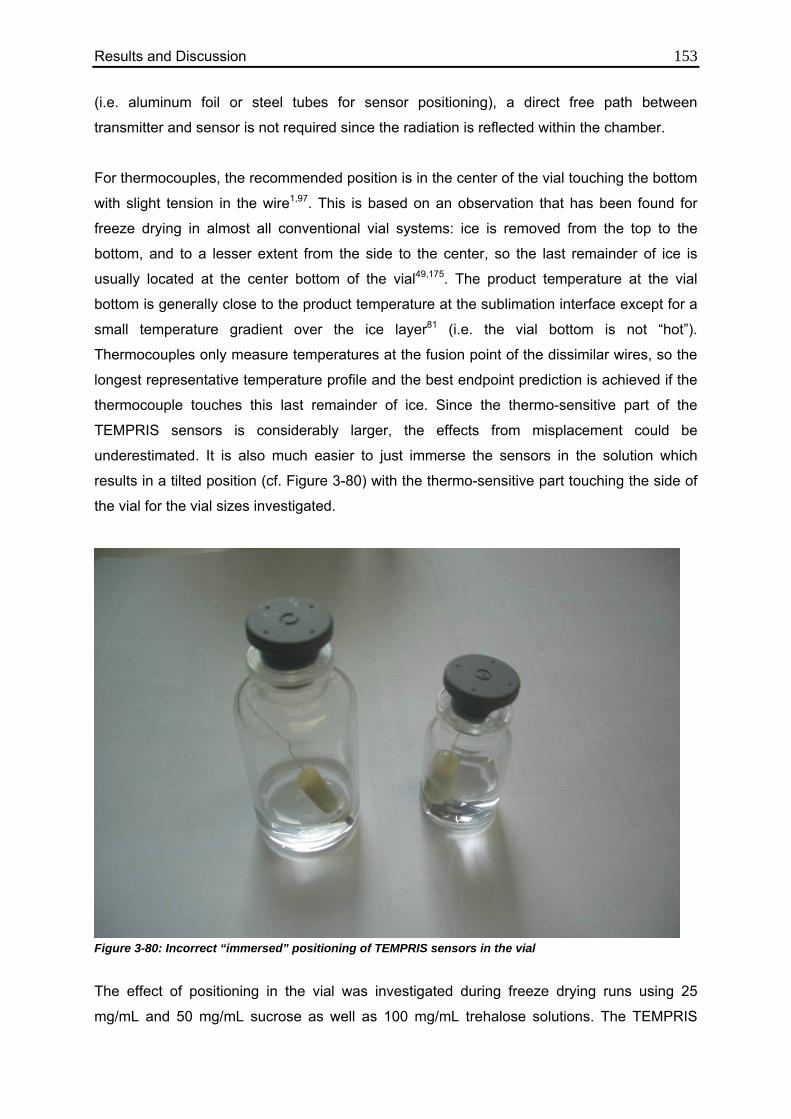
Results and Discussion 153 (i.e. aluminum foil or steel tubes for sensor positioning), a direct free path between
transmitter and sensor is not required since the radiation is reflected within the chamber.
For thermocouples, the recommended position is in the center of the vial touching the bottom
with slight tension in the wire1,97. This is based on an observation that has been found for
freeze drying in almost all conventional vial systems: ice is removed from the top to the
bottom, and to a lesser extent from the side to the center, so the last remainder of ice is
usually located at the center bottom of the vial49,175. The product temperature at the vial
bottom is generally close to the product temperature at the sublimation interface except for a
small temperature gradient over the ice layer81 (i.e. the vial bottom is not “hot”).
Thermocouples only measure temperatures at the fusion point of the dissimilar wires, so the
longest representative temperature profile and the best endpoint prediction is achieved if the
thermocouple touches this last remainder of ice. Since the thermo-sensitive part of the
TEMPRIS sensors is considerably larger, the effects from misplacement could be
underestimated. It is also much easier to just immerse the sensors in the solution which
results in a tilted position (cf. Figure 3-80) with the thermo-sensitive part touching the side of
the vial for the vial sizes investigated.
Figure 3-80: Incorrect “immersed” positioning of TEMPRIS sensors in the vial
The effect of positioning in the vial was investigated during freeze drying runs using 25
mg/mL and 50 mg/mL sucrose as well as 100 mg/mL trehalose solutions. The TEMPRIS
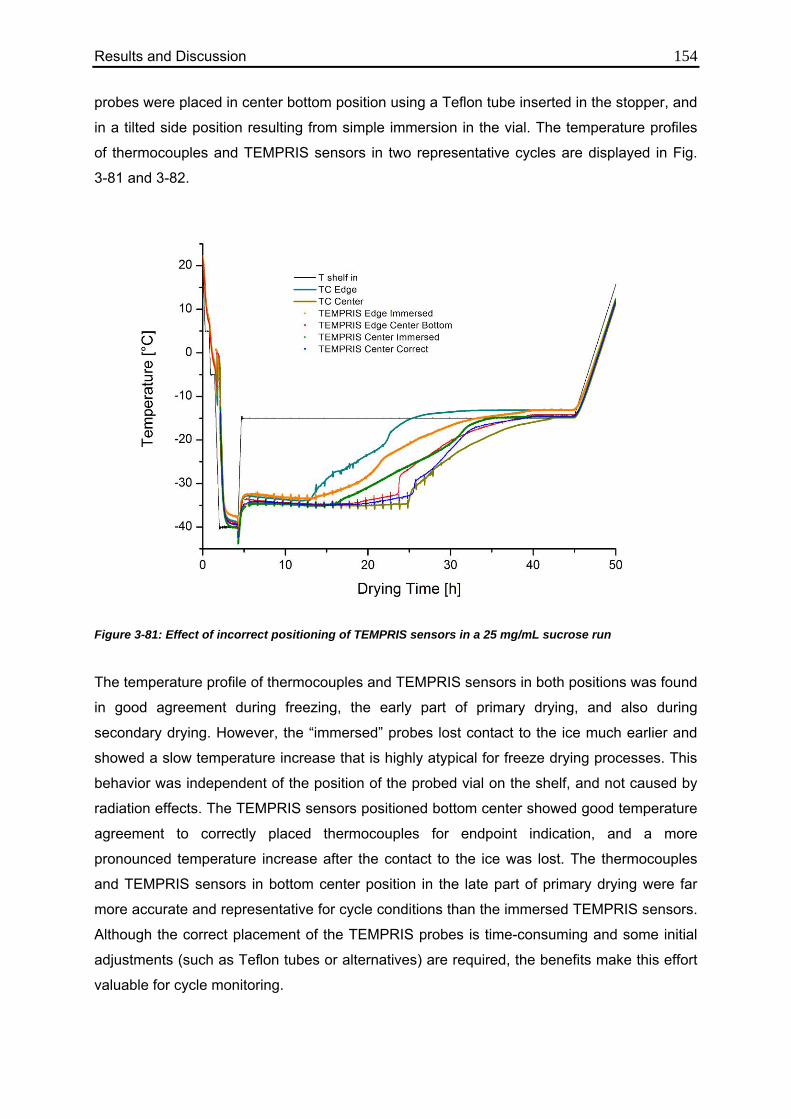
Results and Discussion 154 probes were placed in center bottom position using a Teflon tube inserted in the stopper, and
in a tilted side position resulting from simple immersion in the vial. The temperature profiles
of thermocouples and TEMPRIS sensors in two representative cycles are displayed in Fig.
3-81 and 3-82.
Figure 3-81: Effect of incorrect positioning of TEMPRIS sensors in a 25 mg/mL sucrose run
The temperature profile of thermocouples and TEMPRIS sensors in both positions was found
in good agreement during freezing, the early part of primary drying, and also during
secondary drying. However, the “immersed” probes lost contact to the ice much earlier and
showed a slow temperature increase that is highly atypical for freeze drying processes. This
behavior was independent of the position of the probed vial on the shelf, and not caused by
radiation effects. The TEMPRIS sensors positioned bottom center showed good temperature
agreement to correctly placed thermocouples for endpoint indication, and a more
pronounced temperature increase after the contact to the ice was lost. The thermocouples
and TEMPRIS sensors in bottom center position in the late part of primary drying were far
more accurate and representative for cycle conditions than the immersed TEMPRIS sensors.
Although the correct placement of the TEMPRIS probes is time-consuming and some initial
adjustments (such as Teflon tubes or alternatives) are required, the benefits make this effort
valuable for cycle monitoring.
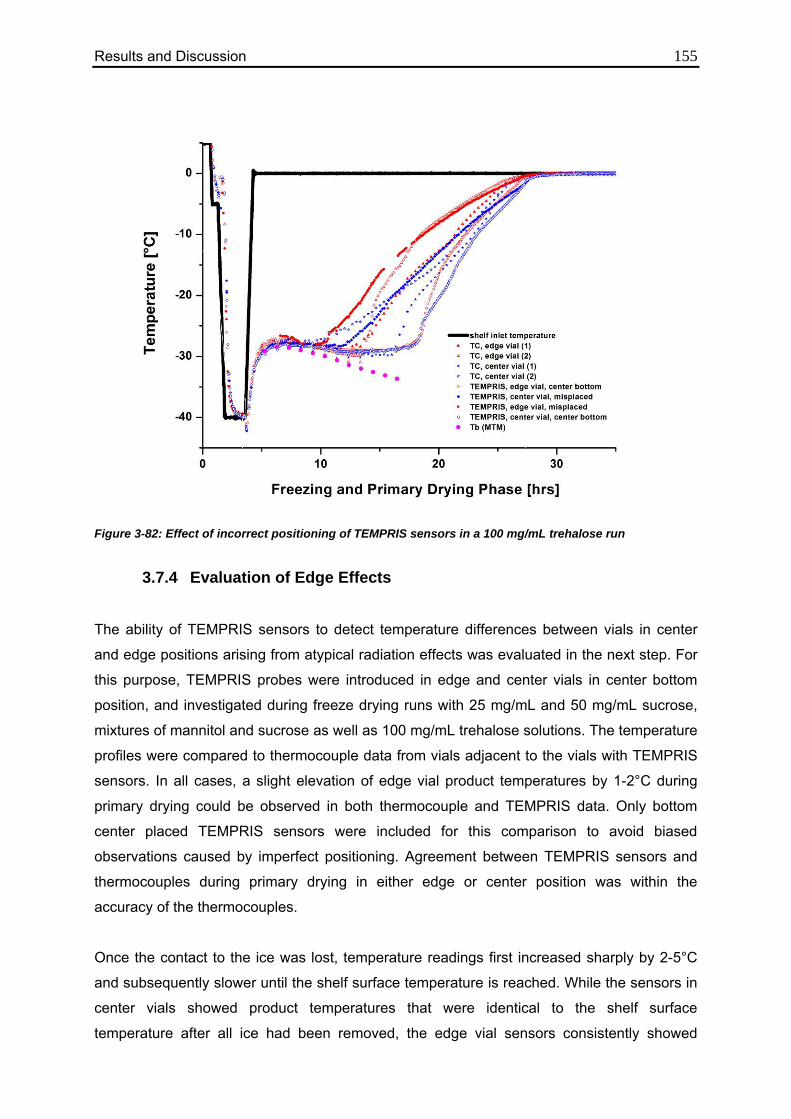
Results and Discussion 155
Figure 3-82: Effect of incorrect positioning of TEMPRIS sensors in a 100 mg/mL trehalose run
3.7.4 Evaluation of Edge Effects
The ability of TEMPRIS sensors to detect temperature differences between vials in center
and edge positions arising from atypical radiation effects was evaluated in the next step. For
this purpose, TEMPRIS probes were introduced in edge and center vials in center bottom
position, and investigated during freeze drying runs with 25 mg/mL and 50 mg/mL sucrose,
mixtures of mannitol and sucrose as well as 100 mg/mL trehalose solutions. The temperature
profiles were compared to thermocouple data from vials adjacent to the vials with TEMPRIS
sensors. In all cases, a slight elevation of edge vial product temperatures by 1-2°C during
primary drying could be observed in both thermocouple and TEMPRIS data. Only bottom
center placed TEMPRIS sensors were included for this comparison to avoid biased
observations caused by imperfect positioning. Agreement between TEMPRIS sensors and
thermocouples during primary drying in either edge or center position was within the
accuracy of the thermocouples.
Once the contact to the ice was lost, temperature readings first increased sharply by 2-5°C
and subsequently slower until the shelf surface temperature is reached. While the sensors in
center vials showed product temperatures that were identical to the shelf surface
temperature after all ice had been removed, the edge vial sensors consistently showed
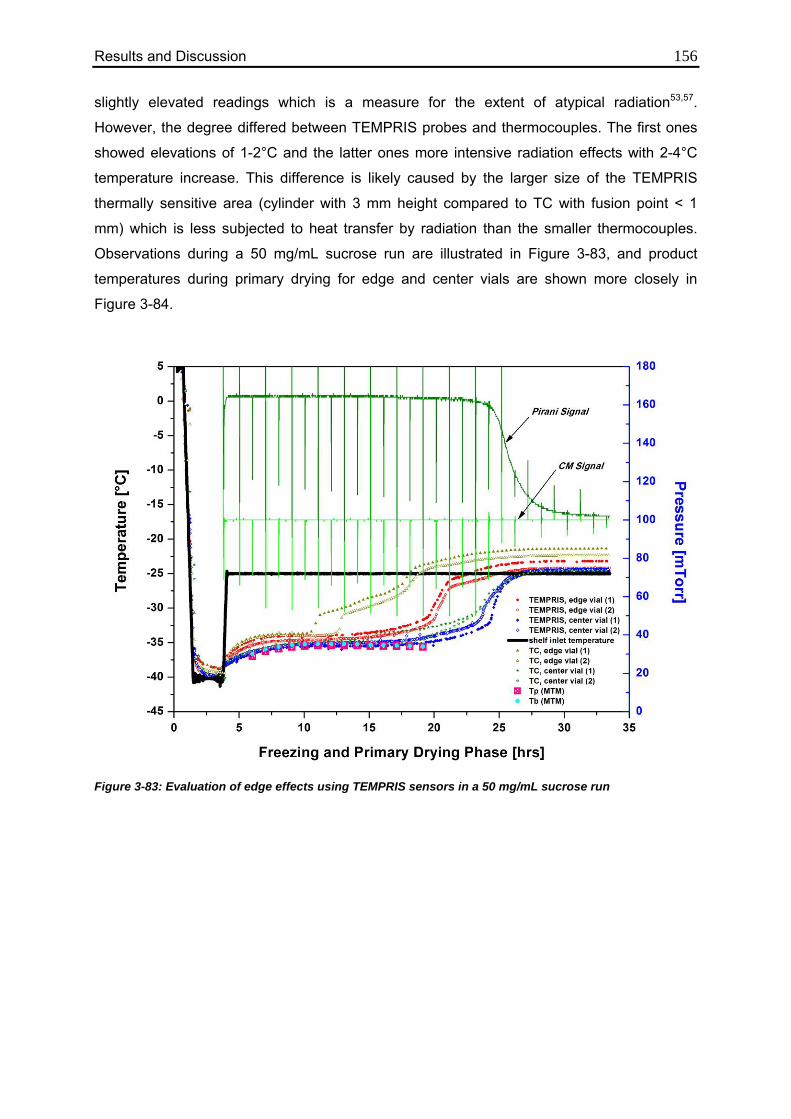
Results and Discussion 156 slightly elevated readings which is a measure for the extent of atypical radiation53,57.
However, the degree differed between TEMPRIS probes and thermocouples. The first ones
showed elevations of 1-2°C and the latter ones more intensive radiation effects with 2-4°C
temperature increase. This difference is likely caused by the larger size of the TEMPRIS
thermally sensitive area (cylinder with 3 mm height compared to TC with fusion point < 1
mm) which is less subjected to heat transfer by radiation than the smaller thermocouples.
Observations during a 50 mg/mL sucrose run are illustrated in Figure 3-83, and product
temperatures during primary drying for edge and center vials are shown more closely in
Figure 3-84.
Figure 3-83: Evaluation of edge effects using TEMPRIS sensors in a 50 mg/mL sucrose run
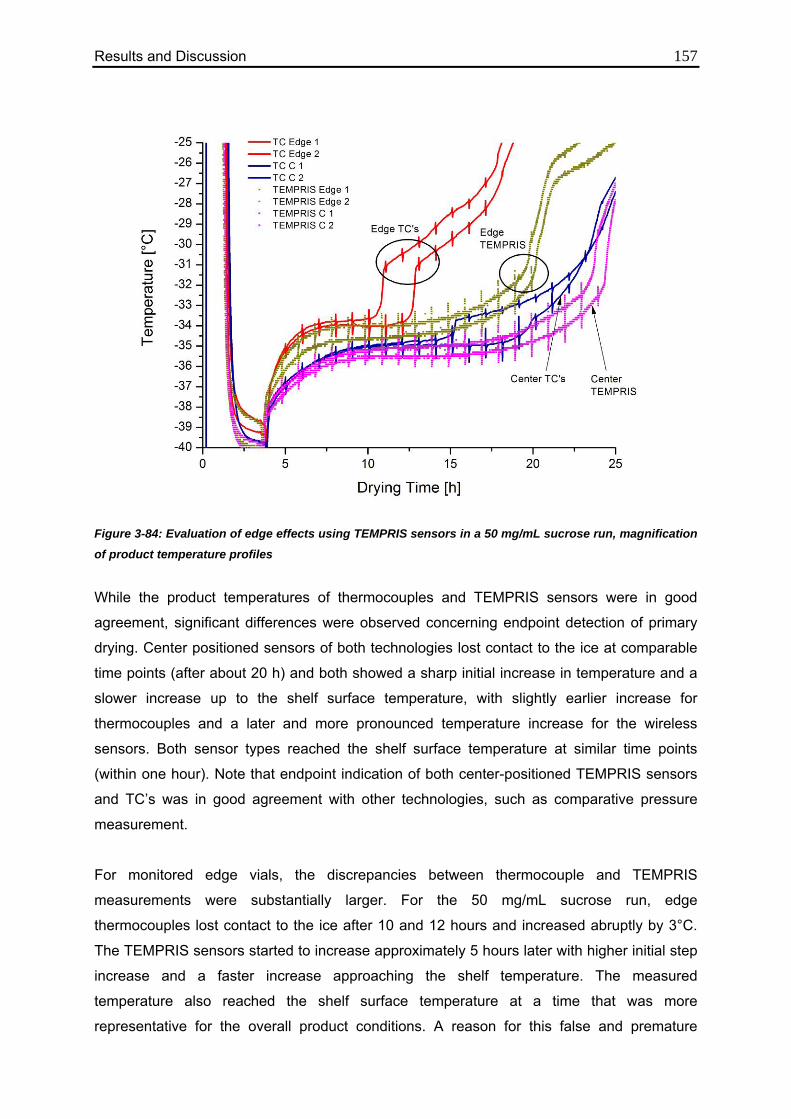
Results and Discussion 157
Figure 3-84: Evaluation of edge effects using TEMPRIS sensors in a 50 mg/mL sucrose run, magnification
of product temperature profiles
While the product temperatures of thermocouples and TEMPRIS sensors were in good
agreement, significant differences were observed concerning endpoint detection of primary
drying. Center positioned sensors of both technologies lost contact to the ice at comparable
time points (after about 20 h) and both showed a sharp initial increase in temperature and a
slower increase up to the shelf surface temperature, with slightly earlier increase for
thermocouples and a later and more pronounced temperature increase for the wireless
sensors. Both sensor types reached the shelf surface temperature at similar time points
(within one hour). Note that endpoint indication of both center-positioned TEMPRIS sensors
and TC’s was in good agreement with other technologies, such as comparative pressure
measurement.
For monitored edge vials, the discrepancies between thermocouple and TEMPRIS
measurements were substantially larger. For the 50 mg/mL sucrose run, edge
thermocouples lost contact to the ice after 10 and 12 hours and increased abruptly by 3°C.
The TEMPRIS sensors started to increase approximately 5 hours later with higher initial step
increase and a faster increase approaching the shelf temperature. The measured
temperature also reached the shelf surface temperature at a time that was more
representative for the overall product conditions. A reason for this false and premature
Results and Discussion 158 temperature increase of the thermocouples could be the extremely small temperature-
sensitive area at the tip which loses contact to the remaining ice still present in the vicinity
earlier. The TEMPRIS probe’s larger thermally-sensitive area enables extended contact to
the remaining ice at thevial bottom. Another factor attributing to this difference is minor heat
input through the thermocouple wire, resulting in faster sublimation around the wire, and loss
of contact at a time when there was still ice in the vial. Due to the passive operation principle
of the TEMPRIS sensors and the larger thermo-sensitive area, the loss of contact was
observed at more representative time points, and temperature data indicative for the real
conditions could be obtained for an extended period of time. This drying time bias can also
be observed to a lesser extent for sensors in center vials.
3.7.5 Endpoint Detection: TEMPRIS vs. Other Common Technologies
If endpoint indication is performed based on data from temperature sensors to control a
freeze drying cycle, special consideration needs to be paid to differences between the
monitored vials and the other vials in the process. All invasive temperature measurements
typically influence the freezing and drying behavior of the monitored vial, leading to shorter
drying times and slightly lower product temperatures due to reduced product resistance,
especially when operating in a GMP environment. If the monitored vials are positioned in a
front row to mitigate sterility risks, the measurements may be even more biased compared to
the rest of the batch. Therefore, ramping into secondary drying is commonly not started
directly at the indicated endpoint (the time when the sensor temperature reaches the shelf
temperature), but after an additional soak time of at least 10-15% of the total primary drying
time1,14.
The endpoint indications of TEMPRIS sensors in center and edge position were compared to
thermocouple measurements and to several batch monitoring technologies (comparative
pressure measurement, dewpoint, MTM) in multiple runs using 25 mg/mL and 50 mg/mL
sucrose, 100 mg/mL trehalose and mixtures of mannitol and sucrose to evaluate the bias
between the monitored vials and the batch average.
As mentioned before, thermocouples and the wireless thermal probes showed good
agreement in endpoint indication if they were placed in center vials, with some differences in
the shape of the increasing curve after contact to the ice was lost. For sensors in edge vials,
thermocouples showed a much earlier sharp temperature increase and also reached the
shelf surface temperature at a time when all other systems still indicated steady state primary
drying. The TEMPRIS probes in edge vials showed more reliable data but still indicated the
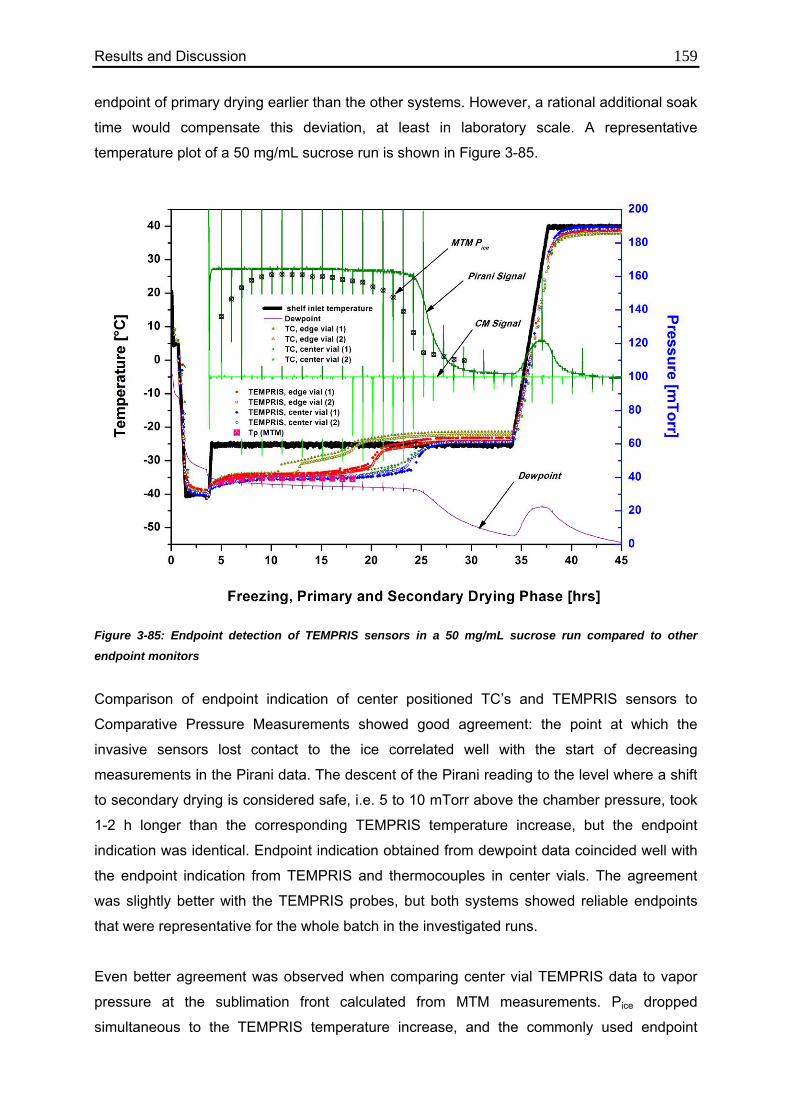
Results and Discussion 159 endpoint of primary drying earlier than the other systems. However, a rational additional soak
time would compensate this deviation, at least in laboratory scale. A representative
temperature plot of a 50 mg/mL sucrose run is shown in Figure 3-85.
Figure 3-85: Endpoint detection of TEMPRIS sensors in a 50 mg/mL sucrose run compared to other
endpoint monitors
Comparison of endpoint indication of center positioned TC’s and TEMPRIS sensors to
Comparative Pressure Measurements showed good agreement: the point at which the
invasive sensors lost contact to the ice correlated well with the start of decreasing
measurements in the Pirani data. The descent of the Pirani reading to the level where a shift
to secondary drying is considered safe, i.e. 5 to 10 mTorr above the chamber pressure, took
1-2 h longer than the corresponding TEMPRIS temperature increase, but the endpoint
indication was identical. Endpoint indication obtained from dewpoint data coincided well with
the endpoint indication from TEMPRIS and thermocouples in center vials. The agreement
was slightly better with the TEMPRIS probes, but both systems showed reliable endpoints
that were representative for the whole batch in the investigated runs.
Even better agreement was observed when comparing center vial TEMPRIS data to vapor
pressure at the sublimation front calculated from MTM measurements. Pice dropped
simultaneous to the TEMPRIS temperature increase, and the commonly used endpoint
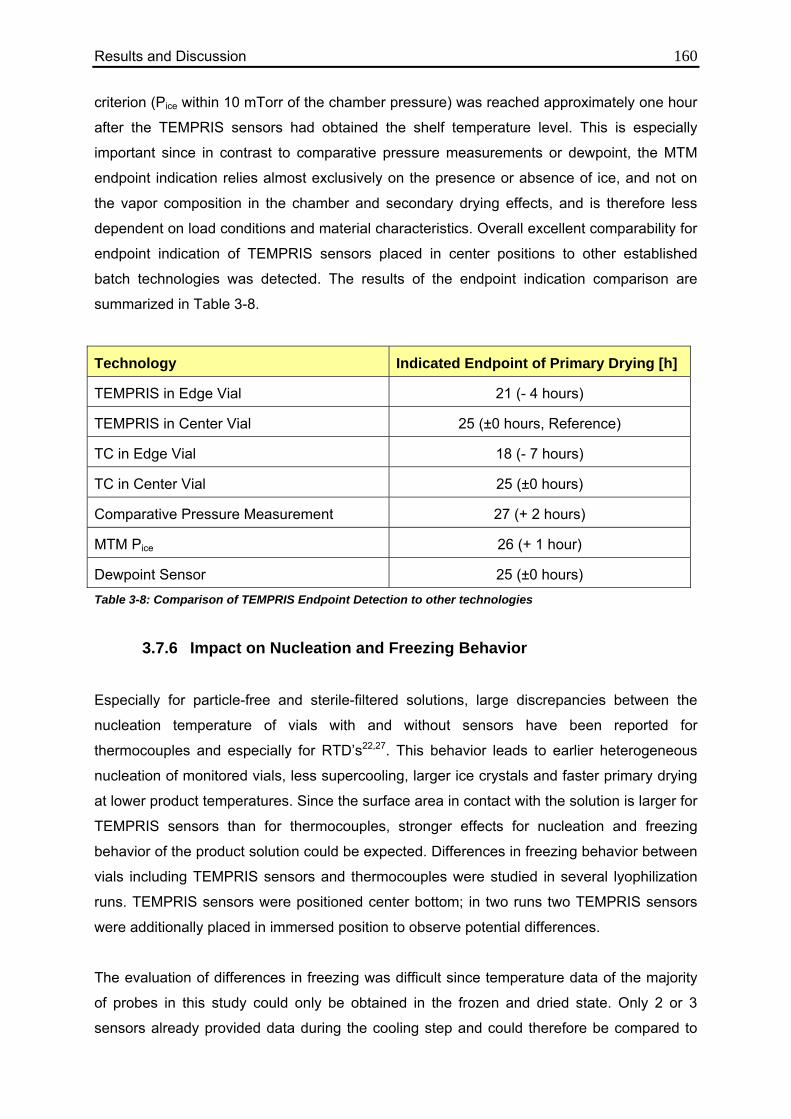
Results and Discussion 160 criterion (Pice within 10 mTorr of the chamber pressure) was reached approximately one hour
after the TEMPRIS sensors had obtained the shelf temperature level. This is especially
important since in contrast to comparative pressure measurements or dewpoint, the MTM
endpoint indication relies almost exclusively on the presence or absence of ice, and not on
the vapor composition in the chamber and secondary drying effects, and is therefore less
dependent on load conditions and material characteristics. Overall excellent comparability for
endpoint indication of TEMPRIS sensors placed in center positions to other established
batch technologies was detected. The results of the endpoint indication comparison are
summarized in Table 3-8.
Technology Indicated Endpoint of Primary Drying [h]
TEMPRIS in Edge Vial 21 (- 4 hours)
TEMPRIS in Center Vial 25 (±0 hours, Reference)
TC in Edge Vial 18 (- 7 hours)
TC in Center Vial 25 (±0 hours)
Comparative Pressure Measurement 27 (+ 2 hours)
MTM Pice 26 (+ 1 hour)
Dewpoint Sensor 25 (±0 hours)
Table 3-8: Comparison of TEMPRIS Endpoint Detection to other technologies
3.7.6 Impact on Nucleation and Freezing Behavior
Especially for particle-free and sterile-filtered solutions, large discrepancies between the
nucleation temperature of vials with and without sensors have been reported for
thermocouples and especially for RTD’s22,27. This behavior leads to earlier heterogeneous
nucleation of monitored vials, less supercooling, larger ice crystals and faster primary drying
at lower product temperatures. Since the surface area in contact with the solution is larger for
TEMPRIS sensors than for thermocouples, stronger effects for nucleation and freezing
behavior of the product solution could be expected. Differences in freezing behavior between
vials including TEMPRIS sensors and thermocouples were studied in several lyophilization
runs. TEMPRIS sensors were positioned center bottom; in two runs two TEMPRIS sensors
were additionally placed in immersed position to observe potential differences.
The evaluation of differences in freezing was difficult since temperature data of the majority
of probes in this study could only be obtained in the frozen and dried state. Only 2 or 3
sensors already provided data during the cooling step and could therefore be compared to
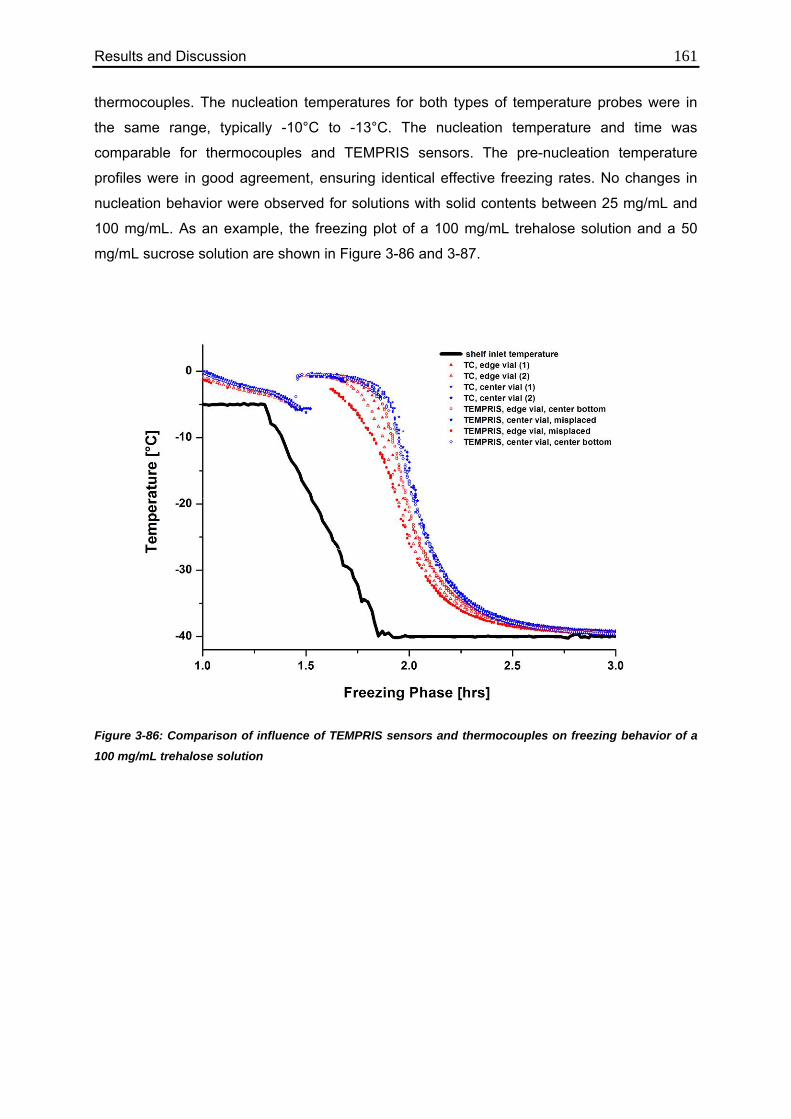
Results and Discussion 161 thermocouples. The nucleation temperatures for both types of temperature probes were in
the same range, typically -10°C to -13°C. The nucleation temperature and time was
comparable for thermocouples and TEMPRIS sensors. The pre-nucleation temperature
profiles were in good agreement, ensuring identical effective freezing rates. No changes in
nucleation behavior were observed for solutions with solid contents between 25 mg/mL and
100 mg/mL. As an example, the freezing plot of a 100 mg/mL trehalose solution and a 50
mg/mL sucrose solution are shown in Figure 3-86 and 3-87.
Figure 3-86: Comparison of influence of TEMPRIS sensors and thermocouples on freezing behavior of a
100 mg/mL trehalose solution
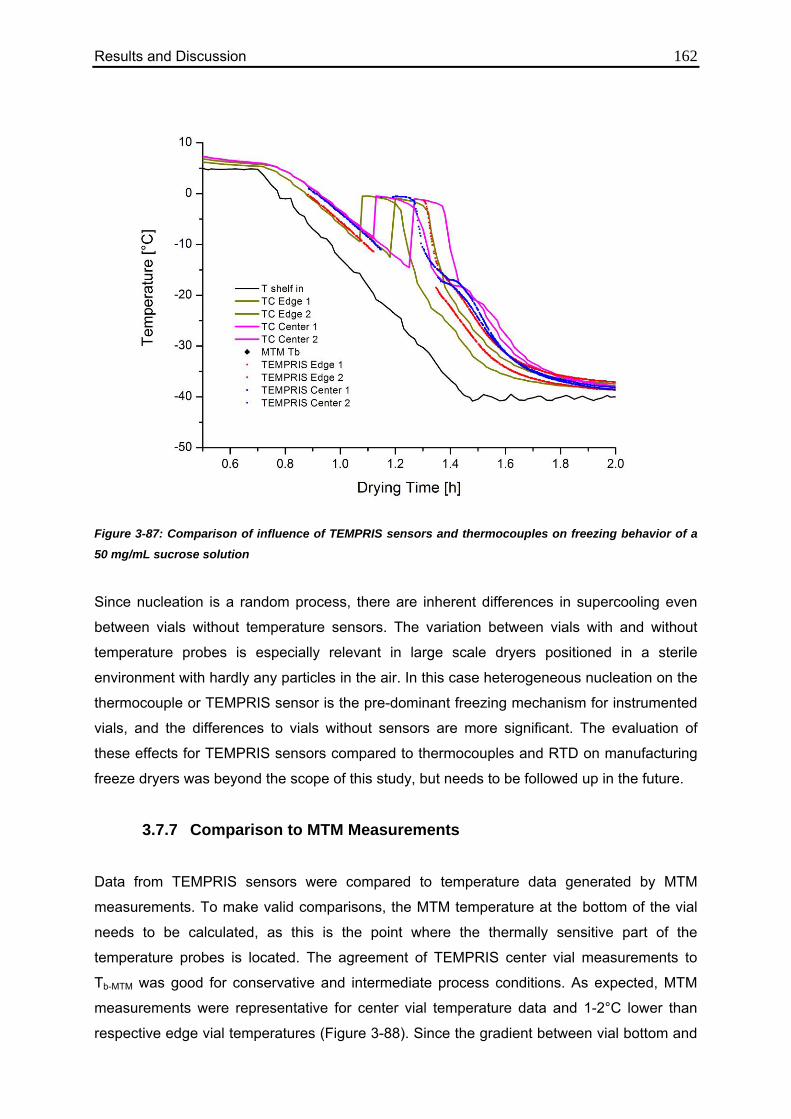
Results and Discussion 162
Figure 3-87: Comparison of influence of TEMPRIS sensors and thermocouples on freezing behavior of a
50 mg/mL sucrose solution
Since nucleation is a random process, there are inherent differences in supercooling even
between vials without temperature sensors. The variation between vials with and without
temperature probes is especially relevant in large scale dryers positioned in a sterile
environment with hardly any particles in the air. In this case heterogeneous nucleation on the
thermocouple or TEMPRIS sensor is the pre-dominant freezing mechanism for instrumented
vials, and the differences to vials without sensors are more significant. The evaluation of
these effects for TEMPRIS sensors compared to thermocouples and RTD on manufacturing
freeze dryers was beyond the scope of this study, but needs to be followed up in the future.
3.7.7 Comparison to MTM Measurements
Data from TEMPRIS sensors were compared to temperature data generated by MTM
measurements. To make valid comparisons, the MTM temperature at the bottom of the vial
needs to be calculated, as this is the point where the thermally sensitive part of the
temperature probes is located. The agreement of TEMPRIS center vial measurements to
Tb-MTM was good for conservative and intermediate process conditions. As expected, MTM
measurements were representative for center vial temperature data and 1-2°C lower than
respective edge vial temperatures (Figure 3-88). Since the gradient between vial bottom and
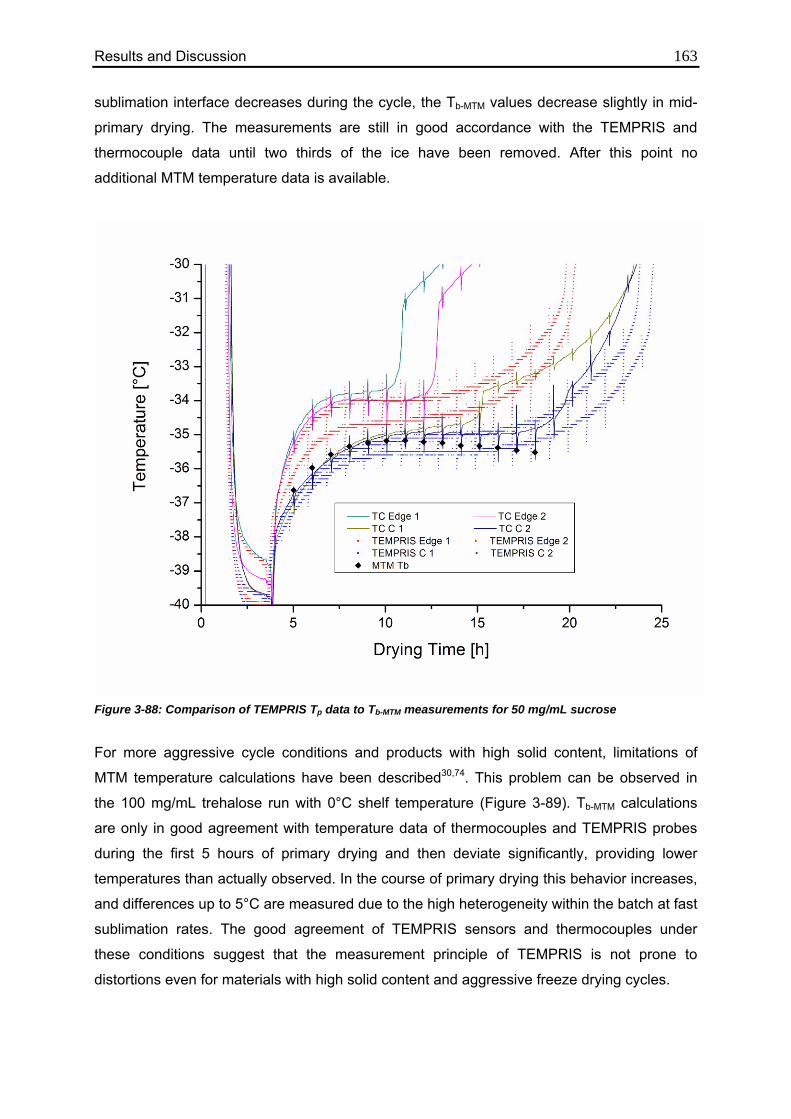
Results and Discussion 163 sublimation interface decreases during the cycle, the Tb-MTM values decrease slightly in mid-
primary drying. The measurements are still in good accordance with the TEMPRIS and
thermocouple data until two thirds of the ice have been removed. After this point no
additional MTM temperature data is available.
Figure 3-88: Comparison of TEMPRIS Tp data to Tb-MTM measurements for 50 mg/mL sucrose
For more aggressive cycle conditions and products with high solid content, limitations of
MTM temperature calculations have been described30,74. This problem can be observed in
the 100 mg/mL trehalose run with 0°C shelf temperature (Figure 3-89). Tb-MTM calculations
are only in good agreement with temperature data of thermocouples and TEMPRIS probes
during the first 5 hours of primary drying and then deviate significantly, providing lower
temperatures than actually observed. In the course of primary drying this behavior increases,
and differences up to 5°C are measured due to the high heterogeneity within the batch at fast
sublimation rates. The good agreement of TEMPRIS sensors and thermocouples under
these conditions suggest that the measurement principle of TEMPRIS is not prone to
distortions even for materials with high solid content and aggressive freeze drying cycles.
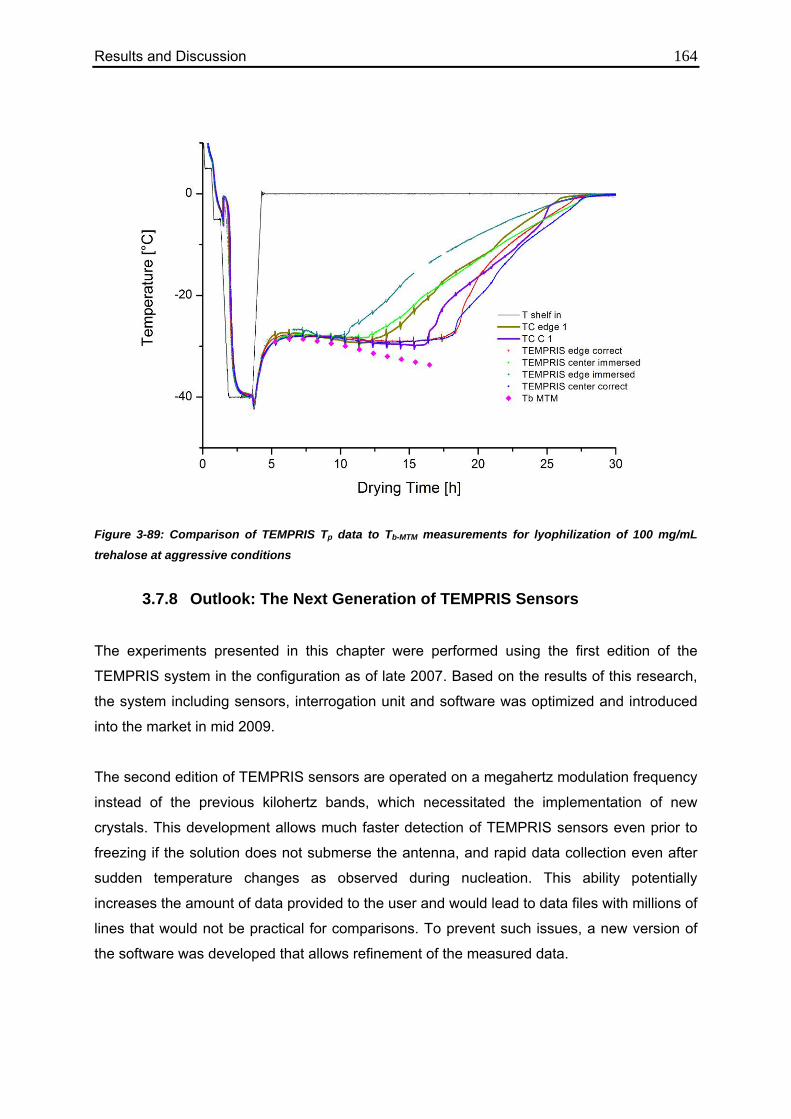
Results and Discussion 164
Figure 3-89: Comparison of TEMPRIS Tp data to Tb-MTM measurements for lyophilization of 100 mg/mL
trehalose at aggressive conditions
3.7.8 Outlook: The Next Generation of TEMPRIS Sensors
The experiments presented in this chapter were performed using the first edition of the
TEMPRIS system in the configuration as of late 2007. Based on the results of this research,
the system including sensors, interrogation unit and software was optimized and introduced
into the market in mid 2009.
The second edition of TEMPRIS sensors are operated on a megahertz modulation frequency
instead of the previous kilohertz bands, which necessitated the implementation of new
crystals. This development allows much faster detection of TEMPRIS sensors even prior to
freezing if the solution does not submerse the antenna, and rapid data collection even after
sudden temperature changes as observed during nucleation. This ability potentially
increases the amount of data provided to the user and would lead to data files with millions of
lines that would not be practical for comparisons. To prevent such issues, a new version of
the software was developed that allows refinement of the measured data.
Results and Discussion 165 The revised sensors are smaller than the previous version and enable easier center-bottom
placement. Additionally the antenna can be easily detached from the sensor and exchanged
if problems are encountered.
To enable the installation on production freeze dryers that are operated using Good
Manufacturing Practice, an additional version of the transmitter has been developed.
Additional to the attachment to a plexiglass door or to a window, it is now possible to install
the transmitter unit consisting of sterilizable materials inside the freeze dryer. Now the
routinely use of multiple transmitters is also possible to obtain data from 16 TEMPRIS
sensors throughout the chamber simultaneously. A radio frequency identification tag (RFID)
was installed in the TEMPRIS sensors to allow easy tracing during automatic aseptic loading
and after the lyophilization run.
These further improvements make TEMPRIS a valuable system for use during development,
scale-up and production freeze drying cycles. The comparability of data and the wireless and
passive principle are a significant improvement for temperature sensing in freeze drying.
Results and Discussion 166
3.8 Merits and Demerits of the Investigated PAT Tools This section summarizes the advantages and disadvantages of the PAT tools that were
employed for the presented research, i.e. TDLAS, MTM and TEMPRIS.
One main advantage of TDLAS compared to conventional technologies is the non-invasive
measurement principle that excludes interaction with the product. Therefore implementation
in manufacturing freeze dryers is possible without risks for sterility and pharmaceutical
quality. The process is not interrupted by the measurements, and the product temperature as
well as other critical product parameters is not altered. Since only batch properties are
determined, it is not possible to assess radiation effects or inhomogeneities between vials.
The continuous measurement of flow velocity and mass flow rate is a feature that is up to
date not possible with any other technology commercially available for lyophilization.
TDLAS was found to obtain very accurate water concentration measurements throughout the
cycle which is comparable to other technologies. In addition, flow velocities and mass flow
rates are continuously calculated which are very useful for monitoring of the status of a
freeze drying run and for derivative calculations. The reliability of velocity and mass flow
measurements depends widely on the process conditions used, short-term and long-term
fluctuations can be observed, and a velocity offset needs to be determined prior to the run
which is critical for the validity of measurements. In most situations an accuracy of ± 5% of
the integrated mass of water removed from the product can be achieved143,146, with larger
deviations for low flow velocities as encountered during secondary drying or at very high
chamber pressures. Overall, TDLAS is a very useful tool on all scales of freeze dryers for
both development of recipes and monitoring of production cycles. Due to the high costs and
the applicability under sterile conditions, the potentially preferable use is in pharmaceutical
manufacturing to obtain additional information about critical product and process parameters
and thereby optimize cycle time and product quality.
MTM also offers the advantage of non-invasive measurements and obtains a range of critical
product parameters during each pressure rise measurement. The calculated results are
useful for direct optimization of cycle conditions and for reactions to changes. As not
interaction with the product occurs and batch parameters are measured, there is no bias of
the monitored vials, and representative data or the batch are compiled. However, the
measurements are not performed continuously but in intervals of mostly 1 hour, leading to
delayed adjustments and large periods without data. The pressure rise measurements

Results and Discussion 167 interrupt the process and lead to brief increases of product temperature within the vial that
may be detrimental for product quality if very aggressive cycle conditions are employed.
Additional disadvantages are the bias towards the coldest vials, the susceptibility to radiation
effects, and the reduced measurement accuracy if high-concentrated amorphous materials
are present. MTM can only be applied in laboratory scale lyophilizers and will likely not be
easily adaptable to production scale due to the extended closing time of the valve and the
very fast pressure rise of the larger number of vials. Therefore the main focus of MTM is on
facilitation of cycle development in the laboratory, transfer to pilot scale, inclusion of
limitations to known heat and mass transfer restrictions of the manufacturing scale dryer
during cycle development, and determination of additional critical product parameters for
established recipes.
The TEMPRIS sensors showed good accuracy of temperature measurements and were
reliable for endpoint detection. They consist of sterilizable materials and can be easily
introduced into automatic loading systems. TEMPRIS is an invasive technology and
therefore influence nucleation and freezing behavior in a sterile environment compared to
non-monitored vials. However, as they can easily obtain product temperature data in large
scale lyophilizers that previously did not have any thermal probes, they offer enormous
opportunities for PAT in production. They are also valuable for scale up and transfer of
freeze drying cycles since the same system can be applied for temperature monitoring on all
scales. Analysis of the enormous amount of measurement data that is recorded by the
system is complex and time-consuming, and a more user-friendly interface needs to be
developed. The positioning of the antenna and the reliability of data recording have been
improved in the latest system. Overall, the TEMPRIS probes have large potential for use in
freeze drying, especially for measurement of product temperature in large scale freeze
dryers.
Conclusion 168
4. Conclusion
Process Analytical Technology has become an important part of development and production
in the pharmaceutical sector. The primary motivation for PAT is improved understanding of
the product, resulting in more efficient and reliable manufacturing and mitigation of risks for
the consumer. The research conducted in the scope of this thesis focused on the
development of new applications for sophisticated Process Analytical Technology tools,
specifically MTM and TDLAS, as well as practical testing and evaluation of a novel wireless
temperature sensing technology.
TDLAS technology showed potential for fast and reliable determination of vial heat transfer
coefficients. Data calculated during the entire sublimation time were in good agreement with
gravimetric measurements. The complex weighing procedure enabled determination of
position effects and delineation of the pressure-dependent and pressure-independent
contributions to heat transfer. TDLAS measurements during steady state enabled rapid
calculation of Kv values that were representative for the entire batch. Use of these
parameters for continuous monitoring of the critical product parameters temperature and
resistance showed good agreement to established technologies. Especially the non-invasive,
continuous and non-interruptive nature of the measurements is a great benefit for application
in all scales of freeze dryers and confirmation of product quality of the entire batch. This
especially constitutes a major advantage for transfer and optimization of lyophilization cycles
in production scale where determination of critical product parameters is mostly limited and
invasive technologies are restricted due to sterility considerations and impaired
representativeness compared to the majority of the batch.
It was also possible to study secondary drying kinetics at constant product temperature using
the TDLAS sensor, and successfully apply the derived correlation for targeting of
intermediate moisture contents. Although the conditions during secondary drying are
generally unfavorable for TDLAS technology, it was possible to perform continuous
measurements and quantify desorption of water. If a well characterized formulation with
optimum stability at intermediate moisture contents is processed, application of TDLAS as an
endpoint monitor of secondary drying would be favorable. If the stability is optimal at low
residual moisture contents, it would be preferable to follow a defined temperature over time
profile without adjustments based on TDLAS measurements.
MTM product resistance data was evaluated as a critical product parameter to obtain
additional information to product temperature. Product resistance measurements were robust
and reproducible in several vial types and reliably indicated changes in concentration,
Conclusion 169 freezing recipe and fill depth. This is especially important for design and optimization of
freeze drying cycles in laboratory scale, where MTM enables non-invasive monitoring of
batch properties and reflects the effects of process changes on the critical product
parameters. Information about product resistance is important for cycle adjustments in the
course of primary drying to avoid increases of product temperature caused by elevated
resistance, and for evaluation of microcollapse during primary drying caused by aggressive
drying conditions. Additionally the duration and conditions of annealing steps can be
optimized based on reduction of product resistance and primary drying time, and it is
possible to ensure batch to batch comparability. In summary, the establishment of Rp
monitoring during the cycle contributes to a better understanding of both product and process
and thereby enhances pharmaceutical Quality be Design.
MTM measurements were also applied in the scope of a central PAT criterion: cycle
robustness testing. Product temperatures and appearance of sucrose and trehalose
solutions processed at conservative, intermediate and aggressive cycle conditions were
characterized and correlated to the observed product resistance. The decrease in Rp at
aggressive primary drying conditions could be connected to microcollapse of pores and
changes of the inner structure to an extent that retained the product temperature at the
sublimation front shortly below the critical formulation temperature. This additional
information is important since the macroscopic appearance of the cakes were comparable for
all process conditions investigated. The microcollapse of pores leads to a more compact
cake structure and more possibilities for degradation reactions which presents a potential risk
for stability and shelf life. MTM technology provided feedback on these effects in real time
and allowed correction of cycle conditions which would not be possible with other common
monitoring technologies.
Reliable and comparable product temperature monitoring in freeze drying is an essential
component of process development and cycle transfer in freeze drying. Important factors for
an ideal product temperature measurement technology are accurate temperature
determination, acquisition of real-time data as process feedback, and passive operation
without introduction of energy into the product. Another important factor on larger scales is
the applicability under sterile conditions, especially by requiring as few manual handling as
possible. It presents a significant advantage if the same system can be employed in all
scales to allow valid comparisons of temperature data. The TEMPRIS system conforms to all
these demands, and therefore shows great potential for application in freeze drying.
Conclusion 170 TEMPRIS technology was found to produce accurate and fast product temperature data with
good indication of process endpoints and high sensitivity for atypical radiation. Since the
sensors can be used on all scales of freeze dryers and do not require manual placement of
wires, they facilitate product temperature comparison and adjustment during transfer and
scale-up of lyophilization cycles. As they can be placed into a vial and introduced through
automatic loading systems, application in aseptic manufacturing of pharmaceuticals is easily
possible. No significant differences could be detected concerning impact on freezing
behavior relative to thermocouples in laboratory scale. However, any type of invasive sensor
is expected to reduce the amount of supercooling relative to non-monitored vials when
operating in a GMP environment. Recent developments in hardware and software have
further improved this temperature monitoring system for freeze drying.
As an outlook, it can be assumed that Quality by Design and PAT will gain additional
importance in all aspects of pharmaceutical research, development and production. The
latest guidances especially demand technologies that obtain information about the entire
batch and not only few selected samples. Another important factor is the application of
comparable measurement systems on different scales to facilitate transfer and scale-up and
thereby make optimal use of the PAT data generated during development. Especially in
respect to Robustness Testing, it is much more feasible to perform additional testing and
qualification during development with a limited number of samples than investigating such
effects on large scale or even after out of range conditions occurred. Another important
aspect is the definition of a design space for both formulation composition and manufacturing
process to allow flexible reaction to variations in raw materials while maintaining optimal
cycle conditions. While practical experiments are imperative for determination of this Design
Space, mathematical simulation, statistical considerations and computer modeling will gain
importance and replace large parts of the practical evaluation.
MTM is an excellent technology for development and optimization of freeze drying cycles as
well as for decisions between different container systems. However, use in large scale freeze
dryers is currently not possible due to the very fast pressure rise and extended closing time
of the isolation valve. Therefore tools such as the SMARTTM freeze dryer will mainly play a
larger role in cycle development, reducing time required for research and making the cycles
more efficient.
In contrast, TDLAS sensors can be used on all scales of freeze dryers if a spool piece of
sufficient dimensions is available. Especially if several production freeze dryers with identical
design and dimensions are in use at the same facility, installation of one TDLAS sensor
Conclusion 171 which could be exchanged between the units would be easy and relatively inexpensive. The
main uses could be operational qualification of freeze dryers to assess potential restrictions
at high mass flow rates and make transfer of recipes easier, as well as monitoring of
production cycles to assure product quality non-intrusively by evaluating conformance of the
critical product parameters (Tp, Rp). For the application in routine manufacturing, the reliability
of the TDLAS system needs to be improved, and an opportunity for calibration should be
developed.
The TEMPRIS sensors are an invasive technology and will not be able to measure product
temperatures that are representative for non-monitored vials during aseptic production
cycles. However, it is a great advantage if the same technology can be easily employed
during all stages of a product lifecycle and on all scales which is the case for TEMPRIS
sensors. Additionally the system can be integrated into large freeze dryers that do not have
any kind of process analytical technology tools, and obtain data from existing cycles that
were developed empirically. Especially the opportunity for introduction into automatic loading
systems is interesting for monitoring of production cycles without compromising the sterility. If
the measurements in large scale GMP units are not viewed as absolutely true product
temperatures and process endpoints of all vials, the data will be valuable for transfer,
optimization and monitoring of routine production cycles in freeze drying. For the future it will
be a challenge to develop a similar passive wireless sensor which is non-invasively
positioned in the head space of a vial and measures gas composition or dewpoint. Such a
device would combine the advantaged of TEMPRIS and of non-invasive technologies and
gain representativeness for non-monitored vials.
In summary, the results presented in this work contribute to the quest of developing
representative real-time monitoring of critical product characteristics to ensure optimal quality
of modern pharmaceuticals.
Zusammenfassung 172
5. Zusammenfassung
Die Verwendung prozessanalytischer Technologien gewinnt bei der Entwicklung und
Produktion pharmazeutischer Produkte immer größere Bedeutung. Motiviert ist dies
hauptsächlich durch verbessertes Produktverständnis, das zu effizienteren und
zuverlässigeren Produktionsabläufen führt und dadurch die Risiken für den Verbraucher
vermindert. Der Schwerpunkt der im Rahmen dieser Arbeit durchgeführten Forschung lag
auf der Entwicklung neuer Anwendungsmöglichkeiten für komplexe PAT Systeme,
insbesondere TDLAS und MTM. Zudem wurde ein neuartiger drahtloser Temperatursensor
praktischen Tests unterzogen und bewertet.
Der erste Teil dieser Dissertation beschreibt die Ermittlung von Wärmeübertragungs-
koeffizienten von Lyophilisationsvials110 mittels einer Wägemethode sowie basierend auf
Messung der TDLAS Massenflussrate. Kv-Werte der Gesamtheit an Vials wurden bei
Kammerdrücken von 65, 100, 200 und 500 mTorr ermittelt. Die Ergebnisse wurden mit Hilfe
einer Modellfunktion mathematisch ausgewertet, um die druckabhängigen und die druck-
unabhängigen Bestandteile der Wärmeübertragung auf das Produkt voneinander zu trennen
und zu quantifizieren. Das Wägeverfahren ergab bei 65 mTorr eine konstante
druckunabhängige Komponente von 1,48 cal/s*cm2*K, entsprechend 45% der
Gesamtwärmeübertragung. Mit steigendem Kammerdruck reduzierte sich der Anteil der
druckunabhängigen Komponente deutlich auf nur 15,3% bei 500 mTorr. Im Gegenzug stieg
der druckabhängige Anteil der Wärmeübertragung bei 500 mTorr auf fast 85% an. Die
berechnete Ausgleichskurve der Modellfunktion wurde zur Interpolation von Kv-Werten
zwischen den experimentell angewendeten Kammerdrücken herangezogen. Sorgfältige
Untersuchung der Positionseffekte zeigte eine Erhöhung der Kv-Werte bei Vials in
Randpositionen von 20% bis 25% gegenüber Vials im Zentrum der Stellfläche. Die Erhöhung
der Kv-Werte von Vials an den Ecken und in der vorderen Reihe war besonders hoch.
Dagegen wurden für Vials an der Seite der Stellfläche nur leicht erhöhte Werte ermittelt. Die
atypische Wärmestrahlung zu Randvials war relativ unabhängig vom Kammerdruck. Ein
zusätzlicher Sublimationsversuch, bei dem eine andere Charge desselben Vialtyps
verwendet wurde, bestätigte die Ergebnisse der vorherigen Versuche. Vergleichbare Kv-
Werte verschiedener Vialchargen sind ein essentieller Faktor für die Verwendung dieser
Daten in Routineprozessen.
Die TDLAS-Massenflussmessung in Echtzeit erlaubt die Berechnung von Kv-Werten auf zwei
verschiedene Arten. Zunächst wurden Massenfluss-Messungen während der gesamten
Sublimationszeit integriert um die Unzulänglichkeiten der konventionellen Wägemethode
nachzubilden. Dabei wurde gute Übereinstimmung der konventionell bestimmten und der
Zusammenfassung 173 mittels TDLAS ermittelten Kv-Werte beobachtet. Bei 500 mTorr wurde aufgrund der
verringerten Messgenauigkeit des TDLAS Sensors bei geringen Fließgeschwindigkeiten eine
größere Abweichung konstatiert. Aufgrund der guten Vergleichbarkeit der Kv-Werte beider
Methoden und der berechneten Kurven in dem pharmazeutisch gebräuchlichen Bereich von
65 bis 200 mTorr ist die Annahme berechtigt, dass TDLAS eine verlässliche Methode für die
schnelle und genaue Bestimmung von Kv-Daten darstellt.
Das Funktionsprinzip des TDLAS Sensors ermöglicht zudem eine schnellere und
störungsfreiere Bestimmung von Wärmeübertragungskoeffizienten. Eine Schlüsselrolle
kommt hierbei der Verwendung von Prozessdaten eines Zeitpunktes während des
Gleichgewichts der Sublimationsphase zu. Dadurch konnten Massenflussdaten, die während
Rampphasen oder während Veränderungen der Produkttemperatur aufgezeichnet wurden,
als Fehlerquellen eliminiert werden. Die ausgehend von Einpunktmessungen während der
Gleichgewichtsphase berechneten Kv-Werte waren deshalb für die Gesamtheit der Vials
repräsentativer. Der Anteil der druckunabhängigen Wärmeübertragung war vergleichbar mit
vorherigen Ergebnissen und nahm von 43,6% bei 65 mTorr bis zu 12,9% bei 500 mTorr ab.
Die Ausgleichskurve der mittels Einpunkt-Methode bestimmten Kv-Werte wurde für die
Berechnung der mittleren Produkttemperatur für die Gesamtheit der Vials verwendet. Diese
wurde für 9 Gefriertrocknungsläufe mit Saccharose, Mannitol und Glycin in verschiedenen
Konzentrationen als Modellhilfsstoffen berechnet. Bei geringen und mittleren
Massenflussraten wurde eine sehr gute Übereinstimmung zwischen Tp-TDLAS und Daten von
Thermoelementen verzeichnet. Das TDLAS-Produkttemperaturprofil spiegelte die
tatsächlichen Prozessbedingungen während eines Großteils der Primärtrocknung genau
wider und lag zwischen den Temperaturprofilen von Vials am Rand und im Zentrum.
Größere Abweichungen der berechneten Tp-TDLAS traten zu Beginn der Primärtrocknung und
nach stufenweiser Veränderung der Stellflächentemperatur auf und dauerten an bis der
Gleichgewichtszustand wieder eingestellt war. Geringe Veränderungen der
Produkttemperatur nach relativ kleinen Anpassungen der Stellflächentemperatur durch den
SMARTTM Freeze Dryer Algorithmus wurden unmittelbar in den Tp-TDLAS Daten reflektiert.
Während Gefriertrocknungsläufen bei denen aggressive Primärtrocknungsbedingungen
vorherrschten und hohe Massenflussraten auftraten lagen die berechneten Tp-TDLAS Werte
durchgehend unter den Thermoelementdaten.
In den meisten Läufen wurde eine prinzipiell gute Übereinstimmung mit aus MTM-
Messungen berechneten Produkttemperaturen konstatiert. Bei Gefriertrocknungsläufen, die
sich durch aggressive Primärtrocknungsbedingungen, erhöhte Chargeninhomogenität oder
Zusammenfassung 174 hohe Feststoffgehalte auszeichneten, waren die Tp-TDLAS-Daten in besserer Übereinstimmung
mit TC-Messungen als die Tp-MTM Werte. Diese Vorteile der TDLAS Messungen sind durch
das nicht-invasive Messprinzip bedingt das keine Unterbrechung des Prozesses erfordert.
Ein weiterer Vorteil der TDLAS Temperaturberechnung ist die minütliche Datenerfassung,
die eine durchgehende Kontrolle der kritischen Produkteigenschaften ermöglicht.
Auf der Basis von Massenflussraten und berechneten Tp-TDLAS in den beschriebenen
Produktläufen wurde der Verlauf des Produktwiderstands ermittelt. Bei konservativen
Primärtrocknungsbedingungen wurde sehr gute Übereinstimmung mit MTM Rp-Daten
beobachtet bis etwa 50% der gesamten Eismenge entfernt worden war. Kristalline Hilfsstoffe
zeigten bei Rp-Messungen mit beiden Technologien einen kontinuierlichen Anstieg des
Produktwiderstands. Die aufgrund von TDLAS-Messungen errechneten Werte stimmten
meist auf 1 Torr*cm2*h/g mit MTM-Daten überein, waren aber nur für einen geringeren
Abschnitt der Primärtrocknung zuverlässig. Falls zukünftige Untersuchungen zur Bewertung
von Vorteilen und Grenzen der TDLAS Rp-Bestimmung positive Ergebnisse liefern könnte
sich diese Funktion zu einem wertvollen nichtinvasiven Verfahren für die Produktion
entwickeln, mit dem sonst nicht zugängliche Produktdaten ermittelt werden können.
Der letzte Abschnitt der auf TDLAS-Messungen basierenden Versuche behandelt die
Überwachung des Sekundärtrocknungsschrittes. Sekundärtrocknungsanalytik ist bei
Produktionsanlagen ohne Probenzugsvorrichtung besonders kompliziert, vor allem wenn ein
mittlerer Restfeuchtegehalt (1-3%) erwünscht ist. Unter Verwendung des TDLAS Sensors
war es möglich eine Korreation zwischen Restfeuchtegehalt und Massenflussrate bei
konstanten Produkttemperaturen zu entwickeln. Dadurch kann der Restwassergehalt zu
Beginn der Sekundärtrocknung ohne Entnahme von Proben oder Interaktion mit dem
Produkt ermittelt werden. Von diesem Bezugspunkt aus konnten TDLAS
Massenflussmesswerte integriert und vom Restwassergehalt abgezogen werden, wobei gute
Übereinstimmung mit entnommenen Proben ermittelt wurde. Eine essentielle Voraussetzung
für dieses Verfahren ist ein gleichmäßiger Restwassergehalt in allen Vials während der
Entwicklung der Korrelationskurve. Die erforderliche Homogenität wurde durch
Implementierung eines speziell entwickelten Äquilibrierungsverfahrens erreicht, das zu
einem Anstieg der Restfeuchte in Randvials auf das Niveau der Vials im Zentrum führte.
TDLAS Massenflusswerte während der Sekundärtrocknung konnten zuverlässig integriert
werden und zeigten gute Übereinstimmung mit Karl Fischer Bestimmungen der
entnommenen Vials. TDLAS zeigte großes Potential, während der Sekundärtrocknung das
gezielte Erreichen mittlerer Restwassergehalte ohne Entnahme von Proben zu ermöglichen.
Zusammenfassung 175 Im zweiten Teil dieser Arbeit wurden Manometrische Temperaturmessungen zur
Überwachung kritischer Produkteigenschaften verwendet. Zunächst wurde der Einfluss
mehrerer Parameter auf den Produktwiderstandsverlauf bei konservativer Gefriertrocknung
von Saccharoselösungen untersucht. Das typische Rp-Verhalten ist charakterisiert durch
einen initialen Anstieg mit einer anschließenden Plateauphase bis zum Abschluss von ca.
2/3 der Primärtrocknung, und wurde in allen Läufen beobachtet. Bei der Gefriertrocknung
von Saccharoselösungen identischer Konzentration und Füllhöhe in Vials verschiedener
Größen und Arten konnten keine signifikanten Unterschiede festgestellt werden. Eine
Erhöhung der Feststoffkonzentration führte zu einem erheblichen Anstieg des
Produktwiderstandes von 3 Torr*cm2*h/g für 50 mg/mL Saccharose bis zu 5,5 Torr*cm2*h/g
für 200 mg/mL Saccharose. Tempern der eingefrorenen Lösung wirkte sich positiv auf Größe
und Verbindungsgrad der Eiskristalle aus. Dies führte zu einer Verminderung des
Widerstands von etwa 1 Torr*cm2*h/g und resultierte in einer verkürzten
Primärtrocknungsdauer. Vergleichbar positive Effekte wurden beim Einfrieren großer
Füllhöhen von 2 cm pro Vial beobachtet. Durch die verlängerte Einfrierzeit bei relativ hoher
Temperatur konnten die Eiskristalle stärker wachsen und größere Poren in der getrockneten
Struktur bilden was in verringertem Produktwiderstand resultierte. Diese Beobachtung
konnte anhand von Raster-Elektronenmikroskopischen Aufnahmen bestätigt werden.
Zusätzliches Tempern der Lösungen mit 2 cm Fülltiefe hatte eine weitere Verminderung des
Produktwiderstands und der Trocknungszeit zur Folge, allerdings in geringerem Ausmaß als
bei den Lösungen mit weniger Füllhöhe. Dagegen konnte zwischen den Lösungen mit 0,5
und 1 cm Füllhöhe keine Unterschiede des Produktwiderstandes erkannt werden.
Die Untersuchungen im folgenden Abschnitt handeln den Einsatz von MTM für die
Robustheitsbeurteilung von Prozessen ab, die ein zentrales Einsatzgebiet der PAT Initiative
darstellt. Zu diesem Zweck wurde verschieden konzentrierte Lösungen von Saccharose und
Trehalose zunächst unterhalb der Kollapstemperatur lyophilisiert. Die resultierenden
Prozessparameter und kritische Produkteigenschaften wurden mit denen aggressiver
Gefriertrocknungsläufe vergleichen. Obwohl die Produkttemperatur am Boden des Vials die
kritische Formulierungstemperatur in mehreren Läufen deutlich überstieg blieb die
Produkttemperatur an der Sublimationsfront selbst bei hohen Stellflächentemperaturen fast
immer unter Tc. Diese Beobachtung war unerwartet, da eine Steigerung von Ts um 30°C
theoretisch die Produkttemperatur um mindestens 6°C erhöhen sollte1. Weitergehende
Datenauswertung zeigte eine erhebliche Verminderung des Produktwiderstandes bei hoher
Stellflächentemperatur von bis zu 50%. Aufgrund des reduzierten Widerstands blieb Tp-MTM
durchgehend knapp unterhalb der kritischen Formulierungstemperatur. Die
Widerstandsverminderung war durch steigende molekulare Mobilität bei Temperaturen nahe
Zusammenfassung 176 der Kollapstemperatur verursacht, die zu einer Fusion von Porenwandstrukturen und lokalem
Mikrokollaps führten, ohne dabei äußerlich sichtbare Veränderungen wie Kollaps oder
Zusammenschrumpfen zu bewirken. Obwohl die getrockneten Lyophilisate akzeptables
makroskopisches Aussehen und Restwassergehalt zeigten, wurden erhebliche
Veränderungen der inneren Porenstruktur aufgrund der MTM Daten erwartet und konnten
mittels Raster-Elektronenmikroskopischen Aufnahmen belegt werden. Der Mikrokollaps führt
zu einer kompakteren Kuchenstruktur und erhöhter Wahrscheinlichkeit von Abbaureaktionen.
Dadurch entsteht ein Risiko für Lagerstabilität und Haltbarkeit, das nicht durch
makroskopische Betrachtung zu erkennen wäre, sondern ausschließlich mit neuartigen PAT-
Verfahren detektiert werden kann.
Anhand der beschriebenen Untersuchungen konnte die Sensitivität von MTM-Messungen für
Änderungen kritischer Produkteigenschaften gezeigt werden. MTM wird dadurch zu einem
wertvollen Hilfsmittel für die Beurteilung der Auswirkung von Prozessänderungen auf das
Lyophilisat und die Sicherstellung der Vergleichbarkeit verschiedener Chargen. Dabei sind
die Detektierbarkeit verschiedener Einfrierbedingungen und des Temperschrittes in den
Produktwiderstandsdaten ein wichtiger Beitrag zur Qualitätssicherung, der mit anderen
Technologien nur schwer zu erreichen wäre.
Der letzte Teil dieser Dissertation beschreibt die praktische Untersuchung und Beurteilung
eines neuartigen drahtlosen Temperaturmessverfahrens, das in Gefriertrocknungsläufen mit
Saccharose, Trehalose sowie Mischungen von Saccharose und Mannitol untersucht wurde.
Die batterielosen TEMPRIS Sensoren wurden zunächst außerhalb des Gefriertrockners
untersucht um für die Positionierung im Vial und die Plazierung in der
Gefriertrocknungskammer wichtige Faktoren zu identifizieren. Da Hochfrequenzstrahlung in
Lösungen schlecht geleitet wird konnten die meisten Sensoren erst nach Eintreten der
Nukleation detektiert werden. Die korrekte Orientierung des Transmitters stellte eine rasche
Auffindung aller Sensoren nach der Nukleation sicher. Die Positionierung der TEMPRIS
Sensoren im Vial wurde so optimiert, dass die Sensorspitze den Boden in der Mitte des Vials
berühren sollte. Dies wurde als kritischer Faktor für die korrekte Bestimmung des
Endpunktes der Primärtrocknung ermittelt. Ein bloßes Eintauchen des Sensors in den Vial
ohne korrekte Positionierung führt zu einer Schräglage, einer geringeren Menge an
verlässlichen Temperaturdaten und zu einem für das Produkt uncharakteristischen Anstieg
der Temperatur vor dem Ende der Primärtrocknung.
Desweiteren wurde die Fähigkeit der TEMPRIS Sensoren bewertet, atypische Strahlung und
Randeffekte zu detektieren. Der Temperaturunterschied zwischen Rand- und Zentrumsvials
Zusammenfassung 177 während der Primärtrocknung war vergleichbar zu Messungen durch Thermoelemente.
Dagegen zeigten die TEMPRIS Sensoren für den Prozess repräsentativere
Temperaturverläufe in Randvials am Ende der Primärtrocknung, die durch einen späteren
und langsameren Anstieg der Produkttemperatur charakterisiert waren. Vials im Zentrum
zeigten vergleichbare Temperaturprofile und Endpunktsindikationen sowohl für
Thermoelemente als auch für TEMPRIS Sensoren solange die korrekte Positionierung
verwendet wurde. Selbiges gilt für den Vergleich der TEMPRIS Endpunktsindikation mit
Komparativer Druckmessung, Taupunktsensor und MTM Pice Werten. Die TEMPRIS
Messungen stimmten gut mit der von MTM Messungen berechneten Temperatur am
Vialboden überein.
Da der Sensorkorpus im Vergleich zu Thermoelementen relativ groß ist wurde der Einfluss
auf Nukleation und Einfrierverhalten untersucht. Im Labormaßstab konnten dabei keine
signifikanten Unterschiede zwischen beiden Messsystemen gefunden werden. Bei dem
Betrieb in einem GMP-Umfeld wird allerdings jegliche Art invasiver Sensoren zu einer
Verminderung des Supercoolings führen und dadurch die Eigenschaften der vermessenen
Lösung im Vergleich zu den restlichen Vials ohne Sensor verändern.
Das neue TEMPRIS System zeigte in den durchgeführten Untersuchungen genaue und
schnelle Erfassung von Produkttemperaturdaten, wobei zuverlässig Prozessendpunkte und
atypische Wärmestrahlung erfasst werden konnten. Da die Sensoren auf Gefriertrocknern
jeglicher Größe eingesetzt werden können, und keine Gefährdung der Sterilität durch
Plazierung von Kabeln erfolgt, werden Vergleiche und Anpassungen der Produkttemperatur
während Transfer und Scale-Up von Gefriertrocknungszyklen vereinfacht. Die Möglichkeit
der Einschleusung eines Vials mit Sensor durch ein automatisches Beladesystem lässt auch
einen Einsatz in der aseptischen Herstellung von Arzneimitteln zu. Aktuelle
Weiterentwicklungen der Hardware und Software haben dieses Temperaturmesssystem für
die Gefriertrocknung weiter verbessert.
Im Rahmen der hier vorgestellten Forschung wurden drei moderne Prozessanalytische
Systeme erfolgreich für die Überwachung kritischer Produktparameter eingesetzt. Die für den
TDLAS Sensor neu entwickelten Anwendungen ermöglichen die schnelle Ermittlung von
Wärmetransferkoeffizienten und nachfolgende Messung von Produkttemperatur und
Widerstand. Zudem wurde die Verwendung von TDLAS während der Sekundärtrocknung
evaluiert und ein Verfahren für das gezielte Erreichen mittlerer Restfeuchtegehalte
entwickelt. Die MTM Technologie wurde bei der Untersuchung des Einflusses verschiedener
Prozess- und Produktparametern auf den Produktwiderstand eingesetzt, und zeigte

Zusammenfassung 178 Mikrokollaps in optisch akzeptablen Produkten. Die TEMPRIS Sensoren wurden bezüglich
ihrer Positionierung optimiert und mit verschiedenen anderen Messsystemen hinsichtlich
Messgenauigkeit, Endpunktsindikation und Erfassung atypischer Wärmestrahlung
verglichen. Die erzielten Ergebnisse tragen somit zum großen Ziel der Entwicklung
repräsentativer Echtzeit-Messsysteme zur Überwachung kritischer Produkteigenschaften
und zur Sicherung optimaler Qualität für moderne Arzneimittel bei.
References 179
6. References
1. Pikal MJ 2002. Freeze Drying. Encyclopedia of Pharmaceutical
Technology:1299-1326.
2. Costantino HR, Pikal MJ, American Association of Pharmaceutical Scientists.
2004. Lyophilization of biopharmaceuticals. Arlington, VA: AAPS Press. p 686 p.
3. Carpenter JF, Chang BS, Garzon-Rodriguez W, Randolph TW 2002. Rational
design of stable lyophilized protein formulations: theory and practice. Pharm
Biotechnol 13:109-133.
4. Pikal MJ, Dellerman K, Roy ML 1992. Formulation and stability of freeze-dried
proteins: effects of moisture and oxygen on the stability of freeze-dried
formulations of human growth hormone. Dev Biol Stand 74:21-37; discussion 37-
28.
5. Pikal MJ. 2007. Freeze Drying of Pharmaceuticals. Phrm 342, UConn School of
Pharmacy.
6. Wang W 2000. Lyophilization and development of solid protein pharmaceuticals.
Int J Pharm 203(1-2):1-60.
7. Greaves RIN. 1954. Biological Applications of Freezing and Drying. New York:
Academic Press.
8. Jennings TA. 1999. Lyophilization: Introduction and Basic Principles. Englewood,
Co: Interpharm Press.
9. Cameron P. 1997. Good Pharmaceutical Freeze-Drying Practice. Interpharm
Press Inc.
10. Abdelwahed W, Degobert G, Stainmesse S, Fessi H 2006. Freeze-drying of
nanoparticles: formulation, process and storage considerations. Adv Drug Deliv
Rev 58(15):1688-1713.
11. Anchordoquy TJ, Allison SD, Molina MC, Girouard LG, Carson TK 2001. Physical
stabilization of DNA-based therapeutics. Drug Discov Today 6(9):463-470.
12. Yu J, Anchordoquy TJ 2008. Synergistic effects of surfactants and sugars on
lipoplex stability during freeze-drying and rehydration. J Pharm Sci.
13. Nail SL, Jiang S, Chongprasert S, Knopp SA 2002. Fundamentals of freeze-
drying. Pharm Biotechnol 14:281-360.
14. Tang X, Pikal MJ 2004. Design of freeze-drying processes for pharmaceuticals:
practical advice. Pharm Res 21(2):191-200.
15. Food and Drug Administration (FDA) 2004. Guidance for industry: PAT - A frame-
work for innovative pharmaceutical development, manufacturing and quality
assurance.
16. Oetjen GW. 1999. Freeze-Drying. Wiley-VCH.
References 180 17. Pikal MJ, Roy ML, Shah S 1984. Mass and heat transfer in vial freeze-drying of
pharmaceuticals: role of the vial. J Pharm Sci 73(9):1224-1237.
18. Franks F 1992. Freeze-drying: from empiricism to predictability. The significance
of glass transitions. Dev Biol Stand 74:9-18; discussion 19.
19. Korey DJ, Schwartz JB 1989. Effects of excipients on the crystallization of
pharmaceutical compounds during lyophilization. J Parenter Sci Technol
43(2):80-83.
20. Gatlin LA, Nail SL 1994. Protein purification process engineering. Freeze drying:
A practical overview. Bioprocess Technol 18:317-367.
21. Rambhatla S, Obert JP, Luthra S, Bhugra C, Pikal MJ 2005. Cake shrinkage
during freeze drying: a combined experimental and theoretical study. Pharm Dev
Technol 10(1):33-40.
22. Searles JA, Carpenter JF, Randolph TW 2001. The ice nucleation temperature
determines the primary drying rate of lyophilization for samples frozen on a
temperature-controlled shelf. J Pharm Sci 90(7):860-871.
23. Searles JA, Carpenter JF, Randolph TW 2001. Annealing to optimize the primary
drying rate, reduce freezing-induced drying rate heterogeneity, and determine
T(g)' in pharmaceutical lyophilization. J Pharm Sci 90(7):872-887.
24. Jiang G, Akers M, Jain M, Guo J, Distler A, Swift R, Wadhwa MV, Jameel F,
Patro S, Freund E 2007. Mechanistic studies of glass vial breakage for frozen
formulations. I. Vial breakage caused by crystallizable excipient mannitol. PDA J
Pharm Sci Technol 61(6):441-451.
25. Milton N, Gopalrathnam G, Craig GD, Mishra DS, Roy ML, Yu L 2007. Vial
breakage during freeze-drying: crystallization of sodium chloride in sodium
chloride-sucrose frozen aqueous solutions. J Pharm Sci 96(7):1848-1853.
26. Petersen A, Rau G, Glasmacher B 2006. Reduction of primary freeze-drying time
by electric field induced ice nucleus formation. Heat Mass Transfer 42(10):929-
938.
27. Rambhatla S, Ramot R, Bhugra C, Pikal MJ 2004. Heat and mass transfer scale-
up issues during freeze drying: II. Control and characterization of the degree of
supercooling. AAPS PharmSciTech 5(4):e58.
28. Pikal MJ 1985. Use of laboratory data in freeze drying process design: heat and
mass transfer coefficients and the computer simulation of freeze drying. J
Parenter Sci Technol 39(3):115-139.
29. Wagner W, Saul A, Pruss A 1994. International Equations for the Pressure along
the Melting and along the Sublimation Curve of Ordinary Water Substance. J
Phys Chem Ref Data 23(3):515-517.
References 181 30. Tang XC, Nail SL, Pikal MJ 2005. Freeze-drying process design by manometric
temperature measurement: design of a smart freeze-dryer. Pharm Res
22(4):685-700.
31. Pikal MJ 1990. Freeze-drying of proteins. Part I: process design. BioPharm
(3):18-28.
32. Wang DQ, Hey JM, Nail SL 2004. Effect of collapse on the stability of freeze-
dried recombinant factor VIII and alpha-amylase. J Pharm Sci 93(5):1253-1263.
33. Meister E, Gieseler H 2008. Freeze-dry microscopy of protein/sugar mixtures:
Drying behavior, interpretation of collapse temperatures and a comparison to
corresponding glass transition Data. J Pharm Sci. Online First
34. Passot S, Fonseca F, Alarcon-Lorca M, Rolland D, Marin M 2005. Physical
characterisation of formulations for the development of two stable freeze-dried
proteins during both dried and liquid storage. Eur J Pharm Biopharm 60(3):335-
348.
35. Nail SL, Her LM, Proffitt CP, Nail LL 1994. An improved microscope stage for
direct observation of freezing and freeze drying. Pharm Res 11(8):1098-1100.
36. Hawe A, Friess W 2006. Physicochemical characterization of the freezing
behavior of mannitol-human serum albumin formulations. AAPS PharmSciTech
7(4):94.
37. Beirowski J, Gieseler H 2008. Application of DSC and MDSC in the development
of freeze dried pharmaceuticals. Eur Pharm Rev (6):63-70.
38. Craig DQ, Royall PG 1998. The use of modulated temperature DSC for the study
of pharmaceutical systems: potential uses and limitations. Pharm Res
15(8):1152-1153.
39. Pikal MJ, Rigsbee D, Roy ML 2008. Solid state stability of proteins III: calorimetric
(DSC) and spectroscopic (FTIR) characterization of thermal denaturation in
freeze dried human growth hormone (hGH). J Pharm Sci 97(12):5122-5131.
40. Bhugra C, Shmeis R, Krill SL, Pikal MJ 2006. Predictions of onset of
crystallization from experimental relaxation times I-correlation of molecular
mobility from temperatures above the glass transition to temperatures below the
glass transition. Pharm Res 23(10):2277-2290.
41. Knopp SA, Chongprasert S, Nail SL 1998. The relationship between type TMDSC
curve of frozen sucrose solutions and collapse during freeze-drying. Journal of
Thermal Analysis and Calorimetry 54(2):659-672.
42. Meister E 2008 Methodology, Data Interpretation and Practical Transfer of
Freeze-Dry Microscopy Ph.D. Thesis University of Erlangen-Nuremberg
References 182 43. Carpenter JF, Pikal MJ, Chang BS, Randolph TW 1997. Rational design of stable
lyophilized protein formulations: some practical advice. Pharm Res 14(8):969-
975.
44. Chatterjee K, Shalaev EY, Suryanarayanan R 2005. Partially crystalline systems
in lyophilization: II. Withstanding collapse at high primary drying temperatures
and impact on protein activity recovery. J Pharm Sci 94(4):809-820.
45. Pikal MJ, Shah S, Roy ML, Putman R 1990. The secondary drying stage of
freeze drying : drying kinetics as a function of temperature and chamber
pressure. International journal of pharmaceutics 60(3):203-217.
46. Hsu CC, Ward CA, Pearlman R, Nguyen HM, Yeung DA, Curley JG 1992.
Determining the optimum residual moisture in lyophilized protein
pharmaceuticals. Dev Biol Stand 74:255-270; discussion 271.
47. Pikal MJ, Shah S 1997. Intravial distribution of moisture during the secondary
drying stage of freeze drying. PDA J Pharm Sci Technol 51(1):17-24.
48. Breen ED, Curley JG, Overcashier DE, Hsu CC, Shire SJ 2001. Effect of
moisture on the stability of a lyophilized humanized monoclonal antibody
formulation. Pharm Res 18(9):1345-1353.
49. Mascarenhas WJ, Akay HU, Pikal MJ 1997. A computational model for finite
element analysis of the freeze-drying process. Comput Method Appl M 148(1-
2):105-124.
50. Kuu WY, Hardwick LM, Akers MJ 2006. Rapid determination of dry layer mass
transfer resistance for various pharmaceutical formulations during primary drying
using product temperature profiles. Int J Pharm 313(1-2):99-113.
51. Schneid S, Gieseler H 2008. Influence of Concentration and Fill Depth on Product
Resistance of Sucrose During Freeze Drying. The Pharmaceutical Solutions
Update.
52. Pikal MJ, Shah S, Senior D, Lang JE 1983. Physical chemistry of freeze-drying:
measurement of sublimation rates for frozen aqueous solutions by a
microbalance technique. J Pharm Sci 72(6):635-650.
53. Brulls M, Rasmuson A 2002. Heat transfer in vial lyophilization. Int J Pharm
246(1-2):1-16.
54. Kuu WY, Hardwick LM, Akers MJ 2005. Correlation of laboratory and production
freeze drying cycles. Int J Pharm 302(1-2):56-67.
55. Kuu WY, Nail SL, Sacha G 2009. Rapid determination of vial heat transfer
parameters using tunable diode laser absorption spectroscopy (TDLAS) in
response to step-changes in pressure set-point during freeze-drying. J Pharm Sci
98(3):1136-1154.
References 183 56. Essig D, Oschmann R. 2000. Lyophilisation. Mainz: APV
57. Rambhatla S, Pikal MJ 2003. Heat and mass transfer scale-up issues during
freeze-drying, I: atypical radiation and the edge vial effect. AAPS PharmSciTech
4(2):E14.
58. Hottot A, Vessot S, Andrieu J 2005. Determination of mass and heat transfer
parameters during freeze-drying cycles of pharmaceutical products. PDA J
Pharm Sci Technol 59(2):138-153.
59. Schneid S, Gieseler, H., Kessler, W., Pikal, M.J. The determination of a position
dependent vial heat transfer coefficient: a comparison of Tunable Diode Laser
Absorption Spectroscopy and gravimetric measurements. Proc. CPPR Freeze-
Drying of Pharmaceuticals and Biologicals, Garmisch-Partenkirchen (Germany),
2006.
60. Schneid SC, Gieseler H, Kessler WJ, Pikal MJ 2008. Non-invasive product
temperature determination during primary drying using tunable diode laser
absorption spectroscopy. J Pharm Sci. Online First
61. Diggle GE 2001. Thalidomide: 40 years on. Int J Clin Pract 55(9):627-631.
62. Hanna L 1998. Thalidomide's long and winding road. Beta:33-35, 42.
63. Barker LF 1975. Food and Drug Administration regulations and licensure. Fed
Proc 34(6):1522-1524.
64. Levchuk JW 1991. Good manufacturing practices and clinical supplies. J
Parenter Sci Technol 45(3):152-155.
65. Donawa ME 1995. Taking control: the Validation Master Plan. Med Device
Technol 6(10):12-14.
66. Hernandez-Abad PE, Huang J, Romero-Torres S 2009. QbD and PAT: From
Science to Compliance. Eur Pharm Rev 14(4):55-59.
67. Food and Drug Administration (FDA) 2002. Pharmaceutical cGMPs for the 21st
century - A risk based approach.
68. Food and Drug Administration (FDA) 2004. Guidance for industry: PAT - A
Framework for Innovative Pharmaceutical Development, Manufacturing and
Quality Assurance.
69. International Conference on Harmonisation. 2008. Q8 (R1) - Pharmaceutical
Development.
70. International Conference on Harmonization. 2005. Q9 - Quality Risk
Management.
71. International Conference on Harmonisation. 2008. Q10 - Pharmaceutical Quality
Systems.
References 184 72. Winkle HN. Implementing Quality by Design. Proc. PDA/FDA Joint Regulatory
Conference, 2007.
73. Office of Pharmaceutical Sciences (OST). Process Analytical Technology (PAT)
Initiative. Electronic Source, accessed on 07/24/2009
74. Gieseler H, Kramer T, Pikal MJ 2007. Use of manometric temperature
measurement (MTM) and SMART freeze dryer technology for development of an
optimized freeze-drying cycle. J Pharm Sci 96(12):3402-3418.
75. Food and Drug Administration (FDA). 2009. Guide to Inspections of Lyophilization
of Parenterals.
76. Khan MA. Quality by Design and its Application to Freeze Dried Products. Proc.
Freeze-Drying of Pharmaceuticals and Biologicals, Breckenridge, CO, 2008.
77. ASTM, Committee E20. 1993. Manual on the use of thermocouples in
temperature measurement ASTM International. p 290.
78. Omega, Thermoelement Typ T Referenztabelle, Electronic Source
http://www.omega.de/pdf/tc/z207iec.pdf. accessed on 07/12/2009
79. Schneid S, Gieseler H 2008. Evaluation of a New Wireless Temperature Remote
Interrogation System (TEMPRIS) to Measure Product Temperature During
Freeze Drying. AAPS PharmSciTech 9(3):729-239
80. Electronic Source, http://www.virtis.com/category/2846, accessed on 06/18/2009
81. Tang X, Nail SL, Pikal MJ 2006. Evaluation of manometric temperature
measurement, a process analytical technology tool for freeze-drying: part I,
product temperature measurement. AAPS PharmSciTech 7(1):E14.
82. Lesker. Measuring Pressure Technical Notes. Electronic Source
http://www.lesker.com/newweb/Gauges/gauges_technicalnotes_1.cfm accessed
on 06/20/2009
83. Pikal MJ, Patel SM. PAT for Sublimation End Point Detection: A Comparison of
Methods. Proc. AAPS National Biotech Conference, Seattle, 2009.
84. Jousten K 2008. On the gas species dependence of Pirani vacuum gauges.
Journal of Vacuum Science & Technology A 26(3):352-359.
85. Scholl RA. 1987 Thermocouple Vacuum Gauge United States Patent 4,633,717
86. Zettler JF. 1986 Thermocouple Vacuum Gauge United States Patent 4,579,002
87. Roy ML, Pikal MJ 1989. Process control in freeze drying: determination of the
end point of sublimation drying by an electronic moisture sensor. J Parenter Sci
Technol 43(2):60-66.
88. Bardat A, Biguet J, Chatenet E, Courteille F 1993. Moisture measurement: a new
method for monitoring freeze-drying cycles. J Parenter Sci Technol 47(6):293-
299.
References 185 89. Gieseler H 2004 Product Morphology and Drying Behavior delineated by a new
Freeze-Drying Microbalance Ph.D. Thesis University of Erlangen-Nuremberg
90. Neumann KH, Oetjen GW. Meß- und Regelprobleme bei der Gefriertrocknung.
Proc. First Intern Congress on Vacuum Technology, Namur, 1958.
91. Haseley P, Oetjen G. Control of Freeze-Drying Processes Without Sensors in the
Product Including the Determination of the Residual Moisture During the Process.
Proc. PDA International Congress, Philadelphia (PA), 1997.
92. Thompson S, Taylor N 1988 Process and device for determining the end of a
primary stage of freeze drying United States Patent 4780964
93. Jennings TA 1980. Residual gas analysis and vacuum freeze drying. J Parenter
Drug Assoc 34(1):62-69.
94. Leebron KS, Jennings TA 1981. Determination of the vacuum outgassing
properties of elastic closures by mass spectrometry. J Parenter Sci Technol
35(3):100-105.
95. Connelly JP, Welch JV 1993. Monitor lyophilization with mass spectrometer gas
analysis. J Parenter Sci Technol 47(2):70-75.
96. Presser I 2003 Innovative Online Messverfahren zur Optimierung von
Gefriertrocknungsprozessen Ph.D. Thesis LMU München
97. Schneid S, Gieseler H. A New Generation of Battery-Free Wireless Temperature
Probes as an Alternative to Thermocouples for Vial Freeze Drying. Proc. CPPR
Freeze Drying of Pharmaceuticals and Biologicals Conference, Breckenridge,
CO, 2008.
98. Ellab Thermal Validation Solutions. 2007. Product Brochure "TrackSense Pro -
The ultimate solution in wireless thermal sensing".
99. Christ M. 2000 Martin Christ Freeze Dryers GmbH. Manual: Wägesystem CWS
40.
100. Roth C, Winter G, Lee G 2001. Continuous measurement of drying rate of
crystalline and amorphous systems during freeze-drying using an in situ
microbalance technique. J Pharm Sci 90(9):1345-1355.
101. Gieseler H, Lee G 2008. Effects of vial packing density on drying rate during
freeze-drying of carbohydrates or a model protein measured using a vial-
weighing technique. Pharm Res 25(2):302-312.
102. Gieseler H, Lee G 2008. Effect of freeze-dryer design on drying rate of an
amorphous protein-formulation determined with a gravimetric technique. Pharm
Dev Technol 13(6):463-472.
103. Gieseler H, Lee G 2009. Gravimetric measurement of momentary drying rate of
spray freeze-dried powders in vials. J Pharm Sci 98(9):3447-3455.
References 186 104. Barresi AA, Pisano R, Fissore D, Velardi SA, Rasetto V, Vallan A. Monitoring and
control of freeze-drying using innovative software devices. Proc. CPPR Freeze-
Drying of Pharmaceuticals and Biologicals, Breckenridge, CO, 2008.
105. Ciurczak EW 2002. Growth of Near-Infrared Spectroscopy in Pharmaceutical and
Medical Sciences. European Pharmaceutical Review 5(4):68-73.
106. Ciurczak EW 2006. Near-Infrared Spectroscopy: Why It Is Still the Number One
Technique in PAT. European Pharmaceutical Review 3(1):19-21.
107. Bai SJ, Rani M, Suryanarayanan R, Carpenter JF, Nayar R, Manning MC 2004.
Quantification of glycine crystallinity by near-infrared (NIR) spectroscopy. J
Pharm Sci 93(10):2439-2447.
108. Brulls M, Folestad S, Sparen A, Rasmuson A 2003. In-situ near-infrared
spectroscopy monitoring of the lyophilization process. Pharm Res 20(3):494-499.
109. Lin TP, Hsu CC 2002. Determination of residual moisture in lyophilized protein
pharmaceuticals using a rapid and non-invasive method: near infrared
spectroscopy. PDA J Pharm Sci Technol 56(4):196-205.
110. Stokvold A, Dyrstad K, Libnau FO 2002. Sensitive NIRS measurement of
increased moisture in stored hygroscopic freeze dried product. J Pharm Biomed
Anal 28(5):867-873.
111. Wiggenhorn M, Winter G, Presser I 2005. The current state of PAT in freeze-
drying. Eur Pharm Rev 8(1):38-44.
112. Derksen MW, van de Oetelaar PJ, Maris FA 1998. The use of near-infrared
spectroscopy in the efficient prediction of a specification for the residual moisture
content of a freeze-dried product. J Pharm Biomed Anal 17(3):473-480.
113. De Beer TR, Vercruysse P, Burggraeve A, Quinten T, Ouyang J, Zhang X,
Vervaet C, Remon JP, Baeyens WR 2009. In-line and real-time process
monitoring of a freeze drying process using Raman and NIR spectroscopy as
complementary process analytical technology (PAT) tools. J Pharm Sci Online
First
114. De Beer TR, Alleso M, Goethals F, Coppens A, Heyden YV, De Diego HL,
Rantanen J, Verpoort F, Vervaet C, Remon JP, Baeyens WR 2007.
Implementation of a process analytical technology system in a freeze-drying
process using Raman spectroscopy for in-line process monitoring. Anal Chem
79(21):7992-8003.
115. Romero-Torres S, Perez-Ramos JD, Morris KR, Grant ER 2006. Raman
spectroscopy for tablet coating thickness quantification and coating
characterization in the presence of strong fluorescent interference. J Pharm
Biomed Anal 41(3):811-819.
References 187 116. Romero-Torres S, Perez-Ramos JD, Morris KR, Grant ER 2005. Raman
spectroscopic measurement of tablet-to-tablet coating variability. J Pharm
Biomed Anal 38(2):270-274.
117. Romero-Torres S, Wikstrom H, Grant ER, Taylor LS 2007. Monitoring of mannitol
phase behavior during freeze-drying using non-invasive Raman spectroscopy.
PDA J Pharm Sci Technol 61(2):131-145.
118. Riris H, Carlisle CB, Carr LW, Cooper DE, Martinelli RU, Menna RJ 1994. Design
of an open path near-infrared diode laser sensor: application to oxygen, water,
and carbon dioxide vapour detection. Applied Optics 33:7059-7066.
119. Svensson O, Josefson M, Langkilde F 1999. Reaction monitoring using Raman
spectroscopy and chemometrics. Chemom Intell Lab Syst 49:49-66.
120. Milton N, Pikal MJ, Roy ML, Nail SL 1997. Evaluation of manometric temperature
measurement as a method of monitoring product temperature during
lyophilization. PDA J Pharm Sci Technol 51(1):7-16.
121. Tang XC, Nail SL, Pikal MJ 2006. Evaluation of manometric temperature
measurement (MTM), a process analytical technology tool in freeze drying, part
III: heat and mass transfer measurement. AAPS PharmSciTech 7(4):97.
122. Tang XC, Nail SL, Pikal MJ 2006. Evaluation of manometric temperature
measurement, a process analytical technology tool for freeze-drying: part II
measurement of dry-layer resistance. AAPS PharmSciTech 7(4):93.
123. Schneid S, Gieseler H. PAT in Freeze-Drying: The Concept of the "SMART
Freeze-Dryer". Proc. Freeze Drying Technology Seminar Series, Mumbai, India,
2008.
124. Tang X 2003 Critical Engineering and Chemical Problems in Freeze Drying
Process Design Ph.D. Thesis University of Connecticut
125. Chouvenc P, Vessot S, Andrieu J, Vacus P 2004. Optimization of the freeze-
drying cycle: A new model for pressure rise analysis. Dry Technol 22(7):1577-
1601.
126. Chouvenc P, Vessot S, Andrieu J, Vacus P 2005. Optimization of the freeze-
drying cycle: adaptation of the pressure rise analysis model to non-instantaneous
isolation valves. PDA J Pharm Sci Technol 59(5):298-309.
127. Chouvenc P, Vessot S, Andrieu J, Vacus P. Optimization of pharmaceuticals
freeze-drying cycles: characterization of annealing effects by the pressure rise
analysis method. Proc. 14th International Drying Symposium, Sao Paulo, 2004.
128. Oetjen GW, Haseley P, Klutsch H, Leineweber M. 2000 Method for controlling a
freeze drying process United States Patent 6163979
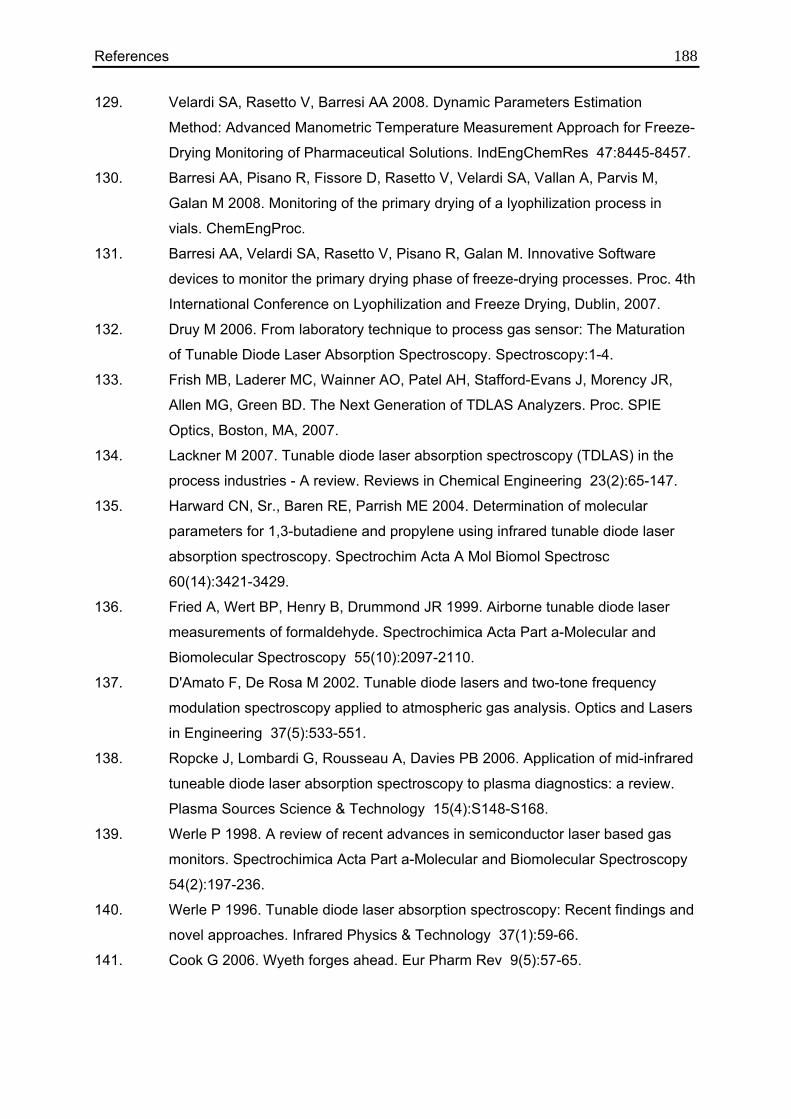
References 188 129. Velardi SA, Rasetto V, Barresi AA 2008. Dynamic Parameters Estimation
Method: Advanced Manometric Temperature Measurement Approach for Freeze-
Drying Monitoring of Pharmaceutical Solutions. IndEngChemRes 47:8445-8457.
130. Barresi AA, Pisano R, Fissore D, Rasetto V, Velardi SA, Vallan A, Parvis M,
Galan M 2008. Monitoring of the primary drying of a lyophilization process in
vials. ChemEngProc.
131. Barresi AA, Velardi SA, Rasetto V, Pisano R, Galan M. Innovative Software
devices to monitor the primary drying phase of freeze-drying processes. Proc. 4th
International Conference on Lyophilization and Freeze Drying, Dublin, 2007.
132. Druy M 2006. From laboratory technique to process gas sensor: The Maturation
of Tunable Diode Laser Absorption Spectroscopy. Spectroscopy:1-4.
133. Frish MB, Laderer MC, Wainner AO, Patel AH, Stafford-Evans J, Morency JR,
Allen MG, Green BD. The Next Generation of TDLAS Analyzers. Proc. SPIE
Optics, Boston, MA, 2007.
134. Lackner M 2007. Tunable diode laser absorption spectroscopy (TDLAS) in the
process industries - A review. Reviews in Chemical Engineering 23(2):65-147.
135. Harward CN, Sr., Baren RE, Parrish ME 2004. Determination of molecular
parameters for 1,3-butadiene and propylene using infrared tunable diode laser
absorption spectroscopy. Spectrochim Acta A Mol Biomol Spectrosc
60(14):3421-3429.
136. Fried A, Wert BP, Henry B, Drummond JR 1999. Airborne tunable diode laser
measurements of formaldehyde. Spectrochimica Acta Part a-Molecular and
Biomolecular Spectroscopy 55(10):2097-2110.
137. D'Amato F, De Rosa M 2002. Tunable diode lasers and two-tone frequency
modulation spectroscopy applied to atmospheric gas analysis. Optics and Lasers
in Engineering 37(5):533-551.
138. Ropcke J, Lombardi G, Rousseau A, Davies PB 2006. Application of mid-infrared
tuneable diode laser absorption spectroscopy to plasma diagnostics: a review.
Plasma Sources Science & Technology 15(4):S148-S168.
139. Werle P 1998. A review of recent advances in semiconductor laser based gas
monitors. Spectrochimica Acta Part a-Molecular and Biomolecular Spectroscopy
54(2):197-236.
140. Werle P 1996. Tunable diode laser absorption spectroscopy: Recent findings and
novel approaches. Infrared Physics & Technology 37(1):59-66.
141. Cook G 2006. Wyeth forges ahead. Eur Pharm Rev 9(5):57-65.
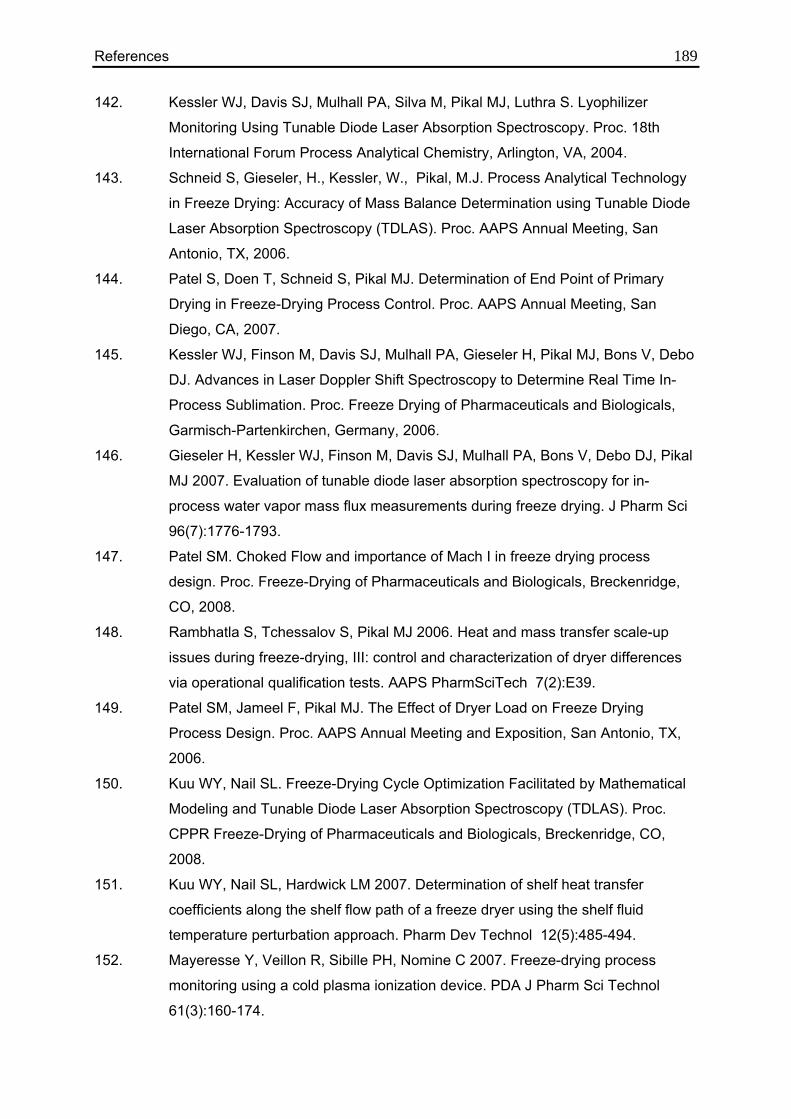
References 189 142. Kessler WJ, Davis SJ, Mulhall PA, Silva M, Pikal MJ, Luthra S. Lyophilizer
Monitoring Using Tunable Diode Laser Absorption Spectroscopy. Proc. 18th
International Forum Process Analytical Chemistry, Arlington, VA, 2004.
143. Schneid S, Gieseler, H., Kessler, W., Pikal, M.J. Process Analytical Technology
in Freeze Drying: Accuracy of Mass Balance Determination using Tunable Diode
Laser Absorption Spectroscopy (TDLAS). Proc. AAPS Annual Meeting, San
Antonio, TX, 2006.
144. Patel S, Doen T, Schneid S, Pikal MJ. Determination of End Point of Primary
Drying in Freeze-Drying Process Control. Proc. AAPS Annual Meeting, San
Diego, CA, 2007.
145. Kessler WJ, Finson M, Davis SJ, Mulhall PA, Gieseler H, Pikal MJ, Bons V, Debo
DJ. Advances in Laser Doppler Shift Spectroscopy to Determine Real Time In-
Process Sublimation. Proc. Freeze Drying of Pharmaceuticals and Biologicals,
Garmisch-Partenkirchen, Germany, 2006.
146. Gieseler H, Kessler WJ, Finson M, Davis SJ, Mulhall PA, Bons V, Debo DJ, Pikal
MJ 2007. Evaluation of tunable diode laser absorption spectroscopy for in-
process water vapor mass flux measurements during freeze drying. J Pharm Sci
96(7):1776-1793.
147. Patel SM. Choked Flow and importance of Mach I in freeze drying process
design. Proc. Freeze-Drying of Pharmaceuticals and Biologicals, Breckenridge,
CO, 2008.
148. Rambhatla S, Tchessalov S, Pikal MJ 2006. Heat and mass transfer scale-up
issues during freeze-drying, III: control and characterization of dryer differences
via operational qualification tests. AAPS PharmSciTech 7(2):E39.
149. Patel SM, Jameel F, Pikal MJ. The Effect of Dryer Load on Freeze Drying
Process Design. Proc. AAPS Annual Meeting and Exposition, San Antonio, TX,
2006.
150. Kuu WY, Nail SL. Freeze-Drying Cycle Optimization Facilitated by Mathematical
Modeling and Tunable Diode Laser Absorption Spectroscopy (TDLAS). Proc.
CPPR Freeze-Drying of Pharmaceuticals and Biologicals, Breckenridge, CO,
2008.
151. Kuu WY, Nail SL, Hardwick LM 2007. Determination of shelf heat transfer
coefficients along the shelf flow path of a freeze dryer using the shelf fluid
temperature perturbation approach. Pharm Dev Technol 12(5):485-494.
152. Mayeresse Y, Veillon R, Sibille PH, Nomine C 2007. Freeze-drying process
monitoring using a cold plasma ionization device. PDA J Pharm Sci Technol
61(3):160-174.
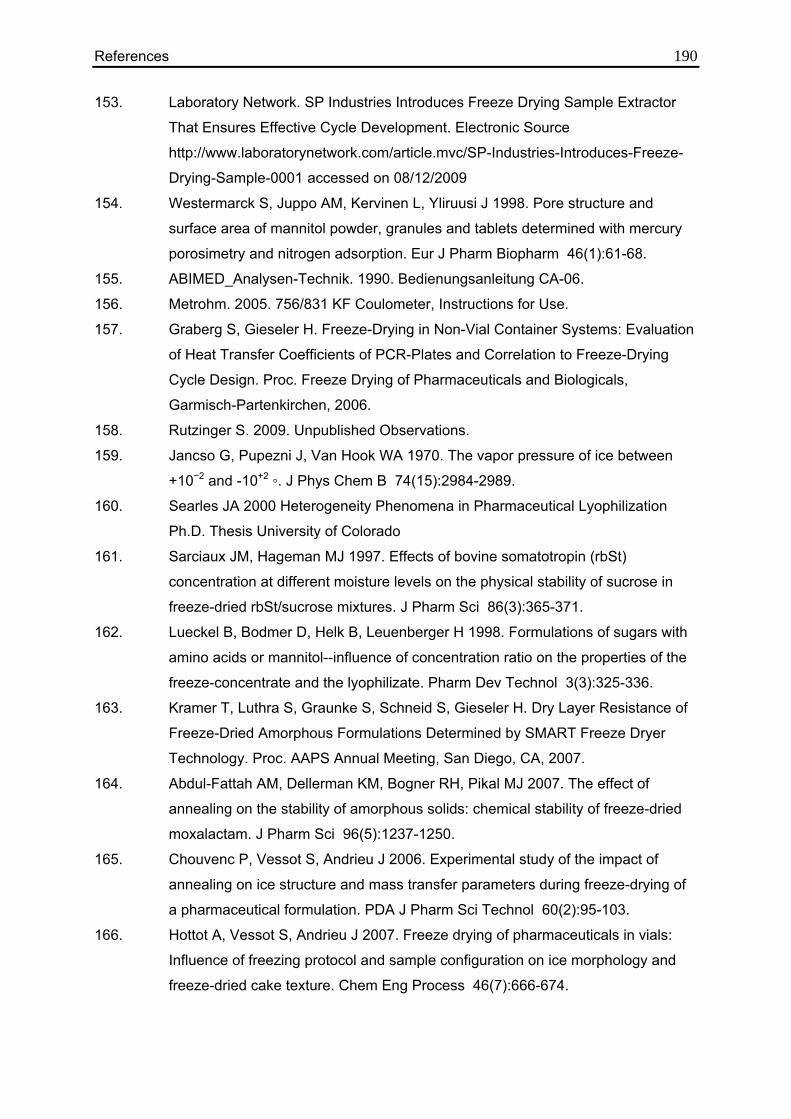
References 190 153. Laboratory Network. SP Industries Introduces Freeze Drying Sample Extractor
That Ensures Effective Cycle Development. Electronic Source
http://www.laboratorynetwork.com/article.mvc/SP-Industries-Introduces-Freeze-
Drying-Sample-0001 accessed on 08/12/2009
154. Westermarck S, Juppo AM, Kervinen L, Yliruusi J 1998. Pore structure and
surface area of mannitol powder, granules and tablets determined with mercury
porosimetry and nitrogen adsorption. Eur J Pharm Biopharm 46(1):61-68.
155. ABIMED_Analysen-Technik. 1990. Bedienungsanleitung CA-06.
156. Metrohm. 2005. 756/831 KF Coulometer, Instructions for Use.
157. Graberg S, Gieseler H. Freeze-Drying in Non-Vial Container Systems: Evaluation
of Heat Transfer Coefficients of PCR-Plates and Correlation to Freeze-Drying
Cycle Design. Proc. Freeze Drying of Pharmaceuticals and Biologicals,
Garmisch-Partenkirchen, 2006.
158. Rutzinger S. 2009. Unpublished Observations.
159. Jancso G, Pupezni J, Van Hook WA 1970. The vapor pressure of ice between
+10−2 and -10+2 . J Phys Chem B 74(15):2984-2989.
160. Searles JA 2000 Heterogeneity Phenomena in Pharmaceutical Lyophilization
Ph.D. Thesis University of Colorado
161. Sarciaux JM, Hageman MJ 1997. Effects of bovine somatotropin (rbSt)
concentration at different moisture levels on the physical stability of sucrose in
freeze-dried rbSt/sucrose mixtures. J Pharm Sci 86(3):365-371.
162. Lueckel B, Bodmer D, Helk B, Leuenberger H 1998. Formulations of sugars with
amino acids or mannitol--influence of concentration ratio on the properties of the
freeze-concentrate and the lyophilizate. Pharm Dev Technol 3(3):325-336.
163. Kramer T, Luthra S, Graunke S, Schneid S, Gieseler H. Dry Layer Resistance of
Freeze-Dried Amorphous Formulations Determined by SMART Freeze Dryer
Technology. Proc. AAPS Annual Meeting, San Diego, CA, 2007.
164. Abdul-Fattah AM, Dellerman KM, Bogner RH, Pikal MJ 2007. The effect of
annealing on the stability of amorphous solids: chemical stability of freeze-dried
moxalactam. J Pharm Sci 96(5):1237-1250.
165. Chouvenc P, Vessot S, Andrieu J 2006. Experimental study of the impact of
annealing on ice structure and mass transfer parameters during freeze-drying of
a pharmaceutical formulation. PDA J Pharm Sci Technol 60(2):95-103.
166. Hottot A, Vessot S, Andrieu J 2007. Freeze drying of pharmaceuticals in vials:
Influence of freezing protocol and sample configuration on ice morphology and
freeze-dried cake texture. Chem Eng Process 46(7):666-674.
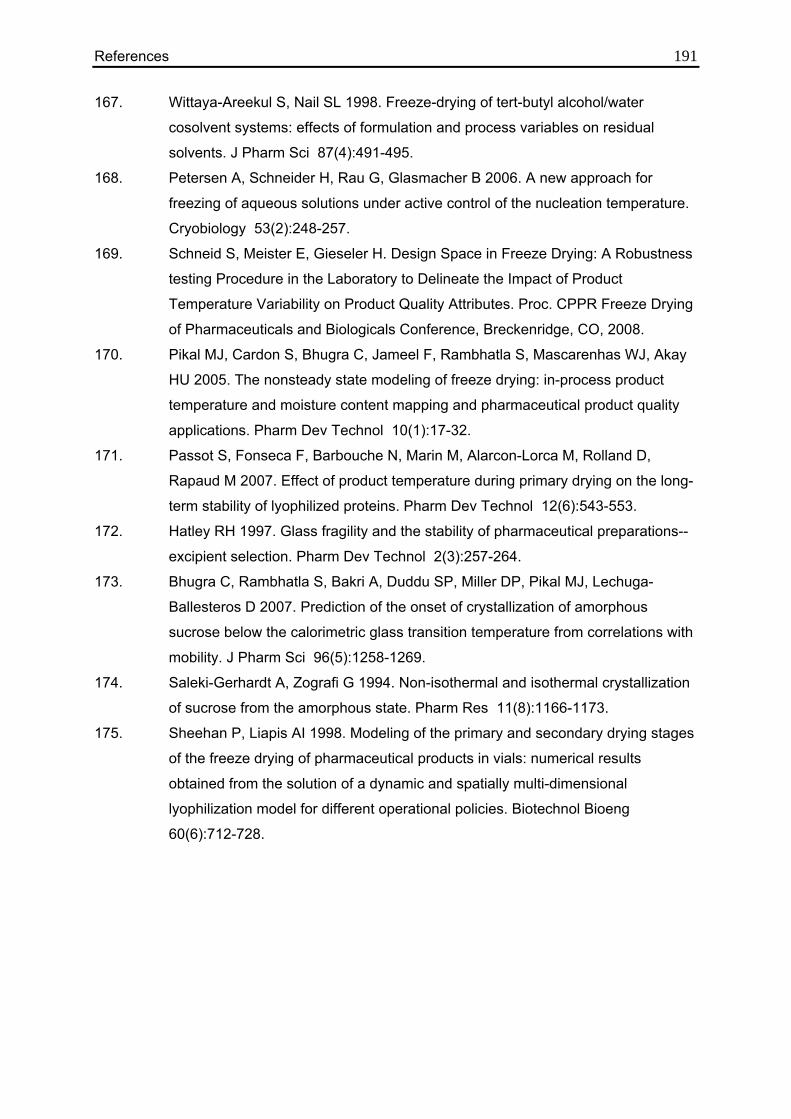
References 191 167. Wittaya-Areekul S, Nail SL 1998. Freeze-drying of tert-butyl alcohol/water
cosolvent systems: effects of formulation and process variables on residual
solvents. J Pharm Sci 87(4):491-495.
168. Petersen A, Schneider H, Rau G, Glasmacher B 2006. A new approach for
freezing of aqueous solutions under active control of the nucleation temperature.
Cryobiology 53(2):248-257.
169. Schneid S, Meister E, Gieseler H. Design Space in Freeze Drying: A Robustness
testing Procedure in the Laboratory to Delineate the Impact of Product
Temperature Variability on Product Quality Attributes. Proc. CPPR Freeze Drying
of Pharmaceuticals and Biologicals Conference, Breckenridge, CO, 2008.
170. Pikal MJ, Cardon S, Bhugra C, Jameel F, Rambhatla S, Mascarenhas WJ, Akay
HU 2005. The nonsteady state modeling of freeze drying: in-process product
temperature and moisture content mapping and pharmaceutical product quality
applications. Pharm Dev Technol 10(1):17-32.
171. Passot S, Fonseca F, Barbouche N, Marin M, Alarcon-Lorca M, Rolland D,
Rapaud M 2007. Effect of product temperature during primary drying on the long-
term stability of lyophilized proteins. Pharm Dev Technol 12(6):543-553.
172. Hatley RH 1997. Glass fragility and the stability of pharmaceutical preparations--
excipient selection. Pharm Dev Technol 2(3):257-264.
173. Bhugra C, Rambhatla S, Bakri A, Duddu SP, Miller DP, Pikal MJ, Lechuga-
Ballesteros D 2007. Prediction of the onset of crystallization of amorphous
sucrose below the calorimetric glass transition temperature from correlations with
mobility. J Pharm Sci 96(5):1258-1269.
174. Saleki-Gerhardt A, Zografi G 1994. Non-isothermal and isothermal crystallization
of sucrose from the amorphous state. Pharm Res 11(8):1166-1173.
175. Sheehan P, Liapis AI 1998. Modeling of the primary and secondary drying stages
of the freeze drying of pharmaceutical products in vials: numerical results
obtained from the solution of a dynamic and spatially multi-dimensional
lyophilization model for different operational policies. Biotechnol Bioeng
60(6):712-728.

References 192
Curriculum Vitae 193
7. Curriculum Vitae
Personal Data Name Stefan Christian Schneid
Date of Birth March 27, 1980 in Munich (Germany)
Marital Status Single
Nationality German
Education
Apr 2006 – Present Friedrich-Alexander-University Erlangen, Germany and
University of Connecticut, USA: Ph. D. studies in
Pharmaceutics under supervision of Dr. H. Gieseler,
Prof. Dr. M.J. Pikal, and Prof. Dr. G. Lee
Mar 2006 Passed Licensing Exam as German Pharmacist
Oct 2000 - Oct 2004 Ludwig-Maximilians-Universität, Munich (LMU), Germany
Studies of Pharmacy
Sep 1990 - Jul 1999 Gymnasium Vaterstetten, Germany
Professional Experience
Dec 2005 - Mar 2006 St. Konrad Pharmacy, Haar, Germany
May 2005 - Oct 2005 Nova Southeastern University, Ft. Lauderdale, Florida, USA
Visiting research student at the College of Pharmacy
Nov 2004 - Apr 2005 St. Konrad Apotheke, Haar, Germany
Internship at a community pharmacy
Jul 2002 - Sep 2002 Ludwig-Maximilians-Universität, Munich (LMU), Germany
Mar 2002 Scientific student assistant at the Department of
Pharmaceutical Chemistry
Community Service
Sep 1999 - Jul 2000 Bezirkskrankenhaus Haar, Germany