Irina Wietek - OPUS Würzburg | HOME · eliciting antigen, bound to a groove in a class I or a...
159
Human Interleukin-4 binding protein epitope involved in high-affinity binding of Interleukin-4: Molecular analysis and characterisation Dissertation zur Erlangung des naturwissenschaftlichen Doktorgrades der Bayerischen Julius-Maximilians-Universität Würzburg vorgelegt von Irina Wietek aus Sofia, Bulgarien Würzburg, Juli 2001
Transcript of Irina Wietek - OPUS Würzburg | HOME · eliciting antigen, bound to a groove in a class I or a...
Human Interleukin-4 binding protein epitope involved in high-affinity
binding of Interleukin-4: Molecular analysis and characterisation
Dissertation zur Erlangung des
naturwissenschaftlichen Doktorgrades
der Bayerischen Julius-Maximilians-Universität Würzburg
vorgelegt von
Irina Wietek
aus
Sofia, Bulgarien
Würzburg, Juli 2001
Eingereicht am: 23. Juli 2001 Mitglieder der Promotionskommission: ................................................................................. Vorsitzender: ........................................................................................................................... Gutachter: Prof. Dr. Walter Sebald Gutachter: Prof. Dr. Erich Buchner Tag des Promotionskolloquiums: ........................................................................................... Doktorurkunde ausgehändigt am: .....................................

______________________________________________________________________ Contents
Contents
1 INTRODUCTION...........................................................................................................4
2. MATERIALS AND METHODS...................................................................................22
2.1 Abbreviations..........................................................................................................................22
2.2 Chemicals and Enzymes ........................................................................................................25
2.3 Bacterial Strains .....................................................................................................................25
2.4 Cell Lines.................................................................................................................................25
2.5 Antibodies ...............................................................................................................................26
2.6 Vectors and Oligonucleotides................................................................................................26 2.6.1 Expression Vector for E.coli .............................................................................................26 2.6.2 Baculovirus Transfer Vector pAcGP67-B ........................................................................26 2.6.3 Oligonucleotides ...............................................................................................................26
2.7 Microbiological Methods .......................................................................................................28 2.7.1 Sterilization .......................................................................................................................28 2.7.2 Culture Media....................................................................................................................29 2.7.3 Culturing of Bacteria.........................................................................................................29 2.7.4 Electrocompetent E.coli ....................................................................................................30
2.7.4.1 Preparation of electrocompetent bacterial cells ........................................................30 2.7.4.2 Electrotransformation of competent E.coli...............................................................30
2.7.5 Storage of Bacterial Cultures ............................................................................................30
2.8 Molecular Biological Methods ..............................................................................................31 2.8.1 Determination of the Concentration of Nucleic Acids......................................................31 2.8.2 Phenol Extraction of DNA................................................................................................31 2.8.3 Ethanol Precipitation of DNA...........................................................................................31 2.8.4 DNA Molecular Standards................................................................................................32 2.8.5 DNA Agarose Gel Electrophoresis ...................................................................................32 2.8.6 Purification of DNA by Agarose Gel Electrophoresis ......................................................33 2.8.7 Site-directed Mutagenesis by PCR....................................................................................33 2.8.8 Site-directed Mutagenesis Using DNA Cassettes .............................................................35 2.8.9 Digestion of DNA .............................................................................................................35 2.8.10 Ligation of DNA .............................................................................................................36 2.8.11 Preparation of Plasmid DNA ..........................................................................................36
2.8.11.1 Lysozyme-alkaline-lysis procedure ........................................................................36 2.8.11.2 PEG precipitation procedure...................................................................................37 2.8.11.3 Preparation of plasmid DNA with LiCl..................................................................38
2.8.12 DNA Sequencing ............................................................................................................39
2.9 Protein Chemical Methods ....................................................................................................39 2.9.1 Determination of the Protein Concentration .....................................................................39 2.9.2 Lyophilization of Proteins.................................................................................................40 2.9.3 Molecular Weight Standard for Protein Samples..............................................................40
1

______________________________________________________________________ Contents
2.9.4 SDS - Polyacrylamide Gel Electrophoresis ......................................................................40 2.9.5 Concentration of Protein Samples by TCA.......................................................................41 2.9.6 Biotinylation of Proteins ...................................................................................................42
2.10 Immunological methods - Western Blot.............................................................................42 2.10.1 Transfer of Proteins to a Nitrocellulose Membrane........................................................42 2.10.2 Detection of Western Blots by a Peroxidase Coupled Antibody ....................................43
2.11 Expression of Recombinant Proteins in E.coli ..................................................................44 2.11.1 Temperature Induced Protein Expression .......................................................................44 2.11.2 Preparation of Inclusion Bodies ......................................................................................45 2.11.3 Denaturation and Renaturation of Proteins .....................................................................45
2.12 Expression of Recombinant Proteins in SF9 cells .............................................................46 2.12.1 General Handling Techniques.........................................................................................46
2.12.1.1 Insect cell culture media .........................................................................................46 2.12.1.2 Cultivation of Sf9 cells ...........................................................................................46 2.12.1.3 Staining and counting of Sf9 cells ..........................................................................47 2.12.1.4 Long-term cell storage............................................................................................47 2.12.1.5 Monolayer culture...................................................................................................48 2.12.1.6 Suspension culture ..................................................................................................48
2.12.2 Generation of Recombinant Baculoviruses.....................................................................49 2.12.2.1 The Baculovirus expression system........................................................................49 2.12.2.2 Co-transfection of BaculoGold DNA and a transfer vector into insect cells .........49 2.12.2.3 Generating pure virus stocks by plaque purification ..............................................51
2.12.3 Amplification of Virus Stocks ........................................................................................52 2.12.3.1 Virus amplification from a single virus plaque ......................................................52 2.12.3.2 Virus amplification in a small volume scale...........................................................53 2.12.3.3 Virus amplification in a large volume scale ...........................................................53 2.12.3.4 Determination of virus titer by plaque assay ..........................................................53 2.12.3.5 Virus storage...........................................................................................................54 2.12.4 Protein Expression .....................................................................................................54
2.13 Purification of Recombinant Proteins................................................................................55 2.13.1 Purification of Proteins Expressed in E.coli ...................................................................55
2.13.1.1 Protein purification by ion exchange chromatography...........................................55 2.13.1.2 Protein purification by RP-HPLC...........................................................................55
2.13.2 Purification of Proteins Expressed in Sf9 Cells ..............................................................57 2.13.2.1 Affinity chromatography using IL-4 as a ligand ....................................................57 2.13.2.2 Affinity chromatography using X14/38 as a ligand ...............................................57 2.13.2.3 Dialysis ...................................................................................................................58 2.13.2.4 Concentration of proteins by ultrafiltration ............................................................58
2.14 Analysis of Protein-Protein Interactions by BIAcore Technology ..................................59 2.14.1 Immobilization of Proteins by Streptavidin-Biotin Coupling.........................................60 2.14.2 Measuring and Evaluation of Protein-Protein Interactions.............................................60 2.14.3 Assessment of the Energetic Effects of Introduced Mutations .......................................61
3. RESULTS ..................................................................................................................62
3.1 Preparation of Recombinant IL-4BP and Its Variants ......................................................62 3.1.1 Cloning of IL-4BP and Its Variants in the Baculovirus Transfer Vector pAcGP67B ......64
2

______________________________________________________________________ Contents
3.1.2 Co-transfection into SF9 Insect Cells and Amplification of the Recombinant Virus.......68 3.1.3 Expression and Purification of Recombinant IL-4BP and Its Variants ............................69
3.1.3.1 Purification of IL-4BP and its variants by IL-4 affinity column ..............................69 3.1.3.2 Purification of IL-4BP variants through Antibody column......................................74
3.1.4 Biotinylation of IL-4BP Recombinant Variants ...............................................................77
3.2 Preparation of Recombinant IL-4 Variants ........................................................................78 3.2.1 Cloning of IL-4 Mutant Variants ......................................................................................78 3.2.2 Expression and Purification of IL-4 Variants ...................................................................81
3.3 Kinetic Analysis of the Interaction of IL-4 with the IL-4BP Variants Using BIAcore Technology.............................................................................................................................84
3.3.1 Immobilization of the Biotinylated IL-4BP and its Variants on the Sensor Chips ...........84 3.3.2 Kinetics of the Interaction of IL-4 and IL-4BP.................................................................87 3.3.3 Effects of Site-Specific Perturbations in IL-4BP on the Interaction with IL-4.................89
3.3.3.1 Kinetics of the binding of IL-4 to the alanine variants of IL-4BP............................89 3.3.3.2 Thermodynamic aspects of the interaction between IL-4 and the IL-4BP variants
included in the alanine scanning mutagenesis........................................................99 3.3.3.3 Analysis of the binding of IL-4 to the IL-4BP tyrosine variants............................103
3.3.4 Analysis of IL-4BP Double Mutants...............................................................................105
3.4 Biosensor Analysis of the Kinetics of Binding of IL-4 Variants to the IL-4BP..............110
4. DISCUSSION...........................................................................................................112
4.1 Structural Features and Binding Site of Human IL-4BP.................................................112
4.2 Defining Functional Important Residues from The Interface of Human IL-4BP for the Interaction with IL-4 ..........................................................................................................116
4.3 Additivity and Cooperativity in the Functional Epitope of IL-4BP................................124
4.4 Comparison of the Structural and the Functional IL-4BP Epitopes ..............................126
4.5 Complementarity between the Functional Epitopes of Human IL-4 and IL-4BP .........129
4.6 Comparison of the IL-4BP Functional Epitope to Other Cytokine Receptors ..............131
5. SUMMARY...............................................................................................................135
6. LITERATURE...........................................................................................................137
7. APPENDICES..........................................................................................................146
ACKNOWLEDGEMENTS............................................................................................155
LEBENSLAUF .............................................................................................................156
ERKLÄRUNG ..............................................................................................................157
3

_________________________________________________________________1. Introduction
1 Introduction
The immune system is a remarkably adaptive defense system that has evolved in vertebrates to
protect them from invading pathogens and cancer. It is able to generate an enormous variety of
cells and molecules capable of specifically recognizing and eliminating an apparently limitless
variety of foreign invaders. These cells and molecules act together in an exquisitely adaptable,
dynamic and complex network.
Immunity has both non-specific and specific components, which work in a synchronized manner
that provides an effective biological defense. Innate, or non-specific immunity refers to the basic
resistance to disease that comprises four types of defensive barriers: anatomic, physiologic,
endocytic and phagocytic, and inflammatory. Acquired, or specific, immunity reflects the
presence of a functional immune system that is capable of specific and selective immune
responses: humoral and cell-mediated. Generation of an effective humoral immune response
requires cell interactions between macrophages, TH cells and B cells leading to the production of
large numbers of antibody molecules specific for a foreign pathogen. The cell-mediated
immunity is characterized by the generation of various effector immune cells: CD4+ and CD8+ T
lymphocytes (antigen-specific), macrophages, neutrophils, eosinophils and natural killer cells
(antigen-non-specific). Unlike the humoral branch of the immune system, which serves mainly to
eliminate extracellular bacteria and their products, the cell-mediated immunity is responsible for
the clearance of intracellular pathogens, virus-infected cells, tumor cells and foreign grafts
(Kuby, 1994).
The large number of distinct cell types which are involved in the immune responses and their
functions must be coordinated to insure a response that is appropriate in quality and in magnitude
to the eliciting antigenic stimulus. A central role in this regulation and co-ordination of functions
has the action of T lymphocytes, whose receptors are specific for peptides derived from the
eliciting antigen, bound to a groove in a class I or a class II MHC molecules. Much of their
function is mediated by a set of small proteins whose expression, secretion, or both is induced as
a result of antigen-stimulated cellular activation. These proteins, designated cytokines, act by
binding to high-affinity receptors expressed on target cells and by inducing biochemical signals
within those cells that profoundly affect their behavior.
4
_________________________________________________________________1. Introduction
Cytokines are a diverse group of proteins, which can be subdivided into several families,
including the haematopoietins, the interferons, tumor necrosis factor (TNF)-related molecules,
immunoglobulin super-family members, and the chemokines (Paul & Seder, 1994). Among these
molecules substantial overlap in functions is observed. These pleiotropic mediators act
synergistically or antagonistically to orchestrate the behavior, proliferation and death of cells,
acting directly or by regulating the expression of other cytokines. A paradigm of cytokine biology
arises from the regulation of the differentiation of naive T cells. Among cloned lines of CD4+ T
cells, two major subsets (TH1 and TH2) have been identified, which have shown a great degree of
polarization in their cytokine-producing phenotype (Romagnani, 1991). TH1 clones tend to
produce IL-2, IFNγ and TNFβ as their unique products, while TH2 clones express IL-4, IL-5, IL-6,
IL-10 and IL-13. TH1 and TH2 cells develop from precursors of T helper cells (pTH), which are bi-
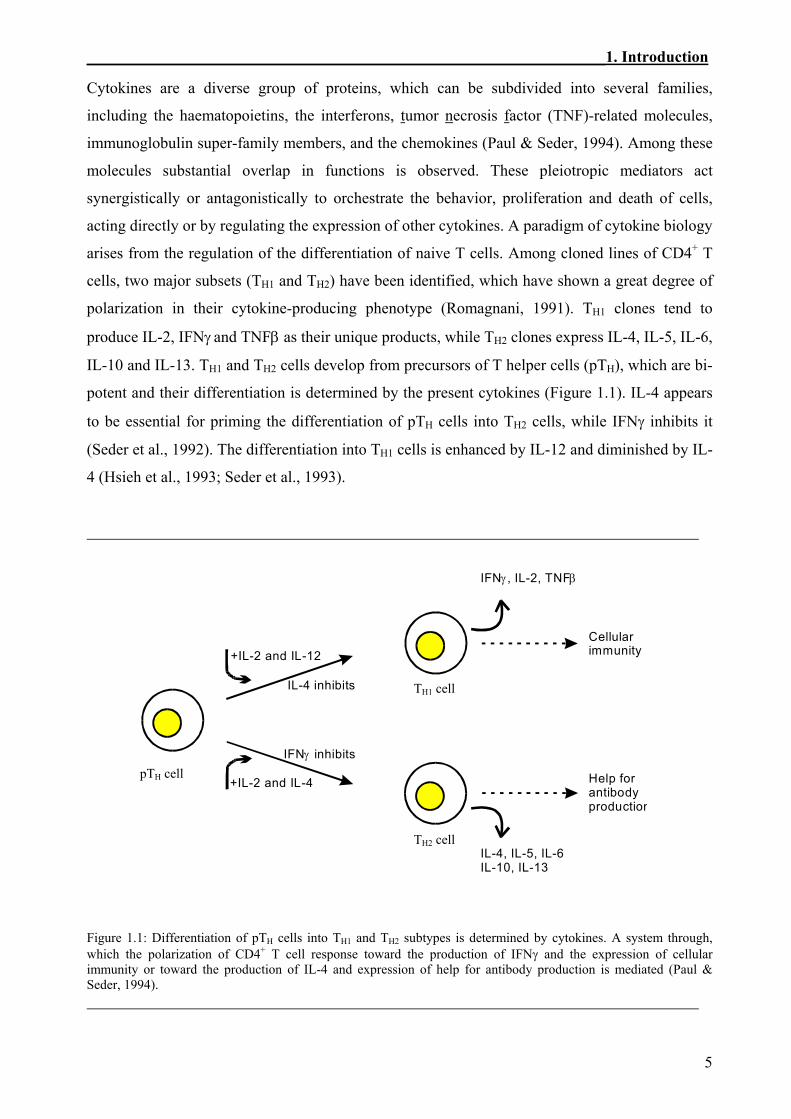
potent and their differentiation is determined by the present cytokines (Figure 1.1). IL-4 appears
to be essential for priming the differentiation of pTH cells into TH2 cells, while IFNγ inhibits it
(Seder et al., 1992). The differentiation into TH1 cells is enhanced by IL-12 and diminished by IL-
4 (Hsieh et al., 1993; Seder et al., 1993).
+IL-2 and IL-4
+IL-2 and IL-12
IFN , IL-2, TNFγ β
IL-4, IL-5, IL-6IL-10, IL-13
Cellularimmunity
Help for antibodyproduction
IL-4 inhibits
IFN inhibitsγ
TH2 cell
TH1 cell
pTH cell
Figure 1.1: Differentiation of pTH cells into TH1 and TH2 subtypes is determined by cytokines. A system through, which the polarization of CD4+ T cell response toward the production of IFNγ and the expression of cellular immunity or toward the production of IL-4 and expression of help for antibody production is mediated (Paul & Seder, 1994).
5

_________________________________________________________________1. Introduction
Interleukin-4 (IL-4) belongs to the haematopoietin family of cytokines. It was initially described
in 1982 and first designated B-cell growth factor (Howard et al., 1982). IL-4 is produced by TH2
cells (Figure 1.1), basophils and mast cells in response to receptor-mediated activation events
(Seder & Paul, 1994). A specialized subset of T cells, some of which express NK1.1 and appear
to be specific for CD-1 (NK T cells), has been also shown to produce IL-4 (Yoshimoto & Paul,
1994; Chen & Paul, 1997). Eosinophils have also been reported to be capable of producing IL-4
(Dubucquoi et al., 1994).
Among the cytokine family, IL-4 is one that displays a wide range of biological effects on
numerous cell types. These effects are either direct or indirect through the modulation of
secretion of other cytokines. As mentioned above, IL-4 plays a central role in regulating the
differentiation of antigen stimulated naive T cells into TH1 or TH2 subtypes and determines the
kind of the following immune response (McKenzie, 2000).
A second function of major physiologic importance is IL-4´s control of specificity of
immunoglobulin class switching. IL-4 determines that human B cells switch to the expression of
IgE and IgG4 and mouse B cells to IgE and IgG1 (Gascan et al., 1991; Coffman et al., 1986).
This switching function is antagonized by IFNγ. Similarly, IL-4 inhibits the production of IgG2a
in B cells treated with IFNγ (Pene et al, 1988). Thus, the control of production of this two
cytokines is a key element in the qualitative nature of immune responses. Indeed, in IL-4 and IL-
4 receptor α (IL-4Rα) deficient mice the serum levels of IgE and IgG1 are strongly reduced
(Kopf et al., 1993; Kuehn et al., 1991; Noben-Trauth et al., 1997). Taken together, these facts
have established an important role of IL-4 in Ig isotype selection in vitro and in vivo.
IL-4 has a variety of other effects in cells of the immune system. It is involved in activation and
proliferation of T and B cells (Nicola, 1994; Rebollo et al, 1996; Friedrich & Wietek, 2001). In
resting B cells IL-4 increases the expression of class II MHC molecules (Noelle et al., 1984),
enhances expression of CD23 (Defrance et al., 1987), up-regulates the expression of the IL-4
receptor (Ohara & Paul, 1988), and in association with lipopolysaccharide allows B cells to
express Thy1 (Snapper et al., 1988). It also acts as a co-mitogen for B cell growth (Howard et al.,
1982). Although not a growth factor by itself for resting lymphocytes, it can substantially prolong
the lives of T and B lymphocytes in culture (Hu-Li et al., 1987). IL-4 also has activity as a
stimulant of IL-3-mediated mast cell growth. IL-4 acts on macrophages to inhibit the release of
proinflammatory molecules such as TNF, IL-1, IL-8 and other cytokines (Nicola & Hilton, 1999).
IL-4 also has an important role in tissue adhesion and inflammation. It acts with TNF to induce
expression of vascular cell adhesion molecule-1 on vascular endothelial cells (Thornhill et al.,
1991) and it down-regulates the expression of E-selectin (Bennett et al., 1997). This shift in
6

_________________________________________________________________1. Introduction
balance of expression of adhesion molecules by IL-4 is thought to favor the recruitment of T cells
and eosinophils, rather than granulocytes, to the side of inflammation.
Many cell types respond to IL-4, including some without apparent connection to haematopoiesis
or to the immune system, e.g. osteoblats, keratinocytes, or fibroblasts (Duschl & Sebald, 1996).
IL-4 acts as a chemotactic factor for fibroblasts and induces dermal fibroblasts to secrete
extracellular matrix proteins, such as type I and type III colagens and fibronectin (Chomarat &
Banchereau, 1997). Although the mechanism remains unclear, IL-4 has been observed to enhance
the killing of tumor cells in vivo (Tepper & Mule, 1994).
Studies with transgenic mice have revealed that over-expression of IL-4 results not only in high
serum IgE levels, but also in inflammatory lesions, which severity and frequency directly
correlates with the level of transgenically expressed IL-4. These lesions histologically resemble
those seen in human allergic disorders suggesting the importance of IL-4 in the pathogenesis of
allergic diseases (Tepper et al., 1990). The pathophysiological features of allergic asthma are
thought to result of aberrant expression of TH2 cells producing IL-4, IL-5 and IL-13. Such
conclusion is supported by the fact that TH2 cells are necessary for induction of allergic asthma in
murine models (Gavett et al., 1994). The type 2 cytokines undergo expansion in these models as
well as in patients with allergic asthma (Walker et al., 1992). High amounts of these cytokines
have been detected especially in the airway tissue of asthmatics and animal models (Gavett et al.,
1995; Tsicopoulos et al., 2000). Experiments using IL-4 deficient mice have shown significantly
attenuated asthma phenotype after repeated allergen exposure, in contrast to wild-type control
animals, where all asthmatic symptoms have developed (Brusselle et al., 1994; Brusselle et al.,
1995; Hamelmann et al., 1999).
Recent studies have demonstrated the contribution of another type 2 cytokine, IL-13 for inducing
allergic asthma in a IL-4-independant manner (Wills-Karp et al., 1998; Gruenig et al., 1998;
Cohn et al., 1999, Izuhara et al., 2000). IL-13 is a cytokine closely related to IL-4 and both bind
to IL-4Rα. Linkage analysis has mapped susceptibility to allergic asthma to a region on human
chromosome 5q25-33, which includes the genes for both IL-4 and IL-13 (Marsh et al., 1996,
Lonjou et al., 2000). A number of additional regions in the genome have been linked to asthma in
human studies, suggesting a complex multifactorial phenotype (Nanavaty et al., 2001). However,
diverse forms of asthma, implicating IL-4 and IL-13 might follow a final common effector
pathway mediated through signals transduced by IL-4Rα.
Allergy comprises a group of syndromes that includes asthma, atopic dermatitis and hay fever.
These diseases have classically been described as caused by an allergic response characterized by
immediate (type 1) hypersensitivity reactions, increased serum IgE, and increased bronchial
reactivity to specific or non-specific inhaled allergens. Allergic asthma is a complex disorder
7

_________________________________________________________________1. Introduction
characterized by local and systemic allergic inflammation and reversible airway obstruction
(Anderson & Morrison, 1998). Asthma develops because of both a genetic predisposition and the
exposure to environmental factors, such as allergens, respiratory tract infections and atmospheric
pollutants (Manian, 1997). Most major allergens are extremely well characterized. They are
usually soluble proteins with dimensions that allow penetration into the airways of the nose or
lung. Allergen sources include house dust mites, domestic and farm animals, and grass or tree
pollen.
Recent decades have brought dramatic increases in the prevalence and severity of allergic asthma.
It is especially an important problem in developed societies, where 10% of the children are
affected (Cookson & Moffatt, 1998).
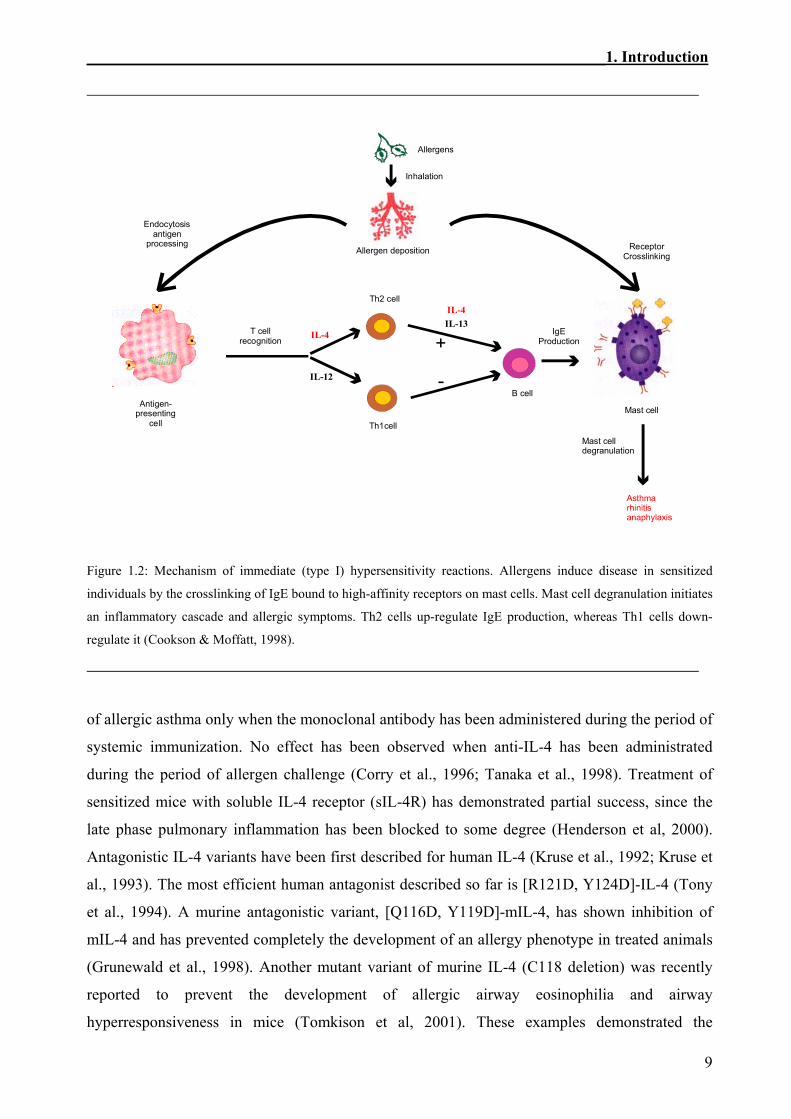
Although some details of the asthmatic pathogenesis remain unclear, the main mechanism and the
role of IL-4 are well established (Figure 1.2). Processing of the allergen by antigen-presenting
cells (APC) leads to the formation of an allergen peptide that is presented to the T-cell receptors
(TCR) of CD4+ T cells in association with MHC class II molecules. IL-4 released by eosinophils,
basophils and mast cells facilitates the differentiation of pTH cells into TH2 cells which secrete IL-
4, IL-5, IL-6, IL-10 and IL-13. Activated TH2 cells interact through the TCR with the peptide-
MHC complex on B cells. Adhesive interaction between TH2 and B cells are also mediated by the
surface expression of CD40 ligand on TH2 cells and CD40 on B cells. IL-4 and IL-13, secreted to
a varied extent by TH2 cells, basophils, mast cells and eosinophils, induce immunoglobulin class
switching to IgE in B cells. Allergic disease is initiated when allergen comes into contact with
IgE bound to the high affinity IgE receptor (FcεRI) on mast cells and basophils. Receptor cross-
linking releases a mixture of inflammatory mediators (histamine, peptide leukotrienes and
platelet-activating factor) that are responsible for the symptoms of allergic asthma. Immediate
inflammation and associated symptoms resolve and are followed by a second phase, which
typically peaks 6 to 20 hours after antigen exposure (Marone, 1998).
The conventional therapy of patients with allergic asthma includes symptomatic treatment with
inhaled corticosteroids. The long term of steroid therapy has shown different side effects such as
osteoporosis, skin thinning and hypertension. New, alternative strategies specifically target the
TH1/TH2 balance of the immune response. Potent candidates for development of anti-allergic
drugs are IL-4, IL-5 and IL-13. Possible therapies include the use of inhibitory antibodies, soluble
cytokine receptors or antagonistic cytokine variants (Prasad et al., 2000; Ramshaw et al., 2001).
An antibody-mediated blockade of IL-4 in a murine model has ablated the development
8
_________________________________________________________________1. Introduction
IL-13
IL-12
IgEProduction
Allergen deposition
Antigen-presenting
cell
Th2 cell
T cellrecognition
Endocytosisantigen
processing
B cell
Th1cell
Mast cell
Mast celldegranulation
-
+
Inhalation
Allergens
ReceptorCrosslinking
IL-4
Asthmarhinitisanaphylaxis
IL-4
Figure 1.2: Mechanism of immediate (type I) hypersensitivity reactions. Allergens induce disease in sensitized
individuals by the crosslinking of IgE bound to high-affinity receptors on mast cells. Mast cell degranulation initiates
an inflammatory cascade and allergic symptoms. Th2 cells up-regulate IgE production, whereas Th1 cells down-
regulate it (Cookson & Moffatt, 1998).
of allergic asthma only when the monoclonal antibody has been administered during the period of
systemic immunization. No effect has been observed when anti-IL-4 has been administrated
during the period of allergen challenge (Corry et al., 1996; Tanaka et al., 1998). Treatment of
sensitized mice with soluble IL-4 receptor (sIL-4R) has demonstrated partial success, since the
late phase pulmonary inflammation has been blocked to some degree (Henderson et al, 2000).
Antagonistic IL-4 variants have been first described for human IL-4 (Kruse et al., 1992; Kruse et
al., 1993). The most efficient human antagonist described so far is [R121D, Y124D]-IL-4 (Tony
et al., 1994). A murine antagonistic variant, [Q116D, Y119D]-mIL-4, has shown inhibition of
mIL-4 and has prevented completely the development of an allergy phenotype in treated animals
(Grunewald et al., 1998). Another mutant variant of murine IL-4 (C118 deletion) was recently
reported to prevent the development of allergic airway eosinophilia and airway
hyperresponsiveness in mice (Tomkison et al, 2001). These examples demonstrated the
9

_________________________________________________________________1. Introduction
therapeutic potential of IL-4 mutant proteins as receptor antagonists that are able to inhibit both
IL-4 and IL-13 in treatment of allergic asthma.
Murine IL-4 is a glycoprotein with an approximate molecular weight of 19 kDa when purified
from T-cell source (Ohara et al., 1985; Grabstein et al., 1986). Recombinant IL-4 produced in
baculovirus expression system has an approximate molecular weight of 14 to 15 kDa, whereas
recombinant IL-4 produced in yeast is quite heterogeneous in molecular weight with some forms
having size of ∼50 kDa. These differences represent variable glycosylation. IL-4 that has been
deglycozylated has full biologic activity (Le et al., 1988), as does recombinant IL-4 produced in
E.coli. Human IL-4 has very similar characteristics (Table 1.1). It exists in molecular weight
forms between 15 and 19 kDa.
Table 1.1: Characteristics of murine and human IL-4 (Beckmann, 1992)
Characteristic Murine IL-4 Human IL-4 Amino acids Precursor 140 153 Mature 120 129 Molecular weight, kDa Predicted 14 14 Expressed 15-19 15-19 N-linked glycosylation sites 3 2 Disulphide bonds Yes (6 Cys) Yes (6 Cys) Gene size, Kbp ∼ 6 ∼ 10 Number of exons 4 4 Chromosomal location 11 5q23.3-31.2
cDNA for both mouse and human IL-4 have been cloned (Lee et al., 1986; Yokota et al., 1986),
and the proteins encoded by the murine and human cDNAs contain 140 and 153 amino acids,
respectively. Both murine and human IL-4 contain putative signal sequences at their N-termini
which following cleavage, result in mature proteins of 120 and 129 amino acids, respectively.
There is approximately 50% overall identity between human and murine IL-4.
The gene for human IL-4 has been mapped to the long arm of chromosome 5 at 5q23-31 (Le
Beau et al., 1988). The IL-4 gene is linked to the genes of a few other cytokines: IL-13, IL-5,
granulocyte/macrophage colony-stimulating factor (GM-CSF) and IL-3. Due to their close
localization, the similar exon structure of the genes and their primary sequence homology, this
cytokines have been termed the IL-4 family (Paul & Seder, 1994). A homologous region has been
found at mouse chromosome 11 (D´Eustachio et al, 1988).
The secondary structure of IL-4 has been described in crystals and in solution (Powers et al.,
1992; Smith et al., 1992; Walter et al., 1992; Wlodawer et al., 1992). IL-4 displays the four α-
10
_________________________________________________________________1. Introduction
helix bundle structure, which is a characteristic of the ligands from class 1 of the cytokine super-
family. The four-helix bundles of haematopoietic ligands have an “up-up-down-down”
orientation in which the first two helices are parallel to each other and anti-parallel to the last two.
This is achieved by cross-over connections linking helix A to B and helix C to D. Based on the
overall length of the polypeptide chain, the length of the main helices, and the inter-helix angles,
class 1of cytokine superfamily is further classified into two groups: a “long chain” and a “short
chain” group (Sprang & Bazan, 1993). As seen from the structures of GH, G-CSF, LIF, EPO, IL-
6, and leptin, members of the long-chain group have about 160 to 200 amino acids, long helices
(about 25 residues), and an angle between the AD and BC helix pairs of about 160°. Based on
sequence comparisons, it is expected that PRL, ONC, CNTR, IL-11, and IL-12 belong to this
group as well. In contrast, the ligands of the short-chain group are 105 to 145 amino acids long,
have shorter helices (about 15 residues), and a large AD/BC packing angle (about 35°), as seen
from the structure of GM- and M-CSF, IL-2, IL-4, and IL-5. Also IL-3, IL-7, IL-9, IL-13, and
CSF are expected to show similar structural topology. Most of the ligands are monomeric, with
the exceptions of the disulfide-linked dimers of M-CSF and IL-5 (for a review see Kossiskoff &
de Vos, 1998; Nicola & Hilton, 1998).
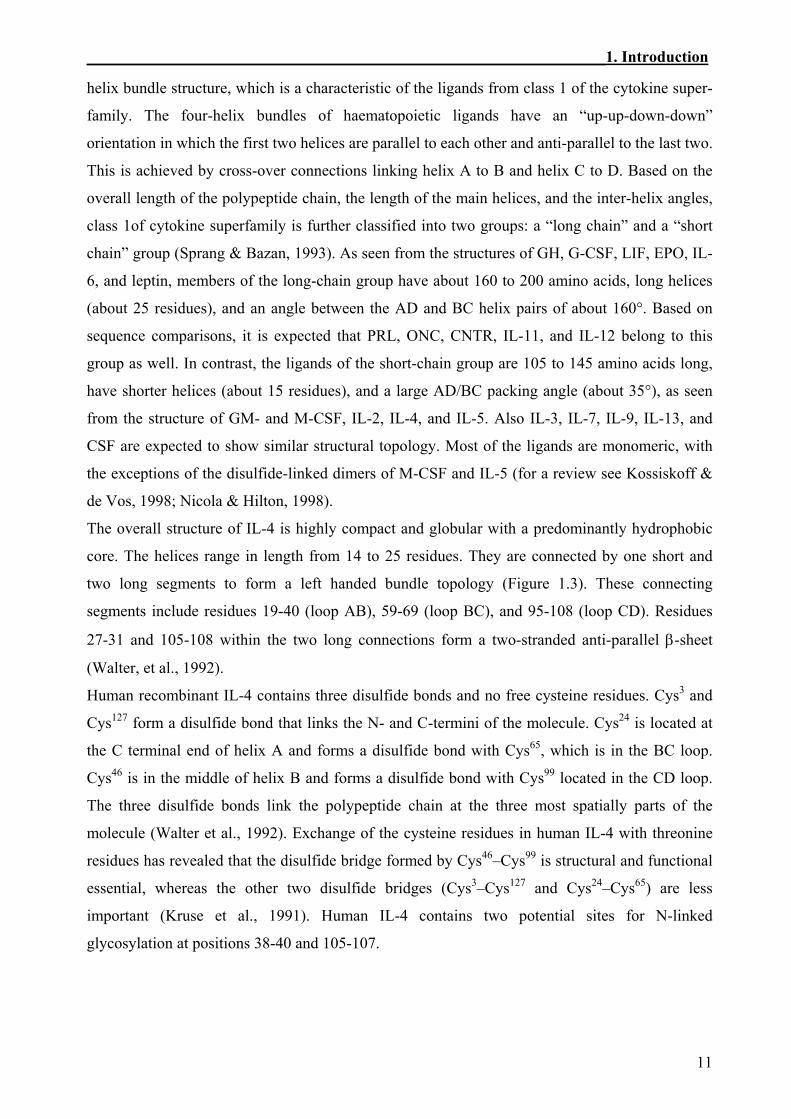
The overall structure of IL-4 is highly compact and globular with a predominantly hydrophobic
core. The helices range in length from 14 to 25 residues. They are connected by one short and
two long segments to form a left handed bundle topology (Figure 1.3). These connecting
segments include residues 19-40 (loop AB), 59-69 (loop BC), and 95-108 (loop CD). Residues
27-31 and 105-108 within the two long connections form a two-stranded anti-parallel β-sheet
(Walter, et al., 1992).
Human recombinant IL-4 contains three disulfide bonds and no free cysteine residues. Cys3 and
Cys127 form a disulfide bond that links the N- and C-termini of the molecule. Cys24 is located at
the C terminal end of helix A and forms a disulfide bond with Cys65, which is in the BC loop.
Cys46 is in the middle of helix B and forms a disulfide bond with Cys99 located in the CD loop.
The three disulfide bonds link the polypeptide chain at the three most spatially parts of the
molecule (Walter et al., 1992). Exchange of the cysteine residues in human IL-4 with threonine
residues has revealed that the disulfide bridge formed by Cys46–Cys99 is structural and functional
essential, whereas the other two disulfide bridges (Cys3–Cys127 and Cys24–Cys65) are less
important (Kruse et al., 1991). Human IL-4 contains two potential sites for N-linked
glycosylation at positions 38-40 and 105-107.
11
_________________________________________________________________1. Introduction
C-terminusN-terminus
Helix A
Helix D
Helix C
Helix B
Loop BC
Loop AB
Loop CD
Figure 1.3: Ribbon model of the IL-4 molecule.
The ability of cytokines to influence the course of cell growth and differentiation uniquely
depends on their recognition and binding by specific receptors. These are cell surface molecules
that transduce the binding of messenger cytokines into cytoplasmatic signals and trigger
developmental processes within the cell (Nicola & Hilton, 1998).
IL-4 receptors (IL-4R) are present in haematopoietic, endothelial, epithelial, muscle, fibroblast,
hepatocyte and brain tissues. Two types of IL-4R have been established, so far (Table 1.2). The
type I IL-4R is constituted by the association of a high-affinity (Kd ~ 100 pM) IL-4R α-chain,
(IL-4Rα) and the IL-2R γ-chain, known as IL-2Rγ or γc (Russell et al., 1993). This kind of
receptor is especially found on T and B lymphocytes, and monocytes. The type II IL-4R, which is
expressed on non-haematopoietic cells, is composed of the IL-4Rα and the low-affinity binding
chain for IL-13 termed IL-13Rα1 (Obiri et al., 1995). The type II receptor is used by both IL-4
and IL-13, whereas the type I is used only by IL-4 (Murata et al., 1998; Jensen, 2000).
12
_________________________________________________________________1. Introduction
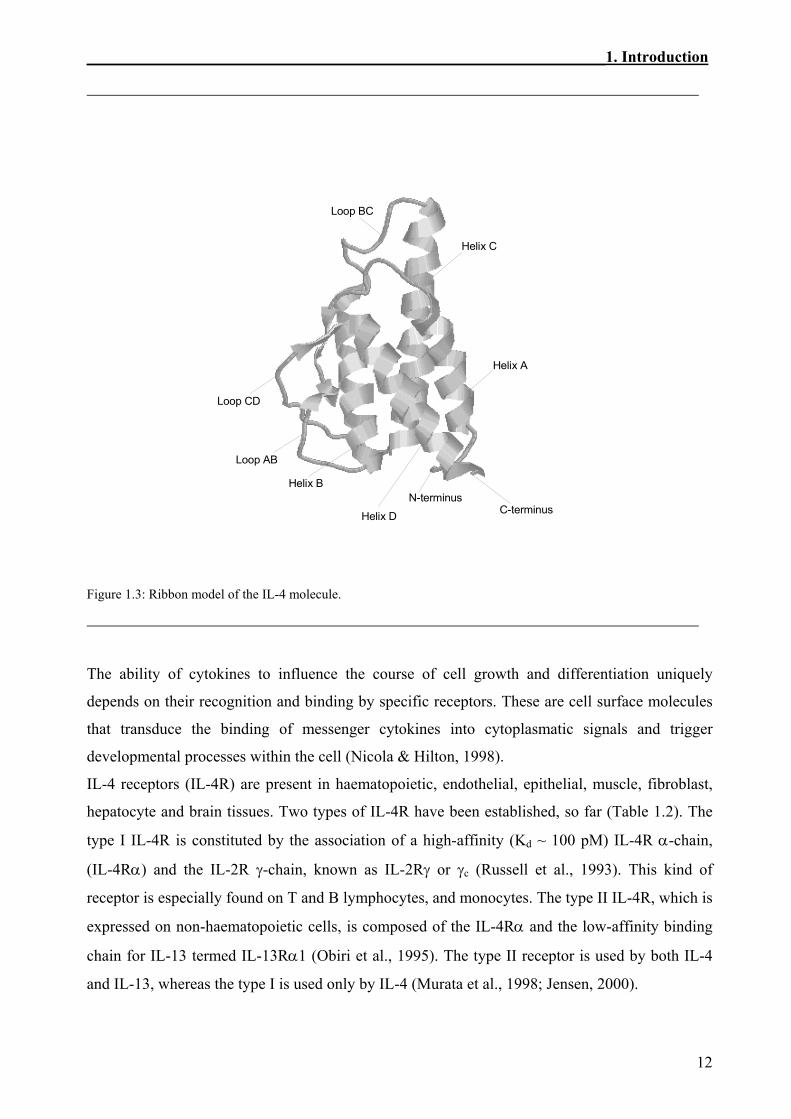
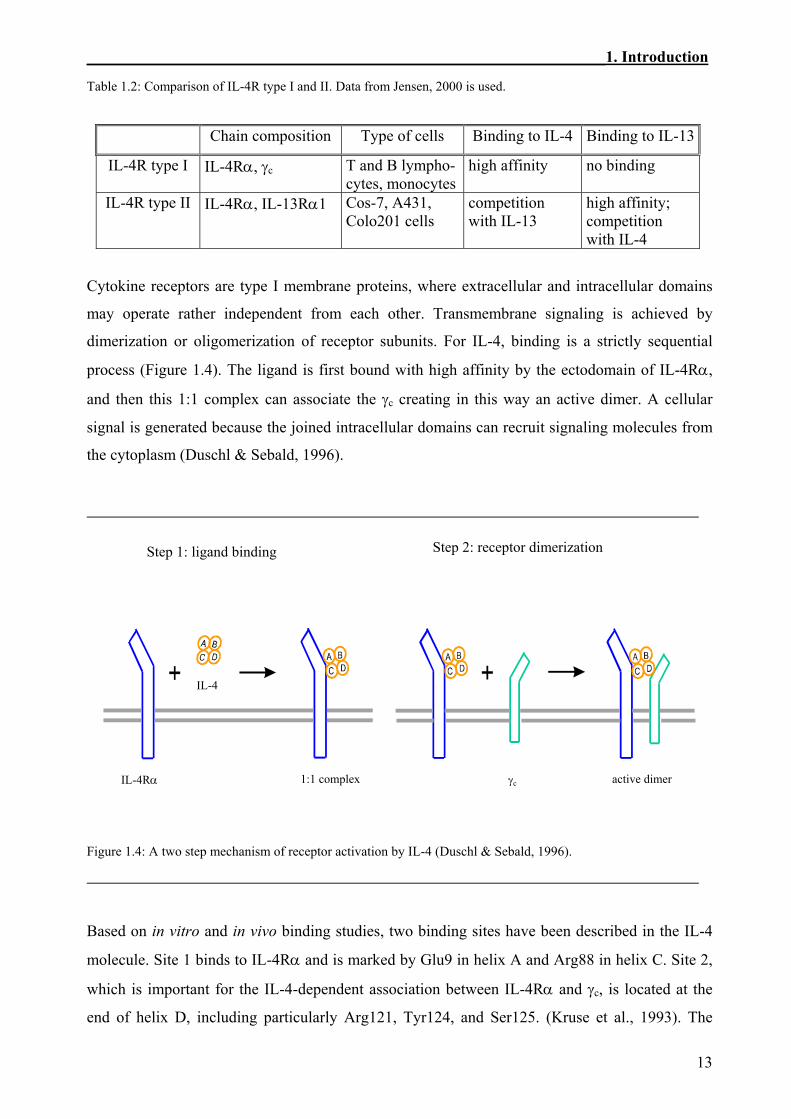
Table 1.2: Comparison of IL-4R type I and II. Data from Jensen, 2000 is used.
Chain composition Type of cells Binding to IL-4 Binding to IL-13
IL-4R type I IL-4Rα, γc T and B lympho-cytes, monocytes
high affinity no binding
IL-4R type II IL-4Rα, IL-13Rα1 Cos-7, A431, Colo201 cells
competition with IL-13
high affinity; competition with IL-4
Cytokine receptors are type I membrane proteins, where extracellular and intracellular domains
may operate rather independent from each other. Transmembrane signaling is achieved by
dimerization or oligomerization of receptor subunits. For IL-4, binding is a strictly sequential
process (Figure 1.4). The ligand is first bound with high affinity by the ectodomain of IL-4Rα,
and then this 1:1 complex can associate the γc creating in this way an active dimer. A cellular
signal is generated because the joined intracellular domains can recruit signaling molecules from
the cytoplasm (Duschl & Sebald, 1996).
Step 2: receptor dimerization Step 1: liga inding
IL
IL-4Rα
Figure 1.4: A two step
Based on in vitro a
molecule. Site 1 bi
which is important
end of helix D, in
nd b
-4
active dimer 1:1 complex γc
mechanism of receptor activation by IL-4 (Duschl & Sebald, 1996).
nd in vivo binding studies, two binding sites have been described in the IL-4
nds to IL-4Rα and is marked by Glu9 in helix A and Arg88 in helix C. Site 2,
for the IL-4-dependent association between IL-4Rα and γc, is located at the
cluding particularly Arg121, Tyr124, and Ser125. (Kruse et al., 1993). The
13

_________________________________________________________________1. Introduction
mechanism of sequential receptor dimerization and the established two binding sites have been
exploited for design of antagonistic variants of IL-4. Such mutants cannot recruit the γc into the
receptor complex, since the site 2 has been destroyed, but they bind to IL-4Rα with high affinity
and in this way block the signaling pathways (Kruse et al., 1992).
Ligand induced dimerization of cytokine receptors results in the activation of tyrosine kinases
that phosphorylate cellular substrates and initiate signaling cascades (Miyajima et al., 1992).
Neither the IL-4Rα nor the γc has endogenous kinase activity and therefore the IL-4R requires
receptor-associated kinases for the initiation of signal transduction. The Janus-family (Jak)
tyrosine kinases are critical in the initiation of signaling through the IL-4R system. Jak1 has been
proposed to associate with IL-4Rα, while Jak3 associates with γc (Miyazaki et al., 1994). IL-4
stimulation results in tyrosine phosphorylation of Jak1 and Jak3 (Figure 1.5). Activation of IL-
4R-associated kinases leads to tyrosine phosphorylation of the IL-4Rα chain itself, a process that
occurs rapidly after IL-4R engagement (Smerz-Bertling & Duschl, 1995). The cytoplasmic
domain of human IL-4Rα contains six conserved tyrosine residues, which are potential sites of
phosphorylation and subsequent interaction with downstream signaling proteins through Src-
homology 2 (SH2) or phosphotyrosine-binding (PTB) domains within these molecules. The
cytoplasmic region of IL-4Rα chain appears to have three functionally distinct domains, one that
acts as an interaction site for Jaks, one required for activation of proliferative pathways
(containing Tyr497), and a third involved in the activation of pathways leading to induction of
gene expression (Tyr575, Tyr603, Tyr631).
Analysis of IL-4Rα deletion mutants have indicated that the region between residues 557 and 657
of the human IL-4Rα is critical for the induction of signaling pathways leading to expression of
IL-4-responsive genes (Wang et al., 1996). The three conserved tyrosine residues within this
region (Tyr575, Tyr603, Tyr631) are potential sites of phosphorylation and subsequent
association of SH2-containing proteins. As a direct connection between the cytokine receptor and
the transcription apparatus act molecules termed signal transducers and activators of
transcription, or STATs. Experimentally it has been shown that Jak activation is required for
STAT activation (Velazquez et al., 1992). Thus, the STAT activation pathway is often referred to
as the Jak-STAT pathway. STAT6 is the primary STAT activated in response to IL-4 stimulation.
IL-4 engagement results in the activation of Jak1 and Jak3, and phosphorylation of specific
tyrosine residues in the receptor cytoplasmic region. STAT6 then binds to the phosphorylated
receptor through a highly conserved SH2 domain, enabling the activated kinases to phosphorylate
STAT6 at a C-terminal tyrosine residue. The conserved Tyr575, Tyr603, Tyr631 have been
proposed to be docking sites for the SH2 domains of STAT6 (Figure 1.5).
14

_________________________________________________________________1. Introduction
IRS-1/2
IL-4
IL-4Rα
JAK3JAK1
Grb2/SOS
p110
p85
PI3-K
Y550
Y472
Y606STAT6
STAT6
Y688
Y796
STAT5
CA
BD
Y578
207
231
800
233
261
347
CD23, MHCII, IL-4, IL-4R, IL-1RA, IgEα
PKC / PKB
Ras / Raf / MAPK
IL-4RE / GAS
Figure 1.5: Signal transduction through the IL-4R complex. A, B, C, and D, IL-4 helixes; IL-4RE, IL-4 responsive
element; IL-1RA, IL-1R antagonist; GAS, IFNγ activated sequence.
Once phosphorylated, the STAT6 molecule disengages from the receptor and forms homodimers
through interaction of its SH2 domain with the C-terminal phosphotyrosine residue of a second
STAT6 molecule. The dimerized STAT6 complexes translocate to the nucleus where they bind to
specific DNA motifs in the promoter of responsive genes. The DNA motifs bound by different
STATs bear remarkable similarity to each other and reflect a dyad symmetry. STAT6 appears to
bind in particular to the sequence TTC-N4-GAA (Leonard & O´Shea, 1998). The exact
mechanism by which STATs activate transcription is still being determined. Activation of gene
transcription by STAT6 may require co-operative interaction with additional transcription factors
(Schaefer et al., 1995; Look et al., 1995), or phosphorylation by kinases activated in the
Ras/MAP kinase cascade (David et al., 1995). Alternatively spliced forms of STAT6 have
15

_________________________________________________________________1. Introduction
deletions in the N-terminal (STAT6b) or SH2 (STAT6c) regions (Patel et al., 1998) and may play
a role in STAT6 regulation.
Stimulation with IL-4 or IL-13 induces tyrosine phosphorylation of a 170 kDa protein designated
insulin receptor substrate-2 (IRS-2), due to its high similarity to IRS-1 (Turner et al., 1991;
Miossec, 1993). The IRS-1/2 molecules link IL-4R to signaling pathways involved in cellular
proliferation (Sun et al., 1995). It has been shown that IRS-2 becomes phosphorylated as a result
of interaction with a phosporylated motif of the IL-4Rα including Tyr497, presumably through
the action of receptor-associated kinases (Wang et al., 1996). Among the molecules that interact
with the phosphorylated IRS-1/2 are the regulatory subunit of phosphoinositide-3-kinase (PI-3-K)
and the adapter molecule, Grb-2 (Figure 1.5). These interactions lead to the activation of the PI-3-
K and Ras/MAPK signaling pathways, respectively. The interaction between the regulatory
subunit of PI-3-K and IRS-1/2 is followed by activation of the catalytic subunit of PI-3-K. Once
activated, the catalytic subunit is capable of phosphorylating membrane lipids as well as Ser/Thr
residues of proteins (Dh et al., 1994). The lipid kinase activity mediates phosphorylation of
inositol in the cellular membrane (Toker et al., 1997). Since phosphoinositides have been
implicated in the activation of a number of downstream kinases that play a key role in cell
survival (Franke et al., 1997), it is hypothesized that activation of the PI-3-K pathway by IL-4
may prevent apoptosis in haematopoietic cells. Although the importance of the Ser/Thr kinase
activity has not yet been fully defined, it has been suggested that this pathway may result in a
negative feedback loop, which contributes to the regulation of the IRS-1/2 signaling pathway. IL-
4 activation of Ras/MAPK is not consistently observed. In particular, this activation critically
depends on cell type and more specifically on the variety of signaling molecules expressed in
these cells. (Welham et al., 1995; Zamorano et al., 1998)
The signaling pathways that are activated by IL-4R engagement, such as the Jak-STAT and
IRS1/2 pathways, mirror those activated by a number of other cytokines. Nevertheless, the
activation of these pathways results in a unique pattern of cellular responses to IL-4. In the case
of IL-4, specificity is in part achieved through the activation of STAT6, an event that, among
class I cytokine receptors, has been demonstrated to occur only through engagement of IL-4Rα.
Specific cellular responses to IL-4 may also result from the unique character of the IL-4R (for a
review, see Nelms et al., 1999).
cDNA encoding the human high-affinity IL-4Rα have been obtained (Idzerda et al., 1990). The
full-length cDNA contains an open reading frame encoding a 825 amino acids protein, which
includes a signal sequence of 25 amino acids. The mature receptor chain is a glycoprotein with
molecular weight of 140 kDa, which displays a 207-amino-acid extracellular domain, a
transmembrane domain of 24 amino acids, and a 569-amino-acid cytoplasic domain. It contains
16

_________________________________________________________________1. Introduction
six potential N-glycosylation sites. Furthermore, an alternatively spliced form of IL-4Rα has
been identified in mouse serum. It encodes a soluble product (sIL-4R) which binds IL-4 with an
affinity comparable with that determined for the cell surface receptor chain (Fernandez-Botran &
Vitetta, 1990). A role of a transport protein that prevents enzymatic degradation of IL-4, has been
suggested for sIL-4R (Fernandez-Botran & Vitetta, 1991).
The γc, first identified as a component of IL-2R, has been found to be shared as a common
subunit among receptors for IL-2, IL-4, IL-7, IL-9 and IL-15. Therefore, it is now called the
common γc. Neither IL-4 nor any other cytokine up to now could be demonstrated to bind directly
to a solitary γc in whole cells (Sugamura et al., 1995). Molecular binding studies have indicated
that the γc recognizes a complex of IL-4 and IL-4Rα and binds to it exhibiting a high dissociation
constant Kd = 3 µM (Letzelter et al., 1998). Although γc does not contribute to the affinity of the
IL-4R complex for IL-4, it is essential for formation of the functional IL-4R and activation of
signaling pathways by IL-4 (Russel et al., 1993). Human cDNA clones encoding the 64 kDa-
protein of the common γc have been isolated (Takeshita et al., 1992). The mature form of γc
consists of 347 amino acids, including an extracellular domain of 232 amino acids, a
transmembrane domain of 29 amino acids, and an 86-amino-acid cytoplasmic domain that
contains two SH2 regions. The human γc gene has been mapped on the same chromosomal locus
(Xq13) as the putative gene responsible for the human X-linked severe combined
immunodeficiency (XSCID) characterized by a complete or profound T cell defect. XSCID is
now understood to be caused by mutations of γc (Sugamura et al., 1996).
The human IL-13Rα1 cDNA encodes for an open reading frame of 427 amino acids. The signal
sequence is represented by 20 amino acids and the mature receptor chain is constituted by an
extracellular domain of 322 amino acids, a transmembrane domain of 24 amino acids, and a 60-
amino acid cytoplasmic domain. The IL-13Rα1 binds IL-13 with a weak affinity (Kd = 2-10 nM),
but its co-expression with the IL-4Rα markedly increases the affinity of the interaction (Kd = 400
pM) (Aman et al., 1996). However, in the interaction between IL-13 and IL-4R type II, IL-13Rα1
is the specificity chain and such an interaction occurs only when this chain is present. Thus, IL-
4Rα has a high-affinity epitope for IL-4 and a low-affinity epitope for IL-13. The epitopes for the
two ligands overlap, since both IL-4- and IL-13-dependent responses can be inhibited by
antagonistic IL-4 variants blocking the IL-4Rα chain (Tony et al., 1994; Tomkinson et al, 2001).
All three chains, which are components of the IL-4R/IL-13R system, belong to the class 1 of the
cytokine receptor superfamily. The structural basis for the classification of the cytokine receptors
in one superfamily is a conserved cytokine receptor homology (CRH) region within their
extracellular portion. This CRH contains the ligand-binding determinants of the receptor. As first
17

_________________________________________________________________1. Introduction
proposed by Bazan (1990), the 200 to 250-amino acids long CRH region consists of two domains
connected by a short linker. Both domains can be classified as fibronectin type III (FNIII)
modules based on their overall fold and topology. Each domain consists of a β sandwich
containing seven β strands, sequentially labeled A, B, C, C´, E, F and G following the accepted
FNIII convention (Leahy et al., 1992). The CHR regions of receptors of class 1 of the super-
family have four strictly conserved cysteine residues in their N-terminal domain and a strongly
conserved Trp-Ser-X-Trp-Ser sequence, the so-called “WSXWS motif”, near the C-terminus of
the second domain (X being any residue).
The crystal structure of the 1:1 complex between human IL-4 and IL-4BP revealed that IL-4BP
exhibits all features characterizing the class I of the cytokine receptor superfamily (Hage et al.,
1999). It has an overall L shape (Figure 1.6) and is organized in two covalently linked domains,
D1 (residues 1-91) and D2 (residues 97-197). The antiparallel β sheets are arranged in three-
strand (A, B, E) and four-strand (G, F, C, C´) β-pleated sheets that are twisted against each other
by ~ 40°. Domain D1 belongs to the h-type topological subclass of the immunoglobulin fold
where strand C´ interacts first with strand C, and then its direct continuation (designated D)
switches to interact with strand E. It contains an additional single helical turn in BC loop and six
cysteine residues that are engaged in three disulfide bridges as follows: Cys9-Cys19, Cys49-Cys61,
and Cys29-Cys59. The first two are conserved among class I CHR´s (Bazan, 1990), while the third
is unique to IL-4BP. D2 domain also shows FN III topology with two additional short helices and
no disulfide bridges.
The quaternary structure of the complex is assembled by IL-4BP binding to the helix AC face of
IL-4 and is characterized by an almost perpendicular orientation of the L-shaped IL-4BP to the
helical axes of αC and αA of IL-4 (Figure 1.7). Loops of IL-4BP that interact with IL-4 are
almost co-linear with the axes of the IL-4 helices and are oriented in a stack-like fashion. They
comprise four different levels, namely loop L2 from IL-4BP interacting with helix B of IL-4,
loops L3 and L1 interacting with αC, and loops L5 and L6 interacting with αA. Loop L4
connects domains D1 and D2 and has no interaction with IL-4.
18

_________________________________________________________________1. Introduction
L1
L2
L3
L4 L5
L6
N
C
AB
CC´
D
E
FG
ABC´
C
E
F
G
Figure 1.6: A ribbon model of IL-4BP. Loops which make contacts to IL-4 are showed in blue. In the dark gray is
loop L2 connecting D1 and D2.
An important feature revealed by the complex is the polar character of the interacting epitopes,
which are highly discontinuous and comprise multiple sequence segments. Contact residues on
IL-4 are distributed over three helices and comprise mainly polar and charged residues. The
complementary receptor epitope is assembled from residues of five loops and has a midline of
hydrophobic side chains. The binding epitope reveals a mosaic-like assembly consisting of three
discrete clusters of trans-interacting residues. Two of them exhibit conspicuous amphipathic
structure with an outer mantle of hydrophobic side chain moieties and an inner core of polar
groups. The third cluster has a completely different design and is dominated by electrostatic
interactions.
19

_________________________________________________________________1. Introduction
Figure 1.7: A ribbon view of the structure of the IL-4/IL-4BP complex (IL-4BP, blue/yellow; IL-4, red). The five IL-
4BP loops that interact with IL-4 are highlighted in yellow. The loop depicted in blue connects D1-D2 and has no
interactions with IL-4 (Hage et al., 1999).
A mosaic-binding pattern has been independently confirmed by a systematic mutational and
kinetic analysis of IL-4 contacting residues (Wang et al., 1997). This study has shown that
charged and polar determinants located on helices A and C predominate in the high-affinity
binding epitope of human IL-4. The binding epitope has been established as a set of side chains
determining the dissociation rate constant (koff) and a partially overlapping set determining the
association rate constant (kon) of IL-4/IL-4BP complex. Based on these results, the koff epitope is
represented by two juxtaposed main determinants (Glu9 and Arg88) surrounded by a few side
chains of lower importance (Ile5, Thr13, Arg53, Asn89, and Trp91). The kon epitope has been
postulated as formed by five positively charged residues on helix C (Lys77, Arg81, Lys84,
Arg85, and Arg88) and two neighboring residues on helix A (Glu9 and Thr13). Thus, both the
data from the crystal structure and from the mutation analysis have revealed novel features,
which are different from these known for the hGH, and are unique for the IL-4 functional epitope.
The formation of complexes between proteins and the specific interactions between a ligand and
its receptor in particular, are critical events in many biological processes. Structural analysis can
20
_________________________________________________________________1. Introduction
reveal the interactions that contribute to protein-protein recognition in atomic details (Jones &
Thornton, 1996). However, it alone cannot show how these interactions contribute to the overall
affinity and specificity. Ideally, the high-resolution structure of a complex would be used to guide
a comprehensive functional survey of residues presented at the interface using site-directed
mutagenesis, to allow their individual contribution to be assessed. Since the effects of alanine and
glutamine substitution in IL-4 variants have been examined (Wang et al., 1997), the present study
concentrates on functional mapping of IL-4BP binding surface. To analyze the contribution of
individual side chains to overall binding energy in the interaction between IL-4 and IL-4BP,
residues of the receptor interface implicated in ligand binding were subjected to systematic
alanine substitution (alanine scanning). The IL-4BP variants were expressed in a eukaryotic
expression system that allowed their glycosylation. The binding kinetics was measured by the
means of the BIAcore technology. For this, the IL-4BP variants were immobilized at the
biosensor matrix. Variants, which demonstrated large changes of the kinetic constants comparing
to the wild-type interaction, were additionally mutated to a more conservative residue. That gave
the possibility to assess weather the loss of binding affinity was due to grate conformational
changes caused during the alanine substitution. In addition, energetic coupling between two
residues was analyzed using variants in which two different mutations were introduced
simultaneously. The effects on binding that was produced by the double mutants were compared
to those observed when the corresponding residues were mutated singly.
The nature of the interactions between cytokines and their receptors is of fundamental importance
for detailed understanding of the immune response. While these receptors are clearly specific to
their ligands, some of them share receptor functions between more than one different ligand.
Understanding of the similarities and differences between these related proteins, and the
molecular mechanisms involved in their binding, will provide insights into more general protein-
protein interactions. Moreover, knowledge about the structural and functional binding epitope of
both IL-4 and IL-4BP, provides the basis for developing molecules with antagonistic properties
to IL-4 and design of highly effective anti-allergic drugs.
21

________________________________________________________2. Materials and Methods
2. Materials and Methods
2.1 Abbreviations
γc “common γ chain”
Ab antibody
AcNPV Autographa californica nuclear polyhedrosis virus
Amp ampicillin
APC antigen presenting cell
APS ammonium persulfate
BEVS Baculovirus expression vector system
bp base pair
BPB bromphenol blue
BSA bovine serum albumin
CD cluster of differentiation
cDNA complementary deoxyribonucleic acid
CNTF ciliary neurotrophic factor
CRH cytokine receptor homology
Da Dalton
∆∆G change of binding free energy
∆∆Gadd the ∆∆G value for a double mutant predicted by adding the ∆∆G values for the
corresponding individual mutants
ddNTPs 2’,3’-dideoxyribonucleoside triphosphates
DMSO dimethylsulfoxide
DNA deoxyribonucleic acid
dNTPs deoxyribonucleoside triphosphates
dsDNA double-stranded deoxyribonucleic acid
DTT dithiothreitol
E.coli Escherichia coli
EBP erythropoietin binding protein
EDTA ethylendiamintetraacetic acid
EPO/EPOR erythropoietin/ erythropoietin receptor
eq., equilib. equilibrium
EtBr ethidium bromide
EtOH ethanol
22

________________________________________________________2. Materials and Methods
FCS fetal calf serum
FNIII fibronectin type III
GCSF granulocyte colony-stimulating factor
GCSF-R granulocyte colony-stimulating factor receptor
GH growth hormone
GM-CSF granulocyte-macrophage colony-stimulating factor
GuHCl guanidine hydrochloride
hGH human growth hormone
hGHbp human growth hormone-binding protein
HMS high molecular standard
HPLC high pressure liquid chromatography
Ig immunoglobulin
IL-13Rα1 interleukin-13 receptor α1
IL-4Rα interleukin-4 receptor α chain
IL-x interleukin-x
IL-xBP interleukin-x binding protein
IL-xR interleukin-x receptor
INF interferon
IRS-1/2 insulin receptor substrate-1/2
Jak Janus kinase
kbp kilo base pair
Kd dissociation equilibrium constant
kin. kinetic data
koff dissociation rate constant
kon association rate constant
LB Luria Broth
LIF leukaemia inhibitory factor
LMS low molecular standard
ln logarithm to the basis of “e”
m mouse
max. maximal
MCS multiple cloning site
M-CSF macrophage colony-stimulating factor
MHC major histocomatibility complex
min minute(s)
23

________________________________________________________2. Materials and Methods
MOI multiplicity of infection (plaque-forming units/cell number)
mRNA messenger ribonucleic acid
MS molecular standard
n number of measurements
NK natural killer (cell)
NMR nuclear magnetic resonance
ORF Open Reading Frame
PAGE polyacrylamide gel electrophoresis
PBS phosphate buffered saline
PCR polymerase chain reaction
PEG polyethylene glycol
pfu plaque forming unit(s) = virus
pg130 glycoprotein 130 (kDa)
PI-3-K phosphoinositide-3-kinase
PTB phosphotyrosine-binding
rel. relative value
RNA ribonucleic acid
RP-HPLC reverse phase high pressure liquid chromatography
RT room temperature
RU resonance units
s soluble
SDS sodium dodecyl sulfate
SDS-PAGE sodium dodecyl sulfate polyacrylamide gel electrophoresis
SE standard error
sec second(s)
Sf Spodoptera frugiperda
SH src homology (domain)
SPR surface plasmon resonance
ssDNA single-stranded deoxyribonucleic acid
STAT signal transducer and activator of transcription
TB Terrific Broth
TCA trichloracetic acid
TCR T cell receptor
TEMED N,N,N’,N’-tetramethylethylenediamine
TGR transforming growth factor
24

________________________________________________________2. Materials and Methods
TH T helper (cell)
TNF tumor necrosis factor
TRIS tris(-hydroxylmethyl)-aminomethane
U unit
UV ultraviolet
v/v volume: volume ratio
Vol volume
wt wildtype
XSCID x-linked severe combined immunodeficiendcy
2.2 Chemicals and Enzymes All chemicals and enzymes were purchased from the following companies: Amersham, Biorad,
Boehringer Mannheim, Fermentas, Fluka, Gibco-BRL, Merck, Pharmacia, Roth, Serva, Sigma.
All solutions used in the experiments were made with deionized water (Millipore-Q-System).
2.3 Bacterial Strains The following genotypes E. coli were used: E. coli JM103 recA- (McCarthy et al., 1985)
Genotype: endA, D (lac-pro), thi-1, strA, sbcB15, hsdR4, supE, F´traD36,
proAB+, lacIq, zDM15, lambda-/F-
E. coli JM109 (Yanisch-Perron et al., 1985)
Genotype: recA1, endA1, thi, gyrA96, hsdR17, supE44, relA1, D (lac-
proAB), F´traD36, proAB+, lacIq
2.4 Cell Lines Sf9 cell line - a cell line, which was originally established from ovarian tissues of Spodoptera
frugiperda larvae (Vaughn et al., 1977). Sf9 cells may be grown in a monolayer or in a
suspension.
25

________________________________________________________2. Materials and Methods
2.5 Antibodies For detection of Western Blot the following antibodies were used:
X14/38: mAb from mouse against the extracellular domain of IL-4Rα (Reusch et
al., 1994)
anti-mouse IgG-POD: pAb from goat, POD-coupled (Sigma)
2.6 Vectors and Oligonucleotides 2.6.1 Expression Vector for E.coli
(McCarthy et al., 1985)
The bacterial vector RTSpRC109 (3988 bp) was used for expression of recombinant protein under
the control of the right λ-phage promoter. It contains the CI857 repressor gene coding
temperature-induced protein translation.
2.6.2 Baculovirus Transfer Vector pAcGP67-B
(Baixeras, E. et al., 1990)
The Baculovirus transfer vector pAcGP67-B (Pharmingen) contains pg67 signal sequence
upstream of a multiple cloning site. After co-transfection with Baculovirus DNA into Sf9 cells,
the cloned gene is expressed as a gp67 signal peptide fusion protein under the control of the
strong Baculovirus polyhedrin promoter.
2.6.3 Oligonucleotides The oligonucleotides, which were used for cloning and sequencing in the work presented here,
are presented in Table 2.1.
26

________________________________________________________2. Materials and Methods
Table 2.1: Sequence and function of the used oligonucleotides. The mutated codons are underlined.
Name Sequence Function
5´Y13A 5´CGTCTCCGACGCCATGAGCATC 3´ PCR induced mutagenesis/ IL-4Rα in AA at position 13
3´Y13A 5´GATGCTCATGGCGTCGGAGACG 3´ PCR induced mutagenesis/ IL-4Rα in AA at position 13
5´Y13F 5´CGTCTCCGACTTCATGAGCATC 3´ PCR induced mutagenesis/ IL-4Rα in AA at position 13
3´Y13F 5´GATGCTCATGAAGTCGGAGACG 3´ PCR induced mutagenesis/ IL-4Rα in AA at position 13
5´L39A 5´CCTGTTGTACCAGGCGGTTTTTCTGC 3´ PCR induced mutagenesis/ IL-4Rα in AA at position 39
3´L39A 5´GCAGAAAAACCGCCTGGTACAACAGG 3´ PCR induced mutagenesis/ IL-4Rα in AA at position 39
5´F41A 5´CCAGCTGGTTGCTCGTCTCTCC 3´ PCR induced mutagenesis/ IL-4Rα in AA at position 41
3´F41A 5´GGAGAGCAGAGCAACCAGCTGG 3´ PCR induced mutagenesis/ IL-4Rα in AA at position 41
5´L42A 5´GCTGGTTTTTGCGCTCTCCGAAGC 3´ PCR induced mutagenesis/ IL-4Rα in AA at position 42
3´L42A 5´GCTTCGGAGAGCGCAAAAACCAGC 3´ PCR induced mutagenesis/ IL-4Rα in AA at position42
5´L43A 5´CTGGTTTTTCTGGCCTCCGAAGCC 3´ PCR induced mutagenesis/ IL-4Rα in AA at position 43
3´L43A 5´GGCTTCGGAGGCCAGAAAAACCAG 3´ PCR induced mutagenesis/ IL-4Rα in AA at position 43
WYH46 5´GCTCATGGATGCCGTGGTCAGTGC 3´ PCR induced mutagenesis/ IL-4Rα in AA at position 67
WYH47 5´GCACTGACCACGGCATCCATGAGC 3´ PCR induced mutagenesis/ IL-4Rα in AA at position 67
5´V69A 5´GCTCATGGATGACGTGGCCAGTGC 3´ PCR induced mutagenesis/ IL-4Rα in AA at position 69
3´V69A 5´GCACTGGCCACGTCATCCATGAGC 3´ PCR induced mutagenesis/ IL-4Rα in AA at position 69
C4D72A 5 5´GTCAGTGCGGCTAACTATACA 3´ PCR induced mutagenesis/ IL-4Rα in AA at position 72
C4D72A 3 5´TGTATAGTTAGCCGCACTGAC 3´ PCR induced mutagenesis/ IL-4Rα in AA at position 72
5´D72N 5´CGTGGTCAGTGCGAATAACTATACACTGG 3´ PCR induced mutagenesis/ IL-4Rα in AA at position 72
3´D72N 5´CCAGTGTATAGTTATTCGCACTGACCACG 3´ PCR induced mutagenesis/ IL-4Rα in AA at position 72
C4K91A 5 5´GGCTCCTTCGCGCCCAGCGAG 3` PCR induced mutagenesis/ IL-4Rα in AA at position 91
C4K91A 3 5´CTCGCTGGGCGCGAAGGAGCC 3´ PCR induced mutagenesis/ IL-4Rα in AA at position 91
5´K91D 5´CTCCTTCGATCCCAGCGAG 3´ PCR induced mutagenesis/ IL-4Rα in AA at posotion 91
3´K91D 5´CTCGCTGGGATCGAAGGAG 3´ PCR induced mutagenesis/ IL-4Rα in AA at position 91
WYH60 5´CTTCAAGCCCGCCGAGGCATGTG 3´ PCR induced mutagenesis/ IL-4Rα in AA at position 93
WYH61 5´CACATGCTCGGCGGGCTTGAAG 3´ PCR induced mutagenesis/ IL-4Rα in AA at position 93
WYH31 5´CCTGACAATGCCCTGTATAATCATC 3´ PCR induced mutagenesis/ IL-4Rα in AA at position 127
27

________________________________________________________2. Materials and Methods
Name Sequence Function
WYH32 5´GATGATTATACAGGGCATTGTCAGG 3´ PCR induced mutagenesis/ IL-4Rα in AA at position 127
5´Y127F 5´CCCCCTGACAATTTCCTGTATAATC 3´ PCR induced mutagenesis/ IL-4Rα in AA at position 127
3´Y127F 5´GATTATACAGGAAATTGTCAGGGGG 3´ PCR induced mutagenesis/ IL-4Rα in AA at position 127
5´Y183A 5´GCTCAGGCCGCTTAACACCACCTG 3´ PCR induced mutagenesis/ IL-4Rα in AA at position 183
3´Y183A 5´CAGGTGGTGTTAGCGGCCTGAGC 3´ PCR induced mutagenesis/ IL-4Rα in AA at position 183
5´Y183F 5´GCTCAGGCCTTTAACACCACCTGG 3´ PCR induced mutagenesis/ IL-4Rα in AA at position 183
3´Y183F 5´CCAGGTGGTGTTAAAGCCTGAGC 3´ PCR induced mutagenesis/ IL-4Rα in AA at position 183
WYH37 5´CGCGGATCCATGAAGGTCTTGCAGGAGC 3´ an external primer, a BamHI restriction site, IL-4Rα mutagenesis
WYH38 5´GCATAACCGATATATTCGGTCGCTGA 3´ an external wild tipe primer for amlifing IL-4Rα
MF37 5´GGCGCATTCTGCCTTTGCG 3´ a sequencing primer- pAcGP67B
WYH39 5´CAGGAAAGGATCAGATCTGCAG 3´ a sequencing primer- pAcGP67B
5´R53A/IL4 5´CGACTGTCTTAGCGCAGTTCTACAGC 3´ PCR induced mutagenesis/ IL-4 in AA at position 53
3´R53A/IL4 5´GCTGTAGAACTGCGCTAAGACAGTCG 3´ PCR induced mutagenesis/ IL-4 in AA at position 53
5´Y56A/IL4 5´TTAAGGCAGTTCGCGAGCCACCATGAGAAGGACA 3´
a cassette for mutagenesis in IL4 - AA at position 56
3´Y56A/IL4 5´CGCGTGTCCTTCTCATGGTGGCTCGCGAACTGCC 3´
a cassette for mutagenesis in IL4 - AA at position 56
MF8 5´CGTTAAATCTATCACCGCAAG 3´ an external wild-type primer for amplifing IL-4
MF14 5´GTCATCACCGAAACGCGCGAG 3´ an external wild-type primer for amplifing IL-4
PWU22-5´ 5´CAGGACTACTACGTTTTAACTGA 3´ a sequencing primer- RTSpRC109
PWU22-3´ 5´CAGGATCGGTCGCTGAGGCTTGCA 3´ a sequencing primer- RTSpRC109
2.7 Microbiological Methods 2.7.1 Sterilization
Experiments dealing with bacteria were performed at sterilized conditions. Glassware and other
experimental materials were sterilized at 180oC for 6 hours in a hot-air-cabinet (Heraeus, ST
5060). Buffers, media and plastic containers were autoclaved (Sterico Vapoclav
Dampfsterilisator) at 121oC and 1.1 bar for 20 min. Solutions of temperature-unstable substances
were sterilized by filtering through Millipore-Filter (DynaGard 0.22µm).
28

________________________________________________________2. Materials and Methods
2.7.2 Culture Media LB-medium: 10g/l Bacto-Trypton, 5g/l Bacto-Yeast Extract, 10g/l NaCl pH7.5
(Sambrook et al., 1989) with 0.1N NaOH adjusted
TB-medium: 13.3g/l Bacto-Trypton, 26.6g/l Bacto-Yeast Extract, 4.4ml/l
(Sambrook et al., 1989) glycerin
before use 10% sterilized 10x Phosphate buffer was added
10 x Phosphate buffer: 0.17M KH2PO4, 0.72M K2HPO4
(Sambrook et al., 1989)
5 x ENB-medium: 40g/l Nutrient Broth, 25g/l Bacto-Pepton, 7.5g/l KH2PO4, 17.5g/l
(Sambrook et al., 1985) NaH2PO4, 25g/l NaCl
ENB-amp-plates 15 g agarose in 800 ml H2O was autoclaved. When the agarose
solution was cooled to 50oC, 200 ml 5 x ENB-medium, 2.5 ml 2M
glucose, 0.5 ml thiamin solution in H2O (10mg/ml) and 50 mg
ampicilin in 2ml 1M TrisHCl buffer (pH 8.0) were added. After
mixing, the agarose solution was filled into plates, cooled at RT
and kept at 4oC
Ampicillin solution, 50 mg/ml in 1M TrisHCl pH 8.0, must be freshly prepared and added to final
concentration of 50 µg/ml for all kinds of media.
2.7.3 Culturing of Bacteria Glycerin stock-culture was spread over an agar plate and incubated at 30oC or 37oC overnight. A
colony was picked up and incubated in 2 ml of medium at 30oC or 37oC for a day. This culture
was further used for making larger culture.
29

________________________________________________________2. Materials and Methods
2.7.4 Electrocompetent E.coli 2.7.4.1 Preparation of electrocompetent bacterial cells E.coli from an agar plate or frozen stock were cultivated in 2 ml of TB-medium with ampicillin at
37oC for 8 h. From this culture was started 200 ml of a new culture, which was incubated and
shook (200 rpm, Cetromat-R) overnight under the same conditions.
The overnight culture was centrifuged at 3500 rpm (Beckmann J2-21, JA-10 rotor), 4oC for 10
min. and then washed with 200 ml cold solution of 10% glycerin/H2O (v/v). The suspension was
consecutively centrifuged in the same way and resuspended in 100 ml, 50 ml, 20 ml and 2 ml of
cold 10% glycerol solution. The final suspension was aliquoted in chilled Eppendorf tubes (40µl)
and frozen in liquid Nitrogen. The competent cells were stored at -70oC.
2.7.4.2 Electrotransformation of competent E.coli The electrocompetent E.coli were placed on ice and thawed out. 10-20 ng of DNA (in TE-buffer)
were added and the suspension was mixed and transferred to a chilled 0.2 cm electroporation
cuvette. Immediately after the pulse was applied (Biorad Gene PulserTM: 250 V, 25 mF and 200
W), 500 µl of LB-medium were added and the cuvette was vigorously shaken. The suspension
was incubated at 30oC or 37oC for 30 min. For selection the bacterial material was placed in 2
ENB-amp-plates, which were kept at 30oC or 37oC overnight.
2.7.5 Storage of Bacterial Cultures 10 µl bacterial suspension was spread over an agar plate and incubated at 30oC or 37oC overnight
until colonies appeared. Such a plate can be kept 4 to 6 weeks at 4oC.
For long-term bacterial storage, a single bacterial colony was cultivated in 50 ml of LB-medium
with ampicillin at 30oC or 37oC until the suspension reached OD550 of 1.5 - 1.7 (LKB Novaspec).
The following centrifugation was carried out at 3000 rpm for 10 min. The pellet was resuspended
in 2 ml of LB-medium/amp and mixed with 2ml of sterilized glycerol (87%). This culture can be
kept at -20oC several years.
30

________________________________________________________2. Materials and Methods
2.8 Molecular Biological Methods 2.8.1 Determination of the Concentration of Nucleic Acids The concentration of nucleic acids was measured by spectrophotometry in the absorption
spectrum range 240-320 nm. (Kontron Uvikon 930 Spectrophotometer). Considering an
extinction value of 1, the relation between A260 and the concentration is as follows:
Nucleic acids Concentration
dsDNA 50 µg/ml ssDNA 33 µg/ml Oligonucleotide 20 µg/ml
The concentration of DNA can be roughly estimated by using an agarose gel electrophoresis. For
amounts less than 200 ng, the flourescence of the ethidium bromide, incorporated in the DNA
fragments is proportional to the concentration of DNA. The intensity of the examined bands was
compared to this of DNA standards with known concentrations.
2.8.2 Phenol Extraction of DNA phenol solution: saturated phenol, neutralized with 1/50 Vol. 2.5M Tris-HCl pH8.0
To the DNA containing fraction was added the phenol solution (1:1 Vol). After 5 min of shaking,
the sample was treated with (1/2 Vol.) chloroform/isoamyl alcohol solution (24:1), again shaken
for 2 min and finally centrifuged for 2 min at 14000 rpm. The aqueous phase was transferred to a
new tube.
2.8.3 Ethanol Precipitation of DNA DNA solutions were precipitated by adding 1/10 Vol. 3M NaOAc pH 8.0 and 2.5 Vol. EtOH. The
sample was thoroughly vortexed, incubated for 30 min at -20oC and centrifuged (15 min, 14000
rpm). The pellet was washed with 70% EtOH and dried under vacuum. The pellet was dissolved
in desired volume sterile dH2O or TE buffer.
31

________________________________________________________2. Materials and Methods
2.8.4 DNA Molecular Standards
The following DNA molecular standards were used:
HMS: phage λ DNA, digested by HindIII
LMS: pBr322 plasmid DNA, digested by AluI
Table 2.2: DNA molecular standards
HMS LMS
bp % bp % 23130 47.7 1608 21.2 9416 19.4 1201 15.9 6682 13.4 999 13.2 4361 9.0 711 9.4 2322 4.8 567 7.5 2027 4.2 517 6.8 564 1.2 396 5.2 125 0.3 360 4.8
1222/219/214 9.6 132/120/112 4.8 76/65/30/27 2.6
2.8.5 DNA Agarose Gel Electrophoresis
(Hermann et al., 1980)
running buffer: 40mM Tris-acetate pH 8.2, 20mM NaOAc, 1M EDTA pH 5.0
EtBr: 5 mg/ml
5 x stop buffer: 15% Ficoll, 50mM EDTA, 0.5%SDS, 0.05% XC, 0.05% BPB in running
buffer
DNA fragments with different length require different concentrations of the agarose for
separation by gel electrophoresis (Table 2.3).
Table 2.3: DNA agarose gel electrophoresis
Length of DNA fragments [kbp] Agarose concentration in %
5 – 60 0.3 1 – 20 0.6
0.8 – 10 0.7 0.4 – 7 1.0 0.2 – 4 1.5 0.1 – 3 2.0
32
________________________________________________________2. Materials and Methods
The agarose was dissolved in running buffer by heating in a microwave oven and kept at 65oC.
After adding of 1/1000 Vol. EtBr (final concentration 5 µg/ml), the agarose was poured into a
horizontal gel-plate. A comb was put in the agarose and it was cooled down until the gel was
formed.
The examined DNA was mixed with ¼ Vol. of 5 x stop buffer and heated at 65oC for 5 min. The
DNA samples and 100 ng DNA molecular standard were loaded in parallel starts of the gel. The
electrophoresis was performed in the electric field of 3 V/cm. The sample was visualized under
UV light due to the incorporation of EtBr in DNA. The length of the DNA fragments was
estimated by comparison with the bands of the standard.
2.8.6 Purification of DNA by Agarose Gel Electrophoresis DNA fragments were purified from agarose gels using NukleotrapTM kit (Macherey-Nagel).
A preparative agarose gel was run and the DNA fragment of interest was cut under a UV light
panel. 330-350 mg of agarose gel containing DNA were transferred in an Eppendorf tube, where
300 µl of buffer T1 were added for each 100 mg from agarose material. This suspension together
with 20µl of the glass beads “Nucleotrap” was incubated at 55oC for 10 min and meanwhile
vortexed a few times. The sample was centrifuged for 30 sec at 13000 rpm and the supernatant
was removed. This step was followed by consecutively washing the pellet twice with 500 µl of
T2 buffer and twice with T3 buffer. After the pellet dried on air, it was resuspended in 50 µl of
TE buffer pH 8.0 and incubated for 10 min at RT. The suspension solution was centrifuged 1min.
at 13000 rpm and the DNA containing supernatant was then transferred to a clean Eppendorf
tube. 2 µl of the DNA solution were analyzed on an agrose gel.
2.8.7 Site-directed Mutagenesis by PCR
(Higuchi et al., 1990)
apparatus: DNA Termal Cycler 480, Perkin Elmer
10 mM dNTPs
Pfu polymerase
10 x Cloned Pfu buffer: 200mM Tris-HCl pH 8.0, 20mM MgSO4, 100mM KCl,
100mM (NH)4SO4, 1% Triton X-100, 1mg/ml nuclease-free BSA
33

________________________________________________________2. Materials and Methods
Most of the mutations were generated by using a two-step polymerase chain reaction. The first
step was performed in two different reactions - reaction 1a and reaction 1b. In reaction 1a (Table
2.4) the 5´-primer carries the mutation of interest and the 3´-primer is external (Table 2.1). The
3´-primer, which was used in reaction 1b, was mutated and complementary to the 5´-primer in
reaction 1a. The 5´-primer in reaction 1b was external.
Table 2.4: PCR - reaction 1a and reaction 1b
Reaction 1a Reaction 1b
template 50 ng 50 ng mutant primer 50 pmol (5´-primer) 50 pmol (3´-primer) external primer 50 pmol (3´-primer) 50 pmol (5´-primer) dNTPs 10 nmol 10 nmol 10 x Pfu polymerase buffer 5 µl 5 µl Pfu polymerase 2.5 U 2.5 U H2O to 50 µl to 50 µl
The synthesized products from reaction 1a and 1b were analyzed by an agarose gel and directly
used as a template during the second step of the PCR generated mutagenesis. This recombinant
PCR was performed with the two external primers, used in the first step: the 3´-primer from
reaction 1a and the 5´-primer from reaction 1b (Table 2.5).
Table 2.5: Second step of the PCR generated mutagenesis
Reaction 2
reaction product 1a 2 µl reaction product 1b 2 µl 5´-primer (from reaction 1b) 50 pmol 3´-primer (from reaction 1a) 50 pmol dNTPs 10 nmol 10 x Pfu polymerase buffer 5 µl Pfu polymerase 2.5 U H2O to 50 µl
All reactions were performed in safe-lock Eppendorf tubes with the following program:
denaturation: 95oC 5 min. 25 cycles: 95oC 1 min. 55oC 1 min. 72oC 2 min. extension: 72oC 7 min.
34

________________________________________________________2. Materials and Methods
The product, synthesized during the second step of the PCR, contains the mutation of choice.
After visualization on a agarose gel, it was precipitated with EtOH and dissolved in 20 µl of H2O.
2.8.8 Site-directed Mutagenesis Using DNA Cassettes This method was used for generation of mutations in the cDNA of IL-4. The cassette is synthetic
double-stranded DNA, which contains a mutation of interest. Its ends are designed as restriction
endonuclease cutting sites. In this way, it is possible using a ligation reaction to insert the cassette
between the same cutting sites represented in the cDNA of IL-4.
2.8.9 Digestion of DNA All restriction reactions were performed in the presence of recommended 10 x reaction buffer.
For analytical purposes were digested 100-500 ng DNA in reaction volume of 10 µl, using 1-10
U restriction endonuclease. The reaction mix was incubated for 1 h at 37oC and then 2-4 µl were
examined by agarose gel electrophoresis.
The reaction volume of a preparative digestion is dependent on the amount of the used DNA,
which should not exceed 1 µg/ml. It is necessary to consider that the standard enzyme solutions
normally contain 50% glycerol. Some restriction endonucleases work non-specifically in the
presence of too high glycerol concentrations (“star activity”). Because of this, the glycerol
content in the reaction volume should not be more than 10%. Every kind of DNA, independent
on the number of restriction sites, was digested with 1-5 U of restriction endonuclease per µg
DNA. (1 enzyme unit (U) is defined as the amount of the restriction endonuclease, which is able
to digest 1 µg of DNA for 1 h.) The incubation was done - if it is not mentioned otherwise - for 2
h at 37°C. The restriction reaction was stopped by adding ¼ volume 5 x stop buffer (15% ficoll,
0.5 % SDS, 50mM EDTA, 0.5 % BPB, 0.5% XB in 5 x tris-acetate buffer). A small aliquot was
examined on an agarose gel. The rest of the DNA was purified by agarose gel electrophoresis,
before it was used for ligation reaction.
35
________________________________________________________2. Materials and Methods
2.8.10 Ligation of DNA T4 DNA ligase
10 x T4 DNA ligase buffer: 500mM Tris-HCl pH 7.6, 100mM MgCl2, 10mM ATP,
10mM DTT
A vector : insert molar ration of 1:3 was determined to be optimal. The total amount of DNA for
cloning per 10 µl reaction volume was 200 ng. The reaction mix, containing 1-5 U of T4 DNA
ligase was incubated for 3 h at RT or for 12-16 h at 15oC. The reaction was stopped by heating at
65oC for 10 min. 25% from the ligation mix were loaded on an agarose gel to examine the
reaction efficiency. The recombinant plasmid DNA (1 µl of the ligation mixture) was directly
used to transform electrocompetent E.coli. To monitor the efficiency of the ligation and
transformation steps, cut vector DNA was ligated in the absence of an insert and competent cells
were transformed with it as well as with uncut non-recombinant vector.
2.8.11 Preparation of Plasmid DNA 2.8.11.1 Lysozyme-alkaline-lysis procedure
(Birnboim and Doley, 1979)
solution 1: 50mM glucose, 10mM EDTA, 25mM Tris-HCl pH 8.0, 2mg/ml
lysozyme, 100 µg/ml RNase A (DNase free)
solution 2: 1% SDS, 0.2M NaOH
solution 3: 3M KOAc pH4.8
(60 ml 5M KOAc with 11.5 ml acetic acid and 28.5 ml H2O)
The described procedure is a simple and fast method for preparation of plasmid DNA and gives
material with quality sufficient for restriction analysis. DNA for analyses, which require better
quality (e.g. sequencing), was isolated by other procedures.
Bacterial cultures were started from single colonies and incubated in 2 ml of TB-medium/amp
overnight at 30oC or 37oC. 1.4 ml of the bacterial suspensions were transferred into Eppendorf
tubes and centrifuged (Eppendorf Centrifuge 5415C) for 2 min at 14000 rpm. The supernatant
was removed by aspiration with a water beam pump. The cell pellet was resuspended in 200 µl of
solution 1 and then 200 µl of solution 2 were added. The samples were thoroughly mixed by
inverting the tubes and incubated for 5 min on ice. After 200 µl of solution 3 were added and the
36

________________________________________________________2. Materials and Methods
tubes were inverted again, the samples were incubated for 15 min on ice. This turbid solution was
centrifuged for 15 min at 14000 rpm. The clear supernatant was transferred to a fresh Eppendorf
tube, avoiding floating precipitate. After precipitation with an equal volume of isopropanol, the
DNA containing pellet was washed with 70% EtOH and dried under vacuum. The pellet was
dissolved in 20 µl of dH2O. An aliquot of 2-5 µl was used for restriction analysis.
2.8.11.2 PEG precipitation procedure
(Tartof and Hobbs, 1987)
solution 1 (GTE buffer): 50mM glucose, 10mM EDTA, 25mM Tris-HCl pH 8.0
solution 2: 1% SDS, 0.2M NaOH
solution 3: 3M KOAc pH4.8
(60 ml 5M KOAc with 11.5 ml acetic acid and 28.5 ml
H2O)
RNase solution: 10 mg/ml RNase A (DNase free)
PEG solution: 13% PEG8000 autoclaved
The following procedure was used for preparation of plasmid DNA for sequencing.
Aliqouts (1.4 ml) of overnight cultures were transferred to Eppendorf tubes and centrifuged at
14000 rpm in a microcentrifuge (Eppendorf Centrifuge 5415C). The supernatant was removed by
aspiration and the bacterial pellet was resuspended in 200 µl of solution 1. Then 300 µl of
solution 2 were added. The content of the tube was mixed by inversion and incubated for 5 min
on ice. After this, 300 µl of solution 3 were added, the content was mixed by inversion of the
tubes and the sample was incubated again for 5 min on ice. Centrifugation at 14000 rpm for 15
min followed. The supernatant was carefully transferred in a fresh tube, avoiding floating
precipitates. Solution of RNase A was added to a final concentration of 25 µg/ml and the tubes
were incubated for 30 min at 37oC. DNA was extracted using 400 µl phenol/Tris and 400 µl
chloroform/isoamylalcohol (24:1). After centrifugation for 1 min at 14000 rpm, the aqueous
phase was transferred to a fresh Eppendorf tube. DNA was precipitated with equal volume of
isopropanol and washed with 70% EtOH. The dried pellet was dissolved in 32 µl of H2O and
after 8 µl of 4M NaCl and 40 µl of autoclaved PEG8000 solution were added, the sample was
thoroughly vortexed and placed on ice for 20 min. The following centrifugation was performed at
4oC, 14000 rpm, for 15 min in a fixed-angle rotor centrifuge (Biofuge A, Heraeus). The
supernatant was carefully removed and the pellet was rinsed with 70% EtOH and dried under
37

________________________________________________________2. Materials and Methods
vacuum. The DNA containing pellet was dissolved in 20 µl of dH2O. The so prepared DNA can
be used for restriction analysis as well as for sequencing. The plasmid DNA was stored at -20oC.
2.8.11.3 Preparation of plasmid DNA with LiCl
solution 1: 50mM glucose, 10mM EDTA, 25mM Tris-HCl pH 8.0, 5mg/ml lysozyme
solution 2: 1% SDS, 0.2M NaOH
solution 3: 3M KOAc pH4.8
(60 ml 5M KOAc with 11.5 ml acetic acid and 28.5 ml H2O)
solution 4: 5M LiCl
RNase solution: 10 mg/ml RNase A (DNase free)
The underwritten method is a simple way to prepare more plasmid DNA comparing to the
described already PEG precipitation. The purity and the amount of the prepared DNA is
sufficient for co-transfection in Sf9 cells.
Bacterial culture was started from a single colony in 2 ml of TB-medium/amp and incubated 8 h
at 37oC. 10-20 µl were transferred in 30-40 ml of fresh medium and cultivated at 37oC overnight.
The bacterial suspension was transferred in a Falcon tissue culture tube and was spun down by
centrifugation at 3000 rpm for 5 min (Megafuge1.0, Heraeus). The pellet was resuspended in 2
ml of solution 1 and after 50 µl of RNase solution were added, the sample was mixed and placed
on ice for 5-10 min. 3 ml of solution 2 were added, the content was thoroughly but gently mixed
by inverting the tube and incubated for 5-10 min on ice. After this step, 2 ml of solution 3 were
added and the tube was thoroughly but gently inverted until a homogeneous suspension was
formed. The sample was incubated 5-10 min on ice, 6 ml of solution 4 (5M LiCl) were added and
the content was mixed. After 5-10 min of incubation on ice, the sample was centrifuged for 15
min at 5500 rpm (Megafuge 1.0, Heraeus). The supernatant was further filtered through 2 layers
of precision wiper paper and transferred to a new Falcon tissue culture tube. DNA was
precipitated with an equal volume of isopropanol and after the pellet was rinsed with 70% EtOH,
it was dried under vacuum. Then the pellet was resuspended in 500 µl of dH2O, transferred to a
fresh Eppendorf tube and 50 µl of RNase solution were added to the DNA solution. The sample
was incubated for 30-60 min at 37oC. DNA was extracted with 400 µl saturated phenol/tris and
400 µl of chloroform/isoamylalcohol (24:1) solution. The aqueous phase was transferred to a new
Eppendorf tube and 1/10 Vol. of 3M NaOAc and an equal volume of isopropanol were added to
it. The sample was thoroughly vortexed, incubated at RT for 5 min and centrifuged at high speed
38
________________________________________________________2. Materials and Methods
(14000 rpm) for 10 min. The pellet was briefly dried under vacuum and redissolved in 40 µl of
dH2O. When the plasmid DNA was isolated to be used for co-transfection in Sf9 cells, the pellet
from the last step was dried under sterile conditions and was dissolved in sterile dH2O.
The concentration of the plasmid DNA was determined by spectrophotometry and the quality was
examined by agarose gel electrophoresis.
2.8.12 DNA Sequencing
The DNA sequencing was performed by Wolgang Haedelt, using an automatic DNA Seguencer
(Applied Biosystems, Model 373A) and according to manufacturer’s instructions.
The used method, according to Sanger, relies on the base-specific termination of the DNA chain
elongation by random integration of labeled ddNTPs at the end of the chain. Four independent
sequencing reactions were carried out for each analyzed DNA sample. Each reaction contained
different chain-terminating ddNTP coupled to a corresponding fluorescent day. After the end of
PCR, the products of the four reactions were mixed together and analyzed on a 7 %
polyacrylamide gel. Due to the different fluorescence, the single DNA fragments could be
detected by an argon laser beam.
2.9 Protein Chemical Methods 2.9.1 Determination of the Protein Concentration The concentration of a protein solution, when it is diluted to 0.1-0.5 mg/ml, can be measured by
spectrophotometry at the absorption spectrum range 250-320 nm (Kontron Uvikon 930
Spectrophotometer). For calculation was used the absorbency value A at 280 nm. The
concentration of IL-4 and IL-4BP per absorbency unit (A280 = 1) and the path length equal to 1
cm are shown in the Table 2.6.
Table 2.6: Molar absorbency factor and concentration of IL-4 and IL-4BP
Protein Molar absorbency factor [mol-1*cm-1]
Concentration per absorbency unit 1 [mg/ml]
IL-4 8610 1.7 IL-4BP 66930 0.357
39
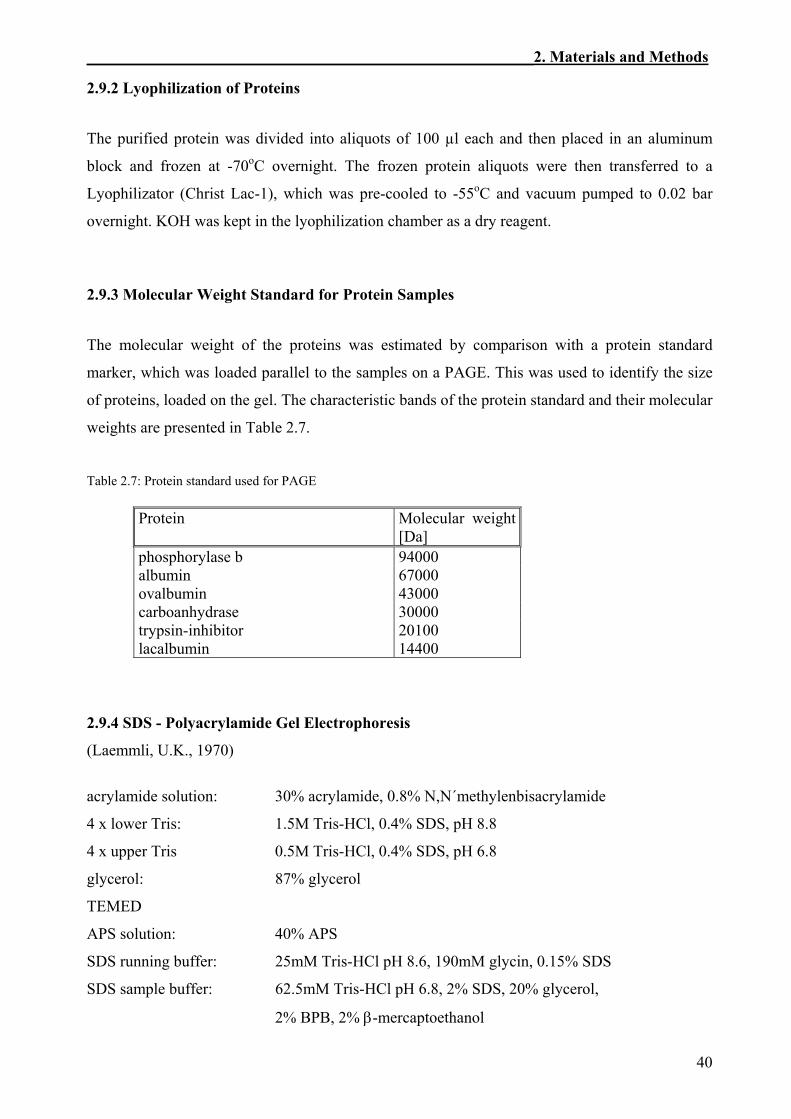
________________________________________________________2. Materials and Methods
2.9.2 Lyophilization of Proteins The purified protein was divided into aliquots of 100 µl each and then placed in an aluminum
block and frozen at -70oC overnight. The frozen protein aliquots were then transferred to a
Lyophilizator (Christ Lac-1), which was pre-cooled to -55oC and vacuum pumped to 0.02 bar
overnight. KOH was kept in the lyophilization chamber as a dry reagent.
2.9.3 Molecular Weight Standard for Protein Samples The molecular weight of the proteins was estimated by comparison with a protein standard
marker, which was loaded parallel to the samples on a PAGE. This was used to identify the size
of proteins, loaded on the gel. The characteristic bands of the protein standard and their molecular
weights are presented in Table 2.7.
Table 2.7: Protein standard used for PAGE
Protein Molecular weight [Da]
phosphorylase b 94000 albumin 67000 ovalbumin 43000 carboanhydrase 30000 trypsin-inhibitor 20100 lacalbumin 14400
2.9.4 SDS - Polyacrylamide Gel Electrophoresis
(Laemmli, U.K., 1970)
acrylamide solution: 30% acrylamide, 0.8% N,N´methylenbisacrylamide
4 x lower Tris: 1.5M Tris-HCl, 0.4% SDS, pH 8.8
4 x upper Tris 0.5M Tris-HCl, 0.4% SDS, pH 6.8
glycerol: 87% glycerol
TEMED
APS solution: 40% APS
SDS running buffer: 25mM Tris-HCl pH 8.6, 190mM glycin, 0.15% SDS
SDS sample buffer: 62.5mM Tris-HCl pH 6.8, 2% SDS, 20% glycerol,
2% BPB, 2% β-mercaptoethanol
40

________________________________________________________2. Materials and Methods
staining solutuion: 0.25% Coomassie Brilliant Blue R250 in destaining solution
destaining solution: 1 Vol. acetic acid, 1 Vol. isopropanol, 8 Vol. H20
In denaturating SDS-polyacrylamide gels the proteins were separated by their molecular weight.
The electrophoresis was performed in a vertical gel electrophoresis system Mini-V 8.10 (Gibco
BRL). Different acrylamide concentrations can be used for different gel preparations (Table 2.8)
depending on the size of the separated proteins.
Table 2.8: Amount of the different components used for SDS-polyacrylamide gel electrophoresis
Solution Stacking gel Separating gel 7.5% 10% 12% acrylamide solution 0.25 ml 1.25 ml 1.67 ml 2 ml 4 x lower Tris - 1.25 ml 1.25 ml 1.25 ml 4 x upper Tris 0.62 ml - - - H2O 1.6 ml 1.5 ml 1.1 ml 0.75 ml 87% glycerol - 1 ml 1 ml 1 ml TEMED 6 µl 5 µl 7 µl 7 µl 40% APS 6 µl 5 µl 7 µl 7 µl
The separating gel solution was decanted between two vertical glass-slabs (layer thickness 0.75
mm) with a Pasteur pipette to 2/3 of the glasses upper edge and then covered with a water layer.
After polymerization, the water was poured out, the stacking gel solution was filled on the top
and a comb was immediately inserted.
The protein samples and SDS sample buffer (1:1) were mixed and boiled at 100oC for 5 min. A
microlitre syringe was used to place the protein solutions in the wells of the slab. For each well
0.5-2 µg of protein was loaded. In the first lane, parallel to the samples, was loaded the protein
standard. Until the samples were concentrating, the gel was running at 100 V and for the
separating part 150 V were used.
After the end of the electrophoresis, the gel was placed for 30 min in a coomassie solution for
staining. The destaining was done overnight. The ready gel was kept 1 h in 20 % methanol and
dried between two pieces of cellophane.
2.9.5 Concentration of Protein Samples by TCA
When the protein concentration was low, concentration by TCA was done before the sample was
loaded on PAGE. To the protein sample, which had to be concentrated was added 1/9 Vol. of 5%
TCA. After mixing, the protein solution was incubated for 20 min on ice and then centrifuged for
41

________________________________________________________2. Materials and Methods
20 min at 14000 rpm (Eppendorf Centrifuge). The pellet was dissolved in desired volume of SDS
sample buffer. When the solution had a yellow color, 1 µl of 2.5M Tris-HCl pH 8.0 was added
until the color got blue.
2.9.6 Biotinylation of Proteins For biotinylation were used protein solutions of purified IL-4BP in PBS. To 300 µl of such a
solution 50 µl of 0.5M NaHCO3, pH 8.5 were added. A solution of 1 µg EZ-LinkTM Sulfo-NHS-
LC-Biotin (Pierce) in 300 µl DMSO was prepared. Biotin solution was added to the protein
sample in such an amount that the protein and the biotin were in a molar ratio of 1:5. The sample
was shortly vortexed and then incubated on ice for 3 h.
The biotinylated protein sample was separated from the free biotin by gel filtration through a
column filled with Biogel P6DG. The column volume was about 14 ml and for elution was used
PBS. The biotinylated protein was eluted after 4-5 ml flow through. The sample was divided into
aliquots, which were kept at -20oC.
2.10 Immunological methods - Western Blot 2.10.1 Transfer of Proteins to a Nitrocellulose Membrane
(Gershoni and Palade, 1983)
Transfer buffer: 25mM Tris-HCl, 192 mM glycin, 20% methanol
Amidoschwarz: 0.1% (w/v) amidoschwarz 10-B, 45% methanol, 10% acetic acid
destaining solution: 1 Vol. acetic acid, 1 Vol. propanol, 8 Vol. H20
nitrocellulose membrane (Schleicher and Schmuell BA85)
Whatman paper
Western blotting was used to verify the expression of IL-4BP by Sf9 cells, after the second step
of virus amplification.
First, the proteins were electrophoretically separated on a SDS polyacrylamide gel. 10 µl of virus
supernatant were mixed with equal volume of protein sample buffer and after 5 min of boiling,
the sample was loaded on a gel, parallel to a protein standard. As a negative control was used a
sample of equal volume, which contained only the medium for Sf9 cells. The positive control was
a sample of wild-type IL-4BP with known concentration. After the end of the electrophoresis, the
42

________________________________________________________2. Materials and Methods
gel was rinsed shortly in transfer buffer. Then a paper-thin nitrocellulose membrane, which
tenaciously binds most proteins, was carefully applied on the face of the gel, preventing the
formation of air bubbles. The gel and its attached membrane were sandwiched between two
pieces of Whatman paper, two porous pads and the plastic support was tightly fixed. The blotting
apparatus (Blot Module Mini-V8.10), containing the gel and the membrane, was placed in an
electrophoresis chamber in a way that the nitrocellulose membrane was toward the anode. The
chamber was filled with transfer buffer and an electric field was applied (150 V) for 1 h. At this
step, the proteins were driven out of the gel and transferred to the membrane.
After the blotting, the membrane was separated from the gel and the first lane, containing the
protein standard was cut out and stained for 5 min in amidoschwarz solution. Then this part of the
membrane was placed in destaining solution, washed in H2O and dried.
All manipulations were carried out with gloves to prevent the transfer of foreign proteins to the
membrane.
2.10.2 Detection of Western Blots by a Peroxidase Coupled Antibody
washing buffer: 10mM Tris-HCl pH 8.0, 150mM NaCl, 0.5% tween
blocking buffer: 3% BSA in washing buffer
luminol solution: 2.5 mM luminol (3-aminophthalhydrasid), 100mM Tris-HCl pH
8.5, 1% DMSO
enhancing solution: 90mM p-cumar acid in DMSO
primary antibody: 3 µg/ml X-14-38 (anti-IL-4BP monoclonal antibody) in blocking
buffer
secondary antibody: anti-mouse polyclonal antibody from goat, peroxidase coupled
In the next step, the membrane was soaked in a solution of the primary antibody, specific for IL-
4BP. Only the band, which contained this protein, bound the antibody. To identify the band
containing the protein of interest, the membrane was developed by a secondary antibody, coupled
with POD.
After the blotting, the membrane was rinsed once for 5 min in washing buffer. Then it was
incubated in blocking buffer for 30 min on a platform shaker to reduce the background of non-
specific binding by blocking potential binding sites with irrelevant proteins. The blocking buffer
was replaced by 5 ml solution of the primary antibody and the membrane was incubated at RT for
at least 2 h with gentle agitation on a platform shaker. When the antibody solution was removed,
43

________________________________________________________2. Materials and Methods
the membrane was rinsed 4 times in washing buffer (5 min between each change) at RT. From
the final wash, the nitrocellulose membrane was transferred in 5 ml solution of the secondary
antibody (0.5-5.0 µg/ml antibody in blocking buffer) and incubated for 1-3 h at RT with gentle
agitation on a platform shaker. The reaction with the secondary antibody was stopped by rinsing
the membrane 4 times in washing buffer (5 min between each change) at RT. For the developing
solution in two separated tubes were added 2.5 ml of luminol solution and 11 µl of enhancing
solution or 2.5 ml of 0.1M Tris pH 8.5 and 1 µl of 30% H2O2, respectively. Right before the
development, the content of the two tubes was mixed. The development was completely carried
out in a dark room. There the membrane was transferred into the developing solution and was
incubated until luminescence was seen (usually not more than 30 sec). The nitrocellulose
membrane was shortly dried, exposed to a X-ray film (Kodak X-100) for 30 sec to 1 min and then
the film was developed.
2.11 Expression of Recombinant Proteins in E.coli (Kato et al., 1985; Weigel et al., 1989)
2.11.1 Temperature Induced Protein Expression medium: TB medium, 10 x phosphate buffer
antibiotic: ampicillin
TE buffer 10mM Tris-HCl, 1M EDTA pH 8.0
expression vector: RTSpRC109, containing the insert of interest
Bacterial culture was started in 2 ml of TB-medium from a single colony and incubated for 8 h at
30oC. 20 µl of this suspension were used to start culture in 50 ml of fresh medium, which was
incubated overnight at 30oC. In a flask (2 l) was prepared 800 ml TE-medium, containing
ampicillin (50 µg/ml) and 1.6 ml from the overnight bacterial culture were added. This bacterial
culture was grown at 30oC on a shaker (Braun Ceromat, 200 rpm) to early logarithmic phase with
OD550 of 0.5 (LKB Novaspec). The flask was then immediately moved to a rotatory water bath,
where it was incubated for another 3 h at 42oC and shaken at 200 rpm. After this time, usually
OD550 of 1.2-1.5 was reached.
The bacterial cells were harvested by centrifugation for 10 min at 6000 rpm (Beckmann J2-21,
JA-10 rotor). The pellet was resuspended and washed in 30 ml of TE buffer, pH 8.0. After the
44

________________________________________________________2. Materials and Methods
bacterial suspension was centrifugated under the same conditions, the pellet was resuspended in
10 volumes of TE buffer (vol/wet mass) and frozen at -20oC.
2.11.2 Preparation of Inclusion Bodies TE buffer was added to the thawed out cell suspension to about 50 volumes of wet mass. The
bacterial cells were sonicated eight times (each time 30 sec sonication followed by 30 sec break)
at 300 W by a sonicator (KLN System 585). During the sonication, the solution was kept in an
ice bath. The suspension was centrifuged at 11000 rpm (Beckmann J2-21, JA-14 rotor) for 30
min at 4oC. The tight sediment was resuspended and washed once in 100 ml of TE buffer and
then centrifuged under the same conditions for 20 min. The final pellet was resuspended in 10
volumes of TE buffer (vol/wet mass).
2.11.3 Denaturation and Renaturation of Proteins GuHCl solution: 6M guanidine hydrochloride, 100mM Tris-HCl pH 8.0
PBS: 120mM NaCl, 2mM KCl, 3 mM NaH2PO4 pH 4.8, 7mM
Na2HPO4 pH 8.0
TE buffer: 10mM Tris-HCl, 1mM EDTA, pH 8.0
acetic acid: 4M acetic acid pH 5.0
To the suspension, containing inclusion bodies slowly were added 3 volumes of 6 M guanidine
hydrochloride solution and 0.1% (by volume) 2-mercaptoethanol. The mixture was stirred for 30
min at RT and then centrifuged at 11000 rpm (Beckmann J2, JA-10 rotor) for 15 min at 4oC. 4
volumes H2O were added drop by drop to the supernatant. The sample was centrifugated at 11000
rpm for 20 min at 4oC. The supernatant was dialysed against 20 volumes of PBS pH 7.4 for 16-20
h at 4oC. The cloudy suspension first was adjusted to pH 5.0, using 4 M acetic acid and then was
centrifuged at 11000 rpm (Beckmann JA-14 rotor) for 20 min at 4oC. The protein containing
supernatant was further purified by ion exchange chromatography.
45

________________________________________________________2. Materials and Methods
2.12 Expression of Recombinant Proteins in SF9 cells
2.12.1 General Handling Techniques
2.12.1.1 Insect cell culture media
Insect - Express medium (BioWhittaker)
SF - 1 medium (BioConcept)
Sf - 900 II Serum-Free Medium (Gibco BRL)
Pluronic F68 for ICM - 10% (BioConcept)
Lipid Ethanol solution for ICM (BioConcept)
L - Glutamine (Seromed)
FCS (Gibco BRL)
All of these media provide basic nutrients for Sf9 cells and have a pH of approximately 6.2.
Insect-Express medium does not require additional supplements and was completed only with 5%
of FCS. The rest of the mentioned mediums were supplemented as shown in Table 2.9.
Table 2.9: Insect cell culture media and required supplements
Medium Lipid mix Pluronic L-glutamine FCS Insect-Express
1000 ml -
- - 50 ml
SF-1 950 ml
1 ml 10 ml 25 ml 50 ml
SF-900 SFM II 980 ml
1 ml 10 ml 10 ml 50 ml
2.12.1.2 Cultivation of Sf9 cells
To prevent bacterial or yeast contamination, all experiments dealing with Sf9 cells were
performed at sterile conditions. Glass pipettes, plastic materials and solutions were sterilized.
Flasks and tubes, containing cells were opened only in a laminar flow hood (LaminAir HB
2448S, Heraeus).
Old medium was exchanged with fresh every second day, since the healthy Sf9 cells double every
18-24 h. The culture was incubated at 27oC in incubators (Heraeus, Memmert).
46

________________________________________________________2. Materials and Methods
2.12.1.3 Staining and counting of Sf9 cells
trypan blue 0.4% (w/v) solution in PBS
The trypan blue exclusion method was used to count the proportion of viable cells and their
concentration in the suspension. Since the exclusion of the stain is a selectively working
definition for viability, the dead cells appear as blue spots, when observed with an inverse
microscope.
A small aliquot of cells was mixed with trypan blue solution at a ratio of 1:1 and kept at RT for 1
min. Apart of this, the suspension was placed in a Neubauer’s chamber and observed with an
inverse microscope. The viable cells in 16 different squares were counted. To calculate the cell
density (cells/ml), the sum of cells counted within those squares has to be multiplied by 104.
2.12.1.4 Long-term cell storage
freezing medium: 90% culture medium and 10% DMSO, freshly filtered through
22 µm filter
cryovials: 2.0 ml, sterile (Nalgene)
Sf9 cells can be stored for long periods of time by freezing in liquid nitrogen. Sf9 cells from a
healthy, log-phase culture were spun down at 2500 rpm (Megafuge 1.0, Heraeus) for 10 min.
After the supernatant was decanted, the cell pellet was kept on ice and resuspended in such a
volume of freezing medium, that the final cell density was 4 x 10⁶. The cell suspension was
aliquoted (1 ml) into freezing vials. To freeze the cells slowly, the vials were placed at -20oC for
1 h and then kept at -80oC overnight. The next day the cells were transferred to liquid nitrogen. A
week or two after the cells were frozen, one vial was thawed to check for cell viability and
contamination.
The frozen cells were quickly thawed by gentle agitation in a 37oC water bath. Then, they were
transferred to a centrifuge tube (Falcon) and 25 ml of fresh medium were added. The cells were
spun down by centrifugation at 1000 rpm (Megafuge 1.0, Heraeus) for 5 min. The pellet was
resuspended in 40 ml of fresh medium and centrifuged again at the same conditions. After the
supernatant was removed, the cells were resuspended in 10 ml of medium and the suspension was
seeded in a 25 cm2 culture flask, which was incubated at 27oC. After 12-24 h the old medium was
replaced with fresh and the culture was incubated at 27oC as long as the cells needed to get
47

________________________________________________________2. Materials and Methods
confluent. Then they were transferred to a bigger flask (75 cm2) and the medium was exchanged
with fresh.
2.12.1.5 Monolayer culture
tissue culture flasks: 25 cm2 (Falcon)
75 cm2 (Falcon)
175 cm2 (Falcon)
Insect cells grow well both in suspension and as monolayer cultures and can be transferred from
one to the other with minimal adaptation.
Sf9 cells from a monolayer culture were subcultured when they were 80-90% confluent. After the
culture was examined for contaminations and cells floating in the medium, the old medium was
discarded and the cells were washed from the surface of the flask by gentle pipetting using 10 ml
of fresh medium. A small aliquot of this suspension was stained with trypan blue. The cells were
examined and counted with an inverse microscope. The suspension was diluted and the cells were
seeded in a new flask with a density of 7.0 x 10⁴ - 1.0 x 10⁵ cells/cm2 in a final volume of 5 ml
(for 25 cm2 flask), 15 ml (for 75 cm2 flask) or 35 ml (for 175 cm2 flask). A culture prepared with
such cell density was ready for next passage in 2-3 days. The flasks were incubated in a
humidified incubator at 27oC.
2.12.1.6 Suspension culture
plastic roller bottles: 2 l (Greiner)
Continuous propagation of Sf9 cells in suspension for more than a few passages resulted in
decreased cell viability and growth rate. That was the reason, that the stock cultures were
passaged as monolayer and used then to seed suspension cultures when it was required.
Usually, 2-3 confluent 175 cm2 flasks were used to start one bottle of a suspension culture. After
the cells were counted, they were inoculated in a plastic roller bottle with a density of 0.8 x 10⁵ -
1.0x 10⁶ cells/ml in a total volume of 80-100 ml. The bottle was incubated at 27oC in an
incubator, where it was slowly rolled (5 rpm). When cells from the suspension attached to the
wall of the bottle and the cell density reached 3-4 x 10⁶ cells/ml, fresh medium was added to the
48

________________________________________________________2. Materials and Methods
culture. In a roller bottle were incubated maximum 200 ml of cell suspension and the cell density
was controlled to be not more than 4.5 x 10⁶ cells/ml.
2.12.2 Generation of Recombinant Baculoviruses 2.12.2.1 The Baculovirus expression system Baculoviruses belong to a diverse group of large double-stranded DNA viruses that infect
different insects as their natural hosts (Matthews, R.E.F., 1982). The Baculovirus genome is
replicated and transcribed in the nuclei of infected host cells where the large Baculovirus DNA
(between 80 and 120 kbp) is packaged into rod-shaped nucleocapsids. Since the size of this
nucleocapsids is flexible, recombinant Baculovirus particles can accumulate large amounts of
foreign DNA.
One of the most commonly used Baculoviruses for expression vector work is Autographa
californica nuclear polyhedrosis virus (AcNPV). Infectious AcNPV particles enter susceptible
insect cells by endocytosis or fusion and viral DNA is uncoated in the nucleus. DNA replication
starts 6 h post-infection. The virus infection cycle can be divided into two different phases: early
and late. During the early phase, the infected insect cell releases extracellular virus particles by
budding off from the cell membrane of infected cells. During the late phase of the infection cycle,
occluded virus particles are assembled inside the nucleus. The occluded viruses are embedded in
a homogenous matrix made predominantly of a single protein, the polyhedrin protein. That is
why, during the late phase of infection, the polyhedrin protein accumulates to very high levels.
Although the polyhedrin protein seems to be one of the most abundant proteins in infected insect
cells, it is not essential for the Baculovirus life cycle in tissue culture. Cloning of a gene of
interest under the control of the polyhedrin promoter, leads to high expression levels of the
recombinant protein. This fact defines the Baculovirus expression vector system as one of the
most powerful available systems for eukaryotic expression of recombinant proteins.
2.12.2.2 Co-transfection of BaculoGold DNA and a transfer vector into insect cells The Baculovirus genome is too large to directly insert foreign genes easily. Hence the foreign
gene has to be cloned first in a transfer vector, which later is co-transfected with AcNPV DNA
into Sf9 cells.
49

________________________________________________________2. Materials and Methods
For co-transfection was used BaculoGold DNA (Pharmingen), which is a modified AcNPV
Baculovirus DNA, containing a lethal deletion and does not code for viable virus. Co-transfection
of BaculoGold DNA with a complementing Baculovirus Transfer Vector rescues the lethal
deletion. The foreign gene has to be cloned into a transfer vector that contains flanking
sequences, which are homologous to the Baculovirus genome. After co-transfection,
recombination takes place within the insect cells between the homologous regions in the transfer
vector and the BaculoGold DNA. Recombinant virus produces recombinant protein and also
infects additional insect cells, thereby resulting in additional recombinant virus.
As a transfer vector was used pAcGP67B, where the gene of interest was cloned under the
control of the strong Baculovirus polyhedrin promoter. It also contains gp67 signal sequence
upstream of a multiple cloning site, which is one of the most effective Baculovirus-encoded
signal sequences for protein secretion. The signal peptide mediates the forced secretion of the
recombinant protein, even if it is normally not secreted. During transport across the cell
membrane, the signal peptide is cleaved and the native protein can be purified from the infection
supernatant. The vector has an E.coli origin of replication, which allows to be amplified in
bacteria. It was prepared for co-transfection by LiCl purification method (see 2.7.11.3).
Co-transfection was performed using BaculoGold transfection kit (Pharmingen). The following
materials were required:
confluent monolayer culture of Sf9 cells
BaculoGold transfection kit: linearized BaculoGold Baculovirus DNA
transfection buffer A
transfection buffer B
AcNPV wild-type high titer stock solution
purified recombinant Baculovirus transfer vector (pAcGP67B)
FCS
6-well tissue-culture plate
Confluent Sf9 cells were counted and diluted with medium containing 5% FCS to a cell density
of 7 x 10⁵ cells/ml. In each well of a 6-well tissue culture plate, 1 ml of this cell suspension was
seeded and 1 ml of fresh medium was added. The plate was incubated shortly at 27oC until the
cells attached firmly to the bottom.
In a sterile Eppendorf tube in a laminar hood, 1 µg of the pure recombinant transfer vector was
mixed with 0.25 µg (2.5 µl) of BaculoGold DNA. After 5 min of incubation at RT, 500 µl of
transfection buffer B were added to the co-transfection mixture. To prepare the positive control,
50

________________________________________________________2. Materials and Methods
25 µl of AcPNV wild-type high titer stock solution were added to 1.5 ml of medium. The old
medium from the cells in the experimental co-transfection well was aspirated and replaced with
500 µl of transfection buffer A. The medium in the positive control well was replaced with the
mixture containing wild-type AcNPV. In the negative control well the medium was aspirated and
1.5 ml of fresh medium were added. Nothing else was added to this well. Drop-by-drop, in the
experimental co-transfection well was added the earlier prepared solution containing BaculoGold
DNA and Baculovirus transfer vector. After every 3-5 drops, the plate was gently rocked back
and forth to mix the drops with the medium. During this procedure, a fine calcium
phosphate/DNA precipitate with white color was formed. The plate was incubated for 4 h at 27oC
and then the medium from the experimental and the positive control wells was aspirated. The
cells there were washed with 1.5 ml of fresh medium, which then was removed. Again 1.5 ml of
fresh medium was added to each of these wells. The plate was placed in a incubator and kept at
27oC for 5 days.
After 5 days the cells in the three wells were examined for signs of infection. The supernatant
from the experimental co-transfection well was collected and centrifuged at 2500 rpm (Biofuge
A, Heraeus) for 5 min. The supernatant was stored at 4oC in the dark and later was used for
plaque purification.
2.12.2.3 Generating pure virus stocks by plaque purification The principle of the following method is to infect cells with extremely low numbers of infectious
particles, so that only isolated cells become infected. An overlay of agarose keeps the cells stable
and limits the spread of virus. When the originally infected cell produces virus and eventually
lyses, only the immediate neighboring cells become infected. Each group of infected cells is
referred to as a plaque. Uninfected cells are dispersed throughout the culture, surrounding the
plaques. After several infection cycles, the infected cells in the center of the plaques begin to lyse
and the peripheral infected cells remain surrounded by uninfected cells. All the virus particles in a
plaque derive from a single infectious particle. Therefore, clonal virus populations may be
purified by isolating individual plaques.
confluent monolayer Sf9 culture
FCS
Insect Express Medium (2 x) (BioWhittaker)
agarose solution: 1.8% SeaPlaque Agarose (BioZym) dissolved in H20, autoclaved
and kept at 65oC
51
________________________________________________________2. Materials and Methods
MTT solution: 1 mg/ml MTT dissolved in H2O, filtered through 22 µl filter
6-well tissue culture plate
The cells were counted and diluted to a cell density of 1.2 x 10⁶ cells/ml. In each well was seeded
1 ml of cell suspension and 1 ml of fresh medium was added. The plate was kept 10-15 min at
27oC on a level surface to allow the cells to spread evenly over the bottom. Serial dilutions of the
viral transfection supernatant in fresh medium were made, as it follows:
3 x 10⁻¹, 1 x 10⁻¹, 1 x 10⁻², 1 x 10⁻³ and 1 x 10⁻⁴.
All dilutions were performed in a total volume of 1 ml in sterile Eppendorf tubes. The medium
was aspirated and replaced with the virus in oculum. One well was used for negative control and
there only fresh medium was added. The plate was incubated at 27oC for 1 h. For each plate was
prepared a solution containing 5 ml of agarose solution, 4.5 ml of Insect Express Medium (2x),
and 500 µl of FCS, which was kept fluid at 40oC. The virus dilutions were aspirated and the cells
were overlaid with an agarose containing solution (1 ml/well). The plate was kept on a leveled
surface until agarose hardened (about 20 min). The plate was incubated in a humid atmosphere at
27oC until visible plaques developed (usually 5-6 days).
To better visualize the plaques, the cells were stained with solution of MTT. To each well was
applied 1 ml of it and the plate was incubated for 1 h at RT. After this time, the plaques were seen
as small white points on a violet background.
2.12.3 Amplification of Virus Stocks The generation of a pure high titer virus stock involved the preparation of a stock starting from a
single infectious unit. During the virus amplification, the following steps were performed to
increase the volume and the titer of the virus stock.
2.12.3.1 Virus amplification from a single virus plaque The plaques were picked from wells containing not more than 20 single plaques. To pick up the
plaques, a sterile micropipette tip was used. Each single plaque was placed in a sterile Eppendorf
tube containing 1 ml of medium and was incubated for 1 h at 27oC. In a 6-well tissue-culture
plate was seeded 1 ml/well Sf9 cells from confluent culture with a cell density of 1.2-1.5 x 10⁶
cells/ml and 1 ml of fresh medium was added to each well. After the cells attached to the bottom,
52

________________________________________________________2. Materials and Methods
the medium was replaced with plaque containing solutions. In the negative control well, 1 ml of
fresh medium was added. The plate was incubated for 1 h at 27oC and then 1 ml of fresh medium
was added to each well.
After 3 days of incubation at 27oC, the supernatant from the different virus clones was collected
and centrifuged at 2500 rpm (Biofuge A, Heraeus) for 5 min. This amplifying step was repeated
once more using 500 µl of each virus stock mixed with 500 µl of fresh medium. After the second
amplification, the virus clones were tested for protein expression by Western blotting (see 2.9).
The virus clone, which showed the best expression level, was chosen for further amplification.
2.12.3.2 Virus amplification in a small volume scale In a 175 cm2 tissue-culture flask were seeded Sf9 cells with a density of 1.6-2.0 x 10⁵ cells/cm2 in
a total volume of 35 ml. After the cells attached to the bottom, the medium was aspirated and
cells were infected with 1 ml of the virus supernatant collected after the second amplification
step. Additionally, 10 ml of fresh medium were added and the flask was incubated for 1 h at
27oC. Then 24 ml of fresh medium were added to the flask. After 3 days of incubation at 27oC,
the virus supernatant was collected and centrifuged (Megafuge 1.0, Heraeus) at 2500 rpm for 5
min.
2.12.3.3 Virus amplification in a large volume scale 5 ml from the virus supernatant collected after the described amplification step were used to
infect Sf9 cells in a roller bottle (Greiner). 95 ml of suspension culture from Sf9 cells with cell
density 1.5 x 10⁶ cells/ml were transferred to a fresh plastic roller bottle and then the virus stock
was added. After 3 days of incubation at 27oC, the supernatant was centrifuged at 2500 rpm
(Megafuge 1.0, Heraeus) for 5 min and was used for determination of virus titer.
2.12.3.4 Determination of virus titer by plaque assay The titer of a virus stock is the concentration of infectious virus particles in that stock. It was
determined by a plaque assay. Plaque assay of a virus stock involves essentially the same
protocol as plaque purification. Because each plaque derives from a single infectious unit,
53
________________________________________________________2. Materials and Methods
counting the number of plaques formed by different dilutions of a virus stock allows determining
the concentration of infectious units in the stock. Viral titers determined in this manner are
expressed in plaque-forming units/ml (pfu/ml). For practical purposes, the virus stock titered by
plaque assay was diluted as it follows:
1 x 10⁻⁴, 1 x 10⁻⁵, 1 x 10⁻⁶, 1 x 10⁻⁷ and 1 x 10⁻⁸.
2.12.3.5 Virus storage
(Jarvis, D.L. et al., 1994)
Working stocks of recombinant viruses were stored at 4oC in tissue-culture medium containing
5% of FCS. Infected cells and cell debris were removed from the virus stock by centrifugation at
1000 x g for 5 min. The stocks were stored in the dark, because the viruses are extremely light
sensitive.
For long-term storage, aliquots of the virus stock were frozen in polypropylene cryovials at
-80oC without any cryoprotectant. Before freezing, FCS was added to 10%. Virus stocks were
retitrated before use after prolonged storage.
2.12.4 Protein Expression After the virus titer was determined, the high titer virus stock was used for protein expression.
200 ml of suspension culture with cell density 1.5 x 10⁶ cells/ml, were transferred to a fresh
plastic roller bottle. The cells were infected with such an amount of high titer virus stock, that the
multiplicity of the infection (infectious virus units/cell) was between 3 and 5. The bottle was
rolled (5 rpm) at 27oC. Aliquots were examined under a microscope and depending on the
number of infected cells, the expression was done for 4 or 5 days. The suspension was
centrifuged at 3000 rpm for 10 min. The protein containing supernatant was frozen and stored at -
20oC.
54
________________________________________________________2. Materials and Methods
2.13 Purification of Recombinant Proteins 2.13.1 Purification of Proteins Expressed in E.coli 2.13.1.1 Protein purification by ion exchange chromatography buffer A: 25mM NH4OAc, pH 5.0
buffer B: 25mM NH4OAc, 1M NaCl, pH 5.0
column: 3 x 10 cm (Biorad)
ion exchanger: CM-Sepharose fast flow
pump: LKB 2232 Microperpex S Peristaltic Pump
detector: LKB 2238 Uvicord, LKB 2210 Recorder
collector: ISCO Retriever II
CM-Sepharose fast flow (Pharmacia) was equilibrated with 4 M NH4OAc, pH 5.0 and washed
several times with 25 mM NH4OAc, pH 5.0 by a funnel. The so prepared ion exchanger was
packed in a column (5-10 ml) and washed with solution A, until the elute reached pH 5.0. The
protein containing solution was slowly loaded (ca. 250 ml/h) into the column. This was followed
by rinsing with five column volumes of solution A. The elution of proteins was performed by a
60 ml linear salt gradient from 0 to 0.5 M NaCl/25 mM NH4OAc pH 5.0 with a flow rate ca.0.5
ml/min. The elute peak was detected with an absorbance device at 280 nm and recorded. The
described procedure was performed in a 4oC room. The collected fractions (2 ml each) were
measured at 280 nm (Konto Uvikon 930 Spectrophotometer), using solution A as a blank.
Further, the fractions (10 µl from each) were examined on a SDS-polyacrylamide gel. The
fractions, which contained pure protein in a sufficient amount were combined and later purified
additionally by the use of RP-HPLC.
2.13.1.2 Protein purification by RP-HPLC controller: LKB 2152 HPLC Controller
pump: LKB 2150 HPLC Pump
detector: Merk Hitachi 655A Variable Wavelength UV Monitor
recorder: LKB 2210
superrac: LKB 2210
55

________________________________________________________2. Materials and Methods
acetonitrile: acetonitrile (Roth, HPLC Grade), filtered through a 22 µm filter
TFA: 0.1% TFA (Merck) in H2O, filtered through a 22 µm filter
protein stock buffer: 12.5 ml of 4 x upper Tris-HCl, 20 ml of 10% SDS, 47.5 ml of H2O, 30 ml
of glycerol mix
The protein containing fractions, collected during the ion exchange chromatography, were
centrifuged at 3000 rpm for 15 min at 4oC. The supernatant was injected into a Vydac C4 HPLC
column (250 x 4.6 mm or 250 x 8 mm), equilibrated with 0.1% TFA. The protein was eluted by
acetonitrile gradient from 0 to 100%. The elution was controlled automatically by the presented
programs (Table 2.10).
Table 2.10: Acetonitrile gradient and retention time, used for analytical and preparative RP-HPLC
Acetonitrile [%] Retention time [min] Analytical RP-HPLC 0 – 35 15 35 – 45 40 45 – 100 15 100 – 100 10 Preparative RP-HPLC 0 – 30 5 30 – 50 45 50 – 100 10 100 – 100 10 100 – 0 10
The flow rate was 0.7 ml/min for the column (250 x 4.6 mm) and 2 ml/min for the column (250 x
8 mm). The protein concentration of the collected fractions was measured at the absorption
spectrum range 250-320 nm (Kontron Uvikon 930 Spectrophotometer). An aliquot (10 µl) from
every fraction was mixed with 30 µl of protein buffer and 5 µl from this solution was analyzed by
SDS-polyacrylamide gel electrophoresis. The fractions with the highest amount of pure protein
were combined, aliquoted and lyophilized.
In addition to the SDS-PAGE, the protein purity was also examined by analytical RP-HPLC,
performed with the use of the small column (250 x 4.6 mm). The procedure followed the
described details for preparative RP-HPLC, except that only 100 µg of protein were required for
analysis and the detection sensitivity was set at 0.08.
56

________________________________________________________2. Materials and Methods
2.13.2 Purification of Proteins Expressed in Sf9 Cells 2.13.2.1 Affinity chromatography using IL-4 as a ligand PBS: 120mM NaCl, 2mM KCl, 3mM NaH2PO4, pH 7.4
eluent: 4M MgCl2
affinity adsorbent: IL-4, immobilised to Sepharose gel
pre-column: 1 x10 cm column (Biorad)
filling for pre-column: CM Sepharose fast flow (Pharmacia)
The affinity matrix (2 ml) was packed in a sterile Pasture pipette. The so prepared affinity column
was washed with 10 volumes of PBS and stored at 4oC. The filling for the pre-column (CM
Sepharose fast flow) was washed several times with 20 x PBS, using a funnel. The gel was stored
under 20 x PBS at 4oC. Immediately before the purification step, 2-3 ml were used to fill the pre-
column, which was washed with 10 volumes of PBS.
The protein containing supernatant was thawed out and centrifuged at 2500 rpm (Megafuge 1.0,
Heraeus) for 10 min to eliminate the precipitate, resulting from freezing. After the affinity
column and the pre-column were connected, the protein material was loaded in a way that it
passed slowly (about 100 ml/h) first through the pre-column. The two columns were
disconnected and the affinity column was washed with 10 column volumes (20 ml) of PBS.
During the elution, which was performed with 4 M MgCl2, 5-6 protein fractions were collected
(each 1.5 ml). The described procedure was carried out at 4oC. The protein concentration was
measured at the absorption spectrum range 250-320 nm (Kontron Uvikon 930
Spectrophotometer). The quality of the protein was analyzed by an SDS-PAGE, where 15 µl of
every fraction were loaded. The fractions containing the highest amount of pure protein were
combined.
The pre-column could be used only once, and then had to be cleaned and refilled with fresh CM
Sepharose. After elution, the affinity column was washed with 20 ml of PBS and recovered in
this way for the next protein purification. It was stored at 4oC under PBS.
2.13.2.2 Affinity chromatography using X14/38 as a ligand PBS: 120mM NaCl, 2mM KCl, 3mM NaH2PO4, pH 7.4
eluent: 4M MgCl2
affinity adsorbent: X-14-38, bond to Sepharose gel
57

________________________________________________________2. Materials and Methods
pre-column: 1 x10 cm column (Biorad)
filling for pre-column: CM Sepharose fast flow (Pharmacia)
X14/38 is an anti-IL-4BP monoclonal antibody, which was used as a ligand for the purification of
low-affinity IL-4BP variants that could not be purified by the method described in above.
The procedure is essentially the same as described in 2.12.2.1. The main difference was, that the
protein containing supernatant was loaded very slowly (usually overnight) onto the columns.
2.13.2.3 Dialysis After the purification by an affinity column, the fractions containing the highest amount of pure
IL-4BP, were combined and dialyzed in order to reduce the high salt concentration. The protein
solution was placed in a semi-permeable dialysis tubing (type 20/32, Roth) made of cellulose
acetate. The dialysis was performed in 2 l of PBS, which was stirred at 4oC overnight. At the next
day, the buffer was exchanged with fresh and the dialysis repeated one more night. To prevent
contamination with foreign proteins, the tubing was touched only through gloves.
2.13.2.4 Concentration of proteins by ultrafiltration ultrafilter: YM10 = 10000 MW (Amicon)
apparatus: stirred cell covering range 1-10 ml (Amicon 8010)
During ultrafiltration, water and other small molecules were driven out of the protein solution
through a semi-permeable membrane by a transmembrane force, such as high pressure.
The new membrane was washed according to the manufacturer’s instructions and stored under
30% ethanol at 4oC. Before use, the filter was washed with dH2O. The system was assembled and
the membrane was placed with the glossy side toward the solution. It was rinsed by filtering a
few ml of PBS at 3.5 atm. PBS was replaced by the dialyzed protein solution (10-15 ml) and
pressure of 4 atm was applied until the protein sample reached a volume of 1-1.5 ml. The
ultrafilter was rinsed in dH2O and stored under 30% ethanol solution at 4oC. The protein
concentration was measured at the absorption spectrum range 250-320 nm. Aliquots of 350 µl
were frozen at -20oC and further biotinylated.
58
________________________________________________________2. Materials and Methods
2.14 Analysis of Protein-Protein Interactions by BIAcore Technology The analysis of kinetic and thermodynamic data of protein-protein interactions between the
extracellular domain of IL-4 receptor (IL-4BP) and its mutated variants with the ligand (IL-4)
was performed with a BIAcore 2000 (Pharmacia). BIAcore 2000 is an instrument, which
measures bio-molecular interactions in real time without labeling of the interactants and allows
detailed investigation of the reaction kinetics by analysis of the resultant signals (Karlsson, R. &
Fealt, A., 1997).
For this purpose, one interactant (here IL-4BP or its variants) is immobilized on the surface of a
sensor chip and a solution containing the other binding partner (IL-4) flows continuously over the
chip. The sensor chip consists of a glass slide coated with a thin gold film to which is attached, by
an inert linker layer, a dextran matrix onto which the mentioned interactant can be immobilized
using well-defined chemistry. The sensor chip forms one wall of a micro-flow cell where its
matrix covered side comes into contact with the solution containing the second interactant. This
system uses the detection principle of surface plasmon resonance. During the interaction, light
passing a prism is focused onto the gold surface of the sensor chip through the glass, and
reflected light is monitored. Evanescent wave photons produced by the incident polarized light
interact with free oscillating electrons (plasmons) in the gold surface. Resonance occurs at a
critical angle of the incident light, and light energy is transferred to electrons in the metal film
surface, causing a minima in the reflected light. This angle depends on the refractive index at, or
close to the metal surface opposite to where the light is focused. By measuring small changes in
refractive index, the instrument monitors the change in mass as a ligand binds to, or dissociates
from, its binding partner. Data are presented as sensograms that show the change in resonance
units (RU) versus time. For proteins, which have a refractive index increment of approximately
0.18, a signal of 1000 RU is equivalent to a surface concentration of 1 ng/mm2 (Stenberg, E. et
al., 1990).
Association is monitored when a sample is injected and binding occurs to the immobilized
interactant. After sample injection, buffer alone flows over the sensor surface and dissociation
parameters can be recorded. At the end of the experiment, the surface can be regenerated using
suitable reagents to remove remaining bound analyte without denaturing the immobilized
reaction partner and the chip can be used for a new cycle of measurements (Nice, E.C. &
Catimel, B., 1999)
59

________________________________________________________2. Materials and Methods
2.14.1 Immobilization of Proteins by Streptavidin-Biotin Coupling After streptavidin was covalently immobilized onto the surface of a sensor chip, the biotinylated
protein was bound to the prepared matrix.
sensor chip: CM5
EDC: 50mM N-Ethyl-N´-(dimethylaminopropyl) carbodiimide
NHS: 200mM N-Hydroxysuccinimide
HBS buffer: 10mM HEPES pH 7.4, 150mM NaCl, 3.4 mM EDTA,
0.005% Surfactant P20
streptavidin solution: 100µg/ml streptavidin in 10mM NaOAc, pH 4.5
regeneration buffer: 100mM HOAc, 1M NaCl, pH 3.0
The immobilization and preparation of a sensor chip was carried out according to the
manufacturer’s instructions (BIAcore Handbook, 1995). The immobilization of streptavidin was
run automatically following the program shown in Table 2.11.
Table 2.11: Immobilization of streptavidin by amine coupling
Immobilization procedure continuously flow buffer HBS flow rate 5 µl/min EDC/NHS (50 mM/200 mM) 35 µl (7 min)
streptavidin (100 µg/ml) 35 µl (7 min) 1 M ethanolamine-HCl 35 µl (7 min)
The concentration of biotinylated proteins used for immobilization was usually 0.1 µg/ml.
2.14.2 Measuring and Evaluation of Protein-Protein Interactions A typical sensogram recorded with BIAcore 2000 is characterized by the following three phases:
1) Association phase - when the sample is injected; increases in the signal correspond to binding
to the immobilized interactant.
2) The signal reaches a constant plateau when equilibrium between association and dissociation is
reached.
3) Dissociation phase - occurs when buffer alone flows over the sensor surface. The decrease in
signal reflects dissociation of analyte from the surface-bound complex.
60
________________________________________________________2. Materials and Methods
Kinetic rate constants can be derived from the association and dissociation phases of the
sensogram. The height of the plateau represents the thermodynamic affinity of binding.
The program BIAevaluation 2.0 was used to calculate the kinetic and thermodynamic constants.
The theoretical equations, which describe the kinetics and equilibrium of interactions in real-time
BIA, are listed in Appendix 1.
2.14.3 Assessment of the Energetic Effects of Introduced Mutations Substitution of a residue, which is direct or indirect involved in binding is followed by a change
in the binding energy of the protein-protein complex. The equilibrium dissociation constants
determined by experiments performed with the BIAcore 2000 analytical system were used to
calculate the loss of binding free energy (∆∆G) characterizing the mutated variants:
∆∆G = R*T*ln (Kd mut/Kd wt)
where R is the gas constant, T is the absolute temperature, Kd mut is the equilibrium dissociation
constant for the mutant variant, Kd wt is the equilibrium dissociation constant for the wild-type
interaction.
The total change in binding free energy (∆G) for the interaction of IL-4 and IL-4BP was
calculated according to the formula:
∆G = -R*T*ln (1/Kd)
where R is the gas constant, T is the absolute temperature, Kd is the equilibrium dissociation
constant for the IL4/IL-4BP interaction.
61
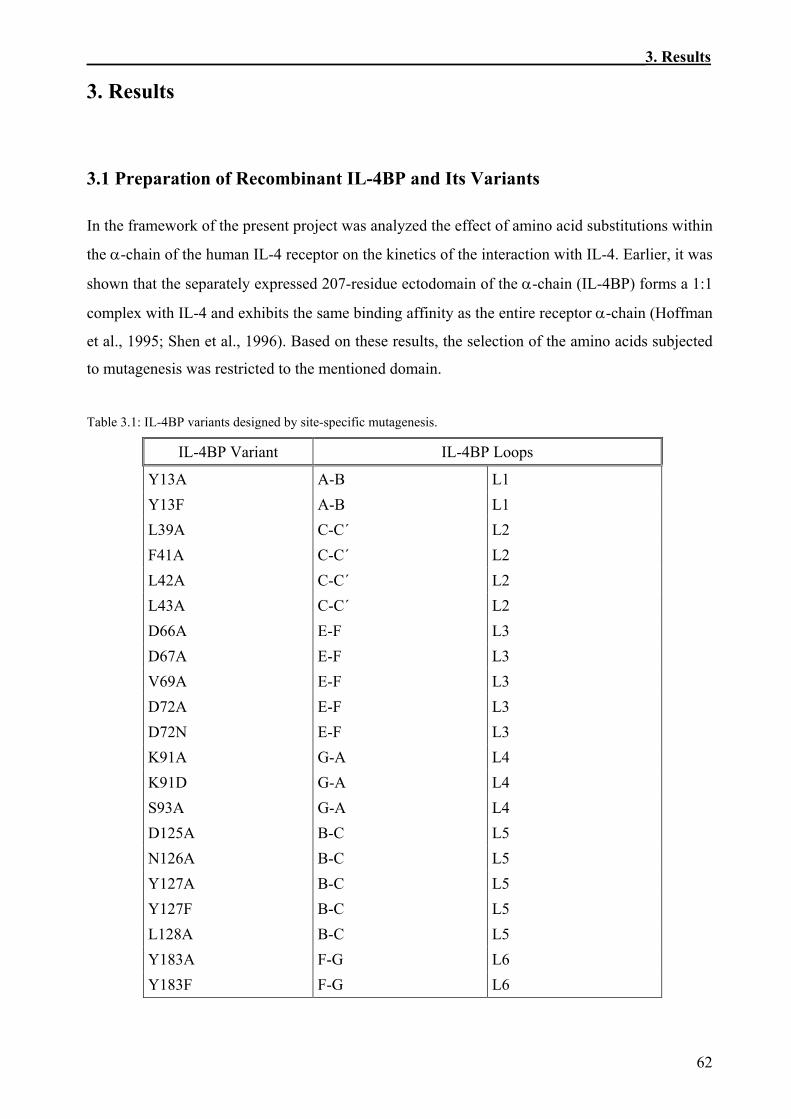
______________________________________________________________________3. Results
3. Results
3.1 Preparation of Recombinant IL-4BP and Its Variants
In the framework of the present project was analyzed the effect of amino acid substitutions within
the α-chain of the human IL-4 receptor on the kinetics of the interaction with IL-4. Earlier, it was
shown that the separately expressed 207-residue ectodomain of the α-chain (IL-4BP) forms a 1:1
complex with IL-4 and exhibits the same binding affinity as the entire receptor α-chain (Hoffman
et al., 1995; Shen et al., 1996). Based on these results, the selection of the amino acids subjected
to mutagenesis was restricted to the mentioned domain.
Table 3.1: IL-4BP variants designed by site-specific mutagenesis.
IL-4BP Variant IL-4BP Loops
Y13A A-B L1 Y13F A-B L1 L39A C-C´ L2 F41A C-C´ L2 L42A C-C´ L2 L43A C-C´ L2 D66A E-F L3 D67A E-F L3 V69A E-F L3 D72A E-F L3 D72N E-F L3 K91A G-A L4 K91D G-A L4 S93A G-A L4 D125A B-C L5 N126A B-C L5 Y127A B-C L5 Y127F B-C L5 L128A B-C L5 Y183A F-G L6 Y183F F-G L6
62

______________________________________________________________________3. Results
All variants of IL-4BP, which were constructed by specific substitutions of a single amino acid,
are shown in Table 3.1. Variants D66A, D67A, V69A, D125A, N126A, Y127A and Y128A were
expressed and purified by Dr. Yonghong Wang and further examined by the author. The study
was accomplished by analyses of variants containing two independent mutations (Table 3.2).
Table 3.2: A list of the IL-4BP double mutants. The contact clusters are defined according Hage et al., 1999.
Contact cluster Variant I II III
Y13F/L39A Y13 L39 Y13F/F41A Y13 F41 Y13F/D67A Y13 D67 Y13F/V69A Y13 V69 Y13F/D72N Y13 D72 Y13F/Y127A Y13 Y127 Y13F/Y183F Y13 Y183 D72N/L39A D72 L39 D72N/F41A D72 F41 D72N/D67A D72 D67 D72N/V69A D72 V69 D72N/Y127A Y127 D72 D72N/Y183F Y183 D72
The proteins representing IL-4BP and its variants, without any exceptions, were recombinantly
expressed in an eukaryotic expression system (Baculovirus expression system). Since in the
human IL-4BP six sites of potential N-linked glycosylation are present, the expression of
functionally active recombinant proteins requires eukaryotic conditions. Therefore, was chosen
the Baculovirus expression system that offers the advantage to express high levels of soluble
proteins in which post-translational modifications are performed.
The kinetics of the binding of IL-4 to the IL-4BP variants was measured by means of the
BIAcore system after the receptor variants were immobilized on the biosensor matrix. This
method requires high purity and homogeneity of the examined samples because this is the only
way to determine the exact concentration of the recombinant IL-4BP variants. The variants that
had relatively higher affinity to IL-4 were purified by affinity chromatography exploring IL-4 as
a ligand. For the rest of the proteins a chromatographic step using anti-IL-4BP antibody was
performed. Both procedures resulted in highly pure protein fractions, which could be used for
BIAcore measurements without any necessity of further purification.
63

______________________________________________________________________3. Results
3.1.1 Cloning of IL-4BP and Its Variants in the Baculovirus Transfer Vector pAcGP67B
The cDNA representing the first 207 residues of mature human IL-4 receptor α chain,
extracellular domain was mutated by recombinant PCR. As a template was used the vector
pRPR9IL4FD (C. Söder, based on vector RTSpRC109, McCarthy et al., 1985, Appendix 2). It
contains an IL-4BP cDNA modified at position C182A, in which the free cysteine is substituted
in order to prevent the formation of disulfide bridges. The complete nucleotide and amino acid
sequence of hIL-4BP is shown in Figure 3.1.
Y A F K V L Q E P T C V S D Y M S I S T 5´CTATGCATTTAAGGTCTTGCAGGAGCCCACCTGCGTCTCCGACTACATGAGCATCTCTAC 3´ 10 20 30 40 50 60
3´GATACGTAAATTCCAGAACGTCCTCGGGTGGACGCAGAGGCTGATGTACTCGTAGAGATG 5´ C E W K M N G P T N C S T E L R L L Y Q 5´TTGCGAGTGGAAGATGAATGGTCCCACCAATTGCAGCACCGAGCTCCGCCTGTTGTACCA 3´ 70 80 90 100 110 120
3´AACGCTCACCTTCTACTTACCAGGGTGGTTAACGTCGTGGCTCGAGGCGGACAACATGGT 5´ L V F L L S E A H T C I P E N N G G A G 5´GCTGGTTTTTCTGCTCTCCGAAGCCCACACGTGTATCCCTGAGAACAACGGAGGCGCGGG 3´ 130 140 150 160 170 180
3´CGACCAAAAAGACGAGAGGCTTCGGGTGTGCACATAGGGACTCTTGTTGCCTCCGCGCCC 5´ C V C H L L M D D V V S A D N Y T L D L 5´GTGCGTGTGCCACCTGCTCATGGATGACGTGGTCAGTGCGGATAACTATACACTGGACCT 3´ 190 200 210 220 230 240
3´CACGCACACGGTGGACGAGTACCTACTGCACCAGTCACGCCTATTGATATGTGACCTGGA 5´ W A G Q Q L L W K G S F K P S E H V K P 5´GTGGGCTGGGCAGCAGCTGCTGTGGAAGGGCTCCTTCAAGCCCAGCGAGCATGTGAAACC 3´ 250 260 270 280 290 300
3´CACCCGACCCGTCGTCGACGACACCTTCCCGAGGAAGTTCGGGTCGCTCGTACACTTTGG 5´ R A P G N L T V H T N V S D T L L L T W 5´CAGGGCCCCAGGAAACCTGACAGTTCACACCAATGTCTCCGACACTCTGCTGCTGACCTG 3´ 310 320 330 340 350 360
3´GTCCCGGGGTCCTTTGGACTGTCAAGTGTGGTTACAGAGGCTGTGAGACGACGACTGGAC 5´ S N P Y P P D N Y L Y N H L T Y A V N I 5´GAGCAACCCGTATCCCCCTGACAATTACCTGTATAATCATCTCACCTATGCAGTCAACAT 3´ 370 380 390 400 410 420
3´CTCGTTGGGCATAGGGGGACTGTTAATGGACATATTAGTAGAGTGGATACGTCAGTTGTA 5´ W S E N D P A D F R I Y N V T Y L E P S 5´TTGGAGTGAAAACGACCCGGCAGATTTCAGAATCTATAACGTGACCTACCTAGAACCCTC 3´ 430 440 450 460 470 480
3´AACCTCACTTTTGCTGGGCCGTCTAAAGTCTTAGATATTGCACTGGATGGATCTTGGGAG 5´
64

______________________________________________________________________3. Results
L R I A A S T L K S G I S Y R A R V R A 5´CCTCCGCATCGCAGCCAGCACCCTGAAGTCTGGGATTTCCTACAGGGCACGGGTGAGGGC 3´ 490 500 510 520 530 540
3´GGAGGCGTAGCGTCGGTCGTGGGACTTCAGACCCTAAAGGATGTCCCGTGCCCACTCCCG 5´ W A Q A Y N T T W S E W S P S T K W H N 5´CTGGGCTCAGGCCTATAACACCACCTGGAGTGAGTGGAGCCCCAGCACCAAGTGGCACAA 3´ 550 560 570 580 590 600
3´GACCCGAGTCCGGATATTGTGGTGGACCTCACTCACCTCGGGGTCGTGGTTCACCGTGTT 5´ S Y R E P F E Q H ∗ 5´CTCCTACAGGGAGCCCTTCGAGCAGCACTAG 3´ 610 620 630
3´GAGGATGTCCCTCGGGAAGCTCGTCGTGATC 5´ Figure 3.1: Nucleotide and amino acid sequence of hIL-4BP cDNA.
The PCR reactions were divided into two steps. During the first step (PCR 1) two fragments
(PCR1a and PCR1b) were separately synthesized and a mutation of interest was introduced with
the help of mutant primers containing one mismatch codon. For variants which were constracted
by a substitution of a single amino acid, as a template in this reaction was used the wild-type
cDNA. To produce variants in which two different amino acids were mutated, as a template was
used a plasmid of hIL-4BP containing already one modified site and applying the described PCR
techniques a second mutation was created. The length of the fragments differed for the particular
variants depending on the exact location of the introduced mutation (Figure 3.2).
LMS PCR1a PCR1b PCR2 Figure 3.2: Reaction products from PCR 1 and PCR 2 of IL-4BP.
The fragments from PCR 1 (20-30 ng) were used as a template in PCR 2. Since the external
primers specific for PCR 2 were in large excess compared to the amount of primers left from
PCR 1a and PCR 1b, the purity of the reaction product was ensured. One of the external primers
65

______________________________________________________________________3. Results
in this step introduces a BamHI restriction site (WYH37) and the other (WYH38) contains a
wild-type sequence. The product of PCR 2 has the length of 682 bp for all mutants in this method
and yielded 1-3 µg DNA.
After the reaction mixture from PCR 2 was precipitated in a volume of 30 µl, and than digested
by BamHI. The restriction product containing the mutated IL-4BP cDNA has a length of 635 bp.
This fragment was isolated and purified exploring an agrose gel electrophoresis and glass milk
elusion. It was inserted into the baculovirus transfer vector pAcGP67B cut by BamHI (Appendix
3). The plasmid caring the mutated IL-4BP (Figure 3.3) was then used for electrotransformation
of competent E.coli (JM 103 recA- or JM 109).
pAcGP67B IL-4BP
10400 bpColEori
Gp67 Secretion SignalIL-4BP
BamHI
Polyhedrin promoter
BamHI
AmpR
Figure 3.3: Baculovirus transfer vector pAcGP67B with cloned IL-4BP.
The first selection of plasmid–containing E.coli was performed by plating the transformation cell
suspension on ampicillin agar plates. Since the plasmid contains an ampicillin resistance gene,
only bacterial cells, which carry the plasmid pAcGP67B/IL-4BP, would be able to form colonies.
The selection procedure was completed by analytical restriction endonuclease digestion. For this
were prepared plasmid DNAs from several individual clones at analytical scale. The intact
circular plasmids were digested first with BamHI to confirm the presence of IL-4BP in the
plasmid. The positive clones showed a band of 635 bp after the restriction reaction, which was
visualized on a 1 % agarose gel (Figure 3.4a). Only in few plasmid samples an IL-4BP insert was
66

______________________________________________________________________3. Results
not found. Most likely the reason that bacterial clones, which do not carry IL-4BP, grew up over
agar plates, is not completed dephosporylation of vector ends. Since only one cutting enzyme was
used during cloning, the positive plasmid samples were analyzed by a second restriction reaction
with EcoRV and SacI. The products from this reaction give information about the orientation of
the inserted IL-4BP fragment within the plasmid pAcGP67B. The cutting site of SacI is unique
and located asymmetrically within the cDNA sequence of IL-4BP. Therefore plasmids which
inserted the IL-4BP cDNA parallel to the direction of transcription, showed after such restriction
reaction a shorter fragment of 320 bp, and those of them which inserted it in the opposite
direction were characterized by a fragment of 800 bp (Figure 3.4b). Usually, equal number of
bacterial colonies representing both kinds of plasmids was detected, as it was theoretically
expected.
LMS 1 2 3 4 5 6 7 8 9 MHS LMS 1 2 3 4 5 6 7 8 9
a) Analytical restriction with BamHI. Lines 1 to 9 represent positive clones.
b) Analytical restriction with EcoRV and SacI. Lines 1,2,4,6 and 9 represent positive clones. Lines 3, 5, 7 and 8 represent clones which inserted .the modified cDNA but in the “wrong” direction.
Figure 3.4: Analytical restriction of pAcGP67B containing the modified IL-4BP cDNA.
Plasmid DNA was isolated from clones, which were positive after all selection steps. Such
preparations were used for sequence analyses and therefore another purification procedure was
used which increased the amount and the quality of purified DNA (see 2.7.11.2). Sequencing was
performed with 5´- and 3´- external primers (MF37 and WYH39). The sequence analysis
confirmed the presence of the introduced mutation in all samples. No other mutations in the DNA
sequence were detected. After the mutation was verified by sequencing, the mutant plasmid DNA
was prepared at large scale for storage and following co-transfection (see 2.7.11.3). With the used
method usually 20 to 30 mg of plasmid DNA were obtained from 40 ml of bacterial culture.
67
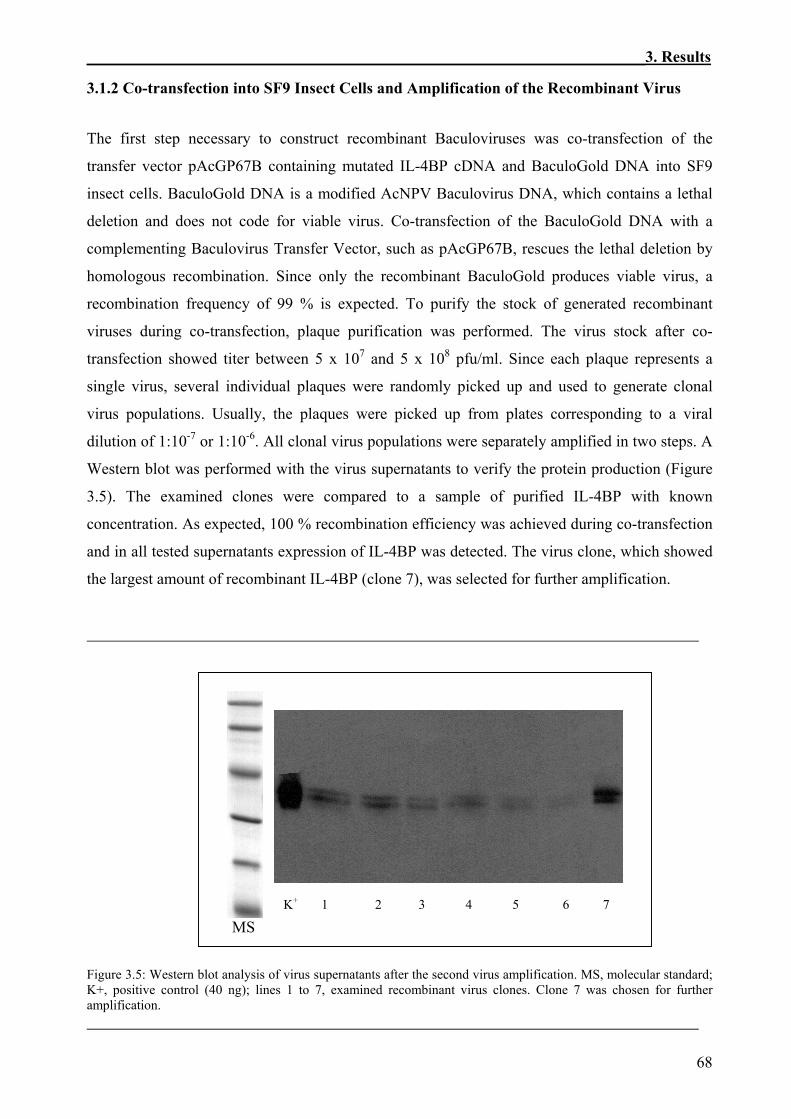
______________________________________________________________________3. Results
3.1.2 Co-transfection into SF9 Insect Cells and Amplification of the Recombinant Virus The first step necessary to construct recombinant Baculoviruses was co-transfection of the
transfer vector pAcGP67B containing mutated IL-4BP cDNA and BaculoGold DNA into SF9
insect cells. BaculoGold DNA is a modified AcNPV Baculovirus DNA, which contains a lethal
deletion and does not code for viable virus. Co-transfection of the BaculoGold DNA with a
complementing Baculovirus Transfer Vector, such as pAcGP67B, rescues the lethal deletion by
homologous recombination. Since only the recombinant BaculoGold produces viable virus, a
recombination frequency of 99 % is expected. To purify the stock of generated recombinant
viruses during co-transfection, plaque purification was performed. The virus stock after co-
transfection showed titer between 5 x 10⁷ and 5 x 10⁸ pfu/ml. Since each plaque represents a
single virus, several individual plaques were randomly picked up and used to generate clonal
virus populations. Usually, the plaques were picked up from plates corresponding to a viral
dilution of 1:10-7 or 1:10-6. All clonal virus populations were separately amplified in two steps. A
Western blot was performed with the virus supernatants to verify the protein production (Figure
3.5). The examined clones were compared to a sample of purified IL-4BP with known
concentration. As expected, 100 % recombination efficiency was achieved during co-transfection
and in all tested supernatants expression of IL-4BP was detected. The virus clone, which showed
the largest amount of recombinant IL-4BP (clone 7), was selected for further amplification.
MS K+ 1 2 3 4 5 6 7
Figure 3.5: Western blot analysis of virus supernatants after the second virus amplification. MS, molecular standard; K+, positive control (40 ng); lines 1 to 7, examined recombinant virus clones. Clone 7 was chosen for further amplification.
68
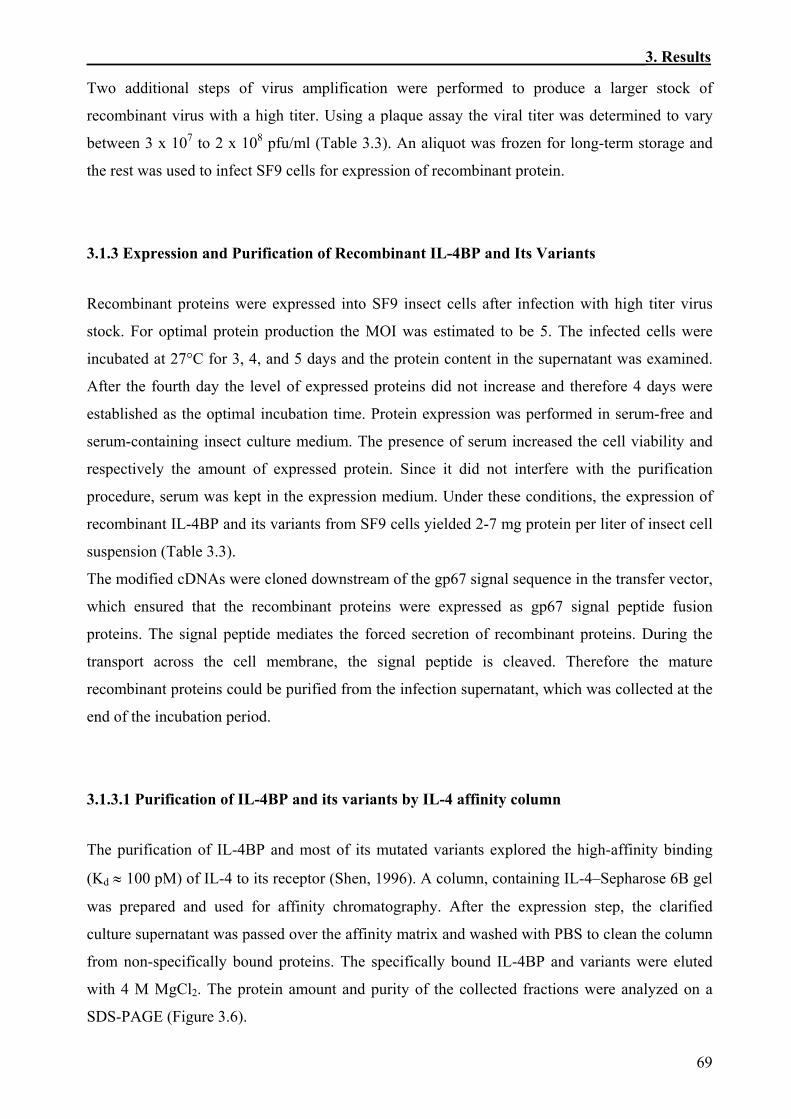
______________________________________________________________________3. Results
Two additional steps of virus amplification were performed to produce a larger stock of
recombinant virus with a high titer. Using a plaque assay the viral titer was determined to vary
between 3 x 10⁷ to 2 x 10⁸ pfu/ml (Table 3.3). An aliquot was frozen for long-term storage and
the rest was used to infect SF9 cells for expression of recombinant protein.
3.1.3 Expression and Purification of Recombinant IL-4BP and Its Variants Recombinant proteins were expressed into SF9 insect cells after infection with high titer virus
stock. For optimal protein production the MOI was estimated to be 5. The infected cells were
incubated at 27°C for 3, 4, and 5 days and the protein content in the supernatant was examined.
After the fourth day the level of expressed proteins did not increase and therefore 4 days were
established as the optimal incubation time. Protein expression was performed in serum-free and
serum-containing insect culture medium. The presence of serum increased the cell viability and
respectively the amount of expressed protein. Since it did not interfere with the purification
procedure, serum was kept in the expression medium. Under these conditions, the expression of
recombinant IL-4BP and its variants from SF9 cells yielded 2-7 mg protein per liter of insect cell
suspension (Table 3.3).
The modified cDNAs were cloned downstream of the gp67 signal sequence in the transfer vector,
which ensured that the recombinant proteins were expressed as gp67 signal peptide fusion
proteins. The signal peptide mediates the forced secretion of recombinant proteins. During the
transport across the cell membrane, the signal peptide is cleaved. Therefore the mature
recombinant proteins could be purified from the infection supernatant, which was collected at the
end of the incubation period.
3.1.3.1 Purification of IL-4BP and its variants by IL-4 affinity column The purification of IL-4BP and most of its mutated variants explored the high-affinity binding
(Kd ≈ 100 pM) of IL-4 to its receptor (Shen, 1996). A column, containing IL-4–Sepharose 6B gel
was prepared and used for affinity chromatography. After the expression step, the clarified
culture supernatant was passed over the affinity matrix and washed with PBS to clean the column
from non-specifically bound proteins. The specifically bound IL-4BP and variants were eluted
with 4 M MgCl2. The protein amount and purity of the collected fractions were analyzed on a
SDS-PAGE (Figure 3.6).
69

______________________________________________________________________3. Results
Table 3.3: Virus titer and protein expression of IL-4BP and its variants
Virus titer [pfu/ml]
Expressed protein Column used for purification Variant [mg/l cell suspension]
IL-4BP 1.8 x 10 8 7.0 IL-4 Y13A 5.6 x 10 7 4.0 Ab Y13F 7.0 x 10 7 5.5 IL-4 L39A 1.0 x 10 8 4.0 IL-4 F41A 1.1 x 10 8 4.5 IL-4 L42A 2.2 x 10 8 7.5 IL-4 L43A 2.3 x 10 8 6.5 IL-4 D66A 1.5 x 10 8 3.0 IL-4 D67A 2.0 x 10 8 3.0 IL-4 V69A 1.5 x 10 8 3.0 IL-4 D72A 1.4 x 10 8 3.5 Ab D72N 1.5 x 10 8 3.5 Ab K91A 2.3 x 10 7 4.5 IL-4 K91D 1.5 x 10 8 4.0 IL-4 S93A 2.5 x 10 7 4.5 IL-4 D125A 4.0 x 10 7 3.5 IL-4 N126A 2.3 x 10⁸ 3.5 IL-4 Y127A 6.0 x 10⁷ 2.0 IL-4 Y127F 8.0 x 10⁷ 6.0 IL-4 L128A 2.3 x 10⁸ 2.0 IL-4 Y183A 1.3 x 10⁸ 3.5 Ab Y183F 7 4.5 IL-4 Y13F/L39A 4.0 x 10⁷ 2.5 Ab Y13F/F41A 2.2 x 10⁸ 3.5 Ab Y13F/D67A 5.5 x 10⁷ 3.0 Ab Y13F/V69A 3.8 x 10⁷ 2.5 Ab Y13F/D72N 8.0 x 10⁷ 3.5 Ab Y13F/Y127A 2.2 x 10⁷ 3.5 Ab Y13F/Y183F 5.2 x 10⁷ 3.5 Ab D72N/L39A 7.9 x 10⁷ 2.5 Ab D72N/F41A 8.0 x 10⁷ 3.5 Ab D72N/D67A 6.0 x 10⁷ 3.0 Ab D72N/V69A 4.3 x 10⁷ 3.5 Ab D72N/Y127A 6.7 x 10⁷ 2.5 Ab D72N/Y183F 9.0 x 10⁷ 3.0 Ab
7.0 x 10
70

______________________________________________________________________3. Results
Usually, the first 3 to 4 fractions showed concentrations of pure protein in the range of 100 – 400
µg/ml and in the rest of the fractions the protein was either of an inadequate quality either of an
insignificant quantity. The best fractions were collected together, dialyzed against PBS and
concentrated by ultrafiltration to a total volume of 1.5 ml. The amount of protein in the
concentrated samples was determined by spectrophotometry and the purity was examined on a
SDS-PAGE. No difference was found between the quality of protein samples expressed in the
presence of FCS or in FCS-free culture medium.
MS St 1 2 3 4 Figure 3.6: Fractions after purification via IL-4 affinity column (variant F41A). MS, molecular standard; St, standard
of IL-4BP (1 µg); lines 1, 2, 3, 4, fractions 1 to 4, respectively.
IL-4BP and its variants produced in SF9 insect cells are extensively glycosylated. Accordingly,
on SDS gels they migrate as two bands with apparent molecular masses of 35 kDa and 32.5 kDa.
Respectively, variant N73A where a potential N-glycosylation site was modified exhibited only
one band, corresponding to 32.5 kDa (Figure 3.7).
Using the IL-4 affinity column successfully were purified IL-4BP, most variants included in the
alanine screening (L39A, F41A, L42A, L43A, D66A, D67A, V69A, N73A, K91A, S93A,
D125A, N126A, Y127A, and L128A), variants in which the original tyrosine amino acid was
exchanged by phenylalanine (Y13F, Y127F, and Y183F) and variant K91D (Table 3.3, Figure
3.7). The total amount of pure protein varied between 200 µg and 1 mg. A correlation between
the protein amount and purity on the one side, and the subsequently determined binding affinity
on the other, was observed for the variants purified by an IL-4 affinity column. Mutated variants
71

______________________________________________________________________3. Results
that later showed a similar Kd to this which characterizes the interaction between IL-4 and IL-
4BP in BIAcore measurements, were yielded in larger amount and with better quality than the
variants which exhibited grater values of Kd.
MS IL-4BP Y13F L39A F41A L42A L43A D66A D67A V69A N73A
900 µgTotal amount of purifiedprotein
700 µg 500 µg 550 µg 1000 µg 850 µg 300 µg 300 µg 400 µg 150 µg
K91AMS K91D S93A D125A N126A Y127A L128AY127F Y183F
Total amountof purifiedprotein
600 µg 500 µg 600 µg 400 µg 400 µg 200 µg 750 µg 200 µg 450 µg Figure 3.7: Variants purified by an IL-4 containing affinity column.
Figure 3.8 shows the result of the purification of variant D72A via IL-4 affinity column in
comparison to IL-4BP, which was prepared in parallel. Since it was the first variant for which the
purification step did not give a useful protein and the Western blot showed lower levels of
expression, contamination in the virus clone was considered and a new viral stock was prepared.
A Western blot after subcloning revealed that the newly generated viral clones expressed the
recombinant protein in amounts comparable to all other variants, which were already successfully
purified. Despite the convincing expression demonstrated by Western blot, the second attempt for
72
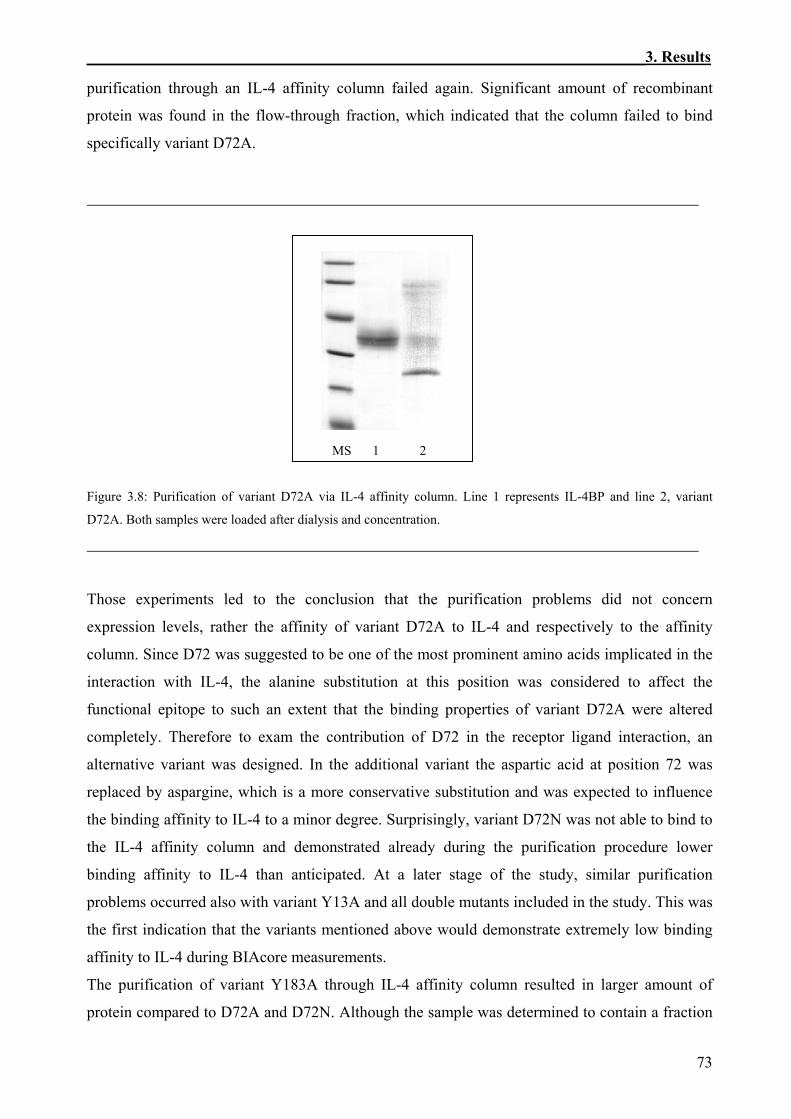
______________________________________________________________________3. Results
purification through an IL-4 affinity column failed again. Significant amount of recombinant
protein was found in the flow-through fraction, which indicated that the column failed to bind
specifically variant D72A.
MS 1 2 Figure 3.8: Purification of variant D72A via IL-4 affinity column. Line 1 represents IL-4BP and line 2, variant
D72A. Both samples were loaded after dialysis and concentration.
Those experiments led to the conclusion that the purification problems did not concern
expression levels, rather the affinity of variant D72A to IL-4 and respectively to the affinity
column. Since D72 was suggested to be one of the most prominent amino acids implicated in the
interaction with IL-4, the alanine substitution at this position was considered to affect the
functional epitope to such an extent that the binding properties of variant D72A were altered
completely. Therefore to exam the contribution of D72 in the receptor ligand interaction, an
alternative variant was designed. In the additional variant the aspartic acid at position 72 was
replaced by aspargine, which is a more conservative substitution and was expected to influence
the binding affinity to IL-4 to a minor degree. Surprisingly, variant D72N was not able to bind to
the IL-4 affinity column and demonstrated already during the purification procedure lower
binding affinity to IL-4 than anticipated. At a later stage of the study, similar purification
problems occurred also with variant Y13A and all double mutants included in the study. This was
the first indication that the variants mentioned above would demonstrate extremely low binding
affinity to IL-4 during BIAcore measurements.
The purification of variant Y183A through IL-4 affinity column resulted in larger amount of
protein compared to D72A and D72N. Although the sample was determined to contain a fraction
73
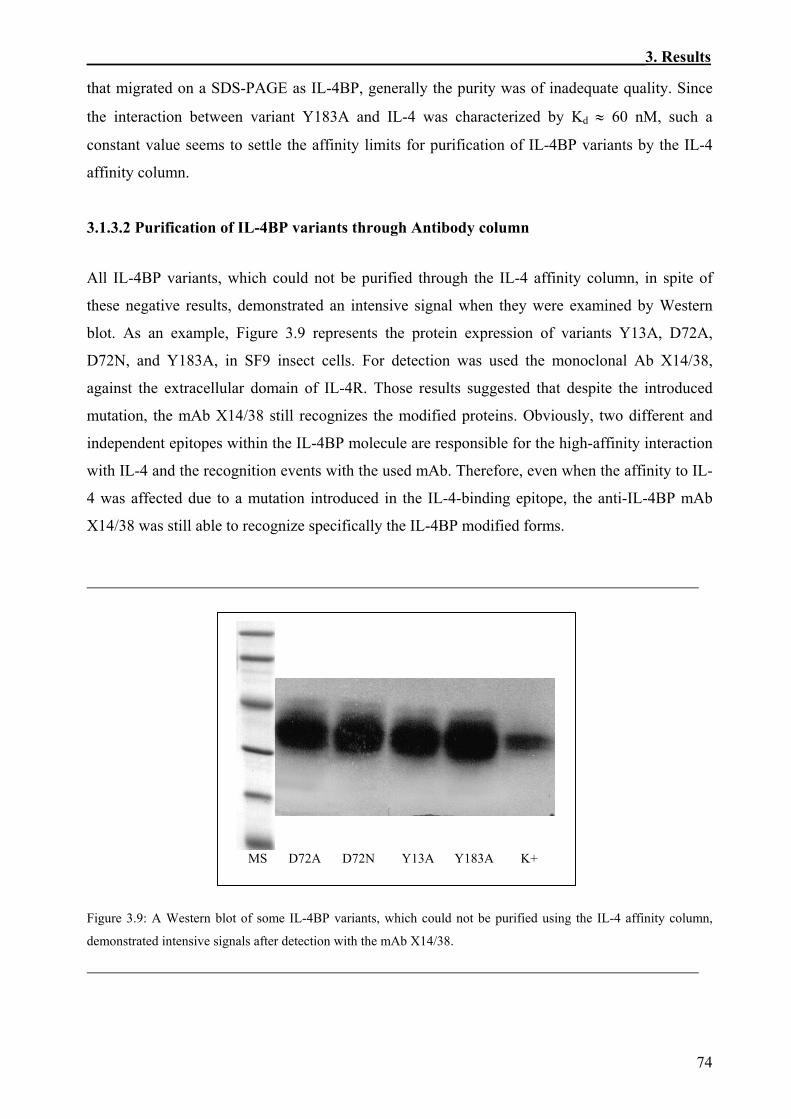
______________________________________________________________________3. Results
that migrated on a SDS-PAGE as IL-4BP, generally the purity was of inadequate quality. Since
the interaction between variant Y183A and IL-4 was characterized by Kd ≈ 60 nM, such a
constant value seems to settle the affinity limits for purification of IL-4BP variants by the IL-4
affinity column.
3.1.3.2 Purification of IL-4BP variants through Antibody column All IL-4BP variants, which could not be purified through the IL-4 affinity column, in spite of
these negative results, demonstrated an intensive signal when they were examined by Western
blot. As an example, Figure 3.9 represents the protein expression of variants Y13A, D72A,
D72N, and Y183A, in SF9 insect cells. For detection was used the monoclonal Ab X14/38,
against the extracellular domain of IL-4R. Those results suggested that despite the introduced
mutation, the mAb X14/38 still recognizes the modified proteins. Obviously, two different and
independent epitopes within the IL-4BP molecule are responsible for the high-affinity interaction
with IL-4 and the recognition events with the used mAb. Therefore, even when the affinity to IL-
4 was affected due to a mutation introduced in the IL-4-binding epitope, the anti-IL-4BP mAb
X14/38 was still able to recognize specifically the IL-4BP modified forms.
MS D72A D72N Y13A Y183A K+ Figure 3.9: A Western blot of some IL-4BP variants, which could not be purified using the IL-4 affinity column,
demonstrated intensive signals after detection with the mAb X14/38.
74
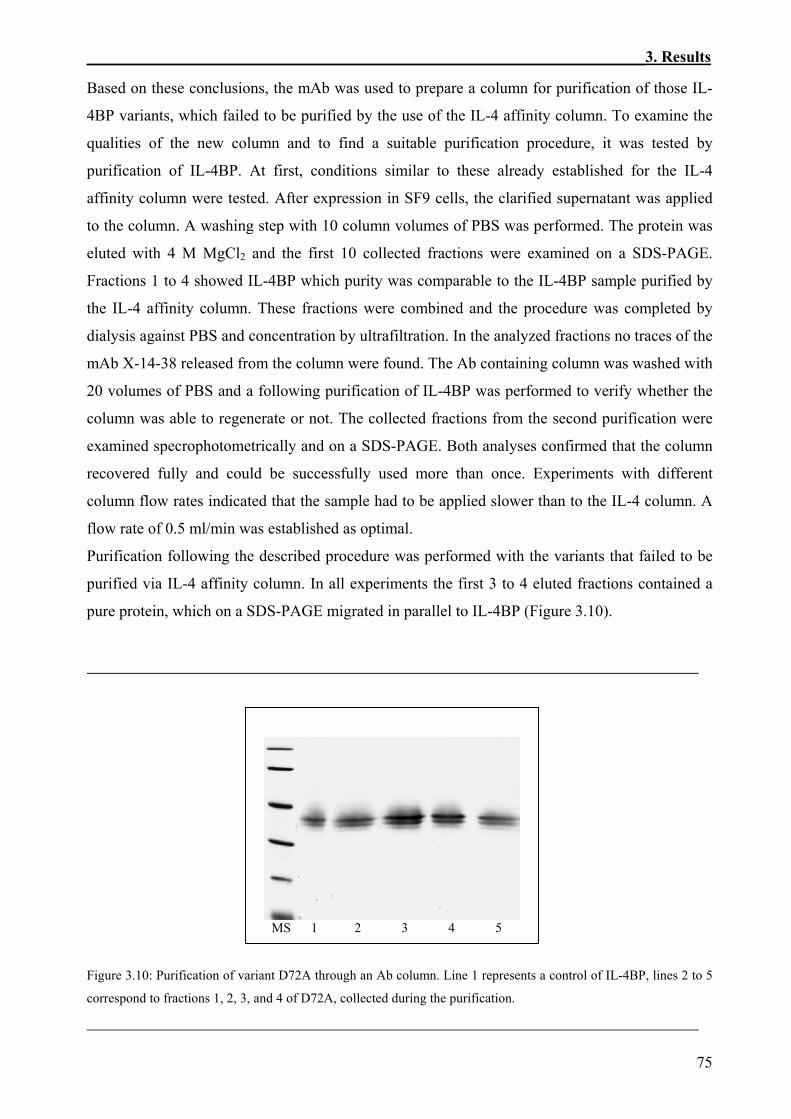
______________________________________________________________________3. Results
Based on these conclusions, the mAb was used to prepare a column for purification of those IL-
4BP variants, which failed to be purified by the use of the IL-4 affinity column. To examine the
qualities of the new column and to find a suitable purification procedure, it was tested by
purification of IL-4BP. At first, conditions similar to these already established for the IL-4
affinity column were tested. After expression in SF9 cells, the clarified supernatant was applied
to the column. A washing step with 10 column volumes of PBS was performed. The protein was
eluted with 4 M MgCl2 and the first 10 collected fractions were examined on a SDS-PAGE.
Fractions 1 to 4 showed IL-4BP which purity was comparable to the IL-4BP sample purified by
the IL-4 affinity column. These fractions were combined and the procedure was completed by
dialysis against PBS and concentration by ultrafiltration. In the analyzed fractions no traces of the
mAb X-14-38 released from the column were found. The Ab containing column was washed with
20 volumes of PBS and a following purification of IL-4BP was performed to verify whether the
column was able to regenerate or not. The collected fractions from the second purification were
examined specrophotometrically and on a SDS-PAGE. Both analyses confirmed that the column
recovered fully and could be successfully used more than once. Experiments with different
column flow rates indicated that the sample had to be applied slower than to the IL-4 column. A
flow rate of 0.5 ml/min was established as optimal.
Purification following the described procedure was performed with the variants that failed to be
purified via IL-4 affinity column. In all experiments the first 3 to 4 eluted fractions contained a
pure protein, which on a SDS-PAGE migrated in parallel to IL-4BP (Figure 3.10).
MS 1 2 3 4 5 Figure 3.10: Purification of variant D72A through an Ab column. Line 1 represents a control of IL-4BP, lines 2 to 5
correspond to fractions 1, 2, 3, and 4 of D72A, collected during the purification.
75
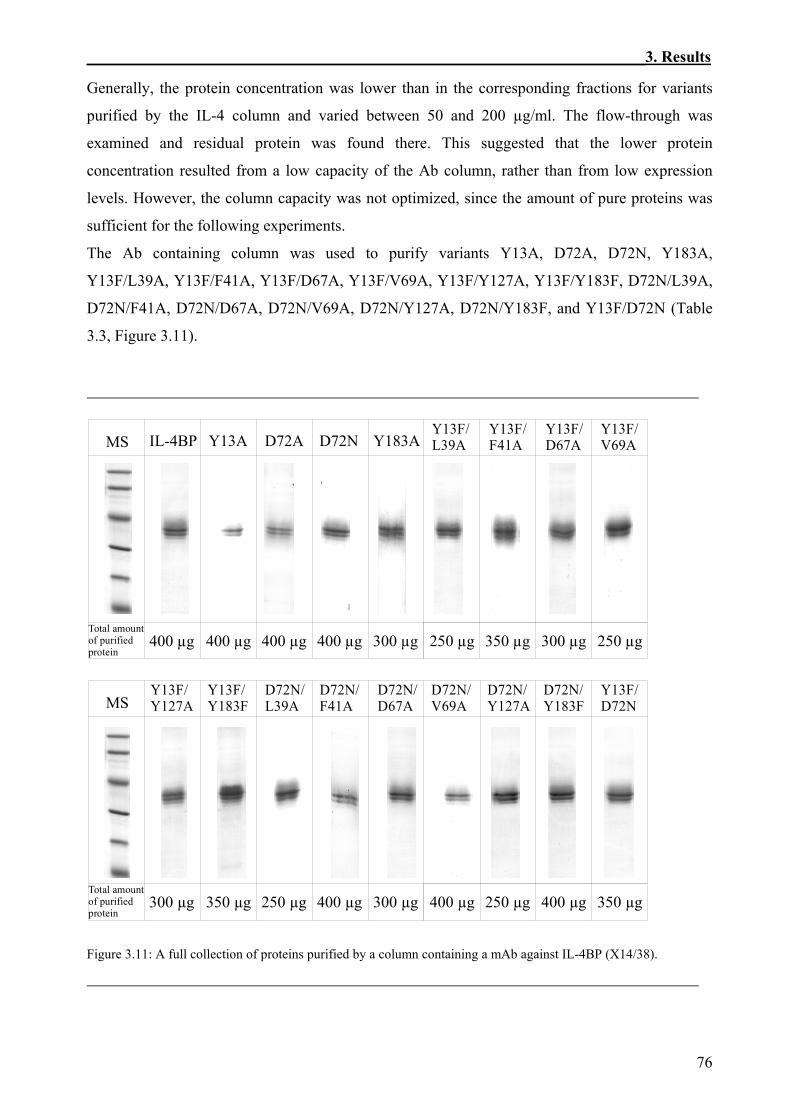
______________________________________________________________________3. Results
Generally, the protein concentration was lower than in the corresponding fractions for variants
purified by the IL-4 column and varied between 50 and 200 µg/ml. The flow-through was
examined and residual protein was found there. This suggested that the lower protein
concentration resulted from a low capacity of the Ab column, rather than from low expression
levels. However, the column capacity was not optimized, since the amount of pure proteins was
sufficient for the following experiments.
The Ab containing column was used to purify variants Y13A, D72A, D72N, Y183A,
Y13F/L39A, Y13F/F41A, Y13F/D67A, Y13F/V69A, Y13F/Y127A, Y13F/Y183F, D72N/L39A,
D72N/F41A, D72N/D67A, D72N/V69A, D72N/Y127A, D72N/Y183F, and Y13F/D72N (Table
3.3, Figure 3.11).
MS
Total amountof purifiedprotein
400 µg 400 µg 400 µg 400 µg 300 µg 250 µg 350 µg 300 µg 250 µg
IL-4BP Y13A D72A D72N Y183AY13F/L39A
Y13F/F41A
Y13F/D67A
Y13F/V69A
MS
Total amountof purifiedprotein
300 µg 350 µg 250 µg 400 µg 300 µg 400 µg 250 µg 400 µg 350 µg
Y13F/D72N
Y13F/Y127A
Y13F/Y183F
D72N/L39A
D72N/F41A
D72N/D67A
D72N/V69A
D72N/Y127A
D72N/Y183F
Figure 3.11: A full collection of proteins purified by a column containing a mAb against IL-4BP (X14/38).
76

______________________________________________________________________3. Results
None of them failed to be purified, confirming that the substituted amino acids are located out of
the epitope recognized by X14/38. Accordingly, independent on the kind of introduced mutation
and its modifying effect on the measured binding affinity, all analyzed protein samples showed
similar purity. There was no correlation between the protein quantity and the extent to which a
mutation affected the binding properties.
In summary, an alternative procedure for purification of IL-4BP and its variants through an Ab
containing column was established. The new purification method is simple for accomplishment
and very similar to the methods for purification required by the IL-4 column. That makes possible
the simultaneous and reversal use of both columns for more effective purification.
3.1.4 Biotinylation of IL-4BP Recombinant Variants The IL-4BP recombinant variants purified by affinity chromatography or antibody column were
biotinylated following the procedure described in 2.9.6. The biotinylated protein samples were
further purified using gel filtration. During the purification step around 50-60 % of the protein
was lost. Therefore the biotinylated proteins were in a final concentration range between 20 and
70 µg/ml and the total protein amount varied between 30 and 80 µg. For each variant was
prepared a dilution with protein concentration of 1 µg/ml, which was further used in biosensor
experiments.
77

______________________________________________________________________3. Results
3.2 Preparation of Recombinant IL-4 Variants Although a collection of different IL-4 variants was previously analyzed, within the framework of
the presented project two more amino acids of IL-4 were substituted by alanine. The crystal
structure of the complex between the human IL-4 and IL-4BP suggested a contribution of R53
and Y56 to possible contacts with the receptor part. Both amino acids are located on helix B of
IL-4 and are part of the second discrete cluster of trans-interacting residues within the binding
epitope (Hage et al., 1999).
3.2.1 Cloning of IL-4 Mutant Variants The cDNA of IL-4 was inserted into the expression vector RTSpRC109 under the control of the
right λ-phage promoter (Figure 3.12; Appendix 4). The regulation of the transcription was
performed through the temperature sensitive repressor cI185, which is also encoded by this
expression plasmid.
Amp
R pRC109 IL-4
4400 bp
ColEori
tfd
cI857
pR
C109
BamHI
IL-4
XhoI
STII
R
TS
Figure 3.12: Schematic diagram of expression vector RTSpRC109/IL-4.
The variant Y56A was generated by cassette mutagenesis. A synthetic doublestranded DNA
cassette which carried the mutation of interest was inserted between engineered restriction
78
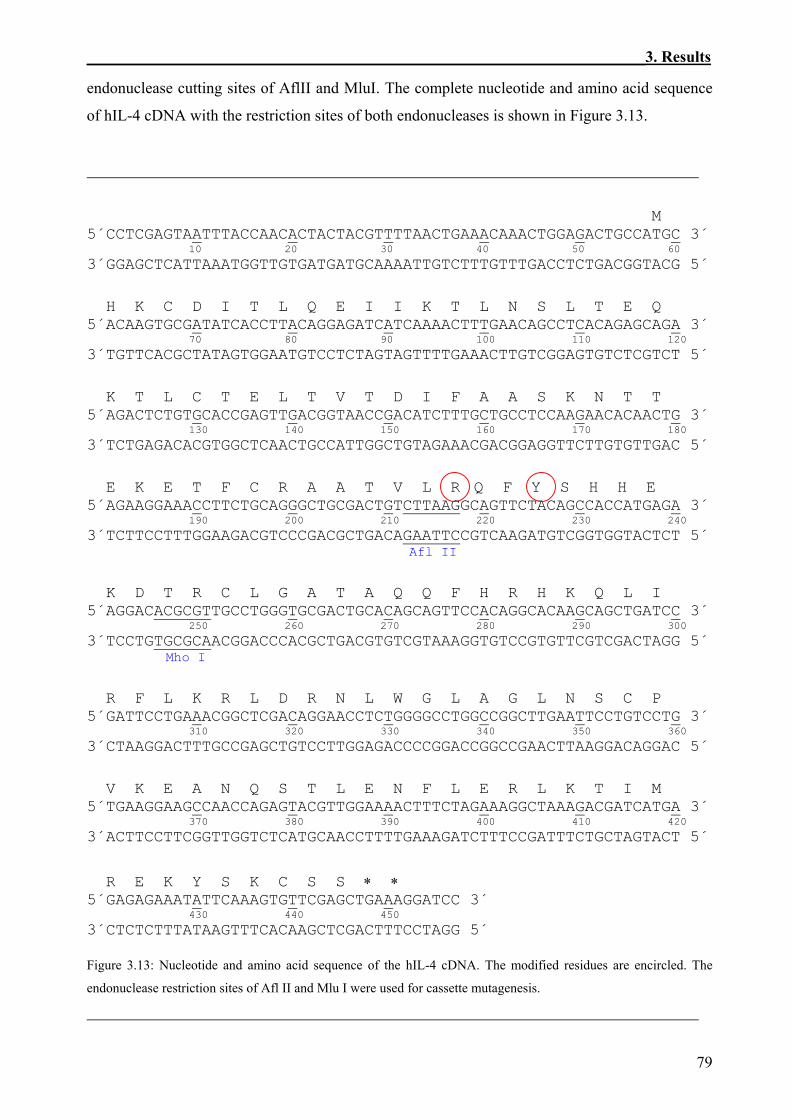
______________________________________________________________________3. Results
endonuclease cutting sites of AflII and MluI. The complete nucleotide and amino acid sequence
of hIL-4 cDNA with the restriction sites of both endonucleases is shown in Figure 3.13.
M 5´CCTCGAGTAATTTACCAACACTACTACGTTTTAACTGAAACAAACTGGAGACTGCCATGC 3´ 10 20 30 40 50 60
3´GGAGCTCATTAAATGGTTGTGATGATGCAAAATTGTCTTTGTTTGACCTCTGACGGTACG 5´ H K C D I T L Q E I I K T L N S L T E Q 5´ACAAGTGCGATATCACCTTACAGGAGATCATCAAAACTTTGAACAGCCTCACAGAGCAGA 3´ 70 80 90 100 110 120
3´TGTTCACGCTATAGTGGAATGTCCTCTAGTAGTTTTGAAACTTGTCGGAGTGTCTCGTCT 5´ K T L C T E L T V T D I F A A S K N T T 5´AGACTCTGTGCACCGAGTTGACGGTAACCGACATCTTTGCTGCCTCCAAGAACACAACTG 3´ 130 140 150 160 170 180
3´TCTGAGACACGTGGCTCAACTGCCATTGGCTGTAGAAACGACGGAGGTTCTTGTGTTGAC 5´ E K E T F C R A A T V L R Q F Y S H H E 5´AGAAGGAAACCTTCTGCAGGGCTGCGACTGTCTTAAGGCAGTTCTACAGCCACCATGAGA 3´ 190 200 210 220 230 240
3´TCTTCCTTTGGAAGACGTCCCGACGCTGACAGAATTCCGTCAAGATGTCGGTGGTACTCT 5´ Afl II
K D T R C L G A T A Q Q F H R H K Q L I 5´AGGACACGCGTTGCCTGGGTGCGACTGCACAGCAGTTCCACAGGCACAAGCAGCTGATCC 3´ 250 260 270 280 290 300
3´TCCTGTGCGCAACGGACCCACGCTGACGTGTCGTAAAGGTGTCCGTGTTCGTCGACTAGG 5´ Mho I
R F L K R L D R N L W G L A G L N S C P 5´GATTCCTGAAACGGCTCGACAGGAACCTCTGGGGCCTGGCCGGCTTGAATTCCTGTCCTG 3´ 310 320 330 340 350 360
3´CTAAGGACTTTGCCGAGCTGTCCTTGGAGACCCCGGACCGGCCGAACTTAAGGACAGGAC 5´ V K E A N Q S T L E N F L E R L K T I M 5´TGAAGGAAGCCAACCAGAGTACGTTGGAAAACTTTCTAGAAAGGCTAAAGACGATCATGA 3´ 370 380 390 400 410 420
3´ACTTCCTTCGGTTGGTCTCATGCAACCTTTTGAAAGATCTTTCCGATTTCTGCTAGTACT 5´ R E K Y S K C S S ∗ ∗ 5´GAGAGAAATATTCAAAGTGTTCGAGCTGAAAGGATCC 3´ 430 440 450
3´CTCTCTTTATAAGTTTCACAAGCTCGACTTTCCTAGG 5´ Figure 3.13: Nucleotide and amino acid sequence of the hIL-4 cDNA. The modified residues are encircled. The
endonuclease restriction sites of Afl II and Mlu I were used for cassette mutagenesis.
79
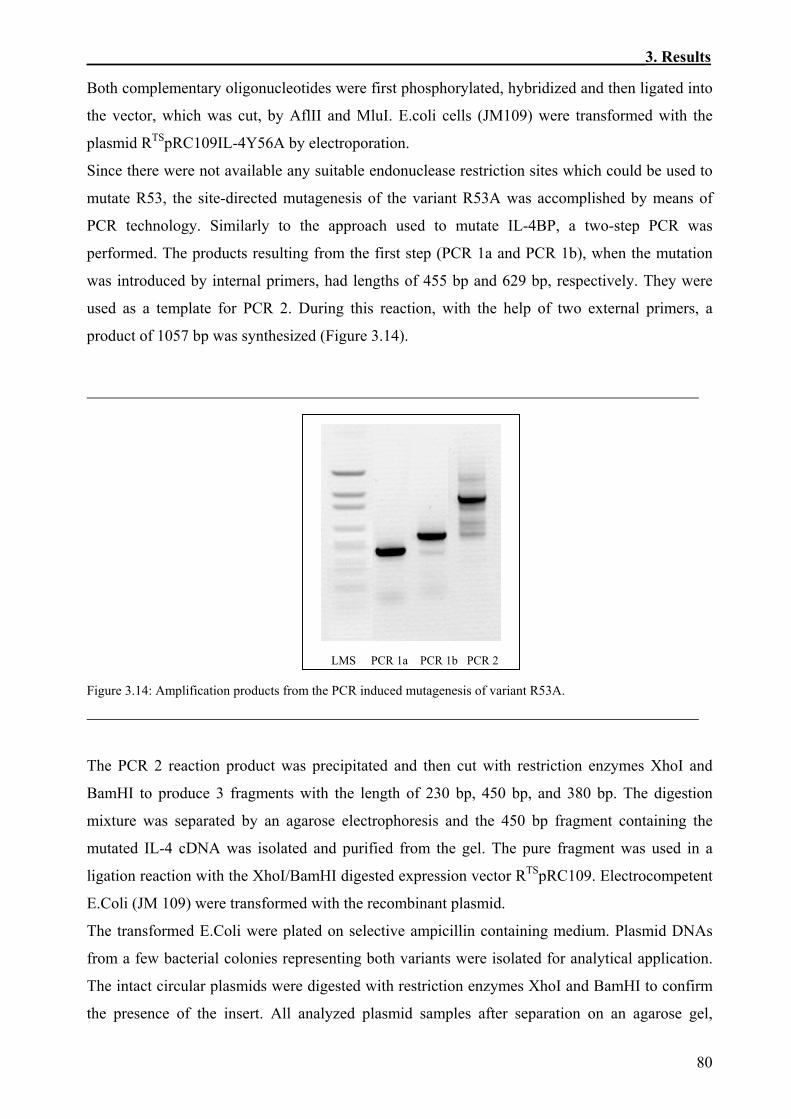
______________________________________________________________________3. Results
Both complementary oligonucleotides were first phosphorylated, hybridized and then ligated into
the vector, which was cut, by AflII and MluI. E.coli cells (JM109) were transformed with the
plasmid RTSpRC109IL-4Y56A by electroporation.
Since there were not available any suitable endonuclease restriction sites which could be used to
mutate R53, the site-directed mutagenesis of the variant R53A was accomplished by means of
PCR technology. Similarly to the approach used to mutate IL-4BP, a two-step PCR was
performed. The products resulting from the first step (PCR 1a and PCR 1b), when the mutation
was introduced by internal primers, had lengths of 455 bp and 629 bp, respectively. They were
used as a template for PCR 2. During this reaction, with the help of two external primers, a
product of 1057 bp was synthesized (Figure 3.14).
LMS PCR 1a PCR 1b PCR 2 Figure 3.14: Amplification products from the PCR induced mutagenesis of variant R53A.
The PCR 2 reaction product was precipitated and then cut with restriction enzymes XhoI and
BamHI to produce 3 fragments with the length of 230 bp, 450 bp, and 380 bp. The digestion
mixture was separated by an agarose electrophoresis and the 450 bp fragment containing the
mutated IL-4 cDNA was isolated and purified from the gel. The pure fragment was used in a
ligation reaction with the XhoI/BamHI digested expression vector RTSpRC109. Electrocompetent
E.Coli (JM 109) were transformed with the recombinant plasmid.
The transformed E.Coli were plated on selective ampicillin containing medium. Plasmid DNAs
from a few bacterial colonies representing both variants were isolated for analytical application.
The intact circular plasmids were digested with restriction enzymes XhoI and BamHI to confirm
the presence of the insert. All analyzed plasmid samples after separation on an agarose gel,
80

______________________________________________________________________3. Results
showed the 450 bp fragment representing the hIL-4 cDNA. In addition, the exact DNA sequence
and the presence of the mutation were verified by DNA sequencing with 5´- and 3´- external
primer.
3.2.2 Expression and Purification of IL-4 Variants For expression of IL-4 variants, E.coli was cultivated until reaching early logarithm phase with
OD550 of 0.5-0.6 and then induced by heating at 42°C and incubated for 3 h. Under these
conditions, the recombinant IL-4 variants were expressed as insoluble aggregate form (inclusion
bodies) in the cell cytoplasm. The amounts of bacterial cells and inclusion bodies for both
variants, which were obtained from 1 liter of E.coli culture, are compared in Table 3.4.
Table 3.4: The yields at different steps of preparation of recombinant proteins for the IL-4 variants.
Cells Inclusion bodies Protein [mg]
Variant [g] [g] (after CM-Sepharose) (after HPLC)
(per 1 liter of E.Coli culture)
R53A 3.1 1.3 1.6 0.6
Y56A 3.8 1.7 1.7 0.9
The inclusion bodies were completely dissolved in 6 M guanidine hydrochloride (GuHCl), pH
8.0. To reduce the disulfide bonds between cysteine residues and to accomplish the protein
denaturation, 0.1% of β-mercaptoethanol was added. The renaturation of the protein to its native
form was achieved by slow dialysis in PBS.
Since the pI of hIL-4 is 10.5 (Callard, R. & Gearing A, 1994) the refolded proteins were applied
to a CM-Sepharose matrix at pH 5.0. During this cation-exchange chromatography, the acidic and
neutral contaminating proteins, which comprised most of the impurities, could not bind to the
column and therefore the IL-4 variants were effectively separated. The bound proteins were
eluted using a linear salt gradient from 0 M NaCl to 0.5 M NaCl. Only a limited amount of basic
contaminating proteins overlapped with the IL-4 pick (Figure 3.15). After this step, the purity of
the IL-4 variants reached over 90%.
81

______________________________________________________________________3. Results
A B
MS 1 2 3 4 5 6 7 8
MS 1 2 3 4 5 6 7 8 9
C
Figure 3.15: Purification of the IL-4 variants through CM-Sepharose column. (A) The elution chart of variant Y56A.
(B) SDS-PAGE analysis of collected fractions for variant R53A. The fractions represented here by lines 3, 4, 5, 6, 7,
and 8 were selected for following purification. (C) SDS-PAGE of the fractions collected during the purification of
the variant Y56A. The fractions represented by lines 4 and 5 were further purified. MS, molecular standard.
Further, the protein purification was accomplished by reversed phase HPLC. Based on
hydrophobic interactions, the protein bound to the chromatography matrix and then elution with
increasing concentration of acetonitrile was performed (Figure 3.16 A). The IL-4 variants were
eluted at around 40% of acetonitrile. Both variants were successfully purified, suggesting that
neither the protein refolding neither the protein stability were disrupted by the individual
mutations. The collected fractions during HPLC were monitored by SDS-PAGE, which revealed
high purity of the obtained protein (Figure 3.16 C, D). In addition, the purity and the refolding
quality of the proteins were examined by analytical RP-HPLC performed in a small column with
detective sensitivity of 0.08. Both variants showed only a single sharp peak confirming the high
homogeneity of the analyzed samples (Figure 3.16 B). The highly purified proteins were divided
into aliquots lyophilized and in this way stored for following experiments.
82

______________________________________________________________________3. Results
MS 1 2 3 4 5 6 7 8 9
MS 1 2 3 4 5 6 7 8 9
D
CA B
Figure 3.16: HPLC purification step of the IL-4 variants. (A) The elution chart of the variant Y56A.
(B) Analytical HPLC of variant Y56A. (C) SDS-PAGE of variant R53A. The fraction represented by line 3 was
chosen for further applications. (D) SDS-PAGE of the fractions collected for variant Y56A. The fractions
represented by lines 4 and 5 were combined (line 9) and used in following experiments. MS, molecular standard.
83

______________________________________________________________________3. Results
3.3 Kinetic Analysis of the Interaction of IL-4 with the IL-4BP Variants Using BIAcore Technology
The purified IL-4BP and its variants were used in a biomolecular examination to determine both,
the kinetic and equilibrium binding constants characterizing the interaction with the ligand. This
comprehensive analysis was carried out to assess the roles of the mutated side chains in
modulating the affinity and kinetics of binding.
A biosensor technology that relies upon surface plasmon resonance to measure changes in
refractive index upon ligand binding to an immobilized receptor was explored to record binding
curves and to evaluate the kinetic parameters of the interaction. The evaluation methods are
described in 2.13.2.
3.3.1 Immobilization of the Biotinylated IL-4BP and its Variants on the Sensor Chips Among the several available immobilization techniques, the amine coupling and streptavidin-
biotin coupling had been chosen to immobilize IL-4BP and its mutated variants on sensor chips.
Earlier experiments have proven that this method offered a higher ligand binding capacity of the
chip, considering the certain amount of immobilized receptors (Shen et al., 1996). The reason for
this seems to be the nonspecific nature of the amine coupling technique and stereo obstacle,
which gives rise to association perturbation of IL-4 to IL-4BP. Therefore the streptavidin-biotin
coupling was used as a standard immobilization method in this study.
First, the four cells of a sensor chip CM5 were coated with streptavidin employing the amine
coupling procedure as described in 2.13.1 (Figure 3.17). Thereafter, the matrix of flow cells 2, 3
and 4 was loaded separately with different IL-4BP variants, which earlier were randomly
biotinylated (Figure 3.18). No receptor was loaded onto flow cell 1. It was used to record a
background sensogram that was subtracted during the evaluation from the sample sensograms in
flow cells 2, 3 and 4.
Experimental conditions connected with different density of the immobilized receptor were
tested. Usually, in the beginning the variants were loaded on the chip with a density of
approximately 150 RU. Since the streptavidin-biotin interaction has an extremely high affinity
(~1015 M-1) (BIAcore Handbook, 1995) the chips could be repeatedly regenerated and the amount
of the immobilized receptor could be increased. For low affinity variants more receptor was
added to the chip until a density of 200, 400 or 500 RU was reached (Table 3.5).
84
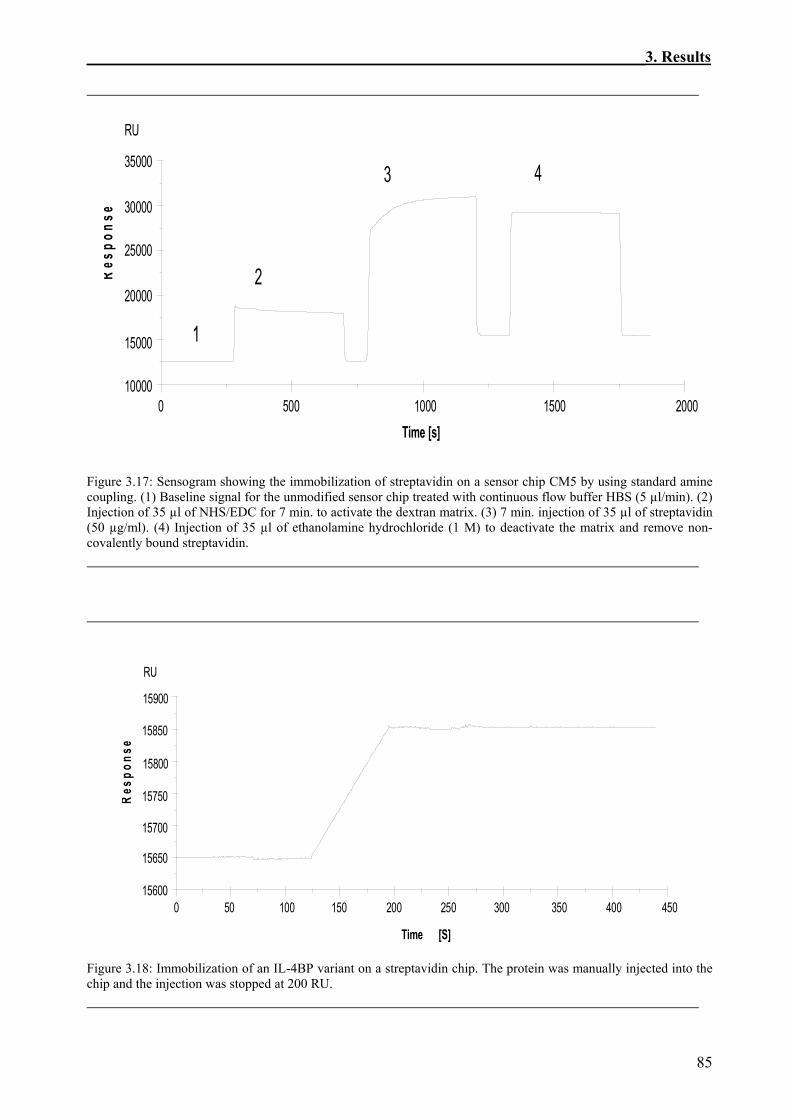
______________________________________________________________________3. Results
0 500 1000 1500 2000Time [s]
Res
pons
eRU
1
2
3 4
10000
15000
20000
25000
30000
35000
Figure 3.17: Sensogram showing the immobilization of streptavidin on a sensor chip CM5 by using standard amine coupling. (1) Baseline signal for the unmodified sensor chip treated with continuous flow buffer HBS (5 µl/min). (2) Injection of 35 µl of NHS/EDC for 7 min. to activate the dextran matrix. (3) 7 min. injection of 35 µl of streptavidin (50 µg/ml). (4) Injection of 35 µl of ethanolamine hydrochloride (1 M) to deactivate the matrix and remove non-covalently bound streptavidin.
Time [S]
400 450350300250200150100500
RU
Res
pons
e
15600
15650
15700
15750
15800
15850
15900
Figure 3.18: Immobilization of an IL-4BP variant on a streptavidin chip. The protein was manually injected into the chip and the injection was stopped at 200 RU.
85

______________________________________________________________________3. Results
Table 3.5: Amount of the immobilized receptor at the biosensor matrix for IL-4BP and the different variants
Receptor variant Immobilized protein [g] [M] Rel. Resp. [RU]IL-4BP 4.0 x 10⁻¹⁰ 6.6 x 10⁻¹¹ 79 Y13A 5.4 x 10⁻⁹ 3.3 x 10⁻¹⁰ 243 Y13F 2.8 x 10⁻¹⁰ 6.7 x 10⁻¹¹ 89 L39A 2.8 x 10⁻¹⁰ 6.7 x 10⁻¹¹ 103 F41A 6.4 x 10⁻¹⁰ 6.7 x 10⁻¹¹ 151 L42A 5.6 x 10⁻¹⁰ 6.7 x 10⁻¹¹ 151 L43A 7.4 x 10⁻¹⁰ 6.7 x 10⁻¹¹ 148 D66A 7.0 x 10⁻¹⁰ 1.6 x 10⁻¹⁰ 163 D67A 6.7 x 10⁻¹⁰ 1.1 x 10⁻¹⁰ 157 V69A 3.4 x 10⁻⁹ 3.3 x 10⁻¹⁰ 503 D72A 6.4 x 10⁻¹⁰ 1.8 x 10⁻¹⁰ 225 D72N 6.1 x 10⁻¹⁰ 1.7 x 10⁻¹⁰ 223 K91A 5.6 x 10⁻¹⁰ 6.6 x 10⁻¹¹ 154 K91D 1.6 x 10⁻⁹ 6.6 x 10⁻¹¹ 145 S93A 8.4 x 10⁻¹⁰ 6.6 x 10⁻¹¹ 152 D125A 5.6 x 10⁻¹⁰ 6.6 x 10⁻¹¹ 152 N126A 7.0 x 10⁻¹⁰ 1.7 x 10⁻¹⁰ 156 Y127A 2.3 x 10⁻⁹ 2.9 x 10⁻¹⁰ 505 Y127F 2.4 x 10⁻¹⁰ 6.6 x 10⁻¹¹ 102 L128A 4.0 x 10⁻¹⁰ 1.7 x 10⁻¹⁰ 154 Y183A 9.4 x 10⁻¹⁰ 6.7 x 10⁻¹¹ 152 Y183F 3.6 x 10⁻¹⁰ 6.6 x 10⁻¹¹ 94 Y13F/L39A 2.0 x 10⁻¹⁰ 3.3 x 10⁻¹⁰ 128 Y13F/F41A 7.0 x 10⁻¹⁰ 2.6 x 10⁻¹⁰ 97 Y13F/D67A 4.0 x 10⁻¹⁰ 3.3 x 10⁻¹⁰ 136 Y13F/V69A 7.0 x 10⁻¹⁰ 1.7 x 10⁻¹⁰ 216 Y13F/D72N 8.0 x 10⁻⁹ 1.3 x 10⁻¹⁰ 423 Y13F/Y127A 6.0 x 10⁻¹⁰ 1.8 x 10⁻¹⁰ 225 Y13F/Y183F 7.0 x 10⁻¹⁰ 1.9 x 10⁻¹⁰ 248 D72N/L39A 1.0 x 10⁻⁹ 1.7 x 10⁻¹⁰ 417 D72N/F41A 1.1 x 10⁻⁹ 1.7 x 10⁻¹⁰ 400 D72N/D67A 1.3 x 10⁻⁹ 1.7 x 10⁻¹⁰ 394 D72N/V69A 1.1 x 10⁻⁹ 1.7 x 10⁻¹⁰ 413 D72N/Y127A 1.2 x 10⁻⁹ 1.7 x 10⁻¹⁰ 410 D72N/Y183F 9.5 x 10⁻⁹ 1.8 x 10⁻¹⁰ 407
86

______________________________________________________________________3. Results
3.3.2 Kinetics of the Interaction of IL-4 and IL-4BP Although the kinetics of binding of IL-4 to IL-4BP was investigated in a earlier study (Shen et
al., 1996), similar measurement was performed again as a control basis of estimation the changes
in binding affinity of the mutated variants. Experiments were performed with IL-4 concentrations
of 2.5, 5.0 and 7.5 nM (Figure 3.19). The sensograms, which recorded the interaction of IL-4 and
IL-4BP at different IL-4 concentrations, showed the typical model of extremely fast association
and slow dissociation, observed earlier.
850800750700Time [s]
650600550500400 450-10
-5
0
5
10
15
20
25
RU
Res
pons
e
Figure 3.19: Overlay of sensograms showing the binding of IL-4 to the immobilized IL-4BP. IL-4 at concentrations of 2.5, 5.0 and 7.5 nM was applied.
Both, the association and dissociation phases were evaluated with BIAevaluation software to
yield the association (kon) and dissociation (koff) rate constants, respectively (Figure 3.20). Due to
the very fast association that in the beginning was diffusion controlled, only a small window (5
RU) could be evaluated for calculation of the association rate constant before attaining
equilibrium. Based on this, the association rate constant was determined to be kon =1.3x10⁷ M-1s-1.
The dissociation phase commenced when the perfusion with IL-4 was exchanged to a perfusion
87
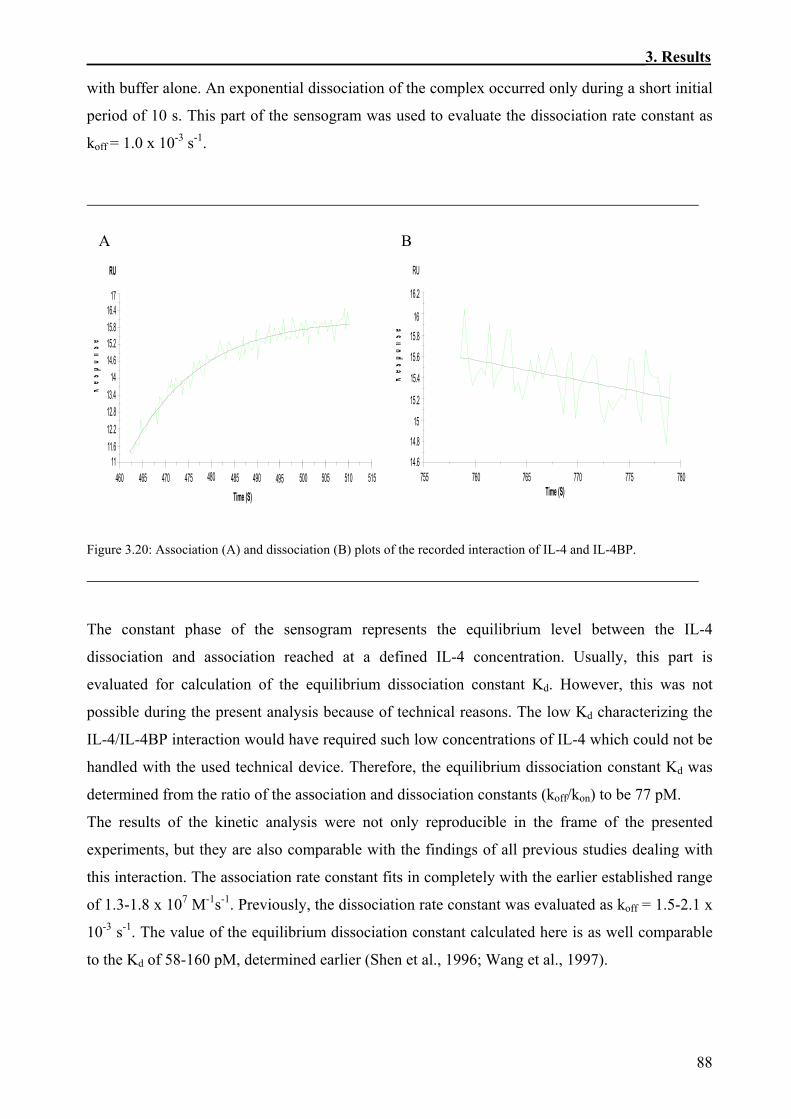
______________________________________________________________________3. Results
with buffer alone. An exponential dissociation of the complex occurred only during a short initial
period of 10 s. This part of the sensogram was used to evaluate the dissociation rate constant as
koff = 1.0 x 10⁻³ s-1.
A B
780775770765760755Time (S)
14.6
14.815
15.2
15.4
15.6
15.816
16.2
Res
pons
e
RU
515510505500495490485460 465 470 475 48011
11.612.212.813.4
1414.615.215.816.4
17
Time (S)
Res
pons
e
RU
Figure 3.20: Association (A) and dissociation (B) plots of the recorded interaction of IL-4 and IL-4BP.
The constant phase of the sensogram represents the equilibrium level between the IL-4
dissociation and association reached at a defined IL-4 concentration. Usually, this part is
evaluated for calculation of the equilibrium dissociation constant Kd. However, this was not
possible during the present analysis because of technical reasons. The low Kd characterizing the
IL-4/IL-4BP interaction would have required such low concentrations of IL-4 which could not be
handled with the used technical device. Therefore, the equilibrium dissociation constant Kd was
determined from the ratio of the association and dissociation constants (koff/kon) to be 77 pM.
The results of the kinetic analysis were not only reproducible in the frame of the presented
experiments, but they are also comparable with the findings of all previous studies dealing with
this interaction. The association rate constant fits in completely with the earlier established range
of 1.3-1.8 x 10⁷ M-1s-1. Previously, the dissociation rate constant was evaluated as koff = 1.5-2.1 x
10-3 s-1. The value of the equilibrium dissociation constant calculated here is as well comparable
to the Kd of 58-160 pM, determined earlier (Shen et al., 1996; Wang et al., 1997).
88

______________________________________________________________________3. Results
3.3.3 Effects of Site-Specific Perturbations in IL-4BP on the Interaction with IL-4 Initially, the amino acids from IL-4BP which were submitted to site-directed mutagenesis, were
selected using the structural alignment between the receptor sequences including human and
mouse IL-4BP, hGHbp (human growth hormone- binding protein), human and mouse IL-2β and
γc (Bamborough et al., 1994). Furthermore, the set of amino acids of interest was extended based
on the results obtained from the crystal structure of the complex between IL-4 and IL-4BP (Hage
et al., 1999). With the purpose of establishing the structure-function correlation, as targets for
mutagenesis were identified residues involved in polar and hydrophobic interactions in the
complex. Basically, all amino acids of interest were included in an alanine scanning mutational
analysis. In order to define the results from the alanine scan more accurately, it was necessary to
replace additionally a few tyrosine residues, involved in potentially important contacts with the
ligand, by phenylalanine.
3.3.3.1 Kinetics of the binding of IL-4 to the alanine variants of IL-4BP The rationale behind alanine scanning mutagenesis is that all interactions of a side chain except
for the Cβ are eliminated (Lau & Fersht, 1987; Cunningham & Wells, 1989). This strategy
assumes that the alanine substitution eliminates interaction without introducing new properties.
The contribution of the deleted groups relative to the alanine residue is assessed from the
difference between the properties of the wild-type relative to the alanine mutant. Free energies of
binding are used to quantify the effect of the alanine substitution at any given site (Di Cera,
1998).
To assess the effect of the introduced mutation on the binding of IL-4 to the IL-4BP, every single
variant was immobilized to a sensor chip as mentioned above (Table 3.5). Sensograms recorded
at different concentrations of IL-4 were evaluated for the kinetic constants (Table 3.6). Based on
the results from the BIAcore measurements the alanine variants assessed in the frame of this
study could be classified into 3 main groups, according to the extent to which the mutation affects
the functional properties of the IL-4BP molecule.
1. Variants L42A, L43A, D66A, K91A, S93A, D125A, N126A, and L128A showed a pattern of
binding very similar to this observed during the interaction of IL-4 and the wild-type IL-4BP. As
the sensograms revealed (Figure 3.21 - A and B), these variants rapidly associate when perfusion
with IL-4 is committed and slowly dissociate when it is changed to perfusion with buffer alone.
IL-4 was applied in concentrations of 2.5, 5 and 7.5 nM. Under such conditions it was possible to
89

______________________________________________________________________3. Results
evaluate both the association and the dissociation phase for all variants from this group (Figure
3.22). The alanine substitution in variant K91A merely did not have any effect on the association.
Variants L42A, L43A, D66A, D125A, and L128A showed association rate constants which were
only slightly altered due to the present mutation (Table 3.6). The on-rates of variants S93A and
N126A were found to be negligible faster than that of IL-4BP.
Table 3.6: Kinetic constants for binding of IL-4 to IL-4BP and its variants included in the alanine screening.
Receptor
variant
n kon (SE) koff (SE) Kd [M]
[x 106M-1s-1] [x 10-3s-1] Kd (kin.) Kd (equilib.)
IL-4BP 3 13 (0.8) 1.0 (0.3) 7.7 x 10⁻¹¹
Y13A 18 ND ND ND 7.9 x 10⁻⁷
L39A 15 4.9 (0.7) 42 (7.8) 8.6 x 10⁻⁹ 1.6 x 10⁻⁸
F41A 9 5.6 (0.7) 29 (3.4) 5.2 x 10⁻⁹ 8.8 x 10⁻⁹
L42A 3 12 (0.8) 1.5 (0.4) 1.2 x 10⁻¹⁰
L43A 3 12 (0.8) 3.1 (0.4) 2.6 x 10⁻¹⁰
D66A 3 11 (0.6) 6.0 (0.4) 5.6 x 10⁻¹⁰
D67A 9 3.1 (0.2) 32 (1.2) 1.0 x 10⁻⁸ 9.3 x 10⁻⁹
V69A 9 6.3 (0.8) 26 (0.9) 4.1 x 10⁻⁹ 6.1 x 10⁻⁹
D72A 18 ND ND ND 2.0 x 10⁻⁷
D72N 18 ND ND ND 2.7 x 10⁻⁷
K91A 3 13 (2.2) 4.3 (0.4) 3.2 x 10⁻¹⁰
K91D 9 4.8 (0.6) 12 (0.3) 2.5 x 10⁻⁹ 1.9 x 10⁻⁹
S93A 3 17 (0.9) 2.6 (0.5) 1.5 x 10⁻¹⁰
D125A 18 9.4 (0.5) 7.3 (0.6) 7.8 x 10⁻¹⁰
N126A 9 14 (0.6) 6.8 (0.4) 4.7 x 10⁻¹⁰
Y127A 18 4.5 (0.2) 19 (0.3) 4.3 x 10⁻⁹ 6.2 x 10⁻⁹
L128A 18 7.5 (0.4) 11 (1.3) 1.5 x 10⁻⁹
Y183A 18 ND ND ND 6.2 x 10⁻⁸ n: number of measurements.
SE: Standard error.
Kd (kin.): Kd calculated from kinetic data.
Kd (equilib.): Kd calculated from steady state binding data. The mean standard error for this value over all
variants was 9 %.
ND: the values could not be accurately determined because they exceeded the limitations of the instrument.
90

______________________________________________________________________3. Results
No large changes in the dissociation rate constant were observed in the above-mentioned set of
alanine variants. The off-rate constant increased in variant L128A 12-fold and this was the fastest
recorded dissociation constant among all variants from this group. Variants D66A, D125A and
N126A showed a 6-7-fold increase of the dissociation rate constant. A 3-4-fold higher off-rate
was found in variants L43A and K91A. A marginal increase in koff occurred in IL-4BP variants
L42A and S93A.
850
850800750700650600550500450400Time (s)
-10
0
10
20
30
40
50RU
Res
pons
e
A
850800750700650600550500450400-10
0
10
20
30
40
50
RU
Res
pons
e
Time (S)
B
Figure 3.21: Overlay of sensograms of IL-4BP variants included in the alanine screening. (A) L42A, (B) K91A
Unfortunately, it was not possible for any of those variants to evaluate the part of the sensograms
representing the equilibrium level between ligand association and dissociation. Similar to the
interaction of IL-4 and the wild-type IL-4BP, the binding of IL-4 to the variants is characterized
by such low equilibrium dissociation constants that would require concentrations of the ligand
under the limit, which the technical device is able to process. Therefore, the equilibrium
dissociation constants for the variants included in the first group were calculated from the ratio of
the on- and off-rates (Table 3.6). Regarding Kd, the most considerable difference showed variants
L128A and D125A, whose binding affinity dropped down 20- and 10-fold, respectively
91

______________________________________________________________________3. Results
compared to the wild-type. The effect is due to the relatively high ratios of koff, which were
recorded for both mutant forms. Marginal increases in Kd, 2 to 7-fold, were observed for variants
L43A, D66A, K91A, and N126A. The equilibrium dissociation constant of variants L42A and
S93A was almost not altered in comparison to the wild-type receptor (Table 3.7).
A B
520515510505500495490485480475Time (s)
3333.634.234.835.4
3636.637.237.838.4
39
RU
Res
pons
e
75275074874674474274073836.6
37
37.4
37.8
38.2
38.6
RU
Res
pons
e
Time (s)
C D
748746744742740738736Time (s)
39.539.840.140.440.7
4141.341.641.942.242.5
RU
Res
pons
e
525521517513509505501497493489485Time (s)
3535.736.4
37.837.1
38.539.239.940.641.3
42
RU
Res
pons
e
Figure 3.22: Plots representing the association (A, C) and the dissociation (B, D) phase of variants with high affinity to IL-4. (A) and (B), L42A; (C) and (D), K91A.
Based on the models of the complex between IL-4 and IL-4BP, K91 was suggested to stabilize
this complex by forming an ion pair with the IL-4 residue E9 (Bamborough et al., 1994).
Therefore, K91 was a residue of particular interest, and additionally to the alanine substitution it
was subjected to a charge conversion. The positive charge was exchanged with negative by
replacing the original lysine residue with aspartic acid. Although a dramatic effect was expected,
92

______________________________________________________________________3. Results
the charge variant K91D exhibited simply 30-fold decrease in binding affinity. The kinetic
constants were as well only slightly affected after the negative charge was introduced. Both the
results from the analyses of the alanine and the charge variant did not support an important
implication of K91 in contacts to amino acids from IL-4.
The described features define the alanine variants included in the first group as not highly
affected due to the introduced amino acid substitution. Alanine substitution at the particular
positions neither caused large changes of the kinetic constants, nor brought the binding affinity
drastically down. Generally, the mutated variants retained relatively high binding affinity to IL-4.
Thus, even if the analyzed amino acids influence the interaction to some extent, they are not main
binding determinants of the receptor part.
2. The alanine variants L39A, F41A, D67A, V69A, and Y127A represent a different model of
binding to IL-4. As the sensograms recorded (Figure 3.23), the association phase is still a rapid
process. In contrast to the above-mentioned IL-4BP variants, the dissociation phase occurred to
be much faster. Since lower binding affinity was expected after the preliminary analysis, the
BIAcore measurements were performed a with wider concentration range of the ligand. The IL-4
concentration was increased to over 100 nM in some cases. Within such a concentration range it
was still possible to obtain plots from the association and dissociation phase and to evaluate the
kinetic constants (Figure 3.24 A, B, D and E).
The evaluated on-rates for all variants are merely slightly lower than the on-rate for IL-4BP
(Table 3.6). Variant D67A exhibited a 4-fold decreased association rate constant. 2 to 3-fold
lower kon compared to the wild-type interaction characterized the rest of the variants. In contrast,
the complex dissociation was considerably accelerated in all examined receptor mutants. The
largest effect in this respect was recorded for variant L39A, which off-rate constant increased
over 40-fold compared to the wild-type receptor. In two further alanine mutants, F41A and
D67A, koff was found to be 30-fold faster. The variant V69A showed a dissociation rate constant
that was 25-fold faster. The alanine substitution in variant Y127A resulted in a relatively modest
effect of 20-fold increase in the off-rate constant.
The relatively low binding affinity of the alanine variants included in this group allowed an
independent determination of the dissociation equilibrium constants by evaluating the receptors
saturation levels obtained at different IL-4 concentrations (Figure 3.24 C and F). The Kd values
derived from the equilibrium phase are in good agreement with the Kd values calculated from the
kinetic constants (Table 3.6). A more than 210-fold reduced binding affinity characterizes the
variant L39A. Over 100- fold decreased the binding affinity for variants F41A and D67A. Both,
variants V69A and Y127A exhibited 80-fold faster Kd than the IL-4BP (Table 3.7).
93

______________________________________________________________________3. Results
400 450 500 550 600 650 700 750 800 850Time (s)
-10
-5
0
5
10
15
20
25
30
35
Res
pons
e
RU
850800750700650600550500400 450-20
0
20
40
60
80
100
120
140
Time (s)
Res
pons
e
RU
900800700400 500 600Time (s)
-20
0
20
40
60
80
100
120
140
Res
pons
e
RU
500 600 700 800 900400Time (s)
-20
0
20
40
60
80
100
120
140
160
180
Res
pons
e
RU
A
B
C
D
Figure 3.23: Sensograms which recorded the binding of IL-4 to the IL-4BP mutants F41A (A), D67A (B), V69A (C),
and Y127A (D).
94

______________________________________________________________________3. Results
A D
485482479476473470467464461458455Time (s)
114
116
118
120
122
124
126
128
RU
Res
pons
e
485480475470465460455450445440435Time (s)
10
12
14
16
18
20
22
RU
Res
pons
e
B E
737736.5736735.5735734.5734733.5733732.5732731.5Time (s)
10
10.5
11
11.5
12
12.5
13
13.5
RU
Res
pons
e
74674474274073873673495
100
105
110
115
120
125
130
Time (s)
RUR
espo
nse
C F
350300250200150100500(nM)
9098
106114122130138146154162170
RU(eq)
60544842363024181260(nM)
0369
12151821242730
RU (eq)
L39A Y127A Figure 3.24: Plots for variants L39A and Y127A representing association (A and D), dissociation (C and F), and
equilibrium phases (C and F).
95

______________________________________________________________________3. Results
Generally, alanine substitution at the mentioned sites is followed by severely affected receptor
binding properties, suggesting an important function of the replaced amino acids in forming
contacts within the complex with IL-4. However, the effect is still limited and does not imply that
the particular residues are the main contact determinants in the receptor molecule.
3. Compared to the wild-type the alanine mutants D72A, Y13A, and Y183A revealed the most
significant changes, as demonstrated by the overlay of the corresponding sensograms (Figure
3.25 A, B, and D). The three variants still associated rapidly with IL-4, but they as well
dissociated extremely fast when buffer alone was applied. Due to the low binding affinity, it was
necessary to increase the amount of the immobilized receptor on the chip, which for the variants
D72A and Y13A exceeded 200 RU (Table 3.5). In addition, the IL-4 concentration was also
increased during the experiments until it reached 750 nM.
The high ligand concentration caused such rapid association phase that could not be evaluated to
calculate the association rate constant. The alanine substitution enhanced the dissociation phase
to such an extent that it was impossible to estimate the dissociation rate constant. Therefore, as
presented in table 3.6, the kinetic constants for those variants are not available.
The presented data for the equilibrium dissociation constant Kd was obtained by the evaluation of
the equilibrium phase (Figure 3.26). By far the most affected variant occurred to be Y13A. The
interaction of IL-4 and Y13A was characterized by over 10000-fold decreased binding affinity.
Sensitive to the alanine substitution was also variant D72A which binding affinity dropped down
2600-fold. Although the variant Y183A showed a less remarkable effect, it still demonstrated
large changes in Kd (Table 3.7). The variant decreased its binding affinity to IL-4 800-fold. The
observed extreme changes in Kd give a reliable explanation to the fact that particularly these
variants could not be successfully isolated and purified by an affinity column containing IL-4.
The strong effect of the alanine substitution on the binding affinity indicates that the replaced
amino acids provide the largest contribution from the receptor side to the stabilization of the
complex. However, it has to be considered that if the introduced alanine residues would cause
structural perturbation in the receptor molecule, the observed effect would rather be structural
than functional. To assess the exact functional role of the examined residues in the interaction and
the character of the contacts in which they are implicated, additional experiments were
performed.
Furthermore, a mutational variant D72N was analyzed. Originally, the variant was constructed as
more conservative than D72A and was expected to retain the high binding affinity to IL-4. As
already mentioned, D72N could not be purified using the IL-4 affinity column, and this was the
first indication that it was strongly affected due to the amino acid substitution. The overlay of the
96

______________________________________________________________________3. Results
A
850800750700650600550500450400Time (s)
-20
0
20
40
60
80
100
120
140
RU
Res
pons
e
850800750700650600550500450400Time (s)
-5
0
5
10
15
20
25
30
35
40
RU
Resp
onse
B
C
D
Figure 3.25: Overlay of sensograms representing the interaction of IL-4 and the low affinity variants of IL-4BP:
Y13A (A), D72A (B), D72N (C), and Y183F (D).
97
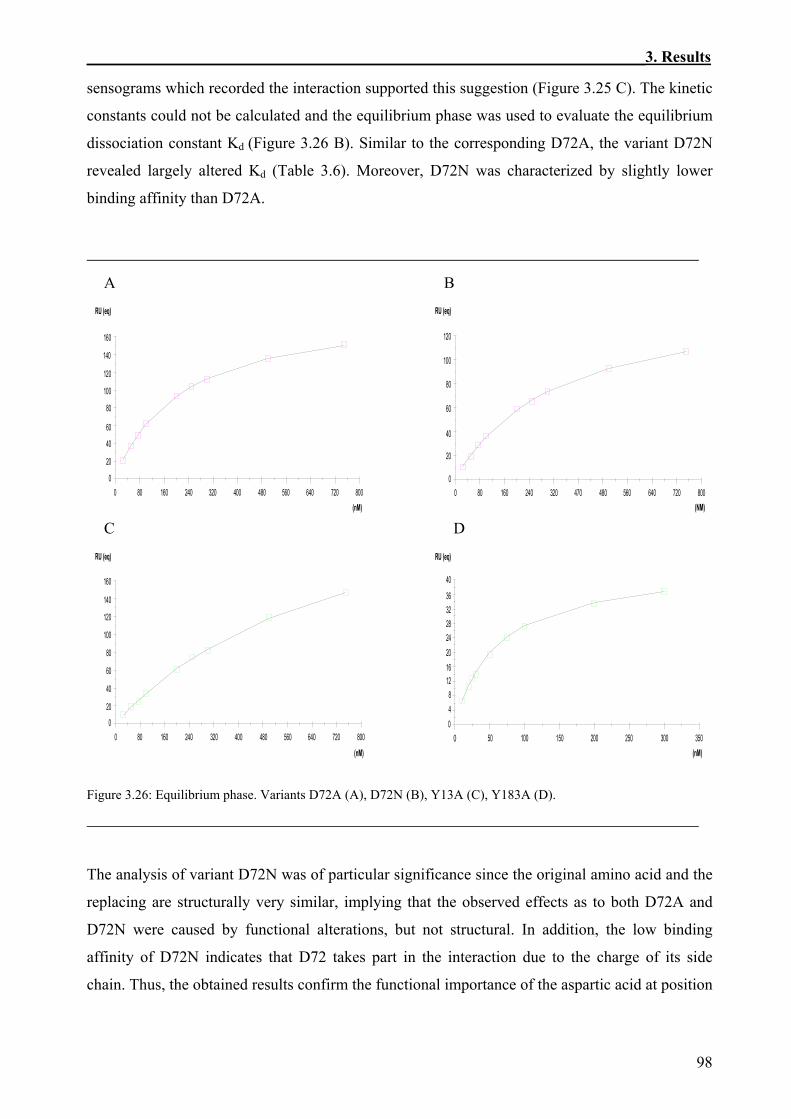
______________________________________________________________________3. Results
sensograms which recorded the interaction supported this suggestion (Figure 3.25 C). The kinetic
constants could not be calculated and the equilibrium phase was used to evaluate the equilibrium
dissociation constant Kd (Figure 3.26 B). Similar to the corresponding D72A, the variant D72N
revealed largely altered Kd (Table 3.6). Moreover, D72N was characterized by slightly lower
binding affinity than D72A.
A B
800720640560480470320240160800(NM)
0
20
40
60
80
100
120
RU (eq)
800720640560480400320240160800(nM)
0
20
40
60
80
100
120
140
160
RU (eq)
C D
800720640560480400320240160800
(nM)
0
20
40
60
80
100
120
140
160
RU (eq)
35030025020015010050(nM)
048
12162024283236
40
RU (eq)
Figure 3.26: Equilibrium phase. Variants D72A (A), D72N (B), Y13A (C), Y183A (D).
The analysis of variant D72N was of particular significance since the original amino acid and the
replacing are structurally very similar, implying that the observed effects as to both D72A and
D72N were caused by functional alterations, but not structural. In addition, the low binding
affinity of D72N indicates that D72 takes part in the interaction due to the charge of its side
chain. Thus, the obtained results confirm the functional importance of the aspartic acid at position
98

______________________________________________________________________3. Results
72 in forming ion pairs within the complex, and define it as one of the main binding determinants
in the IL-4BP.
The analyses of the alanine variants and one additional mutant (K91D) performed by BIAcore
system demonstrate that the rate constant of association between IL-4 and IL-4BP is remarkably
insensitive to amino acid substitutions. The examined residues did not apparently determine the
velocity of the complex formation to an appreciable degree. Loss of charge generally did not
affect the on-rates except in a case of variant D67A. Unfortunately, it was not possible to obtain
neither association nor dissociation rate constants for the variants which exhibited the largest
changes regarding binding affinity and therefore to figure out weather the charge of D72
contributes to the rapid association phase. As far as off-rates could be calculated, they showed
more significant changes, which were followed by a corresponding decrease in the binding
affinity of the particular variants. Generally, no correlation was noticed between the side chains
that had the most affected on- and off-rate. Among the amino acids that showed significant effect
on the dissociation rate constant after alanine substitutions are some large hydrophobic side
chains as well as charged residues. That suggests that electrostatic interactions in parallel with
hydrophobic contacts stabilize the complex between IL-4 and IL-4BP.
3.3.3.2 Thermodynamic aspects of the interaction between IL-4 and the IL-4BP variants included in the alanine scanning mutagenesis
The introduction of a mutation in the system requires determining the energetic consequences of
the substitution made. The information about the energetic alteration caused by an amino acid
substitution indicates how exactly and to which extent the exchanged residue contributes to the
binding properties of the receptor and its importance for the stability of the complex with the
ligand. As an estimation of the effect of the site-directed mutation on the binding process often is
used the change of binding energy relative to the wild-type protein (∆∆G), which in fact measures
the linkage between the functional properties of the examined molecule and the mutation.
Therefore, when the contact determinants are defined the data about ∆∆G is considered as
follows. When ∆∆G >0, the mutation is assumed to reduce the complex stability, whereas
enhanced stability are reflected by ∆∆G <0, and no effect is considered when ∆∆G = 0 (Di Cera,
1998).
The total change in binding free energy (∆G) for the interaction of IL-4 and IL-4BP is 13.8
kcal/mol, as it was calculated from the corresponding equilibrium dissociation constant of 77
pmol estimated within the present study. The loss of binding energy in the alanine variants (∆∆G)
99

______________________________________________________________________3. Results
was calculated according to the change in the dissociation constant Kd relative to the wild-type
interaction (Table 3.7). The Kd values obtained from the equilibrium phase of the biosensor
experiments were used where it was possible. For variants which retained high binding affinity
and the equilibrium dissociation constant could not be directly evaluated were used the Kd ratios
from kinetic measurements.
Table 3.7: Relative Kd and loss of binding free energy of the IL-4BP variants included in the alanine mutational
analysis.
Receptor variant Relative Kd
(Mut/Wild-type)
∆∆G
[kcal/mol]
Y13A 10300 5.5
L39A 210 3.2
F41A 110 2.8
L42A 1.6 0.3
L43A 3.3 0.7
D66A 7.2 1.2
D67A 120 2.8
V69A 80 2.6
D72A 2600 4.7
K91A 4.2 0.8
S93A 2 0.4
D125A 10 1.4
N126A 6.1 1.1
Y127A 80 2.6
L128A 20 1.7
Y183A 800 4.0
The most significant loss of binding free energy after alanine substitution was observed for Y13.
The alanine mutant contributes 5.5 kcal/mol, which accounts for 40 % of the total binding energy.
The most important polar residue in the functional epitope is D72, which provides over 33 % (4.7
kcal/mol) to the total binding energy. Another tyrosine residue, at position 183, also makes a
large apparent contribution with loss of free binding energy of 4 kcal/mol during the alanine scan.
The sum of the reductions in free energy caused only by the alanine substitutions at these
particular positions already exceeds the total binding energy for the complex with IL-4. Five
100
______________________________________________________________________3. Results
additional residues included in the study, L39, F41, D67, V69, and Y127, produced a loss of 2.5
to 3.5 kcal/mol each after they were replaced by alanine residues. The summed contribution of
these amino acids is comparable with the total binding energy characterizing the complex. Lesser
contributions demonstrated D66, D125, N126, and L128 when they were replaced by alanine (1
to 2.1 kcal/mol). The rest of the examined amino acid side chains showed negligible energetic
contribution (under 1 kcal/mol). No one of the alanine variants showed a negative value for ∆∆G,
suggesting that all analyzed residues directly or indirectly stabilize the complex.
The energetic contribution of single amino acid side chains from IL-4BP to the high-affinity
interaction with the ligand, according the results obtained from the alanine scanning mutagenesis,
is indicated the space-filling IL-4 BP model presented in Figure 3.27. The largest contribution
was established for Y13, D72, and Y183 (colored in red) surrounded by residues of less
importance. The mixed character of the functional important amino acids suggests mixed
character of the contacts with IL-4, in contrast to the other well studied receptor-ligand system of
hGH, where two tryptophan residues form a central hydrophobic patch (Clackson & Wells, 1995;
Clackson et al., 1998). Furthermore, the present model is in agreement with the crystal structure
of the complex with IL-4, which proposed a mosaic binding interface (Hage et al., 1999).
Mutations of amino acids from cluster I and II clearly affected the dissociation rate constant.
They resulted in greater loss of free binding energy supporting the idea that the residues from
those clusters have the main role for the stability of the complex with IL-4. The three tyrosine
residues Y13, Y127, and Y183, with properties for forming hydrogen bonds, have shown
significant energetic contribution which implies their central role within the first cluster. The
primary contact residue in the second cluster seems to be D72, surrounded by the hydrophobic
side chains of L39, F41, and V69, which also have important energetic contribution. In contrast,
the mutation analysis of residues within cluster III indicates that they have less energetic
contribution and therefore confirms their minor functional role for complex stability. Their
binding affinity is altered mainly due to slower association phases (especially for D67) which
determines the amino acids from this cluster as kon determinants.
The sum of the apparent binding free energy contributions for the amino acids included in the
alanine mutational analysis accounts for 35.8 kcal/mol. This value considerably exceeds the
calculated binding free energy for the complex. The high cumulative loss might indicate that
some of the examined mutations are not completely independent, but interact with each other
directly or indirectly. Furthermore, the additivity could be broken down if a mutation causes a
change in the mechanism or rate-limiting step of the reaction. Another possibility is that some of
the main binding determinants contribute to more than one single contact. A large loss of binding
free energy in particular variants, and thereby in the total sum might be explained also with great
101
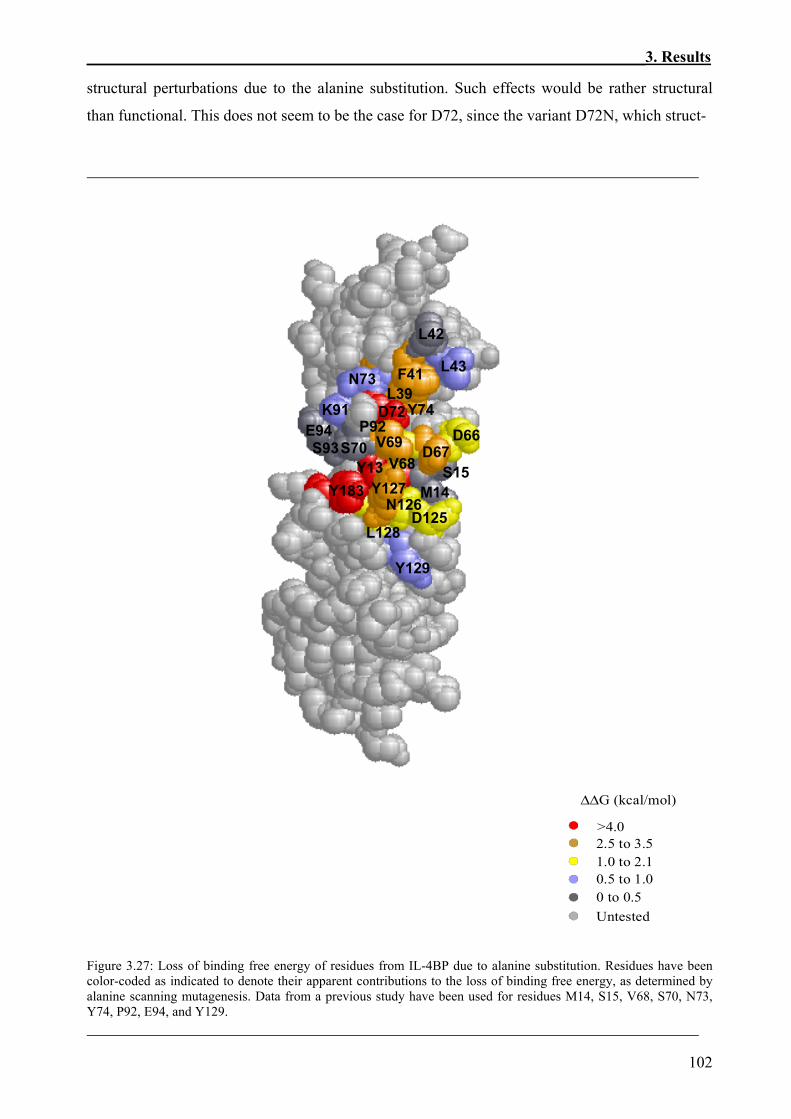
______________________________________________________________________3. Results
structural perturbations due to the alanine substitution. Such effects would be rather structural
than functional. This does not seem to be the case for D72, since the variant D72N, which struct-
Y129
N126
Y13
L39F41
L42
D72
Y183
D67V69
Y127
Y74
D125L128
V68
P92
L43
D66
N73
K91
S93
M14S15
S70E94
∆∆G (kcal/mol)
>4.02.5 to 3.51.0 to 2.10.5 to 1.00 to 0.5Untested
Figure 3.27: Loss of binding free energy of residues from IL-4BP due to alanine substitution. Residues have been color-coded as indicated to denote their apparent contributions to the loss of binding free energy, as determined by alanine scanning mutagenesis. Data from a previous study have been used for residues M14, S15, V68, S70, N73, Y74, P92, E94, and Y129.
102
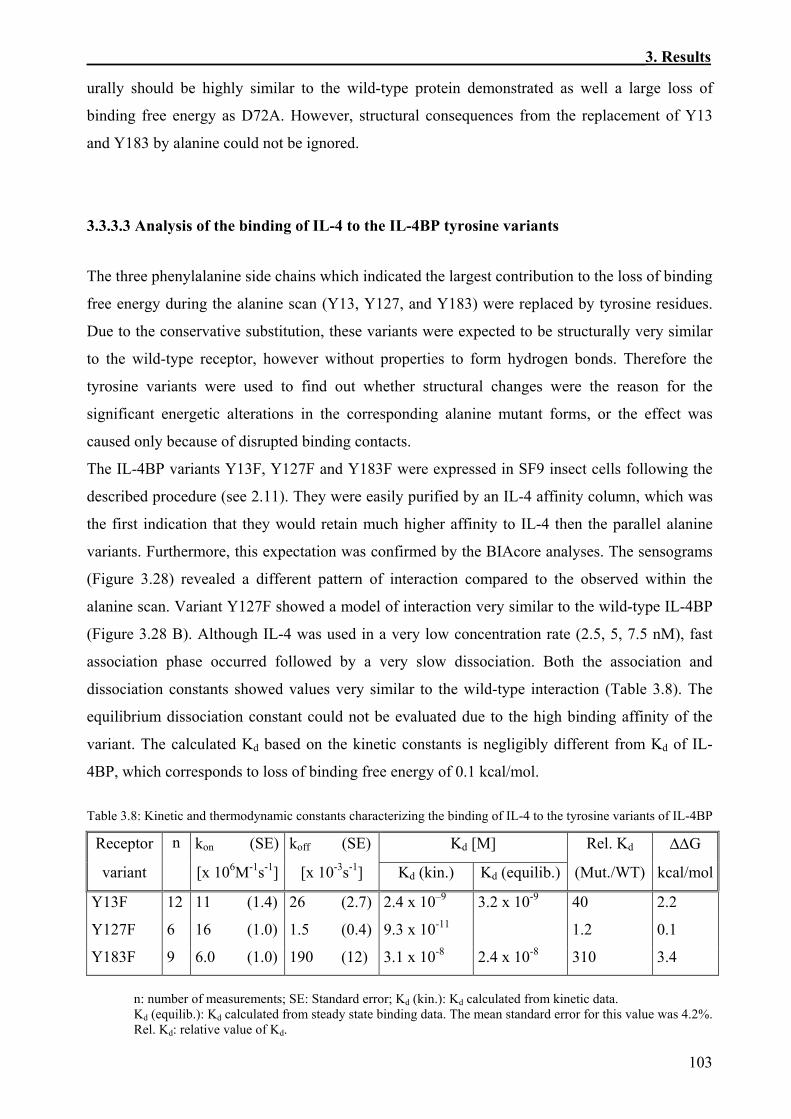
______________________________________________________________________3. Results
urally should be highly similar to the wild-type protein demonstrated as well a large loss of
binding free energy as D72A. However, structural consequences from the replacement of Y13
and Y183 by alanine could not be ignored.
3.3.3.3 Analysis of the binding of IL-4 to the IL-4BP tyrosine variants The three phenylalanine side chains which indicated the largest contribution to the loss of binding
free energy during the alanine scan (Y13, Y127, and Y183) were replaced by tyrosine residues.
Due to the conservative substitution, these variants were expected to be structurally very similar
to the wild-type receptor, however without properties to form hydrogen bonds. Therefore the
tyrosine variants were used to find out whether structural changes were the reason for the
significant energetic alterations in the corresponding alanine mutant forms, or the effect was
caused only because of disrupted binding contacts.
The IL-4BP variants Y13F, Y127F and Y183F were expressed in SF9 insect cells following the
described procedure (see 2.11). They were easily purified by an IL-4 affinity column, which was
the first indication that they would retain much higher affinity to IL-4 then the parallel alanine
variants. Furthermore, this expectation was confirmed by the BIAcore analyses. The sensograms
(Figure 3.28) revealed a different pattern of interaction compared to the observed within the
alanine scan. Variant Y127F showed a model of interaction very similar to the wild-type IL-4BP
(Figure 3.28 B). Although IL-4 was used in a very low concentration rate (2.5, 5, 7.5 nM), fast
association phase occurred followed by a very slow dissociation. Both the association and
dissociation constants showed values very similar to the wild-type interaction (Table 3.8). The
equilibrium dissociation constant could not be evaluated due to the high binding affinity of the
variant. The calculated Kd based on the kinetic constants is negligibly different from Kd of IL-
4BP, which corresponds to loss of binding free energy of 0.1 kcal/mol.
Table 3.8: Kinetic and thermodynamic constants characterizing the binding of IL-4 to the tyrosine variants of IL-4BP
Receptor n kon (SE) koff (SE) Kd [M] Rel. Kd ∆∆G
variant [x 106M-1s-1] [x 10-3s-1] Kd (kin.) Kd (equilib.) (Mut./WT) kcal/mol
Y13F 12 11 (1.4) 26 (2.7) 2.4 x 10⁻⁹ 3.2 x 10⁻⁹ 40 2.2
Y127F 6 16 (1.0) 1.5 (0.4) 9.3 x 10⁻¹¹ 1.2 0.1
Y183F 9 6.0 (1.0) 190 (12) 3.1 x 10⁻⁸ 2.4 x 10⁻⁸ 310 3.4
n: number of measurements; SE: Standard error; Kd (kin.): Kd calculated from kinetic data. Kd (equilib.): Kd calculated from steady state binding data. The mean standard error for this value was 4.2%. Rel. Kd: relative value of Kd.
103

______________________________________________________________________3. Results
Variant Y13F showed more significant effect (Figure 3.28 A) but still not comparable to the
alterations observed with Y13A. The association constant was almost not affected due to the
amino acid substitution. The faster dissociation phase caused a decrease in binding affinity over
40-fold. The energetic contribution of this variant counted for merely 2.2 kcal/mol in contrast to
the large contribution of Y13A, implying that the IL-4BP binding properties were significantly
A
900800700600500400Time (s)
-10
0
10
20
30
40
50
Res
pons
e
RU
900800700600500400Time (s)
-10
-5
0
10
15
20
5
25
30
Res
pons
e
RU
B
C
Figure 3.28: Overlay of the sensograms representing the interaction of IL-4 and the tyrosine variants of IL-4BP: (A)
Y13F, (B) Y127F, (C) Y183F.
104

______________________________________________________________________3. Results
less affected by a phenylalanine substitution at this position than by an alanine replacement.
The largest effect due to the phenylalanine substitution displayed variant Y183F. While the
association constant was only slightly changed, the dissociation constant was over 190-fold faster
compared to the wild-type receptor (Table 3.8). The binding affinity was reduced over 300-fold,
corresponding to apparent binding energy contribution of 3.4 kcal/mol. In relation to the
corresponding alanine variant, Y183F still retained an about 2-fold higher binding affinity.
However, both variants revealed comparable energetic contribution (Table 3.7).
In summary, the substitution of the mentioned tyrosine side chains with the structurally similar
phenylalanine dropped down significantly the energetic contribution of the analyzed variants to
the overall loss of binding free energy. It seems that the hydroxyl group of the tyrosine at this
position does not take part in hydrogen bonds to IL-4 that are critical for the binding. It is more
likely that this tyrosine is involved in hydrophobic interactions through its aromatic ring. The
replacement of Y13 and Y183 by phenylalanine caused considerable effects which suggests that
their hydroxyl groups contribute to binding contacts. However, comparing the energetic
contribution of both variants Y13A and Y13F implies that Y13 has rather structural than
functional importance for the interaction between IL-4 and IL-4BP. It is also possible that Y183
is involved in more hydrogen bonds than Y13 and therefore the loss of its hydroxyl group results
in a greater functional effect. In addition, the results obtained from the phenylalanine variants to
some extent give an explanation for the enormously large sum of binding free energy determined
within the alanine mutational analysis.
3.3.4 Analysis of IL-4BP Double Mutants Since proteins are highly cooperative structures, it has to be considered that the contribution of a
particular residue might involve effects of multiple order. In many cases, interactions of several
amino acids are coupled to one another and may not be reduced simply to a sum of pairwise
interactions. In order to study experimentally the interaction of a certain amino acid residue in a
protein with other residues in that protein, it has become common practice to analyse the free
energy changes of multiple mutants (Wells, 1990; Jin et al., 1994; Hilser et al., 1998; Clackson et
al, 1998; Di Cera, 1998).
The analysis of double mutants considers the changes of binding free energy characterizing two
proteins mutated individually at the sites X and Y, respectively and the double mutant form,
which is mutated at both sites X and Y. To asses whether the effects between the examined
residues are cooperative or additive, the losses of binding free energies characterizing the two
105

______________________________________________________________________3. Results
individual mutations are theoretically summarized (∆∆Gadd) and compared to the value, which is
estimated for the double mutant. If the effects of the mutations are independent (non-
cooperative), the change in free energy for the double mutant form is equal to the sum of those
for the two site-specific mutations. If the two examined sites are coupled, then the change in free
energy for the double mutant differs from the sum of the two single mutants (Carter et al., 1984;
Di Cera, 1998). It is possible for ∆∆Gadd to be either lower or greater than the experimentally
estimated value for the double mutant depending upon whether the interactions between the
examined side chains reduce or enhance the functional properties measured (Wells, 1990).
In order to study whether the contact residues within IL-4BP are involved in cooperative
interactions or function in an independent manner, a series of double mutants was produced and
examined by BIAcore technology. Amino acid side chains from the three IL-4BP clusters
identified by the crystal structure of the complex were included in the analysis (Table 3.2). The
double mutant forms were constructed for all residues whose binding affinity decreased during
the alanine screening over 50 fold (Table 3.7), since they were considered to have significant
contribution to the binding. In half of the variants the mutation, D72N was uniformly present,
while the second mutated site was subsequently exchanged to L39A, F41A, D67A, V69A,
Y127A, or Y183F. The second group of double mutants constantly was modified to Y13F and
additionally the mutations L39A, F41A, D67A, V69A, Y127A, or Y183F were introduced.
Furthermore, a variant containing both mutations D72N and Y13F was created. Considering the
technical limitations of the used device, all the double mutated variants were constructed under
the condition that the theoretical sum of the change in free energies (∆∆Gadd) for the two
introduced mutations does not exceed 8 kcal/mol.
As expected, all examined double mutants demonstrated very low binding affinity to IL-4 (Figure
3.29). Initially, about 100 RU of receptor were immobilized on the biosensor chip and the IL-4
concentration was increased to 750 nM. Under those conditions, binding was recorded only for
variants Y13F/L39A, Y13F/F41A, and Y13F/D67A. To analyze variants Y13F/V69A,
Y13F/Y127A, and Y13F/Y183F, it was necessary to increase the amount of immobilized
receptor to 200 RU and the IL-4 concentration to 3000 nM. The experiments for the remaining
variants were performed with 400 RU of receptor immobilized on the chip, and IL-4
concentrations up to 3000 nM. Both kinetic constants for the interaction of IL-4 and the double
mutant variants could not be evaluated due to the high concentration of ligand that was applied
causing very fast association, on one side, and the extremely rapid dissociation phase, on the
other. Values for the equilibrium dissociation constant Kd were derived from the plots
representing the receptor saturation levels at different ligand concentrations (Figure 3.30).
Generally, the double mutants showed high Kd (between 1.4 x 10⁻⁷ and 7.7 x 10⁻⁵ M), but as
106

______________________________________________________________________3. Results
expected the mutant forms containing Y13F were less affected than the variants carrying D72N
(Table 3.9). Although the receptor variants Y13F/D72N and D72N/D67A were immobilized with
high density on the chip and extremely high IL-4 concentration was used, saturating binding was
A
900800700600500400Time (s)
-5
0
5
10
15
20
25
30
RU
Resp
onse
850800750700650600550500450400Time (s)
-5
0
5
10
15
20
25
30
35
40
RU
Res
pons
e
B
C
Figure 3.29: Overlay of sensograms which recorded the interaction between IL-4 and double mutants of IL-4BP: (A)
Y13F/L39A, (B) Y13F/F41A, (C) D72N/V69A.
107

______________________________________________________________________3. Results
not obtained and the equilibrium binding constants could not be determined. It seems that their
Kd values exceed the detection limits of the used technical device (typically for steady state
analysis 10-4 – 10-9 M), considering the fact that Kd of 7.7 x 10⁻⁵ M was still successfully
determined. Experiments with higher receptor density were not performed within the present
study, since for reliable measurements it is recommended to keep the immobilized receptor at
levels of 100-500 RU (BIAapplications Handbook, 1995). Furthermore, for the system of IL-
4/IL-4BP it was already reported that density above 50 pg/mm2 (1 RU corresponds to 1 pg/mm2)
resulted in high bulk-phase signals and drift phenomena (Shen, et al., 1996).
Table 3.9: Equilibrium dissociation constant and loss of binding free energies for the IL-4BP double mutant variants
Receptor n Kd (equilib.) ∆∆G ∆∆Gadd variant [M] [kcal/mol] [kcal/mol]
Y13F/L39A 9 2.6 x 10⁻⁷ 4.8 5.4 Y13F/F41A 9 2.4 x 10⁻⁷ 4.8 5.0 Y13F/D67A 9 3.9 x 10⁻⁷ 5.1 5.0 Y13F/V69A 9 2.2 x 10⁻⁷ 4.7 4.8 Y13F/D72N 9 ND ND 8.2 Y13F/Y127A 9 1.4 x 10⁻⁷ 4.4 4.8 Y13F/Y183F 9 4.9 x 10⁻⁷ 5.2 5.6 D72N/L39A 9 9.0 x 10⁻⁷ 5.5 8.0 D72N/F41A 9 2.3 x 10⁻⁶ 6.1 7.6 D72N/D67A 9 ND ND 7.6 D72N/V69A 9 2.8 x 10⁻⁶ 6.2 7.4 D72N/Y127A 9 1.6 x 10⁻⁵ 7.2 7.4 D72N/Y183F 9 7.7 x 10⁻⁵ 8.2 8.2
n: number of measurements.
Kd (equilib.): Kd calculated from steady state binding data. The mean standard error for this value was 30 %.
∆∆Gadd: the sum of ∆∆G for the two individual mutations.
ND: the values could not be accurately determined because they exceeded the limitations of the instrument.
The analysis of double mutants applied to IL-4BP revealed that most of the variants were
characterized by values of ∆∆G very similar to the theoretically predicted ∆∆Gadd, implying that
the examined amino acid residues are independent and the observed mutational effects are
108

______________________________________________________________________3. Results
additive. However, the variants D72N/F41A and D72N/V69A were found to have higher binding
affinity than expected. From all double mutants of IL-4BP, which were successfully analyzed
variant D72N/L39A showed the largest difference between the theoretically predicted binding
free energy and the experimental value. The residues L39, F41, V69, and D72, examined through
the mentioned variants, were shown to be part from one and the same structural cluster (Hage et
al., 1999). Therefore, it is likely that they are involved in cooperative contacts, especially
considering the fact that the present data suggests a favorable kind of interactions.
A B
800720640560480400320240160800(nM)
0
2
46
8
10
12
14
16
18
RU (eq)
8007206405604804003202401608000
5
10
15
20
25
(nM)
RU (eq)
C D
3500300025002000150010005000(nM)
05
10
15
20253035
40
4550
RU (eq)
35003000(NM)
250020001500100050000
5
10
15
20
25
30
RU(eq)
35
Figure 3.30: Equilibrium phase ofsome double mutants. (A)Y13F/L39A, (B) Y13F/F41A, (C) Y13F/D67A, (D)
Y13F/Y183F D72N/V69A.
109
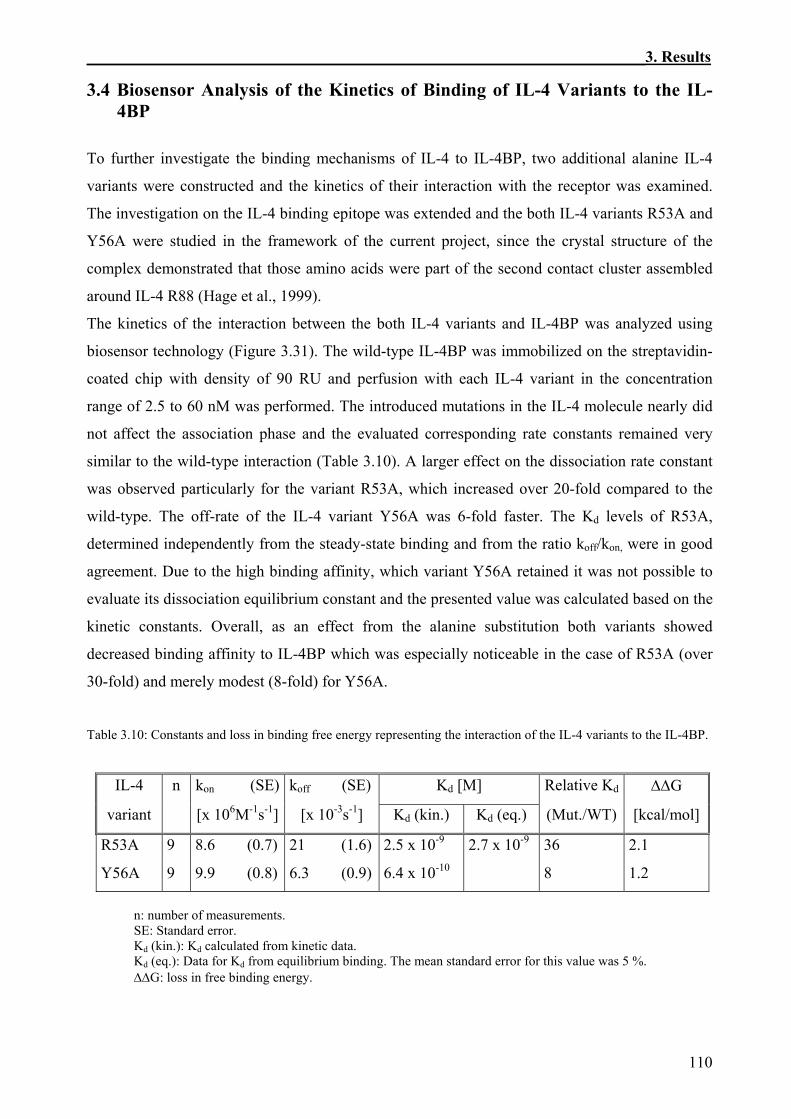
______________________________________________________________________3. Results
3.4 Biosensor Analysis of the Kinetics of Binding of IL-4 Variants to the IL-4BP
To further investigate the binding mechanisms of IL-4 to IL-4BP, two additional alanine IL-4
variants were constructed and the kinetics of their interaction with the receptor was examined.
The investigation on the IL-4 binding epitope was extended and the both IL-4 variants R53A and
Y56A were studied in the framework of the current project, since the crystal structure of the
complex demonstrated that those amino acids were part of the second contact cluster assembled
around IL-4 R88 (Hage et al., 1999).
The kinetics of the interaction between the both IL-4 variants and IL-4BP was analyzed using
biosensor technology (Figure 3.31). The wild-type IL-4BP was immobilized on the streptavidin-
coated chip with density of 90 RU and perfusion with each IL-4 variant in the concentration
range of 2.5 to 60 nM was performed. The introduced mutations in the IL-4 molecule nearly did
not affect the association phase and the evaluated corresponding rate constants remained very
similar to the wild-type interaction (Table 3.10). A larger effect on the dissociation rate constant
was observed particularly for the variant R53A, which increased over 20-fold compared to the
wild-type. The off-rate of the IL-4 variant Y56A was 6-fold faster. The Kd levels of R53A,
determined independently from the steady-state binding and from the ratio koff/kon, were in good
agreement. Due to the high binding affinity, which variant Y56A retained it was not possible to
evaluate its dissociation equilibrium constant and the presented value was calculated based on the
kinetic constants. Overall, as an effect from the alanine substitution both variants showed
decreased binding affinity to IL-4BP which was especially noticeable in the case of R53A (over
30-fold) and merely modest (8-fold) for Y56A.
Table 3.10: Constants and loss in binding free energy representing the interaction of the IL-4 variants to the IL-4BP.
IL-4 n kon (SE) koff (SE) Kd [M] Relative Kd ∆∆G
variant [x 106M-1s-1] [x 10-3s-1] Kd (kin.) Kd (eq.) (Mut./WT) [kcal/mol]
R53A 9 8.6 (0.7) 21 (1.6) 2.5 x 10⁻⁹ 2.7 x 10⁻⁹ 36 2.1
Y56A 9 9.9 (0.8) 6.3 (0.9) 6.4 x 10⁻¹⁰ 8 1.2 n: number of measurements. SE: Standard error. Kd (kin.): Kd calculated from kinetic data. Kd (eq.): Data for Kd from equilibrium binding. The mean standard error for this value was 5 %. ∆∆G: loss in free binding energy.
110

______________________________________________________________________3. Results
The corresponding values of ∆∆G suggest that the examined residues from the IL-4 contact
epitope should be considered as functionally significant, since the energetic contribution of R53A
was counted for 2.1 kcal/mol, and this of Y56A for 1.2 kcal/mol. Generally, an introduction of a
mutation within IL-4 was followed by more moderate alterations of functional properties
compared to IL-4BP (Wang et al., 1997). Therefore, even though the demonstrated effects were
less pronounced, they imply that the mentioned amino acids are of importance for the interaction
with the receptor, and are part of the binding epitope. Furthermore, the data obtained from the
association and dissociation phases is in agreement with the proposal that the amino acids from
the second contact cluster stabilize the complex with the receptor (Hage et al., 1999) and in this
respect they are consistent with results from earlier mutational studies of other residues from the
same cluster (Wang et al., 1997).
850750650550450350Time (s)
-10
0
10
20
30
40
50
RU
Resp
onse
850750650550450350Time (s)
-10
0
10
20
30
40
50
RU
Resp
onse
A
B
Figure 3.31: Sensograms representing the interaction of IL-4 variants R53A (A) and Y56A (B) with IL-4BP.
111

__________________________________________________________________4. Discussion
4. Discussion
Human IL-4, as most cytokines, has pleiotropic functions and exhibits a wide range of biological
effects on various tissues and cells. Responses are induced after IL-4 binds to its receptor. A
central goal of receptor research is to understand, at molecular level, how receptors allow cells to
sense and to respond to their external environment. A possible approach to this issue is to
elucidate the binding determinants within both the ligand and the receptor, and to identify the
molecular recognition mechanisms of the interaction between them. Improving the knowledge of
the features characterizing the binding mechanisms is not only of theoretical interest, but as well
is important for the drug development. Extensive information about the binding epitope of the α
chain of the IL-4 receptor is of special benefit for drug design. With regard to the fact that this
receptor component is implicated in the binding of two cytokines, which are involved in allergic
responses (IL-4 and IL-13), a blocking agent directed against its binding epitope would be of
advantage for both IL-4- and IL-13- mediated allergic diseases.
Usually, two powerful methods, structural analysis and mutational analysis, are exploited to
characterize sufficiently the interactions occurring within a receptor-ligand system. Only in
combination they can explain how energetics and regulatory contacts are encoded into structure,
and to provide comprehensive understanding of structure-functional correlations. Structural
analysis reveals the contacts that contribute to protein-protein recognition in atomic details (Jones
& Thornton, 1996). However, it alone cannot show how these contacts contribute to overall
affinity and specificity. Ideally, the high-resolution structure of a complex is used to guide an
extensive functional survey of residues present at the interface using site-directed mutagenesis, to
allow their individual contributions to be assessed. Furthermore, construction and analyses of
double mutants provides additional information about cooperative interactions, which link the
behavior of different amino acid residues within the protein molecule.
4.1 Structural Features and Binding Site of Human IL-4BP Since at the beginning of the presented study there was no structural data about the ligand-
binding epitope of IL-4BP, the initial selection of amino acids subjected to alanine substitution
relied on two theoretical models of the complex between IL-4 and its receptor, which were
available at that time (Bamborough et al., 1994; Gustchina et al., 1995). Both models were built,
using as a starting point the extracellular portion of human growth hormone receptor (hGHbp),
112

__________________________________________________________________4. Discussion
since the structural and functional epitopes of the receptor and the ligand have been well
characterized (De Vos et al., 1992; Cunningham & Wells, 1993). Based on sequence
conservation and the predicted common structural organization for cytokine receptors, the amino
acid sequences of a few different extracellular domains of cytokine receptors, including IL-4BP
were aligned and examined for similarities to hGHbp.
Although in the hGH/hGHbp complex the major contribution is provided by hydrophobic side
chains, the IL-4BP interface proposed by the two models contains several polar and charged
residues. Agreeably, as most prominent contact determinants from the receptor side were defined
D72 and K91, which were suggested to form ion pairs with IL-4 R88 and E9, respectively. This
assumption was supported also by the results from the mutagenesis study of human IL-4, which
showed that charged and polar determinants predominate in its high-affinity binding epitope
(Wang et al., 1997). According to the alignment of amino acid sequences of hGHbp with IL-4BP
A71 and Y129 of IL-4BP superimpose the two most important binding determinants of hGHbp,
W104 and W169, respectively. Therefore, those amino acids and their close surrounding from the
same loop regions were of principle interest for the mutagenesis study of IL-4BP. Besides this,
the models implicated particularly residues D66, D67, V69, S70, N126, Y127, and L128 of IL-
4BP in direct contacts with amino acids from the ligand. Additionally, in the mutational analysis
were included residues M14 and S15, as well as P92, S93, and E94, since they correlate in the
frame of the sequence alignment to amino acids of hGHbp, which have shown certain functional
importance for the binding with hGH.
At a later step, when the crystal structure of the complex between human IL-4 and IL-4BP was
determined, the set of examined amino acids from IL-4BP interface was extended. Generally, the
structure revealed an organization similar to the already observed for other hematopoietic
receptors (Hage et al., 1999). IL-4BP consists of two covalently linked domains (D1 and D2).
The domains are related to the overall topology of fibronectin type III (FN III) modules and fold
into a sandwich comprising seven antiparallel β sheets. Moreover, it contains the strictly
conserved four cysteine residues in the N-terminal domain and the strongly conserved
“WSXWS” motif near the C-terminus of the second domain, which are distinctive characteristics
of the cytokine receptor homology (CRH) region, as defined by Bazan, 1990.
The structural epitope of IL-4BP was shown to be assembled by residues of five loops and has a
midline of hydrophobic side chains with patches of tyrosine and serine residues situated on one
side and a patch of aspartic acid side chains on the other side (Figure 4.1). An analysis of the
possible hydrogen bonds and van der Waals contacts between IL-4 and its receptor revealed that
their binding epitopes consist of three structurally independent subunits. Two of them (designated
as cluster I and cluster II) were compared to an “avocado fruit”, since they exhibit a conspicuous
113
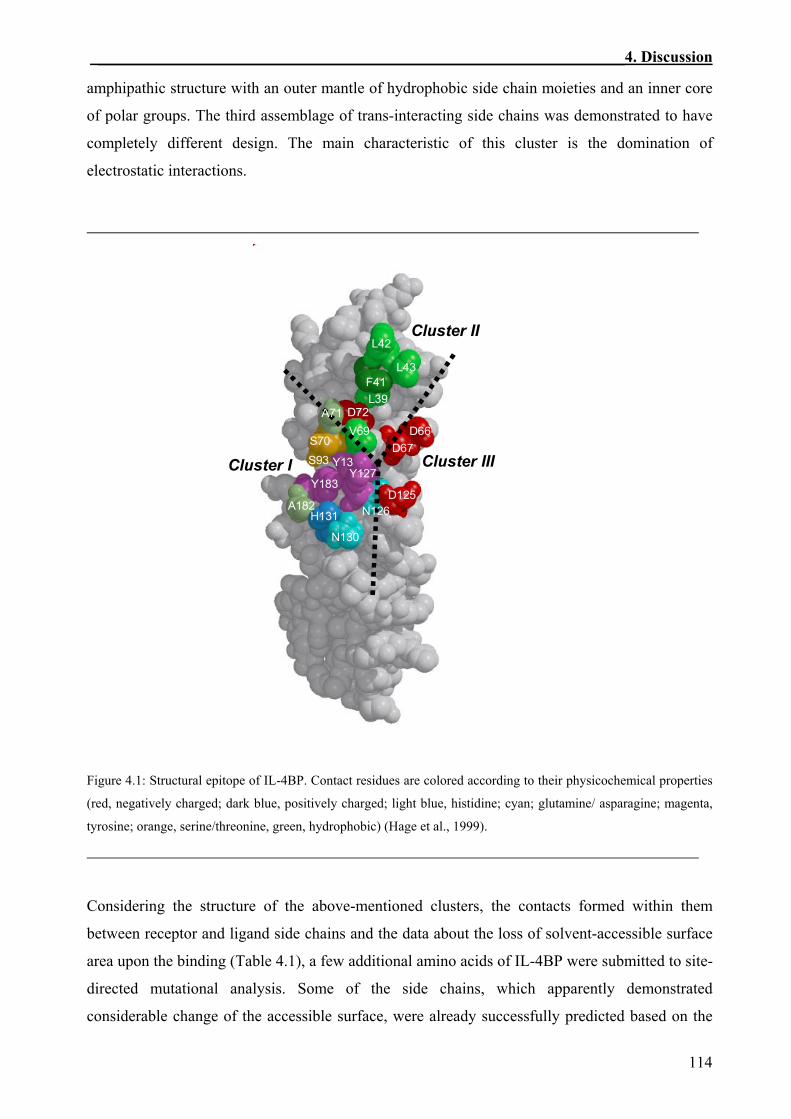
__________________________________________________________________4. Discussion
amphipathic structure with an outer mantle of hydrophobic side chain moieties and an inner core
of polar groups. The third assemblage of trans-interacting side chains was demonstrated to have
completely different design. The main characteristic of this cluster is the domination of
electrostatic interactions.
A182H131
N130
D125Y183
Y13S93S70
L42
L43
L39D72
F41
D66D67
Cluster I
Cluster II
Cluster III
N126
Y127
A71V69
Figure 4.1: Structural epitope of IL-4BP. Contact residues are colored according to their physicochemical properties
(red, negatively charged; dark blue, positively charged; light blue, histidine; cyan; glutamine/ asparagine; magenta,
tyrosine; orange, serine/threonine, green, hydrophobic) (Hage et al., 1999).
Considering the structure of the above-mentioned clusters, the contacts formed within them
between receptor and ligand side chains and the data about the loss of solvent-accessible surface
area upon the binding (Table 4.1), a few additional amino acids of IL-4BP were submitted to site-
directed mutational analysis. Some of the side chains, which apparently demonstrated
considerable change of the accessible surface, were already successfully predicted based on the
114
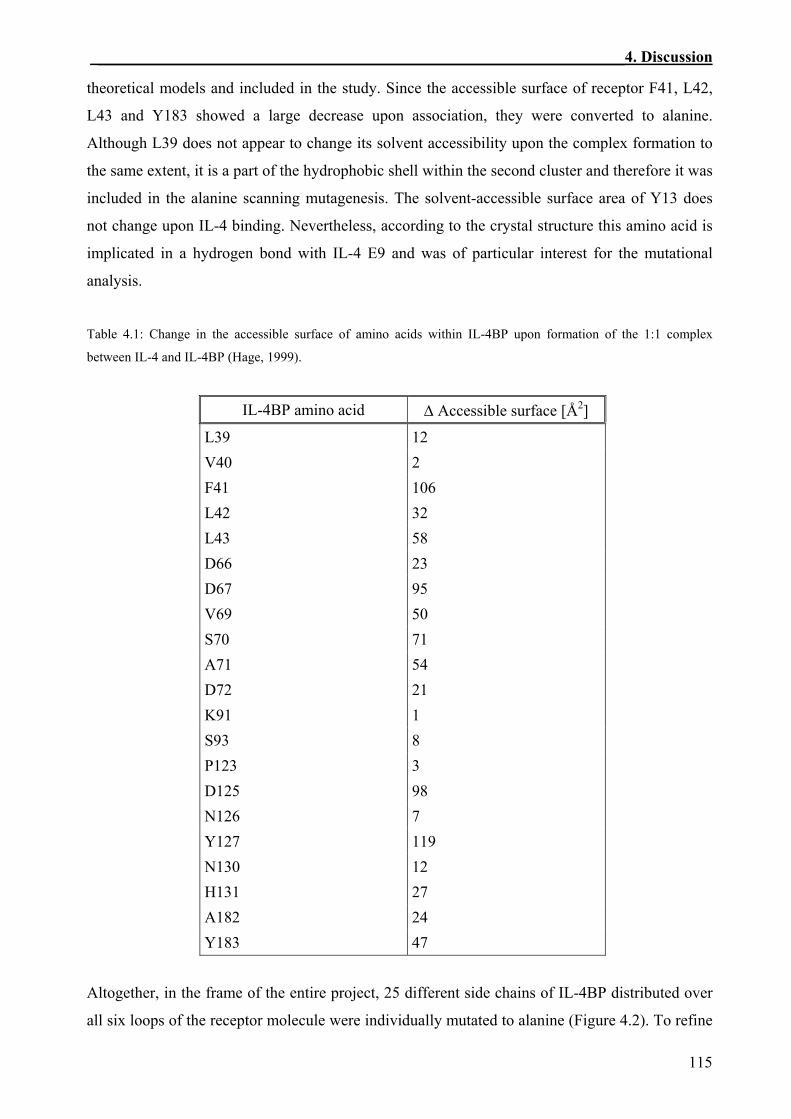
__________________________________________________________________4. Discussion
theoretical models and included in the study. Since the accessible surface of receptor F41, L42,
L43 and Y183 showed a large decrease upon association, they were converted to alanine.
Although L39 does not appear to change its solvent accessibility upon the complex formation to
the same extent, it is a part of the hydrophobic shell within the second cluster and therefore it was
included in the alanine scanning mutagenesis. The solvent-accessible surface area of Y13 does
not change upon IL-4 binding. Nevertheless, according to the crystal structure this amino acid is
implicated in a hydrogen bond with IL-4 E9 and was of particular interest for the mutational
analysis.
Table 4.1: Change in the accessible surface of amino acids within IL-4BP upon formation of the 1:1 complex
between IL-4 and IL-4BP (Hage, 1999).
IL-4BP amino acid ∆ Accessible surface [Å2]
L39 12 V40 2 F41 106 L42 32 L43 58 D66 23 D67 95 V69 50 S70 71 A71 54 D72 21 K91 1 S93 8 P123 3 D125 98 N126 7 Y127 119 N130 12 H131 27 A182 24 Y183 47
Altogether, in the frame of the entire project, 25 different side chains of IL-4BP distributed over
all six loops of the receptor molecule were individually mutated to alanine (Figure 4.2). To refine
115

__________________________________________________________________4. Discussion
the functional epitope, substitutions by more conservative residues were performed, where it was
necessary. The binding affinity of the mutated variants to IL-4 was examined by the use of a
biosensor-based technology.
Y13 M14S15
L39F41
L42L43
D66D67
V68V69S70
D72N73
K91P92
S93
D125N126Y127
L128
Y129
Y183
E94Y74
Figure 4.2: Side chains within IL-4BP subjected to site-directed mutagenesis. The colour scheme is according to
traditional amino acid properties. Roughly, polar amino acids are presented in bright colours and non-polar in darker.
(aspartic acid and glutamic acid, bright red; lysine, mid blue; methionine, yellow; serine, orange; phenylalanine and
tyrosine, blue; asparagine, cyan; valine, leucine, green; proline, flesh).
4.2 Defining Functional Important Residues from The Interface of Human IL-4BP for the Interaction with IL-4
The present study has identified all amino acid side chains within the extracellular domain of the
IL-4 receptor α chain that are engaged in the high-affinity binding of the ligand. A scanning
116

__________________________________________________________________4. Discussion
mutagenesis strategy was used to dissect the contribution of the particular IL-4BP residues to the
binding energy. Such approaches typically assume that no structural disturbances are caused by
the mutations, so that the energetic consequences are entirely attributable to the deletion of the
contacts.
Undeniably, the site-directed mutational analysis defined the side chain of D72 as one of the
major functional determinants for the interaction with the ligand. A mutation at this site to alanine
caused 2600-fold decrease of binding affinity, corresponding to energetic contribution of 4.7
kcal/mol. Such an effect definitely indicates affected functional properties and cannot be
attributed to structural perturbation due to the introduced mutation. The assumption is based on
the analysis of the additional variant D72N. The exchange of the aspartic acid by the structurally
similar asparagine is followed by the loss of a negative charge, but generally is not expected to
have disruptive effect on the structure. Despite the conservative character of the substitution
made, variant D72N demonstrated decrease of binding affinity that basically was the same as the
observed for the alanine variant. Thus, the original side-chain D72 and especially its negative
charge is directly implicated in a contact to the ligand. The conclusion about the functional
importance of D72 for the interaction with IL-4 is consistent with the findings of independent
experiments using a cell-based selection strategy (Friedrich et al., 1999; Wietek, 1999). Two
different receptor constructs carrying the receptor mutants D72A and D72R, respectively, were
expressed in the murine pro-B cell line (Ba/F3) and examined for interaction with IL-4.
Proliferation assays verified that cells expressing the charge reverse mutation D72R completely
failed to proliferate in the presence of IL-4, while cell populations carrying D72A showed a weak
response after treatment with IL-4. In addition, radioligand binding experiments revealed a
complete loss of specific IL-4 binding by cells expressing D72R receptors, confirming that D72R
receptors are incapable of productive interaction with IL-4. Furthermore, the results from the
mutational analysis are in perfect agreement with the crystal structure of the IL-4/IL-4BP
complex (Figure 4.3 B), which revealed that a salt pair links the side chain of D72 to IL-4 R88
(Hage et al., 1999).
The results from the alanine scanning mutagenesis pointed three tyrosine residues, Y13, Y127,
and Y183, as prominent binding determinants from the receptor side. The mutant variant Y13A
showed reduction of binding affinity over 10000-fold compared to the wild-type interaction. Its
contribution to the loss of binding free energy counts 5.5 kcal/mol, which is the largest effect
observed in the course of the alanine scan for IL-4BP. Further experiments were performed to
assess if this effect is functional or structural. Replacement of Y13 by a phenylalanine residue
resulted in merely 40-fold decreased binding affinity in comparison with the wild-type. Since the
phenylalanine is a structural analog of the originally present amino acid, but without properties
117

__________________________________________________________________4. Discussion
for forming hydrogen bonds, it seems that the reason for the large effect demonstrated by Y13A
is rather structural than functional. The alanine variant could still be recognized by the anti-IL-
4BP monoclonal antibody and therefore overall structural disruption could be excluded. It is more
likely that the substitution caused only local perturbations within the contact cluster, but was not
sufficient to destroy the structure as a whole. If Y13 is a structurally important residue for the
entire cluster such a substitution will affect not only the contact properties of Y13, but of all
amino acids within the cluster and will give an explanation for the large loss of binding free
energy demonstrated by Y13A. Further, it has to be considered that in some cases, especially if
much smaller amino acid replaces a large one, solvent can occupy the place of the missing side
chain. Regarding the crystal structure (Hage at al., 1999), it seems that the effect shown by Y13F
represents totally the functional importance of Y13. The hydroxyl group of this residue is
implicated in a hydrogen bond with IL-4 E9 (Figure 4.3 A), and on that base it is reasonable to
expect a modest functional effect by variant Y13F.
Even more dramatic differences between affinity of the alanine and phenylalanine mutant form
were observed in the case of Y127. Variant Y127A was characterized by 80-fold lower binding
affinity to IL-4 than IL-4BP, while Y127F did not demonstrate considerable effect (1.2-fold) on
the binding and in fact behaved as a wild-type receptor. However, the effect of the alanine
substitution is by far not as large as in the case of Y13A and does not support the idea that
Y127A is a structurally affected mutant. The structural data suggest that Y127 takes part in a
series of hydrophobic interactions with the aliphatic side chain of IL-4 E9 (Hage, 1999).
Therefore, it is likely that the reduced binding affinity of variant Y127A represents the
contribution of those contacts and they are perhaps not disrupted when variant Y127F plays a part
in the interaction with IL-4. According to the structure of the complex with IL-4, the hydroxyl
group of receptor Y127 is involved in a hydrogen bond to IL-4 T13 (Figure 4.3 A) and
additionally is bridged by a single ordered water molecule to IL-4 N89 (Hage et al., 1999).
Nevertheless, the analysis of the mutant form Y127F, which is not able to form such contacts,
indicates that they do not have significant contribution to the binding and should not be
considered as functionally important for the complex stability.
Replacement of receptor Y183 by alanine and phenylalanine revealed that both variants Y183A
and Y183F bound IL-4 with low affinity. The alanine substitution caused a larger effect and the
binding affinity of Y183A to IL-4 was reduced 800-fold compared to the wild-type interaction.
Due to the introduced mutation, variant Y183F demonstrated an over 300-fold decrease in
binding affinity corresponding to 3.4 kcal/mol loss of binding free energy. Definitely, the large
energetic effect of mutation Y183F is an indication about the important functional role, which the
hydroxyl group of Y183 takes in the interaction with the ligand. The crystal structure of IL-4/IL-
118

__________________________________________________________________4. Discussion
4BP complex showed that this group is involved in a hydrogen bond to IL-4 E9 (Figure 4.3 A),
one of the major binding determinants within the ligand (Hage et al., 1999). Another hydrogen
bond was suggested to link Y183 to IL-4 K12. Apparently, those are contacts of great
significance, which have a crucial role for the stability of the complex with IL-4, since their
destruction was followed by a large functional effect. Furthermore, the side chain of receptor
Y183 was implicated in van der Waals contacts to IL-4 I5 (Hage, 1999), which might explain to
some extent the fact that a substitution by alanine has a greater effect on ligand binding. Small
structural perturbations in variant Y183A cannot be excluded to be partially the reason for the
reduced binding affinity to IL-4. However, if the mutation Y183A caused some disruptions in the
receptor structure they certainly were minor and cannot be compared to the case observed with
variant Y13A. Therefore, it seems that within contact cluster I of IL-4BP the residue Y183
provides the largest functional contribution to the ligand binding. Moreover, the site-directed
mutational analysis of IL-4BP established the side chain of Y183 as one of the main binding
determinants from the receptor side for the high-affinity interaction with IL-4.
Aspartic acids at positions 66, 67, and 125 were converted to alanine and examined for effects on
the interaction, as they were determined to be engaged within the third structural cluster of IL-
4BP (Hage et al., 1999). The largest reduction in affinity (120-fold) occurred in variant D67A,
which energetic contribution was estimated to be 2.8 kcal/mol. Mutations D66A and D125A
decreased the affinity to a minor degree: 7- and 10-fold, respectively. The lower effects observed
with these variants are in agreement with the suggestion that the third contact cluster is not
important for the complex stability (Hage et al., 1999). The amino acids from the cluster were
supposed to accelerate complex formation through electrostatic steering. Due to an alanine
mutation certainly was affected the association phase of variant D67A, which appeared to be 4-
fold slower compared to the wild-type interaction. Apparently, the other two alanine mutants
demonstrated negligible changes in association. However, the overall contribution of D125 to the
affinity and also to the association of the complex might be partially underestimated, since some
contacts to the ligand in which this amino acid is involved are built by its main chain.
The analysis of the hydrophobic sequence of amino acids localized on loop L2 revealed that only
L39 and F41 are of certain functional importance for the highly-affinity binding between IL-4
and its receptor. Variant L39A bound IL-4 with over 200-fold lower binding affinity than IL-4BP
did, while the binding affinity of F41A decreased over 100-fold. The association phase of both
mutant forms was about 2-fold slower than the wild-type exhibited, but their dissociation was
significantly affected due to the introduced mutation. Substitution of L42 and L43 by alanine did
not result in considerable effects on the binding kinetics. As long as the properties of the alanine
variants from this sequence were affected, the effects did not suggest a direct contribution to the
119

__________________________________________________________________4. Discussion
binding, but a supporting function of the original amino acids. Such an assumption is in
accordance with the crystal structure, which showed that these amino acids are the main part of a
hydrophobic shell surrounding D72 (Figure 4.3 B), and are involved in a number of van der
Waals contacts with residues from IL-4 (Hage, 1999). The side chain of V69 localized on another
loop (L3) in the receptor molecule completes the hydrophobic cluster around D72. Variant V69A
behaved in a similar way to variants L39A and F41A; since it showed a 2-fold slower association
and a modest effect on binding affinity (80-fold reduction). Besides the disruption of weak
contacts, the substitution of large residues by alanine might be followed by penetration of water
molecules in the hydrophobic cluster. Although no one of those residues demonstrated
characteristics of a major binding determinant, disorder in the proper hydrophobic environment,
which they provide alters to some degree the functional properties of IL-4BP as it affects the
complex stability and to a minor extent concerns the association phase.
No one of the residues K91, P92, S93, and E94, which are situated on loop L4 of IL-4BP,
indicated significant contribution to the binding when they were exchanged by alanine. The
corresponding variants reduced the binding affinity between 2- and 17-fold. In the absence of
structural data receptor K91 was of special interest for the study, since a theoretical model of IL-
4/IL-4BP complex suggested this residue to be one of the main contact determinants, taking part
in electrostatic interactions to IL-4 E9 (Bamborough et al., 1994). For that reason an additional
variant K91D was produced and examined, although the analogous alanine variant showed
negligible energetic contribution (0.8 kcal/mol). Despite the fact that the charge reversal mutation
was expected to cause a grate effect on binding, the affinity in this case was reduced merely 30-
fold. Thus, the charge of receptor K91 is not involved in functionally important contacts to the
ligand and the residue is not considered as a binding determinant. The site-directed mutagenesis
of K91 should be seen as an example for the limited potential and accuracy of the molecular
modelling as an approach for defining structural and functional epitopes. Later, in agreement with
the above-mentioned findings, the structure of the complex confirmed that the entire loop L4 is
not implicated in contacts to the ligand (Hage et al., 1999).
The alanine scanning muatgenesis of IL-4BP did not reveal that some of the remaining amino
acids included in the study provide important contribution to binding. Interestingly, variant S70A
showed virtually the same binding affinity to IL-4 as the wild-type receptor. This amino acid is
involved by its main chain in a hydrogen bond to IL-4 E9 (Figure 4.3 A) and additionally by its
side chain forms a second with IL-4 T6 (Hage, 1999). Disruption of the hydrogen bond, in which
the side chain of S70 plays a part, clearly showed that this contact is of no functional importance
for the stability of the complex. This is supported by the fact that mutations of IL-4 T6, caused
just negligible changes on binding affinity (Wang et al., 1997). It is likely that only the contact
120

__________________________________________________________________4. Discussion
made by the main chain of S70 is significant for the interaction with the ligand, but due to
limitations of the used method that could not be assessed.
C
B
A
Figure 4.3: Details of the IL-4/IL-4BP contact: A, contact cluster I; B, contact cluster II; C, contact cluster III (Hage
et al., 1999).
In conclusion, the site-directed mutagenesis of IL-4PB residues defined clearly its functional
epitope for the interaction with IL-4 (Figure 4.4). As major binding determinants were
established the side chains of Y183 and D72 from binding clusters I and II, respectively. The
contacts made by the side chain of D72 are strongly enhanced by the hydrophobic shell that
121
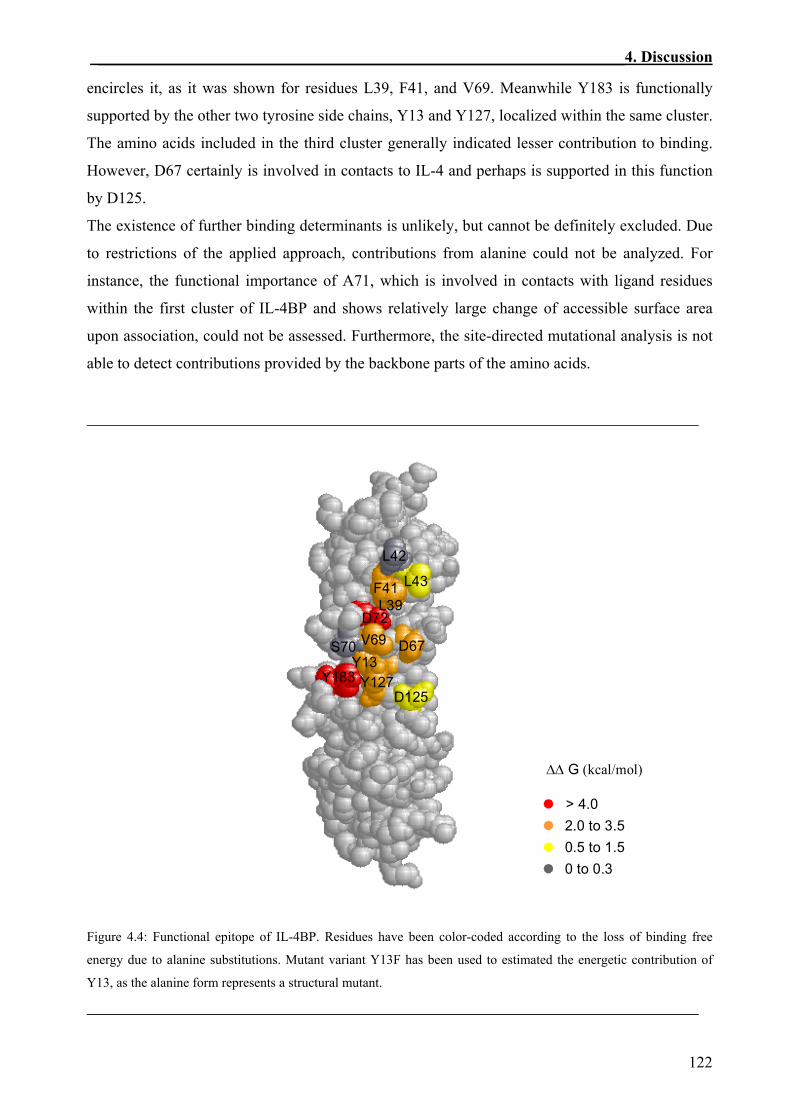
__________________________________________________________________4. Discussion
encircles it, as it was shown for residues L39, F41, and V69. Meanwhile Y183 is functionally
supported by the other two tyrosine side chains, Y13 and Y127, localized within the same cluster.
The amino acids included in the third cluster generally indicated lesser contribution to binding.
However, D67 certainly is involved in contacts to IL-4 and perhaps is supported in this function
by D125.
The existence of further binding determinants is unlikely, but cannot be definitely excluded. Due
to restrictions of the applied approach, contributions from alanine could not be analyzed. For
instance, the functional importance of A71, which is involved in contacts with ligand residues
within the first cluster of IL-4BP and shows relatively large change of accessible surface area
upon association, could not be assessed. Furthermore, the site-directed mutational analysis is not
able to detect contributions provided by the backbone parts of the amino acids.
D72
Y183Y13
Y127
V69S70 D67
D125
F41L39
L43
L42
∆∆ G (kcal/mol)
> 4.02.0 to 3.50.5 to 1.50 to 0.3
Figure 4.4: Functional epitope of IL-4BP. Residues have been color-coded according to the loss of binding free
energy due to alanine substitutions. Mutant variant Y13F has been used to estimated the energetic contribution of
Y13, as the alanine form represents a structural mutant.
122
__________________________________________________________________4. Discussion
Based on the results from the alanine scan, the sum of the apparent binding free energy
contributions (> 36 kcal/mol) considerably exceeds the estimated binding free energy for the
complex (13.8 kcal/mol, corresponding to Kd=77 pM). The contributions made only by the
residues included in the functional epitope of IL-4BP already give a sum of over 26 kcal/mol.
Certainly, some contributions were overestimated due to structural perturbations caused by the
introduced alanine residue. Nevertheless, this is only partially the reason for the high sum. The
most pronounced instance of structural perturbations is presumably variant Y13A, but even in
this case it seems that only approximately 3 kcal/mol from the loss of binding free energy can be
attributed to structural effects, while the remaining 2.2 kcal/mol represent disrupted functional
properties. Likewise, some alanine variants demonstrated large energetic contributions probably
because the side chains of the original amino acids are involved in more than one single contact
to the ligand. For example, the crystal structure revealed that the side chain of receptor Y183
takes part in hydrogen bonds to both IL-4 E9 and K12. Furthermore, high loss of binding free
energy implies that some of the examined mutations are not independent in their effects. That can
be explained by the fact that particular side chains are involved not only in interactions to the
ligand but also in intramolecular contacts. If interactions among residues within the receptor
molecule are present, as a result the effect of the mutation will be propagated to other residues. In
such cases the alanine scanning muatagenesis cannot assess properly the real contribution of the
single side chains because the observed effect depends on the state of other residues (Di Cera,
1998). Cooperativity is supposed to take place between residues within the binding epitope of IL-
4 (Wang et al., 1997). The small number of amino acids identified in the functional epitope of IL-
4BP and the large energetic contribution which they indicate, suggest that cooperative
interactions might exist also in IL-4BP.
In summary, the approach based on an alanine scanning mutagenesis is in principle powerful and
informative. However, in the course of practical applications some limitations should be
considered. Substitution by alanine, although is not supposed to introduce additional new
contacts, might cause structural changes and subsequently large energetic consequences. Such
effects might be wrongly assessed as functional. Therefore, the residues, which revealed great
apparent contribution in the present study, were further mutated to produce structurally similar
variants to the wild-type receptor. Furthermore, results might be misinterpreted in cases when
interactions of several amino acids are coupled to one another and are not reduced simply to a
sum of pairwise interactions. To identify if the effects from the site directed mutagenesis of IL-
4BP are independent or not, the present study was completed by analyses of receptor double
mutant forms.
123
__________________________________________________________________4. Discussion
4.3 Additivity and Cooperativity in the Functional Epitope of IL-4BP Additive and cooperative mutational effects between the residues from the functional IL-4BP
epitope were examined by applying double mutants. The side chains of amino acids L39, F41,
D67, V69, Y127, and Y183 were analyzed for potential intramolecular interactions with Y13 and
D72, respectively. In addition, a variant containing mutations at both sites, D72 and Y13, was
created.
Comparison of the theoretically predicted ∆∆Gadd and the estimated change of binding free
energy (Table 3.9) for variants Y13F/Y127A and Y13F/Y183F indicates that the effects between
the residues from contact cluster I are additive. This suggests not only that the sites act
functionally independent, but also that no one of the introduced mutations caused structural
perturbations. Indirectly this fact confirmed the assumption that mutation Y127A in the
corresponding single variant was not disruptive to the structure and the observed effect
represented basically the functional contribution of this residue to binding. Further, the analysis
of double mutants indicated that the hydroxyl group from the side chain of Y13 is not involved in
contacts to other residues from the cluster, but just in the interaction with IL-4. Therefore the
mutational effect demonstrated by variant Y13F (2.2 kcal/mol) should be seen as the entire
contribution of Y13 to ligand binding. The site-directed mutational analysis revealed that Y13 is
important probably for the structure of the whole cluster. Since in these double mutated forms of
the receptor Y13 was exchanged by the similar phenylalanine residue, which clearly did not
affect the structure, it seems that the aromatic ring of Y13 is a crucial structural element
supporting the conformation and the integrity of the cluster.
Independent contributions to binding were shown from the side of Y13 and the hydrophobic shell
surrounding D72, since the binding free energies of variants Y13F/L39A, Y13F/F41A, and
Y13F/V69A negligibly differ from the corresponding ∆∆Gadd values. Likewise, additivity was
established between the effects of Y13F and the binding determinant from cluster III D67. The
binding free energies characterizing the double mutants, which carry the mutations D72N/Y127A
and D72N/Y183F were very close to the values predicted by adding the energies of the single
mutants. This is a clear indication that the main functional determinant D72 behaves in a
completely independent manner from the two tyrosine residues from cluster I.
The analyses of variants D72N/L39A, D72N/F41A, and D72N/V69A suggested that the
examined sites in those double mutants are not independent in their effects. As those residues are
parts from one and the same binding cluster it is likely that they cooperate and the effects from
the individual substitutions are not additive. Further, the values of ∆∆Gadd are greater than the
estimated ∆∆G for the three variants suggesting favorable interactions between the side chains
124

__________________________________________________________________4. Discussion
(Wells, 1990). The conclusion that the contacts to the ligand in which D72 is involved are
enhanced by the hydrophobic shell including L39, F41, and V69 is in agreement with the results
from the alanine scan of IL-4BP. Accordingly, the structural analysis defined the contact clusters
as assemblies of trans-interacting residues and did not exclude the possibility that within a cluster
certain amino acids cooperate (Hage et al., 1999).
The equilibrium dissociation constants and subsequently the binding free energies for two double
mutants, Y13F/D72N and D72N/D67A, could not be determined due to their extremely low
binding affinity to the ligand. If the effects of the individual substitutions in variants Y13F and
D72N were independent, than the change in binding energy caused due to the simultaneous
mutation of these sites in variant Y13F/D72N, would be ∆∆Gadd = 7.0 kcal/mol. Correspondingly,
the equilibrium dissociation constant of the double mutated variant would be Kd = 1.0 x 10⁻⁵ M,
in a case of additivity. Assuming that the mutational effects in sites D72 and D67 are
independent, a loss of binding free energy ∆∆Gadd = 7.6 kcal/mol and Kd = 2.9 x 10⁻⁵ M are
expected for the interaction between variant D72N/D67A and IL-4. Certainly, those values
indicate such a low affinity to the ligand which is at the detection limits of the used BIAcore
system. Nevertheless, considering the fact that binding was recorded even for a variant with Kd =
7.7 x 10⁻⁵ M (variant D72N/Y183F), detection of interaction also in the case of Y13F/D72N and
D72N/D67A should be still possible. Thus, variants Y13F/D72N and D72N/D67A are
characterized by considerably lower binding affinity to IL-4 than the theoretically estimated
values presuming additive mutational effects. However, this does not necessarily indicate
cooperativity between the examined sites. The structural analysis of IL-4BP strongly suggests
that the three contact clusters are discrete and independent in their interactions (Hage et al.,
1999). Furthermore, if the low binding affinity is seen as a sign for cooperative interactions, the
change of binding free energy for those mutants will be grater than the values of the theoretic
sum ∆∆Gadd. This is not very likely, since such values would suggest that the mutant side chains
reduce functional properties and the individual substitutions underestimated the contributions of
the original residues. Considering the high cumulative loss of binding free energies, which was
assessed in the frame of the alanine scan, effects were probably overestimated but not
underestimated. Hence, the idea that cooperative interactions between the mutated sites in
variants Y13F/D72N and D72N/D67A caused the extremely low binding affinity is not in
agreement neither with the results from the alanine site-directed mutagenesis, nor with the
structural data. It is more likely that due to the substitutions in the case of D72N/D67A the
electrostatic steering between receptor and ligand was affected to a great degree. It was shown
that the extraordinarily fast association rate constant, which is the main reason for the high-
affinity binding of IL-4 to IL-4BP, is caused by complementary electrostatic potentials of both
125

__________________________________________________________________4. Discussion
interfaces (Shen et al., 1996; Wang et al., 1997). Accordingly, variant D67A demonstrated the
slowest association rate constant in the site-directed mutational analysis. The association phase of
D72N could not be examined. In addition, alanine substitutions of the hydrophobic side chains
surrounding D72 in cluster II revealed small but systematic reduction of the on-rate for L39, F41,
and V69, suggesting that perhaps the entire cluster is recognized early in association. The third
charged residue within the functional epitope of IL-4BP (D125) did not indicate significant effect
on the association. It is likely that the charges of D72 and D67 are critical for the initiation of
electrostatic steering between receptor and ligand and therefore their simultaneous loss in variant
D72N/D67A results in such low electrostatic potential in the receptor that is under the point,
which allows the complex formation. This suggestion is in agreement with the mechanism of
association proposed for the complex of hGH and its receptor (Cunningham & Wells, 1993).
Accordingly, the association is a multi-step process that starts with the formation of an initial
weak complex, which undergoes further desolvation and cooperative rearrangement.
Not all amino acids from IL-4BP examined by site-directed mutagenesis were included in the
analysis of double mutants and therefore perhaps not all cases of cooperativity were identified.
However, cooperative effects clearly were demonstrated to take part at least between amino acids
within contact cluster II. This fact gives to some degree an explanation for the high cumulative
loss of binding free energy, which was calculated according to the contribution of alanine
variants.
4.4 Comparison of the Structural and the Functional IL-4BP Epitopes Generally, the functional epitope of IL-4BP defined by mutational analyses is in a good
agreement with the structural data. Similarly to the structural epitope, the functional important
residues of IL-4BP are assembled in three differentiated clusters. The crystal structure of the IL-
4/IL-4BP complex proposed that the clusters are independent, but did not exclude the possibility
that cooperative interactions take place in the same contact cluster (Hage et al., 1999).
Respectively, the present analysis did not show a clear indication for interactions between the
defined clusters. Furthermore, cooperativity was demonstrated to occur between side chains
within one and the same cluster.
The structure revealed that 835 Å2 of the receptor surface area are buried upon complex
formation (Hage et al., 1999). This indicates that the high-affinity interaction between IL-4 and
IL-4BP is generated from a relatively small contact area and that its size is not directly connected
to binding affinity. Accordingly, amino acids localized out of the structural epitope did not appear
126
__________________________________________________________________4. Discussion
to have significant effects on binding affinity when they were mutated. Although segregation in
the contribution of the examined residues present in the structural epitope of IL-4BP was
observed, nearly all of them showed considerable effect on binding. Thus, the modest size of the
IL-4BP structural epitope determines a corresponding functional epitope, which has a similar
size.
The structure of contact clusters I and II was compared to an “avocado fruit” and was suggested
to be highly relevant to binding because polar interactions are enhanced in a hydrophobic
environment (Hage et al., 1999). Agreeably, the mutational analysis indicated as main binding
determinants residues from the central core of IL-4BP clusters I and II. Particularly large
contribution to binding demonstrated the side chains of Y183 and D72, respectively. Most of the
residues from their close surrounding certainly are implicated in the interaction with IL-4,
although the mutations at those sites caused a loss in binding affinity to a lesser extent. Contact
clusters I and II were proposed to have the same contribution to binding (Hage et al., 1999).
However, based on the findings from the mutagenesis study of IL-4BP it seems that, comparing
functional contributions, cluster II has slight prevalence over cluster I. Estimated from the loss of
free binding energy in the mutant proteins, the entire cluster II (13.3 kcal/mol) accounts
approximately for 95 % of binding energy, while the energetic contribution of cluster I
corresponds to around 60 % (8.8 kcal/mol)1. In agreement with the suggestions based on
structural data, the mutational analysis indicated that the residues from the third contact cluster
have minor functional role in complex stability and the entire cluster contributes with 30 % (4.2
kcal/mol) to binding energy. Additionally, the importance of this cluster, and particularly of the
side chain of D67, for the association phase was confirmed. Alanine substitutions of a few
residues present in the defined structural epitope did not produce considerable effect on binding
affinity. Those are amino acids localized in the periphery of the binding epitope, and it is likely
that the contacts made by their side chains are not of importance for the high-affinity interaction
with IL-4. It is possible that some of them are directly involved in binding by their main chains,
but due to limitations of the used approach such a suggestion could not be verified. Furthermore,
it cannot be excluded that the periphery of the interface has another important role. For instance,
it might contribute substantially to the specificity of binding by repulsion of non-target molecules
through unfavorable electrostatic or steric interactions, or both.
Comparison between the change of buried surface area upon binding and the change in the free
energy of binding when the particular side chain was mutated revealed a very poor correlation
1 The contribution of cluster I was estimated considering the loss of binding affinity of variants Y13F, Y127A, and Y183A. Variant Y13F was favoured, since it represents better the functional properties of Y13 than the analogous alanine variant. Data about variants L39A, F41A, V69A, and D72A, was used for cluster II. Other variants were not included, as they demonstrated negligible contribution to binding.
127
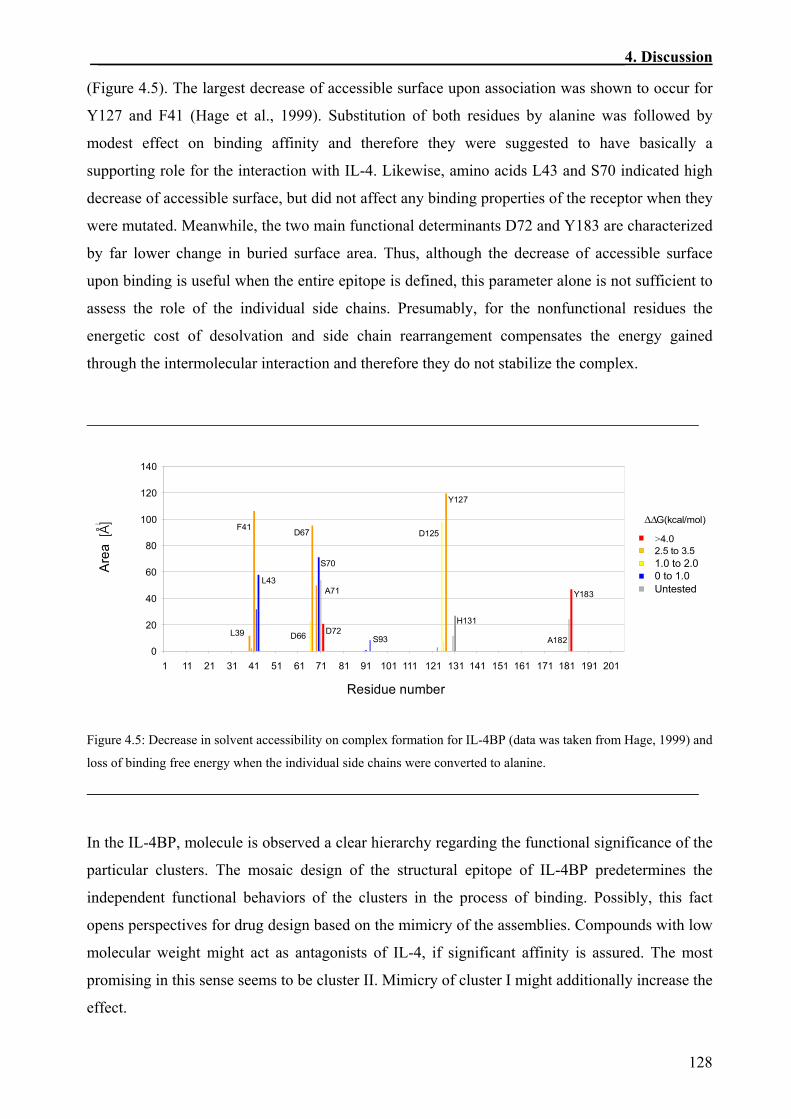
__________________________________________________________________4. Discussion
(Figure 4.5). The largest decrease of accessible surface upon association was shown to occur for
Y127 and F41 (Hage et al., 1999). Substitution of both residues by alanine was followed by
modest effect on binding affinity and therefore they were suggested to have basically a
supporting role for the interaction with IL-4. Likewise, amino acids L43 and S70 indicated high
decrease of accessible surface, but did not affect any binding properties of the receptor when they
were mutated. Meanwhile, the two main functional determinants D72 and Y183 are characterized
by far lower change in buried surface area. Thus, although the decrease of accessible surface
upon binding is useful when the entire epitope is defined, this parameter alone is not sufficient to
assess the role of the individual side chains. Presumably, for the nonfunctional residues the
energetic cost of desolvation and side chain rearrangement compensates the energy gained
through the intermolecular interaction and therefore they do not stabilize the complex.
∆∆G(kcal/mol)
>4.02.5 to 3.51.0 to 2.00 to 1.0Untested
0
20
40
60
80
100
120
140
1 11 21 31 41 51 61 71 81 91 101 111 121 131 141 151 161 171 181 191 201
Y183
A182
H131
Y127
D125
S93D72
A71
S70
D66
D67
L39
F41
L43
Residue number
Area
[Å
]2
Figure 4.5: Decrease in solvent accessibility on complex formation for IL-4BP (data was taken from Hage, 1999) and
loss of binding free energy when the individual side chains were converted to alanine.
In the IL-4BP, molecule is observed a clear hierarchy regarding the functional significance of the
particular clusters. The mosaic design of the structural epitope of IL-4BP predetermines the
independent functional behaviors of the clusters in the process of binding. Possibly, this fact
opens perspectives for drug design based on the mimicry of the assemblies. Compounds with low
molecular weight might act as antagonists of IL-4, if significant affinity is assured. The most
promising in this sense seems to be cluster II. Mimicry of cluster I might additionally increase the
effect.
128

__________________________________________________________________4. Discussion
4.5 Complementarity between the Functional Epitopes of Human IL-4 and IL-4BP
Site-directed mutagenesis has previously been used as a strategy to determine the functional
epitope on the ligand side of the interface (Wang et al., 1997). A set of alanine, glutamine, and
charge reversed mutant forms of IL-4 were studied for effects on the interaction with IL-4BP by
means of the BIAcore technology. The similar approaches used in the previous and current study
give a reliable basis to compare the functional epitopes of ligand and receptor. In the framework
of the present project two additional IL-4 variants R53A and Y56A were produced and analyzed.
The original side chains were shown by the structure to be a part of contact cluster II and were
implicated in contacts to residues from IL-4BP.
The results of the systematic mutational analysis of IL-4 contact residues (Wang et al., 1997)
confirmed that the functional important residues are localized on the helix AC face of the ligand
(Figure 4.6). Furthermore, they are in agreement with the functional significance of the tree
clusters of trans-interacting residues identified in the structure of the complex and support the
existence of a mosaic binding (Wang et al., 1997, Hage et al., 1999). In like manner to the IL-
4BP structure, the contact clusters I and II of IL-4 were shown to resemble an “avocado fruit”.
Mutations of the central amino acids within those two clusters, namely E9 and R88, had the
largest effects on binding affinity observed among the IL-4 mutant forms. Their energetic
contribution to the complex stability was estimated to be over 3.5 kcal/mol for each. Both
residues are implicated in direct contacts to the corresponding main binding determinants from
the IL-4BP interface. Accordingly, the carboxylate of E9 accepts three bonds from receptor Y13,
Y183, and S70, while R88 is linked by a salt pair to the receptor D72. The energetic effect
resulting from the substitution of receptor D72 by alanine is greater than from an analogous
replacement of IL-4 R88. Since those residues were not demonstrated to take part in other
contacts, it is likely that the higher effect in the receptor alanine variant represents the cooperative
interactions within IL-4BP cluster II where D72 is localized. Mutations of residues from the
periphery of IL-4 clusters I and II indicated modest contributions of the original side chains to the
binding. Agreeably, the conversion to alanine of IL-4 residues R53 and Y56, which are parts
from the shell of cluster II, was followed by 36- and 8-fold reduction in binding affinity.
Similarly, the mutagenesis analysis of IL-4BP amino acids, which surround the main
determinants, indicated that their side chains have only indirect but not main functions for the
interaction.
The results from substitutions performed in the corresponding clusters III of IL-4 and IL-4BP
revealed that the residues from the both sides of the interface are important for the association
129

__________________________________________________________________4. Discussion
phase rather than to contribute significantly to the stability of the complex. Thus, comparison
between the energetic effects of mutations introduced in the analogous functional epitopes of IL-
4 and IL-4BP demonstrates a striking complementarity: energetically critical and unimportant
regions on one molecule match those on the other (Figures 4.4 and 4.6). As a result, the two
proteins are able to interact with high affinity and specificity and to form a stable complex
through relatively small functional epitopes.
E9
R88
I5
N89
T13
W91R53
Y56
R85R81 T6
K12Q78∆∆ G (kcal/mol)
> 3.50.5 to 2.50.3 to 0.5< 0.3
Figure 4.6: The functional epitope of IL-4. Residues are color-coded according to the loss of binding free energy
upon site directed mutagenesis. Data from Wang et al., 1997 is taken.
Additivity analysis shows that summation of the disruptive effects of the alanine mutations of
amino acids present in the IL-4BP functional epitope produces a value in excess of 26 kcal/mol.
By comparison, for the mutations performed within the IL-4 functional epitope this value counts
for over 15.5 kcal/mol. The cumulative loss of binding free energy for IL-4 might be slightly
higher than the value mentioned above, since data for IL-4 variant E9A is not available and
therefore the contribution of variant E9Q was used in this calculation (Wang et al., 1997). The
summations of the energetic effects seen for IL-4 and IL-4BP mutant forms, respectively exceed
the total change in binding free energy for the interaction of the wild-type ligand and receptor
(13.8 kcal/mol). Based on this fact, it was assumed that the individual mutations in both proteins
are not completely independent. However, the cumulative loss of binding free energy estimated
130

__________________________________________________________________4. Discussion
for IL-4BP certainly exceeds a lot this for IL-4. This difference cannot be explained with the
implication of more main-chain interactions from one side of the interface than from the other,
because both proteins, IL-4 and IL-4BP, were shown to build contacts mainly through side chains
(Hage, 1999). The substantially greater cumulative loss of binding free energy for the receptor
molecule is consistent with the findings that some of the residues within the functional epitope of
IL-4BP are involved in cooperative interactions. It seems that the main functional side chains in
IL-4 act in a more independent way and if cooperative effects within the epitope exist, they are of
minor importance. In part, this probably reflects the rigidity of secondary structural scaffolds on
which the complementary epitopes are presented: the major binding determinants from IL-4 are
localized on helices whereas those of IL-4BP are displayed from loops.
4.6 Comparison of the IL-4BP Functional Epitope to Other Cytokine Receptors
Structurally the human IL-4BP is similar to the extracellular domains of other type I cytokine
receptors that interact with short or long chain helical cytokines (Hage et al., 1999). Based on the
structural homology and the established pattern of interaction between hGH and hGHbp
(Clackson & Wells, 1995), hydrophobic contacts were suggested to dominate in the complexes of
four-helix bundle cytokines (Kossiakoff & De Voss, 1999). However, the present results put
together with the mutational analysis of IL-4 and the structure of IL-4/IL-4BP complex indicate
that this is not universally the case, since within the epitopes of both the ligand and the receptor, a
mixture of charged, polar, and hydrophobic side chains has been identified.
In contrast to IL-4BP, the functional epitope of hGHbp is represented by a compact patch in the
center of the contact region in which the hydrophobic residues form a core flanked by charged
groups. Two tryptophans of the core (W104 and W169), constituting a “hot spot” for the
interaction with hGH, were shown to account for the majority of the binding free energy. A
structure-based sequence alignment reveals that IL-4BP Y127 is the direct homologue of W169
in hGHbp (Figure 4.7). Furthermore, M150 in EPB (Middletone et al., 1999) and V230 in gp130
(Horsten et al, 1997; Bravo et al, 1998), which superimpose to the same position, are important
binding determinants for the interactions with their corresponding ligands. Similar to hGHbp
W169, V230 from gp130 and M150 from EPB are parts of the hydrophobic surface forming the
functional epitopes of those receptors. Although reduction in binding affinity was seen when
Y127 in IL-4BP was substituted by alanine, the effect indicates rather supporting than major
functions of this residue in binding.
131
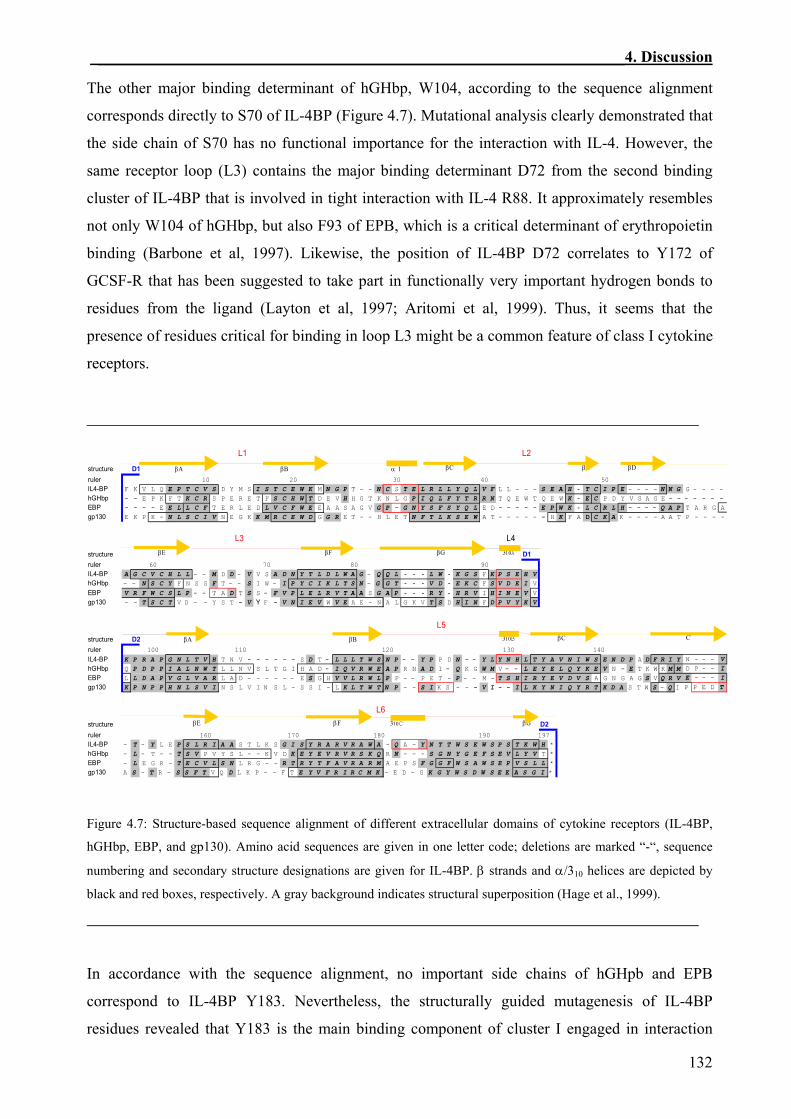
__________________________________________________________________4. Discussion
The other major binding determinant of hGHbp, W104, according to the sequence alignment
corresponds directly to S70 of IL-4BP (Figure 4.7). Mutational analysis clearly demonstrated that
the side chain of S70 has no functional importance for the interaction with IL-4. However, the
same receptor loop (L3) contains the major binding determinant D72 from the second binding
cluster of IL-4BP that is involved in tight interaction with IL-4 R88. It approximately resembles
not only W104 of hGHbp, but also F93 of EPB, which is a critical determinant of erythropoietin
binding (Barbone et al, 1997). Likewise, the position of IL-4BP D72 correlates to Y172 of
GCSF-R that has been suggested to take part in functionally very important hydrogen bonds to
residues from the ligand (Layton et al, 1997; Aritomi et al, 1999). Thus, it seems that the
presence of residues critical for binding in loop L3 might be a common feature of class I cytokine
receptors.
G - - - -- - - - -T A R G AP - - - -
C
N - - - VD P - - IE - - - IP P E D T
structure D1 βΑ βΒ α 1 βC βC βD
ruler 10 20 30 40 50IL4-BP F K V L Q E P T C V S D Y M S I S T C E W K M N G P T - - N C S T E L R L L Y Q L V F L L - - - S E A H - T C I P E - - - - N N GhGHbp - - E P K F T K C R S P E R E T F S C H W T D E V H H G T K N L G P I Q L F Y T R R N T Q E W T Q E W K - E C P D Y V S A G E - -EBP - - - - E E L L C F T E R L E D L V C F W E E A A S A G V G P - G N Y S F S Y Q L E D - - - - - E P W K - L C R L H - - - - Q A Pgp130 E K P K - N L S C I V N E G K K M R C E W D G G R E T - - H L E T N F T L K S E W A T - - - - - - H K F A D C K A K - - - - A A T
structure βE βF βG 310A D1ruler 60 70 80 90IL4-BP A G C V C H L L - - M D D - V V S A D N Y T L D L W A G - Q Q L - - - L W - K G S F K P S E H VhGHbp - - N S C Y F N S S F T - - S I W - I P Y C I K L T S N - G G T - - - V D - E K C F S V D E I VEBP V R F W C S L P - - T A D T S S - F V P L E L R V T A A S G A P - - - R Y - H R V I H I N E V Vgp130 - - T S C T V D - - Y S T - V Y F - V N I E V W V E A E - N A L G K V T S D H I N F D P V Y K V
structure D2 βΑ βΒ 310B βC
ruler 100 110 120 130 140IL4-BP K P R A P G N L T V H T N V - - - - - - S D T - L L L T W S N P - - Y P P D N - - Y L Y N H L T Y A V N I W S E N D P A D F R I YhGHbp Q P D P P I A L N W T L L N V S L T G I H A D - I Q V R W E A P R N A D I - Q K G W M V - - L E Y E L Q Y K E V N - E T K W K M MEBP L L D A P V G L V A R L A D - - - - - - E S G H V V L R W L P P - - P E T - P - - M - T S H I R Y E V D V S A G N G A G S V Q R Vgp130 K P N P P H N L S V I N S L V I N S L - S S I - L K L T W T N P - - S I K S - - - V I - - I L K Y N I Q Y R T K D A S T W S - Q I
structure βE βF 310C βG D2ruler 160 170 180 190 197IL4-BP - T - Y L E P S L R I A A S T L K S G I S Y R A R V R A W A - Q A - Y N T T W S E W S P S T K W H *hGHbp - L - T - - T S V P V Y S L - - K V D K E Y E V R V R S K Q R N - - - S G N Y G E F S E V L Y V T *EBP - L E G R - T E C V L S N L R G - - R T R Y T F A V R A R M A E P S F G G F W S A W S E P V S L L *gp130 A S - T R - S S F T V Q D L K P - - F T E Y V F R I R C M K - E D - G K G Y W S D W S E E A S G I *
L4
L5
L6
L3
L1 L2
Figure 4.7: Structure-based sequence alignment of different extracellular domains of cytokine receptors (IL-4BP,
hGHbp, EBP, and gp130). Amino acid sequences are given in one letter code; deletions are marked “-“, sequence
numbering and secondary structure designations are given for IL-4BP. β strands and α/310 helices are depicted by
black and red boxes, respectively. A gray background indicates structural superposition (Hage et al., 1999).
In accordance with the sequence alignment, no important side chains of hGHpb and EPB
correspond to IL-4BP Y183. Nevertheless, the structurally guided mutagenesis of IL-4BP
residues revealed that Y183 is the main binding component of cluster I engaged in interaction
132
__________________________________________________________________4. Discussion
with the ligand. Comparison with GCSF-R shows that within the same receptor loop where IL-
4BP Y183 is localized (L6), is positioned residue R287, which obtained the greatest effect on
binding after alanine substitution (Layton et al., 1997). Another residue Y13, which is also
present in the first contact cluster of IL-4BP has as a structural homologue R43 from hGHbp.
Structurally Y13 is a part from the hydrophobic shell surrounding the main binding determinant
Y183 of IL-4BP and in like manner L43 is a peripheral element from the functional epitope of
hGHbp. Agreeably, both side chains are characterized by modest effects on binding, when
replaced in a structurally non-disruptive way.
The aspartic acid at position 67 from the third contact cluster of IL-4BP appears to be
homologous to D89 in EBP that has been implicated in contacts to EPO at site 2 (Syed et al.,
1998). Although data from mutagenesis of EPB D89 currently is not available, generally it is
known that the interactions between EPB and EPO at site 2 are less extensive than at site 1.
Similarly, the present analysis indicates that the residues within cluster III of IL-4BP provide
lesser contribution to the stability of the complex with IL-4. The other aspartic acid present in the
same cluster of IL-4BP D125 resembles D164 in hGHbp. Substitution by alanine of both side
chains was followed by relatively small effects on binding affinity (Clackson et al., 1998).
The functions in binding of the hydrophobic sequence localized within loop L2 and comprising
L39, F41, L42, and L43 is unique for the IL-4/IL-4BP receptor complex. This sequence
represents the main part of the hydrophobic shell in cluster II, which is completed by V69 from
loop L3. According to the structural alignment, IL-4BP V69 superimposes I103 from hGHbp and
L171 from GCSF-R. The effects on binding affinity observed after the hydrophobic residues at
this position were mutated to alanine suggest that in all receptors they have indirect functional
contribution to the binding (Clackson & Wells, 1995; Layton et al., 1997).
In summary, the functional epitope of IL-4BP significantly differs from other structurally well-
characterized cytokine receptors, such as hGHbp and EBP, for which the majority of binding
energy is attributed to a few hydrophobic residues. In contrast, both the present study and the
mutational analysis of IL-4 indicate that the critical contacts in the IL-4/IL-4BP complex are
provided by polar and charged residues. Correspondingly, the crystal structure of IL-4/IL-4BP
complex revealed that the relative position of IL-4BP is remarkably altered compared to hGHbp
(Hage et al., 1999). Thus, both the spatial orientation of IL-4 and IL-4BP in the complex and the
functional properties of the contact establish novel features different from the binding in the
homodimeric hGH receptor complex. The molecular arrangement of GCSF and its receptor was
shown to be similar to that of IL-4/IL-4BP complex (Aritomi et al., 1999). Furthermore, the
distribution of hydrophobic and polar contacts found in the two complexes is comparable. The
importance of charged residues and polar contacts was demonstrated also for the interaction
133

__________________________________________________________________4. Discussion
between p35 and p40, the two subunits of IL-12, which is a heterodimeric cytokine similar to the
class I cytokine-receptor complexes in its overall architecture (Yoon et al., 2000). Based on these
data, two distinct models of interactions seem to exist for the binding between cytokines and their
receptors. In the first case, the interfaces are dominated by hydrophobic residues, as it has been
established for the receptor systems of hGH and EPO. In the second, charged and polar contacts
are dominating, while the hydrophobic have only indirect contribution to the binding, as it was
shown for the complexes of IL-4, GCSF and the two subunits of IL-12. Moreover, the binding
epitope of IL-4BP is further distinguished from those receptors by its unique mosaic-like
topography consisting of three discrete contact clusters.
134
__________________________________________________________________5. Summary
5. Summary
The cytokine IL-4 is a basic regulator of immune responses that plays a pivotal role in the
pathophysiology of allergic diseases. Its effects depend upon binding to and signaling through a
receptor complex composed of the IL-4Rα chain and the common gamma chain (γ ). A first and
crucial event in receptor activation is the interaction between IL-4Rα chain and IL-4, which is
characterized by high affinity (K ≈ 100 pM) and specificity. Signal transduction pathways are
mediated after the subsequent recruitment of γ . Therefore the IL-4 receptor complex is seen as a
promising therapeutic target for treatment of allergic disorders.
c
d
c
The aim of the present study was to define the functional epitope of IL-4BP that is engaged in the
high-affinity interaction with IL-4. Side chains of IL-4BP amino acids, implicated in contacts to
the ligand, were analyzed systematically by the means of site-directed mutagenesis. In a first step,
all residues of interest were replaced by alanine. To verify whether the observed effects in the
alanine variants were functional or structural, in a few cases, the original amino acids were
further substituted by structurally similar residues. Moreover, double mutants were constructed
with the purpose to examine cooperative and additive interactions between residues within the
functional epitope of IL-4BP. All IL-4BP mutant variants were expressed in an eukaryotic
expression system (Sf9 insect cells). Variants, which retained relatively high binding affinity to
the ligand, were successfully purified by IL-4 affinity chromatography. An alternative
purification procedure using a monoclonal antibody against IL-4BP was established for low-
affinity variants. The effects on binding kinetics, due to the introduced mutations, were measured
employing biosensor technology.
The mutagenesis analysis revealed that IL-4BP takes part in the high-affinity interaction with IL-
4 through a relatively small functional epitope. As major binding determinants were identified the
side chains of two amino acids localized within contact clusters I and II, respectively. The
residues of six additional amino acids contribute to the binding to a minor extent. In contrast to
other cytokine receptors, in which the major contributions to binding are from hydrophobic side
chains, the IL-4BP functional epitope is assembled from charged, polar, and hydrophobic
residues. Furthermore, the critical contacts for binding to IL-4 are provided by charged and polar
residues, while the hydrophobic side chains have only supporting functions in the interaction. The
energetic segregation observed within the IL-4BP binding interface is highly relevant and
complementary to the already described IL-4 functional epitope.
The mosaic design of the binding epitope proposed by the crystal structure of the IL-4/IL-4BP
complex was confirmed in this study. The three contact clusters were demonstrated to act in an
135
__________________________________________________________________5. Summary
independent manner. However, cooperative interactions between residues present in one and the
same cluster were observed. Moreover, the clusters could be distinguished according to their
apparent contribution and functional importance for the binding. Estimated from the loss of free
binding energy in the affected mutant variants, contact cluster II has the greatest contribution to
binding followed by cluster I and cluster III, respectively. Both clusters I and II appear to have
important functions in stabilizing the complex between IL-4 and its receptor, since mutations
introduced in those assembles resulted in considerably affected binding properties. In contrast,
substitutions of residues from cluster III caused merely small effects on binding affinity,
indicating that the cluster plays a role mainly in electrostatic steering in order to accelerate
complex formation.
The mutational analysis presented in this thesis, together with the already established IL-4
functional epitope and the structure of the intermediate complex between IL-4 and IL-4BP,
improves the understanding of the molecular mechanisms of receptor binding and activation for
members of the cytokine receptor family. Detailed knowledge about the molecular recognition
between cytokines and their receptors is not only of theoretical interest, but is also important as a
base for drug design.
136

6. Literature
6. Literature
Aman, M.J., Tayebi, N., Obiri, N., Puri, R.K., Modi, W.S. & Leonard, W.J. (1996) cDNA cloning and characterisation of the human interleukin 13 receptor α chain. J. Biol. Chem. 271, 29265-29270 Anderson, G.G. & Morrison, J.F. (1998) Molecular biology and genetics of allergy and asthma. Arch. Dis. Chil. 78, 488 Aritomi, M., Kunishima, N., Okamoto, T., Kuroki, R., Ota, Y. & Morikawa, K. (1999) Atomic structure of the GCSF-receptor complex showing a new cytokine-receptor recognition scheme. Nature 401, 713-717 Baixeras, E., Roman-Roman, S., Jitsukawa, S., Genevee, C., Mechiche, S., Viegas-Pequignot, E., Hercend, T. & Triebel, F. (1990) Cloning and expression of a lymphocyte activation gene (Lag-1) Mol. Immunol. 27, 1091-1102 Bamborough, P., Hedgecock, C.JR. & Richards, W.G. (1994) The interleukin-2 and interleukin-4 receptors studied by molecular modeling. Structure 15, 839-851 Barbone, F.P., Middleton, S.A., Johnson, D.L., McMahon, F.J., Tullai, J., Gruninger, R.H., Schilling, A.E., Jolliffe, L.K. & Mulcahy, L.S. (1997) Mutagenesis studies of the human erythropoietin receptor. J. Biol. Chem. 272, 4985-4992 Bazan, J.F. (1990) Structural design and molecular evolution of a cytokine receptor superfamily. Proc. Natl., Acad. Sci. USA 87, 6934-6938 Beckmann, M.P., Cosman, D., Fanslow, W., Maliszewski, C.R. & Lyman, S.D. (1992) Interleukins: Molecular biology and immunology. Chem. Immunol. 51, 107-134 Bennett, B.L., Cruz, R., Lacson, R.G., Manning, A.M. (1997) Interleukin-4 suppression of TNFα-stimulated E-selectin gene transcription in mediated by STAT6 antagonism of NFκB. J. Biol. Chem. 272, 10212-10219 BIAcore Handbook (1995) Biacore 2000 Handbook, Pharmacia Birnboim, H.C. & Doly, J. (1979) A rapid extraction procedure for screening recombinant plasmid DAN. Nucl Acid Res 7, 1513-1523. Bravo, J., Staunton, D., Heath, J.K. & Jones, E.Y. (1998) Crystal strucrure of a cytokine-binding region of gp 130. The EMBO J. 17, 1665-1674 Brusselle, G., Kips, J., Joos, G., Bluethmann, H. & Pauwels, R. (1995) Allergen-induced airway inflammation and bronchial responsiveness in wild-type and interleukin-4-deficient mice. Am. J. Respir. Cell Mol. Biol. 12, 254-259 Brusselle, G.G., Kips, J.C., Tavernier, J.H., van der Heyden, J.G., Cuvelier, C.A., Pauwels, R.A. & Bluethmann, H.
(1994) Attenuation of allergic airway inflammation in IL-4 feficient mice. Clin. Exp. Allergy 24, 73-80
Callard, R. & Gearing A. (1994) The cytokine facts book, p53 Carter, P., Winter, G., Wilkinson, J., & Fersht, R. (1984) Cell 38, 835-840 Chen, H.J. & Paul, W.E. (1997) Cultured NK1.1(+)CD4(+) T cells produce large amounts of IL-4 and IFNγ upon activation by anti-CD3 or CD1. J. Immunol. 159, 2240-2249 Chomarat; P. & Banchereau, J. (1997) An update on interleukin-4 and its receptor. Eur. Cytokine Netw. 8, 333-344 Clackson, T. & Wells, J.A. (1995) A hot spot of binding energy in a hormone-receptor interface. Science 267, 383-386
137
6. Literature
Clackson, T., Ultsch, M.H., Wells, J.A. & de Vos, A.M. (1998) Structural and functional analysis of the 1:1 growth hormone: receptor complex reveals the molecular basis for receptor affinity. J. Mol.. Biol. 277, 1111-1128 Coffman, R.L., Ohara, J., Bond, M.W., Carty J., Zlotnik, A. & Paul, W.E. (1986) B cell stimulatory factor 1 enhances the IgE response of lipopolysacchride-activated B cells. J. Immunol. 136, 4538-4541 Cohn, L., Homer, R.J., MacLeod, H., Mohrs, M., Brombacher, F. & Bottomly, K. (1999) Th2-induced airway mucus production is dependent on IL-Rα, but not on eosinophils. J.Immunol. 162, 6178-6183 Cookson, W.O. & Moffatt, M.F. (1998) Alchemy for asthma. Nature Medicine 4, 500-501 Corry, D.B., Folkesson, H.G., Warnock, M.L., Erle, D.J., Matthay, M.A., Wiener-Kronish, J.P. & Locksley, R.M. (1996) Interleukin 4, but not interleukin 5 or eosinophils, is required in a murine model of acute airway hyperreactivity. J. Exp. Med. 183, 109-117 Cunningham, B.C. & Wells, J.A. (1993) Comparison of a structural and a functional epitope. J. Mol. Biol. 234, 554-563 Cunningham, B.C. & Wells, J.A. (1995) Science 244, 1081-1085 D´Eustachio, P., Brown, M., Watson, C. & Paul, W.E. (1988) The IL-4 gene maps to chromosome 11, near the gene encoding IL-3. J. Immunol. 141, 3067 David, M., Petricoin, E., Benjamin, C., Pine, R., Weber, M.J. & Larner, A.C. (1995) requirementfor MAP kinase activity in interferon α and interferon β-stimulated gene expression through STAT protein. Science 269, 1721-1723 De Vos, A.M., Ultsch, M. & Kossiafoff, A.A. (1992) Human growth hormone and extracellular domain of ist receptor: crystal structure of the complex. Science 255, 306-312 Defrance, T., Aubry, J.P. Rousset, F., Vandervliet, B., Bonnefoy, J.Y., Arai, N., Takebe, Y., Yokota, T., Lee, F., Arai, k., (1987) Human recombinant interleukin-4 induces Fcε receptors (CD23) on normal human b lymphocytes. J. Exp. Med. 165, 1459-67 Dh, R., Hiles, I., Panayotou, G., Roche, S., Fry, M.J., Gout, I., Totty, N.F., Truong, O., Vicendo, P., Yonezawa, K., et al., (1994): PI-3 kinase is a dual specificity enzyme: autoregulation by an intrinsic protein-serine kinase activity. EMBO J. 13, 522-533. Di Cera, E. (1998) Site – specific analysis of mutational effects in proteins. Advances in Protein Chemistry 51, 59-119 Dubucquoi, S., Desreumaux, P., Janin, A., klein, O., Goldman, M., Tavernier, J., Capron, M. & Capron, A. (1994) Interleukin-5 secretion by eosinophils – association with granules and immunoglobulin-dependant secretion. J. Exp. Med. 179, 703-708 Duschl, A. & Sebald, W. (1996) Transmembrane and intracellular signalling by interleukin-4: receptor dimerization and beyond. Eur. Cytokine Netw. 7, 37-49 Fernandez-Botran, R. & Vitetta, E.S. (1990) A soluble, high-affinity, interleukin-4 binding protein is present in the biological fluids of mice. Proc. Natl., Acad. Sci. USA 87, 4202-4206 Fernandez-Botran, R. & Vitetta, E.S. (1991) Evidence that natural murine soluble interleukin 4 receptors may act as transport proteins. J. Exp. Med. 174, 673-681 Franke, T.F., Kaplan, D.R. & Cantley, L.C. (1997) PI3K: downstream action blocks apoptosis. Cell 88, 435-437. Friedrich, K. & Wietek, S. (2001) Experimental regulation of STAT gene expression reveals an involvement of STAT5 in IL-4-drivem cell proliferation. Biol. Chem. 382, 343-351 Friedrich, K., Wietek, S., Lischke, A., Wellbrock, C., Kreitman, R.J., Pastan, I. & Sebald, W. (1999) A two-step selection approach for identification of ligand-binding determinants in cytokine receptors. Anal. Biochem. 268, 179-186
138

6. Literature
Frisch, C., Schreiber., G., Johnson, C.M. & Fersht, A.R. (1997) Thermodynamics of the interaction of barnase and barstar: changes in free energy versus chnges in enthalpy on mutation. J Mol Biol 267, 696-706 Gascan, H., Gauchat, J.F., Roncarolo, M.G., Yssel, H. & de Vries, J.E. (1991) Human B cell clones can be induced to proliferate and to switch to IgE and IgG4 synthesis by interleukin 4 and signal provided by activated CD4+ T cell clones. J. Exp. Med. 173, 747-750 Gavett, S.H. et al. (1994) Am. J. Respir. Cell Mol. Biol. 10, 587 Gavett, S.H. et al. (1995) J. Exp. Med. 182, 1527 Gershoni, J.M. & Palade, G.E. (1983) Anal. Biochem. 131, 1-15 Grabstein, K., Eisenman, J., Mochizuki, D., Shanebeck, K., Conlon, P., Hopp, T., March, C. & Gillis, S. (1986) Purification of homogeneity of B cell stimulating factor. J. Exp. Med. 163, 1405 Gruenig, G., Watnock, M., Wakil, A.E., Venkayya, R., Brombacher, F., Rennick, D.M., Sheppard, D., Mohrs, M., Donaldson, D.D., Locksley, R.M. & Corry, D.B. (1998) Requirement for IL-13 independently of IL-4 in experimental asthma. Science 282, 2261-2263 Grunewald, S.M., Brocker, E.B., Sebald, W. & Duschl, A. (1998) Cytokine antagonists and allergy. Eur. Cytokine Netw. 9, 92-94 Grunewald, S.M., Werthmann, A., Schnarr, B., Klein, C.E., Brocker, E.B., Mohrs, M., Brombacher, F., Sebald, W. & Duschl, A. (1998) An antagonistic IL-4 preventstype I allergy in mouse. Inhibition of the IL-4/IL-13 receptor system completely abrogates humoral immune response to allergen and development of allergic symptoms in vivo. J. Immunol. 160, 404 Gustchina, A., Zdanov, A., Schalk-Hihi, C. & Wlodawer, A. (1995) A model of the complex between interleukin-4 and its receptor. Proteins 21, 140-148 Hage, T. (1999) PhD Thesis, Julius-Maximilians University of Wuerzburg Hage, T., Sebald, W. &Reinemer, P. (1999) Crystal structure of the interleukin-4/receptor α chain complex reveals a mosaic binding interface. Cell 97, 271-281 Hamelmann, E., Wahn, U. & Gelfand, E.W. (1999) Role of Th2 cytokines in the development of allergen-induced airway inflammation and hyperresponsiveness. Int. Arch. Allergy Immunol 118, 90-94 Henderson, W.R., Chi, E.Y. & Maliszewski, C.R. (2000) Soluble IL-4R inhibits airway inflammation following allergen challenge in a mouse model of asthma. J. Immunol. 164, 1086-1095 Hermann, R.G., Whitefield, P.R. &Bottomly, W. (1980) Gene 8, 179-191 Hilser V.J., Dowdy D., Oas, T.G. & Freire E. (1998) The structural distribution of cooperative interactions in proteins: analisys of the native state ensemble. Proc. Natl. Acad. Sci. USA 95, 9903-9908 Hoffman, R.C., Castner, B.J., Gerhart, M., Gibson, M.G., Rasmussen, B.D., March, C.J., Weatherbee, J., Tsang, M., Gustchina, A., Schalk-Hihi, C., Reshetnikova, L. & Wlodawer, A. (1995) Direct evidence of a heteromeric complex of human interleukin-4 with its receptor. Prot. Sci. 4, 382-386 Horovitz, A. & Fersht, A.R. (1990) Strategy for analysing the co-operativity of intramolecular interactions in peptides and proteins. J Mol. Biol. 214, 613-617 Horsten, U., Muller-Newen, G., Gerhartz, C., Wollmer, A., Wijdenes, J., Heinrich, P.C. 6 Grotzinger J. (1997) Molecular modeling-guided mutagenesis of the extracellular part of gp 130 leads to the identification of contact site in the interleukin-6-IL-6 receptor-gp 130 complex. J. Biol. Chem. 272, 23748-23757 Howard, M., Farrar, J., Hilfiker, M., Johnson, B., Takatsu, K., Hamaoka, T., Paul, W.E. (1982) Identification of T-cell derived B-cell growth factor distinct from interleukin 2. J. Exp. Med. 155, 914
139

6. Literature
Hsieh, C.S., Heimberger, A.B., Gold J.S., O´Garra, a. & Murphy, K.M. (1992) Differential regulation of T helper phenotype development by interleukins 4 and 10 in an alpha beta T-cell receptor transgenic system. Proc. Natl. Acad. Sci. USA 89, 6065-6069 Hu-li, J., Shevach, E.M., Mizuguchi, J., Ohara, J., Mosmann, T. & Paul, W.E. (1987) B cell stimulatory factor 1 (interleukin 4) is a potent stimulant for normal resting T-lymphocytes. J. Exp. Med. 165, 157-172
Izuhara K., Umeshita-Suyama, R., Akaiwa, M., Shirakawa, T., Deichmann, K.A., Arima, K. & Hopkin, J.M. (2000) Recent advances in understanding how IL-13 signals are involved in the pathogenesis of bronchial asthma. Arch. Immunol. The.r Exp. 48, 502-512
Jensen, P.L. (2000) The IL-13 receptor complex. Stem Cells 18, 61-62
Jones, S. & Thornton, M. (1996) Principles of protein-protein interactions. Proc. Natl. Acad. Sci. USA 93, 13-20
Koph, M., Le Gros, G., Bachmann, M., Lamers, M.C., Bluethmann, H. & Koehler, G. (1993) Disruption of murine IL-4 gene blocks Th2 cytokine responses. Nature, 362, 245-248
Kruse, ., Shen, B.J., Arnold, S, Tony, H.P., Mueller, T. & Sebald, W. (1993) Two distinct functional sites of human interleukin 4 are identified by variants impaired in either receptor binding or receptor activation. EMBO J. 12, 5121
Kruse, N., Tony, H.-P. & Sebald, W. (1992) Coversion of human interleukin-4 into a high affinity antagonist by a single amino acid replacement. The EMBO J 11, 3237-3244
Kühn, R., Rajewsky, K. & Müller, W. (1991) Generation and analysis of interleukin 4 deficient mice. Science 254, 707-710
Layton, J., Iaria, J., Smith, D. & Treutlein, H. (1997) Identification of a ligand-binding site on the Granulocyte Colony-stimulating Factor Receptor by molecular modeling and mutagenesis. J. Biol. Chem. 272, 29735-29741
Idzerda, R.L., March, C.J., Mosely, B., Lyman, S.D., VandenBos, T., Gimpel, S.D., Din, W.S., Grabstein, K.H., Widmer, M.B., Park, L.S., Cosman, D. & Beckmann, M.P. (1990) Human interleukin-4 receptor confers biological responsiveness and defines a novel receptor super-famaly. J. Exp. Med. 171, 86
Jarvis, D.L. & Garcia A. (1994) Long-term stability of baculoviruses stored under various conditions. BioTechniques 16, 508-513
Jin, L. & Wells, J. A. (1992) Dissecting the enrgetics of an antibody-antigen interfaceby alanine shaving and molecular grafting. Protein Sci. 3, 2351-2357
Karlsson, R. & Fealt, A (1997) Experimental design for kinetic analysis of protein-protein interactions with surface plasmon resonance biosensors. J. Immonol. Meth. 200, 121-133
Kossiakoff, A. & de Vos, A.M. (1998) Strustural basis for cytokine hormone-receptor recognition and receptor activation. Adv Prot Chem 52, 67-108
Kruse, N., Lehrnbecher, T. & Sebald, W. (1991) Site-directed mutagenesis reveals the importance of disulfide bridges aromatic residues for structure and proliferative activity of human interleukin-4. FEBS Lett. 286, 58-60
Kuby, J. (1994) Immunology. Second Edition, 1-19
Lau, F. T. & Fersht, A. R. (1987) Nature 326, 811-812
Le Beau, M.M., Lemons, E.R.S., Espinosa, R., Larson, R.A., Arai, N. & Rowley, J.D. (1988) IL-4 and IL-5 map to human chromosome 5 in a region encoding growth factors and receptors and are deleted in myeloid leukemias with a del(5q) Blood 73, 647 Le, H.V., Ramanathan, L., Labdon, J.E., Mays-Ichinco, C.A., Sytp, R., Arai, N., Hoy, P., Takebe, Y., Nagabhushan, T.L. & Trotta, P.P. (1988) Isolation and characterisation of multiple variants of recombinant human iterleukin 4 expressed in mammalian cells. J. Biol. Chem. 263, 10817
140

6. Literature
Leahy, D.J., Hendrickson, W.A., Aukhil, I. & Erickson, H.P. (1992) Structure of a fibronectin type III domain from tenascin phased by MAD analysis of the selenomethionyl protein. Science 258, 987-991. Lee, F., Yokota, T., Otsuka, T., Meyerson, P., Villaret, D., Coffman, R., Mosmann, T., Rennick, D., Roehm, N., Smith, C., Zlotnick, A. & Arai, K. (1986) Isolation and characterisation of mouse interleukin cDNA clone that expresses B-cells stimulatory factor 1 and T-cell and mast-cell-stimulating activities. Proc. Natl. Acad. Sci. USA 83, 2061 Leonard W.J. & O´Shea, J.J. (1998) JAKS and STATS: biological implications, Annu. Rev. Immunol. 16, 293-322 Letzelter, F., Wang, Y. & Sebald, W. (1998) The interleukin-4 site-2 epitope determining binding of the common receptor γ chain Eur. J. Biochem. 257, 11-20 Lonjou, C., Barnes, K., Chen, H., Cookson, W.O., Deichmann, K.A., Hall, I.P., Holloway, J.W., Laitinen, T., Palmer, L.J., Wjst, M. & Moton, N.E. (2000) A first trial of retrospective collaboration for positional cloning in complex inheritance: assay of the cytokine region on chromosome 5 by COAG. Proc. Natl. Acad. Sci. USA 97, 10942-10947 Look, D.C., Pelletier, M.R., Tidwell, R.M., Roswit, W.T. & Holtzman, M.J. (1995) STAT-1depends on transcriptional synergy with Sp1. J. Biol. Chem. 270, 30264-30267 Lukacs, N.W., Strieter, R.M., Chensue, S.W. & Kunkel, S.L. (1994) Am. J. Respir. Cell Mol. Biol. 10, 526 Manian, P. (1997) Genetics of asthma: a review. Chest 112, 1397 Marone G. (1998) Asthma: recent advances. Immunology Today 19, 5-9 Marsh, D.G. et al. (1996) Science 264, 1152 Matthews, R.E.F. (1982) Classification and nomenclature of viruses. Fourth report of international committee on taxonomy of viruses. Karger, Basel McCarthy, J.E., Schairer, H.U. & Sebald, W. (1985) Translation initiation frequency of atp genes from Escherichia coli: identification of an intercistronic sequence that enhances translation. Embo J 4, 519-526 McKenzie A.N. (2000) Regulation of T helper type immunity by IL-4 and IL-13. Pharmacol. Ther. 88, 143-151 Middletone, S.A., Barbone, F.P., Johnson, D.L., Thurmond, R.L., McMahon, F.J., Jin, R., Livnah, O., Tullai, J., Farrell, F.X., Goldsmith, M.A., Wilson, I.A. & Jolliffe L.K. (1999) Shared and unique determinants of the erythropoietin (EPO) receptor are important for binding EPO and EPO mimetic protein. J. Biol. Chem. 274, 14163-14169 Miossec, P. (1994) Acting on the cytokine balance to control autoimmunity and chronic inflammation. Eur. Cytoline Netw. 4, 245f. Miyajima, A., Kitamura, T., Harada, N., Yokota, T., & Arai, K. (1992) Cytokine receptors and signal transduction. Annu. Rev.Immunol. 10, 295-331 Miyazaki, T., Kawahara, A., Fujii, H., Nakagawa, Y., Minami, Y., Liu, Z., Oishi, I., Silvennoinen, O., Witthahn, B.A., Ihle, J.N. (1994) Functional activation of Jak1 and Jak3 by selective association with IL-2R subunits. Science 266, 1045-47 Murata, T., Taguchi, J. & Puri, R.K. (1998) Interleukin –13 receptor α´ but not α chain: a functional component of interleukin-4 receptors. Blood 91, 3884-3891 Nanavaty, U., Goldstein, A.D. & Levine S.J. (2001) Polymorphisms in candidate asthma genes. Am. J. Med. Sci. 321, 11-16 Nelms, K., Keegan, A.D., Zamorano, J., Ryan, J.J. & Paul, W.E. (1999) The IL-4 receptor: signaling mechanisms and biologic function. Annu. Rev. Immunol. 17, 701-738
141

6. Literature
Nice, E.C. & Catimel, B. (1999) Instrumental biosensors: new perspectives for the analysis of biomolecular interactions. BioEssays 21, 339-352 Nicola, N. & Hilton, D. (1998) General classes and function of four-helih bundle cytokines. Adv Prot Chem 52, 1-65 Nicola, N.A. ed.(1994)”Guidebook to cytokines and their receptors”. Oxford University Press, Oxford, 1-7 Noben-Trauth, N., Schultz, L.D., Brombacher, F., Urban, J.F.; Gu, H. & Paul, W.E. (1997) An interleukin 4 independent pathway for CD4+ T-cell IL-4 production is revealed in IL-4 receptor deficient mice. Proc. Natl. Acad. Sci. USA 94, 10838-10843 Noelle, R., Kramme, R.P., Ohara, J., Uhr, J.W., Vitetta, E.S. (1984) Increased expression of Ia antigens on resting B cells: an additional role for B-cell growth factor. Proc. Natl. Acad. Sci. USA 81, 6149-6153 Obiri, N.I., Debinski, W., Leonard, W.J. & Puri, R.K. (1995) Receptor for interleukin 13- interaction with interleukin 4 by a mechanism that does not involve the common γ chain shared by receptors for interleukin 2, 4, 7, 9, and 15. J. Biol. Chem. 270, 8797-8804 Ohara, J. & Paul, W.E. (1988) Up-regulation of interleukin-4/B-cell stimulatory factor 1 receptor expression. Proc. Natl. Acad. Sci. USA 85, 8221-8225 Ohara, J., Lahet, S., Inman, J. & Paul, W.E. (1985) Partial purification of murine B-cell stimulatory factor –1. J. Immunol. 135, 2518 Otzen, D.E. & Fersht, A.R. (1999) Analysis of protein-protein interactions by mutagenesis: direct versus indirect effects. Prot. Engin. 12, 41-45 Patel, B.K.R., Pierce, J.H. & LaRochelle, W.J. (1998) Regulation of Interleukin-4-mediated signalling by naturally occurring dominant negative and attenuated forms of human STAT-6. Proc. Natl. Acad. Sci. USA 95, 172-177 Paul, W.E. & Seder, R.A. (1994) Lymphocyte responses and cytokines. Cell 76, 241-251 Pene, J., Rousset, F., Briere, F., Chretien, I., Bonnefoy, J.Y., Spits, H., Yokota, T., Arao, N., Arai, K.I., Bancherea, J. & de Vries, J.E. (1988) IgE production by normal human lymphocytes is induced by interleukin-4 and suppressed by IFN γ and αand prostaglandin E2. Proc. Natl. Acad. Sci. USA 85, 6880-6884 Powers, R., Garrett, D.S., March, C.J., Frieden, E.A., Gronenborn, A.M. & Clore, G.M. (1992) Three-dimensional solution structureof human interleukin-4 by multidimensional heteronuclear magnetic resonance spectroscopy. Science 256, 1673-1677 Prasad, M.R., Bahekar, R.H. & Rao, (2000) Recent perspectives in the design of antiasthamatic agents. Pharmazie 55, 457-482 Ramshaw, H., Woodcock, J., Bagley, C., McClure, B., Hercus, T. & Lopez, A. (2001) New approaches in the treatment of asthma. Immunol. Cell Biol. 79, 154-159 Rebollo, A., Gomez, J. & Martnez-A., C. (1996) lessons from immunological, biochemical and molecular pathways of the activation mediated by IL-2 and IL-4. Adv. Immunol. 63, 127-196 Renz, H., Bradley, K., Enssle, K., Loader, J.E., Larsen, G.L. & Gelfand, E.W. (1996) prevention of development of immediate hyperresponsiveness following in vivo treatment with soluble IL-4 receptor. Int. Arch. Allergy Immunol. 109, 167-176 Reusch, P., Arnold, S., Heusser, C., Wagner, K., Weston, B. & Sebald, W. (1994) Neutralizing monoclonal antibodies define two different functional sites in human interlekin-4. Eur J Biochem 222, 491-499 Romagnani, S. (1991) Human TH1 and TH2 subsets:doubt no more. Immunol. Today 12, 256-257 Russell, S.M., Keegan, A.D., Harada, N., Nakamura, Y., Noguchi, M., Leland, P., Friedmann, M.C., Miyajima, A., Puri, R.K., Paul, W.E. & Leonard, W.J. (1993) Interleukin-2 receptor γ chain: a functional component of the interleukin-4 receptor. Science 262, 1880-1883
142

6. Literature
Sambrook, J., Fritsch, E.F. & Maniatis, T. (1989) Molecular cloning: a laboratory manual. Cold Spring Habour Laboratory Press, USA. Schaefer, T.S., Sanders, L.K. & Nathans, D. (1995) Co-operative transcriptional activity of Jun and STAT-3β, a short form of STAT-3. Proc. Natl. Acad. Sci. USA 92, 9097-9101
Schreiber, G. & Fersht, A.R. (1995) Energetics of protein-protein interactions: analysis of barnase-barstar interface by single mutations and double mutant cycles. J Mol. Biol. 248, 478-486
Seder, R.A., Gazzinelli, R., Sher, A. & Paul, W.E. (1993) IL-12 acts directly on CD4+ T cells to enhance priming for IFNγ production and diminishes IL-4 inhibition of such priming. Proc. Natl. Acad. Sci. USA 90, 10188-10192
Seder, R.A., Paul, W.E., Davis, M.M. & Fazekas de St. Groth, B. (1992) The presence of interleukin 4 during in vitro priming determines the lymphokine-producing potential of CD4+ T cells from T cell receptor transgenic mice. J. Exp. Med. 176, 1091-1098
Shen, B-J. (1996) Thesis work, University of Wuerzburg
Seder, R.A. & Paul, W.E. (1994) Acquisition of lymphokine-producing phenotype by CD4+ T-cells. Annu. Rev. Immunol. 12, 635-673
Shen, B. (1996) Molecular recognition during binding of human IL-4 to its receptor. PhD Thesis, Julius-Maximilians University of Wuerzburg
Smerz-Bertling, C. & Duschl, A. (1995) Both interleukin-4 and interleukin-13 induce tyrosine phosphorilation of the 140 kD subunit of the interleukin-4 receptor. J. Bol. Chem. 270, 966-970 Smith, L.J., Redfield, C., Boyd, J., Lawrence, G., Edwards, R.G., Smith, R.A.G. & Dobson, C.M. (1992) Human interleukin 4- the solution structure of a four-helih bundle protein. J. Mol. Biol. 224, 899-904 Snapper, C.M., Hornbeck, P.V., Atasoy, U., Pereira, G.M. & Paul, W.E. (1988) Interleukin 4 induces membrane Thy-1 expression on normal murine B cells. Proc. Natl. Acad. Sci. USA 85, 6107-6111 Sprang, S.R. & Bazan, J.F. (1993) Cytokine structural taxonomy and mechanisms of receptor engagement. Curr. Opin. Struct. Biol. 3, 815-827 Sugamura, K., Asao, H., Kondo, M., Tanaka, N., Ishii, N., Nakamura, M. & Takeshita, T. (1995) The common γ-chain for multiple cytokine receptors. Adv. Immunol. 59, 225-277 Sugamura, K., Asao, H., Kondo, M., Tanaka, N., Ishii, N., Ohbo, K., Nakamura, M. & Takeshita, T. (1996) The interleukin-2 receptor γ chain: its role in the multiple cytokine receptor complexes and T cell development in XSCID. Annu. Rev. Immunol. 14, 179-205 Sun, X.J., Wang, L.M., Zhang, Y., Yenush, L., Myers, M.G.J., Glasheen, E., Lane, W.S., Pierce, J.H. & White, M.F. (1995) Role of IRS-2 in insulin and cytokine signalling. Nature 377, 173-177 Takeshita, T., Asao, H., Ohtani, K., Ishii, N., Kumaki, S., Tanaka, N., Munakata, H., Nakamura, M. & Sugamura, K. (1992) Cloning of the γ chain of the human IL-2 receptor. Science 257, 551-556 Tanaka, H., Nagai, H. & Maeda., Y. (1998) Effect of anti-IL-4 and anti-IL-5 antibodies on allergic airway hyperresponsiveness in mice. Life. Sci. 62, 169-174 Tartof, K.D. & Hobbs, C.A. (1987) Improved media for growing plasmid and cosmid clones. Bethesda Res. Lab. Focus 9:12 Tepper, R.I. & Mule, J.J. (1994) Experimental and clinical studies of cytokine gene-modified tumor cells. Hum. Gene. Ther. 5, 153-164 Tepper, R.I., Levinson, D.A., Stanger, B.Z., Campos-Torres, Abbas, A.K. & Leder, P. (1990) II-4 induces allergic-like inflammatory disease and alters T cell development in transgenic mice. Cell 62, 457-467
143

6. Literature
Thornhill, M.H., Wellicoms, S.M., Mahiouz, D.L., Lanchbury, J.S., Kyan-Aung, U. & Haskard, D.O. (1991) TNF combines with interleukin 4 or IFNγ to selectively enhance andothelial cell adhesiveness for T cells. The contribution of vascular cell adhesion molecule-1-dependent and independent binding mechanisms. J. Immunol. 146, 592-598 Toker, A. & Cantley, L.C. (1997) Signalling through the lipid products of phsophoinositide-3-OH kinase. Nature 387, 673-676. Tomkinson, A., Duez, C., Cieslewicz, G., Pratt, J.C., Joetham, A., Shanafelt, .C., Gundel, R. & Gelfand, E.W. (2001) A murine IL-4R antagonist that inhibits IL-4- and IL-13-induced responses prevents antigen-induced airway eosinophilia and airway hypeeesponsiveness. J. Immunol. 166, 5792-5800 Tony H.P., Shen , B.J., Reusch, P. & Sebald, W. (1994) Design of human interleukin-4 antagonists inhibiting interleukin-4-dependent and interleukin-13-dependent responses in T cells and B cells with high efficiency. Eur. J. Biochem. 225, 659 Tsicopoulos, A., Janin, A., Akoum, H., Lamblin, C., Vorng, H., Hamid, Q., Tonnel, A.B. & Wallaert, B. (2000) Cytokine profile in MSGs from patients with bronchial asthma. Allergy Clin. Immunol. 106, 687-696 Turner, B., Rapp, U., App, H., Greene, M., Dobashi, K. & Reed, J. (1991) Interleukin-2 induces tyrosine phosphorylation and activation of p72-74 Raf-1 kinase in a T-cell line. Proc. Natl. Acad. Sci. USA 88, 1227f. Vaughn, J.L., Goodwin, R.H. & Tompkins, G.J. (1977) In vitro 13, 213-217 Velazquez, L., Fellous, M., Stark, G.R. & Pellegrini, S. (1992) A protein tyrosine kinase in the interferon α/β signalling pathway. Cell 70, 313-322 Walker, C. et al. (1992) Am. Rev. Respir. Dis. 146, 109 Walter, M.R., Cook, W.J., Zhao, B.G., Cameron, R.P., Ealick, S.E., Walter, R.L., Reichert, P., Nagabhushan, T.L., Trotta, P.P. & Bugg, C.E. (1992) Crystal structure of recombinant human interleukin-4. J. Biol. Chem. 267, 20371-20376
Wang, Y., Shen, B-J. & Sebald, W. (1997) A mixed – charge pair in human interleukin 4 dominates high-affinity interaction with the receptor α chain. Proc. Natl. Acad. Sci. USA 94, 1657-1662
Wells, J.A. (1990) Additivity of mutational effects in proteins. Biochemistry, 29, 8509-8517
Wills-Karp, M., Luyimbazi, J., Xu, X., Schofield, B., Neben, T.Y., Karp, C.L. & Donaldson, D.D. (1998) Interleukin-13: central mediator of allergic asthma. Science 282, 2258-2261
Yanisch-Perron, C., Vieira, J. & Messing, J. (1985) Improved M13 phage cloning vectors and host strains: nucleotide sequences of M13amp18 and pUC19 vectors. Gene 33, 103-119
Wang, H.Y., Paul, W.E. & Keegan, A.D. (1996) IL-4 function can be transferred to the IL-2 receptor by tyrosine containing sequences found in the IL-4 receptor alpha chain. Immunity 4, 113-121.
Welham, M.J., Learmonth, L., Bone, H., Schrader, J.W. (1995) Interleukin-13 signal transduction in lymphohemopoietic cells. Similarities and differences in signal transduction with interleukin-4 and insulin. J. Biol. Chem. 270, 12286-12296
Wietek, S. (1999) Gezielte Beeinflussung der Signaltransduktion des humanen Interleukin-4 Rezeptors durch Expression von mutierten Komponenten der Signalweiterleitungs-Kaskade. PhD Thesis, Julius-Maximilians University of Wuerzburg
Wlodawer, A., Pavlovsky, A. & Gustchina, A. (1992) Crystal structure of human recombinant interleukin-4 at 2.25 A resolution. FEBS lett. 309, 59-64
Yokota, T., Otsuka, T., Mosmann, T., Banchereau, J., Defrance, T., Blanchard, D., de Vries, J.E., Lee., F. & Arai, K. (1986) Isolation and characterisation of a human interleukin cDNA clone homologous to mouse B-cell stimulatory factor 1 that expresses B-cell and T-cell-stimulatory activities. Proc. Natl. Acad. Sci. USA 83, 5894
144
6. Literature
Yoon, C., Johnston, S., Tang, J., Stahl, M., Tobin, J.F. & Somers, W.S. (2000) Charged residues dominate a unique interlocking topography in the heterodimeric cytokine interleukin-12. EMBO J. 19, 3350-3541
Zamorano, J. & Keegan, A.D. (1998) Regulation of apoptosis by tyrosine containing domains of IL-4Rα:Y497 and Y713, but not the Stat-6-docking tyrosine, signal protection from apoptosis. J. Immunol. 161, 859-867
Yoshimoto, T. & Paul, W.E. (1994) CD4pos, NK1.1pos T-cells pomtly produce Interleukin-4 in response to in vivo challenge with anti-CD3. J. Exp. Med. 179, 1285-1295
145
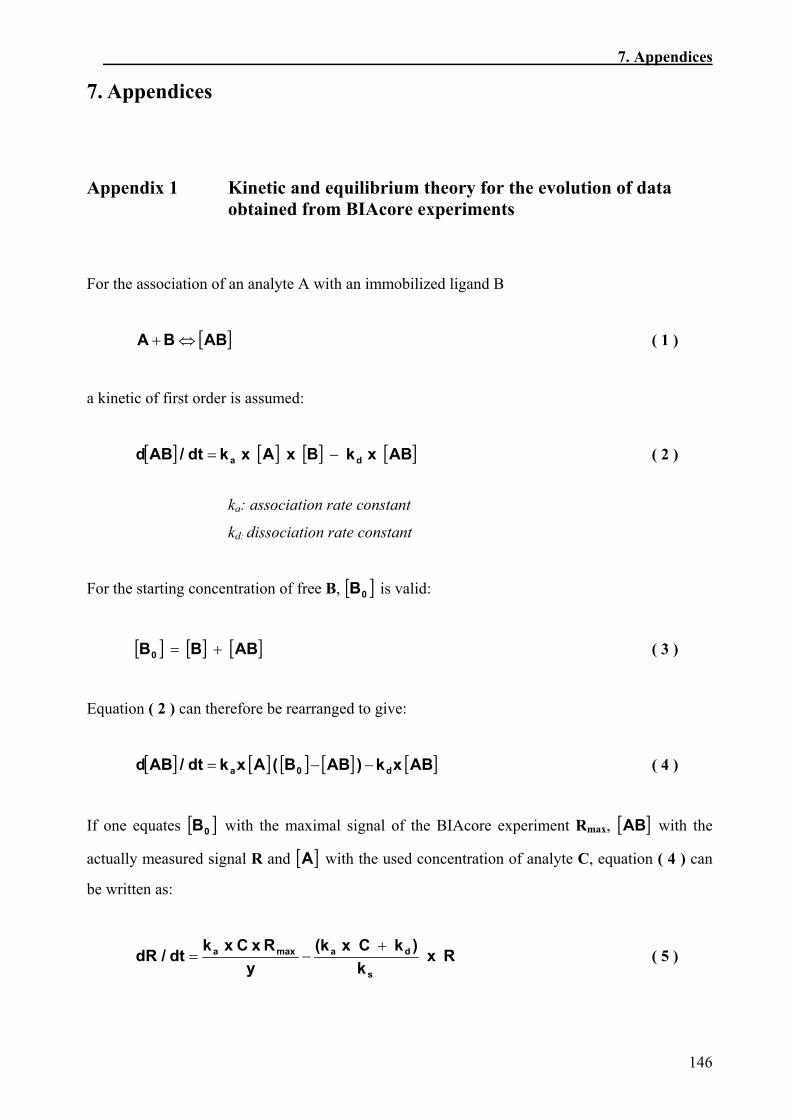
7. Appendices
7. Appendices
Appendix 1 Kinetic and equilibrium theory for the evolution of data
obtained from BIAcore experiments
For the association of an analyte A with an immobilized ligand B
a kinetic of first order is assumed:
k : association rate constant a
d:
For the starting concentration of free B, is valid:
( 3 )
Equation ( 2 ) can therefore be rearranged to give:
( 4 )
If one equates [ with the maximal signal of the BIAcore experiment R , with the
actually measured signal R and with the used concentration of analyte C, equation ( 4 ) can
be written as:
( 5 )
[ABBA ⇔+ ] ( 1 )
( 2 ) [ ] [ ] [ ] [ ]AB x k B x A x kdt / ABd da −=
k dissociation rate constant
[ ]0B
[ ] [ ] [AB B B0 += ]
[ ] [ ] [ ] [ ] [ ]AB xk) ABB ( A xkdt / ABd d0a −−=
] ]0B [AB
[ ]A
max
R x k
)k C x (ky
R x C x kdtdR / s
damaxa +−=
146

7. Appendices
Equation ( 5 ) is the equation of a straight line with k as gradient. s
( 6 )
s s
d
By measurement at different analyte concentrations C through this graphical representation k as
well as k can be determined. In practice, the determination of k by graphical representa-tion is
not very accurate, because in general is valid:
a
d
d
For the dissociation a time law of first order is assumed:
This can be transformed into
A graphical representation of ln against results in a straight line with k as
gradient.
das k C x k k +=
The graphical representation of k against C results also in a straight line with k as gradient and
the k as ordinate segment.
d
da k C x k >>
The determination of k therefore is achieved according to another method.
)t(t k
0t0de x R R −−=
)t(t x k )/R(R ln 0dt0 −=
)/R(R t0 )t(t 0− d
147

7. Appendices
Appendix 2 Vector pRPR9IL-4FD (with IL-4BP cDNA 1278-1970 bp)
5’TTCTCATGTTTGACAGCTTATCATCGATTTTATGAATATACAAATAATTGGAGCCAACC 3’
5’GCAGGTGATGATTATCAGCCAGCAGAGAATTAAGGAAAACAGACAGGTTTATTGAGCGCT 3´ 120
T 180
5’CCATTTACTATGTTATGTTCTGAGGGGAGTGAAAATTCCCCTAATTCGATGAAGATTCTT 3´
5’GCTCAATTGTTATCAGCTATGCGCCGACCAGAACACCTTGCCGATCAGCCAAACGTCTCT 3´ 300
5’TCAGGCCACTGACTAGCGATAACTTTCCCCACAACGGAACAACTCTCATTGCATGGGAT 3´ 360
5’ATTGGGTACTGTGGGTTTAGTGGTTGTAAAAACACCTGACCGCTATCCCTGATCAGTTTC 3´ 420
C 480
5’TGCTCAGGGTCAACGAGAATTAACATTCCGTCAGGAAAGCTTGGCTTGGAGCCTGTTGGT 3´
5’GCGGTCATGGAATTACCTTCAACCTCAAGCCAGAATGCAGAATCACTGGCTTTTTTGGTT 3´ 600
5’GTGCTTACCCATCTCTCCGCATCACCTTTGGTAAAGGTTCTAAGCTTAGGTGAGAACAT 3´ 660
5’CCTGCCTGAACATGAGAAAAAACAGGGTACTCATACTCACTTCTAAGTGACGGCTGCATA 3´ 720
G 780
5’CTAACTTTGAGAATTTTTGTAAGCAATGCGGCGTTATAAGCATTTAATGCATTGATGCCA 3´
5’TTAAATAAAGCACCAACGCCTGACTGCCCCATCCCCATCTTGTCTGCGACAGATTCCTGG 3´ 900
5’GATAAGCCAAGTTCATTTTTCTTTTTTTCATAAATTGCTTTAAGGCGACGTGCGTCCTC 3´ 960
5’AGCTGCTCTTGTGTTAATGGTTTCTTTTTTGTGCTCATACGTTAAATCTATCACCGCAAG 3´ 1020
C 1080
5’ATGTACTAAGGAGGTTGTATGGAACAACGCATAACCCTGAAAGATTATGCAATGCGCTTT 3´
5’GGGCAAACCAAGACAGCTAAAGATCAAGAATGTTGATCTTCAGTGTTTCGCCTGTCTGTT 3´ 1200
5’TTGCACCGGAATTTTTGAGTTCTGCCTCGAGCTGGTATAAGTTTTATTGCTTATAGCAA 3´ 1260
5’AAGGTTGAGGTGATTTTATGAAAAAGAATATCGCATTTCTTCTTGCATCTATGTTCGTTT 3´ 1320
G 1380
5’ACTACATGAGCATCTCTACTTGCGAGTGGAAGATGAATGGTCCCACCAATTGCAGCACCG 3´
T 1 60
5’TATCTTTCCCTTTATTTTTGCTGCGGTAAGTCGCATAAAAACCATTCTTCATAATTCAA 3´
240
C
5’TTGAAGGTAAACTCATCACCCCCAAGTCTGGCTATGCAGAAATCACCTGGCTCAACAGC 3´
540
C
5’CTAACCGCTTCATACATCTCGTAGATTTCTCTGGCGATTGAAGGGCTAAATTCTTCAAC 3´
840
A
5’GGATAAATATCTAACACCGTGCGTGTTGACTATTTTACCTCTGGCGGTGATAATGGTTG 3´
1140
T
5’TTTCTATTGCTACAAATGCCTATGCATTTAAGGTCTTGCAGGAGCCCACCTGCGTCTCC 3´
1440
5’AGCTCCGCCTGTTGTACCAGCTGGTTTTTCTGCTCTCCGAAGCCCACACGTGTATCCCT 3´ G 1500
5’AGAACAACGGAGGCGCGGGGTGCGTGTGCCACCTGCTCATGGATGACGTGGTCAGTGCG 3´ G 1560
5’ATAACTATACACTGGACCTGTGGGCTGGGCAGCAGCTGCTGTGGAAGGGCTCCTTCAAG 3´ C 1620
5’CCAGCGAGCATGTGAAACCCAGGGCCCCAGGAAACCTGACAGTTCACACCAATGTCTCC 3´ G 1680
148

7. Appendices
5’ACACTCTGCTGCTGACCTGGAGCAACCCGTATCCCCCTGACAATTACCTGTATAATCATC 3´ 1740
5’TCACCTATGCAGTCAACATTTGGAGTGAAAACGACCCGGCAGATTTCAGAATCTATAACG 3´ 1800
5’TGACCTACCTAGAACCCTCCCTCCGCATCGCAGCCAGCACCCTGAAGTCTGGGATTTCC 3´ T 1860
5’ACAGGGCACGGGTGAGGGCCTGGGCTCAGGCCTATAACACCACCTGGAGTGAGTGGAGC 3´ C 1920
5’CCAGCACCAAGTGGCACAACTCCTACAGGGAGCCCTTCGAGCAGCACTAGGATCCCGCAA 3´ BamHI 1980
5’AAGCGGCCTTTGACTCCCTGCAAGCCTCAGCGACCGAATATATCGGTTATGCGTGGGCGA 3´ 2040
5’TGGTTGTTGTCATTGTCGGCGCAACTATCGGTATCAAGCTGTTTAAGAAATTCACCTCG 3´ A 2100
5’AAGCAAGCTGATAAACCGATACAATTAAAGGCTCCTTTTGGAGCCTTTTTTTTTGGAGAT 3´ 2160
5’TTTCAACGTGAAAAAATTATTATTCGCAATTCCTTTAGTTGTTCCTTTCTATTCTCACTC 3´ 2220
5’CGCTGAAACTGTTGAAAGTTGTTTAGCAAAACCTCATACAGAAAATTCATTTACTAACG 3´ T 2280
5’CTGGAAAGACGACAAAACTTTAGATCCGGCCAAGCTTCGTCGACCCTGCCTCGCGCGTT 3´ T 2340
5’CGGTGATGACGGTGAAAACCTCTGACACATGCAGCTCCCGGAGACGGTCACAGCTTGTCT 3´ 2400
5’GTAAGCGGATGCCGGGAGCAGACAAGCCCGTCAGGGCGCGTCAGCGGGTGTTGGCGGGTG 3´ 2460
5’TCGGGGCGCAGCCATGACCCAGTCACGTAGCGATAGCGGAGTGTATACTGGCTTAACTA 3´ T 2520
5’GCGGCATCAGAGCAGATTGTACTGAGAGTGCACCATATGCGGTGTGAAATACCGCACAG 3´ A 2580
5’TGCGTAAGGAGAAAATACCGCATCAGGCGCTCTTCCGCTTCCTCGCTCACTGACTCGCTG 3´ 2640
5’CGCTCGGTCGTTCGGCTGCGGCGAGCGGTATCAGCTCACTCAAAGGCGGTAATACGGTTA 3´ 2700
5’TCCACAGAATCAGGGGATAACGCAGGAAAGAACATGTGAGCAAAAGGCCAGCAAAAGGC 3´ C 2760
5’AGGAACCGTAAAAAGGCCGCGTTGCTGGCGTTTTTCCATAGGCTCCGCCCCCCTGACGAG 3´ 2820
5’CATCACAAAAATCGACGCTCAAGTCAGAGGTGGCGAAACCCGACAGGACTATAAAGATAC 3´ 2880
5’CAGGCGTTTCCCCCTGGAAGCTCCCTCGTGCGCTCTCCTGTTCCGACCCTGCCGCTTAC 3´ C 2940
5’GGATACCTGTCCGCCTTTCTCCCTTCGGGAAGCGTGGCGCTTTCTCATAGCTCACGCTG 3´ T 3000
5’AGGTATCTCAGTTCGGTGTAGGTCGTTCGCTCCAAGCTGGGCTGTGTGCACGAACCCCCC 3´ 3060
5’GTTCAGCCCGACCGCTGCGCCTTATCCGGTAACTATCGTCTTGAGTCCAACCCGGTAAGA 3´ 3120
5’CACGACTTATCGCCACTGGCAGCAGCCACTGGTAACAGGATTAGCAGAGCGAGGTATGT 3´ A 3180
5’GGCGGTGCTACAGAGTTCTTGAAGTGGTGGCCTAACTACGGCTACACTAGAAGGACAGT 3´ A 3240
5’TTTGGTATCTGCGCTCTGCTGAAGCCAGTTACCTTCGGAAAAAGAGTTGGTAGCTCTTGA 3´ 3300
5’TCCGGCAAACAAACCACCGCTGGTAGCGGTGGTTTTTTTGTTTGCAAGCAGCAGATTACG 3´ 3360
5’CGCAGAAAAAAAGGATCTCAAGAAGATCCTTTGATCTTTTCTACGGGGTCTGACGCTCA 3´ G 3420
5’TGGAACGAAAACTCACGTTAAGGGATTTTGGTCATGAGATTATCAAAAAGGATCTTCACC 3´ 3480
5’TAGATCCTTTTAAATTAAAAATGAAGTTTTAAATCAATCTAAAGTATATATGAGTAAACT 3´ 3540
149

7. Appendices
5’TGGTCTGACAGTTACCAATGCTTAATCAGTGAGGCACCTATCTCAGCGATCTGTCTATT 3´ T 3600
5’CGTTCATCCATAGTTGCCTGACTCCCCGTCGTGTAGATAACTACGATACGGGAGGGCTTA 3´ 3660
5’CCATCTGGCCCCAGTGCTGCAATGATACCGCGAGACCCACGCTCACCGGCTCCAGATTTA 3´ 3720
5’TCAGCAATAAACCAGCCAGCCGGAAGGGCCGAGCGCAGAAGTGGTCCTGCAACTTTATC 3´ C 3780
5’GCCTCCATCCAGTCTATTAATTGTTGCCGGGAAGCTAGAGTAAGTAGTTCGCCAGTTAA 3´ T 3840
5’AGTTTGCGCAACGTTGTTGCCATTGCTGCAGGCATCGTGGTGTCACGCTCGTCGTTTGGT 3´ 3900
5’ATGGCTTCATTCAGCTCCGGTTCCCAACGATCAAGGCGAGTTACATGATCCCCCATGTT 3´ G 3960
5’TGCAAAAAAGCGGTTAGCTCCTTCGGTCCTCCGATCGTTGTCAGAAGTAAGTTGGCCGC 3´ A 4020
5’GTGTTATCACTCATGGTTATGGCAGCACTGCATAATTCTCTTACTGTCATGCCATCCGT 3´ A 4080
5’TTAAAAGTGCTCATCATTGGAAAACGTTCTTCGGGGCGAAAACTCTCAAGGATCTTACC 3´ G 4140
5’CTGTTGAGATCCAGTTCGATGTAACCCACTCGTGCACCCAACTGATCTTCAGCATCTTTT 3´ 4200
5’ACTTTCACCAGCGTTTCTGGGTGAGCAAAAACAGGAAGGCAAAATGCCGCAAAAAAGGG 3´ A 4260
5’AGATGCTTTTCTGTGACTGGTGAGTACTCAACCAAGTCATTCTGAGAATAGTGTATGCG 3´ G 4320
5’CGACCGAGTTGCTCTTGCCCGGCGTCAACACGGGATAATACCGCGCCACATAGCAGAAC 3´ T 4380
5’ATAAGGGCGACACGGAAATGTTGAATACTCATACTCTTCCTTTTTCAATATTATTGAAG 3´ C 4440
5’ATTTATCAGGGTTATTGTCTCATGAGCGGATACATATTTGAATGTATTTAGAAAAATAA 3´ A 4500
5’CAAATAGGGGTTCCGCGCACATTTCCCCGAAAAGTGCCACCTGACGTCTAAGAAACCAT 3´ T 4560
5’ATTATCATGACATTAACCTATAAAAATAGGCGTATCACGAGGCCCTTTCGTCTTCAAGA 3´ A 4620
150
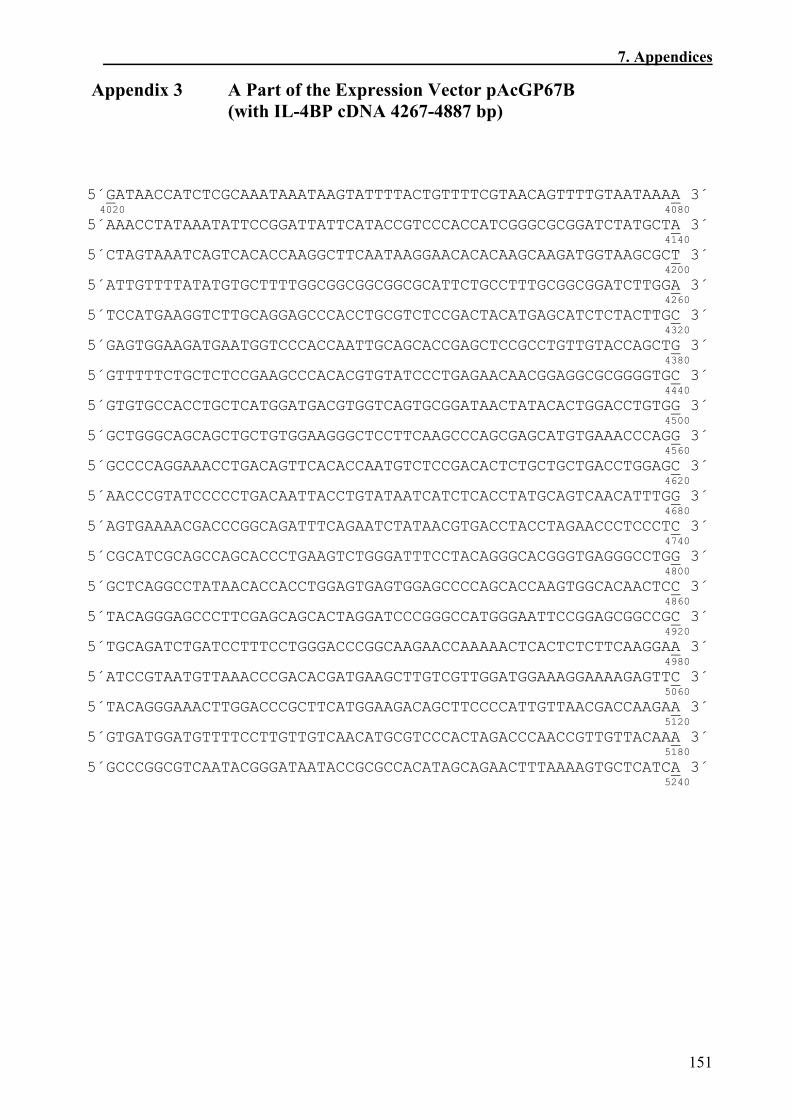
7. Appendices
Appendix 3 A Part of the Expression Vector pAcGP67B (with IL-4BP cDNA 4267-4887 bp)
5´GATAACCATCTCGCAAATAAATAAGTATTTTACTGTTTTCGTAACAGTTTTGTAATAAA 3´ A 4020 4080
5´AAACCTATAAATATTCCGGATTATTCATACCGTCCCACCATCGGGCGCGGATCTATGCT 3´ A 4140
5´CTAGTAAATCAGTCACACCAAGGCTTCAATAAGGAACACACAAGCAAGATGGTAAGCGC 3´ T 4200
5´ATTGTTTTATATGTGCTTTTGGCGGCGGCGGCGCATTCTGCCTTTGCGGCGGATCTTGG 3´ A 4260
5´TCCATGAAGGTCTTGCAGGAGCCCACCTGCGTCTCCGACTACATGAGCATCTCTACTTG 3´ C 4320
5´GAGTGGAAGATGAATGGTCCCACCAATTGCAGCACCGAGCTCCGCCTGTTGTACCAGCTG 3´ 4380
5´GTTTTTCTGCTCTCCGAAGCCCACACGTGTATCCCTGAGAACAACGGAGGCGCGGGGTG 3´ C 4440
5´GTGTGCCACCTGCTCATGGATGACGTGGTCAGTGCGGATAACTATACACTGGACCTGTGG 3´ 4500
5´GCTGGGCAGCAGCTGCTGTGGAAGGGCTCCTTCAAGCCCAGCGAGCATGTGAAACCCAGG 3´ 4560
5´GCCCCAGGAAACCTGACAGTTCACACCAATGTCTCCGACACTCTGCTGCTGACCTGGAGC 3´ 4620
5´AACCCGTATCCCCCTGACAATTACCTGTATAATCATCTCACCTATGCAGTCAACATTTG 3´ G 4680
5´AGTGAAAACGACCCGGCAGATTTCAGAATCTATAACGTGACCTACCTAGAACCCTCCCT 3´ C 4740
5´CGCATCGCAGCCAGCACCCTGAAGTCTGGGATTTCCTACAGGGCACGGGTGAGGGCCTG 3´ G 4800
5´GCTCAGGCCTATAACACCACCTGGAGTGAGTGGAGCCCCAGCACCAAGTGGCACAACTCC 3´ 4860
5´TACAGGGAGCCCTTCGAGCAGCACTAGGATCCCGGGCCATGGGAATTCCGGAGCGGCCG 3´ C 4920
5´TGCAGATCTGATCCTTTCCTGGGACCCGGCAAGAACCAAAAACTCACTCTCTTCAAGGA 3´ A 4980
5´ATCCGTAATGTTAAACCCGACACGATGAAGCTTGTCGTTGGATGGAAAGGAAAAGAGTT 3´ C 5060
5´TACAGGGAAACTTGGACCCGCTTCATGGAAGACAGCTTCCCCATTGTTAACGACCAAGA 3´ A 5120
5´GTGATGGATGTTTTCCTTGTTGTCAACATGCGTCCCACTAGACCCAACCGTTGTTACAA 3´ A 5180
5´GCCCGGCGTCAATACGGGATAATACCGCGCCACATAGCAGAACTTTAAAAGTGCTCATCA 3´ 5240
151

7. Appendices
Appendix 4 Sequence of the Expression Vector R pRC109 (with IL-4 cDNA 1281-1673 bp)
5´TTCTCATGTTTGACAGCTTATCATCGATTTTATGAATATACAAATAATTGGAGCCAACC 3´
1 60
5´GCAGGTGATGATTATCAGCCAGCAGAGAATTAAGGAAAACAGACAGGTTTATTGAGCGCT 3´ 120
5´TATCTTTCCCTTTATTTTTGCTGCGGTAAGTCGCATAAAAACCATTCTTCATAATTCAAT 3´ 180
5´CCATTTACTATGTTATGTTCTGAGGGGAGTGAAAATTCCCCTAATTCGATGAAGATTCT 3´ 240
5´GCTCAATTGTTATCAGCTATGCGCCGACCAGAACACCTTGCCGATCAGCCAAACGTCTCT 3´ 300
5´TCAGGCCACTGACTAGCGATAACTTTCCCCACAACGGAACAACTCTCATTGCATGGGATC 3´ 360
5´ATTGGGTACTGTGGGTTTAGTGGTTGTAAAAACACCTGACCGCTATCCCTGATCAGTTT 3´ 420
5´TTGAAGGTAAACTCATCACCCCCAAGTCTGGCTATGCAGAAATCACCTGGCTCAACAGCC 3´ 480
5´TGCTCAGGGTCAACGAGAATTAACATTCCGTCAGGAAAGCTTGGCTTGGAGCCTGTTGGT 3´ 540
5´GCGGTCATGGAATTACCTTCAACCTCAAGCCAGAATGCAGAATCACTGGCTTTTTTGGT 3´ 600
5´GTGCTTACCCATCTCTCCGCATCACCTTTGGTAAAGGTTCTAAGCTTAGGTGAGAACATC 3´ 660
5´CCTGCCTGAACATGAGAAAAAACAGGGTACTCATACTCACTTCTAAGTGACGGCTGCATA 3´ 720
5´CTAACCGCTTCATACATCTCGTAGATTTCTCTGGCGATTGAAGGGCTAAATTCTTCAAC 3´ 780
5´CTAACTTTGAGAATTTTTGTAAGCAATGCGGCGTTATAAGCATTTAATGCATTGATGCCA 3´ 840
5´TTAAATAAAGCACCAACGCCTGACTGCCCCATCCCCATCTTGTCTGCGACAGATTCCTGG 3´ 900
5´GATAAGCCAAGTTCATTTTTCTTTTTTTCATAAATTGCTTTAAGGCGACGTGCGTCCTC 3´ 960
5´AGCTGCTCTTGTGTTAATGGTTTCTTTTTTGTGCTCATACGTTAAATCTATCACCGCAAG 3´ 1020
5´GGATAAATATCTAACACCGTGCGTGTTGACTATTTTACCTCTGGCGGTGATAATGGTTGC 3´ 1080
5´ATGTACTAAGGAGGTTGTATGGAACAACGCATAACCCTGAAAGATTATGCAATGCGCTT 3´ 1140
5´GGGCAAACCAAGACAGCTAAAGATCAAGAATGTTGATCTTCAGTGTTTCGCCTGTCTGTT 3´ 1200
5´TTGCACCGGAATTTTTGAGTTCTGCCTCGAGTAATTTACCAACACTACTACGTTTTAACT 3´ 1260
5´GAAACAAACTGGAGACTGCCATGCACAAGTGCGATATCACCTTACAGGAGATCATCAAA 3´ 1320
5´CTTTGAACAGCCTCACAGAGCAGAAGACTCTGTGCACCGAGTTGACCGTAACAGACATCT 3´ 1380
5´TTGCTGCCTCCAAGAACACAACTGAGAAGGAAACCTTCTGCAGGGCTGCGACTGTGCTCC 3´ 1440
5´GGCAGTTCTACAGCCACCATGAGAAGGACACTCGCTGCCTGGGTGCGACTGCACAGCAG 3´ 1500
5´TCCACAGGCACAAGCAGCTGATCCGATTCCTGAAACGGCTCGACAGGAACCTCTGGGGCC 3´ 1560
5´TGGCGGGCTTGAATTCCTGTCCTGTGAAGGAAGCCAACCAGAGTACGTTGGAAAACTTCT 3´ 1620
5´TGGAAAGGCTAAAGACGATCATGAGAGAGAAATATTCAAAGTGTTCGAGCTGATAAGGA 3´ 1680
TS
T
T
C
T
G
A
T
A
T
T
152

7. Appendices
5´CCCGCAAAAGCGGCCTTTGACTCCCTGCAAGCCTCAGCGACCGAATATATCGGTTATGCG 3´ 1740
5´TGGGCGATGGTTGTTGTCATTGTCGGCGCAACTATCGGTATCAAGCTGTTTAAGAAATTC 3´ 1800
5´ACCTCGAAAGCAAGCTGATAAACCGATACAATTAAAGGCTCCTTTTGGAGCCTTTTTTT 3´ 1860
5´TGGAGATTTTCAACGTGAAAAAATTATTATTCGCAATTCCTTTAGTTGTTCCTTTCTATT 3´ 1920
5´CTCACTCCGCTGAAACTGTTGAAAGTTGTTTAGCAAAACCTCATACAGAAAATTCATTTA 3´ 1980
5´CTAACGTCTGGAAAGACGACAAAACTTTAGATCCGGCCAAGCTTCGTCGACCCTGCCTC 3´ 2040
5´CGCGTTTCGGTGATGACGGTGAAAACCTCTGACACATGCAGCTCCCGGAGACGGTCACAG 3´ 2100
5´CTTGTCTGTAAGCGGATGCCGGGAGCAGACAAGCCCGTCAGGGCGCGTCAGCGGGTGTTG 3´ 2160
5´GCGGGTGTCGGGGCGCAGCCATGACCCAGTCACGTAGCGATAGCGGAGTGTATACTGGC 3´ 2220
5´TAACTATGCGGCATCAGAGCAGATTGTACTGAGAGTGCACCATATGCGGTGTGAAATACC 3´ 2280
5´GCACAGATGCGTAAGGAGAAAATACCGCATCAGGCGCTCTTCCGCTTCCTCGCTCACTGA 3´ 2340
5´CTCGCTGCGCTCGGTCGTTCGGCTGCGGCGAGCGGTATCAGCTCACTCAAAGGCGGTAA 3´ 2400
5´ACGGTTATCCACAGAATCAGGGGATAACGCAGGAAAGAACATGTGAGCAAAAGGCCAGCA 3´ 2460
5´AAAGGCCAGGAACCGTAAAAAGGCCGCGTTGCTGGCGTTTTTCCATAGGCTCCGCCCCCC 3´ 2520
5´TGACGAGCATCACAAAAATCGACGCTCAAGTCAGAGGTGGCGAAACCCGACAGGACTAT 3´ 2580
5´AAGATACCAGGCGTTTCCCCCTGGAAGCTCCCTCGTGCGCTCTCCTGTTCCGACCCTGCC 3´ 2640
5´GCTTACCGGATACCTGTCCGCCTTTCTCCCTTCGGGAAGCGTGGCGCTTTCTCATAGCTC 3´ 2700
5´ACGCTGTAGGTATCTCAGTTCGGTGTAGGTCGTTCGCTCCAAGCTGGGCTGTGTGCACG 3´ 2760
5´ACCCCCCGTTCAGCCCGACCGCTGCGCCTTATCCGGTAACTATCGTCTTGAGTCCAACCC 3´ 2820
5´GGTAAGACACGACTTATCGCCACTGGCAGCAGCCACTGGTAACAGGATTAGCAGAGCGAG 3´ 2880
5´GTATGTAGGCGGTGCTACAGAGTTCTTGAAGTGGTGGCCTAACTACGGCTACACTAGAA 3´ 2940
5´GACAGTATTTGGTATCTGCGCTCTGCTGAAGCCAGTTACCTTCGGAAAAAGAGTTGGTAG 3´ 3000
5´CTCTTGATCCGGCAAACAAACCACCGCTGGTAGCGGTGGTTTTTTTGTTTGCAAGCAGCA 3´ 3060
5´GATTACGCGCAGAAAAAAAGGATCTCAAGAAGATCCTTTGATCTTTTCTACGGGGTCTG 3´ 3120
5´CGCTCAGTGGAACGAAAACTCACGTTAAGGGATTTTGGTCATGAGATTATCAAAAAGGAT 3´ 3180
5´CTTCACCTAGATCCTTTTAAATTAAAAATGAAGTTTTAAATCAATCTAAAGTATATATGA 3´ 3240
5´GTAAACTTGGTCTGACAGTTACCAATGCTTAATCAGTGAGGCACCTATCTCAGCGATCT 3´ 3300
5´TCTATTTCGTTCATCCATAGTTGCCTGACTCCCCGTCGTGTAGATAACTACGATACGGGA 3´ 3360
5´GGGCTTACCATCTGGCCCCAGTGCTGCAATGATACCGCGAGACCCACGCTCACCGGCTCC 3´ 3420
5´AGATTTATCAGCAATAAACCAGCCAGCCGGAAGGGCCGAGCGCAGAAGTGGTCCTGCAA 3´ 3480
5´TTTATCCGCCTCCATCCAGTCTATTAATTGTTGCCGGGAAGCTAGAGTAAGTAGTTCGCC 3´ 3540
T
G
T
T
A
A
G
A
G
C
153
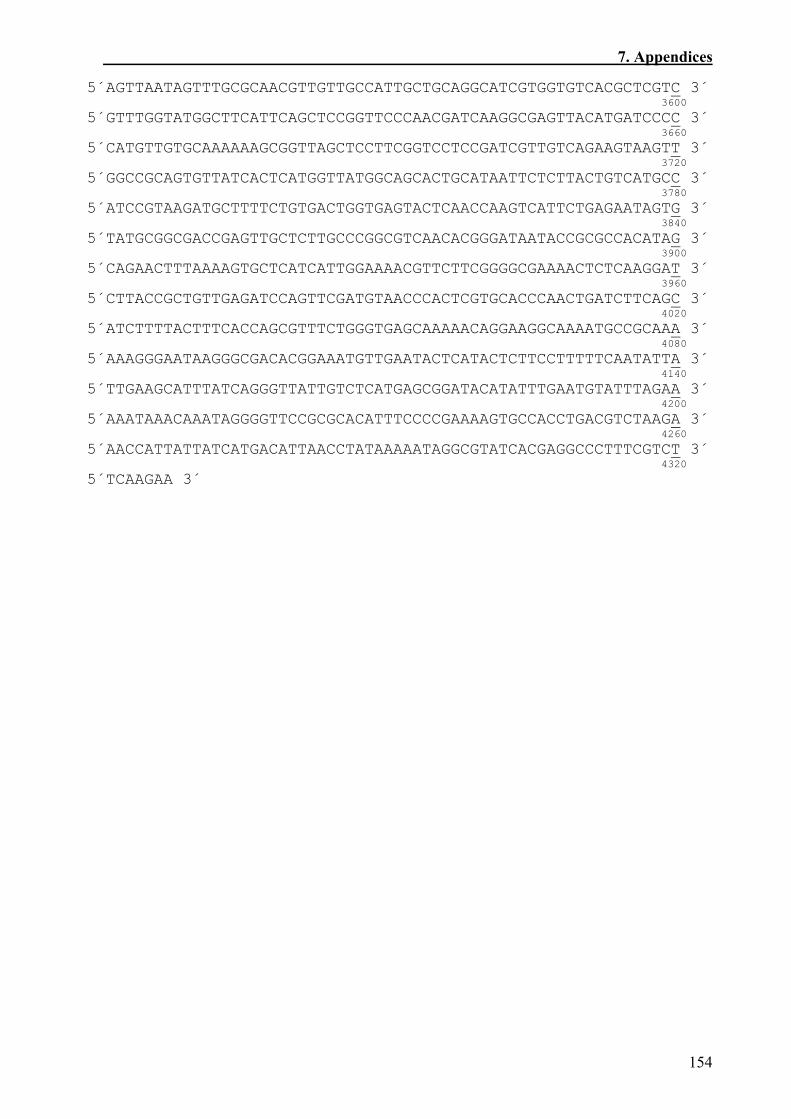
7. Appendices
5´AGTTAATAGTTTGCGCAACGTTGTTGCCATTGCTGCAGGCATCGTGGTGTCACGCTCGTC 3´ 3600
5´GTTTGGTATGGCTTCATTCAGCTCCGGTTCCCAACGATCAAGGCGAGTTACATGATCCCC 3´ 3660
5´CATGTTGTGCAAAAAAGCGGTTAGCTCCTTCGGTCCTCCGATCGTTGTCAGAAGTAAGT 3´ 3720 T
5´GGCCGCAGTGTTATCACTCATGGTTATGGCAGCACTGCATAATTCTCTTACTGTCATGCC 3´ 3780
5´ATCCGTAAGATGCTTTTCTGTGACTGGTGAGTACTCAACCAAGTCATTCTGAGAATAGTG 3´ 3840
5´TATGCGGCGACCGAGTTGCTCTTGCCCGGCGTCAACACGGGATAATACCGCGCCACATAG 3´ 3900
5´CAGAACTTTAAAAGTGCTCATCATTGGAAAACGTTCTTCGGGGCGAAAACTCTCAAGGAT 3´ 3960
5´CTTACCGCTGTTGAGATCCAGTTCGATGTAACCCACTCGTGCACCCAACTGATCTTCAGC 3´ 4020
5´ATCTTTTACTTTCACCAGCGTTTCTGGGTGAGCAAAAACAGGAAGGCAAAATGCCGCAAA 3´ 4080
5´AAAGGGAATAAGGGCGACACGGAAATGTTGAATACTCATACTCTTCCTTTTTCAATATTA 3´ 4140
5´TTGAAGCATTTATCAGGGTTATTGTCTCATGAGCGGATACATATTTGAATGTATTTAGAA 3´ 4200
5´AAATAAACAAATAGGGGTTCCGCGCACATTTCCCCGAAAAGTGCCACCTGACGTCTAAGA 3´ 4260
5´AACCATTATTATCATGACATTAACCTATAAAAATAGGCGTATCACGAGGCCCTTTCGTCT 3´ 4320
5´TCAAGAA 3´
154

Acknowledgements
The present work was carried out at the Department for Physiological Chemistry II of the Theodor-Boveri-Institute of the University of Würzburg between June 1997 and January 2000. I would like to thank all these who worked together with me, who supported me and who were responsible for the nice working atmosphere: I am very much thankful to Prof. Dr. W. Sebald for the opportunity to carry out my Ph.D. in his working group, the lots of discussions and invaluable guidance he gave to me. Especially I would like to thank him for introducing me to the BIAcore technology. I particularly wish to thank Prof. Dr. E. Buchner (Department of Genetics) for being the second referee of this work and for representing this work in front of the Faculty of Biology. I thank very much Mrs. Mayer for her general support and her kindness and helpfulness with finding lodging. I am grateful to Dr. Y. Wang and Michael Blässe for introducing me into the project and some of the used techniques. I would like to say many thanks to Christian Söder for the excellent technical assistance in protein purification. To Wolfgang Hädelt I would like to thank for the excellent technical assistance in DNA sequencing. I would like to say thank you to Dr. Thorsten Hage for his helpful discussions and technical support. Many thanks also to Dr. Joachim Nickel for various useful scientific discussions. For the friendly and nice atmosphere in lab 349 I am thankful to Michael Blässe, Dr. Thorsten Hage, Thomas Hom, Dr. Felix Letzelter, Dr. Joachim Nickel and Angelika Wagner. I am thankful to my husband Dr. Stefan Wietek for his useful comments and discussions and for his technical help with the formation of the present thesis. I highly appreciate his patience, understanding and moral support in the time of my Ph.D. work. To my parents and my brother I would like to thank for the moral support and courage, which they gave me and for their efforts to keep in order all my affairs in Bulgaria during my foreign stage.
I would like to address my thanks to all the other people, who have not been mentioned here by names, but who helped me during my thesis work and who made my stage in Würzburg an exciting experience.
155

Lebenslauf Persönliche Daten: Name: Irina Wietek geb. Simeonova Anschrift: Motorstr. 46 D-80809 München Tel.: 089 / 35 70 96 71 Mobil: 0178 / 687 58 78 geboren am: 6. Januar 1972 in Sofia (Bulgarien) Familienstand: verheiratet Nationalität: Bulgarisch
Berufstätigkeit: seit 07/00 Analyst Customer Integration bei der eLabsEurope AG, München
09/95-06/97 Labor für Molekulare Pathologie, Universitätsklinik für Geburtshilfe und Gynäkologie, Sofia (molekulare Basis und Diagnose vererbbarer Erkrankungen)
Promotion: seit 06/97 Biozentrum der Universität Würzburg, Prof. W. Sebald (Medizinische Fakultät, Abteilung Physiologische Chemie) “Human Interleukin-4 binding protein epitope involved in high-affinity binding of Interleukin-4: Molecular analysis and characterisation”
Studium: 07/95 Diplom in Biochemie und Mikrobiologie; Gesamtnote: ausgezeichnet
01-07/95 Diplomarbeit im Labor für Molekulare Pathologie, Universitätsklinik für Geburtshilfe und Gynäkologie, Sofia: „DNS-Analyse von Familien mit spinaler Muskelatrophy“; Gesamtnote: ausgezeichnet 09/93-12/94 Spezialisierung in Klinischer Chemie, Abteilung Biochemie, Universität Sofia und Abteilung für Klinisches Labor und Klinische Immunologie, Medizinische Universität Sofia 09/90-07/93 Biochemie und Mikrobiologie an der Universität Sofia, Fakultät für Biologie; Vor-Diplom
Stipendium 09/90-07/95 St. Kliment Ohridsky Universität Sofia
Schulausbildung: 09/86-06/90 Nationales Gymnasium für Mathematik und Naturwissenschaften 09/79-06/86 Grundschule
156

Erklärung Ich erkläre hiermit ehrenwörtlich, daß ich die Dissertation „Human Interleukin-4 binding protein
epitope involved in high-affinity binding of Interleukin-4: Molecular analysis and
characterisation“ selbständig angefertigt und keine anderen als die von mir angegebenen Quellen
und Hilfsmittel benutzt habe.
Ich erkläre, daß diese Dissertation weder in der gleichen noch in einer anderen Form in einem
anderen Prüfungsverfahren vorgelegen hat.
Außer den mit dem Zulassungsgesuch urkundlich vorgelegten Graden habe ich keine weiteren
akademischen Grade erworben oder zu erwerben versucht.
München, den 23. Juli 2001
Irina Wietek
157


![^vO^C^ rxo - zfn.mpdl.mpg.dezfn.mpdl.mpg.de/data/Reihe_A/48/ZNA-1993-48a-1026.pdf · long to the class of benzenoid systems [16]; their rings are of size six. The molecular graphs](https://static.fdokument.com/doc/165x107/5f3b005e5c575e66691d1fb7/voc-rxo-zfnmpdlmpgdezfnmpdlmpgdedatareihea48zna-1993-48a-1026pdf.jpg)