J. Ignacio Gimenez-Nadal · PDF file · 2016-06-18Gender Differences in the...
44
econstor www.econstor.eu Der Open-Access-Publikationsserver der ZBW – Leibniz-Informationszentrum Wirtschaft The Open Access Publication Server of the ZBW – Leibniz Information Centre for Economics Standard-Nutzungsbedingungen: Die Dokumente auf EconStor dürfen zu eigenen wissenschaftlichen Zwecken und zum Privatgebrauch gespeichert und kopiert werden. Sie dürfen die Dokumente nicht für öffentliche oder kommerzielle Zwecke vervielfältigen, öffentlich ausstellen, öffentlich zugänglich machen, vertreiben oder anderweitig nutzen. Sofern die Verfasser die Dokumente unter Open-Content-Lizenzen (insbesondere CC-Lizenzen) zur Verfügung gestellt haben sollten, gelten abweichend von diesen Nutzungsbedingungen die in der dort genannten Lizenz gewährten Nutzungsrechte. Terms of use: Documents in EconStor may be saved and copied for your personal and scholarly purposes. You are not to copy documents for public or commercial purposes, to exhibit the documents publicly, to make them publicly available on the internet, or to distribute or otherwise use the documents in public. If the documents have been made available under an Open Content Licence (especially Creative Commons Licences), you may exercise further usage rights as specified in the indicated licence. zbw Leibniz-Informationszentrum Wirtschaft Leibniz Information Centre for Economics Campaña, Juan Carlos; Gimenez-Nadal, J. Ignacio; Molina, José Alberto Working Paper Gender Differences in the Distribution of Total Work- Time of Latin-American Families: The Importance of Social Norms IZA Discussion Papers, No. 8933 Provided in Cooperation with: Institute for the Study of Labor (IZA) Suggested Citation: Campaña, Juan Carlos; Gimenez-Nadal, J. Ignacio; Molina, José Alberto (2015) : Gender Differences in the Distribution of Total Work-Time of Latin-American Families: The Importance of Social Norms, IZA Discussion Papers, No. 8933 This Version is available at: http://hdl.handle.net/10419/110128
-
Upload
phungkhuong -
Category
Documents
-
view
213 -
download
1
Transcript of J. Ignacio Gimenez-Nadal · PDF file · 2016-06-18Gender Differences in the...
econstor www.econstor.eu
Der Open-Access-Publikationsserver der ZBW – Leibniz-Informationszentrum WirtschaftThe Open Access Publication Server of the ZBW – Leibniz Information Centre for Economics
Standard-Nutzungsbedingungen:
Die Dokumente auf EconStor dürfen zu eigenen wissenschaftlichenZwecken und zum Privatgebrauch gespeichert und kopiert werden.
Sie dürfen die Dokumente nicht für öffentliche oder kommerzielleZwecke vervielfältigen, öffentlich ausstellen, öffentlich zugänglichmachen, vertreiben oder anderweitig nutzen.
Sofern die Verfasser die Dokumente unter Open-Content-Lizenzen(insbesondere CC-Lizenzen) zur Verfügung gestellt haben sollten,gelten abweichend von diesen Nutzungsbedingungen die in der dortgenannten Lizenz gewährten Nutzungsrechte.
Terms of use:
Documents in EconStor may be saved and copied for yourpersonal and scholarly purposes.
You are not to copy documents for public or commercialpurposes, to exhibit the documents publicly, to make thempublicly available on the internet, or to distribute or otherwiseuse the documents in public.
If the documents have been made available under an OpenContent Licence (especially Creative Commons Licences), youmay exercise further usage rights as specified in the indicatedlicence.
zbw Leibniz-Informationszentrum WirtschaftLeibniz Information Centre for Economics
Campaña, Juan Carlos; Gimenez-Nadal, J. Ignacio; Molina, José Alberto
Working Paper
Gender Differences in the Distribution of Total Work-Time of Latin-American Families: The Importance ofSocial Norms
IZA Discussion Papers, No. 8933
Provided in Cooperation with:Institute for the Study of Labor (IZA)
Suggested Citation: Campaña, Juan Carlos; Gimenez-Nadal, J. Ignacio; Molina, José Alberto(2015) : Gender Differences in the Distribution of Total Work-Time of Latin-American Families:The Importance of Social Norms, IZA Discussion Papers, No. 8933
This Version is available at:http://hdl.handle.net/10419/110128
DI
SC
US
SI
ON
P
AP
ER
S
ER
IE
S
Forschungsinstitut zur Zukunft der ArbeitInstitute for the Study of Labor
Gender Differences in the Distribution of Total Work-Time of Latin-American Families:The Importance of Social Norms
IZA DP No. 8933
March 2015
Juan Carlos CampañaJ. Ignacio Gimenez-NadalJose Alberto Molina
Gender Differences in the Distribution of Total Work-Time of Latin-American Families:
The Importance of Social Norms
Juan Carlos Campaña University of Zaragoza
J. Ignacio Gimenez-Nadal
University of Zaragoza and CTUR
Jose Alberto Molina University of Zaragoza and IZA
Discussion Paper No. 8933 March 2015
IZA
P.O. Box 7240 53072 Bonn
Germany
Phone: +49-228-3894-0 Fax: +49-228-3894-180
E-mail: [email protected]
Any opinions expressed here are those of the author(s) and not those of IZA. Research published in this series may include views on policy, but the institute itself takes no institutional policy positions. The IZA research network is committed to the IZA Guiding Principles of Research Integrity. The Institute for the Study of Labor (IZA) in Bonn is a local and virtual international research center and a place of communication between science, politics and business. IZA is an independent nonprofit organization supported by Deutsche Post Foundation. The center is associated with the University of Bonn and offers a stimulating research environment through its international network, workshops and conferences, data service, project support, research visits and doctoral program. IZA engages in (i) original and internationally competitive research in all fields of labor economics, (ii) development of policy concepts, and (iii) dissemination of research results and concepts to the interested public. IZA Discussion Papers often represent preliminary work and are circulated to encourage discussion. Citation of such a paper should account for its provisional character. A revised version may be available directly from the author.
IZA Discussion Paper No. 8933 March 2015
ABSTRACT
Gender Differences in the Distribution of Total Work-Time of Latin-American Families: The Importance of Social Norms*
We analyze differences by gender in the time dedicated to total work (paid and unpaid) by families in Latin America, with particular attention to the effect of social norms. To this end, we use survey data on time use in Mexico (2009), Peru (2010), Ecuador (2012) and Colombia (2012), to estimate differential equations through OLS. Our results reveal differences between countries in terms of the gender distribution of total work (paid work plus unpaid work), with Colombia and Peru being more equitable. These two countries could be approaching a situation of “iso-work”, or equality of work, in the sense that men and women spend similar amounts of time in total work. When considering the social norms that explain gender differences in the time spent in total work, we use data from the last wave (2010-2014) of the World Values Survey (WVS). Our results indicate that the more egalitarian countries exhibit the highest levels of equality in the distribution of work. It is important to know how men and women from these four countries distribute their time in total work, in order to understand why there are clear differences by gender. JEL Classification: D13, J22, J13, J16 Keywords: total work, Latin America, differences by gender, social norms Corresponding author: Ignacio Gimenez Nadal Department of Economic Analysis University of Zaragoza C/ Gran Via 2 50005 – Zaragoza Spain E-mail: [email protected]
* This paper was partially written while Jose Alberto Molina was Visiting Fellow at the Department of Economics of the Boston College (US), to which he would like to express his thanks for the hospitality and facilities provided. This paper has benefited from funding from the Spanish Ministry of Economics (Project ECO2012-34828).
2
1. Introduction
This study aims to analyze the differences in the time spent in total work (paid and unpaid) in
four Latin-American countries. This is an important issue, since this time can be converted
into money, goods, and services, which then increases consumption. Analysis of this time use
will provide us with an overview of production as consumption (Fleming and Spellerberg,
1999). Furthermore, knowing the total work time of men and women will provide us with a
knowledge of the time spent on leisure. Total work and leisure time are the two crucial points
when discussing the so-called "gender wars" (Burda et al., 2007). It should be noted,
moreover, that differences in how individuals use their time in paid and unpaid work may
have implications for their daily well-being (Kahneman et al., 2004; Kahneman and Kruger,
2006; Kruger, 2007). We conduct an analysis of families in Mexico, Peru, Colombia and
Ecuador that will give us an approximate view of the allocation of time in total work, for both
men and women.
The majority of economic investigations in Latin America have focused on studying time
spent in paid, or market work. As indicated by Burda, et al (2013), gender differentials
continue to be largely ignored by economists in the study of time dedicated to total work,
despite the obvious importance of looking at how people spend their time outside the labour
market. One probable cause of this oversight has been the lack of available data, but this has
begun to change, especially in developed countries, with more cross-country comparisons
beginning to appear (Gimenez-Nadal and Sevilla, 2012; Burda et al., 2007, 2008, 2013).
In Latin-America, we find very limited evidence regarding the gender division of
housework and market work. Canelas and Salazar (2014), using a variety of polls for
Ecuador, Guatemala and Bolivia, conclude that, relative to men, women are discriminated
against in the labour market and are burdened with the bulk of domestic household
activities. To overcome the limitations of the available, heterogeneous data, in our work we
provide information on four Latin-American countries, using, as a homogeneous source of
data, surveys of time use in similar time periods.
To draw our comparisons, we analyse data from surveys of time use in Mexico (2009),
Peru (2010), Colombia (2012), and Ecuador (2012), with respect to the uses of time spent in
paid work, domestic work, childcare, and total work. We find that men in these four countries
spend more time in paid work, while the women spend more time in chores and
childcare. Men in Peru spend the most time in paid work, 50.93 hours per week, compared to
3
Ecuador, Mexico, and Colombia, at 48.57, 49.68 and 46.91 weekly hours,
respectively. Women in Mexico spend the most hours in housework, 38.91 hours per week,
compared to women in Ecuador, Peru, and Colombia, at 37.54, 37.69 and 31.61 weekly
hours, respectively. Women in Ecuadorian spend the most time in childcare, at 6.43 hours a
week, compared to Mexico, Peru, and Colombia with 5.13, 5.48, and 4.88 hours per week,
respectively.
Based on this evidence, we have combined paid work, housework and caring for children
into a single activity, total work. In Ecuador and Mexico, we find quite marked differences
between men and women, in favour of men: 7.34 and 3.70 hours per week, respectively,
while Peru and Colombia display less discriminating behaviour. In Peru, the gender gap for
women is 1.66 hours per week, and in Colombia, men devote 0.46 more hours per week to
total work than do women. We use social norms as one possible explanation for the reasons
behind these gender differentials. Burda et al., (2013) consider that social standards serve as a
device to coordinate total work between men and women. More traditional social norms
dictate that women bear the heaviest burden of total work, which, in turn, acts as a drag on
economic development. To measure the effect of social standards in the four countries
studied, we use information from the last wave of the world values survey (WVS, 2010-
2014) and construct an egalitarian index, following Alessina and Giuliano (2007) and Sevilla
(2010), to determine which countries are more - or less - egalitarian countries. Our results
confirm that the more egalitarian the country, the smaller the gender gap in total work.
Considering the importance of social norms and how they influence the distribution of total
work, we carry out regressions via OLS, with our results confirming that cross-country
gender differences disappearing with the growth of gender equality.
In this context, we analyze heterogeneous groups within each country, as have other
studies of time use (Gimenez-Nadal and Sevilla, 2014), determining three levels of education
(primary, secondary, and University) and considering the presence or absence of children at
home. Our results show that more egalitarian social norms tend to have a greater effect in
reducing gender differences when there are no children in the home, but are less efficacious
when children are present. This can be explained by the difficulties imposed by the labour
market on women with children (Mateo Diaz and Rodriguez-Chamussy, 2013) and the
prevailing limitations on the services offered for childcare (Araujo et al, 2013).
Section 2 presents our theoretical framework, Section 3 contains a review of the relevant
literature, and Section 4 describes our data and variables, and trends in total work in the four
4
countries studied. In Section 5 we deal with the relevant social norms, and Section 6 presents
our descriptive results, identified by socio-demographic groups, as well as other country
evidence. Our econometric analysis and empirical results comprise Section 7, and Section 8
summarizes our conclusions and policy recommendations.
2 Theoretical Framework
Our theoretical framework is based on Gimenez-Nadal and Sevilla (2014), who establish that
time spent in total work is represented as:
TWm =εwm and TWf =εwf,
where "m" is male and "f" is female, and where we assume that the sensitivity of work to the
wage rate "w" is equal across genders in each country. Focusing on gender differences in
total work we obtain:
TWm - TWf = wm - εf w = ε ε(wm - w-f).
In Australia, the Netherlands, and Norway, men devote more time to overall work (Gimenez-
Nadal and Sevilla, 2012), in the Mediterranean countries they spend less time in total work
than women (Burda et al., 2007).
Thus, we consider the existence of a social/gender norm in a given country that
influences individual time in total work, defined as the mean time men (TWm *) and women
(TWf *) should devote to total work. We measure the strength of the social norm regarding
total work as, 0 ≤ ϕ ≤ ∞, where ϕ = 0 indicates that there is no binding social/gender norm
and thus agents choose TW = εw, whereas when ε ϕ = ∞, the social/gender norm is
infinitely powerful and obligates individuals to choose TWm =TWm * and TWf =TWf *. For ϕ
between 0 and ∞, the social/gender norm pulls total optimal choice away from
work TW = εw towards TW*, and hence:
TWm = α(Εwm) + (1 - α) TWm *
TWf = α(Εwf) + (1 - α) TWf *
with the weight 0≤ α ≤ 1 and defined as α = 1/1 +Φε. We establish a negative relationship
between α and ϕ. If ϕ = 0, α = 1, indicating that there is no binding social/gender norm and
individuals choose freely their total work time, according to TW = εw. If ϕ = ∞, α = 0,
5
indicating that the social/gender norm is infinitely powerful and obligates individuals to
choose TWm = TWm * and TWf = TWf *.
Focusing on gender differences in total work time, we obtain:
TWm - TWf = αε (wm - w-f) + (1 - α) (TWm * -TWf *)
If α = 1, we could consider that there is no social/gender norm, and thus the gender
difference in total work can be explained by TWm - TWf = ε(wm - w-f). Sevilla (2010) carries
out a classification of 13 countries, from more to less egalitarian, showing how social norms
influence the behavior of men and women, depending on countries. While countries of
northern Europe, including Sweden and Norway, would be considered more egalitarian
countries (approximate α = 1), countries of southern Europe, such as Spain, would be framed
as being less egalitarian (α < 1), thus explaining why social norms have an effect on total
work time (see Garcia et al., 2010 and 2011, and Molina and Montuenga, 2009, on gender
differences in time spent at work and on childcare in Spain).
3 Background
Over the past three decades one of the most significant changes in Latin-America has been
the growing economic contribution of women in the region, due mainly to millions of women
having entered the labour market. The rate of female labour participation on the Mainland
increased from 35% in 1980 to 53% in 2007 (Pages and Piras, 2010) and between 30% and
40% of the increase in the labor force participation of women is due to changes related to
educational level (Duryea et al 2004). Despite these increases in the labor force participation
of women, specialization within the household has changed very little in recent
decades. According to Folbre (2006), in Latin America, as in the Caribbean, the primary
responsibility for the care of the sick, the elderly, and children still falls on women. While
this creates well-being for households, it imposes costs on, and substantial limitations to, the
female members of the family.
There is evidence from other countries. Sevilla et al., (2010), show how between 1980 and
2000 in the developed world, women doubled their participation in the labour market, from
22% to 44%. However, despite this increase, the proportion of the time devoted by women to
domestic tasks and childcare has hardly changed in the same time frame (see Figure 1). As
seen in Baxter (2002), Bianchi (2000), and Bittman (1999), despite the increase of women in
6
the labour market, they still specialized in unpaid work. Regarding the participation of men in
the home, the increase for men in housework time has been modest, to say the least. Thus,
specialization in chores has undergone little change (Gershuny, 2000, and Bianchi et al.,
2006). More evidence exists of the so-called second shift, that is, when the woman works
outside the home for more hours than her husband, she still carries the greater burden of
housework (Hochshild and Machung, 1989). In recent decades, differences in the distribution
of the time spent in total work (paid and unpaid work) has become somewhat more equal,
especially in the developed countries, even getting to the point where some men carry more
of the load of total work than women (see Giménez-Nadal and Sevilla, 2012).
Burda et al., (2013) point out that, even though men spend more time in the labour market,
and women are more involved in home production, the inter-gender distribution of total work
is equal in certain countries. Comparing the Catholic and non-Catholic developed countries;
these authors show that, in the case of the non-Catholic countries, total work time is nearly
equal by gender, while women in Catholic countries invest more time in total work. In
general, in the 27 developed countries studied (Catholic and non-Catholic) the total workload
is greater for women than for men. However, when the sample is restricted to non-Catholic
countries, then the time dedicated to total work is almost the same for men and women,
indicating that social norms can partially influence partially the results. This phenomenon,
where the distribution of total work is equal between men and women is known as "iso-
work".
According to Burda, Hamermesh and Weil (2013), social gender norms are what allow for
the existence of this "iso-work", since such norms serve as a coordinating device between the
total work of both men and women, allowing equal opportunities between the sexes in terms
of the distribution of time. Social standards exist, and are shared by others and by members of
the general community (Elster, 1989). These social standards assume that individuals
experience social pressure to conform to a common standard for the allocation of time. See,
for example, Gimenez-Nadal et al., 2012, and Gimenez-Nadal and Sevilla, 2014, for the case
of Spain, and Burda et al., (2008) for Italy. These authors show how gender social norms
encourage an inegalitarian distribution of time between men and women in terms of total
work, to the detriment of women, so that these countries are shifted away from "iso-work".
7
4. The use of time data
4.1 Description of data and variables
Our aim is to compare four Latin American countries, with respect to total work (paid
work outside the home, and unpaid work within) and the distribution of time. Time use
surveys are a method of compiling timely and accurate data on the division of labour in the
family context, allowing us to consider the interdependence of both paid and unpaid work.
As indicated by Stuart (2014), although information relating to unpaid work is widely
available from a variety of surveys (of income and expenses, of homes and living conditions),
time-use surveys are considered the primary statistical tools. Gimenez and Sevilla (2012)
show that time-use surveys are the preferred method for gathering information as to the time
spent on paid work, unpaid work, and leisure time. (See Aguiar et al., 2008, Krueger, 2007,
and Hurst, 2007, who all use data from time use surveys).
The difficulty of obtaining this type of data for Latin American countries, differences in
the years of conducting these surveys, and little comparability in terms of the number of
questions related to the use of time, have limited our study to four countries: Mexico (2009),
Peru (2010), Colombia (2012) and Ecuador (2012).1 We can state that, in the case of these
countries, these are the first independent time-use surveys, since data was only previously
available through other types of survey, such as integrated household surveys.2
The population studied are all members of households surveyed after age 12 for
Mexico, Peru, and Ecuador, and from age 10 for Colombia. The first three surveys take as
reference period the previous week, while for that for Colombia takes as reference period the
previous day. Lists of activities based on the following international classifications are used
in the data collection: Peru (ICATUS, classification international activities of use of
time)3; Mexico (CMAUT, classification of the time use)4; Ecuador and Colombia (CAUTAL,
classification of activities of the use of time for Latin America and the Caribbean)5.
1 Both the databases and methodologies for the surveys of the use of time have been obtained through information published by the relevant institutes of statistics in each country. The information obtained for Mexico is from INEGI (National Institute of statistics and geography); for Peru, from INEI (Instituto Nacional de Estadística e Informática); for Colombia from DANE (National Administrative Department of statistics); and for Ecuador from INEC (National Institute of statistics and censuses). 2 For an overview of the more detailed surveys of time use in Latin-American countries, see Aguirre and Ferrari (2013) 3 ICATUS is a pilot project for the international classification of activities for time-use statistics, developed during the 1990s. The first material was prepared in 1997. The latest revision was in 2003. 4 The CMAUT comprises the adaptation of ICATUS to Mexico. 5 CAUTAL is created to meet national requirements and regional mandates, comparable with ICATUS and EUROSTAT. CAUTAL is comparable with ICATUS and CMAUT, since the scheme of ICATUS is the benchmark for CAUTAL.
8
The structure of ICATUS (Peru) comprises 15 main divisions: work for corporates, quasi-
companies, non-profits, and public administration institutions; Work in households (Primary
production activities); Work in households (Non-primary production activities);Work in
households (Construction activities): work in households (Provision of paid
services); Domestic services, unpaid; Unpaid provision of support and care to members of the
household; Provision of unpaid services to the community and help to other homes; Study
activities; Social life and participation in community activities; Attendance at cultural events,
trainings and sports; Hobbies, games and other pastimes; Sports, fitness, and outdoor
activities; Use of mass media; and personal care.
CMAUT (Mexico) comprises 11 divisions: structured sectors and households, domestic
work unpaid, unpaid services of care and support to members of the household, non-
remunerated support services to other homes and the community, study activities, social life
with family, friends, other people, and the community, attendance at cultural events, training,
sports and competitive, participation in games and hobbies, sports and physical exercise; use
of mass media; activities and personal care.
CAUTAL (Ecuador and Colombia) comprises 9 divisions: paid work; activities related to
paid work; household chores unpaid; care unpaid of household members; unpaid work for
others homes, community and unpaid voluntary work; learning and study; coexistence,
culture, hobbies and sport; use of means of communication; and personal care.
For purposes of comparison with prior studies of time use (Aguiar and Hurst,
2007; Giménez-Nadal and Sevilla, 2014), we restrict our sample to individuals between 21
and 65 years of age, who are not students or retirees,6 which gives us 28,492 observations for
Mexico, 7,243 for Peru, 76,621 for Colombia and 23,345 observations for Ecuador.7 We
utilise the demographic weights proposed by Katz and Murphy (1992) to ensure a constant of
types of individual and days of the week. These demographic weights (see Appendix A) have
been used in other time use studies (Aguiar and Hurtz, 2007, 2009; and Gimenez-Nadal and
Sevilla, 2012, 2014).
The calculation of time is of weekly hours. The category of total work includes paid
and unpaid work, with the latter divided into the categories of general housework and
childcare. It is important to make this distinction, since, as pointed out by Sevilla et al., 6 In the survey of time use for Peru, we have no data on whether individuals are retirees, but we do know that the legal retirement age is 65, so our limit is valid. 7 In the case of Ecuador, we consider only those surveys that have been filled out in their entirety by each Member of the household, since parts of the survey could be filled by another Member of the household as the spouse.
9
(2010) and Gimenez-Nadal and Molina (2013), those women who have a better position in
the labour market, rather than reduce their time dedicated to the care of children in the home,
increase it. On the other hand, Kahneman, et al., (2004); Kahneman and Krueger (2006);
Krueger (2007); and Guryan et al., (2008) all show that the time parents spend on children is
an enjoyable activity, so we consider it necessary to separate these activities.
For comparison purposes, we use the definition of categories of time use of Aguiar and
Hurst (2007), who consider separate categories for paid work, domestic work, and
childcare. (See Appendix B, Tables B1 to B4 for an overview of such activities in the four
countries.)
Paid work includes all the time spent working in the paid sector, including main job, a
second job where applicable, and overtime, including paid work at home and travel
allowances, etc.
Domestic work includes any time spent in the preparation of meals, cleaning, laundry,
ironing, dusting, vacuuming, maintenance (including painting and decorating), time spent on
the procurement of goods and services (that is, making purchase of groceries, shopping for
items for the home), along with time spent on other productive activities at home, such as
outdoor cleaning and vehicle repair.
Childcare includes all time spent on childcare as main activity, such as food preparation
for babies and children, washing and bathing, changing diapers, putting children and babies
to sleep, Babysitting, medical care, reading to or playing with babies and children, helping
with homework, and supervisory duties.
4.2. Trends in total work
We analyze trends in the time devoted to work, by both men and women, in Mexico, Peru,
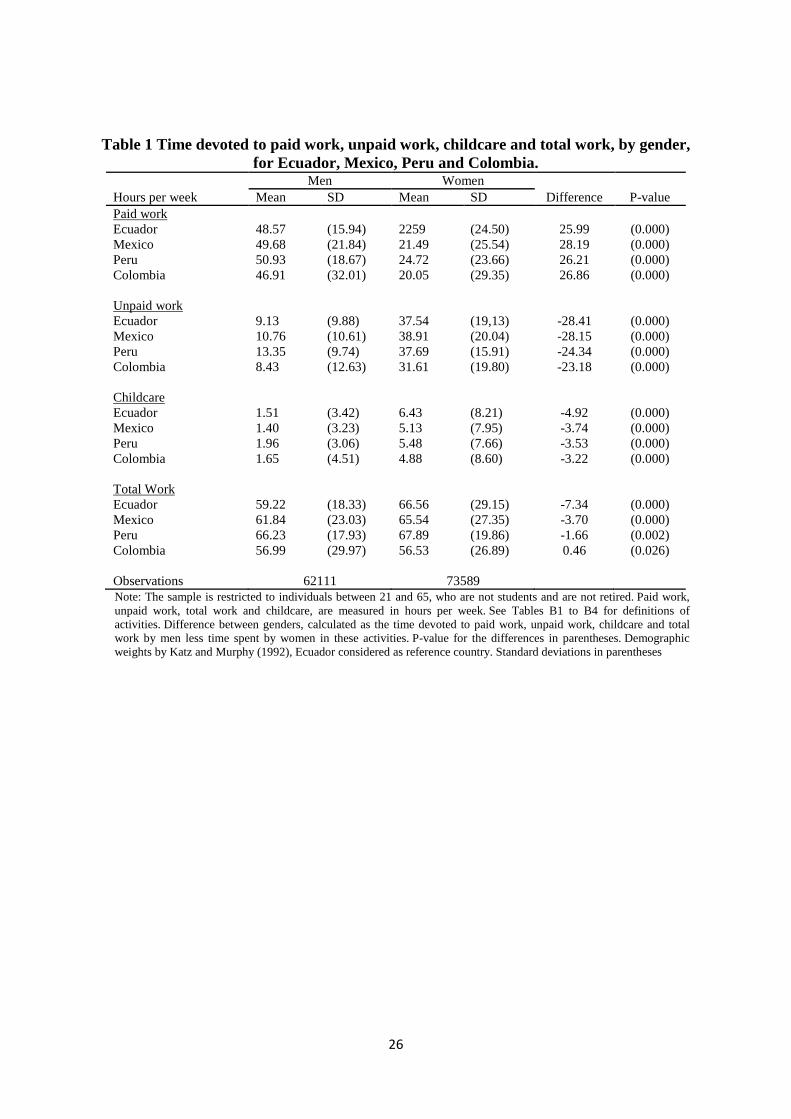
Colombia and Ecuador. Table 1 presents the work categories, male and female time
allocation, and gender differentials. It is clear that these four countries show statistically
significant gender differences in favour of men in paid work, while gender differences are
statistically significant in favour of women in housework and childcare. The fact that men
spend more time in paid work, and women more time in housework and childcare does not
vary across countries (Aguiar and Hurst, 2007; Sevilla et al., 2010; Gimenez-Nadal and
Sevilla, 2012; Gimenez-Nadal and Sevilla, 2014).
10
(Table 1)
Despite the statistically significant differences across these four countries, it is clear that
there are different trends towards a more equal sharing of the total work between men and
women ("iso-work"). Ecuador presents a bias of 7.34 hours per week against women, and
Mexico presents 3.70 hours per week of the same factor. These values are greater than in
Peru and Colombia, with the former showing a bias of 1.66 hours per week against women,
and the latter showing a bias of 0.46 hours per week of bias against men.
The social norms in each country can, in large part, explain these variations, and gender
norms are increasingly used in economic interpretations and models (Fernandez, 2010),
interpretations of the division of labour (Brines 1994; Coltrane, 2000; Alvarez and Miles,
2003; Sevilla et al, 2010) and the division of total work (Gimenez-Nadal and Sevilla, 2014).
5. Social norms
Social norms are standards that must be shared and fulfilled by members of a community
(Elster, 1989). Investigations such as those of Fernandez et al., (2006) and Giuliano (2007),
have provided an understanding, in the US case, of how social norms influence the behavior
of immigrants. Sevilla (2010) shows that more egalitarian social standards can reduce the
discrimination that confronts men participating in activities traditionally considered female;
for instance, men help more with household chores and childcare in more egalitarian
societies, which can explain how the total workload can be higher for men in certain
countries.
To analyze how social norms (culture) influence the distribution of total work in the
countries studied, we construct an index to capture which countries are more egalitarian and
which are less. To this end, we use the data from the world values survey (WVS), a
compilation of national surveys with information on norms and values, such as tolerance of
minorities, support for democracy, the role of religion, and support for gender equality. The
survey has six waves, the most recent of which covers the years 2010-2014, which
corresponds to our surveys of time use.
As in the time-use surveys, we consider individuals between 21 and 65 years of age, who
are not students or retired, matching the regions of countries with respect to time use. This
indication is particularly relevant in the case of Colombia, as its survey of time use does not
contain information on one of its regions, and its survey of values does not provide data on
11
another region. Thus, for our study, we consider the regions of Sierra, Costa, and Amazon for
Ecuador, Center, Center-West, North, South, and South-East for Mexico, Sierra, Selva,
Metropolitan Lima, and the rest of the coast for Peru, and Atlantic, Central, Eastern, Pacific,
and Bogotá for Colombia.
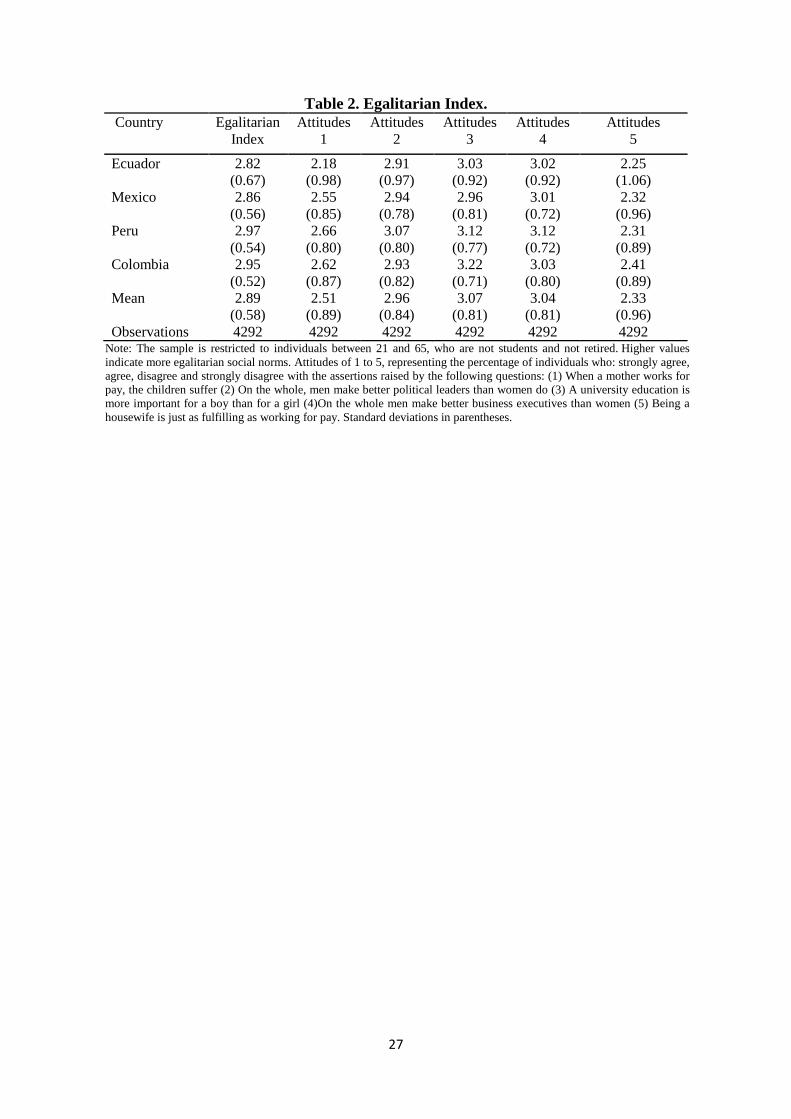
The questions that allow us to build the index are designed to elicit individual opinions on
gender equality, thus: (1) When a mother works for pay, the children suffer (2) On the whole,
men make better political leaders than women do (3) A university education is more
important for a boy than for a girl (4) On the whole men make better business executives than
women (5) Being a housewife is just as fulfilling as working for pay. The possible responses
are on a 4-point scale, thus: 1: agree strongly, 2: agree, 3: disagree 4: disagree
strongly. Higher valuations would indicate that respondents in a given country are more
egalitarian.
Following the work of Alesina and Giuliano (2007) and Sevilla (2010), and using the
Principal Component Analysis (PCA) technique, we extract the first principal component of
each of five questions of all individual responses. Thus, a weight is assigned to each question
allowing us to obtain an egalitarian index.8 The weights assigned to each question are 0.24 to
question (1), 0.54 to question (2), 0.54 to question (3), 0.56 to question (4), and 0.20 to
question (5). Column 1 of Table 2 shows the results of the index. Ecuador (2.82) and Mexico
(2.86) have the lower weightings, indicating that they are less supportive of gender equality,
compared with Peru (2.97) and Colombia (2.95). (As in Table 1, countries that show major
gender differences in the distribution of total work (Ecuador and Mexico), are also less
egalitarian.) Columns 2 to 6 of Table 2 show percentages of responses to our five questions
in support of gender equality; the higher the percentages, the more egalitarian the country.
(Table 2)
6 Descriptive results
6.1 Results by demographic groups
We consider three levels of education: primary (less than a high school degree), secondary
(high school degree), and University (more than a high school degree), as well as the
8 Principal Components Analysis (PCA) is a statistical technique that allows us to transform a number of variables that may be correlated to a number of variables that are not correlated, so-called major components that would be associated with the original variables by an orthogonal transformation.
12
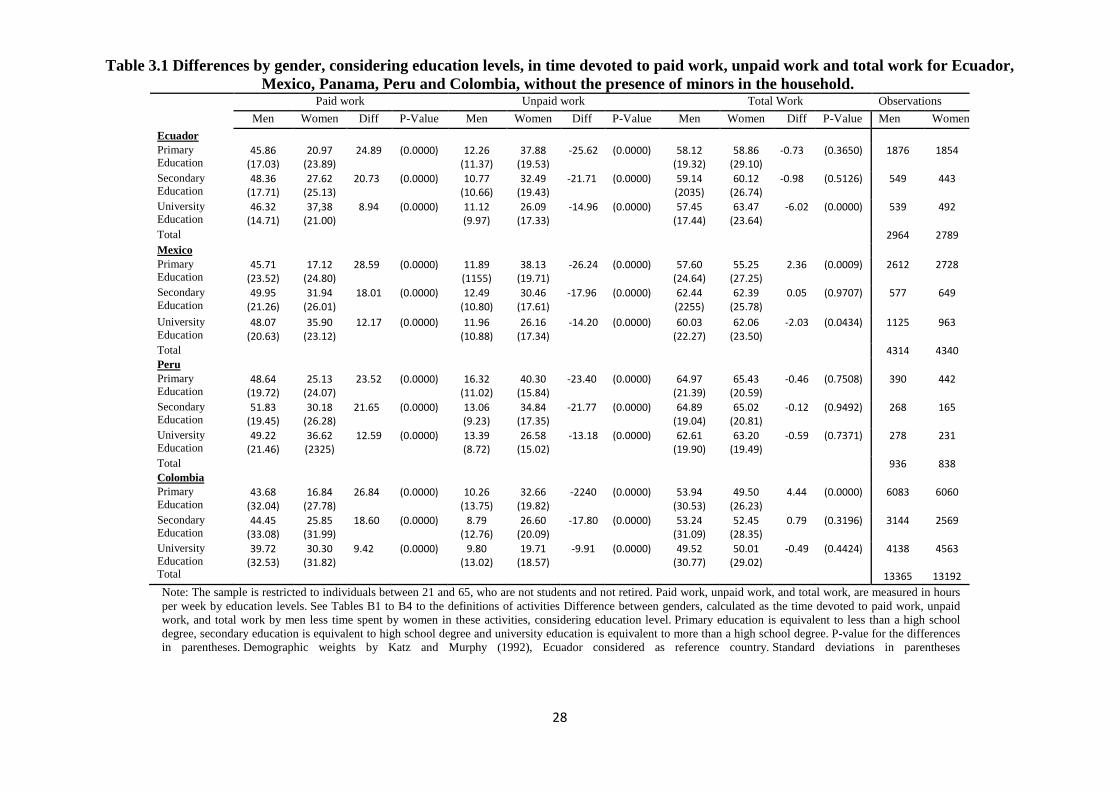
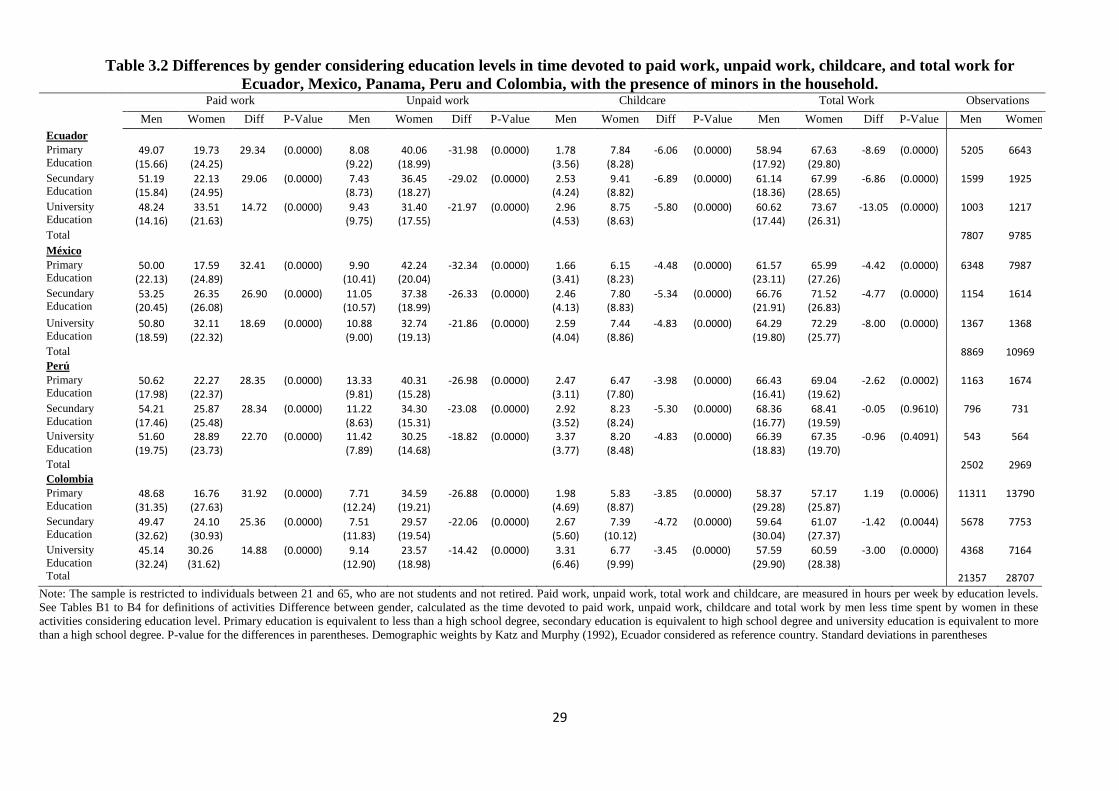
presence, or not, of children in the home.9 Table 3.1 shows results from respondents with no
children (and therefore no childcare component) and Table 3.2 shows results from
respondents with children. We also show the time spent on various activities, gender
differences, and the p-values of the difference in accordance with the level of education of
men and women. We see clear differences between the two tables. It can be seen that the
presence of children in the home is related to an increase in gender differences in the total
work, biased against the woman. Also worthy of note is the fact that women with university
education in less egalitarian countries (Ecuador and Mexico) spend more time in the total
work than men with the same level of training, with or without the presence of children in the
home.
(Table 3.1)
(Table 3.2)
Analyzing Table 3.1 (without children) by primary education, we observe that, on average
in the four countries, men spend 45.97 hours in paid work per week and 12.68 hours unpaid
work (housework), for total work of 58.65 hours, while women spend 20.02 hours in paid
work per week and 37.24 hours of unpaid work (housework), for total work of 57.26 hours.
Ecuador and Peru show small gender differences against women, 0.73 and 0.46 weekly
hours, respectively, while Mexico and Colombia show gender gaps of gender against men of
2.36 and 4.44 hours per week, respectively.
In Table 3.2, for the same level of education, but now with children, men spend 49.59
hours in paid work per week and 11.73 hours in unpaid work (9.76 hours of chores and 1.97
hours in childcare), for total work of 61.32 hours, while women with primary educational
level spend 19.09 paid work hours and 45.87 hours unpaid work (39.30 hours of chores and
6.57 hours of childcare) for total work of 64.96 hours. Thus, women have 3.64 more hours of
total work than men. Country differences are more marked in less egalitarian countries:
Ecuador and Mexico with 8.69 and 4.42 hours per week, respectively, while Peru shows a
smaller gap of 2.62 hours weekly, and Colombia again shows men with the greater burden,
1.19 hours per week more than women. Giménez-Nadal and Sevilla (2012) argue that the
presence of children changes the distribution of time between men and women. We can 9 75% of Ecuadorian households, 69% of Mexican households, 75 per cent of Peruvian households, and 65 per cent of Colombian households have children present (see Table A1).
13
confirm this argument since, as Tables 3.1 and 3.2 show, time distributions change when
children are present in the home.
For those with secondary education, with no children, we observe that men devote 48.65
hours per week to paid work and 11.28 hours to unpaid work, for total work of 59.93 hours.
Women, on average, spend 28.90 hours per week on paid work and 31.10 hours on unpaid
housework, for total work of 60.00 hours per week. The average of our four countries shows
an almost imperceptible gender gap of 0.06 hours per week. When we look at individual
countries, Ecuador and Peru show small gender gaps against women of 0.98 and 0.12 hours
per week, respectively, while the gap is reversed in Mexico and Colombia, showing gaps
against men of 0.05 and 0.79 hours per week, respectively.
For those with secondary education, and with children, the picture is slightly different.
Men spend 52.03 hours per week on paid work and 11.95 hours on unpaid work (9.30 hours
of chores and 2.65 hours of childcare), for total work of 63.98 hours. Women spend 24.61
hours on paid work and 42.63 hours of unpaid work (34.43 hours of chores and 8.21 hours of
childcare) for total work of 67.25 hours. This produces a gender gap against women of 3.27
hours per week, on average. By country, the differences are more marked. In Ecuador and
Mexico, the gender gap is 6.86 and 4.77 hours, respectively, while Peru and Colombia have
smaller gaps of 0.05 and 1.42 hours, respectively. In all four countries, these gaps are against
women.
Important changes to consider in the transition from the primary level of education to the
secondary is that both men and women increase their participation in the labour market
(mainly women with no children), presumably because a higher education allows greater
access to the labour market. This, in turn, increases the opportunity cost of time (Becker,
1965). As can be seen, the women exchange more hours of paid work for fewer hours of
chores – a result that is more pronounced for women with no children. Women who have
children at home, despite decreasing their time dedicated to housework, increase their time
spent in the care of their children (1.63 hours per week on average), which is accounted for
by Sevilla et al., (2010), through the argument that women specialize in childcare, regardless
of their capacity for negotiation or relative productivity.
For those with a University-level education, with no children, a somewhat different pattern
emerges. On average, men in this group spend 45.83 hours per week in paid work and 11.57
hours in unpaid housework, for total work of 57.40 hours per week. Women in the same
14
group spend 35.05 hours in paid work and 24.64 hours in unpaid housework, for total work of
59.69 hours. The average gender gap is, then, 2.28 hours, against women. Focusing on the
countries, Ecuador and Mexico present significant bias against women, of 6.02 and 2.03
hours per week, respectively, while in Peru and Colombia the gender gaps are much smaller,
at 0.49 and 0.59 hours per week, respectively.
For those with a University-level education, and with children, men, on average, spend
48.95 hours per week in paid work and 13.28 hours in unpaid work (10.22 hours of chores
and 3.06 hours of childcare), for total work of 62.22 hours. Women spend 31.19 hours in paid
work and 37.28 hours in unpaid work (29.49 hours of chores and 7.79 hours of childcare) for
total work of 68.47 hours, which produces a gender gap against women of 6.25 hours per
week. By country, we find that the differences in the distribution of total work are much more
marked in Ecuador and Mexico, with 13.05 and 8.00 hours per week, respectively, while in
Peru and Colombia, the differences are much less with 0.96 and 3.00 hours per week,
respectively.
In the transition from secondary education to University, we observe different preferences
between men and women. University-educated men spend less time in total work than
secondary-educated men, three hours less per week (with or no children in the
home). University-educated women, on the other hand, spend more time on paid work
compared to women with secondary education, with an average of more than six hours (with
or no children in the home). Men at this level decrease their hours of work, but do not present
major changes in terms of the time spent on unpaid work (in the case of Mexico, there are
decreases in the time spent on unpaid work.10 Women, on the other hand, by increasing their
time in paid work, reduce the time spent on housework. When children are present, women
with university education spend almost the same amount of time in childcare as women with
secondary education, but reduce the hours spent in housework.
The presence of children in the home appears to accentuate gender differences in total
work, mainly in the cases of Ecuador and Mexico and should, as indicated by Gimenez-Nadal
and Sevilla (2014) and Sevilla et al., (2010), increase the gender gap in total work in less
egalitarian countries. Traditional norms of femininity dominate standards of masculinity in 10 In another context, Giménez-Nadal and Molina (2014), for the Spanish case, show that men who spend less time at work due to unemployment, do not spend any more time helping their spouse with domestic chores and child care, despite having more time available.
15
these two countries. In Ecuador and Mexico, regardless of the presence of children, at the
University level of education we find gender gaps against women, indicating that traditional
social standards, such as those expressed by Hochschild and Machung (1989) and Arkelof
and Kranton (2000), are still prevalent, as in the notion that "If a woman earns more than her
husband, she must commit herself to do more domestic tasks, so that the man does not lose
his identity".
6.2 Results by Country
In addition to considering the importance of social standards in the distribution of the total
work between genders, and how this distribution can vary depending on level of training and
the presence of children in the home, it is necessary to also consider the effects of the factors
specific to each country. These factors could lead to large or small gender differentials in
total work, and could bias the results if overlooked. Thus, we consider variables of income, of
the labour market, and of the marriage market.
In Table 4, we consider, in column 1, GDP per capita of each country. Burda., et al (2013)
show that economic development is associated with gender neutrality in the total work "iso-
work", and is positively correlated with higher levels of per capita GDP. Colombia, in general
terms (see Table 1), is the most egalitarian country in terms of the distribution of total work,
and it is also the country with the greater PIB, which confirms this hypothesis. Column 2 of
Table 4 shows the female unemployment rate of the four countries. Fernandez (2007) argues
that countries with more traditional norms regarding the role of women tend to have a lower
labor force participation rate for women. We note that, in comparison to Ecuador (our
country with the least gender equality), Mexico and Peru have a lower rate of female
unemployment. In the case of Colombia, which has a higher rate of female unemployment,
and is one of the two most egalitarian countries (in terms of the overall division of labour),
there is a smaller share of women in paid work in comparison with other countries.11
(Table 4)
Column 3 of Table 4 shows the proportion of women for every 100 men in all four
countries (sex ratio). This indicator is mainly discussed in the literature of the marriage
11 The male unemployment rate is also higher in Colombia, compared to the other three countries. According to the World Bank for the year 2012, the male unemployment rate for Ecuador was 3.1%, for Mexico, 4.9%, for Peru, 3.3%, and for Columbia, 8.0%.
16
market (see Grossbard and Amuedo-Dorantes, 2007, and Grossbard and Sechtman
1984). Gimenez Nadal et al (2012) argue that a lower proportion of women would make
women more valued, which would imply a greater equity in the distribution of total work. We
can see that this is true in the case of Peru, since it is the country with the lowest proportion
of women, which may be one reason why we do not see major gender differentials in the
distribution of total work (see Tables 1, 3.1 and 3.2). Column 4 of Table 4 shows fertility
rates. Alessina and Giuliano (2007) relate higher fertility rates to traditional families, in
which women are mainly devoted to household tasks, while men spend most of their time in
the labour market. This, in turn, leads to women having a lower level of education. We note
that Ecuador has the highest fertility rate of our four countries, which may be why the
country is characterised by traditional behaviors that are detrimental to women in their
allocation of time.
Finally, column 5 of Table 4 shows gross rates of divorce among countries. Sevilla (2010)
shows that more egalitarian countries as Norway and Sweden have a higher proportion of
individuals in couples, in comparison to less egalitarian countries, such as Japan and
Spain. We note that both Ecuador and Mexico have higher rates of divorce than Peru and
Colombia, coinciding with our rankings of which countries are more egalitarian and which
not. The fact of being in a couple, or not, could also be an influential factor in total work.
7. Econometric analysis and empirical findings
We estimate the regressions of the time dedicated to total work through Ordinary Least
Squares (OLS). Gershuny (2012) argues that OLS models can deliver accurate estimates of
average activity times for samples and subgroups. Frazis and Stewart (2012) also prefer these
models for the analysis of time-allocation decisions, while Foster and Kalenkoski (2013)
discussing the analysis of childcare time, compare OLS and Tobit models, finding that the
qualitative conclusions of the two models are similar.
First, we estimate through OLS:
𝑇𝑖𝑘 = 𝛼 + 𝛽1𝑊𝑜𝑚𝑎𝑛𝑖𝑘 + 𝛽2𝑥𝑖𝑘 + 𝛽3𝑍𝑘 + 𝛽4𝐼𝑘 + 𝜀𝑖𝑘 (1)
where 𝑇𝑖𝑘 is the time spent in total work by the individual, 𝑊𝑜𝑚𝑎𝑛𝑖𝑘 takes value 1 if the
respondent is female, and o otherwise, 𝑥𝑖𝑘 is a vector of variables that includes dummies for
primary education, university education (secondary education as reference), the presence of
children under age 18 in the home, and the number of members of the household, the age and
17
age squared of the respondent, 𝑍𝑘 represents country-specific factors, 𝐼𝑘 represents the
variables of the countries (with Ecuador as reference), and y 𝜀𝑖𝑘 is the error term.
The dummy variable 𝑊𝑜𝑚𝑎𝑛𝑖𝑘 is included to measure gender differences among
countries. 𝛽1 > 0 indicates that women spend more time in total work than do men.
Column 1 of Table 5 shows the results of the estimation of equation 1, without considering
country-specific factors, with male being the reference category. We can see that 𝛽1 is
positive and statistically significant (p < 0.01), indicating that there is a gender gap in total
work that favours women. Columns 2 to 6 of Table 5 consider separately the country factors,
as explained in Table 4. While all variables provide significant values (p < 0.01) against
women, gender gaps are not reduced, remaining at 𝛽1 > 0. Column 7 includes the country-
specific factors and, although 5 variables remain significant (p < 0.01), no changes occur, and
𝛽1 > 0, that is, the gender gaps remain.
(Table 5)
To measure the effect of social standards, we include the variable 𝐸𝐼𝑘 in Equation 1. The
social norms of each country are represented by the egalitarian index 𝐸𝐼𝑘, whose higher
values represent more egalitarian social norms, which leads to:
𝑇𝑖𝑘 = 𝛼 + 𝛽1𝑊𝑜𝑚𝑎𝑛𝑖𝑘 + 𝛽2𝑥𝑖𝑘 + 𝛽3𝑍𝑘 + 𝛽4𝐼𝑘 + 𝛽5𝐸𝐼𝑘 + 𝜀𝑖𝑘 (2)
In Table 6, column 1 (without country factors) and column 2 (with country factors) both
show positive and significant values (p < 0.01) of the variable 𝑊𝑜𝑚𝑎𝑛𝑖𝑘, indicating gender
gaps against women, 𝛽1 > 0. In column 3, the gaps disappear and this variable is no longer
significant. The results in column 3 confirm that the egalitarian index is positive and
significant (p < 0.01). This coefficient, multiplied by the difference between the value of the
most egalitarian country and the least (see Table 2 data on Ecuador and Peru) gives us a
result that could reduce the gender gap against women by up to 1.82 hours per week.
(Table 6)
We now analyze how social norms influence the presence, or not, of children in the home,
for the three levels of education. Column 1 of Table 7 (primary) shows that the variable
𝑊𝑜𝑚𝑎𝑛𝑖𝑘 is significant (p < 0.01) and negative, with 𝛽1 < 0, indicating a gender gap
against men. Some factors that, in part, allow us to explain this circumstance can be seen in
Table 3.1. Gender roles are more defined than in the other two levels of education, in the
sense that men spend more hours per week in paid work to unpaid work, while women spend
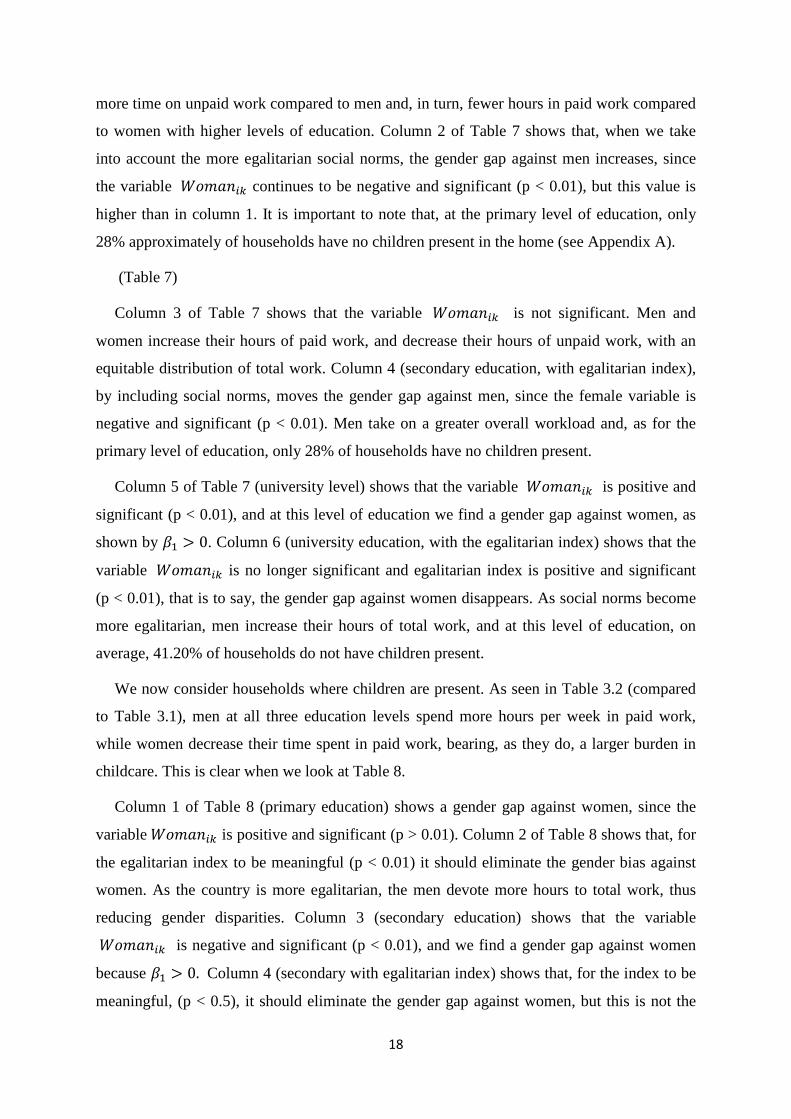
18
more time on unpaid work compared to men and, in turn, fewer hours in paid work compared
to women with higher levels of education. Column 2 of Table 7 shows that, when we take
into account the more egalitarian social norms, the gender gap against men increases, since
the variable 𝑊𝑜𝑚𝑎𝑛𝑖𝑘 continues to be negative and significant (p < 0.01), but this value is
higher than in column 1. It is important to note that, at the primary level of education, only
28% approximately of households have no children present in the home (see Appendix A).
(Table 7)
Column 3 of Table 7 shows that the variable 𝑊𝑜𝑚𝑎𝑛𝑖𝑘 is not significant. Men and
women increase their hours of paid work, and decrease their hours of unpaid work, with an
equitable distribution of total work. Column 4 (secondary education, with egalitarian index),
by including social norms, moves the gender gap against men, since the female variable is
negative and significant (p < 0.01). Men take on a greater overall workload and, as for the
primary level of education, only 28% of households have no children present.
Column 5 of Table 7 (university level) shows that the variable 𝑊𝑜𝑚𝑎𝑛𝑖𝑘 is positive and
significant (p < 0.01), and at this level of education we find a gender gap against women, as
shown by 𝛽1 > 0. Column 6 (university education, with the egalitarian index) shows that the
variable 𝑊𝑜𝑚𝑎𝑛𝑖𝑘 is no longer significant and egalitarian index is positive and significant
(p < 0.01), that is to say, the gender gap against women disappears. As social norms become
more egalitarian, men increase their hours of total work, and at this level of education, on
average, 41.20% of households do not have children present.
We now consider households where children are present. As seen in Table 3.2 (compared
to Table 3.1), men at all three education levels spend more hours per week in paid work,
while women decrease their time spent in paid work, bearing, as they do, a larger burden in
childcare. This is clear when we look at Table 8.
Column 1 of Table 8 (primary education) shows a gender gap against women, since the
variable 𝑊𝑜𝑚𝑎𝑛𝑖𝑘 is positive and significant (p > 0.01). Column 2 of Table 8 shows that, for
the egalitarian index to be meaningful (p < 0.01) it should eliminate the gender bias against
women. As the country is more egalitarian, the men devote more hours to total work, thus
reducing gender disparities. Column 3 (secondary education) shows that the variable
𝑊𝑜𝑚𝑎𝑛𝑖𝑘 is negative and significant (p < 0.01), and we find a gender gap against women
because 𝛽1 > 0. Column 4 (secondary with egalitarian index) shows that, for the index to be
meaningful, (p < 0.5), it should eliminate the gender gap against women, but this is not the
19
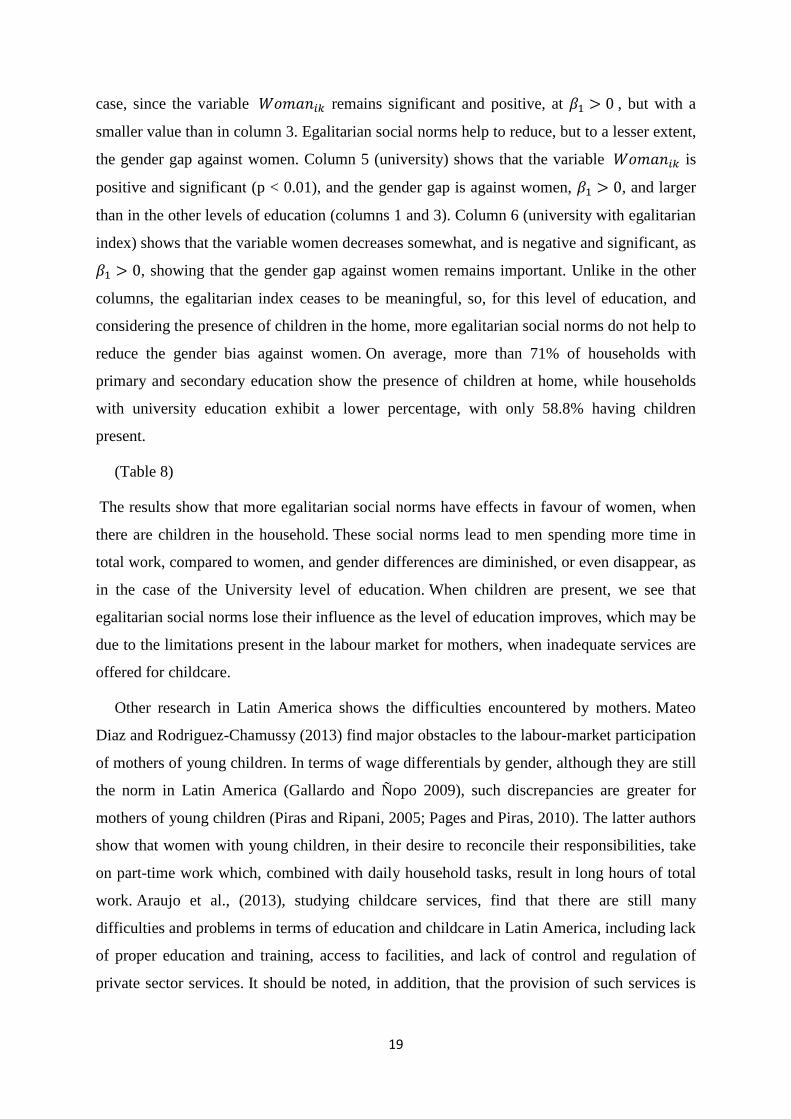
case, since the variable 𝑊𝑜𝑚𝑎𝑛𝑖𝑘 remains significant and positive, at 𝛽1 > 0 , but with a
smaller value than in column 3. Egalitarian social norms help to reduce, but to a lesser extent,
the gender gap against women. Column 5 (university) shows that the variable 𝑊𝑜𝑚𝑎𝑛𝑖𝑘 is
positive and significant (p < 0.01), and the gender gap is against women, 𝛽1 > 0, and larger
than in the other levels of education (columns 1 and 3). Column 6 (university with egalitarian
index) shows that the variable women decreases somewhat, and is negative and significant, as
𝛽1 > 0, showing that the gender gap against women remains important. Unlike in the other
columns, the egalitarian index ceases to be meaningful, so, for this level of education, and
considering the presence of children in the home, more egalitarian social norms do not help to
reduce the gender bias against women. On average, more than 71% of households with
primary and secondary education show the presence of children at home, while households
with university education exhibit a lower percentage, with only 58.8% having children
present.
(Table 8)
The results show that more egalitarian social norms have effects in favour of women, when
there are children in the household. These social norms lead to men spending more time in
total work, compared to women, and gender differences are diminished, or even disappear, as
in the case of the University level of education. When children are present, we see that
egalitarian social norms lose their influence as the level of education improves, which may be
due to the limitations present in the labour market for mothers, when inadequate services are
offered for childcare.
Other research in Latin America shows the difficulties encountered by mothers. Mateo
Diaz and Rodriguez-Chamussy (2013) find major obstacles to the labour-market participation
of mothers of young children. In terms of wage differentials by gender, although they are still
the norm in Latin America (Gallardo and Ñopo 2009), such discrepancies are greater for
mothers of young children (Piras and Ripani, 2005; Pages and Piras, 2010). The latter authors
show that women with young children, in their desire to reconcile their responsibilities, take
on part-time work which, combined with daily household tasks, result in long hours of total
work. Araujo et al., (2013), studying childcare services, find that there are still many
difficulties and problems in terms of education and childcare in Latin America, including lack
of proper education and training, access to facilities, and lack of control and regulation of
private sector services. It should be noted, in addition, that the provision of such services is
20
generally only on a part-time basis, as shown by Berlinski et al (2011) for the case of
Argentina.
The persistence of gender differentials, even for highly-educated women, may be due to
the fact that, having greater human capital, such women must invest most of their time in paid
work (compared to the other two levels of training), since a larger portion of the household
total income may depend on them. Mateo Díaz and Rodriguez-Chamussy (2013) show that,
for the higher income quintiles of income (for our four countries of studies), women
contribute, on average, 43.12% of total household income. Difficulties in the labour market,
inadequate provision of childcare services, and the necessity to provide a significant portion
of household income, are all obstacles in the way of gender equity, that also impose limits on
the effects of egalitarian social norms.
8. Conclusions
In this study, we have analyzed the time-allocation decisions, by men and women in four
Latin-American countries, using time use surveys of Mexico (2009), Peru (2010), Colombia
(2012) and Ecuador (2012). The results indicate that Ecuador and Mexico have greater
gender differences in the distribution of total work. To explain these gender differentials, we
examine the influence of the social norms of each country, by constructing an index from
data contained in the last wave (2010 to 2014) of the World Values Survey WVS). This index
allows us to determine that the more egalitarian of these four countries, Peru and Colombia,
are those that display only minor gender differences in total work. At the same time, our
econometric results confirm that gender differentials are beginning to disappear as countries
become more egalitarian.
From an overview of the four countries, we divide our sample according to three levels of
education (primary, secondary, and University), and as to whether, or not, there are children
present in the household. Our econometric results show that more egalitarian social norms
positively influence women's total work, provided that there are no children present in the
home. When children are present, the egalitarian social norms lose their influence as the level
of education rises. This could be due to the prevailing difficulties in the labour market for
mothers with young children, and the lack of adequate child-care services available for
working mothers, a problem that is more, or less, acute, depending on the country.
21
Our recommendations in terms of public policy are that Governments should encourage
companies to hire more women who have children, by, for example, giving tax credits for
such hires. Additionally, while there has been progress in offering more – and better – child-
care services, Governments can, and should, do more (Araujo et al, 2013).
References
Alvarez, B. and Miles, D. (2003) Gender-effect in housework allocation: evidence from
Spanish two-earner couples, Journal of Population Economics, 16, 227–42.
Aguiar, M. and Hurst, E. (2007) Measuring trends in leisure: the allocation of time over five
decades, Quarterly Journal of Economics, 115, 969–1006.
Aguiar, M. and Hurst, E. (2009) A summary of trends in American time allocation: 1965–
2005, Social Indicators Research, 93, 57–64.
Aguirre, R., and Ferrari, F. (2013). Surveys on time use and unpaid work in Latin America
and the Caribbean: Experience to date and challenges for the future. United Nations
(ECLAC).
Akerlof, George A. and Rachel E. Kranton. (2000). Economics and Identity, Quarterly
Journal of Economics , 115 (3): 715-53.
Alesina A, and Giuliano P (2007) The power of the family. Working Paper 13051. National
Bureau of Economic Research
Araujo, M. C., Lopez Boo, f., and Puyana, J. M. (2013).Overview of early childhood
development services in Latin America and the Caribbean. Inter-American Development
Bank.
Baxter, J. (2002) Patterns of change and stability in the gender division of household labour
in Australia, 1996–1997 Journal of Sociology, 38, 399–424.
Becker GS (1965) A theory of the allocation of time. ECON J 75:493-517
Berlinski S, Galiani S, and McEwan P (2011) and Preschool and nursery school Labor
Market Outcomes: Evidence from a Regression Discontinuity Design. Economic
Development and Cultural Change, 59 (2): 313-344.
Bianchi, S. M. (2000) Maternal employment and time with children: dramatic change or
surprising continuity? Demography, 37, 401–414.
22
Bianchi, Suzanne M., John P. Robinson, and Melissa A. Milkie. (2006) Changing Rhythms
of American Family Life. New York: Russell Sage Foundation.
Bittman, M. (1999) Now that the future has arrived: a retrospective of Gershuny's theory of
social innovation, Social Policy Research Centre, Discussion Paper, no. 110, University of
New South Wales, Kensington.
Burda M, Hamermesh and D Weil P (2007) Total work, gender and social norms. NBER
Working Paper No. 13000
Burda, M., Hamermesh, D. and Weil, P. (2008) The distribution of total work in the US and
EU, in Working Hours and Job Sharing in the EU and USA: Are Americans
Crazy? AreEuropeans Lazy?, Boeri, T., Burda, M. and Kramarz, f. (Eds), Oxford
University Press, Oxford.
Burda, M., Hamermesh, D. and Weil, P. (2013) Total work and gender: facts and possible
explanations, Journal of Population Economics, 26, 239–61.
Brines, J. (1994) Economic dependency, gender, and the division of labor at home, American
Journal of Sociology, 100, 652–88.
Canelas, C., and Salazar, S. (2014). Gender and ethnic inequalities in LAC countries. IZA
Journal of work & Development, 3(1), 18.
Coltrane, S. (2000) Research on household work: modeling and measuring the social
embeddedness of routine familywork, Journal of Marriage and the Family, 62, 1208–33.
Duryea, S., A.C. Edwards and M. Ureta. (2004). "Women in the LAC work Market: The
Remarkable 1990s". In: Piras, Claudia (ed.). Women at Work: Challenges for Latin
America. Washington, D.C.: IDB.
Elster, J. (1989). Social norms and economic theory. The Journal of Economic Perspectives,
99-117.
Fernandez R , Fogli , Olivetti C (2006) Fertility: the role of culture and family experience,
Journal of European Economic Association, 4 (3): 552-561
Fernandez R. (2007) Women, work and culture Journal of European Economic Association ,
5 (2): 305-333
Fernandez R. (2010) Does culture matter? In: J. Benhabib, Bisin A, Jackson M (eds)
Handbook of social economics, vol 1a. Elsevier, Amsterdam, pp 481-510
23
Fleming Robing and Spellerberg Anne, (1999), Using Time Use Data: A History of Time-
Use Surveys and use of Time Use Data. New Zealand: Statistics New Zealand
Folbre, N. (2006). Measuring Care: Gender, Empowerment, and the Care Economy. Journal
of Human Development, 7 (2), 183-200.
Foster, G. and Kalenkoski, C. (2013) and Tobit or OLS? An empirical evaluation under
different diary window lengths, Applied Economics, 45, 2994–3010.
Frazis, H. Stewart, J. (2012) and How to think about time - use data: what inferences can we
make about long-and shortrun time use from time use diaries?, Annals of Economics and
Statistics, 105/106, 231–46.
Gallardo, l., & Ñopo, H. (2009). Ethnic and gender wage gaps in Ecuador (No.
679). Working paper. Inter-American Development Bank, Research Department.
Garcia, I., Molina, J.A. and Montuenga, V. (2010). Intra-family distribution of paid-work
time. Applied Economics, 42, 589-601.
Garcia, I., Molina, J.A. and Montuenga, V. (2011). Gender differences in childcare: time
allocation in five European countries. Feminist Economics, 17 (1), 119-150.
Gershuny, Jonathan. (2000) Changing Times: Work and Leisure in post-industrial
Society. Oxford: Oxford University Press.
Gimenez-Nadal, J. I. Molina, J. A. (2013) and Parents'education as a determinant of
educational childcare time, Journal of Population Economics, 26, 719–49.
Giménez-Nadal, J. I. Molina, J. A. (2014) and Regional unemployment, gender, and time
allocation of the unemployed, Review of the Economics of the Household, 12 (1): 105-127
Gimenez-Nadal, J. I., Molina, J. A., & Sevilla-Sanz, a. (2012).Social norms, partnerships and
children. Review of the Economics of the Household, 10(2), 215-236.
Gimenez-Nadal, J. I. Sevilla, A. (2012) and Trends in time allocation: a cross country
analysis, European Economic Review, 56, 1338–59.
Gimenez-Nadal, J. I., & Sevilla, A. (2014).Total work time in Spain: evidence from time
diary data. Applied Economics, 46(16), 1894-1909.
Giuliano, P (2007) Living arrangements in western Europe: does cultural origin matter?
Journal of European Economic Association 5 (5): 927-952
24
Grossbard, S., & Amuedo-Dorantes, C. (2007).Marriage markets and women's labor force
participation. Review of the Economics of the Household, 5, 249-278.
Grossbard-Sechtman, A. (1984). A theory of the allocation of time in markets for labour and
marriage. Economic Journal, 94, 863-882.
Guryan, J., Hurst, E and Kearney, M. (2008) Parental education and paretal time with
children. Journal of Economic Perspectives, 22, 23-46
Hochschild, Arlie Russell and Anne Machung. (1989) The Second Shift: Working Parents
and the Revolution at Home. New York: Viking.
Kahneman, D and Krueger, A. B. (2006) Developments in the measurement of subjective
well-being, Journal of Economic Perspectives, 20, 3–24.
Kahneman, D., Krueger, A. B.,and Schkade, D. (2004) a survey method for characterizing
daily life experience: the day reconstruction method, Science, 306, 1776–1780.
Katz, l. and Murphy, k. (1992) Changes in relative wages, 1963–1987: supply and demand
factors, Quarterly Journal of Economics, 107, 35–78.
Krueger, A. B. (2007) Are we having more fun yet? Categorizing and evaluating changes in
time allocation, Brooking Papers on Economic Activity, 2, 193–217.
Mateo Diaz, M., and Rodriguez Chamussy, l. (2013). Childcare and Women's work
Participation: Evidence for Latin America and the Caribbean. Inter-American
Development Bank.
Molina, J.A. and Montuenga, V. (2009). The motherhood wage penalty in Spain, Journal of
Family and Economic Issues, 20, 237-251.
Pages, C., and Piras, C. (2010). The Gender Dividend: Capitalizing on Women's Work. Inter-
American Development Bank.
Piras, C, and Ripani L. (2005). "The Effects of Motherhood on Wages and Labor Force
Participation: Evidence from Bolivia, Brazil, Ecuador and Peru." Sustainable
Development Department Technical Papers Series. WID-109
Sevilla, A. (2010) Household division of labor and cross-country differences in household
formation rates, Journal of Population Economics, 23, 225–49.
Sevilla, A. Giménez-Nadal, J. I. and Fernandez, C. (2010) Gender roles and the division of
unpaid work in Spanish households, Feminist Economics, 16, 137–84.
25
Stuart, S. (2014). Situation of unpaid work and gender in the Caribbean: The measurement of
unpaid work through time - use studies. United Nations (ECLAC).
26
Table 1 Time devoted to paid work, unpaid work, childcare and total work, by gender, for Ecuador, Mexico, Peru and Colombia.
Men Women Hours per week Mean SD Mean SD Difference P-value Paid work Ecuador 48.57 (15.94) 2259 (24.50) 25.99 (0.000) Mexico 49.68 (21.84) 21.49 (25.54) 28.19 (0.000) Peru 50.93 (18.67) 24.72 (23.66) 26.21 (0.000) Colombia
46.91 (32.01) 20.05 (29.35) 26.86 (0.000)
Unpaid work Ecuador 9.13 (9.88) 37.54 (19,13) -28.41 (0.000) Mexico 10.76 (10.61) 38.91 (20.04) -28.15 (0.000) Peru 13.35 (9.74) 37.69 (15.91) -24.34 (0.000) Colombia
8.43 (12.63) 31.61 (19.80) -23.18 (0.000)
Childcare Ecuador 1.51 (3.42) 6.43 (8.21) -4.92 (0.000) Mexico 1.40 (3.23) 5.13 (7.95) -3.74 (0.000) Peru 1.96 (3.06) 5.48 (7.66) -3.53 (0.000) Colombia 1.65 (4.51) 4.88 (8.60) -3.22 (0.000) Total Work Ecuador 59.22 (18.33) 66.56 (29.15) -7.34 (0.000) Mexico 61.84 (23.03) 65.54 (27.35) -3.70 (0.000) Peru 66.23 (17.93) 67.89 (19.86) -1.66 (0.002) Colombia
56.99
(29.97)
56.53
(26.89) 0.46 (0.026)
Observations 62111 73589 Note: The sample is restricted to individuals between 21 and 65, who are not students and are not retired. Paid work, unpaid work, total work and childcare, are measured in hours per week. See Tables B1 to B4 for definitions of activities. Difference between genders, calculated as the time devoted to paid work, unpaid work, childcare and total work by men less time spent by women in these activities. P-value for the differences in parentheses. Demographic weights by Katz and Murphy (1992), Ecuador considered as reference country. Standard deviations in parentheses
27
Table 2. Egalitarian Index. Country Egalitarian
Index Attitudes
1 Attitudes
2 Attitudes
3 Attitudes
4 Attitudes
5
Ecuador 2.82 (0.67)
2.18 (0.98)
2.91 (0.97)
3.03 (0.92)
3.02 (0.92)
2.25 (1.06)
Mexico 2.86 (0.56)
2.55 (0.85)
2.94 (0.78)
2.96 (0.81)
3.01 (0.72)
2.32 (0.96)
Peru 2.97 (0.54)
2.66 (0.80)
3.07 (0.80)
3.12 (0.77)
3.12 (0.72)
2.31 (0.89)
Colombia 2.95 (0.52)
2.62 (0.87)
2.93 (0.82)
3.22 (0.71)
3.03 (0.80)
2.41 (0.89)
Mean Observations
2.89 (0.58) 4292
2.51 (0.89) 4292
2.96 (0.84) 4292
3.07 (0.81) 4292
3.04 (0.81) 4292
2.33 (0.96) 4292
Note: The sample is restricted to individuals between 21 and 65, who are not students and not retired. Higher values indicate more egalitarian social norms. Attitudes of 1 to 5, representing the percentage of individuals who: strongly agree, agree, disagree and strongly disagree with the assertions raised by the following questions: (1) When a mother works for pay, the children suffer (2) On the whole, men make better political leaders than women do (3) A university education is more important for a boy than for a girl (4)On the whole men make better business executives than women (5) Being a housewife is just as fulfilling as working for pay. Standard deviations in parentheses.
28
Table 3.1 Differences by gender, considering education levels, in time devoted to paid work, unpaid work and total work for Ecuador, Mexico, Panama, Peru and Colombia, without the presence of minors in the household.
Paid work Unpaid work Total Work Observations Men Women Diff P-Value Men Women Diff P-Value Men Women Diff P-Value Men Women Ecuador Primary Education
45.86 (17.03)
20.97 (23.89)
24.89 (0.0000) 12.26 (11.37)
37.88 (19.53)
-25.62 (0.0000) 58.12 (19.32)
58.86 (29.10)
-0.73 (0.3650) 1876 1854
Secondary Education
48.36 (17.71)
27.62 (25.13)
20.73 (0.0000) 10.77 (10.66)
32.49 (19.43)
-21.71 (0.0000) 59.14 (2035)
60.12 (26.74)
-0.98 (0.5126) 549 443
University Education
46.32 (14.71)
37,38 (21.00)
8.94 (0.0000) 11.12 (9.97)
26.09 (17.33)
-14.96 (0.0000) 57.45 (17.44)
63.47 (23.64)
-6.02 (0.0000) 539 492
Total 2964 2789 Mexico Primary Education
45.71 (23.52)
17.12 (24.80)
28.59 (0.0000) 11.89 (1155)
38.13 (19.71)
-26.24 (0.0000) 57.60 (24.64)
55.25 (27.25)
2.36 (0.0009) 2612 2728
Secondary Education
49.95 (21.26)
31.94 (26.01)
18.01 (0.0000) 12.49 (10.80)
30.46 (17.61)
-17.96 (0.0000) 62.44 (2255)
62.39 (25.78)
0.05 (0.9707) 577 649
University Education
48.07 (20.63)
35.90 (23.12)
12.17 (0.0000) 11.96 (10.88)
26.16 (17.34)
-14.20 (0.0000) 60.03 (22.27)
62.06 (23.50)
-2.03 (0.0434) 1125 963
Total 4314 4340 Peru Primary Education
48.64 (19.72)
25.13 (24.07)
23.52 (0.0000) 16.32 (11.02)
40.30 (15.84)
-23.40 (0.0000) 64.97 (21.39)
65.43 (20.59)
-0.46 (0.7508) 390 442
Secondary Education
51.83 (19.45)
30.18 (26.28)
21.65 (0.0000) 13.06 (9.23)
34.84 (17.35)
-21.77 (0.0000) 64.89 (19.04)
65.02 (20.81)
-0.12 (0.9492) 268 165
University Education
49.22 (21.46)
36.62 (2325)
12.59 (0.0000) 13.39 (8.72)
26.58 (15.02)
-13.18 (0.0000) 62.61 (19.90)
63.20 (19.49)
-0.59 (0.7371) 278 231
Total 936 838 Colombia Primary Education
43.68 (32.04)
16.84 (27.78)
26.84 (0.0000) 10.26 (13.75)
32.66 (19.82)
-2240 (0.0000) 53.94 (30.53)
49.50 (26.23)
4.44 (0.0000) 6083 6060
Secondary Education
44.45 (33.08)
25.85 (31.99)
18.60 (0.0000) 8.79 (12.76)
26.60 (20.09)
-17.80 (0.0000) 53.24 (31.09)
52.45 (28.35)
0.79 (0.3196) 3144 2569
University Education Total
39.72 (32.53)
30.30 (31.82)
9.42 (0.0000) 9.80 (13.02)
19.71 (18.57)
-9.91 (0.0000) 49.52 (30.77)
50.01 (29.02)
-0.49 (0.4424) 4138
13365
4563
13192 Note: The sample is restricted to individuals between 21 and 65, who are not students and not retired. Paid work, unpaid work, and total work, are measured in hours per week by education levels. See Tables B1 to B4 to the definitions of activities Difference between genders, calculated as the time devoted to paid work, unpaid work, and total work by men less time spent by women in these activities, considering education level. Primary education is equivalent to less than a high school degree, secondary education is equivalent to high school degree and university education is equivalent to more than a high school degree. P-value for the differences in parentheses. Demographic weights by Katz and Murphy (1992), Ecuador considered as reference country. Standard deviations in parentheses
29
Table 3.2 Differences by gender considering education levels in time devoted to paid work, unpaid work, childcare, and total work for Ecuador, Mexico, Panama, Peru and Colombia, with the presence of minors in the household.
Paid work Unpaid work Childcare Total Work Observations
Men Women Diff P-Value Men Women Diff P-Value Men Women Diff P-Value Men Women Diff P-Value Men Women Ecuador Primary Education
49.07 (15.66)
19.73 (24.25)
29.34 (0.0000) 8.08 (9.22)
40.06 (18.99)
-31.98 (0.0000) 1.78 (3.56)
7.84 (8.28)
-6.06 (0.0000) 58.94 (17.92)
67.63 (29.80)
-8.69 (0.0000) 5205 6643
Secundary Education
51.19 (15.84)
22.13 (24.95)
29.06 (0.0000) 7.43 (8.73)
36.45 (18.27)
-29.02 (0.0000) 2.53 (4.24)
9.41 (8.82)
-6.89 (0.0000) 61.14 (18.36)
67.99 (28.65)
-6.86 (0.0000) 1599 1925
University Education
48.24 (14.16)
33.51 (21.63)
14.72 (0.0000) 9.43 (9.75)
31.40 (17.55)
-21.97 (0.0000) 2.96 (4.53)
8.75 (8.63)
-5.80 (0.0000) 60.62 (17.44)
73.67 (26.31)
-13.05 (0.0000) 1003 1217
Total 7807 9785 México Primary Education
50.00 (22.13)
17.59 (24.89)
32.41 (0.0000) 9.90 (10.41)
42.24 (20.04)
-32.34 (0.0000) 1.66 (3.41)
6.15 (8.23)
-4.48 (0.0000) 61.57 (23.11)
65.99 (27.26)
-4.42 (0.0000) 6348 7987
Secundary Education
53.25 (20.45)
26.35 (26.08)
26.90 (0.0000) 11.05 (10.57)
37.38 (18.99)
-26.33 (0.0000) 2.46 (4.13)
7.80 (8.83)
-5.34 (0.0000) 66.76 (21.91)
71.52 (26.83)
-4.77 (0.0000) 1154 1614
University Education
50.80 (18.59)
32.11 (22.32)
18.69 (0.0000) 10.88 (9.00)
32.74 (19.13)
-21.86 (0.0000) 2.59 (4.04)
7.44 (8.86)
-4.83 (0.0000) 64.29 (19.80)
72.29 (25.77)
-8.00 (0.0000) 1367 1368
Total 8869 10969 Perú Primary Education
50.62 (17.98)
22.27 (22.37)
28.35 (0.0000) 13.33 (9.81)
40.31 (15.28)
-26.98 (0.0000) 2.47 (3.11)
6.47 (7.80)
-3.98 (0.0000) 66.43 (16.41)
69.04 (19.62)
-2.62 (0.0002) 1163 1674
Secundary Education
54.21 (17.46)
25.87 (25.48)
28.34 (0.0000) 11.22 (8.63)
34.30 (15.31)
-23.08 (0.0000) 2.92 (3.52)
8.23 (8.24)
-5.30 (0.0000) 68.36 (16.77)
68.41 (19.59)
-0.05 (0.9610) 796 731
University Education
51.60 (19.75)
28.89 (23.73)
22.70 (0.0000) 11.42 (7.89)
30.25 (14.68)
-18.82 (0.0000) 3.37 (3.77)
8.20 (8.48)
-4.83 (0.0000) 66.39 (18.83)
67.35 (19.70)
-0.96 (0.4091) 543 564
Total 2502 2969 Colombia Primary Education
48.68 (31.35)
16.76 (27.63)
31.92 (0.0000) 7.71 (12.24)
34.59 (19.21)
-26.88 (0.0000) 1.98 (4.69)
5.83 (8.87)
-3.85 (0.0000) 58.37 (29.28)
57.17 (25.87)
1.19 (0.0006) 11311 13790
Secundary Education
49.47 (32.62)
24.10 (30.93)
25.36 (0.0000) 7.51 (11.83)
29.57 (19.54)
-22.06 (0.0000) 2.67 (5.60)
7.39 (10.12)
-4.72 (0.0000) 59.64 (30.04)
61.07 (27.37)
-1.42 (0.0044) 5678 7753
University Education Total
45.14 (32.24)
30.26 (31.62)
14.88 (0.0000) 9.14 (12.90)
23.57 (18.98)
-14.42 (0.0000) 3.31 (6.46)
6.77 (9.99)
-3.45 (0.0000) 57.59 (29.90)
60.59 (28.38)
-3.00 (0.0000) 4368
21357
7164
28707 Note: The sample is restricted to individuals between 21 and 65, who are not students and not retired. Paid work, unpaid work, total work and childcare, are measured in hours per week by education levels. See Tables B1 to B4 for definitions of activities Difference between gender, calculated as the time devoted to paid work, unpaid work, childcare and total work by men less time spent by women in these activities considering education level. Primary education is equivalent to less than a high school degree, secondary education is equivalent to high school degree and university education is equivalent to more than a high school degree. P-value for the differences in parentheses. Demographic weights by Katz and Murphy (1992), Ecuador considered as reference country. Standard deviations in parentheses
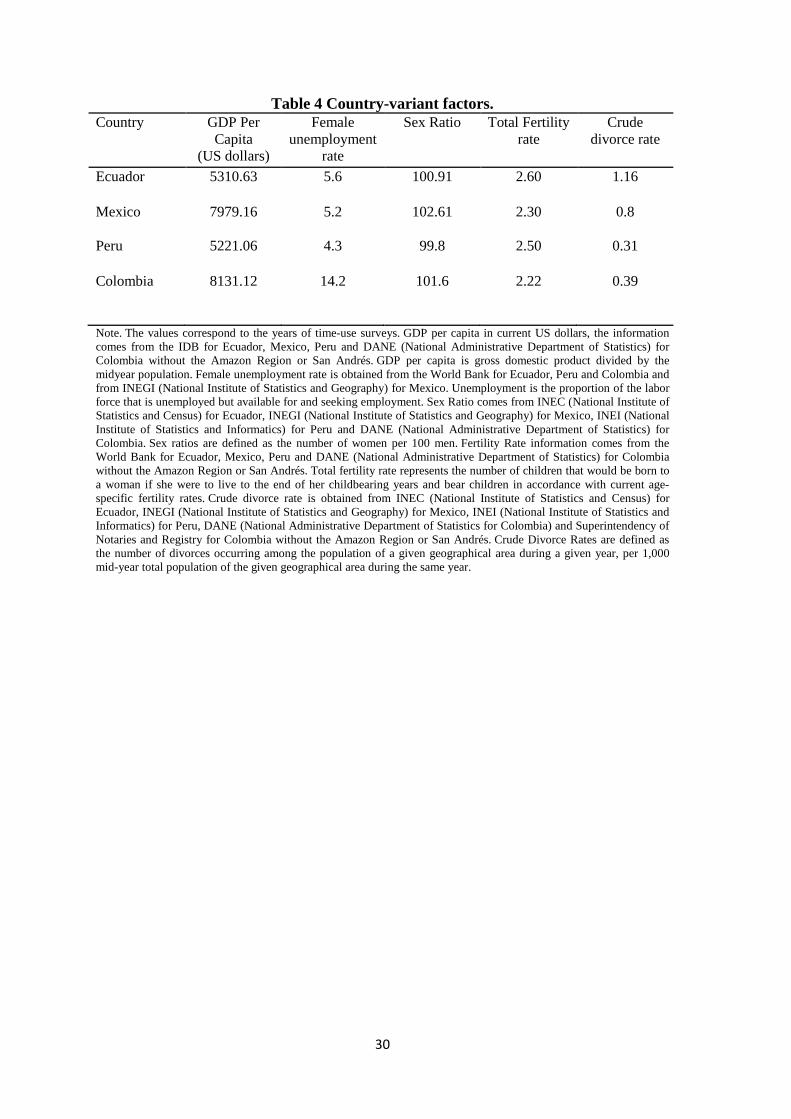
30
Table 4 Country-variant factors. Country GDP Per
Capita (US dollars)
Female unemployment
rate
Sex Ratio Total Fertility rate
Crude divorce rate
Ecuador
5310.63 5.6 100.91 2.60 1.16
Mexico
7979.16 5.2 102.61 2.30 0.8
Peru
5221.06 4.3 99.8 2.50 0.31
Colombia
8131.12 14.2 101.6 2.22 0.39
Note. The values correspond to the years of time-use surveys. GDP per capita in current US dollars, the information comes from the IDB for Ecuador, Mexico, Peru and DANE (National Administrative Department of Statistics) for Colombia without the Amazon Region or San Andrés. GDP per capita is gross domestic product divided by the midyear population. Female unemployment rate is obtained from the World Bank for Ecuador, Peru and Colombia and from INEGI (National Institute of Statistics and Geography) for Mexico. Unemployment is the proportion of the labor force that is unemployed but available for and seeking employment. Sex Ratio comes from INEC (National Institute of Statistics and Census) for Ecuador, INEGI (National Institute of Statistics and Geography) for Mexico, INEI (National Institute of Statistics and Informatics) for Peru and DANE (National Administrative Department of Statistics) for Colombia. Sex ratios are defined as the number of women per 100 men. Fertility Rate information comes from the World Bank for Ecuador, Mexico, Peru and DANE (National Administrative Department of Statistics) for Colombia without the Amazon Region or San Andrés. Total fertility rate represents the number of children that would be born to a woman if she were to live to the end of her childbearing years and bear children in accordance with current age-specific fertility rates. Crude divorce rate is obtained from INEC (National Institute of Statistics and Census) for Ecuador, INEGI (National Institute of Statistics and Geography) for Mexico, INEI (National Institute of Statistics and Informatics) for Peru, DANE (National Administrative Department of Statistics for Colombia) and Superintendency of Notaries and Registry for Colombia without the Amazon Region or San Andrés. Crude Divorce Rates are defined as the number of divorces occurring among the population of a given geographical area during a given year, per 1,000 mid-year total population of the given geographical area during the same year.
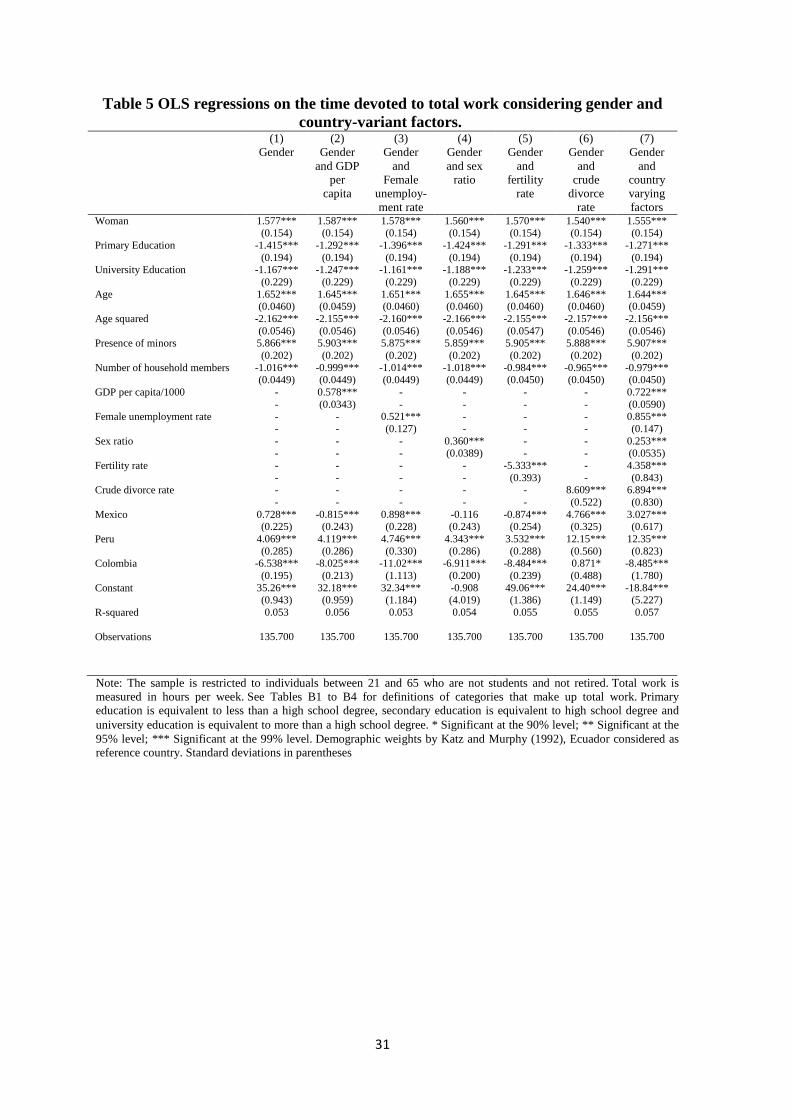
31
Table 5 OLS regressions on the time devoted to total work considering gender and country-variant factors.
(1) Gender
(2) Gender
and GDP per
capita
(3) Gender
and Female
unemploy- ment rate
(4) Gender and sex
ratio
(5) Gender
and fertility
rate
(6) Gender
and crude
divorce rate
(7) Gender
and country varying factors
Woman Primary Education University Education Age Age squared Presence of minors Number of household members GDP per capita/1000 Female unemployment rate Sex ratio Fertility rate Crude divorce rate Mexico Peru Colombia Constant R-squared Observations
1.577*** (0.154)
-1.415*** (0.194)
-1.167*** (0.229)
1.652*** (0.0460)
-2.162*** (0.0546) 5.866*** (0.202)
-1.016*** (0.0449)
- - - - - - - - - -
0.728*** (0.225)
4.069*** (0.285)
-6.538*** (0.195)
35.26*** (0.943) 0.053
135.700
1.587*** (0.154)
-1.292*** (0.194)
-1.247*** (0.229)
1.645*** (0.0459)
-2.155*** (0.0546) 5.903*** (0.202)
-0.999*** (0.0449) 0.578*** (0.0343)
- - - - - - - -
-0.815*** (0.243)
4.119*** (0.286)
-8.025*** (0.213)
32.18*** (0.959) 0.056
135.700
1.578*** (0.154)
-1.396*** (0.194)
-1.161*** (0.229)
1.651*** (0.0460)
-2.160*** (0.0546) 5.875*** (0.202)
-1.014*** (0.0449)
- -
0.521*** (0.127)
- - - - - -
0.898*** (0.228)
4.746*** (0.330)
-11.02*** (1.113)
32.34*** (1.184) 0.053
135.700
1.560*** (0.154)
-1.424*** (0.194)
-1.188*** (0.229)
1.655*** (0.0460)
-2.166*** (0.0546) 5.859*** (0.202)
-1.018*** (0.0449)
- - - -
0.360*** (0.0389)
- - - -
-0.116 (0.243)
4.343*** (0.286)
-6.911*** (0.200) -0.908 (4.019) 0.054
135.700
1.570*** (0.154)
-1.291*** (0.194)
-1.233*** (0.229)
1.645*** (0.0460)
-2.155*** (0.0547) 5.905*** (0.202)
-0.984*** (0.0450)
- - - - - -
-5.333*** (0.393)
- -
-0.874*** (0.254)
3.532*** (0.288)
-8.484*** (0.239)
49.06*** (1.386) 0.055
135.700
1.540*** (0.154)
-1.333*** (0.194)
-1.259*** (0.229)
1.646*** (0.0460)
-2.157*** (0.0546) 5.888*** (0.202)
-0.965*** (0.0450)
- - - - - - - -
8.609*** (0.522)
4.766*** (0.325)
12.15*** (0.560) 0.871* (0.488)
24.40*** (1.149) 0.055
135.700
1.555*** (0.154)
-1.271*** (0.194)
-1.291*** (0.229)
1.644*** (0.0459)
-2.156*** (0.0546) 5.907*** (0.202)
-0.979*** (0.0450) 0.722*** (0.0590) 0.855*** (0.147)
0.253*** (0.0535) 4.358*** (0.843)
6.894*** (0.830)
3.027*** (0.617)
12.35*** (0.823)
-8.485*** (1.780)
-18.84*** (5.227) 0.057
135.700
Note: The sample is restricted to individuals between 21 and 65 who are not students and not retired. Total work is measured in hours per week. See Tables B1 to B4 for definitions of categories that make up total work. Primary education is equivalent to less than a high school degree, secondary education is equivalent to high school degree and university education is equivalent to more than a high school degree. * Significant at the 90% level; ** Significant at the 95% level; *** Significant at the 99% level. Demographic weights by Katz and Murphy (1992), Ecuador considered as reference country. Standard deviations in parentheses
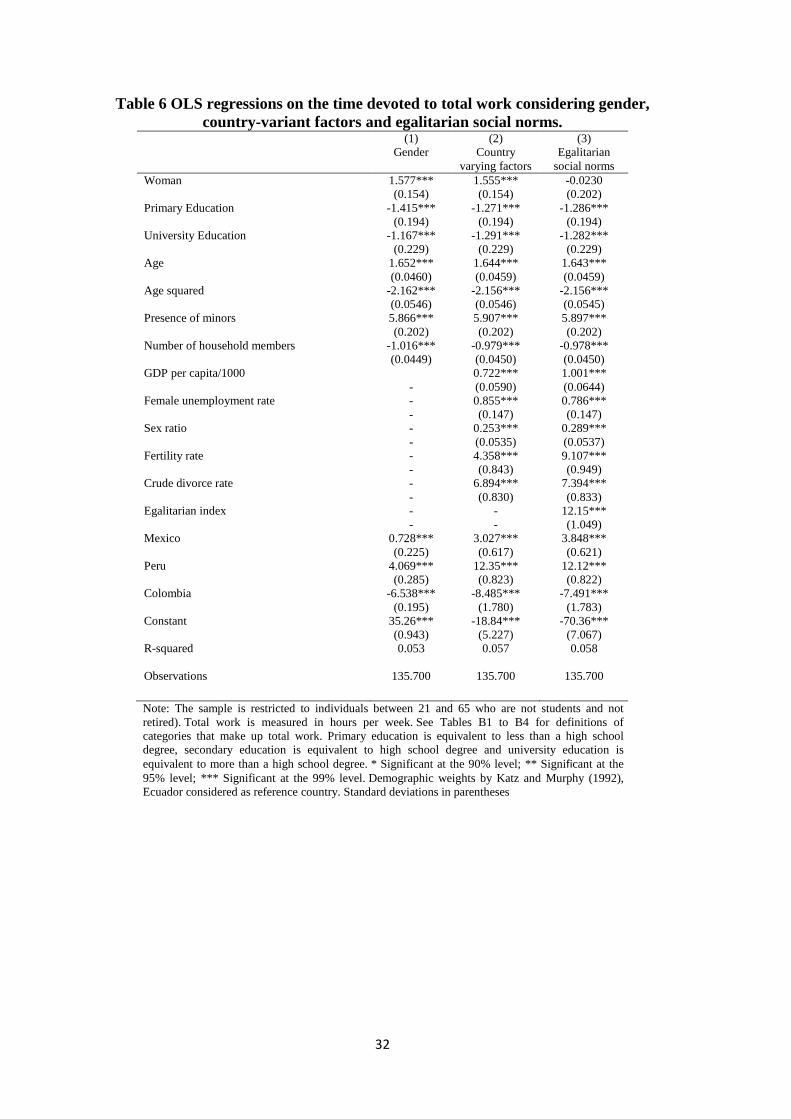
32
Table 6 OLS regressions on the time devoted to total work considering gender, country-variant factors and egalitarian social norms.
(1) Gender
(2) Country
varying factors
(3) Egalitarian
social norms Woman Primary Education University Education Age Age squared Presence of minors Number of household members GDP per capita/1000 Female unemployment rate Sex ratio Fertility rate Crude divorce rate Egalitarian index Mexico Peru Colombia Constant R-squared Observations
1.577*** (0.154)
-1.415*** (0.194)
-1.167*** (0.229)
1.652*** (0.0460)
-2.162*** (0.0546) 5.866*** (0.202)
-1.016*** (0.0449)
- - - - - - - - - - -
0.728*** (0.225)
4.069*** (0.285)
-6.538*** (0.195)
35.26*** (0.943) 0.053
135.700
1.555*** (0.154)
-1.271*** (0.194)
-1.291*** (0.229)
1.644*** (0.0459)
-2.156*** (0.0546) 5.907*** (0.202)
-0.979*** (0.0450) 0.722*** (0.0590) 0.855*** (0.147)
0.253*** (0.0535) 4.358*** (0.843)
6.894*** (0.830)
- -
3.027*** (0.617)
12.35*** (0.823)
-8.485*** (1.780)
-18.84*** (5.227) 0.057
135.700
-0.0230 (0.202)
-1.286*** (0.194)
-1.282*** (0.229)
1.643*** (0.0459)
-2.156*** (0.0545) 5.897*** (0.202)
-0.978*** (0.0450) 1.001*** (0.0644) 0.786*** (0.147)
0.289*** (0.0537) 9.107*** (0.949)
7.394*** (0.833)
12.15*** (1.049)
3.848*** (0.621)
12.12*** (0.822)
-7.491*** (1.783)
-70.36*** (7.067) 0.058
135.700
Note: The sample is restricted to individuals between 21 and 65 who are not students and not retired). Total work is measured in hours per week. See Tables B1 to B4 for definitions of categories that make up total work. Primary education is equivalent to less than a high school degree, secondary education is equivalent to high school degree and university education is equivalent to more than a high school degree. * Significant at the 90% level; ** Significant at the 95% level; *** Significant at the 99% level. Demographic weights by Katz and Murphy (1992), Ecuador considered as reference country. Standard deviations in parentheses
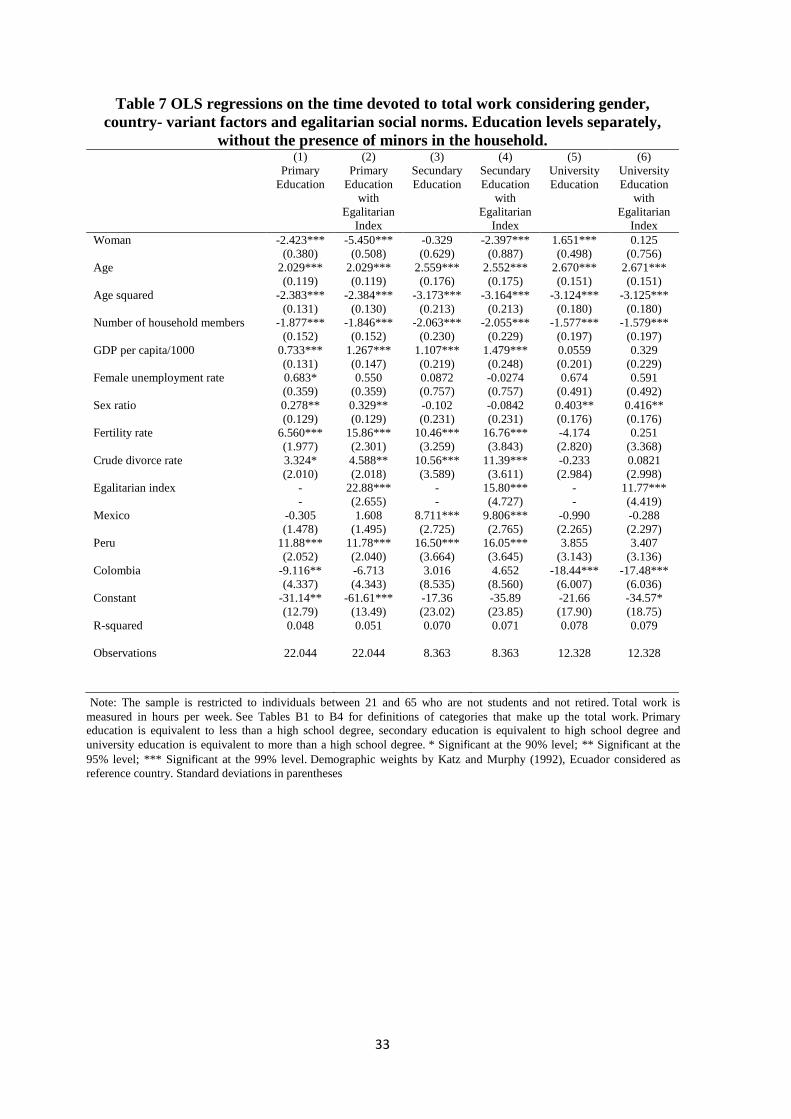
33
Table 7 OLS regressions on the time devoted to total work considering gender, country- variant factors and egalitarian social norms. Education levels separately,
without the presence of minors in the household. (1)
Primary Education
(2) Primary
Education with
Egalitarian Index
(3) Secundary Education
(4) Secundary Education
with Egalitarian
Index
(5) University Education
(6) University Education
with Egalitarian
Index Woman Age Age squared Number of household members GDP per capita/1000 Female unemployment rate Sex ratio Fertility rate Crude divorce rate Egalitarian index Mexico Peru Colombia Constant R-squared Observations
-2.423*** (0.380)
2.029*** (0.119)
-2.383*** (0.131)
-1.877*** (0.152)
0.733*** (0.131) 0.683* (0.359) 0.278** (0.129)
6.560*** (1.977) 3.324* (2.010)
- -
-0.305 (1.478)
11.88*** (2.052)
-9.116** (4.337)
-31.14** (12.79) 0.048
22.044
-5.450*** (0.508)
2.029*** (0.119)
-2.384*** (0.130)
-1.846*** (0.152)
1.267*** (0.147) 0.550
(0.359) 0.329** (0.129)
15.86*** (2.301) 4.588** (2.018)
22.88*** (2.655) 1.608
(1.495) 11.78*** (2.040) -6.713 (4.343)
-61.61*** (13.49) 0.051
22.044
-0.329 (0.629)
2.559*** (0.176)
-3.173*** (0.213)
-2.063*** (0.230)
1.107*** (0.219) 0.0872 (0.757) -0.102 (0.231)
10.46*** (3.259)
10.56*** (3.589)
- -
8.711*** (2.725)
16.50*** (3.664) 3.016
(8.535) -17.36 (23.02) 0.070
8.363
-2.397*** (0.887)
2.552*** (0.175)
-3.164*** (0.213)
-2.055*** (0.229)
1.479*** (0.248) -0.0274 (0.757) -0.0842 (0.231)
16.76*** (3.843)
11.39*** (3.611)
15.80*** (4.727)
9.806*** (2.765)
16.05*** (3.645) 4.652
(8.560) -35.89 (23.85) 0.071
8.363
1.651*** (0.498)
2.670*** (0.151)
-3.124*** (0.180)
-1.577*** (0.197) 0.0559 (0.201) 0.674
(0.491) 0.403** (0.176) -4.174 (2.820) -0.233 (2.984)
- -
-0.990 (2.265) 3.855
(3.143) -18.44***
(6.007) -21.66 (17.90) 0.078
12.328
0.125 (0.756)
2.671*** (0.151)
-3.125*** (0.180)
-1.579*** (0.197) 0.329
(0.229) 0.591
(0.492) 0.416** (0.176) 0.251
(3.368) 0.0821 (2.998)
11.77*** (4.419) -0.288 (2.297) 3.407
(3.136) -17.48***
(6.036) -34.57* (18.75) 0.079
12.328
Note: The sample is restricted to individuals between 21 and 65 who are not students and not retired. Total work is measured in hours per week. See Tables B1 to B4 for definitions of categories that make up the total work. Primary education is equivalent to less than a high school degree, secondary education is equivalent to high school degree and university education is equivalent to more than a high school degree. * Significant at the 90% level; ** Significant at the 95% level; *** Significant at the 99% level. Demographic weights by Katz and Murphy (1992), Ecuador considered as reference country. Standard deviations in parentheses
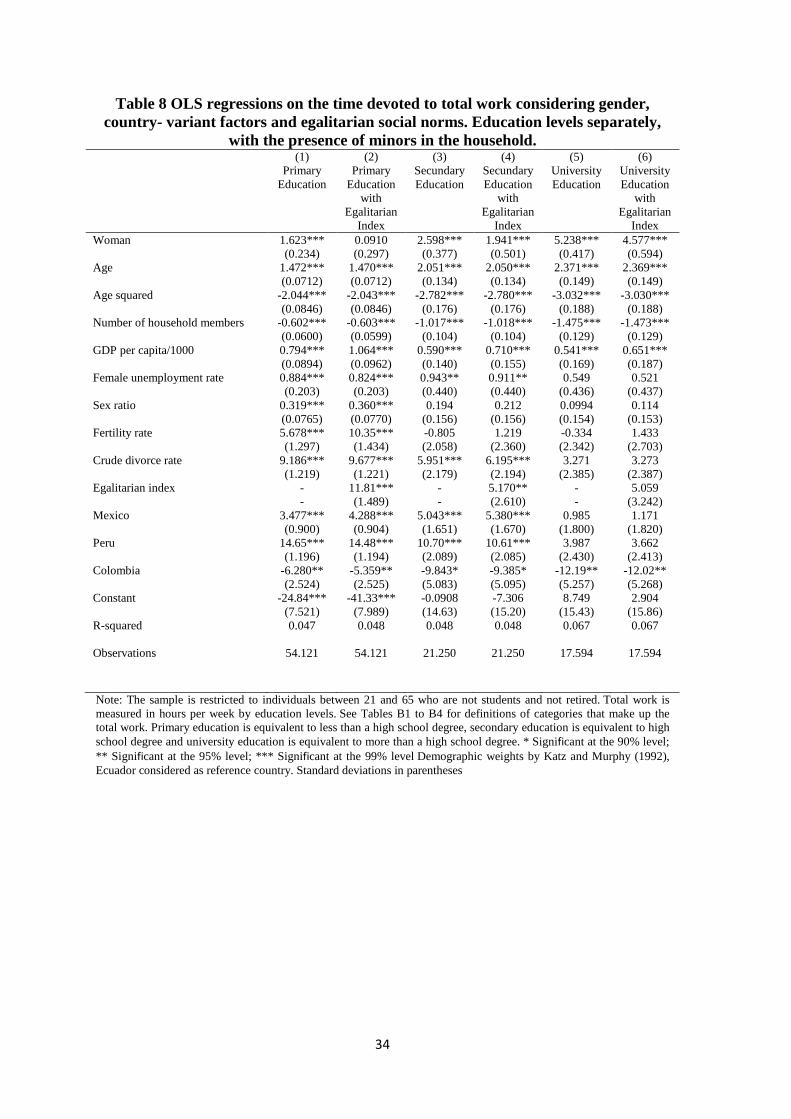
34
Table 8 OLS regressions on the time devoted to total work considering gender, country- variant factors and egalitarian social norms. Education levels separately,
with the presence of minors in the household. (1)
Primary Education
(2) Primary
Education with
Egalitarian Index
(3) Secundary Education
(4) Secundary Education
with Egalitarian
Index
(5) University Education
(6) University Education
with Egalitarian
Index Woman Age Age squared Number of household members GDP per capita/1000 Female unemployment rate Sex ratio Fertility rate Crude divorce rate Egalitarian index Mexico Peru Colombia Constant R-squared Observations
1.623*** (0.234)
1.472*** (0.0712)
-2.044*** (0.0846)
-0.602*** (0.0600) 0.794*** (0.0894) 0.884*** (0.203)
0.319*** (0.0765) 5.678*** (1.297)
9.186*** (1.219)
- -
3.477*** (0.900)
14.65*** (1.196)
-6.280** (2.524)
-24.84*** (7.521) 0.047
54.121
0.0910 (0.297)
1.470*** (0.0712)
-2.043*** (0.0846)
-0.603*** (0.0599) 1.064*** (0.0962) 0.824*** (0.203)
0.360*** (0.0770) 10.35*** (1.434)
9.677*** (1.221)
11.81*** (1.489)
4.288*** (0.904)
14.48*** (1.194)
-5.359** (2.525)
-41.33*** (7.989) 0.048
54.121
2.598*** (0.377)
2.051*** (0.134)
-2.782*** (0.176)
-1.017*** (0.104)
0.590*** (0.140) 0.943** (0.440) 0.194
(0.156) -0.805 (2.058)
5.951*** (2.179)
- -
5.043*** (1.651)
10.70*** (2.089) -9.843* (5.083) -0.0908 (14.63) 0.048
21.250
1.941*** (0.501)
2.050*** (0.134)
-2.780*** (0.176)
-1.018*** (0.104)
0.710*** (0.155) 0.911** (0.440) 0.212
(0.156) 1.219
(2.360) 6.195*** (2.194) 5.170** (2.610)
5.380*** (1.670)
10.61*** (2.085) -9.385* (5.095) -7.306 (15.20) 0.048
21.250
5.238*** (0.417)
2.371*** (0.149)
-3.032*** (0.188)
-1.475*** (0.129)
0.541*** (0.169) 0.549
(0.436) 0.0994 (0.154) -0.334 (2.342) 3.271
(2.385) - -
0.985 (1.800) 3.987
(2.430) -12.19** (5.257) 8.749
(15.43) 0.067
17.594
4.577*** (0.594)
2.369*** (0.149)
-3.030*** (0.188)
-1.473*** (0.129)
0.651*** (0.187) 0.521
(0.437) 0.114
(0.153) 1.433
(2.703) 3.273
(2.387) 5.059
(3.242) 1.171
(1.820) 3.662
(2.413) -12.02** (5.268) 2.904
(15.86) 0.067
17.594
Note: The sample is restricted to individuals between 21 and 65 who are not students and not retired. Total work is measured in hours per week by education levels. See Tables B1 to B4 for definitions of categories that make up the total work. Primary education is equivalent to less than a high school degree, secondary education is equivalent to high school degree and university education is equivalent to more than a high school degree. * Significant at the 90% level; ** Significant at the 95% level; *** Significant at the 99% level Demographic weights by Katz and Murphy (1992), Ecuador considered as reference country. Standard deviations in parentheses
35
Appendix A: Demographic weighting
Based on prior studies of individual time-use, such as Aguiar and Hurst (2007) and
Gimenez-Nadal and Sevilla (2012, 2014), we maintain constant demographic
composition, taking Ecuador as the reference country, for comparison with the three
other countries studied, Mexico, Peru and Colombia. We divide the sample into
demographic cells of five age groups (21-29, 30-39, 40-49, 50-59 and 60-65), three levels
of education (primary, secondary, and university), gender, whether there are children in
the household, and whether the respondent lives in a couple or not. We did not create a
cell for the presence of children with respondents aged 60-65, due to the very limited
presence of children in households of this age group. To calculate the constant weights,
we unify the four surveys into one and calculate the percentage of the population that
would be within each cell population within each survey. Following Katz and Murphy
(1992), we use fixed weights to calculate weighted averages for each activity. As our
analysis is based on gender we compute scaled weights to sum to one by gender. We
compute the percentage of men and women residing in each cell population (based on
age, education, presence of children, and life partner) and these percentages add up to
one for men and women. By having the four surveys unified into one to calculate the
percentage of population within each demographic cell, and using the weights provided
by each survey (based on the reference country) we generate reference periods and each
survey is represented in the same manner in the bulk sample.
Table A1 shows the summary statistics of the demographic variables used to calculate
the constant demographic weight, mainly observed differences in education levels. 28%
of Colombian women and 21% of Peruvian women have an education level above high
school, compared to 15% and 14% of Mexican and Ecuadorian women, respectively. In
the case of Colombia, we also indicate that the proportion of respondents who live with a
partner, and have children in the household, are both smaller than the other three
countries.
It is important to note that there is a greater presence of minors in households with
primary and secondary level education (approximately 71% on average) while in
households whose members have university education levels, that proportion is
approximately 59% on average. Gimenez-Nadal and Sevilla (2012) show that these
differences may determine changes in the distribution of time, a greater presence of
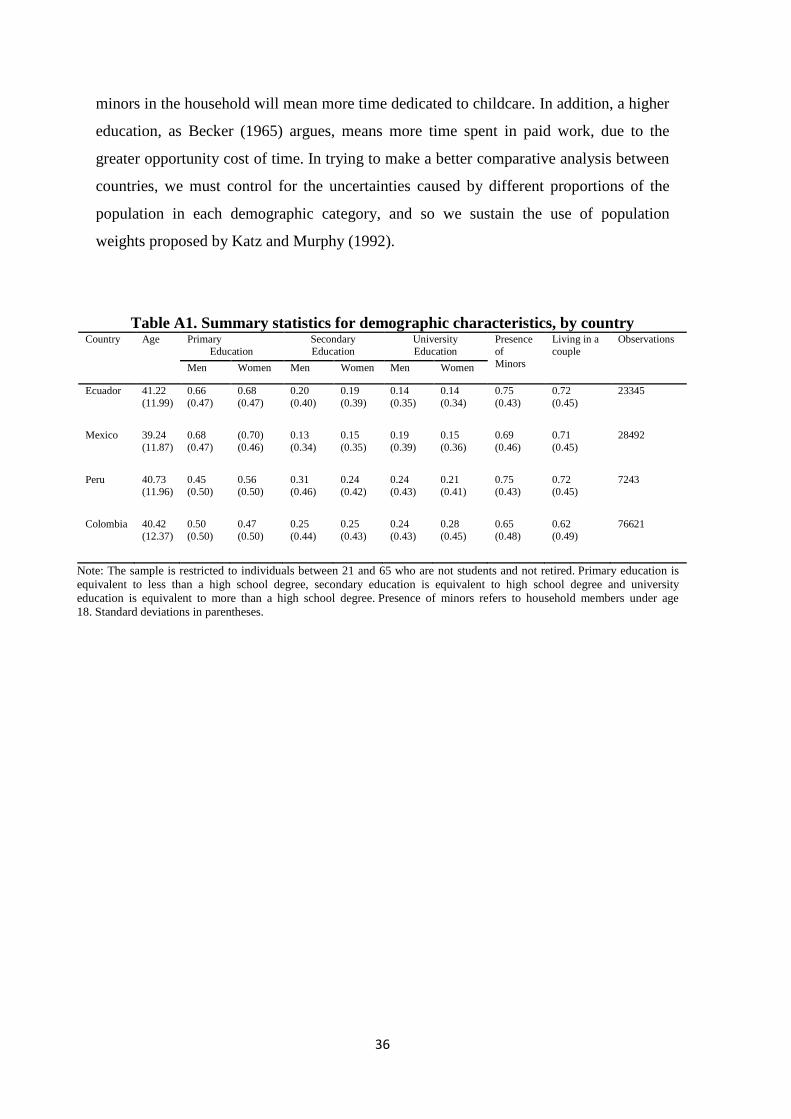
36
minors in the household will mean more time dedicated to childcare. In addition, a higher
education, as Becker (1965) argues, means more time spent in paid work, due to the
greater opportunity cost of time. In trying to make a better comparative analysis between
countries, we must control for the uncertainties caused by different proportions of the
population in each demographic category, and so we sustain the use of population
weights proposed by Katz and Murphy (1992).
Table A1. Summary statistics for demographic characteristics, by country Country Age Primary
Education Secondary Education
University Education
Presence of Minors
Living in a couple
Observations
Men Women Men Women Men Women Ecuador
41.22 (11.99)
0.66 (0.47)
0.68 (0.47)
0.20 (0.40)
0.19 (0.39)
0.14 (0.35)
0.14 (0.34)
0.75 (0.43)
0.72 (0.45)
23345
Mexico
39.24 (11.87)
0.68 (0.47)
(0.70) (0.46)
0.13 (0.34)
0.15 (0.35)
0.19 (0.39)
0.15 (0.36)
0.69 (0.46)
0.71 (0.45)
28492
Peru
40.73 (11.96)
0.45 (0.50)
0.56 (0.50)
0.31 (0.46)
0.24 (0.42)
0.24 (0.43)
0.21 (0.41)
0.75 (0.43)
0.72 (0.45)
7243
Colombia
40.42 (12.37)
0.50 (0.50)
0.47 (0.50)
0.25 (0.44)
0.25 (0.43)
0.24 (0.43)
0.28 (0.45)
0.65 (0.48)
0.62 (0.49)
76621
Note: The sample is restricted to individuals between 21 and 65 who are not students and not retired. Primary education is equivalent to less than a high school degree, secondary education is equivalent to high school degree and university education is equivalent to more than a high school degree. Presence of minors refers to household members under age 18. Standard deviations in parentheses.
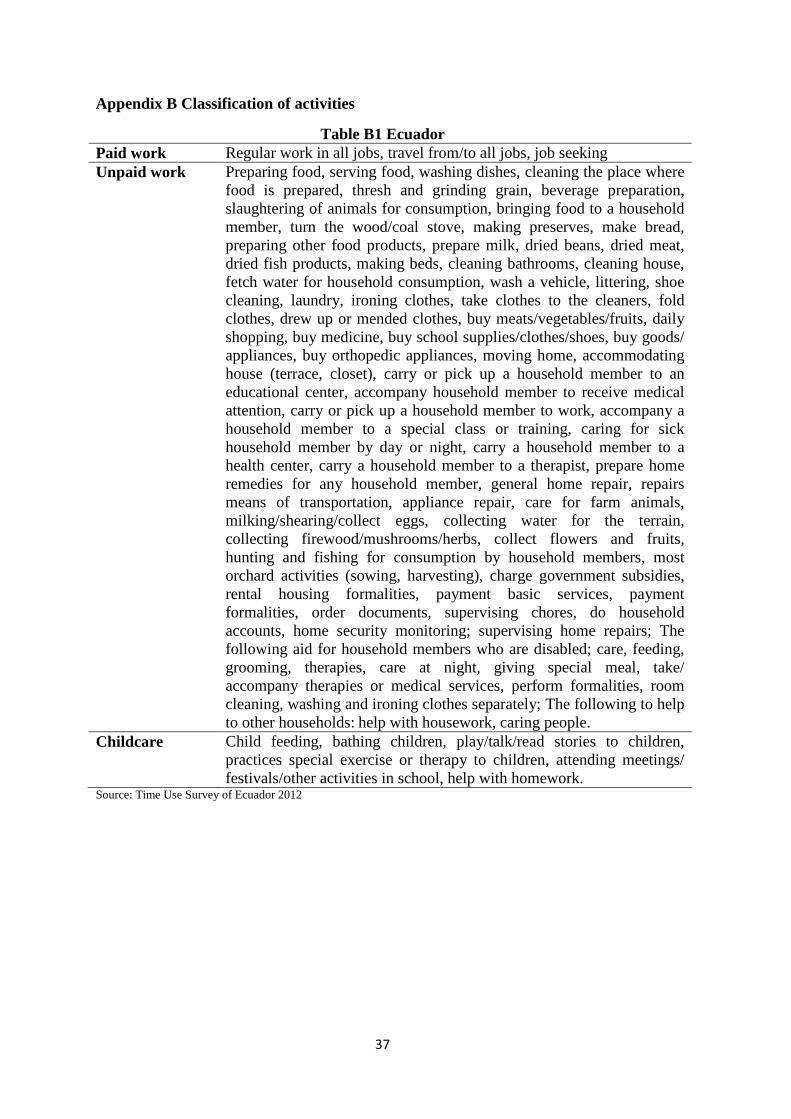
37
Appendix B Classification of activities
Table B1 Ecuador Paid work Regular work in all jobs, travel from/to all jobs, job seeking Unpaid work
Preparing food, serving food, washing dishes, cleaning the place where food is prepared, thresh and grinding grain, beverage preparation, slaughtering of animals for consumption, bringing food to a household member, turn the wood/coal stove, making preserves, make bread, preparing other food products, prepare milk, dried beans, dried meat, dried fish products, making beds, cleaning bathrooms, cleaning house, fetch water for household consumption, wash a vehicle, littering, shoe cleaning, laundry, ironing clothes, take clothes to the cleaners, fold clothes, drew up or mended clothes, buy meats/vegetables/fruits, daily shopping, buy medicine, buy school supplies/clothes/shoes, buy goods/ appliances, buy orthopedic appliances, moving home, accommodating house (terrace, closet), carry or pick up a household member to an educational center, accompany household member to receive medical attention, carry or pick up a household member to work, accompany a household member to a special class or training, caring for sick household member by day or night, carry a household member to a health center, carry a household member to a therapist, prepare home remedies for any household member, general home repair, repairs means of transportation, appliance repair, care for farm animals, milking/shearing/collect eggs, collecting water for the terrain, collecting firewood/mushrooms/herbs, collect flowers and fruits, hunting and fishing for consumption by household members, most orchard activities (sowing, harvesting), charge government subsidies, rental housing formalities, payment basic services, payment formalities, order documents, supervising chores, do household accounts, home security monitoring; supervising home repairs; The following aid for household members who are disabled; care, feeding, grooming, therapies, care at night, giving special meal, take/ accompany therapies or medical services, perform formalities, room cleaning, washing and ironing clothes separately; The following to help to other households: help with housework, caring people.
Childcare
Child feeding, bathing children, play/talk/read stories to children, practices special exercise or therapy to children, attending meetings/ festivals/other activities in school, help with homework.
Source: Time Use Survey of Ecuador 2012
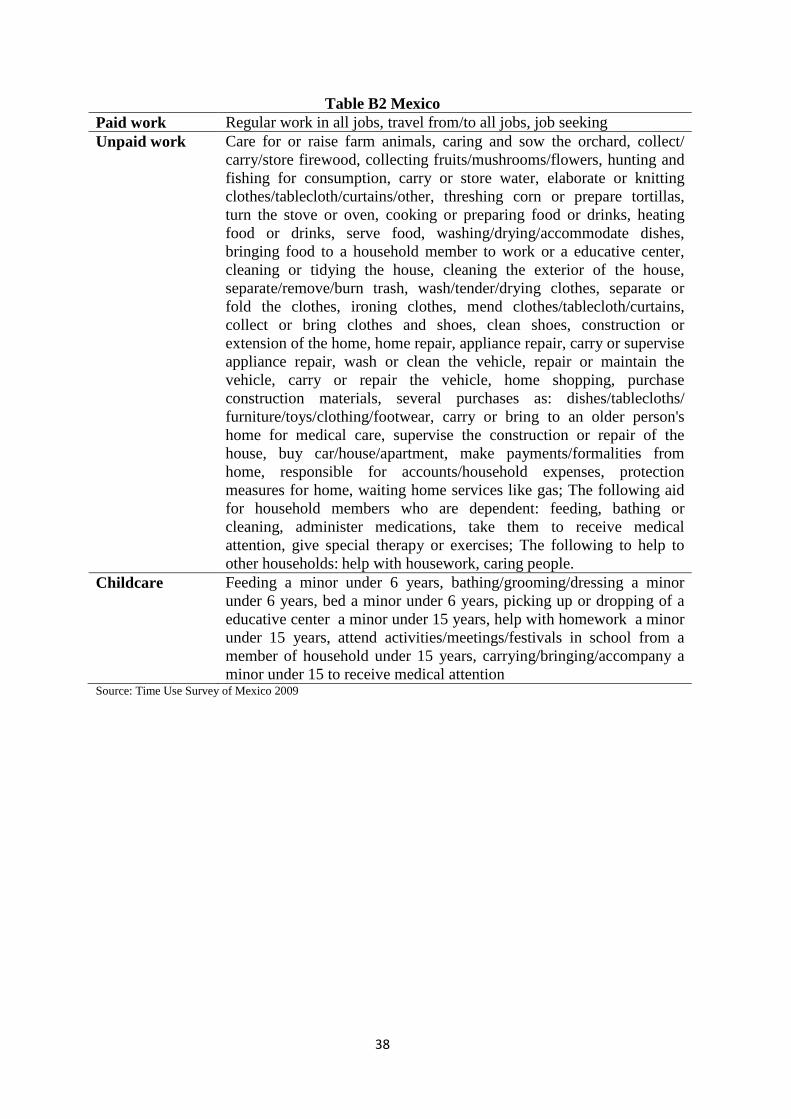
38
Table B2 Mexico Paid work Regular work in all jobs, travel from/to all jobs, job seeking Unpaid work
Care for or raise farm animals, caring and sow the orchard, collect/ carry/store firewood, collecting fruits/mushrooms/flowers, hunting and fishing for consumption, carry or store water, elaborate or knitting clothes/tablecloth/curtains/other, threshing corn or prepare tortillas, turn the stove or oven, cooking or preparing food or drinks, heating food or drinks, serve food, washing/drying/accommodate dishes, bringing food to a household member to work or a educative center, cleaning or tidying the house, cleaning the exterior of the house, separate/remove/burn trash, wash/tender/drying clothes, separate or fold the clothes, ironing clothes, mend clothes/tablecloth/curtains, collect or bring clothes and shoes, clean shoes, construction or extension of the home, home repair, appliance repair, carry or supervise appliance repair, wash or clean the vehicle, repair or maintain the vehicle, carry or repair the vehicle, home shopping, purchase construction materials, several purchases as: dishes/tablecloths/ furniture/toys/clothing/footwear, carry or bring to an older person's home for medical care, supervise the construction or repair of the house, buy car/house/apartment, make payments/formalities from home, responsible for accounts/household expenses, protection measures for home, waiting home services like gas; The following aid for household members who are dependent: feeding, bathing or cleaning, administer medications, take them to receive medical attention, give special therapy or exercises; The following to help to other households: help with housework, caring people.
Childcare
Feeding a minor under 6 years, bathing/grooming/dressing a minor under 6 years, bed a minor under 6 years, picking up or dropping of a educative center a minor under 15 years, help with homework a minor under 15 years, attend activities/meetings/festivals in school from a member of household under 15 years, carrying/bringing/accompany a minor under 15 to receive medical attention
Source: Time Use Survey of Mexico 2009
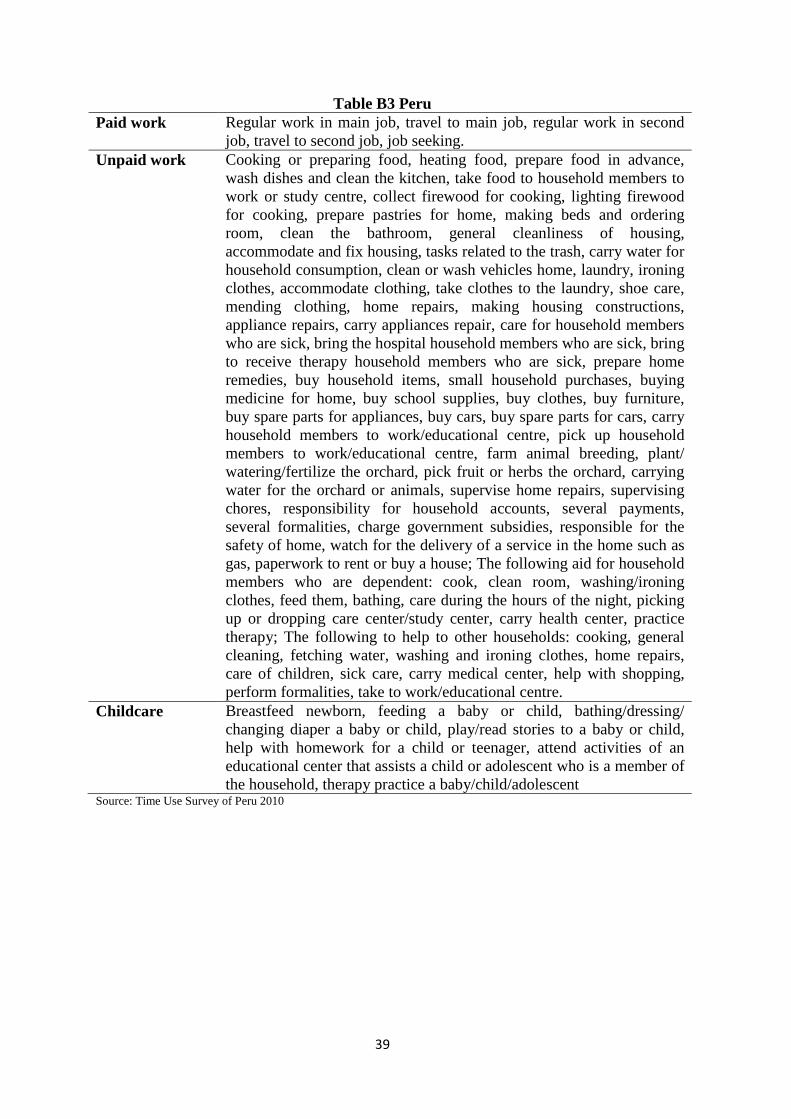
39
Table B3 Peru Paid work
Regular work in main job, travel to main job, regular work in second job, travel to second job, job seeking.
Unpaid work Cooking or preparing food, heating food, prepare food in advance, wash dishes and clean the kitchen, take food to household members to work or study centre, collect firewood for cooking, lighting firewood for cooking, prepare pastries for home, making beds and ordering room, clean the bathroom, general cleanliness of housing, accommodate and fix housing, tasks related to the trash, carry water for household consumption, clean or wash vehicles home, laundry, ironing clothes, accommodate clothing, take clothes to the laundry, shoe care, mending clothing, home repairs, making housing constructions, appliance repairs, carry appliances repair, care for household members who are sick, bring the hospital household members who are sick, bring to receive therapy household members who are sick, prepare home remedies, buy household items, small household purchases, buying medicine for home, buy school supplies, buy clothes, buy furniture, buy spare parts for appliances, buy cars, buy spare parts for cars, carry household members to work/educational centre, pick up household members to work/educational centre, farm animal breeding, plant/ watering/fertilize the orchard, pick fruit or herbs the orchard, carrying water for the orchard or animals, supervise home repairs, supervising chores, responsibility for household accounts, several payments, several formalities, charge government subsidies, responsible for the safety of home, watch for the delivery of a service in the home such as gas, paperwork to rent or buy a house; The following aid for household members who are dependent: cook, clean room, washing/ironing clothes, feed them, bathing, care during the hours of the night, picking up or dropping care center/study center, carry health center, practice therapy; The following to help to other households: cooking, general cleaning, fetching water, washing and ironing clothes, home repairs, care of children, sick care, carry medical center, help with shopping, perform formalities, take to work/educational centre.
Childcare
Breastfeed newborn, feeding a baby or child, bathing/dressing/ changing diaper a baby or child, play/read stories to a baby or child, help with homework for a child or teenager, attend activities of an educational center that assists a child or adolescent who is a member of the household, therapy practice a baby/child/adolescent
Source: Time Use Survey of Peru 2010
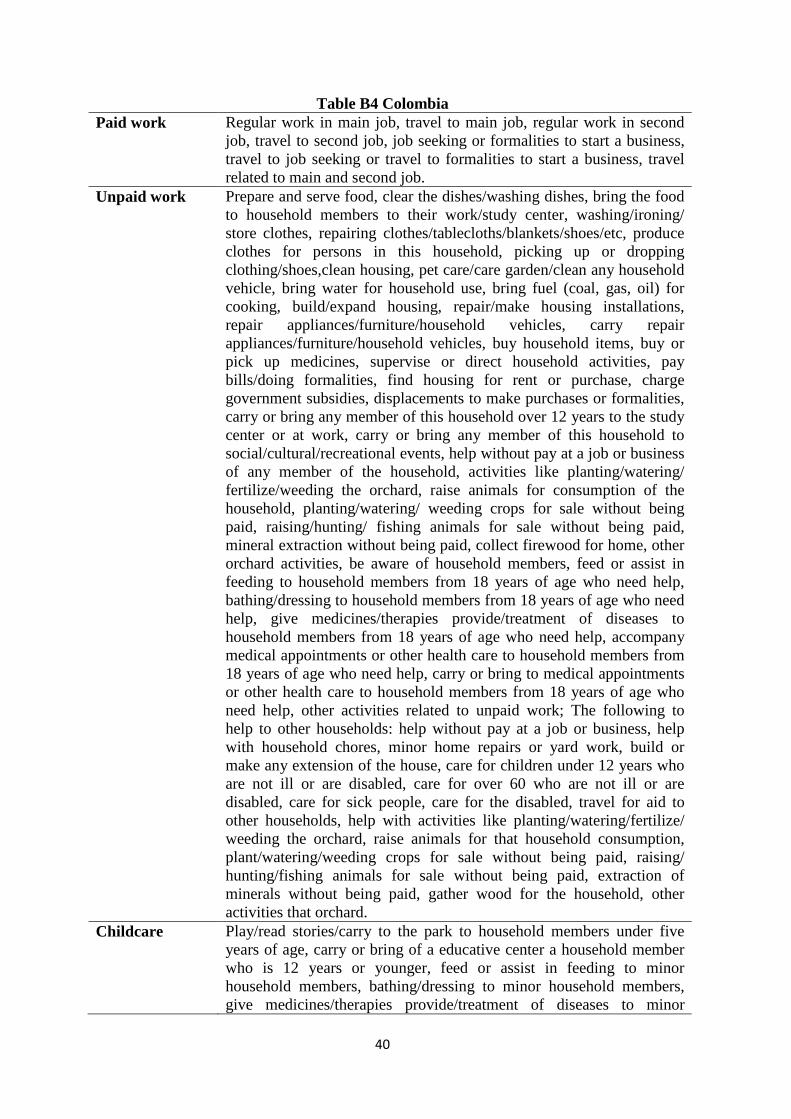
40
Table B4 Colombia Paid work
Regular work in main job, travel to main job, regular work in second job, travel to second job, job seeking or formalities to start a business, travel to job seeking or travel to formalities to start a business, travel related to main and second job.
Unpaid work Prepare and serve food, clear the dishes/washing dishes, bring the food to household members to their work/study center, washing/ironing/ store clothes, repairing clothes/tablecloths/blankets/shoes/etc, produce clothes for persons in this household, picking up or dropping clothing/shoes,clean housing, pet care/care garden/clean any household vehicle, bring water for household use, bring fuel (coal, gas, oil) for cooking, build/expand housing, repair/make housing installations, repair appliances/furniture/household vehicles, carry repair appliances/furniture/household vehicles, buy household items, buy or pick up medicines, supervise or direct household activities, pay bills/doing formalities, find housing for rent or purchase, charge government subsidies, displacements to make purchases or formalities, carry or bring any member of this household over 12 years to the study center or at work, carry or bring any member of this household to social/cultural/recreational events, help without pay at a job or business of any member of the household, activities like planting/watering/ fertilize/weeding the orchard, raise animals for consumption of the household, planting/watering/ weeding crops for sale without being paid, raising/hunting/ fishing animals for sale without being paid, mineral extraction without being paid, collect firewood for home, other orchard activities, be aware of household members, feed or assist in feeding to household members from 18 years of age who need help, bathing/dressing to household members from 18 years of age who need help, give medicines/therapies provide/treatment of diseases to household members from 18 years of age who need help, accompany medical appointments or other health care to household members from 18 years of age who need help, carry or bring to medical appointments or other health care to household members from 18 years of age who need help, other activities related to unpaid work; The following to help to other households: help without pay at a job or business, help with household chores, minor home repairs or yard work, build or make any extension of the house, care for children under 12 years who are not ill or are disabled, care for over 60 who are not ill or are disabled, care for sick people, care for the disabled, travel for aid to other households, help with activities like planting/watering/fertilize/ weeding the orchard, raise animals for that household consumption, plant/watering/weeding crops for sale without being paid, raising/ hunting/fishing animals for sale without being paid, extraction of minerals without being paid, gather wood for the household, other activities that orchard.
Childcare
Play/read stories/carry to the park to household members under five years of age, carry or bring of a educative center a household member who is 12 years or younger, feed or assist in feeding to minor household members, bathing/dressing to minor household members, give medicines/therapies provide/treatment of diseases to minor
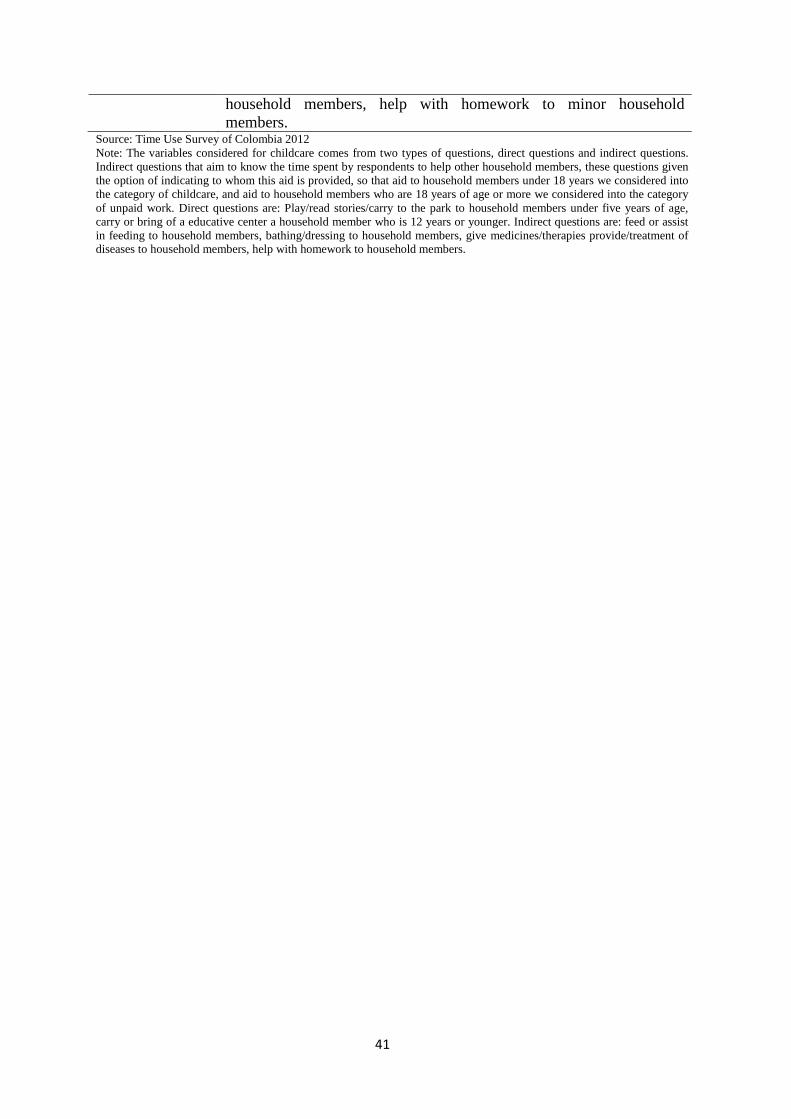
41
household members, help with homework to minor household members.
Source: Time Use Survey of Colombia 2012 Note: The variables considered for childcare comes from two types of questions, direct questions and indirect questions. Indirect questions that aim to know the time spent by respondents to help other household members, these questions given the option of indicating to whom this aid is provided, so that aid to household members under 18 years we considered into the category of childcare, and aid to household members who are 18 years of age or more we considered into the category of unpaid work. Direct questions are: Play/read stories/carry to the park to household members under five years of age, carry or bring of a educative center a household member who is 12 years or younger. Indirect questions are: feed or assist in feeding to household members, bathing/dressing to household members, give medicines/therapies provide/treatment of diseases to household members, help with homework to household members.