MASH Explorer: A Universal Software Environment for Top ...
26
MASH Explorer: A Universal Software Environment for Top-Down Proteomics Zhijie Wu 1 , David S. Roberts 1 , Jake A. Melby 1 , Kent Wenger 2,3 , Molly Wetzel 2 , Yiwen Gu 2,3 , Sudharshanan Govindaraj Ramanathan 2 , Elizabeth F. Bayne 1 , Xiaowen Liu 4,5 , Ruixiang Sun 6 , Irene M. Ong 7, 8, 9 , Sean J. McIlwain 7,8 *, Ying Ge 1, 2, 3 * 1 Department of Chemistry, University of Wisconsin-Madison, Madison, WI 53705, USA. 2 Department of Cell and Regenerative Biology, University of Wisconsin-Madison, Madison, WI 53705, USA. 3 Human Proteomics Program, School of Medicine and Public Health, University of Wisconsin- Madison, Madison, WI 53705, USA. 4 Department of BioHealth Informatics, Indiana University-Purdue University Indianapolis, Indianapolis, IN 46202, USA. 5 Center for Computational Biology and Bioinformatics, Indiana University-Purdue University Indianapolis, Indianapolis, IN 46202, USA. 6 National Institute of Biological Sciences, Beijing, 102206, China. 7 Department of Biostatistics and Medical Informatics, University of Wisconsin-Madison, Madison, WI 53705, USA. 8 University of Wisconsin Carbone Cancer Center, University of Wisconsin-Madison, Madison, WI 53705, USA. 9 Department of Obstetrics and Gynecology, University of Wisconsin-Madison, Madison, WI 53705, USA. *Correspondence should be addressed to S.J.M. ([email protected]) and Y.G. ([email protected]). Page 1 of 26 Journal of Proteome Research 1 2 3 4 5 6 7 8 9 10 11 12 13 14 15 16 17 18 19 20 21 22 23 24 25 26 27 28 29 30 31 32 33 34 35 36 37 38 39 40 41 42 43 44 45 46 47 48 49 50 51 52 53 54 55 56 ____________________________________________________ This is the author's manuscript of the article published in final edited form as: Wu, Z., Roberts, D. S., Melby, J. A., Wenger, K., Wetzel, M., Gu, Y., Ramanathan, S. G., Bayne, E. F., Liu, X., Sun, R., Ong, I. M., McIlwain, S. J., & Ge, Y. (2020). MASH Explorer: A Universal Software Environment for Top-Down Proteomics. Journal of Proteome Research. https://doi.org/10.1021/acs.jproteome.0c00469
Transcript of MASH Explorer: A Universal Software Environment for Top ...
MASH Explorer: A Universal Software Environment for Top-Down Proteomics
Zhijie Wu1, David S. Roberts1, Jake A. Melby1, Kent Wenger2,3, Molly Wetzel2, Yiwen Gu2,3,
Sudharshanan Govindaraj Ramanathan2, Elizabeth F. Bayne1, Xiaowen Liu4,5, Ruixiang Sun6,
Irene M. Ong7, 8, 9, Sean J. McIlwain7,8*, Ying Ge1, 2, 3*
1Department of Chemistry, University of Wisconsin-Madison, Madison, WI 53705, USA.
2Department of Cell and Regenerative Biology, University of Wisconsin-Madison, Madison, WI
53705, USA.
3Human Proteomics Program, School of Medicine and Public Health, University of Wisconsin-
Madison, Madison, WI 53705, USA.
4Department of BioHealth Informatics, Indiana University-Purdue University Indianapolis,
Indianapolis, IN 46202, USA.
5Center for Computational Biology and Bioinformatics, Indiana University-Purdue University
Indianapolis, Indianapolis, IN 46202, USA.
6National Institute of Biological Sciences, Beijing, 102206, China.
7Department of Biostatistics and Medical Informatics, University of Wisconsin-Madison, Madison,
WI 53705, USA.
8University of Wisconsin Carbone Cancer Center, University of Wisconsin-Madison, Madison,
WI 53705, USA.
9Department of Obstetrics and Gynecology, University of Wisconsin-Madison, Madison, WI
53705, USA.
*Correspondence should be addressed to S.J.M. ([email protected]) and Y.G.
Page 1 of 26 Journal of Proteome Research
1234567891011121314151617181920212223242526272829303132333435363738394041424344454647484950515253545556
____________________________________________________
This is the author's manuscript of the article published in final edited form as: Wu, Z., Roberts, D. S., Melby, J. A., Wenger, K., Wetzel, M., Gu, Y., Ramanathan, S. G., Bayne, E. F., Liu, X., Sun, R., Ong, I. M., McIlwain, S. J., & Ge, Y. (2020). MASH Explorer: A Universal Software Environment for Top-Down Proteomics. Journal of Proteome Research. https://doi.org/10.1021/acs.jproteome.0c00469

2
Abstract
Top-down mass spectrometry (MS)-based proteomics enables a comprehensive analysis of
proteoforms with molecular specificity to achieve a proteome-wide understanding of protein
functions. However, the lack of a universal software for top-down proteomics is becoming
increasingly recognized as a major barrier especially for newcomers. Here we develop MASH
Explorer, a universal, comprehensive, and user-friendly software environment for top-down
proteomics. MASH Explorer integrates multiple spectral deconvolution and database searching
algorithms into a single, universal platform which can process top-down proteomics data from
various vendor formats, for the first time. It addresses the urgent need in the rapidly growing top-
down proteomics community and is freely available to all users worldwide. With the critical need
and tremendous support from the community, we envision this MASH Explorer software package
will play an integral role in advancing top-down proteomics to realize its full potential for
biomedical research.
Keywords: Top-down Proteomics; Data Analysis Software; Proteoform Characterization; Intact
Protein Analysis
Page 2 of 26
ACS Paragon Plus Environment
Journal of Proteome Research
123456789101112131415161718192021222324252627282930313233343536373839404142434445464748495051525354555657585960

3
Introduction
Top-down mass spectrometry (MS)-based proteomics provides a comprehensive analysis
of “proteoforms” — all protein products arising from post-translational modifications (PTMs),
alternative splicing and genetic variations originating from a single gene — with molecular
specificity to achieve a proteome-wide understanding of protein functions.1-4 Top-down MS
analyzes intact proteins without proteolytic digestion and can detect various proteoforms
simultaneously in a single MS experiment, thereby enabling their comprehensive molecular
characterization. Specific information about proteoforms including PTM sites and sequence
variations can be further characterized by tandem MS (MS/MS).5-7 In contrast to the well-
developed software packages in the peptide-based bottom-up proteomics, the data analysis tools
for protein-based top-down proteomics remain under-developed due to the major challenge in
handling the enormous complexity of high-resolution intact protein mass spectra.7-9 Particularly,
the lack of a universal and user-friendly software for streamlined analysis of complex top-down
proteomics data is becoming increasingly recognized as a major barrier, especially for newcomers,
thus limiting the broader impact of top-down proteomics in the biomedical research communities.
Additionally, the relatively high cost of commercial top-down software limits the accessibility for
general users and thus necessitates a freely available academic version.
Here we develop MASH Explorer, a universal, comprehensive, user-friendly, and freely
available software environment for top-down proteomics
(http://ge.crb.wisc.edu/MASH_Explorer/index.htm). This software can process high-resolution
MS, MS/MS data and liquid-chromatography tandem MS (LC-MS/MS) across multiple vendor-
specific formats, with automated database searching for protein identification as well as user-
friendly tools for proteoform characterization and data visualization/validation. MASH Explorer
Page 3 of 26
ACS Paragon Plus Environment
Journal of Proteome Research
123456789101112131415161718192021222324252627282930313233343536373839404142434445464748495051525354555657585960

4
includes two major workflows: “Discovery Mode” for analysis of complex high-resolution LC-
MS/MS data to achieve global protein identification and “Targeted Mode” for comprehensive
proteoform characterization including PTMs and sequence variants, with user-friendly graphic
user interface (GUI) support. Advancing on our previous generations of proteomics software,
MASH Suite10 and MASH Suite Pro,11 MASH Explorer has many new features including: (1)
development of a universal platform for streamlined data processing from various vendor formats
to standardize the data analysis; (2) integration of multiple deconvolution and database search
algorithms for significantly enhanced protein identifications; (3) workflow management for high-
throughput data processing such as Process Wizard and Workflow Manager; (4) comprehensive
proteoform characterization tools with the capability of handling highly complex data resulting
from various MS/MS techniques such as collision-induced dissociation (CID), electron capture
dissociation (ECD), electron transfer dissociation (ETD), and ultraviolet photodissociation
(UVPD). The universal accessibility of non-proprietary, free software solutions such as MASH
Explorer will significantly bolster the growth of the top-down proteomics community and
welcome newcomers to employ this powerful technology to realize its impact in biomedical
research.
Experimental Section
Software Design and Algorithm Support
MASH Explorer is a multithreaded Windows application implemented in C# using .NET
framework within the Visual Studio Integrated Development Environment. The software visual
components are provided by Microsoft Office Runtime Support. Importing data obtained from
Page 4 of 26
ACS Paragon Plus Environment
Journal of Proteome Research
123456789101112131415161718192021222324252627282930313233343536373839404142434445464748495051525354555657585960

5
different MS instruments is supported using ProteoWizard,12 DeconEngine,13 and vendor provided
libraries. Additionally, MASH Explorer supports multiple deconvolution and database search
algorithms, including TopPIC suite,14 pTop,15 Informed-Proteomics,16 MS-Deconv,17 MS-
Align+,18 and a modified version of THRASH19 (eTHRASH11). As of March 24th, 2020, the
supported versions of the deconvolution and database search algorithms are summarized in Table
S1.
Computer Setup for Data Analysis
Data analysis was performed to simulate basic research environment. This computer has
Windows 10 Student Edition operating system installed. It was equipped with an Intel i5-2400
central processing unit, which has 4 cores and 4 threads for processing, 16 GB DDR3 2400 MHz
random access memory, and 1 TB SATA hard drive.
Mass Spectrometry Data
Two LC-MS/MS datasets from two different mass spectrometer vendors, Thermo
Scientific and Bruker Corporation (referred to as Thermo and Bruker, respectively, in this
manuscript), were utilized to demonstrate the Discovery Mode workflow of the MASH Explorer.
The Thermo dataset is publicly available in the MassIVE repository with identifier/username
MSV000079978 (ftp://massive.ucsd.edu/MSV000079978/).20 The dataset was acquired by
extracting protein from DLD-1 parental (KRas wt/G13D) human colorectal cancer cells and using
a GELFrEE system for size-based separation.21 The MS experiment was performed using reverse-
Page 5 of 26
ACS Paragon Plus Environment
Journal of Proteome Research
123456789101112131415161718192021222324252627282930313233343536373839404142434445464748495051525354555657585960

6
phase (RP) LC-MS/MS analysis using a 21 Tesla Fourier Transform Ion Cyclotron Resonance
mass spectrometer.
The Bruker LC-MS/MS dataset used was publicly available from the PRIDE repository via
ProteoXchange with identifier PXD010825.4 Briefly, the samples from this dataset were prepared
by protein extraction using a photo-cleavable surfactant, 4-hexylphenylazosulfonate (Azo), from
the human embryonic kidney 293K stem cells. The samples were irradiated to cleave the Azo
surfactant. RPLC-MS/MS experiment was performed on a Bruker maXis II quadrupole-time of
flight (Q-TOF) mass spectrometer. For the Bruker dataset, the mass spectra were also
deconvoluted using Maximum Entropy Algorithm with 80,000 resolution from 10,000 Da to
50,000 Da using Bruker DataAnalysis 4.3.
The dataset for MS/MS analysis was previously published.22 Briefly, the samples were
prepared by extracting proteins from non-human primate skeletal muscles. The dataset was
published previously,22 and is publicly available through ProteomeXchange Consortium via the
PRIDE partner repository with the PXD018043 identifier.23 Target sarcomeric proteins were
fractionated using a Waters nanoAQUITY liquid chromatography system, and the fractionated
samples were analyzed with a Bruker solariX 12 Tesla FT-ICR instrument using an Advion
Nanomate. Specifically, beta-tropomyosin (βTpm, Uniprot-Swissprot accession number P07951)
with ECD spectrum and myosin light chain 2 slow isoform (MLC-2S, Uniprot-Swissprot accession
number A0A1D5RDY5) with the CID spectrum were used for demonstration of top-down protein
characterization using the “Targeted Mode” of MASH Explorer.
A Bruker MS/MS dataset were used for demonstrating the functions of the Targeted Mode
in MASH Explorer for characterization of the antibody-drug conjugate (ADC), Adcetris
(brentuximab vedotin) subunits, were previously published.24 Briefly, Adcetris was digested by
Page 6 of 26
ACS Paragon Plus Environment
Journal of Proteome Research
123456789101112131415161718192021222324252627282930313233343536373839404142434445464748495051525354555657585960

7
IdeS, and the interchain disulfide bond was reduced by dithiothreitol (DTT). The subunits were
analyzed by LC-MS/MS using a combination of a Waters M-Class LC system and a Bruker maXis
II Q-TOF mass spectrometer. The precursor of each subunit was subject to MS/MS experiment
using both CID and ETD. The MS/MS spectra for each subunit were averaged using Bruker
DataAnalysis 4.3 software and exported in .ascii format. The ions were extracted using THRASH
at 60% fit, and the fragmentation ions were manually validated.
The MS/MS dataset for demonstrating ultraviolet photodissociation (UVPD) ion fragment
in Figure 1 was previously published by the Brodbelt group and could be accessed through
ProteomeXchange with the PXD009447 accession number.25 This dataset was acquired by
applying both CID and UVPD fragmentation methods on single amino acid variants of the human
mitochondrial enzyme branched-chain amino acid transferase 2 using a modified prototype of
Thermo Q Exactive UHMR instrument.
Algorithm Parameters and Database Search
For comparison of deconvolution and database search algorithms in this study, our analysis
used the default parameters from different algorithms. Additionally, we attempted to use the same
parameters to minimize runtime differences caused by parameters. For instance, all algorithms
were set to 100,000 Dalton (Da) for maximum protein mass. A standard list of modifications such
as N-terminal acetylation and N-terminal methionine removal was included during database search.
A human database (Uniprot-Swissprot database, release December 2019, containing 20,367
protein sequences) was used for LC-MS/MS database search.
Page 7 of 26
ACS Paragon Plus Environment
Journal of Proteome Research
123456789101112131415161718192021222324252627282930313233343536373839404142434445464748495051525354555657585960
8
Results
MASH Explorer software is a multifaceted software, which is built upon C# programming
language using Visual Studio software under .NET framework environment. The combination of
C# and Visual Studio enables the development of user-friendly Windows-based graphical interface,
which is very intuitive for users, especially newcomers, to learn for streamlined routine analysis.
This software development environment allows high performance, low latency, and rich data
interaction for high throughput data processing.
The core functions of MASH Explorer include spectral deconvolution, protein
identification, proteoform characterization, graphical data output, data validation, and workflow
automation (Figure 1). Users can choose the integrated deconvolution and database search
algorithms to perform spectral deconvolution tasks, which extracts spectral features and
subsequently generates a mass list from complex mass spectrum to search against a database for
protein identification. Spectral deconvolution and protein identification tasks are supported by
GUI tools in the MASH Explorer software for automation. The proteoform characterization
function allows users to match fragment ions to protein sequence for localizing PTM sites and
identifying sequence variations. MASH Explorer provides GUI to visualize experimental data for
LC chromatograms, mass spectra, and fragment ion maps generated from various MS/MS
experiments such as CID, ECD/ETD, and UVPD.
One unique feature of MASH Explorer is its universal data processing platform for top-
down proteomics with the capability to process data from multiple vendor formats. MASH
Explorer currently support specific vendor raw data format from Thermo (.raw), Bruker (.d
and .ascii), and Waters (.raw) (Figure 1). Moreover, universal data formats such as mzXML and
mgf can be imported. The data import function is supported by ProteoWizard,12 DeconEngine,13
Page 8 of 26
ACS Paragon Plus Environment
Journal of Proteome Research
123456789101112131415161718192021222324252627282930313233343536373839404142434445464748495051525354555657585960
9
and vendor provided libraries. To allow successful data import, codes in MASH Explorer are
continuously updated to accommodate the latest version of ProteoWizard and vendor-specific data
acquisition software.
For the first time, MASH Explorer integrates multiple deconvolution and database
searching algorithms into a single platform to maximize the performance for enhanced protein
identification (Figure 1). Currently, the software incorporates various deconvolution algorithms
including MS-Deconv,17 TopFD,14 eTHRASH,19 pParseTD,15 and ProMex26 for both MS and
MS/MS deconvolution. The database searching algorithms such as MS-Align+,18 TopPIC,14
pTop,15 and MSPathFinderT26 were integrated in the software for protein identification. MASH
Explorer implements the process wizard, a user-friendly GUI to allow users to easily select
deconvolution and database search algorithms and to customize the parameters of the selected
algorithms for data processing, which is particularly convenient for users. In contrast, some
database searching algorithms, such as MS-Align+, require command line inputs using the
Windows terminal, which is complicated and difficult for users with limited computational
experience. The Configuration tool provides an intuitive interface for the users to find the directory
of the supported deconvolution and database search algorithms (Figure S1).
The main interface of MASH Explorer allows users to perform data visualization, data
validation, and customized output. The panels in the main interface include Workflow, Status Bar,
Results View, Mass List, Logbook, and Sequence Table (Figure S2). In the Workflow and
Parameters panel, several sections are available for users to process top-down MS data, including
“Discovery Mode” for LC-MS/MS data processing, “Targeted Mode” for single protein
characterization. In addition, “Data Reporting” allows users to save processed datasets in
Extensible Markup Language (XML) format, which can be reopened for further analysis, and to
Page 9 of 26
ACS Paragon Plus Environment
Journal of Proteome Research
123456789101112131415161718192021222324252627282930313233343536373839404142434445464748495051525354555657585960
10
export Microsoft object files of both mass spectra and fragment ion maps for image processing. In
the Results View panel, a mass spectrum is displayed for data visualization. Users can navigate
through different scans, zoom-in and zoom-out of the selected spectrum, and adjust the theoretical
Gaussian distribution of the fragment ions using the buttons displayed in the panel. The Mass List
panel allows users browse through deconvoluted mass list from the mass spectra for data validation.
The entries in the Mass List panel interacts with the Results View and Sequence Table panels,
offering users to visualize the fragment ion mapping for different types of MS/MS techniques to
characterize the protein sequence. The entries in the Mass List panel can be copied to text editing
software and is converted to .msalign format during data processing. In the Sequence Table panel,
PTMs of the protein sequences can also be selected and analyzed. The Logbook and Status Bar
panels record all data processing by the software such as the versions of the tools used for raw data
import, the parameters used in deconvolution and database search tasks. Users can copy the
Logbook recordings to a text editor in the event an error occurs. Moreover, the information in the
Logbook recordings can help the MASH Explorer software developers troubleshoot any problems.
MASH Explorer features a “Discovery Mode” workflow that is useful for high-throughput
data processing and proteoform identification from batch LC-MS/MS raw data files without a
priori knowledge of specific proteins (Figure 2). “Discovery mode” integrates several top-down
MS processing tools to centroid, deconvolute, and search databases against raw datasets for
comprehensive proteoform characterization. The software environment highlights intuitive and
user-friendly Process Wizard and Workflow Manager to enhance the efficiency of data processing.
MASH Explorer offers a user-friendly GUI, Process Wizard, for different deconvolution
and database search algorithms (Figure S3). This GUI tool bundles top-down data processing steps
including centroiding, deconvolution, and database search. After data import, users can choose
Page 10 of 26
ACS Paragon Plus Environment
Journal of Proteome Research
123456789101112131415161718192021222324252627282930313233343536373839404142434445464748495051525354555657585960

11
available processing pipelines in the Process Wizard. Users can run the algorithms using default
settings or change the parameters of each algorithm in the Advanced tab. Additionally, MASH
Explorer implements a Workflow Manager to enhance the efficiency of processing top-down
proteomics datasets (Figure S4). In the Workflow Manager, users can run a batch analysis of top-
down proteomic datasets in sequence. The Workflow Manager achieves this function by reading
the workflow log created during the algorithm process and gives instructions to wait to execute
the next operation. Upon completion, the Workflow Manager automatically imports both the
deconvolution and database search results into MASH Explorer for validation of identified
proteins. It provides users with convenience in both automatic data file conversion and parameter
input in algorithms without sacrificing the efficiency of the database search.
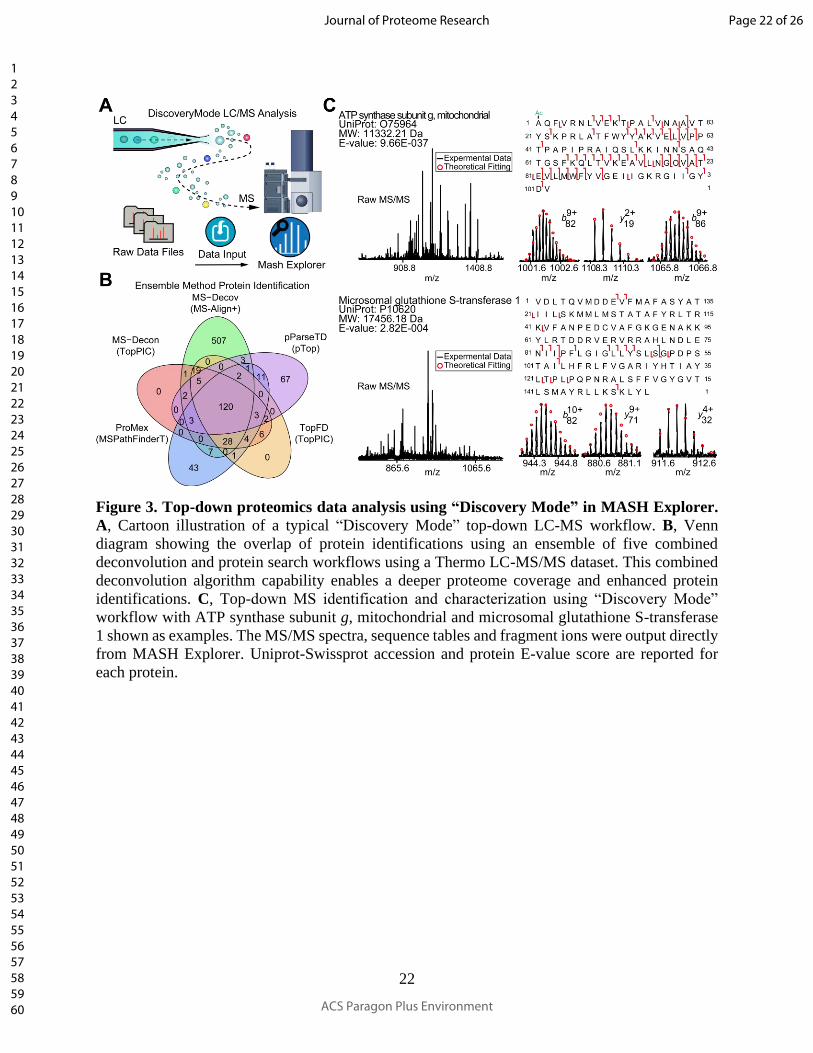
Incorporation of various deconvolution and database search algorithms enables MASH
Explorer to improve global proteoform identification and characterization (Figure 3 and Figure
S5). As an example, multiple deconvolution and database search workflows have been performed
on both Thermo dataset from human colorectal cancer cell protein extracts20 and Bruker dataset
from surfactant-extracted protein mixture4 for global proteoform identification (Figure 3B and
Figure S5A, detailed discussions on using “Discovery Mode” for data analysis are provided in the
Supporting Information). Identified proteoforms can be further analyzed using tools provided by
MASH Explorer for comprehensive proteoform characterization (Figure 3C). In addition to the
current list of deconvolution and database search algorithms, MASH Explorer has the capability
to incorporate more algorithms, owing to the modularity of the software. The incorporation of
recently developed deconvolution algorithms such as FLASHDeconv8 and UniDec27-28 could
increase the diversity in deconvolution methods and thus enable MASH Explorer to process
datasets more effectively. Moreover, the results from multiple algorithms can be used for analysis
Page 11 of 26
ACS Paragon Plus Environment
Journal of Proteome Research
123456789101112131415161718192021222324252627282930313233343536373839404142434445464748495051525354555657585960

12
and further implementation of machine learning algorithms. Recent algorithm development in the
MASH project will enable users to run a machine learning tool on deconvolution.23 This machine
learning tool used hierarchical clustering to combine deconvoluted peak lists from different
algorithms, which can effectively detect true positive peaks while filtering out false positive peaks,
resulting in enhanced accuracy and confidence in protein identification during database search.
Another important feature of MASH Explorer is a complimentary “Targeted Mode”
workflow that is optimized for the detailed and comprehensive characterization of individual
proteins, enabling users to identify site-specific PTMs within a protein target (Figure 4). The
“Targeted Mode” workflow was developed for comprehensive protein characterization. It includes
data import, spectral deconvolution to identify and verify isotopic distributions, database search to
identify target protein, and finally protein characterization by matching identified isotopic
distribution to the target proteoform sequence. The “Targeted Mode” workflow aims to perform
identification of fragment ions that help identify and localize PTMs of a target proteoform
sequence.
In addition to the functions introduced in our previous generation software, MASH Suite
Pro,11 which provides tools for users to perform charge state and mass shift correction, the
“Targeted Mode” in MASH Explorer introduces an Ion Finder Tool GUI that parses through
generated ion lists from different fragmentation methods to find proteoform annotations and allow
users to match theoretical and observed fragment ions (Figure S6). Using the Ion Finder Tool,
users can input the fragment ion type and the charge state of the specific fragment ion of interest.
The software will then zoom-in to the m/z region of targeted ion and attempt to perform fragment
ion matching. The Ion Finder Tool complements the existing THRASH algorithm in MASH
Explorer to provide a more comprehensive fragment ion mapping for top-down protein analysis.
Page 12 of 26
ACS Paragon Plus Environment
Journal of Proteome Research
123456789101112131415161718192021222324252627282930313233343536373839404142434445464748495051525354555657585960

13
As an example, we have demonstrated on a previously published dataset in the characterization of
cardiac sarcomeric proteins from non-human primate skeletal muscle such as βTpm, which was
modified with N-terminal acetylation, and MLC-2S with N-terminal methionine removal and
PTMs including N-terminal acetylation and deamidation at Asn13 (Figure S7).22 Moreover,
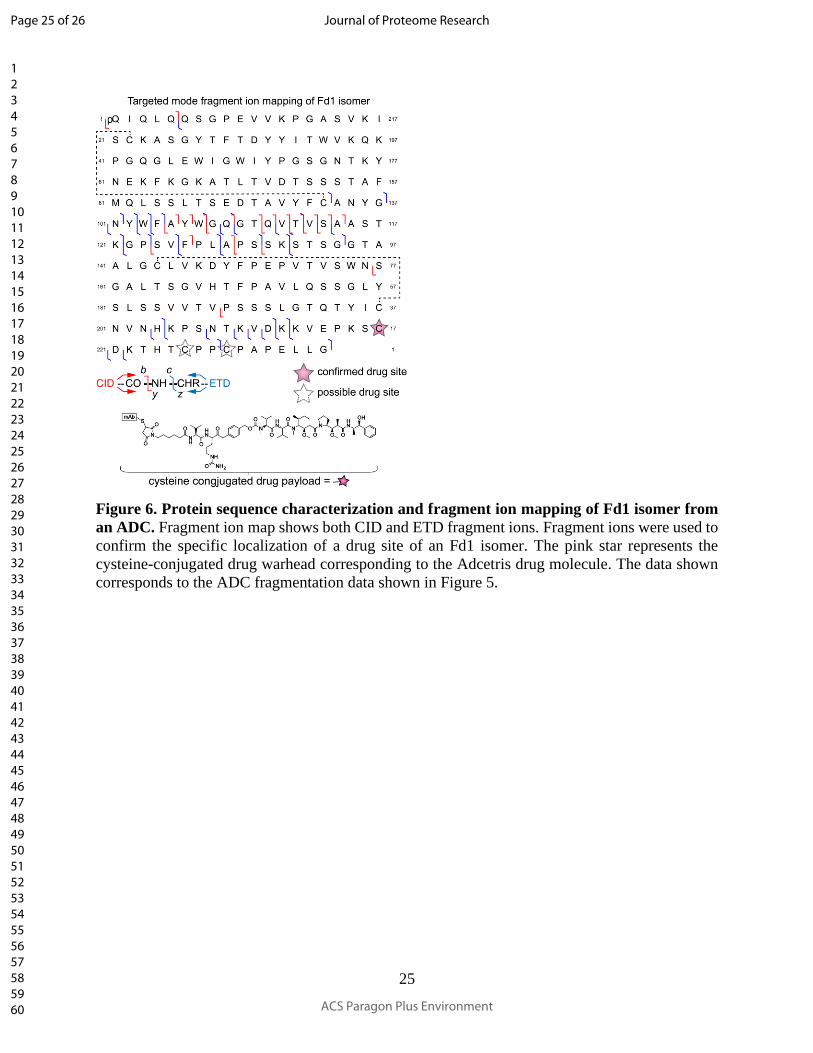
MASH Explorer can also be extended to characterize the subunits of ADCs,24 which combine the
target specificity of monoclonal antibody and the potency of the cytotoxin drugs, gaining
enormous interest in the pharmaceutical industry (Figure 5 and Figure 6). One of the analytical
tasks for ADC characterization is the site localization of drug payload. The digestion of an ADC,
brentuximab vedotin, with IdeS resulted Fd1 subunits in three possible isomers, where drugs can
be incorporated on three possible cysteine residues (Figure 5A, detailed discussion on using
“Targeted Mode” for data analysis is provided in the Supporting Information). Using MASH
Explorer, MS/MS spectra can be imported and performed by fragment ion mapping on specific
Fd1 subunit (Figure 6). Additionally, fragment ions near three possible sites including Cys220,
Cys226, and Cys229, which are the specific locations of inter-chain disulfide bonds for drug
linkage, can be localized. As illustrated in Figure 2D, z•15, z•16, z•23, and z•24 ions were visualized
using the Ion Finder Tool to localize Cys220 as the site for the payload for an Fd1 subunit isomer
(Figure 5B).
Discussion
MASH Explorer is a non-proprietary and free software solution, providing a universal and
comprehensive environment for processing top-down proteomics data. The major innovations of
MASH Explorer include the integration of multiple deconvolution and search algorithms into a
single, universal platform to process raw data from various vendor formats in a user-friendly
Page 13 of 26
ACS Paragon Plus Environment
Journal of Proteome Research
123456789101112131415161718192021222324252627282930313233343536373839404142434445464748495051525354555657585960

14
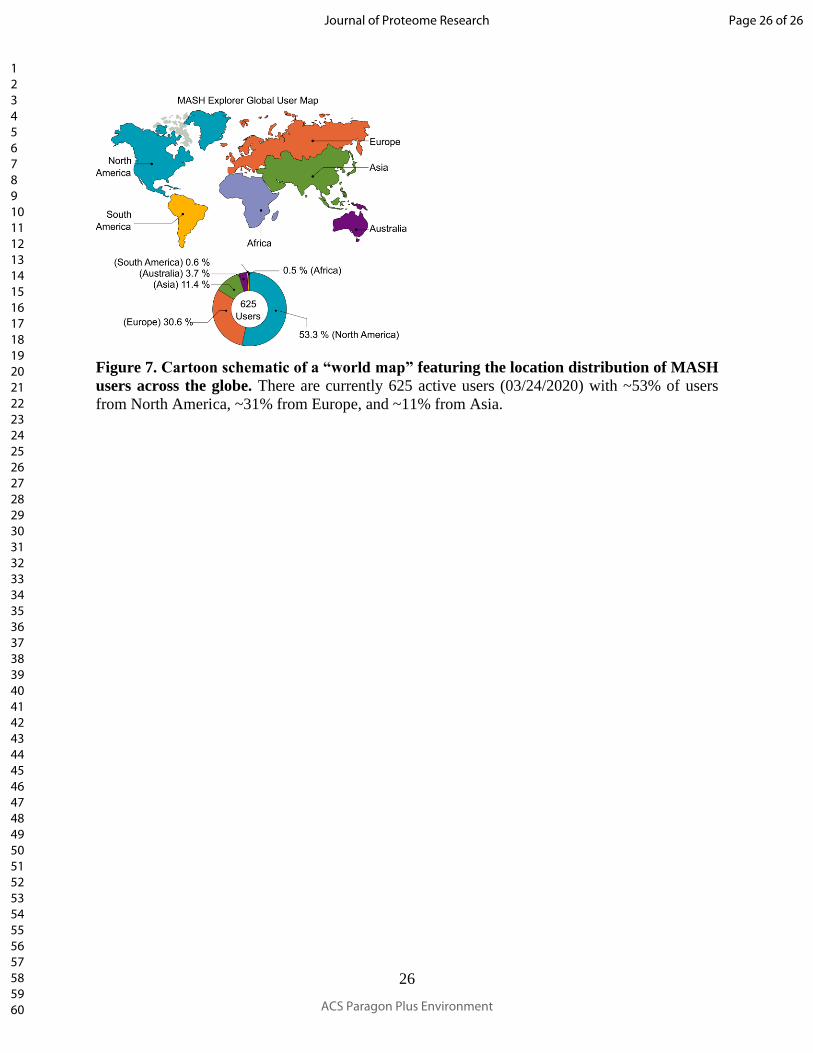
interface. Since the development of the MASH project, the software has been downloaded and
used by more than 600 users around the world (as of March 24th, 2020) (Figure 7). While the
majority of users are from North America, the MASH software has continuously attracted users
across the globe, including users from continents such as Europe and Asia. As the popularity of
top-down MS-based proteomics grows, MASH software increasingly becomes a vital and integral
tool for users to process complex high-resolution top-down LC-MS/MS data. In addition to the
case studies of protein identification from human colorectal cancer cell protein extracts20 and
surfactant-extracted protein mixture,4 as well as the characterization of ADC,24 many other groups
have used the MASH software packages in top-down proteomics projects including analysis of the
light and heavy chain connectivity of a monoclonal antibody,29 characterization of branched
ubiquitin chainsm,30-31 intact phosphoprotein characterization,32 and localization of
phosphorylation sites of a phosphatase.33
As the burgeoning top-down proteomics community continues its rapid growth and has
gained momentum through the creation of the Consortium for Top-down Proteomics (CTDP)
(http://www.topdownproteomics.org/), the need for universal, comprehensive and globally
accessible top-down proteomics software increases tremendously. With the critical need and
tremendous support from the community, we envision this MASH Explorer software package will
serve as a powerful tool to enable top-down proteomics researchers worldwide, playing an integral
role in advancing the top-down proteomics to realize its full potential for biomedical research.
Acknowledgement
Page 14 of 26
ACS Paragon Plus Environment
Journal of Proteome Research
123456789101112131415161718192021222324252627282930313233343536373839404142434445464748495051525354555657585960
15
This work was supported by the NIH R01 GM125085 (to Y.G). Y.G. would also like to
acknowledge support by NIH R01 HL096971, GM117058 and S10 OD018475. We would like to
thank Ziqing Lin, Yutong Jin, Bifan Chen, Trisha Tucholski, Kyle Brown, and Austin Carr for the
helpful discussions. We also thank all the MASH user worldwide for the excellent feedback which
has helped the development of the software.
Supporting Information
The following supporting information is available free of charge at ACS website
http://pubs.acs.org:
• Supplementary Results and Discussion
• Table S1. Supported versions of deconvolution and database search tools.
• Figure S1. Software configuration.
• Figure S2. MASH Explorer main interface.
• Figure S3. Process Wizard for top-down data processing.
• Figure S4. Workflow Manager for batch analysis of multiple datasets.
• Figure S5. “Discovery Mode” Analysis on a Bruker LC-MS/MS dataset.
• Figure S6. Demonstration of Ion Finder Tool.
• Figure S7. Top-down protein characterization using “Targeted Mode” workflow.
• MASH Explorer User Manual v2.0,
• MASH Video Part 1 Introduction,
• MASH Video Part 2 Configuration Setup,
• MASH Video Part 3 Discovery Mode,
Page 15 of 26
ACS Paragon Plus Environment
Journal of Proteome Research
123456789101112131415161718192021222324252627282930313233343536373839404142434445464748495051525354555657585960
16
• MASH Video Part 4 Targeted Mode,
• MASH Video Part 5 Data Processing and Export Functions.
References
1. Smith, L. M.; Kelleher, N. L., Proteoforms as the next proteomics currency. Science 2018,
359 (6380), 1106-1107.
2. Smith, L. M.; Thomas, P. M.; Shortreed, M. R.; Schaffer, L. V.; Fellers, R. T.; LeDuc, R. D.;
Tucholski, T.; Ge, Y.; Agar, J. N.; Anderson, L. C.; Chamot-Rooke, J.; Gault, J.; Loo, J. A.;
Pasa-Tolic, L.; Robinson, C. V.; Schluter, H.; Tsybin, Y. O.; Vilaseca, M.; Vizcaino, J. A.;
Danis, P. O.; Kelleher, N. L., A five-level classification system for proteoform identifications.
Nat. Methods 2019.
3. Aebersold, R.; Agar, J. N.; Amster, I. J.; Baker, M. S.; Bertozzi, C. R.; Boja, E. S.; Costello,
C. E.; Cravatt, B. F.; Fenselau, C.; Garcia, B. A.; Ge, Y.; Gunawardena, J.; Hendrickson, R.
C.; Hergenrother, P. J.; Huber, C. G.; Ivanov, A. R.; Jensen, O. N.; Jewett, M. C.; Kelleher,
N. L.; Kiessling, L. L.; Krogan, N. J.; Larsen, M. R.; Loo, J. A.; Loo, R. R. O.; Lundberg,
E.; MacCoss, M. J.; Mallick, P.; Mootha, V. K.; Mrksich, M.; Muir, T. W.; Patrie, S. M.;
Pesavento, J. J.; Pitteri, S. J.; Rodriguez, H.; Saghatelian, A.; Sandoval, W.; Schluter, H.;
Sechi, S.; Slavoff, S. A.; Smith, L. M.; Snyder, M. P.; Thomas, P. M.; Uhlen, M.; Van Eyk,
J. E.; Vidal, M.; Walt, D. R.; White, F. M.; Williams, E. R.; Wohlschlager, T.; Wysocki, V.
H.; Yates, N. A.; Young, N. L.; Zhang, B., How many human proteoforms are there? Nat.
Chem. Biol. 2018, 14 (3), 206-214.
4. Brown, K. A.; Chen, B. F.; Guardado-Alvarez, T. M.; Lin, Z. Q.; Hwang, L.; Ayaz-Guner,
S.; Jin, S.; Ge, Y., A photocleavable surfactant for top-down proteomics. Nat. Methods 2019,
16 (5), 417-420.
5. Siuti, N.; Kelleher, N. L., Decoding protein modifications using top-down mass spectrometry.
Nat. Methods 2007, 4 (10), 817-21.
6. Cai, W.; Tucholski, T. M.; Gregorich, Z. R.; Ge, Y., Top-down Proteomics: Technology
Advancements and Applications to Heart Diseases. Expert Rev. Proteomics 2016, 13 (8),
717-30.
7. Chen, B.; Brown, K. A.; Lin, Z.; Ge, Y., Top-Down Proteomics: Ready for Prime Time?
Anal. Chem. 2018, 90 (1), 110-127.
8. Jeong, K.; Kim, J.; Gaikwad, M.; Hidayah, S. N.; Heikaus, L.; Schluter, H.; Kohlbacher, O.,
FLASHDeconv: Ultrafast, High-Quality Feature Deconvolution for Top-Down Proteomics.
Cell Syst. 2020, 10 (2), 213-218 e6.
9. Schaffer, L. V.; Millikin, R. J.; Miller, R. M.; Anderson, L. C.; Fellers, R. T.; Ge, Y.; Kelleher,
N. L.; LeDuc, R. D.; Liu, X.; Payne, S. H.; Sun, L.; Thomas, P. M.; Tucholski, T.; Wang, Z.;
Page 16 of 26
ACS Paragon Plus Environment
Journal of Proteome Research
123456789101112131415161718192021222324252627282930313233343536373839404142434445464748495051525354555657585960
17
Wu, S.; Wu, Z.; Yu, D.; Shortreed, M. R.; Smith, L. M., Identification and Quantification of
Proteoforms by Mass Spectrometry. Proteomics 2019, 19 (10), e1800361.
10. Guner, H.; Close, P. L.; Cai, W.; Zhang, H.; Peng, Y.; Gregorich, Z. R.; Ge, Y., MASH Suite:
a user-friendly and versatile software interface for high-resolution mass spectrometry data
interpretation and visualization. J. Am. Soc. Mass Spectrom. 2014, 25 (3), 464-70.
11. Cai, W. X.; Guner, H.; Gregorich, Z. R.; Chen, A. J.; Ayaz-Guner, S.; Peng, Y.; Valeja, S.
G.; Liu, X. W.; Ge, Y., MASH Suite Pro: A Comprehensive Software Tool for Top-Down
Proteomics. Mol. Cell. Proteomics 2016, 15 (2), 703-714.
12. Kessner, D.; Chambers, M.; Burke, R.; Agusand, D.; Mallick, P., ProteoWizard: open source
software for rapid proteomics tools development. Bioinformatics 2008, 24 (21), 2534-2536.
13. Jaitly, N.; Mayampurath, A.; Littlefield, K.; Adkins, J. N.; Anderson, G. A.; Smith, R. D.,
Decon2LS: An open-source software package for automated processing and visualization of
high resolution mass spectrometry data. BMC Bioinformatics 2009, 10, 87.
14. Kou, Q.; Xun, L.; Liu, X., TopPIC: a software tool for top-down mass spectrometry-based
proteoform identification and characterization. Bioinformatics 2016, 32 (22), 3495-3497.
15. Sun, R. X.; Luo, L.; Wu, L.; Wang, R. M.; Zeng, W. F.; Chi, H.; Liu, C.; He, S. M., pTop
1.0: A High-Accuracy and High-Efficiency Search Engine for Intact Protein Identification.
Anal. Chem. 2016, 88 (6), 3082-3090.
16. Park, J.; Piehowski, P. D.; Wilkins, C.; Zhou, M.; Mendoza, J.; Fujimoto, G. M.; Gibbons,
B. C.; Shaw, J. B.; Shen, Y.; Shukla, A. K.; Moore, R. J.; Liu, T.; Petyuk, V. A.; Tolic, N.;
Pasa-Tolic, L.; Smith, R. D.; Payne, S. H.; Kim, S., Informed-Proteomics: open-source
software package for top-down proteomics. Nat. Methods 2017, 14 (9), 909-914.
17. Liu, X.; Inbar, Y.; Dorrestein, P. C.; Wynne, C.; Edwards, N.; Souda, P.; Whitelegge, J. P.;
Bafna, V.; Pevzner, P. A., Deconvolution and database search of complex tandem mass
spectra of intact proteins: a combinatorial approach. Mol. Cell. Proteomics 2010, 9 (12),
2772-82.
18. Liu, X.; Sirotkin, Y.; Shen, Y.; Anderson, G.; Tsai, Y. S.; Ting, Y. S.; Goodlett, D. R.; Smith,
R. D.; Bafna, V.; Pevzner, P. A., Protein Identification Using Top-Down Spectra. Mol Cell.
Proteomics 2012, 11 (6), M111.008524.
19. Horn, D. M.; Zubarev, R. A.; McLafferty, F. W., Automated reduction and interpretation of
high resolution electrospray mass spectra of large molecules. J. Am. Soc. Mass Spectrom.
2000, 11 (4), 320-332.
20. Anderson, L. C.; DeHart, C. J.; Kaiser, N. K.; Fellers, R. T.; Smith, D. F.; Greer, J. B.; LeDuc,
R. D.; Blakney, G. T.; Thomas, P. M.; Kelleher, N. L.; Hendrickson, C. L., Identification and
Characterization of Human Proteoforms by Top-Down LC-21 Tesla FT-ICR Mass
Spectrometry. J. Proteome Res. 2017, 16 (2), 1087-1096.
21. Tran, J. C.; Doucette, A. A., Gel-eluted liquid fraction entrapment electrophoresis: an
electrophoretic method for broad molecular weight range proteome separation. Anal. Chem.
2008, 80 (5), 1568-73.
Page 17 of 26
ACS Paragon Plus Environment
Journal of Proteome Research
123456789101112131415161718192021222324252627282930313233343536373839404142434445464748495051525354555657585960

18
22. Jin, Y.; Diffee, G. M.; Colman, R. J.; Anderson, R. M.; Ge, Y., Top-down Mass Spectrometry
of Sarcomeric Protein Post-translational Modifications from Non-human Primate Skeletal
Muscle. J. Am. Soc. Mass Spectrom. 2019, 30 (12), 2460-2469.
23. McIlwain, S. J.; Wu, Z.; Wetzel, M.; Belongia, D.; Jin, Y.; Wenger, K.; Ong, I. M.; Ge, Y.,
Enhancing Top-Down Proteomics Data Analysis by Combining Deconvolution Results
through a Machine Learning Strategy. J. Am. Soc. Mass Spectrom. 2020, 31 (5), 1104-1113.
24. Chen, B.; Lin, Z.; Zhu, Y.; Jin, Y.; Larson, E.; Xu, Q.; Fu, C.; Zhang, Z.; Zhang, Q.; Pritts,
W. A.; Ge, Y., Middle-Down Multi-Attribute Analysis of Antibody-Drug Conjugates with
Electron Transfer Dissociation. Anal. Chem. 2019, 91 (18), 11661-11669.
25. Mehaffey, M. R.; Sanders, J. D.; Holden, D. D.; Nilsson, C. L.; Brodbelt, J. S., Multistage
Ultraviolet Photodissociation Mass Spectrometry To Characterize Single Amino Acid
Variants of Human Mitochondrial BCAT2. Anal. Chem. 2018, 90 (16), 9904-9911.
26. Park, J.; Piehowski, P. D.; Wilkins, C.; Zhou, M.; Mendoza, J.; Fujimoto, G. M.; Gibbons,
B. C.; Shaw, J. B.; Shen, Y.; Shukla, A. K.; Moore, R. J.; Liu, T.; Petyuk, V. A.; Tolić, N.;
Paša-Tolić, L.; Smith, R. D.; Payne, S. H.; Kim, S., Informed-Proteomics: open-source
software package for top-down proteomics. Nat. Methods 2017, 14, 909.
27. Marty, M. T.; Baldwin, A. J.; Marklund, E. G.; Hochberg, G. K.; Benesch, J. L.; Robinson,
C. V., Bayesian deconvolution of mass and ion mobility spectra: from binary interactions to
polydisperse ensembles. Anal. Chem. 2015, 87 (8), 4370-6.
28. Marty, M. T., A Universal Score for Deconvolution of Intact Protein and Native Electrospray
Mass Spectra. Anal. Chem. 2020, 92 (6), 4395-4401.
29. Srzentic, K.; Nagornov, K. O.; Fornelli, L.; Lobas, A. A.; Ayoub, D.; Kozhinov, A. N.;
Gasilova, N.; Menin, L.; Beck, A.; Gorshkov, M. V.; Aizikov, K.; Tsybin, Y. O., Multiplexed
Middle-Down Mass Spectrometry as a Method for Revealing Light and Heavy Chain
Connectivity in a Monoclonal Antibody. Anal. Chem. 2018, 90 (21), 12527-12535.
30. Crowe, S. O.; Rana, A. S. J. B.; Deol, K. K.; Ge, Y.; Strieter, E. R., Ubiquitin Chain
Enrichment Middle-Down Mass Spectrometry Enables Characterization of Branched
Ubiquitin Chains in Cellulo. Anal. Chem. 2017, 89 (17), 9610-9610.
31. Rana, A. S. J. B.; Ge, Y.; Strieter, E. R., Ubiquitin Chain Enrichment Middle-Down Mass
Spectrometry (UbiChEM-MS) Reveals Cell-Cycle Dependent Formation of Lys11/Lys48
Branched Ubiquitin Chains. J. Proteome Res. 2017, 16 (9), 3363-3369.
32. Roberts, D. S.; Chen, B.; Tiambeng, T. N.; Wu, Z.; Ge, Y.; Jin, S., Reproducible large-scale
synthesis of surface silanized nanoparticles as an enabling nanoproteomics platform:
Enrichment of the human heart phosphoproteome. Nano Res. 2019, 12 (6), 1473-1481.
33. Wu, C. G.; Chen, H.; Guo, F.; Yadav, V. K.; McIlwain, S. J.; Rowse, M.; Choudhary, A.;
Lin, Z.; Li, Y.; Gu, T.; Zheng, A.; Xu, Q.; Lee, W.; Resch, E.; Johnson, B.; Day, J.; Ge, Y.;
Ong, I. M.; Burkard, M. E.; Ivarsson, Y.; Xing, Y., PP2A-B' holoenzyme substrate
recognition, regulation and role in cytokinesis. Cell Discov. 2017, 3, 17027.
Page 18 of 26
ACS Paragon Plus Environment
Journal of Proteome Research
123456789101112131415161718192021222324252627282930313233343536373839404142434445464748495051525354555657585960

19
TOC
Page 19 of 26
ACS Paragon Plus Environment
Journal of Proteome Research
123456789101112131415161718192021222324252627282930313233343536373839404142434445464748495051525354555657585960

20
Figures
Figure 1. Schematic of the various MASH Explorer functions for proteomics data processing.
Main functions of MASH Explorer include data import, spectral deconvolution, workflow
automation, data validation, protein identification, and graphical output. MASH Explorer utilizes
a new data processing module based on the ProteoWizard Library to accept various data input file
formats from major instrument vendors (e.g. Thermo, Bruker, and Waters). Raw MS and MS/MS
data files are then processed by deconvolution algorithms (i.e. MS-Deconv, TopFD, eTHRASH,
and pParseTD), and database search algorithms (i.e. MS-Align+, TopPIC, pTop, and
MSPathFinderT). MASH Explorer provides a user-friendly interface for data validation,
proteoform identification, and characterization.
Page 20 of 26
ACS Paragon Plus Environment
Journal of Proteome Research
123456789101112131415161718192021222324252627282930313233343536373839404142434445464748495051525354555657585960

21
Figure 2. Illustration of “Discovery Mode” for LC-MS/MS data processing. “Discovery mode”
can handle batch LC-MS/MS raw data files and includes features such as data import, data
processing (deconvolution and database search), and data validation for protein identification. A
simple and user-friendly Workflow Manager GUI automates the search and validation process and
outputs processed data to a tabulated “Mass List” where users can view individual fragment ions
and assign additional PTMs to reflect the fragment ion mapping on individual protein sequences.
Page 21 of 26
ACS Paragon Plus Environment
Journal of Proteome Research
123456789101112131415161718192021222324252627282930313233343536373839404142434445464748495051525354555657585960
22
Figure 3. Top-down proteomics data analysis using “Discovery Mode” in MASH Explorer.
A, Cartoon illustration of a typical “Discovery Mode” top-down LC-MS workflow. B, Venn
diagram showing the overlap of protein identifications using an ensemble of five combined
deconvolution and protein search workflows using a Thermo LC-MS/MS dataset. This combined
deconvolution algorithm capability enables a deeper proteome coverage and enhanced protein
identifications. C, Top-down MS identification and characterization using “Discovery Mode”
workflow with ATP synthase subunit g, mitochondrial and microsomal glutathione S-transferase
1 shown as examples. The MS/MS spectra, sequence tables and fragment ions were output directly
from MASH Explorer. Uniprot-Swissprot accession and protein E-value score are reported for
each protein.
Page 22 of 26
ACS Paragon Plus Environment
Journal of Proteome Research
123456789101112131415161718192021222324252627282930313233343536373839404142434445464748495051525354555657585960

23
Figure 4. Illustration of “Targeted Mode” workflow for MASH Explorer. “Targeted Mode”
workflow includes data import, spectral deconvolution to identify and verify isotopic distributions,
database search based on identified isotopic distributions, and proteoform characterization by
matching identified isotopic distributions to the target proteoform sequence. “Targeted Mode”
helps expedite PTM localization by a simple Ion finder Tool, which searches for fragment ions to
confidently localize PTMs.
Page 23 of 26
ACS Paragon Plus Environment
Journal of Proteome Research
123456789101112131415161718192021222324252627282930313233343536373839404142434445464748495051525354555657585960

24
Figure 5. Characterization of ADC subunits using “Targeted Mode” in MASH Explorer. A,
Intact ADC, brentuximab vedotin (Adcetris), is first subjected to IdeS digestion to cleave the hinge
region and then further reduced to generate the ADC subunits (Fc/2, Lc0, Lc1, Fd0, Fd1, Fd2, and
Fd3). B, The MASH Explorer Ion Finder Tool was used to search through candidate ions and
generate fragment ion maps for the identification and localization of the site-specific drug
conjugation site of a positional isomer of Fd1 subunit. The number in the parentheses represents
the number of drug payloads included in the fragment ion.
Page 24 of 26
ACS Paragon Plus Environment
Journal of Proteome Research
123456789101112131415161718192021222324252627282930313233343536373839404142434445464748495051525354555657585960
25
Figure 6. Protein sequence characterization and fragment ion mapping of Fd1 isomer from
an ADC. Fragment ion map shows both CID and ETD fragment ions. Fragment ions were used to
confirm the specific localization of a drug site of an Fd1 isomer. The pink star represents the
cysteine-conjugated drug warhead corresponding to the Adcetris drug molecule. The data shown
corresponds to the ADC fragmentation data shown in Figure 5.
Page 25 of 26
ACS Paragon Plus Environment
Journal of Proteome Research
123456789101112131415161718192021222324252627282930313233343536373839404142434445464748495051525354555657585960
26
Figure 7. Cartoon schematic of a “world map” featuring the location distribution of MASH
users across the globe. There are currently 625 active users (03/24/2020) with ~53% of users
from North America, ~31% from Europe, and ~11% from Asia.
Page 26 of 26
ACS Paragon Plus Environment
Journal of Proteome Research
123456789101112131415161718192021222324252627282930313233343536373839404142434445464748495051525354555657585960