Microclot array elastometry for integrated measurement of ...
13
ARTICLE Microclot array elastometry for integrated measurement of thrombus formation and clot biomechanics under fluid shear Zhaowei Chen 1 , Jiankai Lu 1 , Changjie Zhang 2 , Isaac Hsia 1 , Xinheng Yu 2 , Leo Marecki 1 , Eric Marecki 1 , Mohammadnabi Asmani 1 , Shilpa Jain 3 , Sriram Neelamegham 2 & Ruogang Zhao 1 Blood clotting at the vascular injury site is a complex process that involves platelet adhesion and clot stiffening/contraction in the milieu of fluid flow. An integrated understanding of the hemodynamics and tissue mechanics regulating this process is currently lacking due to the absence of an experimental system that can simultaneously model clot formation and measure clot mechanics under shear flow. Here we develop a microfluidic-integrated microclot-array-elastometry system (clotMAT) that recapitulates dynamic changes in clot mechanics under physiological shear. Treatments with procoagulants and platelet antago- nists and studies with diseased patient plasma demonstrate the ability of the system to assay clot biomechanics associated with common antiplatelet treatments and bleeding disorders. The changes of clot mechanics under biochemical treatments and shear flow demonstrate independent yet equally strong effects of these two stimulants on clot stiffening. This microtissue force sensing system may have future research and diagnostic potential for various bleeding disorders. https://doi.org/10.1038/s41467-019-10067-6 OPEN 1 Department of Biomedical Engineering, State University of New York at Buffalo, Buffalo, NY 14260, USA. 2 Department of Chemical and Biological Engineering and Clinical & Translational Research Center, State University of New York at Buffalo, Buffalo, NY 14260, USA. 3 Hemophilia Center of Western New York, Department of Pediatrics, Division of Pediatric Hematology-Oncology, John R. Oishei Children’s Hospital of Buffalo, Buffalo, NY 14203, USA. Correspondence and requests for materials should be addressed to S.N. (email: [email protected]) or to R.Z. (email: [email protected]) NATURE COMMUNICATIONS | (2019)10:2051 | https://doi.org/10.1038/s41467-019-10067-6 | www.nature.com/naturecommunications 1 1234567890():,;
Transcript of Microclot array elastometry for integrated measurement of ...

ARTICLE
Microclot array elastometry for integratedmeasurement of thrombus formation andclot biomechanics under fluid shearZhaowei Chen 1, Jiankai Lu1, Changjie Zhang2, Isaac Hsia1, Xinheng Yu 2, Leo Marecki1, Eric Marecki1,
Mohammadnabi Asmani 1, Shilpa Jain3, Sriram Neelamegham2 & Ruogang Zhao 1
Blood clotting at the vascular injury site is a complex process that involves platelet adhesion
and clot stiffening/contraction in the milieu of fluid flow. An integrated understanding of the
hemodynamics and tissue mechanics regulating this process is currently lacking due to the
absence of an experimental system that can simultaneously model clot formation and
measure clot mechanics under shear flow. Here we develop a microfluidic-integrated
microclot-array-elastometry system (clotMAT) that recapitulates dynamic changes in clot
mechanics under physiological shear. Treatments with procoagulants and platelet antago-
nists and studies with diseased patient plasma demonstrate the ability of the system to assay
clot biomechanics associated with common antiplatelet treatments and bleeding disorders.
The changes of clot mechanics under biochemical treatments and shear flow demonstrate
independent yet equally strong effects of these two stimulants on clot stiffening. This
microtissue force sensing system may have future research and diagnostic potential for
various bleeding disorders.
https://doi.org/10.1038/s41467-019-10067-6 OPEN
1 Department of Biomedical Engineering, State University of New York at Buffalo, Buffalo, NY 14260, USA. 2Department of Chemical and BiologicalEngineering and Clinical & Translational Research Center, State University of New York at Buffalo, Buffalo, NY 14260, USA. 3 Hemophilia Center of WesternNew York, Department of Pediatrics, Division of Pediatric Hematology-Oncology, John R. Oishei Children’s Hospital of Buffalo, Buffalo, NY 14203, USA.Correspondence and requests for materials should be addressed to S.N. (email: [email protected]) or to R.Z. (email: [email protected])
NATURE COMMUNICATIONS | (2019) 10:2051 | https://doi.org/10.1038/s41467-019-10067-6 | www.nature.com/naturecommunications 1
1234
5678
90():,;

B lood clotting at the vascular injury site is a complex bio-mechanical process mediated by several key factorsincluding platelet deposition and contraction, clot stiffening
and hemodynamic forces1,2. In hemostasis, the interplay of thesemechanical factors leads to strong clots that stem bleeding, but inclotting disorders such as von Willebrand disease (VWD), dis-rupted biomechanical interactions lead to weak clots and bleed-ing3–5. Although different aspects of the clotting problem such asshear flow-mediated platelet adhesion and single plateletmechanics have been studied in the past6,7, an integratedunderstanding of the interplay between clot mechanics andhemodynamic shear is still missing. This is mainly due to the lackof combined capacity to model and measure clotting mechanicsin the presence of shear flow in existing research models.
Recent technological advancement has resulted in the evolutionof independent approaches that focus on different parts of theclotting problem. For example, microfluidics systems create well-controlled blood flow in matrix protein-coated microchannels,and thus they have become a widely used vascular injury modelfor the study of platelet adhesion, aggregation and thrombusformation8. These systems are powerful tools to study the effectsof various flow conditions, surface chemistries and coagulationfactors on platelet adhesion and aggregation9–13; however, theyare not equipped with the ability to measure clot mechanics.Furthermore, matrix proteins are coated on glass or relativelyrigid surfaces, which do not mimic the physiological stiffness ofexposed matrix at vascular injury sites. In the study of plateletmechanics, atomic force microscopy and flexible micropost arrayshave been used to measure single platelet-generated contractileforces under static conditions2,14, and matrix protein microdotarrays have been used to study the effects of substrate stiffnessand mechanosensitive signaling pathways on platelet-generatedcontractile force15,16. Single platelet-mediated fibrin fiber remo-deling has also been studied using confocal microscopy17. Whilethese studies provide important information on plateletmechanics, they do not include the effect of hemodynamic forcesand offer limited insight into clot mechanics at the tissue level. Inthe clinic, cup and cone type of rheometers, also known asthromboelastography (TEG) or rotation thromboelastometry(ROTEM), have been developed to measure clot stiffness at dif-ferent stages of the coagulation process18,19. Although thesesystems provide useful information that can assist the diagnosis ofcoagulation disorders, their consideration of hemodynamic flowand platelet−matrix interactions is inadequate. As a result, theirdiagnostic power is limited and they are seldom applied for dis-orders of primary hemostasis, like VWD18,19. Together, the lackof an integrated system that can follow clot formation andmechanical properties in the presence of shear flow has hinderedan integrated understanding of the biomechanical events occur-red during blood clotting.
With recent advent of microfabrication technology, we andothers have created microtissue array-based mechanical sensingplatforms that allow simultaneous control of tissue formation andmeasurement of tissue mechanics20–22. In this system, cellcontraction-mediated self-assembly of matrix proteins such ascollagen and fibrin leads to the formation of submillimetermicrotissues that anchor on top of multiple flexible poly(dime-thylsiloxane) (PDMS) micropillars. These micropillars serve asmechanical sensors that can report in-situ tissue mechanicalproperties. The composition and stiffness of these microtissues,contributed both by preseeded and cell-secreted matrix proteins,mimic those of native vascular tissue. By virtue of their smalldimensions, the microtissues offer orders of magnitude scale-upadvantages over conventional bulk hydrogel models and open upthe possibility to integrate with microfluidics. This system hasbeen used to study the mechanics of cardiac and skeletal muscles,
fibrotic tissues and wound healing21,23–27; however, it has notbeen integrated with the shear flow.
In the current study, we develop a microfluidic-integratedmicroclot array elastometry (clotMAT) system by integrating acollagen microtissue array-based mechanical sensing platformwith platelet flow. This system recapitulates the dynamic processof platelet adhesion and clot formation under various flow con-ditions and reports changes in clot mechanical properties in realtime. Through platelet agonist (ADP and thrombin) treatments,we dissected the contributions of hemodynamic and tissue/cellforces to clot stiffening. Treatments with platelet antagonist(glycoprotein receptor antibodies, blebbistatin and acetylsalicyclicacid (ASA)) further enabled the examination of the effects ofplatelet adhesion and cytoskeletal tension on clot mechanics. Theutility of the clotMAT system in bleeding disorders wasdemonstrated through the study of clotting mechanics of VWD.Integrated analysis of results show strong correlation between clotstiffness, clot contractile force and the level of clot retraction(volume shrinkage) under both biochemically treated conditionsand shear flow conditions, suggesting these two stimulantsindependently yet equally strongly affect clot remodeling andstiffening. This finding unveils the tissue remodeling/stiffeningmechanism in a previously unexplored shear flow regime, andthus it significantly expands the boundary of previously estab-lished tissue remodeling theory. Together, this work describes aphysiologically relevant microtissue force sensing system for thestudy of normal and abnormal clot biomechanics under shearflow, which may have future research and diagnostic potential forvarious bleeding disorders.
ResultsMicroclot array formation under platelet flow. The clotMATdevice consists of three functional layers including a top PDMSlayer containing multiple microfluidic channels for platelet flow, amiddle PDMS layer containing arrays of collagen microtissuesthat capture flowing platelets and report clot contractile forces,and a bottom stretchable silicone membrane for clot stiffnessmeasurement (Fig. 1a, b). The middle and bottom layers werebonded through the formation of irreversible covalent bondsupon casting liquid PDMS on silicone membrane, and the topand middle layers were bonded temporarily through sustainedpressure (Supplementary Fig. 1). We fabricated the middle PDMSlayer using a multilayer photolithography and soft-lithographytechnique as previously described21,28. An array of submillimeter-size microwells (13 columns by 6 rows) were cast in the middlePDMS layer, and each microwell contains a pair of flexible PDMSmicropillars that serve as force sensors to report clot-generatedcontractile forces (Fig. 1a, b). A single micropillar consists of aslim leg section and an enlarged head section that providesmechanical constraint to the suspended microtissue (Supple-mentary Fig. 2). The collagen microtissue array was fabricated byutilizing endothelial cell-mediated collagen gel compaction(Supplementary Movie 1)21. Additional steps were performed toremove originally seeded endothelial cells after dog-bone-shapedmicrotissue formation (Supplementary Fig. 1), in order to reca-pitulate the matrix composition anticipated during vascularinjury. The resulting individual bare micro-collagen matrix hangsbetween the heads of a pair of flexible micropillars (Supplemen-tary Figs. 2, 3), mimicking exposed subendothelial collagen atvessel injury sites and avoiding the effect of rigid substrates usedin existing microfluidic devices12. The bare collagen microtissuesmeasure 132.7 ± 17.2 µm (mean ± SD, 113 replicates) wide and80.7 ± 5.9 µm (16 replicates) thick. The microfluidic channels inthe top PDMS layer were aligned with individual rows of collagenmicrotissues in the middle layer (Supplementary Fig. 4).
ARTICLE NATURE COMMUNICATIONS | https://doi.org/10.1038/s41467-019-10067-6
2 NATURE COMMUNICATIONS | (2019) 10:2051 | https://doi.org/10.1038/s41467-019-10067-6 | www.nature.com/naturecommunications
When the microchannels were perfused with citrated platelet-rich plasma (PRP), flowing platelets were arrested on a row ofindividual micro-collagen matrices contained by the microchan-nel (Fig. 1c−e). The adhered platelets gradually covered thecollagen matrix, as demonstrated by the gradual increase influorescence intensity of the microtissue (SupplementaryMovie 2). Over a period of 30 min, platelets continued toaggregate and fibrin continued to polymerize over the collagenmatrix surface, leading to the formation of a submillimeter-sizedmicroclot hanging between two micropillars (Fig. 1f, g). SEM andconfocal imaging of microclots formed using healthy PRP showthat aggregated platelets and fibrin meshwork together formed athick clot shell covering the bare collagen core. The width of thewhole microclot is 83.3 ± 9.2 µm (14 replicates). The thickness ofthe clot shell is 28.2 ± 7.6 µm (14 replicates) and that of the wholeclot is 64.1 ± 5.8 µm (14 replicates, Supplementary Figs. 5–7).Compared to the bare collagen matrix before flow, the size of the
collagen core decreased after platelet flow. Such compaction ofthe matrix is contributed by the collective contraction ofactivated platelets, as detected by the deflection of the micropillars(Fig. 1f, g).
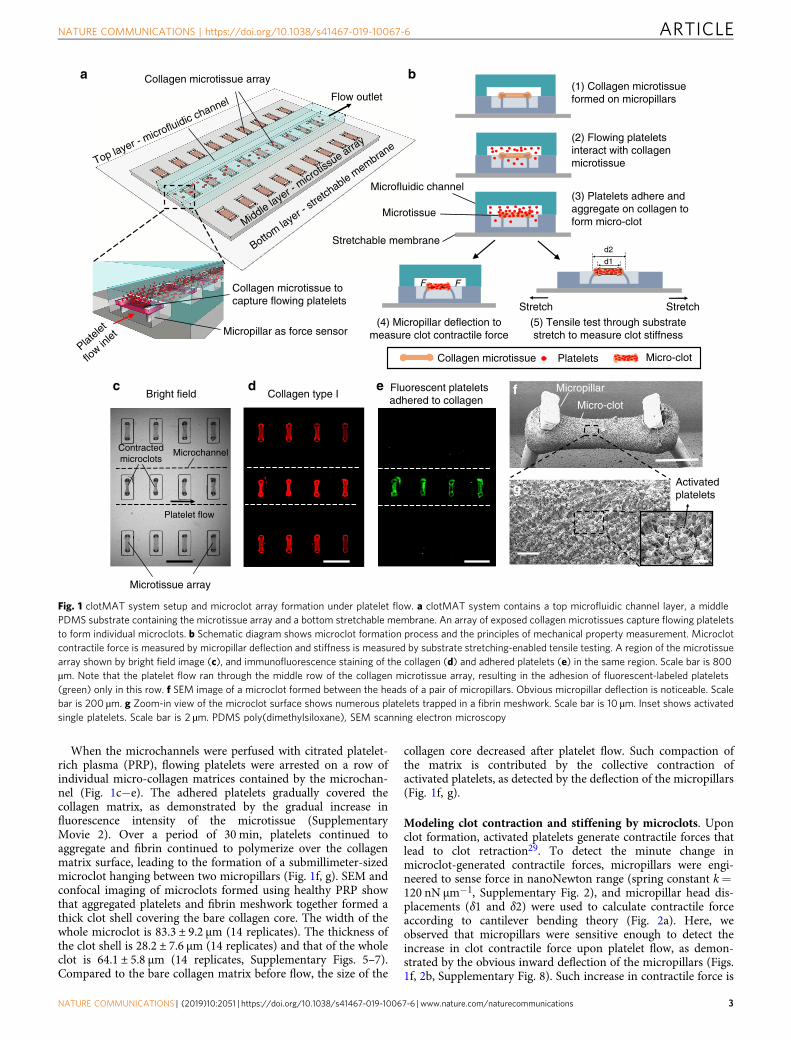
Modeling clot contraction and stiffening by microclots. Uponclot formation, activated platelets generate contractile forces thatlead to clot retraction29. To detect the minute change inmicroclot-generated contractile forces, micropillars were engi-neered to sense force in nanoNewton range (spring constant k=120 nN μm−1, Supplementary Fig. 2), and micropillar head dis-placements (δ1 and δ2) were used to calculate contractile forceaccording to cantilever bending theory (Fig. 2a). Here, weobserved that micropillars were sensitive enough to detect theincrease in clot contractile force upon platelet flow, as demon-strated by the obvious inward deflection of the micropillars (Figs.1f, 2b, Supplementary Fig. 8). Such increase in contractile force is
(2) Flowing plateletsinteract with collagenmicrotissue
(1) Collagen microtissueformed on micropillarsFlow outlet
(3) Platelets adhere andaggregate on collagen toform micro-clot
(4) Micropillar deflection tomeasure clot contractile force
(5) Tensile test through substratestretch to measure clot stiffness
a b
Activatedplatelets
Bright field
Platele
t
flow in
let
Collagen type IFluorescent plateletsadhered to collagen
c d
g
Collagen microtissue array
Collagen microtissue tocapture flowing platelets
Micropillar as force sensor
d1
StretchStretch
Microtissue array
Platelet flow
Microchannel
Micro-clot
Micropillare f
d2
Collagen microtissue Platelets Micro-clot
Contractedmicroclots
Microfluidic channel
Microtissue
Stretchable membraneBottom la
yer -
stretch
able membrane
Middle laye
r - micr
otissue arra
y
Top layer - microfluidic channel
FF
Fig. 1 clotMAT system setup and microclot array formation under platelet flow. a clotMAT system contains a top microfluidic channel layer, a middlePDMS substrate containing the microtissue array and a bottom stretchable membrane. An array of exposed collagen microtissues capture flowing plateletsto form individual microclots. b Schematic diagram shows microclot formation process and the principles of mechanical property measurement. Microclotcontractile force is measured by micropillar deflection and stiffness is measured by substrate stretching-enabled tensile testing. A region of the microtissuearray shown by bright field image (c), and immunofluorescence staining of the collagen (d) and adhered platelets (e) in the same region. Scale bar is 800µm. Note that the platelet flow ran through the middle row of the collagen microtissue array, resulting in the adhesion of fluorescent-labeled platelets(green) only in this row. f SEM image of a microclot formed between the heads of a pair of micropillars. Obvious micropillar deflection is noticeable. Scalebar is 200 µm. g Zoom-in view of the microclot surface shows numerous platelets trapped in a fibrin meshwork. Scale bar is 10 µm. Inset shows activatedsingle platelets. Scale bar is 2 µm. PDMS poly(dimethylsiloxane), SEM scanning electron microscopy
NATURE COMMUNICATIONS | https://doi.org/10.1038/s41467-019-10067-6 ARTICLE
NATURE COMMUNICATIONS | (2019) 10:2051 | https://doi.org/10.1038/s41467-019-10067-6 | www.nature.com/naturecommunications 3

accompanied by significant increase in tissue-level fluorescenceintensity (Fig. 2c, d), confirming that contractile force is mainlygenerated by aggregated platelets. In contrast, shear flow withoutplatelet has negligible effect on measured contractile force (Sup-plementary Fig. 9).
During clot remodeling, progressive clot retraction is oftenaccompanied by clot stiffening2. In the clotMAT system,microclot stiffness was measured by tensile testing, which wasenabled by stretching the bottom silicone membrane (Fig. 2e,Supplementary Fig. 10a–c). Externally applied tensile force wasreported by micropillar deflection as F= k (δ1′+ δ2′)/2, and themicrotissue tensile strain was determined based on imagetracking of the displacement of fiducial markers in themicrotissue before and after stretch (Supplementary Fig. 11).The stress and strain relationship derived from tensile testing
results was then used to calculate microclot stiffness (Supple-mentary Fig. 10d). Under the same amount of substrate stretch,the forced elongation of the microclot (δ1′micro_clot+ δ2′micro_clot)was less than that of bare collagen microtissue (δ1′collagen+δ2′collagen) (Fig. 2f), indicating higher resistance to the stretch andthus higher stiffness of the microclots as compared to that of thebare collagen microtissues. The stiffness of the bare collagenmatrix (5.7 ± 0.8 kPa, 36 replicates) falls within the range that hasbeen shown to be optimal for platelet adhesion andactivation15,16, and thus it allows the modeling of plateletadhesion on physiologically soft subenthothelial matrix and is asubstantial improvement over collagen coating on rigid substratesin existing microfluidic devices (Fig. 2g). The stiffness ofmicroclots (18.0 ± 2.8 kPa, 34 replicates), formed under 30 minof citrated PRP flow at 500 s−1 shear rate, is much higher than
b Phase contrast Fluorescent
**
g
Bare collagen Microclot
Pre_stretch
Post_stretch
�1′collagen �2′collagen �2′microclot�1′microclot
Post_stretch
�1′ �2′
Stretchablemembrane
Pre_stretch
Stretch Stretch
Stiffness (E ) =2Wt
( �1′+�2′) / (d2−d1
d1)
d1
d2
t
a
Post_flow
Pre_flow
Contractile force measurement
�1 �2
F F
F
L
�
Contractile force (F ) = 3EIL3 �
c d
e f
Post_flow
Pre_flow
Stiffness measurement
*
k
10
5
0Pre_flow Post_flow
Collagen Micro-clot
Pre_flow Post_flow
μTis
sue
cont
ract
ilefo
rce
(μN
)
μTis
sue
stiff
ness
(kP
a)
Flu
ores
cenc
ein
tens
ity (
a.u.
)
10
20
0
10
20
30
0
Fig. 2 Measurement of clot contraction and stiffening in the microclot array. Schematic diagram (a) and phase contrast and fluorescence (b) sideviewimages of a microtissue before and after platelet-mediated contraction. Micropillar deflection (δ1 and δ2) can be easily detected after platelet adhesion andactivation (postflow), which was used to calculate microclot-generated contractile force. Comparison of microtissue contractile force (c) and fluorescenceintensity (d) before and after platelet flow. e Schematic diagram of microtissues before and after externally applied stretching. Mechanical stretchingcaused microtissue elongation (d2–d1), which was used to calculate tensile strain; the force needed to develop such elongation was reported by micropillardeflection as F= k(δ1′+ δ2′)/2 which was used to calculate the tensile stress. Microtissue stiffness was determined based on stress−strain relationship.f Comparison of tissue elongation between a microclot and a bare collagen microtissue under the same amount of substrate stretch. g Comparison of thestiffness between microclots and bare collagen microtissues. *P < 0.001, n > 10, each dot in box plot represents an independent experiment. All box plotswith whiskers represent the data distribution based on five number summary (maximum, third quartile, median, first quartile, minimum). Statisticalsignificance was determined by unpaired t test with Welch’s correction method. Scale bar is 200 µm
ARTICLE NATURE COMMUNICATIONS | https://doi.org/10.1038/s41467-019-10067-6
4 NATURE COMMUNICATIONS | (2019) 10:2051 | https://doi.org/10.1038/s41467-019-10067-6 | www.nature.com/naturecommunications

that of the bare collagen matrix and agrees well with the stiffnessof laboratory-created thromboembolic analog30. Such differencein measured stiffness suggests that the clotMAT device is sensitiveenough to detect the stiffness increase occurred during microclotformation and remodeling.
In addition to the standard sample preparation condition(citrated PRP), we also tested the utility of the clotMAT systemunder several other common preparation conditions, includingthe use of whole blood, recalcified PRP samples and differentanticoagulants. Since red blood cells (RBCs) interfere with opticaldetection, we washed away unbounded RBCs at the end of 30 minof whole blood flow at 500 s−1 shear rate and measured themicroclot properties (Supplementary Fig. 13). Here, we observedthat the size of the microclot formed with whole blood is largerand the contraction force is higher as compared to the microclotsformed with PRP. Recalcification of citrated PRP significantlyincreased platelet adhesion, leading to the formation of a large,loose clot that hung above the microtissue and blocked thechannel after 10 min of flow. Due to the relatively short flowperiod, we did not detect significant difference in the contractionforce between microclots formed under citrate PRP vs. recalcifiedPRP (Supplementary Fig. 14). We also compared the properties ofmicroclots formed under different anticoagulants. PRP sampleswere prepared using either sodium citrate or D-phenylalanyl-L-prolyl-L-arginine chloromethyl ketone (70 µM PPACK, a throm-bin inhibitor). Here, we observed more platelet binding andhigher contractile force generation in the early stage (first 10 min)of flow experiment in the PPACK group compared to the citrategroup (Supplementary Fig. 15). Even though platelets are robustlyactivated by collagen regardless of the anticoagulant (Supple-mentary Fig. 16), PPACK restricts thrombin-mediated fibrinformation (Supplementary Fig. 17). The lack of fibrin commonlyresulted in platelet detachment/thromboembolism in the PPACKrun and this is observed as a decrease in platelet fluorescenceintensity and contractile force in the mid to late stage (10–30min) of the flow experiment in the clotMAT system (Supple-mentary Fig. 15)31. Treatment of the PPACK group withthrombin receptor activator peptide 6 (TRAP 6) rescued thedecrease in fluorescence intensity during mid to late stage of theflow experiment in the clotMAT system but had no effect oncontractile force (Supplementary Fig. 15). Overall, while fibrinformed by locally released thrombin from platelets maycontribute to clot formation, stabilization and part of thecontraction, contractile forces generated by the activated plateletsand transmitted via direct adhesive interactions between plateletsand the collagen matrix may be the primarily driver of clotcontraction. Additionally, these results demonstrate the ability ofthe clotMAT system to model and measure clot formation undervarious coagulation conditions.
Microclot mechanics under various shear flow conditions. As ademonstration of the integrated modeling and measurementcapacity of the clotMAT system, we studied clot mechanics undervarious shear flow-mediated clotting conditions. Thus, fluid shearrate was varied from 3 to 1500 s−1, and microtissue contractileforce, fluorescence intensity, stiffness and tissue volume weremeasured over 30 min of citrated PRP flow (Fig. 3a). For all theshear rates tested, we observed that microtissue contractile forceand fluorescence intensity continuously increased over the 30-min period (Fig. 3b−d). However, microtissue width and topviewarea continuously decreased during the same period (Supple-mentary Fig. 18a, b). The changing rate of these parameters (i.e.the slope of time-dependent curves) increased with increased flowrate (Fig. 3b−d, Supplementary Fig. 18a, b), indicating a shear-rate-dependent alteration in microclot properties. Indeed,
comparison of results between different flow rates revealed thattissue fluorescence intensity, microclot contractile force andmicroclot stiffness increased with increased shear rate (Fig. 3e–g),but microclot thickness and volume decreased with increasedflow rate (Fig. 3h, Supplementary Fig. 19). Together, the dataindicate that increased shear rate promotes platelet adhesion,microclot contractile force generation, volume retraction andstiffening. Such shear-rate-dependent changes in microclot tissuemechanics may be due to the nature of shear-rate-dependentplatelet adhesion.
Platelet agonist and antagonist treatments on microclots. Webiochemically characterized the clotMAT system using a range ofagonist/procoagulants and antagonists (Fig. 4a). First, in order todissect the contributions of platelet number and the contractilityof individual platelets to clot stiffness and contractility, we per-fused 10 μM ADP or 5 UmL−1 thrombin over microclots thatwere previously formed under 30 min flow of citrated PRP at500 s−1. Since platelets were absent in the agonists-containingperfusion buffer, the number of recruited platelets was compar-able between this experiment and the standard flow condition.Consistent with this notion, neither ADP nor thrombin causedsignificant change in the microclot fluorescence intensity(Fig. 4b). However, both stimuli significantly increased microclotcontractile force and stiffness, and decreased microclot volume(Fig. 4c–e, Supplementary Fig. 20), with the effects of ADP beinggreater compared to thrombin under the conditions tested. Thestiffness of ADP-treated microclots (28.4 ± 6.1 kPa, 22 replicates)was 56% higher than that of untreated microclots and agrees wellwith the stiffness of fresh thrombi (26 ± 2.6 kPa) collected fromcarotid and cerebral arteries in stroke patients30. Since the abovechanges in the clot mechanical properties were not due toalterations in platelet number, these data confirm that individualplatelet-generated contractile force, rather than simply plateletnumber, contribute to the measured changes in clot stiffness andvolume. The more profound effect of ADP (MW 427 Da) com-pared to thrombin (MW 37 kDa) in this setting may be due to itssmaller size which enables greater penetration into the platelet-dense clot, unlike thrombin which would be diffusion limited32,33.Indeed, when thrombin or ADP was added to citrated PRP justprior to flow, thrombin caused the formation of larger, fibrin-richclots that blocked the flow channel within minutes (Supplemen-tary Fig. 21).
To determine the molecular players regulating clotting in thismodel, we applied antagonists against the platelet glycoproteinreceptor GpIbα epitope (mAb HIP1) that recognizes vonWillerbrand factor (VWF), and also a GpIIb-IIIa receptorantagonist (Abciximab) at both venous (500 s−1) and arterial(1500 s−1) shear rates. Here, antagonist treatment significantlyinhibited platelet binding to the collagen matrix and associatedfluorescence intensity (Fig. 4f, g). Reduction in microclotcontractile force and stiffness (Fig. 4h, i) and increase inmicroclot volume (Fig. 4j, Supplementary Fig. 20) were alsoobserved under these treatments as compared to untreated PRP,indicating lack of functional platelet activity. Among theantagonists, inhibition of GpIIb-IIIa function by Abciximabblocked platelet recruitment, clot contraction and stiffening at allshear rates while the anti-GpIbα mAb (HIP1) was more effectiveonly at the higher shear rate, 1500 s−1 (Fig. 4f–j). This isconsistent with the known property of GpIbα−VWF interactionin the arterial shear regime8,34. Together, these observations areconsistent with the notion that initial platelet recruitment isfacilitated by GpIbα binding to VWF that is initially recruitedonto the collagen matrix35. This is likely followed by theengagement of GpIIb-IIIa and other proteins that engage platelets
NATURE COMMUNICATIONS | https://doi.org/10.1038/s41467-019-10067-6 ARTICLE
NATURE COMMUNICATIONS | (2019) 10:2051 | https://doi.org/10.1038/s41467-019-10067-6 | www.nature.com/naturecommunications 5

onto the extracellular matrix36,37. The colocalization of fibrin andplatelet signals in confocal images suggests that platelet adhesionand fibrin formation occur over overlapping time scales(Supplementary Figs. 5 and 6).
In addition to platelet antagonists, we also used a myosin IIAinhibitor blebbistatin to simulate platelet myosin IIAimpairment-induced clotting disorder, such as those seen inMay-Hegglin anomaly, Fechtner, Epstein, and Sebastian
Evaluation of microclot properties
Platelet binding: Fluorescent intensity
Mechanics: Contractile force, microclot volume,microclot stiffness.
Varied shearflow rates
PRP
a
b e
Pre_flow
10 mins
20 mins
30 mins
5 mins
Phase contrast FluorescentL pre
L 5 min
L 10 min
L 20 min
L 30 min
Fluorescent
f
g
h
Phase contrastTime dependent effects Flow rate dependent effects
500 s–1 flow
3 s–1 flow
33 s–1 flow
167 s–1 flow
1500 s–1 flow
L 3 s–1
L 33 s–1
L 167 s–1
L 500 s–1
L 1500 s–1
**
**
*
c
d
**
**
**
*
**
NS
*
1010
8
6
4
2
0
30
20
10
0
10
8
6
4
2
Pre_flow 3 s–1 33 s–1 167 s–1
Shear rate
500 s–1 1500 s–1
Pre_flow 3 s–1 33 s–1 167 s–1
Shear rate
500 s–1 1500 s–1
Pre_flow 3 s–1 33 s–1 167 s–1
Shear rate500 s–1 1500 s–1
12
μTis
sue
cont
ract
ile fo
rce
(μN
)
μTis
sue
cont
ract
ilefo
rce
(μN
)μT
issu
e st
iffne
ss (
kPa)
μTis
sue
volu
me
(106
μm3 )
Flu
ores
cenc
e in
tens
ity (
a.u.
)
8
6
4
2
0
0
5
10
15
20
0 10 20Minutes
30 40
0 10 20Minutes
30 40
1500 s–1
500 s–1
167 s–1
33 s–1
3 s–1
1500 s–1
500 s–1
167 s–1
33 s–1
3 s–1
ARTICLE NATURE COMMUNICATIONS | https://doi.org/10.1038/s41467-019-10067-6
6 NATURE COMMUNICATIONS | (2019) 10:2051 | https://doi.org/10.1038/s41467-019-10067-6 | www.nature.com/naturecommunications

syndromes38. Blebbistatin treatment in citrated PRP flow for 30min at 500 s−1 shear rate resulted in faint fluorescence (Fig. 4f, g),a significant reduction in microtissue contractile force andstiffness (Fig. 4h, j), and an increase in microtissue volume(Fig. 4j, Supplementary Fig. 20), as compared to untreated PRPsample. Such impairment on the microclot mechanical propertiesby blebbistatin is consistent with its effects on disruptingthrombus consolidation and stability reported in the previousstudy39. To examine the diagnostic potential of the clotMATsystem, we tested the response of the clotMAT system toacetylsalicylic acid (ASA, aspirin) treatment. ASA treatment ofcitrated PRP resulted in significant reductions in microtissuefluorescence (Fig. 4f, g), microtissue contractile force, stiffness(Fig. 4h, i), and an increase in microtissue volume (Fig. 4j,Supplementary Fig. 20), as compared to untreated PRP sample,which is consistent with previous study40. Overall, these datademonstrate that the clotMAT mimics molecular aspectspreviously reported in classical flow chamber/microfluidicssystems in collagen-based substrate assays8; only now we canalso simultaneously measure platelet contractility and clotstiffness.
VWD patient sample results in mechanically weak microclots.We determined if the clotMAT system can be used for thediagnosis of bleeding disorders. To this end, we used VWD (vonWillebrand Disease) type 2A patient plasma due to the prevalenceof this disease and the role of VWF on platelet adhesion in thissystem (Fig. 5a). In these patients, enhanced ADAMTS13-mediated proteolysis results in deficiency in high molecularmass VWF multimers, lower plasma VWF concentrations andreduced shear-induced platelet activation (SupplementaryFig. 22). Flow experiments using reconstituted VWD PRP(rVWD PRP) for 30 min at 500 s−1 resulted in faint fluorescencein microtissues, indicating significant reduction in platelet bind-ing to collagen (Fig. 5b, c). Microtissue contractile force andstiffness were also lower and microtissue volume was higher inreconstituted VWD sample as compared to control samplesincluding both healthy PRP and reconstituted healthy PRP(rHealthy PRP) (Fig. 5d−f). Together, these results demonstratethat the clotMAT device is sensitive enough to detect the changein clot mechanics associated with bleeding disorders.
Effects of biochemicals and shear flow on clot stiffening. Theability of the clotMAT system to report major mechanical para-meters involved in clotting process enables us to perform inte-grated, quantitative analysis of these parameters. Using datacollected from different clotting experiments performed undervarious flow and coagulation conditions, we performed regressionanalyses of the microclot contractile force against its stiffness andvolume. We then compare the regression slopes between flow-mediated condition and biochemically induced coagulation con-ditions. Here microclot volume is used as a quantitative
measurement of the clot retraction level. For biochemicallyinduced coagulation conditions (procoagulation factors, antago-nists, VWD patient sample), we observed strong correlationsbetween microclot stiffness and its contractile force (R2= 0.97,Fig. 6a, Supplementary Fig. 23) and between microclot volumeand its contractile force (R2= 0.93, Fig. 6b). For all shear ratestested (3−1500 s−1 shear rate), strong correlations between thesemechanical parameters were also observed (R2= 0.96−0.97,Fig. 6c, d, Supplementary Fig. 23). Interestingly, no significantdifference was found for the regression slopes between these twoexperimental groups, indicating these two types of stimulantsindependently yet equally strongly affect clot remodeling andstiffening.
To further dissect the biomechanical parameters involved inclot contraction and retraction, we performed finite element (FE)analysis of the microclot retraction process by representing thecontractile platelet population using contractile 3D elements27,41.Due to the geometrical restriction by two micropillars at bothends, microclot contraction causes volume shrinkage and thedevelopment of necking in the middle section (Fig. 6e, Supple-mentary movie 3), mimicking the microclot retraction processobserved in the experiment. Simulated decrease in microclotvolume almost linearly correlates with increased contractile stressacross all force ranges (Fig. 6f), recapitulating the experimentalcorrelation between these two measurements, as shown in Fig. 6b, d.These results suggest that clot retraction is driven by the collectivecontractile force of the platelet population, which may beactivated by biochemical treatments and shear flows.
DiscussionThe mechanical properties of blood clots are critical to stembleeding upon vessel injury, and may also contribute to embo-lism. Despite numerous studies on platelet mechanics2,14,15, littleis known about the origin of tissue-level clot mechanicalproperties1,29. Commonly used tissue mechanics models such ascell-laden bulk hydrogel models do not recapitulate the dynamicflow environment that is critical to clot formation and are low-throughout and time and resource intensive42,43. We describedherein a medium-throughput clotMAT system with integratedflow and mechanical measurement capacity. Using a panel ofagonist and antagonist used in classical vascular injury models,we demonstrate the ability of this system to integrate the bio-molecular players and shear stresses that are known to be criticalin vivo. The system recapitulates the evolution of clot morphol-ogy and mechanical properties under normal and abnormalclotting conditions. Since clot mechanical properties are widelyused in the clinic as indicators for blood coagulation functions,the knowledge gained in this study may help to improve thediagnosis and treatment of coagulation disorders.
Initial platelet adhesion in the clotMAT system is dependenton collagen, VWF, and the platelet receptors GpIbα andGpIIbIIIa. In this regard, whereas blocking GpIIbIIIa inhibitsplatelet accumulation at all shear rates, GpIbα−VWF interactions
Fig. 3 Microclot mechanics under various shear flow conditions. a Overview of the approach for evaluating microclot mechanics under various shear flowconditions. b Time-lapsed phase contrast and fluorescence images of a microclot formed under 167 s−1 shear rate. The number of adhered platelets andmicroclot contraction gradually increased over a 30-min period, as demonstrated by gradually increased microtissue fluorescence intensity and decreasedmicropillar distance (L). Measured microclot contractile force (c), fluorescence intensity (d) over the 30-min time period for 3, 33, 167, 500 and 1500 s−1
shear rates. e Phase contrast and fluorescence images of microclots formed after 30min flow under different shear rates. Increased shear rate leads toincreased level of platelet adhesion and microclot contraction, as demonstrated by increased microtissue fluorescence intensity and decreased micropillardistance (L) from shear rate 3 to 1500 s−1. Measured contractile force (f), stiffness (g) and volume (h) of microclots formed at 30min under differentshear rates. Data are presented as mean ± standard deviation for (c), (d). *P < 0.005, **P < 0.05, n > 10, each dot in box plot represents an independentexperiment. All box plots with whiskers represent the data distribution based on five number summary (maximum, third quartile, median, first quartile,minimum). Statistical significance was determined by one-way analysis of variance (ANOVA). Scale bar is 200 µm
NATURE COMMUNICATIONS | https://doi.org/10.1038/s41467-019-10067-6 ARTICLE
NATURE COMMUNICATIONS | (2019) 10:2051 | https://doi.org/10.1038/s41467-019-10067-6 | www.nature.com/naturecommunications 7

are dominant modifiers of platelet adhesion at arterial shears(Fig. 4f–j). The observation that a fibrin-platelet shell coversthe collagen substrate suggests that thrombin secreted locallyat the coagulation site may contribute to fibrin formation(Supplementary Figs. 5–7). Consistent with this, fibrin depositionis only observed on the collagen substrate and not other sectionsof the flow channel (Fig. 1). Reduction in fibrin formation uponuse of PPACK, a thrombin inhibitor, resulted in unstable plateletthrombi that embolized under flow (Supplementary Fig. 15).
Nevertheless, clot contraction was measured even upon use ofPPACK, although it was ~2 µN lower compared to the case ofcitrated PRP. Thus, contractile forces in the system are likelyprimarily generated by the activated platelets and transmitted viaplatelet interaction with the collagen substrate, presumably viareceptors GpVI and VLA-2 37. Fibrin has an indirect role in clotretraction as it stabilizes the platelet thrombi and preventsembolization. Addition of thrombin or ADP to the flowing PRPresults in higher amounts of fibrin formation and larger platelet
a
Antagonists, Blebbistatin
Sideview
Post_flow
Fluorescent
*
NS
*
* *
f
c
d
e
Procoagulationtreatments
Topview
Pre_flow
L AbciximabL Blebbistatin L HIP1L Thrombin L ADP
b
Shear flowEvaluation of
microclot propertiesShear flow toform microclot
Evaluation ofmicroclotproperties
L AbciximabL HIP1
L ASA
PRP
*
NS
*
Abciximab 500 s–1
(10 μg mL–1)Blebbistatin
500 s–1 (10 μM)HIP1 500 s–1
(20 μg mL–1)Thrombin 500 s–1
(5 units mL–1)ADP 500 s–1
(10 μM)Abciximab 1500 s–1
(10 μg mL–1)HIP1 1500 s–1
(20 μg mL–1)ASA 500 s–1
(15 μM)
j
g h
i
NS
*
NS
*
NS
***
NS
15 25 12
8
4
0
20
Flu
ores
cenc
e in
tens
ity(a
.u.) 15
10
10
0
20
30 10
8
6
4
5
0
Blebbis
tatin
_500
s–1
Blebbis
tatin
_500
s–1
Pre_f
low
ASA_500
s–1
ASA_500
s–1
Abcixi
mab
_500
s–1
Abcixi
mab
_500
s–1
HIP1_
500
s–1
HIP1_
500
s–1
HIP1_
1500
s–1
HIP1_
1500
s–1
Untre
ated
_500
s–1
Untre
ated
_500
s–1
Untre
ated
_150
0 s–1
Untre
ated
_150
0 s–1
Abcixi
mab
_150
0 s–1
Abcixi
mab
_150
0 s–1
Blebbis
tatin
_500
s–1
Pre_f
low
ASA_500
s–1
Abcixi
mab
_500
s–1
HIP1_
500
s–1
HIP1_
1500
s–1
Untre
ated
_500
s–1
Untre
ated
_150
0 s–1
Abcixi
mab
_150
0 s–1
Blebbis
tatin
_500
s–1
Pre_f
low
ASA_500
s–1
Abcixi
mab
_500
s–1
HIP1_
500
s–1
HIP1_
1500
s–1
Untre
ated
_500
s–1
Untre
ated
_150
0 s–1
Abcixi
mab
_150
0 s–1
10
40
30
20
10
0
5
4
3
2
μTis
sue
cont
ract
ilefo
rce
(μN
)
μTis
sue
cont
ract
ile fo
rce
(μN
)
μTis
sue
stiff
ness
(kP
a)
μTis
sue
stiff
ness
(kP
a)
μTis
sue
volu
me
(106
μm3 )
μTis
sue
volu
me
(106
μm3 )
5
Untre
ated
Vehic
le co
ntro
l
Throm
bin ADP
Untre
ated
Untreated
Vehic
le co
ntro
l
Throm
bin
Thrombin
ADP
ADP
Fig. 4 Microclot mechanics under platelet agonist and antagonist treatments. a Overview of the approaches. b Phase contrast and fluorescence images ofmicroclots after 10 μM ADP or 5 UmL−1 thrombin treatment under flow. These microclots were first formed over 30min of 500 s−1 platelet flow prior toagonist introduction for an additional 10min. Measured contractile force (c), stiffness (d) and volume (e) of microclots after various procoagulationtreatments. f Phase contrast and fluorescence images of microtissues formed after 30min of 500 or 1500 s−1 platelet flow treated with blebbistatin,acetylsalicyclic acid (ASA), abciximab (anti GPIIb/IIIa) or HIP1 (anti-GpIbα) antibody. Measured fluorescence intensity (g), contractile force (h), stiffness(i) and volume (j) of microtissues formed under above anticoagulation treatments. **P < 0.05, *P < 0.005, n > 10, each dot in box plot represents anindependent experiment. All box plots with whiskers represent the data distribution based on five number summary (maximum, third quartile, median, firstquartile, minimum). Statistical significance was determined by one-way analysis of variance (ANOVA). Scale bar is 200 µm
ARTICLE NATURE COMMUNICATIONS | https://doi.org/10.1038/s41467-019-10067-6
8 NATURE COMMUNICATIONS | (2019) 10:2051 | https://doi.org/10.1038/s41467-019-10067-6 | www.nature.com/naturecommunications

filled clots (Supplementary Fig. 21). Clot contraction and theimpact of fibrin could not be evaluated during the course of thisstudy, due to the massive platelet-fibrin clots that blocked theflow path. While tissue factor is absent in the current study, it isnot possible to rule out the possibility that the contact pathwaymay also contribute to platelet deposition and clot mechanics inthis system.
In clinical hematology, a major existing challenge is the diag-nosis of patients whose standard laboratory test results are bor-derline but still have bleeding symptoms. Currently, there is nogood functional assay that can be used to diagnose these patients.Thromboelastometry such as TEG and ROTEM are among themost commonly used point-of-care devices for diagnosing coa-gulation disorders, but it suffers from apparent limitations indiagnosing VWD and disorders of primary hemostasis18,19. In thecurrent study, we showed that clotMAT system is able to detectimpaired clot formation and stiffness of VWD patient samples.Such improvement over existing clinical tests suggests that theclotMAT system may have the potential to be used to improve thediagnosis of coagulation disorders, especially for patients whoseclinical phenotype cannot be determined using existing clinicaltests. Preliminary results in the current study show that theclotMAT system is able to report time-dependent increases in clot
mechanical properties based on the smooth ascending curves(Fig. 4b), which is qualitatively similar to the ascending curvesrepresenting clot stiffening in clinical thromboelastometry18,19.
To further validate the diagnostic potential of the clotMATsystem, we also tested its response to ASA since patients at risk tocardiovascular events commonly consume aspirin. The resultsshowed that clotMAT is sensitive enough to detect the mildimpairment of platelet function, clot formation and stiffness byASA. This test, along with others performed using plateletantagonists (abciximab, anti-GpIbα) and blebbistatin, was per-formed using healthy blood samples collected from more than 20healthy donors, yet the significant differences in the results werenot masked by donor variation, which demonstrates the detectionsensitivity of the system. Together, these data provide preliminaryconfirmation of the potential clinical utility of the clotMAT sys-tem. Additional comprehensive tests in a clinical setting areneeded in the future to fully validate the clotMAT system. Thesetests may include reagents often used in TEG and ROTEM assayssuch as thromboplastin, heparinase and ellagic acid, differentVWD/disease populations, and hyper reactive platelets fromindividuals suffering from cardiovascular diseases. It would bealso interesting to compare the detection sensitivity of the clot-MAT system directly with TEG and ROTEM. Finally, the
b
**
*
d e
NS
a
VWD type 2Adisease plasma
Healthy donorpooled plasma
Healthyplatelets
c
f
Shear flow
Shear flow
20 **
15
Flu
ores
cenc
e in
tens
ity(a
.u.)
10
5
0rVWDPRP
rHealthyPRP
HealthyPRP
*
**
*
*
rVWDPRP
rHealthyPRP
HealthyPRP
Pre_flow
rVWDPRP
rHealthyPRP
HealthyPRP
Pre_flow
rVWDPRP
rHealthyPRP
HealthyPRP
Pre_flow
Compare?
Post_flow
Fluorescent
Pre_flow
Lpatient Lhealthy
rVWD PRP
Healthyplatelets
Evaluation of microclot properties
Platelet binding: Fluorescent intensity
Mechanics: Contractile force, microclotvolume, microclot stiffness.
ReconstitutedVWD PRP
ReconstitutedHealthy PRP
10 25
20
15
10
5
0
8
6
4
2
0μTis
sue
cont
ract
ile fo
rce
(μN
)
μTis
sue
volu
me
(106 μ
m3 ) 10
8
6
4
2
μTis
sue
stiff
ness
(kP
a)
rHealthy PRP
Fig. 5 VWD patient sample results in mechanically weak microclots. a Overview of the strategy for comparing microclot mechanics between VWD sampleand healthy donor sample. Healthy human washed platelets were added to VWD patient plasma and healthy donor plasma to form reconstituted VWDPRP (rVWD PRP) and reconstituted healthy PRP (rHealthy PRP). The mechanical properties of microclots formed using these reconstituted systems wascompared with “Healthy PRP”, normal PRP isolated from healthy volunteer. b Phase contrast and fluorescence images of microclots formed using VWDpatient sample and healthy donor sample. Measured fluorescence intensity (c), contractile force (d), stiffness (e) and volume (f) of the above twomicroclot groups. *P < 0.05, n > 10, each dot in box plot represents an independent experiment. All box plots with whiskers represent the data distributionbased on five number summary (maximum, third quartile, median, first quartile, minimum). Statistical significance was determined by one-way analysis ofvariance (ANOVA)
NATURE COMMUNICATIONS | https://doi.org/10.1038/s41467-019-10067-6 ARTICLE
NATURE COMMUNICATIONS | (2019) 10:2051 | https://doi.org/10.1038/s41467-019-10067-6 | www.nature.com/naturecommunications 9

development of the clotMAT system was enabled by theadvancement in microfabrication technology; due to its low-cost,medium-throughput and the potential for scale-up, there exists ahigh potential to translate this technology into an improvedpoint-of-care system for coagulation diagnosis18.
The mechanics involved in tissue remodeling has often beenstudied using cell-laden bulk hydrogels comprised of matrixproteins17,42,43. However, due to the difficulty to incorporate flowcondition and the inherent limitations in solute diffusion andexperimental throughput, bulk hydrogel models are not suited forthe study of clot mechanics. Previous studies using these modelshave shown that stiffening of the fibrin gels can be inducedthrough either externally applied mechanical strain or myosin-
mediated cellular contraction that aligns and bundles fibrin fibersand compacts matrix meshwork44,45. However, the applicabilityof this strain stiffening theory under shear flow condition has notbeen examined. Here, through analyzing results from coagulationconditions regulated by either biochemical treatments or shearflows, we observed equally strong correlations in the microclotmechanical properties (Fig. 6a–d; Supplementary Fig. 19), indi-cating these two types of stimulants independently yet equallystrongly affect clot remodeling and stiffening. This finding unveilsthe tissue remodeling/stiffening mechanism in a previouslyunexplored shear flow regime, and thus it significantly expandsthe boundary of previously established tissue remodeling theorythat was based on bulk, static hydrogel models. Such integrated,
0
0.2
0.4
0.6
0.8
1
1.2
0
µTis
sue
volu
me
(a.u
.)
µTissue contractile stress (a.u.)
1�1
0.6
0
Before contraction
Under platelet-generatedcontraction
x
yz
fe
VWD patient
Procoagulation
Healthy donor
Antagonists
Y = 2.395x + 0.34740
μTis
sue
stiff
ness
(kP
a)μT
issu
e st
iffne
ss (
kPa)
μTis
sue
volu
me
(106 μ
m3 )
μTis
sue
volu
me
(106 μ
m3 )
30
20
10
0
30
20
0
Varied biochemical treatmentsVaried flow conditions
Varied biochemical treatmentsVaried flow conditions
1500 s–1
1500 s–1
500 s–1
500 s–1167 s–1
167 s–1
33 s–1
33 s–1
3 s–1
3 s–1
Pre_flow
Pre_flow
10
0
10
8
6
4
2
0
10
8
6
4
2
0
5 10 15
R2 = 0.9657
R2 = 0.9325
Y = –0.4550x + 7.873
VWD patient
Procoagulation
Healthy donor
Antagonists
Y = 2.297x + 0.205R2 = 0.9587 R2 = 0.9691
P = 0.7428
Y = –0.5281x + 8.175
P = 0.3451
ba
dc
ADP
Thrombin500 s–1
500 s–1ASA
HIP1500 s–1
HIP1500 s–1
VWDPre_flow
Abci.1500 s–1
Abci. 1500 s–1
HIP11500 s–1
HIP11500 s–1
Abci.500 s–1
Abci. 500 s–1
Bleb.
ADP
Thrombin
ASA
VWD
Pre_flow
Bleb.
μTissue contractile force (μN)
0 5 10 15
μTissue contractile force (μN)
0 5 10 15
μTissue contractile force (μN)
0 5 10 15
μTissue contractile force (μN)
1500 s–1
1500 s–1
0.2 0.4 0.6 0.8 1
Fig. 6 Effects of biochemical treatment and shear flow on clot stiffening. Strong correlation between microclot stiffness and microclot contractile force(a) and between microclot volume and microclot contractile force (b) exists for various coagulation conditions under biochemical treatments. Abciximab(Abci.), Blebbistatin (Bleb.), VWD (VWD patient sample), acetylsalicyclic acid (ASA), anti-GpIbα antibody (HIP1). c, d Comparison of linear regressionsbetween biochemical treatment condition and shear flow condition. Strong correlation between microclot mechanical properties also exists under variedshear flow (solid, black line). No significant difference was found for the regression slopes between biochemical treatment condition and shear flowcondition. The significant difference of slopes and intercepts for two linear regressions was measured using a method equivalent to analysis of covariance(ANCOVA). Correlation between groups was analyzed using Pearson correlation coefficients. e Finite element model of the microclot before and underplatelet-generated contraction. Simulated effective stress contour is plotted over undeformed and deformed model geometry. Active contraction of plateletpopulation is represented by the contractility of every single element. Due to the geometrical restriction by two micropillars at both ends, microclotcontraction causes volume shrinkage and the development of necking in the middle section, mimicking the microclot retraction process observed in theexperiment. Color scale indicates normalized effective stress level. f Simulated decrease in microclot volume almost linearly correlates with increasedcontractile stress, recapitulating the experimental correlation between these two measurements. Data are presented as mean ± standard deviation
ARTICLE NATURE COMMUNICATIONS | https://doi.org/10.1038/s41467-019-10067-6
10 NATURE COMMUNICATIONS | (2019) 10:2051 | https://doi.org/10.1038/s41467-019-10067-6 | www.nature.com/naturecommunications

quantitative analysis of the tissue remodeling mechanism underflow condition is enabled by the combined tissue mechanics andshear flow capacity of the clotMAT system44,46. Adding cyclicstretching function to this system may further expand its capacityto detect viscoelastic property of the clots.
MethodsHealthy donor plasma sample preparation. Human blood was obtained byvenipuncture from healthy adult volunteers, following protocols approved by theUB Health Science Institutional Review Board (Buffalo, NY). Volunteers of eithersex were used and studies were performed within 3 h of blood draw. Blood donorsself-reported absence of coagulation defects and use of medication. Majority of thesamples were prepared using sodium citrate (1:9) as anticoagulant with a fewexceptions that were prepared using PPACK (70 μM, Cayman Chemicals). In somecases, PRP was recalcified by addition of 10 mM CaCl2. 2 μM Prostaglandin E1(PGE1, Cayman Chemicals) was added when washed platelets were prepared. PRPwas obtained by centrifuging blood at 180 × g for 15 min47. To obtain healthyplasma or platelet-poor plasma (PPP), the remaining blood was again spun at1200 × g for 12 min and the plasma supernatant was collected. Washed plateletswere similarly obtained by further centrifuging PRP containing PGE1, at 1200 × gfor 12 min. In this case, the pellet was washed once using HEPES buffer (30 mM 4-(2-hydroxyethyl)-1-piperazineethanesulfonic acid, 110 mM NaCl, 10 mM KCl, 1mM MgCl2, 10 mM glucose, pH 7.4) containing 2 μM PGE1 before resuspension inHEPES buffer lacking PGE1 35. 1 µM BCECF (2′,7′-Bis-(2-Carboxyethyl)-5-(and-6)-Carboxyfluorescein, Acetoxymethyl Ester) (ThermoFisher Scientific) was addedto PRP/washed platelets for 30 min at room temperature to stain platelets withgreen fluorescence.
VWD type 2A patient plasma sample preparation. VWD type 2 A patientplasma from a single donor was obtained from CoaChrom Diagnostica GmbH(Austria). 0.7% agarose gel electrophoresis was used to compare VWF multimerdistribution in patient and healthy plasma47. ADAMTS13 activity was measured interms of FRET ratio using the XS-VWF FRET substrate48. Briefly, this involvedaddition of citrated plasma VWF to 1 µM XS-VWF FRET for 1 h at room tem-perature. FRET ratio was then quantified using a Synergy 4 BioTek fluorescenceplate reader, based on the ratio of XS-VWF emission intensities at 541/25 nm vs.485/20 nm following excitation at 420/50 nm. A flow cytometer-bead sandwichassay determined VWF concentration49. Washed platelets (300,000 µL−1) fromhealthy donor blood were mixed with either healthy plasma from normal donor toobtain reconstituted healthy PRP (rHealthy PRP) or VWD plasma to obtainreconstituted VWD PRP (rVWD PRP).
Microtissue array device fabrication. The microtissue array device was made bymultilayer microlithography and soft-lithography techniques20,21. Briefly, multiplelayers of SU-8 (bottom layer for the leg section and top layer for the head section)were successively deposited on the silicon wafer (University Wafer), exposed to UVlight through transparency masks printed by laser plotting (CAD/Art Services Inc.),and baked and developed according to the manufacturer’s protocols. Soft-lithography was then used to transfer the micro-patterns to polydimethylsiloxane(PDMS, Sylgard 184, DowCorning) molds made with 10:1 ratio of dimer to curingagent (Supplementary Fig. 1). The micropillar geometry was optimized throughincreasing micropillar height and reducing micropillar cross-sectional area toincrease its force sensing sensitivity. The optimized micropillar dimensions are:width (W)= 42 μm, depth (T)= 81 μm, and height (L)= 291 μm (SupplementaryFig. 4). According to the cantilever bending theory, F ¼ kδ ¼ 3EI
L3 δ; where E is theYoung’s modulus of PDMS, I is the moment of inertia, L is the height of micro-pillar and δ is the deflection at the micropillar head, the spring constant (k) of themicropillar is 120 nN μm−1. The micropillar head was designed to stick out of themicrowell so that when microtissues form on the heads, they can directly face andinteract with the platelet flow in the microchannel to increase the platelet captureefficiency (Supplementary Fig. 4).
Preparation of bare collagen microtissue array. Human umbilical vein endo-thelial cells (HUVEC) were obtained from Lonza (C2519A, Walkersville, Mary-land) and cultured in Endothelial Cell Growth Medium 2 (CC-22011, PromoCell).To perform microtissue seeding, unpolymerized collagen type I were neutralizedand diluted to final concentrations of 3 mgmL−1 (rat tail collagen I, #354236,Corning) and 20 µg mL−1 (equine collagen, Chrono-log, Havertown, PA) andmixed with HUVECs (300,000 cells per device). This mixture was seeded intosterilized micropillar device through centrifugation, polymerized and maintainedunder standard culture condition for 2 days (Supplementary Fig. 1). By day 2, dog-bone-shaped microtissues were formed in the microwells. The microtissues werethen treated with 0.25% trypsin for 20 min to allow most of the HUVECs to detachfrom the collagen matrix, resulting in a nearly bare collagen microtissue hungbetween the two micropillars (Supplementary Fig. 3).
Fabrication and integration of the microfluidic channel. The PDMS micro-channels measuring 1189 µm in width and 498 µm in height were fabricated usingstandard photolithography and soft-lithography methods. The microchannels werealigned with individual rows of trypsinized microtissues under stereomicroscope,and the PDMS slab containing microchannels was bond with the PDMS substratecontaining microtissue array through custom clamps (Supplementary Fig. 4). Theplatelet flow was created through syringe pump (NE-1000, New Era Pump System)withdraw at the outlet of the microfluidic channel, and the inlet of the microfluidicchannel was connected to a platelet-containing reservoir (~300,000 platelets per µL,8 mL total). Both the inlet and outlet of the microchannel were connected tothe flow system through 18G needles. Flow rate was set between 0.01 and4.5 mLmin−1 and the corresponding shear rate was 3~1500 s−1, calculated by_γx ¼ 6Q
wh2, where Q is the volume flow rate, w and h are the width and the height ofthe channel, respectively. In the study of the effect of shear rate on microtissueformation, the experiments at each shear rate were performed on at least threedonors with at least seven samples per donor.
Microtissue contractile force measurement. HUVEC-mediated microtissueformation involves the generation of contractile force that partially remains afterthe removal of the HUVECs by trypsinization. Such residual contractile force of1.88 ± 0.49 µN (153 replicates) was recorded before platelet flow. During plateletflow, bright field images of the micropillars were taken every 10 min to monitorplatelet-generated contractile forces in real time. Micropillar deflection wasdetermined by the travel distance of the micropillar head relative to the bottom ofits leg and was used to calculate the microtissue contractile force according to thecantilever bending theory F= kδ, where δ is the averaged deflection δ= (δ1+ δ2)/2of the two micropillars and k= 120 nN µm−1 is the spring constant of themicropillar (Fig. 2a and Supplementary Fig. 5). A Nikon Eclipse Ti-U invertedmicroscope with ×10 objective was used to image individual microtissue. Duringmicroclot contraction, each of the micropillars displaced around 50 µm during the30 min PRP flow at 500 s−1 shear rate, so the contraction rate of the microclot isapproximately 1.7 µmmin−1, which is comparable to the value reported in theprevious study50.
Microtissue stiffness measurement. To enable mechanical stretching, micro-tissue array device was casted on a deformable silicone substrate (silicone sheeting,0.01-inch NRV G/G 40D, SMI, Saginaw, MI) that is mounted on a custom-madeuniaxial stretching frame (Supplementary Fig. 9). Silicone substrate was stretchedto 150% strain along the longitudinal direction of the microtissues to apply uniaxialtension across the entire microtissue array. Images of the microtissue and micro-pillars before and after stretching were recorded and used to calculate the stress andstrain. Externally applied stretch caused microtissue elongation (d2–d1), and theforce needed to develop such elongation was reported by micropillar deflection asF= k (δ1′+ δ2′)/2. This force was divided by the cross-sectional area of micro-tissue to calculate the tensile stress (Fig. 2e). The microtissue tensile strain wasdetermined based on microtissue elongation as ε= (d2–d1)/d1, by tracking thechange in distance between two fiducial markers in the microtissue before and afterstretch (Supplementary Fig. 11). Subsequently, the stress was divided by the strainto calculate the elastic modulus for the microtissue. The thickness (t) of themicrotissue for cross-sectional area calculation was determined by confocalmicroscopy imaging (Supplementary Fig. 12). Due to the small thickness of theassembled clotMAT device (3−4 mm total), uniform stretching across the wholedevice was achieved without delamination between the layers.
Platelet agonist and antagonist treatments. Many assays in the current studywere performed using PRP containing various platelet agonists/antagonists. Thesetreatments include 10 μg mL−1 Abciximab (anti-GpIIb/IIIa, Reopro, Eli Lilly),10 μM blebbistatin (Sigma), 20 μg mL−1 anti-CD42b antibody (#14-0429-80, HIP1clone, ThermoFisher), and 15 μM acetylsalicylic acid (ASA, TCI America). Here,mAbs and ASA were incubated with citrated PRP for 30 min before flow andblebbistatin was incubated for 5 min before flow. In some cases, 15 µM TRAP-6(#4017752, Bachem, Torrance, CA) was added to PRP prepared using PPACK justbefore flow. ADP (10 μM) and thrombin (5 UmL−1) were diluted in Dulbecco’sphosphate-buffered saline and infused at 500 s−1 shear rate for 10 min overmicroclots previously formed under citrated PRP flow (Fig. 4b−e). In some cases,ADP (5 μM) and thrombin (2 UmL−1) were directly added to citrate PRP beforeflow to study their effects on clot formation (Supplementary Fig. 21). For all theagonist and antagonist treatments, at least three donors with at least seven samplesper donor were measured.
Platelet activation studies. PRP was isolated from fresh human blood usingeither 70 µM PPACK or 3.8% sodium citrate (1:9) as anticoagulant. In some cases,PRP was recalcified by addition of 10 mM CaCl2. 50 µL PRP was incubated with amixture of anti-human CD41/CD61 activation-specific mAb PAC-1 (Alexa647labeled, #362805, Biolegend, San Diego, CA) and PE-labeled anti-CD62P mAbAC1.2 (#550561, BD, San Jose, CA) for 5 min at room temperature. This mixturewas then stimulated with either 15 µM TRAP-6 (#4017752, Bachem, Torrance,CA), 5 UmL−1 Thrombin (#T7009, Sigma, Burlington, MA), 20 µM ADP (Sigma,Burlington, MA) or 5 µgmL−1 collagen (Chrono-Log, Haverton, PA). A portion of
NATURE COMMUNICATIONS | https://doi.org/10.1038/s41467-019-10067-6 ARTICLE
NATURE COMMUNICATIONS | (2019) 10:2051 | https://doi.org/10.1038/s41467-019-10067-6 | www.nature.com/naturecommunications 11

the sample was diluted 200-fold at various times and analyzed using a BD FortessaX-20 flow cytometer (Supplementary Fig. 16).
Fibrin formation assay under static condition. Alexa fluor-594-conjugatedfibrinogen (Fb-594) was prepared by mixing 10 mgmL−1 fibrinogen (#9001-32-5,Sigma) with 20-fold molar excess Alexa flour-594 (NHS ester, #1101-1, Fluorop-robes, Scottsdale, AZ) in PBS (pH= 8.0) for 1 h at room temperature. Followingquenching of the reaction using 100 µL 1M Tris-HCl (pH= 8.0) for 10 min,labeled protein was desalted into PBS using a Zeba Spin Column according to themanufacturer’s instructions (7K MWCO, #89882, ThermoFisher).
To assay fibrin formation, 0.125 mgmL−1 Fb-594 was added to PRP (20 µLvolume). Following this, various stimuli were added: 15 µM TRAP-6, 5 UmL−1
Thrombin, 20 µM ADP or 5 µg mL−1 collagen. Such assays were performed usingcitrated PRP, recalcified citrated PRP and PPACK anticoagulated PRP under staticcondition. Following 10 min, 150 µL PBS containing 5 mM EDTA was added tostop the reaction. Fibrin clot was then immediately pelleted using centrifugation at14,000 × g for 10 min, and Alexa 594 fluorescence in supernatant was measuredusing a plate reader in order to determine % Fb-594 incorporated into fibrin clot(Supplementary Fig. 17). Calibration curve was made by serial dilution of Fb-594.
Shear-induced platelet activation (SIPAct). Two microliters citrated healthyPRP was diluted 40-fold into either healthy human plasma (PPP) or VWD type 2Aplasma. The mixture was sheared in a cone-plate viscometer at 9600 s−1 47.Samples withdrawn at various times were incubated with Annexin-V FITC for 5min at 37 °C in HEPES buffer containing 5 mM CaCl2, prior to flow cytometryanalysis. % Platelet activation is a measure of the fraction of platelets bindinggreater than baseline levels of Annexin-V (Supplementary Fig. 22).
Immunofluorescence staining and imaging. Microtissues were fixed using 4% (v/v) paraformaldehyde (PFA) (EMS, Hatfield, USA) for 10 min at room temperature,permeabilized by 0.1% (v/v) Triton X-100 for 5 min, and blocked with 3% BSA(Sigma) for 30 min at 37°C. Samples were incubated with collagen type I antibody(Millipore, AB755P, 1:300) overnight and labeled with Alexa Fluor™ 594 secondaryantibody (ThermoFisher, A-11037, 1:400) for 1.5 h. Hoechst 33342 (Invitrogen)was used at 1:1000 ratio to label cell nuclei in the microtissue. Confocal images ofthe microtissue were taken using an Andor Technology DSD2 confocal unit cou-pled to an Olympus IX-81 motorized inverted microscope. Plan-Apochromat ×10objective was used to record the stack with 1 μm optical slices for all channels. Thestack of images was then processed using the Z stack tool in ImageJ (NIH) toobtain the projected 2D views. To characterize the microclot volume change afterflow, topview area and thickness of the microtissue were analyzed based on brightfield topview images and confocal stacks in ImageJ (Supplementary Fig. 12). Tocompare the signal intensity of platelet aggregation on microclots formed undervarious flow and coagulation conditions, images were taken by a Nikon Eclipse Ti-U inverted microscope equipped with ×10 air objective and Hamamatsu ORCA-Flash 4.0 LT CMOS camera under exact imaging conditions and processed inImageJ. The video of platelet adhesion to the collagen microtissue was taken usingthe Nikon microscope and Flash 4.0 LT camera under fluorescence illumination at1.25 fps frame rate for 4 min. A total of 300 images were recorded and processed inImageJ.
Finite element modeling of microclot retraction. Finite element model of themicroclot was constructed in FEBio41. Microclot geometry was discretized by 3Dquadratic tetrahedral elements capable of large deformation. Microclot model isunder active contraction and is restricted at the same time by two micropillars atboth ends. The contractile platelet population was represented by the contractileelements whose constitutive material model consist of a neo-Hookean solidcomponent and an isotropic contractile stress component51. The compressive neo-Hookean solid allows compaction of the microclot model under active contraction.Simulated effective stress contour was plotted over undeformed and deformedmodel geometry in the results. The change in microclot volume versus effectivestress over the entire retraction process was plotted.
Scanning electron microscopy. The microtissues were fixed using 2% glutar-aldehyde (233280250, ACROS organics) for 1.5 h, and dehydrated through a seriesof ethanol treatment at 15, 30, 50, 70, 90 and 100%. Finally, hexamethyldisilazanewas added to the sample to prepare them for imaging on a HITACHI SU-70 SEMsystem.
Statistics. For all the shear flow conditions and all the agonist and antagonisttreatment conditions, at least three donors with at least seven samples per donorwere measured. Data are presented as mean ± standard deviation unless otherwisestated. Significance difference between dual comparison was verified by unpairedt test with Welch’s correction method. Significance difference for multiple groupswas determined by one-way analysis of variance (ANOVA). Correlation betweengroups was analyzed using Pearson correlation coefficients. The significant dif-ference of slopes and intercepts for two linear regressions was measured usingGraphPad Prism, using a method equivalent to analysis of covariance (ANCOVA).
Reporting summary. Further information on research design is available inthe Nature Research Reporting Summary linked to this article.
Data availabilityAll data supporting the findings of this study are available within the article and itssupplementary information files or from the corresponding author upon reasonablerequest.
Received: 12 September 2018 Accepted: 15 April 2019
References1. Weisel, J. Biophysics. Enigmas of blood clot elasticity. Science 320, 456 (2008).2. Lam, W. et al. Mechanics and contraction dynamics of single platelets and
implications for clot stiffening. Nat. Mater. 10, 61 (2011).3. Brass, L. F., Wannemacher, K. M., Ma, P. & Stalker, T. J. Regulating thrombus
growth and stability to achieve an optimal response to injury. J. Thromb.Haemost. 9, 66–75 (2011).
4. Jen, C. J. & McIntire, L. V. The structural properties and contractile force of aclot. Cytoskeleton 2, 445–455 (1982).
5. Gogia, S. & Neelamegham, S. Role of fluid shear stress in regulating VWFstructure, function and related blood disorders. Biorheology 52, 319–335 (2015).
6. Nesbitt, W. et al. A shear gradient-dependent platelet aggregation mechanismdrives thrombus formation. Nat. Med. 15, 665–673 (2009).
7. Tolouei, E. et al. Effect of hemodynamic forces on platelet aggregationgeometry. Ann. Biomed. Eng. 39, 1403–1413 (2011).
8. Zhang, C. & Neelamegham, S. Application of microfluidic devices in studies ofthrombosis and hemostasis. Platelets 28, 434–440 (2017).
9. Gutierrez, E. et al. Microfluidic devices for studies of shear-dependent plateletadhesion. Lab Chip 8, 1486–1495 (2008).
10. Tovar-Lopez, F. et al. A microfluidics device to monitor platelet aggregationdynamics in response to strain rate micro-gradients in flowing blood. LabChip 10, 291–302 (2010).
11. Wootton, D. M., Markou, C. P., Hanson, S. R. & Ku, D. N. A mechanisticmodel of acute platelet accumulation in thrombogenic stenoses. Ann. Biomed.Eng. 29, 321–329 (2001).
12. Colace, T., Falls, E., Zheng, X. & Diamond, S. Analysis of morphology ofplatelet aggregates formed on collagen under laminar blood flow. Ann.Biomed. Eng. 39, 922–929 (2011).
13. Neeves, K., Illing, D. & Diamond, S. Thrombin flux and wall shear rateregulate fibrin fiber deposition state during polymerization under flow.Biophys. J. 98, 1344–1352 (2010).
14. Liang, X., Han, S., Reems, J., Gao, D. & Sniadecki, N. Platelet retraction forcemeasurements using flexible post force sensors. Lab Chip 10, 991 (2010).
15. Qiu, Y. et al. Platelet mechanosensing of substrate stiffness during clotformation mediates adhesion, spreading, and activation. Proc. Natl Acad. Sci.USA 111, 14430 (2014).
16. Myers, D. et al. Single-platelet nanomechanics measured by high-throughputcytometry. Nat. Mater. 16, 230 (2017).
17. Kim, O. V., Litvinov, R. I., Alber, M. S. & Weisel, J. W. Quantitative structuralmechanobiology of platelet-driven blood clot contraction. Nat. Commun. 8,1274 (2017).
18. Bolliger, D., Seeberger, M. & Tanaka, K. Principles and practice ofthromboelastography in clinical coagulation management and transfusionpractice. Transfus. Med. Rev. 26, 1 (2012).
19. Lang, T. et al. Multi-centre investigation on reference ranges for ROTEMthromboelastometry. Blood Coagul. Fibrinolysis 16, 301–310 (2005).
20. Zhao, R., Boudou, T., Wang, W. G., Chen, C. S. & Reich, D. H. Decoupling celland matrix mechanics in engineered microtissues using magnetically actuatedmicrocantilevers. Adv. Mater. 25, 1699–1705 (2013).
21. Zhao, R., Chen, C. S. & Reich, D. H. Force-driven evolution of mesoscalestructure in engineered 3D microtissues and the modulation of tissuestiffening. Biomaterials 35, 5056–5064 (2014).
22. Legant, W. R. et al. Microfabricated tissue gauges to measure and manipulateforces from 3D microtissues. Proc. Natl. Acad. Sci. USA 106, 10097–10102(2009).
23. Sakar, M. S. et al. Formation and optogenetic control of engineered 3D skeletalmuscle bioactuators. Lab Chip 12, 4976–4985 (2012).
24. Thavandiran, N. et al. Design and formulation of functional pluripotent stemcell-derived cardiac microtissues. Proc. Natl Acad. Sci. USA 110, E4698–E4707(2013).
25. Boudou, T. et al. A microfabricated platform to measure and manipulate themechanics of engineered cardiac microtissues. Tissue Eng. Part A 18, 910–919(2012).
26. Sakar, M. S. et al. Cellular forces and matrix assembly coordinate fibrous tissuerepair. Nat. Commun. 7, 11036 (2016).
ARTICLE NATURE COMMUNICATIONS | https://doi.org/10.1038/s41467-019-10067-6
12 NATURE COMMUNICATIONS | (2019) 10:2051 | https://doi.org/10.1038/s41467-019-10067-6 | www.nature.com/naturecommunications

27. Asmani, M. et al. Fibrotic microtissue array to predict anti-fibrosis drugefficacy. Nat. Commun. 9, 2066 (2018).
28. Chen, Z. et al. Lung microtissue array to screen the fibrogenic potential ofcarbon nanotubes. Sci. Rep. 6, 31304 (2016).
29. Weisel, J. Biomechanics in hemostasis and thrombosis. J. Thromb. Haemost. 8,1027 (2010).
30. Chueh, J. Y. et al. Mechanical characterization of thromboemboli in acuteischemic stroke and laboratory embolus analogs. AJNR Am. J. Neuroradiol. 32,1237–1244 (2011).
31. Stalker, T. J. et al. Hierarchical organization in the hemostatic response and itsrelationship to the platelet signaling network. Blood 121, 1875–1885 (2013).
32. Diamond, S. L. & Anand, S. Inner clot diffusion and permeation duringfibrinolysis. Biophys. J. 65, 2622–2643 (1993).
33. Blinc, A. et al. Lysing patterns of retracted blood clots with diffusion or bulkflow transport of plasma with urokinase into clots—a magnetic resonanceimaging study in vitro. Thromb. Haemost. 68, 667–671 (1992).
34. Savage, B., Saldívar, E. & Ruggeri, Z. M. Initiation of platelet adhesion byarrest onto fibrinogen or translocation on von Willebrand factor. Cell 84,6289–6297 (1996).
35. Zhang, C. et al. The physical spacing between the von Willebrand factor D’D3and A1 domains regulates platelet adhesion in vitro and in vivo. J. Thromb.Haemost. 16, 571–582 (2018).
36. Ruggeri, Z. M. Platelets in atherothrombosis. Nat. Med. 8, 1227 (2002).37. Jackson, S. P. The growing complexity of platelet aggregation. Blood 109,
5087–5095 (2007).38. Heath, K. et al. Nonmuscle myosin heavy chain IIA mutations define a
spectrum of autosomal dominant macrothrombocytopenias: May−Hegglinanomaly and Fechtner, Sebastian, Epstein, and Alport-like syndromes. Am. J.Hum. Genet. 69, 1033 (2001).
39. Ono, A. et al. Identification of a fibrin-independent platelet contractilemechanism regulating primary hemostasis and thrombus growth. Blood 112,90–99 (2008).
40. Li, R., Fries, S., Li, X., Grosser, T. & Diamond, S. L. Microfluidic assay ofplatelet deposition on collagen by perfusion of whole blood from healthyindividuals taking aspirin. Clin. Chem. 59, 1195–1204 (2013).
41. Maas, S. A., Ellis, B. J., Ateshian, G. A. & Weiss, J. A. FEBio: finite elements forbiomechanics. J. Biomech. Eng. 134, 011005 (2012).
42. Wufsus, A. et al. Elastic behavior and platelet retraction in low- and high-density fibrin gels. Biophys. J. 108, 173 (2015).
43. Jansen, K., Bacabac, R., Piechocka, I. & Koenderink, G. Cells actively stiffenfibrin networks by generating contractile stress. Biophys. J. 105, 2240 (2013).
44. Wen, Q., Basu, A., Winer, J. P., Yodh, A. & Janmey, P. A. Local and globaldeformations in a strain-stiffening fibrin gel. New J. Phys. 9, 428 (2007).
45. Storm, C., Pastore, J. J., MacKintosh, F. C., Lubensky, T. C. & Janmey, P. A.Nonlinear elasticity in biological gels. Nature 435, 191–194 (2005).
46. Kang, H. et al. Nonlinear elasticity of stiff filament networks: strain stiffening,negative normal stress, and filament alignment in fibrin gels. J. Phys. Chem. B113, 3799–3805 (2009).
47. Shankaran, H., Alexandridis, P. & Neelamegham, S. Aspects of hydrodynamicshear regulating shear-induced platelet activation and self-association of vonWillebrand factor in suspension. Blood 101, 2637–2645 (2003).
48. Dayananda, K. M., Gogia, S. & Neelamegham, S. Escherichia coli-derived vonWillebrand factor-A2 domain fluorescence/Förster resonance energy transferproteins that quantify ADAMTS13 activity. Anal. Biochem. 410, 206–213 (2011).
49. Singh, I. et al. Solution structure of human von Willebrand factor studiedusing small angle neutron scattering. J. Biol. Chem. 281, 38266–38275 (2006).
50. Muthard, R. W. & Diamond, S. L. Blood clots are rapidly assembledhemodynamic sensors: flow arrest triggers intraluminal thrombus contraction.Arterioscler., Thromb., Vasc. Biol. 32, 2938–2945 (2012).
51. Ateshian, G. A., Costa, K. D., Azeloglu, E. U., Morrison, Br & Hung, C. T.Continuum modeling of biological tissue growth by cell division, andalteration of intracellular osmolytes and extracellular fixed charge density.J. Biomech. Eng. 131, 101001 (2009).
AcknowledgementsResearch reported in this study was supported in part by National Institutes of Health(NIH) under grants R01EB019411 (R.Z.), HL77258 and HL103411 (S.N.). The content issolely the responsibility of the authors and does not necessarily represent the officialviews of the National Institutes of Health. The authors would also like to acknowledgethe funding support from the School of Engineering and Jacobs School of Medicine andBiomedical Sciences at the University at Buffalo.
Author contributionsR.Z. and S.N. conceived the idea; Z.C., J.L., C.Z., I.H., X.Y., L.M., E.M., M.A. and R.Z.performed the experiments and analyzed the data; Z.C., S.J., S.N. and R.Z. wrote themanuscript.
Additional informationSupplementary Information accompanies this paper at https://doi.org/10.1038/s41467-019-10067-6.
Competing interests: The authors declare no competing interests.
Reprints and permission information is available online at http://npg.nature.com/reprintsandpermissions/
Journal peer review information: Nature Communications thanks Shaun Jackson andthe other anonymous reviewer(s) for their contribution to the peer review of this work.Peer reviewer reports are available.
Publisher’s note: Springer Nature remains neutral with regard to jurisdictional claims inpublished maps and institutional affiliations.
Open Access This article is licensed under a Creative CommonsAttribution 4.0 International License, which permits use, sharing,
adaptation, distribution and reproduction in any medium or format, as long as you giveappropriate credit to the original author(s) and the source, provide a link to the CreativeCommons license, and indicate if changes were made. The images or other third partymaterial in this article are included in the article’s Creative Commons license, unlessindicated otherwise in a credit line to the material. If material is not included in thearticle’s Creative Commons license and your intended use is not permitted by statutoryregulation or exceeds the permitted use, you will need to obtain permission directly fromthe copyright holder. To view a copy of this license, visit http://creativecommons.org/licenses/by/4.0/.
This is a U.S. government work and not under copyright protection in the U.S.; foreigncopyright protection may apply 2019
NATURE COMMUNICATIONS | https://doi.org/10.1038/s41467-019-10067-6 ARTICLE
NATURE COMMUNICATIONS | (2019) 10:2051 | https://doi.org/10.1038/s41467-019-10067-6 | www.nature.com/naturecommunications 13