Molecular characterization of the lipidome by mass spectrometry · Molecular characterization of...
105
Molecular characterization of the lipidome by mass spectrometry DISSERTATION zur Erlangung des akademischen Grades Doctor rerum naturalium (Dr. rer. nat.) vorgelegt der Fakultät für Biologie und Naturwissenschaften der Technische Universität Dresden von Master of Science, Christer Stenby Ejsing Geboren am 10. August 1976 in Gentofte, Dänemark Gutachter: Prof. Dr. Kai Simons (Technische Universität Dresden) Prof. Dr. Bernard Hoflack (Technische Universität Dresden) Prof. Dr. Michael Karas (Johann Wolfgang Goethe-Universität) Eingereicht am: 16. October 2006 Tag der Verteidigung: 13. Februar 2007
Transcript of Molecular characterization of the lipidome by mass spectrometry · Molecular characterization of...
MMoolleeccuullaarr cchhaarraacctteerriizzaattiioonn ooff tthhee
lliippiiddoommee bbyy mmaassss ssppeeccttrroommeettrryy
DISSERTATION
zur Erlangung des akademischen Grades
Doctor rerum naturalium
(Dr. rer. nat.)
vorgelegt
der Fakultät für Biologie und Naturwissenschaften
der Technische Universität Dresden
von
Master of Science,
Christer Stenby Ejsing Geboren am 10. August 1976 in Gentofte, Dänemark
Gutachter: Prof. Dr. Kai Simons (Technische Universität Dresden)
Prof. Dr. Bernard Hoflack (Technische Universität Dresden)
Prof. Dr. Michael Karas (Johann Wolfgang Goethe-Universität)
Eingereicht am: 16. October 2006
Tag der Verteidigung: 13. Februar 2007
2
SUMMARY Cells, whether bacterial, fungal or mammalian, are all equipped with metabolic
pathways capable of producing an assortment of structurally and functionally distinct lipid
species. Despite the structural diversity of lipids being recognized and correlated to specific
cellular phenomena and disease states, the molecular mechanisms that underpin this structural
diversity remain poorly understood. In part, this is due to the lack of adequate analytical
techniques capable of measuring the structural details of lipid species in a direct,
comprehensive and quantitative manner. The aim of my thesis study was to establish
methodology for automated and quantitative analysis of molecular lipid species based on
mass spectrometry. From this work a novel high-throughput methodology for lipidome
analysis emerged. The main assets of the methodology were the structure-specific mass
analysis by powerful hybrid mass spectrometers with high mass resolution, automated and
sensitive infusion of total lipid extracts by a nanoelectrospray robot, and automated spectral
deconvolution by dedicated Lipid Profiler software. The comprehensive characterization and
quantification of molecular lipid species was achieved by spiking total lipid extracts with
unique lipid standards, utilizing selective ionization conditions for sample infusion, and
performing structure-specific mass analysis by hybrid quadrupole time-of-flight and ion trap
mass spectrometry. The analytical routine allowed the comprehensive characterization and
quantification of molecular glycerophospholipid species, molecular diacylglycerol species,
molecular sphingolipid species including ceramides, glycosphingolipids and inositol-
containing sphingolipids, and sterol lipids including cholesterol.
The performance of the methodology was validated by comparing its dynamic
quantification range to that of established methodology based on triple quandrupole mass
spectrometry. Furthermore, its efficacy for lipidomics projects was demonstrated by the
successful quantitative deciphering of the lipid composition of T cell receptor signaling
domains, mammalian tissues including heart, brain and red blood cells, and the yeast
Saccharomyces cerevisiae.
3
TABLE OF CONTENTS
Summary.....................................................................................................................................2 Table of contents ........................................................................................................................3 List of abbreviations ...................................................................................................................5 Index of figures...........................................................................................................................6 Index of tables ............................................................................................................................7 1. Introduction ........................................................................................................................8
1.1. Lipidomics ..................................................................................................................8 1.1.1. Classification and chemistry of lipids ................................................................9
1.2. Mass spectrometric lipid analysis.............................................................................12 1.2.1. Fundamentals of mass spectrometry ................................................................12 1.2.2. Lipid analysis by electrospray ionization mass spectrometry ..........................15 1.2.3. The hybrid quadrupole time-of-flight (QqTOF) mass spectrometer ................16
2. Aim of the thesis...............................................................................................................20 3. Results and discussion......................................................................................................21
3.1. Automated identification and quantification of glycerophospholipid molecular species by MPIS ...................................................................................................................21
3.1.1. Identification of lipid species by MPIS ............................................................22 3.1.2. Identification of lipid species by Lipid Profiler software.................................24 3.1.3. MPIS enhances the identification specificity of lipid molecular species .........25 3.1.4. High mass resolution of the TOF analyzer improves the specificity of MPIS.28 3.1.5. MPIS identification of lipid species having a polyunsaturated FA moiety......29 3.1.6. Isotope correction of peak intensities for MPIS quantification........................31 3.1.7. Quantification of glycerophospholipid species by MPIS.................................32 3.1.8. Discussion.........................................................................................................37
3.2. Charting molecular composition of PC species by MPIS and ion trap MS3 fragmentation........................................................................................................................39
3.2.1. Quantification of positional isomers of synthetic PC standards.......................41 3.2.2. MS/MS fragmentation of anion adducts of PCs on a QqTOF mass spectrometer .....................................................................................................................42 3.2.3. Profiling of PCs by MPIS.................................................................................43 3.2.4. MSn fragmentation of PC adducts on an ion trap mass spectrometer ..............44 3.2.5. Quantitative analysis of positional isomers by MS3 fragmentation .................46 3.2.6. Validation of the mass spectrometric approach................................................47 3.2.7. Discussion.........................................................................................................49
3.3. Collision-induced dissociation pathways of yeast sphingolipids and their molecular profiling in total lipid extracts ..............................................................................................51
3.3.1. Fragmentation pathways of IPCs......................................................................53 3.3.2. Fragmentation pathways of MIPCs ..................................................................58 3.3.3. Fragmentation pathways of M(IP)2Cs ..............................................................60 3.3.4. Profiling of sphingolipids in yeasts ..................................................................62 3.3.5. Simultaneous profiling of sphingolipids and glycerophospholipids ................64 3.3.6. Discussion.........................................................................................................65
3.4. Automated lipid analysis by robotic sample infusion ..............................................66 3.4.1. Method validation.............................................................................................67 3.4.2. Selective ionization of lipid classes..................................................................69 3.4.3. Cholesterol quantification by MRM analysis...................................................72 3.4.4. Discussion.........................................................................................................75
4
3.5. Automated and quantitative lipidome analysis of T cell receptor signalling domains 77
3.5.1. Overview of analytical strategy........................................................................78 3.5.2. Comparison of lipid class composition ............................................................79 3.5.3. Comparison of molecular lipid species composition........................................81 3.5.4. Discussion.........................................................................................................83
4. Conclusions ......................................................................................................................84 5. Materials and methods......................................................................................................88
5.1.1. Chemicals, cell media and lipid standards........................................................88 5.1.2. Synthesis of PI 17:0/17:0..................................................................................88 5.1.3. Hydrolysis of PC standards by phospholipase A2 ............................................88 5.1.4. Yeast strains, growth conditions and lipid extraction ......................................89 5.1.5. Fractionation of yeast sphingolipids by TLC ...................................................89 5.1.6. Mammalian cell culture, sample preparation and lipid extraction ...................90 5.1.7. Acetyl chloride derivatization of cholesterol....................................................90 5.1.8. Sample preparation for mass spectrometric analysis........................................90 5.1.9. Quadrupole time-of-flight mass spectrometry..................................................91 5.1.10. Mass spectrometry on ion trap and hybrid LTQ Orbitrap instruments ............92 5.1.11. Annotation of glycerophospholipid species .....................................................92 5.1.12. Annotation of sphingolipid species ..................................................................93 5.1.13. Lipid Profiler prototype software .....................................................................93
6. References ........................................................................................................................95 7. Appendix: List of fragment ions.....................................................................................102 8. Publications ....................................................................................................................103 9. Acknowledgments ..........................................................................................................104 10. Declaration according to § 5.5.........................................................................................105

5
LIST OF ABBREVIATIONS Cer/[Cer]- - used for the annotation of ceramide species or designating ceramide-specific
fragment ions [CerP]- - used to designate ceramide phosphate-specific fragment ions Da - Dalton FA - fatty acid FWHM - Full Width at Half Maximum, -I - used to designate fragment ions produced by neutral loss of inositol [IP]- - inositolphosphate fragment ion IPC - inositolphosphoceramide [LCBP]- - used for designating long chain base phosphate-specific fragment ions LPC - lysophosphatidylcholine LTQ Orbitrap - hybrid linear ion trap Orbitrap mass spectrometer. m/z - mass per charge ratio MS - mass spectrometry MS/MS - tandem mass spectrometry MSn - multi-stage mass spectrometry MIPC - mannosyl-inositolphosphoceramide [MIP]- - mannosyl-inositolphosphate fragment ion M(IP)2C - mannosyl-diinositolphosphoceramide [M(IP)2]2- - doubly charged mannosyl-diinositolphosphate fragment ion MPIS - multiple precursor ion scanning MRM - multiple reaction monitoring -P - used to designate fragment ions produced by neutral loss of phosphate PA - phosphatidic acid PC - phosphatidylcholine PE - phosphatidylethanolamine PG - phosphatidylglycerol PI - phosphatidylinositols PIS - precursor ion scanning; PIS m/z 281.3 stands for scanning for precursor ions that produce a fragment ion with m/z 281.3 upon collision-induced dissociation PLA2 - phospholipase A2 ppm - parts per million PS - phosphatidylserine PX FAi/FAj - PX molecule with FAi moiety on the sn-1 position of the glycerol phosphate backbone, and FAj moiety on the sn-2 position PX FAi-FAj - PX molecule (or a mixture of isomeric molecules) comprising FAi-FAj on unidentified positions of the glycerol phosphate backbone QqTOF - quadrupole time-of-flight mass spectrometer, “q” stands for a RF-only
quadrupole of the collision cell SM - sphingomyelin TLC - thin-layer chromatography TOF - time-of-flight
6
INDEX OF FIGURES
Figure Content Page
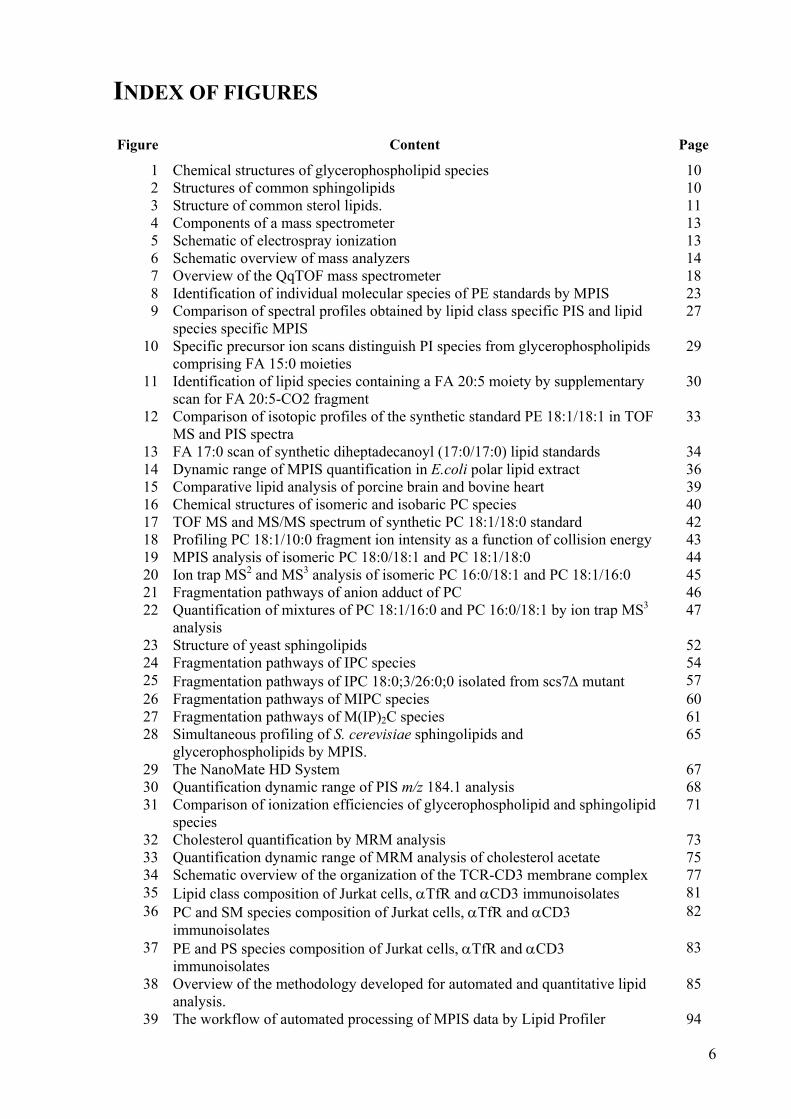
1 Chemical structures of glycerophospholipid species 10 2 Structures of common sphingolipids 10 3 Structure of common sterol lipids. 11 4 Components of a mass spectrometer 13 5 Schematic of electrospray ionization 13 6 Schematic overview of mass analyzers 14 7 Overview of the QqTOF mass spectrometer 18 8 Identification of individual molecular species of PE standards by MPIS 23 9 Comparison of spectral profiles obtained by lipid class specific PIS and lipid
species specific MPIS 27
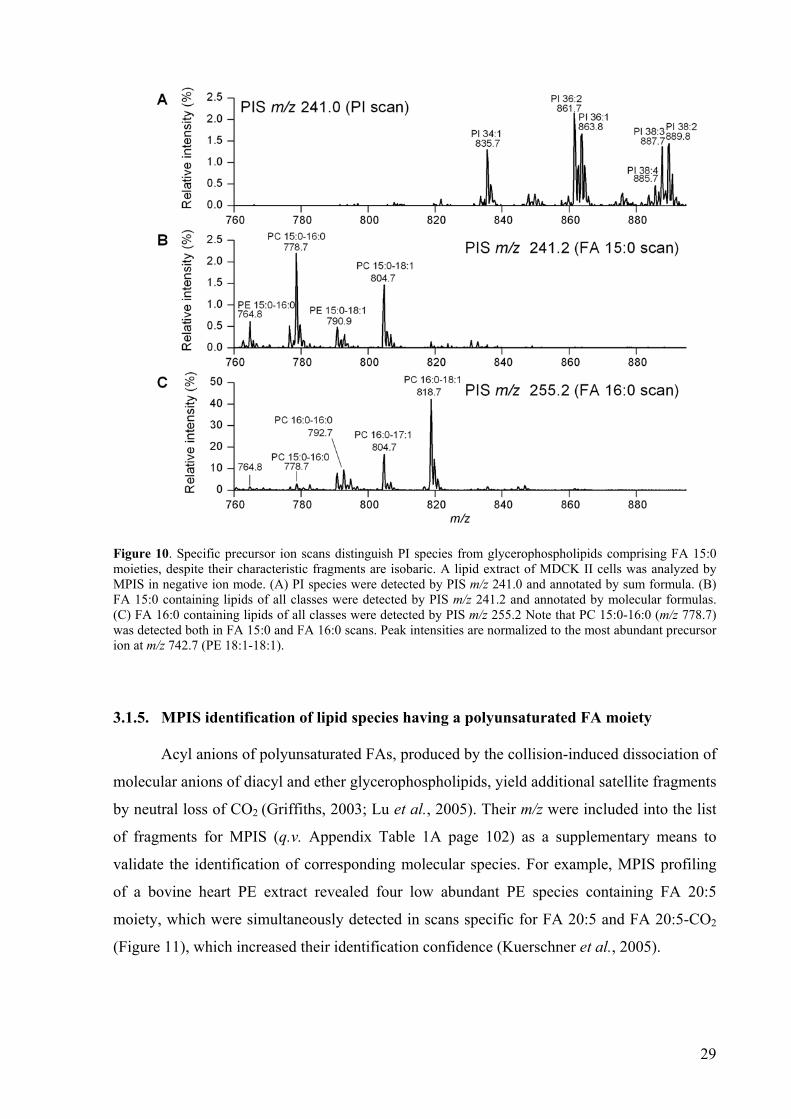
10 Specific precursor ion scans distinguish PI species from glycerophospholipids comprising FA 15:0 moieties
29
11 Identification of lipid species containing a FA 20:5 moiety by supplementary scan for FA 20:5-CO2 fragment
30
12 Comparison of isotopic profiles of the synthetic standard PE 18:1/18:1 in TOF MS and PIS spectra
33
13 FA 17:0 scan of synthetic diheptadecanoyl (17:0/17:0) lipid standards 34 14 Dynamic range of MPIS quantification in E.coli polar lipid extract 36 15 Comparative lipid analysis of porcine brain and bovine heart 39 16 Chemical structures of isomeric and isobaric PC species 40 17 TOF MS and MS/MS spectrum of synthetic PC 18:1/18:0 standard 42 18 Profiling PC 18:1/10:0 fragment ion intensity as a function of collision energy 43 19 MPIS analysis of isomeric PC 18:0/18:1 and PC 18:1/18:0 44 20 Ion trap MS2 and MS3 analysis of isomeric PC 16:0/18:1 and PC 18:1/16:0 45 21 Fragmentation pathways of anion adduct of PC 46 22 Quantification of mixtures of PC 18:1/16:0 and PC 16:0/18:1 by ion trap MS3
analysis 47
23 Structure of yeast sphingolipids 52 24 Fragmentation pathways of IPC species 54 25 Fragmentation pathways of IPC 18:0;3/26:0;0 isolated from scs7∆ mutant 57 26 Fragmentation pathways of MIPC species 60 27 Fragmentation pathways of M(IP)2C species 61 28 Simultaneous profiling of S. cerevisiae sphingolipids and
glycerophospholipids by MPIS. 65
29 The NanoMate HD System 67 30 Quantification dynamic range of PIS m/z 184.1 analysis 68 31 Comparison of ionization efficiencies of glycerophospholipid and sphingolipid
species 71
32 Cholesterol quantification by MRM analysis 73 33 Quantification dynamic range of MRM analysis of cholesterol acetate 75 34 Schematic overview of the organization of the TCR-CD3 membrane complex 77 35 Lipid class composition of Jurkat cells, αTfR and αCD3 immunoisolates 81 36 PC and SM species composition of Jurkat cells, αTfR and αCD3
immunoisolates 82
37 PE and PS species composition of Jurkat cells, αTfR and αCD3 immunoisolates
83
38 Overview of the methodology developed for automated and quantitative lipid analysis.
85
39 The workflow of automated processing of MPIS data by Lipid Profiler 94

7
INDEX OF TABLES
Table Content Page
1 The number of lipid species identified by lipid class-specific scans and by MPIS analysis
27
2 Quantification of the isobaric species PE O-16:1/22:6 and PE 18:0/18:0 31 3 Isomeric purity of synthetic PC standards 41 4 The molecular composition of PC species from human red blood cells 49 5 Structure specific fragment ions produced from inositol-containing
sphingolipids 58
6 Detection of inositol-containing sphingolipids in various yeasts 63 7 Overview of monitored lipid classes and applied methodology for the
characterization of the lipidome of TCR signaling domains 79
8 Overview of the applied solvent systems and concomitant ion spray settings 91 1A Fatty acid and lipid class-specific fragment ions applicable for MPIS in
negative ion mode 102
8
1. INTRODUCTION
1.1. LIPIDOMICS
The crucial role of lipids in cell, tissue and organ physiology is evident by their unique
membrane organizing properties that provide cells with functionally distinct subcellular
membrane compartments (e.g. endoplasmatic reticulum, Golgi apparatus, secretory vesicles,
plasma membrane, etc.), their functional role in cell signaling (e.g. phospholipase C and
phospholipase A2 in modulating immunological responses), their endocrine actions (e.g.
steroid hormones), and their essential role for energy production and energy storage (Vance
and Vance, 1996). Cells, whether bacterial, fungal or mammalian, are all equipped with
metabolic pathways capable of producing an assortment of structurally and functionally
distinct lipid species by combining a variety of apolar fatty acid (FA) or fatty alcohol moieties
with different backbone structures (i.e. glycerol phosphate and long chain bases) and various
head groups. In mammalian cell membranes the total number of molecular lipid species may
well exceed thousands (van Meer, 2005).
Although the chemical diversity of lipids is well appreciated and has been correlated to
specific cellular phenomena and disease states (Casserly and Topol, 2004; Ikonen and Holtta-
Vuori, 2004; Serhan and Savill, 2005; Simons and Ehehalt, 2002), the molecular mechanisms
that underpin this diversity remain poorly understood. In part, this is due to the lack of
adequate analytical techniques capable of measuring the structural details of lipid species in a
direct, comprehensive and quantitative manner. Novel analytical approaches, in particular the
mass spectrometry-based techniques, are emerging for the system-level analysis of lipid
species and are set to define the cell biological and physiological functions of the lipid species
heterogeneity.
Lipidomics can be defined as the system-level analysis and characterization of lipids
and their interaction partners (van Meer, 2005; Wenk, 2005). A "lipidome" is the
comprehensive and quantitative description of a set of lipid species; for example constituting
a cell (thereby termed cellular lipidome). Lipidomics is a subgroup within the field of
metabolomics. Furthermore, lipidomics can be subdivided into membrane-lipidomics and
mediator-lipidomics (Serhan, 2005) which address either the comprehensive and quantitative
description of membrane lipid constituents, or the structural characterization and
quantification of low abundant bioactive lipid species, respectively.

9
1.1.1. Classification and chemistry of lipids
Lipids can be classified into 8 classes based on their chemical structure: fatty acyls,
glycerolipids, glycerophospholipids, sphingolipids, sterol lipids, prenol lipids, saccharolipids,
and polyketides (Fahy et al., 2005). Pertinent to this thesis work are the three main classes of
membrane lipids: glycerophospholipids, sphingolipids and sterol lipids.
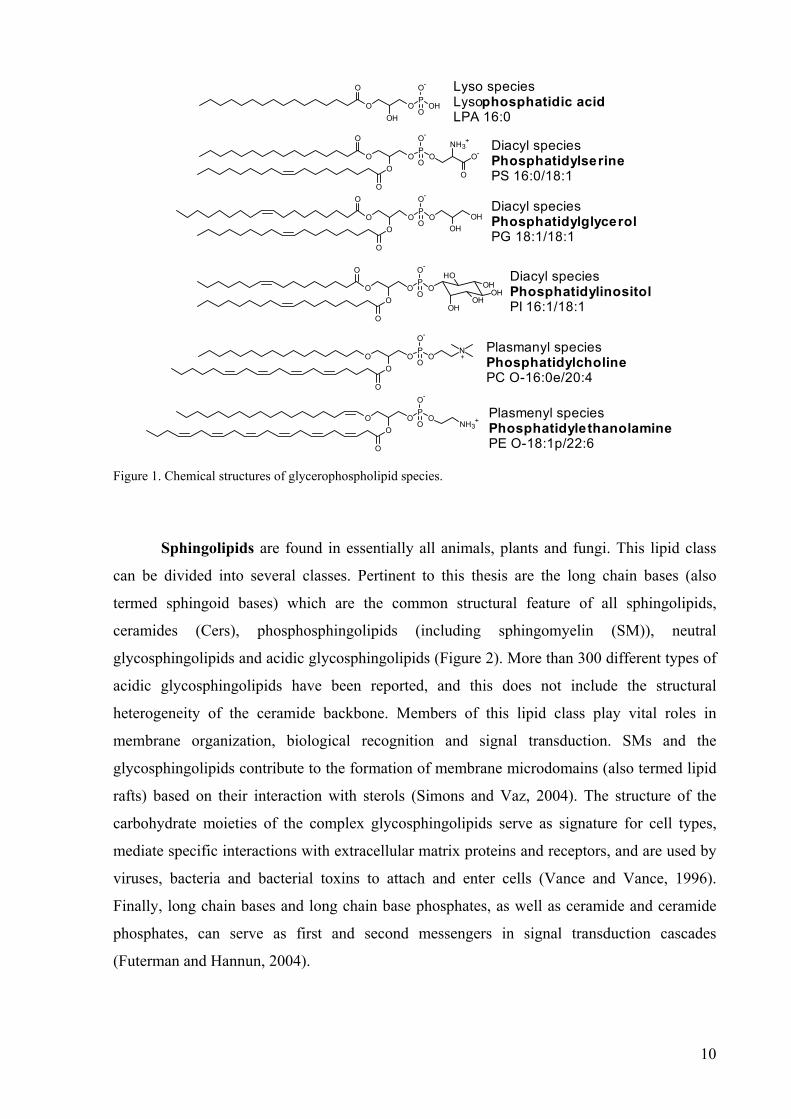
Glycerophospholipids are the major components of biological membranes, and have
inherent biological activities by acting as second messengers themselves or as precursors for
the generation of second messengers (Vance and Vance, 1996). Glycerophospholipids consist
of a glycerol phosphate backbone with a head group attached at the sn-3 position, and FA or
fatty alcohol moieties attached to the remaining two positions via ester or ether bonds,
respectively. Seven classes of glycerophospholipids are commonly recognized based on the
chemical structure of the head group: phosphatidic acid (PA), phosphatidylserine (PS),
phosphatidylglycerol (PG), cardiolipin, phosphatidylcholine (PC), phosphatidylethanolamine
(PE), and phosphatidylinositol (PI) (Figure 1).
Glycerophospholipids with an ether or vinyl-ether linked fatty alcohol moiety at the
sn-1 position are subdivided into plasmanyl species and plasmenyl species (also termed
plasmalogens), respectively (Figure 1) (IUPAC-IUB, 1978; Nagan and Zoeller, 2001). In
mammalians, ether linkages occur predominantly in PCs and PEs. Plasmanyl species typically
exist as PC species, whereas plasmenyl species mainly exist as PE species with the exception
of the heart where plasmenyl PC species predominate (Vance and Vance, 1996). The main
significance of ether species relate to the production of platelet activating factor (1-alkyl-2-
acetyl-PC) and its concomitant implication in blood coagulation and inflammatory responses.
Lysospecies exist having only one FA or fatty alcohol moiety attached to the glycerol
phosphate backbone (Figure 1). Lysospecies occur as intermediates in glycerophospholipid
biosynthesis, and function as second messengers.
10
Diacyl speciesPhosphatidylinositolPI 16:1/18:1
Plasmanyl speciesPhosphatidylcholinePC O-16:0e/20:4
Plasmenyl speciesPhosphatidylethanolamine PE O-18:1p/22:6
OP
OO
O-
OO
O
OOH
OHOH
OHHO
OP
OO
O-
OO
O
NH3+
OHP
OO
O-
OOH
O Lyso speciesLysophosphatidic acidLPA 16:0
Diacyl speciesPhosphatidylserinePS 16:0/18:1
+
Diacyl speciesPhosphatidylglycerolPG 18:1/18:1
OP
OO
O-
OO
O
O
OHOH
N
O
OO
O-
O OP
O
O
O
OO
O-
O OP
O
NH3+
O-O
Figure 1. Chemical structures of glycerophospholipid species.
Sphingolipids are found in essentially all animals, plants and fungi. This lipid class
can be divided into several classes. Pertinent to this thesis are the long chain bases (also
termed sphingoid bases) which are the common structural feature of all sphingolipids,
ceramides (Cers), phosphosphingolipids (including sphingomyelin (SM)), neutral
glycosphingolipids and acidic glycosphingolipids (Figure 2). More than 300 different types of
acidic glycosphingolipids have been reported, and this does not include the structural
heterogeneity of the ceramide backbone. Members of this lipid class play vital roles in
membrane organization, biological recognition and signal transduction. SMs and the
glycosphingolipids contribute to the formation of membrane microdomains (also termed lipid
rafts) based on their interaction with sterols (Simons and Vaz, 2004). The structure of the
carbohydrate moieties of the complex glycosphingolipids serve as signature for cell types,
mediate specific interactions with extracellular matrix proteins and receptors, and are used by
viruses, bacteria and bacterial toxins to attach and enter cells (Vance and Vance, 1996).
Finally, long chain bases and long chain base phosphates, as well as ceramide and ceramide
phosphates, can serve as first and second messengers in signal transduction cascades
(Futerman and Hannun, 2004).

11
Figure 2. Chemical structure of common sphingolipids.
Sterol lipids (Figure 3), of which cholesterol and its derivatives are the most widely
studied in mammalian systems, constitute an important component of membrane lipids. In
addition, this structurally complex lipid class is implicated in numerous physiological
functions including hormonal actions (steroid hormones), digestive processes (bile acids),
tissue development (Eaton, 2006) and regulating cell membrane permeability (Haines, 2001).
In addition to cholesterol, there are many unique sterols in plant, fungal and marine sources
(Vance and Vance, 1996).
Figure 3. Chemical structure of common sterol lipids.

12
1.2. MASS SPECTROMETRIC LIPID ANALYSIS
In order to gain further insights into the molecular mechanisms that underpin the lipid
species diversity of biological membranes, the application of analytical methodology capable
of measuring the structural details of lipid species in a direct, comprehensive and quantitative
manner is required. Conventional analytical technologies for lipid analysis such as high-
performance liquid chromatography, thin-layer chromatography (TLC), and gas
chromatography are only applicable for the characterization of global perturbations of lipid
composition or target analysis of radioactively or fluorescently labeled species (Blank et al.,
1984; Connor et al., 1997; Kuypers et al., 1991). These techniques are time-consuming, labor-
intensive, require relatively large amount of sample, and can be prone to biased losses of
certain types of lipids (DeLong et al., 2001). Improvements in mass spectrometric technology
have proved highly efficient for the characterization and quantification of molecular lipid
species in total lipid extracts (Reviewed by Griffiths, 2003; Han and Gross, 2005; Merrill et
al., 2005; Murphy et al., 2001; Pulfer and Murphy, 2003). This methodology is less time-
consuming compared to that of conventional methods, and requires less sample amount
because of its higher sensitivity and specificity.
1.2.1. Fundamentals of mass spectrometry
Mass spectrometry is a method that measures the mass-to-charge ratio (m/z, can be
measured in Dalton (Da)) of molecular ions and detects their intensity. The data generated by
a mass spectrometer is represented by a mass spectrum having the m/z of molecular ions on
the abscissa and their intensity on the ordinate (Figure 17A page 42). By mass spectrometry,
the accurate mass estimate of a given molecular ion, the abundance, and, in the case of
tandem or multiple-stage (MSn) mass spectrometry, structural information can be obtained.
There are three main components of a mass spectrometer: an ion source, mass
analyzers, and an ion detector (Figure 4). The ion source serves to generate molecular ions in
gas phase (e.g. by electron impact, electrospray ionization). The molecular ions are focused
and transported by ion optics into the mass analyzers which separate the ions according to
their m/z prior to their final registration by an ion detector. All components are operated by
dedicated electronics and a computer. The mass analyzer and ion detector sections are
operated at low pressures to allow unperturbed transmission and detection of the gas phase
ions (i.e. in the range of 10-2 to 10-7 Torr).

13
Figure 4. Typical components of a mass spectrometer include an ionization source, a section of mass analyzers, and an ion detector. The components are operated by electronics and a computer.
Electrospray ionization is a commonly used method for the mass spectrometric
analysis of glycerophospholipids and sphingolipids. The basics of electrospray ionization are
reviewed by Cole (2000). Electrospray ionization generates molecular ions at atmospheric
pressure by passing a sample in solution through a small capillary at a low flow rate (1-300
µl/min). The application of a strong electric field (1-4 kV) results in electrolytic processes
within the capillary and an electrical field at the apex of the capillary, which produces a fine
spray of charged droplets. A series of fission events ultimately leads to the production of
smaller droplets that bear an excess charge and a single molecule. Inevitably, single molecules
will become charged as the remaining solvent evaporates (Figure 5). The electrospray
ionization process produces ions primarily via protonation (in positive ion mode) or
deprotonation (in negative ion mode), or via the formation of adduct cations (e.g. Li+) or
adduct anions (e.g. Cl-).
Figure 5. Schematic of electrospray ionization in positive ion mode.
Electrospray ion sources can be combined with mass spectrometers having distinct
types of mass analyzers such as quadrupole, ion trap, time-of-flight (TOF), Fourier transform
ion cyclotron resonance and orbitrap. Each type of mass analyzer and concomitant ion
detector has its specific analytical advantages. Importantly, all analyzers differ in the speed by
which they produce mass spectra, their mass accuracy (the error of the estimated m/z value
compared to the calculated m/z value) and mass resolution (which can be defined as ∆m being
the full width of a peak at half its maximum (FWHM) height).
Quadrupole mass analyzers are ion beam analyzers. These devices are usually
composed of four rods with cylindrical geometry arranged in a specific three-dimensional

14
orientation (Figure 6A). By applying a combination of direct current and relative frequency
voltages to the rods, ions can be transmitted through the quadrupole mass analyzer. The
analyzer can be operated in three modes, depending on the selection of voltages and
frequencies: (i) all ions with m/z within a certain interval (e.g. 200 to 1000) can be transmitted
simultaneously, (ii) ions of a given m/z ratio can traverse the analyzer, whereas ions with
different m/z ratios collide with the rods and are lost, or (iii) ions of increasing m/z can be
made to pass successively through the analyzer in small intervals (e.g. 0.1 to 0.2 Da). In the
last mentioned operation mode, the quadrupole mass analyzer is said to be scanning, and is
the basis of precursor ion scanning (PIS) technology (q.v. additional details below).
D
Figure 6. Schematic overview of mass analyzers. (A) Quadrupole mass analyzer. The top rod is not shown since the view is from above. (B) TOF analyzer. (C) Quadrupole ion trap mass spectrometer. The ion trap analyzer is composed of the two end-cap electrodes and the ring electrode. (D) Cutaway view of the orbitrap mass analyzer. Picture is adapted from (March, 1997) and (Hu et al.).
The TOF analyzer is a relatively simple device (Figure 6B). In this type of analyzer,
ions are pulse-accelerated into a TOF drift tube. Based on difference in obtained velocity, ions
will be separated according to m/z. Since all ions acquire the same energy during the pulse,
ions of lower m/z ions achieve higher velocities than the higher m/z ions. Thus, the m/z of ions
can be determined by measuring the time it takes for the ions to travel a fixed distance.
Quadrupole ion trap mass analyzers are composed of two end-cap electrodes and
one ring electrode (Glish and Vachet, 2003; March, 1997) (Figure 6C). Ions are injected in the
trap over a short period of time and are then maintained in stable orbits within the trap by
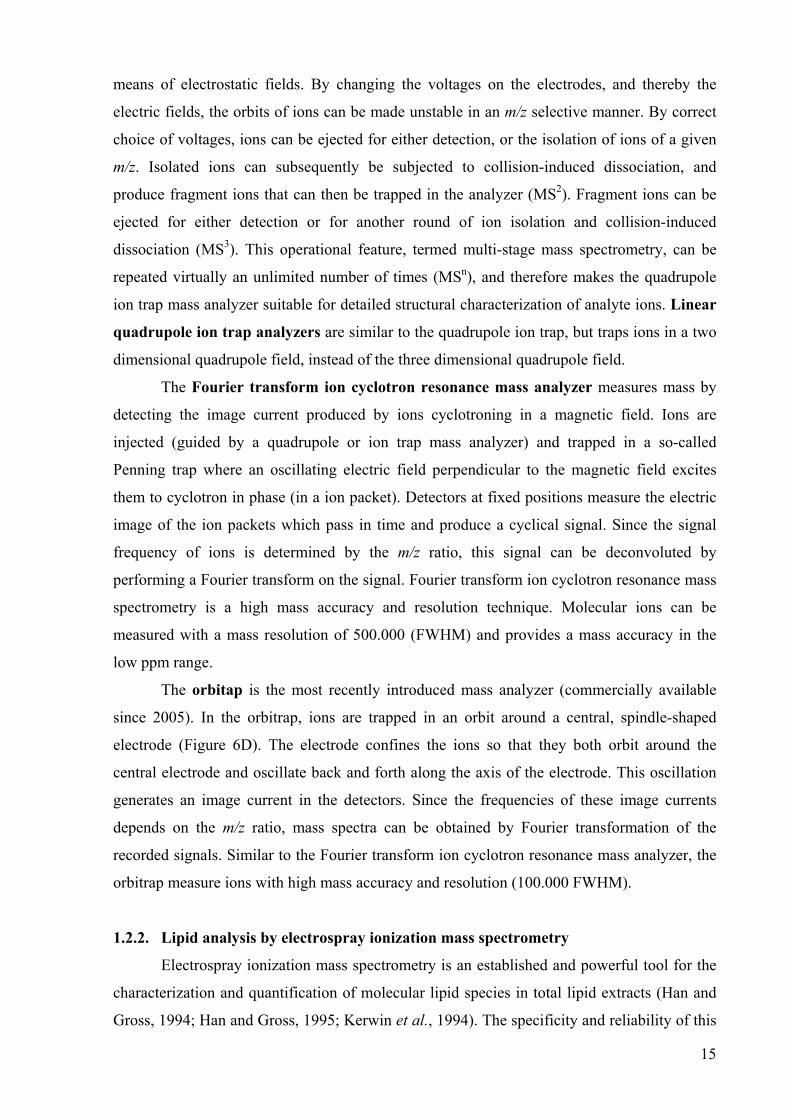
15
means of electrostatic fields. By changing the voltages on the electrodes, and thereby the
electric fields, the orbits of ions can be made unstable in an m/z selective manner. By correct
choice of voltages, ions can be ejected for either detection, or the isolation of ions of a given
m/z. Isolated ions can subsequently be subjected to collision-induced dissociation, and
produce fragment ions that can then be trapped in the analyzer (MS2). Fragment ions can be
ejected for either detection or for another round of ion isolation and collision-induced
dissociation (MS3). This operational feature, termed multi-stage mass spectrometry, can be
repeated virtually an unlimited number of times (MSn), and therefore makes the quadrupole
ion trap mass analyzer suitable for detailed structural characterization of analyte ions. Linear
quadrupole ion trap analyzers are similar to the quadrupole ion trap, but traps ions in a two
dimensional quadrupole field, instead of the three dimensional quadrupole field.
The Fourier transform ion cyclotron resonance mass analyzer measures mass by
detecting the image current produced by ions cyclotroning in a magnetic field. Ions are
injected (guided by a quadrupole or ion trap mass analyzer) and trapped in a so-called
Penning trap where an oscillating electric field perpendicular to the magnetic field excites
them to cyclotron in phase (in a ion packet). Detectors at fixed positions measure the electric
image of the ion packets which pass in time and produce a cyclical signal. Since the signal
frequency of ions is determined by the m/z ratio, this signal can be deconvoluted by
performing a Fourier transform on the signal. Fourier transform ion cyclotron resonance mass
spectrometry is a high mass accuracy and resolution technique. Molecular ions can be
measured with a mass resolution of 500.000 (FWHM) and provides a mass accuracy in the
low ppm range.
The orbitap is the most recently introduced mass analyzer (commercially available
since 2005). In the orbitrap, ions are trapped in an orbit around a central, spindle-shaped
electrode (Figure 6D). The electrode confines the ions so that they both orbit around the
central electrode and oscillate back and forth along the axis of the electrode. This oscillation
generates an image current in the detectors. Since the frequencies of these image currents
depends on the m/z ratio, mass spectra can be obtained by Fourier transformation of the
recorded signals. Similar to the Fourier transform ion cyclotron resonance mass analyzer, the
orbitrap measure ions with high mass accuracy and resolution (100.000 FWHM).
1.2.2. Lipid analysis by electrospray ionization mass spectrometry
Electrospray ionization mass spectrometry is an established and powerful tool for the
characterization and quantification of molecular lipid species in total lipid extracts (Han and
Gross, 1994; Han and Gross, 1995; Kerwin et al., 1994). The specificity and reliability of this

16
methodology was improved by the use of PIS and neutral loss scanning technology (Brugger
et al., 1997). Applying this technology allowed the specific detection of molecular ions
(precursor ions) that upon collision-induced dissociation release characteristic fragment ions.
In positive ion mode PCs and SMs are readily detected as protonated molecular cations. Upon
collision-induced dissociation these ions generate a characteristic fragment ion of the
phosphorylcholine head group having m/z 184.07. Performing PIS m/z 184.1 on a triple
quadrupole mass spectrometer allowed the quantitative profiling of molecular PC and SM
species at the low nM concentration range (Brugger et al., 1997). Collision-induced
dissociation of cationic molecular PE and PS species promote the specific neutral loss of their
head group moiety (e.g. neutral loss of 141 by PE species) which prompted their quantitative
profiling by neutral loss scanning (Brugger et al., 1997). Notably, all glycerophospholipids
except for PCs are preferentially ionized as negatively charged molecular anions. Upon
collision-induced dissociation in negative ion mode, anionic glycerophospholipid species
produce acyl anions corresponding to the FA moieties attached to the glycerol phosphate
backbone (Hsu and Turk, 2000a; Hsu and Turk, 2000b; Hsu and Turk, 2000c; Hsu and Turk,
2001). This prompted the use of PIS technology for quantitative and direct profiling of the FA
constituents molecular glycerophospholipid species (Beckedorf et al., 2002; Ekroos et al.,
2002; Han et al., 2004). Similar approaches have been applied for the molecular
characterization and quantification of sphingolipids (Gu et al., 1997; Han, 2002; Liebisch et
al., 1999).
Electrospray ionization mass spectrometry has been successfully applied in studies of
lipid composition (Blom et al., 2001; Brugger et al., 1999; Brugger et al., 2006; Brugger et
al., 2004; Fridriksson et al., 1999; Rodemer et al., 2003; Schneiter et al., 1999), lipid
trafficking (Heikinheimo and Somerharju, 2002), and lipid metabolism (Boumann et al.,
2003; Boumann et al., 2004; Brooks et al., 2002; DeLong et al., 1999; Hunt et al., 2002).
Interestingly, the studies on lipid metabolism allowed the monitoring of enzyme substrate
specificity and FA remodelling in vivo. The use of stable isotope labeled precursors of PC
metabolism was used to demonstrate that the two pathways for PC synthesis produce different
molecular species in both mammalians and yeast (Boumann et al., 2003; Boumann et al.,
2004; DeLong et al., 1999).
1.2.3. The hybrid quadrupole time-of-flight (QqTOF) mass spectrometer
Mass spectrometric lipid analysis has been developed successfully using triple
quadrupole and ion trap mass spectrometers. However, novel hybrid instrumentations which
combine the analytical advantages of different mass analyzers are emerging as powerful tools
17
for lipid analysis due to their higher sensitivity, mass accuracy and mass resolution. Recently,
a hybrid QqTOF mass spectrometer (Chernushevich et al., 2001) combined with a
nanoelectrospray ion source was successfully applied for comprehensive lipidome analysis
(Ekroos et al., 2002). Contrary to triple quadrupole mass spectrometers which only allow the
acquisition of a single precursor ion scan at the time, QqTOF mass spectrometers can acquire
a virtually unlimited number of precursor ion spectra due to the TOF analyzer. This multiple
precursor ion scanning (MMPPIISS) technology was demonstrated to be an efficient tool for the
simultaneous and quantitative profiling of the FA composition of molecular
glycerophospholipid in total lipid extracts (Ekroos et al., 2002; Kuerschner et al., 2005).
Furthermore, the sensitivity of this instrumentation was similar to that of conventional triple
quadrupole mass spectrometers (Brugger et al., 1997; Liebisch et al., 2004).
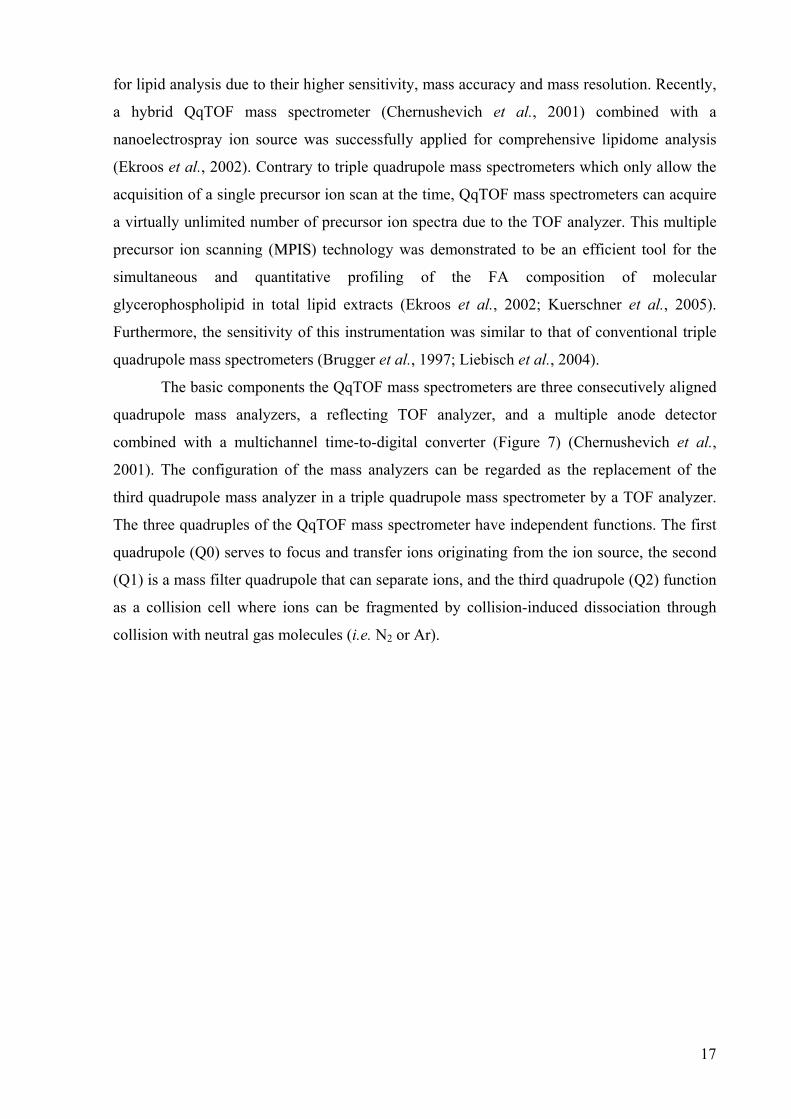
The basic components the QqTOF mass spectrometers are three consecutively aligned
quadrupole mass analyzers, a reflecting TOF analyzer, and a multiple anode detector
combined with a multichannel time-to-digital converter (Figure 7) (Chernushevich et al.,
2001). The configuration of the mass analyzers can be regarded as the replacement of the
third quadrupole mass analyzer in a triple quadrupole mass spectrometer by a TOF analyzer.
The three quadruples of the QqTOF mass spectrometer have independent functions. The first
quadrupole (Q0) serves to focus and transfer ions originating from the ion source, the second
(Q1) is a mass filter quadrupole that can separate ions, and the third quadrupole (Q2) function
as a collision cell where ions can be fragmented by collision-induced dissociation through
collision with neutral gas molecules (i.e. N2 or Ar).

18
Figure 7. Overview of the QqTOF mass spectrometer. From the Operator Manual of QSTAR Pulsar-i
Ions entering from Q2 are detected in the TOF analyzer. The basic components of the
TOF analyzer are an ion accelerator, an ion mirror, and the ion detector. The ion accelerator
serves to accelerate ions, which are then separated in the drift tube based on difference in
velocity. The ion reflector functions to reverse the direction of the ion. This instrumental
feature improves the mass resolution by reducing variation in the kinetic energy ions pulsed
out of the ion accelerator.
The QqTOF mass spectrometer can be operated in three acquisition modes: (i) TOF
mass spectrometry (TOF MS) mode, (ii) tandem mass spectrometry (MS/MS) mode, and (iii)
(M)PIS mode. In TOF MS mode, the mass filter quadrupole (Q1) is operated as a
transmission element, i.e. all ions having a broad range of m/z are transmitted simultaneously,
and the TOF analyzer records the mass spectrum. This yields a mass spectrum of all ionized
molecules present in the electrosprayed solvent. The TOF MS spectrum provides information
regarding molecular mass (m/z) and number of charges of a given analyte ion (q.v. Figure 17A
page 42). Limited information about the molecular structure of the analyte ion can be derived.
In MS/MS mode, the Q1 is operated in the mass filter mode to transmit only a
precursor ion of interest within a certain mass window (typically of 1-3 Da). Precursor ions
are then accelerated into the collision cell (Q2) where they undergo collision-induced
dissociation through multiple collisions with gas molecules. Resulting product ions (and
remaining precursor ions) then pass into the TOF analyzer for detection. The recorded
MS/MS spectrum reflects a set of structure specific fragment ions that provide structural
19
information about the precursor ion (q.v. Figure 17B page 42). Multiple reaction monitoring
(MRM) and data-dependent acquisition are two additional acquisition modes based on
MS/MS analysis. By data-dependent acquisition an initial survey TOF MS spectrum is
recorded, which is used to automatically select abundant precursor ions for subsequent
MS/MS analysis. The MS/MS analysis of each selected precursor ion is performed only once
during the sample acquisition, and typically requires 30 seconds for recording each MS/MS.
This technology was recently applied for comprehensive lipidome analysis (Schwudke et al.,
2006). MRM analysis allows the targeted MS/MS analysis of a defined set of precursor ions.
This acquisition mode is independent of the abundance of the precursor ions detected by TOF
MS, and is performed by the repeated 1 second MS/MS analysis of each of the targeted
precursor ions for several minutes. Quantitative analysis of targeted precursor ions is readily
performed by monitoring the intensities of fragment ions.
In (M)PIS mode, precursor ions that generate one or a set of specific fragment ions are
detected. In this mode, the Q1 scans over a defined mass range (e.g. m/z 600-900) in small
steps (0.1 or 0.2 Da). Precursor ions with increasing m/z values are sequentially transmitted
and accelerated into the collision cell where they undergo collision-induced dissociation. The
fragment ions generated at the defined precursor m/z are transmitted into the TOF analyzer for
detection. By this technology a Q1 mass spectrum is generated that specifically shows only
the precursor ions producing the monitored fragment ions. Importantly, the TOF analyzer
allows a virtually unlimited number of PIS to be simultaneously recorded and monitored with
high mass accuracy (0.1 Da). In comparison, conventional triple quadrupole mass
spectrometers only allow the monitoring of a single fragment ion with a relatively poor mass
accuracy (1 Da).

20
2. AIM OF THE THESIS
The aim of the thesis study was to develop mass spectrometric methodology for
automated and quantitative lipid analysis. It was desired that the methodology allowed the
characterization and absolute quantification of molecular glycerophospholipid, sphingolipid
and sterol lipid species. The methodology should be designed for high-throughput oriented
lipid analysis by integrating robotic sampling, lipid species-specific mass analysis and
software-assisted deconvolution of spectral data. Furthermore, the methodology should be
applicable for biochemical and cell biological studies of cellular membranes.
21
3. RESULTS AND DISCUSSION
3.1. AUTOMATED IDENTIFICATION AND QUANTIFICATION OF
GLYCEROPHOSPHOLIPID MOLECULAR SPECIES BY MPIS
To understand how the full cellular lipid complement (also termed cellular lipidome
(Han and Gross, 2003; Han and Gross, 2005)) controls diverse cellular processes, it is
important to characterize and quantify lipids as individual molecular species. This means that,
for glycerophospholipid species, the head group and moieties of fatty alcohol and/or FA(s)
should be determined for each lipid molecule.
Collision-induced dissociation of molecular anions of glycerophospholipids produces
abundant acyl anions of their FA moieties (Han and Gross, 1994; Hsu and Turk, 2000a; Hsu
and Turk, 2000b; Hsu and Turk, 2000c; Hsu and Turk, 2001; Kerwin et al., 1994). By
selecting their m/z for MPIS on a hybrid QqTOF mass spectrometer (Chernushevich, 2000;
Chernushevich et al., 2001), the FA composition of a large number of molecular species could
be simultaneously determined in total lipid extracts (Ekroos et al., 2002; Ekroos et al., 2003)
(q.v. section 3.2. page 39). Thus, MPIS advanced the characterization of lipidomes compared
to the conventional analysis by PIS and/or neutral loss scanning that annotates lipid species by
their lipid class and sum formula (the total number of carbon atoms and double bonds) of their
FA moieties (Brugger et al., 1997; Han and Gross, 1994; Koivusalo et al., 2001; Liebisch et
al., 2004; Wenk et al., 2003). The specificity arising from the accurate selection of m/z of
fragment ions by the high mass resolution TOF analyzer enhanced the dynamic range of
precursor ion scans (Ekroos et al., 2002; Steen et al., 2001) and enabled the identification of
low abundant molecular species from various classes of glycerophospholipids comprising
unique FA moieties (Kuerschner et al., 2005).
However, MPIS spectra acquired from total lipid extracts are exceedingly complex
and hardly amenable to manual interpretation under high-throughput settings (Ekroos et al.,
2002). The identification of molecular species of glycerophospholipids typically required
manual reviewing, matching and annotation of more than 40 simultaneously acquired
precursor ion spectra, which, considering a large number of detected precursors and a more
than ten-fold difference in their abundance was extremely laborious. Furthermore, only
relative quantification of individual species was possible since no methods for absolute
quantification (including the selection of internal standards and isotope intensity correction

22
algorithms (Han and Gross, 2005)) were available. This severely limited the scope and impact
of MPIS-driven lipidomics and prompted the development of algorithms and their software
implementation for rapid, quantitative and automated interpretation of large amounts of MPIS
data.
This section describes the methodology developed for the identification and
quantification of molecular glycerophospholipid species by automated interpretation of MPIS
spectra which has been implemented in dedicated software termed Lipid Profiler. Endogenous
species of common lipid classes could be simultaneously quantified using a set of synthetic
lipid class-specific diheptadecanoyl (17:0/17:0) internal standards, and applying a novel
algorithm for the isotopic correction of peak intensities adjusted to the specific features of
MPIS spectra.
3.1.1. Identification of lipid species by MPIS
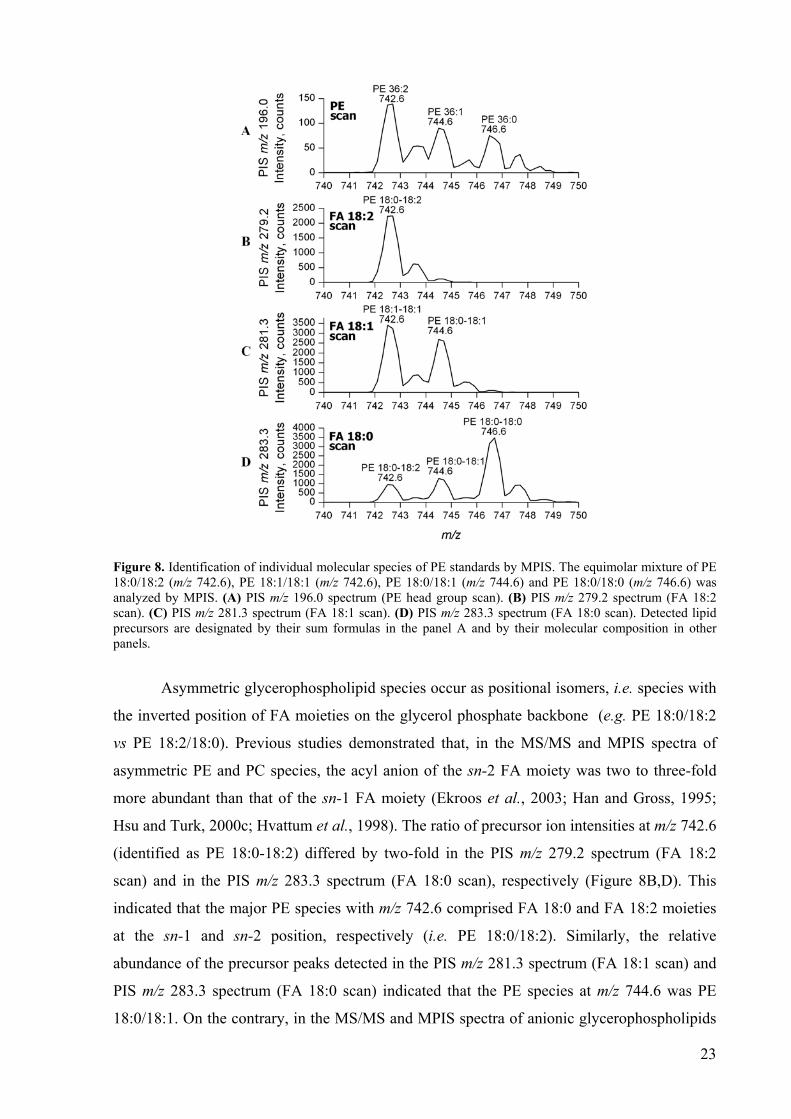
Figure 8 shows how MPIS for acyl anions of FAs and a head group-specific fragment
ion identified glycerophospholipid molecular species. An equimolar mixture of synthetic PE
18:0/18:2, PE 18:1/18:1, PE 18:0/18:1 and PE 18:0/18:0 was directly infused into a hybrid
QqTOF mass spectrometer. MPIS analysis was performed in negative ion mode by
simultaneously acquiring precursor ion spectra for the PE head group fragment ion (PIS m/z
196.0, Figure 8A), and acyl anions corresponding to FA 18:2 (PIS m/z 279.2, Figure 8B), FA
18:1 (PIS m/z 281.3, Figure 8C) and FA 18:0 (PIS m/z 283.3, Figure 8D), respectively. The
PE head group scan detected three precursor ions at m/z 742.6, 744.6 and 746.6,
corresponding to PE species with the sum formulae PE 36:2, PE 36:1 and PE 36:0,
respectively (Figure 8A). Cross-correlation of peak profiles in the PE head group scan, and
the three FA scans, revealed that PE 36:2 was comprised of two individual molecular species,
i.e. asymmetric PE 18:0-18:2 species, as determined by the simultaneous detection of the
precursor ion with m/z 742.6 by FA 18:2 scan (PIS m/z 279.2, Figure 8B) and by FA 18:0
scan (PIS m/z 283.3, Figure 8D), and symmetric PE 18:1-18:1 species detected by FA 18:1
scan (PIS m/z 281.3, Figure 8C). Similarly, MPIS identified PE 36:1 (m/z 744.6) and PE 36:0
(m/z 746.6) species as PE 18:0-18:1 and PE 18:0-18:0, respectively (Figure 8C,D).
23
Figure 8. Identification of individual molecular species of PE standards by MPIS. The equimolar mixture of PE 18:0/18:2 (m/z 742.6), PE 18:1/18:1 (m/z 742.6), PE 18:0/18:1 (m/z 744.6) and PE 18:0/18:0 (m/z 746.6) was analyzed by MPIS. (A) PIS m/z 196.0 spectrum (PE head group scan). (B) PIS m/z 279.2 spectrum (FA 18:2 scan). (C) PIS m/z 281.3 spectrum (FA 18:1 scan). (D) PIS m/z 283.3 spectrum (FA 18:0 scan). Detected lipid precursors are designated by their sum formulas in the panel A and by their molecular composition in other panels.
Asymmetric glycerophospholipid species occur as positional isomers, i.e. species with
the inverted position of FA moieties on the glycerol phosphate backbone (e.g. PE 18:0/18:2
vs PE 18:2/18:0). Previous studies demonstrated that, in the MS/MS and MPIS spectra of
asymmetric PE and PC species, the acyl anion of the sn-2 FA moiety was two to three-fold
more abundant than that of the sn-1 FA moiety (Ekroos et al., 2003; Han and Gross, 1995;
Hsu and Turk, 2000c; Hvattum et al., 1998). The ratio of precursor ion intensities at m/z 742.6
(identified as PE 18:0-18:2) differed by two-fold in the PIS m/z 279.2 spectrum (FA 18:2
scan) and in the PIS m/z 283.3 spectrum (FA 18:0 scan), respectively (Figure 8B,D). This
indicated that the major PE species with m/z 742.6 comprised FA 18:0 and FA 18:2 moieties
at the sn-1 and sn-2 position, respectively (i.e. PE 18:0/18:2). Similarly, the relative
abundance of the precursor peaks detected in the PIS m/z 281.3 spectrum (FA 18:1 scan) and
PIS m/z 283.3 spectrum (FA 18:0 scan) indicated that the PE species at m/z 744.6 was PE
18:0/18:1. On the contrary, in the MS/MS and MPIS spectra of anionic glycerophospholipids
24
(i.e. PA, PS, and PG), the relative intensity of acyl anions is reversed – the acyl anion of the
sn-1 FA moiety is more abundant than the acyl anion of the sn-2 FA moiety (Hsu and Turk,
2000b; Hsu and Turk, 2001).
If required, the relative amount of positional isomers could be estimated by correlating
the precursor ion intensity ratio to a response function determined by MPIS analysis of a set
of synthetic positional isomers identical or similar to the endogenous species in question (e.g.
PE 18:0/18:2 and PE 18:2/18:0). However, due to the vast number of molecular species in
total lipid extracts this approach is practically impossible since it requires determining
response functions for each pair of potential positional isomers. To circumvent this limitation
of MPIS analysis, methodology was developed to accurately determine the relative amount of
positional isomers by the direct MS3 analysis of lipid precursors on an ion trap mass
spectrometer (q.v. section 3.2, page 39).
3.1.2. Identification of lipid species by Lipid Profiler software
Lipid Profiler software was developed for automated identification and quantification
of molecular lipid species detected by TOF MS and MPIS. Lipid Profiler deciphered MPIS
spectra and identified molecular species of glycerophospholipids, essentially as outlined
above. The identification of an asymmetric glycerophospholipid species required that the
same precursor ion was detected by two complementary FA scans (e.g. the detection of
precursor ions with m/z 742.6 by scans for FA 18:0 and FA 18:2, Figure 8B,D). In addition,
the precursor ion m/z should equal, within a specified tolerance, the m/z expected for a lipid
species of a given class, whose sum formula matches the total number of carbon atoms and
double bonds in the corresponding FA scans. In the example above, the precursor ions with
m/z 742.6 matched the m/z expected for the sum formula of PE 36:2 (i.e. m/z 742.54), since it
was detected by PIS m/z 283.3 and PIS m/z 279.2 for the acyl anions of FA 18:0 and FA 18:2,
respectively. The identification of symmetric glycerophospholipid species relied on the
detection of a precursor ion by a single FA scan, however, both matching criteria equally
applied. Hence, the precursor ion with m/z 742.6 should match the sum formula of PE 36:2,
since it was detected by PIS m/z 281.3 for the acyl anion of FA 18:1 (Figure 8C).
In some glycerophospholipid species the hydrocarbon moiety is attached to the sn-1
position of the glycerol phosphate backbone through an ether bond (plasmanyl species) or
vinyl ether bond (plasmenyl species or plasmalogens) (Figure 1 page 10) (Nagan and Zoeller,
2001). Collision-induced dissociation of molecular anions of both plamanyl and plasmenyl
species produces abundant acyl anions of the sn-2 FA moieties, along with relatively low
abundant head group fragments and, for the plasmenyl species, also a low abundant
25
alkenoxide fragment ions is produced from the O-alk-1’-enyl moiety. Acyl anions were
typically 20- to 100-fold more abundant compared to alkenoxide fragments. Alkenoxide
fragments and acyl anions that differ by a single methylene group are isobaric (∆m = 0.0364
Da), and therefore robust assignment of precursor ions as ether or diacyl species relied upon
the abundance difference between sn-2 and sn-1 related fragments: to recognize a precursor
ion as an ether species, more than a 20-fold difference in abundance was typically required.
Otherwise, this precursor was considered as a diacyl species. Ambiguous assignments could
be verified by direct MS/MS analysis of the corresponding precursors (Schwudke et al., 2006;
Zemski Berry and Murphy, 2004)
The lipid species identification was further supported by the concomitant detection of
the same precursor ions in confirmatory and/or supplementary precursor ion scans.
Confirmatory scans use m/z of lipid class-specific fragment ions, such as PIS m/z 196.0 - the
PE head group scan. For example, the identification of PE 18:0-18:2 detected at m/z 742.6 by
scans specific for FA 18:0 and FA 18:2 moieties (Figure 8B,D), was validated by detecting
the same precursor by the PE head group-specific scan (Figure 8A). Supplementary scans
utilize fragment ions that are common for lipids of all classes comprising specific FA
moieties. For example, upon collision-induced dissociation, acyl anions of polyunsaturated
FAs lose CO2. Corresponding m/z of neutral loss products were included in the MPIS
experiment and supported the identification of lipid species containing a polyunsaturated FA
moiety, independently of the lipid class (q.v. section 3.1.5 page 29).
A typical MPIS analysis utilized 41 simultaneously acquired precursor ion scans and
recognized ca. 200 lipid precursors in a total lipid extract. The spectra were interpreted by
Lipid Profiler within 30 seconds on a conventional (Pentium 4) desktop computer. Within this
time period the software accessed the MPIS data file, produced a peak list with a user-defined
threshold intensity, performed isotopic correction (see below), annotated precursor ions and
created the identification report. Details on the quantification routines are presented in section
3.1.7 page 32.
3.1.3. MPIS enhances the identification specificity of lipid molecular species
The performance of MPIS in identifying molecular species of glycerophospholipids
was evaluated by comparing it to the conventional lipid-class specific precursor- and neutral
loss scans commonly applied in lipidomics. To this end, a commercially available PC extract
from bovine heart was analyzed by PIS m/z 184.1 in positive ion mode. This scan specifically
detects PC and SM species, yet it only annotates them with the sum formula (Brugger et al.,
1997; Liebisch et al., 2004). The same extract was analyzed by MPIS in negative ion mode by

26
selecting m/z of 41 acyl anions of common FAs, as well as several lipid class-specific
fragments (q.v. Appendix Table 1A page 102). Notice that including ammonium salts in the
electrosprayed analyte enabled sensitive detection of PC species as anionic adducts (q.v.
section 3.2. page 39). The PIS m/z 184.1 and MPIS spectra were processed by Lipid Profiler
software, which identified and annotated plausible PC precursors (Figure 9A). Among other
peaks, PIS m/z 184.1 scan detected abundant diacyl PC 34:2 at m/z 758.6 and putative ether
species PC O-34:3 at m/z 742.7 (Figure 9A). The MPIS profile was in a full agreement with
the PIS m/z 184.1 spectrum, but also provided important details on the chemical structure of
the identified lipids. The diacyl PC 34:2 was detected as an acetate adduct at m/z 816.7 by
precursor ion scans specific for FA 16:1, FA 16:0, FA 18:2 and FA 18:1 moieties (Figure 9B).
The relative abundance of the precursor peaks in the corresponding FA scans determined the
predominant location (sn-1 and sn-2) of FA moieties in both molecular species. Its major and
minor isobaric components were identified as PC 16:0/18:2 and PC 16:1/18:1 with peak
intensity ratios equal to 3 and 5, respectively. The ether PC O-34:3 was detected by scans for
FA 18:2 and FA 15:1/O-16:1 moieties at m/z 800.7 (Figure 9B). However, because of the
peak intensity ratio of 100, it was annotated as the plasmenyl species PC O-16:1/18:2, where
the O-alk-1’-enyl moiety was 16:1 and the sn-2 moiety was FA 18:2. The fully automated
interpretation recognized 30 isobaric PCs in the PIS m/z 184.1 spectrum, whereas 48
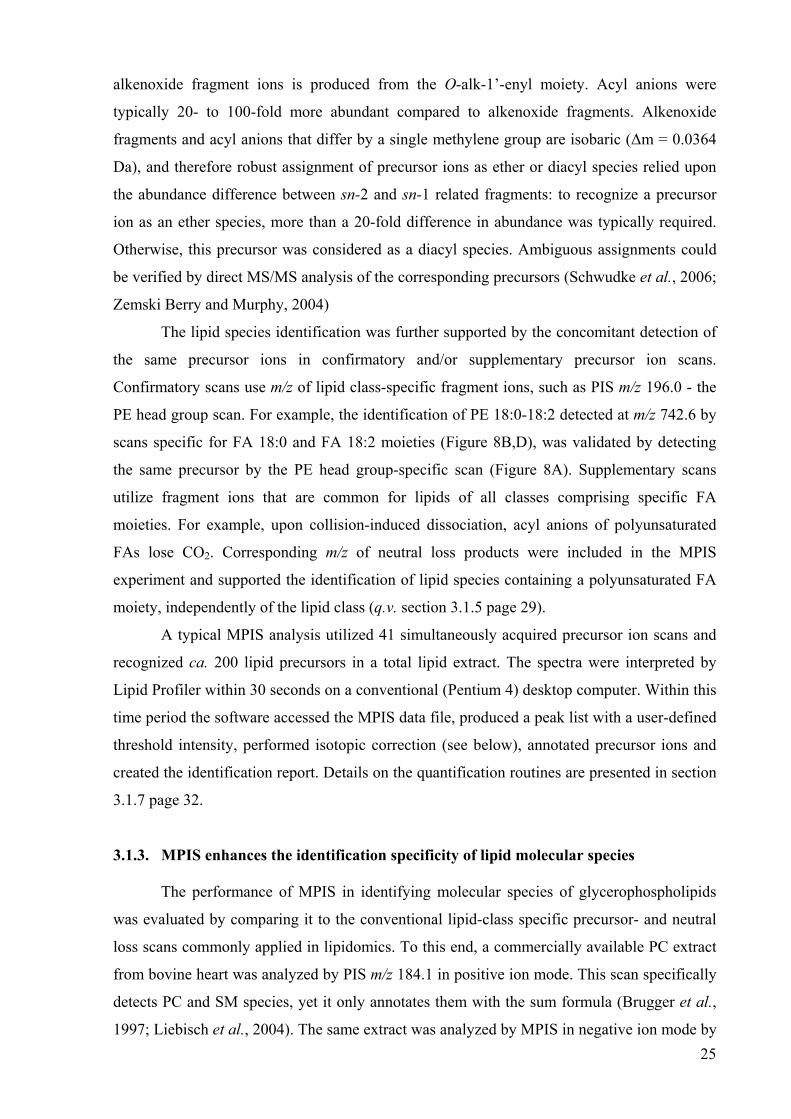
individual molecular species were revealed by MPIS (Table 1).
To further validate the automated interpretation of MPIS profiles, we analyzed, in the
same way (however, in negative ion mode), commercially available extracts of PAs, PEs,
PGs, PSs, and PIs. The lipid class specific scans (PIS m/z 153.0 for PAs, PGs and PSs; PIS
m/z 196.0 for PEs and PIS m/z 241.0 for PIs) were acquired simultaneously with FA scans in
the same MPIS experiments (q.v. Appendix Table 1A page 102) and deciphered by Lipid
Profiler. We compared the number of species detected by the respective lipid class-specific
scans (as annotated by the sum formula) and the number of species detected in FA scans (as
annotated by the molecular composition). Altogether, MPIS method increased the number of
detected species in all classes, on average, by a factor of 1.8, compared to the conventional
lipid class-specific precursor ion scans (Table 1).
27
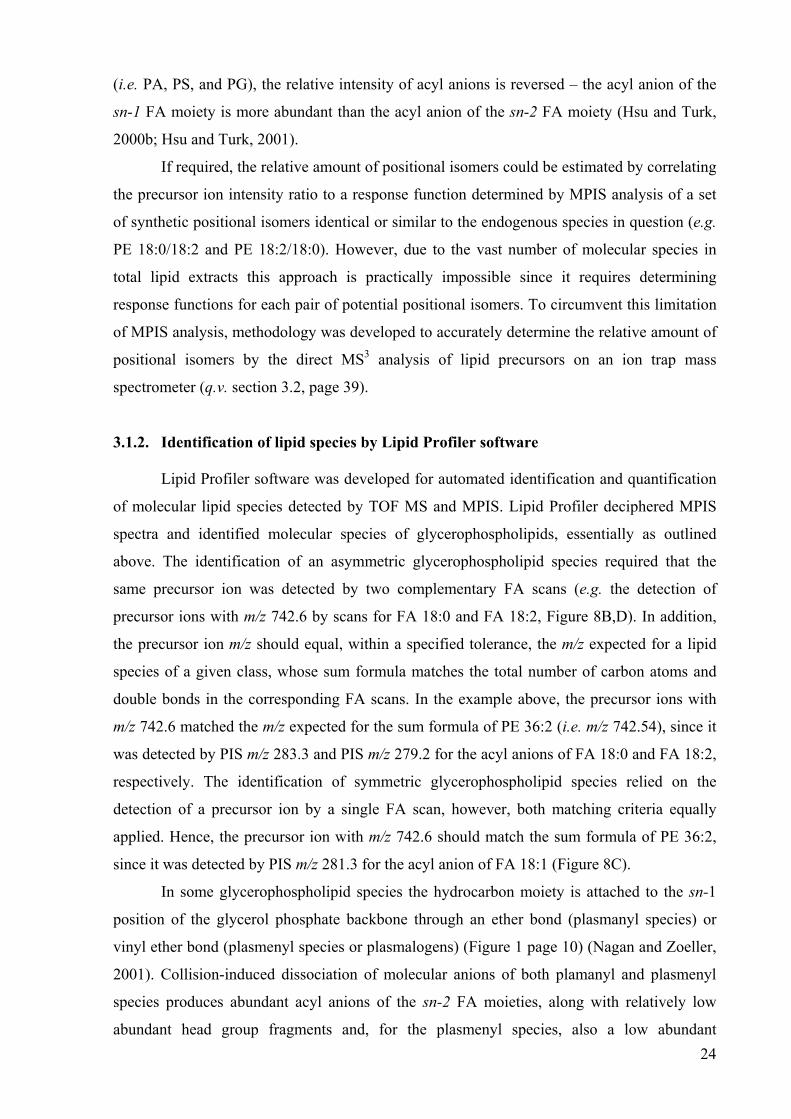
Figure 9. Spectral profiles obtained by lipid class specific PIS and lipid species specific MPIS. (A) PIS m/z 184.1 spectrum of bovine heart PC extract acquired in positive ion mode. Detected precursors are annotated as diacyl or ether species using a sum formula. Note that PIS m/z 184.1 is not capable of distinguishing isobaric diacyl species and ether species. Identified PC species are annotated assuming that the major constituent of the detected precursor contains even numbered acyl, alkyl, or alkenyl chains. (B) FA profile of bovine heart PC extract obtained by MPIS analysis. In negative ion mode PC precursors were detected as acetate adducts. For clarity only 5 precursor ion spectra (out of 41 acquired) are presented. Identified precursor ions are annotated using molecular formula that describes the FA moieties of the detected lipid species.
The identification specificity of species with long and unsaturated FA moieties was
noticeably improved. Thereby, MPIS revealed that PE O-38:6 detected at m/z 748.7 by PE-
specific head group scan PIS m/z 196.0 comprised of at least three individual species: PE O-
18:2/20:4, PE O-18:1/20:5 and PE O-16:1/22:5. At the same time, PE 34:1 detected at m/z
716.6 was single species PE 16:0/18:1 (data not shown). Similar results were obtained by the
analysis of extracts of other lipid classes.
Table 1. The number of lipid species identified by lipid class-specific scans and by MPIS analysis1
28
3.1.4. High mass resolution of the TOF analyzer improves the specificity of MPIS
The identification of lipid species by Lipid Profiler relies on the specificity of
precursor ion scans. Here we demonstrate that because of the high mass resolution of the TOF
analyzer, MPIS distinguishes lipid species whose specific fragments, potentially suitable for
precursor ion scan profiling, are isobaric. Collision-induced dissociation of PIs yields the
class-specific head group fragment ion with m/z 241.01 (C6H10O8P)(Hsu and Turk, 2000a).
However, it is isobaric with the acyl anion of FA 15:0 having m/z 241.22 (C15H29O2), which,
despite having the odd number of carbon atoms, is common in mammalian
glycerophospholipids (Connor et al., 1997; Ekroos et al., 2003).
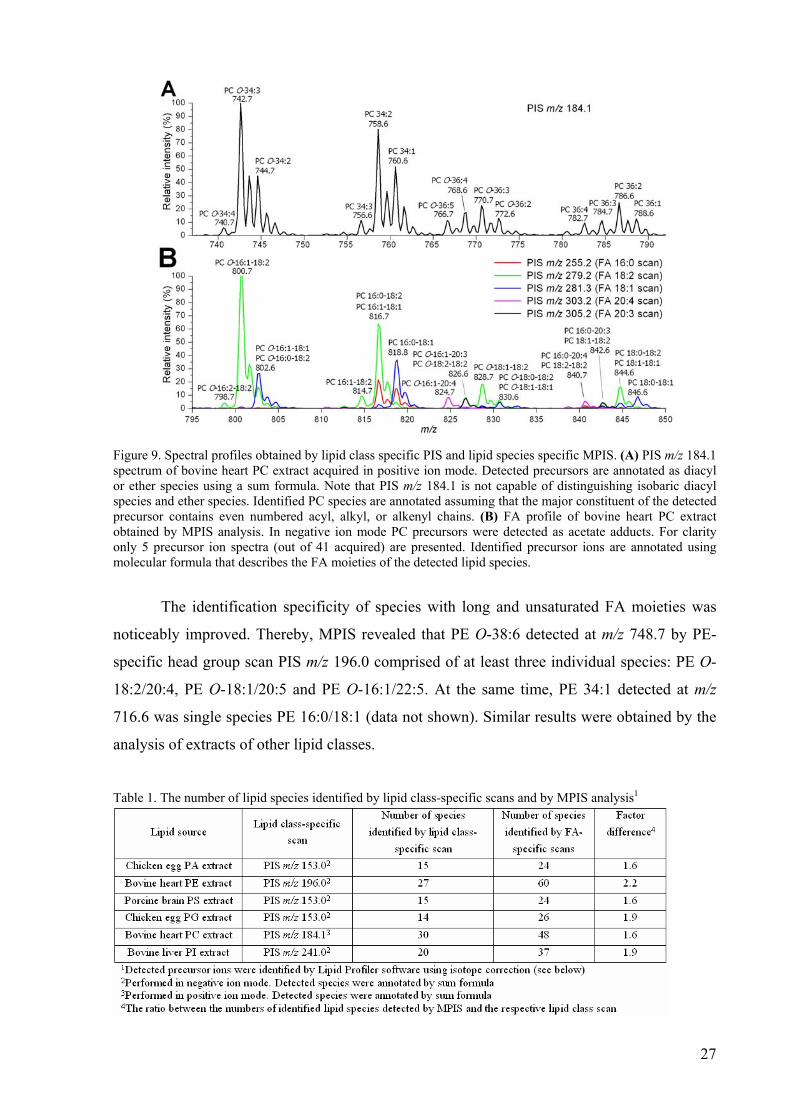
A total lipid extract of MDCK II cells was analyzed by MPIS as described above. As
anticipated, PIS m/z 241.0 revealed a profile of PI species (Figure 10A), but did not overlap
with the PIS m/z 241.2 profile (Figure 10B) that is specific for glycerophospholipids with FA
15:0 moieties. The detected species were identified by Lipid Profiler by considering other FA
scans that were acquired in parallel. One of these scans, specific for glycerophospholipids
containing FA 16:0 moieties, is presented in Figure 10C as a reference. The ratio of intensities
of the precursor peaks detected by FA 16:0 and FA 15:0 scans was equal to 1 thus indicating
that the precursor at m/z 778.7 was an equimolar mixture of PC 15:0/16:0 and PC 16:0/15:0.
In other lipid species the FA 15:0 moiety was mostly located at the sn-1 position: PC
15:0/18:1 (m/z 804.7, peak intensities ratio = 5), PE 15:0/16:0 (m/z 764.8; peak intensities
ratio = 3) and PE 15:0/18:1 (m/z 790.9, peak intensities ratio = 6). Interestingly, the FA 16:0
scan identified another lipid with the odd numbered FA moiety PC 16:0/17:1 (Figure 10C),
which was confirmed by the cross-correlation with the FA 17:1 scan (data not shown).
29
Figure 10. Specific precursor ion scans distinguish PI species from glycerophospholipids comprising FA 15:0 moieties, despite their characteristic fragments are isobaric. A lipid extract of MDCK II cells was analyzed by MPIS in negative ion mode. (A) PI species were detected by PIS m/z 241.0 and annotated by sum formula. (B) FA 15:0 containing lipids of all classes were detected by PIS m/z 241.2 and annotated by molecular formulas. (C) FA 16:0 containing lipids of all classes were detected by PIS m/z 255.2 Note that PC 15:0-16:0 (m/z 778.7) was detected both in FA 15:0 and FA 16:0 scans. Peak intensities are normalized to the most abundant precursor ion at m/z 742.7 (PE 18:1-18:1).
3.1.5. MPIS identification of lipid species having a polyunsaturated FA moiety
Acyl anions of polyunsaturated FAs, produced by the collision-induced dissociation of
molecular anions of diacyl and ether glycerophospholipids, yield additional satellite fragments
by neutral loss of CO2 (Griffiths, 2003; Lu et al., 2005). Their m/z were included into the list
of fragments for MPIS (q.v. Appendix Table 1A page 102) as a supplementary means to
validate the identification of corresponding molecular species. For example, MPIS profiling
of a bovine heart PE extract revealed four low abundant PE species containing FA 20:5
moiety, which were simultaneously detected in scans specific for FA 20:5 and FA 20:5-CO2
(Figure 11), which increased their identification confidence (Kuerschner et al., 2005).

30
Figure 11. Validating the identification of lipid species containing a FA 20:5 moiety by supplementary scan for FA 20:5-CO2 fragment. Bovine heart PE extract was subjected to MPIS analysis. Scans acquired for FA 20:5 (PIS m/z 301.2) and FA 20:5-CO2 (PIS m/z 257.2) allowed the specific identification of FA 20:5 containing PE species. Peak intensities were normalized to the most abundant peak with m/z 766.6 detected by FA 20:4 scan (PIS m/z 303.2) that corresponded to PE 18:0-20:4.
Neutral loss of CO2 from polyunsaturated acyl anions has two important implications
for lipid profiling. First, loss of CO2 from the acyl anion of docosahexaenoic acid FA 22:6
yields a fragment ion with m/z 283.2431 ([FA 22:6-CO2]-) that is isobaric with the acyl anion
m/z 283.2642 of abundant stearic acid FA 18:0 and, therefore, additional caution should be
taken when using m/z of this fragment in supplementary PIS. However, most importantly, loss
of CO2 directly affects the quantification accuracy of docosahexaenoic acid FA 22:6
containing glycerophospholipid species, which, as we demonstrate below, can be improved by
using a specific correction factor together with MPIS profiles.
Here we define the correction factor αPX as a ratio of the peak intensities of the
precursor from the lipid class PX (i.e. PA, PE, PG, PS, PC, PI) detected by PIS m/z 283.3 (FA
22:6-CO2 scan) and PIS m/z 327.2 (FA 22:6 scan). Correction factors were determined in a
separate experiment using available synthetic standard(s), such as PC 16:0/22:6, PE O-
16:1/22:6, PA 16:0/22:6 and PG 16:0/22:6, under the fixed instrument settings (most
importantly, the collision energy offset). We observed that the intensity ratio of the acyl anion
of FA 22:6 and its neutral loss fragment FA 22:6-CO2 was mainly dependent on the lipid class
(data not shown). The lipid class-specific correction factors were then used to adjust the
intensities of the corresponding endogenous lipid precursors detected by PIS m/z 283.3 (FA
18:0 and FA 22:6-CO2 scan):
IFA 18:0 = IPIS m/z 283 - αPX ⋅ IPIS m/z 327.2,
31
The same correction factors also adjusted the intensity of the precursor peak at PIS m/z 327.2
(FA 22:6 scan):
IFA 22:6 = (1+αPX) ⋅ IPIS m/z 327.2,
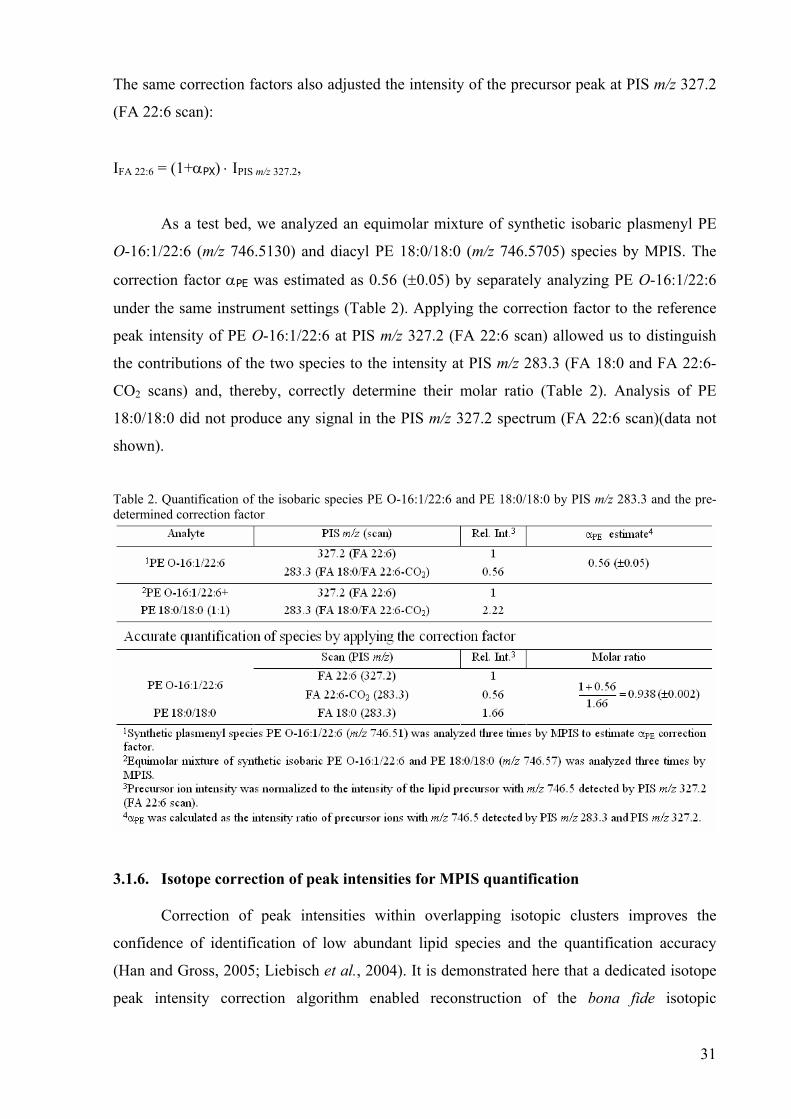
As a test bed, we analyzed an equimolar mixture of synthetic isobaric plasmenyl PE
O-16:1/22:6 (m/z 746.5130) and diacyl PE 18:0/18:0 (m/z 746.5705) species by MPIS. The
correction factor αPE was estimated as 0.56 (±0.05) by separately analyzing PE O-16:1/22:6
under the same instrument settings (Table 2). Applying the correction factor to the reference
peak intensity of PE O-16:1/22:6 at PIS m/z 327.2 (FA 22:6 scan) allowed us to distinguish
the contributions of the two species to the intensity at PIS m/z 283.3 (FA 18:0 and FA 22:6-
CO2 scans) and, thereby, correctly determine their molar ratio (Table 2). Analysis of PE
18:0/18:0 did not produce any signal in the PIS m/z 327.2 spectrum (FA 22:6 scan)(data not
shown).
Table 2. Quantification of the isobaric species PE O-16:1/22:6 and PE 18:0/18:0 by PIS m/z 283.3 and the pre-determined correction factor
3.1.6. Isotope correction of peak intensities for MPIS quantification
Correction of peak intensities within overlapping isotopic clusters improves the
confidence of identification of low abundant lipid species and the quantification accuracy
(Han and Gross, 2005; Liebisch et al., 2004). It is demonstrated here that a dedicated isotope
peak intensity correction algorithm enabled reconstruction of the bona fide isotopic

32
distributions of lipid species in MPIS experiments. An extensive description of the isotope
correction algorithms employed by Lipid Profiler software is provided in Ejsing el al. (2006).
TOF MS and MPIS spectra of synthetic PE 18:1/18:1 are presented here as an
example. The isotope profile observed in TOF MS spectrum was in good agreement with the
profile computed from its elemental composition C41H77NO8P (Figure 12). However, in PIS
spectra the isotope profiles were perturbed because only a subset of the isotopic population of
the intact precursor was detected. For example, the PIS m/z 281.3 (FA 18:1 scan) spectrum
matched the isotope distribution calculated for the neutral fragment of the PE 18:1/18:1 that
lost the acyl anion of FA 18:1 (C23H44NO6P). The isotope profiles of the precursor in the PIS
m/z 282.3 spectrum and PIS m/z 283.3 spectrum (FA 18:0 scan) also differed from the profile
of the intact species, but agreed with the calculated isotopic abundances. Importantly,
summing up the isotopic peak intensities in the PIS m/z 281.3, PIS m/z 282.3 and PIS m/z
283.3 spectra (Figure 12B,C,D) recreated the isotopic profile of the intact molecule (Figure
12A). For further quantitative analysis and reports, Lipid Profiler software operated with the
total intensities of isotopic clusters computed using the ρ correction factor (type I isotope
correction factor (Han and Gross, 2005)) as described in the Materials and Methods section
(q.v. section 5.1.13. page 93).
3.1.7. Quantification of glycerophospholipid species by MPIS
Han et al (Han and Gross, 2005; Han et al., 2004) demonstrated that quantification of
lipid species in total lipid extracts could rely upon a single internal standard per analyzed lipid
class, if applied together with the isotope correction of intensities of their monoisotopic peaks.
The internal standards were selected such that their m/z was out of the range, typical for
endogenous species, and the analysis was performed using an “intrasource separation”
method that stimulated preferential ionization of certain lipid classes (Han et al., 2006).

33
Figure 12. Comparison of isotopic profiles of the synthetic standard PE 18:1/18:1 in TOF MS and PIS spectra. Peak intensities in all precursor ion scans (panel B, C and D) were normalized to the intensity of the monoisotopic peak at m/z 742.6 in the PIS m/z 281.3 spectrum. MPIS spectra of two independent analyses are shown in grey line and black dots. The calculated isotopic distributions are presented as vertical bars and respective values are in parenthesis. (A) TOF MS spectrum. (B) PIS m/z 281.3 spectrum (FA 18:1 scan). (C) PIS m/z 282.3 spectrum. (D) PIS m/z 283.3 spectrum (stands for FA 18:0 scan). Note that summing up the intensities of isotopic peaks in precursor ion spectra (panels B, C, D) recreates the isotopic profile of the intact PE 18:1/18:1 detected by TOF MS (panel A).
Here, it is demonstrated that molecular species of glycerophospholipids of various
classes could be simultaneously quantified by MPIS using a one-class/one-standard approach,
combined with the collision energy ramping and the dedicated isotope correction algorithm.
Synthetic diheptadecanoyl species of major glycerophospholipid classes: PA 17:0/17:0, PE
17:0/17:0, PG 17:0/17:0, PS 17:0/17:0, PC 17:0/17:0 and PI 17:0/17:0 were employed as
internal standards. All of them were detectable by PIS m/z 269.3 (FA 17:0 scan) (Figure 13A)
and their mixture was spiked at nM concentration into total lipid extracts. Ramping the
collision energy compensated for m/z-dependent differences in the yield of acyl anions
(Figure 13B). The PIS profile of these 6 diheptadecanoyl species (Figure 13A) was
reproducible and served as an internal quality control for the efficiency of lipid extraction and
ionization. None of them were detectable in total lipid extracts from E. coli, S. cerevisiae and
34
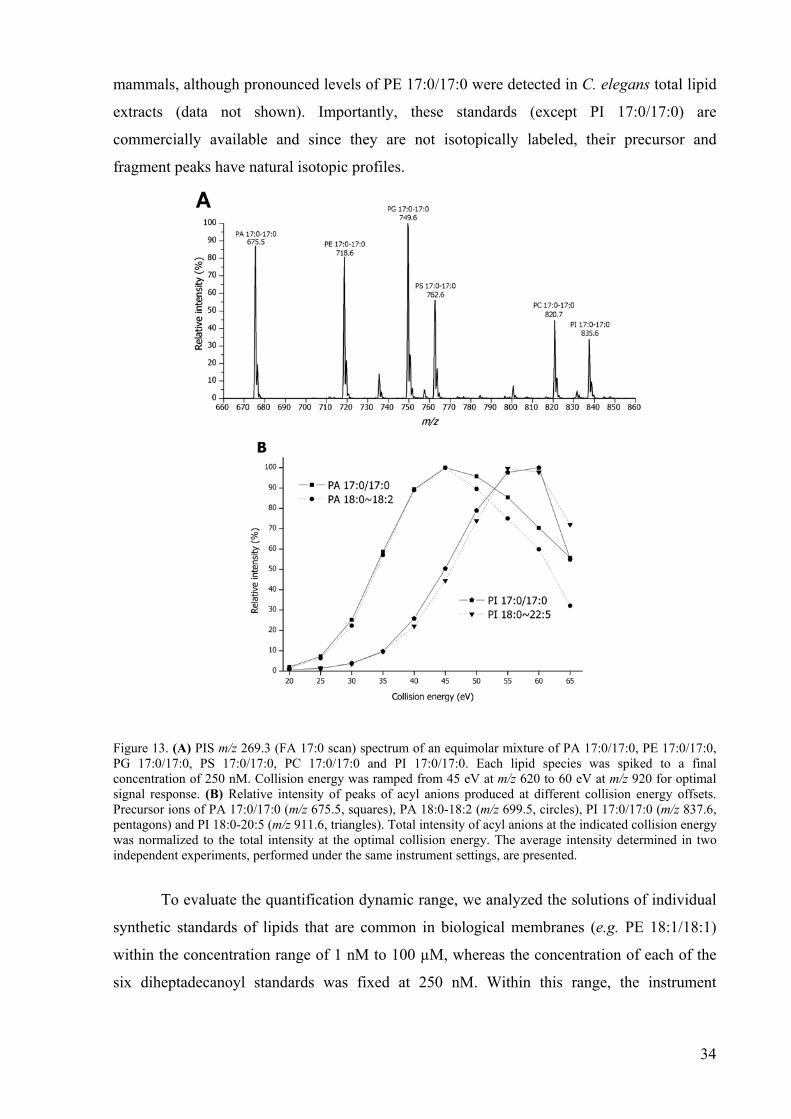
mammals, although pronounced levels of PE 17:0/17:0 were detected in C. elegans total lipid
extracts (data not shown). Importantly, these standards (except PI 17:0/17:0) are
commercially available and since they are not isotopically labeled, their precursor and
fragment peaks have natural isotopic profiles.
Figure 13. (A) PIS m/z 269.3 (FA 17:0 scan) spectrum of an equimolar mixture of PA 17:0/17:0, PE 17:0/17:0, PG 17:0/17:0, PS 17:0/17:0, PC 17:0/17:0 and PI 17:0/17:0. Each lipid species was spiked to a final concentration of 250 nM. Collision energy was ramped from 45 eV at m/z 620 to 60 eV at m/z 920 for optimal signal response. (B) Relative intensity of peaks of acyl anions produced at different collision energy offsets. Precursor ions of PA 17:0/17:0 (m/z 675.5, squares), PA 18:0-18:2 (m/z 699.5, circles), PI 17:0/17:0 (m/z 837.6, pentagons) and PI 18:0-20:5 (m/z 911.6, triangles). Total intensity of acyl anions at the indicated collision energy was normalized to the total intensity at the optimal collision energy. The average intensity determined in two independent experiments, performed under the same instrument settings, are presented.
To evaluate the quantification dynamic range, we analyzed the solutions of individual
synthetic standards of lipids that are common in biological membranes (e.g. PE 18:1/18:1)
within the concentration range of 1 nM to 100 µM, whereas the concentration of each of the
six diheptadecanoyl standards was fixed at 250 nM. Within this range, the instrument

35
response was linear for all analyzed species with a slope value of approximately one,
independently of their lipid class (data not shown).
To test if the quantification method was applicable for analyzing complex mixtures of
endogenous lipids, we analyzed a dilution series of an E. coli polar lipid extract spiked with
the fixed concentration of the same diheptadecanoyl standards and quantified the absolute
amounts of PE 16:0/17:1 and PG 16:0/19:1 - the two most abundant species among all
detectable PEs and PGs. To this end, their total peak intensity (the sum of intensities of the
precursor peaks detected in the two complementary FA scans) were subjected to isotopic
correction, divided by the intensity of the peak of the internal standards PE 17:0/17:0 and PG
17:0/17:0, respectively, and multiplied by the concentration of the internal standard and the ρ
correction factor (q.v. equation in section 5.1.13. page 93). The concentrations of PE
16:0/17:1 and PG 16:0/19:1 were plotted as a function of the total lipid concentration in the
extract (in mg/L) and total concentration of phosphate (in µM), as was determined by
phosphate analysis (Figure 14). Similar to the results obtained with synthetic standards, the
signal intensity of both quantified species changed linearly within approximately 10 nM to
100 µM of the total sample phosphate with a Limit of Quantification (Schwudke et al., 2006)
better than 1 nM and 30 nM for PE 16:0/17:1 and PG 16:0/19:1, respectively. The total molar
concentration of all identified PE and PG species equaled 89% of the total sample phosphate
content, with the remaining 11% corresponding to cardiolipins, which are poorly ionizable
under the applied infusion conditions (data not shown). The PE and PG class species equaled
78% and 11% of the total sample phosphate content, respectively, which was in good
agreement with previous reports (Vance and Vance, 1996).
Using MPIS, together with the set of diheptadecanoyl internal standards, we profiled
commercially available polar lipid extracts from porcine brain and bovine heart. Automated
identification, annotation, isotopic correction and quantification of lipid species were
performed using Lipid Profiler software. The absolute concentration of each species (e.g. PE
18:0/20:4) was determined and converted to mol% by normalizing to the sum of the
concentrations of all identified glycerophospholipid species (Figure 15A). The comparative
analysis of brain and heart lipid extracts suggested multifaceted differences in their molecular
lipid composition. The most abundant species in the brain tissue were PC 16:0/18:1, PS
18:0/18:1, PE O-18:2/18:1 and PC 18:1/18:1, compared to PC O-16:1/18:2, PE 18:0/20:4, PC
16:0/18:2, PC 16:0/18:1 and PE O-16:1/18:2 in the heart tissue (Figure 15A).

36
Figure 14. Dynamic range of MPIS quantification in the E.coli polar lipid extract. The set of synthetic internal standards (each at a final concentration of 250 nM) was spiked into an E. coli polar lipid extract. MPIS spectra were acquired as described in Materials and Methods and individual species identified and quantified using Lipid Profiler software. The estimated concentrations of the abundant PE 16:0/17:1 (m/z 702.5) and PG 16:0/19:1 (m/z 761.5) were plotted as a function of the total lipid concentration in mg/L (upper x-axis) and total sample phosphate content (lower x-axis).
MPIS methodology provided comprehensive and quantitative description of the
glycerophospholipidome, which can be processed, displayed and compared in several ways –
such as the direct quantitative species-to-species comparison (Figure 15A), or emulated total
FA profile (Figure 15B) (typically obtained by gas chromatography - mass spectrometry) or
lipid class profile (Figure 15C) (typically obtained by thin layer chromatography or normal
phase liquid chromatography). For example, the emulated FA profile showed that brain
glycerophospholipids were enriched in FA 18:1, and contained similar amounts of FA 18:0
and FA 16:0. They also comprised a diverse pool of polyunsaturated FA 22:6, FA 22:5, FA
22:4 and FA 20:4 that, taken together, equaled 15 mol% of all FA moieties (Figure 15B). In
comparison, heart glycerophospholipids were enriched in FA 18:2 (low abundant in brain
glycerophospholipids) and FA 20:4, and contained similar amounts of FA 18:1, FA 18:0 and
FA 16:0 (Figure 15B). At the same time, the lipid class-specific profiling showed that PEs
were equally abundant in brain and heart, whereas the two tissues showed noticeable
differences in the amounts of PCs, PSs and PIs (Figure 15C).
Despite being a sensitive, versatile and robust analytical tool, the MPIS approach
requires optimization of the sample preparation protocol and several instrument control
settings. In particular, it is important to minimize in-source fragmentation of lipid precursors,
adjust the collision energy ramping and collision gas pressure for best signal response,
optimize the enhancement (q2 ion trapping) settings (Chernushevich, 2000) and control the
37
intensities of detected peaks to avoid saturation of the TOF analyzer. Settings of the ion
source (NanoMate HD System) must allow stable and reproducible spray with the flow
injection rate of 200 to 300 nL/min. Sample preparation should minimize the content of
chloride anions in the sprayed analyte to avoid the enhanced abundance of chloride adducts
with PCs (in addition to the desired acetate adducts) complicating the identification of PC
species. If MPIS fails to achieve unequivocal identification of certain molecular species, it is
worth reducing the sample complexity by preparative TLC or liquid chromatography
(DeLong et al., 2001; Sommer et al., 2006).
3.1.8. Discussion
We developed an analytical routine for the automated deciphering of MPIS spectra,
which includes the identification, annotation, isotopic correction of peak intensities and
quantification of molecular species of glycerophospholipids. The quantification relied upon a
set of six diheptadecanoyl (17:0/17:0) synthetic internal lipid standards, covering common
glycerophospholipid classes, and was linear within a concentration range of 10 nM to 100
µM. The MPIS methodology produced a comprehensive and quantitative description of the
complex ensemble of glycerophospholipid species by the direct analysis of total lipid extracts
of cells and tissues. The analysis time was 30 minutes per sample and lent itself to high
throughput lipidomics.
Quantification of glycerophospholipids in total lipid extracts typically relies on spiked
internal standards, representing lipids of the quantified lipid classes, and the acquisition of
lipid class-specific precursor or neutral loss scans (Brugger et al., 1997; Liebisch et al., 2004).
This methodology is straightforward and powerful, yet it fails to distinguish isobaric species
often present in lipid extracts (e.g. PC 18:0/18:2 and PC 18:1/18:1). By applying a
combination of multiple FA-specific, lipid class-specific and supplementary precursor ion
scans bundled in a single MPIS experiment, it has become possible to distinguish and
quantify isobaric diacyl and ether species. The specificity and quantification capabilities of
the MPIS approach were supported by the linearity of calibration curves of individual lipid
species, acquired from a total lipid extract (Figure 14); by matching MPIS and conventional
PIS profiles acquired from the same sample in independent experiments, (Schwudke et al.,
2006) and Figure 9, and, finally, by a good agreement between the composition and relative
abundance of endogenous lipid species detected by MPIS and a mass spectrometry
independent approach (Connor et al., 1997; Ekroos et al., 2003).
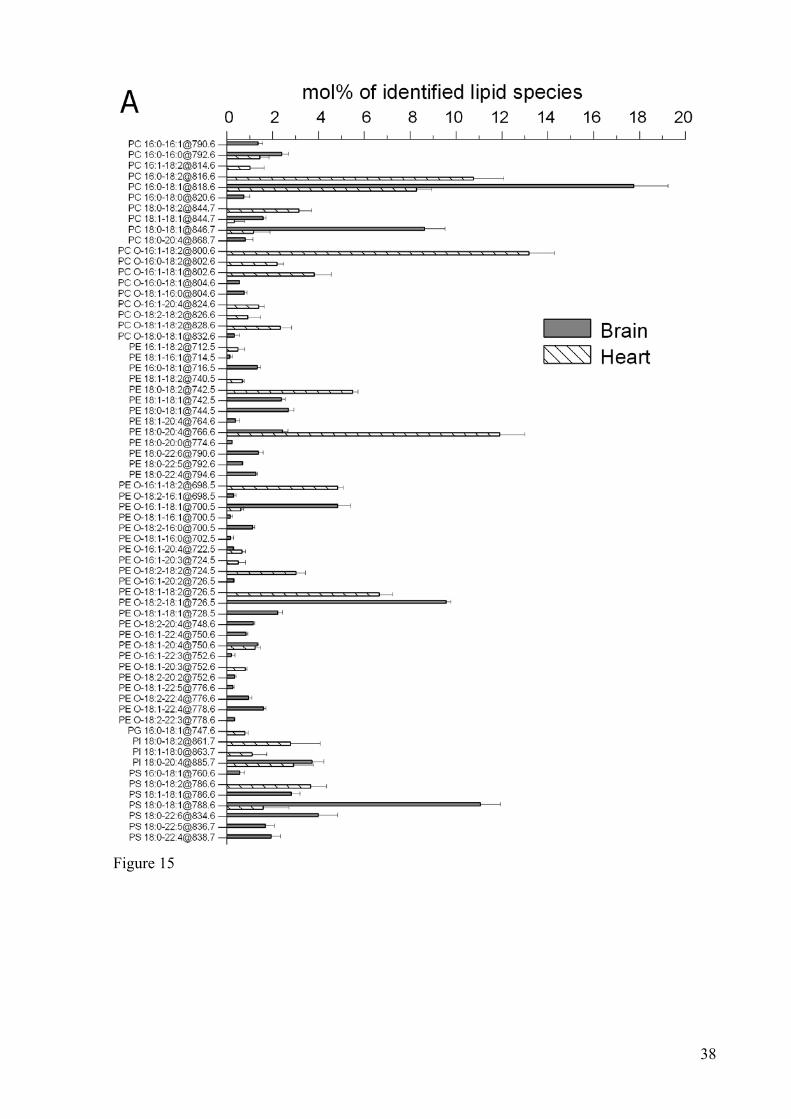
38
Figure 15

39
Figure 15. Comparative lipid analysis of total polar lipid extracts from porcine brain and bovine heart. (A) Species-to-species comparison. The mol% of identified lipid species were calculated as outlined in Materials and Methods. (B) Emulated total FA profile. The mol% of FA moieties were calculated as the sum of molar concentrations of lipid species in panel A containing the respective FA moiety, followed by normalization to the total molar concentration of all FA moieties. The FA concentration corresponding to symmetric lipid species was multiplied by a factor of two to account for two identical FA moieties. (C) Lipid class profile. The mol% of lipid classes were calculated as the sum of the mol% of lipid species (in panel A) of the respective lipid class. The MPIS analysis was repeated four times.
3.2. CHARTING MOLECULAR COMPOSITION OF PC SPECIES BY MPIS AND ION
TRAP MS3 FRAGMENTATION
Phosphatidylcholines are the most abundant glycerophospholipids in mammalian cells,
accounting for more than 30% of the total lipid content (Kawai et al., 1974). In mammalian
cells, PCs are synthesised via the CDP-choline pathway or via the phosphatidylethanolamine
methylation pathway (Cui et al., 1993; Kent, 1995; Walkey et al., 1998). Further metabolism
involves remodelling processes, which are controlled by a coordinated action of
acyltransferases, transacylases, and lipases (Yamashita et al., 1997). Inhibiting the CDP-
choline pathway is lethal (Baburina and Jackowski, 1998; Cui et al., 1996) and is not
compensated by the alternative PE methylation pathway, presumably because different PC
species are produced (DeLong et al., 1999; Waite and Vance, 2000). The majority of de novo
synthesized PCs are believed to comprise saturated FAs at the sn-1 position and unsaturated
FAs at the sn-2 position (Akesson et al., 1970; Arvidson, 1968), although they might be
altered by subsequent remodeling (Lands and Hart, 1965; Okuyama et al., 1975; van Heusden
et al., 1981).
Electrospray ionisation mass spectrometry is a sensitive and specific tool for the
characterization of PCs in total lipid extracts (Brugger et al., 1997; Han and Gross, 1994; Han
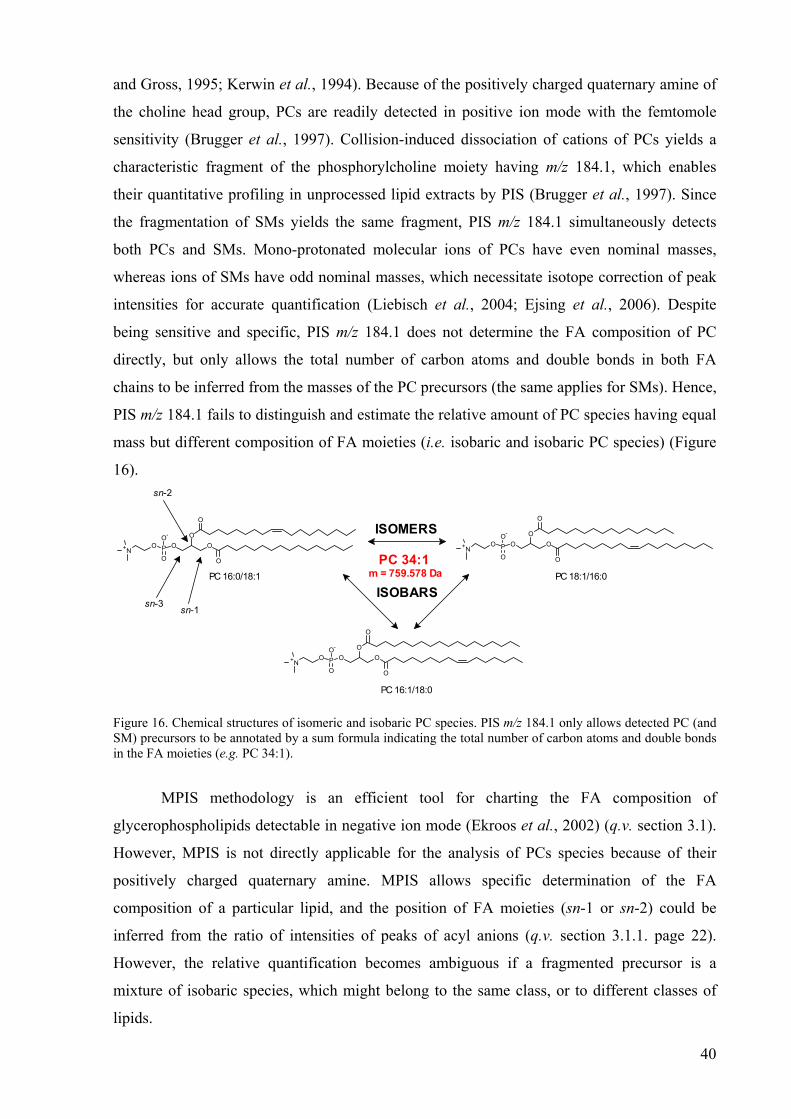
40
and Gross, 1995; Kerwin et al., 1994). Because of the positively charged quaternary amine of
the choline head group, PCs are readily detected in positive ion mode with the femtomole
sensitivity (Brugger et al., 1997). Collision-induced dissociation of cations of PCs yields a
characteristic fragment of the phosphorylcholine moiety having m/z 184.1, which enables
their quantitative profiling in unprocessed lipid extracts by PIS (Brugger et al., 1997). Since
the fragmentation of SMs yields the same fragment, PIS m/z 184.1 simultaneously detects
both PCs and SMs. Mono-protonated molecular ions of PCs have even nominal masses,
whereas ions of SMs have odd nominal masses, which necessitate isotope correction of peak
intensities for accurate quantification (Liebisch et al., 2004; Ejsing et al., 2006). Despite
being sensitive and specific, PIS m/z 184.1 does not determine the FA composition of PC
directly, but only allows the total number of carbon atoms and double bonds in both FA
chains to be inferred from the masses of the PC precursors (the same applies for SMs). Hence,
PIS m/z 184.1 fails to distinguish and estimate the relative amount of PC species having equal
mass but different composition of FA moieties (i.e. isobaric and isobaric PC species) (Figure
16).
ISOBARS
ISOMERS
PC 16:0/18:1
+N
O
O
OOO
O-
OPO
sn-1
sn-2
sn-3
PC 18:1/16:0
+N
O
O
OOO
O-
OPO
PC 16:1/18:0
+N
O
O
OOO
O-
OPO
PC 34:1m = 759.578 Da
Figure 16. Chemical structures of isomeric and isobaric PC species. PIS m/z 184.1 only allows detected PC (and SM) precursors to be annotated by a sum formula indicating the total number of carbon atoms and double bonds in the FA moieties (e.g. PC 34:1).
MPIS methodology is an efficient tool for charting the FA composition of
glycerophospholipids detectable in negative ion mode (Ekroos et al., 2002) (q.v. section 3.1).
However, MPIS is not directly applicable for the analysis of PCs species because of their
positively charged quaternary amine. MPIS allows specific determination of the FA
composition of a particular lipid, and the position of FA moieties (sn-1 or sn-2) could be
inferred from the ratio of intensities of peaks of acyl anions (q.v. section 3.1.1. page 22).
However, the relative quantification becomes ambiguous if a fragmented precursor is a
mixture of isobaric species, which might belong to the same class, or to different classes of
lipids.

41
This section outlines an analytical strategy for quantitative profiling of PC species by a
combination of MPIS on a QqTOF mass spectrometer and MS3 fragmentation on an ion trap
mass spectrometer. Millimolar concentrations of ammonium salts in the electrosprayed
analyte enabled sensitive detection of PCs as negatively charged adducts, which can be
directly analysed by MPIS. MS3 fragmentation of adducts on an ion trap mass spectrometer
allowed us to quantify the relative abundance of positional isomers. The analysis of lipid
extracts from human red blood cells characterized the pool of PCs as a complex mixture of
isobaric and isomeric species.
3.2.1. Quantification of positional isomers of synthetic PC standards
To quantify positional isomers of endogenous PCs, we first established the isomeric
purity of available synthetic standards. Phospholipase A2 (PLA2) hydrolyses the sn-2 ester
bond in PCs, yielding 2-lysoPCs. We tested PLA2 specificity by hydrolysing 15 mg of
synthetic PC 16:0/18:1 standard and analysing the reaction mixture by 1H-NMR. We only
detected the signal from hydrogen atoms of the secondary alcohol and not from the primary
alcohol, which indicated that sn-1 ester bond was not hydrolysed to any noticeable extent
(data not shown). We therefore concluded that under the applied reaction conditions the
hydrolysis of the sn-2 ester bond by PLA2 is specific.
Mass spectrometric analysis of PLA2-treated PC standards on a QqTOF mass
spectrometer by TOF MS and by PIS m/z 184.1 suggested that they contained a noticeable
amount of positional isomers as presented in Table 3 (mol% determined by MPIS and ion trap
MS3 fragmentation of the same standard PCs are also presented in Table 3 and discussed
below).
Table 3. Isomeric purity of synthetic PC standards
amol% of the indicated lipid standard/mol% of the related isomer, e.g. PC 16:0/18:1 vs. PC 18:1/16:0 bcoefficient of variation for QqTOF MS measurements was 1.6 % and for ion trap MS3 measurements 3.6% cMS3 fragmentation of chloride adducts in negative ion mode
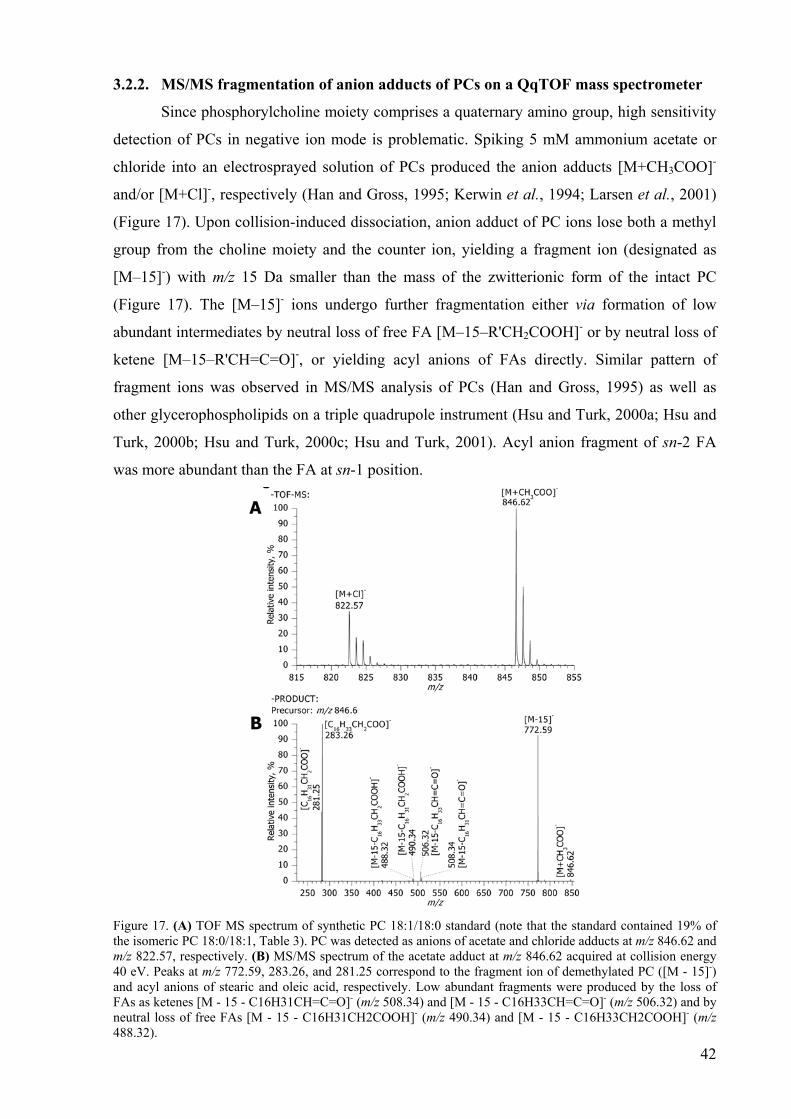
42
3.2.2. MS/MS fragmentation of anion adducts of PCs on a QqTOF mass spectrometer
Since phosphorylcholine moiety comprises a quaternary amino group, high sensitivity
detection of PCs in negative ion mode is problematic. Spiking 5 mM ammonium acetate or
chloride into an electrosprayed solution of PCs produced the anion adducts [M+CH3COO]-
and/or [M+Cl]-, respectively (Han and Gross, 1995; Kerwin et al., 1994; Larsen et al., 2001)
(Figure 17). Upon collision-induced dissociation, anion adduct of PC ions lose both a methyl
group from the choline moiety and the counter ion, yielding a fragment ion (designated as
[M–15]-) with m/z 15 Da smaller than the mass of the zwitterionic form of the intact PC
(Figure 17). The [M–15]- ions undergo further fragmentation either via formation of low
abundant intermediates by neutral loss of free FA [M–15–R'CH2COOH]- or by neutral loss of
ketene [M–15–R'CH=C=O]-, or yielding acyl anions of FAs directly. Similar pattern of
fragment ions was observed in MS/MS analysis of PCs (Han and Gross, 1995) as well as
other glycerophospholipids on a triple quadrupole instrument (Hsu and Turk, 2000a; Hsu and
Turk, 2000b; Hsu and Turk, 2000c; Hsu and Turk, 2001). Acyl anion fragment of sn-2 FA
was more abundant than the FA at sn-1 position.
Figure 17. (A) TOF MS spectrum of synthetic PC 18:1/18:0 standard (note that the standard contained 19% of the isomeric PC 18:0/18:1, Table 3). PC was detected as anions of acetate and chloride adducts at m/z 846.62 and m/z 822.57, respectively. (B) MS/MS spectrum of the acetate adduct at m/z 846.62 acquired at collision energy 40 eV. Peaks at m/z 772.59, 283.26, and 281.25 correspond to the fragment ion of demethylated PC ([M - 15]-) and acyl anions of stearic and oleic acid, respectively. Low abundant fragments were produced by the loss of FAs as ketenes [M - 15 - C16H31CH=C=O]- (m/z 508.34) and [M - 15 - C16H33CH=C=O]- (m/z 506.32) and by neutral loss of free FAs [M - 15 - C16H31CH2COOH]- (m/z 490.34) and [M - 15 - C16H33CH2COOH]- (m/z 488.32).

43
We further examined how the intensity of fragments depends on the applied collision
energy (Figure 18). At low collision energy (~ 30 eV) MS/MS spectra were dominated by the
intact precursor ion and [M–15]- fragment of the de-methylated PC. With increasing collision
energy the intensity of both precursor and [M–15]- ions decreased, with concomitantly
increasing intensity of acyl anion fragments. The intensity of acyl anions peaked at ~50 eV
and then decreased, presumably because high collision energy compromised focusing and
steering of the ion beam in the mass spectrometer. In the range of 40-60 eV, altering the
collision energy had almost no impact on the yield of acyl anions and, consequently, no
tuning of the collision energy was required for optimising the sensitivity.
Figure 18. Intensity of peaks of fragments of the acetate adduct of PC 18:1/18:0 change with increasing the collision energy. m/z 846.6 - [M+CH3COO]-; m/z 772.6 - [M–15]-; m/z 281.2 and m/z 283.2 - acyl anions of stearic and oleic acids, respectively.
3.2.3. Profiling of PCs by MPIS
Since acyl anions of FA moieties are efficiently produced by collision-induced
dissociation of anion adducts of PCs they could be directly profiled by MPIS, similar to other
classes of glycerophospholipids (Ekroos et al., 2002). MPIS analysis of PC 16:0/18:1 and PC
18:1/16:0 standards was performed by selecting m/z 255.2 and 281.2, corresponding to acyl
anions of palmitic acid (16:0) and oleic acid (18:1), respectively, and precursor ions of acetate
and chloride adducts were detected (Figure 19). As expected, the fragment patterns in MS/MS
spectra of adducts (Figure 17), the peak of the precursor ion was more abundant in precursor
ion scans for the acyl anion fragment of sn-2 FA, than of sn-1 FA. The ratio of their
intensities did not depend on the mode of analysis and delineated the major component in the
mixture of positional isomers.
PLA2-treated PC standards were subjected to MPIS, which demonstrated that LPCs
were also detectable as acetate and chloride adduct ions (data not shown). Further analysis of
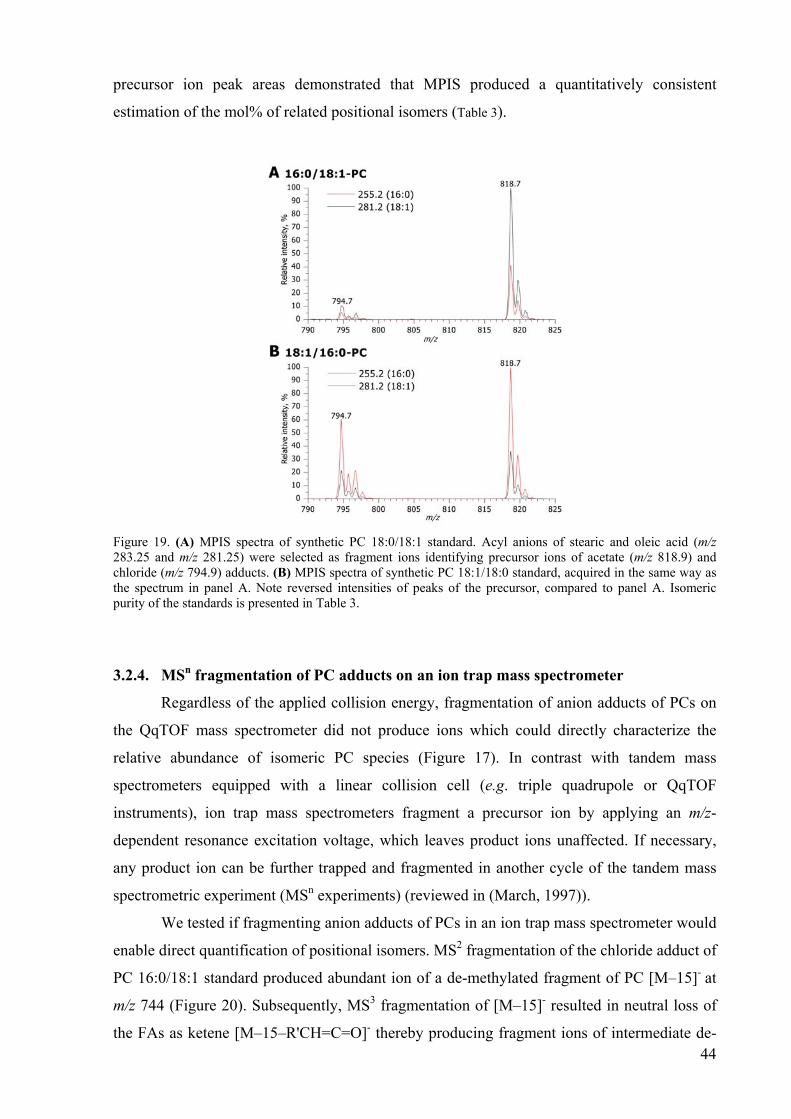
44
precursor ion peak areas demonstrated that MPIS produced a quantitatively consistent
estimation of the mol% of related positional isomers (Table 3).
Figure 19. (A) MPIS spectra of synthetic PC 18:0/18:1 standard. Acyl anions of stearic and oleic acid (m/z 283.25 and m/z 281.25) were selected as fragment ions identifying precursor ions of acetate (m/z 818.9) and chloride (m/z 794.9) adducts. (B) MPIS spectra of synthetic PC 18:1/18:0 standard, acquired in the same way as the spectrum in panel A. Note reversed intensities of peaks of the precursor, compared to panel A. Isomeric purity of the standards is presented in Table 3.
3.2.4. MSn fragmentation of PC adducts on an ion trap mass spectrometer
Regardless of the applied collision energy, fragmentation of anion adducts of PCs on
the QqTOF mass spectrometer did not produce ions which could directly characterize the
relative abundance of isomeric PC species (Figure 17). In contrast with tandem mass
spectrometers equipped with a linear collision cell (e.g. triple quadrupole or QqTOF
instruments), ion trap mass spectrometers fragment a precursor ion by applying an m/z-
dependent resonance excitation voltage, which leaves product ions unaffected. If necessary,
any product ion can be further trapped and fragmented in another cycle of the tandem mass
spectrometric experiment (MSn experiments) (reviewed in (March, 1997)).
We tested if fragmenting anion adducts of PCs in an ion trap mass spectrometer would
enable direct quantification of positional isomers. MS2 fragmentation of the chloride adduct of
PC 16:0/18:1 standard produced abundant ion of a de-methylated fragment of PC [M–15]- at
m/z 744 (Figure 20). Subsequently, MS3 fragmentation of [M–15]- resulted in neutral loss of
the FAs as ketene [M–15–R'CH=C=O]- thereby producing fragment ions of intermediate de-

45
methylated LPCs at m/z 480 and 506, with the m/z 480 being most abundant. Acyl anion
fragments [R'CH2COO]- were observed at m/z 255 and 281, although they were less abundant
than in QqTOF spectra. Minor fragments formed by neutral loss of free FA [M–15–
R'CH2COOH]- from [M–15]- were detected at m/z 462 and 488. As expected, MS4
fragmentation of the de-methylated LPCs produced the acyl anion fragment and
corresponding products of ketene and free FA losses at m/z 242 and 224, respectively (data
not shown). Ion trap MSn analysis of other PC standards followed the same fragmentation
pathways (data not shown).
Figure 20. (A) MS2 spectrum of a chloride adduct of the synthetic PC 16:0/18:1 standard. Abundant fragment at m/z 744 corresponds to de-methylated PC [M–15]-. (B) MS3 spectrum of m/z 744 ([M-15]-). The observed fragments are the products of ketene loss [M–15–C14H29CH=C=O]- (m/z 506) and [M–15–C16H31CH=C=O]-
(m/z 480), corresponding to ions of de-methylated LPC 18:1 and LPC 16:0, respectively; acyl anions of oleic (m/z 281) and palmatic (m/z 255) acids; loss of free FA [M–15–C14H29CH2COOH]- (m/z 488) and [M–15–C16H31CH2COOH]- (m/z 462). (C) MS3 spectrum of [M–15]- ion (m/z 744) obtained by MS2 fragmentation of a chloride adduct of synthetic PC 18:1/16:0 standard. The spectrum is similar to the one in panel B, but the intensities of fragments at m/z 506 and 480, as well as at m/z 281 and 255 are reversed.
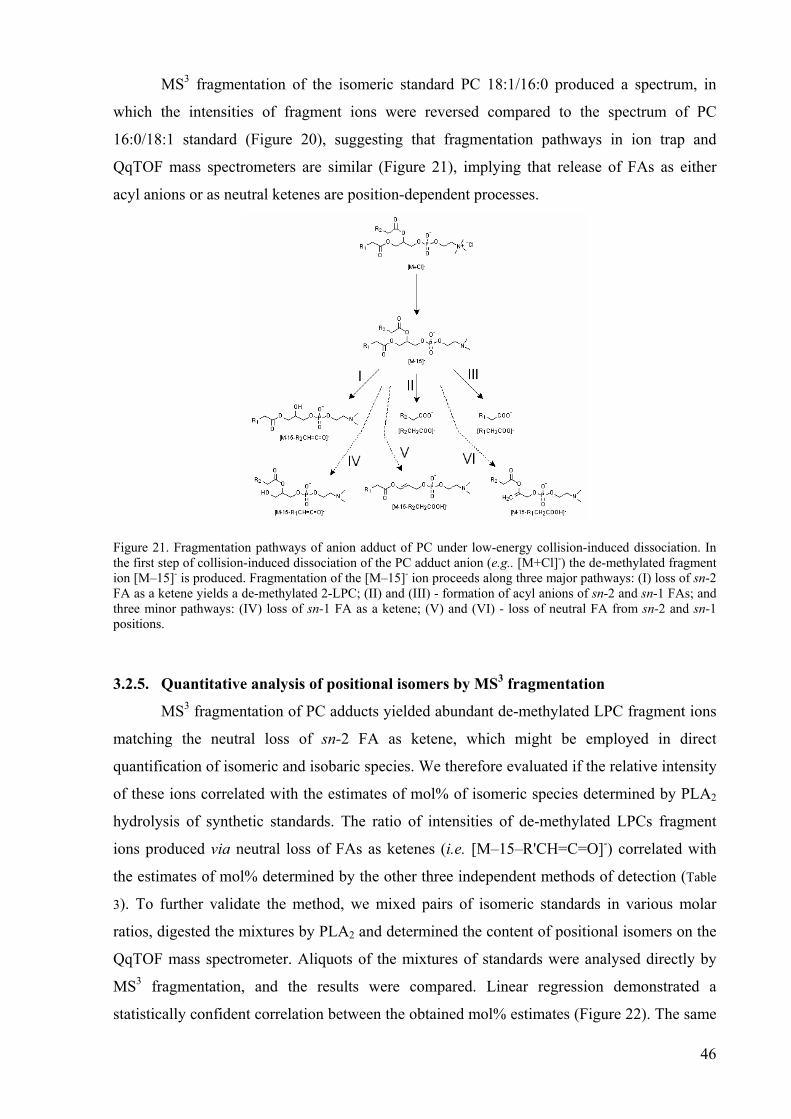
46
MS3 fragmentation of the isomeric standard PC 18:1/16:0 produced a spectrum, in
which the intensities of fragment ions were reversed compared to the spectrum of PC
16:0/18:1 standard (Figure 20), suggesting that fragmentation pathways in ion trap and
QqTOF mass spectrometers are similar (Figure 21), implying that release of FAs as either
acyl anions or as neutral ketenes are position-dependent processes.
Figure 21. Fragmentation pathways of anion adduct of PC under low-energy collision-induced dissociation. In the first step of collision-induced dissociation of the PC adduct anion (e.g.. [M+Cl]-) the de-methylated fragment ion [M–15]- is produced. Fragmentation of the [M–15]- ion proceeds along three major pathways: (I) loss of sn-2 FA as a ketene yields a de-methylated 2-LPC; (II) and (III) - formation of acyl anions of sn-2 and sn-1 FAs; and three minor pathways: (IV) loss of sn-1 FA as a ketene; (V) and (VI) - loss of neutral FA from sn-2 and sn-1 positions.
3.2.5. Quantitative analysis of positional isomers by MS3 fragmentation
MS3 fragmentation of PC adducts yielded abundant de-methylated LPC fragment ions
matching the neutral loss of sn-2 FA as ketene, which might be employed in direct
quantification of isomeric and isobaric species. We therefore evaluated if the relative intensity
of these ions correlated with the estimates of mol% of isomeric species determined by PLA2
hydrolysis of synthetic standards. The ratio of intensities of de-methylated LPCs fragment
ions produced via neutral loss of FAs as ketenes (i.e. [M–15–R'CH=C=O]-) correlated with
the estimates of mol% determined by the other three independent methods of detection (Table
3). To further validate the method, we mixed pairs of isomeric standards in various molar
ratios, digested the mixtures by PLA2 and determined the content of positional isomers on the
QqTOF mass spectrometer. Aliquots of the mixtures of standards were analysed directly by
MS3 fragmentation, and the results were compared. Linear regression demonstrated a
statistically confident correlation between the obtained mol% estimates (Figure 22). The same

47
experiment was performed using other pairs of isomeric standards: PC 16:0/18:0 and PC
18:0/16:0, and PC 14:0/18:0 and PC 18:0/14:0, and produced similar results (data not shown).
Taken together, the data indicated that neutral loss of FA as ketene predominantly occurs at
the sn-2 position.
Figure 22. Quantification of mixtures of PC 18:1/16:0 and PC 16:0/18:1 standards by ion trap MS3 fragmentation. X-axis: mol% of PC 18:1/16:0 in the mixture determined by PLA2 hydrolysis and PIS m/z 184.1; Y-axis: the peak intensity of de-methylated [LPC 16:0-15]- (i.e. [M–15–C16H31CH=C=O]- , m/z 480) divided by the sum of peak intensities of de-methylated [LPC 16:0-15]- and [LPC 18:1-15]- (i..e. [M–15–C14H29CH=C=O]- , m/z 506) and in acquired MS3 spectra.
The intensity of other fragments, or a combination of intensities of fragments,
observed in MS3 spectra did not correlate well with the mol% of the isomers, possibly due to
the yield of fragments from other fragmentation pathways being less position-specific than
that of ketene loss. Further supporting this notion, we found that lysophosphatidic acid
fragments formed by loss of ketene from sn-2 position enabled accurate estimates of mol% in
mixtures of PA 16:0/18:1 and PA 18:1/16:0, although they were much less abundant than
fragment ions produced by neutral loss of free FA (data not shown).
3.2.6. Validation of the mass spectrometric approach
The lipid composition and major molecular species of glycerophospholipids of human
red blood cells were previously rigorously characterized (Connor et al., 1997) by a
sophisticated analytical routine that involved several TLC separations, hydrolysis of lipids by
phospholipase C, derivatization of diradylglycerols by benzoic anhydride followed by
quantification of diradylglycerolbenzoates by reversed-phase HPLC (Blank et al., 1984).
Diradylglycerolbenzoates were separated into 20 chromatographic peaks (some of them
contained a few co-eluted species), however separation of positional isomers was not
achieved (Blank et al., 1984).
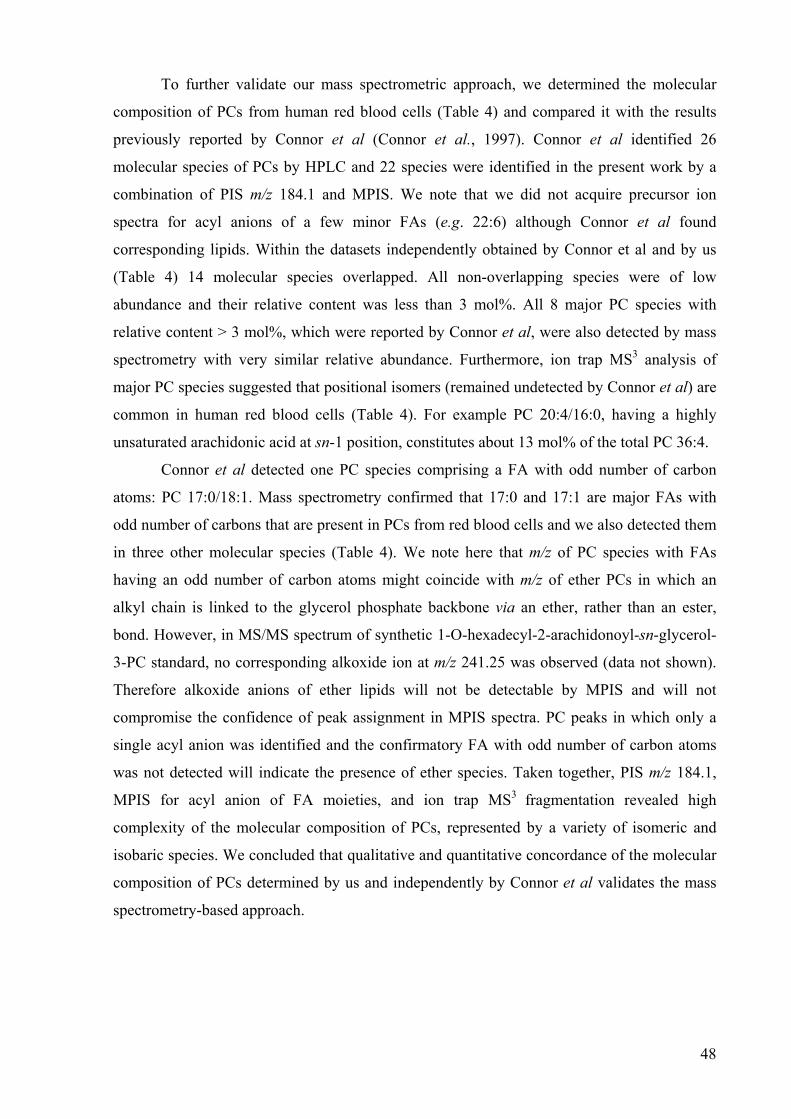
48
To further validate our mass spectrometric approach, we determined the molecular
composition of PCs from human red blood cells (Table 4) and compared it with the results
previously reported by Connor et al (Connor et al., 1997). Connor et al identified 26
molecular species of PCs by HPLC and 22 species were identified in the present work by a
combination of PIS m/z 184.1 and MPIS. We note that we did not acquire precursor ion
spectra for acyl anions of a few minor FAs (e.g. 22:6) although Connor et al found
corresponding lipids. Within the datasets independently obtained by Connor et al and by us
(Table 4) 14 molecular species overlapped. All non-overlapping species were of low
abundance and their relative content was less than 3 mol%. All 8 major PC species with
relative content > 3 mol%, which were reported by Connor et al, were also detected by mass
spectrometry with very similar relative abundance. Furthermore, ion trap MS3 analysis of
major PC species suggested that positional isomers (remained undetected by Connor et al) are
common in human red blood cells (Table 4). For example PC 20:4/16:0, having a highly
unsaturated arachidonic acid at sn-1 position, constitutes about 13 mol% of the total PC 36:4.
Connor et al detected one PC species comprising a FA with odd number of carbon
atoms: PC 17:0/18:1. Mass spectrometry confirmed that 17:0 and 17:1 are major FAs with
odd number of carbons that are present in PCs from red blood cells and we also detected them
in three other molecular species (Table 4). We note here that m/z of PC species with FAs
having an odd number of carbon atoms might coincide with m/z of ether PCs in which an
alkyl chain is linked to the glycerol phosphate backbone via an ether, rather than an ester,
bond. However, in MS/MS spectrum of synthetic 1-O-hexadecyl-2-arachidonoyl-sn-glycerol-
3-PC standard, no corresponding alkoxide ion at m/z 241.25 was observed (data not shown).
Therefore alkoxide anions of ether lipids will not be detectable by MPIS and will not
compromise the confidence of peak assignment in MPIS spectra. PC peaks in which only a
single acyl anion was identified and the confirmatory FA with odd number of carbon atoms
was not detected will indicate the presence of ether species. Taken together, PIS m/z 184.1,
MPIS for acyl anion of FA moieties, and ion trap MS3 fragmentation revealed high
complexity of the molecular composition of PCs, represented by a variety of isomeric and
isobaric species. We concluded that qualitative and quantitative concordance of the molecular
composition of PCs determined by us and independently by Connor et al validates the mass
spectrometry-based approach.
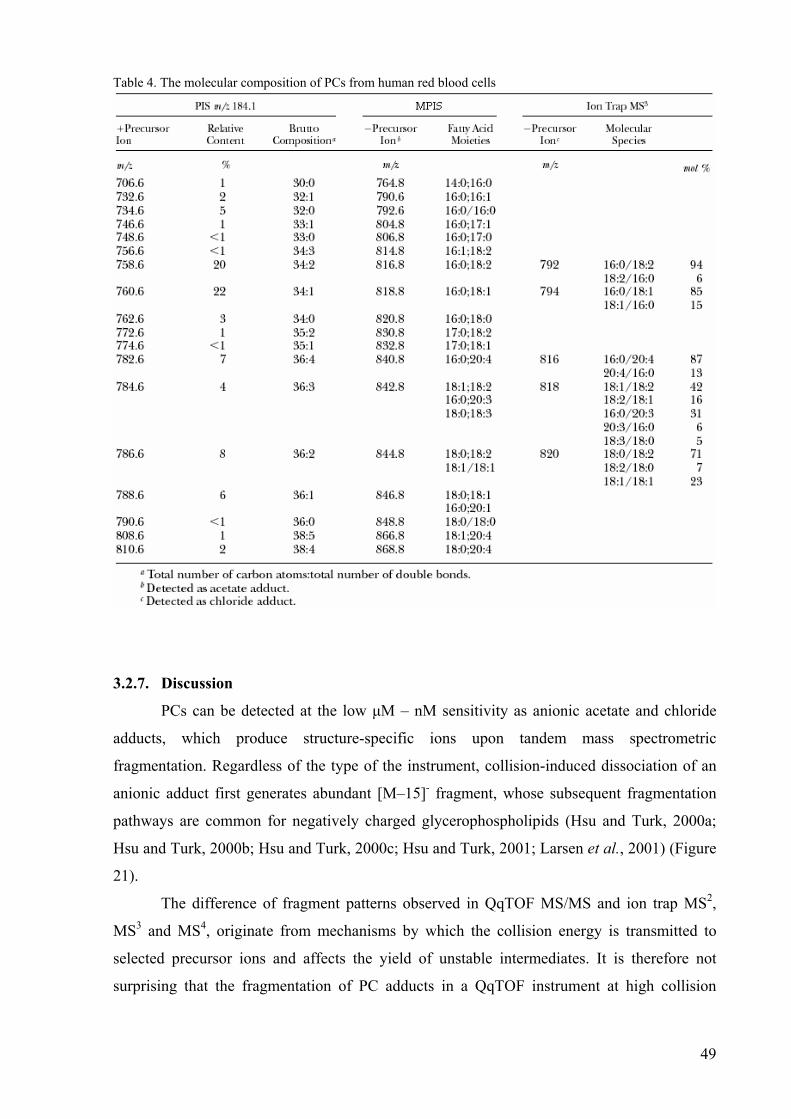
49
Table 4. The molecular composition of PCs from human red blood cells
3.2.7. Discussion
PCs can be detected at the low µM – nM sensitivity as anionic acetate and chloride
adducts, which produce structure-specific ions upon tandem mass spectrometric
fragmentation. Regardless of the type of the instrument, collision-induced dissociation of an
anionic adduct first generates abundant [M–15]- fragment, whose subsequent fragmentation
pathways are common for negatively charged glycerophospholipids (Hsu and Turk, 2000a;
Hsu and Turk, 2000b; Hsu and Turk, 2000c; Hsu and Turk, 2001; Larsen et al., 2001) (Figure
21).
The difference of fragment patterns observed in QqTOF MS/MS and ion trap MS2,
MS3 and MS4, originate from mechanisms by which the collision energy is transmitted to
selected precursor ions and affects the yield of unstable intermediates. It is therefore not
surprising that the fragmentation of PC adducts in a QqTOF instrument at high collision

50
energy predominantly yielded acyl anion fragments of the FA moieties, whereas abundant
peaks of the de-methylated LPCs were observed in MS3 ion trap spectra.
The inspection of fragmentation pathways by ion trap MS3 revealed that they have
different positional specificity (Figure 20 and Figure 21). Neutral loss of FA as ketene
accounts for ~58 % of the total intensity of fragment ions and occurs almost exclusively via
the cleavage of sn-2 FA (~99% of ketene fragment ions), thus generating de-methylated 2-
LPC. Its yield does not depend on the FA moieties, as is evident from the accurate estimation
of mol% of isomeric species comprising different combinations of FAs (Table 3 and Figure
22). Acyl anion fragments are abundant in MS3 spectra (~39% of the total fragment ion
intensity) and are mostly (although not exclusively!) produced from the sn-2 FA (80% of
intensity of acyl anion fragments). Neutral loss of free FA appears to be a relatively minor
process that accounts for about 2% of the total fragment ion intensity.
Relative (in mol%) quantification of isobaric and isomeric PC species by ion trap MS3
fragmentation is direct and does not require internal standards. The determination is very
specific because of the accurate selection of precursor masses at MS2 and MS3 stages, and
therefore is reliable even if applied to total lipid extracts. Furthermore, matching pairs of de-
methylated 2-LPCs and acyl anion fragments of sn-2 FA additionally verify the peak
assignment. At the same time, MS3 fragmentation is poorly suited for the detection of PC
precursors in lipid mixtures, as well as for the quantification of PC species with different
molecular mass. Since no efficient PIS is possible on ion trap mass spectrometers,
complementary analysis by QqTOF mass spectrometry and by ion trap mass spectrometry
should be performed.
We applied MPIS on a QqTOF mass spectrometer and MS3 fragmentation on the ion
trap mass spectrometer, to characterize the molecular composition of PCs. MPIS
complemented the previously established method of PIS m/z 184.1 and not only increased the
specificity and the dynamic range of detection, but also allowed us to identify the FA moieties
and their relative localization on the glycerol phosphate backbone of the individual PC
molecules. MS3 fragmentation of precursor ions detected by MPIS independently enabled
quantitative estimation of the relative amount of their positional isomers. Since a combination
of mass spectrometric methods could account for individual molecular species of PCs, we
assumed that this is currently the most comprehensive approach for their characterization.
The combination of MPIS and MS3 was applied to profile PCs in a total lipid extract
from human red blood cells (Table 4) and MDCK II cells (data not shown). Although PCs of
human red blood cells have been extensively characterized, no indication of the possible
presence of positional isomers has been reported (Renooij et al., 1976). Biochemical studies
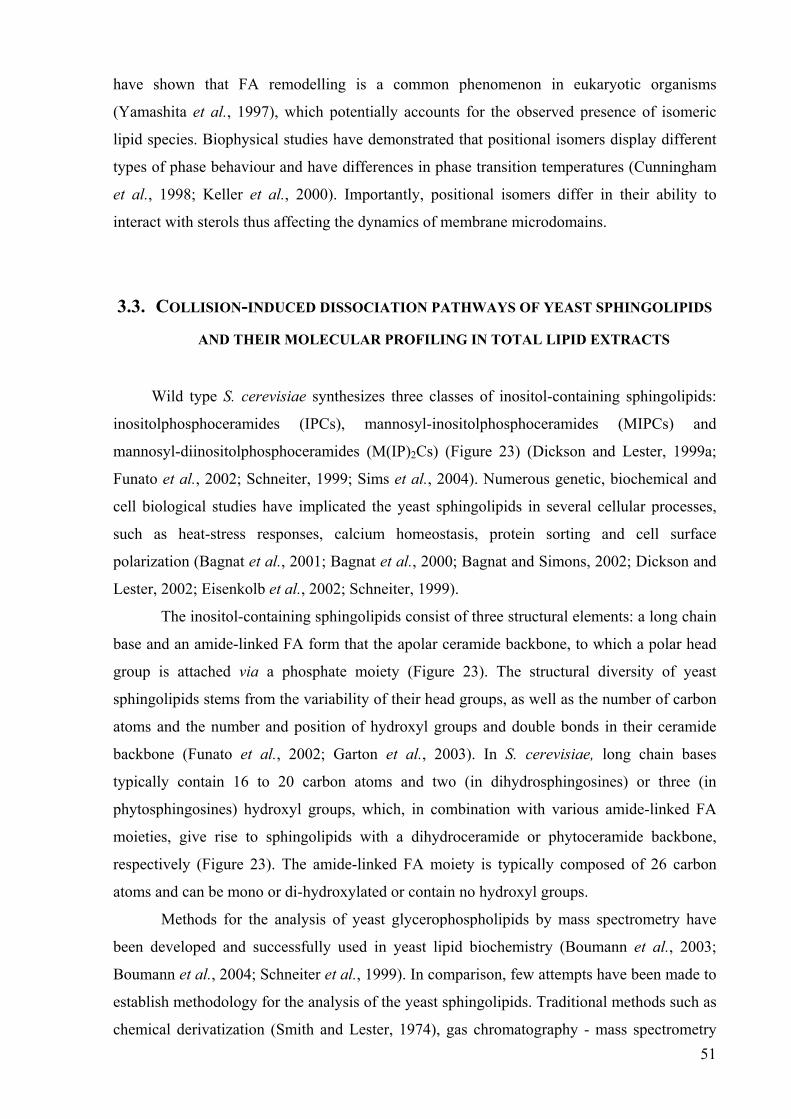
51
have shown that FA remodelling is a common phenomenon in eukaryotic organisms
(Yamashita et al., 1997), which potentially accounts for the observed presence of isomeric
lipid species. Biophysical studies have demonstrated that positional isomers display different
types of phase behaviour and have differences in phase transition temperatures (Cunningham
et al., 1998; Keller et al., 2000). Importantly, positional isomers differ in their ability to
interact with sterols thus affecting the dynamics of membrane microdomains.
3.3. COLLISION-INDUCED DISSOCIATION PATHWAYS OF YEAST SPHINGOLIPIDS
AND THEIR MOLECULAR PROFILING IN TOTAL LIPID EXTRACTS
Wild type S. cerevisiae synthesizes three classes of inositol-containing sphingolipids:
inositolphosphoceramides (IPCs), mannosyl-inositolphosphoceramides (MIPCs) and
mannosyl-diinositolphosphoceramides (M(IP)2Cs) (Figure 23) (Dickson and Lester, 1999a;
Funato et al., 2002; Schneiter, 1999; Sims et al., 2004). Numerous genetic, biochemical and
cell biological studies have implicated the yeast sphingolipids in several cellular processes,
such as heat-stress responses, calcium homeostasis, protein sorting and cell surface
polarization (Bagnat et al., 2001; Bagnat et al., 2000; Bagnat and Simons, 2002; Dickson and
Lester, 2002; Eisenkolb et al., 2002; Schneiter, 1999).
The inositol-containing sphingolipids consist of three structural elements: a long chain
base and an amide-linked FA form that the apolar ceramide backbone, to which a polar head
group is attached via a phosphate moiety (Figure 23). The structural diversity of yeast
sphingolipids stems from the variability of their head groups, as well as the number of carbon
atoms and the number and position of hydroxyl groups and double bonds in their ceramide
backbone (Funato et al., 2002; Garton et al., 2003). In S. cerevisiae, long chain bases
typically contain 16 to 20 carbon atoms and two (in dihydrosphingosines) or three (in
phytosphingosines) hydroxyl groups, which, in combination with various amide-linked FA
moieties, give rise to sphingolipids with a dihydroceramide or phytoceramide backbone,
respectively (Figure 23). The amide-linked FA moiety is typically composed of 26 carbon
atoms and can be mono or di-hydroxylated or contain no hydroxyl groups.
Methods for the analysis of yeast glycerophospholipids by mass spectrometry have
been developed and successfully used in yeast lipid biochemistry (Boumann et al., 2003;
Boumann et al., 2004; Schneiter et al., 1999). In comparison, few attempts have been made to
establish methodology for the analysis of the yeast sphingolipids. Traditional methods such as
chemical derivatization (Smith and Lester, 1974), gas chromatography - mass spectrometry

52
(Oh et al., 1997) and magnetic sector mass spectrometry (Hechtberger et al., 1994) have
provided valuable information about the structural diversity of yeast sphingolipids. However,
these methods are laborious and offer low sensitivity which severely limits their efficacy for
high-throughput oriented lipidomics studies of S. cerevisiae and other organisms synthesizing
inositol-containing sphingolipids (Dickson and Lester, 1999b; Sperling and Heinz, 2003).
This sections outlines the use of QqTOF (Chernushevich et al., 2001) and linear ion
trap-orbitrap (LTQ Orbitrap)(Hu et al., 2005; Olsen et al., 2005) mass spectrometers to
elucidate the fragmentation pathways of inositol-containing sphingolipids and the
identification of specific fragment ions for each lipid class and the ceramide backbone of
individual lipid species. Subsequent QqTOF analysis using the method of MPIS, based on m/z
of class-specific fragments, enabled simultaneous profiling of sphingolipids and
glycerophospholipids in total yeast lipid extracts.
Figure 23. Structure of yeast sphingolipids. Inositol-containing sphingolipids consist of a long chain base and an amide-linked FA that together consitute a ceramide backbone, to which a polar head group is attached via a phosphate moiety. The long chain base and the FA moiety typically comprise 16 to 20 and 20 to 26 carbon atoms, respectively. The long chain base might comprise two (dihydrosphingosine) or three (phytosphingosine) hydroxyl groups at positions 1, 3 and 4 that form dihydroceramides or phytoceramides, respectively. The amide-linked FA moiety can be non-, mono-, or di-hydroxylated, with one hydroxyl group at position 2' (α-hydroxyl group) and other groups elsewhere between positions 9' and 16'. In this work, yeast sphingolipids were annotated either by their molecular composition or by sum formula. The molecular composition indicates the number of carbon atoms, double bonds and hydroxyl groups separately in the long chain base and in the FA moiety, whereas the sum formula provides the total number of carbon atoms, double bonds and hydroxyl goups in the entire ceramide backbone. The species annotation convention is explained in the Material and Methods (page 93).

53
3.3.1. Fragmentation pathways of IPCs
To elucidate the fragmentation pathways of the three inositol-containing sphingolipid
classes - IPC, MIPC and M(IP)2C, we isolated them by preparative TLC from the lipid
extracts of wild type S. cerevisiae (Hechtberger et al., 1994) and from three mutants (i.e.
scs7∆, sur2∆ and scs7∆sur2∆), which are known to synthesize sphingolipids having altered
structures of their ceramide backbones. Individual species within the same lipid class were
subjected to tandem mass spectrometry on the QqTOF and LTQ Orbitrap mass spectrometers.
The most abundant ions in the IPC fraction isolated from wild type strain of S.
cerevisiae were detected at m/z 952.70, 968.70, and 980.73, corresponding to IPC 44:0;4, IPC
44:0;5 and IPC 46:0;4, respectively (data not shown), as was previously observed (Gaigg et
al., 2001; Hechtberger et al., 1994). Tandem mass spectra of all species acquired on a QqTOF
instrument were dominated by two fragment ions at m/z 259.02 ([IP]-) and 241.01 ([IP - H2O]-
), both originating from the inositolphosphate head group (Figure 24A, D). These fragments
are also typical for tandem mass spectra of phosphatidylinositols (Hsu and Turk, 2000a).
Since m/z of IPC species do not overlap with m/z of phosphatidylinositols that comprise
common FA moieties, the fragment ion with m/z 241.0 was previously used for profiling IPC
species by PIS (Young et al., 2002). Two very low abundant fragment ions, detected at m/z
790.65 and 772.63, were produced via neutral loss of the head group as dehydroinositol (∆m
= 162.05 Da) followed by the loss of H2O, corresponding to the two ceramide phosphate
fragments [CerP]- and [CerP - H2O]-, respectively (Figure 24D). Efficient fragmentation of
IPCs was achieved at the collision energy offset of 65-75 eV, compared to the 40-55 eV that
was typically required for the fragmentation of glycerophospholipids (Ekroos et al., 2003).
Although the ratio of intensities of the two fragment ions m/z 259.02 and 241.01 was collision
energy dependent, both fragments were always observed simultaneously, contrary to a typical
fragmentation pattern of phosphatidylinositol species, in which m/z 241.0 fragment was most
abundant (Hsu and Turk, 2000a).
We further investigated if the fragmentation of IPC species could yield abundant ions
that were specific to their ceramide backbone. To this end we acquired MSn spectra from their
molecular anions on a hybrid linear ion trap - orbitrap mass spectrometer (Hu et al., 2005).
orbitrap is a novel Fourier transform orbital trapping mass analyzer (Hardman and Makarov,
2003; Makarov, 2000). To acquire MSn spectra with high mass accuracy, precursor ions were
isolated and fragmented in the linear trap, and spectra were acquired using either the orbitrap
analyzer (for higher mass accuracy) or the linear ion trap detector (for better sensitivity). In
contrast to instruments equipped with a linear collision cell, such as QqTOF or triple
quadrupole mass spectrometers, the collision induced dissociation of precursor ions in an ion

54
trap usually leaves fragment ions intact, since they fall off the excitation resonance frequency.
Therefore, labile intermediate products could be identified and the entire sequence of
fragmentation events established via successive fragmentation by MSn (Ekroos et al., 2003;
Larsen et al., 2001). Continuous nanoflow infusion of lipid extracts offered ample time to
acquire MSn spectra with reliable ion statistics. Higher than 30.000 (FWHM) mass resolution,
together with mass accuracy more than 3 ppm, achieved by the orbitrap analyzer, allowed us
to unequivocally determine the elemental composition of detected fragment ions.
A
B
C D
Figure 24. Fragmentation pathways of IPC species. (A) QqTOF MS/MS spectrum of IPC 44:0;4 ion of m/z 952.7 ([M - H]-) acquired at the collision energy of 68 eV. (B) Orbitrap MS2 spectrum acquired from the same precursor (C) Orbitrap MS3 spectrum acquired from the precursor ion m/z 772.6205 ([CerP - H2O]-) at the relative collision energy of 24%. Peaks with m/z 462.6826, 409.8589, 365.5548, 296.0985 originated from background and were not detectable in the corresponding ion trap MS3 spectrum (data not shown). (D) Major fragmentation pathways of IPC 18:0;3/26:0;1 elucidated by QqTOF MS/MS and LTQ Orbitrap MSn analysis. The structure of the [CerP - H2O]- fragment ion with m/z 772.6225 is presented with a cyclic phosphate residue between the hydroxyl groups at positions 1 and 3 of the long chain moiety, however isomer structures are possible.
Orbitrap MS2 analysis of the abundant IPC 44:0;4 species with m/z 952.6897, yielded
intense ceramide phosphate fragments [CerP - H2O]- and [CerP]- with m/z 772.6205 and m/z
790.6312, respectively (Figure 24B). The identification of fragment ions was supported by

55
their accurately determined m/z that deviated by less than 3 ppm from the corresponding
calculated values, as well as by their further MS3 analysis (see below). In general, similar
patterns of fragment ions were observed in MS2 spectra, acquired from the same precursors on
the linear ion trap and on the orbitrap (data not shown). However, MS2 spectra did not reveal
the exact chemical structure of both ceramide-specific fragments. It was unclear, if the loss of
H2O produced a double bond elsewhere within their molecules, or yielded a cyclic phosphate
moiety. For clarity we present the structure of (dehydro)ceramide phosphate fragment ions,
with a cyclic phosphate moiety between the hydroxyl groups at positions 1 and 3 of the long
chain base (Figure 24D), however alternative isomeric molecular structures are also possible.
Further orbitrap MS3 analysis of m/z 772.6205 ([CerP - H2O]-) elucidated the
composition of its ceramide backbone (Figure 24C). The fragmentation produced an acyl
anion of the FA moiety [FA26:0;1 + O]- with m/z 411.3840 (mass accuracy 0.7 ppm). Another
fragment ion, related to the FA moiety was detected at m/z 365.3787 and was produced via
subsequent loss of CH2O, i.e. [FA26:0;1 - CH2O]- (mass accuracy 0.6 ppm). These fragments
were previously detected in tandem mass spectra of ceramides acquired in negative ion mode
on a triple quadrupole instrument (Han, 2002; Hsu and Turk, 2002). Fragments with m/z
378.2412, 363.2305 and 360.2314 were produced via neutral loss of the amide-linked FA,
yielding the long chain base phosphate fragment ions [LCBP18:0;3 - H2O]- (mass accuracy
0.5 ppm), [LCBP18:0;3 - H3NO]- (mass accuracy 0.1 ppm) and [LCBP18:0;3 - 2H2O]- (mass
accuracy 1.4 ppm), respectively (Figure 24C, D). The fragment ion with m/z 406.2358 was
produced by internal cleavage of the FA moiety resulting in neutral loss of the hydrocarbon
chain with secondary α-hydroxyl ([LCBP18:0;3 - H2O + CO]- (mass accuracy 1.5 ppm).
Although we could only speculate on the exact chemical structure of these fragment
ions, the orbitrap mass accuracy allowed us to unequivocally determine the number of carbon
atoms, hydroxyl groups and double bonds separately in the long chain base and in the amide-
linked FA of their ceramide backbone. Once fragment ions in MS3 spectra were identified,
further structural analysis of low abundant IPC species was performed by MS3 analysis on the
linear ion trap, which improved the sensitivity and reduced the analysis time (data not shown).
Thus, the combination of QqTOF MS/MS and orbitrap MS2 and MS3 fragmentation
allowed us to elucidate the chemical composition of the head group and both cleavable parts
of the ceramide backbone, i.e. the long chain base and the amide-linked FA (Figure 24D).
Interestingly, no fragments were observed in the MS3 spectrum that pointed to alternative
ceramide structures having different numbers of either methylene or hydroxyl groups. This
indicated that the precursor ion IPC 44:0;4 at m/z 952.7 contained a ceramide backbone
composed of a long chain base with 18 carbon atoms and three hydroxyl groups
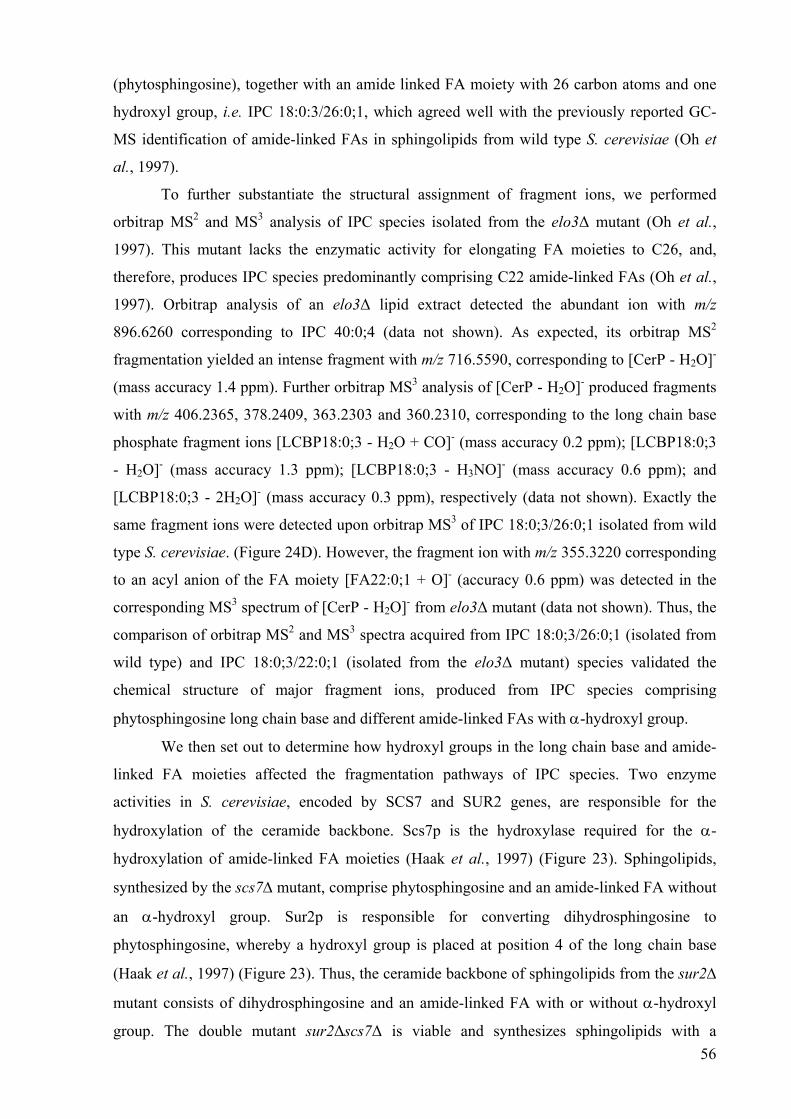
56
(phytosphingosine), together with an amide linked FA moiety with 26 carbon atoms and one
hydroxyl group, i.e. IPC 18:0:3/26:0;1, which agreed well with the previously reported GC-
MS identification of amide-linked FAs in sphingolipids from wild type S. cerevisiae (Oh et
al., 1997).
To further substantiate the structural assignment of fragment ions, we performed
orbitrap MS2 and MS3 analysis of IPC species isolated from the elo3∆ mutant (Oh et al.,
1997). This mutant lacks the enzymatic activity for elongating FA moieties to C26, and,
therefore, produces IPC species predominantly comprising C22 amide-linked FAs (Oh et al.,
1997). Orbitrap analysis of an elo3∆ lipid extract detected the abundant ion with m/z
896.6260 corresponding to IPC 40:0;4 (data not shown). As expected, its orbitrap MS2
fragmentation yielded an intense fragment with m/z 716.5590, corresponding to [CerP - H2O]-
(mass accuracy 1.4 ppm). Further orbitrap MS3 analysis of [CerP - H2O]- produced fragments
with m/z 406.2365, 378.2409, 363.2303 and 360.2310, corresponding to the long chain base
phosphate fragment ions [LCBP18:0;3 - H2O + CO]- (mass accuracy 0.2 ppm); [LCBP18:0;3
- H2O]- (mass accuracy 1.3 ppm); [LCBP18:0;3 - H3NO]- (mass accuracy 0.6 ppm); and
[LCBP18:0;3 - 2H2O]- (mass accuracy 0.3 ppm), respectively (data not shown). Exactly the
same fragment ions were detected upon orbitrap MS3 of IPC 18:0;3/26:0;1 isolated from wild
type S. cerevisiae. (Figure 24D). However, the fragment ion with m/z 355.3220 corresponding
to an acyl anion of the FA moiety [FA22:0;1 + O]- (accuracy 0.6 ppm) was detected in the
corresponding MS3 spectrum of [CerP - H2O]- from elo3∆ mutant (data not shown). Thus, the
comparison of orbitrap MS2 and MS3 spectra acquired from IPC 18:0;3/26:0;1 (isolated from
wild type) and IPC 18:0;3/22:0;1 (isolated from the elo3∆ mutant) species validated the
chemical structure of major fragment ions, produced from IPC species comprising
phytosphingosine long chain base and different amide-linked FAs with α-hydroxyl group.
We then set out to determine how hydroxyl groups in the long chain base and amide-
linked FA moieties affected the fragmentation pathways of IPC species. Two enzyme
activities in S. cerevisiae, encoded by SCS7 and SUR2 genes, are responsible for the
hydroxylation of the ceramide backbone. Scs7p is the hydroxylase required for the α-
hydroxylation of amide-linked FA moieties (Haak et al., 1997) (Figure 23). Sphingolipids,
synthesized by the scs7∆ mutant, comprise phytosphingosine and an amide-linked FA without
an α-hydroxyl group. Sur2p is responsible for converting dihydrosphingosine to
phytosphingosine, whereby a hydroxyl group is placed at position 4 of the long chain base
(Haak et al., 1997) (Figure 23). Thus, the ceramide backbone of sphingolipids from the sur2∆
mutant consists of dihydrosphingosine and an amide-linked FA with or without α-hydroxyl
group. The double mutant sur2∆scs7∆ is viable and synthesizes sphingolipids with a

57
ceramide backbone containing dihydrosphingosine and an amide-linked FA without α-
hydroxyl group (Haak et al., 1997).
Orbitrap MS and TOF MS spectra, acquired from a lipid extract of scs7∆ mutant,
showed an abundant ion at m/z 936.6937, corresponding to IPC 44:0;3 (data not shown). Its
orbitrap MS2 analysis yielded intense ceramide phosphate fragments [CerP - H2O]- with m/z
756.6262 (mass accuracy 2.0 ppm) and [CerP]- m/z 774.6369 (mass accuracy 1.7 ppm) (data
not shown). In turn, MS3 fragmentation of [CerP - H2O]- produced two long chain base
phosphate fragment ions with m/z 378.2412 and 360.2307, corresponding to [LCBP18:0;3 -
H2O]- (mass accuracy 0.1 ppm) and [LCBP18:0;3 - 2H2O]- (mass accuracy 0.6 ppm),
respectively (Figure 25A, B). Acyl anion of the amide-linked FA [FA26:0;0 + O]- was
detected at m/z 395.3887 (mass accuracy 1.8 ppm) (Figure 3, panels A and B). Wild type IPC
44:0,4 and IPC 44:0;3 from scs7∆ were only different by a single hydroxyl group in the FA
moiety (cp. Figure 24D with Figure 25B), yet several long chain base-specific fragments were
missing in MS3 spectra of IPC 44:0;3 from scs7∆. Therefore, we speculate that the α-hydroxyl
group enhanced the diversity of pathways of neutral loss of fragments of amide-linked FA
moieties off the ceramide backbone. Nevertheless, it was possible to unambiguously assign
fragments specific for the long chain base and amide-linked FA and thus identify IPC 44:0;3
from scs7∆ mutant as IPC 18:0:3/26:0;0.
A B
Figure 25. Fragmentation pathways of IPC 18:0;3/26:0;0 isolated from scs7∆ mutant. (A) Orbitrap MS3 analysis of intermediate [CerP - H2O]- fragment (m/z 756.6), which was obtained from the molecular anion of IPC 44:0;3 via its MS2 fragmentation. Peaks with m/z 462.6826, 409.8589, 365.5548, 328.0986 originate from background and were not detectable in the ion trap MS3 spectrum from the same precursor (data not shown). (B) Major fragmentation pathways of IPC 18:0;3/26:0;0 isolated from the scs7∆ mutant elucidated by QqTOF MS/MS and LTQ Orbitrap MSn analysis.
We further compared the fragmentation pathways of the four IPCs with altered
ceramide backbones: IPC 18:0:3/26:0;1 (wild type) (Figure 24D), IPC 18:0:3/26:0;0 (scs7∆)
(Figure 25B), IPC 18:0:2/26:0;1 (sur2∆) (data not shown), and IPC 18:0:2/26:0;0

58
(sur2∆scs7∆) (data not shown). All four IPCs produced a common set of structure-specific
fragments. [LCBP - H2O]- and [LCBP - 2H2O]- were always produced from the long chain
base, and the acyl anion [FA + O]- was produced from the amide-linked FA moiety (Table 5).
If an α-hydroxyl group was present in the amide-linked FA (e.g. IPC 18:0:3/26:0;1, IPC
18:0:2/26:0;1), products of neutral loss of the FA related fragments [LCBP - H2O + CO]- and
[LCBP - H3NO]- were typically observed, along with another FA related fragment [FA -
CH2O]- (Table 5; Figure 24D; Figure 25B). The relative intensities of structure-specific
fragment ions varied between IPC species. Fragment ions comprising a long chain base
phosphate moiety were, typically, more abundant than fragment ion(s) related to the FA
moiety, although the α-hydroxyl group enhanced their intensity.
Thus we concluded that the fragmentation of molecular anions of IPCs on a QqTOF
mass spectrometer predominantly produced head group specific fragments, whereas MS2
fragmentation on the ion trap yielded abundant ceramide phosphate fragments [CerP - H2O]-,
which served as a starting point for further ceramide backbone-specific fragmentation by
MS3. MS3 analysis determined the number of carbon atoms, double bonds and hydroxyl
groups in the long chain base and in the amide-linked FA of each fragmented IPC precursor
and, hence, enabled their identification as individual molecular species.
Table 5. Structure specific fragment ions produced from inositol-containing sphingolipids upon MS3 fragmentation of the intermediate [CerP - H2O]- fragment ion
3.3.2. Fragmentation pathways of MIPCs
The most abundant ions in the MIPC fraction were detected on a QqTOF mass
spectrometer at m/z 1114.74 and 1142.79 and corresponded, respectively, to MIPC 44:0;4 and
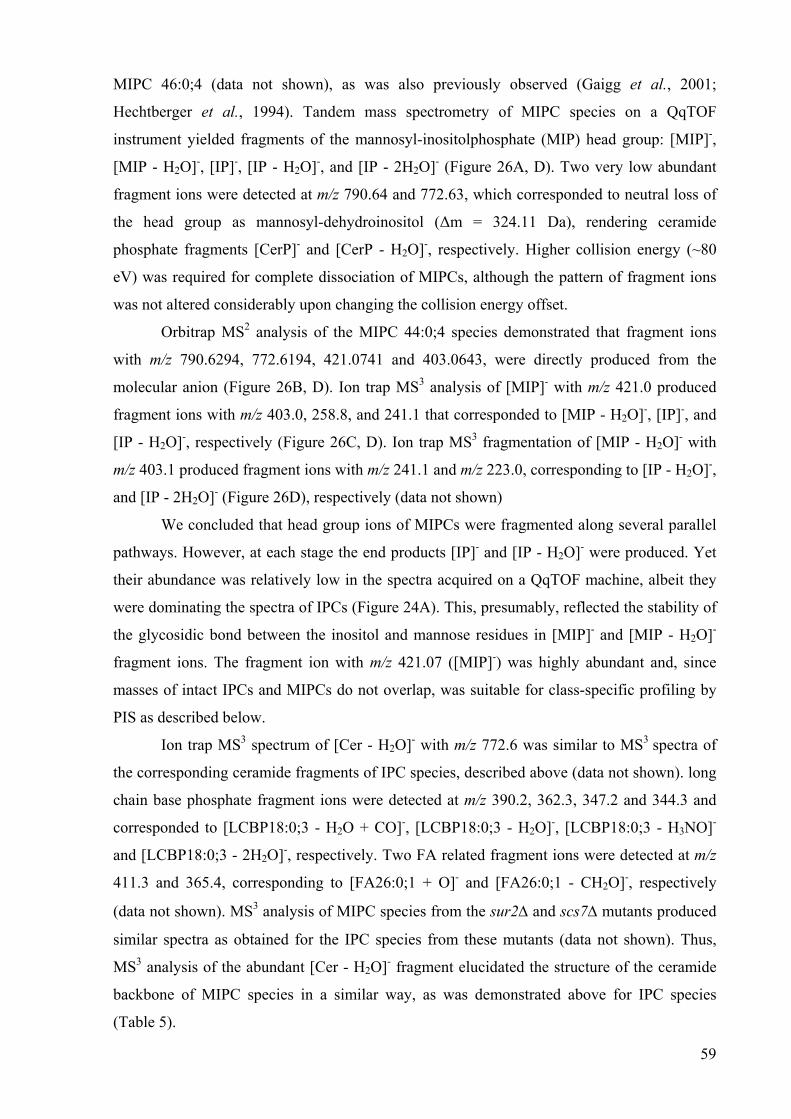
59
MIPC 46:0;4 (data not shown), as was also previously observed (Gaigg et al., 2001;
Hechtberger et al., 1994). Tandem mass spectrometry of MIPC species on a QqTOF
instrument yielded fragments of the mannosyl-inositolphosphate (MIP) head group: [MIP]-,
[MIP - H2O]-, [IP]-, [IP - H2O]-, and [IP - 2H2O]- (Figure 26A, D). Two very low abundant
fragment ions were detected at m/z 790.64 and 772.63, which corresponded to neutral loss of
the head group as mannosyl-dehydroinositol (∆m = 324.11 Da), rendering ceramide
phosphate fragments [CerP]- and [CerP - H2O]-, respectively. Higher collision energy (~80
eV) was required for complete dissociation of MIPCs, although the pattern of fragment ions
was not altered considerably upon changing the collision energy offset.
Orbitrap MS2 analysis of the MIPC 44:0;4 species demonstrated that fragment ions
with m/z 790.6294, 772.6194, 421.0741 and 403.0643, were directly produced from the
molecular anion (Figure 26B, D). Ion trap MS3 analysis of [MIP]- with m/z 421.0 produced
fragment ions with m/z 403.0, 258.8, and 241.1 that corresponded to [MIP - H2O]-, [IP]-, and
[IP - H2O]-, respectively (Figure 26C, D). Ion trap MS3 fragmentation of [MIP - H2O]- with
m/z 403.1 produced fragment ions with m/z 241.1 and m/z 223.0, corresponding to [IP - H2O]-,
and [IP - 2H2O]- (Figure 26D), respectively (data not shown)
We concluded that head group ions of MIPCs were fragmented along several parallel
pathways. However, at each stage the end products [IP]- and [IP - H2O]- were produced. Yet
their abundance was relatively low in the spectra acquired on a QqTOF machine, albeit they
were dominating the spectra of IPCs (Figure 24A). This, presumably, reflected the stability of
the glycosidic bond between the inositol and mannose residues in [MIP]- and [MIP - H2O]-
fragment ions. The fragment ion with m/z 421.07 ([MIP]-) was highly abundant and, since
masses of intact IPCs and MIPCs do not overlap, was suitable for class-specific profiling by
PIS as described below.
Ion trap MS3 spectrum of [Cer - H2O]- with m/z 772.6 was similar to MS3 spectra of
the corresponding ceramide fragments of IPC species, described above (data not shown). long
chain base phosphate fragment ions were detected at m/z 390.2, 362.3, 347.2 and 344.3 and
corresponded to [LCBP18:0;3 - H2O + CO]-, [LCBP18:0;3 - H2O]-, [LCBP18:0;3 - H3NO]-
and [LCBP18:0;3 - 2H2O]-, respectively. Two FA related fragment ions were detected at m/z
411.3 and 365.4, corresponding to [FA26:0;1 + O]- and [FA26:0;1 - CH2O]-, respectively
(data not shown). MS3 analysis of MIPC species from the sur2∆ and scs7∆ mutants produced
similar spectra as obtained for the IPC species from these mutants (data not shown). Thus,
MS3 analysis of the abundant [Cer - H2O]- fragment elucidated the structure of the ceramide
backbone of MIPC species in a similar way, as was demonstrated above for IPC species
(Table 5).
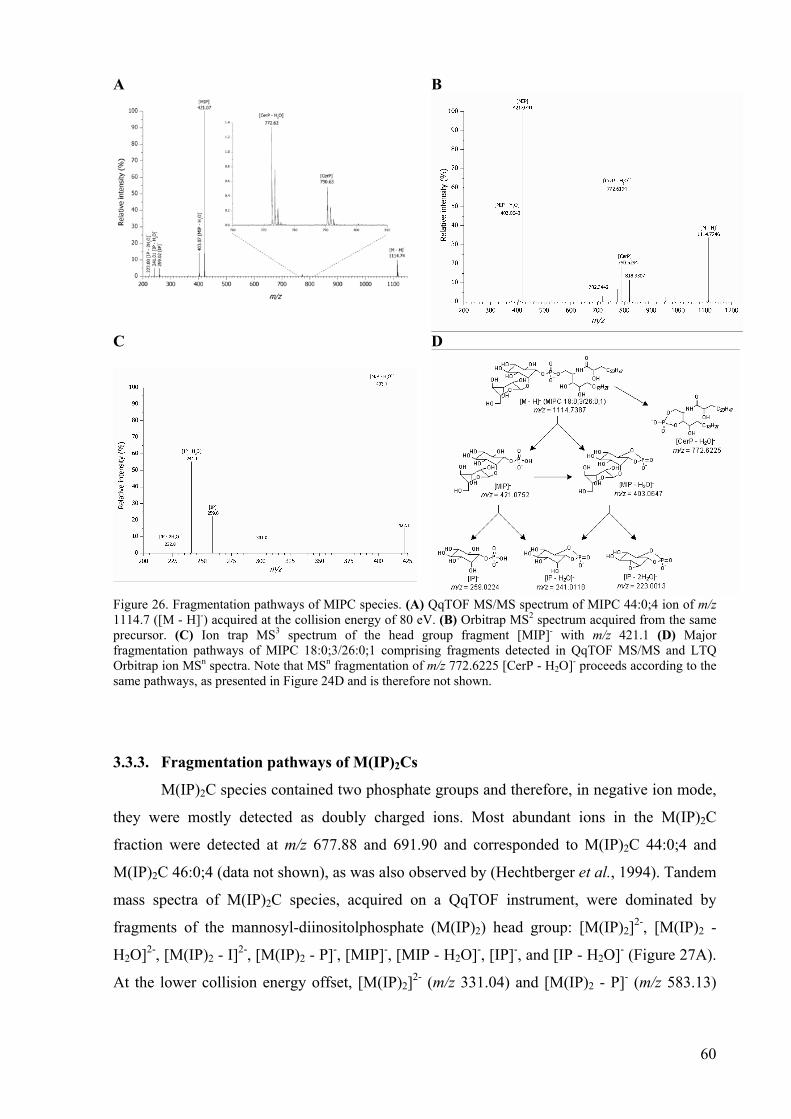
60
A B
C
D
Figure 26. Fragmentation pathways of MIPC species. (A) QqTOF MS/MS spectrum of MIPC 44:0;4 ion of m/z 1114.7 ([M - H]-) acquired at the collision energy of 80 eV. (B) Orbitrap MS2 spectrum acquired from the same precursor. (C) Ion trap MS3 spectrum of the head group fragment [MIP]- with m/z 421.1 (D) Major fragmentation pathways of MIPC 18:0;3/26:0;1 comprising fragments detected in QqTOF MS/MS and LTQ Orbitrap ion MSn spectra. Note that MSn fragmentation of m/z 772.6225 [CerP - H2O]- proceeds according to the same pathways, as presented in Figure 24D and is therefore not shown.
3.3.3. Fragmentation pathways of M(IP)2Cs
M(IP)2C species contained two phosphate groups and therefore, in negative ion mode,
they were mostly detected as doubly charged ions. Most abundant ions in the M(IP)2C
fraction were detected at m/z 677.88 and 691.90 and corresponded to M(IP)2C 44:0;4 and
M(IP)2C 46:0;4 (data not shown), as was also observed by (Hechtberger et al., 1994). Tandem
mass spectra of M(IP)2C species, acquired on a QqTOF instrument, were dominated by
fragments of the mannosyl-diinositolphosphate (M(IP)2) head group: [M(IP)2]2-, [M(IP)2 -
H2O]2-, [M(IP)2 - I]2-, [M(IP)2 - P]-, [MIP]-, [MIP - H2O]-, [IP]-, and [IP - H2O]- (Figure 27A).
At the lower collision energy offset, [M(IP)2]2- (m/z 331.04) and [M(IP)2 - P]- (m/z 583.13)

61
were most abundant (Figure 27B), whereas at the higher collision energy offset the
fragmentation mainly yielded [IP - H2O]- (m/z 241.01).
A
B
C
D
Figure 27. Fragmentation pathways of M(IP)2C species. (A) QqTOF MS/MS spectrum of M(IP)2C 44:0;4 ion having m/z 677.9 ([M - 2H]2-) acquired at the collision energy of 52 eV. The charges of ions are indicated in brakets. (B) The intensity of fragment ions yielded from the M(IP)2C 44:0;4 species ([M - 2H]2-) plotted against the collision energy offset. (C) Orbitrap MS3 spectrum of M(IP)2C 44:0;4 species ([M - 2H]2-) with m/z 677.8781. (D) Major fragmentation pathways of M(IP)2C species based on the fragments identified by QqTOF MS/MS and LTQ Orbitrap MSn. MS3 fragmentation of m/z 772.6225 [CerP - H2O]- produced the same set of fragments as shown in Figure 24D. MS3 fragmentation of [Cer]- yielded two FA specific fragment ions [FA26:0;1 + O]- and [FA26:0;1 - CH2O]- (data not shown).
Orbitrap MS2 and ion trap MS2 spectra of the M(IP)2C species indicated that [M(IP)2 -
P]-, [M(IP)2]2-, [M(IP)2 - H2O]2- and [IP - H2O]- fragments were directly produced from the
precursor (Figure 27C) by neutral loss of singly charged head group fragments. The fragment
ion with m/z 1114.7316 was produced by cleaving [IP - H2O]- (m/z 241.0114) fragment off the
doubly charged precursor yielding [M - 2H - 241]-. Loss of the head group as [M(IP)2 - P]-
(m/z 583.1256) and [M(IP)2 - H2O]- (m/z 645.0815) yielded the ceramide-phosphate m/z
772.6190 ([CerP - H2O]-) and the ceramide m/z 710.6637 ([Cer]-) fragment ions, respectively
(Figure 27C, D).
Further ion trap MS3 fragmentation of [M(IP)2]2- mainly produced [M(IP)2 - P]- that
subsequently yielded [IP - H2O]- with m/z 241.0 (data not shown). Hence, [M(IP)2 - P]- was
produced via at least two independent pathways, which eventually produced the [IP - H2O]-
62
fragment (Figure 27D). MS3 analysis of the ceramide backbone fragment ion [CerP - H2O]-
with m/z 772.6 produced long chain base phosphate and FA related fragments, similar to IPC
and MIPC species (data not shown). MS3 analysis of the [Cer]- fragment yielded an abundant
acyl anion of the amide-linked FA with m/z 411.4 ([FA26:0;1 + O]-) and its neutral loss
product with m/z 365.4 ([FA26:0;1 - CH2O]-) (data not shown).
Taken together, we observed strong similarity between the fragmentation pathways of
molecular anions of all three classes of inositol-containing sphingolipids and their subtypes.
Collision-induced dissociation of precursors on a QqTOF instrument produced fragment ions
in which charged phosphate group(s) was (were) attached to the inositol-containing head
group, rather than to the ceramide backbone. In QqTOF spectra, ceramide-related fragments
were hardly detectable at the collision energy offset required to cleave the precursor ions,
although they were readily detectable in the corresponding ion trap spectra. In the linear
collision cell of a QqTOF instrument, multiple-collision fragmentation promoted neutral loss
of the ceramide backbone leaving a net negative charge at the head group. Therefore stable
ceramide backbone fragments, such as [FA26:0;1 + O]- , were abundant in ion trap mass
spectra, however they were hardly detectable in spectra acquired on the QqTOF instrument.
Importantly, ion trap MS2 fragmentation of molecular anions of species of all three yeast
sphingolipid classes yielded abundant [CerP]- and [CerP - H2O]- fragments, paving the way
for the characterization of their molecular composition via MS3 fragmentation. Thus,
molecular profiling of sphingolipids was most effectively achieved by combining the
complementary mass spectrometric approaches: QqTOF MS/MS lent itself to rapid class-
specific profiling, whereas ion trap MSn enabled the structural elucidation of the ceramide
backbone in individual molecular species (Table 5).
3.3.4. Profiling of sphingolipids in yeasts
We used m/z of the abundant fragment ions specific for each sphingolipid class for
profiling lipid extracts by the method of MPIS (Ekroos et al., 2002). The extracts were first
subjected to mild alkaline hydrolysis, which destroyed glycerophospholipids. Within each
sphingolipid class of S. cerevisiae, we detected several species that differed by the total
number of carbon atoms and hydroxyl groups in their ceramide-backbone (Table 6). The
ceramide backbone of the most abundant species of IPCs, MIPCs and M(IP)2Cs comprised 44
or 46 carbon atoms and four hydroxyl groups, which agreed well with previous observations
(Gaigg et al., 2001; Hechtberger et al., 1994; Young et al., 2002). Since M(IP)2C species
were detected as doubly charged ions, unit mass resolution of the analytical quadrupole was
insufficient to fully resolve their isotopic peaks. However, their identification was further
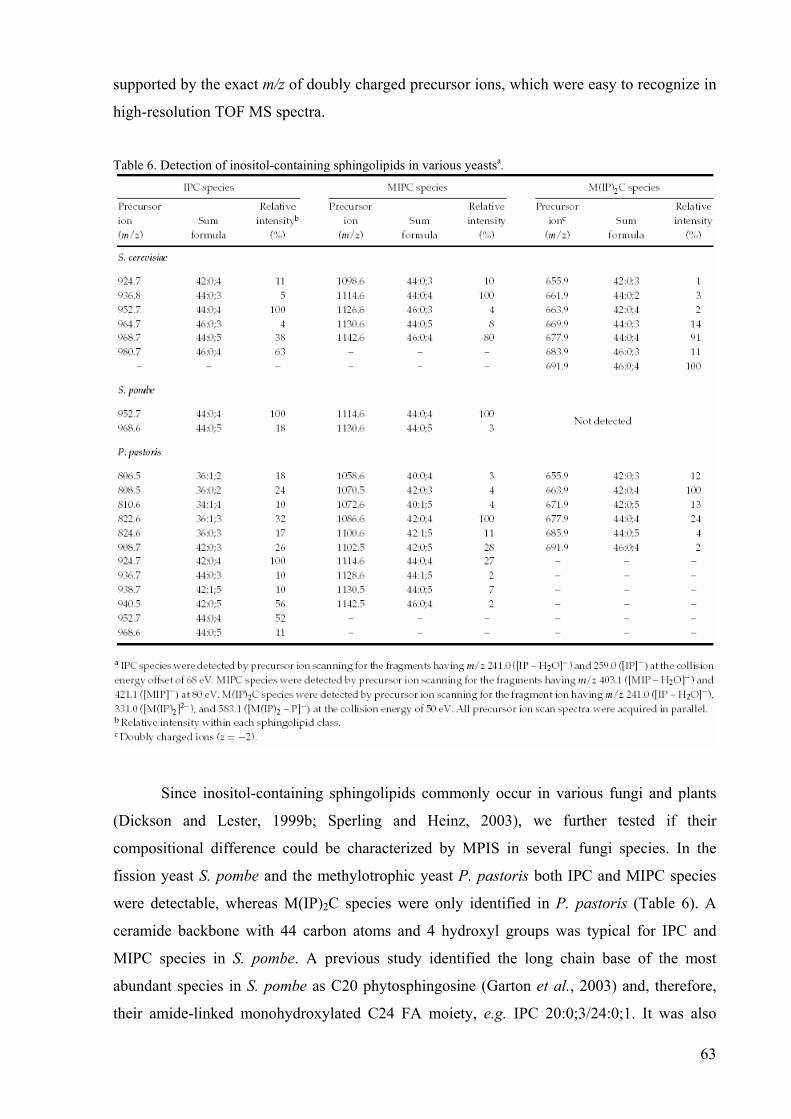
63
supported by the exact m/z of doubly charged precursor ions, which were easy to recognize in
high-resolution TOF MS spectra.
Table 6. Detection of inositol-containing sphingolipids in various yeastsa.
Since inositol-containing sphingolipids commonly occur in various fungi and plants
(Dickson and Lester, 1999b; Sperling and Heinz, 2003), we further tested if their
compositional difference could be characterized by MPIS in several fungi species. In the
fission yeast S. pombe and the methylotrophic yeast P. pastoris both IPC and MIPC species
were detectable, whereas M(IP)2C species were only identified in P. pastoris (Table 6). A
ceramide backbone with 44 carbon atoms and 4 hydroxyl groups was typical for IPC and
MIPC species in S. pombe. A previous study identified the long chain base of the most
abundant species in S. pombe as C20 phytosphingosine (Garton et al., 2003) and, therefore,
their amide-linked monohydroxylated C24 FA moiety, e.g. IPC 20:0;3/24:0;1. It was also
64
reported that S. pombe synthesizes sphingolipids with monounsaturated C20 sphingosine long
chain base (Garton et al., 2003), however, no such species were detected among IPC and
MIPC species in this work.
The sum formula of inositol-containing sphingolipids in P. pastoris strongly varied
(Table 6), especially within the IPC class. P. pastoris mainly synthesized species with a
ceramide backbone of 42 carbon atoms and four hydroxyl groups, whereas in S. cerevisiae
and S. pombe, species with 44 carbon atoms and four hydroxyl groups were most abundant.
Taken together, rapid and accurate profiling of the sphingolipid composition in several fungi
organisms suggested that MPIS is a valuable tool for elucidating molecular details of
sphingolipid biosynthesis.
3.3.5. Simultaneous profiling of sphingolipids and glycerophospholipids
Ion trapping capabilities (Chernushevich, 2000) of a QqTOF mass spectrometers
enable the simultaneous acquisition of precursor ion spectra for a large number of fragment
ions. We previously demonstrated that MPIS could rapidly decipher the molecular
composition of glycerophospholipid species (Ekroos et al., 2002; Ekroos et al., 2003). Upon
collision-induced dissociation, molecular anions of glycerophospholipids produced acyl
anions of their FA moieties (Hsu and Turk, 2000a; Hsu and Turk, 2000b; Hsu and Turk,
2000c; Hsu and Turk, 2001). If masses of all possible acyl anions were selected for MPIS,
individual lipid species would be detected in the two precursor ion scans, corresponding to
their FA moieties. Since m/z of acyl anions of FAs do not overlap with m/z of characteristic
fragments of sphingolipids, we reasoned that glycerophospholipids and sphingolipids could be
simultaneously and independently detected in total lipid extracts.
As a case study, we analyzed a total lipid extract from S. cerevisiae. The m/z of six
acyl anions of the most common saturated and monounsaturated FAs, with 14, 16 and 18
carbon atoms, and 11 yeast sphingolipid fragment ions were selected (Figure 28). Since
optimal collision energy depends on the lipid class, we increased the collision energy linearly
from 48 eV at m/z 650 to 82 eV at m/z 1150. 17 simultaneously acquired precursor ion scan
spectra were interpreted by Lipid Profiler software and all prominent peaks automatically
identified (Figure 28). Thus, MPIS enabled simultaneous and specific profiling of IPC, MIPC,
M(IP)2C species, together with the identification of the molecular composition of individual
species of PIs, PAs, PEs, PSs, and PCs. Similar results were obtained on total lipid extracts of
S. pombe and P. pastoris (data not shown).
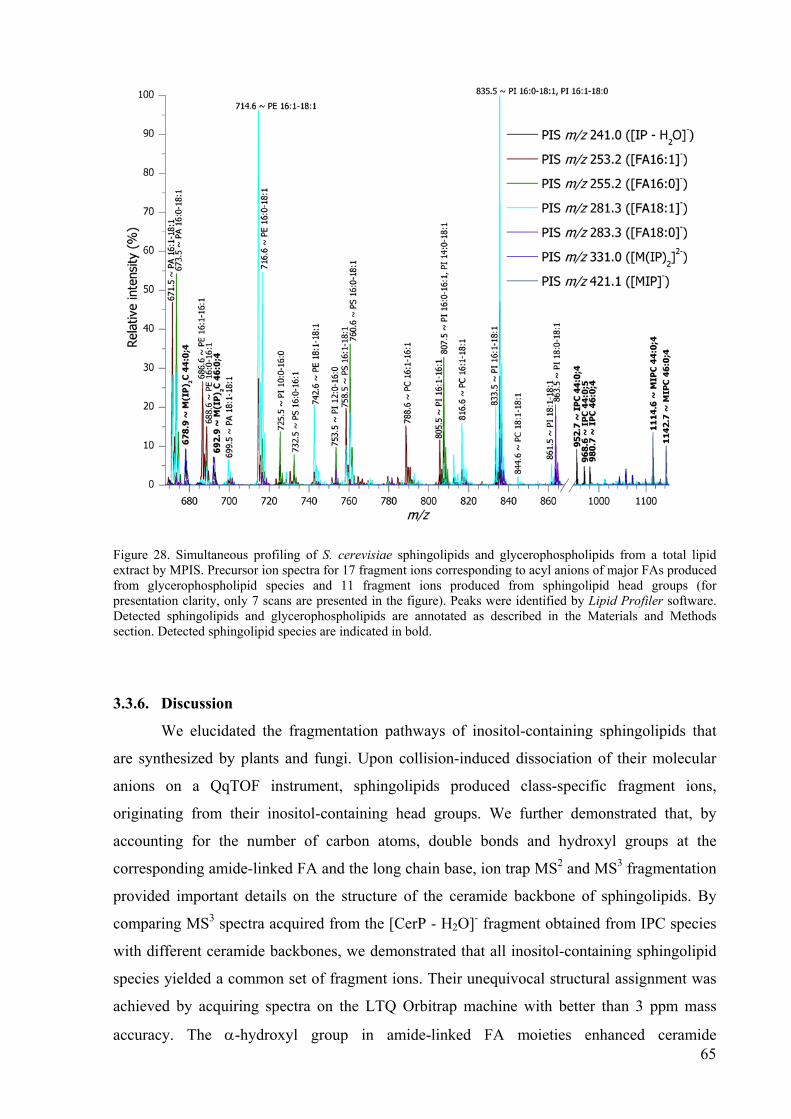
65
Figure 28. Simultaneous profiling of S. cerevisiae sphingolipids and glycerophospholipids from a total lipid extract by MPIS. Precursor ion spectra for 17 fragment ions corresponding to acyl anions of major FAs produced from glycerophospholipid species and 11 fragment ions produced from sphingolipid head groups (for presentation clarity, only 7 scans are presented in the figure). Peaks were identified by Lipid Profiler software. Detected sphingolipids and glycerophospholipids are annotated as described in the Materials and Methods section. Detected sphingolipid species are indicated in bold.
3.3.6. Discussion
We elucidated the fragmentation pathways of inositol-containing sphingolipids that
are synthesized by plants and fungi. Upon collision-induced dissociation of their molecular
anions on a QqTOF instrument, sphingolipids produced class-specific fragment ions,
originating from their inositol-containing head groups. We further demonstrated that, by
accounting for the number of carbon atoms, double bonds and hydroxyl groups at the
corresponding amide-linked FA and the long chain base, ion trap MS2 and MS3 fragmentation
provided important details on the structure of the ceramide backbone of sphingolipids. By
comparing MS3 spectra acquired from the [CerP - H2O]- fragment obtained from IPC species
with different ceramide backbones, we demonstrated that all inositol-containing sphingolipid
species yielded a common set of fragment ions. Their unequivocal structural assignment was
achieved by acquiring spectra on the LTQ Orbitrap machine with better than 3 ppm mass
accuracy. The α-hydroxyl group in amide-linked FA moieties enhanced ceramide

66
fragmentation and produced additional fragments specific for their long chain bases (Table 5).
The m/z of sphingolipid fragment ions, derived from their head groups, did not overlap with
the m/z of acyl anions of common FAs, which enabled simultaneous profiling of sphingolipids
and glycerophospholipids in total lipid extracts. As a case study, we compared the
sphingolipid profiles in the yeasts S. cerevisiae, S. pombe and P. pastoris, which revealed that
the composition of their ceramide backbones was remarkably diverse (Table 6).
3.4. AUTOMATED LIPID ANALYSIS BY ROBOTIC SAMPLE INFUSION
Sample infusion is a technically demanding and limiting factor for high throughput
mass spectrometry-driven lipidomics. Several techniques based on (high) pressure delivery
systems combined with electrospray ionization have been applied to automate and improve
the analytical throughput. Two approaches are commonly used to deliver analytes for
electrospray ionization and mass analysis; flow injection and liquid chromatography. By flow
injection, sample material is automatically aspirated, transferred through a non-retaining
transfer column to the electrospray capillary (Han and Gross, 1994; Han et al., 2006; Kerwin
et al., 1994; Koivusalo et al., 2001; Liebisch et al., 1999; Liebisch et al., 2004). By liquid
chromatography, aspirated sample material is transferred through a chromatographic column
which can separate lipids into classes or species prior to the subsequent electrospray
ionization (Hermansson et al., 2005; Merrill et al., 2005). Common to the flow injection and
liquid chromatography systems are the need for high flow rates (µl/min) and high ionization
voltages (2-4 kV), which inherently reduce sensitivity and promote in-source fragmentation of
analytes. Furthermore, these systems require time-consuming washing and pre-conditioning
of the columns to minimize sample carryover.
Recently, an automated nanoelectrospray robot, the NanoMate, was developed
(Schultz et al., 2000). This robotic infusion device consists of a conventional 96-well plate, a
rack of 96 disposable and conductive pipette tips, and an ESI Chip (Figure 29). The ESI Chip
is fabricated from a monolithic silicon substrate, and today contains a 20x20 array of nozzles
offering 400 analyses per microchip. The robotic infusion device is capable of sampling from
the 96-well plate and infusing each sample in rapid succession, providing relatively high
sample throughput. The low nanoliter/minute flow rates allow for very small sample
consumption and improved sensitivity compared to devices operating with higher flow rates.
Furthermore, a dedicated pipette tip and nozzle are used for each sample, thus eliminating the
potential for carryover. This device has been applied in the fields of proteomics (Zhang and
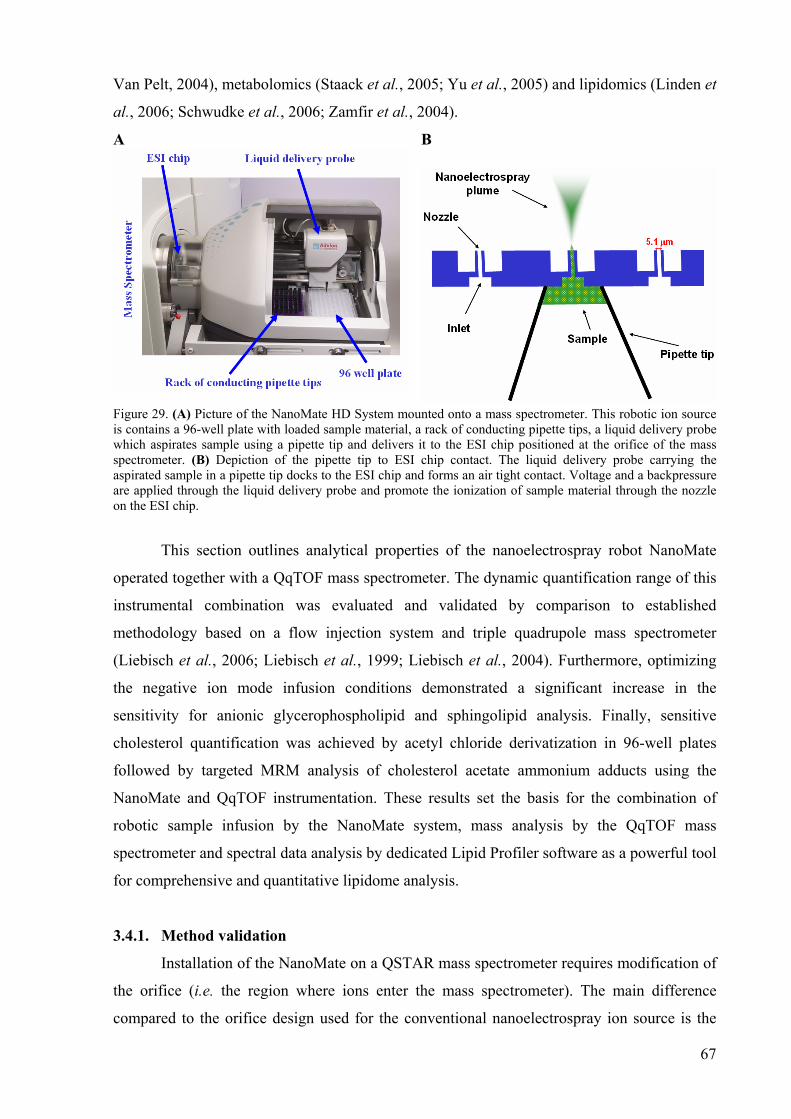
67
Van Pelt, 2004), metabolomics (Staack et al., 2005; Yu et al., 2005) and lipidomics (Linden et
al., 2006; Schwudke et al., 2006; Zamfir et al., 2004).
A
B
Figure 29. (A) Picture of the NanoMate HD System mounted onto a mass spectrometer. This robotic ion source is contains a 96-well plate with loaded sample material, a rack of conducting pipette tips, a liquid delivery probe which aspirates sample using a pipette tip and delivers it to the ESI chip positioned at the orifice of the mass spectrometer. (B) Depiction of the pipette tip to ESI chip contact. The liquid delivery probe carrying the aspirated sample in a pipette tip docks to the ESI chip and forms an air tight contact. Voltage and a backpressure are applied through the liquid delivery probe and promote the ionization of sample material through the nozzle on the ESI chip.
This section outlines analytical properties of the nanoelectrospray robot NanoMate
operated together with a QqTOF mass spectrometer. The dynamic quantification range of this
instrumental combination was evaluated and validated by comparison to established
methodology based on a flow injection system and triple quadrupole mass spectrometer
(Liebisch et al., 2006; Liebisch et al., 1999; Liebisch et al., 2004). Furthermore, optimizing
the negative ion mode infusion conditions demonstrated a significant increase in the
sensitivity for anionic glycerophospholipid and sphingolipid analysis. Finally, sensitive
cholesterol quantification was achieved by acetyl chloride derivatization in 96-well plates
followed by targeted MRM analysis of cholesterol acetate ammonium adducts using the
NanoMate and QqTOF instrumentation. These results set the basis for the combination of
robotic sample infusion by the NanoMate system, mass analysis by the QqTOF mass
spectrometer and spectral data analysis by dedicated Lipid Profiler software as a powerful tool
for comprehensive and quantitative lipidome analysis.
3.4.1. Method validation
Installation of the NanoMate on a QSTAR mass spectrometer requires modification of
the orifice (i.e. the region where ions enter the mass spectrometer). The main difference
compared to the orifice design used for the conventional nanoelectrospray ion source is the
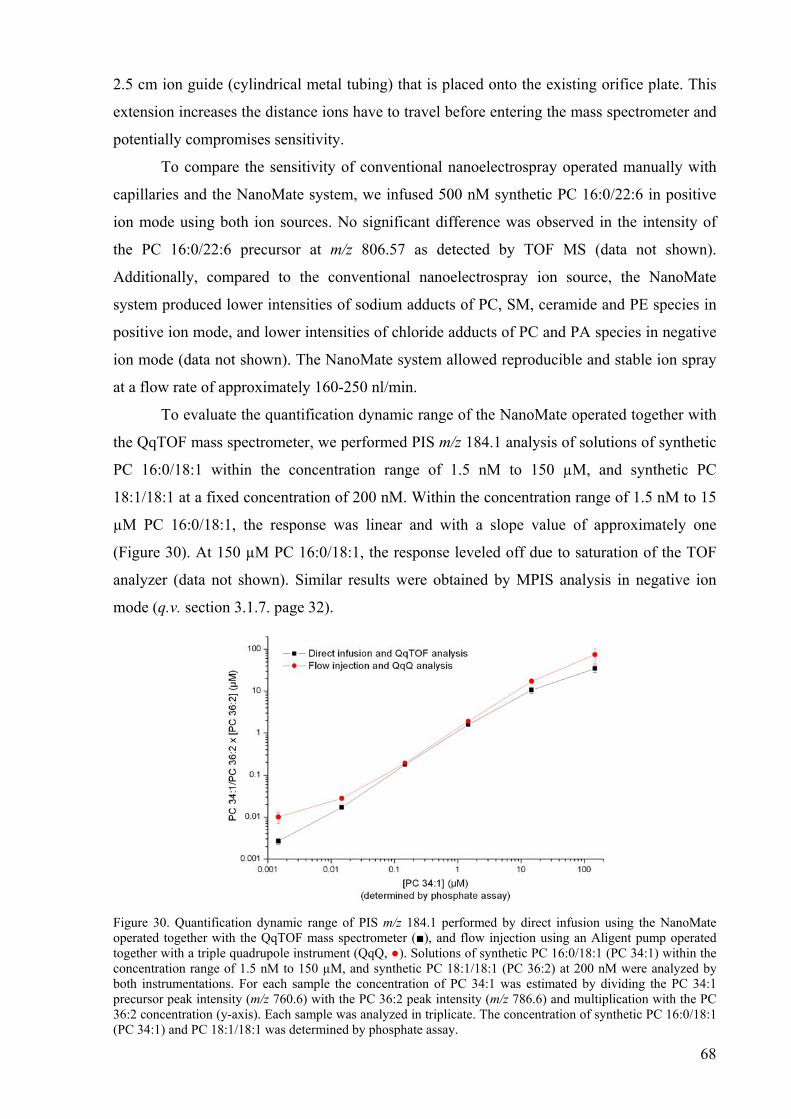
68
2.5 cm ion guide (cylindrical metal tubing) that is placed onto the existing orifice plate. This
extension increases the distance ions have to travel before entering the mass spectrometer and
potentially compromises sensitivity.
To compare the sensitivity of conventional nanoelectrospray operated manually with
capillaries and the NanoMate system, we infused 500 nM synthetic PC 16:0/22:6 in positive
ion mode using both ion sources. No significant difference was observed in the intensity of
the PC 16:0/22:6 precursor at m/z 806.57 as detected by TOF MS (data not shown).
Additionally, compared to the conventional nanoelectrospray ion source, the NanoMate
system produced lower intensities of sodium adducts of PC, SM, ceramide and PE species in
positive ion mode, and lower intensities of chloride adducts of PC and PA species in negative
ion mode (data not shown). The NanoMate system allowed reproducible and stable ion spray
at a flow rate of approximately 160-250 nl/min.
To evaluate the quantification dynamic range of the NanoMate operated together with
the QqTOF mass spectrometer, we performed PIS m/z 184.1 analysis of solutions of synthetic
PC 16:0/18:1 within the concentration range of 1.5 nM to 150 µM, and synthetic PC
18:1/18:1 at a fixed concentration of 200 nM. Within the concentration range of 1.5 nM to 15
µM PC 16:0/18:1, the response was linear and with a slope value of approximately one
(Figure 30). At 150 µM PC 16:0/18:1, the response leveled off due to saturation of the TOF
analyzer (data not shown). Similar results were obtained by MPIS analysis in negative ion
mode (q.v. section 3.1.7. page 32).
Figure 30. Quantification dynamic range of PIS m/z 184.1 performed by direct infusion using the NanoMate operated together with the QqTOF mass spectrometer (■), and flow injection using an Aligent pump operated together with a triple quadrupole instrument (QqQ, ●). Solutions of synthetic PC 16:0/18:1 (PC 34:1) within the concentration range of 1.5 nM to 150 µM, and synthetic PC 18:1/18:1 (PC 36:2) at 200 nM were analyzed by both instrumentations. For each sample the concentration of PC 34:1 was estimated by dividing the PC 34:1 precursor peak intensity (m/z 760.6) with the PC 36:2 peak intensity (m/z 786.6) and multiplication with the PC 36:2 concentration (y-axis). Each sample was analyzed in triplicate. The concentration of synthetic PC 16:0/18:1 (PC 34:1) and PC 18:1/18:1 was determined by phosphate assay.
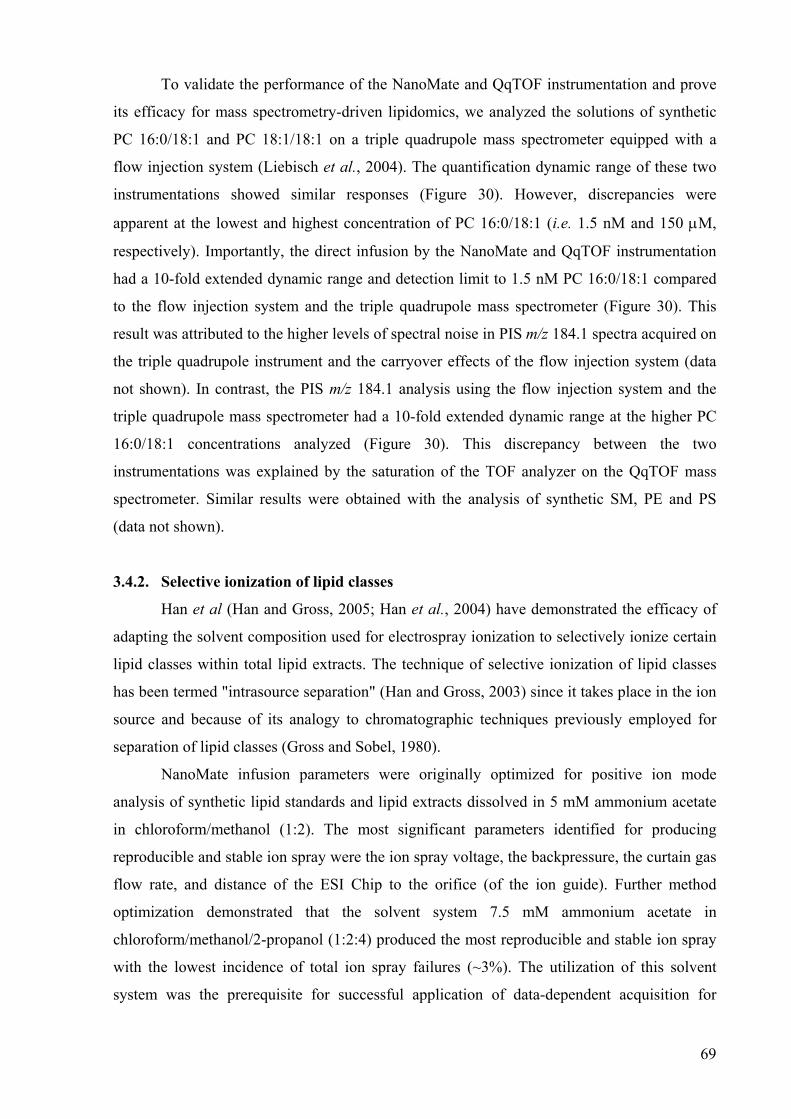
69
To validate the performance of the NanoMate and QqTOF instrumentation and prove
its efficacy for mass spectrometry-driven lipidomics, we analyzed the solutions of synthetic
PC 16:0/18:1 and PC 18:1/18:1 on a triple quadrupole mass spectrometer equipped with a
flow injection system (Liebisch et al., 2004). The quantification dynamic range of these two
instrumentations showed similar responses (Figure 30). However, discrepancies were
apparent at the lowest and highest concentration of PC 16:0/18:1 (i.e. 1.5 nM and 150 µM,
respectively). Importantly, the direct infusion by the NanoMate and QqTOF instrumentation
had a 10-fold extended dynamic range and detection limit to 1.5 nM PC 16:0/18:1 compared
to the flow injection system and the triple quadrupole mass spectrometer (Figure 30). This
result was attributed to the higher levels of spectral noise in PIS m/z 184.1 spectra acquired on
the triple quadrupole instrument and the carryover effects of the flow injection system (data
not shown). In contrast, the PIS m/z 184.1 analysis using the flow injection system and the
triple quadrupole mass spectrometer had a 10-fold extended dynamic range at the higher PC
16:0/18:1 concentrations analyzed (Figure 30). This discrepancy between the two
instrumentations was explained by the saturation of the TOF analyzer on the QqTOF mass
spectrometer. Similar results were obtained with the analysis of synthetic SM, PE and PS
(data not shown).
3.4.2. Selective ionization of lipid classes
Han et al (Han and Gross, 2005; Han et al., 2004) have demonstrated the efficacy of
adapting the solvent composition used for electrospray ionization to selectively ionize certain
lipid classes within total lipid extracts. The technique of selective ionization of lipid classes
has been termed "intrasource separation" (Han and Gross, 2003) since it takes place in the ion
source and because of its analogy to chromatographic techniques previously employed for
separation of lipid classes (Gross and Sobel, 1980).
NanoMate infusion parameters were originally optimized for positive ion mode
analysis of synthetic lipid standards and lipid extracts dissolved in 5 mM ammonium acetate
in chloroform/methanol (1:2). The most significant parameters identified for producing
reproducible and stable ion spray were the ion spray voltage, the backpressure, the curtain gas
flow rate, and distance of the ESI Chip to the orifice (of the ion guide). Further method
optimization demonstrated that the solvent system 7.5 mM ammonium acetate in
chloroform/methanol/2-propanol (1:2:4) produced the most reproducible and stable ion spray
with the lowest incidence of total ion spray failures (~3%). The utilization of this solvent
system was the prerequisite for successful application of data-dependent acquisition for

70
lipidome analysis since this method cannot tolerate pronounced fluctuations and premature
breakdown of the ion spray (Schwudke et al., 2006).
For negative ion mode MPIS analysis, 7.5 mM ammonium acetate in
chloroform/methanol/2-propanol (1:2:4) produced reproducible and stable ion spray, which
allowed the non-selective ionization of PA, PE, PS, PG, PI and PC as acetate adducts (q.v.
Figure 13A page 34). However, compared to the sensitive analysis of PC species in positive
ion mode, the inclusion of ammonium acetate reduced the sensitivity of negative ion mode
analysis of PC species 21-fold (data not shown). Hence, various solvent compositions without
ammonium salts and applicable infusion conditions were sought to improve the sensitivity
and allow the selective ionization of lipid classes.
Three solvent systems without ammonium salts were found to significantly improve
the sensitivity of the negative ion mode analysis, allow the selective ionization of lipid
classes, and produce reproducible ion spray: i) chloroform/methanol/2-propanol (1:2:4), ii)
0.05% saturated methylamine (CH3NH2) in chloroform/methanol/2-propanol (1:2:4) and iii)
0.05% saturated methylamine in methanol. Saturated methylamine solutions were prepared by
purging gaseous methylamine into methanol.
A systematic comparison of ionization efficiencies of glycerophospholipid and
sphingolipid classes was performed by infusing a comprehensive mixture of the
glycerophospholipid species; PA 17:0/17:0, PS 17:0/17:0, PI 17:0/17:0, PG 17:0/17:0,
cardiolipin (Car) 14:0/14:0/14:0/14:0, PE 17:0/17:0 and PC 18:3/18:3, and sphingolipid
species; Cer 18:1;2/17:0;0, galactosylceramide (GalCer) 18:1;2/12:0;0, SM 18:1;2/17:0;0,
IPC 18:0;2/26:0;0, MIPC 18:0;2/26:0;0 and M(IP)2C 18:0;2/26:0;0 dissolved in the above-
mentioned solvent systems (Figure 31).
Infusing the comprehensive lipid mixture dissolved in chloroform/methanol/2-
propanol (1:2:4) improved the ionization efficiency of the anionic glycerophospholipid
classes PA, PS, PI, PG and cardiolipin, but had no impact on the ionization efficiency of PE,
and reduced the ionization efficiency of PC compared to the conventional infusion with 7.5
mM ammonium acetate in chloroform/methanol/2-propanol (1:2:4) (Figure 31B). This solvent
composition increased the ionization efficiency of the PG and cardiolipin species 30-fold, and
increased the ionization efficiency of PA, PS and PI species 11-fold. The ionization
efficiencies of sphingolipids were also improved; most significant were the 11-fold increase
in IPC and M(IP)2C ionization efficiency, and the 6-fold increase in MIPC ionization
efficiency (Figure 31C).
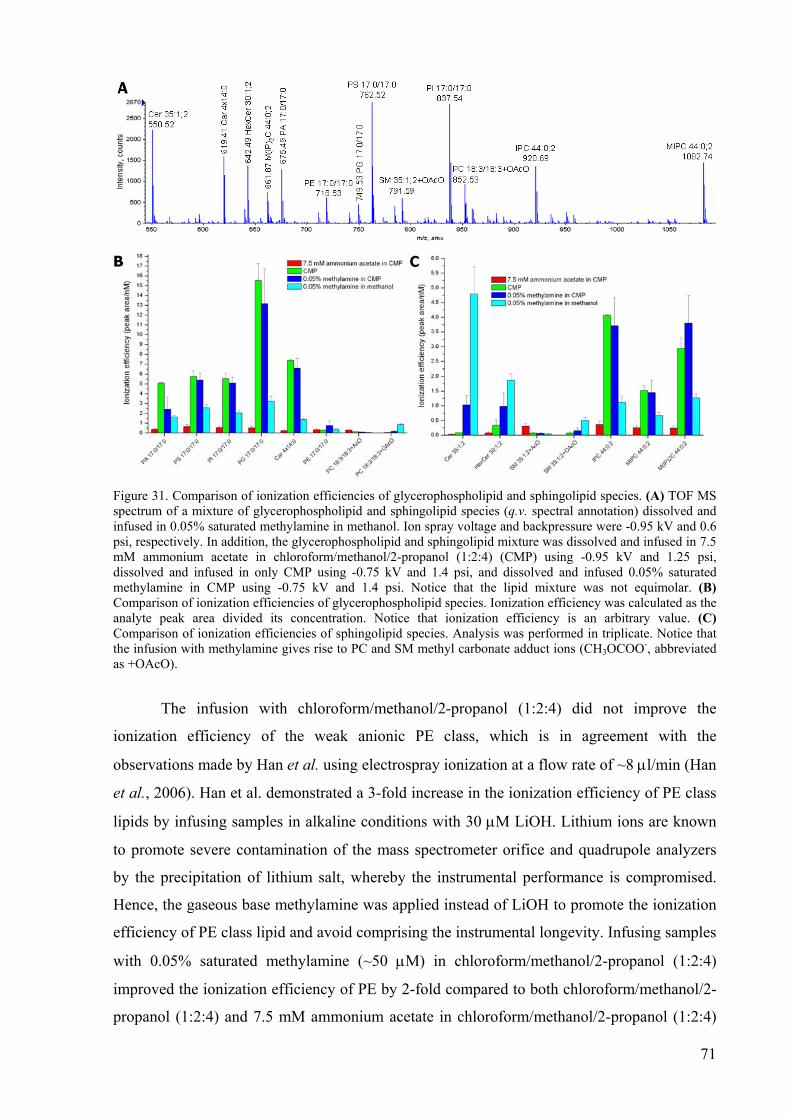
71
Figure 31. Comparison of ionization efficiencies of glycerophospholipid and sphingolipid species. (A) TOF MS spectrum of a mixture of glycerophospholipid and sphingolipid species (q.v. spectral annotation) dissolved and infused in 0.05% saturated methylamine in methanol. Ion spray voltage and backpressure were -0.95 kV and 0.6 psi, respectively. In addition, the glycerophospholipid and sphingolipid mixture was dissolved and infused in 7.5 mM ammonium acetate in chloroform/methanol/2-propanol (1:2:4) (CMP) using -0.95 kV and 1.25 psi, dissolved and infused in only CMP using -0.75 kV and 1.4 psi, and dissolved and infused 0.05% saturated methylamine in CMP using -0.75 kV and 1.4 psi. Notice that the lipid mixture was not equimolar. (B) Comparison of ionization efficiencies of glycerophospholipid species. Ionization efficiency was calculated as the analyte peak area divided its concentration. Notice that ionization efficiency is an arbitrary value. (C) Comparison of ionization efficiencies of sphingolipid species. Analysis was performed in triplicate. Notice that the infusion with methylamine gives rise to PC and SM methyl carbonate adduct ions (CH3OCOO-, abbreviated as +OAcO).
The infusion with chloroform/methanol/2-propanol (1:2:4) did not improve the
ionization efficiency of the weak anionic PE class, which is in agreement with the
observations made by Han et al. using electrospray ionization at a flow rate of ~8 µl/min (Han
et al., 2006). Han et al. demonstrated a 3-fold increase in the ionization efficiency of PE class
lipids by infusing samples in alkaline conditions with 30 µM LiOH. Lithium ions are known
to promote severe contamination of the mass spectrometer orifice and quadrupole analyzers
by the precipitation of lithium salt, whereby the instrumental performance is compromised.
Hence, the gaseous base methylamine was applied instead of LiOH to promote the ionization
efficiency of PE class lipid and avoid comprising the instrumental longevity. Infusing samples
with 0.05% saturated methylamine (~50 µM) in chloroform/methanol/2-propanol (1:2:4)
improved the ionization efficiency of PE by 2-fold compared to both chloroform/methanol/2-
propanol (1:2:4) and 7.5 mM ammonium acetate in chloroform/methanol/2-propanol (1:2:4)

72
(Figure 31B). More remarkable was the 40-fold and 12-fold increase in ionization efficiency
of ceramide and galactosylceramide, respectively, compared to the 7.5 mM ammonium
acetate in chloroform/methanol/2-propanol (1:2:4) (Figure 31C).
Further optimization of the ionization conditions prompted infusion of sample material
dissolved in 0.05% saturated methylamine in methanol. Using this solvent composition
showed a striking 188-fold and 24-fold increase in the ionization efficiency of ceramide and
galactosylceramide, respectively, compared to infusion in 7.5 mM ammonium acetate in
chloroform/methanol/2-propanol (1:2:4) (Figure 31C). The ionization efficiencies of all other
glycerophospholipid and sphingolipid classes in 0.05% saturated methylamine in methanol
were superior to those of infusing with 7.5 mM ammonium acetate in chloroform/methanol/2-
propanol (1:2:4), but produce approximately 2-fold lower ionization efficiencies than infusion
in chloroform/methanol/2-propanol (1:2:4) with or without methylamine (Figure 31B,C).
Interestingly, the infusion in the presence of methylamine rendered PC and SM
species detectable as methyl carbonate (CH3OCOO-) adduct ions (Figure 31B,C) (Zhang and
Reid, 2006). The alkaline conditions created by the methylamine induced the chemical
reaction where atmospheric CO2 reacts with methanol (CH3OH) to form methyl carbonate.
Compared to the ionization efficacy of PC and SM acetate adduct ion obtained by infusion
with 7.5 mM ammonium acetate, the ionization efficiency of PC and SM methyl carbonate
adduct were 2-fold higher in the methylamine containing infusate. Further evaluation of the
properties of the infusion with 0.05% saturated methylamine in methanol demonstrated that
neutral DAG species formed methyl carbonate adduct ions applicable for molecular profiling
by MPIS (data not shown).
3.4.3. Cholesterol quantification by MRM analysis
Cholesterol is an abundant and essential component of mammalian cell membranes.
Recently, structural characterization of this poorly ionizable neutral lipid species by
electrospray ionization mass spectrometry was achieved indirectly by chemically acetylating
cholesterol to form cholesterol acetate, which subsequently allowed the sensitive ionization of
cholesterol acetate as an ammonium adduct (Liebisch et al., 2006). MS/MS analysis of the
cholesterol acetate ammonium adduct ion produced a single structure-specific fragment with
m/z 369.36 through the neutral loss of acetic acid and ammonia (Figure 32A). Spiking total
lipid extracts with stable isotope labeled cholesterol (i.e. D7 or D6) and performing MRM
analysis on a triple quadrupole instrument allowed the absolute quantification of cholesterol
in biological extracts (Liebisch et al., 2006). The conversion of cholesterol into cholesterol

73
acetate was performed by harsh acetyl chloride (CH3COCl) derivatization in sealed glass
tubes.
This cholesterol quantification method was further optimized for MRM analysis using
the NanoMate and QqTOF instrumentation. Infusion of synthetic cholesterol acetate dissolved
in 7.5 mM ammonium acetate in chloroform/methanol/2-propanol (1:2:4) rendered
cholesterol acetate detectable as an ammonium adduct with m/z 446.40 which upon collision-
induced dissociation released the structure specific-fragment ion with m/z 369.36 (Figure
32A). MRM analysis was performed by repeated MS/MS analysis of the ammonium adducts
of cholesterol acetate (m/z 446.4) and internal standard cholesterol-D6 acetate (m/z 452.4)
produced by acetyl chloride derivatization (Figure 32B). The absolute quantification of
cholesterol was performed by dividing the peak intensity of the cholesterol acetate fragment
ion at m/z 369.36 with the peak intensity of the cholesterol-D6 acetate fragment ion at m/z
375.40 followed by multiplication with the spiked amount of cholesterol-D6 (similar to the
quantification of glycerophospholipids, q.v. section 3.1.7. page 32).
Figure 32. (A) Outline of the cholesterol quantification procedure. Cholesterol was converted to cholesterol acetate by acetyl chloride derivatization, followed by sample infusion in positive ion mode which allowed the ionization of cholesterol acetate as an ammonium adduct having m/z 446.40. Collision-induced dissociation of the cholesterol acetate ammonium adduct produced the structure specific fragment ion with m/z 369.36 (B) MS/MS spectra of ammonium adducts of cholesterol acetate (m/z 446.4) and cholesterol-D6 acetate (m/z 452.4) obtained by MRM analysis of a derivatizised mixture of cholesterol and cholesterol-D6 (both at 1 µM in the original sample). MRM analysis was performed by repeated MS/MS analysis of m/z 446.4 and MS/MS analysis m/z 452.4. Each MS/MS experiment was recorded for 1 second, thereby producing a cycle time of 2 seconds. In total, 300 cycles were acquired (i.e. 10 minutes of analysis) for the shown TOF MS spectra.

74
A major disadvantage of acetyl chloride derivatization is the concomitant production
of hydrogen chloride (HCl) which corrodes the expensive vacuum centrifugation apparatus
used for evaporating the derivatization reagent prior to the mass spectrometric analysis. This
disadvantage could in principle be circumvented by evaporating the derivatization reagent
using a stream of nitrogen. However, this approach limits the sample throughput since no
suitable device exists for evaporating more than 20 samples at a time. This prompted the
evaluation of the efficacy of performing the acetyl chloride derivatization in the
polypropylene-based 96-well plates used for storing samples prior to infusion by the
NanoMate (Figure 29A page 67).
The acetyl chloride derivatization method was performed in 96-well plates by adding
50 µl of acetyl chloride/chloroform (1:5) to dried sample material, and leaving the reaction
mixture unsealed at room temperature in the fume hood. The reaction mixture was evaporated
after 2 hours. Sample material was dissolved in 7.5 mM ammonium acetate in
chloroform/methanol/2-propanol (1:2:4) and subjected to MRM analysis as outlined above.
Initial experiments demonstrated no significant difference in the production of cholesterol
acetate by the acetyl chloride derivatization in 96-well plates or in glass vials (data not
shown). To evaluate the dynamic quantification range of this adapted cholesterol
quantification method, we performed MRM analysis of solutions of cholesterol-D6 within the
concentration range of 1 nM to 10 µM subjected to acetyl chloride derivatization either in a
96-well plate or glass vials (Figure 33). After the derivatization, samples were dried by
vacuum centrifugation, and dissolved in 7.5 mM ammonium acetate in
chloroform/methanol/2-propanol (1:2:4) containing synthetic cholesterol acetate at a fixed
concentration of 1 µM. The response of the cholesterol-D6 acetate fragment ion with m/z
375.40 was linear within the concentration range of 1 nM to 10 µM (Figure 33), and showed
that the detection limit of the method to was approximately 1 nM cholesterol, which equal the
detection limit for sterols achieved using atmospheric pressure photoionization (Lembcke et
al., 2005). In comparison, a detection limit of 500 nM cholesterol was previously reported for
this method when operated on a triple quadrupole instrument (Liebisch et al., 2006). The
improved sensitivity of the QqTOF-based MRM analysis primarily reflects the high mass
resolution of the TOF analyzer which allows specific detection of the cholesterol acetate
derived fragment ion, and secondarily a longer acquisition time. Importantly, the dynamic
quantification range was independent of whether acetyl chloride derivatization was performed
in a 96-well plate or in glass vials (Figure 33). Furthermore, comparing the peak intensities of
the cholesterol-D6 and cholesterol acetate fragment ions at m/z 375.40 and 369.38,
respectively, showed that 93% of cholesterol-D6 was converted into cholesterol-D6 acetate.

75
In conclusion, the cholesterol quantification method previously developed by Liebisch
et al. (Liebisch et al., 2006) was successfully adapted to the 96-well plate format applicable
for the NanoMate infusion device. Equally important, performing the acetyl chloride
derivatization in a 96-well plate allowed the remaining sample material after PIS m/z 184.1
and MPIS analysis to be used for cholesterol analysis, thus reducing the sample amount
required for total lipidome analysis (q.v. section 3.5.).
Figure 33. Quantification dynamic range the MRM analysis of derivatized cholesterol. 50 µl aliquots of solutions of cholesterol-D6 within the concentration range of 1 nM to 10 µM were loaded in either a 96-well plate or in glass vials. Samples in the 96-well plate were evaporated by vacuum centrifugation, whereas samples in glass vials were evaporated using a stream of nitrogen. Dried samples were added 50 µl acetyl chloride/chloroform (1:5). Samples in 96-well plates were left unsealed at room temperature for 2 hours. Samples in glass vials were left at room temperature for 1 hour followed by evaporation using a stream of nitrogen. Dried sample were dissolved in 50 µl of 7.5 mM ammonium acetate in chloroform/methanol/2-propanol (1:2:4) containing 1 µM synthetic cholesterol acetate. Samples were automatically analyzed by 10 minutes MRM analysis (q.v. Figure 32B). Absolute peak intensities of cholesterol-D6 and cholesterol acetate fragment ions with m/z 375.40 and 369.38, respectively, are plotted as a function of cholesterol-D6 concentration. Sample analysis was performed in triplicate.
3.4.4. Discussion
The basis for a novel high-throughput orientated lipid analysis methodology has been
established by combining an automated nanoelectrospray robot, the NanoMate, with mass
analysis by a QqTOF mass spectrometer and spectral data analysis by dedicated Lipid Profiler
software. It was demonstrated that this method design allowed sensitive mass analysis in both
positive and negative ion mode equivalent to established methodology based on flow injection
system and triple quadrupole mass spectrometry (Figure 30) (Liebisch et al., 2004). The
robotic infusion device allowed the selective ionization of lipid classes with a concomitant
increase in sensitivity by modification of the solvent composition, the ion spray voltage and

76
backpressure (Figure 31), which could not be achieved by conventional nanoelectrospray
operated with capillaries (personal observation). The combined NanoMate and QqTOF
instrumentation offered direct quantification of the molecular constituents of a wide range of
lipid classes with detection limits in the order of 1-10 nM (Figure 30, Figure 33 and Figure 14
page 36). Notably, a preferential and enhanced ionization of all anionic glycerophospholipid
and sphingolipid species was achieved by omitting ammonium acetate in the infusate, or
replacing ammonium acetate with methylamine (3.4.2. page 69). Interestingly, the alkaline
infusion conditions with methylamine resulted in the specific ionization of ceramide and
hexosylceramide species, a 2-fold increase in the PE ionisation, and promoted the detection of
PC, SM and DAG species methyl carbonate adduct ions.
The total analysis time for the PIS m/z 184.1 (and MRM analysis of cholesterol
acetate) was 1.3 minute per sample by the flow injection system and triple quadrupole mass
spectrometer (Liebisch et al., 2004). Although this instrumental setup allowed rapid mass
analysis of lipid extracts and was high-throughput orientated, this technique required multiple
injections of the same lipid extract to separately analyze each lipid class by lipid class-specific
precursor ion scans (PE, PG, PI, etc.). Typically, 20 µl sample was required per injection
(Liebisch et al., 2004). In addition, the poor resolution power of the triple quadrupole
instrument may complicate the analysis of complex sample material where the presence of
isobaric lipid species, matrix-derived precursor ions and elevated noise levels may reduce the
efficacy of the methodology.
In comparison, the time for PIS m/z 184.1 analysis by the combination of the
NanoMate and the QqTOF mass spectrometer was set to 18 minutes per sample, thus
providing a lower analytical throughput for the PIS m/z 184.1 analysis than the flow injection
system and triple quadrupole instrumentation. However, the PIS m/z 184.1 analysis by the
QqTOF instrumentation allowed precursor ion scans to be recorded with high mass resolution
thereby producing almost noise-free precursor ion scans and improving the specificity and
sensitivity (Ekroos et al., 2002). Importantly, the direct infusion by the NanoMate and a 30
minutes QqTOF-driven MPIS analysis in negative ion mode allowed the molecular
glycerophospholipid species of all classes (PA, PG, PI, PS, PE, PC) to be quantified from a
single injection of 10 µl sample (q.v. Figure 31, and section 3.1. page 21). In addition,
sensitive cholesterol analysis was achieved by acetyl chloride derivatization followed by
targeted MRM analysis of cholesterol acetate ammonium adducts. Furthermore, the targeted
MRM analysis was applicable for the quantification of low abundant ceramide,
hexosylceramide and lactosylceramide species in total lipid extract (data not shown, q.v.
section 3.5. below).
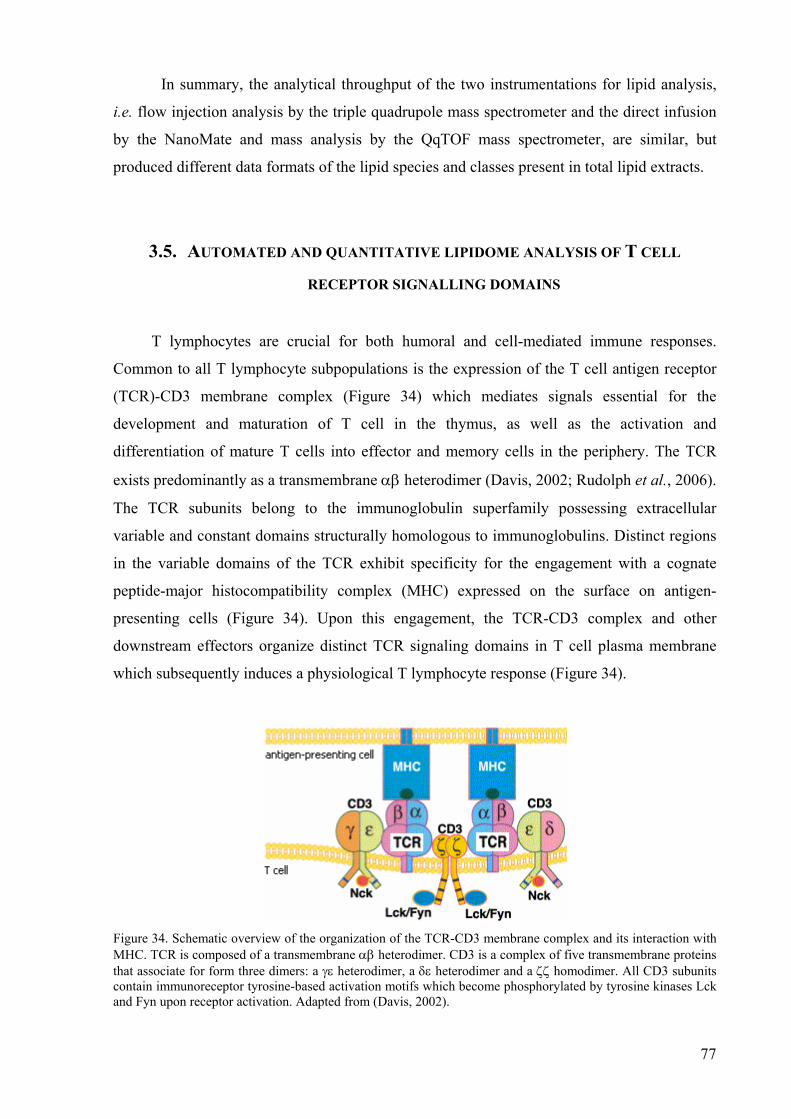
77
In summary, the analytical throughput of the two instrumentations for lipid analysis,
i.e. flow injection analysis by the triple quadrupole mass spectrometer and the direct infusion
by the NanoMate and mass analysis by the QqTOF mass spectrometer, are similar, but
produced different data formats of the lipid species and classes present in total lipid extracts.
3.5. AUTOMATED AND QUANTITATIVE LIPIDOME ANALYSIS OF T CELL
RECEPTOR SIGNALLING DOMAINS
T lymphocytes are crucial for both humoral and cell-mediated immune responses.
Common to all T lymphocyte subpopulations is the expression of the T cell antigen receptor
(TCR)-CD3 membrane complex (Figure 34) which mediates signals essential for the
development and maturation of T cell in the thymus, as well as the activation and
differentiation of mature T cells into effector and memory cells in the periphery. The TCR
exists predominantly as a transmembrane αβ heterodimer (Davis, 2002; Rudolph et al., 2006).
The TCR subunits belong to the immunoglobulin superfamily possessing extracellular
variable and constant domains structurally homologous to immunoglobulins. Distinct regions
in the variable domains of the TCR exhibit specificity for the engagement with a cognate
peptide-major histocompatibility complex (MHC) expressed on the surface on antigen-
presenting cells (Figure 34). Upon this engagement, the TCR-CD3 complex and other
downstream effectors organize distinct TCR signaling domains in T cell plasma membrane
which subsequently induces a physiological T lymphocyte response (Figure 34).
Figure 34. Schematic overview of the organization of the TCR-CD3 membrane complex and its interaction with MHC. TCR is composed of a transmembrane αβ heterodimer. CD3 is a complex of five transmembrane proteins that associate for form three dimers: a γε heterodimer, a δε heterodimer and a ζζ homodimer. All CD3 subunits contain immunoreceptor tyrosine-based activation motifs which become phosphorylated by tyrosine kinases Lck and Fyn upon receptor activation. Adapted from (Davis, 2002).
78
Several studies have implicated lipid rafts in the formation of TCR signaling domains.
Lipid rafts are envisaged as lateral assemblies enriched in cholesterol and sphingolipids that
form liquid-ordered membrane microdomains into which specific classes of proteins can
partition (Simons and Vaz, 2004). Biochemical studies of the composition of detergent-
resistant membranes from T cells have indicated several effectors of the TCR signaling
machinery to be lipid raft-associated, including the TCR ζ-chain and protein tyrosine kinases
(Montixi et al., 1998; Zhang et al., 1998). However, the analysis of detergent-resistant
membranes is prone to artifacts due to the unspecific detergent extraction of membrane and
non-equilibrium density gradient centrifugation. Thus, an alternative method based on
immunoisolation using antibody-labeled magnetic beads was developed for the isolation of
TCR signaling machinery (Harder and Kuhn, 2000). This method showed that effectors of the
TCR signaling machinery were specifically recruited into TCR signaling domains in a time
dependent manner (Harder and Kuhn, 2000; Hartgroves et al., 2003). Further evidence for a
functional significance of specific lipid-lipid interactions mediating a putative lipid raft
environment within the TCR signaling domains was obtained by two-photon laser scanning
microscopy of the membrane-order probe Laurdan. This approach revealed an elevated order
of the T cell plasma membrane in the vicinity of activated TCRs (Gaus et al., 2005).
However, these biochemical and microscopy-based methods have provided no insight into the
specific molecular lipid composition assumed to compose the TCR signaling domains in
living cells.
To specifically address the molecular lipid composition of TCR signaling domains, we
immunoisolated plasma membrane fragments enriched in activated TCR-CD3 complexes
from Jurkat cells as previously described (Harder and Kuhn, 2000; Hartgroves et al., 2003).
Immunoisolates were subjected to lipid extraction and analyzed using a repertoire of the
developed mass spectrometric methodology presented throughout this thesis. This
methodology revealed a specific lipid composition with elevated levels of cholesterol, SM
species, and PC species with short chain and saturated FA moieties in the immunoisolated
TCR signaling domains.
3.5.1. Overview of analytical strategy
Plasma membrane fragments enriched in the TCR-CD3 complex were immunoisolated
by forming conjugates between αCD3 antibody-coated magnetic beads and Jurkat cells, an
immortalized T lymphoma cell line. Conjugates were warmed to 37°C for 10 min, inducing
the formation of TCR signaling domains as previously described (Harder and Kuhn, 2000;
Hashemi et al., 1996; Lowin-Kropf et al., 1998). Subsequently, the conjugates were
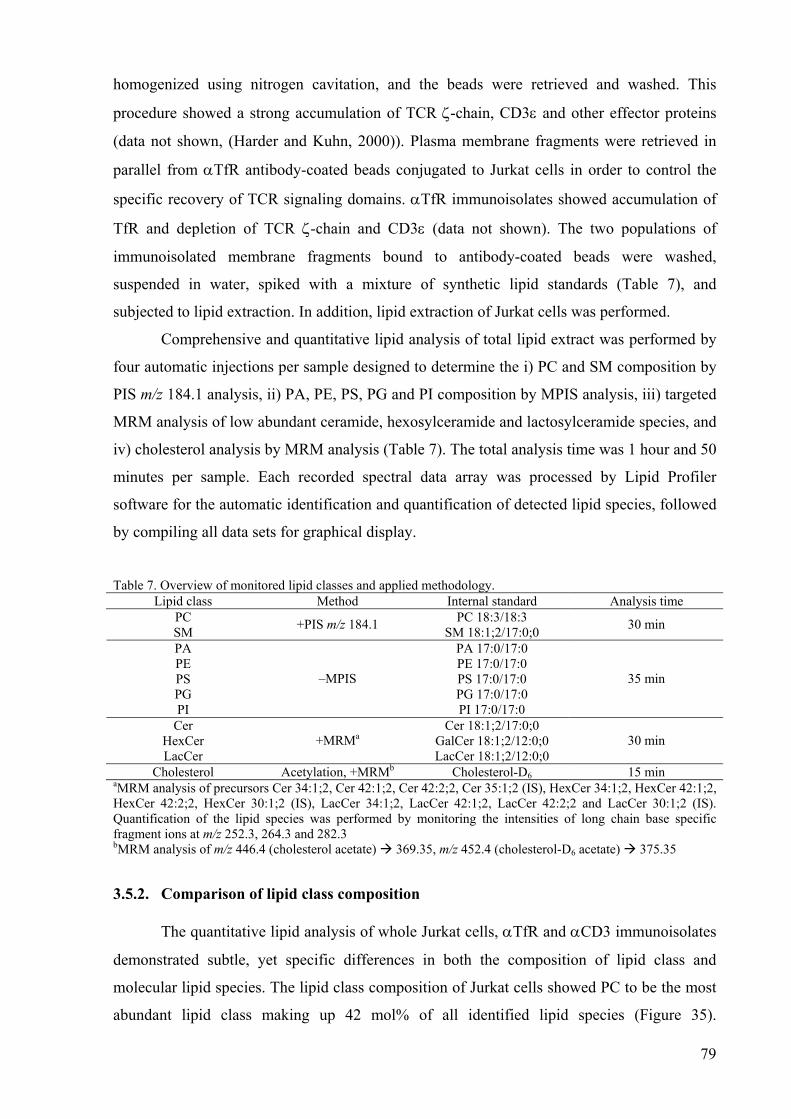
79
homogenized using nitrogen cavitation, and the beads were retrieved and washed. This
procedure showed a strong accumulation of TCR ζ-chain, CD3ε and other effector proteins
(data not shown, (Harder and Kuhn, 2000)). Plasma membrane fragments were retrieved in
parallel from αTfR antibody-coated beads conjugated to Jurkat cells in order to control the
specific recovery of TCR signaling domains. αTfR immunoisolates showed accumulation of
TfR and depletion of TCR ζ-chain and CD3ε (data not shown). The two populations of
immunoisolated membrane fragments bound to antibody-coated beads were washed,
suspended in water, spiked with a mixture of synthetic lipid standards (Table 7), and
subjected to lipid extraction. In addition, lipid extraction of Jurkat cells was performed.
Comprehensive and quantitative lipid analysis of total lipid extract was performed by
four automatic injections per sample designed to determine the i) PC and SM composition by
PIS m/z 184.1 analysis, ii) PA, PE, PS, PG and PI composition by MPIS analysis, iii) targeted
MRM analysis of low abundant ceramide, hexosylceramide and lactosylceramide species, and
iv) cholesterol analysis by MRM analysis (Table 7). The total analysis time was 1 hour and 50
minutes per sample. Each recorded spectral data array was processed by Lipid Profiler
software for the automatic identification and quantification of detected lipid species, followed
by compiling all data sets for graphical display.
Table 7. Overview of monitored lipid classes and applied methodology.
Lipid class Method Internal standard Analysis time PC PC 18:3/18:3 SM +PIS m/z 184.1 SM 18:1;2/17:0;0 30 min
PA PA 17:0/17:0 PE PE 17:0/17:0 PS PS 17:0/17:0 PG PG 17:0/17:0 PI
–MPIS
PI 17:0/17:0
35 min
Cer Cer 18:1;2/17:0;0 HexCer GalCer 18:1;2/12:0;0 LacCer
+MRMa LacCer 18:1;2/12:0;0
30 min
Cholesterol Acetylation, +MRMb Cholesterol-D6 15 min aMRM analysis of precursors Cer 34:1;2, Cer 42:1;2, Cer 42:2;2, Cer 35:1;2 (IS), HexCer 34:1;2, HexCer 42:1;2, HexCer 42:2;2, HexCer 30:1;2 (IS), LacCer 34:1;2, LacCer 42:1;2, LacCer 42:2;2 and LacCer 30:1;2 (IS). Quantification of the lipid species was performed by monitoring the intensities of long chain base specific fragment ions at m/z 252.3, 264.3 and 282.3 bMRM analysis of m/z 446.4 (cholesterol acetate) 369.35, m/z 452.4 (cholesterol-D6 acetate) 375.35
3.5.2. Comparison of lipid class composition
The quantitative lipid analysis of whole Jurkat cells, αTfR and αCD3 immunoisolates
demonstrated subtle, yet specific differences in both the composition of lipid class and
molecular lipid species. The lipid class composition of Jurkat cells showed PC to be the most
abundant lipid class making up 42 mol% of all identified lipid species (Figure 35).
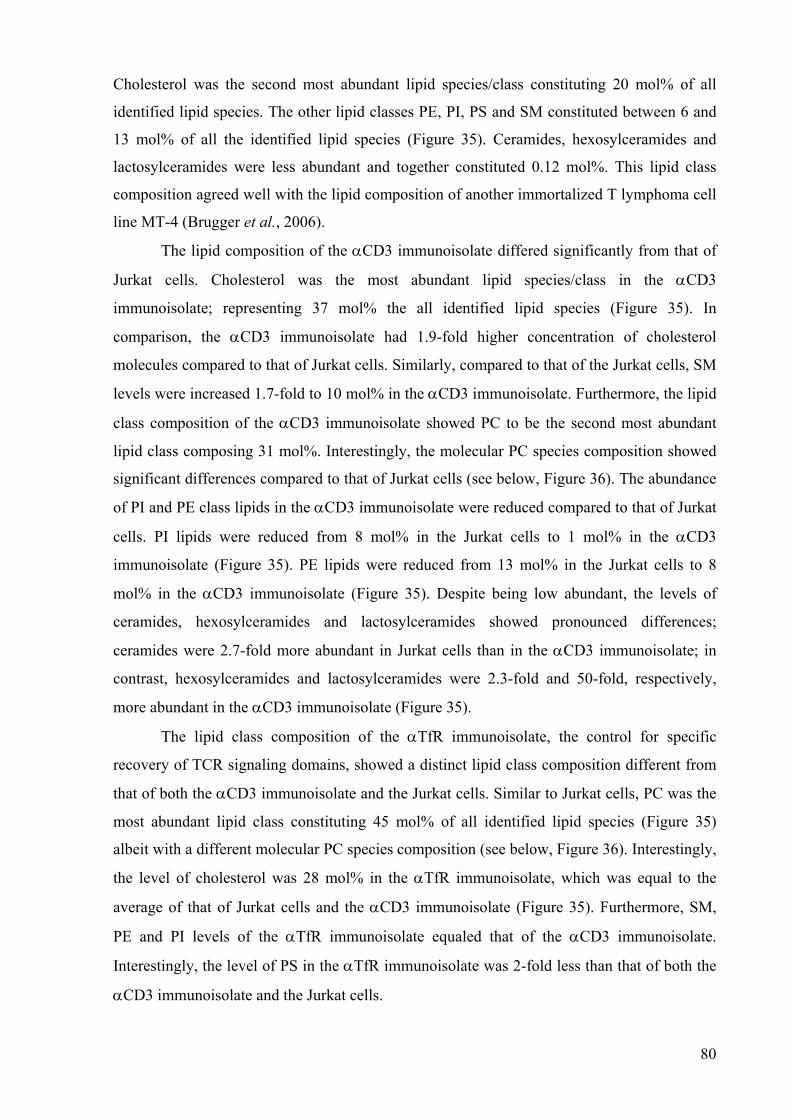
80
Cholesterol was the second most abundant lipid species/class constituting 20 mol% of all
identified lipid species. The other lipid classes PE, PI, PS and SM constituted between 6 and
13 mol% of all the identified lipid species (Figure 35). Ceramides, hexosylceramides and
lactosylceramides were less abundant and together constituted 0.12 mol%. This lipid class
composition agreed well with the lipid composition of another immortalized T lymphoma cell
line MT-4 (Brugger et al., 2006).
The lipid composition of the αCD3 immunoisolate differed significantly from that of
Jurkat cells. Cholesterol was the most abundant lipid species/class in the αCD3
immunoisolate; representing 37 mol% the all identified lipid species (Figure 35). In
comparison, the αCD3 immunoisolate had 1.9-fold higher concentration of cholesterol
molecules compared to that of Jurkat cells. Similarly, compared to that of the Jurkat cells, SM
levels were increased 1.7-fold to 10 mol% in the αCD3 immunoisolate. Furthermore, the lipid
class composition of the αCD3 immunoisolate showed PC to be the second most abundant
lipid class composing 31 mol%. Interestingly, the molecular PC species composition showed
significant differences compared to that of Jurkat cells (see below, Figure 36). The abundance
of PI and PE class lipids in the αCD3 immunoisolate were reduced compared to that of Jurkat
cells. PI lipids were reduced from 8 mol% in the Jurkat cells to 1 mol% in the αCD3
immunoisolate (Figure 35). PE lipids were reduced from 13 mol% in the Jurkat cells to 8
mol% in the αCD3 immunoisolate (Figure 35). Despite being low abundant, the levels of
ceramides, hexosylceramides and lactosylceramides showed pronounced differences;
ceramides were 2.7-fold more abundant in Jurkat cells than in the αCD3 immunoisolate; in
contrast, hexosylceramides and lactosylceramides were 2.3-fold and 50-fold, respectively,
more abundant in the αCD3 immunoisolate (Figure 35).
The lipid class composition of the αTfR immunoisolate, the control for specific
recovery of TCR signaling domains, showed a distinct lipid class composition different from
that of both the αCD3 immunoisolate and the Jurkat cells. Similar to Jurkat cells, PC was the
most abundant lipid class constituting 45 mol% of all identified lipid species (Figure 35)
albeit with a different molecular PC species composition (see below, Figure 36). Interestingly,
the level of cholesterol was 28 mol% in the αTfR immunoisolate, which was equal to the
average of that of Jurkat cells and the αCD3 immunoisolate (Figure 35). Furthermore, SM,
PE and PI levels of the αTfR immunoisolate equaled that of the αCD3 immunoisolate.
Interestingly, the level of PS in the αTfR immunoisolate was 2-fold less than that of both the
αCD3 immunoisolate and the Jurkat cells.
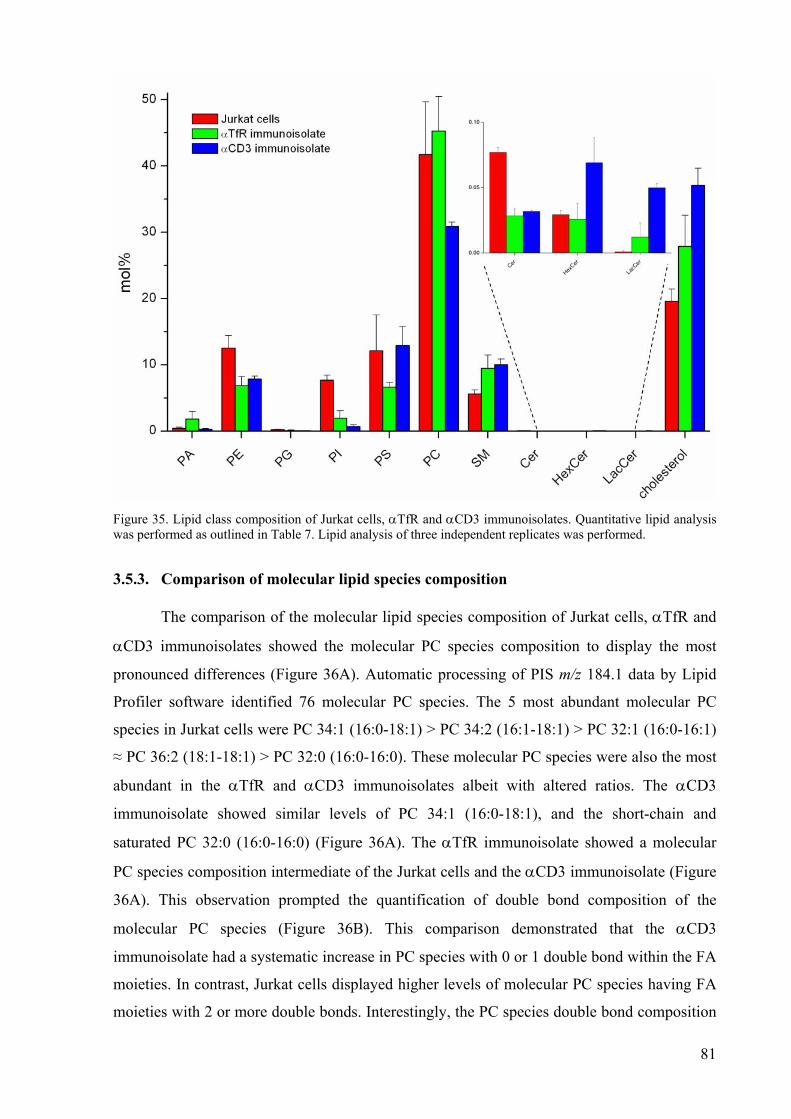
81
Figure 35. Lipid class composition of Jurkat cells, αTfR and αCD3 immunoisolates. Quantitative lipid analysis was performed as outlined in Table 7. Lipid analysis of three independent replicates was performed.
3.5.3. Comparison of molecular lipid species composition
The comparison of the molecular lipid species composition of Jurkat cells, αTfR and
αCD3 immunoisolates showed the molecular PC species composition to display the most
pronounced differences (Figure 36A). Automatic processing of PIS m/z 184.1 data by Lipid
Profiler software identified 76 molecular PC species. The 5 most abundant molecular PC
species in Jurkat cells were PC 34:1 (16:0-18:1) > PC 34:2 (16:1-18:1) > PC 32:1 (16:0-16:1)
≈ PC 36:2 (18:1-18:1) > PC 32:0 (16:0-16:0). These molecular PC species were also the most
abundant in the αTfR and αCD3 immunoisolates albeit with altered ratios. The αCD3
immunoisolate showed similar levels of PC 34:1 (16:0-18:1), and the short-chain and
saturated PC 32:0 (16:0-16:0) (Figure 36A). The αTfR immunoisolate showed a molecular
PC species composition intermediate of the Jurkat cells and the αCD3 immunoisolate (Figure
36A). This observation prompted the quantification of double bond composition of the
molecular PC species (Figure 36B). This comparison demonstrated that the αCD3
immunoisolate had a systematic increase in PC species with 0 or 1 double bond within the FA
moieties. In contrast, Jurkat cells displayed higher levels of molecular PC species having FA
moieties with 2 or more double bonds. Interestingly, the PC species double bond composition

82
of the αTfR immunoisolate was consistently intermediate of the αCD3 immunoisolate and the
Jurkat cells, thus emphasizing molecular specificity of the αCD3 immunoisolate. Quantitative
evaluation of the distribution of FA chain-length in molecular PC species showed minor, but
systematic differences. PC species of the αCD3 and αTfR immunoisolate had shorter FA
chain-lengths compared to that of Jurkat cells (Figure 36C).
The automatic processing of PIS m/z 184.1 data by Lipid Profiler software identified
16 molecular SM species; the most abundant having the sum composition 34:1;2
corresponding to the species SM 18:1;2/16:0;0 (Figure 36A). Comparison of the molecular
SM composition showed SM 34:1;2 to be specifically enriched in the αCD3 and αTfR
immunoisolates compared to that of Jurkat cells (Figure 36A).
Figure 36. (A) Molecular composition of PC and SM species. (B) Double bond (db) composition of PC species. (C) Composition of total FA chain-length of PC species. All data was compiled from PIS m/z 184.1 analysis of three independent replicates.

83
The results of the MPIS analysis of anionic glycerophospholipid species in negative
ion mode showed differences mainly in lipid class composition (see above, Figure 35). The
automatic processing of MPIS data by Lipid Profiler software identified 29 molecular PE
species (Figure 37A) and 11 molecular PS species (Figure 37B). In-depth analysis of the
molecular PE species composition showed that PE 18:0-18:2 and PE 18:0-18:1 were the
major species in Jurkat cells, αCD3 and αTfR immunoisolates (Figure 37A). The Jurkat cells,
αCD3 and αTfR immunoisolates displayed subtle differences in the PE species composition.
Similar to the PC species of the αCD3 immunoisolate, the molecular PE species showed a
tendency for higher concentrations of species with saturated or mono-unsaturated FA residues
compared to both the Jurkat cells and the αTfR immunoisolate (Figure 37A). Interestingly,
both immunoisolates displayed elevated levels of ether PE species having a polyunsaturated
FA moiety (Figure 37A), similar to that observed in the lipidome of HIV (Brugger et al.,
2006).
The analysis of the molecular PS species composition of Jurkat cells, αCD3 and αTfR
immunoisolates displayed subtle differences (Figure 37B). The species PS 18:0-18:2 and PS
18:0-18:1 were the most abundant, similar to that of the PE class lipids.
Figure 37. (A) Molecular composition of PE species. (B) Molecular composition of PS species. Data was obtained by negative ion mode MPIS analysis.
3.5.4. Discussion
This study indicated that TCR signaling complexes comprise a unique lipid
composition reminiscent of lipid rafts (Simons and Vaz, 2004). TCR signaling complexes,
isolated as αCD3 immunoisolate, were found to be specifically enriched in cholesterol, SM
species and PC species having short- and saturated FA moieties compared to that of Jurkat

84
cells and the αTfR immunoisolate (Figure 35 and Figure 36). In addition, the isolated TCR
signaling complexes displayed significant levels of PS species, and depletion in PI species
and glycerophospholipid species containing polyunsaturated FA moieties. Of particular note
was the finding that TCR signaling domains were not highly enriched in SM species, which
was compensated by increased levels of PC species having short- and saturated FA moieties
(Figure 36). This finding corroborates biophysical results indicating that liquid-ordered
domains can exist in the absence of SM with only cholesterol and PC species having low and
high phase transition temperatures (Veatch and Keller, 2003). The determined lipid
composition of the TCR signaling domains also corroborates recent results demonstrating an
increased order of the plasma membrane in vicinity of activated TCRs (Gaus et al., 2005).
Interestingly, a time-course analysis of the lipid composition of the αCD3 immunoisolate
indicated a specific time-dependent reorganization of lipid species within the TCR signaling
domains (data not shown).
TCR/CD3 signaling is central to the initiation of antigen-specific T cell responses to
pathogens, vaccines, transplanted tissues, tumors, and autoantigens. Hence, elucidating the
earliest events in T cell signaling is critical for a basic understanding of these responses and
thereby advancing efforts to enhance or attenuate T cell responses in vivo. In summary, the
results presented in this section demonstrated the efficacy of the developed mass
spectrometric methodology for advancing our basic understanding of membrane function and
architecture.
4. CONCLUSIONS
During my thesis study, I established methodology for automated and quantitative
analysis of molecular lipid species based on mass spectrometry. From this work a novel high-
throughput methodology for lipidome analysis emerged (Figure 38). The main assets of this
methodology are the use of powerful hybrid mass spectrometers with high mass resolution
combined with the sensitive and automated sample analysis by a nanoelectrospray robot and
dedicated Lipid Profiler software (Figure 38). Comprehensive characterization and
quantification of molecular lipid species was achieved by spiking total lipid extracts with
unique lipid standards, utilizing selective ionization conditions for sample infusion, and
performing structure-specific mass analysis by hybrid QqTOF and linear ion trap-orbitrap
mass spectrometers. The analytical routine allowed the comprehensive characterization and
quantification of molecular glycerophospholipid species, molecular diacylglycerol species

85
(data not shown), molecular sphingolipid species including ceramides, glycosphingolipids and
inositol-containing sphingolipids, and the sterol lipid cholesterol and its acylated derivatives
(data not shown).
The performance of the analytical routine was validated by comparing its dynamic
quantification range to that of established methodology based on triple quandrupole mass
spectrometry (section 3.4.1. page 67). Furthermore, its efficacy for lipidomics projects was
demonstrated by the successful quantitative deciphering of the lipid composition of TCR
signaling domains (section 3.5.), its capacity as tracer technology tool for identifying low
abundant lipid species with unique structural features (Kuerschner et al., 2005), and its
analytical flexibility by charting lipidomes of bacteria, yeast and viruses (data not shown).
Figure 38. Overview of the methodology developed for automated and quantitative lipid analysis.
The developed methodology comprises six consecutive procedures (Figure 38). 1)
sample preparation, 2) two phase lipid extraction to isolate a total lipid extract, 3) automatic
sample infusion by the robotic ion source NanoMate, 4) lipid species specific mass analysis
by either QqTOF or ion trap mass spectrometry, 5) automated identification and
quantification of detected lipid species by Lipid Profiler software, and 6) export of compiled
data arrays for interpretation by conventional or multivariate data analysis.
Although not discussed in detail in this thesis, the initial sample preparation and lipid
extraction often represent the limiting factor for successful and accurate lipidome analysis. Of
particular importance is the use of lipid class-specific internal standards for correcting biased
losses of lipid classes during the extraction procedure and to correct for perturbations of
ionization efficiencies during sample infusion. Equally important is to minimize the co-
extraction of sample matrix components (e.g. sodium salts, protease inhibitors) which can
compromise ion spray stability, impose ion suppression, and promote detection of unspecific

86
precursor ions. For example, the successful characterization and quantification of polar and
low abundant lipid classes such as phosphoinositides and complex sphingolipids relied on
stringent evaluation of the applied lipid extraction conditions for optimizing recovery and
detection (Pettitt et al., 2006). Furthermore, the analysis of highly complex lipidomes, where
the identification and quantification of certain molecular species are ambiguous, can be
improved by reducing sample complexity by preparative TLC or liquid chromatography
(DeLong et al., 2001; Sommer et al., 2006).
The analytical throughput of the methodology was enhanced by integrating the chip-
based nanoelectrospray robot NanoMate and the development of Lipid Profiler software. The
performance of the robotic nanoelectrospray ionization source was optimized to allow
reproducible and sensitive analysis of total lipid extracts (section 3.4.). Equally important, for
negative ion mode analysis the robotic infusion device demonstrated the capacity to
selectively ionize certain lipid classes with enhanced sensitivity upon modification of the
solvent composition used for infusion (section 3.4.2.). The chip-based nanoelectrospray
ionization source allowed low sample consumption (5-10 µl total lipid extract per injection)
and eliminated the potential for carryover effects, inherent to flow injection and liquid
chromatography systems, by infusing each sample with a dedicated pipette tip and nozzle.
A hybrid QqTOF mass spectrometer served as the primary tool for structure-specific
analysis of lipid species. MPIS and targeted MRM analysis were successfully applied for
charting molecular lipid species in total lipid extracts of mammalian, yeast and bacterial
sources. Negative ion mode MPIS analysis was highly efficient and specific for the
comprehensive characterization of molecular glycerophospholipid and diacylglycerol species
based on their release of structure-specific fragment ions upon collision-induced dissociation
(section 3.1.). This approach also allowed the absolute quantification of molecular lipid
species by spiking total lipid extracts with synthetic lipid standards having heptadecanoyl
(17:0)-containing FA moieties, and was demonstrated to have a linear quantification range
from 10 nM to 100 µM. Furthermore, the MPIS method increased the number of detected
species in all lipid classes by an average factor of 1.8, compared to the conventional lipid
class-specific precursor ion scans (Table 1 page 27). The acquisition time was within 35 min
per sample and the approach lent itself to high-throughput lipidomics. The MPIS
methodology increased the scope and precision of the characterization of
glycerophopholipidomes without limiting the analysis throughput, since all required structure-
specific scans were acquired in parallel and rapidly deciphered by the dedicated Lipid Profiler
software. However, the most comprehensive characterization and quantification of individual
glycerophospholipid species, including sn-1/sn-2 positional isomers, required the combination
87
of QqTOF and ion trap mass spectrometry (section 3.2.), which potentially can be
complemented by orifice ozonolysis to determine the localization of double bond in FA
moieties (Thomas et al., 2006). The targeted MRM analysis was an efficient approach for
quantification of cholesterol (after acetyl chloride derivatization) and low abundant
sphingolipid species. This method was used to improve the analytical sensitivity by
optimizing the acquisition time used for detection of structure-specific fragment ions derived
from the targeted lipid precursors.
The most comprehensive characterization of glycerophospholipid species was achieved
by the combination of QqTOF and ion trap mass spectrometry. It was demonstrated that ion
trap MS3 analysis allowed quantification of positional isomeric PC species in total lipid
extracts without prior chromatographic separation (section 3.2.). Similarly, the MSn analysis
on a novel high mass resolution linear ion trap-orbitrap mass spectrometer was used to
unravel structure-specific fragmentation pathways of inositol-containing sphingolipids which
in turn allowed their molecular characterization directly from total lipid extracts (q.v. section
3.3.).
The prerequisite for rendering the MPIS and MRM-based methodologies applicable
for high-throughput orientated lipidomics projects was the development of Lipid Profiler
software. Lipid Profiler software was designed for the automated identification and
quantification of detected lipid species. Importantly, applying a novel algorithm for the
isotopic correction of peak intensities that was adjusted to the specific features of MPIS
spectra was implemented for accurate identification and quantification of lipid species
(section 3.1.6.). Currently, Lipid Profiler software allows the identification of species from
numerous lipid classes, including glycerophospholipid and their lyso-species, sphingolipids
including sulphatides and gangliosides, glycerolipids including diacylglycerols,
triacylglycerols and diacylglycerolglycosides, and sterol lipids. In addition to its efficient data
handling properties, Lipid Profiler software was designed for visual inspection of acquired
spectra with automated annotation of precursors, overlay of MPIS spectra from single
experiments or the overlay of spectra recorded of different samples (data not shown). Various
spectral normalization modes were implemented (e.g. to maximal peak intensity in a
spectrum, to defined internal standard peak) together with spectral subtraction plots which
assisted the identification of perturbed lipid precursors in the sample material.
In conclusion, the novel high-throughput methodology for automated, comprehensive
and quantitative lipidome analysis was successfully applied in several lipidomics projects
thereby defining it as an efficient venue for investigating the molecular architecture of
biological membranes.

88
5. MATERIALS AND METHODS
5.1.1. Chemicals, cell media and lipid standards
All common chemicals were purchased from Sigma Chemicals (St. Louis, MO) or
Merck (Darmstadt, Germany). Synthetic lipid standards (expect for PI 17:0/17:0) and lipid
extracts were purchased from Avanti Polar Lipids, Inc. (Alabaster, AL). The concentration of
lipid species in stock solutions was determined by phosphate assay (Rouser et al., 1970).
Phospholipase A2 from Crotalus atrox venom, cholesterol and cholesterol acetate was from
Sigma Chemical Company, (St. Louis MO). [2,2,3,4,4,6-D6]-cholesterol was obtained from
Cambridge Isotope Laboratories (Andover, MA, USA) with isotope purity higher than 98 %.
Yeast extract, peptone and dextrose were purchased from Difco Laboratories (BD GmbH,
Heidelberg, Germany). Cell media was from Gibco BRL (Rockville MD) and foetal calf
serum from PAA Laboratories GmbH (Cölbe, Germany). Nanoelectrospray capillaries (brand
“short”) were purchased from Proxeon Biosystems A/S (Odense, Denmark). T
5.1.2. Synthesis of PI 17:0/17:0
1,2-diheptadecanoyl-sn-glycero-3-phosphoinisitol (PI 17:0/17:0) was synthesized
according to the procedure of Filthuth and Eibl(Filthuth and Eibl, 1992). The phosphoramidite
of 2,3,4,5,6-penta-O-acetyl-DL-myo-inositol was coupled to 1,2-di-heptadecanoyl-sn-glycerol
(obtained by acylation of sn-3-O-benzyl-glycerol with heptadecanoylchloride followed by
hydrogenolysis), followed by oxidation and deprotection(Filthuth and Eibl, 1992). The final
product was purified using a silica column and eluted with a gradient of
CHCl3/MeOH/aqueous ammonia 90:9:1 to 60:36:4 (v/v/v), yielding the ammonium salt of PI
17:0/17:0. The purity and identity of the compound was assessed by thin layer
chromatography, quantitative determination of phosphorus content (Rouser et al., 1970) and
tandem mass spectrometry.
5.1.3. Hydrolysis of PC standards by phospholipase A2
Synthetic PC standards and their mixtures were hydrolysed by phospholipase A2 as
described by Kates et al. (Kates, 1986). Briefly, 500 nmol of dried PC standard was dissolved
in 800 µL diethyl ether/MeOH 99:1 (v/v) and mixed with 450 µL of aqueous solution
containing 40 mM calcium chloride, 20 mM Tris-HCl pH 8.0 and 7 µg phospholipase A2.
Mixtures were vigorously vortexed for 5 hours and then dried in a vacuum concentrator.
Dried samples were extracted and prepared for mass spectrometric analysis as described
below.
89
5.1.4. Yeast strains, growth conditions and lipid extraction
Yeast strains used in this work were Saccharomyces cerevisiae RH690-15D (wild
type); mutant strains elo3∆, sur2∆, and scs7∆ produced in the BY4741 background were
obtained from Euroscarf (Frankfurt, Germany); the double null mutant scs7∆sur2∆ was
kindly provided by Dr. Teresa Dunn; Schizosaccharomyces pombe strain FY254 and Pichia
pastoris strain SmdII 684. Yeast cells were grown at 30°C to log phase in rich medium (yeast
extract/peptone/dextrose) prepared as previously described(Sherman, 1991).
Yeasts were harvested by centrifugation for 5 min at 1000 g, and washed twice in a
cold lysis buffer (25 mM Tris, 5 mM EDTA, pH 8.5). Pelleted yeast was stored at -80°C until
used. Upon thawing, the pellet was re-suspended in a cold lysis buffer to a density of 4 OD600
unit/ml. Cells were lysed by vortexing their suspension with glass beads for 5 min at 4°C
(Serrano, 1988). The cell lysate was then cleared of glass beads by centrifugation for 5 min at
500 g and 4°C. The cell lysate was then mixed with chloroform/methanol/water/pyridine
(60:30:6:1) and extracted at 60°C for 2 hours (Hechtberger and Daum, 1995). The extract was
dried in a vacuum centrifuge, followed by either mild alkaline hydrolysis or resuspension in
chloroform/methanol/water (16:16:5) and stored at -20°C.
To hydrolyze glycerophospholipids, the pelleted cell lysate was taken up in methanol
containing 0.1 M NaOH and vortexed at 30°C for 2 hours (Hechtberger et al., 1994; Smith
and Lester, 1974). 1 M acetic acid and 0.5% (w/w) EDTA were added to adjust the pH of the
reaction mixture to neutral. Chloroform was added to induce phase separation and the organic
phase was recovered and evaporated to dryness in a vacuum centrifuge. Extracted
sphingolipids were re-dissolved in chloroform/methanol/water (16:16:5) and stored at -20°C
5.1.5. Fractionation of yeast sphingolipids by TLC
Preparative TLC was carried out on aluminium-back silica 60 high-performance plates
(Camag, Muttenz, Switzerland) essentially as described by Hetchberger et al.(Hechtberger et
al., 1994). Total lipid extracts dissolved in chloroform/methanol/water (16:16:5) were loaded
as 5 cm lane in the center of a silica plate and developed in chloroform/methanol/4.2 M
ammonia (9:7:2) or chloroform/methanol/acetic acid/water (16:6:4:1.6). Developed silica
plates were dried, cut in half, and one half was subjected to sulphuric acid staining.
Subsequently, the two parts were aligned, and strips containing M(IP)2C, MIPC and IPC
sphingolipids were excised from an un-stained part of the TLC plate. Silica strips were
extracted with chloroform/methanol/water (16:16:5) for 1 hour, and the obtained sphingolipid
class fractions stored at -20°C.

90
5.1.6. Mammalian cell culture, sample preparation and lipid extraction
MDCK II cells were cultured and subjected to lipid extraction as previously described
(Ekroos et al., 2002; Ekroos et al., 2003). Jurkat cells were cultured as previously described
(Harder and Kuhn, 2000), and prepared for lipid extraction by two times washing in
phosphate buffered saline (PBS) followed by pelleting of 200.000 Jurkat cells. αCD3 and
αTfR immunoisolates from Jurkat cells were prepared as previously described (Harder and
Kuhn, 2000), and washed two times washing in PBS. Jurkat cells, αCD3 and αTfR
immunoisolates were added 200 µL water and spiked with 10 µL internal standard solution,
containing defined amounts of PA 17:0/17:0, PS 17:0/17:0, PI 17:0/17:0, PG 17:0/17:0, PE
17:0/17:0, PC 18:3/18:3, ceramide 18:1;2/17:0;0, galactosylceramide 18:1;2/12:0;0, SM
18:1;2/17:0;0, and cholesterol-D6. Then 495 µL chloroform/methanol (3:1) was added and the
resultant mixture was vortexed for 15 minutes. Phase separation was induced by 2 minutes
centrifugation at 1000 g. The lower (organic) phase was transferred to a new tube. The
samples were dried by vacuum centrifugation and dissolved in 50 µL methanol.
5.1.7. Acetyl chloride derivatization of cholesterol
Lipid standards and total lipid extracts were loaded in 96-well plates (Eppendorf AG,
Hamburg, Germany) and evaporated using a vacuum centrifuge. Dried samples were
dissolved in 50 µL acetyl chloride/chloroform (1:5) (Liebisch et al., 2006) and left unsealed at
room temperature for 2 hours to produce cholesterol acetate. Dried and acetylated samples
were dissolved in 7.5 mM ammonium acetate in chloroform/methanol/2-propanol and
subjected to MRM analysis (see below).
5.1.8. Sample preparation for mass spectrometric analysis
Standards and lipid extracts were prepared in specified concentrations and in specific
solvent systems depending on the infusion device and the mode of analysis. Table 8
summarizes the applied solvent systems and concomitant ion spray settings. Solvents systems
containing methylamine were prepared diluting a saturated methylamine solution obtained by
purging gaseous methylamine into methanol.

91
Table 8. Overview of the applied solvent systems and concomitant ion spray settings
Infusion device Solvent composition Ion mode Ion spray settings
Nanoelectrospray ion source a 5 mM chloroform/methanol (1:2) ±
IS = ±0.9 kV GS1 = 3
NanoMate HD Systemb 7.5 mM ammonium acetate in chloroform/methanol/2-propanol (1:2:4)
±
Voltage = ±0.95 kV Pressure = 1.25 psi
NanoMate HD Systemb Chloroform/methanol/2-propanol (1:2:4) − Voltage = -0.75 kV Pressure = 1.4 psi
NanoMate HD Systemb 0.05% saturated methylamine in chloroform/methanol/2-propanol (1:2:4)
− Voltage = -0.75 kV Pressure = 1.4 psi
NanoMate HD Systemb 0.05% saturated methylamine in methanol − Voltage = -0.95 kV Pressure = 0.6 psi
aIon spray settings were controlled by Analyst QS software aIon spray settings were controlled by Chipsoft 6.3.2 software
5.1.9. Quadrupole time-of-flight mass spectrometry
Lipid extracts and synthetic lipid standards were analyzed in negative and positive ion
modes on a modified QSTAR® Pulsar i quadrupole time-of-flight mass spectrometer
(Applied Biosystems/MDS Sciex, Concord, Canada) equipped with a nanoelectrospray ion
source (Proxeon Biosystems A/S, Odense, Denmark) as previously described (Ekroos et al.,
2002) or the robotic nanoflow ion source NanoMate HD System (Advion Biosciences Inc,
Ithaca NJ). The instrument was calibrated in MS/MS mode using a synthetic lipid standard 1-
palmitoyl-2-docosahexaenoyl-sn-glycero-3-phosphocholine as previously described (Ekroos
and Shevchenko, 2002).
The characteristic fragment ion of phosphorylcholine, m/z 184.1, was selected for PIS
analysis of SM, PC and LPC species in positive ion mode. Negative ion mode MPIS was
performed as previously described (Ekroos et al., 2002). The analytical quadrupole Q1 was
operated under the unit mass resolution settings with 30 msec dwell time and step size of 0.2
Da. Collision energy was linearly ramped from 45 eV at m/z 620 to 60 eV at m/z 920. The m/z
of fragment ions selected for MPIS are listed in the Appendix Table 1A. The m/z of fragment
ions were selected within a mass range of 0.15 Da. Peak enhancement (Chernushevich, 2000)
(trapping of fragment ions in the collision cell) was applied according to the instructions of
the manufacturer and controlled by Analyst® QS 1.1 software (Applied Biosystems/MDS
Sciex).
MRM analysis was performed in positive ion mode by repeated MS/MS analysis of
targeted precursor ions. Each cycle of MS/MS experiments were set to 1 second per precursor
ion. All MS/MS spectra were recorded at unit resolution of the analytical quadrupole Q1 and
peak enhancement applied according to the instructions of the manufacturer. The
quantification of cholesterol performed by monitoring the fragmentations of m/z 446.4 to m/z

92
369.38 (cholesterol acetate) and m/z 452.4 to m/z 375.40 (cholesterol-D6 acetate).
Quantification of targeted ceramide, hexosylceramides and lactosylceramides were performed
by monitoring the common long chain base-specific fragment ions with m/z 252.3, 264.3 and
282.3.
5.1.10. Mass spectrometry on ion trap and hybrid LTQ Orbitrap instruments
MSn fragmentation was performed on a quadrupole ion trap mass spectrometer LCQ
(ThermoElectron Corp., San Jose, CA) as previously described (Ekroos et al., 2003), and a
hybrid linear ion trap - orbitrap mass spectrometer (LTQ Orbitrap)(Hu et al., 2005; Olsen et
al., 2005) from the same company equipped with the NanoMate HD ion source (Advion
BioSciences Ltd, Ithaca NJ). MS analysis was performed in negative ion mode. The
instrument was calibrated externally according to the instructions of the manufacturer. MS2
and MS3 spectra were acquired under operator control. MS2 and MS3 spectra were recorded
with a mass resolution of R = 30.000 (FWHM) at m/z 400 and an acquisition time period of
0.5 sec/scan. For MS2 and MS3 experiments the normalized collision energy of 20% and 26%,
respectively, was applied. The activation time was set at 30 ms with the activation parameter
q = 0.25. For MS2 and MS3 analysis, precursor ions were isolated within the range of 3 Da
and 5 Da, respectively. The mass accuracy was better than 3 ppm for MS and MSn
experiments.
5.1.11. Annotation of glycerophospholipid species
Detected glycerophospholipid species were be annotated by their molecular
composition or by their sum formula depending on the mode of analysis. For sum formula
annotations the following convention was applied: <lipid class> <total number of carbon
atoms in the FA moieties>:<total number of double bonds in the FA moieties> (e.g. PE 36:2
as detected by the PE head group scan PIS m/z 196.0, Figure 8A page 23).
The molecular composition of glycerophospholipid species detected by MPIS was
annotated as: <lipid class> <number of carbon atoms in the first FA moiety>:<number of
double bonds in the first FA moiety>-<number of carbon atoms in the second FA
moiety>:<number of double bonds in the second FA moiety>. For example, PE 18:0-18:2 is
an asymmetric diacyl PE comprising a FA moiety with 18 carbon atoms and no double bonds
and another FA moiety with 18 carbon atoms and two double bonds. This annotation was
chosen to reflect the limitation of the MPIS analysis in accurately determining the position of
the FA moieties (sn-1 or sn-2) on the glycerol phosphate backbone, and the position or cis-
trans configuration of double bonds.
93
Lipid species with the known or accurately determined position of FA moieties were
annotated as: <lipid class> <number of carbon atoms in the sn-1 positioned FA
moiety>:<number of double bonds in the sn-1 positioned FA moiety>/<number of carbon
atoms in the sn-2 positioned FA moiety >:<number of double bonds in the sn-2 positioned FA
moiety > (e.g. PE 18:0/18:2). Detected ether species were annotated with the prefix O- (e.g.
PC O-34:2 or PC O-16:1/18:1).
5.1.12. Annotation of sphingolipid species
Yeast sphingolipid species were annotated either by their molecular composition or by
sum formula, depending on the method of their structural characterization. To denote the
molecular composition the following convention was applied: <Lipid class> <Number of
carbon atoms in the long chain base moiety>:<Number of double bonds in the long chain base
moiety >;<Number of hydroxyl groups in the long chain base moiety >/<Number of carbon
atoms in the FA moiety>:<Number of double bonds in the FA moiety >;<Number of hydroxyl
groups in the FA moiety>. For example, a peak at m/z 952.7 was identified as IPC
18:0;3/26:0;1 (Figure 24 page 54), i.e. as an inositolphosphoceramide, whose long chain base
consisted of C18 phytosphingosine with no double bonds and 3 hydroxyl groups. Its amide-
linked FA moiety comprised 26 carbon atoms, no double bonds and one hydroxyl group. If
the composition of the FA moiety and long chain base were not separately determined,
sphingolipids were characterized by the sum formula of their ceramide backbone: <Lipid
class> <Number of carbon atoms in the ceramide backbone>:<Number of double bonds in the
ceramide backbone>;<Number of hydroxyl groups in the ceramide backbone>. For example,
a peak detected at m/z 938.7 was identified as IPC 42:1;5, i.e. as an inositolphosphoceramide
containing a total of 42 carbon atoms, one double bond, and five hydroxyl groups in its entire
ceramide backbone.
5.1.13. Lipid Profiler prototype software
Lipid Profiler software was developed in collaboration with MDS Sciex. The software
operates together with Analyst software (MDS Sciex) to identify and quantify lipid species
detected by MPIS. Optionally, it could also process spectra acquired on triple quadrupole and
linear ion trap mass spectrometers (data not shown). It was written in Visual Basic and uses a
stand-alone lipid database (Microsoft Access), which stores information on the m/z and
fragment specificity of lipid classes and the applied precursor ion scans (q.v. Appendix). Lipid
species were identified by matching, within a user-defined tolerance, the m/z of precursor ions
detected in MPIS spectra to the candidate m/z calculated using the database. Lipid Profiler

94
software employed two isotopic correction algorithms to calculate the intensity of lipid
precursors within overlapping isotopic clusters which are explained in (Ejsing et al., 2006).
Absolute quantification of identified species relied upon a spiked mixture of synthetic
internal standards having two diheptadecanoyl FA moieties: PA 17:0/17:0, PE 17:0/17:0, PG
17:0/17:0, PS 17:0/17:0, PC 17:0/17:0 and PI 17:0/17:0. The concentration of an endogenous
lipid species of the PX class with the FA moieties FAi and FAj was calculated as:
[ ] [ ]FAj-FAi PX
0:0/17:17 PXjiji
ρρ
0:0/17:17 PX0):0/17:17 I(PX)FA-FA I(PX
FA-FA PX ⋅⋅= ,
where [PX 17:0/17:0] stands for the concentration of the internal standard of the same PX
class; I(PX FAi-FAj) is the sum of intensities (or the areas) of the monoisotopic peaks of the
corresponding precursor detected in the precursor ion scans specific for the FA moieties FAi
and FAj; I(PX 17:0/17:0) is the intensity (area) of the monoisotopic peak of the precursor ion
of the internal standard detected in the precursor ion scan specific for FA 17:0. The intensities
(areas) of monisotopic peaks were adjusted to represent the total intensity of the isotopic
cluster. To this end, they were multiplied by a factor equal to 1 / ρ, where ρ is the intensity of
the monoisotopic peak relative to the total intensity of all peaks in the isotopic cluster
calculated from the theoretical isotopic distribution of the corresponding lipid species.
The mol% of the quantified lipid species relative to all identified lipid species in the
analyzed sample was calculated as:
[ ][ ]∑
=
ji,X,
ji
jiji
FA-FA PXFA-FA PX)FA-FA η(PX ,
A workflow diagram of MPIS data processing by Lipid Profiler software is presented in
Figure 39.
Figure 39. The workflow of automated processing of MPIS data by Lipid Profiler.

95
6. REFERENCES
AKESSON, B., J. ELOVSON, and G. ARVIDSON. 1970. Initial incorporation into rat liver glycerolipids of intraportally injected (9,10-3H2)palmitic acid. Biochim Biophys Acta. 218:44-56.
ARVIDSON, G.A. 1968. Biosynthesis of phosphatidylcholines in rat liver. Eur J Biochem. 5:415-21.
BABURINA, I., and S. JACKOWSKI. 1998. Apoptosis triggered by 1-O-octadecyl-2-O-methyl-rac-glycero-3- phosphocholine is prevented by increased expression of CTP:phosphocholine cytidylyltransferase. J Biol Chem. 273:2169-73.
BAGNAT, M., A. CHANG, and K. SIMONS. 2001. Plasma membrane proton ATPase Pma1p requires raft association for surface delivery in yeast. Mol Biol Cell. 12:4129-4138.
BAGNAT, M., S. KERANEN, A. SHEVCHENKO, and K. SIMONS. 2000. Lipid rafts function in biosynthetic delivery of proteins to the cell surface in yeast. Proc Natl Acad Sci U S A. 97:3254-3259.
BAGNAT, M., and K. SIMONS. 2002. Cell surface polarization during yeast mating. Proc Natl Acad Sci U S A. 99:14183-14188.
BECKEDORF, A.I., C. SCHAFFER, P. MESSNER, and J. PETER-KATALINIC. 2002. Mapping and sequencing of cardiolipins from Geobacillus stearothermophilus NRS 2004/3a by positive and negative ion nanoESI- QTOF-MS and MS/MS. J Mass Spectrom. 37:1086-94.
BLANK, M.L., M. ROBINSON, V. FITZGERALD, and F. SNYDER. 1984. Novel Quantitative Method for Determination of Molecular-Species of Phospholipids and Diglycerides. Journal of Chromatography. 298:473-482.
BLOM, T.S., M. KOIVUSALO, E. KUISMANEN, R. KOSTIAINEN, P. SOMERHARJU, and E. IKONEN. 2001. Mass spectrometric analysis reveals an increase in plasma membrane polyunsaturated phospholipid species upon cellular cholesterol loading. Biochemistry. 40:14635-14644.
BOUMANN, H.A., M.J.A. DAMEN, C. VERSLUIS, A.J.R. HECK, B. DE KRUIJFF, and A. DE KROON. 2003. The two biosynthetic routes leading to phosphatidylcholine in yeast produce different sets of molecular species. Evidence for lipid remodeling. Biochemistry. 42:3054-3059.
BOUMANN, H.A., B. DE KRUIJFF, A.J. HECK, and A.I. DE KROON. 2004. The selective utilization of substrates in vivo by the phosphatidylethanolamine and phosphatidylcholine biosynthetic enzymes Ept1p and Cpt1p in yeast. FEBS Lett. 569:173-7.
BROOKS, S., G.T. CLARK, S.M. WRIGHT, R.J. TRUEMAN, A.D. POSTLE, A.R. COSSINS, and N.M. MACLEAN. 2002. Electrospray ionisation mass spectrometric analysis of lipid restructuring in the carp (Cyprinus carpio L.) during cold acclimation. J Exp Biol. 205:3989-97.
BRUGGER, B., G. ERBEN, R. SANDHOFF, F.T. WIELAND, and W.D. LEHMANN. 1997. Quantitative analysis of biological membrane lipids at the low picomole level by nanoelectrospray ionization tandem mass spectrometry. Proc Natl Acad Sci U S A. 94:2339-2344.
BRUGGER, B., G. ERBEN, R. SANDHOFF, F.T. WIELAND, and W.D. LEHMANN. 1999. Quantitative analysis of biological membrane lipids at the low picomole level by nano-electrospray ionization tandem mass spectrometry (vol 94, pg 2339, 1997). Proceedings of the National Academy of Sciences of the United States of America. 96:10943-10943.
BRUGGER, B., B. GLASS, P. HABERKANT, I. LEIBRECHT, F.T. WIELAND, and H.G. KRASSLICH. 2006. The HIV lipidome: A raft with an unusual composition. Proceedings of the National Academy of Sciences of the United States of America. 103:2641-2646.
BRUGGER, B., C. GRAHAM, I. LEIBRECHT, E. MOMBELLI, A. JEN, F. WIELAND, and R. MORRIS. 2004. The membrane domains occupied by glycosylphosphatidylinositol-anchored prion protein and Thy-1 differ in lipid composition. Journal of Biological Chemistry. 279:7530-7536.
CASSERLY, I., and E. TOPOL. 2004. Convergence of atherosclerosis and Alzheimer's disease: inflammation, cholesterol, and misfolded proteins. Lancet. 363:1139-1146.
CHERNUSHEVICH, I. 2000. Duty cycle improvement for a quadrupole time-of-flight mass spectrometer and its use for precursor ion scans. Eur J Mass Spectrom. 6:471-479.
CHERNUSHEVICH, I., A. LOBODA, and B. THOMSON. 2001. An introduction to quadrupole time-of-flight mass spectrometry. J Mass Spectrom. 36:849-865.
96
COLE, R.B. 2000. Some tenets pertaining to electrospray ionization mass spectrometry. J Mass Spectrom. 35:763-772.
CONNOR, W.E., D.S. LIN, G. THOMAS, F. EY, T. DELOUGHERY, and N. ZHU. 1997. Abnormal phospholipid molecular species of erythrocytes in sickle cell anemia. J Lipid Res. 38:2516-2528.
CUI, Z., M. HOUWELING, M.H. CHEN, M. RECORD, H. CHAP, D.E. VANCE, and F. TERCE. 1996. A genetic defect in phosphatidylcholine biosynthesis triggers apoptosis in Chinese hamster ovary cells. J Biol Chem. 271:14668-71.
CUI, Z., J.E. VANCE, M.H. CHEN, D.R. VOELKER, and D.E. VANCE. 1993. Cloning and expression of a novel phosphatidylethanolamine N- methyltransferase. A specific biochemical and cytological marker for a unique membrane fraction in rat liver. J Biol Chem. 268:16655-63.
CUNNINGHAM, B.A., A.D. BROWN, D.H. WOLFE, W.P. WILLIAMS, and A. BRAIN. 1998. Ripple phase formation in phosphatidylcholine: Effect of acyl chain relative length, position, and unsaturation. Phys Rev E. 58:3662-3672.
DAVIS, M.M. 2002. A new trigger for T cells. Cell. 110:285-287.
DELONG, C.J., P.R.S. BAKER, M. SAMUEL, Z. CUI, and M.J. THOMAS. 2001. Molecular species composition of rat liver phospholipids by ESI-MS/MS: the effect of chromatography. J Lipid Res. 42:1959-1968.
DELONG, C.J., Y.J. SHEN, M.J. THOMAS, and Z. CUI. 1999. Molecular distinction of phosphatidylcholine synthesis between the CDP- choline pathway and phosphatidylethanolamine methylation pathway. J Biol Chem. 274:29683-8.
DICKSON, R.C., and R.L. LESTER. 1999a. Metabolism and selected functions of sphingolipids in the yeast Saccharomyces cerevisiae. Biochim Biophys Acta. 1438:305-321.
DICKSON, R.C., and R.L. LESTER. 1999b. Yeast sphingolipids. Biochim Biophys Acta. 1426:347-357.
DICKSON, R.C., and R.L. LESTER. 2002. Sphingolipid functions in Saccharomyces cerevisiae. Biochim Biophys Acta. 1583:13-25.
EATON, S. 2006. Release and trafficking of lipid-linked morphogens. Current Opinion in Genetics & Development. 16:17-22.
EISENKOLB, M., C. ZENZMAIER, E. LEITNER, and R. SCHNEITER. 2002. A specific structural requirement for ergosterol in long-chain fatty acid synthesis mutants important for maintaining raft domains in yeast. Mol Biol Cell. 13:4414-28.
EJSING, C.S., E. DUCHOSLAV, J. SAMPAIO, K. SIMONS, R. BONNER, C. THIELE, K. EKROOS, and A. SHEVCHENKO. 2006. Automated identification and quantification of glycerophospholipid molecular species by multiple precursor ion scanning. Analytical Chemistry. 78:6202-6214.
EKROOS, K., I.V. CHERNUSHEVICH, K. SIMONS, and A. SHEVCHENKO. 2002. Quantitative profiling of phospholipids by multiple precursor ion scanning on a hybrid quadrupole time-of-flight mass spectrometer. Anal Chem. 74:941-9.
EKROOS, K., C.S. EJSING, U. BAHR, M. KARAS, K. SIMONS, and A. SHEVCHENKO. 2003. Charting molecular composition of phosphatidylcholines by fatty acid scanning and ion trap MS3 fragmentation. J Lipid Res. 44:2181-2192.
EKROOS, K., and A. SHEVCHENKO. 2002. Simple two-point calibration of hybrid quadrupole time-of-flight instruments using a synthetic lipid standard. Rapid Commun Mass Spectrom. 16:1254-1255.
FAHY, E., S. SUBRAMANIAM, H.A. BROWN, C.K. GLASS, A.H. MERRILL, R.C. MURPHY, C.R.H. RAETZ, D.W. RUSSELL, Y. SEYAMA, W. SHAW, T. SHIMIZU, F. SPENER, G. VAN MEER, M.S. VANNIEUWENHZE, S.H. WHITE, J.L. WITZTUM, and E.A. DENNIS. 2005. A comprehensive classification system for lipids. Journal of Lipid Research. 46:839-861.
FILTHUTH, E., and H. EIBL. 1992. Synthesis of Enantiomerically Pure Lysophosphatidylinositols and Alkylphosphoinositols. Chemistry and Physics of Lipids. 60:253-261.
FRIDRIKSSON, E.K., P.A. SHIPKOVA, E.D. SHEETS, D. HOLOWKA, B. BAIRD, and F.W. MCLAFFERTY. 1999. Quantitative analysis of phospholipids in functionally important membrane domains from RBL-2H3 mast cells using tandem high-resolution mass spectrometry. Biochemistry. 38:8056-8063.
FUNATO, K., B. VALLEE, and H. RIEZMAN. 2002. Biosynthesis and trafficking of sphingolipids in the yeast Saccharomyces cerevisiae. Biochemistry. 41:15105-15114.
97
FUTERMAN, A.H., and Y.A. HANNUN. 2004. The complex life of simple sphingolipids. Embo Reports. 5:777-782.
GAIGG, B., T.B.F. NEERGAARD, R. SCHNEITER, J.K. HANSEN, N.J. FAERGEMAN, N.A. JENSEN, J.R. ANDERSEN, J. FRIIS, R. SANDHOFF, H.D. SCHRODER, and J. KNUDSEN. 2001. Depletion of acyl-coenzyme A-binding protein affects sphingolipid synthesis and causes vesicle accumulation and membrane defects in Saccharomyces cerevisiae. Mol Biol Cell. 12:1147-1160.
GARTON, S., L.V. MICHAELSON, F. BEAUDOIN, M.H. BEALE, and J.A. NAPIER. 2003. The dihydroceramide desaturase is not essential for cell viability in Schizosaccharomyces pombe. FEBS Lett. 538:192-196.
GAUS, K., E. CHKLOVSKAIA, B.F.S. GROTH, W. JESSUP, and T. HARDER. 2005. Condensation of the plasma membrane at the site of T lymphocyte activation. Journal of Cell Biology. 171:121-131.
GLISH, G.L., and R.W. VACHET. 2003. The basics of mass spectrometry in the twenty-first century. Nat Rev Drug Discov. 2:140-150.
GRIFFITHS, W.J. 2003. Tandem mass spectrometry in the study of fatty acids, bile acids, and steroids. Mass Spectrometry Reviews. 22:81-152.
GROSS, R.W., and B.E. SOBEL. 1980. Isocratic High-Performance Liquid-Chromatography Separation of Phosphoglycerides and Lysophosphoglycerides. Journal of Chromatography. 197:79-85.
GU, M., J.L. KERWIN, J.D. WATTS, and R. AEBERSOLD. 1997. Ceramide profiling of complex lipid mixtures by electrospray ionization mass spectrometry. Anal Biochem. 244:347-356.
HAAK, D., K. GABLE, T. BEELER, and T. DUNN. 1997. Hydroxylation of Saccharomyces cerevisiae ceramides requires Sur2p and Scs7p. J Biol Chem. 272:29704-29710.
HAINES, T.H. 2001. Do sterols reduce proton and sodium leaks through lipid bilayers? Progress in Lipid Research. 40:299-324.
HAN, X. 2002. Characterization and direct quantitation of ceramide molecular species from lipid extracts of biological samples by electrospray ionization tandem mass spectrometry. Anal Biochem. 302:199-212.
HAN, X., and R.W. GROSS. 1994. Electrospray ionization mass spectroscopic analysis of human erythrocyte plasma membrane phospholipids. Proc Natl Acad Sci U S A. 91:10635-9.
HAN, X., and R.W. GROSS. 2003. Global analyses of cellular lipidomes directly from crude extracts of biological samples by ESI mass spectrometry: a bridge to lipidomics. J Lipid Res. 44:1071-9.
HAN, X., K. YANG, J. YANG, K.N. FIKES, H. CHENG, and R.W. GROSS. 2006. Factors influencing the electrospray intrasource separation and selective ionization of glycerophospholipids. J Am Soc Mass Spectrom. 17:264-74.
HAN, X.L., and R.W. GROSS. 1995. Structural determination of picomole amounts of phospholipids via electrospray ionization tandem mass spectrometry. J Am Soc Mass Spectrom. 6:1202-1210.
HAN, X.L., and R.W. GROSS. 2005. Shotgun lipidomics: Electrospray ionization mass spectrometric analysis and quantitation of cellular lipidomes directly from crude extracts of biological samples. Mass Spectrometry Reviews. 24:367-412.
HAN, X.L., J.Y. YANG, H. CHENG, H.P. YE, and R.W. GROSS. 2004. Toward fingerprinting cellular lipidomes directly from biological samples by two-dimensional electrospray ionization mass spectrometry. Analytical Biochemistry. 330:317-331.
HARDER, T., and M. KUHN. 2000. Selective accumulation of raft-associated membrane protein LAT in T cell receptor signaling assemblies. Journal of Cell Biology. 151:199-207.
HARDMAN, M., and A.A. MAKAROV. 2003. Interfacing the orbitrap mass analyzer to an electrospray ion source. Anal Chem. 75:1699-1705.
HARTGROVES, L.C., J. LIN, H. LANGEN, T. ZECH, A. WEISS, and T. HARDER. 2003. Synergistic assembly of linker for activation of T cells signaling protein complexes in T cell plasma membrane domains. Journal of Biological Chemistry. 278:20389-20394.
HASHEMI, B.B., J.P. SLATTERY, D. HOLOWKA, and B. BAIRD. 1996. Sustained T cell receptor-mediated Ca2+ responses rely on dynamic engagement of receptors. Journal of Immunology. 156:3660-3667.
HECHTBERGER, P., and G. DAUM. 1995. Intracellular-transport of inositol-containing sphingolipids in the yeast Saccharomyces cerevisiae. FEBS Lett. 367:201-204.

98
HECHTBERGER, P., E. ZINSER, R. SAF, K. HUMMEL, F. PALTAUF, and G. DAUM. 1994. Characterization, quantification and subcellular localization of inositol-containing sphingolipids of the yeast Saccharomyces cerevisiae. Eur J Biochem. 225:641-649.
HEIKINHEIMO, L., and P. SOMERHARJU. 2002. Translocation of phosphatidylthreonine and -serine to mitochronida diminishes exponentially with increasing molecular hydrophobicity. Traffic. 3:367-377.
HERMANSSON, M., A. UPHOFF, R. KAKELA, and P. SOMERHARJU. 2005. Automated quantitative analysis of complex lipidomes by liquid chromatography/mass spectrometry. Analytical Chemistry. 77:2166-2175.
HSU, F.F., and J. TURK. 2000a. Characterization of phosphatidylinositol, phosphatidylinositol-4- phosphate, and phosphatidylinositol-4,5-bisphosphate by electrospray ionization tandem mass spectrometry: a mechanistic study. J Am Soc Mass Spectrom. 11:986-99.
HSU, F.F., and J. TURK. 2000b. Charge-driven fragmentation processes in diacyl glycerophosphatidic acids upon low-energy collisional activation. A mechanistic proposal. J Am Soc Mass Spectrom. 11:797-803.
HSU, F.F., and J. TURK. 2000c. Charge-remote and charge-driven fragmentation processes in diacyl glycerophosphoethanolamine upon low-energy collisional activation: a mechanistic proposal. J Am Soc Mass Spectrom. 11:892-9.
HSU, F.F., and J. TURK. 2001. Studies on phosphatidylglycerol with triple quadrupole tandem mass spectrometry with electrospray ionization: Fragmentation processes and structural characterization. J Am Soc Mass Spectrom. 12:1036-1043.
HSU, F.F., and J. TURK. 2002. Characterization of ceramides by low energy collisional-activated dissociation tandem mass spectrometry with negative-ion electrospray ionization. J Am Soc Mass Spectrom. 13:558-70.
HU, Q.Z., R.J. NOLL, H.Y. LI, A. MAKAROV, M. HARDMAN, and R.G. COOKS. 2005. The Orbitrap: a new mass spectrometer. J Mass Spectrom. 40:430-443.
HUNT, A.N., G.T. CLARK, J.R. NEALE, and A.D. POSTLE. 2002. A comparison of the molecular specificities of whole cell and endonuclear phosphatidylcholine synthesis. FEBS Lett. 530:89-93.
HVATTUM, E., G. HAGELIN, and A. LARSEN. 1998. Study of mechanisms involved in the collision-induced dissociation of carboxylate anions from glycerophospholipids using negative ion electrospray tandem quadrupole mass spectrometry. Rapid Commun Mass Spectrom. 12:1405-9.
IKONEN, E., and M. HOLTTA-VUORI. 2004. Cellular pathology of Niemann-Pick type C disease. Seminars in Cell & Developmental Biology. 15:445-454.
IUPAC-IUB. 1978. Nomenclature of Lipids - (Recommendations 1976) - Iupac-Iub-Commission-on-Biochemical-Nomenclature. Biochemical Journal. 171:21-35.
KATES, M. 1986. Techniques of lipidology . In RH Burdon & PH van Knippenberg (eds), Laboratory Techniques in Biochemistry and Molecular Biology. A.E.S. B.V., editor.
KAWAI, K., M. FUJITA, and M. NAKAO. 1974. Lipid components of two different regions of an intestinal epithelial cell membrane of mouse. Biochim Biophys Acta. 369:222-33.
KELLER, S.L., A. RADHAKRISHNAN, and H.M. MCCONNELL. 2000. Saturated phospholipids with high melting temperatures form complexes with cholesterol in monolayers. J Phys Chem B. 104:7522-7527.
KENT, C. 1995. Eukaryotic phospholipid biosynthesis. Annu Rev Biochem. 64:315-43.
KERWIN, J.L., A.R. TUININGA, and L.H. ERICSSON. 1994. Identification of molecular species of glycerophospholipids and sphingomyelin using electrospray mass spectrometry. J Lipid Res. 35:1102-14.
KOIVUSALO, M., P. HAIMI, L. HEIKINHEIMO, R. KOSTIAINEN, and P. SOMERHARJU. 2001. Quantitative determination of phospholipid compositions by ESI-MS: effects of acyl chain length, unsaturation, and lipid concentration on instrument response. J Lipid Res. 42:663-72.
KUERSCHNER, L., C.S. EJSING, K. EKROOS, A. SHEVCHENKO, K.I. ANDERSON, and C. THIELE. 2005. Polyene-lipids: A new tool to image lipids. Nature Methods. 2:39-45.
KUYPERS, F.A., P. BUTIKOFER, and C.H.L. SHACKLETON. 1991. Application of Liquid-Chromatography Thermospray Mass-Spectrometry in the Analysis of Glycerophospholipid Molecular-Species. Journal of Chromatography-Biomedical Applications. 562:191-206.
LANDS, W.E.M., and P. HART. 1965. Metabolism of glycerolipids. 6. Specificities of acyl coenzyme A - phospholipid acyltransferases. J Biol Chem. 240:1905-&.

99
LARSEN, A., S. URAN, P.B. JACOBSEN, and T. SKOTLAND. 2001. Collision-induced dissociation of glycero phospholipids using electrospray ion-trap mass spectrometry. Rapid Commun Mass Spectrom. 15:2393-8.
LEMBCKE, J., U. CEGLAREK, G.M. FIEDLER, S. BAUMANN, A. LEICHTLE, and J. THIERY. 2005. Rapid quantification of free and esterified phytosterols in human serum using APPI-LC-MS/MS. Journal of Lipid Research. 46:21-26.
LIEBISCH, G., M. BINDER, R. SCHIFFERER, T. LANGMANN, B. SCHULZ, and G. SCHMITZ. 2006. High throughput quantification of cholesterol and cholesteryl ester by electrospray ionization tandem mass spectrometry (ESI-MS/MS). Biochim Biophys Acta.
LIEBISCH, G., W. DROBNIK, M. REIL, B. TRUMBACH, R. ARNECKE, B. OLGEMOLLER, A. ROSCHER, and G. SCHMITZ. 1999. Quantitative measurement of different ceramide species from crude cellular extracts by electrospray ionization tandem mass spectrometry (ESI-MS/MS). J Lipid Res. 40:1539-1546.
LIEBISCH, G., B. LIESER, J. RATHENBERG, W. DROBNIK, and G. SCHMITZ. 2004. High-throughput quantification of phosphatidylcholine and sphingomyelin by electrospray ionization tandem mass spectrometry coupled with isotope correction algorithm. Biochimica Et Biophysica Acta-Molecular and Cell Biology of Lipids. 1686:108-117.
LINDEN, D., L. WILLIAM-OLSSON, A. AHNMARK, K. EKROOS, C. HALLBERG, H.P. SJOGREN, B. BECKER, L. SVENSSON, J.C. CLAPHAM, J. OSCARSSON, and S. SCHREYER. 2006. Liver-directed overexpression of mitochondrial glycerol-3-phosphate acyltransferase results in hepatic steatosis, increased triacylglycerol secretion and reduced fatty acid oxidation. Faseb J. 20:434-43.
LOWIN-KROPF, B., V.S. SHAPIRO, and A. WEISS. 1998. Cytoskeletal polarization of T cells is regulated by an immunoreceptor tyrosine-based activation motif-dependent mechanism. Journal of Cell Biology. 140:861-871.
LU, Y., S. HONG, E. TJONAHEN, and C.N. SERHAN. 2005. Mediator-lipidomics: databases and search algorithms for PUFA-derived mediators. Journal of Lipid Research. 46:790-802.
MAKAROV, A. 2000. Electrostatic axially harmonic orbital trapping: A high-performance technique of mass analysis. Anal Chem. 72:1156-1162.
MARCH, R.E. 1997. An introduction to quadrupole ion trap mass spectrometry. J Mass Spectrom. 32:351-369.
MERRILL, A.H., M.C. SULLARDS, J.C. ALLEGOOD, S. KELLY, and E. WANG. 2005. Sphingolipidomics: High-throughput, structure-specific, and quantitative analysis of sphingolipids by liquid chromatography tandem mass spectrometry. Methods. 36:207-224.
MONTIXI, C., C. LANGLET, A.M. BERNARD, J. THIMONIER, C. DUBOIS, M.A. WURBEL, J.P. CHAUVIN, M. PIERRES, and H.T. HE. 1998. Engagement of T cell receptor triggers its recruitment to low-density detergent-insoluble membrane domains. Embo Journal. 17:5334-5348.
MURPHY, R.C., J. FIEDLER, and J. HEVKO. 2001. Analysis of nonvolatile lipids by mass spectrometry. Chemical Reviews. 101:479-526.
NAGAN, N., and R.A. ZOELLER. 2001. Plasmalogens: biosynthesis and functions. Progress in Lipid Research. 40:199-229.
OH, C.S., D.A. TOKE, S. MANDALA, and C.E. MARTIN. 1997. ELO2 and ELO3, homologues of the Saccharomyces cerevisiae ELO1 gene, function in fatty acid elongation and are required for sphingolipid formation. J Biol Chem. 272:17376-17384.
OKUYAMA, H., K. YAMADA, and H. IKEZAWA. 1975. Accepton concentration effect in the selectivity of acyl coenzyme A: U aclglycerylphosphorylcholine acyltransferase system in rat liver. J Biol Chem. 250:1710-3.
OLSEN, J.V., L.M. DE GODOY, G. LI, B. MACEK, P. MORTENSEN, R. PESCH, A. MAKAROV, O. LANGE, S. HORNING, and M. MANN. 2005. Parts per million mass accuracy on an orbitrap mass spectrometer via lock-mass injection into a C-trap. Mol Cell Proteomics.
PETTITT, T.R., S.K. DOVE, A. LUBBEN, S.D.J. CALAMINUS, and M.J.O. WAKELAM. 2006. Analysis of intact phosphoinositides in biological samples. Journal of Lipid Research. 47:1588-1596.
PULFER, M., and R.C. MURPHY. 2003. Electrospray mass spectrometry of phospholipids. Mass Spectrometry Reviews. 22:332-364.
RENOOIJ, W., L.M. VAN GOLDE, R.F. ZWAAL, and L.L. VAN DEENEN. 1976. Topological asymmetry of phospholipid metabolism in rat erythrocyte membranes. Evidence for flip-flop of lecithin. Eur J Biochem. 61:53-8.
100
RODEMER, C., T.P. THAI, B. BRUGGER, T. KAERCHER, H. WERNER, K.A. NAVE, F. WIELAND, K. GORGAS, and W.W. JUST. 2003. Inactivation of ether lipid biosynthesis causes male infertility, defects in eye development and optic nerve hypoplasia in mice. Human Molecular Genetics. 12:1881-1895.
ROUSER, G., S. FKEISCHER, and A. YAMAMOTO. 1970. Two dimensional thin layer chromatographic separation of polar lipids and determination of phospholipids by phosphorus analysis of spots. Lipids. 5:494-6.
RUDOLPH, M.G., R.L. STANFIELD, and I.A. WILSON. 2006. How TCRs bind MHCs, peptides, and coreceptors. Annual Review of Immunology. 24:419-466.
SCHNEITER, R. 1999. Brave little yeast, please guide us to Thebes: sphingolipid function in S. cerevisiae. Bioessays. 21:1004-1010.
SCHNEITER, R., B. BRUGGER, R. SANDHOFF, G. ZELLNIG, A. LEBER, M. LAMPL, K. ATHENSTAEDT, C. HRASTNIK, S. EDER, G. DAUM, F. PALTAUF, F.T. WIELAND, and S.D. KOHLWEIN. 1999. Electrospray ionization tandem mass spectrometry (ESI-MS/MS) analysis of the lipid molecular species composition of yeast subcellular membranes reveals acyl chain-based sorting/remodeling of distinct molecular species en route to the plasma membrane. J Cell Biol. 146:741-754.
SCHULTZ, G.A., T.N. CORSO, S.J. PROSSER, and S. ZHANG. 2000. A fully integrated monolithic microchip electrospray device for mass spectrometry. Anal Chem. 72:4058-63.
SCHWUDKE, D., J. OEGEMA, L. BURTON, E. ENTCHEV, J.T. HANNICH, C.S. EJSING, T. KURZCHALIA, and A. SHEVCHENKO. 2006. Lipid profiling by multiple precursor and neutral loss scanning driven by the data-dependent acquisition. Anal Chem. 78:585-95.
SERHAN, C.N. 2005. Mediator lipidomics. Prostaglandins & Other Lipid Mediators. 77:4-14.
SERHAN, C.N., and J. SAVILL. 2005. Resolution of inflammation: The beginning programs the end. Nature Immunology. 6:1191-1197.
SERRANO, R. 1988. H+-ATPase from plasma membranes of Saccharomyces cerevisiae and Avena sativa roots - purification and reconstitution. Methods Enzymol. 157:533-544.
SHERMAN, F. 1991. Getting started with yeast. Methods Enzymol. 194:3-21.
SIMONS, K., and R. EHEHALT. 2002. Cholesterol, lipid rafts, and disease. Journal of Clinical Investigation. 110:597-603.
SIMONS, K., and W.L.C. VAZ. 2004. Model systems, lipid rafts, and cell membranes. Annual Review of Biophysics and Biomolecular Structure. 33:269-295.
SIMS, K.J., S.D. SPASSIEVA, E.O. VOIT, and L.M. OBEID. 2004. Yeast sphingolipid metabolism: clues and connections. Biochem. Cell Biol. 82:45-61.
SMITH, S.W., and R.L. LESTER. 1974. Inositol phosphorylceramide, a novel substance and the chief member of a major group of yeast sphingolipids containing a single inositol phosphate. J Biol Chem. 249:3395-3405.
SOMMER, U., H. HERSCOVITZ, F.K. WELTY, and C.E. COSTELLO. 2006. LC-MS-based method for the qualitative and quantitative analysis of complex lipid mixtures. Journal of Lipid Research. 47:804-814.
SPERLING, P., and E. HEINZ. 2003. Plant sphingolipids: structural diversity, biosynthesis, first genes and functions. Biochim Biophys Acta. 1632:1-15.
STAACK, R.F., E. VARESIO, and G. HOPFGARTNER. 2005. The combination of liquid chromatography/tandem mass spectrometry and chip-based infusion for improved screening and characterization of drug metabolites. Rapid Communications in Mass Spectrometry. 19:618-626.
STEEN, H., B. KUSTER, M. FERNANDEZ, A. PANDEY, and M. MANN. 2001. Detection of tyrosine phosphorylated peptides by precursor ion scanning quadrupole TOF mass spectrometry in positive ion mode. Anal Chem. 73:1440-8.
THOMAS, M.C., T.W. MITCHELL, and S.J. BLANKSBY. 2006. Ozonolysis of phospholipid double bonds during electrospray ionization: A new tool for structure determination. Journal of the American Chemical Society. 128:58-59.
VAN HEUSDEN, G.P., C.P. REUTELINGSPERGER, and H. VAN DEN BOSCH. 1981. Substrate specificity of lysophospholipase-transacylase from rat lung and its action on various physical forms of lysophosphatidylcholine. Biochim Biophys Acta. 663:22-33.
VAN MEER, G. 2005. Cellular lipidomics. Embo Journal. 24:3159-3165.
101
VANCE, D., and J. VANCE. 1996. New Comprehensive Biochemistry Volume 31: Biochemistry of Lipids, Lipoproteins and Membranes. Amsterdam: Elsevier Science B.V.
VEATCH, S.L., and S.L. KELLER. 2003. Separation of liquid phases in giant vesicles of ternary mixtures of phospholipids and cholesterol. Biophysical Journal. 85:3074-3083.
WAITE, K.A., and D.E. VANCE. 2000. Why expression of phosphatidylethanolamine N-methyltransferase does not rescue Chinese hamster ovary cells that have an impaired CDP-choline pathway. J Biol Chem. 275:21197-202.
WALKEY, C.J., L. YU, L.B. AGELLON, and D.E. VANCE. 1998. Biochemical and evolutionary significance of phospholipid methylation. J Biol Chem. 273:27043-6.
WENK, M.R. 2005. The emerging field of lipidomics. Nature Reviews Drug Discovery. 4:594-610.
WENK, M.R., L. LUCAST, G. DI PAOLO, A.J. ROMANELLI, S.F. SUCHY, R.L. NUSSBAUM, G.W. CLINE, G.I. SHULMAN, W. MCMURRAY, and P. DE CAMILLI. 2003. Phosphoinositide profiling in complex lipid mixtures using electrospray ionization mass spectrometry. Nature Biotechnology. 21:813-817.
YAMASHITA, A., T. SUGIURA, and K. WAKU. 1997. Acyltransferases and transacylases involved in fatty acid remodeling of phospholipids and metabolism of bioactive lipids in mammalian cells. J Biochem (Tokyo). 122:1-16.
YOUNG, M.E., T.S. KARPOVA, B. BRUGGER, D.M. MOSCHENROSS, G.K. WANG, R. SCHNEITER, F.T. WIELAND, and J.A. COOPER. 2002. The Sur7p family defines novel cortical domains in Saccharomyces cerevisiae, affects sphingolipid metabolism, and is involved in sporulation. Mol Cell Biol. 22:927-934.
YU, L.J., Y. CHEN, M.P. DENINNO, T.N. O'CONNELL, and C. HOP. 2005. Identification of a novel glutathione adduct of diclofenac, 4 '-hydroxy-2 '-glutathion-deschloro-diclofenac, upon incubation with human liver microsomes. Drug Metabolism and Disposition. 33:484-488.
ZAMFIR, A., Z. VUKELIC, L. BINDILA, J. PETER-KATALINIC, R. ALMEIDA, A. STERLING, and M. ALLEN. 2004. Fully-automated chip-based nanoelectrospray tandem mass spectrometry of gangliosides from human cerebellum. Journal of the American Society for Mass Spectrometry. 15:1649-1657.
ZEMSKI BERRY, K.A., and R.C. MURPHY. 2004. Electrospray ionization tandem mass spectrometry of glycerophosphoethanolamine plasmalogen phospholipids. J Am Soc Mass Spectrom. 15:1499-508.
ZHANG, S., and C.K. VAN PELT. 2004. Chip-based nanoelectrospray mass spectrometry for protein characterization. Expert Rev Proteomics. 1:449-68.
ZHANG, W.G., R.P. TRIBLE, and L.E. SAMELSON. 1998. LAT palmitoylation: Its essential role in membrane microdomain targeting and tyrosine phosphorylation during T cell activation. Immunity. 9:239-246.
ZHANG, X., and G.E. REID. 2006. Multistage tandem mass spectrometry of anionic phosphatidylcholine lipid adducts reveals novel dissociation pathways. International Journal of Mass Spectrometry. 252:242-255.

102
7. APPENDIX: LIST OF FRAGMENT IONS
Table 1A. FA and lipid class-specific fragment ions commonly used for MPIS in negative ion mode.
Fragment ion m/z Specific detection of [Glycerolphosphate – H2O]- 153.0 PA/PG/PS/PI [Cholinephosphate – 15]- 168.0 PC/LPC FA 10:0 171.1 glycerophospholipid species FA 11:0 185.2 glycerophospholipid species [ethanolaminephosphate – H2O]- 196.0 PE/LPE FA 12:0 199.2 glycerophospholipid species FA 13:1 211.2 glycerophospholipid species O-14:1 211.2 plasmenyl species FA 13:0 213.2 glycerophospholipid species [Inositolphosphate – 2H2O]- 223.0 PI [dimethylethanolaminephosphate – H2O]- 224.1 PC/LPC/dimethylphosphoethanolamine FA 14:1 225.2 glycerophospholipid species FA 14:0 227.2 glycerophospholipid species FA 15:2 237.2 glycerophospholipid species O-16:2 237.2 plasmenyl species FA 15:1 239.2 glycerophospholipid species O-16:1 239.2 plasmenyl species [Inositolsphophate – H2O]- 241.0 PI FA 15:0 241.2 glycerophospholipid species FA 16:2 251.2 glycerophospholipid species FA 16:1 253.2 glycerophospholipid species FA 16:0 255.2 glycerophospholipid species FA 20:5-CO2 257.2 glycerophospholipid species [Inositolphosphate]- 259.0 PI FA 20:4-CO2 259.2 glycerophospholipid species FA 17:2 265.2 glycerophospholipid species O-18:2 265.3 plasmenyl species FA 17:1 267.2 glycerophospholipid species O-18:1 267.3 plasmenyl species FA 17:0 269.3 glycerophospholipid species FA 18:3 277.2 glycerophospholipid species FA 18:2 279.2 glycerophospholipid species FA 18:1 281.3 glycerophospholipid species FA 22:6-CO2 283.2 glycerophospholipid species FA 18:0 283.3 glycerophospholipid species FA 22:5-CO2 285.3 glycerophospholipid species FA 22:4-CO2 287.3 glycerophospholipid species FA 19:2 293.3 glycerophospholipid species O-20:2 293.3 plasmenyl species O-20:1 295.3 plasmenyl species FA 19:1 295.3 glycerophospholipid species FA 19:0 297.3 glycerophospholipid species FA 20:5 301.2 glycerophospholipid species FA 20:4 303.2 glycerophospholipid species FA 20:3 305.2 glycerophospholipid species FA 20:2 307.3 glycerophospholipid species FA 20:1 309.3 glycerophospholipid species FA 20:0 311.3 glycerophospholipid species FA 22:6 327.2 glycerophospholipid species FA 22:5 329.2 glycerophospholipid species FA 22:4 331.3 glycerophospholipid species FA 22:3 333.3 glycerophospholipid species FA 22:2 335.3 glycerophospholipid species FA 22:1 337.3 glycerophospholipid species FA 22:0 339.3 glycerophospholipid species FA 26:0 395.4 glycerophospholipid species

103
8. PUBLICATIONS
Ekroos K, Ejsing CS, Bahr U, Karas M, Simons K, Shevchenko A.
Charting molecular composition of phosphatidylcholines by fatty acid scanning and
ion trap MS3 fragmentation J Lipid Res. 2003 Nov;44(11):2181-92
Equal contributions by Ekroos and Ejsing.
Kuerschner L, Ejsing CS, Ekroos K, Shevchenko A, Anderson KI, Thiele C.
Polyene-lipids: a new tool to image lipids Nat Methods. 2005 Jan;2(1):39-45
Ejsing CS, Moehring T, Bahr U, Duchoslav, Karas M, Simons K, Shevchenko A.
Collision-induced dissociation pathways of yeast sphingolipids and their molecular
profiling in total lipid extracts: a study by quadrupole TOF and linear ion trap-orbitrap
mass spectrometry J Mass Spectrom. 2006 Mar;41(3):372-89.
Ejsing CS, Duchoslav E, Simons K, Thiele C, Ekroos K, Shevchenko A.
Automated identification and quantification of glycerophospholipid molecular species
by multiple precursor ion scanning Anal Chem. 2006 Sep 1;78(17):6202-14.
Özcan N, Ejsing CS, Lipski A, Morbach S, Shevchenko A, Krämer R
Activitiy modulation of the betaine transporter BetP from Corynebacterium
glutamicum by changes in osmolality, temperature and lipid surrounding Submitted
104
9. ACKNOWLEDGMENTS
I thank my advisors Kai Simons and Andrej Shevchenko for providing the facilities and
resources I needed throughout this thesis study, for their educational conversations and
putting their trust in me.
I am indebted to my friends and colleagues; Kim Ekroos, Robin Klemm, Vineeth
Surendranath, Julio Sampaio for their collaboration, kind support and advice in many aspects
of life and the work I carried out. I thank all group members of the Simons and Shevchenko
laboratories for their expert advice, critical discussions and assistance. Thanks to Michel
Bagnat and Tomasz Proszynski for providing me with yeast strains. I thank Ms. Judith
Nicholls and Dominik Schwudke for their critical reading of manuscripts.
I especially thank Eva Duchoslav and Ron Bonner for the indispensable collaboration
which fostered the Lipid Profiler software. I am grateful to Igor Chernushevich and Lyle
Burton for their expert advice on quadrupole time-of-flight mass spectrometry and data
processing.
I am grateful to Christoph Thiele for synthesizing PI 17:0/17:0 and his constructive
comments. I thank Lars Kuerschner for the interesting and fruitful collaboration on the
metabolism of polyene-lipids. I thank Gerhard Liebisch for his technical assistance with the
cholesterol quantification and the comparison of our methodologies. Thanks to Uta Bahr and
Thomas Möhring for their kind assistance with ion trap mass spectrometry. A special thanks
to Reinaldo Almeida and Mark Baumert for their expert advice on NanoMate HD System
operation.
I thank Tobias Zech and Thomas Harder for the collaboration on charting the lipid
composition of TCR signaling domains. I thank Nuran Özcan, Reinhard Krämer, Ching-Ju
Tsai and Christine Ziegler for the collaborative studies on activity modulation and
crystallization of the betaine transporter BetP from Corynebacterium glutamicum.
I am grateful to Bernard Hoflack and Michael Karas for reviewing my thesis.
Finally, I would like to thank my parents, my brother and my grandparents for supporting
me throughout my life, for providing me the foundation for what I have accomplished today.
And, thank you, Dalma, for loving me!
105
10. DECLARATION ACCORDING TO § 5.5
I herewith declare that I have produced this paper without the prohibited assistance of third
parties and without making use of aids other than those specified; notions taken over directly
or indirectly from other sources have been identified as such. This paper has not previously
been presented in identical or similar form to any other German or foreign examination board.
The thesis work was conducted from 1.10.2003 to 16.10.2006 under the supervision of Kai
Simons and Andrej Shevchenko at the Max Planck Institute of Molecular Cell Biology and
Genetics, Dresden.
Dresden, 16. October 2006
Christer Stenby Ejsing