Nordea 1 Global Climate & Environment Fund · • Hexcel zählt zu den weltweit führenden...
29
For Professionals Only* Nordea 1 – Global Climate & Environment Fund LU0348926287, BP-EUR (thesaurierend) LU0994683356, AP-EUR (ausschüttend) October 2017 *die gemäß MiFID-Definition (Richtlinie 2004/39/EG) auf eigene Rechnung anlagen
Transcript of Nordea 1 Global Climate & Environment Fund · • Hexcel zählt zu den weltweit führenden...

For Professionals Only*
Nordea 1 – Global Climate & Environment Fund
LU0348926287, BP-EUR (thesaurierend)
LU0994683356, AP-EUR (ausschüttend)
October 2017
*die gemäß MiFID-Definition (Richtlinie 2004/39/EG) auf eigene Rechnung anlagen
For Professionals Only
2
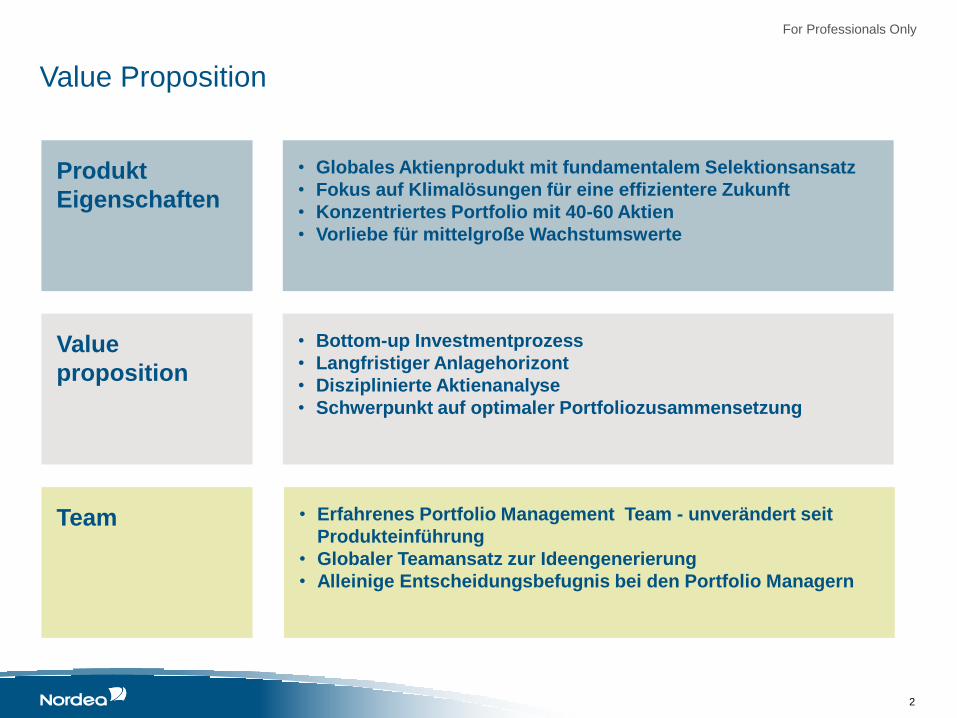
Value Proposition
Produkt
Eigenschaften
• Globales Aktienprodukt mit fundamentalem Selektionsansatz
• Fokus auf Klimalösungen für eine effizientere Zukunft
• Konzentriertes Portfolio mit 40-60 Aktien
• Vorliebe für mittelgroße Wachstumswerte
Team
Value
proposition
• Bottom-up Investmentprozess
• Langfristiger Anlagehorizont
• Disziplinierte Aktienanalyse
• Schwerpunkt auf optimaler Portfoliozusammensetzung
• Erfahrenes Portfolio Management Team - unverändert seit
Produkteinführung
• Globaler Teamansatz zur Ideengenerierung
• Alleinige Entscheidungsbefugnis bei den Portfolio Managern
For Professionals Only
3
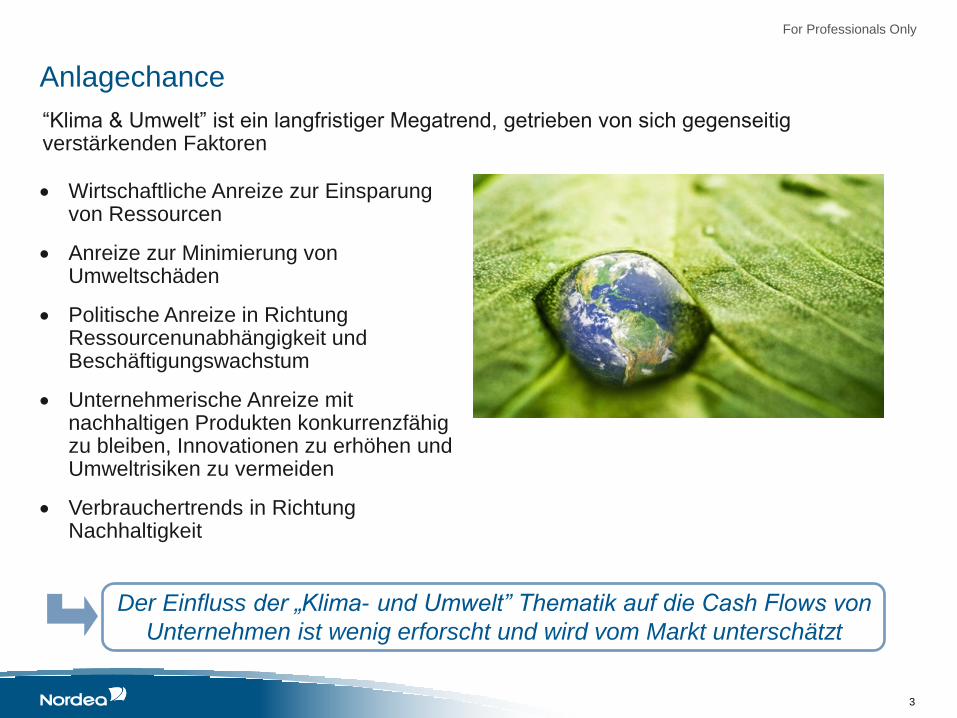
Anlagechance
“Klima & Umwelt” ist ein langfristiger Megatrend, getrieben von sich gegenseitig verstärkenden Faktoren
Der Einfluss der „Klima- und Umwelt” Thematik auf die Cash Flows von
Unternehmen ist wenig erforscht und wird vom Markt unterschätzt
Wirtschaftliche Anreize zur Einsparung von Ressourcen
Anreize zur Minimierung von Umweltschäden
Politische Anreize in Richtung Ressourcenunabhängigkeit und Beschäftigungswachstum
Unternehmerische Anreize mit nachhaltigen Produkten konkurrenzfähig zu bleiben, Innovationen zu erhöhen und Umweltrisiken zu vermeiden
Verbrauchertrends in Richtung Nachhaltigkeit
For Professionals Only
4
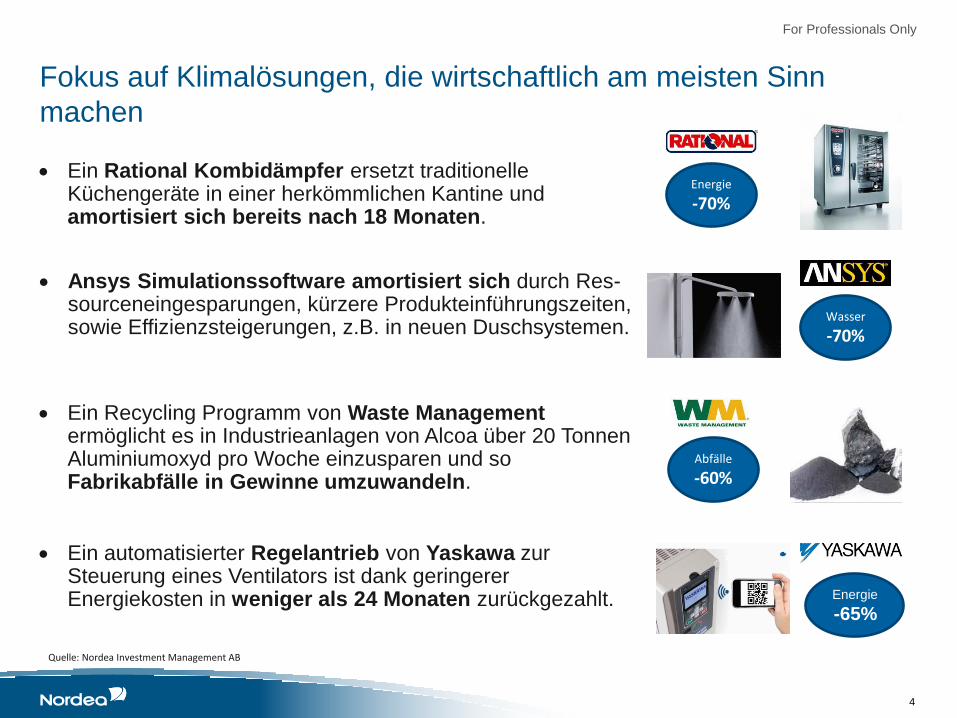
Fokus auf Klimalösungen, die wirtschaftlich am meisten Sinn
machen
Energie
-70%
Wasser
-70%
Abfälle
-60%
Ein Rational Kombidämpfer ersetzt traditionelle Küchengeräte in einer herkömmlichen Kantine und amortisiert sich bereits nach 18 Monaten.
Ansys Simulationssoftware amortisiert sich durch Res-sourceneingesparungen, kürzere Produkteinführungszeiten, sowie Effizienzsteigerungen, z.B. in neuen Duschsystemen.
Quelle: Nordea Investment Management AB
Ein Recycling Programm von Waste Management ermöglicht es in Industrieanlagen von Alcoa über 20 Tonnen Aluminiumoxyd pro Woche einzusparen und so Fabrikabfälle in Gewinne umzuwandeln.
Ein automatisierter Regelantrieb von Yaskawa zur Steuerung eines Ventilators ist dank geringerer Energiekosten in weniger als 24 Monaten zurückgezahlt. Energie
-65%
For Professionals Only
5
Quelle: Nordea Investment Management AB
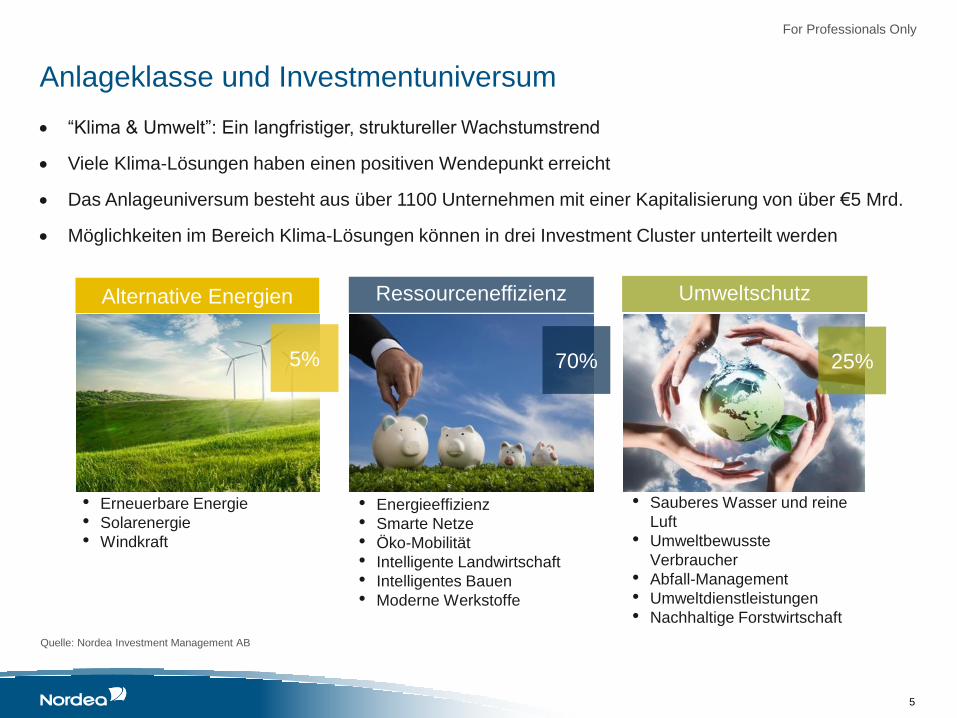
Anlageklasse und Investmentuniversum
Resource Efficiency Umweltschutz Alternative Energien Ressourceneffizienz
5% 70% 25%
• Erneuerbare Energie
• Solarenergie
• Windkraft
• Energieeffizienz
• Smarte Netze
• Öko-Mobilität
• Intelligente Landwirtschaft
• Intelligentes Bauen
• Moderne Werkstoffe
• Sauberes Wasser und reine
Luft
• Umweltbewusste
Verbraucher
• Abfall-Management
• Umweltdienstleistungen
• Nachhaltige Forstwirtschaft
“Klima & Umwelt”: Ein langfristiger, struktureller Wachstumstrend
Viele Klima-Lösungen haben einen positiven Wendepunkt erreicht
Das Anlageuniversum besteht aus über 1100 Unternehmen mit einer Kapitalisierung von über €5 Mrd.
Möglichkeiten im Bereich Klima-Lösungen können in drei Investment Cluster unterteilt werden

For Professionals Only
6
Wachsendes und sich wandelndes Anlageuniversum
Resource Efficiency
Quelle: Nordea Investment Management AB
Marktvolumen und Veränderungen des „Klima und Umwelt“
Anlageuniversums 2010 bis 2015
# 800 880 880 925 1000 1080
# = Nettoanzahl von Unternehmen im “Klima und Umwelt“ Anlageuniversums
For Professionals Only
7
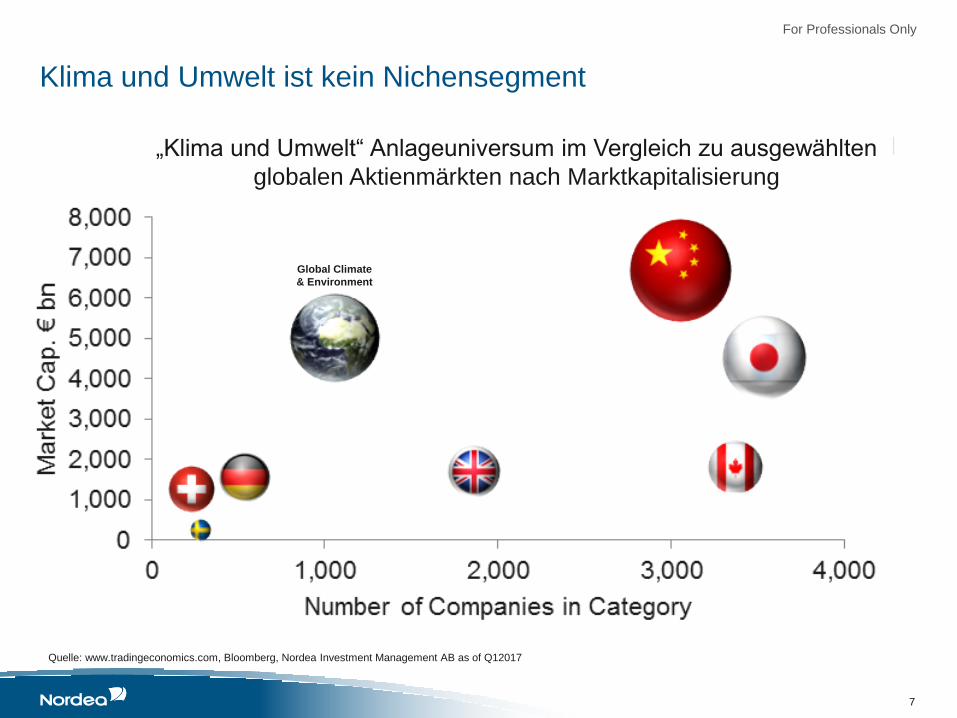
Klima und Umwelt ist kein Nichensegment
Resource Efficiency
Quelle: www.tradingeconomics.com, Bloomberg, Nordea Investment Management AB as of Q12017
„Klima und Umwelt“ Anlageuniversum im Vergleich zu ausgewählten
globalen Aktienmärkten nach Marktkapitalisierung
Global Climate
& Environment
For Professionals Only
8
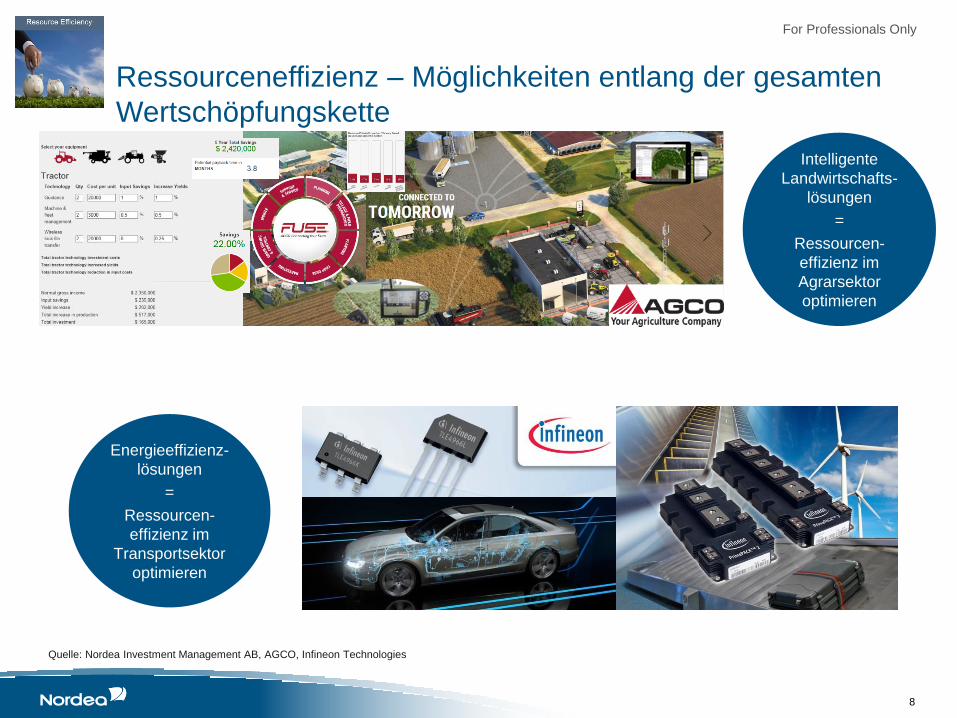
Ressourceneffizienz – Möglichkeiten entlang der gesamten
Wertschöpfungskette
Intelligente
Landwirtschafts-
lösungen
=
Ressourcen-
effizienz im
Agrarsektor
optimieren
Energieeffizienz-
lösungen
=
Ressourcen-
effizienz im
Transportsektor
optimieren
Quelle: Nordea Investment Management AB, AGCO, Infineon Technologies
For Professionals Only
9
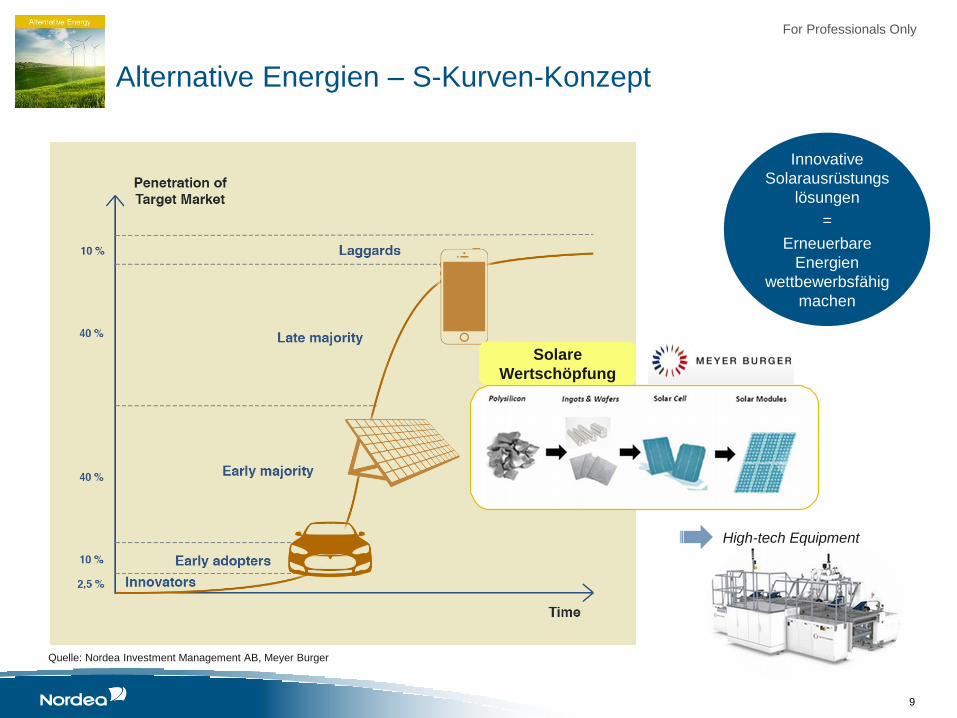
Alternative Energien – S-Kurven-Konzept
Innovative
Solarausrüstungs
lösungen
=
Erneuerbare
Energien
wettbewerbsfähig
machen
Quelle: Nordea Investment Management AB, Meyer Burger
High-tech Equipment
Solare
Wertschöpfung
For Professionals Only
10
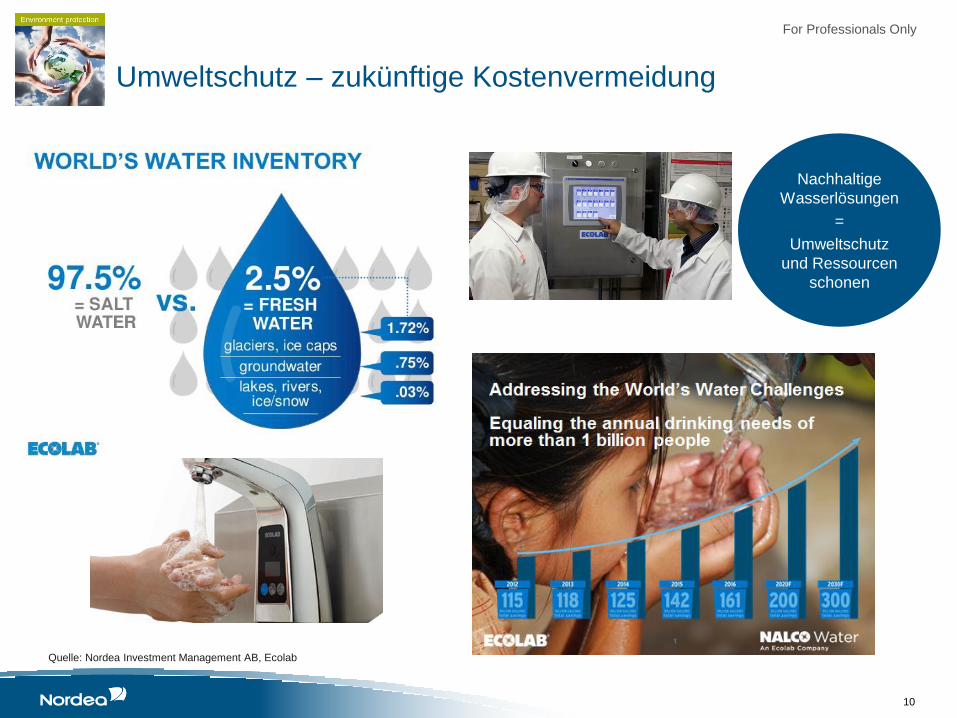
Umweltschutz – zukünftige Kostenvermeidung
Nachhaltige
Wasserlösungen
=
Umweltschutz
und Ressourcen
schonen
Quelle: Nordea Investment Management AB, Ecolab

For Professionals Only
11
Investment Team
Das “Klima und Umwelt” Portfolio Management ist Teil einer starken globalen Research Plattform, die wertvollen Input für den Investmentprozess liefert
24 Investmentprofis sind an der Ideengenerierung beteiligt
Thomas Sørensen
Portfolio Manager, 19 Jahre Investment-
erfahrung mit Nordea
Henning Padberg
Portfolio Manager, 8 Jahre Investment-
erfahrung mit Nordea
Research Plattform
16 “Globale Super-Sektoren” Analysten
− Konsumenten
− Rohstoffe
− Zyklische Werte
− Finanzwerte
− Regulierte Unternehmen
6 Schwellenländer Spezialisten
2 Nebenwerte Spezialisten (Small/Mid)

For Professionals Only
12
Der Investmentprozess
~1100
~200
Anlageuniversum der
„Klima und Umwelt“ Nutznießer
Liquiditätsfilter
Ausschluss < 10 Handelstage
Strategische
Unternehmensbewertung
Unternehmenskultur, Fundamentaldaten
und Finanzlage
Anzahl
Unternehmen
~500
Bewertung Erwartungen und
Bewertung des
diskontierten
Cashflows
Optimiertes Portfolio
aus 40 bis 60
Einzeltiteln
Environment ProtectionAlternative Energy Resource Efficiency Environment Protection
5% 70% 25%
13
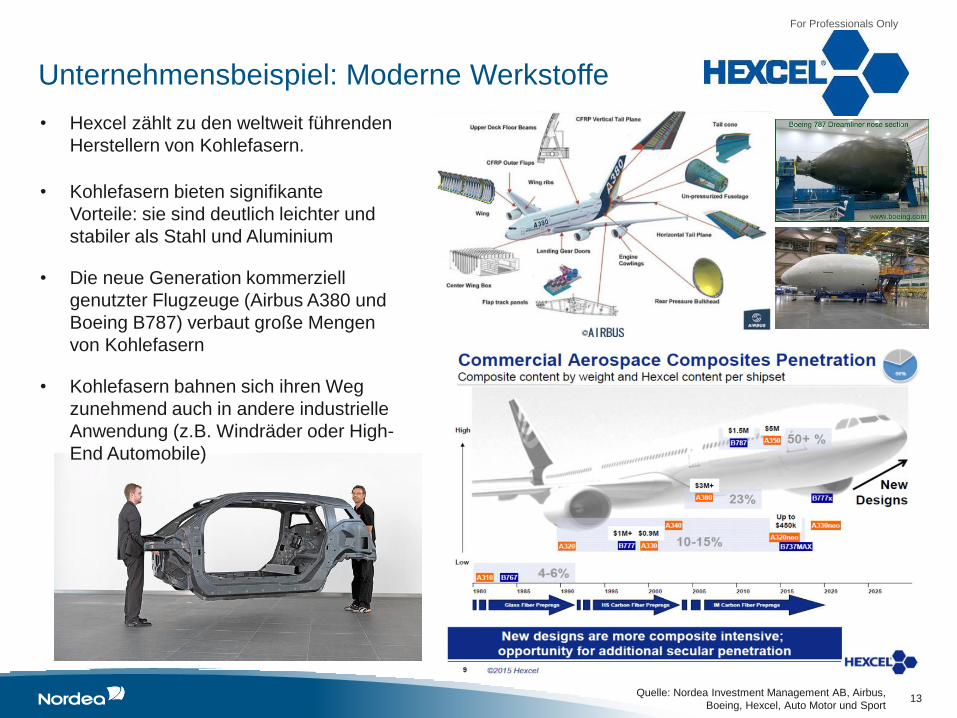
• Hexcel zählt zu den weltweit führenden
Herstellern von Kohlefasern.
• Kohlefasern bieten signifikante
Vorteile: sie sind deutlich leichter und
stabiler als Stahl und Aluminium
• Die neue Generation kommerziell
genutzter Flugzeuge (Airbus A380 und
Boeing B787) verbaut große Mengen
von Kohlefasern
• Kohlefasern bahnen sich ihren Weg
zunehmend auch in andere industrielle
Anwendung (z.B. Windräder oder High-
End Automobile)
Quelle: Nordea Investment Management AB, Airbus,
Boeing, Hexcel, Auto Motor und Sport
For Professionals Only
Unternehmensbeispiel: Moderne Werkstoffe

• Starke Fokussierung auf moderne Werkstoffe,
profitiert von steigender Kohlefasernachfrage
Essenziell für die Steigerung der Treibstoff-
Effizienz im Transportsektor
• Solides ESG Profil mit einem BBB ESG Rating
• Starke Fundamentaldaten, solide Finanzlage
und innovative Unternehmenskultur
• Nachhaltig wachsender Markt für Kohlefasern
• Weltweite Nr. 1 mit hohen Eintrittsbarrieren
• Hohe Auftragsvisibilität dank hoher
Auftragsbestände in der Flugzeugindustrie
• Attraktive Gewinnmarge und Erträge
• Erfahrenes Management
• Bewertung rechtfertigt 20% Kurspotenzial
• Attraktives Risiko-Ertrags Profil im Hinblick auf
das Portfolio
For Professionals Only
Source: Nordea Investment Management AB,
Hexcel, CS Holt
20% höhere Treibstoffeffizienz im
Vergleich zu Flugzeugen
ähnlicher Größe
14
Unternehmensbeispiel: Moderne Werkstoffe
For Professionals Only
15
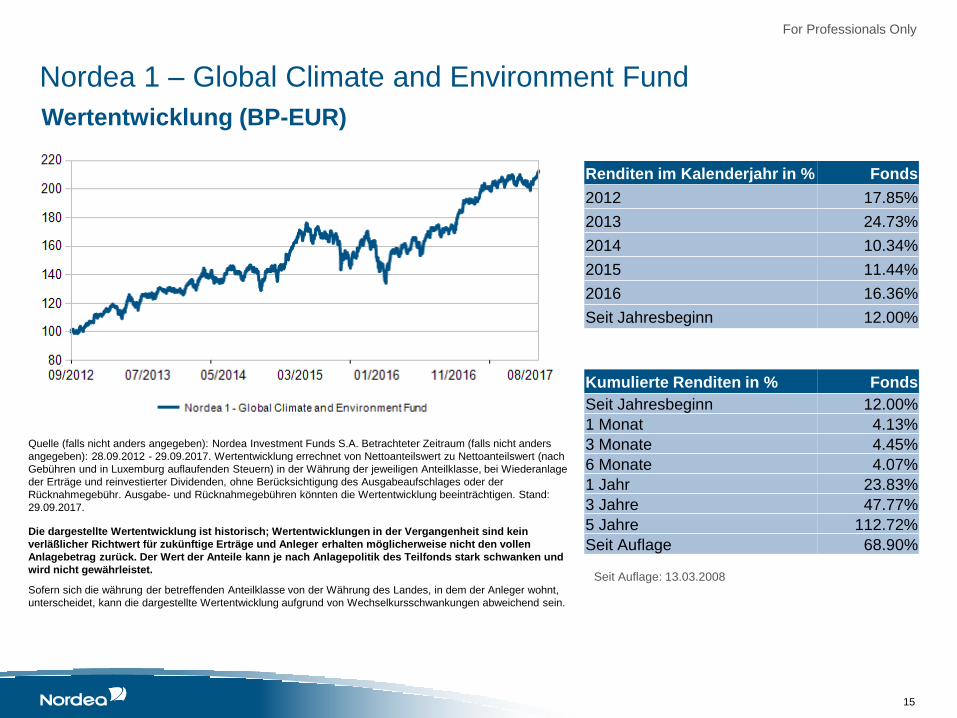
Wertentwicklung (BP-EUR)
Nordea 1 – Global Climate and Environment Fund
Seit Auflage: 13.03.2008
Renditen im Kalenderjahr in % Fonds
2012 17.85%
2013 24.73%
2014 10.34%
2015 11.44%
2016 16.36%
Seit Jahresbeginn 12.00%
Kumulierte Renditen in % Fonds
Seit Jahresbeginn 12.00%
1 Monat 4.13%
3 Monate 4.45%
6 Monate 4.07%
1 Jahr 23.83%
3 Jahre 47.77%
5 Jahre 112.72%
Seit Auflage 68.90%
Quelle (falls nicht anders angegeben): Nordea Investment Funds S.A. Betrachteter Zeitraum (falls nicht anders
angegeben): 28.09.2012 - 29.09.2017. Wertentwicklung errechnet von Nettoanteilswert zu Nettoanteilswert (nach
Gebühren und in Luxemburg auflaufenden Steuern) in der Währung der jeweiligen Anteilklasse, bei Wiederanlage
der Erträge und reinvestierter Dividenden, ohne Berücksichtigung des Ausgabeaufschlages oder der
Rücknahmegebühr. Ausgabe- und Rücknahmegebühren könnten die Wertentwicklung beeinträchtigen. Stand:
29.09.2017.
Die dargestellte Wertentwicklung ist historisch; Wertentwicklungen in der Vergangenheit sind kein
verläßlicher Richtwert für zukünftige Erträge und Anleger erhalten möglicherweise nicht den vollen
Anlagebetrag zurück. Der Wert der Anteile kann je nach Anlagepolitik des Teilfonds stark schwanken und
wird nicht gewährleistet.
Sofern sich die währung der betreffenden Anteilklasse von der Währung des Landes, in dem der Anleger wohnt,
unterscheidet, kann die dargestellte Wertentwicklung aufgrund von Wechselkursschwankungen abweichend sein.
For Professionals Only
16
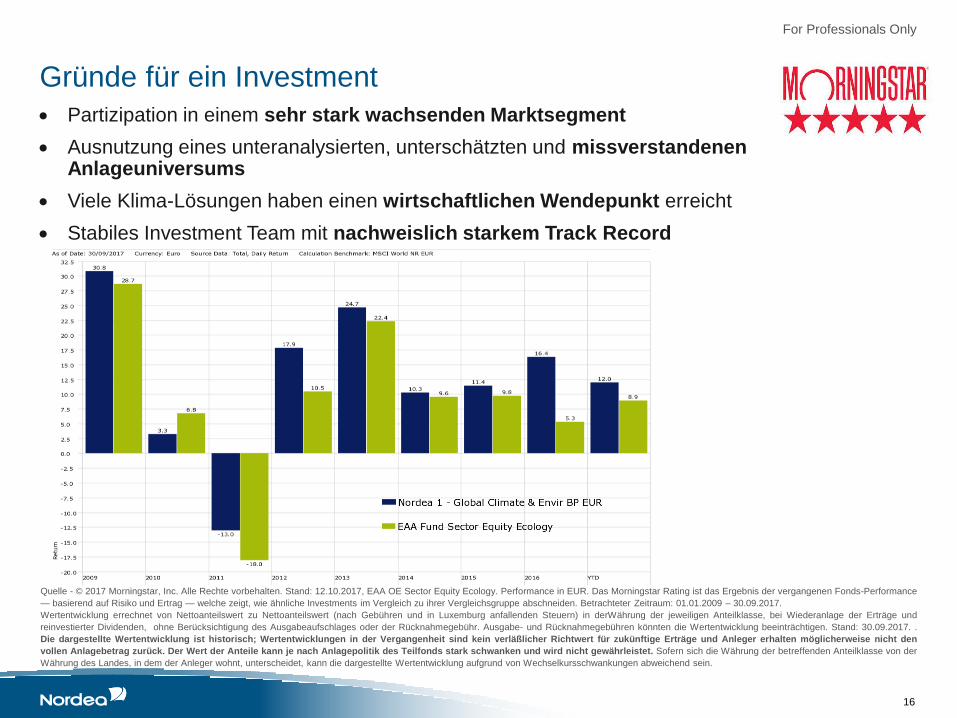
Partizipation in einem sehr stark wachsenden Marktsegment
Ausnutzung eines unteranalysierten, unterschätzten und missverstandenen Anlageuniversums
Viele Klima-Lösungen haben einen wirtschaftlichen Wendepunkt erreicht
Stabiles Investment Team mit nachweislich starkem Track Record
Gründe für ein Investment
Quelle - © 2017 Morningstar, Inc. Alle Rechte vorbehalten. Stand: 12.10.2017, EAA OE Sector Equity Ecology. Performance in EUR. Das Morningstar Rating ist das Ergebnis der vergangenen Fonds-Performance
— basierend auf Risiko und Ertrag — welche zeigt, wie ähnliche Investments im Vergleich zu ihrer Vergleichsgruppe abschneiden. Betrachteter Zeitraum: 01.01.2009 – 30.09.2017.
Wertentwicklung errechnet von Nettoanteilswert zu Nettoanteilswert (nach Gebühren und in Luxemburg anfallenden Steuern) in derWährung der jeweiligen Anteilklasse, bei Wiederanlage der Erträge und
reinvestierter Dividenden, ohne Berücksichtigung des Ausgabeaufschlages oder der Rücknahmegebühr. Ausgabe- und Rücknahmegebühren könnten die Wertentwicklung beeinträchtigen. Stand: 30.09.2017. .
Die dargestellte Wertentwicklung ist historisch; Wertentwicklungen in der Vergangenheit sind kein verläßlicher Richtwert für zukünftige Erträge und Anleger erhalten möglicherweise nicht den
vollen Anlagebetrag zurück. Der Wert der Anteile kann je nach Anlagepolitik des Teilfonds stark schwanken und wird nicht gewährleistet. Sofern sich die Währung der betreffenden Anteilklasse von der
Währung des Landes, in dem der Anleger wohnt, unterscheidet, kann die dargestellte Wertentwicklung aufgrund von Wechselkursschwankungen abweichend sein.

• Appendix
For Professionals Only
18
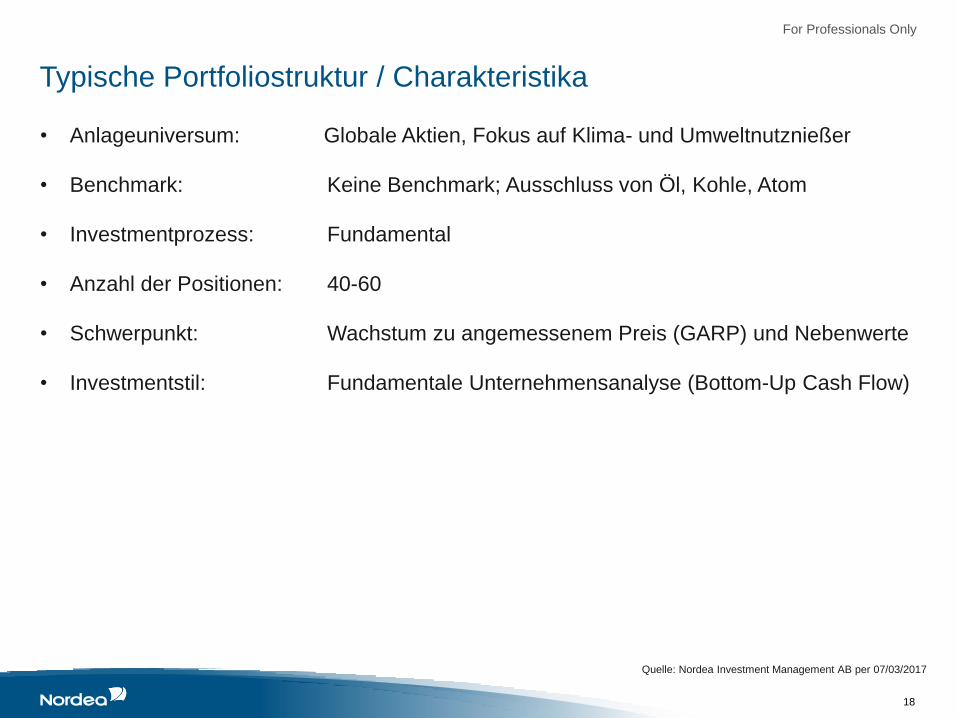
Typische Portfoliostruktur / Charakteristika
Quelle: Nordea Investment Management AB per 07/03/2017
• Anlageuniversum: Globale Aktien, Fokus auf Klima- und Umweltnutznießer
• Benchmark: Keine Benchmark; Ausschluss von Öl, Kohle, Atom
• Investmentprozess: Fundamental
• Anzahl der Positionen: 40-60
• Schwerpunkt: Wachstum zu angemessenem Preis (GARP) und Nebenwerte
• Investmentstil: Fundamentale Unternehmensanalyse (Bottom-Up Cash Flow)
For Professionals Only
19
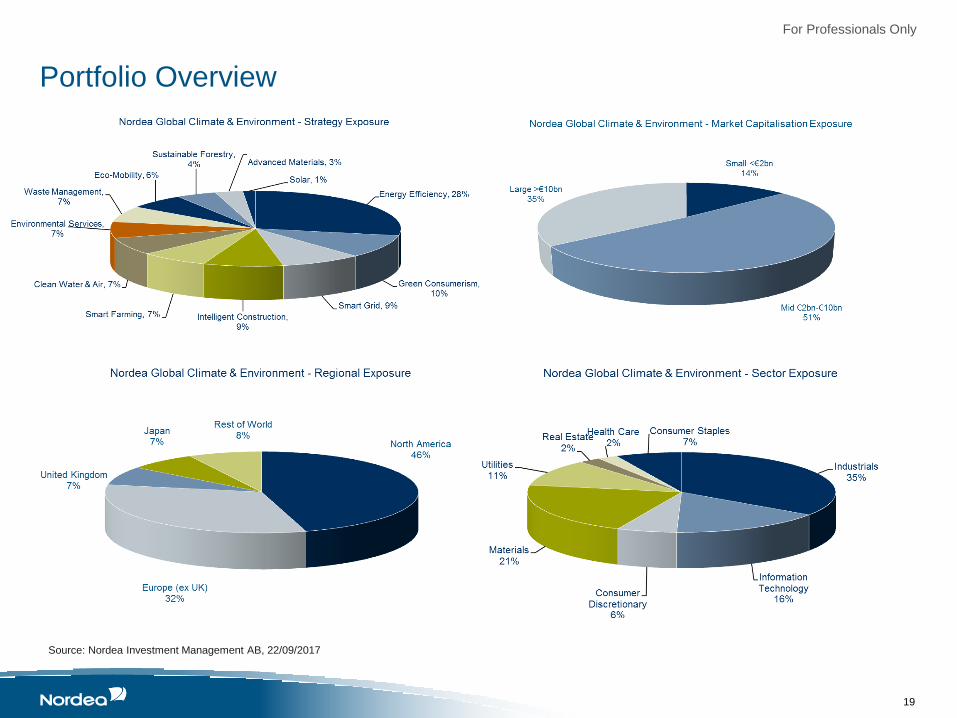
Portfolio Overview
Source: Nordea Investment Management AB, 22/09/2017
For Professionals Only
20
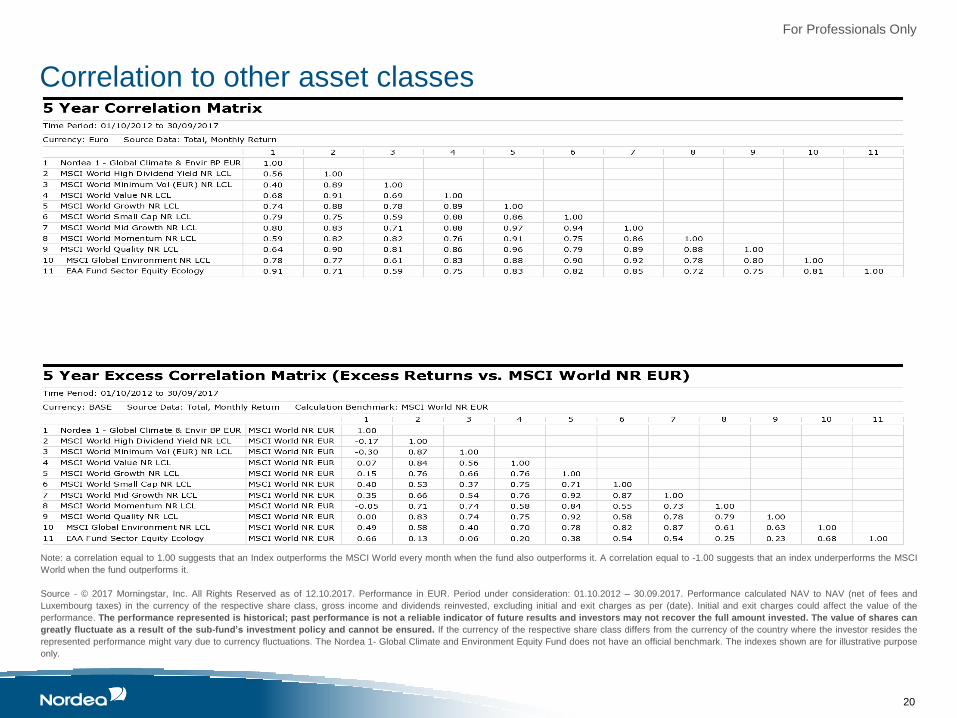
Correlation to other asset classes
Note: a correlation equal to 1.00 suggests that an Index outperforms the MSCI World every month when the fund also outperforms it. A correlation equal to -1.00 suggests that an index underperforms the MSCI
World when the fund outperforms it.
Source - © 2017 Morningstar, Inc. All Rights Reserved as of 12.10.2017. Performance in EUR. Period under consideration: 01.10.2012 – 30.09.2017. Performance calculated NAV to NAV (net of fees and
Luxembourg taxes) in the currency of the respective share class, gross income and dividends reinvested, excluding initial and exit charges as per (date). Initial and exit charges could affect the value of the
performance. The performance represented is historical; past performance is not a reliable indicator of future results and investors may not recover the full amount invested. The value of shares can
greatly fluctuate as a result of the sub-fund’s investment policy and cannot be ensured. If the currency of the respective share class differs from the currency of the country where the investor resides the
represented performance might vary due to currency fluctuations. The Nordea 1- Global Climate and Environment Equity Fund does not have an official benchmark. The indexes shown are for illustrative purpose
only.
For Professionals Only
21
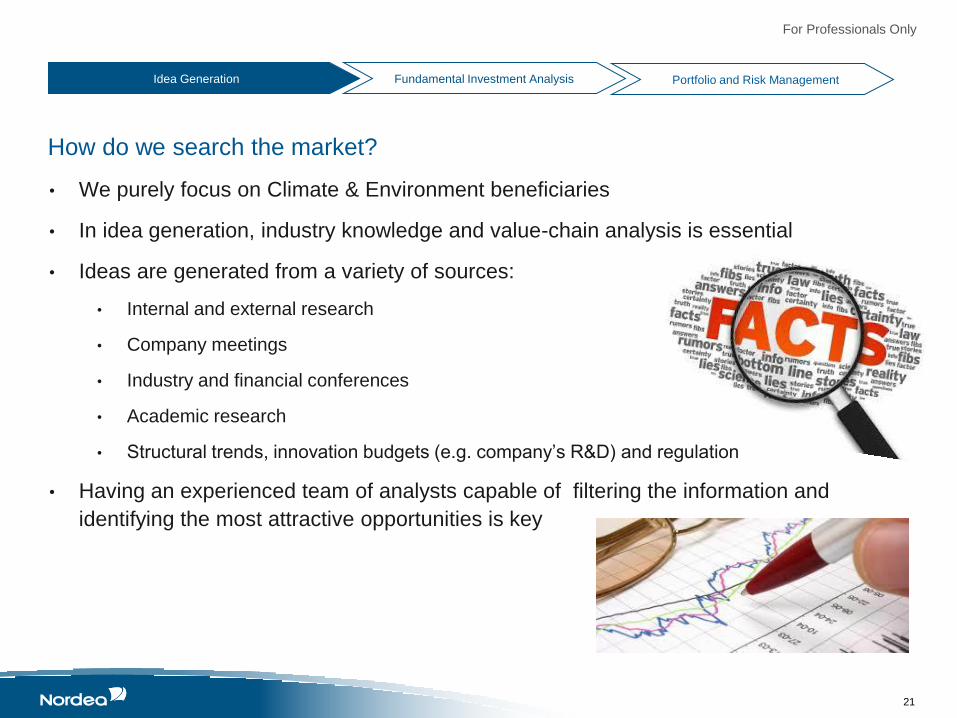
How do we search the market?
Idea Generation Fundamental Investment Analysis Portfolio and Risk Management
• We purely focus on Climate & Environment beneficiaries
• In idea generation, industry knowledge and value-chain analysis is essential
• Ideas are generated from a variety of sources:
• Internal and external research
• Company meetings
• Industry and financial conferences
• Academic research
• Structural trends, innovation budgets (e.g. company’s R&D) and regulation
• Having an experienced team of analysts capable of filtering the information and
identifying the most attractive opportunities is key

For Professionals Only
22
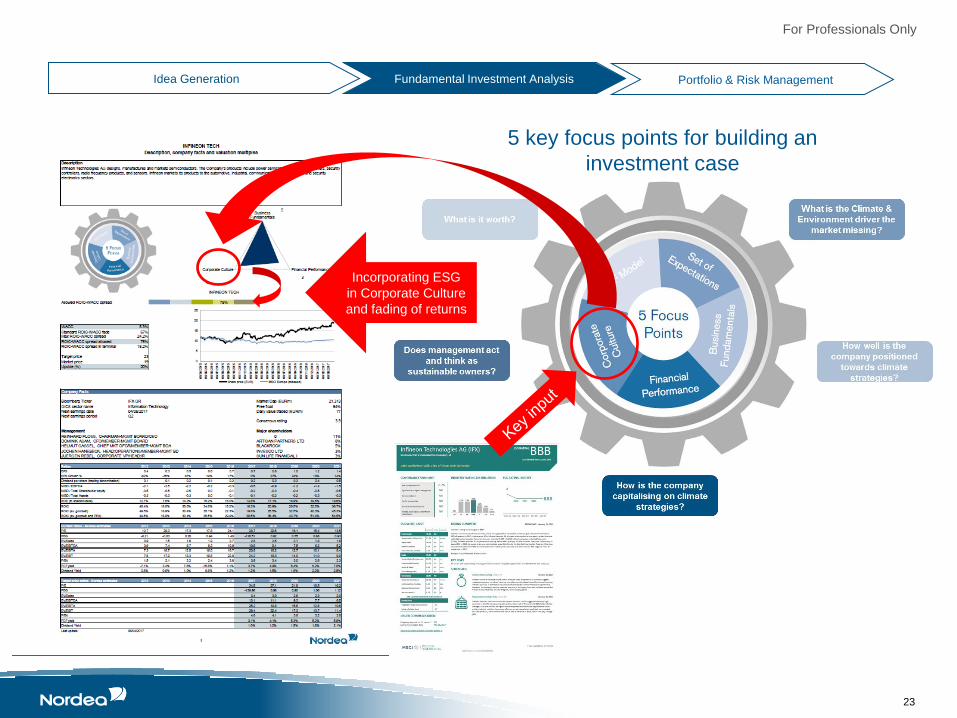
Idea Generation Fundamental Investment Analysis Portfolio & Risk Management
5 key focus points for building an investment case
How well is the
company positioned
towards climate
strategies?
How is the company
capitalising on climate
strategies?
Does management act
and think as
sustainable owners?
What is it worth?
What is the Climate &
Environment driver the
market missing?
For Professionals Only
23
Idea Generation Fundamental Investment Analysis Portfolio & Risk Management
5 key focus points for building an
investment case
Incorporating ESG
in Corporate Culture
and fading of returns
For Professionals Only
24
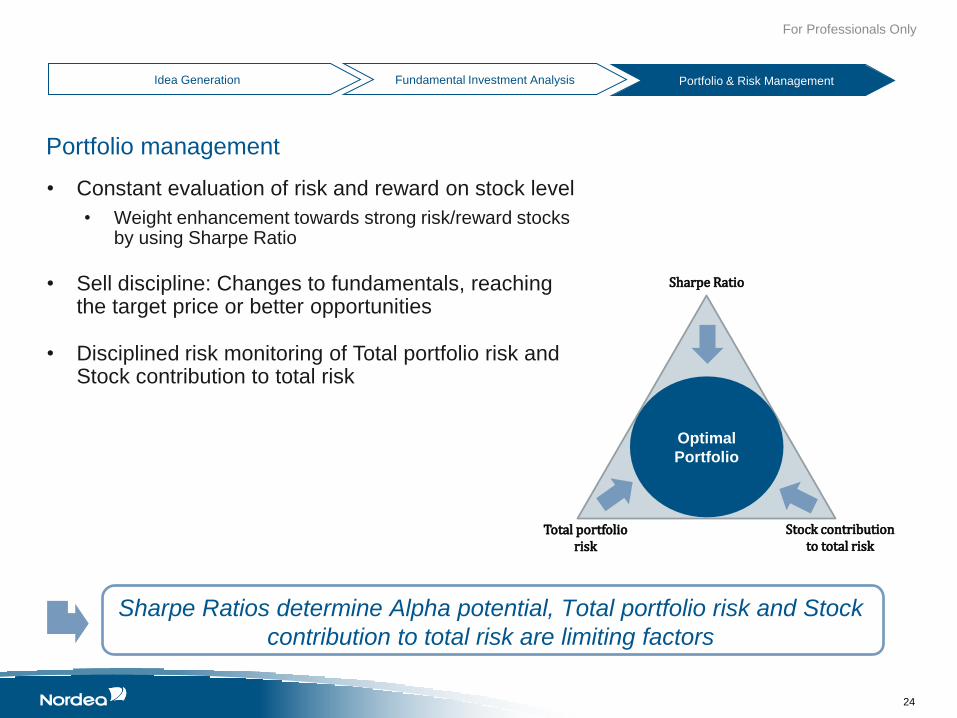
Idea Generation Fundamental Investment Analysis Portfolio & Risk Management
• Constant evaluation of risk and reward on stock level
• Weight enhancement towards strong risk/reward stocks by using Sharpe Ratio
• Sell discipline: Changes to fundamentals, reaching the target price or better opportunities
• Disciplined risk monitoring of Total portfolio risk and Stock contribution to total risk
Portfolio management
Stock contribution to total risk
Optimal
Portfolio
Total portfolio risk
Sharpe Ratio
Sharpe Ratios determine Alpha potential, Total portfolio risk and Stock
contribution to total risk are limiting factors

For Professionals Only
25
Idea Generation Fundamental Investment Analysis Portfolio & Risk Management
Stock contribution to total risk
Optimal
Portfolio
Total portfolio risk
Sharpe Ratio
Stock contribution to total risk
Optimal
Portfolio
Total portfolio risk
Sharpe Ratio
Source: Nordea Investment Management AB, as of 14/08/2017

For Professionals Only
26
Risk management & control
• Ongoing risk dialogue
• Pre-trade analysis
• Monthly risk reviews
• Dedicated Risk Management team
• Standardized risk reporting based on MSCI
Barra and Style Research
• Ad-hoc risk analysis (e.g. style biases,
market scenarios, portfolio optimization)
• Internal Risk Control team
• Line and limit controls
• Liquidity control (UCITS compliant)
Idea Generation Fundamental Investment Analysis Portfolio & Risk Management
N2205-LUA - Nordea 1 - Climate and Environment E.Fund - AssetDate: 15-Dec-14
Main Risk Numbers Benchmark: MSCI World (NDR)
Total Risk 14.62%
Benchmark Risk 12.26% (Std.Dev. of Return) Portfolio (Beg Last mth) Benchmark (Beg Last mth) Active (Beg Last mth) Trend AR % AR
Active Risk 5.52% Total Risk 14.62 (15.13) 12.26 (12.45) 5.52 (5.82) Down 100.00%
Beta Benchmark 1.11 Local Market Risk 15.13 (15.68) 12.33 (12.5) 5.51 (5.82) Down 99.67%
Market Value BarraOne (EUR) 43,414,626 Common Factor Risk 14.85 (15.39) 12.31 (12.48) 4.63 (4.93) Down 70.37%
Base Currency Cash % 1.0% Industry 13.72 (13.91) 12.26 (12.45) 3.10 (3.05) Neutral 31.45%
Gross Future Exposure 0.0% Style 2.59 (2.84) 0.58 (0.6) 2.97 (3.23) Down 28.89%
Net Future Exposure 0.0% Factor Interaction 10.03%
Active Share 99% Selection Risk 2.92 (3.03) 0.73 (0.74) 2.99 (3.1) Down 29.30%
Number of assets (excl. cash buckets) 49 Currency Risk 4.98 (5.13) 5.59 (5.7) 0.74 (0.72) Up 1.79%
Number of rejected assets 0 Currency/Market Interaction -1.45%
Largest Active Weights - Issuer Largest MCAR (riskiest securities) in Portfolio - Issuer
Name
Por
Weight
Benchmark
Weight
Active
Weight
Total
Risk (%) Beta MCAR
% Ctr to
Act Risk Name Por Weight
Benchmark
Weight
Active
Weight
Total Risk
(%) Beta MCAR
% Ctr to
Act Risk
Hexcel Corp 3.77% 0.00% 3.77% 23.30 1.15 0.08 5.2% SMA Solar Technology AG 0.56% 0.00% 0.56% 57.03 1.77 0.21 2.1%
ANSYS Inc 3.63% 0.02% 3.61% 22.08 1.00 0.07 4.5% Suss Microtec AG 0.47% 0.00% 0.47% 49.25 1.63 0.19 1.7%
Plum Creek Timber Co Inc 3.57% 0.02% 3.54% 17.21 0.82 0.03 1.8% Meyer Burger Technology AG 1.44% 0.00% 1.44% 51.26 1.31 0.18 4.7%
Middleby Corp/The 3.37% 0.00% 3.37% 26.94 1.27 0.10 6.0% Chart Industries Inc 1.30% 0.00% 1.30% 46.54 2.01 0.18 4.3%
Stericycle Inc 2.87% 0.03% 2.84% 17.17 0.65 0.02 1.0% Amtech Systems Inc 1.04% 0.00% 1.04% 48.24 1.54 0.18 3.3%
Danaher Corp 2.97% 0.16% 2.81% 18.31 0.97 0.04 1.9% Manz AG 1.29% 0.00% 1.29% 43.45 1.42 0.18 4.1%
Denso Corp 2.84% 0.07% 2.77% 25.28 0.91 0.05 2.3% MasTec Inc 2.57% 0.00% 2.57% 40.11 1.71 0.16 7.3%
Infineon Technologies AG 2.75% 0.04% 2.71% 26.38 1.35 0.13 6.4% Energy Recovery Inc 1.17% 0.00% 1.17% 43.89 1.57 0.15 3.3%
Continental AG 2.70% 0.07% 2.63% 23.74 1.24 0.10 4.7% Dialog Semiconductor PLC 1.16% 0.00% 1.16% 40.91 1.47 0.15 3.2%
IPG Photonics Corp 2.59% 0.00% 2.59% 29.72 1.28 0.11 5.3% Aixtron SE 1.92% 0.00% 1.92% 35.01 0.99 0.14 5.0%
10 Largest Active Risk Contributors by Issuer Smallast MCAR (most diversifying securities) with BM Weight >0,25% or in Portfolio - Issuer
Name
Por
Weight
Benchmark
Weight
Active
Weight
Total
Risk (%) Beta MCAR
% Ctr to
Act Risk Name Por Weight
Benchmark
Weight
Active
Weight
Total Risk
(%) Beta MCAR
% Ctr to
Act Risk
MasTec Inc 2.57% 0.00% 2.57% 40.11 1.71 0.16 7.3% Merck & Co Inc 0.00% 0.51% -0.51% 0.00 0.00 -0.02 0.2%
Veeco Instruments Inc 2.49% 0.00% 2.49% 33.39 1.37 0.14 6.4% Procter & Gamble Co/The 0.00% 0.75% -0.75% 0.00 0.00 -0.01 0.2%
Infineon Technologies AG 2.75% 0.04% 2.71% 26.38 1.35 0.13 6.4% Pfizer Inc 0.00% 0.61% -0.61% 0.00 0.00 -0.01 0.1%
Middleby Corp/The 3.37% 0.00% 3.37% 26.94 1.27 0.10 6.0% Bristol-Myers Squibb Co 0.00% 0.30% -0.30% 0.00 0.00 -0.01 0.1%
IPG Photonics Corp 2.59% 0.00% 2.59% 29.72 1.28 0.11 5.3% Altria Group Inc 0.00% 0.30% -0.30% 0.00 0.00 -0.01 0.1%
Hexcel Corp 3.77% 0.00% 3.77% 23.30 1.15 0.08 5.2% Johnson & Johnson 0.00% 0.91% -0.91% 0.00 0.00 -0.01 0.2%
Aixtron SE 1.92% 0.00% 1.92% 35.01 0.99 0.14 5.0% PepsiCo Inc 0.00% 0.44% -0.44% 0.00 0.00 -0.01 0.1%
Meyer Burger Technology AG1.44% 0.00% 1.44% 51.26 1.31 0.18 4.7% Berkshire Hathaway Inc 0.00% 0.52% -0.52% 0.00 0.00 -0.01 0.1%
Continental AG 2.70% 0.07% 2.63% 23.74 1.24 0.10 4.7% Philip Morris International Inc 0.00% 0.41% -0.41% 0.00 0.00 -0.01 0.0%
ON Semiconductor Corp 1.93% 0.00% 1.93% 31.46 1.49 0.13 4.6% Coca-Cola Co/The 0.00% 0.50% -0.50% 0.00 0.00 0.00 0.0%
0.00
1.00
2.00
3.00
4.00
5.00
6.00
7.00
8.00
0.0
2.0
4.0
6.0
8.0
10.0
12.0
14.0
16.0
18.0
Dec Jan
Feb
Mar
Ap
r
May Jun
Jul
Au
g
Sep
Oct
No
v
Risk
Portfolio Risk (lhs) Benchmark Risk (lhs)Active Risk (rhs) Active Industry Risk (rhs)Active Style Risk (rhs) Active Selection Risk (rhs)Active Currency Risk (rhs) Active Risk (Short Model) (rhs)
0.0
-0.1
0.5
1.8
2.2
-0.3
-0.6
-0.2
-0.4
0.3
0.0
0.1
0.0
1.5
4.0
5.6
0.3
0.4
0.0
0.0
1.7
0.0
-1.0 0.0 1.0 2.0 3.0 4.0 5.0 6.0
Utilities (0.75)
Telecommunication Services (0)
Materials (0.8)
Information Technology (1.03)
Industrials (1.07)
Health Care (0.99)
Financials (0.79)
Energy (0)
Consumer Staples (0)
Consumer Discretionary (1.11)
Cash
Risk (%)
GICS Sector Contribution To Risk/Active Risk
Sect Contrib to Total Ind Risk Sect Contrib to Act Ind Risk
(Portfolio Sector Beta to Bm Sector)
-1.50%
-3.36%
6.08%
14.68%
29.52%
-10.75%
-17.43%
-7.53%
-9.95%
-0.84%
1.08%
-30% -20% -10% 0% 10% 20% 30% 40% 50%
Utilities
Telecommunication Services
Materials
Information Technology
Industrials
Health Care
Financials
Energy
Consumer Staples
Consumer Discretionary
Cash
Effective Weight
GICS Sector Weights
Eff. Portfolio Weight Eff. Active Weight
0.96
0.98
1
1.02
1.04
1.06
1.08
1.1
1.12
1.14
1.16
0
10,000,000
20,000,000
30,000,000
40,000,000
50,000,000
60,000,000
70,000,000
Dec Jan
Feb
Mar
Ap
r
May Jun
Jul
Au
g
Sep
Oct
No
v
Bet
a
Ma
rket
Va
lue
Market Value and Beta
Market Value Beta
-10.0% 0.0% 10.0% 20.0%
United States
Taiwan,…
Singapore
Sweden
Portugal
New Zealand
Norway
Netherlands
Japan
Italy
Israel
Ireland
Hong Kong
United Kingdom
France
Finland
Spain
Denmark
Germany
Switzerland
Canada
Belgium
Australia
Austria
Exposure
Active Equity Country
Exposure
-1 Week Current
-8.0%
-6.0%
-4.0%
-2.0%
0.0%
2.0%
4.0%
6.0%
8.0%
10.0%
12.0%
EU
RO
PE
JAP
AN
NO
RTH
AM
ERIC
A
RE
ST OF W
OR
LD
Exp
osu
re
Active Equity Regional
Exposure
Current -1 Week98%
98%
99%
99%
100%
100%
101%
0.00%
5.00%
10.00%
15.00%
20.00%
Dec-13 Jan-14 Feb-14 Mar-14 Apr-14 May-14 Jun-14 Jul-14 Aug-14 Sep-14 Oct-14 Nov-14 Dec-14
Act
ive
Sha
re
Per
form
an
ce
Portfolio Performance & Active Share
Portfolio
Performance
Active Share
-2.00
-1.00
0.00
1.00
Dec-13 Mar-14 Jun-14 Sep-14
Exp
osu
re (
>0,2
=>
act
ive
bet
)
Style Factor Exposure
Global Volatility
Global Value
Global Size
Global
Momentum
-2.00
-1.50
-1.00
-0.50
0.00
0.50
1.00
Global Size (vol*act exp=2.32%)Global Momentum (vol*act exp=0.69%)Global Value (vol*act exp=0.28%)Global Volatility (vol*act exp=1.59%)US Dividend Yield (vol*act exp=0.68%)US Size Non-Linearity (vol*act exp=0.92%)US Earnings Yield (vol*act exp=0.46%)US Leverage (vol*act exp=0.27%)US Growth (vol*act exp=0.27%)
Exp
osu
re
Active Global Style Exposure (all) & Local Exposure (>0.2)
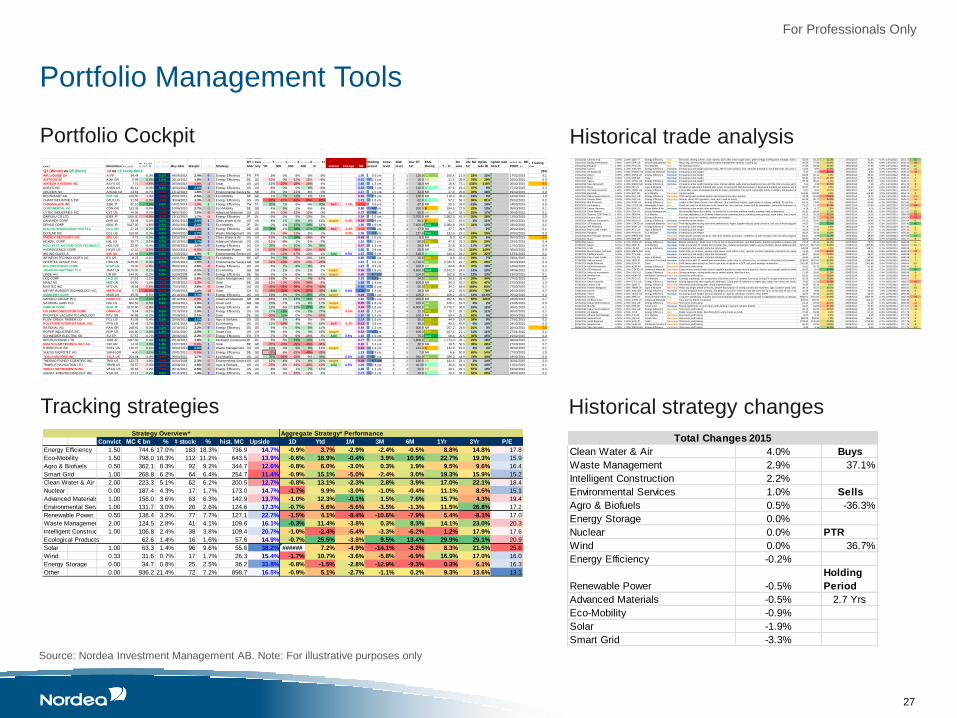
Source: Nordea Investment Management AB. Note: For illustrative purposes only
For Professionals Only
27
Portfolio Management Tools
N A M E BloombergPX _ LA ST
R T_ PX _ C H
G_ PC T_ 1D
rel. Perf
vs. Local Buy date Weight CTR Strategy
CNT
RY_I
SSU
Risk
Cou
ntry
R E A L _T IM E _T R R _ Y
TD
R E A L _T IM E _T R R _ 1
MO
R E A L _T IM E _T R R _ 3
MO
R E A L _T IM E _T R R _ 6
MO
E Q Y _T R R _P C T _ 1Y
R Action! Change SR
Holding
period
Conv.
level
Risk
level
Our TP
h2
ESG
Rating B E S T _ TA R G E T PR IC E
3m
vola
Up/dns
ide Nd
h2
Up/dn
side Bl
Up/dn side
HOLT
EX PEC TED _ RE
PORT_ D T
# Trading days
Q1 (Worst) vs Q5 (Best) >4 vs <2 exceptions 25%
AIR LIQUIDE SA AI FP 94.44 -0.3% 0.1% 04/06/2014 2.4% 0 Energy Efficiency FR FR 3% -3% -3% -3% 8% 1.00 0.5 yrs 2 1 115.0 AA 105.4 21.9 22% 12% #VALUE! 17/02/2015 0.1
AIXTRON SE AIXA GR 8.98 0.6% 1.0% 26/10/2012 1.9% 2 Energy Efficiency DE GE -15% 0% -12% -15% -8% 2.01 2.1 yrs 3 4 16.0 BB 11.6 38.9 78% 29% #VALUE! 25/02/2015 0.5
AMTECH SYSTEMS INC ASYS US 7.71 -4.6% -3.9% 04/09/2013 1.0% -4 Solar US US 11% -22% -28% -26% 4% 1.82 1.3 yrs 3 5 18.0 NR 16.6 73.1 133% 116% #VALUE! 06/02/2015 9.5
ANSYS INC ANSS US 80.11 -0.3% 0.4% 02/04/2012 3.6% 1 Energy Efficiency US US -8% 0% 0% 6% -6% 2.03 2.7 yrs 3 1 110.0 A 87.6 18.4 37% 9% #VALUE! 27/02/2015 0.3
ARCADIS NV ARCAD NA 23.63 -0.7% -0.3% 13/12/2013 1.8% -1 Environmental ServicesNL NE -6% 0% -11% -8% 0% 1.37 1.0 yrs 2 2 32.0 NR 27.9 25.8 35% 18% #VALUE! 19/02/2015 0.9
BERTRANDT AG BDT GR 109.50 -1.4% -1.0% 25/01/2012 2.5% -3 Eco-Mobility DE GE 1% 7% 13% 1% 11% 0.65 2.9 yrs 2 1 130.0 NR 119.3 28.9 19% 9% #VALUE! 16/02/2015 1.9
CHART INDUSTRIES INC GTLS US 31.58 -2.9% -2.3% 30/04/2013 1.3% -3 Energy Efficiency US US -67% -27% -51% -60% -65% 1.71 1.6 yrs 3 3 62.0 A 57.2 56.3 96% 81% #VALUE! 25/02/2015 0.2
CHROMA ATE INC 2360 TT 82.10 2.6% 3.0% 14/01/2014 1.0% 3 Energy Efficiency TW TA 35% 1% -3% -4% 40% Sell -1.0% -0.56 0.9 yrs 3 2 67.0 NR 93.5 33.0 -18% 14% #VALUE! 24/03/2015 0.8
CONTINENTAL AG CON GR 163.35 -0.9% -0.5% 10/06/2010 2.7% -1 Eco-Mobility DE GE 4% 6% 1% -5% 8% 0.80 4.5 yrs 3 2 200.0 B 184.5 27.9 22% 13% #VALUE! 05/03/2015 0.1
CYTEC INDUSTRIES INC CYT US 44.05 -0.7% -0.1% 09/07/2010 1.5% -0 Advanced Materials US US -5% -10% -12% -12% 0% 0.77 4.4 yrs 3 3 55.0 BB 51.7 32.1 25% 17% #VALUE! 30/01/2015 0.1
DAIFUKU CO LTD 6383 JP 1260.00 -4.9% -3.0% 13/12/2013 1.7% -5 Energy Efficiency JP JN -5% -3% -3% -10% 3% 0.84 1.0 yrs 3 2 1,700.0 NR 1,582.5 41.3 35% 26% #VALUE! 12/02/2015 0.5
DANAHER CORP DHR US 83.39 -0.4% 0.2% 20/01/2012 2.9% 1 Clean Water & Air US US 8% 1% 8% 4% 11% target -0.4% 0.19 2.9 yrs 2 1 86.5 B 92.7 19.6 4% 11% #VALUE! 19/02/2015 0.0
DENSO CORP 6902 JP 5417.00 -1.6% 0.3% 05/02/2013 2.9% 1 Eco-Mobility JP JN 0% -1% 15% 14% 11% 1.05 1.9 yrs 3 3 7,100.0 AAA 5,980.8 29.5 31% 10% #VALUE! 03/02/2015 0.1
DIALOG SEMICONDUCTOR PLC DLG GR 27.23 0.2% 0.6% 15/03/2011 1.2% 1 Energy Efficiency DE GE 74% -1% 28% 17% 95% Sell -1.2% -0.02 3.8 yrs 3 4 27.0 NR 27.7 39.6 -1% 2% #VALUE! 20/02/2015 0.1
ECOLAB INC ECL US 102.03 -0.3% 0.3% 29/04/2010 2.7% 1 Waste Management US US -1% -9% -12% -5% 1% -0.5% 1.05 4.6 yrs 2 1 127.0 AAA 122.9 23.2 24% 20% #VALUE! 20/02/2015 0.0
ENERGY RECOVERY INC ERII US 4.72 0.0% 0.6% 13/12/2013 1.2% 1 Clean Water & Air US US -15% 1% 24% -18% -8% 0.43 1.0 yrs 3 5 6.0 NR 5.0 62.4 27% 6% #VALUE! 05/03/2015 2.6
HEXCEL CORP HXL US 39.77 0.1% 0.7% 26/10/2012 3.7% 3 Advanced Materials US US -11% -8% 1% -1% -7% 1.10 2.1 yrs 3 2 50.0 BBB 47.8 23.3 26% 20% #VALUE! 23/01/2015 0.4
HOLLYSYS AUTOMATION TECHNOLO HOLI US 23.90 -0.4% 0.2% 23/08/2013 1.5% 0 Energy Efficiency US CH 26% -3% 10% 3% 38% 0.47 1.3 yrs 3 3 28.0 NR 27.8 36.5 17% 16% #VALUE! 17/02/2015 0.4
HYDROGENICS CORP HYGS US 12.10 -3.5% -2.9% 03/02/2014 0.6% -2 Renewable Power US CA -37% -18% -34% -20% -36% 1.60 0.9 yrs 3 5 26.5 NR 29.0 74.4 119% 140% #VALUE! 06/03/2015 0.9
IHS INC-CLASS A IHS US 115.68 1.9% 2.6% 17/05/2012 1.9% 5 Environmental ServicesUS US -3% -12% -17% -10% -1% Add 0.3% 1.15 2.6 yrs 3 2 148.0 A 140.6 24.2 28% 22% #VALUE! 13/01/2015 0.1
INFINEON TECHNOLOGIES AG IFX GR 8.23 -0.6% -0.2% 19/01/2011 2.7% -0 Eco-Mobility DE GE 8% 9% -7% -10% 14% 0.85 3.9 yrs 3 2 10.5 BBB 8.8 32.4 28% 7% #VALUE! 29/01/2015 0.1
INTERTEK GROUP PLC ITRK LN 2149.00 0.3% 0.7% 22/05/2014 1.9% 1 Environmental ServicesGB GB -31% -19% -20% -23% -26% 1.21 0.6 yrs 2 1 2,710.0 AA 2,781.5 21.7 26% 29% #VALUE! 02/03/2015 0.3
IPG PHOTONICS CORP IPGP US 73.00 -2.8% -2.2% 03/02/2014 2.6% -6 Energy Efficiency US US -6% 2% 8% 9% -2% 1.21 0.9 yrs 3 3 100.0 BB 84.9 30.6 37% 16% #VALUE! 13/02/2015 0.2
JOHNSON MATTHEY PLC JMAT LN 3175.00 0.1% 0.5% 15/02/2013 2.1% 1 Eco-Mobility GB GB -1% 1% 3% 1% 1% target 0.56 1.8 yrs 2 2 3,600.0 AAA 3,572.0 24.0 13% 13% #VALUE! 04/06/2015 0.2
LINDE AG LIN GR 144.50 -0.2% 0.2% 01/04/2008 2.4% 0 Energy Efficiency DE GE -3% -1% -6% -6% -1% target 0.66 6.7 yrs 2 1 164.0 AA 162.9 20.6 13% 13% #VALUE! 13/03/2015 0.1
LKQ CORP LKQ US 27.51 -1.1% -0.4% 06/10/2009 2.5% -1 Waste Management US US -16% -5% -2% 7% -17% 0.93 5.2 yrs 2 2 34.0 AA 36.8 25.4 24% 34% #VALUE! 27/02/2015 0.2
MANZ AG M5Z GR 54.50 -1.0% -0.6% 07/08/2013 1.3% -1 Solar DE GE -12% -13% -25% -34% -8% 1.98 1.4 yrs 3 4 100.0 NR 80.0 42.2 83% 47% #VALUE! 27/03/2015 1.4
MASTEC INC MTZ US 18.68 -2.6% -2.0% 27/04/2012 2.6% -5 Smart Grid US US -43% -26% -38% -42% -40% 2.85 2.6 yrs 3 3 50.0 BBB 34.2 58.8 168% 83% #VALUE! 27/02/2015 0.2
MEYER BURGER TECHNOLOGY AG MBTN SW 5.71 -10.3% -9.9% 07/08/2013 1.4% -14 Solar CH SZ -46% -31% -40% -57% -35% Add 0.5% 4.35 1.4 yrs 3 4 18.0 NR 10.2 49.5 215% 78% #VALUE! 26/03/2015 0.7
MIDDLEBY CORP MIDD US 95.35 -0.5% 0.1% 20/10/2011 3.4% 0 Energy Efficiency US US 19% 2% 9% 18% 25% target 0.49 3.2 yrs 3 2 109.0 BB 108.2 29.5 14% 13.5% #VALUE! 25/02/2015 0.3
NANOCO GROUP PLC NANO LN 121.00 2.3% 2.7% 08/12/2011 0.9% 2 Advanced Materials GB GB -16% 1% 13% 16% -11% 1.10 3.0 yrs 3 5 200.0 NR 267.5 59.6 65% 121% #VALUE! 23/03/2015 0.7
NATIONAL GRID PLC NG/ LN 860.50 0.5% 0.9% 30/04/2013 1.9% 2 Smart Grid GB GB 15% -7% -1% 4% 17% target 0.35 1.6 yrs 2 1 910.0 AA 876.7 16.3 6% 2% #VALUE! 21/05/2015 0.0
OMRON CORP 6645 JP 5170.00 -2.8% -0.9% 15/03/2013 1.9% -2 Energy Efficiency JP JN 13% -5% 10% 27% 28% target 0.45 1.8 yrs 3 3 6,000.0 AA 5,772.7 36.0 16% 12% #VALUE! 30/01/2015 0.1
ON SEMICONDUCTOR CORP ONNN US 9.64 -0.1% 0.5% 22/10/2013 2.0% 1 Energy Efficiency US US 17% 16% 0% 7% 27% -0.5% 0.63 1.2 yrs 3 4 12.0 BBB 10.7 39.1 24% 11% #VALUE! 06/02/2015 0.1
PFEIFFER VACUUM TECHNOLOGY PFV GR 66.88 -0.2% 0.2% 07/08/2013 2.1% 0 Solar DE GE -30% 12% 0% -17% -24% 1.97 1.4 yrs 3 2 100.0 NR 69.4 25.2 50% 4% #VALUE! 20/03/2015 2.0
PLUM CREEK TIMBER CO PCL US 41.08 -0.4% 0.2% 28/06/2013 3.5% 1 Agro & Biofuels US US -8% 1% 4% -5% -5% 2.14 1.5 yrs 3 2 55.0 BBB 44.9 15.9 34% 9% #VALUE! 27/01/2015 0.2
POLYPORE INTERNATIONAL INC PPO US 43.44 -1.7% -1.0% 13/01/2014 1.6% -2 Eco-Mobility US US 12% -18% 3% -9% 18% Sell -0.3% 0.13 0.9 yrs 3 4 46.0 BBB 49.3 45.8 6% 14% #VALUE! 24/02/2015 0.3
RATIONAL AG RAA GR 248.91 -0.3% 0.1% 22/10/2013 2.2% 0 Energy Efficiency DE GE 6% -1% 9% 8% 11% 0.84 1.2 yrs 2 2 300.0 NR 257.2 24.5 21% 3% #VALUE! 20/03/2015 2.6
ROPER INDUSTRIES INC ROP US 150.80 0.6% 1.2% 12/01/2010 2.5% 3 Smart Grid US US 9% -4% 2% 3% 15% target 0.54 4.9 yrs 2 1 168.0 BBB 167.4 21.1 11% 11% #VALUE! 27/01/2015 0.1
SCHNEIDER ELECTRIC SE SU FP 57.57 -0.7% -0.3% 28/06/2013 2.2% -1 Energy Efficiency FR FR -7% -7% -9% -16% -3% Add 0.5% 1.02 1.5 yrs 3 2 75.0 AAA 66.4 29.5 30% 15% #VALUE! 19/02/2015 0.0
SEKISUI HOUSE LTD 1928 JP 1497.50 -0.4% 1.5% 22/10/2013 1.8% 3 Intelligent ConstructionJP JN 5% -5% 19% 14% 11% 0.77 1.2 yrs 3 2 1,800.0 AA 1,773.0 26.1 20% 18% #VALUE! 06/03/2015 0.1
SMA SOLAR TECHNOLOGY AG S92 GR 14.44 1.0% 1.4% 14/07/2014 0.6% 1 Solar DE GE -37% -20% -39% -46% -34% 0.68 0.4 yrs 3 4 20.0 NR 18.5 56.5 39% 28% #VALUE! 27/03/2015 0.7
STERICYCLE INC SRCL US 128.07 0.1% 0.7% 04/02/2013 2.8% 2 Waste Management US US 10% 0% 9% 9% 11% target 0.26 1.9 yrs 2 1 133.0 B 132.9 15.0 4% 4% #VALUE! 05/02/2015 0.1
SUESS MICROTEC AG SMHN GR 4.30 1.1% 1.5% 23/01/2012 0.5% 1 Energy Efficiency DE GE -33% -6% -22% -49% -29% 1.23 2.9 yrs 3 5 7.0 NR 6.6 50.8 63% 54% #VALUE! 27/03/2015 1.5
TESLA MOTORS INC TSLA US 204.04 -1.4% -0.8% 06/04/2011 1.7% -1 Eco-Mobility US US 36% -21% -22% -9% 38% 0.3% 1.65 3.7 yrs 3 4 355.0 AA 286.2 44.9 74% 40% #VALUE! 19/02/2015 0.0
THERMO FISHER SCIENTIFIC INC TMO US 123.73 -1.0% -0.4% 01/04/2008 2.3% -1 Environmental ServicesUS US 12% 4% 1% 4% 22% target 0.08 6.7 yrs 2 2 126.0 BB 141.6 23.1 2% 14% #VALUE! 30/01/2015 0.0
TRIMBLE NAVIGATION LTD TRMB US 26.57 -2.3% -1.6% 02/08/2012 1.6% -3 Agro & Biofuels US US -23% -8% -16% -30% -19% Add 0.5% 1.45 2.4 yrs 3 2 40.00 A 30.3 34.9 51% 14% #VALUE! 11/02/2015 0.1
VEECO INSTRUMENTS INC VECO US 35.63 -1.2% -0.6% 05/11/2013 2.5% -1 Energy Efficiency US US 8% 0% 1% 7% 17% 1.46 1.1 yrs 3 4 56.0 BB 39.1 39.1 57% 10% #VALUE! 19/02/2015 0.4
VISHAY INTERTECHNOLOGY INC VSH US 13.17 0.2% 0.9% 07/11/2012 1.4% 1 Energy Efficiency US US 1% -3% -15% -12% 5% 1.71 2.1 yrs 3 3 20.0 A 16.2 30.3 52% 23% #VALUE! 04/02/2015 0.2
Portfolio Cockpit
14/01/2014 Chroma ATE 2.00% 2.00% 2360 TT Energy Efficiency Buy Electronic testing (semis, solar, battery, EV); after some tough years, green energy coming back strongly; solid company with proven model and margins62.59 82.10 31.0% 31% 14/01/2014 62.34 -0.4% 14/01/2014 1651.73 62
13/01/2014 Darling International 2.00% 2.00% DAR US Waste Management Buy Recycling, processing and special waste management (animal, cooking oil) 20.93 17.59 -16.5% -17% 13/01/2014 20.80 -0.6% 13/01/2014 1645.41 -33
13/01/2014 Polypore 1.00% 1.00% PPO US Eco-Mobility Buy Re-entering position 37.45 43.44 15.4% 15% 13/01/2014 37.46 0.0% 13/01/2014 1645.41 15
13/01/2014 Aixtron 0.50% 1.70% AIXA GR Energy Efficiency Increase Increasing active weight (positive news: MPI is forecasting is new MOCVD demand to reach 200 units this year vs 60 units in 2013 and 300-350 units in 2010-2011)11.65 8.95 -23.8% -24% 13/01/2014 11.61 -0.3% 13/01/2014 1645.41 -12
13/01/2014 GT Advanced 0.40% 2.00% GTATQ US Advanced Materials Increase Increasing active weight 9.24 0.41 -96.1% -96% 13/01/2014 8.93 -3.3% 13/01/2014 1645.41 -38
13/01/2014 Ansys 0.30% 2.80% ANSS US Energy Efficiency Increase Increasing active weight 84.68 80.11 -6.0% -6% 13/01/2014 84.24 -0.5% 13/01/2014 1645.41 -2
13/01/2014 Manz 0.30% 1.10% M5Z GR Solar Increase Increasing active weight 68.33 53.76 -21.9% -22% 13/01/2014 67.52 -1.2% 13/01/2014 1645.41 -7
13/01/2014 Veeco 0.40% 2.00% VECO US Energy Efficiency Increase Increasing active weight 35.79 35.63 -1.0% -1% 13/01/2014 35.22 -1.6% 13/01/2014 1645.41 0
14/01/2014 Süss Microtech 0.20% 1.00% SMHN GR Energy Efficiency Increase Increasing active weight (positive news: Epistar adopts wafer-level packaging process with flip-chip structure and develops embedded LED chip (ELC) solution )7.11 4.36 -38.8% -39% 14/01/2014 7.18 1.0% 14/01/2014 1651.73 -8
13/01/2014 Deere -1.90% 0.00% DE US Agro & Biofuels Sell Weakening agriculture markets after years of overspend; high-horsepower in developed markets not growing and EM not yet that advanced90.52 87.47 3.9% -4% 13/01/2014 90.07 -0.5% 13/01/2014 1645.41 7
13/01/2014 ON Semiconsuctor -1.60% 0.00% ONNN US Energy Efficiency Sell Exiting after years af disappointments on Sanyo integration; too much commodity product portfolio, not moving up the chain8.67 9.64 -10.7% 11% 13/01/2014 8.67 0.0% 13/01/2014 1645.41 -17
14/01/2014 Bertrandt -0.60% 1.00% BDT GR Eco-Mobility Decrease Limited upside 112.90 108.80 3.8% -4% 14/01/2014 112.88 0.0% 14/01/2014 1651.73 2
13/01/2014 Dialog Semiconductor -0.30% 1.90% DLG GR Energy Efficiency Decrease Profit taking after positive quarter and strong stock price reaction 15.78 26.95 -70.2% 70% 13/01/2014 15.73 -0.3% 13/01/2014 1645.41 -21
13/01/2014 Dresser-Rand -0.50% 1.80% DRC US Energy Efficiency Decrease Nervous about 2014 guidance, near-term could be lumpy 58.29 80.77 -38.0% 38% 13/01/2014 57.92 -0.6% 13/01/2014 1645.41 -19
03/02/2014 IPG Photonics 1.20% 1.20% IPGP US Energy Efficiency Buy Leader in fiber lasers (much more efficienct than traditional lasers); applications in cutting, welding, 3D printing 64.71 73.00 7.6% 8% 03/02/2014 64.55 -0.2% 03/02/2014 1571.92 9
03/02/2014 Hydrogenics 1.00% 1.00% HYGS US Renewable Power Buy Small fuel cells for on-site electricity generation, telco backup, power shift for renewables; potentially hydrogen cars longer-term option23.17 12.10 -53.0% -53% 03/02/2014 22.93 -1.0% 03/02/2014 1571.92 -53
03/02/2014 Energy Recovery 0.20% 1.00% ERII US Clean Water & Air Increase Increasing active weight after weakness 4.18 4.72 7.6% 8% 03/02/2014 4.16 -0.7% 03/02/2014 1571.92 2
03/02/2014 Clean Harbors -1.30% 0.00% CLH US Waste Management Sell Not providing hoped for stability, no conviction to increase medium weight; earnings have disappointed 55.41 48.64 17.5% -17% 03/02/2014 53.87 -2.8% 03/02/2014 1571.92 23
04/02/2014 Zhuzhou CSR Times Electric-1.40% 0.00% 3898 HK Eco-Mobility Sell Too high dependency on Chinese infrastructure spending, future spending more granular, more urban, less long-distance high speed23.23 33.35 -38.2% 38% 04/02/2014 23.26 0.1% 04/02/2014 1569.93 -53
19/02/2014 Dresser-Rand -1.50% 0.00% DRC US Energy Efficiency Sell Earnings risks into numbers; weaker end markets 53.47 80.77 -51.1% 51% 19/02/2014 53.46 0.0% 19/02/2014 1655.04 -77
19/02/2014 Hollysys Automation 0.30% 1.50% HOLI US Energy Efficiency Increase Increasing active weight 19.11 23.90 25.1% 25% 19/02/2014 18.99 -0.7% 19/02/2014 1655.04 8
28/02/2014 GT Advanced -1.00% 2.00% GTATQ US Advanced Materials Decrease Profit-taking after strong short-term performance; Apple Sapphire factory partly priced in, still lots of technology/execution risks14.51 0.41 95.9% -96% 28/02/2014 14.46 -0.3% 28/02/2014 1675.40 96
28/02/2014 IPG Photonics 0.50% 1.60% IPGP US Energy Efficiency Increase Increasing active weight 70.78 73.00 4.4% 4% 28/02/2014 71.34 0.8% 28/02/2014 1675.40 2
28/02/2014 Plum Creek Timber 0.50% 2.30% PCL US Agro & Biofuels Increase Increasing active weight 43.20 41.08 -3.7% -4% 28/02/2014 43.24 0.1% 28/02/2014 1675.40 -2
28/02/2014 Polypore 0.50% 1.40% PPO US Eco-Mobility Increase Increasing active weight 35.52 43.44 23.5% 24% 28/02/2014 35.17 -1.0% 28/02/2014 1675.40 12
10/03/2014 Meyer Burger Technologies-1.00% 2.20% MBTN SW Solar Decrease Initial upside scenario priced in; now more visibility and mgmt. confidence in even stronger order recovery required to calculate high enough upside to justify risk18.47 4.99 71.7% -72% 10/03/2014 18.09 -2.0% 10/03/2014 1676.53 72
07/03/2014 Manz 0.30% 1.30% M5Z GR Solar Increase Increasing active weight 68.50 53.76 -19.9% -20% 07/03/2014 68.63 0.2% 07/03/2014 1681.17 -6
02/05/2014 Ansys 0.40% 2.70% ANSS US Energy Efficiency Increase Buying opportunity: slight miss in the Q due to Russia/Ukraine; very high quality, leading simulation company with strong structural growth drivers73.53 80.11 11.0% 11% 02/05/2014 73.75 0.3% 02/05/2014 1688.99 4
07/05/2014 Denso 0.70% 2.50% 6902 JP Eco-Mobility Increase Fallen in-line with JP market and stronger Yen; underlying business healthy and ecomobility driving additional demand; too cheap at 5x EV/EBITDA4457.21 5417.00 23.3% 23% 07/05/2014 4457.86 0.0% 07/05/2014 1684.04 16
02/05/2014 Linde 0.40% 2.50% LIN GR Energy Efficiency Increase Increasing active weight, attractive risk/reward 148.93 143.90 -1.3% -1% 02/05/2014 148.73 -0.1% 02/05/2014 1688.99 -1
02/05/2014 Meyer Burger Technologies0.60% 2.00% MBTN SW Solar Increase Fallen 40% on no news, positive solar capex cycle still to come, recently stronger indication of inclusion for Apple related sapphire business11.11 4.99 -53.1% -53% 02/05/2014 11.02 -0.8% 02/05/2014 1688.99 -32
02/05/2014 Pfeiffer Vacuum 0.40% 1.80% PFV GR Solar Increase Increasing active weight, attractive risk/reward 86.47 66.62 -20.9% -21% 02/05/2014 86.22 -0.3% 02/05/2014 1688.99 -8
02/05/2014 Plum Creek Timber 0.50% 2.90% PCL US Agro & Biofuels Increase Increasing active weight, attractive risk/reward 43.80 41.08 -4.2% -4% 02/05/2014 43.65 -0.4% 02/05/2014 1688.99 -2
07/05/2014 Sekisui House 0.30% 1.50% 1928 JP Intelligent ConstructionIncrease Fallen in-line with JP market and around lower orders due to consumer tax; no change in structural trend towards low-emission houses1238.90 1497.50 22.6% 23% 07/05/2014 1238.43 0.0% 07/05/2014 1684.04 7
07/05/2014 Asahi Diamond -0.80% 1.00% 6140 JP Solar Decrease Profit taking after strong run; hard to get a lot of upside in a DCF; still good earnings momentum 1361.90 1176.00 11.9% -12% 07/05/2014 1361.88 0.0% 07/05/2014 1684.04 10
02/05/2014 ASM International -0.50% 1.60% ASM NA Energy Efficiency Decrease Short-term profit taking 31.61 32.70 -5.5% 5% 02/05/2014 31.63 0.1% 02/05/2014 1688.99 -3
02/05/2014 GT Advanced -1.00% 1.30% GTATQ US Advanced Materials Decrease Expectations around Apple related sapphire production ramp mostly priced in; hard to see enough upside to justify future uncertainty16.87 0.41 95.5% -96% 02/05/2014 16.91 0.2% 02/05/2014 1688.99 96
02/05/2014 Hollysys Automation -0.50% 1.20% HOLI US Energy Efficiency Decrease Strong performer, taking profits due to limited upside, little black box 21.93 23.90 -11.0% 11% 02/05/2014 22.02 0.4% 02/05/2014 1688.99 -6
02/05/2014 Nemetschek -0.20% 1.40% NEM GR Intelligent ConstructionDecrease Short-term profit taking 63.02 79.95 -28.9% 29% 02/05/2014 63.30 0.4% 02/05/2014 1688.99 -6
06/05/2014 Polypore 0.30% 1.70% PPO US Eco-Mobility Increase Earnings stabilising, still in transition of business from LG towards Samsung; strong EV design momentum with company indicating wins in >100 models; consensus only expecting single digit top-line vs. We see higher level and acceleration in coming years35.25 43.44 24.9% 25% 06/05/2014 35.26 0.0% 06/05/2014 1683.52 7
06/05/2014 Chart Industries 0.90% 1.80% GTLS US Energy Efficiency Increase Buying opportunity after significant weakness; China and US transition to higher gas usage main driver over medium term73.95 31.58 -55.6% -56% 06/05/2014 74.11 0.2% 06/05/2014 1683.52 -50
07/05/2014 Chroma ATE -0.40% 2.00% 2360 TT Energy Efficiency Decrease Short-term profit taking after strong outperformance 76.99 82.10 -8.4% 8% 07/05/2014 77.29 0.4% 07/05/2014 1684.04 -3
06/05/2014 Trimble Navigation -0.50% 2.00% TRMB US Agro & Biofuels Decrease Reducing weight ahead of results, despite expectation for strong construction business, agro could be weak; shares have performed well and risk-reward justifies small reduction38.43 26.57 29.1% -29% 06/05/2014 38.24 -0.5% 06/05/2014 1683.52 15
22/05/2014 Aixtron 0.50% 2.00% AIXA GR Energy Efficiency Increase Positive feedback from company visit (Illtgen) on current shipment rate (30 tools this Q vs 10 last and 20 last y) and feedback on new tool (30% efficiency gain, higher ASP); stock corrected without significant news10.28 8.95 -10.8% -11% 22/05/2014 10.43 1.5% 22/05/2014 1692.36 -5
22/05/2014 Veeco 0.30% 2.00% VECO US Energy Efficiency Increase Increasing active weight; pent-up demand as capacity utilisation of clients nears 100% 32.05 35.63 13.4% 13% 22/05/2014 32.53 1.5% 22/05/2014 1692.36 4
22/05/2014 Intertek 2.00% 2.00% ITRK LN Environmental ServicesBuy Long-term beneficiary of quality and environemental regulation; structural growth in fragmented industry at reasonable price; China opening up with high focus on reducing pollution big additional opportunity; good portfolio diversifier2908.01 2161.00 -23.5% -23% 22/05/2014 2904.45 -0.1% 22/05/2014 1692.36 -47
22/05/2014 AZ Electronics -1.70% 0.00% AZEM LN Advanced Materials Sell Take-over by Merck completed 403.50 403.50 -2.2% 2% 22/05/2014 403.02 -0.1% 22/05/2014 1692.36 -4
22/05/2014 Dialog Semiconductor -0.60% 2.00% DLG GR Energy Efficiency Decrease Short-term profit taking 21.24 26.95 -29.1% 29% 22/05/2014 21.25 0.1% 22/05/2014 1692.36 -17
02/06/2014 MasTec 0.50% 2.30% MTZ US Smart Grid Increase Buying opportunity on short-term profit warning, long-term remains healthy 31.97 18.68 -37.9% -38% 02/06/2014 31.97 0.0% 02/06/2014 1717.27 -19
02/06/2014 Dialog Semiconductor -0.50% 1.60% DLG GR Energy Efficiency Decrease Short-term profit taking 22.72 26.95 -22.3% 22% 02/06/2014 22.68 -0.2% 02/06/2014 1717.27 -11
04/06/2014 Air Liquide 2.50% 2.50% AI FP Energy Efficiency Buy Stable long-term name, benefitting from same trends as Linde 97.29 93.93 0.2% 0% 04/06/2014 97.10 -0.2% 04/06/2014 1717.76 1
04/06/2014 Infineon Technologies -0.50% 2.90% IFX GR Eco-Mobility Decrease Short-term profit taking 9.07 8.14 6.6% -7% 04/06/2014 9.05 -0.3% 04/06/2014 1717.76 3
04/06/2014 National Grid -0.50% 2.50% NG/ LN Smart Grid Decrease Short-term profit taking 830.58 864.50 -7.8% 8% 04/06/2014 833.57 0.4% 04/06/2014 1717.76 -4
04/06/2014 Asahi Diamond -0.30% 1.00% 6140 JP Solar Decrease Short-term profit taking 1709.92 1176.00 27.5% -28% 04/06/2014 1706.00 -0.2% 04/06/2014 1717.76 8
04/06/2014 Nemetschek -0.30% 1.20% NEM GR Intelligent ConstructionDecrease Short-term profit taking 69.37 79.95 -18.9% 19% 04/06/2014 69.43 0.1% 04/06/2014 1717.76 -6
04/06/2014 Süss Microtech -0.30% 1.00% SMHN GR Energy Efficiency Decrease Short-term profit taking 8.48 4.36 44.9% -45% 04/06/2014 8.49 0.1% 04/06/2014 1717.76 13
Tracking strategies Historical strategy changes
Historical trade analysis
Aggregate Strategy* Performance
ConvictionMC € bn % # stocks % hist. MC Upside 1D Ytd 1M 3M 6M 1Yr 3Yr P/E
Energy Efficiency 1.50 744.6 17.0% 183 18.3% 736.9 14.7% -0.9% 3.7% -2.9% -2.4% -0.5% 8.8% 14.8% 17.8
Eco-Mobility 1.50 798.0 18.3% 112 11.2% 643.5 13.9% -0.6% 18.9% -0.4% 3.9% 10.9% 22.7% 19.3% 15.9
Agro & Biofuels 0.50 362.1 8.3% 92 9.2% 344.7 12.6% -0.8% 6.0% -3.0% 0.3% 1.9% 9.5% 9.6% 16.4
Smart Grid 1.00 268.8 6.2% 64 6.4% 254.7 11.4% -0.9% 15.1% -5.0% -2.4% 3.0% 19.3% 15.9% 15.2
Clean Water & Air 2.00 223.3 5.1% 62 6.2% 200.5 12.7% -0.8% 13.1% -2.3% 2.8% 3.9% 17.0% 22.1% 18.4
Nuclear 0.00 187.4 4.3% 17 1.7% 173.0 14.7% -1.7% 9.9% -3.0% -1.0% -0.4% 11.1% 8.5% 15.1
Advanced Materials 1.00 156.0 3.6% 63 6.3% 142.9 13.7% -1.0% 12.3% -0.1% 1.5% 7.6% 15.7% 4.3% 19.4
Environmental Services1.00 131.7 3.0% 26 2.6% 124.6 17.3% -0.7% 5.6% -5.6% -3.5% -1.3% 11.5% 26.8% 17.2
Renewable Power 0.50 138.4 3.2% 77 7.7% 127.1 22.7% -1.5% 4.1% -8.4% -10.6% -7.9% 5.4% -8.1% 17.0
Waste Management 2.00 124.5 2.8% 41 4.1% 109.6 16.1% -0.3% 11.4% -3.8% 0.3% 8.3% 14.1% 23.0% 20.3
Intelligent Construction 1.00 106.8 2.4% 38 3.8% 109.4 20.7% -1.0% -2.4% -5.4% -3.3% -6.2% 1.2% 17.9% 17.6
Ecological Products 62.6 1.4% 16 1.6% 57.6 14.9% -0.7% 25.5% -3.8% 9.5% 13.4% 29.9% 29.1% 20.9
Solar 1.00 63.3 1.4% 96 9.6% 55.6 38.2% ###### 7.2% -4.9% -14.1% -8.2% 8.3% 21.5% 25.6
Wind 0.33 31.6 0.7% 17 1.7% 26.3 15.4% -1.7% 10.7% -3.6% -5.8% -6.9% 16.9% 17.0% 16.0
Energy Storage 0.00 34.7 0.8% 25 2.5% 36.2 33.8% -0.8% -1.5% -2.8% -12.9% -9.3% 0.3% 6.1% 16.3
Other 0.00 936.2 21.4% 72 7.2% 898.7 16.5% -0.9% 5.1% -2.7% -1.1% 0.2% 9.3% 13.6% 13.1
Strategy Overview*
Clean Water & Air 4.0% Buys
Waste Management 2.9% 37.1%
Intelligent Construction 2.2%
Environmental Services 1.0% Sells
Agro & Biofuels 0.5% -36.3%
Energy Storage 0.0%
Nuclear 0.0% PTR
Wind 0.0% 36.7%
Energy Efficiency -0.2%
Renewable Power -0.5%
Holding
Period
Advanced Materials -0.5% 2.7 Yrs
Eco-Mobility -0.9%
Solar -1.9%
Smart Grid -3.3%
Total Changes 2015
Source: Nordea Investment Management AB. Note: For illustrative purposes only

For Professionals Only
28
Biographies
Mr. Thomas Sørensen
Mr. Sørensen has been the portfolio manager on the Climate and Environment product since its launch in 2008. In 1999, he joined
the Investment Management division and has undertaken a number of portfolio management and research responsibilities, including
now being part of the portfolio management team on our European Focus equity products and responsible for the Commodities
Super Sector research globally. Thomas began his career in 1997 with Nordea. He holds a BSc. Finance from Copenhagen Business
School.
Mr. Henning Padberg
Mr. Padberg has been the portfolio manager on the Climate & Environment since 2009. He began his career in 2008 with Nordea
Investment Management as a research associate focusing on the financial sector globally. In 2011 Henning became responsible for
the IT sector research globally. In 2014 Henning became part of the portfolio management team on our European Focus equity
products and responsible for the Cyclical Super Sector research globally. Henning holds a MSc. in Business Management from the
University of Münster, Germany.
For Professionals Only
29
The sub-funds mentioned are part of Nordea 1, SICAV, an open-ended Luxembourg-based investment company (Société d'Investissement à Capital Variable), validly formed and existing in accordance with the laws of Luxembourg and with European Council Directive 2009/65/EC of 13 July 2009.This document is advertising material and does not disclose all relevant information concerning the presented sub-funds. Any investment decision in the sub-funds should be made on the basis of the current prospectus and the Key Investor Information Document (KIID), which are available, along with the current annual and semi-annual reports, electronically in English and in the local language of the market where the mentioned SICAV is authorised for distribution, without charge upon request from Nordea Investment Funds S.A., 562, rue de Neudorf, P.O. Box 782, L-2017 Luxembourg, from the local representatives or information agents, or from our distributors. Investments in derivative and foreign exchange transactions may be subject to significant fluctuations which may affect the value of an investment. Investments in Emerging Markets involve a higher element of risk. The value of shares can greatly fluctuate as a result of the sub-fund’s investment policy and cannot be ensured. Investments in equity and debt instruments issued by banks could bear the risk of being subject to the bail-in mechanism (meaning that equity and debt instruments could be written down in order to ensure that most unsecured creditors of an institution bear appropriate losses) as foreseen in EU Directive 2014/59/EU. For further details of investment risks associated with these sub-funds, please refer to the relevant Key Investor Information Document (KIID), available as described above. Nordea Investment Funds S.A. only publishes product-related information and does not make any investment recommendations. Published by Nordea Investment Funds S.A., 562, rue de Neudorf, P.O. Box 782, L-2017 Luxembourg, which is authorized by the Commission de Surveillance du Secteur Financier in Luxembourg. Further information can be obtained from your financial advisor. He/she can advise you independently of Nordea Investment Funds S.A. Additional information for investors in Switzerland: The Swiss Representative and Paying Agent is BNP Paribas Securities Services, Paris, succursale de Zurich, Selnaustrasse 16, CH-8002 Zurich, Switzerland. Additional information for investors in Germany: The Information Agent in Germany is Société Générale S.A. Frankfurt Branch, Neue Mainzer Straße 46-50, D-60311 Frankfurt am Main. A hard copy of the above-mentioned fund documentation is also available from here. Additional information for investors in Austria: Sub-paying Agent and Representative in Austria is Erste Bank der Österreichischen Sparkassen AG, Am Belvedere 1, A-1100 Vienna. Additional information for investors in the Netherlands: Nordea 1, SICAV is a Luxembourg Undertaking for Collective Investment in Transferable Securities (UCITS) registered in the Netherlands in the register kept by the AFM, and as such is allowed to offer its shares in the Netherlands. The AFM register can be consulted via www.afm.nl/register. Additional information for investors in France: With the authorisation of the AMF the shares of the sub-funds of Nordea 1, SICAV may be distributed in France. Centralising Correspondent in France is CACEIS Bank, located at 1-3, place Valhubert, 75013 Paris. Investors are advised to conduct thorough research before making any investment decision. Additional information for investors in Belgium: The Representative Agent in Belgium is BNP Paribas Securities Services S.C.A., Brussels branch, 25 Rue de Loxum, Brussels, B-1000-Belgium. A hard copy of the above-mentioned fund documentation is available upon demand free of charge. Additional information for investors in Spain: Nordea 1, SICAV is duly registered in the CNMV official registry of foreign collective investment institutions (entry no. 340) as authorised to be marketed to the public in Spain. The Depositary of the SICAV’s assets is, J.P. Morgan Bank Luxembourg S.A. In Spain, any investment must be made through the authorised distributors and on the basis of the information contained in the mandatory documentation that must be received from the SICAV’s authorised distributor prior to any subscription. The Representative Agent is Allfunds Bank S.A., Paseo de la Castellana 9, ES-28046 Madrid, Spain. A complete list of the authorised distributors is available in the CNMV’s webpage (www.cnmv.es). Additional information for investors in Portugal: The Management Company of the SICAV, Nordea Investment Funds, S.A., and the Depositary of the SICAV’s assets, J.P. Morgan Bank Luxembourg S.A., are validly formed and existing in accordance with the laws of Luxembourg and authorized by the Commission de Surveillance du Secteur Financier in Luxembourg. Our distributor in Portugal is BEST - Banco Electrónico de Serviço Total, S.A., duly incorporated under the laws of Portugal and registered with the CMVM as a financial intermediary. Additional information for investors in Italy: Fund documentation as listed above is also available in Italy from the distributors and on the website www.nordea.it. The updated list of distribution agents in Italy, grouped by homogenous category, is available from the distributors themselves, at State Street Bank International GmbH – Succursale Italia, branches (located in the main towns of each region), BNP Paribas Securities Services - Succursale di Milano, Banca Sella Holding S.p.A, Banca Monte dei Paschi di Siena S.p.A., Allfunds Bank S.A. Succursale di Milano, Société Générale Securities Services S.p.A. and on the website www.nordea.it. Any requests for additional information should be sent to the distributors. Before investing, please read the prospectus and the KIID carefully. We recommend that you read the most recent annual financial statement in order to be better informed about the fund's investment policy. The prospectus and KIID for the sub-funds have been published with Consob.Additional information for investors in the United Kingdom: Approved by Nordea Bank AB, 5 Aldermanbury Square, London EC2V 7AZ, which is regulated by the FCA in the United Kingdom. Additional information for investors in Sweden: The Paying Agent is Nordea Bank AB (publ), Smålandsgatan 17, Stockholm SE-105 71. The Representative Agent is Nordea Funds Ltd, Swedish Branch, Mäster Samuelsgatan 21, Stockholm, SE-105 71. Additional information for investors in Denmark: The Information and Paying Agent is Nordea Danmark, filial af Nordea Bank AB (publ), Sverige, Strandgade 3, Christiansbro, DK-1401 Copenhagen K. A hard copy of the above-mentioned fund documentation is available here. Additional information for investors in Norway: The Paying Agent is Nordea Bank AB (publ), Filial i Norge, Essendrops gate 7, Postboks 1166 Sentrum, NO-0107 Oslo. The Representative Agent is Nordea Funds Ltd., Norwegian Branch, Essendrops gate 7, Postboks 1166 Sentrum, NO-0107 Oslo. Additional information for investors in Finland: The Paying Agent is Nordea Bank AB (publ), Finnish Branch, Satamaradankatu 5, FI-00020 NORDEA, Helsinki. The Representative Agent is Nordea Funds Ltd, Satamaradankatu 5, FI-00020 NORDEA, Helsinki. Additional information for investors in Latvia: The Representative and Paying Agent is Luminor Bank AS, Skanstes iela 12, Riga, LV-1013. Additional information for investors in Estonia: The Representative and Paying Agent in Estonia is Luminor Bank AS, Liivalaia 45, 10145 Tallinn. Additional information for investors in Lithuania: The Representative and Paying Agent in Lithuania is Luminor Bank AB, Konstitucijos pr. 21A , 03601 Vilnius. Shareholders must evaluate possible investment risks and take this into consideration when making investment decisions. Information for investors in Brazil: Nordea 1, SICAV have not been, and will not be, registered with the CVM and may not be offered or sold in Brazil except in circumstances which do not constitute a public offering or distribution under Brazilian laws and regulations. Investors within Brazil should consult with their own counsel as to the applicability of these laws and regulations or any exemption there from. This material aims to provide information only and does not constitute and should not be construed as an offer to buy or sell or solicitation of an offer to buy or sell any security or financial instrument. Source (unless otherwise stated): Nordea Investment Funds S.A. Unless otherwise stated, all views expressed are those of Nordea Investment Funds S.A. This document may not be reproduced or circulated without prior permission and must not be passed to private investors. This document contains information only intended for professional investors and independent financial advisers and is not intended for general publication. Reference to companies or other investments mentioned within this document should not be construed as a recommendation to the investor to buy or sell the same, but is included for the purpose of illustration.