Oklahoma CES Benchmark Report 2020
14
2020 Oklahoma Employment Security Commission Economic Research and Analysis Division
Transcript of Oklahoma CES Benchmark Report 2020
2020
Oklahoma Employment Security Commission Economic Research and Analysis Division
Oklahoma 2020 CES Benchmark
A publication fromOklahoma Employment Security Commission
Economic Research and Analysis Division
P.O. Box 52003Oklahoma City, OK 73152-2003
Shelley Zumwalt, Executive DirectorLynn Gray, Director, Economic Research and Analysis
May 2021
This publication is issued and is part of the activities of the Oklahoma Employment Security Commissionas authorized by the Oklahoma Employment Security Act. An electronic copy has been deposited
with the Publishing Clearinghouse of the Oklahoma Department of Libraries.
Equal Opportunity Employer/ProgramAuxiliary aids and services are available upon request to individuals with disabilities.
Oklahoma 2020 CES BenchmarkEach year, the Current Employment Statistics Program (CES) survey of nonfarm establishments undergoes a benchmarking process, which is a revision of previously published monthly employment, hours, and earnings estimates. The benchmarking process replaces sample-based estimates with universe counts of employment provided primarily from Unemployment Insurance (UI) tax reports. For more information on the benchmarking process and for a summary of national benchmark revisions, see “Current Employment Statistics - CES (National) Benchmark Article” at: https://www.bls.gov/sae/publications/benchmark-article/annual-benchmark-article.htm
Changes to Current Employment Statistics Data: Nonfarm payroll estimates for states and metropolitan areas were revised to reflect the incorporation of the 2020 benchmarks and the recalculation of seasonal adjustment factors. The revisions affect all not seasonally adjusted data from April 2019 to December 2020, all seasonally adjusted data from January 2016 to December 2020, and select series subject to historical revisions before April 2019.
Page 1

• The 2020 benchmark revision for Oklahoma’s non-seasonally adjusted total nonfarm employment decreased from the published March 2020 estimate of 1,692,300 by -0.21 percent to 1,688,800.
• Over the past 10 years, the magnitude of revisions have ranged from -0.56 percent in 2016 to 1.5 percent in 2012.
Page 2
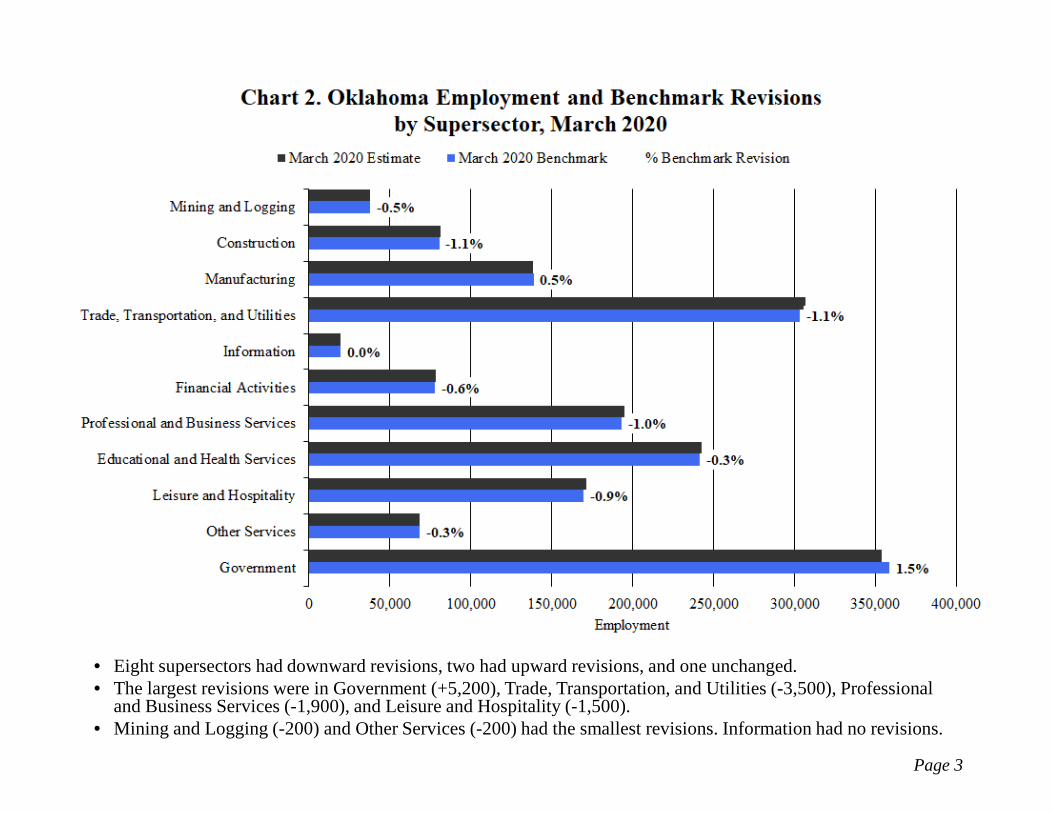
• Eight supersectors had downward revisions, two had upward revisions, and one unchanged.• The largest revisions were in Government (+5,200), Trade, Transportation, and Utilities (-3,500), Professional
and Business Services (-1,900), and Leisure and Hospitality (-1,500).• Mining and Logging (-200) and Other Services (-200) had the smallest revisions. Information had no revisions.
Page 3
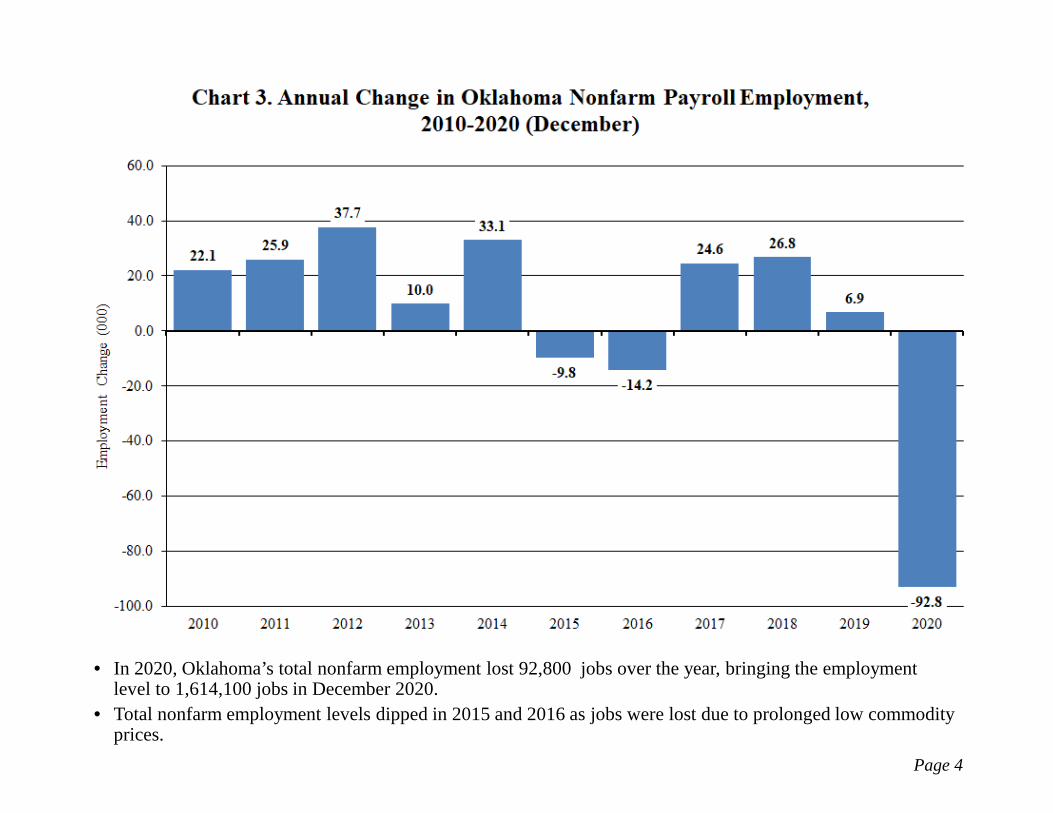
• In 2020, Oklahoma’s total nonfarm employment lost 92,800 jobs over the year, bringing the employment level to 1,614,100 jobs in December 2020.
• Total nonfarm employment levels dipped in 2015 and 2016 as jobs were lost due to prolonged low commodity prices.
Page 4
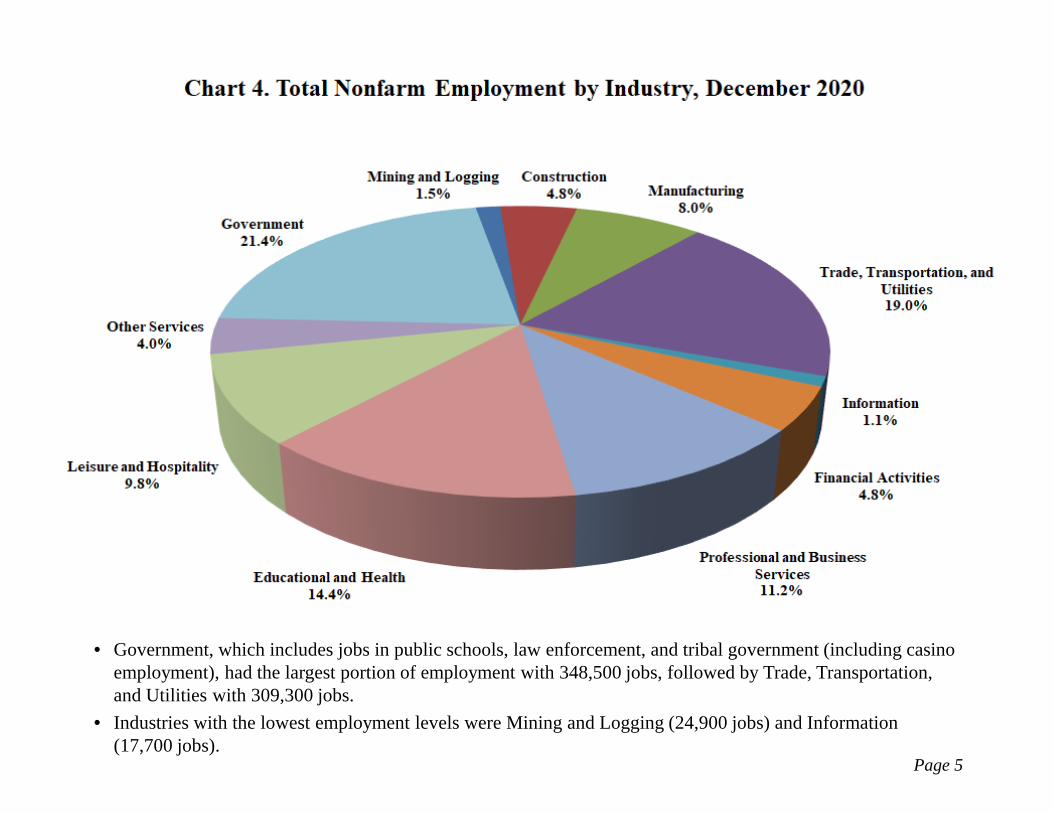
• Government, which includes jobs in public schools, law enforcement, and tribal government (including casino employment), had the largest portion of employment with 348,500 jobs, followed by Trade, Transportation, and Utilities with 309,300 jobs.
• Industries with the lowest employment levels were Mining and Logging (24,900 jobs) and Information (17,700 jobs).
Page 5
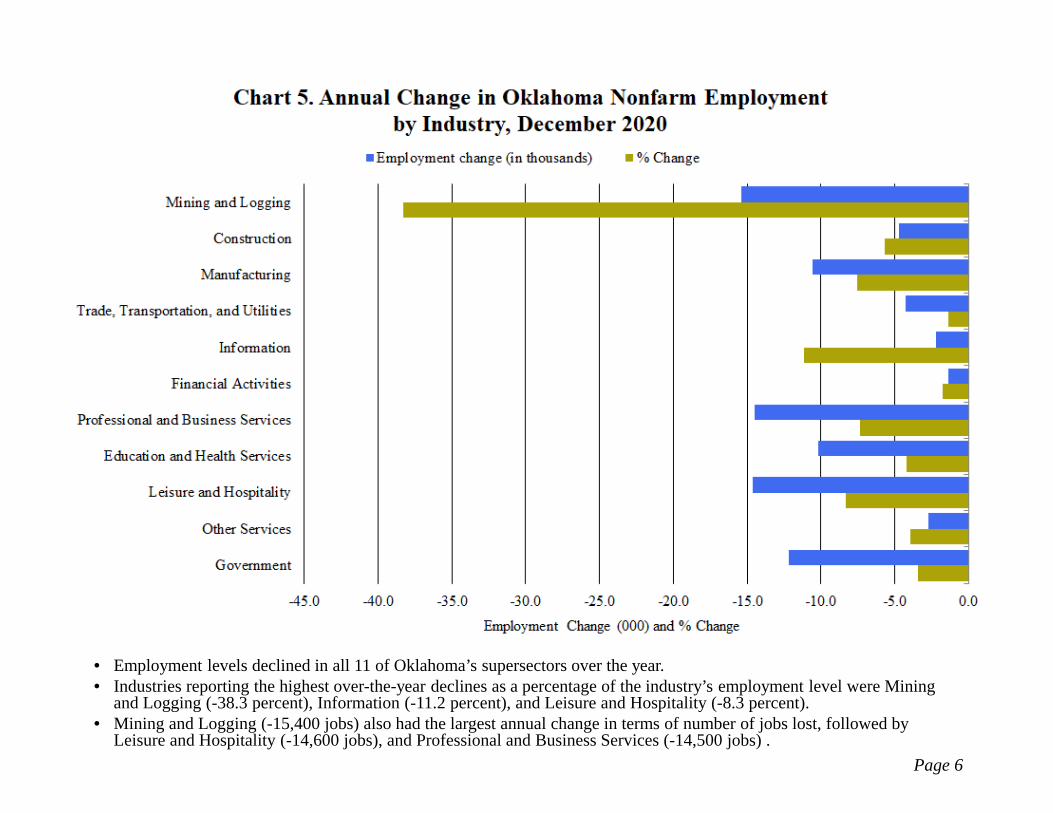
• Employment levels declined in all 11 of Oklahoma’s supersectors over the year.• Industries reporting the highest over-the-year declines as a percentage of the industry’s employment level were Mining
and Logging (-38.3 percent), Information (-11.2 percent), and Leisure and Hospitality (-8.3 percent).• Mining and Logging (-15,400 jobs) also had the largest annual change in terms of number of jobs lost, followed by
Leisure and Hospitality (-14,600 jobs), and Professional and Business Services (-14,500 jobs) .Page 6
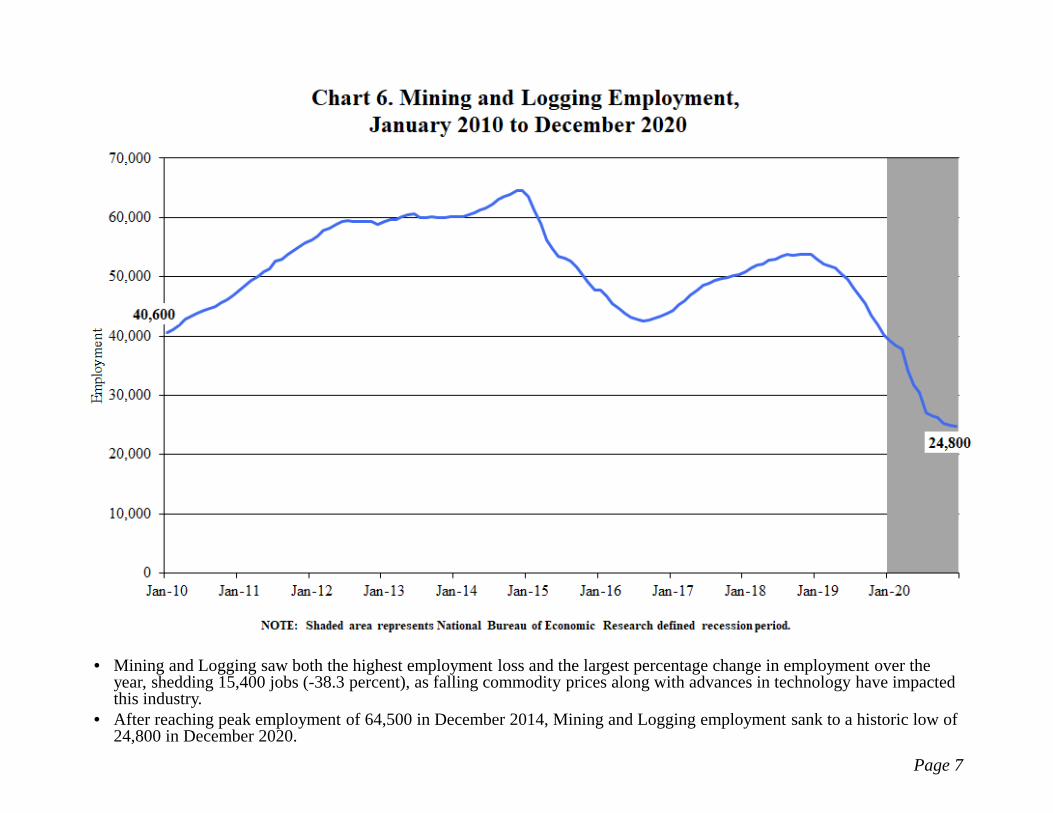
• Mining and Logging saw both the highest employment loss and the largest percentage change in employment over the year, shedding 15,400 jobs (-38.3 percent), as falling commodity prices along with advances in technology have impacted this industry.
• After reaching peak employment of 64,500 in December 2014, Mining and Logging employment sank to a historic low of 24,800 in December 2020.
Page 7
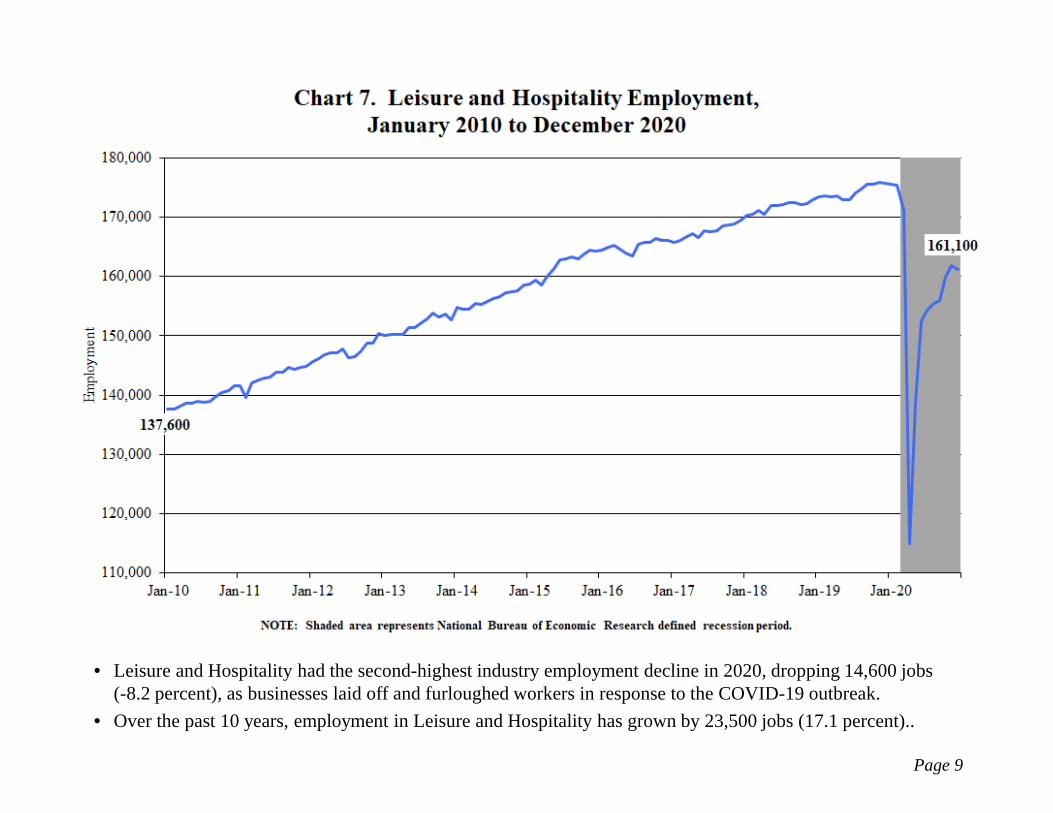
• Leisure and Hospitality had the second-highest industry employment decline in 2020, dropping 14,600 jobs (-8.2 percent), as businesses laid off and furloughed workers in response to the COVID-19 outbreak.
• Over the past 10 years, employment in Leisure and Hospitality has grown by 23,500 jobs (17.1 percent)..
Page 9
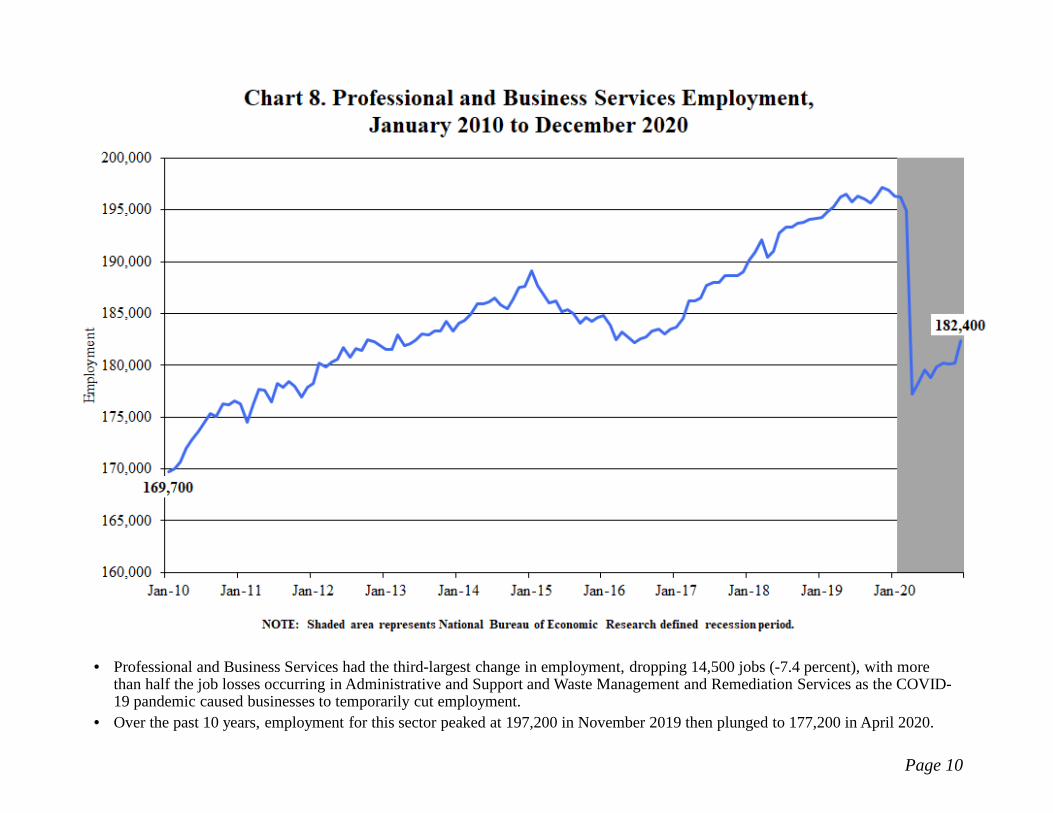
• Professional and Business Services had the third-largest change in employment, dropping 14,500 jobs (-7.4 percent), with more than half the job losses occurring in Administrative and Support and Waste Management and Remediation Services as the COVID-19 pandemic caused businesses to temporarily cut employment.
• Over the past 10 years, employment for this sector peaked at 197,200 in November 2019 then plunged to 177,200 in April 2020.
Page 10
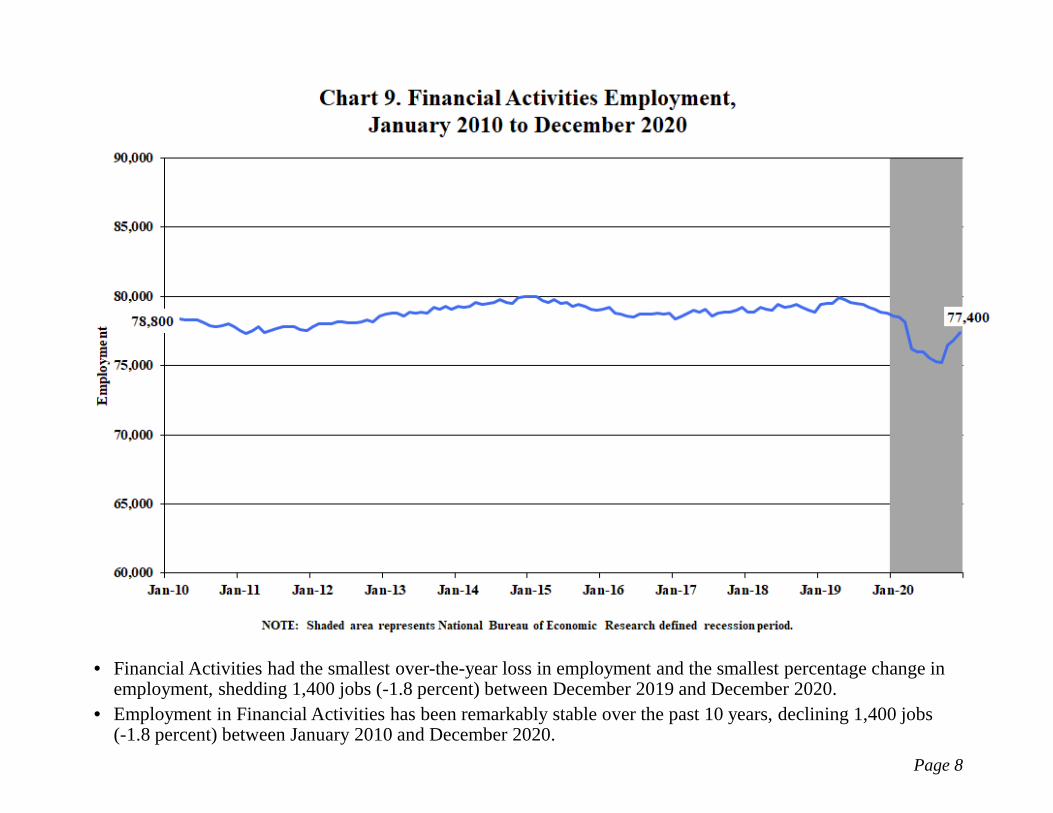
• Financial Activities had the smallest over-the-year loss in employment and the smallest percentage change in employment, shedding 1,400 jobs (-1.8 percent) between December 2019 and December 2020.
• Employment in Financial Activities has been remarkably stable over the past 10 years, declining 1,400 jobs (-1.8 percent) between January 2010 and December 2020.
Page 8
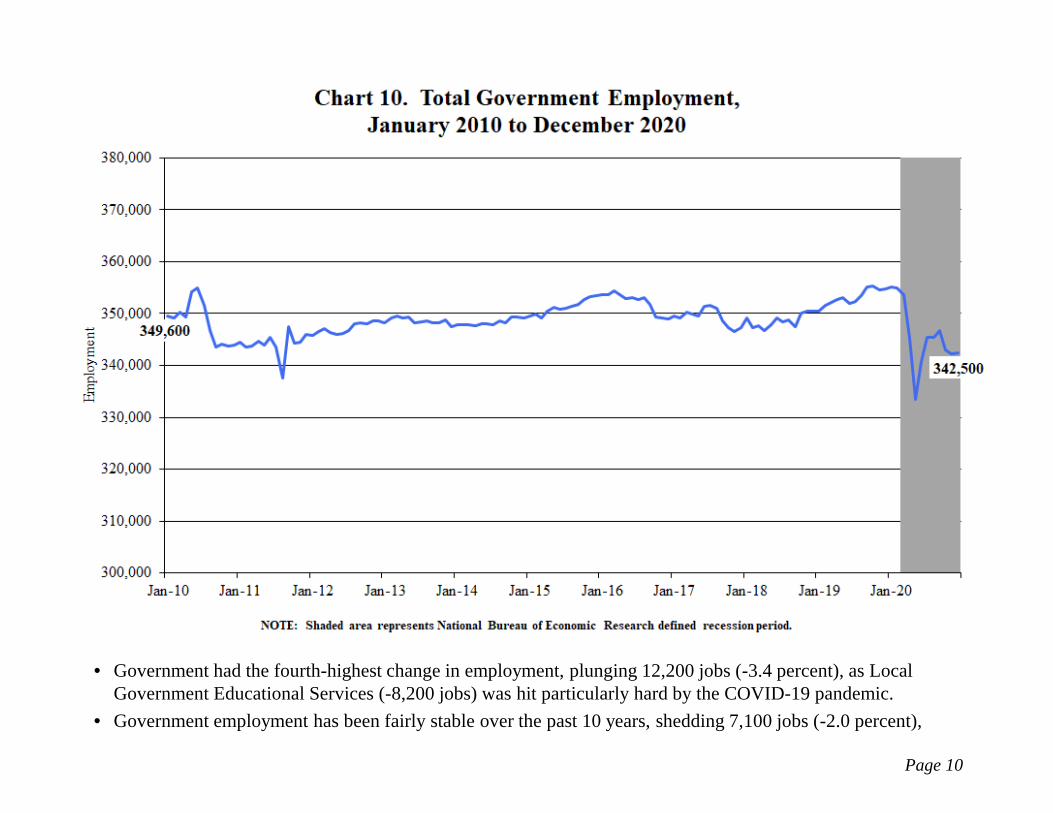
• Government had the fourth-highest change in employment, plunging 12,200 jobs (-3.4 percent), as Local Government Educational Services (-8,200 jobs) was hit particularly hard by the COVID-19 pandemic.
• Government employment has been fairly stable over the past 10 years, shedding 7,100 jobs (-2.0 percent),
Page 10
This workforce product was funded by a grant awarded by the U.S. Department of Labor’s Employment and TrainingAdministration. This product was created by the recipient and does not necessarily reflect the official position of theU.S. Department of Labor. The U.S. Department of Labor makes no guarantees, warranties, or assurances of anykind, express or implied, with respect to such information, including any information on linked sites and including,but not limited to, accuracy of the information or its completeness, timeliness, usefulness, adequacy, continuedavailability, or ownership. This product is copyrighted by the institution that created it. Internal use by anorganization and/or personal use by an individual for non-commercial purposes is permissible. All other usesrequire the prior authorization of the copyright owner.