Proteomic profiling of tumor cells after induction of telomere dysfunction
14
RESEARCH ARTICLE Proteomic profiling of tumor cells after induction of telomere dysfunction Stefan Zimmermann 1 , Martin L. Biniossek 2 , Milena Pantic 1 , Dietmar Pfeifer 1 , Hendrik Veelken 1 and Uwe M. Martens 1 1 Department of Hematology/Oncology, University Medical Center Freiburg, Freiburg, Germany 2 Institut für Molekulare Medizin und Zellforschung, Zentrum für Biochemie und Molekulare Zellforschung, Albert-Ludwigs-Universität Freiburg, Germany Cell division in the absence of telomerase causes progressive telomere shortening which ulti- mately leads to telomere dysfunction and initiation of genome instability. In order to identify factors related to loss of telomere function, the effects of telomerase inhibition on the proteome of five tumor cell lines were followed by SELDI-TOF-MS. Five differentially expressed protein peaks (p,0.01) were found in a total of 60 clones of five cell lines representing four tissues (lung, breast, prostate, and colon) in which telomerase was inhibited by retroviral overexpression of a dominant negative (DN) mutant of human telomerase reverse transcriptase (hTERT). Among these, a 11.3 kDa peak diminished in DN-hTERT clones was identified as histone H4 by nano- flow-HPLC-MS/MS. Immunoblot analysis not only confirmed the decline of histone H4, but also of other core histone proteins including histone H3. Furthermore, upregulation of several cyto- keratins was found to be associated with telomere attrition. In conclusion, loss of telomere function is associated with alterations in the proteome which may represent novel biomarkers for the detection of replicative senescence. Received: May 30, 2008 Revised: August 19, 2008 Accepted: August 21, 2008 Keywords: SELDI / Senescence / Telomerase / Telomere dysfunction Proteomics 2009, 9, 521–534 521 1 Introduction Telomeres are DNA–protein complexes that protect the end of eukaryotic chromosomes from degradation, recombina- tion, and fusions with other chromosomes. Human telo- meres are organized in repeated units of TTAGGG sequen- ces which are associated with specific DNA single strand and double strand binding proteins [1]. Telomeric DNA is lost in dividing cells mainly due to incomplete lagging strand syn- thesis [2], exonuclease activity [3], and oxidative damage [4]. Since short telomeres drive eukaryotic cells into replicative senescence and apoptosis, the maintenance of functional telomeres is crucial for continued proliferation. Almost all eukaryotic cells depend on the enzyme telo- merase, a reverse transcriptase, for the de novo synthesis of telomeres [5]. The ribonucleoprotein complex telomerase uses a RNA component telomerase RNA (TR) as a template for the production of telomeric repeats via the catalytic sub- unit human telomerase reverse transcriptase (TERT) [6]. Telomerase is downregulated in most human cells during embryogenesis, whereby telomeres successively shorten with proliferation until critically short telomeres activate a DNA-damage pathway which ultimately limits their pro- liferative capacity. This senescence state can be bypassed by inactivation of cell cycle checkpoint genes like p53 resulting in continued proliferation accompanied by additional telo- Correspondence: Dr. Stefan Zimmermann, Department of Hema- tology/Oncology, University Medical Center Freiburg, Hugstetter Strasse 55, 79106 Freiburg, Germany E-mail: [email protected] Fax: 149-761-270-3754 Abbreviations: DN, dominant negative; GFP, green fluorescent protein; TERT, human telomerase reverse transcriptase; TRF, tel- omere restriction fragment DOI 10.1002/pmic.200800471 © 2009 WILEY-VCH Verlag GmbH & Co. KGaA, Weinheim www.proteomics-journal.com
-
Upload
stefan-zimmermann -
Category
Documents
-
view
213 -
download
0
Transcript of Proteomic profiling of tumor cells after induction of telomere dysfunction

RESEARCH ARTICLE
Proteomic profiling of tumor cells after induction
of telomere dysfunction
Stefan Zimmermann1, Martin L. Biniossek2, Milena Pantic1, Dietmar Pfeifer1,Hendrik Veelken1 and Uwe M. Martens1
1 Department of Hematology/Oncology, University Medical Center Freiburg, Freiburg, Germany2 Institut für Molekulare Medizin und Zellforschung, Zentrum für Biochemie und Molekulare Zellforschung,
Albert-Ludwigs-Universität Freiburg, Germany
Cell division in the absence of telomerase causes progressive telomere shortening which ulti-mately leads to telomere dysfunction and initiation of genome instability. In order to identifyfactors related to loss of telomere function, the effects of telomerase inhibition on the proteomeof five tumor cell lines were followed by SELDI-TOF-MS. Five differentially expressed proteinpeaks (p,0.01) were found in a total of 60 clones of five cell lines representing four tissues (lung,breast, prostate, and colon) in which telomerase was inhibited by retroviral overexpression of adominant negative (DN) mutant of human telomerase reverse transcriptase (hTERT). Amongthese, a 11.3 kDa peak diminished in DN-hTERT clones was identified as histone H4 by nano-flow-HPLC-MS/MS. Immunoblot analysis not only confirmed the decline of histone H4, but alsoof other core histone proteins including histone H3. Furthermore, upregulation of several cyto-keratins was found to be associated with telomere attrition. In conclusion, loss of telomerefunction is associated with alterations in the proteome which may represent novel biomarkersfor the detection of replicative senescence.
Received: May 30, 2008Revised: August 19, 2008
Accepted: August 21, 2008
Keywords:
SELDI / Senescence / Telomerase / Telomere dysfunction
Proteomics 2009, 9, 521–534 521
1 Introduction
Telomeres are DNA–protein complexes that protect the endof eukaryotic chromosomes from degradation, recombina-tion, and fusions with other chromosomes. Human telo-meres are organized in repeated units of TTAGGG sequen-ces which are associated with specific DNA single strand anddouble strand binding proteins [1]. Telomeric DNA is lost in
dividing cells mainly due to incomplete lagging strand syn-thesis [2], exonuclease activity [3], and oxidative damage [4].Since short telomeres drive eukaryotic cells into replicativesenescence and apoptosis, the maintenance of functionaltelomeres is crucial for continued proliferation.
Almost all eukaryotic cells depend on the enzyme telo-merase, a reverse transcriptase, for the de novo synthesis oftelomeres [5]. The ribonucleoprotein complex telomeraseuses a RNA component telomerase RNA (TR) as a templatefor the production of telomeric repeats via the catalytic sub-unit human telomerase reverse transcriptase (TERT) [6].Telomerase is downregulated in most human cells duringembryogenesis, whereby telomeres successively shortenwith proliferation until critically short telomeres activate aDNA-damage pathway which ultimately limits their pro-liferative capacity. This senescence state can be bypassed byinactivation of cell cycle checkpoint genes like p53 resultingin continued proliferation accompanied by additional telo-
Correspondence: Dr. Stefan Zimmermann, Department of Hema-tology/Oncology, University Medical Center Freiburg, HugstetterStrasse 55, 79106 Freiburg, GermanyE-mail: [email protected]: 149-761-270-3754
Abbreviations: DN, dominant negative; GFP, green fluorescentprotein; TERT, human telomerase reverse transcriptase; TRF, tel-omere restriction fragment
DOI 10.1002/pmic.200800471
© 2009 WILEY-VCH Verlag GmbH & Co. KGaA, Weinheim www.proteomics-journal.com
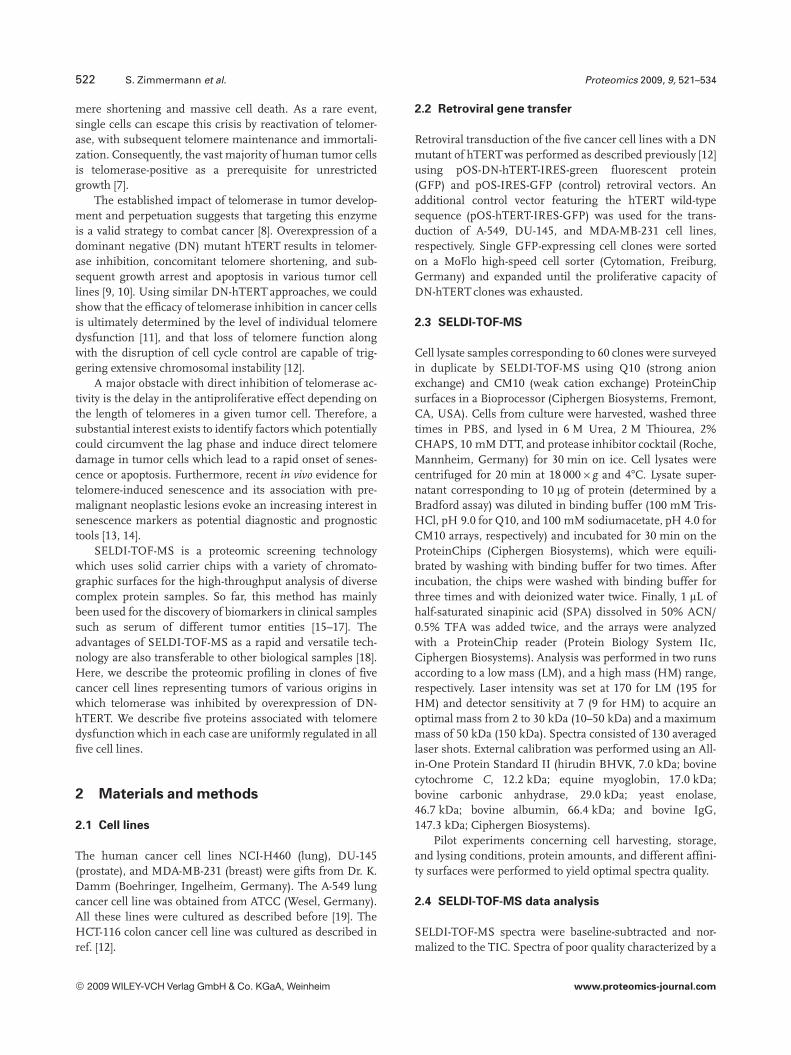
522 S. Zimmermann et al. Proteomics 2009, 9, 521–534
mere shortening and massive cell death. As a rare event,single cells can escape this crisis by reactivation of telomer-ase, with subsequent telomere maintenance and immortali-zation. Consequently, the vast majority of human tumor cellsis telomerase-positive as a prerequisite for unrestrictedgrowth [7].
The established impact of telomerase in tumor develop-ment and perpetuation suggests that targeting this enzymeis a valid strategy to combat cancer [8]. Overexpression of adominant negative (DN) mutant hTERT results in telomer-ase inhibition, concomitant telomere shortening, and sub-sequent growth arrest and apoptosis in various tumor celllines [9, 10]. Using similar DN-hTERT approaches, we couldshow that the efficacy of telomerase inhibition in cancer cellsis ultimately determined by the level of individual telomeredysfunction [11], and that loss of telomere function alongwith the disruption of cell cycle control are capable of trig-gering extensive chromosomal instability [12].
A major obstacle with direct inhibition of telomerase ac-tivity is the delay in the antiproliferative effect depending onthe length of telomeres in a given tumor cell. Therefore, asubstantial interest exists to identify factors which potentiallycould circumvent the lag phase and induce direct telomeredamage in tumor cells which lead to a rapid onset of senes-cence or apoptosis. Furthermore, recent in vivo evidence fortelomere-induced senescence and its association with pre-malignant neoplastic lesions evoke an increasing interest insenescence markers as potential diagnostic and prognostictools [13, 14].
SELDI-TOF-MS is a proteomic screening technologywhich uses solid carrier chips with a variety of chromato-graphic surfaces for the high-throughput analysis of diversecomplex protein samples. So far, this method has mainlybeen used for the discovery of biomarkers in clinical samplessuch as serum of different tumor entities [15–17]. Theadvantages of SELDI-TOF-MS as a rapid and versatile tech-nology are also transferable to other biological samples [18].Here, we describe the proteomic profiling in clones of fivecancer cell lines representing tumors of various origins inwhich telomerase was inhibited by overexpression of DN-hTERT. We describe five proteins associated with telomeredysfunction which in each case are uniformly regulated in allfive cell lines.
2 Materials and methods
2.1 Cell lines
The human cancer cell lines NCI-H460 (lung), DU-145(prostate), and MDA-MB-231 (breast) were gifts from Dr. K.Damm (Boehringer, Ingelheim, Germany). The A-549 lungcancer cell line was obtained from ATCC (Wesel, Germany).All these lines were cultured as described before [19]. TheHCT-116 colon cancer cell line was cultured as described inref. [12].
2.2 Retroviral gene transfer
Retroviral transduction of the five cancer cell lines with a DNmutant of hTERT was performed as described previously [12]using pOS-DN-hTERT-IRES-green fluorescent protein(GFP) and pOS-IRES-GFP (control) retroviral vectors. Anadditional control vector featuring the hTERT wild-typesequence (pOS-hTERT-IRES-GFP) was used for the trans-duction of A-549, DU-145, and MDA-MB-231 cell lines,respectively. Single GFP-expressing cell clones were sortedon a MoFlo high-speed cell sorter (Cytomation, Freiburg,Germany) and expanded until the proliferative capacity ofDN-hTERT clones was exhausted.
2.3 SELDI-TOF-MS
Cell lysate samples corresponding to 60 clones were surveyedin duplicate by SELDI-TOF-MS using Q10 (strong anionexchange) and CM10 (weak cation exchange) ProteinChipsurfaces in a Bioprocessor (Ciphergen Biosystems, Fremont,CA, USA). Cells from culture were harvested, washed threetimes in PBS, and lysed in 6 M Urea, 2 M Thiourea, 2%CHAPS, 10 mM DTT, and protease inhibitor cocktail (Roche,Mannheim, Germany) for 30 min on ice. Cell lysates werecentrifuged for 20 min at 18 0006g and 47C. Lysate super-natant corresponding to 10 mg of protein (determined by aBradford assay) was diluted in binding buffer (100 mM Tris-HCl, pH 9.0 for Q10, and 100 mM sodiumacetate, pH 4.0 forCM10 arrays, respectively) and incubated for 30 min on theProteinChips (Ciphergen Biosystems), which were equili-brated by washing with binding buffer for two times. Afterincubation, the chips were washed with binding buffer forthree times and with deionized water twice. Finally, 1 mL ofhalf-saturated sinapinic acid (SPA) dissolved in 50% ACN/0.5% TFA was added twice, and the arrays were analyzedwith a ProteinChip reader (Protein Biology System IIc,Ciphergen Biosystems). Analysis was performed in two runsaccording to a low mass (LM), and a high mass (HM) range,respectively. Laser intensity was set at 170 for LM (195 forHM) and detector sensitivity at 7 (9 for HM) to acquire anoptimal mass from 2 to 30 kDa (10–50 kDa) and a maximummass of 50 kDa (150 kDa). Spectra consisted of 130 averagedlaser shots. External calibration was performed using an All-in-One Protein Standard II (hirudin BHVK, 7.0 kDa; bovinecytochrome C, 12.2 kDa; equine myoglobin, 17.0 kDa;bovine carbonic anhydrase, 29.0 kDa; yeast enolase,46.7 kDa; bovine albumin, 66.4 kDa; and bovine IgG,147.3 kDa; Ciphergen Biosystems).
Pilot experiments concerning cell harvesting, storage,and lysing conditions, protein amounts, and different affini-ty surfaces were performed to yield optimal spectra quality.
2.4 SELDI-TOF-MS data analysis
SELDI-TOF-MS spectra were baseline-subtracted and nor-malized to the TIC. Spectra of poor quality characterized by a
© 2009 WILEY-VCH Verlag GmbH & Co. KGaA, Weinheim www.proteomics-journal.com

Proteomics 2009, 9, 521–534 523
normalization factor ,0.1 and .3 were excluded from fur-ther analysis. By that means only three spectra in CM10 LM,1 in CM10 HM, and 1 in Q10 LM (out of 120 each) had to beomitted. For the initial analysis of single cell lines, peakswith S/Ns.5 and a cluster mass detection window at 0.3% ofmass were automatically detected using the BiomarkerWizard Peak Picking Algorithm of the ProteinChip Software3.1. p-Values were determined by nonparametric two-samplecomparison with the Wilcoxon rank sum test. Further, anal-ysis of spectra of all samples was performed by Ciphergen-Express Software 3.0. Peaks of all spectra within LM range of2.5–50 kDa (HM: 20–150 kDa) were clustered (S/N and massdetection window as above), the peak intensities of the repli-cates were averaged, and the p-values determined by non-parametric two-sample comparison with the Mann-Whitneytest.
Mass accuracy was calculated from 151 control groupspectra (76 Q10 and 75 CM10, respectively) for five peaks of6.9, 11.3, 13.8, 14.0, and 15.3 kDa. The mean mass accuracy(average coefficient of variation for the five peaks) was 0.08%(9.0 mass units at m/z 11 300).
2.5 Protein identification
2.5.1 Protein purification
Proteins of interest were enriched by anion exchange chro-matography using Q HyperD F Spin Columns (CiphergenBiosystems) according to the manufacturer’s instructions.Briefly, up to 250 mL of crude cell lysate containing up to2 mg protein were diluted 1:1 in 50 mM Tris-HCl, pH 9.0and incubated with the equilibrated anion exchange sorbentof the column on a shaker at room temperature for 30 min.Proteins were eluted in 100 mL aliquots by a pH gradient infive decrement steps (pH 9.0, 7.0, 5.0, 4.0, and 3.0) concludedby an organic washing step in a solution of 33.3% iso-propanol, 16.7% ACN, and 0.1% TFA. 10 mL of each fractiondiluted in 90 mL of binding buffer was monitored by SELDI-TOF-MS on CM10 arrays as described above. The residual ofeach fraction was separated on 10–16% Tris-tricine poly-acrylamide gels according to Schägger et al. [20] that werestained overnight with colloidal CBB G250 [21] anddestained with 20% methanol.
2.5.2 Trypsin digestion after passive elution
Proteins of low molecular weight (,20 kDa) were passivelyeluted from gel bands as described before [22] using a solu-tion of 45% formic acid, 30% ACN, 10% isopropanol, 15%H2O. A small portion (3 mL) of eluted protein was re-analysedby SELDI-TOF-MS on normal phase (NP20) arrays. Theremaining eluate was lyophilized and resolved in 5 mL of20 ng/mL sequencing grade trypsin (Promega, Madison, WI)in 25 mM ammonium bicarbonate and 10% ACN and incu-bated overnight at 377C.
2.5.3 Trypsin in-gel digestion
Trypsin in-gel digestion was performed for bands greaterthan 20 kDa and also for bands of lower molecular weight.Samples were reduced in 10 mM DTT in 100 mM ammo-nium bicarbonate for 30 min at 567C and SH groups werealkylated in 55 mM iodacetamide in 100 mM ammoniumbicarbonate for 45 min at room temperature. Gel bands wereincubated in 12.5 ng/mL Trypsin (Promega) in 50 mMammonium bicarbonate and 5 mM CaCl2 at 377C overnight.
2.5.4 Peptide mapping using SELDI-TOF-MS
Tryptic peptides were analysed by SELDI-TOF-MS on NP20arrays using an CHCA matrix and external calibration by anAll-in-One Peptide Standard (vasopressin, 1.08 kDa; soma-tostatin, 1.64 kDa; dynorphin, 2.15 kDa; ACTH 1–24,2.93 kDa; bovine insulin b-chain, 3.50 kDa; human insulin,5.81 kDa; hirudin BHVK, 6.96 kDa; Ciphergen Biosystems).The MASCOTsoftware [23] (Matrixscience, London, UK) wasused in the Peptide Mass Fingerprint mode in combinationwith the NCBInr database (National Center for Biotechnol-ogy Information, WA, USA) for protein identification(Search criteria: monoisotopic m/z, mass accuracy 1.2 Da orbetter, up to one missed cleavage). Probability based Mowsescores greater than 65 were considered as significant(p,0.05).
2.5.5 Nanoflow-HPLC-MS/MS
For nanoflow-HPLC-MS/MS, dried samples from trypsinin-gel digestion were dissolved in 2% TFA (99.9%, SDS,Peypin, France; water: Lichrosolv®, Darmstadt, Germany).Measurements were performed on a QSTAR Pulsar i massspectrometer (Applera, Darmstadt, Germany) coupled to anUltimate micro pump (Dionex, Idstein, Germany). HPLC-column tips (fused-silica) with 75 mm id (New Objective,USA) were self packed [24] with Reprosil-Pur 120 ODS-3(Dr. Maisch, Ammerbuch, Germany). A gradient of A (0.5%acetic acid (ACS Reagent, Sigma, Germany) in water) and B(0.5 acetic acid in 80% ACN (HPLC gradient grade, SDS,Peypin, France)) with increase in organic proportion wasused for peptide separation. The mass spectrometer wasoperated in the data-dependent mode and switched auto-matically between MS and MS/MS. The MASCOT-Software[23] (Matrixscience, London, UK) in combination with theNCBInr Database (National Center for Biotechnology Infor-mation, WA, USA) was used for protein identification(Search criteria: monoisotopic m/z, mass accuracy for MS:200 ppm or better, for MS/MS 0.5 Da or better, up to onemissed cleavage, variable modifications: Carbamidomethyl(-Cys), Propionamid (-Cys), Oxidation (-Met), Gln-.pyro-Glu (N-term Gln), Glu-.pyro-Glu (N-term Glu)). Proteinswere considered significant when at least two peptides withscore values matching the MASCOT criterium for the indi-cation of identity (p,0.05) were found.
© 2009 WILEY-VCH Verlag GmbH & Co. KGaA, Weinheim www.proteomics-journal.com

524 S. Zimmermann et al. Proteomics 2009, 9, 521–534
2.6 SA-�-galactosidase activity
Cells were plated on chamber slides (Nalge Nunc Inter,Naperville, IL, USA) and a senescence detection assay wascarried out according to manufacturer’s protocol (Trevigen,Gaitersburg, MD, USA).
2.7 Telomerase repeat amplification protocol assay
Telomerase activity of cell populations was determined usingthe TeloTAGGG PCR ELISAPLUS kit (Roche, Mannheim,Germany) according to the manufacturer’s protocol asdescribed previously [25]. For each sample, 0.5 mg of totalprotein was used in the PCR reaction. RNase treated celllysates were used as negative controls. Samples were con-sidered as telomerase negative if the net absorbance (absor-bancesample–absorbanceRNase-treated sample) was lower than thetwo-fold background activity.
2.8 Telomere restriction fragment Southern blot
Telomere length was analyzed by telomere restriction frag-ment (TRF) Southern blot according to the following proce-dure: 2 mg of genomic DNA were digested by mixing HinfIand RsaI (Roche Diagnostics, Mannheim, Germany), andTRFs were separated by 0.8% agarose gel electrophoresis.DNA fragments were transferred to a positively chargednylon membrane (Roche Diagnostics Mannheim, Germany)and UV crosslinked. Hybridization and detection were per-formed using the TeloTAGGG Telomere Length Assay Kit(Roche Diagnostics) according to the manufacturer’s proto-col.
2.9 Immunoblotting
Western blot analysis was performed as described previously[26]. Briefly, proteins were loaded onto SDS- and Tris-tricinepolyacrylamide gels, transferred onto polyvinylidene mem-branes (Millipore, Billerica, MA, USA), and detected with anECL Plus detection system (Amersham, Buckinghamshire,UK). The following primary polyclonal antibodies were used:anti-histone H4 (no. 2592), and anti-histone H2A (no. 2578)(Cell Signaling Technology, Danvers, MA, USA); anti-histoneH2B (no. 07-371) (Upstate Cell Signaling Solutions, LakePlacid, NY, USA); anti-cytokeratin 8, and anti-cytokeratin 18(Santa Cruz Biotechnologies, Santa Cruz, CA, USA); anti-cytokeratin 19 (Dako Cytomations, Glostrup, Denmark); andanti-actin (Biocarta, San Diego, CA, USA). In addition, mAbanti-histone H4 (no. 05-858) (Upstate Cell Signaling Solu-tions, Lake Placid, NY, USA) and anti-histone H3 (ab10799)(Abcam, Cambridge, UK) were used.
2.10 Immunoprecipitation
Antibodies against histone H2B, cytokeratin 19, and cyto-keratin 18 and corresponding isotype control antibodies were
bound on protein A- and G-Sepharose beads (Sigma),respectively. Therefore, up to 30 mg of antibody was incu-bated with 30 mL of resin in 300 mL of 0.01% Triton X-100 inPBS in duplicate rotating overnight at 47C. The resin waswashed twice with nondenaturating lysis buffer (0.1% TritonX-100, 50 mM Tris Cl, 300 mM NaCl, 5 mM EDTA, pH 7.4)and incubated with 100 mg of crude cell extract (diluted in thesame buffer to 1 mg/mL). After 1 h rotating at 47C the super-natant was transferred to the second line of resin and incu-bated for another hour. The supernatant was assayed forimmunodepletion on Q10 arrays as described above. Thebeads were washed four times with nondenaturating lysisbuffer, once with PBS, and once with deionized water. Theimmunoprecipitated proteins were released from the beadswith 0.1 M acetic acid and analysed on NP20 arrays.
3 Results
3.1 Telomerase inhibition in cancer cell lines
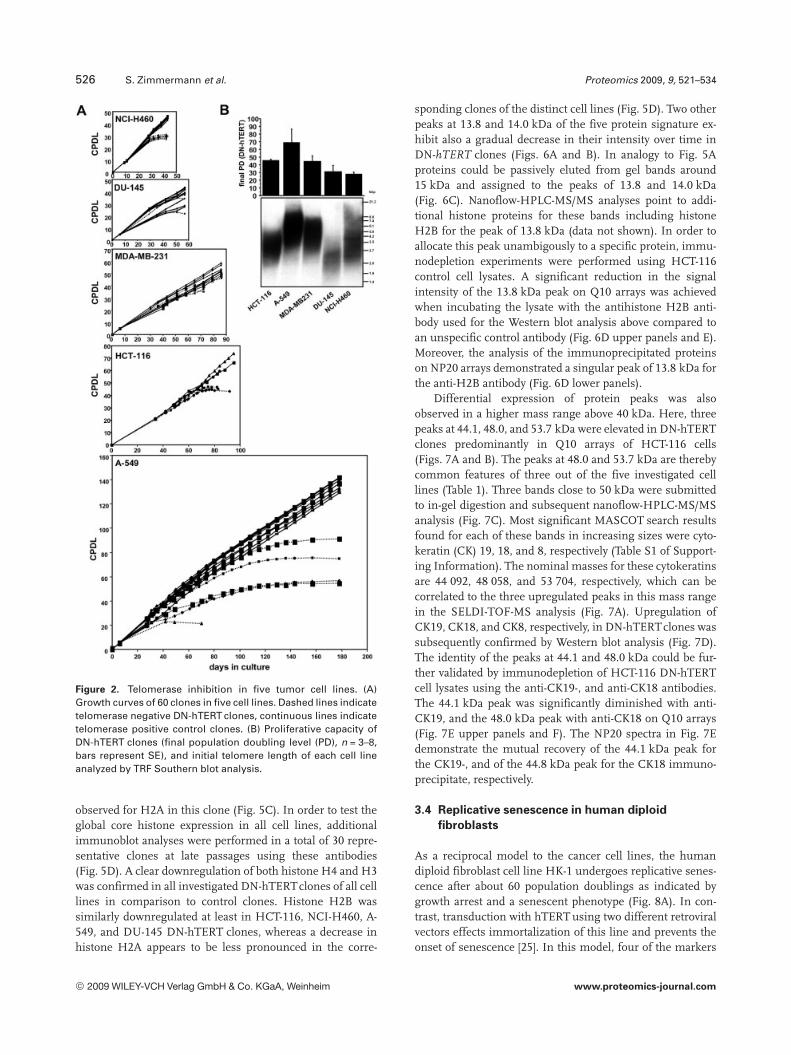
In order to induce telomere dysfunction in tumor cells, a DNmutant of hTERT was retrovirally transduced in the telo-merase positive cell lines HCT-116, NCI-H460, A-549, DU-145, and MDA-MB-231. Among these, 60 clones were select-ed based on their maintenance of GFP expression until theend of the culture. As we described recently [11, 12], theselected DN-hTERT clones exhibited a complete ablation oftelomerase activity throughout the culture which was mon-itored by telomerase repeat amplification protocol (TRAP)assay (data not shown). Figure 1 shows characteristics of tel-omerase inhibition in a representative DN-hTERT clone inthe A-549 lung cancer cell line indicating a proliferationarrest (Fig. 1A) in the course of successive telomere short-ening (Fig. 1B). This ultimately results in a typical senes-cence phenotype characterized by a flattened and enlargedcell morphology and the expression of senescence-associatedb-galactosidase (Fig. 1C). In contrast, telomerase positivecontrol clones maintain their proliferative capacity, telomerelength, and cell morphology throughout the culture(Figs. 1A–C). As it has been described previously [9], theinitial telomere length of the investigated cell lines correlatedwith the proliferative capacity of the corresponding DN-hTERT clones which is manifesting in a relatively long life-span of DN-hTERT clones of cell lines with long telomeressuch as A-549 cells (Fig. 2).
3.2 SELDI-TOF-MS analysis of tumor cell clones
All 60 clones described above were analyzed on Q10 (stronganion exchange) and CM10 (weak cation exchange) Pro-teinChip arrays. Analyses included longitudinal studies ofsuccessive time points of representative single clones duringcell culture as well as the comparison between telomerase-inhibited clones and controls at late passages as shown forHCT-116 cells in Fig. 3A. Although the profiles appeared
© 2009 WILEY-VCH Verlag GmbH & Co. KGaA, Weinheim www.proteomics-journal.com

Proteomics 2009, 9, 521–534 525
Figure 1. Telomerase inhibitionin A-549 lung cancer cell line. (A)Representative growth curves ofsingle cell clones after retroviraltransduction with DN mutant ofhTERT (DN-hTERT) and vectorcontrol. Numbers indicate timepoints of analysis in telomerasenegative DN-hTERT clone(squares) and telomerase posi-tive vector control clone (cir-cles). (B) TRF Southern blotanalysis in control (1, 2) and DN-hTERT clone over time (3–8). (C)Senescence assay performed atlate passages of culture of theDN-hTERT (8) and the control (2)clones. CPDL: cumulative popu-lation doubling levels.
homogeneously within each cell line, significant differencesin the expression of proteins were observed as a consequenceof telomerase inhibition (Fig. 3B). Some of these peaksthereby revealed a gradual alteration in the intensities overthe time course of the culture as illustrated for the threepeaks in Fig. 3C. For late passages of the cell culture 15 dif-ferentially regulated peaks (seven up- and eight down-regulated) were found in at least three of the five cell lines inat least one of the ProteinChip array types using the Bio-marker Wizard analysis (p,0.05, Table 1). Among these, fivepeaks with m/z values in the range of 10.4–15.3 kDa weredifferentially regulated (one up- and four downregulated) inall investigated cell lines.
In order to strengthen the statistical significance of thesepeaks, a more comprehensive analysis of all clones inmerged duplicates was undertaken using the CiphergenEx-press software 3.0. The comparison of DN-hTERT clones(n = 22) with the vector only- (n = 17) and nontransducedclones (n = 14), respectively, revealed six highly significantpeaks on Q10 arrays and nine on CM10 arrays including thefive peaks described above exhibiting very low p values up to2.561027 (Table 2, Fig. 4). High area under the curve (AUC)values in receiver operating characteristic (ROC) plots up to0.97 make these peaks good markers for separating DN-hTERT and control samples (Table 2). No significant differ-ences were found when comparing vector- and non-transduced control clones among each other (p.0.1).
3.3 Identification of differentially expressed proteins
For the purification and identification of differentiallyexpressed proteins in telomerase-inhibited tumor cellslysates from the HCT-116 cell line were used because thesecells demonstrated the relevant peaks in high abundance.Such samples were fractionated and separated on polyacryl-
amide gels. Proteins of low molecular weight (,20 kDa)were passively eluted from gel bands [22]. The re-analysis ofan eluted protein on NP20 arrays allowed confirmation of itsmass identity with the protein peak of the original SELDI-TOF-MS spectrum. Figure 5A shows the application of thisstrategy for a band of about 12 kDa which was cut out from agel lane containing the organic fraction of a HCT-116 controlclone cell lysate. Passively eluted protein from this band wasre-analyzed on a NP20 array resulting in a single peak of11.3 kDa which is in accordance with the original peak foundon Q10 arrays of control samples. A MASCOT databasesearch for peptide masses from a NP20 array after trypsindigestion of this protein revealed histone H4 with a signifi-cant probability based mowse score of 72 and a sequencecoverage of 41%. A molecular weight range between 11 230(gi:223582) and 11 370 (gi:124504316) for different humanhistone H4 family members supports the observed peakmass in the SELDI-TOF-MS analysis. The identity of the11.3 kDa peak as histone H4 could be confirmed by nano-flow-HPLC-MS/MS analysis of comparable bands subjectedto trypsin-in-gel digestion (Fig. 5B). Nanoflow-HPLC-MS/MS is not only providing information about the peptidemasses but also additionally about the sequence of the singlepeptide. Although this powerful technology reveals multiplehits for a single band under certain conditions, in this bandhistone H4 was found as the only significant protein(Fig. 5B). As seen in Figs. 3 and 4, the intensity of the11.3 kDa peak is decreasing in DN-hTERT clones. Westernblot analysis of the HCT-116 clone presented in Fig. 3 exhib-ited a clear downregulation of histone H4 as a result of telo-merase inhibition which was demonstrated by the use ofpolyclonal and monoclonal anti-histone H4 antibodies(Fig. 5C). A downregulation of histone H3 was found to thesame extent as for histone H4. Furthermore, the expressionof histone H2B was decreased, whereas no alteration was
© 2009 WILEY-VCH Verlag GmbH & Co. KGaA, Weinheim www.proteomics-journal.com
526 S. Zimmermann et al. Proteomics 2009, 9, 521–534
Figure 2. Telomerase inhibition in five tumor cell lines. (A)Growth curves of 60 clones in five cell lines. Dashed lines indicatetelomerase negative DN-hTERT clones, continuous lines indicatetelomerase positive control clones. (B) Proliferative capacity ofDN-hTERT clones (final population doubling level (PD), n = 3–8,bars represent SE), and initial telomere length of each cell lineanalyzed by TRF Southern blot analysis.
observed for H2A in this clone (Fig. 5C). In order to test theglobal core histone expression in all cell lines, additionalimmunoblot analyses were performed in a total of 30 repre-sentative clones at late passages using these antibodies(Fig. 5D). A clear downregulation of both histone H4 and H3was confirmed in all investigated DN-hTERTclones of all celllines in comparison to control clones. Histone H2B wassimilarly downregulated at least in HCT-116, NCI-H460, A-549, and DU-145 DN-hTERT clones, whereas a decrease inhistone H2A appears to be less pronounced in the corre-
sponding clones of the distinct cell lines (Fig. 5D). Two otherpeaks at 13.8 and 14.0 kDa of the five protein signature ex-hibit also a gradual decrease in their intensity over time inDN-hTERT clones (Figs. 6A and B). In analogy to Fig. 5Aproteins could be passively eluted from gel bands around15 kDa and assigned to the peaks of 13.8 and 14.0 kDa(Fig. 6C). Nanoflow-HPLC-MS/MS analyses point to addi-tional histone proteins for these bands including histoneH2B for the peak of 13.8 kDa (data not shown). In order toallocate this peak unambigously to a specific protein, immu-nodepletion experiments were performed using HCT-116control cell lysates. A significant reduction in the signalintensity of the 13.8 kDa peak on Q10 arrays was achievedwhen incubating the lysate with the antihistone H2B anti-body used for the Western blot analysis above compared toan unspecific control antibody (Fig. 6D upper panels and E).Moreover, the analysis of the immunoprecipitated proteinson NP20 arrays demonstrated a singular peak of 13.8 kDa forthe anti-H2B antibody (Fig. 6D lower panels).
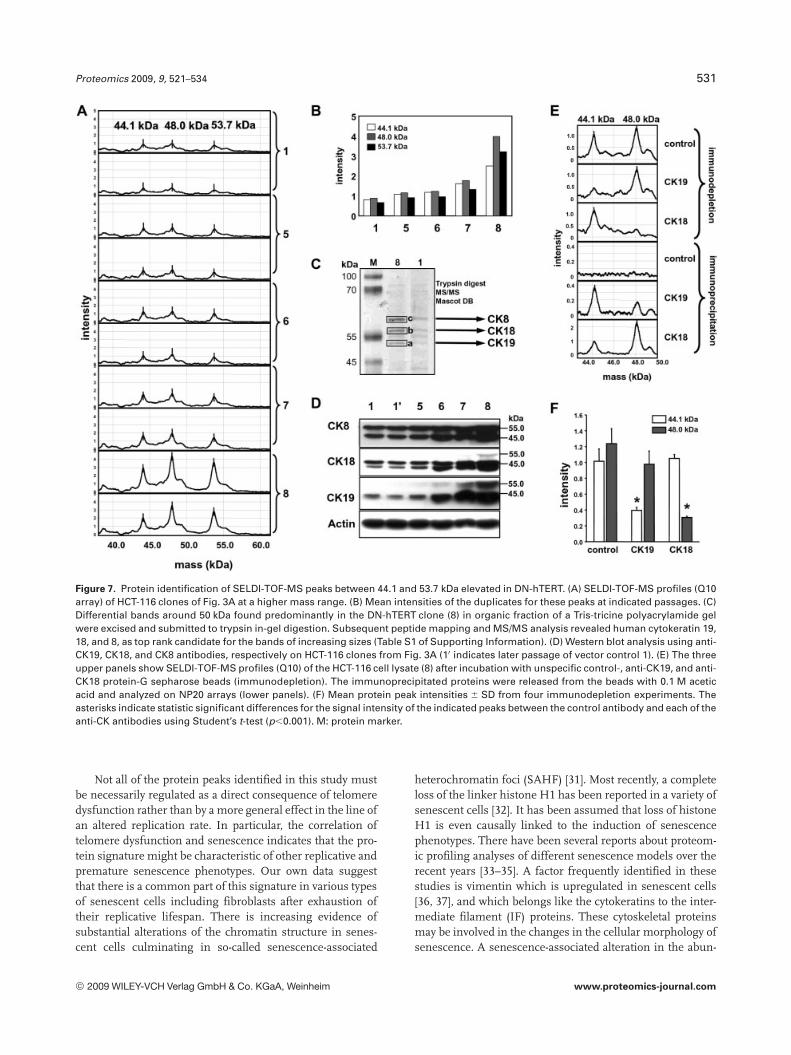
Differential expression of protein peaks was alsoobserved in a higher mass range above 40 kDa. Here, threepeaks at 44.1, 48.0, and 53.7 kDa were elevated in DN-hTERTclones predominantly in Q10 arrays of HCT-116 cells(Figs. 7A and B). The peaks at 48.0 and 53.7 kDa are therebycommon features of three out of the five investigated celllines (Table 1). Three bands close to 50 kDa were submittedto in-gel digestion and subsequent nanoflow-HPLC-MS/MSanalysis (Fig. 7C). Most significant MASCOT search resultsfound for each of these bands in increasing sizes were cyto-keratin (CK) 19, 18, and 8, respectively (Table S1 of Support-ing Information). The nominal masses for these cytokeratinsare 44 092, 48 058, and 53 704, respectively, which can becorrelated to the three upregulated peaks in this mass rangein the SELDI-TOF-MS analysis (Fig. 7A). Upregulation ofCK19, CK18, and CK8, respectively, in DN-hTERTclones wassubsequently confirmed by Western blot analysis (Fig. 7D).The identity of the peaks at 44.1 and 48.0 kDa could be fur-ther validated by immunodepletion of HCT-116 DN-hTERTcell lysates using the anti-CK19-, and anti-CK18 antibodies.The 44.1 kDa peak was significantly diminished with anti-CK19, and the 48.0 kDa peak with anti-CK18 on Q10 arrays(Fig. 7E upper panels and F). The NP20 spectra in Fig. 7Edemonstrate the mutual recovery of the 44.1 kDa peak forthe CK19-, and of the 44.8 kDa peak for the CK18 immuno-precipitate, respectively.
3.4 Replicative senescence in human diploid
fibroblasts
As a reciprocal model to the cancer cell lines, the humandiploid fibroblast cell line HK-1 undergoes replicative senes-cence after about 60 population doublings as indicated bygrowth arrest and a senescent phenotype (Fig. 8A). In con-trast, transduction with hTERT using two different retroviralvectors effects immortalization of this line and prevents theonset of senescence [25]. In this model, four of the markers
© 2009 WILEY-VCH Verlag GmbH & Co. KGaA, Weinheim www.proteomics-journal.com

Proteomics 2009, 9, 521–534 527
Figure 3. SELDI-TOF-MS analysis in clones of the HCT-116 colon cancer cell line after telomerase inhibition. (A) Growth curves of single cellclones characterized in ref. [12] in analogy to Fig. 1A. (B) SELDI-TOF-MS profiles of defined time points in A in duplicate using Q10 Pro-teinChip arrays. Arrows indicate alterations in peak intensities at 10.1, 11.3, and 12.0 kDa, respectively. (C) Mean intensities of the dupli-cates for these peaks at indicated passages.
Table 1. Summary of SELDI peaks differentially expressed in DN-hTERT clones in at least three of the five cell lines and the array type theywere found on
Mass (kDa) Expression in DN-hTERT HCT-116 A-549 NCI-H460 DU-145 MDA-MB-231
4.5 Up CM10 CM10 CM104.7 Up CM10 CM10 CM1010.4a) Up Q10 Q10 Q10 Q10 Q1011.3a) Down Q10 CM10 Q10 Q10 CM10 Q10 CM10 Q1011.6 Up CM10 CM10 CM1011.9 Down Q10 Q10 Q1012.0 Down Q10 Q10 Q1013.8a) Down Q10 CM10 Q10 CM10 Q10 CM10 CM10 Q10 CM1014.0a) Down Q10 CM10 Q10 CM10 Q10 CM10 Q10 CM10 Q10 CM1015.3a) Down Q10 CM10 Q10 Q10 CM10 Q10 CM10 Q1022.6 Down CM10 CM10 CM1022.8 Down Q10 Q10 Q1038.6 Up CM10 CM10 CM1048.0 Up Q10 CM10 Q10 CM10 Q10 CM1053.7 Up Q10 Q10 Q10
Analysis of the single cell lines on Q10 (strong anion exchange) and CM10 (weak cation exchange) ProteinChip arrays was performed byCiphergen ProteinChip software using Biomarker Wizard.a) Peaks which show equal alterations in all five cell lines.
© 2009 WILEY-VCH Verlag GmbH & Co. KGaA, Weinheim www.proteomics-journal.com

528 S. Zimmermann et al. Proteomics 2009, 9, 521–534
Table 2. Most significant peaks (p,0.01) from CiphergenExpress software analysis of all clones in merged duplicates
Mass (kDa) Mean peak intensity (6 SD) DN vs. neg DN vs. vec
neg (n = 14) vec (n = 17) DN (n = 22) p AUC p AUC
Q10
10.4a) 1.0 6 0.4 1.1 6 0.6 1.9 6 0.8 2.161023 0.20 1.161023 0.2211.3a) 1.8 6 0.8 2.2 6 0.9 0.7 6 0.5 5.061025 0.92 2.661026 0.9412.0 1.9 6 0.6 2.0 6 0.7 1.0 6 0.5 6.661026 0.88 4.561025 0.8613.8a) 1.0 6 0.3 1.1 6 0.3 0.4 6 0.2 3.561026 0.94 8.361027 0.9514.0a) 0.9 6 0.3 1.0 6 0.3 0.3 6 0.2 4.861026 0.94 6.261027 0.9715.3a) 0.4 6 0.2 0.5 6 0.3 0.1 6 0.1 9.961025 0.88 3.061026 0.95
CM1010.1 7.1 6 2.4 6.3 6 2.3 11.3 6 5.6 7.861023 0.23 5.561024 0.1710.3 1.5 6 0.5 1.4 6 0.4 2.4 6 1.0 3.561023 0.23 4.061024 0.1711.3a) 3.7 6 1.8 4.6 6 2.5 2.5 6 3.3 1.561023 0.84 2.661024 0.8311.6 2.8 6 0.7 2.7 6 0.8 4.5 6 1.4 8.661025 0.11 2.261025 0.1311.9 1.5 6 0.4 1.4 6 0.4 2.1 6 0.5 4.661024 0.14 1.261024 0.1513.8a) 4.5 6 1.2 4.5 6 1.1 1.6 6 0.9 8.161027 0.97 2.561027 0.9714.0a) 3.2 6 1.1 3.5 6 1.3 1.2 6 1.0 2.561025 0.90 3.961026 0.9215.3a) 1.1 6 0.7 1.4 6 1.0 0.7 6 1.4 1.061023 0.82 4.061024 0.8322.6 0.2 6 0.1 0.2 6 0.1 0.1 6 0.1 1.261023 0.81 4.961024 0.84
DN: dominant-negative hTERT-, neg: non-, vec: vector-transduced clones. AUC: area under the curve in ROC plots. p-Values were deter-mined by nonparametric two-sample comparison with the Mann-Whitney test intrinsic to the Ciphergen Express software.a) Peaks already identified in single analyses of all five cell lines (see Table 1).
Figure 4. Protein peak signature of telomere dysfunction. Com-prehensive SELDI-TOF-MS data analysis of five cell lines repre-sented by 60 clones in merged duplicates using CiphergenEx-press software reveal five significant protein peaks (p,0.01,Table 2) when comparing DN-hTERT clones (squares) with non-(circles, neg) and vector-transduced (triangles, vec) controlclones as represented here on Q10 arrays.
identified in the tumor cell model (11.3, 13.8, 14.0, and44.1 kDa) were significantly changed (p,0.01) in late pas-sages of wild type-cells with senescent phenotype in com-parison to derivative hTERT-overexpressing fibroblasts asdemonstrated by SELDI-TOF-MS analysis (Fig. 8B). More-over, Western blot analysis confirmed the downregulation ofhistones H4, H3, and H2B, in addition to the upregulation ofcytokeratin 19 in senescent fibroblasts, whereas hTERT-immortalized cells lacked these senescence-associatedchanges of their proteome (Fig. 7C).
4 Discussion
Cellular senescence induced by telomere dysfunction hasbeen known to constitute a potent tumor suppressionmechanism [14]. The ongoing chromosomal instability thatoccurs when telomere function is lost will ultimately resultin genotoxic stress which triggers DNA damage responsepathways and activation of p53. Here, we have performedmass spectrometric analyses to discover proteome alterationsin cancer cells at the onset of telomere dysfunction. Thepower of this study is based on the analysis of multiple clonalcell populations of different tumor origins using a combina-tion of SELDI-TOF-MS as rapid screening tool and nanoflow-HPLC-MS/MS as technology of high performance. In con-trast to bulk transfected cell populations, these clones arecharacterized by complete abrogation of telomerase activityand therefore permit an efficient analysis of telomere lengthand growth dynamics (Figs. 1A and B). The phenotypic
© 2009 WILEY-VCH Verlag GmbH & Co. KGaA, Weinheim www.proteomics-journal.com

Proteomics 2009, 9, 521–534 529
Figure 5. Protein identification of 11.3 kDa peak diminished in DN-hTERT. (A) A band about 12 kDa (organic fraction in Tris-tricine poly-acrylamide gel) which is higher expressed in HCT-116 control (1) than in DN-hTERT clone (8) was excised and subjected to passive elutionand analyzed on a normal phase (NP20) array. Unique peak from passive elution (MW 11,321, lower spectrum) is correlated with the orig-inal 11.3 kDa peak of the corresponding clone on a Q10 array (MW 11,322, upper spectrum). NP20 array analysis of peptides of the passiveeluted protein after trypsin digestion (right spectrum) reveals fingerprint characteristic for human histone H4 (MASCOT database search).M: protein marker. (B) MASCOT database results for nano-flow-HPLC-MS/MS analysis of comparable 12 kDa band following trypsin in-geldigestion. Peptides in brackets show score values failing the MASCOT criterium for the indication of identity (p,0.05). Expt: experimental.(C) Western blot analysis of HCT-116 clones by time points indicated in Fig. 3A using histone H4 (*, monoclonal and 7, polyclonal, respec-tively), and histone H3, histone H2A, and histone H2B antibodies. (D) Western blot analyses of clones of all five tumor cell lines at latepassages of the cell culture. Comparison of DN-hTERT (DN) clones and controls including non-, vector-, and wild-type hTERT-transducedclones using anti-histone antibodies as indicated above. Asterisks mark the HCT-116 clones from the longitudinal analysis in C.
effects of telomere dysfunction have been recently describedby us in clones of the colorectal cancer cell line HCT-116 [12]which were also used in this study. The SELDI-TOF-MSanalysis of such clones resulted in homogenous profiles al-though distinct alterations in protein peak intensities wereobserved following the onset of telomere dysfunction (Fig. 3).Our studies were extended to a total of five cancer cell linesrepresenting tumor tissues of four different origins (lung,colon, breast, and prostate). The proteomic signaturesrevealed a panel of 15 protein peaks differentially expressedin at least three cell lines predominantly at late passages. Thequintessence of the study is a signature of five distinct pro-
teins common to all five cell lines with telomere dysfunction.Two independent statistic analyses provided congruentresults for the significance of these proteins as biomarkersrelated to telomere dysfunction.
One out of the five proteins corresponding to the11.3 kDa peak downregulated in DN-hTERT clones wasidentified and validated as histone H4. Recently, a peak at11.3 kDa was identified as histone H4 using a similarapproach in a proteomic analysis of mucosa of invasive headand neck cancer [27]. In general, histone synthesis is mainlyregulated by the abundance of histone mRNA and is tightlycoupled to DNA synthesis during S-phase of the cell cycle
© 2009 WILEY-VCH Verlag GmbH & Co. KGaA, Weinheim www.proteomics-journal.com

530 S. Zimmermann et al. Proteomics 2009, 9, 521–534
Figure 6. Downregulation of 13.8 and 14.0 kDa peaks in DN-hTERT. (A) SELDI-TOF-MS profiles of defined time points of HCT-116 clones inFig. 3A in duplicate using Q10 ProteinChip arrays. (B) Mean intensities of the duplicates for these peaks at indicated passages. (C) Passiveelution from protein bands around 15 kDa as described in Fig. 5. (D) The two upper panels show SELDI-TOF-MS profiles (Q10) of the HCT-116 cell lysate (1) after incubation with unspecific control-, and anti-histone H2B antibody protein-A sepharose beads (immunodepletion).The immunoprecipitated proteins were released from the beads with 0.1 M acetic acid and analyzed on NP20 arrays (lower panels). (E)Mean protein peak intensities 6 SD from four immunodepletion experiments. The asterisk indicates an statistic significant difference forthe signal intensity of the 13.8 kDa peak between control- and anti-H2B antibody using Student’s t-test (p,0.01).
[28]. DNA damage by ionizing radiation was shown to inducea direct downregulation in the expression of histone genes ofall subtypes through the G1 checkpoint pathway [29]. So far,there have been no reports about a bulk downregulation ofhistones in the context of telomere dysfunction. Our workdemonstrates for the first time that telomere dysfunction,which is a distinct mechanism associated with DNA damage[30] is having similar effects which is represented by a de-crease in the protein amount primarily of the core histonesH4, H3, and H2B. Our study is based on a SELDI-TOF-MSanalysis of crude cell lysates which predominantly allows theidentification of more abundant proteins. In order to identifyless abundant factors related to telomere dysfunction, wecurrently perform proteomic analyses using fractionation of
HCT-116 cell compartments including cytoplasmatic andnuclear fractions. Appropriately, SELDI-TOF-MS analysis ofa nuclear subfraction of proteins representing the histones isresulting in a strong and exclusive enrichment of the fourprotein peaks (11.3, 13.8, 14.0, and 15.3 kDa data notshown). In conclusion, up to four out of the five proteinsassociated with telomere dysfunction are histone proteins.
Su et al. [29] used also HCT-116 cells with different p53and p21 backgrounds to demonstrate the dependence ofhistone downregulation on these two cell cycle checkpointsfollowing irradiation. The histone regulation in associationwith a loss of telomere function might also depend on intactp53 and p21 expression in line with our previous studies onDN-hTERT clones of these HCT-116 derivatives [12].
© 2009 WILEY-VCH Verlag GmbH & Co. KGaA, Weinheim www.proteomics-journal.com
Proteomics 2009, 9, 521–534 531
Figure 7. Protein identification of SELDI-TOF-MS peaks between 44.1 and 53.7 kDa elevated in DN-hTERT. (A) SELDI-TOF-MS profiles (Q10array) of HCT-116 clones of Fig. 3A at a higher mass range. (B) Mean intensities of the duplicates for these peaks at indicated passages. (C)Differential bands around 50 kDa found predominantly in the DN-hTERT clone (8) in organic fraction of a Tris-tricine polyacrylamide gelwere excised and submitted to trypsin in-gel digestion. Subsequent peptide mapping and MS/MS analysis revealed human cytokeratin 19,18, and 8, as top rank candidate for the bands of increasing sizes (Table S1 of Supporting Information). (D) Western blot analysis using anti-CK19, CK18, and CK8 antibodies, respectively on HCT-116 clones from Fig. 3A (10 indicates later passage of vector control 1). (E) The threeupper panels show SELDI-TOF-MS profiles (Q10) of the HCT-116 cell lysate (8) after incubation with unspecific control-, anti-CK19, and anti-CK18 protein-G sepharose beads (immunodepletion). The immunoprecipitated proteins were released from the beads with 0.1 M aceticacid and analyzed on NP20 arrays (lower panels). (F) Mean protein peak intensities 6 SD from four immunodepletion experiments. Theasterisks indicate statistic significant differences for the signal intensity of the indicated peaks between the control antibody and each of theanti-CK antibodies using Student’s t-test (p,0.001). M: protein marker.
Not all of the protein peaks identified in this study mustbe necessarily regulated as a direct consequence of telomeredysfunction rather than by a more general effect in the line ofan altered replication rate. In particular, the correlation oftelomere dysfunction and senescence indicates that the pro-tein signature might be characteristic of other replicative andpremature senescence phenotypes. Our own data suggestthat there is a common part of this signature in various typesof senescent cells including fibroblasts after exhaustion oftheir replicative lifespan. There is increasing evidence ofsubstantial alterations of the chromatin structure in senes-cent cells culminating in so-called senescence-associated
heterochromatin foci (SAHF) [31]. Most recently, a completeloss of the linker histone H1 has been reported in a variety ofsenescent cells [32]. It has been assumed that loss of histoneH1 is even causally linked to the induction of senescencephenotypes. There have been several reports about proteom-ic profiling analyses of different senescence models over therecent years [33–35]. A factor frequently identified in thesestudies is vimentin which is upregulated in senescent cells[36, 37], and which belongs like the cytokeratins to the inter-mediate filament (IF) proteins. These cytoskeletal proteinsmay be involved in the changes in the cellular morphology ofsenescence. A senescence-associated alteration in the abun-
© 2009 WILEY-VCH Verlag GmbH & Co. KGaA, Weinheim www.proteomics-journal.com

532 S. Zimmermann et al. Proteomics 2009, 9, 521–534
Figure 8. Senescence in human diploid fibroblasts. The primary human fibroblast cell line HK-1 was immortalized by retroviral transduc-tion with hTERT as described before [25]. As seen there, non- (neg) and empty vector transduced cells (vec) showed no detectable telo-merase activity resulting in telomere shortening and replicative senescence at about 60 population doublings whereas telomerase activitywas induced in cells transduced with two different retroviral hTERT vectors (pBABE-hTERT and pOS-hTERT) resulting in telomere main-tenance and immortalization of both lines. (A) Senescence b-galactosidase assay, (B) SELDI-TOF-MS analyses, and (C) Western blot wasperformed at late passages of these cell lines as described in Figs. 1, 3, and 5, respectively. (B) Mean protein peak intensities 6 SD at indi-cated masses from three experiments on Q10 SELDI-TOF-MS ProteinChip arrays. Asterisks indicate statistic significant differences be-tween the controls (neg, vec) and each of the hTERT lines using Student t-test (p,0.01).
dance and organization of IF proteins has been reportedmore than 20 years ago [38, 39]. However, an upregulation ofcytokeratins in this context has not been described so far.Since keratins of hair and skin are frequent contaminators ofmass-spectrometric analyses they can complicate the identi-fication of related proteins in the real sample [40]. Never-theless, none of the cytokeratins identified here (CK19,CK18, and CK8) could be detected in blank control bands cutout from the same gels, which indeed contained other hu-man keratins (CK1, CK14, CK2e, CK10 among others, datanot shown). Another factor with a role in cytoskeleton remo-deling could be recently identified as human profilin-1 in aSELDI-TOF-MS analysis of T-cell clones after long-term cul-ture as a potential marker of immunosenescence [41].
The elucidation of novel biomarkers associated with tel-omere dysfunction may have significant clinical importance.
Loss of telomere function with ongoing genetic instabilitymakes cells susceptible for the development of cancer. Theapplication of markers which may indicate cells on the roadto neoplastic outgrowth could have diagnostic and prog-nostic impact. The general paucity of markers for cellularsenescence makes it difficult to evaluate this phenomenon,even if the long-sought in vivo evidence for senescence wasobtained recently [42, 43]. Therefore, it would be interestingto show if the biomarkers identified in this study are suitableto detect senescent cells in vitro and in vivo.
Grant support from European Community grant LSHC-CT-2004-502943 (MOL CANCER MED) to U. M. and S. Z.
The authors have declared no conflict of interest.
© 2009 WILEY-VCH Verlag GmbH & Co. KGaA, Weinheim www.proteomics-journal.com

Proteomics 2009, 9, 521–534 533
5 References
[1] Verdun, R. E., Karlseder, J., Replication and protection oftelomeres. Nature 2007, 447, 924–931.
[2] Watson, J. D., Origin of concatemeric T7 DNA. Nat. NewBiol. 1972, 239, 197–201.
[3] Lingner, J., Cooper, J. P., Cech, T. R., Telomerase and DNAend replication: No longer a lagging strand problem? Sci-ence 1995, 269, 1533–1534.
[4] von Zglinicki, T., Oxidative stress shortens telomeres. TrendsBiochem. Sci. 2002, 27, 339–344.
[5] Cech, T. R., Beginning to understand the end of the chromo-some. Cell 2004, 116, 273–279.
[6] Greider, C. W., Blackburn, E. H., A telomeric sequence in theRNA of tetrahymena telomerase required for telomererepeat synthesis. Nature 1989, 337, 331–337.
[7] Kim, N. W., Piatyszek, M. A., Prowse, K. R., Harley, C. B. et al.,Specific association of human telomerase activity withimmortal cells and cancer. Science 1994, 266, 2011–2015.
[8] Zimmermann, S., Martens, U. M., Telomeres and telomeraseas targets for cancer therapy. Cell. Mol. Life Sci. 2007, 64,906–921.
[9] Hahn, W. C., Stewart, S. A., Brooks, M. W., York, S. G. et al.,Inhibition of telomerase limits the growth of human cancercells. Nat. Med. 1999, 5, 1164–1170.
[10] Zhang, X., Mar, V., Zhou, W., Harrington, L., Robinson, M. O.,Telomere shortening and apoptosis in telomerase-inhibitedhuman tumor cells. Genes Dev. 1999, 13, 2388–2399.
[11] Pantic, M., Zimmermann, S., Waller, C. F., Martens, U. M.,The level of telomere dysfunction determines the efficacy oftelomerase based therapeutics in a lung cancer cell line. Int.J. Oncol. 2005, 26, 1227–1232.
[12] Pantic, M., Zimmermann, S., El Daly, H., Opitz, O. G. et al.,Telomere dysfunction and loss of p53 cooperate in defectivemitotic segregation of chromosomes in cancer cells. Onco-gene 2006, 25, 4413–4420.
[13] Collado, M., Serrano, M., The power and the promise ofoncogene-induced senescence markers. Nat. Rev. Cancer2006, 6, 472–476.
[14] Sedivy, J. M., Telomeres limit cancer growth by inducingsenescence: Long-sought in vivo evidence obtained. CancerCell 2007, 11, 389–391.
[15] Zhukov, T. A., Johanson, R. A., Cantor, A. B., Clark, R. A.,Tockman, M. S., Discovery of distinct protein profiles spe-cific for lung tumors and pre-malignant lung lesions bySELDI mass spectrometry. Lung Cancer 2003, 40, 267–279.
[16] Melle, C., Ernst, G., Schimmel, B., Bleul, A. et al., A technicaltriade for proteomic identification and characterization ofcancer biomarkers. Cancer Res. 2004, 64, 4099–4104.
[17] Zhang, Z., Bast, R. C., Jr., Yu, Y., Li, J. et al., Three biomarkersidentified from serum proteomic analysis for the detectionof early stage ovarian cancer. Cancer Res. 2004, 64, 5882–5890.
[18] Nakamura, K., Yoshikawa, K., Yamada, Y., Saga, S. et al.,Differential profiling analysis of proteins involved in anti-proliferative effect of interferon-alpha on renal cell carci-noma cell lines by protein biochip technology. Int. J. Oncol.2006, 28, 965–970.
[19] Damm, K., Hemmann, U., Garin-Chesa, P., Hauel, N. et al., Ahighly selective telomerase inhibitor limiting human cancercell proliferation. EMBO J. 2001, 20, 6958–6968.
[20] Schagger, H., von Jagow, G., Tricine-sodium dodecyl sul-fate-polyacrylamide gel electrophoresis for the separationof proteins in the range from 1 to 100 kDa. Anal. Biochem.1987, 166, 368–379.
[21] Neuhoff, V., Arold, N., Taube, D., Ehrhardt, W., Improvedstaining of proteins in polyacrylamide gels including iso-electric focusing gels with clear background at nanogramsensitivity using Coomassie Brilliant Blue G-250 and R-250.Electrophoresis 1988, 9, 255–262.
[22] Le Bihan, M. C., Tarelli, E., Coulton, G. R., Evaluation of anintegrated strategy for proteomic profiling of skeletal mus-cle. Proteomics 2004, 4, 2739–2753.
[23] Perkins, D. N., Pappin, D. J., Creasy, D. M., Cottrell, J. S.,Probability-based protein identification by searchingsequence databases using mass spectrometry data. Elec-trophoresis 1999, 20, 3551–3567.
[24] Olsen, J. V., Ong, S. E., Mann, M., Trypsin cleaves exclu-sively C-terminal to arginine and lysine residues. Mol. Cell.Proteomics 2004, 3, 608–614.
[25] Zimmermann, S., Glaser, S., Ketteler, R., Waller, C. F. et al.,Effects of telomerase modulation in human hematopoieticprogenitor cells. Stem Cells 2004, 22, 741–749.
[26] El-Daly, H., Kull, M., Zimmermann, S., Pantic, M. et al.,Selective cytotoxicity and telomere damage in leukemiacells using the telomerase inhibitor BIBR1532. Blood 2005,105, 1742–1749.
[27] Roesch-Ely, M., Nees, M., Karsai, S., Ruess, A. et al., Prote-omic analysis reveals successive aberrations in proteinexpression from healthy mucosa to invasive head and neckcancer. Oncogene 2007, 26, 54–64.
[28] Zhao, J., Coordination of DNA synthesis and histone geneexpression during normal cell cycle progression and afterDNA damage. Cell Cycle 2004, 3, 695–697.
[29] Su, C., Gao, G., Schneider, S., Helt, C. et al., DNA damageinduces downregulation of histone gene expressionthrough the G1 checkpoint pathway. EMBO J. 2004, 23,1133–1143.
[30] d’Adda di Fagagna, F., Teo, S. H., Jackson, S. P., Functionallinks between telomeres and proteins of the DNA-damageresponse. Genes Dev. 2004, 18, 1781–1799.
[31] Narita, M., Nunez, S., Heard, E., Narita, M. et al., Rb-medi-ated heterochromatin formation and silencing of E2F targetgenes during cellular senescence. Cell 2003, 113, 703–716.
[32] Funayama, R., Saito, M., Tanobe, H., Ishikawa, F., Loss oflinker histone H1 in cellular senescence. J. Cell Biol. 2006,175, 869–880.
[33] Benvenuti, S., Cramer, R., Bruce, J., Waterfield, M. D., Jat, P.S., Identification of novel candidates for replicative senes-cence by functional proteomics. Oncogene 2002, 21, 4403–4413.
[34] Dierick, J. F., Kalume, D. E., Wenders, F., Salmon, M. et al.,Identification of 30 protein species involved in replicativesenescence and stress-induced premature senescence.FEBS Lett. 2002, 531, 499–504.
[35] Cong, Y. S., Fan, E., Wang, E., Simultaneous proteomic pro-filing of four different growth states of human fibroblasts,
© 2009 WILEY-VCH Verlag GmbH & Co. KGaA, Weinheim www.proteomics-journal.com

534 S. Zimmermann et al. Proteomics 2009, 9, 521–534
using amine-reactive isobaric tagging reagents and tandemmass spectrometry. Mech. Ageing Dev. 2006, 127, 332–343.
[36] Nishio, K., Inoue, A., Qiao, S., Kondo, H., Mimura, A.,Senescence and cytoskeleton: Overproduction of vimentininduces senescent-like morphology in human fibroblasts.Histochem. Cell Biol. 2001, 116, 321–327.
[37] Nishio, K., Inoue, A., Senescence-associated alterations ofcytoskeleton: Extraordinary production of vimentin thatanchors cytoplasmic p53 in senescent human fibroblasts.Histochem. Cell Biol. 2005, 123, 263–273.
[38] Wang, E., Gundersen, D., Increased organization of cyto-skeleton accompanying the aging of human fibroblasts invitro. Exp. Cell Res. 1984, 154, 191–202.
[39] Wang, E., Are cross-bridging structures involved in thebundle formation of intermediate filaments and the de-crease in locomotion that accompany cell aging? J. Cell Biol.1985, 100, 1466–1473.
[40] Parker, K. C., Garrels, J. I., Hines, W., Butler, E. M. et al.,Identification of yeast proteins from two-dimensional gels:Working out spot cross-contamination. Electrophoresis1998, 19, 1920–1932.
[41] Mazzatti, D. J., Pawelec, G., Longdin, R., Powell, J. R., For-sey, R. J., SELDI-TOF-MS ProteinChip array profiling of T-cellclones propagated in long-term culture identifies humanprofilin-1 as a potential bio-marker of immunosenescence.Proteome Sci. 2007, 5, 7.
[42] Herbig, U., Ferreira, M., Condel, L., Carey, D., Sedivy, J. M.,Cellular senescence in aging primates. Science 2006, 311,1257.
[43] Cosme-Blanco, W., Shen, M. F., Lazar, A. J., Pathak, S. et al.,Telomere dysfunction suppresses spontaneous tumorigen-esis in vivo by initiating p53-dependent cellular senescence.EMBO Rep. 2007, 8, 497–503.
© 2009 WILEY-VCH Verlag GmbH & Co. KGaA, Weinheim www.proteomics-journal.com