Redox-regulation of starch and lipid synthesis in leaves · PDF fileAbstract...
144
Max-Planck-Institut für Molekulare Pflanzenphysiologie, Golm Department of Metabolic Networks Research-group: Storage Carbohydrate Metabolism Redox-regulation of starch and lipid synthesis in leaves Disseration zur Erlangung des naturwissenschaftlichen Grades Doktor rerum naturalium Eingereicht an der mathematisch-naturwissenschaftlichen Fakultät der Universität Potsdam Anna Kolbe June 2005
Transcript of Redox-regulation of starch and lipid synthesis in leaves · PDF fileAbstract...
Max-Planck-Institut für Molekulare Pflanzenphysiologie, Golm Department of Metabolic Networks
Research-group: Storage Carbohydrate Metabolism
Redox-regulation of starch and lipid
synthesis in leaves
Disseration zur Erlangung des naturwissenschaftlichen Grades
Doktor rerum naturalium
Eingereicht an der mathematisch-naturwissenschaftlichen
Fakultät der Universität Potsdam
Anna Kolbe
June 2005
This Ph.D. thesis is the account of work done between April 2002 and June 2005 in
the department of Prof. Dr. Mark Stitt in the Max-Planck-Institut für Molekulare
Pflanzenphysiologie, Golm, Germany. It is result of my own work and has not been
submitted for any degree or Ph. D. at any other university.
Eidesstattliche Erklärung
Die Disseration ist ein Ergebnis praktischer Arbeit, welche von April 2002 bis Juni
2005 durgeführt wurde im Departament von Prof. Dr. Mark Stitt im Max-Planck-
Institut für Molekulare Pflanzenphysiologie, Golm. Ich erkläre, daß ich vorliegende
Arbeit selbstständig und ohne unerlaubte Hilfe angefertigt habe. Es wurden keine
anderen als die angegebenen Quellen und Hilfsmittel benutzt, und die den benutzten
Quellen wörtlichen und inhaltlichen Stellen sind als solche kenntlich gemacht.
Golm, Juni 2005
Anna Kolbe
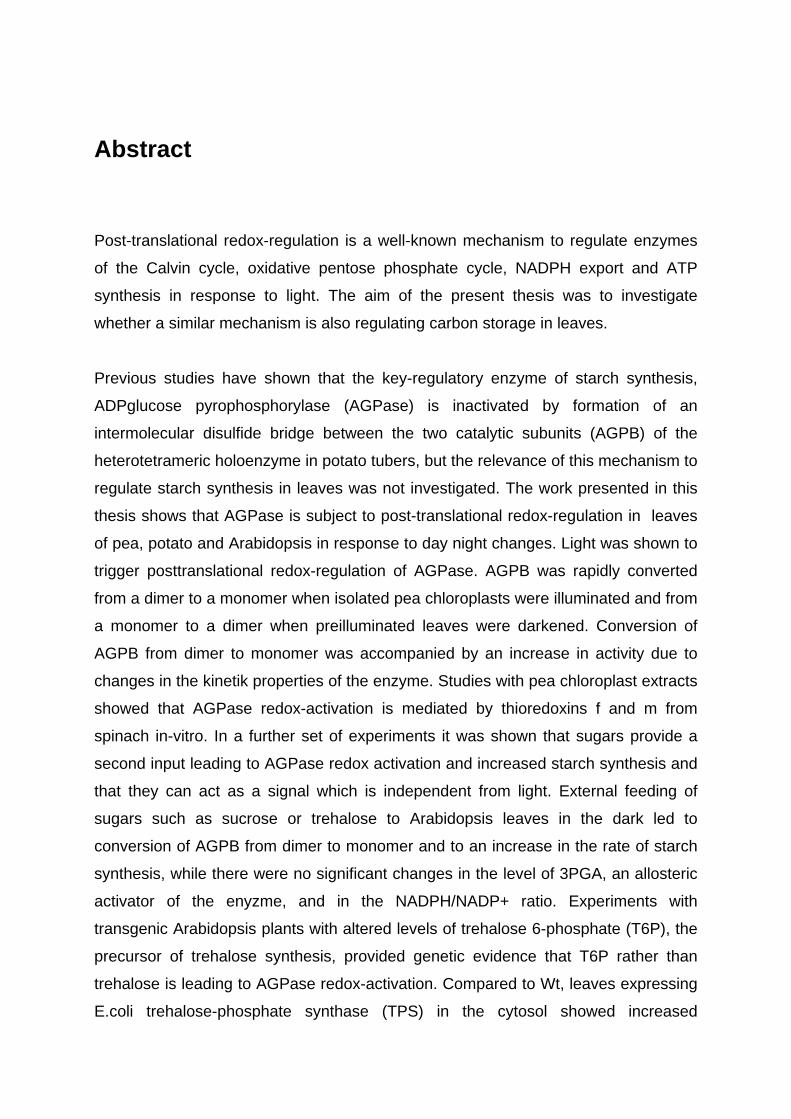
Abstract
Post-translational redox-regulation is a well-known mechanism to regulate enzymes
of the Calvin cycle, oxidative pentose phosphate cycle, NADPH export and ATP
synthesis in response to light. The aim of the present thesis was to investigate
whether a similar mechanism is also regulating carbon storage in leaves.
Previous studies have shown that the key-regulatory enzyme of starch synthesis,
ADPglucose pyrophosphorylase (AGPase) is inactivated by formation of an
intermolecular disulfide bridge between the two catalytic subunits (AGPB) of the
heterotetrameric holoenzyme in potato tubers, but the relevance of this mechanism to
regulate starch synthesis in leaves was not investigated. The work presented in this
thesis shows that AGPase is subject to post-translational redox-regulation in leaves
of pea, potato and Arabidopsis in response to day night changes. Light was shown to
trigger posttranslational redox-regulation of AGPase. AGPB was rapidly converted
from a dimer to a monomer when isolated pea chloroplasts were illuminated and from
a monomer to a dimer when preilluminated leaves were darkened. Conversion of
AGPB from dimer to monomer was accompanied by an increase in activity due to
changes in the kinetik properties of the enzyme. Studies with pea chloroplast extracts
showed that AGPase redox-activation is mediated by thioredoxins f and m from
spinach in-vitro. In a further set of experiments it was shown that sugars provide a
second input leading to AGPase redox activation and increased starch synthesis and
that they can act as a signal which is independent from light. External feeding of
sugars such as sucrose or trehalose to Arabidopsis leaves in the dark led to
conversion of AGPB from dimer to monomer and to an increase in the rate of starch
synthesis, while there were no significant changes in the level of 3PGA, an allosteric
activator of the enyzme, and in the NADPH/NADP+ ratio. Experiments with
transgenic Arabidopsis plants with altered levels of trehalose 6-phosphate (T6P), the
precursor of trehalose synthesis, provided genetic evidence that T6P rather than
trehalose is leading to AGPase redox-activation. Compared to Wt, leaves expressing
E.coli trehalose-phosphate synthase (TPS) in the cytosol showed increased
activation of AGPase and higher starch level during the day, while trehalose-
phosphate phosphatase (TPP) overexpressing leaves showed the opposite. These
changes occurred independently of changes in sugar and sugar-phosphate levels
and NADPH/NADP+ ratio. External supply of sucrose to Wt and TPS-overexpressing
leaves led to monomerisation of AGPB, while this response was attenuated in TPP
expressing leaves, indicating that T6P is involved in the sucrose-dependent redox-
activation of AGPase. To provide biochemical evidence that T6P promotes redox-
activation of AGPase independently of cytosolic elements, T6P was fed to intact
isolated chloroplasts for 15 min. incubation with concentrations down to 100 µM of
T6P, but not with sucrose 6-phosphate, sucrose, trehalose or Pi as controls,
significantly and specifically increased AGPB monomerisation and AGPase activity
within 15 minutes, implying T6P as a signal reporting the cytosolic sugar status to the
chloroplast. The response to T6P did not involve changes in the NADPH/NADP+ ratio
consistent with T6P modulating redox-transfer to AGPase independently of changes
in plastidial redox-state.
Acetyl-CoA carboxylase (ACCase) is known as key-regulatory enzyme of fatty acid
and lipid synthesis in plants. At the start of the present thesis there was mainly in
vitro evidence in the literature showing redox-regulation of ACCase by DTT, and
thioredoxins f and m. In the present thesis the in-vivo relevance of this mechanism to
regulate lipid synthesis in leaves was investigated. ACCase activity measurement in
leaf tissue collected at the end of the day and night in Arabidopsis leaves revealed a
3-fold higher activation state of the enzyme in the light than in the dark. Redox-
activation was accompanied by change in kinetic properties of ACCase, leading to an
increase affinity to its substrate acetyl-CoA . In further experiments, DTT as well as
sucrose were fed to leaves, and both treatments led to a stimulation in the rate of
lipid synthesis accompanied by redox-activation of ACCase and decrease in acetyl-
CoA content.
In a final approach, comparison of metabolic and transcript profiling after DTT feeding
and after sucrose feeding to leaves provided evidence that redox-modification is an
important regulatory mechanism in central metabolic pathways such as TCA cycle
and amino acid synthesis, which acts independently of transcript levels.
TABLE OF CONTENTS
Abstract
Table of contents
1. INTRODUCTION 9
1.1. Importance of Carbon Metabolism in Plants 9
1.2. Photosynthesis and its regulation in leaves 10
1.3. The pathway of starch synthesis in leaves and its regulation 13 1.3.1. Starch synthesis pathway 13 1.3.2. Regulation of starch synthesis 15
1.4. The pathway of sucrose synthesis in leaves and its regulation 18
1.5. Pathway and Regulation of Fatty Acid Synthesis in Leaves 19 1.5.1. The pathway of fatty acid synthesis 19 1.5.2. Regulation of fatty acid synthesis 22
1.6. Aims and objectives of the present work 24
2. MATERIALS AND METHODS 27
2.1. Enzymes and chemicals 27
2.2. Plant material and growth 27
2.3. Harvesting procedure, sample storage 28
2.4. Homogenisation of frozen leaf tissue 28
2.5. Incubation of Leaves with Sugars in the Darkness 28
2.6. Incubation of leaf discs with DTT 28
2.7. Trichloroacetic acid (TCA) extraction 29
2.8. Extraction of AGPase for western blot and procedures for gels 29
2.9. Extraction and assay of AGPase 30
2.10. HPLC (measurement of ADP-glucose) 30
2.11. Extraction and assay of ACCAse 31
2.12. Chloroplast preparation 31
2.13. Incubations of chloroplasts and photosynthesis measurement 32
2.14. Desalting of proteins from isolated chloroplasts 32
2.15. Thioredoxin reduction 33
2.16. Extraction and assay of FBPase and NADP malate dehydrogenase 33
2.17. Ethanolic extraction 34
2.18. Assay of sucrose, reducing sugars, starch 34
2.19. Assay of hexose-phosphates 34 2.19.1. Glucose 6-phosphate 34 2.19.2. Glucose 1-phosphate 35 2.19.3. Fructose 6-phosphate 35
2.20. Pyruvate and phosphoenolpyruvate 36
2.21. 3PGA 36
2.22. Glycerol-3-phosphate 36
2.23. Acetyl-coenzyme A 36
2.24. NADPH/NADP+ ratio measurement 37
2.25. Labeling experiments and label separation 37
2.26. Extraction and derivatisation for GC/MS (gas chromatography/mass spectrometry) 38
2.27. GC/MS analysis 38
2.28. Determination of relative metabolite levels 39
2.29. RNA isolation 39
2.30. Transcript levels measurement and analysis 40
3. RESULTS 41
3.1. AGPase is subject to post-translational redox-activation in leaves in response to light signals 41
3.1.1. Establishing of a new protocol to measure changes in the reduction state of AGPase in leaves 41
3.1.2. Changes in AGPB dimerisation and activity in response to day/night changes in leaves 42
3.1.3. Rapid Changes in AGPB Dimerisation as a Response to Light/Dark Transitions 46
3.1.4. Light leads to monomerisation of AGPB in isolated pea chloroplasts 47 3.1.5. AGPase activation in chloroplast extracts incubated with thioredoxins 49 3.1.6. Conclusions 52
3.2. AGPase is activated by posttranslational redox-modification in response to sugars in leaves 52
3.2.1. Supplying sugars to leaves during the night leads to conversion of AGPB from a dimer to a monomer and to increased rates of starch synthesis 53
3.2.2. Short-term feeding of sucrose or trehalose to leaf discs leads to increased AGPB monomerisation without affecting hexose-P levels and NADPH/NADP+ ratio 55
3.2.3. Manipulation of T6P metabolism in transgenic Arabidopsis plants leads to AGPase redox-modification and changes in starch content 57
3.2.4. Sucrose and trehalose dependent redox-activation of AGPase is attenuated in transgenic plants expressing TPP in the cytosol 60
3.2.5. Short-term feeding of trehalose-6-phosphate to intact purified chloroplasts leads to a specific increase in redox-activation of AGPase without changing the plastidial redox-state 64
3.2.6. Conclusions 67
3.3. Redox-regulation of ACCase is involved in regulating lipid synthesis in response to day/night changes and sugars in Arabidopsis leaves 68
3.3.1. Establishing of a protocol to measure diurnal changes in reductive activation of ACCase in Arabidopsis Leaves 69
3.3.2. Feeding of the reductant DTT to leaves leads to increased rates of lipid synthesis by increasing redox-activation of ACCase 71
3.3.2.1. Increase in carbon flux to lipids in response to DTT feeding to leaves in the dark 71
3.3.2.2. DTT feeding leads to an increase in ACCase activation state in leaves in the dark 73
3.3.2.3. Changes in metabolite levels after DTT feeding to leaves 74 3.3.3. Sugar feeding to leaves in the dark lead to an increase in ACCase activation state
and the rate of lipid synthesis which is accompanied by a decrease of acetyl-CoA content 75
3.3.3.1. Increase in flux to lipids by sucrose feeding 75 3.3.3.2. Increase in ACCase activation state after sucrose feeding 77 3.3.3.3. Changes in metabolite levels after sucrose feeding 77
3.3.4. Conclusions 78
3.4. Changes in metabolite and transcript profiles in Arabidospis leaves in response to manipulation of the redox-state by feeding DTT 79
3.4.1. Metabolic Profiling of Arabidopsis Leaves after DTT Feeding 79 3.4.2. Changes in transcript profile in response to DTT feeding 81
3.5. Changes in metabolite and transcript profiles in Arabidospis leaves in response sucrose feeding 83
3.5.1. Metabolic profiling of Arabidopsis leaves after sucrose feeding 83 3.5.2. Transcript profiling of Arabidopsis leaves after sucrose feeding 85 3.5.3. Conclusions 87
4. DISCUSSION 91
4.1. Starch synthesis is regulated via redox-modification of AGPase in response to light and sugar signals in leaves 92
4.2. Trehalose 6-phosphate provides a link between changes in sucrose status of the cytosol and redox-regulation of AGPase in the plastid 96
4.3. Importance of redox-regulation of AGPase in other plant tissues 99
4.4. Light and sugars are regulating lipid synthesis via redox-activation of ACCase 100
4.5. Post-translational redox-regulation may control different pathways in leaves 103
4.6. Final conclusions 107 Abbreviations
References
Appendix
Deutsche Zusammenfassung
Acknowledgements
Curriculum vitae
Publication list
1. Introduction
1.1. Importance of Carbon Metabolism in Plants
Photosynthesis is the physico-chemical process by which plants, algae and
photosynthetic bacteria use light energy to drive the synthesis of organic compounds.
In plants, algae and certain types of bacteria, the photosynthetic process results in
the release of molecular oxygen and the removal of carbon dioxide from the
atmosphere that is used to synthesize triose-phosphates. .A part of triose-
phosphates can be then exported from chloroplasts and converted to end products
that are required for growth and reproduction. Another part is used in biosynthetic
pathways inside the chloroplast such as starch and fatty acid synthesis. Starch is the
primary carbohydrate used for carbon and energy storage in plants (Dennis et al.,
1997). It is a polymer of glucose, with different glycosidic linkages between glucose
monomers and different degrees of branching. Alpha-amylose, one form of starch,
has glucose subunits joined by alpha(1-4)-glycosidic bonds and does not have
branches. These alpha-glycosidic bonds give the polymer a helical structure that
aggregates, forming insoluble starch granules. Another form of starch, amylopectin,
is also composed of glucose units joined largely by alpha(1-4)-glycosidic bonds, with
the addition of branches at regular intervals. Advantages of starch over glucose for
energy storage are that large polymers take less space, have less water associated,
and have a lower osmotic pressure, making storage in the cell easier. Leaf starch
represents a transient store, which is synthesised during the day and remobilized
during the night to supply carbon for leaf metabolism (Geiger and Servaites, 1994).
Its importance is demonstrated by the phenotype of starch-deficient mutants, which
grow poorly or die in short-day conditions (Caspar et al., 1986; Schulze et al., 1991;
Geiger et al., 1995; Sun et al., 2002). In plants de novo fatty acid synthesis occurs
primarily in the plastid. In leaf tissue these fatty acids are used for the synthesis of
plastidial and other cellular membranes in all cells. In certain plant tissues, mainly in
seeds, they are also used for the synthesis of storage oils (TAG: triacylglycerols)
(Ohlrogge et al., 1997; Stumpf, 1987; Harwood, 1988; Rawsthorne, 2002).
Both, starch and lipid synthesis are the important pathways of reduced carbon in the
chloroplast. However, we do not know much about how the partitioning of carbon
between these products is determined. The regulation of the pathways involved in
carbon supply to fatty acid and starch synthesis in leaf chloroplasts is one of the main
features of plant metabolism and is important for understanding of plant physiology.
Furthermore, in seeds and other storage organs starch and lipids are economically
important plant products that are common components of the human diet. They are
also used industrially for many applications. The possibility of producing customized
starches through manipulation of starch synthesis has contributed to the significant
interest in the biochemistry of this process.
1.2. Photosynthesis and its regulation in leaves
All the energy consumed by biological systems ultimately comes from light energy
trapped in reduced carbon skeletons by the process of photosynthesis:
H2O + CO2 => (CH2O) + O2
The mechanism of phtosynthesis is complex and requires the interplay of many
enzymes. In green plants it takes place in chloroplasts. The light reaction is a
membrane bound process. The photosynthetic membranes in plants contain two
photosystems, PS I and PS II. PS I captures the energy of single photons by
excitation of electrons in magnesium ions in chlorophyll. It is coupled to ferredoxin-
NADP+-reductase, which catalyzes the transfer of reducing equivalents from
ferredoxin to thioredxin to produce reducing power in the form of NADPH/H+. This
reduction requires a steady supply of electrons and protons (reducing equivalents),
which are provided by PS II which oxidizes water to molecular oxygen. PS II uses the
energy from a second photon to reduce plastoquinone QH2. The reduced quinones
are deoxidized by a cytochrome bf complex separating electrons from protons
generating a proton gradient. The proton gradient is coupled to H+-ATPases
synthesizing ATP from ADP + Pi (Stryer, 1998, Buchanan and Balmer, 2005).
Calvin cycle uses products of light reactions (ATP and NADPH) to convert CO2 into
intermediates that supply carbon to various synthetic pathways inside as well as
outside the chloroplast. The CO2 molecule condenses with ribulose 1.5-bisphosphate
(Ru1.5bisP) to form a transient six-carbon compound, which is rapidly hydrolysed to
two molecules of 3-phosphoglycerate (3PGA) in reaction catalysed by Rubisco
(ribulose 1.5-bisphosphate carboxylase). 3PGA is phosphorylated by 3PGA kinase
and reduced by NADP-glyceraldehyde 3-phosphate dehydrogenase to
glyceraldehyde 3-phosphate. Glyceraldehyde 3-phosphate is than converted by
Fru1.6bisP aldolase to fructose 1.6-bisphosphate (Fru1.6bisP). Fru1.6bisP molecule
is dephosphorylated to fructose 6-phosphate (Fru6P) by FBPase (fructose 1.6-
bisphosphatase). One part of the F6P is recycled to provide ribulose 5-phosphate
which can be further phosphorylated by ATP hydrolysis to form ribulose 1.5-
bisphosphate. The net energy balance of six rounds of the Calvin cycle to produce
one mol of hexose is thus:
6CO2+18ATP+12NADPH+12H2O => C6H12O6+18ADP+18Pi+12NADP++6H+
The Calvin cycle’s hexose product is fructose 6-phosphate which can be converted to
glucose 6-phosphate by the gluconeogenetic pathway. Glucose 6-phosphate can be
used for starch and cellulose synthesis (Geiger and Servaites, 1994) (Fig.1).
Carbon dioxide fixation occurs during the day time and is strictly dependent on the
light reaction and the formation of reductive power as NADPH. It does not occur
literally in the dark (at night). The metabolic activity at night instead is mainly shifted
to carbohydrate oxidation, when plants consume oxygen rather than producing it.
The control of the Calvin cycle therefore means the control of regulation between
light and dark reaction. The enzymes of the Calvin cycle are sensitive to the proton
concentration of the chloroplast stromal compartment. The optimum pH for Rubisco
activity lies around pH 8. The proton pump driven during light absorption moves
protons from the stroma to the lumenal side to the thylakoid membrane increasing
the stromal pH. This activates Rubisco and thus the Calvin cycle. The proton level
control is coupled to magnesium interaction (chelation) with carbamates. Magnesium
stabilizes carbamate formation and thus activates Rubisco. The key enzymes,
fructose bisphosphatase and sedoheptulose bisphosphatase, of the Calvin cycle are
also under pH control. The light-induced changes regulate synthetic pathways and
opposing degradation pathways (ex. glycolysis) so that the cell can optimize available
resources (Buchanan 1980, 1991).
Several Calvin cycle enzymes are known to be activated by light by a process linked
to photosynthetic electron transport via the ferredoxin/thioredoxin system.
Chloroplasts contain different thioredoxins showing selectivity toward different
enzymes, thioredoxin f (named for its capability to activate fructose 1.6-
bisphosphatase), m (named for its capability to activate NADP-malate
dehydrogenase) (Jacquot et al. 1976, 1978; Buchanan et al. 1978) and two recently
characterised thioredoxins: x and y (Lemaire et al., 2003; Mestres-Ortega et al.,
1999). The experimental evidence suggests that thioredoxins f and m represent the
major chloroplast forms, and x and y, whose functions are now being studied, are of
lower abundance (Buchanan and Balmer, 2005). Thioredoxins are small proteins with
a redox-active disulfide bridge present in the characteristic active site sequence -Trp-
Cys-Gly-Pro-Cys-. They have a molecular mass of approximately 12 kDa and are
universally distributed in animal, plant and bacterial cells. In their reduced form they
constitute very efficient protein disulfide oxido-reductases and have been found to
serve as electron donors in a variety of cellular redox-reactions. In chloroplasts and
cyanobacterial cells, thioredoxins are reduced in response to light. Light-driven
photosynthetic electron transport produces reduced ferredoxin (Fd), which serves as
electron donor for ferredoxin:thioredoxin reductase (FTR). This enzyme reduces
thioredoxins, which interact with target proteins involved in photosynthesis
(Schürman and Jacquot, 2000). The ferredoxin/thioredoxin system has been shown
to function similarly in the different types of plant photosynthesis (C3, C4, CAM) and
to control, either directly or indirectly, the activity of each of the five regulatory
enzymes of the Calvin cycle: fructose 1.6-bisphosphatase, sedoheptulose 1.7-
bisphosphatase, phosphoribulokinase, NADP-glyceraldehyde 3-phosphate
dehydrogenase and Rubisco (Breazeale et al. 1978; Buchanan et al., 1980;
Schürmann and Jacquot, 2000). Regulatory enzymes of many other chloroplast
processes were also found to be linked to thioredoxin: glucose 6-phosphate
dehydrogenase (oxidative pentose cycle), ATP synthase (ATP synthesis), NADP-
malate dehydrogenase (C4 photosynthesis, malate valve), acetyl-CoA carboxylase
(fatty acid synthesis) (Buchanan 1980, 1991; Schürmann and Jacquot, 2000;
Schürmann and Buchanan, 2001). Except for glucose 6-phosphate dehydrogenase
and NADP-malate dehydrogenase, which are affected with thioredoxin m, these
enzymes show a strong preference for thioredoxin f. Additionally, besides glucose 6-
phosphate dehydrogenase, which is deactivated by thioredoxin, all these enzymes
are activated by the reduction via thioredoxin (Buchanan, 1980; Schürmann and
Jacquot, 2000).
A part of triose-phosphates synthesized during Calvin cycle is exported to cytosol
and converted to sucrose. Sucrose accumulates when export is decreased and this
affects photosynthetic rate by repression of the expression of photosynthetic genes
(Sheen et al., 1990; Krapp et al. 1991). Sugar control of metabolism, growth and
development, stress, and gene expression has long been thought to be a metabolic
effect. However, the control of gene expression observed with non-metabolizable or
partially metabolizable hexoses or hexose and sucrose analogs clearly suggest the
involvement of specific signal sensing and transduction mechanisms that do not
require sugar catabolism (Stitt and Krapp, 1999; Sheen et al., 1999; Smeekens,
2000). Although hexoses are potent signals sensed in plants, sucrose-specific (Rook
et al., 1998) and trehalose-mediated (Goddijn and Smeekens, 1998) signalling
pathways also play important role in regulating development and gene expression. In
developing seeds, it has been suggested that sucrose regulates differentiation and
storage, whereas hexoses control growth and metabolism (Weber et al., 1997).
1.3. The pathway of starch synthesis in leaves and its
regulation
1.3.1. Starch synthesis pathway
In leaves, a part of the photosynthetically fixed carbon is converted to starch within
the chloroplast. The carbon precursor used for starch synthesis in leaves is provided
by Calvin cycle. Inorganic CO2 is converted to triose-phosphates, which are exported
to cytosol and are used for sucrose synthesis. Some of the reduced carbon is
retained in the chloroplast to synthesise starch as a transient carbon store, which is
remobilised during the night to support non-photosynthetic leaf metabolism and
sucrose export (see Fig. 1). This portion of triose-phosphates is converted via series
of Calvin cycle reactions to fructose 6-phosphate (Fru6P). Fru6P can be used to
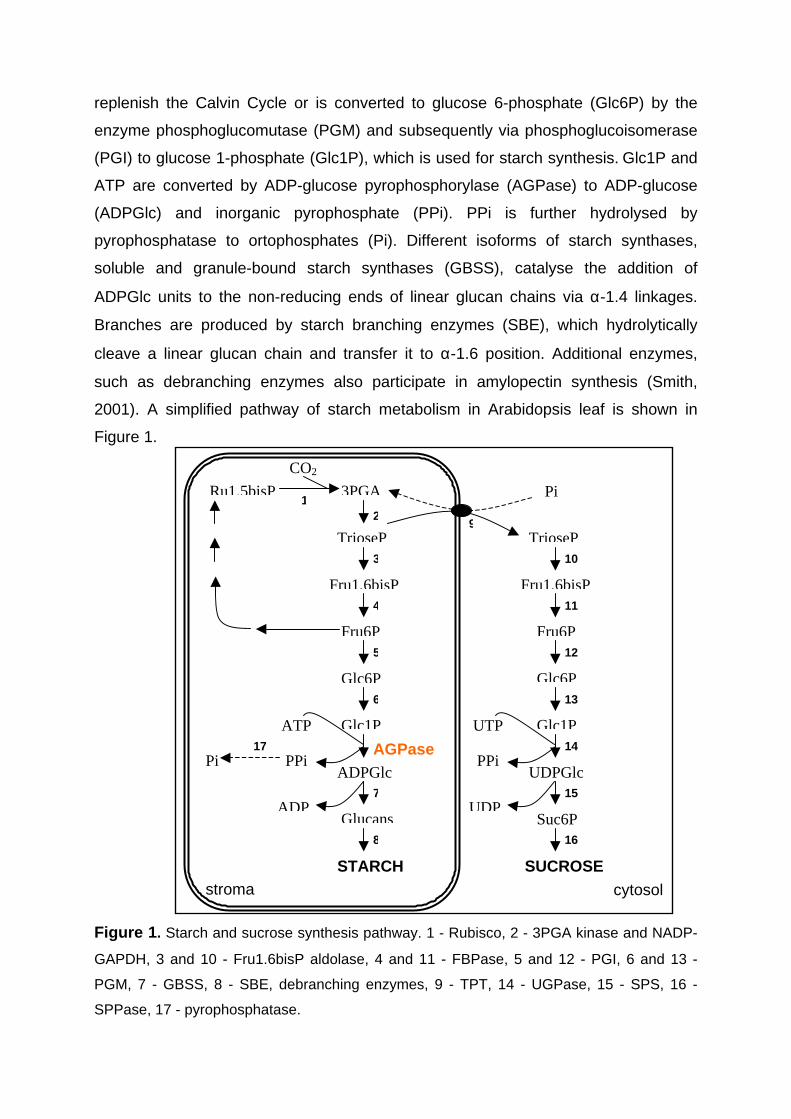
replenish the Calvin Cycle or is converted to glucose 6-phosphate (Glc6P) by the
enzyme phosphoglucomutase (PGM) and subsequently via phosphoglucoisomerase
(PGI) to glucose 1-phosphate (Glc1P), which is used for starch synthesis. Glc1P and
ATP are converted by ADP-glucose pyrophosphorylase (AGPase) to ADP-glucose
(ADPGlc) and inorganic pyrophosphate (PPi). PPi is further hydrolysed by
pyrophosphatase to ortophosphates (Pi). Different isoforms of starch synthases,
soluble and granule-bound starch synthases (GBSS), catalyse the addition of
ADPGlc units to the non-reducing ends of linear glucan chains via α-1.4 linkages.
Branches are produced by starch branching enzymes (SBE), which hydrolytically
cleave a linear glucan chain and transfer it to α-1.6 position. Additional enzymes,
such as debranching enzymes also participate in amylopectin synthesis (Smith,
2001). A simplified pathway of starch metabolism in Arabidopsis leaf is shown in
Figure 1.
Figure 1 . Starch and sucrose synthesis pathway. 1 - Rubisco, 2 - 3PGA kinase and NADP-
GAPDH, 3 and 10 - Fru1.6bisP aldolase, 4 and 11 - FBPase, 5 and 12 - PGI, 6 and 13 -
PGM, 7 - GBSS, 8 - SBE, debranching enzymes, 9 - TPT, 14 - UGPase, 15 - SPS, 16 -
SPPase, 17 - pyrophosphatase.
Ru1,5bisP 3PGA
CO2
TrioseP
Fru1,6bisP
Fru6P
Glc6P
Glc1P
ADPGlc
Glucans
STARCH
ADP
PPi
ATP
Pi AGPase
TrioseP
Fru1,6bisP
Fru6P
Glc6P
Glc1P
UDPGlc
Suc6P
SUCROSE
UDP
PPi
UTP
Pi
stroma cytosol
1
4
5
6
11
12
13
14
15
16
9
10
2
8
7
3
17
1.3.2. Regulation of starch synthesis
Previous studies showed a relationship between the activity of ADP-glucose
pyrophosphorylase (AGPase, EC 2.7.7.27) and starch accumulation in several plant
species and tissues. Isolated mutants of maize endosperm deficient in AGPase
activity were shown to be deficient in starch content (Tsai and Nelson, 1966;
Dickinson and Preiss, 1969). In confirmation, Müller-Röber et al. (1992) showed that
expression of a chimeric gene encoding antisense RNA for AGPase in potato plants
resulted in a reduction in enzymatic activity to 2-5% of the wild type levels and a
commensurate reduction in starch content in growing tubers. Furthermore,
expression of a mutated E.coli-AGPase in potato plants led to an increase in the
starch content of the tubers by 30-60% (Stark et al. 1992). More recently, flux control
analysis of the pathway of starch synthesis in Arabidopsis leaves (Neuhaus and Stitt
1990), potato tubers (Geigenberger, Müller-Röber and Stitt 1999; Geigenberger et al.
2004) and seeds of oil-seed rape (Vigeolas et al. 2004) showed that AGPase exerts
a high degree of control on the pathway of starch synthesis, indicating that the
enzyme is catalysing a near rate-limiting reaction.
AGPase from higher plants is a heterotetramer consisting of two bigger regulatory
subunits (AGPS) and two smaller catalytical subunits (AGPB) (Morell et al., 1987;
Okita et al., 1990). Studies of subunits expressed in E. coli indicate that small
subunits alone can form catalytically active enzyme, and that large subunits are
responsible for modulation of the sensitivity of the enzyme to effectors (Preiss and
Sivak, 1996; Ballicora et al., 2000). The size of the two AGPB subunits has been
found to range from 50 to 56 kDa and the size of two AGPS subunits varies between
51 and 60 kDa, depending on the plant species under investigation (Morell et al.,
1987). cDNA clones encoding small and large AGPase subunits from a variety of
monocot and dicot plant species have been isolated in recent years (Vailland et al.,
1992; Ainsworth et al., 1993). Comparison of the primary structures of 11 plant
AGPase proteins (Smith-White and Preiss 1992) revealed existence of at least three
types of AGPase polypeptides in higher plants: the small subunit expressed in both
photosynthetic and nonphotosynthetic tissues, a large subunit present in
nonphotosynthetic tissues and a large subunit found in photosynthetic cells. The
precise functions of the various AGPase polypeptides are not known, however there
are several possible explanations for the presence of these isoforms. 1) All four
AGPase polypeptides contribute to the holoenzyme which is believed to function as a
tetramer. Iglesias et al. (1993) showed that only when both subunits from potato were
expressed simultaneously in E.coli high AGPase activity was detected. Expression of
either subunit alone led to only minor AGPase activities. The precise composition of
the enzyme could vary with the developmental stage and with changes in metabolism
of the plant, allowing a finetuning of starch biosynthesis (La Cognata et al., 1995). 2)
The various AGPase polypeptides could have different intracellular locations.
Although the majority of the enzyme is located within chloroplasts and amyloplasts, it
can not be excluded that at least some of the enzyme is also located in the cytoplasm
(La Cognata et al., 1995). 3) The various AGPase polypeptides could contribute
differently to cell-specific isozymes of the AGPase. In the transgenic potato and
tobacco plants, GUS activity in leaves was restricted to stomatal guard cells and to
the starch sheath, which is adjacent to the vascular tissues. No GUS activity was
detected in mesophyll cells upon histochemical analysis (Müller-Röber et al., 1994;
La Cognata et al., 1995).
Transcript levels of AGPS are increased by light and sucrose (Sokolov et al., 1998)
and decreased by nitrates and phosphates (Scheible et al., 1997; Nielsen et al.,
1998). This mechanism allows AGPase to react on changes of the carbon level and
nutritional status on the long-term scale (Stitt and Krapp, 1999), but the changes in
enzyme activity require up to days to develop (Geigenberger et al., 1994). In case of
Arabidopsis leaves AGPase activity changes much slower than transcript levels
during photoperiod (Sokolov et al., 1998). In antisense potato transformants large
changes in AGPB transcripts were required to produce a significant decrease in
AGPase activity (Müller-Röber et al., 1992; Zrenner et al., 1995). This indicates that
transcriptional regulation on its own is not an efficient method to alter enzyme
activities and fluxes.
AGPase is exquisitively sensitive to allosteric regulation, being activated by 3-
phosphoglyceric acid (3PGA) and inhibited by inorganic orthophosphate (Pi) (Preiss,
1984, 1988; Sowokinos and Preiss, 1982). Studies with isolated chloroplasts led to
the concept that starch synthesis is stimulated when low Pi restricts carbon export
from the plastid (Heldt et al., 1977). In these conditions ATP falls, leading to an
inhibition of 3PGA reduction. Rising 3PGA/Pi ratio provides a sensitive signal that
carbon fixation is exceeding the rate of export and activates AGPase. A similar
situation occurs in leaves when the rate of the end products synthesis falls below the
rate of photosynthesis. For example, feedback regulation of sucrose synthesis will
lead to the accumulation of phosphorylated intermediates, depletion of Pi, and
activation of AGPase by the rising 3PGA/Pi ratio, resulting in a stimulation of starch
synthesis (Herold, 1980; Stitt et al., 1987).
For very long time, this biochemical model has provided the framework to explain
how the photosynthate allocation between sucrose and starch is regulated. However,
several situations have been reported in which changes in the rate of starch
synthesis could not be explained by allosteric regulation or changes in expression of
AGPase, for example treatments that modify partitioning by altering sugar levels in
the leaf. Starch synthesis was stimulated in the absence of an increase of 3PGA
when sugars were supplied to detached spinach leaves (Krapp et al., 1991), when
spinach leaves were cold-grigled to decrease export (Krapp and Stitt, 1995), and
when phloem transport was inhibited by phloem-specific expression of E. coli
pyrophosphorylase in tobacco (Nicotiana tabacum, Geigenberger et al, 1996). In at
least some conditions, decreased expression of SPS in Arabidopsis leads to
decreased rather than inceased starch synthesis (Strand et al., 2000). Moreover,
transgenic potato (Solanum tuberosum) plants with increased levels of 3PGA due to
antisense inhibition of cytosolic phosphoglycerate mutase did not show any increase
of starch in their leaves (Westram et al., 2002). These results indicate that there are
gaps in our understanding of the regulation of photosynthate partitioning.
Recent studies provided in vitro evidence for post-translational redox-regulation of
AGPase. When potato tuber AGPB and AGPS were heterologously overexpressed in
E. coli an intermolecular bridge formed between the Cys12 residues of the two AGPB
subunits (Fu et al. 1998). To obtain active enzyme, it was necessary to incubate the
complex with dithiothreitol (DTT) or reduced plastidal thioredoxins to break this link
(Fu et al., 1998; Ballicora et al., 2000). The kinetic properties of the thioredoxin-
reduced enzyme differed from the oxidized form by an increase in the affinity towards
the activator 3-PGA. Thioredoxin f was shown to be more efficient than thioredoxin m
in the reduction and activation process. Fifty percent activation was at 4.5 and 8.7 µM
for reduced thioredoxin f and m respectively. The activation was reversed by oxidized
thioredoxin (Ballicora et al., 2000). Regulation of starch synthesis in leaves may
occur in a similar way as the light-dependent regulation of Calvin cycle enzymes,
where reduced thioredoxins act as activators (Scheibe, 1991; Schürmann and
Jacquot, 2000). One of the major questions asked in the present thesis was whether
reduction mediated by the ferredoxin-thioredoxin system could play a role in the fine
regulation of the AGPase in leaves.
1.4. The pathway of sucrose synthesis in leaves and
its regulation
Sucrose is synthesized in leaves as one of the primary end products of leaf
photosynthesis. During the day, the substrate for sucrose synthesis is triose
phosphate, released from the chloroplast on the triose phosphate translocator in
exchange for inorganic phosphate (Huber et al., 1993; Winter and Huber, 2000).
Trisose phosphate is converted by fructose 1.6-bisphosphate aldolase (Fru1.6bisP
aldolase) to Fru1.6bisP and than by FBPase to Fru6P. PGI converts Fru6P to Glc6P
and Glc6P is further converted to Glc1P by PGM. UDPglucose pyrophosphorylase
(UGPase) by incorporating UTP and releasing inorganic pyrophosphate (PPi)
produces UDPglucose, which is further converted to sucrose 6-phosphate (Suc6P)
and sucrose using sucrose phosphate synthase (SPS) and sucrose phosphate
synthase (SPPase), respectively. At night, starch mobilization provides the substrate
for sucrose biosynthesis released on the hexose transporter (Schleucher et al.,
1998). Several control mechanisms are involved in regulating sucrose synthesis.
When sucrose accumulates in leaves SPS activity decreases because of an increase
in the phosphorylation state of the enzyme (Foyer, 1990; Siegl and Stitt, 1990). SPS
has been shown to be a substrate for SNF-1 related protein kinases (SnRKs; Sugden
et al, 1999) which may be important in modulating SPS activity when sucrose
accumulates. Control of sucrose synthesis includes also metabolite regulation of SPS
by inorganic phosphate (inhibitor) and glucose 6-phosphate (activator) (Doehlert and
Huber, 1983). Thus, sucrose synthesis is only promoted when metabolites are
aboundant. Decreased hexose phosphate utilization by sucrose synthesis stimulates
fructose 2.6-bisphosphate (F2.6BP) synthesis. In some plants this results in
decreased cytosolic FBPase activity (Neuhaus et al., 1990; Stitt, 1990). As a result of
the decreased Pi liberation imposed by low cytosolic FBPase activity more carbon is
retained in chloroplasts for starch synthesis. The importance of F2.6BP in controlling
sucrose synthesis has been emphasized in transgenic tobacco where elevated
F2.6BP concentrations , produced by the activity of a modified mammalian gene
encoding 6-phosphofructo-2-kinase, led to decreased fluxes of carbon to soluble
sugars, organic acids and amino acids while enhancing starch accumulation (Scott et
al., 1995).
1.5. Pathway and Regulation of Fatty Acid Synthesis
in Leaves
1.5.1. The pathway of fatty acid synthesis
Fatty acids are an essential component of the cellular membranes of all living
organisms excepting the Archebacteria (Davis et al., 2000). In plants de novo
synthesis of fatty acids takes place in chloroplasts (Ohlrogge and Browse, 1995). It
starts with the carboxylation of acetyl-CoA and its convertion to malonyl-CoA (Fig. 2).
This reaction is the first commited step of the pathway and is catalysed by acetyl-CoA
carboxylase (ACCase). Since acetyl-CoA is not imported by plastids it must be
generated by metabolism within the plastid (Ke et al. 2000). In chloroplasts,
photosynthesis provides an endogenous source of fixed carbon. Whether this fixed
carbon can be utilised for the synthesis of acetyl-CoA depends upon the enzyme
complement within the plastid in different species and during different developmental
stages. Plants appear to have multiple pathways for generating acetyl-CoA.
Four possible routes for the acetyl-CoA synthesis in plastids have been proposed. In
the first, free acetate deriving from hydrolysis of mitochondrial acetyl-CoA is taken up
by diffusion into the plastid where it is converted to acetyl-CoA by plastidial ACS
(acetyl-CoA synthetase) in an ATP-dependent reaction (Kuhn et al., 1981).
Suggested alternative acetate sources include the combined actions of pyruvate
decarboxylase and acetaldehyde dehydrogenase (Cui et al., 1996) or the action of O-
acetyl-Ser thiol-lyase in forming Cys from O-acetyl-Ser (Leustek and Saito, 1999). In
the second, pyruvate is converted to acetyl-CoA by the PDC (pyruvate
dehydrogenase complex) in a reaction that generates NADH. This pathway requires
the conversion of 3PGA to acetyl-CoA via 2PGA, PEP and then pyruvate and is
sometimes called C3-C2 pathway. A modification of this pathway occurs, if not all the
glycolytic steps occur in the plastid, but instead some reactions are located in the
cytosol and PEP or pyruvate are re-imported into the chloroplast (Fischer et al.,
1997). During photosynthesis, a further source of pyruvate can be Rubisco, which at
a low frequency catalyses a side reaction in which pyruvate is generated. A third
possible route for intraplastidial synthesis of acetyl-CoA is through a plastidial ACC
(carnitine acetyltransferase) reaction in which acetate is transferred from acetyl-
carnitine to CoA. It has been proposed that this activity represents part of a carnitine-
dependent acetyl/acyl transfer mechanism in the plant cell (Thomas et al., 1993).
However, this proposed mechanism is controversial since it was not possible to
demonstrate the incorporation of acetate from acetyl-carnitine into fatty acids by
chloroplasts from spinach and pea leaves (Roughan et al., 1993). The fourth route is
through the ACL (ATP-citrate lyase) reaction. The proposed role of this enzyme in de
novo fatty acid synthesis is also controversial. Overexpression of the ACL from a rat
liver in the plastid was reported to increase the fatty acid content of tobacco leaves
by 16% compared to control plants. Whether this overexpression actually increases
the rate of fatty acid synthesis has not been shown, nor has the source of plastidial
citrate been identified (reviewed by Rawsthorne, 2002).
After acetyl-CoA is synthesised, its conversion to malonyl-CoA is catalysed by
ACCase in an ATP-dependent reaction. After this step, elongation cycle starts. In
subsequent reactions the condensation of malonyl-CoA and another acetyl-CoA to
form acetoacetyl-ACP, the reduction, the dehydration and another reduction leading
to production of butyryl-ACP occur. The reactions are catalysed by β-ketoacyl-ACP
synthase III (KAS III), β-ketoacyl-ACP reductase, β-hydroxyacyl-ACP dehydratase
and enoyl-ACP reductase. In the next rounds of synthesis C2 elements are
successively added, but there are some differences in enzymes involved in this
pathway. First, the condensation is catalysed by β-ketoacyl-ACP synthase I (KAS I),
leading to production of palmitoyl-ACP (C-16:0-ACP). Second, the elongation to
stearoyl-ACP (C18:0-ACP) and desaturation to oleoyl-ACP (C18:1-ACP) requires β-
ketoacyl-ACP synthase II (KAS II) and stearoyl-ACP desaturase, respectively.
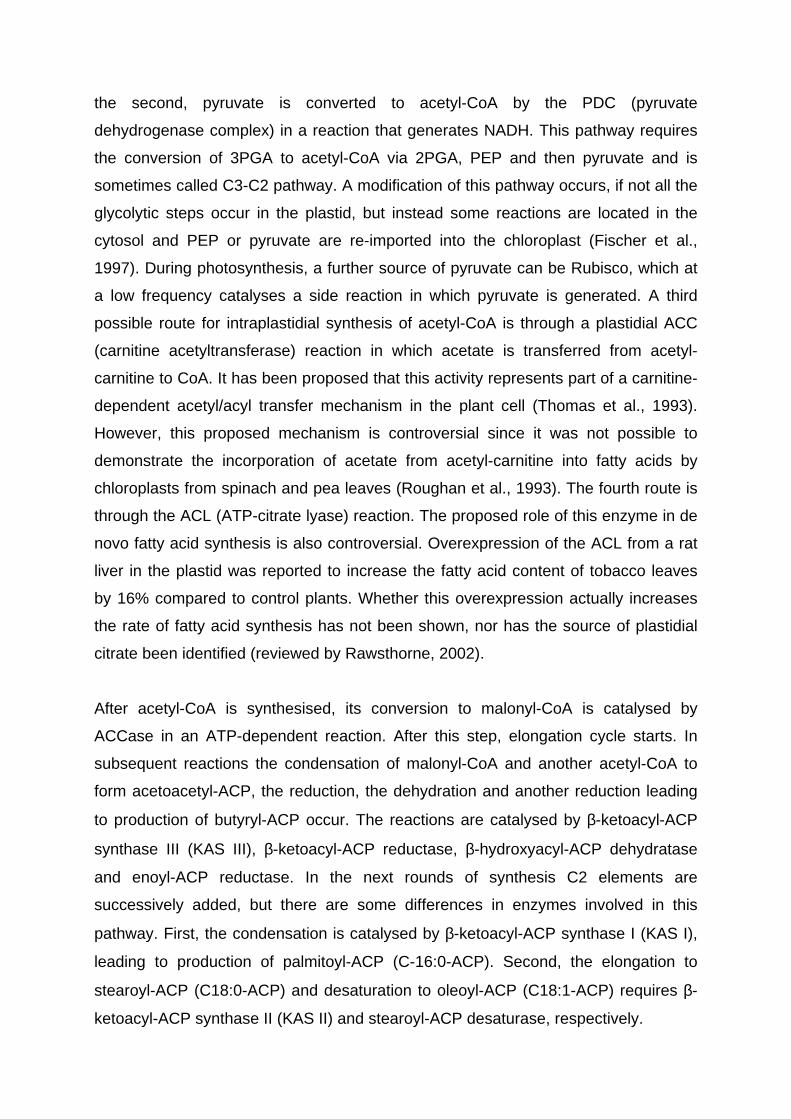
Some of the 16:0, 18:0 and 18:1 acyl groups are transferred from ACP to Gly3P by
plastidic Gly3P:acyltransferases, thereby entering the so-called ‘procaryotic’ pathway
leading to characteristic set of phospholipids (mono- and digalactosyldiacylglycerol,
phosphatidylglycerol, sulphoquinovosyldiacylglycerol) (Ohlrogge and Browse, 1995).
Alternatively, these groups can be released via acyl-ACP-thioesterases and move to
cytosol, where they are reconverted to acyl-CoA and enter the ‘eucaryotic’ pathway
for lipid synthesis, leading to another set of phospholipids ( phosphatidyl-choline, -
ethanoloamine, -glycerol, - inositol) and TAG (Ohlrogge and Browse, 1995). Paralell
reactions in the endoplasmic reticulum and plasmid convert acyl groups to
phosphatidic acid (PA) and diacylglycerol (DAG) via combined action of sn2-
Gly3P:acyltransferases and lysophosphatidic acid:acyltransferases, followed by
dephosphorylation of PA by phosphatidic acid phosphatase. DAG can be also
substrate for diacylglycerol:acyltransferase, which synthesises triacylglycerol (TAG)
(Ohlrogge and Browse, 1995).
Figure 2. Lipid synthesis in chloroplast. 1- TrioseP/Pi transporter (TPT), 2- PEP/Pi
transporter, 3-Pyr/Pi transporter, 4-Fatty acids transporter.
Pyruvate
Acetyl - CoA
Malonyl - CoA ACCase CO 2 ATP
ADP+Pi Condensing
enzyme
PEP
ER
TrioseP
Calvin cycle
cytoplasm
CoA
PEP
Pyruvate
TrioseP
Acetate
1
2
3
4
Pyr kinase
Pyr DH
Pyruvate
Acetyl - CoA
Malonyl - CoA ACCase CO 2 ATP
ADP+Pi Condensing
enzyme
PEP
Acyl ACBP
G3P
PA LPA
ER
TrioseP
Calvin cycle
cytoplasm
CoA
PEP
Pyruvate
TrioseP
Acetate
1
2
3
4
Pyruvate
Acetyl - CoA
Malonyl - CoA ACCase CO 2 ATP
ADP+Pi
PEP
- CoA
TAG
PC
DAG
chloroplast
TrioseP
Calvin cycle
cytoplasm
CoA
PEP
Pyruvate
TrioseP
Acetate
1
2
3
CoA
PEP
Pyruvate
TrioseP
Acetate
1
2
3
4
Pyr kinase
Pyr DH
Fatty acids
1.5.2. Regulation of fatty acid synthesis
Acetyl-CoA carboxylase (ACCase, EC 2.4.1.13) regulates the rate of fatty acid
synthesis in yeasts, animals, bacteria and plants (Sasaki et al., 1997; Ohlrogge and
Jaworski, 1997; Rawsthorne, 2002). There are several lines of evidence suggesting
that ACCase does represent a regulatory step in plants. Intermediates of fatty acid
synthesis change during the transition to darkness in leaves and chloroplasts in a
manner consistent with control at the level of ACCase (Ohlrogge and Jaworski,
1997). This observation is entirely consistent with the more recent reports of light-
dependent regulation of chloroplast ACCase by the redox status of the plastid
whereby the enzyme is more active under the reducing conditions found in the light
(Kozaki and Sasaki, 1999). In leaves, the light-dependent regulation of fatty acid
synthesis through ACCase activity is logical if the synthesis from malonyl-CoA is in
turn dependent upon the supply of reducing power and ATP from the light reactions
of photosynthesis. Other aspects of the control of carbon flux through fatty acid
synthesis by ACCase have been addressed in a number of ways. By using specific
enzyme inhibitors, Page et al. (1994) have reported that ACCase exerts strong
control over flux into fatty acid synthesis in isolated barley and maize leaf
chloroplasts. Indirect evidence for control by ACCase can be drawn from experiments
in which fatty acids were supplied to tobacco suspention cell cultures (Shintani and
Ohlrogge, 1995). This resulted in inhibition of fatty acid synthesis, which was
explained by feedback inhibition of ACCase by an undefined mechanism.
Two forms of ACCase are known to occur in plants: type I ACCase, which is a
multifunctional, homodimeric polypeptide analogous to that found in mammals and
yeasts, or type II, which is a heteromeric, multi-subunit form analogous to that found
in prokaryotes (Ohlrogge and Jaworski, 1997). In most of higher plants ACCase II is
active in plastids, with the exception of Gramineae species such as maize and wheat
where the plastidic ACCase has a homodimeric (type I) structure. (Alban et al., 1994;
Ohlrogge and Jaworski,1997). All higher plants possess an extraplastidial type I
enzyme which is proposed to be cytosolic (Ohlrogge and Jaworski, 1997). In contrast
to the plastidial isoform, the cytosolic ACCase does not catalyse the de novo fatty
acid biosynthesis, but it is required for the fatty acids elongation (over 18-C). In
addition to this it is involved in the synthesis of variety of phytochemicals such as
epicutical waxes, suberin, flavonoids, stilbenoids, a variety of malonylated chemicals
and free malonic acid (Nikolau et al., 1984; Caffrey et al., 1998).
Heteromeric ACCase from plastids is composed of a dissociable complex of biotin
carboxylase (BC), catalysing the carboxylation of biotin on the biotin carboxyl carrier
protein (BCCP) subunit, and the carboxyltransferase α- and β-subunits (α-CT and β-
CT), which catalyse the transfer of CO2 from carboxybiotin to acetyl-CoA to form
malonyl-CoA (Sasaki et al, 1995; Ohlrogge and Browse, 1995). The β-subunit is
encoded by the chloroplast genome, while the other three sunbunits are encoded by
the nuclear genome (Sasaki et al., 1995).
Plastidial ACCase has pH optimum near 8.0 to 8.5. It is activated by ATP, CoA,
malonyl-CoA, propionyl-CoA and butyryl-CoA (Hunter and Ohlrogge, 1998).
Competitive inhibitors of ACCase are ADP and to lesser extent AMP (Nikolau et al.,
1984). Studies in isolated pea chloroplasts showed that the plastidial ACCase in
plants is subject to phosphorylation. Dephosphorylation of pea chloroplast extracts by
an alkaline phosphatase reduced in vitro plastidial ACCase activity by 67%. Evidence
was presented pointing to the carboxyltransferase β-subunit as a candidate for
regulation by protein phosphorylation/dephosphorylation (Savage and Ohlrogge,
1999).
Plastid ACCase has also been shown to be redox-regulated via reduction of a
disulfide bridge between the nuclear encoded α and plastidial encoded β subunits of
carboxyltransferase. Reducing agents led to an increase in ACCase activity in
spinach chloroplasts and preparations of partially purified pea ACCase (Sauer and
Heise, 1984; Sasaki et al., 1997). Reduced thioredoxin activated the enzyme more
efficiently than DTT alone, and thioredoxin f was more effective than thioredoxin m or
E. coli thioredoxin. Western blot analysis of partially purified ACCase from pea
chloroplasts showed that in the absence of reducing agents Cys-267 and Cys-442
between α- and β-CT subunits form a disulfide bridge leading to the dimerisation and
inactivation of the enzyme. In the presence of 2-mercaptoethanol CT subunits were
present in monomerised active form (Kozaki et al., 2001). Comparison of the redox-
state of ACCase measured in chloroplasts isolated from dark- or light-adapted pea
seedlings showed that in the light CT subunits are partially monomerised, whereas in
the dark all the enzyme is in the dimerised non-active form (Kozaki et al., 2001).
However, direct in-planta evidence for the regulation of lipid synthesis by redox
regulation is lacking. Fatty acid synthesis in pea chloroplasts is increased in the light
and decreased in the dark. It was demonstrated (Sauer and Heise, 1983) that
isolated chloroplasts are able to incorporate acetate into malonyl-CoA within minutes
when exposed to light and the incorporation decreases after the exposure ends.
These changes were at least partly explained by changes in ACCase activity via
light-dependent changes of pH, Mg2+ and adenine nucleotide levels in the stroma.
During illumination, increases in pH from 7 to 8 and in Mg2+ from 1 to 3 mM have
been measured for chloroplast stroma. The activity of ACCase at pH 8 and 2.5 mM
Mg2+ was 90-fold that at 7 and 1 mM Mg2+, suggesting that stromal ACCase could be
activated very strongly by these changes in the light (Kozaki and Sasaki,1999). In the
dark, ATP and ADP concentrations have been found to be in the range of 0.3-0.8 mM
and 0.6-1.0 mM, respectively, in chloroplast stroma. Upon illumination,
photophosphorylation causes a rise in the ATP concentration to 0.8-1.4 mM while
ADP decreases to 0.3-0.6 mM. Such changes have been shown to lead to a 2-fold
increase in the stimulated ACCase activity in-vitro. (Nikolau and Hawke, 1984).
Further, in addition to the unclarified role of light for the redox-activation of ACCase in
leaves, the involvement of sugars as a second input in analogy to the situation for
AGPase in potato tubers (see above) has not been considered. One of the aims of
the present thesis is to investigate whether lipid synthesis is redox-regulated in planta
and what signals are leading to reductive activation of ACCase.
1.6. Aims and objectives of the present work
Post-translational redox-regulation has been found many years ago to regulate
enzymes of the Calvin cycle, oxidative pentose phosphate cycle, NADPH export and
ATP synthesis in response to light via the ferredoxin/thioredoxin system (Buchanan
1980, 1991; Schürmann and Jacquot, 2000; Schürmann and Buchanan, 2001). In the
present thesis it should be investigated whether this concept can be extended to the
regulation of carbon storage in leaves. It has been shown by other research groups
that heterologously overexpressed AGPase is activated by DTT and thioredoxins f
and m in vitro, which involves reduction of a disulfide-bond between Cys12 of
regulatory subunits (Fu et al., 1998; Ballicora et al., 2000). In the first part of the
thesis, the in vivo importance of this mechanism in the regulation of starch synthesis
in leaves in response to light should be investigated. In the second part it should be
investigated whether sugars provide a second input that leads to redox-regulation of
AGPase and starch synthesis, and possible factors that are involved in this response
should be identified. In the third part it should be investigated whether lipid synthesis
is regulated by a similar mechanism which involves reductive activation of acetyl-CoA
carboxylase in vivo. Up to the start of the thesis, redox-regulation of ACCase has
mainly been investigated in vitro (Sasaki et al., 1997).
The following questions should be investigated in this thesis:
1. Is it possible to measure the redox-activation state of AGPase in leaves or is it
necessary to adjust the current protocols?
2. Are there changes in AGPase redox-activation during day-night alterations in
leaves?
3. Is there a direct light effect leading to reductive activation of AGPase in leaves?
4. Are there sugars involved in reductive activation of AGPase and do they provide a
second input that is different from light? Is an increase in AGPase redox-activation
accompanied by an increase in the rate of starch synthesis?
5. What could be the link between sugars and redox activation of AGPase? Do
sugars lead to an increase in the overall redox-state or to changes in signal
metabolites that report the cytosolic sugar status to the plastid?
6. Is it possible to measure the redox-activation state of ACCase in leaves or is it
necessary to adjust the current protocols?
7. Is there a decrease in ACCase redox-activation during the night?
8. Is it possible to re-activate ACCase and to stimulate lipid synthesis by DTT
feeding?
9. Does sugar feeding lead to redox-activation of ACCase and stimulation of lipid
synthesis similar to its effect on AGPase?
10. Is post-translational redox-regulation of general importance for the regulation of
metabolic pathways in leaves and what is the role of transcriptional regulation in this
context?
The work was mainly focused on Arabidopsis as a model system, where the
complete genome sequence is known and mutants are available. Some experiments
were also performed with leaves from potato and pea to show the general importance
of the results. Pea was also used as a convenient system to perform experiments
with isolated chloroplasts. Overall, leaves provide an excellent system to investigate
the effect of light on starch and lipid synthesis. It also represents a convenient system
to manipulate sugar levels.
2. Materials and methods
All experiments were reproduced at least once with independent biological material.
Data points are at least the average of duplicate measurements of the same
biological sample. When error bars are shown, they represent the standard deviation
(SD) of the average of the measurements on at least two biological samples of the
same experiment or standard error (SE) when indicated.
Some of the specific conditions and experimental procedures have changed during
the course of the thesis. In these cases the figure legends explain the detailed
conditions that were used for that particular set of experiments.
2.1. Enzymes and chemicals
Biochemical enzymes and substrates were purchased from Roche (Mannheim) and
Sigma (München), chemicals were obtained from Roche (Mannheim), Merck
(Darmstadt), Sigma (München) and Fluka. Reagents for SDS-PAGE were used from
BioRad (München). Radiochemicals were from Amersham-Pharmacia
(Braunschweig). X-ray films were from Kodak. Most enzymes were grade II and
chemicals were of analytical purity.
2.2. Plant material and growth
Pea (Pisum sativum cv Marcia) was grown either in a greenhouse with a 16-h day of
180 µE, 21°C/19°C (day/night), and 50% humidity or in a high-light phytotron with a
14-h day, 20°C/16°C, and 60%/75% humidity. The pea cv Kelvedo n Wonder was
grown in a short-day phytotron (8-h day of 180 µE, 20°C/16°C, and 60%/75%
humidity day/night). Arabidopsis thaliana var Col-0 (wild type) and transgenic lines
overexpressing otsA encoding for E.coli TPS (line A19.3) or otsB encoding for an
E.coli TPP (line B12.1) (Schluepmann et al., 2003) were grown in the same short-day
phytotron. Potato (Solanum tuberosum cv Desiree) and tobacco (Nicotiana tabacum)
Wt and transgenic plants overexpressing otsA encoding for E.coli TPS or otsB
encoding for an E.coli TPP (Pellny et al., 2004) were grown in a greenhouse at 400
µE, 14-h day, 20°C/16°C day/night, and 50% humidity throughout.
2.3. Harvesting procedure, sample storage
Leaves were harvested while leaving the plants in place. Only source leaves that
were not shaded by other leaves were collected. Leaves were put directly into liquid
nitrogen, and stored at –80°C until use.
2.4. Homogenisation of frozen leaf tissue
A swingmill (MM 200, Retch) was used to homogenise the frozen leaf material to a
fine powder. The metal ball (2 cm) and containers (stainless steal of 20 ml volume)
were precooled in liquid nitrogen and the frozen tissue was homogenised at 30 Hz for
at least 1 minute. The frozen powder was then transferred to precooled eppis or
falcons for the different extractions. Work was done quickly to not allow the frozen
powder to melt and water to condensate on it. The powder was kept free of liquid
nitrogen to allow an accurate mass determination and avoid explosion of safelock
eppis after storage at -80oC.
2.5. Incubation of Leaves with Sugars in the Darkne ss
At the end of the dark period (or at the end of day period in case of over night
feeding), plants were taken from the phytotron. Non-shaded source leaves were cut,
and their petioles were recut under buffer solution. The recut petioles were inserted
into the feeding solution, containing 2 mM MES, pH 6.5, and varying concentrations
of sorbitol, sucrose, trehalose or glucose. The leaves were put in the growth cabinet
(where the conditions were the same as in phytotron, but the light was switched off)
and incubated there (times of incubations are indicated in figure legends). After
incubation, leaves were frozen immediately in liquid nitrogen, after excising that part
of the petiole, which had been immersed in the feeding solution.
2.6. Incubation of leaf discs with DTT
Incubation with DTT (dithiotreitol) was performed similar to the sugar incubations.
The difference was that leaf discs not whole leaves were incubated in the medium
containing 2 mM Mes, pH 6.5 (control) or 2 mM Mes, pH 6.5 with different
concentrations of DTT. The discs were put in the growth cabinet (where the
conditions were the same as in phytotron, but the light was switched off and
incubated there for 1 hour. After incubation, discs were frozen immediately in liquid
nitrogen.
2.7. Trichloroacetic acid (TCA) extraction
The frozen plant tissue (0.1 g FW) was resuspended in 0.8 ml of 16% (w/v) TCA
dissolved in diethyl ether and incubated shortly on ice. Then 300 µl of 16% (w/v) TCA
in water including 5 mM EGTA was added, mixed well and incubated for 2h in
thermomixer at 4oC. The samples were centrifuged at 10000 g for 10 min at 4oC. The
water soluble phase was transferred to a new tube and washed 3 times with diethyl
ether to remove TCA. Samples were neutralised (pH 6-7) with 5 M KOH including 1
M triethanoloamine and centrifuged 5 min 10000 g at 4oC. The supernatant was
frozen in liquid nitrogen and stored at -80oC for metabolite analysis.
2.8. Extraction of AGPase for western blot and
procedures for gels
Frozen leaf material was homogenized using a liquid nitrogen cooled ball-mill, and 50
mg of leaf material was extracted in cold 16% (w/v) TCA in diethyl ether, mixed, and
stored at –20°C for at least 2 h. The pellet was collected by centrifugation at 13,000
rpm for 5 min at 4°C. The pellet was washed three times with ice-cold acetone, dried
briefly under vacuum, and resuspended in 1x Laemmli sample buffer containing no
reductant (Laemmli, 1970). After heating the sample for 3 min at 95°C, the insoluble
material was settled by a 1-min spin, and the supernatant was used for gel
electrophoresis on 10% or 7.5%(w/v) acrylamide gels in presence of SDS. Proteins
coming from 0.5 or 1 mg of fresh weight were loaded per small or broad lane,
respectively and separated at constant voltage (140 V) for 2 hours (Laemmli, 1970).
The gels were blotted onto polyvinylidene difluoride (PVDF) membrane according to
standard procedures. After transfer of the proteins to membrane, it was incubated for
at least 1 hour with blocking solution consisting of 1xTBS (20 mM Tris-HCl pH 7.5,
500 mM NaCl) and 5% (w/v) fat-free milk (Bio-Rad). AGPase antigen was detected
for 1 h at RT, using a primary rabbit antibody raised against the His-tagged AGPB of
potato, diluted 1:10000 in blocking buffer (Tiessen et al., 2002 ). Thereafter one
short washing step with 1xTBST (1xTBS containing 0.1% v/v Tween) and two
washing steps with 1xTBS were performed. Incubation with a second antibody
(peroxidase-conjugated secondary goat anti-rabbit antibody, Bio-Rad Laboratories,
Hercules, CA) was done for 1 h at RT and the same washing steps were repeated..
The peroxidase was detected on film using the ECL kit of Amersham Biosciences
(Uppsala). To quantify the amount of AGPase present as monomer, the films were
scanned with standardized settings, saved as tif files, and analyzed with Scion image
software (Raytest Isotopenmessgeräte GmbH, Straubenhardt, Germany). Gel
samples from chloroplasts were prepared by mixing 1 volume of chloroplasts with 1
volume of 2x Laemmli sample buffer without reductant. The samples were heated at
95°C for 3 min and stored at room temperature until use. Proteins coming from 6.25
µg of chlorophyll were loaded per lane. Electrophoresis, blotting, and immunolabeling
procedures were as described above. For detection of the peroxidase, the ECL or
ECL advance kit was used (Amersham).
2.9. Extraction and assay of AGPase
Activity measurements were performed essentially as described (Tiessen et al.,
2002): Fifty milligrams of material was extracted with 0.5 ml of extraction buffer (50
mM K-HEPES, pH 7.5, 5 mM MgCl2, 1 mM EGTA, 1 mM EDTA, 1 mM benzamidine,
and 1 mM -aminocaproic acid). The sample was centrifuged for 30s at 4°C. T he
supernatant was used directly at 1/10 or 1/20 of the volume in the activity assay
containing 50 mM K-HEPES, pH 7.5, 5 mM MgCl2, 1.5 mM G1P, and varying
amounts of ATP and 3PGA. After 15 min at 30°C, the reaction was stopped by boiling
for 3 min. After a 5-min centrifugation, the supernatant was stored at 4°C o r –80°C
until the ADP-Glucose content was determined by HPLC. Chloroplasts suspensions
or desalted protein extracts used for activity measurements were first incubated for
15 minutes with different concentrations of T6P, DTT or reduced thioredoxins and
than assayed as described above.
2.10. HPLC (measurement of ADP-glucose)
According to Geigenberger et al. (1996, 1997).
ADPglucose was measured by high performance liquid chromatography using a
system from Kontron Instruments (München). The AGPase assays were kept at 4oC
and 20 µl were injected by the auto sampler to the HPLC column. Buffer A consisted
of 10 mM NH4H2PO4 pH 2.8 (adjusted with H3PO4). Buffer B consisted of 750 mM
NH4H2PO4 pH 3.7. Both buffers were first filtered (Cellulose acetate filter, 3 µm mesh,
Sarstedt) and then degassed by ultrasonification. The gradient program used to
separate the nucleotides was as follows: flow 1 ml/min, 0 min 7.5% B, 0.5 min inject,
12 min 7.5 B, 15 min 50% B, 19.5 min 90% B, 34 min 100% B, 38 min Acq. Off, 39
min end. Detection was performed with UV light at 254 nm and at 230 nm. A partisil-
10-SAX ion exchange column (5 mm x 250 mm, Whatman, UK) and a precolumn (5
mm x 20 mm) were used for the separation of the nucleotides. The nucleotides were
identified by comparison of the elution time of standards and the 254 nm/ 230 nm
ratio of absorbance. Standards consisted of 20 µM, 50 mM and 100 µM of the mono-,
di- and tri-nucleotides, respectively. The amount of metabolite was calculate via
software (Kroma System 3000, Kontron) from the peak area by using a calibration
factor obtained from standard runs.
2.11. Extraction and assay of ACCAse
50 mg of leaf material was extracted with 0.5 ml of extraction buffer (50 mM K-
HEPES, pH 7.6, 5 mM MgCl2, 1 mM EGTA, 1 mM EDTA, 1 mM benzamidine, and 1
mM -aminocaproic acid). The sample was centrifuged for 30s at 4°C an d
supernatant preincubated 15 min without or with 5 mM DTT in RT. 5 µl of
supernatant was added to 20 µl of reaction mixture (50 mM Tricine/KOH pH 9, 1 mM
ATP, 2.5 mM MgCl2, 50 mM KCl, 200 µM Acetyl-CoA, 3.4 mM NaH14CO3 [14.8 kBq],
+/- 5 mM DTT), incubated for 20 min in 30oC, stopped with 5 µl of 6 M HCl and
transferred on Whatman paper (3 mm). Control samples were prepared by adding
HCl before incubation with the reaction mixture. The paper was dried and the
radioactivity determined (modified from Sasaki et al., 1997).
2.12. Chloroplast preparation
Ten- to 16-day-old pea seedlings were subjected to an extended night by 5 h to
deplete the internal starch pools and subsequently were transferred to light for about
30 min to induce photosynthesis. Chloroplasts were then prepared essentially as
described by Lunn et al. (1990), but with some adaptations. 500 µl of extraction buffer
(0.33 M sorbitol, 0.01 M Mes/KOH pH 6.5, 0.005 M MgCl2, 0.002 M ascorbate, 0.5%
BSA) and 80 g of pea leaves were blended 2x 10 sec, filtered through miracloth and
nylonmesh to discard leaf tissue, poured into plastic tubes, centrifuged 1 min 1700g
at 4oC. Pellet was dissolved in 1 ml of resuspension buffer (0.33 M sorbitol, 0.05 M
Hepes/KOH pH 7.5, 0.002 M EDTA, 0.001 M MgCl2), filtered through 40% (v/v)
percoll mixed with resuspension buffer by centrifugation for 1 min, 1700g, 4oC. Pellet
was dissolved in 250 µl resuspension buffer, mixed and kept in darkness on ice until
use. The chlorophyll content of the final preparation was determined in MeOH
extracts (Porra et al., 1989) and calculated according to the equation:
Chlorophyll a+b = 22.12*(A652-A750)+2.71*(A665-A750).
Intactness of chloroplasts was determined routinely by microscopy or determined on
oxygen electrode. Intact chloroplasts measurement mixture: 500 µl 2x concentrated
degassed resuspention buffer (containing 0.004 M NaHCO3 additionally), 20 µl
chloroplasts extract, 500 µl degassed water. Mixture was darkened for 5 min, next 50
µl of 0.2 M glyceraldehyde and 5 µl of 1M ferricyanate were added, darkened for 2
min and 20 µl of 0.25 M ammonium chloride added. Destroyed chloroplasts
measurement mixure contained the same solutions, but water was added first, than
chloroplasts and buffer (Lilley et al., 1975).
2.13. Incubations of chloroplasts and photosynthesi s
measurement
Oxygen evolution was measured in an oxygen electrode at 25°C on the chloroplasts
suspension of 50 µg chlorophyll ml–1 in resuspension buffer containing 4 mM
NaHCO3 and additives as indicated in the figure legends. The cuvette was darkened
for 5 min before the dark sample was taken. After restabilisation of the evolution
trace, the sample was illuminated using the beam of a slide projector.
2.14. Desalting of proteins from isolated chloropla sts
Freshly isolated intact chloroplasts were destroyed by 5-fold dilution with water
(osmotic shock) and cleaned on desalting Sephadex G-50 column. Sephadex G-50
resin was prepared according to Amersham Biosciences procedure and 10 ml of the
resin was used for column preparation. 10 mM Na2HPO4 buffer, pH 6.8, was used for
the equilibration of the column and elution of the sample. After desalting samples
were stored on ice until use and used within one day.
2.15. Thioredoxin reduction
Plastidial thioredoxins f and m from spinach leaves (provided by Prof. Renate
Scheibe (Osnabrück). were reduced as described (Sasaki et al., 1997). The mixture
containing 50 mM Hepes pH 7.8, 0.1 mM EDTA, 5 mM DTT, 1 mM thioredoxin was
incubated for 10 minutes in 37oC, cooled on ice and used for AGPase reduction.
2.16. Extraction and assay of FBPase and NADP malat e
dehydrogenase
FBPase (fructose bisphosphatase) and NADP-MDH (NADP-malate dehydrogenase)
activities in chloroplasts were measured by mixing 20 µl of the chloroplasts solution
from the oxygen electrode with 180 µl of reaction mixture containing 50 mM K-Tricine,
pH 8.0, 5 mM MgCl2, and 0.1% (v/v) Triton X-100. For FBPase, the mixture
additionally contained 0.1 mM NADP+, 40 µM Fru-1,6-bisphosphate, and 1.75 mM
EDTA. The reaction was stopped by the addition of 20 µl of 1 M NaOH either directly
or after a 3- or 10-min incubation at room temperature. The reaction mix for NADP-
malate dehydrogenase assays instead contained 0.1 mM NADPH, and 0 or 2 mM
oxaloacetate additionally. It was stopped after 10 min by addition of 20 µl 1 M HCl/0.1
M Tricine, pH 9. In both cases, the difference in NADP(H) content of the two samples
was taken as a measure for enzyme activity. The samples were stored at 4°C until
further processing. Heating of the samples for 5 min at 95°C ensured the complete
disrupture of all unused nucleotide-adenine substrate (NADP or NADPH). Five or 10
µl of the reaction was brought to pH 9 by the addition of 25 mM HCl/50 mM Tricine,
pH 9, for FBPase or 0.1 M NaOH for MDH. The NADP(H) content was determined
directly after the pH adjustment by an enzymatic cycling assay (like for glucose 6-
phosphate, see 2.13.1). Both assays were shown to be linear with time for over 10
min.
2.17. Ethanolic extraction
Frozen plant material was extracted in two subsequent steps with 80% (v/v) ethanol
(250 µl per 10 mg FW and 150 µl per 10 mg FW), mixed for 20 min at 80oC and
centrifuged at max speed for 5 min. The pellet was re-extracted in with 50% (v/v)
ethanol (250 µl per 10mg FW), the supernatants were combined and used for
immediate assay or stored at -20oC until use. The pellet of the ethanol extraction was
used for starch analysis.
2.18. Assay of sucrose, reducing sugars, starch
Sucrose, glucose, fructose and starch were determined enzymatically in ethanol
extracts (Stitt et al., 1989) using a microplate spectrophotometer. The assay
contained a final volume of 220 µl (179 µl of 100 mM Hepes/KOH with 3 mM MgCl2
(pH 7), 10 µl of 12 mg/ml NADP, 10 µl of 20 mg/ml ATP, 0.5 U glucose 6-phophate
dehydrogenase from yeast and 20 µl of ethanol extract. The reactions were started
by successive addition of 1U hexokinase (from yeast), 1 U phosphoglucoisomerase
(from yeast) and 20 U invertase (from yeast).
For starch determination, the pellets of the ethanol extraction were solubilized by
heating them to 95°C in 0.1 M NaOH for 30 min. After acidification to pH 4.9 with an
HCl/sodium-acetate, pH 4.9, mixture, part of the suspension was digested overnight
with amyloglucosidase and α-amylase. The glucose content of the supernatant was
then used to assess the starch content of the sample.
2.19. Assay of hexose-phosphates
Hexose-phosphates were determined as described in Gibon et al. (2002).
2.19.1. Glucose 6-phosphate
Aliquots of 5 µl of ethanol extracts or hexose-P standards (0-50 pmol) were disposed
into 1.5 ml microtubes, containing 20 µl of 50 mM Tricine/KOH buffer pH 9 containing
2.5 mM MgCl2, 0.02 U G6PDH and 6.5 nmol NADP added, incubated for 20 min at
RT, 20 µl 0.5 M NaOH added, heated at 95oC for 5 min, cooled on ice, centrifuged 30
sec and contents transferred to a 96-well microplate containing 20 µl of 0.5 M HCl in
buffer. After mixing, 50 µl buffer containing 1.2 U G6PDH, 0.3 µmol G6P, 0.5 µmol
EDTA, 0.04 µmol PMS and 0.1 µmol MTT was added and absorbance read at 570
nm for 10 min.
2.19.2. Glucose 1-phosphate
Aliquots of 10 µl of ethanol extracts or hexose-P standards (0-20 pmol) were
disposed into 1.5 ml microtubes, containing 20 µl of 50 mM Tricine/KOH buffer pH 9
containing 2.5 mM MgCl2, 0.02 U G6PDH and 6.5 nmol NADP added, incubated for
20 min at RT, 10 µl of 0.25 M HCl was added and incubated 10 min at RT. This
incubation removed G6P and destroyed the resulting NADPH. After neutralising with
10 µl of 0.25 M a in buffer, 20 µl of 50 mM buffer containing 0.2 U G6PDH, 0.04 U
PGM and 0.5 nmol G1,6-bisP were added, incubated 20 min at RT, 20 µl 0.5 M
NaOH added, heated at 95oC for 5 min, cooled on ice, centrifuged 30 sec and
contents transferred to a 96-well microplate containing 20 µl of 0.5 M HCl in buffer.
After mixing, 50 µl buffer containing 1.2 U G6PDH, 0.3 µmol G6P, 0.5 µmol EDTA,
0.04 µmol PMS and 0.1 µmol MTT was added and absorbance read at 570 nm for 10
min.
2.19.3. Fructose 6-phosphate
Aliquots of 10 µl of ethanol extracts or hexose-P standards (0-50 pmol) were
disposed into 1.5 ml microtubes containing 20 µl of 50 mM Tricine/KOH buffer pH 9
containing 2.5 mM MgCl2, 0.02 U G6PDH and 6.5 nmol NADP added, incubated for
20 min at RT, 10 µl of 0.25 M HCl was added and incubated 10 min at RT. This
incubation removed G6P and destroyed the resulting NADPH. After neutralising with
10 µl of 0.25 M a in buffer, 20 µl of 50 mM buffer containing 0.2 U G6PDH, 0.04 U
PGI and 0.5 nmol G1,6-bisP were added, incubated 20 min at RT, 20 µl 0.5 M NaOH
added, heated at 95oC for 5 min, cooled on ice, centrifuged 30 sec and contents
transferred to a 96-well microplate containing 20 µl of 0.5 M HCl in buffer. After
mixing, 50 µl buffer containing 1.2 U G6PDH, 0.3 µmol G6P, 0.5 µmol EDTA, 0.04
µmol PMS and 0.1 µmol MTT was added and absorbance read at 570 nm for 10 min.
2.20. Pyruvate and phosphoenolpyruvate
The TCA extracts were used to measure pyruvate and phosphoenolpyruvate
enzymatically (Stitt et al., 1989) in a dual-wavelengh spectrophotometer (Sigma). The
assay (600 µl) contained 50 mM Hepes/KOH pH 7, 5 mM MgCl2, 50 µM NADH, 1
mM ADP and 40 µl extract. The reactions were started by successive addition of 1 U
1-lactate-dehydrogenase and 2 U pyruvate kinase.
2.21. 3PGA
The TCA extracts were used to measure 3-phosphoglyceric acid (3PGA)
enzymatically (Stitt et al., 1989) in a dual-wavelengh spectrophotometer (Sigma). The
assay (600 µl) contained contained 50 mM Hepes/KOH pH 7, 5 mM MgCl2, 50 µM
NADH, 1.5 mM ATP and 20 µl extract. The reaction was started by simultaneous
addition of 5 U glycerine-aldehyd-3-phosphate-dehydrogenase (rabbit muscle) and 5
U 3-phosphoglycerate-kinase (yeast).
2.22. Glycerol-3-phosphate
Gly3P was determined as described in Gibon et al. (2002).
Aliquots of extract (10 µl) or Gly3P standard (0-20 pmol) were added to 40 µl 200 mM
buffer, heated for 20 min, 95oC to destroy DAP, cooled on ice, centrifuged 30 sec, the
supernatants transferred to a 96-well microplate, mixed with 40 µl 50 mM buffer
containing 2 U Gly3POX, 130 U catalase, 0.4 U Gly3PDH and 0.12 µmol NADH, and
absorbance by 340 nm was read for 20 min.
2.23. Acetyl-coenzyme A
Acetyl-Coa was determined as described in Gibon et al. (2002).
Aliquots of 20 µl extract or Acetyl-CoA standards (0.5-10 pmol) were disposed into a
microplate and 0 or 1 µmol of N-ethylmaleimide was added (20 µl) in order to remove
CoASH. After 10 min incubation, 100 µl of 200 mM Tris/HCl ph 7.4 containig 0 or 1
µmol DTT and 20 µmol malate were added and the plate was incubated for 15 min at
RT. Finally 50 µl of a mixture containing 0.5 µmol DTT, 0.92 µmol acetyl phosphate,
0.28 µmol NAD, 2.8 U malate dehydrogenase in 100 mM Tris/HCl were added and
absorbance was read at 340 nm for 10 min.
2.24. NADPH/NADP+ ratio measurement
NADPH/NADP+ ratio was determined in ethanol extracts as described in Lowry et al.
(1961). 500µl of ethanol extract was pipeted to 50µl of 0.5M NaOH (for NADPH
measurement) or to 50µl of 0.5M HCl, heated at 90oC for 2 minutes, cooled on ice for
1 minute and centrifuged in 4oC on maximum speed. 20µl of supernatant was used
for cycling assay (as for glucose 6-phosphate, see 2.13.1) immediately.
2.25. Labeling experiments and label separation
Labeling experiments were carried out with whole Arabidopsis leaves cut directly
from the plant, with ends of petioles re-cut under water. Leaves were incubated in the
dark for 13 h at 20°C (humidity of 60%) in medium containing 2 mM MES-KOH (pH
6.5) and 0.66 mM or 0.33 mM [U-14C]-glucose (specific activity, 111 kBq/mmol;
Amersham-Buchler, Braunschweig, Germany) together with various concentrations of
sucrose (see legends to figures for details). Incubations were done in petri dishes (5-
ml volume). Wet ends of petioles of incubated leaves were cut and discarded, and
leaves were frozen immediately in liquid nitrogen. After ethanol extraction, 1 ml of
chloroform and 1 ml water were added to the combined supernatants and the
extracts were vigorously shaken. The upper phase (ethanol/water) were transferred
into a small tube and dried under an air stream at 45°C, taken up in 1 ml H 2O
(soluble fraction), and separated into neutral, anionic and cationic fractions by ion-
exchange chromatography (Geigenberger et al., 1997). The chloroform fraction was
dried and counted for total lipids or freeze-dired, taken up in 75 µl of water and
further separated by thin-layer chromatography (Geigenberger et al., 1997),
developing 8 times with ethyl acetate/pyridine /water (100:35:25, by vol.), and
quantifying using a linear analyser (Tracemaster 20, Berthold, Bad Wildbad,
Germany). Peaks were identified using radiolabelled standards. The insoluble
material (starch, proteins and cell wall) left after ethanol extraction was analysed to
determine the amount of label in starch, protein and cell walls as in Merlo et al.
(1993). Label in the hexose phosphate pool was analyzed as by Geigenberger et al.
(1997), and total carbon in the hexose phosphate pool was determined in ethanol
extracts as described above using non-radioactive replicates incubated in parallel.
Total fatty acids were extracted according to the method of Bligh and Dyer (1959)
and the lipid content was counted for the radioactivity.
2.26. Extraction and derivatisation for GC/MS (gas
chromatography/mass spectrometry)
The polar metabolite fraction was obtained from wild type (ecotype Columbia-0) or
transgenic Arabidopsis thaliana plants overexpressing E.coli genes for trehalose
metabolism. Samples were harvested at the end of day and night or incubated with
different sugars or DTT (see Materials and Methods and description of experiments
in Results chapter). After freezing in liquid nitrogen and homogenization the tissue
was extracted in 1400µl 100% methanol containing 60µl quantitative internal
standard (2mg ribitol in 1ml water) for 15 min at 70oC and centrifuged. The
supernatant was then transferred to glass vials and vigorously mixed with 750µl of
chloroform and 1500µl water and subsequently centrifuged at 4000rpm. Aliquots of
the methanol/water supernatant (400 and 800µl) were dried in speed vac for 6-16
hours.
The dried residue was redissolved and derivatised in 40µl of 20mg/ml methoxyamine
hydrochloride in pyridine for 2h at 37oC followed by treatment with 70ml MSTFA for
30min at 37oC. Retention time standard mixture (10µl) was added to
trimethylsilylation. The retention time standard mixture contained heptanoic, nonanoic
, undecanoic, tridecanoic and pentadecanoic acid – 3.7% (w/v) each, tricosanoic and
nonadecanoic acid – 7.4% (w/v) each, heptacosanoic acid – 22.2% (w/v) and
hentriacontanoic acid – 55.5% (w/v) in tetrahydrofuran at 10mg/ml total
concentration.
2.27. GC/MS analysis
All GC/MS analyses were carried out using a GC/MS system consisted of an AS
2000 autosampler, a GC 8000 gas chromatograph and a Voyager quadrupole mass
spectrometer (ThermoQuest, Manchester, GB). The mass spectrometer was tuned
according to the manufacturer’s recommendations using tris-(perfluorobutyl)-amine
(CF43). Gas chromatography was performed on a 30m SPB-50 comlumn with
0.25mm inner diameter and 0.25µm film thickness (Supelco, Belfonte, CA). Injection
temperature was 230oC, the interface set to 250oC and the ion source adjusted to
200oC. The carrier gas used was helium set at a constant flow rate of 1ml/min. The
temperature program was 5min isothermal heating at 70oC, followed by a 5oC/min
oven temperature ramp to 310oC and a final 1min heating at 310oC. The system was
then temperature equilibrated for 6min at 70oC prior to injection of the next sample.
Mass spectra were recorded at 2scan/s with m/z 50-600 scanning range.
2.28. Determination of relative metabolite levels
The chromatograms and mass spectra were evaluated using the Masslab program
(ThermoQuest, Manchester, GB). A retention time and mass spectral library for
automatic peak quantification of metabolite derivatives was implemented within the
Masslab method format. For evaluation of relative values within each chromatogram
the peak areas derived from specific ion traces indicative of each analysed
compound were normalized by the peak area derived from an internal standard
present within the same chromatogram.
At least 5 replicates were measured and standard error (SE) was determined.
Significance was determined using t-test analysis. Significant data are marked on red
colour on the list of measured metabolites (Appendix).
2.29. RNA isolation
Total RNA was isolated according to Trizol RNA extraction protocol (adapted by O.
Bläsing). 5ml Trizol was added to 0.5 g of frozen leaf sample, vortexed for 30 sec and
incubated at RT for 5 min. Next it was centrifuged 20 min in 4oC, 4000 rpm,
supernatant was transferred to a new tube and 3ml pure chlorophorm was added, the
miture was vortexed and incubated at RT for 5 min. After centrifugation (20 min, 4000
rpm, 4oC), RNA containing aqueous phase was transferred to a new tube. 1/10
volume 3M sodium acetate and 0.6 volume of isopropyl alcohol was added, mixed
and incubated at 4oC for 15 min. Next samples were centrifuged 10 min, 4000 rpm at
4oC to pellet RNA. Supernatnat was removed, pellet was washed twice with 1ml 70%
Ethanol, spinned 5 min, 4000 rpm at 4oC. Finally pellet was air dryed for 10 min at
RT, resuspended in 50µl DEPC treated water and stored in freezer until use.
2.30. Transcript levels measurement and analysis
Chip hybridization was performed as in Thimm et al. (2004) MAPMAN: a user-driven
tool to display genomics data sets onto diagrams of metabolic pathways and other
biological processes. The Plant Journal 37: 914-939
Data analysis was done using the Bioconductor package in the R software (Robert C
Gentleman and Vincent J. Carey and Douglas M. Bates and Ben Bolstad and Marcel
Dettling and Sandrine Dudoit and Byron Ellis and Laurent Gautier and Yongchao Ge
and Jeff Gentry and Kurt Hornik and Torsten Hothorn and Wolfgang Huber and
Stefano Iacus and Rafael Irizarry and Friedrich Leisch Cheng Li and Martin Maechler
and Anthony J. Rossini and Gunther Sawitzki and Colin Smith and Gordon Smyth
and Luke Tierney and Jean Y. H. Yang and Jianhua Zhang, 2004, Bioconductor:
Open software development for computational biology and bioinformatics. Genome
Biology, 5: R80).
Normalisation of the raw data and estimation of signal intensities was done using
RMA methodology (Bolstad, B.M., Irizarry, R. A., Astrand, M. and Speed, T.P. (2003),
A comparison of normalization methods for high density oligonucleotide array data
based on bias and variance.Bioinformatics, 19, 185–193) combining all experiments
with the same experimental treatment.
Cluster analysis was performed using self-made selection macros written in EXCEL,
as well as the TIGRE MeV software package (Saeed, A.I., Sharov, V., White, J., Li,
J., Liang, W., Bhagabati, N., Braisted, J., Klapa, M., Currier, T., Thiagarajan, M.,
Strun, A., Snuffin, M., Rezantsev, A., Popov, D., Ryltsov, A., Kostukovich, E.,
Borisovsky, I., Liu, Z., Vinsavich, A., Trush, V. and Quackenbush, J. (2003) TM4: a
free, open-source system for microarray data management and analysis.
Biotechniques, 34, 374–378.)
3. Results
3.1. AGPase is subject to post-translational redox-
activation in leaves in response to light signals
AGPase is a key-regulatory step in the pathway of starch synthesis. Previous studies
provided in-vitro evidence for post-translational redox-regulation of AGPase. (Fu et
al., 1998; Ballicora et al., 2000). However, the in-vivo importance of this mechanism
for the regulation of photosynthetic starch synthesis and its relation to the well-
establisehd light-dependent regulation of the activities of Calvin cycle and other
enzymes invovled in photosynthesis by thioredoxin-mediated redox activation
remained unclear.
In the following chapter it is investigated whether AGPase is subject to redox-
regulation in response to light-dark changes in leaves. To do this, a protocol was
established to measure in-vivo AGPB-dimerisation state and activation in leaves.
Then AGPB dimerisation state and activation was measured in leaves at the end of
the day and night and in response to more rapid light-dark transitions. AGPB
dimerisation was also measured in isolated chloroplasts to investigate whether there
is direct response to light.
3.1.1. Establishing of a new protocol to measure changes
in the reduction state of AGPase in leaves
To investigate whether leaf AGPB undergoes reversible dimerisation in vivo, extracts
were initially prepared rapidly in degassed SDS solutions and subjected to non-
reducing SDS-PAGE and AGPB protein was detected using a rabbit-antibody raised
against AGPB from potato. When extracts from growing potato tubers were prepared
this way, they contained a mixture of monomeric and dimeric AGPB (Tiessen et al.,
2002). In case of leaves, all the AGPB protein ran with an apparent molecular mass
of about 100 kDa, irrespective of whether extracts were prepared from illuminated or
darkened plants. When extracts from leaves were mixed 1:1 with extracts from
growing potato tubers, the immunosignal was also obtained at only 100 kDa (data not
shown). These results indicated that leaf extracts contain unknown compounds that
rapidly oxidize AGPB to a dimer. To prevent this, leaves were extracted in a
trichloroacetic acid (TCA)-diethyl ether mixure at 4°C to rapidly denature AGPase
and physically separate AGPB subunits that were present as monomers, and
analysed in non-reducing SDS-PAGE electrophoresis. Rapid oxidation of AGPB in
leaf extracts probably explains why posttranslational redox-regulation was overlooked
in earlier studies.
3.1.2. Changes in AGPB dimerisation and activity in
response to day/night changes in leaves
In leaves, starch is accumulating during the day and decreasing during the night. Pea
(Pisum sativum), potato (Solanum tuberosum), and Arabidopsis thaliana leaves were
harvested during the night, and in the second half of the light period to investigate
whether leaf AGPB is subject to reversible dimerisation in vivo using the new
extraction procedure. Results show that pea leaf AGPB subunit is completely
dimerised in the night, and partly converted to a monomer during the day (Fig. 3).
When the extracts were separated in reducing conditions (samples contained DTT),
immunosignal was found only at 50 kDa, showing that the intermolecular link involves
a disulfide bridge. Similar results were obtained for potato and Arabidopsis leaves.
The proportion converted to a monomer was lower in Arabidopsis compared to pea
and potato, possibly reflecting the lower growth light intensity.
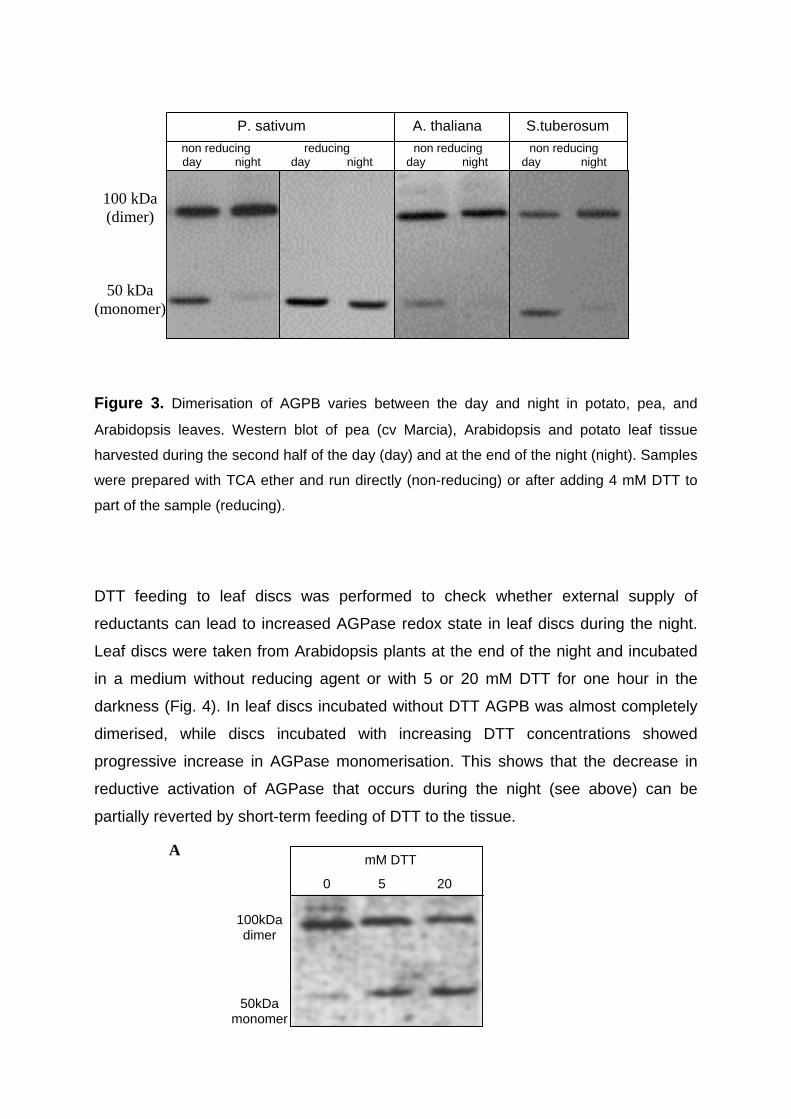
Figure 3. Dimerisation of AGPB varies between the day and night in potato, pea, and
Arabidopsis leaves. Western blot of pea (cv Marcia), Arabidopsis and potato leaf tissue
harvested during the second half of the day (day) and at the end of the night (night). Samples
were prepared with TCA ether and run directly (non-reducing) or after adding 4 mM DTT to
part of the sample (reducing).
DTT feeding to leaf discs was performed to check whether external supply of
reductants can lead to increased AGPase redox state in leaf discs during the night.
Leaf discs were taken from Arabidopsis plants at the end of the night and incubated
in a medium without reducing agent or with 5 or 20 mM DTT for one hour in the
darkness (Fig. 4). In leaf discs incubated without DTT AGPB was almost completely
dimerised, while discs incubated with increasing DTT concentrations showed
progressive increase in AGPase monomerisation. This shows that the decrease in
reductive activation of AGPase that occurs during the night (see above) can be
partially reverted by short-term feeding of DTT to the tissue.
non reducing reducing non reducing non reducing day night day night day night day night
100 kDa (dimer)
50 kDa (monomer)
P. sativum A. thaliana S.tuberosum
A
100kDa dimer
50kDa monomer
0 5 20
mM DTT
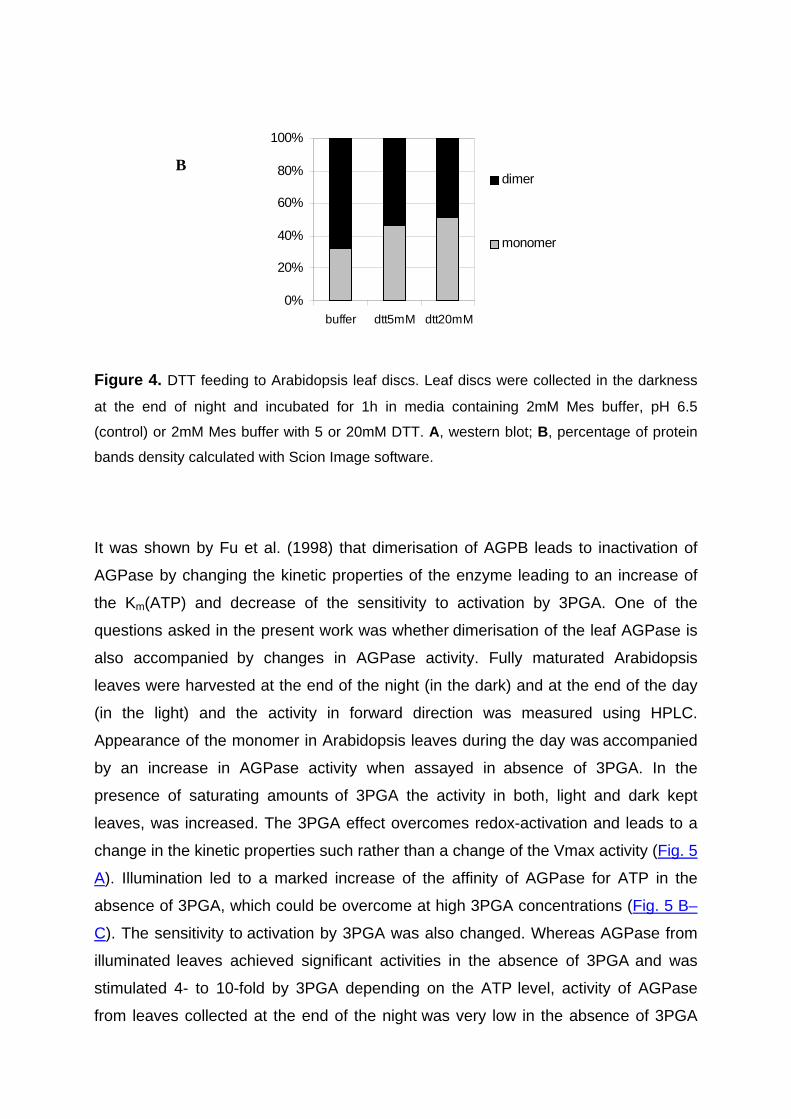
Figure 4. DTT feeding to Arabidopsis leaf discs. Leaf discs were collected in the darkness
at the end of night and incubated for 1h in media containing 2mM Mes buffer, pH 6.5
(control) or 2mM Mes buffer with 5 or 20mM DTT. A, western blot; B, percentage of protein
bands density calculated with Scion Image software.
It was shown by Fu et al. (1998) that dimerisation of AGPB leads to inactivation of
AGPase by changing the kinetic properties of the enzyme leading to an increase of
the Km(ATP) and decrease of the sensitivity to activation by 3PGA. One of the
questions asked in the present work was whether dimerisation of the leaf AGPase is
also accompanied by changes in AGPase activity. Fully maturated Arabidopsis
leaves were harvested at the end of the night (in the dark) and at the end of the day
(in the light) and the activity in forward direction was measured using HPLC.
Appearance of the monomer in Arabidopsis leaves during the day was accompanied
by an increase in AGPase activity when assayed in absence of 3PGA. In the
presence of saturating amounts of 3PGA the activity in both, light and dark kept
leaves, was increased. The 3PGA effect overcomes redox-activation and leads to a
change in the kinetic properties such rather than a change of the Vmax activity (Fig. 5
A). Illumination led to a marked increase of the affinity of AGPase for ATP in the
absence of 3PGA, which could be overcome at high 3PGA concentrations (Fig. 5 B–
C). The sensitivity to activation by 3PGA was also changed. Whereas AGPase from
illuminated leaves achieved significant activities in the absence of 3PGA and was
stimulated 4- to 10-fold by 3PGA depending on the ATP level, activity of AGPase
from leaves collected at the end of the night was very low in the absence of 3PGA
B
0%
20%
40%
60%
80%
100%
buffer dtt5mM dtt20mM
dimer
monomer
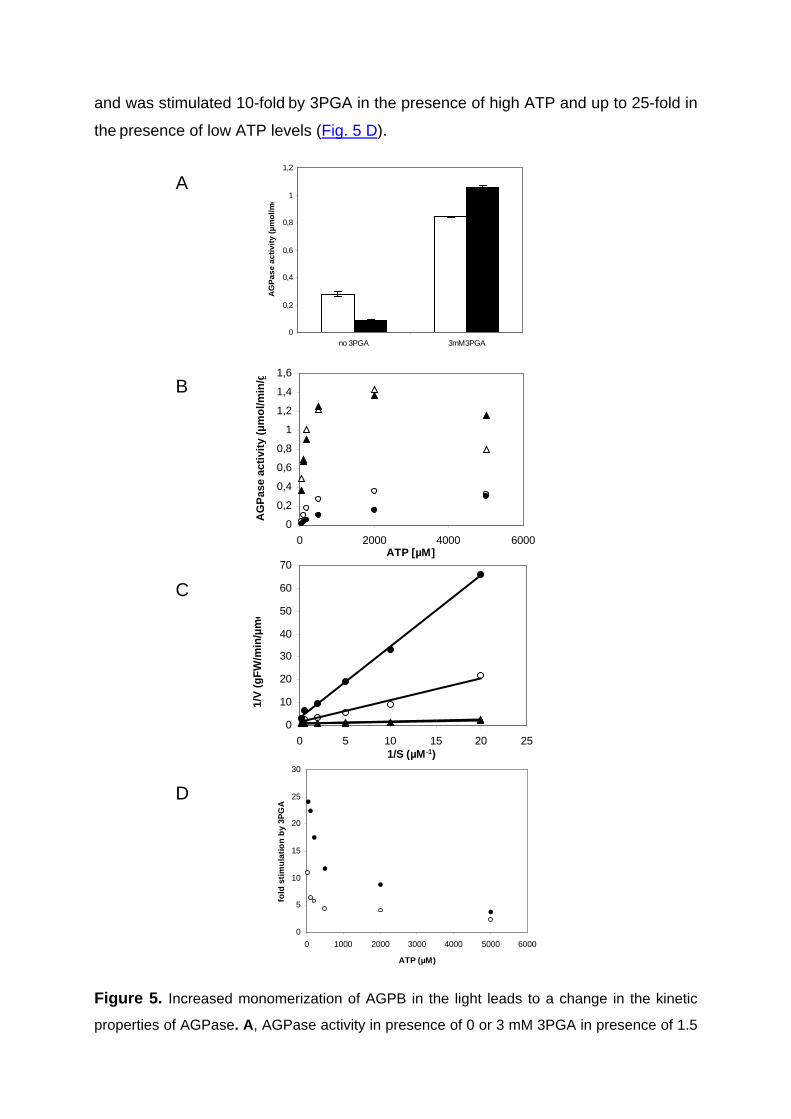
and was stimulated 10-fold by 3PGA in the presence of high ATP and up to 25-fold in
the presence of low ATP levels (Fig. 5 D).
Figure 5. Increased monomerization of AGPB in the light leads to a change in the kinetic
properties of AGPase. A, AGPase activity in presence of 0 or 3 mM 3PGA in presence of 1.5
0
0,2
0,4
0,6
0,8
1
1,2
no 3PGA 3mM3PGA
AG
Pas
e ac
tivity
(µm
ol/m
g/m
in)A
0
0,2
0,4
0,6
0,8
1
1,2
1,4
1,6
0 2000 4000 6000ATP [µM]
AG
Pas
e ac
tivity
(µm
ol/m
in/g
FW
)
B
0
10
20
30
40
50
60
70
0 5 10 15 20 251/S (µM -1)
1/V
(gF
W/m
in/µ
mol
)
C
0
5
10
15
20
25
30
0 1000 2000 3000 4000 5000 6000
ATP (µM)
fold
stim
ulat
ion
by 3
PG
A
D
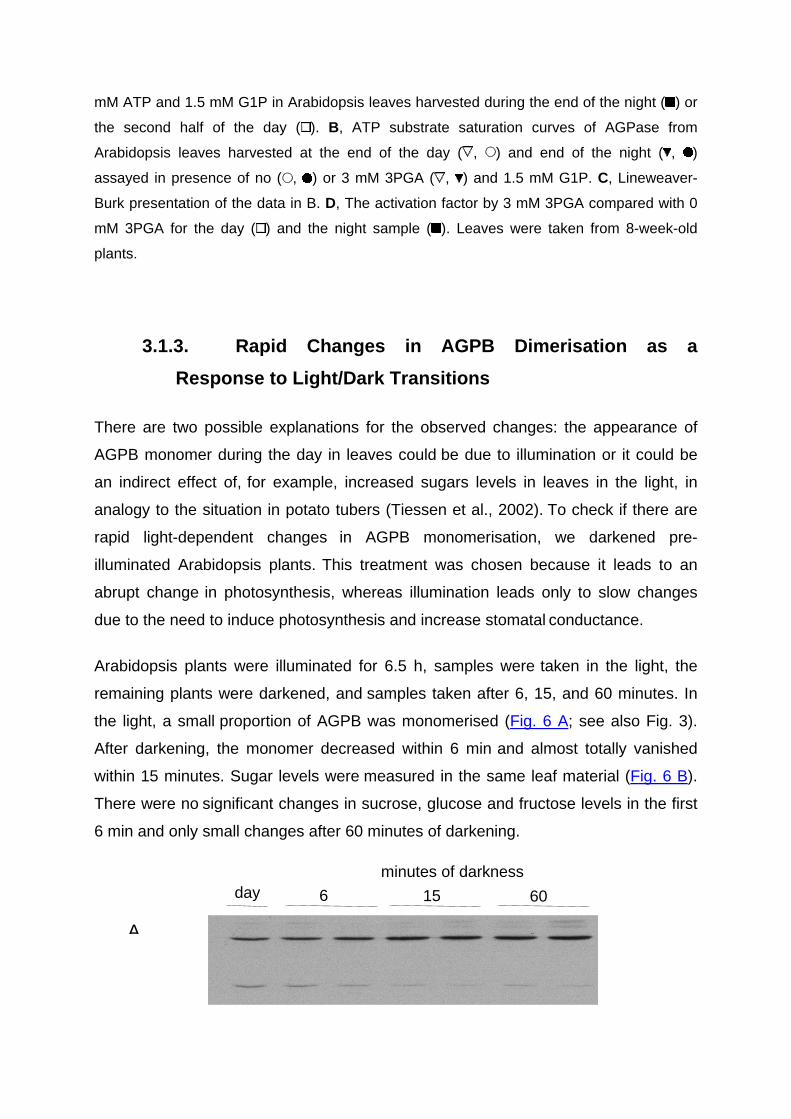
mM ATP and 1.5 mM G1P in Arabidopsis leaves harvested during the end of the night ( ) or
the second half of the day ( ). B, ATP substrate saturation curves of AGPase from
Arabidopsis leaves harvested at the end of the day ( , ) and end of the night ( , )
assayed in presence of no ( , ) or 3 mM 3PGA ( , ) and 1.5 mM G1P. C, Lineweaver-
Burk presentation of the data in B. D, The activation factor by 3 mM 3PGA compared with 0
mM 3PGA for the day ( ) and the night sample ( ). Leaves were taken from 8-week-old
plants.
3.1.3. Rapid Changes in AGPB Dimerisation as a
Response to Light/Dark Transitions
There are two possible explanations for the observed changes: the appearance of
AGPB monomer during the day in leaves could be due to illumination or it could be
an indirect effect of, for example, increased sugars levels in leaves in the light, in
analogy to the situation in potato tubers (Tiessen et al., 2002). To check if there are
rapid light-dependent changes in AGPB monomerisation, we darkened pre-
illuminated Arabidopsis plants. This treatment was chosen because it leads to an
abrupt change in photosynthesis, whereas illumination leads only to slow changes
due to the need to induce photosynthesis and increase stomatal conductance.
Arabidopsis plants were illuminated for 6.5 h, samples were taken in the light, the
remaining plants were darkened, and samples taken after 6, 15, and 60 minutes. In
the light, a small proportion of AGPB was monomerised (Fig. 6 A; see also Fig. 3).
After darkening, the monomer decreased within 6 min and almost totally vanished
within 15 minutes. Sugar levels were measured in the same leaf material (Fig. 6 B).
There were no significant changes in sucrose, glucose and fructose levels in the first
6 min and only small changes after 60 minutes of darkening.
day 60 156
minutes of darkness
A
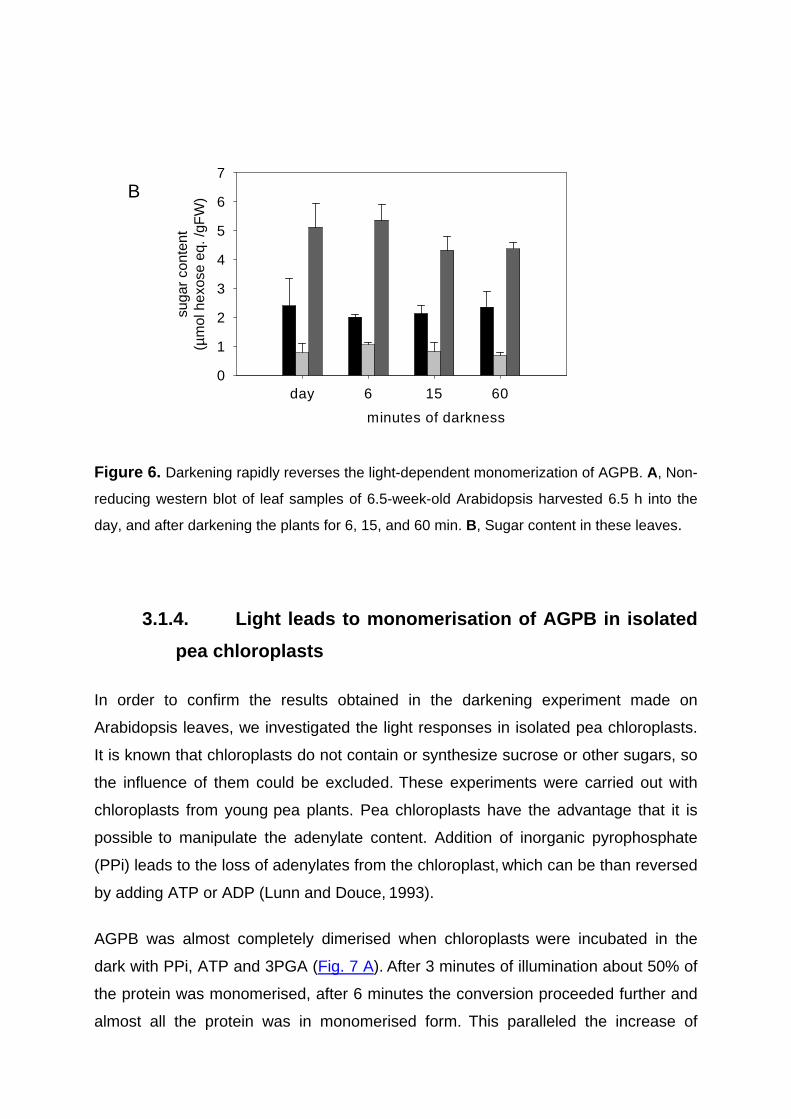
Figure 6. Darkening rapidly reverses the light-dependent monomerization of AGPB. A, Non-
reducing western blot of leaf samples of 6.5-week-old Arabidopsis harvested 6.5 h into the
day, and after darkening the plants for 6, 15, and 60 min. B, Sugar content in these leaves.
3.1.4. Light leads to monomerisation of AGPB in isolated
pea chloroplasts
In order to confirm the results obtained in the darkening experiment made on
Arabidopsis leaves, we investigated the light responses in isolated pea chloroplasts.
It is known that chloroplasts do not contain or synthesize sucrose or other sugars, so
the influence of them could be excluded. These experiments were carried out with
chloroplasts from young pea plants. Pea chloroplasts have the advantage that it is
possible to manipulate the adenylate content. Addition of inorganic pyrophosphate
(PPi) leads to the loss of adenylates from the chloroplast, which can be than reversed
by adding ATP or ADP (Lunn and Douce, 1993).
AGPB was almost completely dimerised when chloroplasts were incubated in the
dark with PPi, ATP and 3PGA (Fig. 7 A). After 3 minutes of illumination about 50% of
the protein was monomerised, after 6 minutes the conversion proceeded further and
almost all the protein was in monomerised form. This paralleled the increase of
minutes of darkness
day 6 15 60
suga
r co
nten
t(µ
mol
hex
ose
eq. /
gFW
)
0
1
2
3
4
5
6
7B
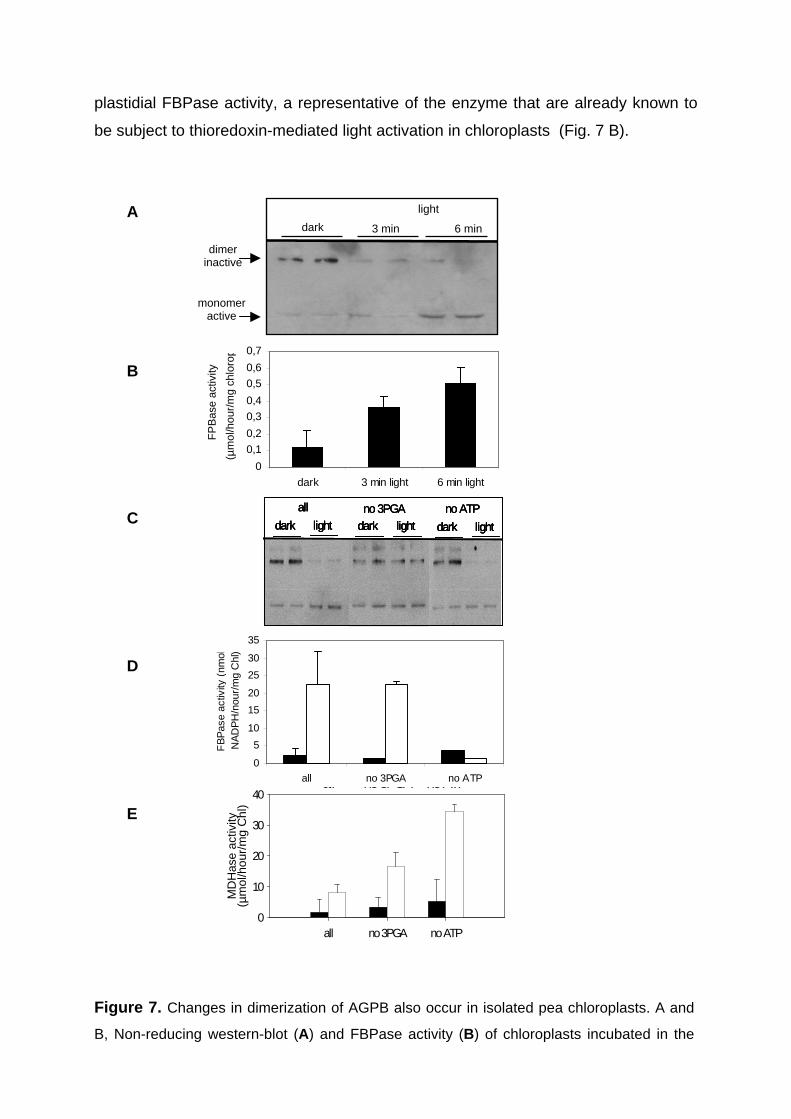
plastidial FBPase activity, a representative of the enzyme that are already known to
be subject to thioredoxin-mediated light activation in chloroplasts (Fig. 7 B).
Figure 7. Changes in dimerization of AGPB also occur in isolated pea chloroplasts. A and
B, Non-reducing western-blot (A) and FBPase activity (B) of chloroplasts incubated in the
dark 3 min
light
dimer inactive
monomer active
6 min
0
0,1
0,2
0,3
0,4
0,5
0,6
0,7
dark 3 min light 6 min light
FP
Bas
e ac
tivity
(µ
mol
/hou
r/m
g ch
loro
phyl
l)
0
5
10
15
20
25
30
35
all no 3PGA no ATP
FB
Pas
e ac
tivity
(nm
ol
NA
DP
H/n
our/
mg
Chl
)
A
B
D
no 3PGA no ATPall
dark light dark light dark light
no 3PGA no ATPall
dark light dark light dark light
no 3PGA no ATPall
dark lightdark light dark lightdark light dark lightdark light
E
C
all no 3PGA no ATP
all no 3PGA no ATP
MD
Has
e ac
tivity
(µm
ol/h
our/
mg
Chl
)
0
10
20
30
40
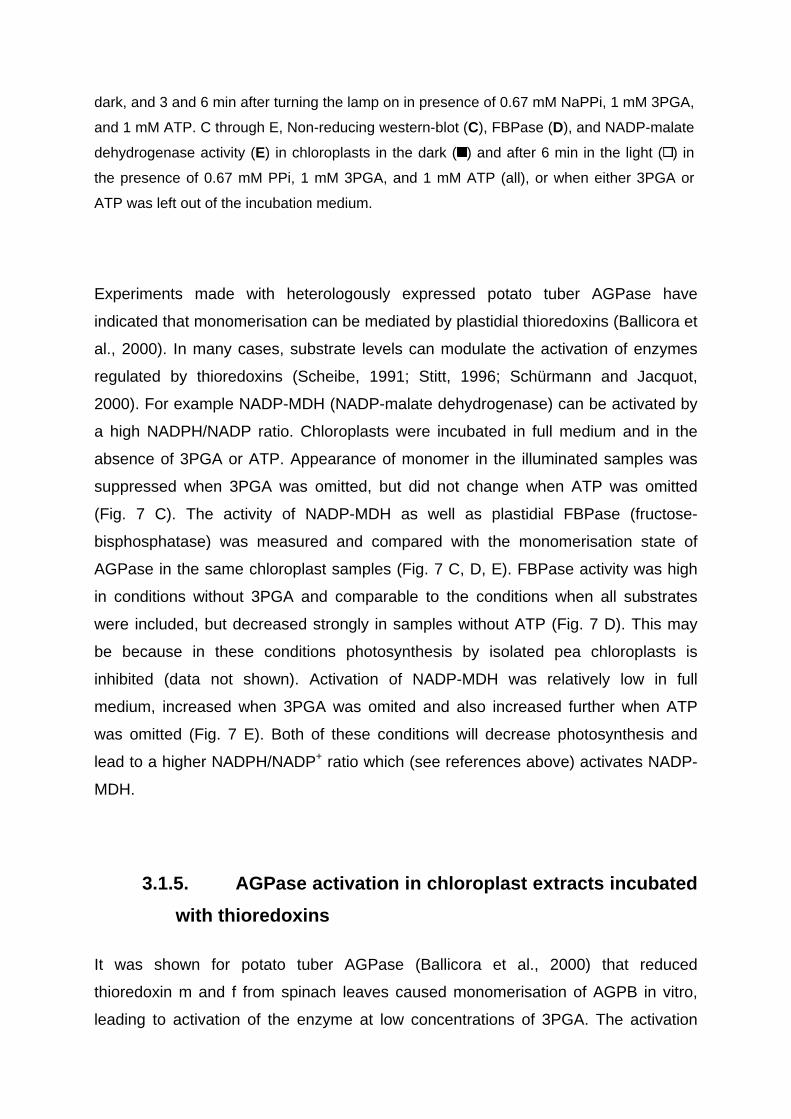
dark, and 3 and 6 min after turning the lamp on in presence of 0.67 mM NaPPi, 1 mM 3PGA,
and 1 mM ATP. C through E, Non-reducing western-blot (C), FBPase (D), and NADP-malate
dehydrogenase activity (E) in chloroplasts in the dark ( ) and after 6 min in the light ( ) in
the presence of 0.67 mM PPi, 1 mM 3PGA, and 1 mM ATP (all), or when either 3PGA or
ATP was left out of the incubation medium.
Experiments made with heterologously expressed potato tuber AGPase have
indicated that monomerisation can be mediated by plastidial thioredoxins (Ballicora et
al., 2000). In many cases, substrate levels can modulate the activation of enzymes
regulated by thioredoxins (Scheibe, 1991; Stitt, 1996; Schürmann and Jacquot,
2000). For example NADP-MDH (NADP-malate dehydrogenase) can be activated by
a high NADPH/NADP ratio. Chloroplasts were incubated in full medium and in the
absence of 3PGA or ATP. Appearance of monomer in the illuminated samples was
suppressed when 3PGA was omitted, but did not change when ATP was omitted
(Fig. 7 C). The activity of NADP-MDH as well as plastidial FBPase (fructose-
bisphosphatase) was measured and compared with the monomerisation state of
AGPase in the same chloroplast samples (Fig. 7 C, D, E). FBPase activity was high
in conditions without 3PGA and comparable to the conditions when all substrates
were included, but decreased strongly in samples without ATP (Fig. 7 D). This may
be because in these conditions photosynthesis by isolated pea chloroplasts is
inhibited (data not shown). Activation of NADP-MDH was relatively low in full
medium, increased when 3PGA was omited and also increased further when ATP
was omitted (Fig. 7 E). Both of these conditions will decrease photosynthesis and
lead to a higher NADPH/NADP+ ratio which (see references above) activates NADP-
MDH.
3.1.5. AGPase activation in chloroplast extracts incubated
with thioredoxins
It was shown for potato tuber AGPase (Ballicora et al., 2000) that reduced
thioredoxin m and f from spinach leaves caused monomerisation of AGPB in vitro,
leading to activation of the enzyme at low concentrations of 3PGA. The activation
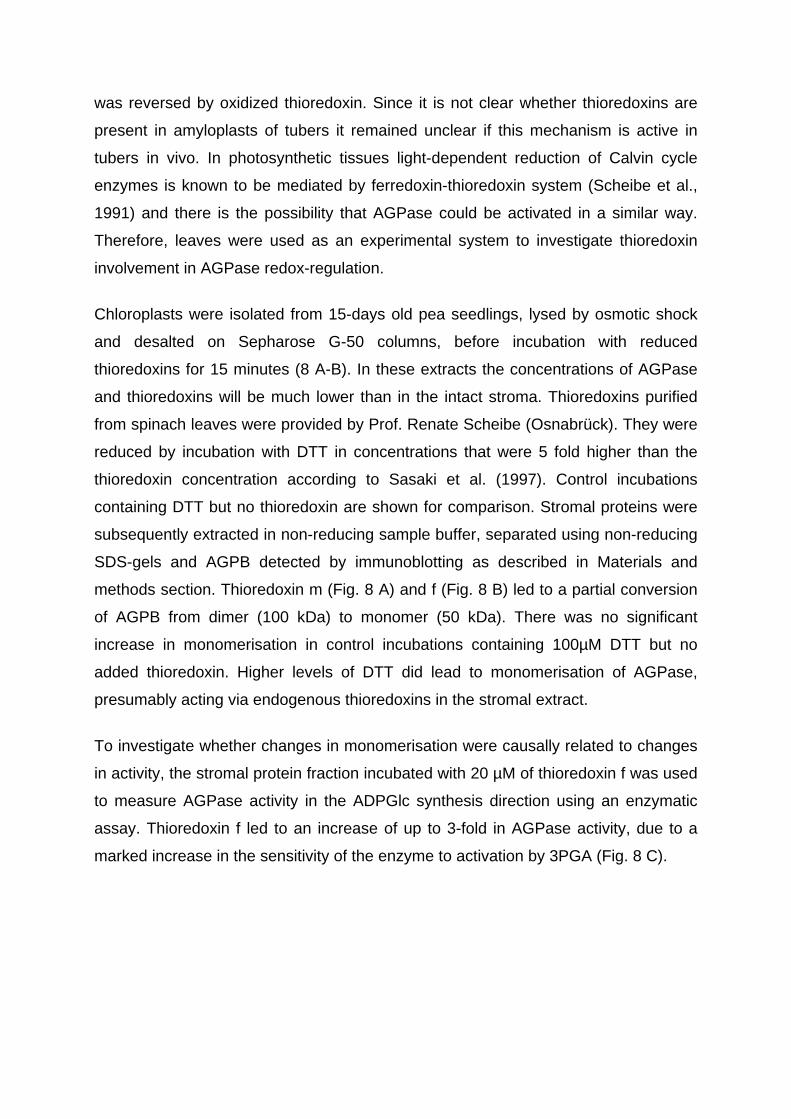
was reversed by oxidized thioredoxin. Since it is not clear whether thioredoxins are
present in amyloplasts of tubers it remained unclear if this mechanism is active in
tubers in vivo. In photosynthetic tissues light-dependent reduction of Calvin cycle
enzymes is known to be mediated by ferredoxin-thioredoxin system (Scheibe et al.,
1991) and there is the possibility that AGPase could be activated in a similar way.
Therefore, leaves were used as an experimental system to investigate thioredoxin
involvement in AGPase redox-regulation.
Chloroplasts were isolated from 15-days old pea seedlings, lysed by osmotic shock
and desalted on Sepharose G-50 columns, before incubation with reduced
thioredoxins for 15 minutes (8 A-B). In these extracts the concentrations of AGPase
and thioredoxins will be much lower than in the intact stroma. Thioredoxins purified
from spinach leaves were provided by Prof. Renate Scheibe (Osnabrück). They were
reduced by incubation with DTT in concentrations that were 5 fold higher than the
thioredoxin concentration according to Sasaki et al. (1997). Control incubations
containing DTT but no thioredoxin are shown for comparison. Stromal proteins were
subsequently extracted in non-reducing sample buffer, separated using non-reducing
SDS-gels and AGPB detected by immunoblotting as described in Materials and
methods section. Thioredoxin m (Fig. 8 A) and f (Fig. 8 B) led to a partial conversion
of AGPB from dimer (100 kDa) to monomer (50 kDa). There was no significant
increase in monomerisation in control incubations containing 100µM DTT but no
added thioredoxin. Higher levels of DTT did lead to monomerisation of AGPase,
presumably acting via endogenous thioredoxins in the stromal extract.
To investigate whether changes in monomerisation were causally related to changes
in activity, the stromal protein fraction incubated with 20 µM of thioredoxin f was used
to measure AGPase activity in the ADPGlc synthesis direction using an enzymatic
assay. Thioredoxin f led to an increase of up to 3-fold in AGPase activity, due to a
marked increase in the sensitivity of the enzyme to activation by 3PGA (Fig. 8 C).
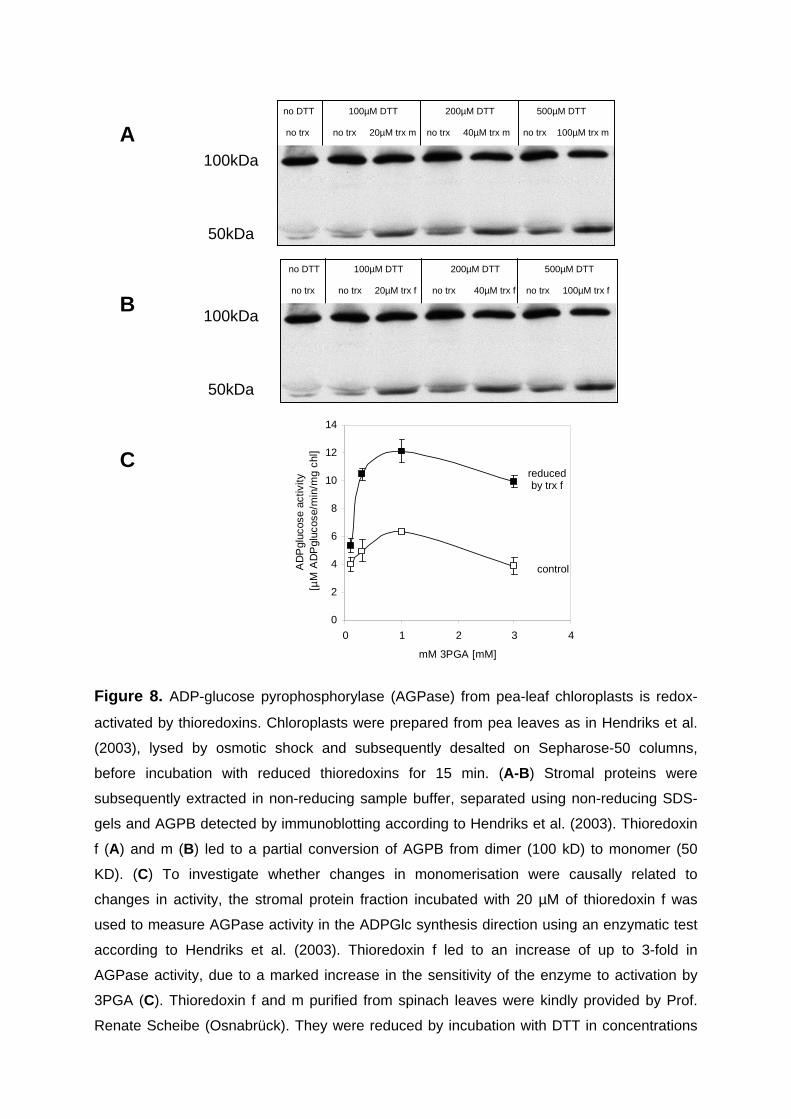
Figure 8. ADP-glucose pyrophosphorylase (AGPase) from pea-leaf chloroplasts is redox-
activated by thioredoxins. Chloroplasts were prepared from pea leaves as in Hendriks et al.
(2003), lysed by osmotic shock and subsequently desalted on Sepharose-50 columns,
before incubation with reduced thioredoxins for 15 min. (A-B ) Stromal proteins were
subsequently extracted in non-reducing sample buffer, separated using non-reducing SDS-
gels and AGPB detected by immunoblotting according to Hendriks et al. (2003). Thioredoxin
f (A) and m (B) led to a partial conversion of AGPB from dimer (100 kD) to monomer (50
KD). (C) To investigate whether changes in monomerisation were causally related to
changes in activity, the stromal protein fraction incubated with 20 µM of thioredoxin f was
used to measure AGPase activity in the ADPGlc synthesis direction using an enzymatic test
according to Hendriks et al. (2003). Thioredoxin f led to an increase of up to 3-fold in
AGPase activity, due to a marked increase in the sensitivity of the enzyme to activation by
3PGA (C). Thioredoxin f and m purified from spinach leaves were kindly provided by Prof.
Renate Scheibe (Osnabrück). They were reduced by incubation with DTT in concentrations
0
2
4
6
8
10
12
14
0 1 2 3 4
mM 3PGA [mM]
AD
Pgl
ucos
e ac
tivity
[µ
M A
DP
gluc
ose/
min
/mg
chl]
reduced by trx f
control
100kDa 50kDa
A
100kDa 50kDa
B
C
no DTT 100µM DTT 200µM DTT 500µM DTT no trx no trx 20µM trx m no trx 40µM trx m no trx 100µM trx m
no DTT 100µM DTT 200µM DTT 500µM DTT no trx no trx 20µM trx f no trx 40µM trx f no trx 100µM trx f
that were 5 fold higher than the thioredoxin concentration according to Sasaki et al. (1997).
Control incubations containing DTT but no thioredoxin are shown for comparison.
3.1.6. Conclusions
The results provide evidence that AGPase is subject to posttranslational redox
regulation in leaves in vivo. This involves reversible interconversion between a less
active form in which AGPB is present as a dimer and an active form in which AGPB
exists as monomers. The shift from dimer to a monomer is mediated by thioredoxins
and accompanied by an increase in AGPase activity. The increase of AGPase
activity involved a change in the kinetic properties, including increased affinity for
ATP and altered sensitivity to regulation by 3PGA. AGPase is redox-activated in
response to a light-dependent signal. Evidence for this is provided by two
independent experiments: First, AGPB monomerisation decreases rapidly after
darkening of wild type plants even though sugar levels do not change and second
AGPB monomerisation increases rapidly after illumination of isolated chloroplasts.
3.2. AGPase is activated by posttranslational redox -
modification in response to sugars in leaves
While the experiments presented above show that light leads to monomerisation and
activation of leaf AGPase, in the next set of experiments it was asked whether sugars
can also increase AGPB monomerisation and whether they can act as an
independent signal. To manipulate sugar levels in the leaf tissue, short and long term
incubations of Arabidopsis leaves in different sugars solutions in the dark were
performed. To investigate candidate components that may link reductive activation of
AGPase to sugars, leaves of transgenic Arabidopsis plants with increased and
decreased T6P contents were analysed. It was shown by Schluepmann et al. (2003)
that the metabolic precursor of trehalose, T6P (trehalose 6-phosphate), is essential
for the regulation of sugar utilization in Arabidopsis but the sites of action remained
unresolved. To provide further evidence for the involvement of T6P in AGPase redox-
modification, chloroplasts from pea leaves were isolated and incubated with T6P and
a variety of other metabolites.
3.2.1. Supplying sugars to leaves during the night leads
to conversion of AGPB from a dimer to a monomer and to
increased rates of starch synthesis
Leaves from 8-week-old Arabidopsis plants were fed via their petioles with buffer and
varying concentrations of sucrose in the dark during their natural night (0, 50, 100,
and 200 mM). For comparison, leaves harvested from intact plants at the start (end of
day [ED]) and at the end of the experiment (end of night [EN]) are also presented
(Fig. 9).
Western blot in non-reducing conditions shows that AGPB is converted into the
monomeric form by supplying sugars to leaves in the dark. The proportion of AGPB
converted to monomer in response to sucrose feeding in the dark was similar to that
seen in the light under normal growth conditions. In the leaf extracts from the end of
the night and in leaves incubated in buffer without sucrose, AGPB was almost
completely dimerised (Fig. 9 A).
Sucrose feeding led to a progressive increase in sugars levels (Fig. 9 B), but 3PGA
remained unaltered (Fig. 9 E). There was also an increase of starch levels (Fig. 9 C).
This might be due to stimulation of starch synthesis or to slower breakdown of starch
during the 13-h dark treatment. To measure the rate of starch synthesis, the
unlabeled sucrose was spiked with high specific activity [14C]-glucose. The rate of
starch synthesis was calculated by dividing the label incorporated into starch by the
specific activity of the hexose phosphate pool (for a detailed discussion of this
approach, see Geigenberger et al., 1997; and Materials and methods section).
Sucrose feeding led to a concentration-dependent stimulation of starch synthesis in
the dark (Fig. 9 D).
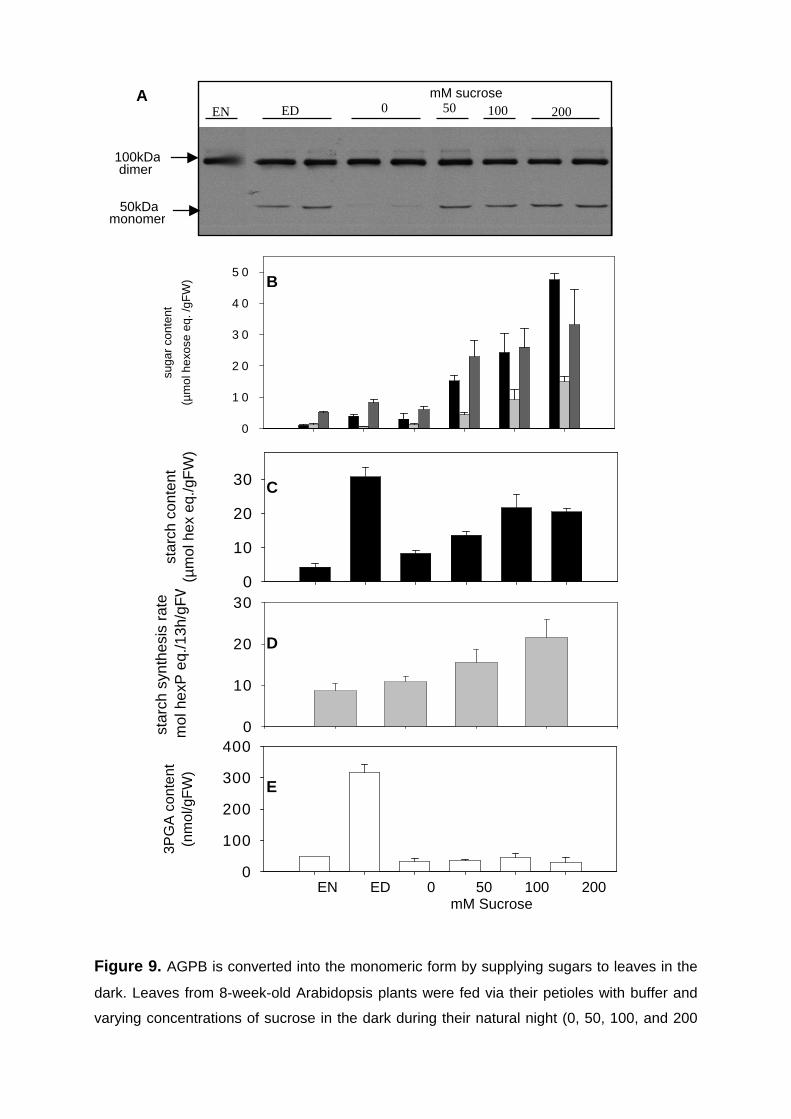
Figure 9. AGPB is converted into the monomeric form by supplying sugars to leaves in the
dark. Leaves from 8-week-old Arabidopsis plants were fed via their petioles with buffer and
varying concentrations of sucrose in the dark during their natural night (0, 50, 100, and 200
200 100 0 mM sucrose
ED EN 50
100kDa
50kDa
dimer
monomer
suga
r co
nten
t
(µm
ol h
exos
e eq
. /gF
W)
0
1 0
2 0
3 0
4 0
5 0
4 0 0
mM sucrose
EN ED 0 50 100 2000
3PG
A c
onte
nt(n
mol
/gF
W)
0
100
200
300
400
EN ED 0 50 100 200 mM Sucrose
mM sucrose
0 10 50 100
star
ch s
ynth
esis
rat
e(µ
mol
hex
P e
q./1
3h/g
FW
)
0
10
20
30
star
ch c
onte
nt(µ
mol
hex
eq.
/gF
W)
0
10
20
30
E
D
C
B
A
mM). For comparison, leaves harvested from intact plants at the start (end of day [ED]) and
at the end of the experiment (end of night [EN]) are also shown. A, Non-reducing western
blot of AGPB; B, sugar content; C, starch content; D, In parallel incubations, high specific [U-14C]-glucose was supplied together with the various concentrations of unlabeled sucrose, to
investigate the rate of starch synthesis. E, 3PGA content.
Further evidence showing that sugars increase monomerisation of AGPB was
provided by Janneke Hendriks (Hendriks et al., 2003), who carried out a set of
experiments comparing diurnal changes in wild-type Col 0 and the pgm mutant
(Caspar et al., 1986). Obtained results are shown in Appendix (Fig. 36, 37).
3.2.2. Short-term feeding of sucrose or trehalose to leaf
discs leads to increased AGPB monomerisation without
affecting hexose-P levels and NADPH/NADP+ ratio
A time-course of the effect of sucrose feeding on AGPB monomerisation using leaf
discs in the dark was investigated. Discs were also incubated with sorbitol or
trehalose as further controls, since both of these sugars are not metabolised to
starch. .
Arabidopsis leaves were harvested at the end of the night and discs incubated in
media containing 100mM sorbitol, 100 mM sucrose or 100 mM trehalose for 15, 30
minutes and 3 hours (Fig. 10). In discs from leaves sampled at the end of the night
and incubated with sorbitol as osmotic control, AGPB was completely dimerised (Fig.
10 A) and sucrose and starch were relatively low (Fig. 10 B). Sucrose feeding led to
partial monomerisation of AGPB (Fig. 10 I) and increased starch content after 3
hours (Fig. 10 J) without changing the glucose 6-phosphate level (Fig. 10 K).
Surprisingly, trehalose incubation resulted in similar but even more rapid changes in
AGPB monomerisation and starch accumulation as observed after sucrose feeding.
AGPB monomers were visible already after 15 minutes (Fig. 10 A) and increased
further during the course of the experiment. Trehalose led to a significant increase in
starch levels within 30 min which increased further in the next 2.5 h. Crucially, this
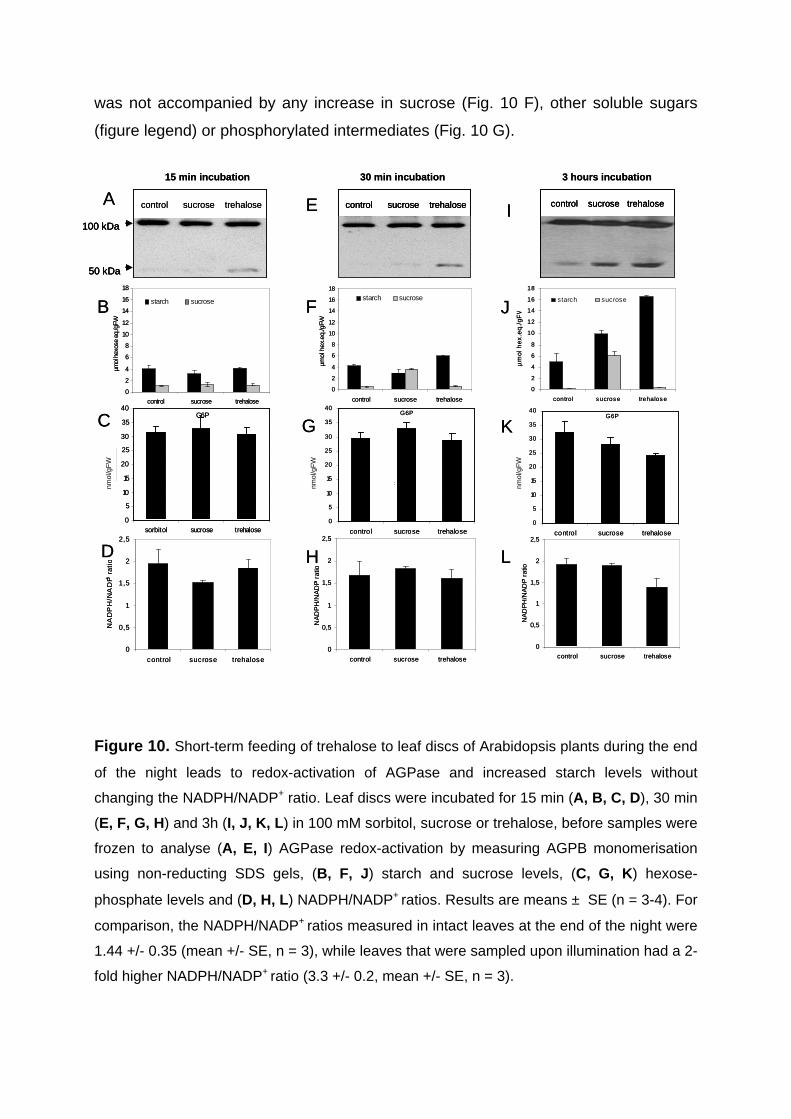
was not accompanied by any increase in sucrose (Fig. 10 F), other soluble sugars
(figure legend) or phosphorylated intermediates (Fig. 10 G).
Figure 10. Short-term feeding of trehalose to leaf discs of Arabidopsis plants during the end
of the night leads to redox-activation of AGPase and increased starch levels without
changing the NADPH/NADP+ ratio. Leaf discs were incubated for 15 min (A, B, C, D ), 30 min
(E, F, G, H) and 3h (I, J, K, L ) in 100 mM sorbitol, sucrose or trehalose, before samples were
frozen to analyse (A, E, I) AGPase redox-activation by measuring AGPB monomerisation
using non-reducting SDS gels, (B, F, J ) starch and sucrose levels, (C, G, K) hexose-
phosphate levels and (D, H, L) NADPH/NADP+ ratios. Results are means ± SE (n = 3-4). For
comparison, the NADPH/NADP+ ratios measured in intact leaves at the end of the night were
1.44 +/- 0.35 (mean +/- SE, n = 3), while leaves that were sampled upon illumination had a 2-
fold higher NADPH/NADP+ ratio (3.3 +/- 0.2, mean +/- SE, n = 3).
100 kDa
50 kDa
30 min incubation
control sucrose trehalose control sucrose trehalose
3 hours incubation
A
B
E
F
C
0
2
4
6
8
10
12
14
16
18
control sucrose trehalose
µm
ol
he
x.e
q./
gF
W
starch sucrose
0
2
4
6
8
10
12
14
16
18
control sucrose trehalose
µmol
hex
.eq.
/gFW
starch sucrose
0
0,5
1
1,5
2
2,5
control sucrose trehalose
NA
DP
H/N
AD
P + ra
tio
0
0,5
1
1,5
2
2,5
control sucrose trehalose
NA
DP
H/N
AD
P + ra
tio
GG6P
0
5
10
15
20
25
30
35
40
contro l sucrose trehalose
7
G6P
0
5
10
15
20
25
30
35
40
control sucrose trehalose
HD
15 min incubation
control sucrose trehalose
J
K
H
L
I
0
0,5
1
1,5
2
2,5
control sucrose trehalose
NA
DP
H/N
AD
P
+ ra
tio
G6P
0
5
10
15
20
25
30
35
40
sorbitol sucrose trehalose
0
2
4
6
8
10
12
14
16
18
control sucrose trehalose
µmol
hex
ose
eq./g
FW
starch sucrose
nmol
/gF
W
nmol
/gF
W
nmol
/gF
W
100 kDa
50 kDa
100 kDa
50 kDa
30 min incubation
control sucrose trehalosecontrol sucrose trehalose control sucrose trehalosecontrol sucrose trehalose
3 hours incubation
A
B
E
F
C
0
2
4
6
8
10
12
14
16
18
control sucrose trehalose
µm
ol
he
x.e
q./
gF
W
starch sucrose
0
2
4
6
8
10
12
14
16
18
control sucrose trehalose
µmol
hex
.eq.
/gFW
starch sucrose
0
0,5
1
1,5
2
2,5
control sucrose trehalose
NA
DP
H/N
AD
P + ra
tio
0
0,5
1
1,5
2
2,5
control sucrose trehalose
NA
DP
H/N
AD
P + ra
tio
GG6P
0
5
10
15
20
25
30
35
40
contro l sucrose trehalose
7
G6P
0
5
10
15
20
25
30
35
40
control sucrose trehalose
HD
15 min incubation
control sucrose trehalose
J
K
H
L
I
0
0,5
1
1,5
2
2,5
control sucrose trehalose
NA
DP
H/N
AD
P
+ ra
tio
G6P
0
5
10
15
20
25
30
35
40
sorbitol sucrose trehalose
0
2
4
6
8
10
12
14
16
18
control sucrose trehalose
µmol
hex
ose
eq./g
FW
starch sucrose
nmol
/gF
W
nmol
/gF
W
nmol
/gF
W
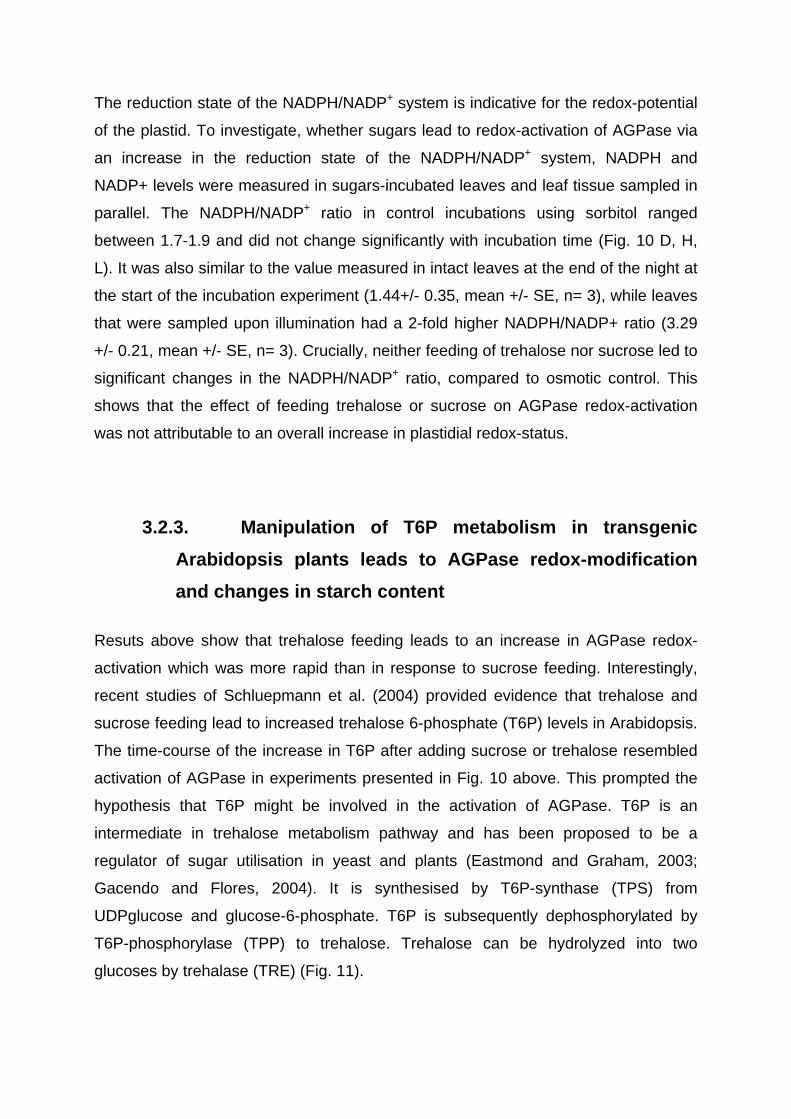
The reduction state of the NADPH/NADP+ system is indicative for the redox-potential
of the plastid. To investigate, whether sugars lead to redox-activation of AGPase via
an increase in the reduction state of the NADPH/NADP+ system, NADPH and
NADP+ levels were measured in sugars-incubated leaves and leaf tissue sampled in
parallel. The NADPH/NADP+ ratio in control incubations using sorbitol ranged
between 1.7-1.9 and did not change significantly with incubation time (Fig. 10 D, H,
L). It was also similar to the value measured in intact leaves at the end of the night at
the start of the incubation experiment (1.44+/- 0.35, mean +/- SE, n= 3), while leaves
that were sampled upon illumination had a 2-fold higher NADPH/NADP+ ratio (3.29
+/- 0.21, mean +/- SE, n= 3). Crucially, neither feeding of trehalose nor sucrose led to
significant changes in the NADPH/NADP+ ratio, compared to osmotic control. This
shows that the effect of feeding trehalose or sucrose on AGPase redox-activation
was not attributable to an overall increase in plastidial redox-status.
3.2.3. Manipulation of T6P metabolism in transgenic
Arabidopsis plants leads to AGPase redox-modification
and changes in starch content
Resuts above show that trehalose feeding leads to an increase in AGPase redox-
activation which was more rapid than in response to sucrose feeding. Interestingly,
recent studies of Schluepmann et al. (2004) provided evidence that trehalose and
sucrose feeding lead to increased trehalose 6-phosphate (T6P) levels in Arabidopsis.
The time-course of the increase in T6P after adding sucrose or trehalose resembled
activation of AGPase in experiments presented in Fig. 10 above. This prompted the
hypothesis that T6P might be involved in the activation of AGPase. T6P is an
intermediate in trehalose metabolism pathway and has been proposed to be a
regulator of sugar utilisation in yeast and plants (Eastmond and Graham, 2003;
Gacendo and Flores, 2004). It is synthesised by T6P-synthase (TPS) from
UDPglucose and glucose-6-phosphate. T6P is subsequently dephosphorylated by
T6P-phosphorylase (TPP) to trehalose. Trehalose can be hydrolyzed into two
glucoses by trehalase (TRE) (Fig. 11).
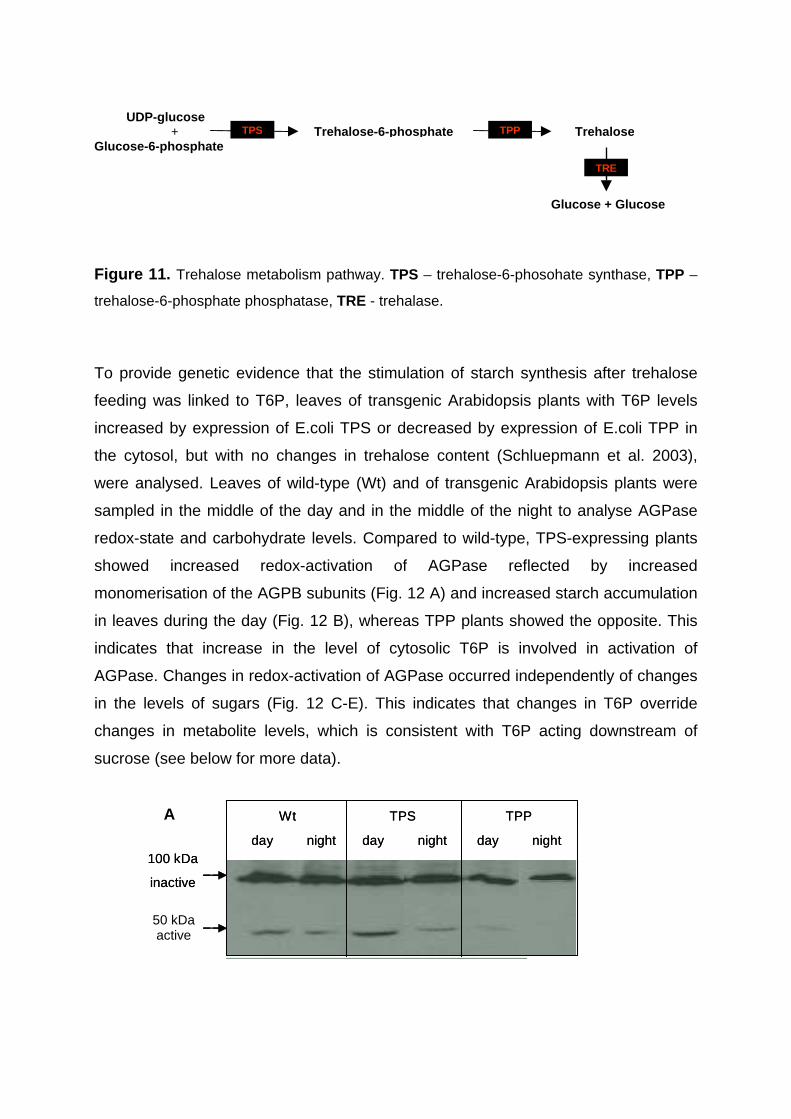
Figure 11. Trehalose metabolism pathway. TPS – trehalose-6-phosohate synthase, TPP –
trehalose-6-phosphate phosphatase, TRE - trehalase.
To provide genetic evidence that the stimulation of starch synthesis after trehalose
feeding was linked to T6P, leaves of transgenic Arabidopsis plants with T6P levels
increased by expression of E.coli TPS or decreased by expression of E.coli TPP in
the cytosol, but with no changes in trehalose content (Schluepmann et al. 2003),
were analysed. Leaves of wild-type (Wt) and of transgenic Arabidopsis plants were
sampled in the middle of the day and in the middle of the night to analyse AGPase
redox-state and carbohydrate levels. Compared to wild-type, TPS-expressing plants
showed increased redox-activation of AGPase reflected by increased
monomerisation of the AGPB subunits (Fig. 12 A) and increased starch accumulation
in leaves during the day (Fig. 12 B), whereas TPP plants showed the opposite. This
indicates that increase in the level of cytosolic T6P is involved in activation of
AGPase. Changes in redox-activation of AGPase occurred independently of changes
in the levels of sugars (Fig. 12 C-E). This indicates that changes in T6P override
changes in metabolite levels, which is consistent with T6P acting downstream of
sucrose (see below for more data).
Trehalose -6-phosphate Trehalose TPP TPS
Glucose + Glucose
TRE
UDP-glucose +
Glucose-6-phosphate
100 kDa
inactive
Wt TPS TPP
day night day night day night100 kDa
inactive
Wt TPS TPP
day night day night day night
50 kDa active
A
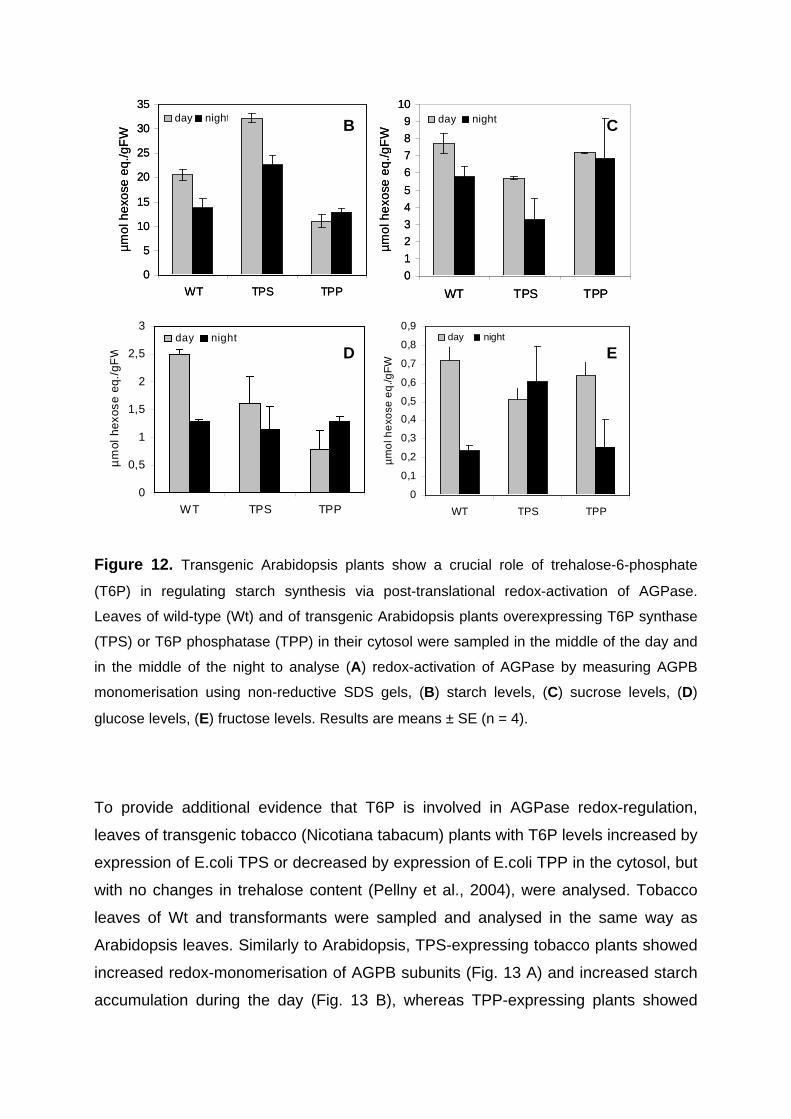
Figure 12. Transgenic Arabidopsis plants show a crucial role of trehalose-6-phosphate
(T6P) in regulating starch synthesis via post-translational redox-activation of AGPase.
Leaves of wild-type (Wt) and of transgenic Arabidopsis plants overexpressing T6P synthase
(TPS) or T6P phosphatase (TPP) in their cytosol were sampled in the middle of the day and
in the middle of the night to analyse (A) redox-activation of AGPase by measuring AGPB
monomerisation using non-reductive SDS gels, (B) starch levels, (C) sucrose levels, (D)
glucose levels, (E) fructose levels. Results are means ± SE (n = 4).
To provide additional evidence that T6P is involved in AGPase redox-regulation,
leaves of transgenic tobacco (Nicotiana tabacum) plants with T6P levels increased by
expression of E.coli TPS or decreased by expression of E.coli TPP in the cytosol, but
with no changes in trehalose content (Pellny et al., 2004), were analysed. Tobacco
leaves of Wt and transformants were sampled and analysed in the same way as
Arabidopsis leaves. Similarly to Arabidopsis, TPS-expressing tobacco plants showed
increased redox-monomerisation of AGPB subunits (Fig. 13 A) and increased starch
accumulation during the day (Fig. 13 B), whereas TPP-expressing plants showed
0
5
10
15
20
25
30
35
WT TPS TPP
µm
ol h
exos
e eq
./gF
Wday night
0
1
2
3
4
5
6
7
8
9
10
WT TPS TPP
µm
ol h
exos
e eq
./gF
W
day night
0
0,5
1
1,5
2
2,5
3
WT TPS TPP
µm
ol h
exos
e eq
./gF
W
day night
0
0,1
0,2
0,3
0,4
0,5
0,6
0,7
0,8
0,9
WT TPS TPP
µm
ol h
exo
se e
q./g
FW
day night
0
5
10
15
20
25
30
35
WT TPS TPP
µm
ol h
exos
e eq
./gF
Wday night
0
1
2
3
4
5
6
7
8
9
10
WT TPS TPP
µm
ol h
exos
e eq
./gF
W
day night
0
0,5
1
1,5
2
2,5
3
WT TPS TPP
µm
ol h
exos
e eq
./gF
W
day night
0
0,1
0,2
0,3
0,4
0,5
0,6
0,7
0,8
0,9
WT TPS TPP
µm
ol h
exo
se e
q./g
FW
day night
B C
D E
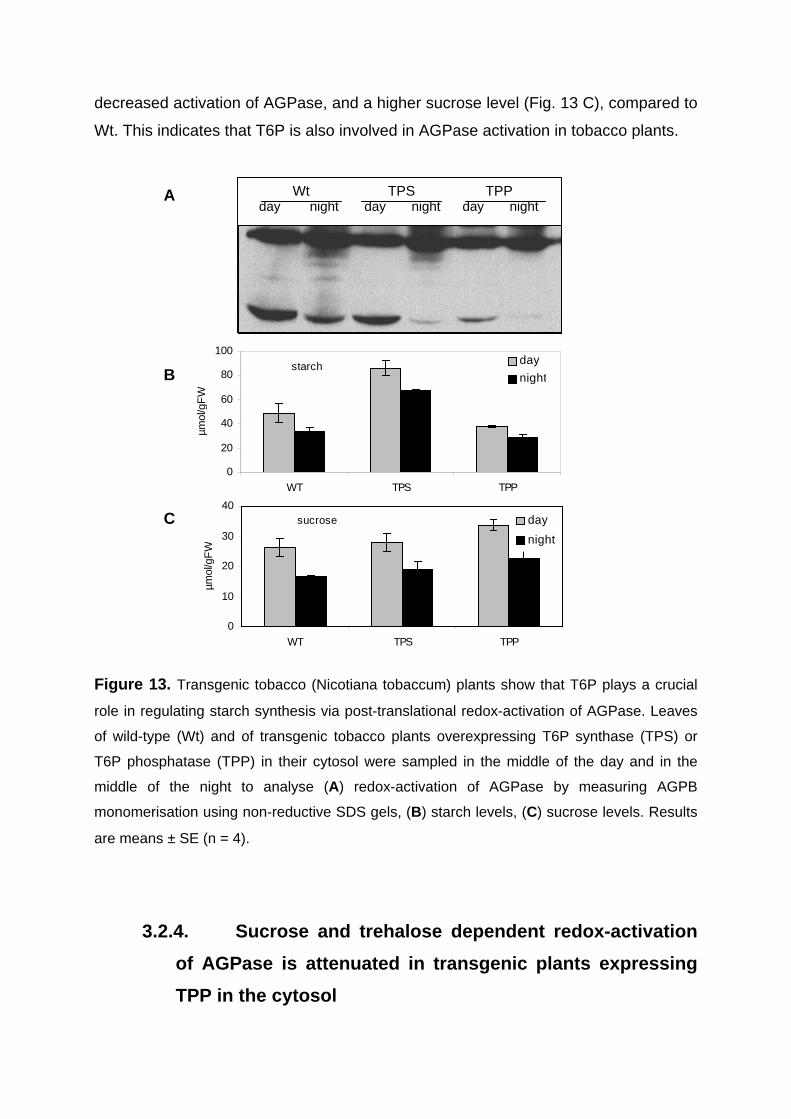
decreased activation of AGPase, and a higher sucrose level (Fig. 13 C), compared to
Wt. This indicates that T6P is also involved in AGPase activation in tobacco plants.
Figure 13. Transgenic tobacco (Nicotiana tobaccum) plants show that T6P plays a crucial
role in regulating starch synthesis via post-translational redox-activation of AGPase. Leaves
of wild-type (Wt) and of transgenic tobacco plants overexpressing T6P synthase (TPS) or
T6P phosphatase (TPP) in their cytosol were sampled in the middle of the day and in the
middle of the night to analyse (A) redox-activation of AGPase by measuring AGPB
monomerisation using non-reductive SDS gels, (B) starch levels, (C) sucrose levels. Results
are means ± SE (n = 4).
3.2.4. Sucrose and trehalose dependent redox-activation
of AGPase is attenuated in transgenic plants expressing
TPP in the cytosol
Wt TPS TPP day night day night day night
starch
0
20
40
60
80
100
WT TPS TPP
µmol
/gF
W
day
night
sucrose
0
10
20
30
40
WT TPS TPP
µmol
/gF
W
day
night
A
B
C
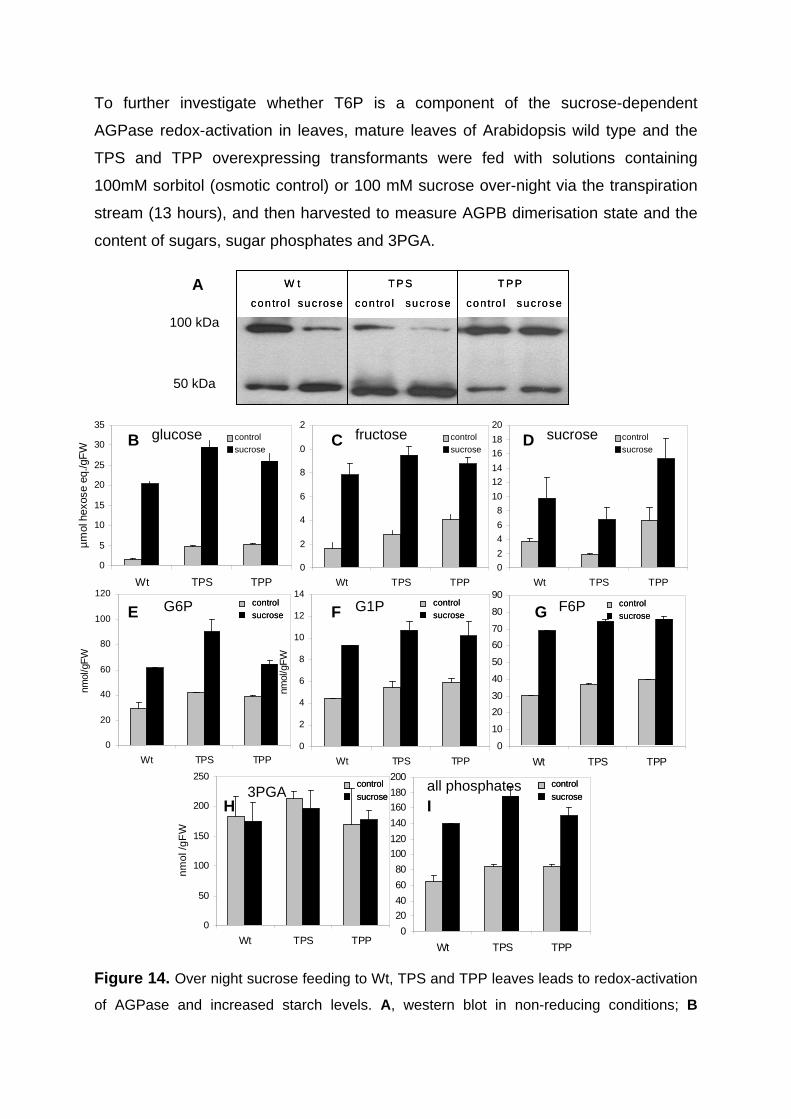
To further investigate whether T6P is a component of the sucrose-dependent
AGPase redox-activation in leaves, mature leaves of Arabidopsis wild type and the
TPS and TPP overexpressing transformants were fed with solutions containing
100mM sorbitol (osmotic control) or 100 mM sucrose over-night via the transpiration
stream (13 hours), and then harvested to measure AGPB dimerisation state and the
content of sugars, sugar phosphates and 3PGA.
Figure 14. Over night sucrose feeding to Wt, TPS and TPP leaves leads to redox-activation
of AGPase and increased starch levels. A, western blot in non-reducing conditions; B
0
2
4
6
8
10
12
14
16
18
20
Wt TPS TPP
µm
ol h
exos
e eq
./gF
W
0
2
4
6
8
10
12
Wt TPS TPP
µm
ol h
exos
e eq
./gF
W
0
5
10
15
20
25
30
35
Wt TPS TPP
µm
ol h
exos
e eq
./gF
W
controlsucrose
controlsucrose
controlsucrose
W t T P S T P P
con tro l suc rose con tro l suc rose contro l sucrose
W t T P S T P P
con tro l suc rose con tro l suc rose contro l sucrose
100 kDa
50 kDa
A
0
10
20
30
40
50
60
70
80
90
Wt TPS TPP
nmol
/gF
W
0
20
40
60
80
100
120
Wt TPS TPP
nmol
/gF
W
0
2
4
6
8
10
12
14
Wt TPS TPP
nmol
/gF
W
controlsucrosecontrolsucrose
controlsucrosecontrolsucrose
controlsucrosecontrolsucrose
0
20
40
60
80
100
120
140
160
180
200
Wt TPS TPP
nmol
/gF
W
0
50
100
150
200
250
Wt TPS TPP
nmol
/gF
W
controlsucrosecontrolsucrose
controlsucrosecontrolsucrose
D C B
E G F
I H
glucose sucrose fructose
F6P G1P G6P
3PGA all phosphates
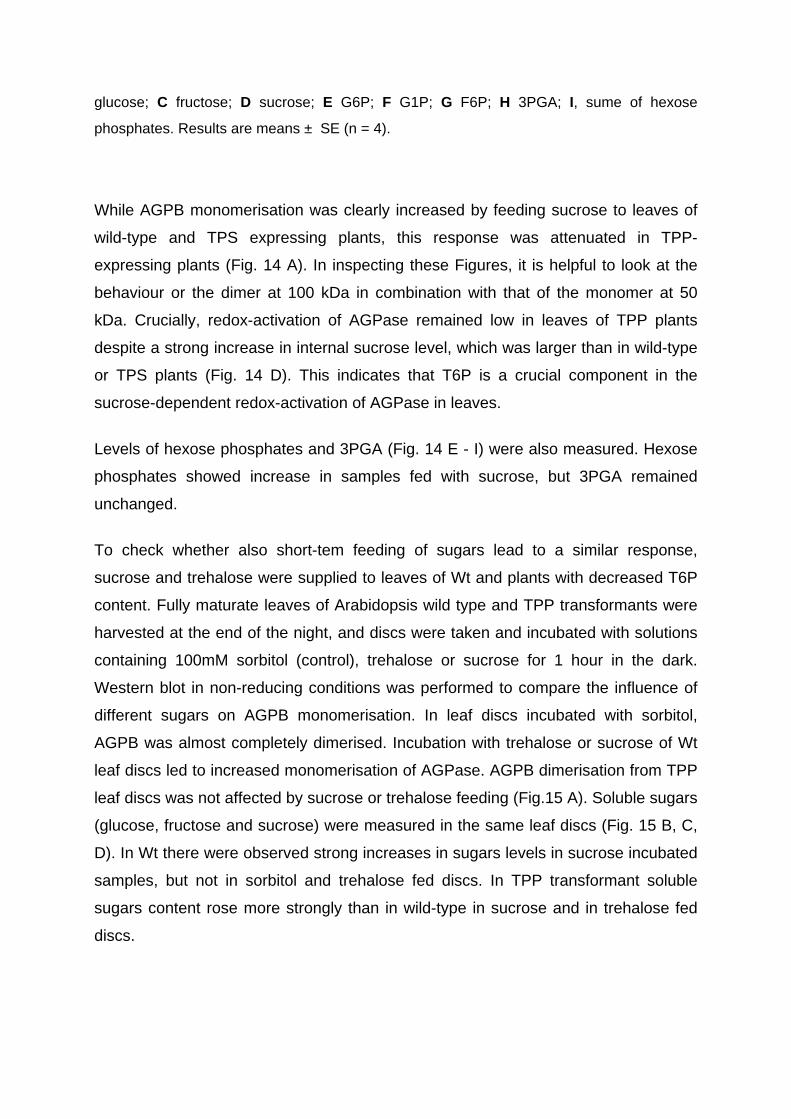
glucose; C fructose; D sucrose; E G6P; F G1P; G F6P; H 3PGA; I, sume of hexose
phosphates. Results are means ± SE (n = 4).
While AGPB monomerisation was clearly increased by feeding sucrose to leaves of
wild-type and TPS expressing plants, this response was attenuated in TPP-
expressing plants (Fig. 14 A). In inspecting these Figures, it is helpful to look at the
behaviour or the dimer at 100 kDa in combination with that of the monomer at 50
kDa. Crucially, redox-activation of AGPase remained low in leaves of TPP plants
despite a strong increase in internal sucrose level, which was larger than in wild-type
or TPS plants (Fig. 14 D). This indicates that T6P is a crucial component in the
sucrose-dependent redox-activation of AGPase in leaves.
Levels of hexose phosphates and 3PGA (Fig. 14 E - I) were also measured. Hexose
phosphates showed increase in samples fed with sucrose, but 3PGA remained
unchanged.
To check whether also short-tem feeding of sugars lead to a similar response,
sucrose and trehalose were supplied to leaves of Wt and plants with decreased T6P
content. Fully maturate leaves of Arabidopsis wild type and TPP transformants were
harvested at the end of the night, and discs were taken and incubated with solutions
containing 100mM sorbitol (control), trehalose or sucrose for 1 hour in the dark.
Western blot in non-reducing conditions was performed to compare the influence of
different sugars on AGPB monomerisation. In leaf discs incubated with sorbitol,
AGPB was almost completely dimerised. Incubation with trehalose or sucrose of Wt
leaf discs led to increased monomerisation of AGPase. AGPB dimerisation from TPP
leaf discs was not affected by sucrose or trehalose feeding (Fig.15 A). Soluble sugars
(glucose, fructose and sucrose) were measured in the same leaf discs (Fig. 15 B, C,
D). In Wt there were observed strong increases in sugars levels in sucrose incubated
samples, but not in sorbitol and trehalose fed discs. In TPP transformant soluble
sugars content rose more strongly than in wild-type in sucrose and in trehalose fed
discs.
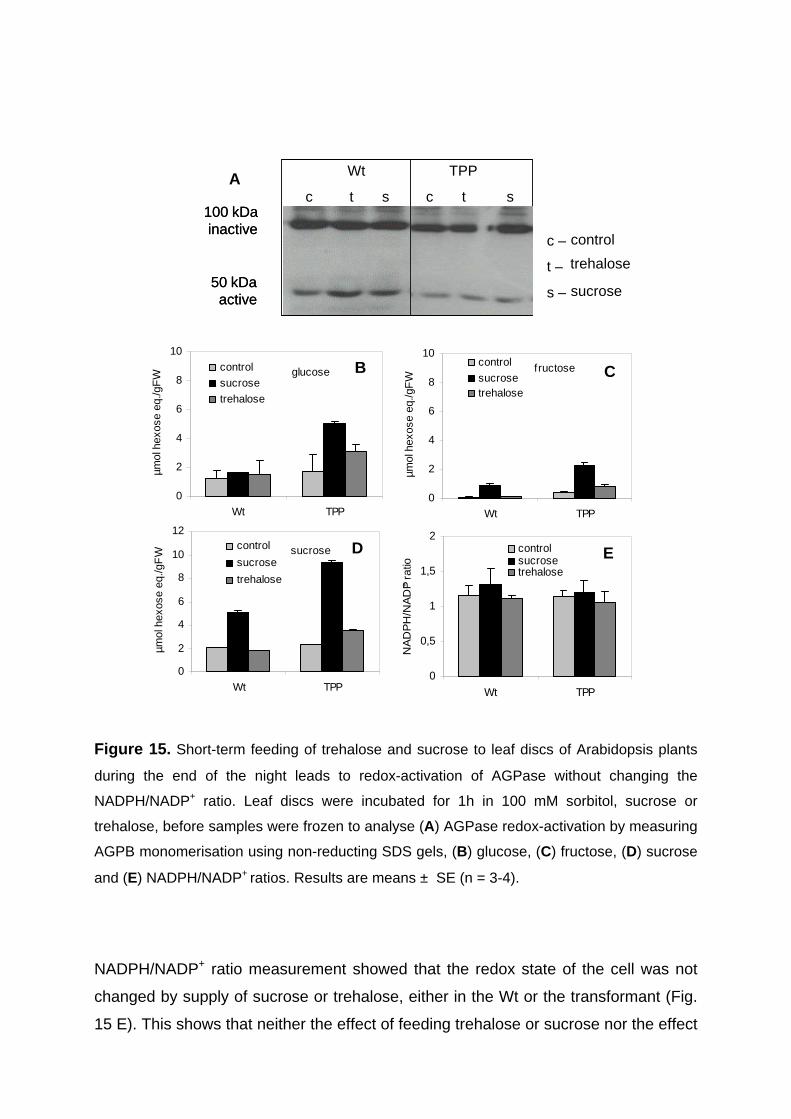
Figure 15. Short-term feeding of trehalose and sucrose to leaf discs of Arabidopsis plants
during the end of the night leads to redox-activation of AGPase without changing the
NADPH/NADP+ ratio. Leaf discs were incubated for 1h in 100 mM sorbitol, sucrose or
trehalose, before samples were frozen to analyse (A) AGPase redox-activation by measuring
AGPB monomerisation using non-reducting SDS gels, (B) glucose, (C) fructose, (D) sucrose
and (E) NADPH/NADP+ ratios. Results are means ± SE (n = 3-4).
NADPH/NADP+ ratio measurement showed that the redox state of the cell was not
changed by supply of sucrose or trehalose, either in the Wt or the transformant (Fig.
15 E). This shows that neither the effect of feeding trehalose or sucrose nor the effect
glucose
0
2
4
6
8
10
Wt TPP
µmol
hex
ose
eq./g
FW
control
sucrose
trehalose
fructose
0
2
4
6
8
10
Wt TPP
µmol
hex
ose
eq./g
FW
control
sucrosetrehalose
sucrose
0
2
4
6
8
10
12
Wt TPP
µmol
hex
ose
eq./g
FW
control
sucrose
trehalose
0
0,5
1
1,5
2
Wt TPP
NA
DP
H/N
AD
P+ r
atio
controlsucrosetrehalose
100 kDainactive
50 kDaactive
100 kDainactive
50 kDaactive
Wt TPP
c t s c t s
c – control
t – trehalose
s – sucrose
A
B C
D E
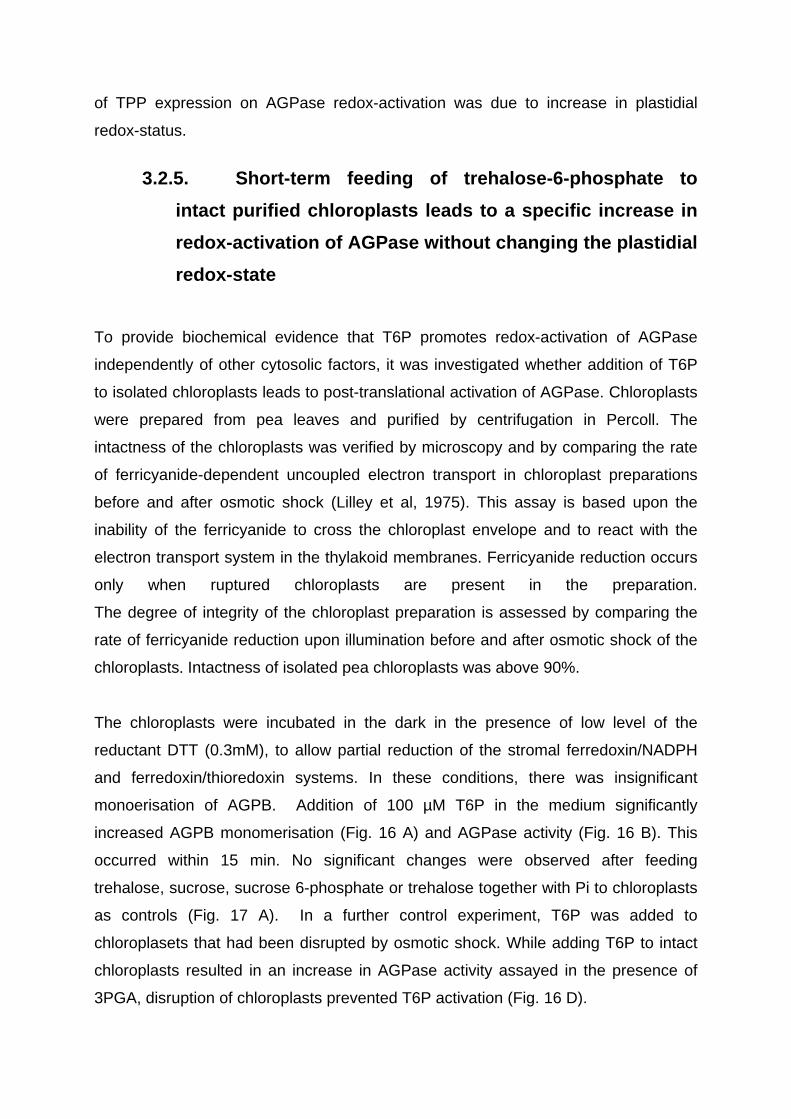
of TPP expression on AGPase redox-activation was due to increase in plastidial
redox-status.
3.2.5. Short-term feeding of trehalose-6-phosphate to
intact purified chloroplasts leads to a specific increase in
redox-activation of AGPase without changing the plastidial
redox-state
To provide biochemical evidence that T6P promotes redox-activation of AGPase
independently of other cytosolic factors, it was investigated whether addition of T6P
to isolated chloroplasts leads to post-translational activation of AGPase. Chloroplasts
were prepared from pea leaves and purified by centrifugation in Percoll. The
intactness of the chloroplasts was verified by microscopy and by comparing the rate
of ferricyanide-dependent uncoupled electron transport in chloroplast preparations
before and after osmotic shock (Lilley et al, 1975). This assay is based upon the
inability of the ferricyanide to cross the chloroplast envelope and to react with the
electron transport system in the thylakoid membranes. Ferricyanide reduction occurs
only when ruptured chloroplasts are present in the preparation.
The degree of integrity of the chloroplast preparation is assessed by comparing the
rate of ferricyanide reduction upon illumination before and after osmotic shock of the
chloroplasts. Intactness of isolated pea chloroplasts was above 90%.
The chloroplasts were incubated in the dark in the presence of low level of the
reductant DTT (0.3mM), to allow partial reduction of the stromal ferredoxin/NADPH
and ferredoxin/thioredoxin systems. In these conditions, there was insignificant
monoerisation of AGPB. Addition of 100 µM T6P in the medium significantly
increased AGPB monomerisation (Fig. 16 A) and AGPase activity (Fig. 16 B). This
occurred within 15 min. No significant changes were observed after feeding
trehalose, sucrose, sucrose 6-phosphate or trehalose together with Pi to chloroplasts
as controls (Fig. 17 A). In a further control experiment, T6P was added to
chloroplasets that had been disrupted by osmotic shock. While adding T6P to intact
chloroplasts resulted in an increase in AGPase activity assayed in the presence of
3PGA, disruption of chloroplasts prevented T6P activation (Fig. 16 D).
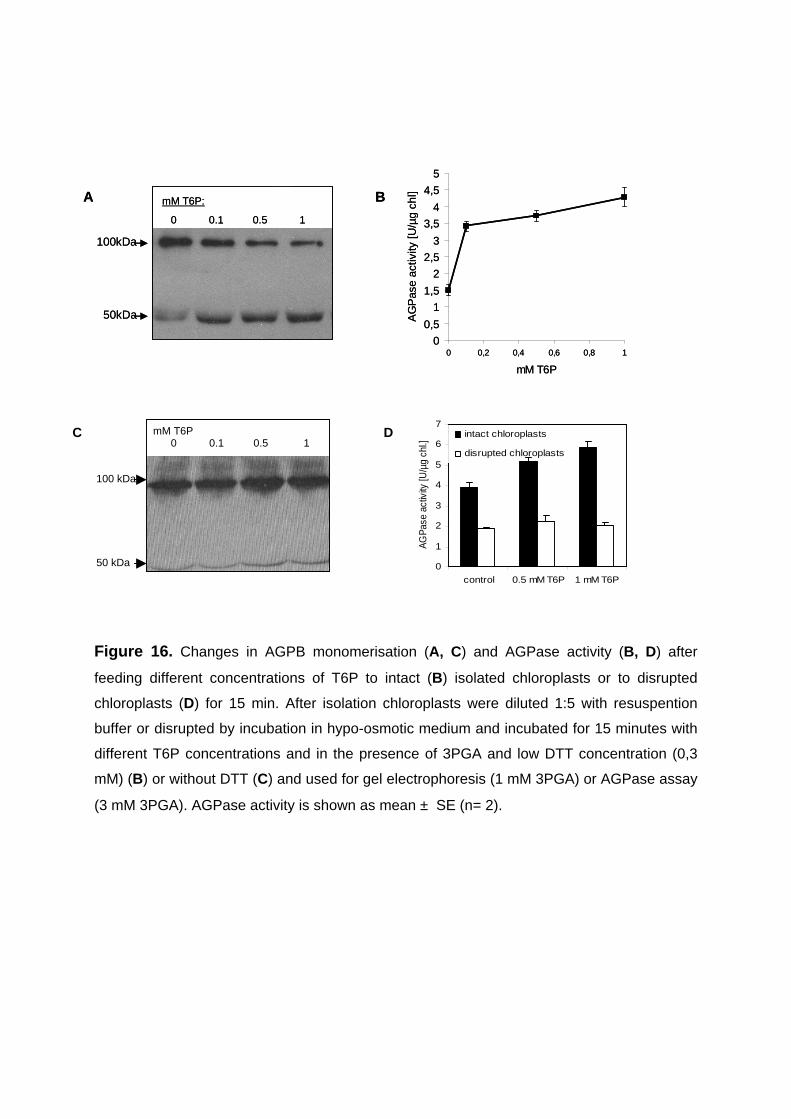
Figure 16. Changes in AGPB monomerisation (A, C) and AGPase activity (B, D) after
feeding different concentrations of T6P to intact (B) isolated chloroplasts or to disrupted
chloroplasts (D) for 15 min. After isolation chloroplasts were diluted 1:5 with resuspention
buffer or disrupted by incubation in hypo-osmotic medium and incubated for 15 minutes with
different T6P concentrations and in the presence of 3PGA and low DTT concentration (0,3
mM) (B) or without DTT (C) and used for gel electrophoresis (1 mM 3PGA) or AGPase assay
(3 mM 3PGA). AGPase activity is shown as mean ± SE (n= 2).
A mM T6P:
0 0.1 0.5 1
50kDa
100kDa
0
0,5
1
1,5
2
2,5
3
3,5
4
4,5
5
0 0,2 0,4 0,6 0,8 1
mM T6P
AG
Pas
e ac
tivity
[U/µ
g ch
l]
BA mM T6P:
0 0.1 0.5 1
50kDa
100kDa
0
0,5
1
1,5
2
2,5
3
3,5
4
4,5
5
0 0,2 0,4 0,6 0,8 1
mM T6P
AG
Pas
e ac
tivity
[U/µ
g ch
l]
B
mM T6P 0 0.1 0.5 1
100 kDa
50 kDa
C
0
1
2
3
4
5
6
7
control 0.5 mM T6P 1 mM T6P
AGPa
se a
ctiv
ity [U
/µg
chl.]
intact chloroplasts
disrupted chloroplasts
D
Figure 17. A, Changes in AGPB monomerisation after incubation of intact isolated
chloroplsts in the presence of 1 mM 3-phosphoglycerate (3PGA) and 0.3 mM DTT for 15
minutes. Control – chloroplasts in resuspention buffer; concentrations used for incubations –
5 mM S6P (sucrose-6-phosphate), 5 mM T6P, 10 mM sucrose, 10 mM trehalose, 0.1 or 1
mM Pi alone or in mixture with 10 mM sucrose or trehalose; B, NADPH/NADP+ ratio
measured in intact pea chloroplasts. Chloroplasts after isolation were diluted 5 times with
resuspention buffer (see Materials and Methods, Chloroplasts Isolation), incubated for 15
minutes in the presence of 1 mM 3PGA with 5 mM T6P or 5 mM DTT or only in buffer
(control) and used for assay as described.
The above experiments were carried out with a low level of DTT in the medium to
provide a source of reducing equivalents for the plastid. When experiments were
performed using chloroplasts in the absence of any external source of reductants,
T6P did not affect redox-activation of AGPase (Fig. 16 C). Feeding DTT to
chloroplasts led to an increase in the NADPH/NADP+ ratio, which however, on its
own, did not lead to a significant increase in monomerisation of AGPB (see above).
The response to T6P did not involve further changes in the reduction state of the
chloroplast NADP-system (Fig. 17 B). This is consistent with T6P acting by
modulating redox-transfer from ferredoxin or NADPH via thioredoxins to AGPase,
rather than increasing the plastidial redox-state.
100kDa
50kDa
0.1mM Pi + 1mM Pi + control S6P T6P sucrose trehalose sucrose trehalose 0.1mM Pi sucrose trehalose 1mM Pi
0
0,2
0,4
0,6
0,8
1
1,2
control 5mM T6P 5mM DTT
NA
DP
H/N
AD
P + /r
atio
B
A
3.2.6. Conclusions
The results show that AGPase is subject to posttranslational redox regulation in
leaves in vivo in response to sugars, which can act as an independent signal.
Evidence is provided by experiments showing that AGPase monomerisation is
increased by supplying exogenous sugars to wild type leaves in the dark. Over night
sucrose feeding leads to conversion of AGPB from a dimer to a monomer and to
increased rates of starch synthesis without any significant changes in the level of
allosterical activator 3PGA. The effect of sucrose feeding on AGPB redox-state and
starch synthesis is visible after 3 hours.
The results also implicate T6P in the signal transduction chain. After trehalose
feeding changes in AGPB redox state were much quicker; AGPB was partially
monomerised already after 15 minutes and starch increased within 30 minutes
without any increase in the levels of other sugars or glycolytic intermediates.
Trehalose feeding is known to lead to an increase of T6P. NADPH/NADP+ ratio in the
tissue was not affected by supply of any tested sugars showing that the effect of
sugars feeding on AGPB redox-state was not dependent on changes in plastidial
redox-status in leaves. Transgenic Arabidopsis and tobacco plants with increased
and decreased T6P levels in cytosol provide evidence that T6P rather than trehalose
leads to redox-activation of AGPase. TPS-overexpressing plants showed increased
redox-activation of AGPase and higher starch levels during the day, while TPP-
overexpressing plants showed the opposite, when compared to Wt. Changes in
AGPase redox-activation occurred independently of changes in the levels of sugars,
sugar-phosphates and NADPH/NADP+ ratio. This indicates that T6P overrides light-
dependent changes in metabolite levels and redox-status. While AGPase was
activated and starch levels increased by feeding sucrose to leaves of wild-type and
TPS-overexpressing plants, this response was attenuated in TPP-overexpressing
plants, providing evidence that T6P links AGPase redox-activation to sucrose.
Incubation with T6P clearly increased AGPB monomerisation and AGPase activity
within 15 minutes, while no significant changes were observed after sucrose or
trehalose feeding to the chloroplasts. This shows that the effects of sucrose and
trehalose on AGPase redox-activation in leaf tissue require T6P synthesis in the
cytosol.
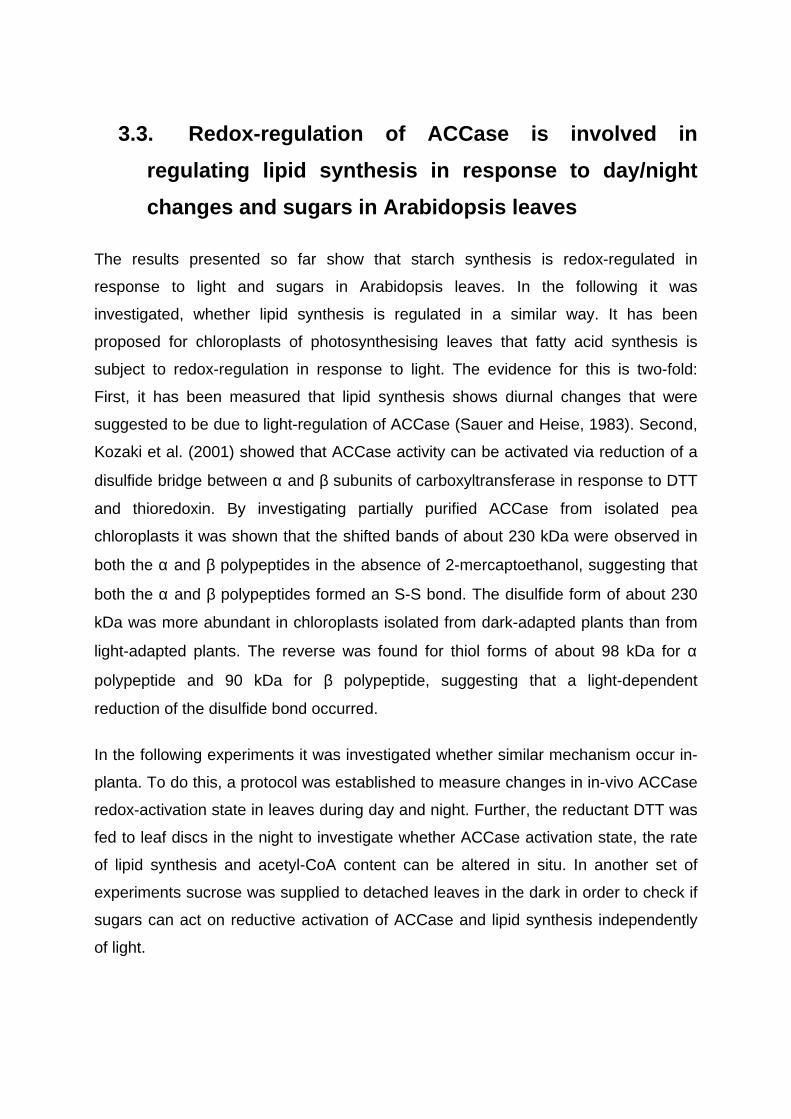
3.3. Redox-regulation of ACCase is involved in
regulating lipid synthesis in response to day/night
changes and sugars in Arabidopsis leaves
The results presented so far show that starch synthesis is redox-regulated in
response to light and sugars in Arabidopsis leaves. In the following it was
investigated, whether lipid synthesis is regulated in a similar way. It has been
proposed for chloroplasts of photosynthesising leaves that fatty acid synthesis is
subject to redox-regulation in response to light. The evidence for this is two-fold:
First, it has been measured that lipid synthesis shows diurnal changes that were
suggested to be due to light-regulation of ACCase (Sauer and Heise, 1983). Second,
Kozaki et al. (2001) showed that ACCase activity can be activated via reduction of a
disulfide bridge between α and β subunits of carboxyltransferase in response to DTT
and thioredoxin. By investigating partially purified ACCase from isolated pea
chloroplasts it was shown that the shifted bands of about 230 kDa were observed in
both the α and β polypeptides in the absence of 2-mercaptoethanol, suggesting that
both the α and β polypeptides formed an S-S bond. The disulfide form of about 230
kDa was more abundant in chloroplasts isolated from dark-adapted plants than from
light-adapted plants. The reverse was found for thiol forms of about 98 kDa for α
polypeptide and 90 kDa for β polypeptide, suggesting that a light-dependent
reduction of the disulfide bond occurred.
In the following experiments it was investigated whether similar mechanism occur in-
planta. To do this, a protocol was established to measure changes in in-vivo ACCase
redox-activation state in leaves during day and night. Further, the reductant DTT was
fed to leaf discs in the night to investigate whether ACCase activation state, the rate
of lipid synthesis and acetyl-CoA content can be altered in situ. In another set of
experiments sucrose was supplied to detached leaves in the dark in order to check if
sugars can act on reductive activation of ACCase and lipid synthesis independently
of light.
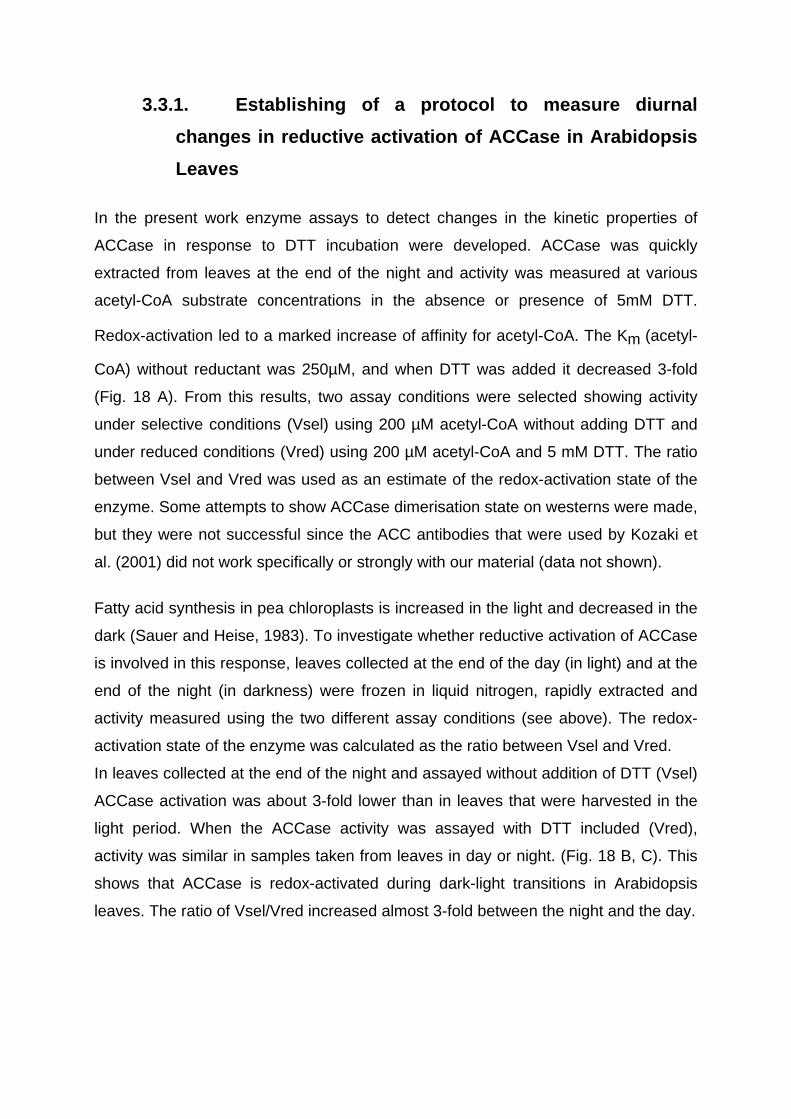
3.3.1. Establishing of a protocol to measure diurnal
changes in reductive activation of ACCase in Arabidopsis
Leaves
In the present work enzyme assays to detect changes in the kinetic properties of
ACCase in response to DTT incubation were developed. ACCase was quickly
extracted from leaves at the end of the night and activity was measured at various
acetyl-CoA substrate concentrations in the absence or presence of 5mM DTT.
Redox-activation led to a marked increase of affinity for acetyl-CoA. The Km (acetyl-
CoA) without reductant was 250µM, and when DTT was added it decreased 3-fold
(Fig. 18 A). From this results, two assay conditions were selected showing activity
under selective conditions (Vsel) using 200 µM acetyl-CoA without adding DTT and
under reduced conditions (Vred) using 200 µM acetyl-CoA and 5 mM DTT. The ratio
between Vsel and Vred was used as an estimate of the redox-activation state of the
enzyme. Some attempts to show ACCase dimerisation state on westerns were made,
but they were not successful since the ACC antibodies that were used by Kozaki et
al. (2001) did not work specifically or strongly with our material (data not shown).
Fatty acid synthesis in pea chloroplasts is increased in the light and decreased in the
dark (Sauer and Heise, 1983). To investigate whether reductive activation of ACCase
is involved in this response, leaves collected at the end of the day (in light) and at the
end of the night (in darkness) were frozen in liquid nitrogen, rapidly extracted and
activity measured using the two different assay conditions (see above). The redox-
activation state of the enzyme was calculated as the ratio between Vsel and Vred.
In leaves collected at the end of the night and assayed without addition of DTT (Vsel)
ACCase activation was about 3-fold lower than in leaves that were harvested in the
light period. When the ACCase activity was assayed with DTT included (Vred),
activity was similar in samples taken from leaves in day or night. (Fig. 18 B, C). This
shows that ACCase is redox-activated during dark-light transitions in Arabidopsis
leaves. The ratio of Vsel/Vred increased almost 3-fold between the night and the day.
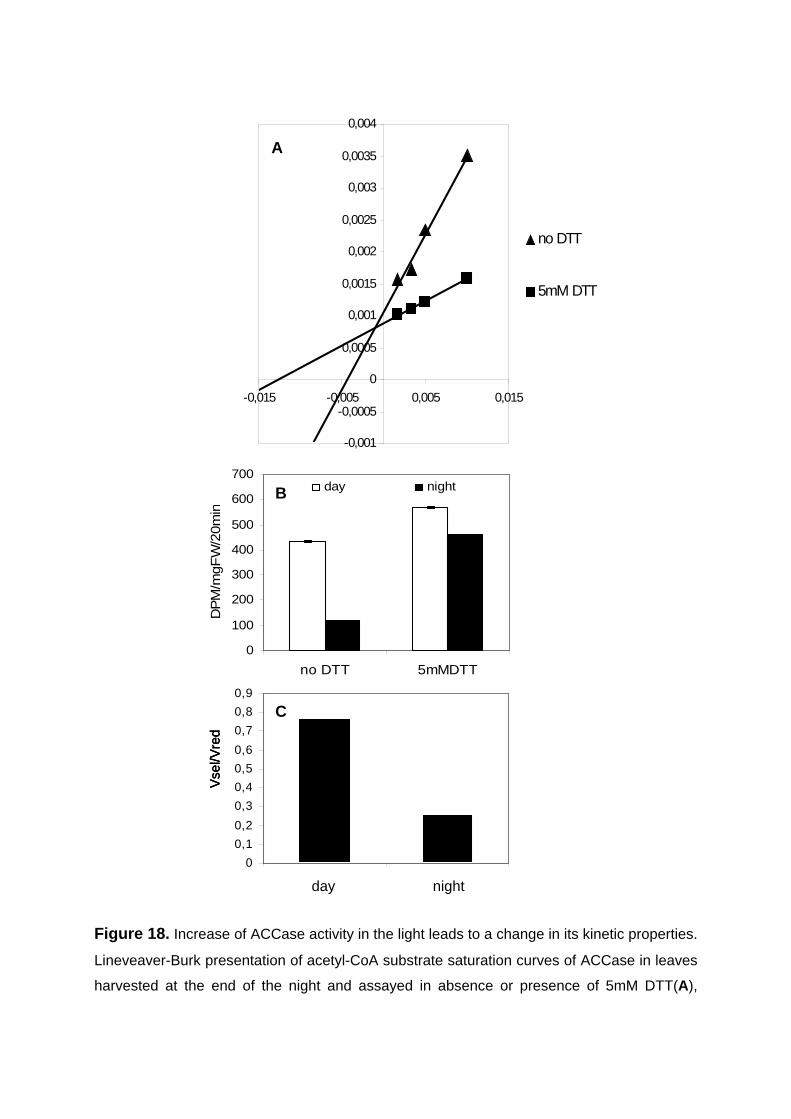
Figure 18. Increase of ACCase activity in the light leads to a change in its kinetic properties.
Lineveaver-Burk presentation of acetyl-CoA substrate saturation curves of ACCase in leaves
harvested at the end of the night and assayed in absence or presence of 5mM DTT(A),
0
100
200
300
400
500
600
700
no DTT 5mMDTT
DP
M/m
gFW
/20m
in
day night
-0,001
-0,0005
0
0,0005
0,001
0,0015
0,002
0,0025
0,003
0,0035
0,004
-0,015 -0,005 0,005 0,015
no DTT
5mM DTT
C
-0,001
-0,0005
0
0,0005
0,001
0,0015
0,002
0,0025
0,003
0,0035
0,004
-0,015 -0,005 0,005 0,015
no DTT
5mM DTT
C
0
0,1
0,2
0,3
0,4
0,5
0,6
0,7
0,8
0,9
day night
Vse
l/Vre
d
B
day night0
0,1
0,2
0,3
0,4
0,5
0,6
0,7
0,8
0,9
day night
Vse
l/Vre
d
B
0
0,1
0,2
0,3
0,4
0,5
0,6
0,7
0,8
0,9
day night
Vse
l/Vre
d
B
day night day night
C
B
A
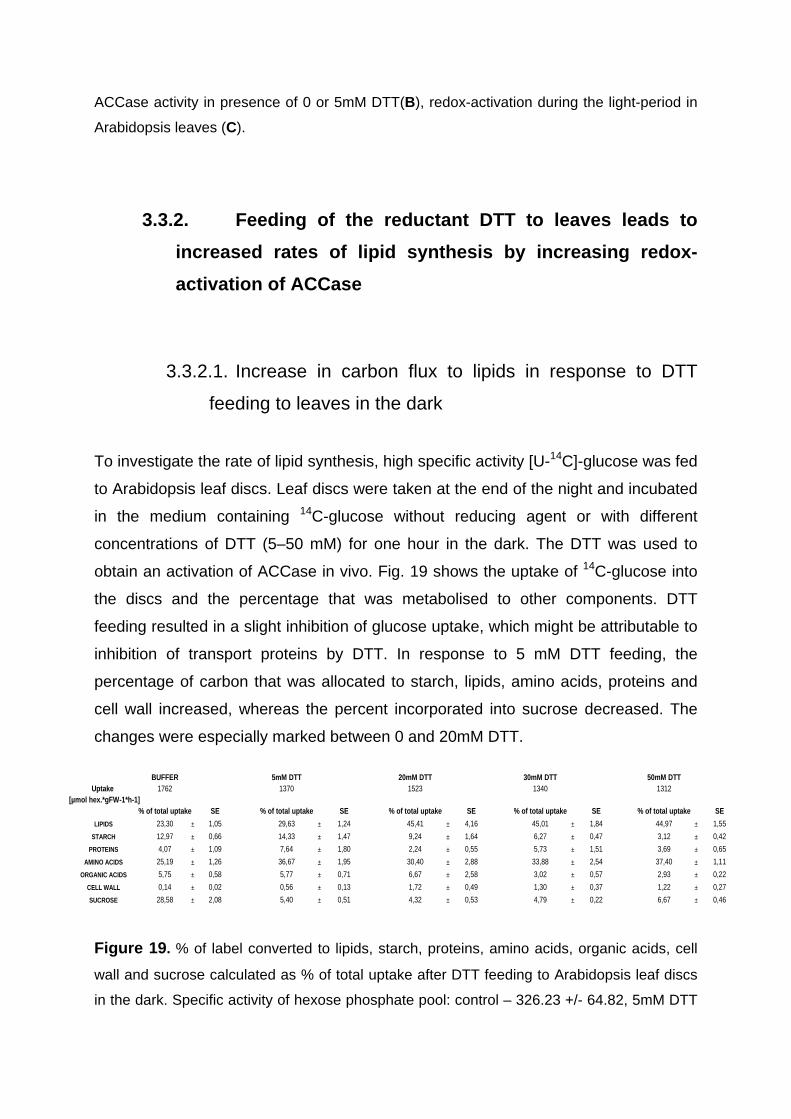
ACCase activity in presence of 0 or 5mM DTT(B), redox-activation during the light-period in
Arabidopsis leaves (C).
3.3.2. Feeding of the reductant DTT to leaves leads to
increased rates of lipid synthesis by increasing redox-
activation of ACCase
3.3.2.1. Increase in carbon flux to lipids in response to DTT
feeding to leaves in the dark
To investigate the rate of lipid synthesis, high specific activity [U-14C]-glucose was fed
to Arabidopsis leaf discs. Leaf discs were taken at the end of the night and incubated
in the medium containing 14C-glucose without reducing agent or with different
concentrations of DTT (5–50 mM) for one hour in the dark. The DTT was used to
obtain an activation of ACCase in vivo. Fig. 19 shows the uptake of 14C-glucose into
the discs and the percentage that was metabolised to other components. DTT
feeding resulted in a slight inhibition of glucose uptake, which might be attributable to
inhibition of transport proteins by DTT. In response to 5 mM DTT feeding, the
percentage of carbon that was allocated to starch, lipids, amino acids, proteins and
cell wall increased, whereas the percent incorporated into sucrose decreased. The
changes were especially marked between 0 and 20mM DTT.
Figure 19 . % of label converted to lipids, starch, proteins, amino acids, organic acids, cell
wall and sucrose calculated as % of total uptake after DTT feeding to Arabidopsis leaf discs
in the dark. Specific activity of hexose phosphate pool: control – 326.23 +/- 64.82, 5mM DTT
BUFFER 5mM DTT 20mM DTT 30mM DTT 50mM DTTUptake 1762 1370 1523 1340 1312
[µmol hex.*gFW-1*h-1]% of total uptake SE % of total uptake SE % of total up take SE % of total uptake SE % of total uptake SE
LIPIDS 23,30 ± 1,05 29,63 ± 1,24 45,41 ± 4,16 45,01 ± 1,84 44,97 ± 1,55
STARCH 12,97 ± 0,66 14,33 ± 1,47 9,24 ± 1,64 6,27 ± 0,47 3,12 ± 0,42
PROTEINS 4,07 ± 1,09 7,64 ± 1,80 2,24 ± 0,55 5,73 ± 1,51 3,69 ± 0,65
AMINO ACIDS 25,19 ± 1,26 36,67 ± 1,95 30,40 ± 2,88 33,88 ± 2,54 37,40 ± 1,11
ORGANIC ACIDS 5,75 ± 0,58 5,77 ± 0,71 6,67 ± 2,58 3,02 ± 0,57 2,93 ± 0,22
CELL WALL 0,14 ± 0,02 0,56 ± 0,13 1,72 ± 0,49 1,30 ± 0,37 1,22 ± 0,27
SUCROSE 28,58 ± 2,08 5,40 ± 0,51 4,32 ± 0,53 4,79 ± 0,22 6,67 ± 0,46
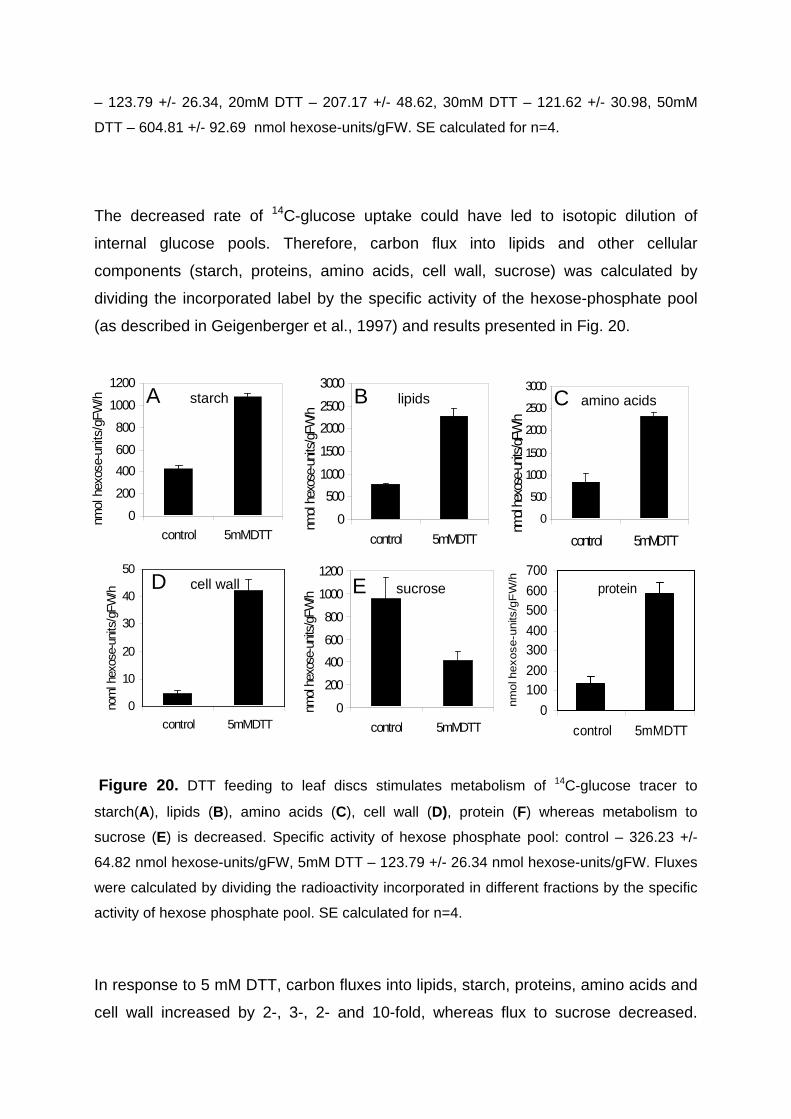
– 123.79 +/- 26.34, 20mM DTT – 207.17 +/- 48.62, 30mM DTT – 121.62 +/- 30.98, 50mM
DTT – 604.81 +/- 92.69 nmol hexose-units/gFW. SE calculated for n=4.
The decreased rate of 14C-glucose uptake could have led to isotopic dilution of
internal glucose pools. Therefore, carbon flux into lipids and other cellular
components (starch, proteins, amino acids, cell wall, sucrose) was calculated by
dividing the incorporated label by the specific activity of the hexose-phosphate pool
(as described in Geigenberger et al., 1997) and results presented in Fig. 20.
Figure 20. DTT feeding to leaf discs stimulates metabolism of 14C-glucose tracer to
starch(A), lipids (B), amino acids (C), cell wall (D), protein (F) whereas metabolism to
sucrose (E) is decreased. Specific activity of hexose phosphate pool: control – 326.23 +/-
64.82 nmol hexose-units/gFW, 5mM DTT – 123.79 +/- 26.34 nmol hexose-units/gFW. Fluxes
were calculated by dividing the radioactivity incorporated in different fractions by the specific
activity of hexose phosphate pool. SE calculated for n=4.
In response to 5 mM DTT, carbon fluxes into lipids, starch, proteins, amino acids and
cell wall increased by 2-, 3-, 2- and 10-fold, whereas flux to sucrose decreased.
0
200
400
600
800
1000
1200
control 5mMDTT
nmol
hex
ose-
units
/gFW
/h A starch
0
200
400
600
800
1000
1200
control 5mMDTT
nmol
hex
ose-
units
/gFW
/h A starch
0
10
20
30
40
50
control 5mMDTT
nom
l hex
ose-
units
/gFW
/h D cell wall
0
10
20
30
40
50
control 5mMDTT
nom
l hex
ose-
units
/gFW
/h D cell wall
0
500
1000
1500
2000
2500
3000
control 5mMDTT
nmol
hexo
se-u
nits/
gFW
/h
C amino acids
0
500
1000
1500
2000
2500
3000
control 5mMDTT
nmol
hexo
se-u
nits/
gFW
/h
C amino acids
0
200
400
600
800
1000
1200
control 5mMDTT
nmol
hex
ose-
units
/gFW
/h
E sucrose
0
200
400
600
800
1000
1200
control 5mMDTT
nmol
hex
ose-
units
/gFW
/h
E sucrose
0
500
1000
1500
2000
2500
3000
control 5mMDTT
nmol
hex
ose-
units
/gFW
/h
B lipids
0
500
1000
1500
2000
2500
3000
control 5mMDTT
nmol
hex
ose-
units
/gFW
/h
B lipids
protein
0
100200
300400
500600
700
control 5mMDTT
nm
ol h
exose-u
nits
/gF
W/h
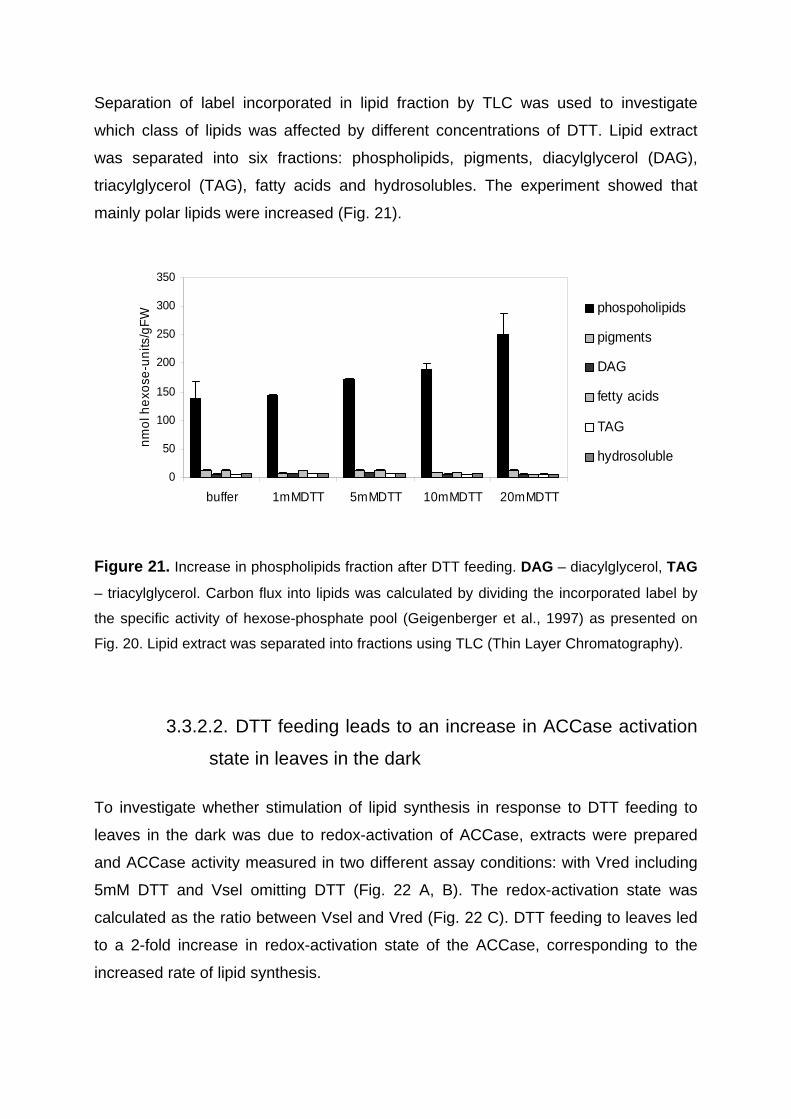
Separation of label incorporated in lipid fraction by TLC was used to investigate
which class of lipids was affected by different concentrations of DTT. Lipid extract
was separated into six fractions: phospholipids, pigments, diacylglycerol (DAG),
triacylglycerol (TAG), fatty acids and hydrosolubles. The experiment showed that
mainly polar lipids were increased (Fig. 21).
Figure 21. Increase in phospholipids fraction after DTT feeding. DAG – diacylglycerol, TAG
– triacylglycerol. Carbon flux into lipids was calculated by dividing the incorporated label by
the specific activity of hexose-phosphate pool (Geigenberger et al., 1997) as presented on
Fig. 20. Lipid extract was separated into fractions using TLC (Thin Layer Chromatography).
3.3.2.2. DTT feeding leads to an increase in ACCase activation
state in leaves in the dark
To investigate whether stimulation of lipid synthesis in response to DTT feeding to
leaves in the dark was due to redox-activation of ACCase, extracts were prepared
and ACCase activity measured in two different assay conditions: with Vred including
5mM DTT and Vsel omitting DTT (Fig. 22 A, B). The redox-activation state was
calculated as the ratio between Vsel and Vred (Fig. 22 C). DTT feeding to leaves led
to a 2-fold increase in redox-activation state of the ACCase, corresponding to the
increased rate of lipid synthesis.
0
50
100
150
200
250
300
350
buffer 1mMDTT 5mMDTT 10mMDTT 20mMDTT
nm
ol h
exo
se-u
nits
/gF
W phospoholipids
pigments
DAG
fetty acids
TAG
hydrosoluble
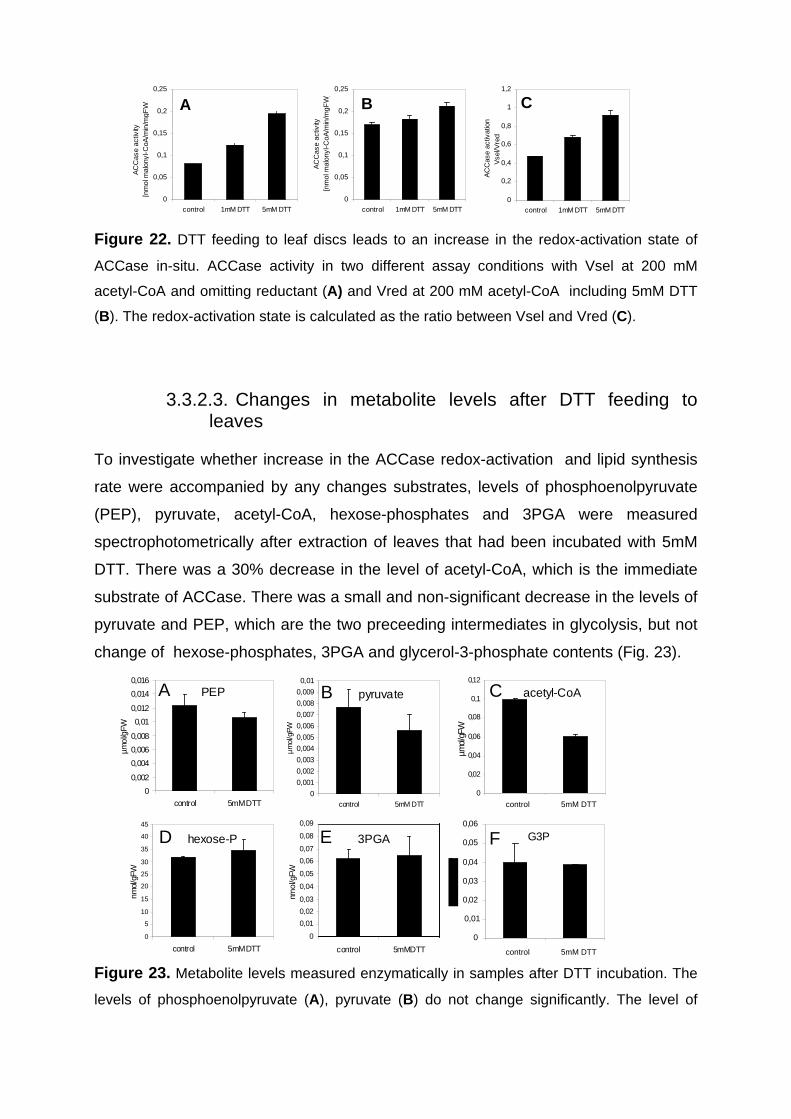
Figure 22. DTT feeding to leaf discs leads to an increase in the redox-activation state of
ACCase in-situ. ACCase activity in two different assay conditions with Vsel at 200 mM
acetyl-CoA and omitting reductant (A) and Vred at 200 mM acetyl-CoA including 5mM DTT
(B). The redox-activation state is calculated as the ratio between Vsel and Vred (C).
3.3.2.3. Changes in metabolite levels after DTT feeding to leaves
To investigate whether increase in the ACCase redox-activation and lipid synthesis
rate were accompanied by any changes substrates, levels of phosphoenolpyruvate
(PEP), pyruvate, acetyl-CoA, hexose-phosphates and 3PGA were measured
spectrophotometrically after extraction of leaves that had been incubated with 5mM
DTT. There was a 30% decrease in the level of acetyl-CoA, which is the immediate
substrate of ACCase. There was a small and non-significant decrease in the levels of
pyruvate and PEP, which are the two preceeding intermediates in glycolysis, but not
change of hexose-phosphates, 3PGA and glycerol-3-phosphate contents (Fig. 23).
Figure 23. Metabolite levels measured enzymatically in samples after DTT incubation. The
levels of phosphoenolpyruvate (A), pyruvate (B) do not change significantly. The level of
0
0,001
0,002
0,003
0,004
0,005
0,006
0,007
0,008
0,009
0,01
control 5mM DTT
µm
ol/g
FW
B pyruvate
0
0,002
0,004
0,006
0,008
0,01
0,012
0,014
0,016
control 5mM DTT
µmol
/gFW
A PEP
0
0,02
0,04
0,06
0,08
0,1
0,12
control 5mM DTT
µmol
/gFW
C acetyl-CoA
0
5
10
15
20
25
30
35
40
45
control 5mM DTT
nmol
/gFW
D hexose-P
0
0,01
0,02
0,03
0,04
0,05
0,06
0,07
0,08
0,09
control 5mMDTT
nmol
/gFW
E 3PGA
G3P
0
0,01
0,02
0,03
0,04
0,05
0,06
cont rol 5mM DTT
F
0
0,001
0,002
0,003
0,004
0,005
0,006
0,007
0,008
0,009
0,01
control 5mM DTT
µm
ol/g
FW
B pyruvate
0
0,001
0,002
0,003
0,004
0,005
0,006
0,007
0,008
0,009
0,01
control 5mM DTT
µm
ol/g
FW
B pyruvate
0
0,002
0,004
0,006
0,008
0,01
0,012
0,014
0,016
control 5mM DTT
µmol
/gFW
A PEP
0
0,02
0,04
0,06
0,08
0,1
0,12
control 5mM DTT
µmol
/gFW
C acetyl-CoA
0
5
10
15
20
25
30
35
40
45
control 5mM DTT
nmol
/gFW
D hexose-P
0
0,01
0,02
0,03
0,04
0,05
0,06
0,07
0,08
0,09
control 5mMDTT
nmol
/gFW
E 3PGA
G3P
0
0,01
0,02
0,03
0,04
0,05
0,06
cont rol 5mM DTT
F
0
0,002
0,004
0,006
0,008
0,01
0,012
0,014
0,016
control 5mM DTT
µmol
/gFW
A PEP
0
0,002
0,004
0,006
0,008
0,01
0,012
0,014
0,016
control 5mM DTT
µmol
/gFW
A PEP
0
0,02
0,04
0,06
0,08
0,1
0,12
control 5mM DTT
µmol
/gFW
C acetyl-CoA
0
0,02
0,04
0,06
0,08
0,1
0,12
control 5mM DTT
µmol
/gFW
C acetyl-CoA
0
5
10
15
20
25
30
35
40
45
control 5mM DTT
nmol
/gFW
D hexose-P
0
5
10
15
20
25
30
35
40
45
control 5mM DTT
nmol
/gFW
D hexose-P
0
0,01
0,02
0,03
0,04
0,05
0,06
0,07
0,08
0,09
control 5mMDTT
nmol
/gFW
E 3PGA
0
0,01
0,02
0,03
0,04
0,05
0,06
0,07
0,08
0,09
control 5mMDTT
nmol
/gFW
E 3PGA
G3P
0
0,01
0,02
0,03
0,04
0,05
0,06
cont rol 5mM DTT
F
control 5mM DTT
control 5mM DTT
0
0,2
0,4
0,6
0,8
1
1,2
control 1mM DTT 5mM DTT
AC
Cas
e ac
tivat
ion
Vse
l/Vre
d
0
0,05
0,1
0,15
0,2
0,25
control 1mM DTT 5mM DTT
AC
Cas
e ac
tivity
[nm
ol m
alon
yl-C
oA/m
in/m
gFW
]
0
0,05
0,1
0,15
0,2
0,25
control 1mM DTT 5mM DTT
AC
Cas
e ac
tivity
[nm
ol m
alon
yl-C
oA/m
in/m
gFW
] A C B
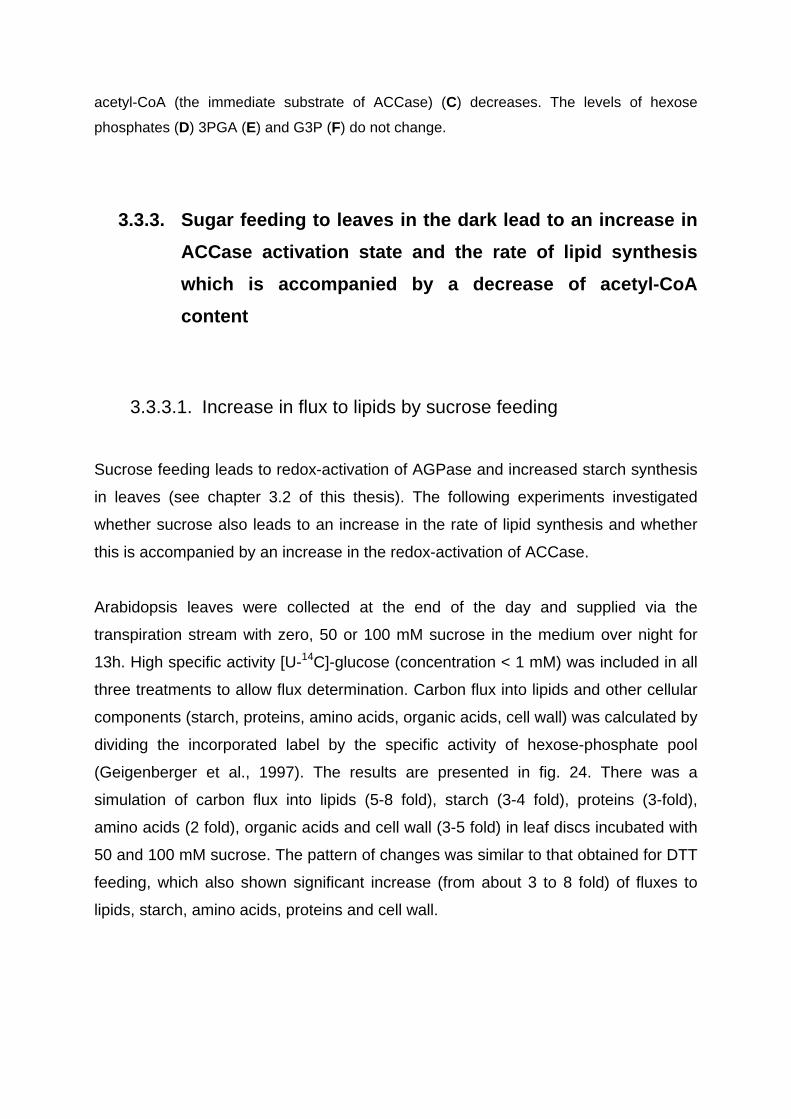
acetyl-CoA (the immediate substrate of ACCase) (C) decreases. The levels of hexose
phosphates (D) 3PGA (E) and G3P (F) do not change.
3.3.3. Sugar feeding to leaves in the dark lead to an increase in
ACCase activation state and the rate of lipid synthesis
which is accompanied by a decrease of acetyl-CoA
content
3.3.3.1. Increase in flux to lipids by sucrose feeding
Sucrose feeding leads to redox-activation of AGPase and increased starch synthesis
in leaves (see chapter 3.2 of this thesis). The following experiments investigated
whether sucrose also leads to an increase in the rate of lipid synthesis and whether
this is accompanied by an increase in the redox-activation of ACCase.
Arabidopsis leaves were collected at the end of the day and supplied via the
transpiration stream with zero, 50 or 100 mM sucrose in the medium over night for
13h. High specific activity [U-14C]-glucose (concentration < 1 mM) was included in all
three treatments to allow flux determination. Carbon flux into lipids and other cellular
components (starch, proteins, amino acids, organic acids, cell wall) was calculated by
dividing the incorporated label by the specific activity of hexose-phosphate pool
(Geigenberger et al., 1997). The results are presented in fig. 24. There was a
simulation of carbon flux into lipids (5-8 fold), starch (3-4 fold), proteins (3-fold),
amino acids (2 fold), organic acids and cell wall (3-5 fold) in leaf discs incubated with
50 and 100 mM sucrose. The pattern of changes was similar to that obtained for DTT
feeding, which also shown significant increase (from about 3 to 8 fold) of fluxes to
lipids, starch, amino acids, proteins and cell wall.
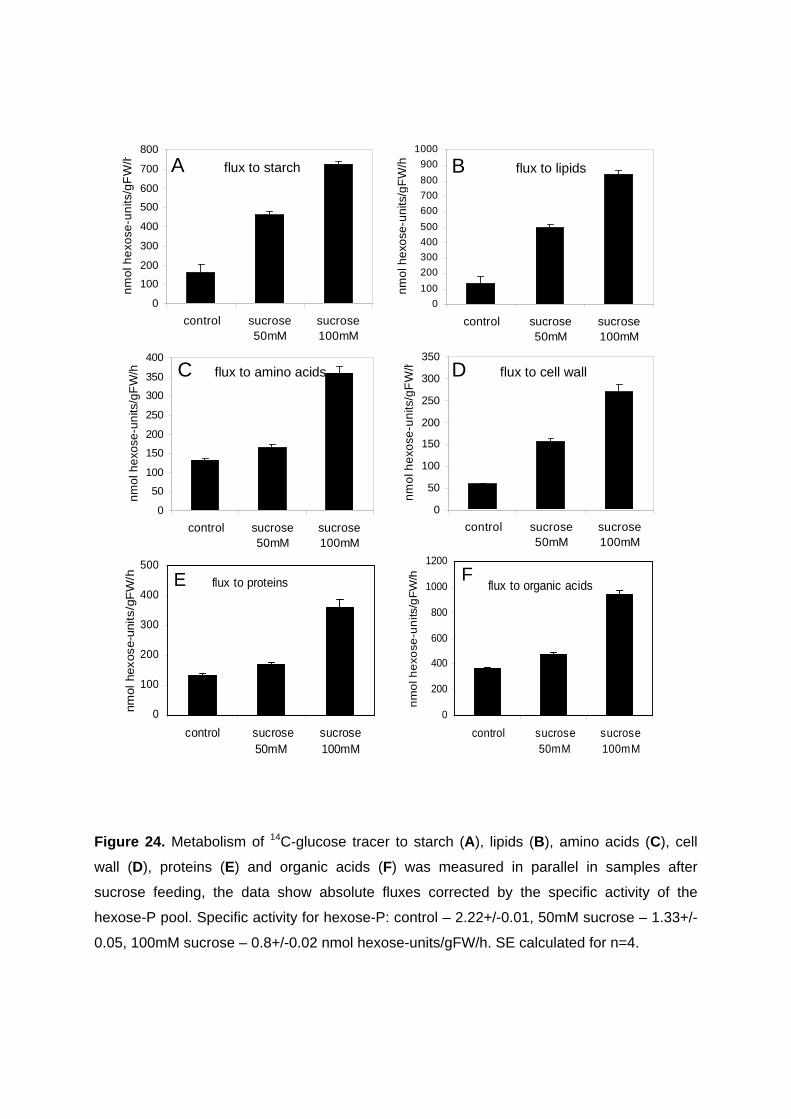
Figure 24. Metabolism of 14C-glucose tracer to starch (A), lipids (B), amino acids (C), cell
wall (D), proteins (E) and organic acids (F) was measured in parallel in samples after
sucrose feeding, the data show absolute fluxes corrected by the specific activity of the
hexose-P pool. Specific activity for hexose-P: control – 2.22+/-0.01, 50mM sucrose – 1.33+/-
0.05, 100mM sucrose – 0.8+/-0.02 nmol hexose-units/gFW/h. SE calculated for n=4.
0
100
200
300
400
500
600
700
800
control sucrose50mM
sucrose100mM
nm
ol h
exo
se-u
nits
/gF
W/h A flux to starch
0
100
200
300
400
500
600
700
800
control sucrose50mM
sucrose100mM
nm
ol h
exo
se-u
nits
/gF
W/h A flux to starch
0
100
200
300
400
500
600
700
800
900
1000
control sucrose50mM
sucrose100mM
nmol
hex
ose-
units
/gF
W/h B flux to lipids
0
100
200
300
400
500
600
700
800
900
1000
control sucrose50mM
sucrose100mM
nmol
hex
ose-
units
/gF
W/h B flux to lipids
0
50
100
150
200
250
300
350
400
control sucrose50mM
sucrose100mM
nmol
hex
ose-
units
/gF
W/h C flux to amino acids
0
50
100
150
200
250
300
350
400
control sucrose50mM
sucrose100mM
nmol
hex
ose-
units
/gF
W/h C flux to amino acids
0
50
100
150
200
250
300
350
control sucrose50mM
sucrose100mM
nm
ol h
exo
se-u
nits
/gF
W/h D flux to cell wall
0
50
100
150
200
250
300
350
control sucrose50mM
sucrose100mM
nm
ol h
exo
se-u
nits
/gF
W/h D flux to cell wall
flux to proteins
0
100
200
300
400
500
control sucrose50mM
sucrose100mM
nmol
hex
ose-
uni
ts/g
FW
/h
flux to organic acids
0
200
400
600
800
1000
1200
control sucrose50mM
sucrose100mM
nm
ol h
exo
se-u
nits
/gF
W/hE F
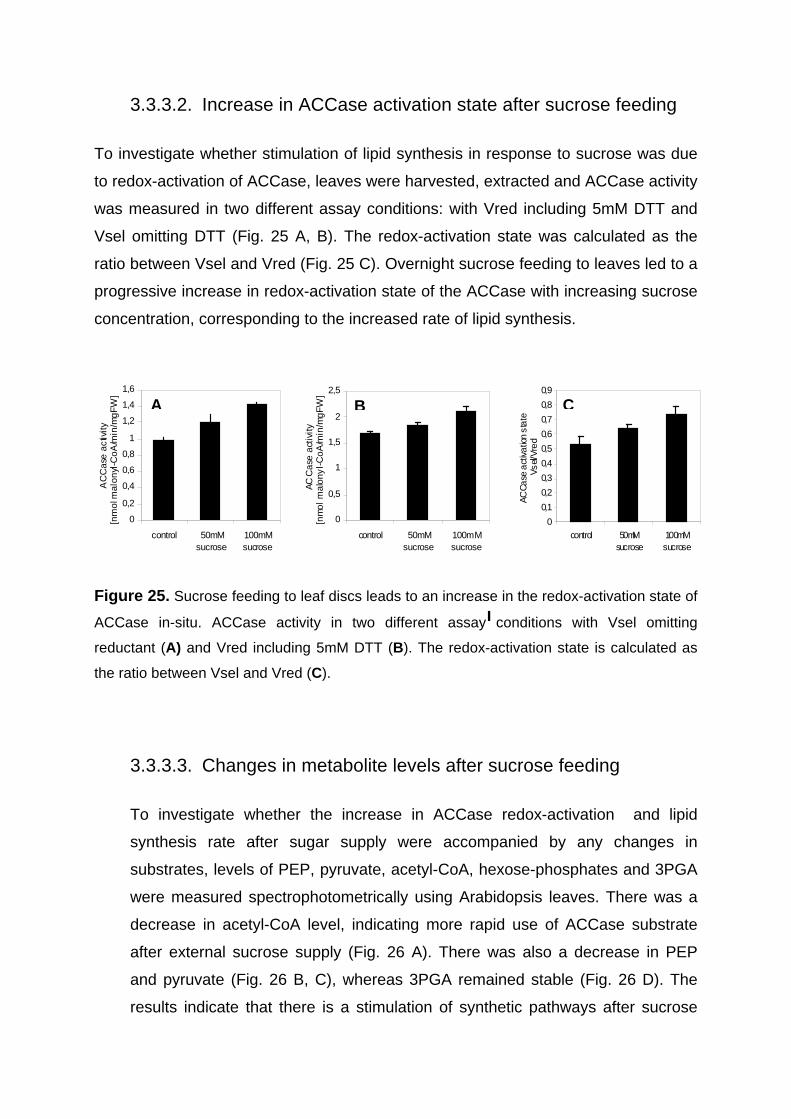
3.3.3.2. Increase in ACCase activation state after sucrose feeding
To investigate whether stimulation of lipid synthesis in response to sucrose was due
to redox-activation of ACCase, leaves were harvested, extracted and ACCase activity
was measured in two different assay conditions: with Vred including 5mM DTT and
Vsel omitting DTT (Fig. 25 A, B). The redox-activation state was calculated as the
ratio between Vsel and Vred (Fig. 25 C). Overnight sucrose feeding to leaves led to a
progressive increase in redox-activation state of the ACCase with increasing sucrose
concentration, corresponding to the increased rate of lipid synthesis.
Figure 25. Sucrose feeding to leaf discs leads to an increase in the redox-activation state of
ACCase in-situ. ACCase activity in two different assay conditions with Vsel omitting
reductant (A) and Vred including 5mM DTT (B). The redox-activation state is calculated as
the ratio between Vsel and Vred (C).
3.3.3.3. Changes in metabolite levels after sucrose feeding
To investigate whether the increase in ACCase redox-activation and lipid
synthesis rate after sugar supply were accompanied by any changes in
substrates, levels of PEP, pyruvate, acetyl-CoA, hexose-phosphates and 3PGA
were measured spectrophotometrically using Arabidopsis leaves. There was a
decrease in acetyl-CoA level, indicating more rapid use of ACCase substrate
after external sucrose supply (Fig. 26 A). There was also a decrease in PEP
and pyruvate (Fig. 26 B, C), whereas 3PGA remained stable (Fig. 26 D). The
results indicate that there is a stimulation of synthetic pathways after sucrose
0
0,2
0,4
0,6
0,8
1
1,2
1,4
1,6
control 50mMsucrose
100mMsucrose
AC
Cas
e ac
tivity
[n
mol
mal
onyl
-CoA
/min
/mgF
W]
0
0,1
0,2
0,3
0,4
0,5
0,6
0,7
0,8
0,9
control 50mMsucrose
100mMsucrose
ACCa
se a
ctiva
tion
stat
e V
sel/V
red
0
0,5
1
1,5
2
2,5
control 50mMsucrose
100mMsucrose
ACC
ase
activ
ity
[nm
ol m
alon
yl-C
oA/m
in/m
gFW
] A B C
I
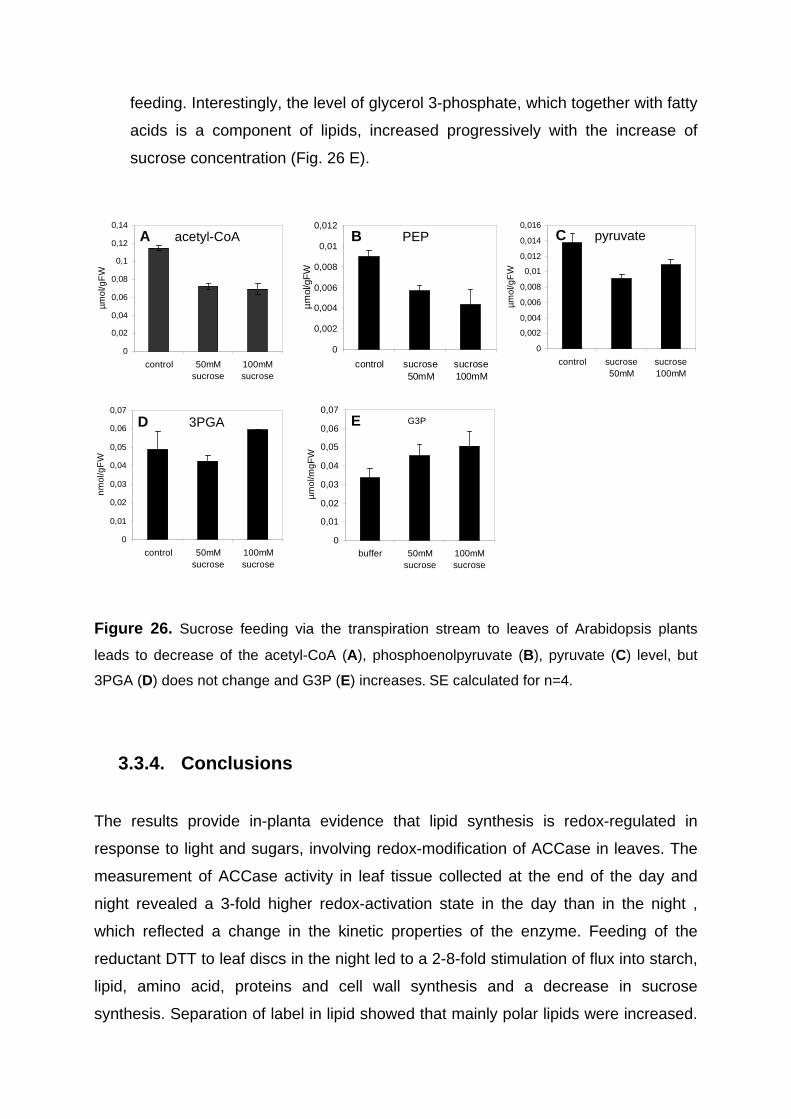
feeding. Interestingly, the level of glycerol 3-phosphate, which together with fatty
acids is a component of lipids, increased progressively with the increase of
sucrose concentration (Fig. 26 E).
Figure 26. Sucrose feeding via the transpiration stream to leaves of Arabidopsis plants
leads to decrease of the acetyl-CoA (A), phosphoenolpyruvate (B), pyruvate (C) level, but
3PGA (D) does not change and G3P (E) increases. SE calculated for n=4.
3.3.4. Conclusions
The results provide in-planta evidence that lipid synthesis is redox-regulated in
response to light and sugars, involving redox-modification of ACCase in leaves. The
measurement of ACCase activity in leaf tissue collected at the end of the day and
night revealed a 3-fold higher redox-activation state in the day than in the night ,
which reflected a change in the kinetic properties of the enzyme. Feeding of the
reductant DTT to leaf discs in the night led to a 2-8-fold stimulation of flux into starch,
lipid, amino acid, proteins and cell wall synthesis and a decrease in sucrose
synthesis. Separation of label in lipid showed that mainly polar lipids were increased.
0
0,002
0,004
0,006
0,008
0,01
0,012
0,014
0,016
control sucrose50mM
sucrose100mM
µm
ol/g
FW
0
0,002
0,004
0,006
0,008
0,01
0,012
control sucrose50mM
sucrose100mM
µm
ol/g
FW
0
0,01
0,02
0,03
0,04
0,05
0,06
0,07
control 50mMsucrose
100mMsucrose
nm
ol/g
FW
G3P
0
0,01
0,02
0,03
0,04
0,05
0,06
0,07
buffer 50mMsucrose
100mMsucrose
µm
ol/m
gFW
0
0,02
0,04
0,06
0,08
0,1
0,12
0,14
control 50mMsucrose
100mMsucrose
µm
ol/g
FW
A acetyl-CoA B PEP C pyruvate
D 3PGA E
DTT feeding led to an increase in ACCase redox-activation state, corresponding to
an increased rate of lipid synthesis and a decrease of acetyl-CoA content. ACCase
was also redox-activated in response to sucrose feeding during the night. The
increase in ACCase redox- activation state was accompanied by an increase of lipid
synthesis and a decrease of acetyl-CoA level. These results show that redox
regulation of ACCase provides a mechanism to increase lipid synthesis in reponse to
light, and in response to the sugar supply.
3.4. Changes in metabolite and transcript profiles in
Arabidospis leaves in response to manipulation of t he
redox-state by feeding DTT
The results presented above show that DTT can be used to alter the NADPH/NADP+
ratio of isolated chloroplast and to induce changes in the activation state of redox-
regulated enzymes like AGPase and ACCase when supplied to intact leaf tissue.
This indicates that DTT can be used as a tool to manipulate the redox-state of plant
tissues. In the following the effect of DTT feeding on metabolite and transcript profiles
was investigated in leaf discs incubated in the dark. This systemic approach might
allow identification of further redox-regulated sites in leaf metabolism.
3.4.1. Metabolic Profiling of Arabidopsis Leaves after DTT
Feeding
Leaf discs were taken from Arabidopsis plants at the end of the night and incubated
in the medium without reducing agent or with 5 mM DTT for one hour in the
darkness. After harvest and extraction, metabolite contents were measured and
calculated as ratio between DTT and buffer incubated samples. Fig. 27 presents a
schematic overview of metabolites placed in metabolic pathways to show which
metabolites increase or decrease in response to DTT feeding using a color code. The
list of all measured metabolites is presented in Table 1, Appendix, where the extent
and significance of the changes is also documented.
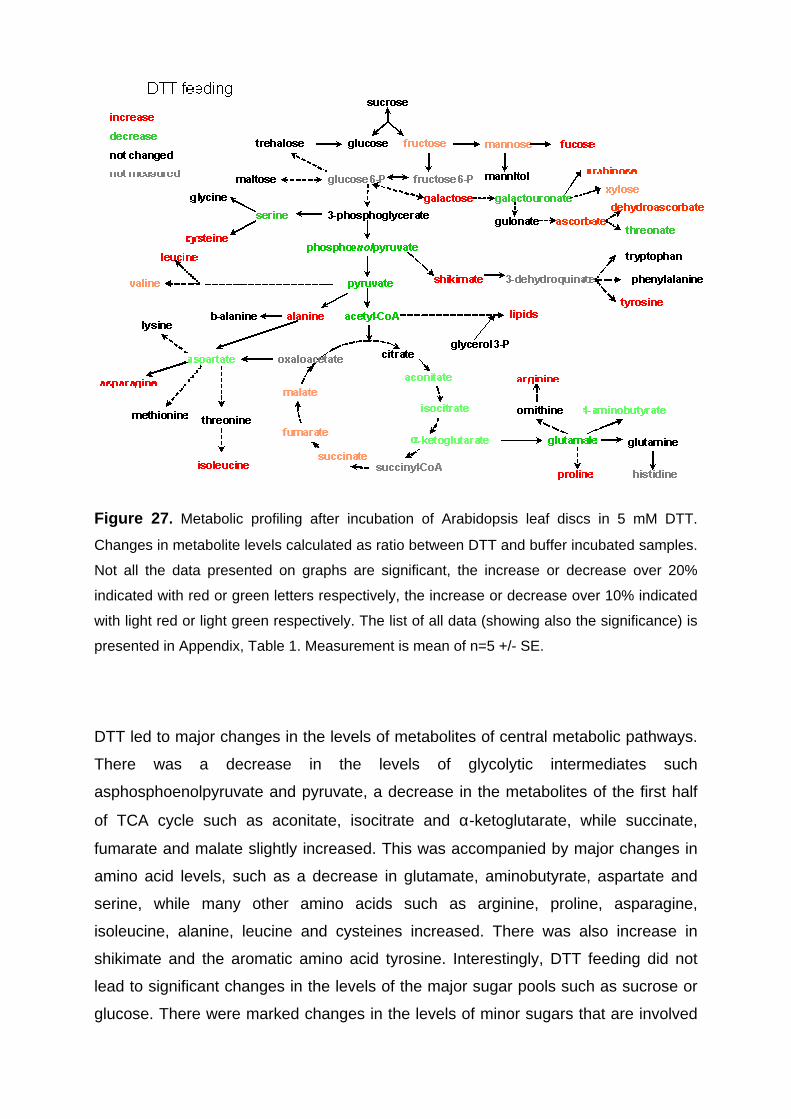
Figure 27 . Metabolic profiling after incubation of Arabidopsis leaf discs in 5 mM DTT.
Changes in metabolite levels calculated as ratio between DTT and buffer incubated samples.
Not all the data presented on graphs are significant, the increase or decrease over 20%
indicated with red or green letters respectively, the increase or decrease over 10% indicated
with light red or light green respectively. The list of all data (showing also the significance) is
presented in Appendix, Table 1. Measurement is mean of n=5 +/- SE.
DTT led to major changes in the levels of metabolites of central metabolic pathways.
There was a decrease in the levels of glycolytic intermediates such
asphosphoenolpyruvate and pyruvate, a decrease in the metabolites of the first half
of TCA cycle such as aconitate, isocitrate and α-ketoglutarate, while succinate,
fumarate and malate slightly increased. This was accompanied by major changes in
amino acid levels, such as a decrease in glutamate, aminobutyrate, aspartate and
serine, while many other amino acids such as arginine, proline, asparagine,
isoleucine, alanine, leucine and cysteines increased. There was also increase in
shikimate and the aromatic amino acid tyrosine. Interestingly, DTT feeding did not
lead to significant changes in the levels of the major sugar pools such as sucrose or
glucose. There were marked changes in the levels of minor sugars that are involved
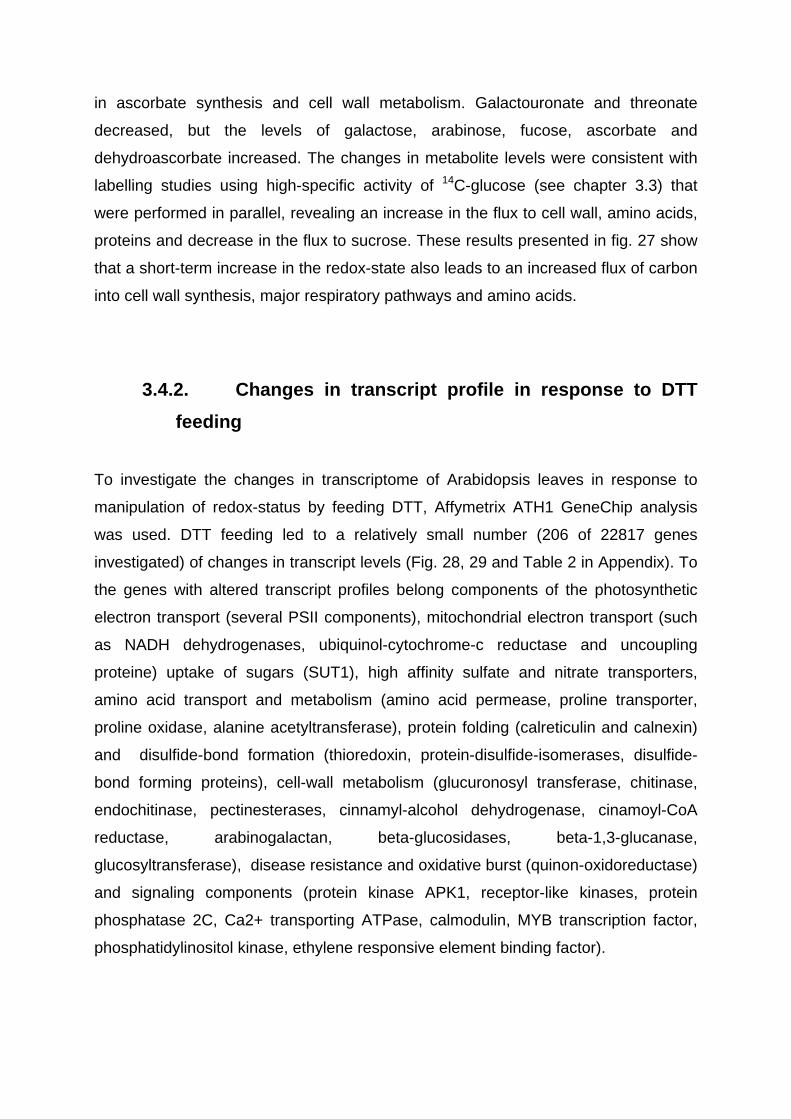
in ascorbate synthesis and cell wall metabolism. Galactouronate and threonate
decreased, but the levels of galactose, arabinose, fucose, ascorbate and
dehydroascorbate increased. The changes in metabolite levels were consistent with
labelling studies using high-specific activity of 14C-glucose (see chapter 3.3) that
were performed in parallel, revealing an increase in the flux to cell wall, amino acids,
proteins and decrease in the flux to sucrose. These results presented in fig. 27 show
that a short-term increase in the redox-state also leads to an increased flux of carbon
into cell wall synthesis, major respiratory pathways and amino acids.
3.4.2. Changes in transcript profile in response to DTT
feeding
To investigate the changes in transcriptome of Arabidopsis leaves in response to
manipulation of redox-status by feeding DTT, Affymetrix ATH1 GeneChip analysis
was used. DTT feeding led to a relatively small number (206 of 22817 genes
investigated) of changes in transcript levels (Fig. 28, 29 and Table 2 in Appendix). To
the genes with altered transcript profiles belong components of the photosynthetic
electron transport (several PSII components), mitochondrial electron transport (such
as NADH dehydrogenases, ubiquinol-cytochrome-c reductase and uncoupling
proteine) uptake of sugars (SUT1), high affinity sulfate and nitrate transporters,
amino acid transport and metabolism (amino acid permease, proline transporter,
proline oxidase, alanine acetyltransferase), protein folding (calreticulin and calnexin)
and disulfide-bond formation (thioredoxin, protein-disulfide-isomerases, disulfide-
bond forming proteins), cell-wall metabolism (glucuronosyl transferase, chitinase,
endochitinase, pectinesterases, cinnamyl-alcohol dehydrogenase, cinamoyl-CoA
reductase, arabinogalactan, beta-glucosidases, beta-1,3-glucanase,
glucosyltransferase), disease resistance and oxidative burst (quinon-oxidoreductase)
and signaling components (protein kinase APK1, receptor-like kinases, protein
phosphatase 2C, Ca2+ transporting ATPase, calmodulin, MYB transcription factor,
phosphatidylinositol kinase, ethylene responsive element binding factor).
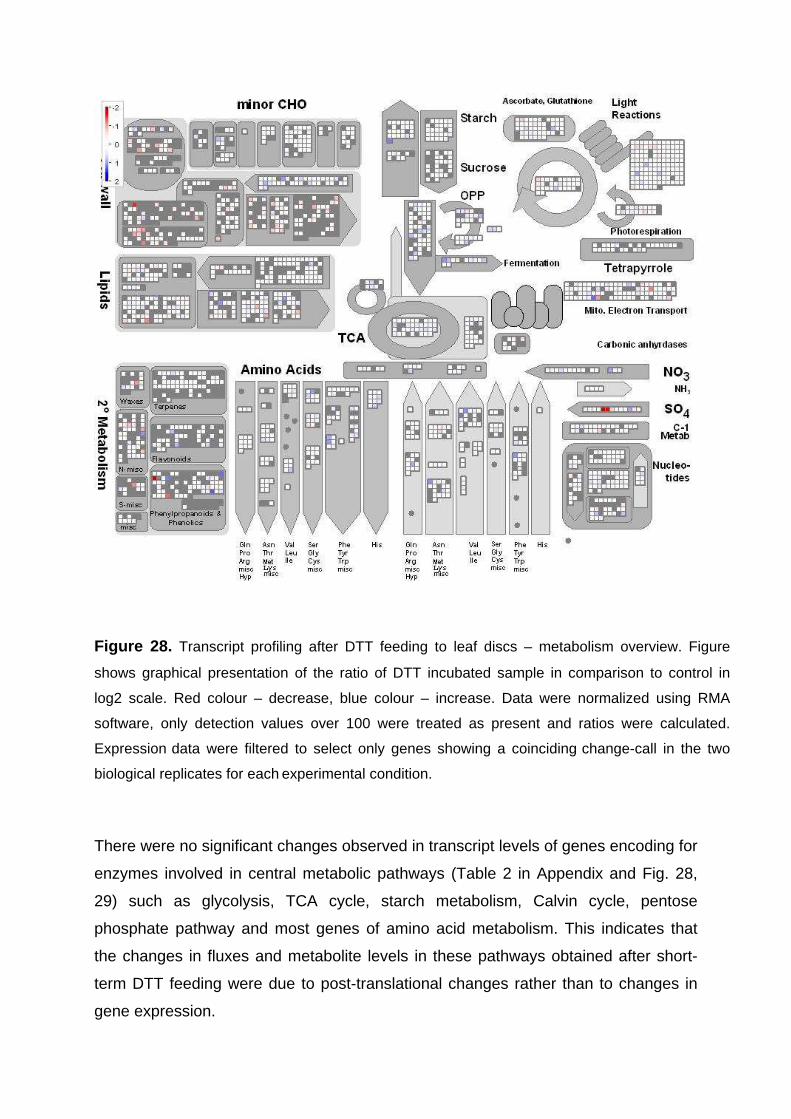
Figure 28. Transcript profiling after DTT feeding to leaf discs – metabolism overview. Figure
shows graphical presentation of the ratio of DTT incubated sample in comparison to control in
log2 scale. Red colour – decrease, blue colour – increase. Data were normalized using RMA
software, only detection values over 100 were treated as present and ratios were calculated.
Expression data were filtered to select only genes showing a coinciding change-call in the two
biological replicates for each experimental condition.
There were no significant changes observed in transcript levels of genes encoding for
enzymes involved in central metabolic pathways (Table 2 in Appendix and Fig. 28,
29) such as glycolysis, TCA cycle, starch metabolism, Calvin cycle, pentose
phosphate pathway and most genes of amino acid metabolism. This indicates that
the changes in fluxes and metabolite levels in these pathways obtained after short-
term DTT feeding were due to post-translational changes rather than to changes in
gene expression.
Figure 29. Transcript profiling after DTT feeding to leaf discs – metabolism overview. Data
from Fig. 28 recalculated and shown as percentage of total amount of genes involved in
different metabolic pathways.
3.5. Changes in metabolite and transcript profiles in
Arabidospis leaves in response sucrose feeding
The results in chapters 3.1 – 3.3 of this thesis showed that sucrose and DTT feeding
both lead to a similar increase in redox-activation of enzymes such as AGPase and
ACCase and related metabolic fluxes. However, in contrast to DTT, sucrose led to
these changes without increasing the overall redox-state of the tissue (see above). It
was therefore investigated, whether sucrose also led to a different response
concerning the changes in metabolite and transcript profiles.
3.5.1. Metabolic profiling of Arabidopsis leaves after
sucrose feeding
(-2.00, -1.55) (-1.55, -1.11) (-1.11, -0.66) (-0.66, -0.22) (-0.22, 0.22) (0.22, 0.66) (0.66, 1.11) (1.11, 1.55) (1.55, 2.00) (2.00, 3.00) absent (%)
light reactions 127 0,0 0,0 0,0 14,2 68,5 11,8 2,4 0,0 0,0 0,0 3,1
photorespiration 20 0,0 0,0 5,0 5,0 40,0 35,0 0,0 0,0 0,0 0,0 15,0
Calvin cycle 32 0,0 0,0 3,1 3,1 68,8 12,5 3,1 0,0 0,0 0,0 9,4
starch/sucrose 103 0,0 0,0 0,0 4,9 53,4 17,5 1,0 0,0 0,0 0,0 23,3
glycolysis 62 0,0 0,0 0,0 6,5 37,1 25,8 4,8 0,0 0,0 0,0 25,8
TCA 78 0,0 0,0 0,0 1,3 41,0 34,6 0,0 0,0 0,0 0,0 23,1
fermentation 12 0,0 0,0 0,0 0,0 25,0 25,0 25,0 0,0 0,0 0,0 25,0
gluconeogenesis 10 0,0 0,0 0,0 0,0 50,0 50,0 0,0 0,0 0,0 0,0 0,0
OPP 31 0,0 0,0 0,0 9,7 35,5 32,3 6,5 0,0 0,0 0,0 16,1
mitoch. e transport 99 0,0 1,0 2,0 11,1 47,5 19,2 1,0 1,0 0,0 0,0 17,2
minor CHO 104 0,0 0,0 0,0 4,8 51,0 13,5 1,0 0,0 0,0 0,0 29,8
cell wall 485 0,0 0,4 4,3 14,2 21,4 6,0 0,4 0,0 0,0 0,0 53,2
lipids 384 0,0 0,0 2,1 14,1 37,5 13,8 0,8 0,0 0,0 0,0 31,8
amino acids 318 0,0 0,0 0,6 5,3 49,4 23,0 3,5 0,0 0,0 0,0 18,2
redox 176 0,0 0,0 0,6 8,0 48,9 23,3 2,8 0,6 0,6 1,1 14,2
tetrapyrrole 32 0,0 0,0 0,0 0,0 53,1 21,9 0,0 0,0 0,0 0,0 25,0
nitrate metabolism 23 0,0 0,0 0,0 0,0 65,2 21,7 8,7 0,0 0,0 0,0 4,3
sulfur metabolism 13 15,4 0,0 0,0 15,4 38,5 23,1 7,7 0,0 0,0 0,0 0,0
nucleotides 139 0,0 0,0 0,0 9,4 41,0 24,5 2,2 0,0 0,0 0,0 23,0
2nd metabolism 406 0,0 0,0 1,2 7,4 26,8 11,1 0,7 0,7 0,0 0,0 52,0
percentage of genes involved in different pathways showing decrease (–2 to –0.22), no changes (–0.22 to 0.22) or increase (0.22 to 3) in transcription levels or being absent:
transcription level (in log2 scale):
metabolic pathway
number of genes involved
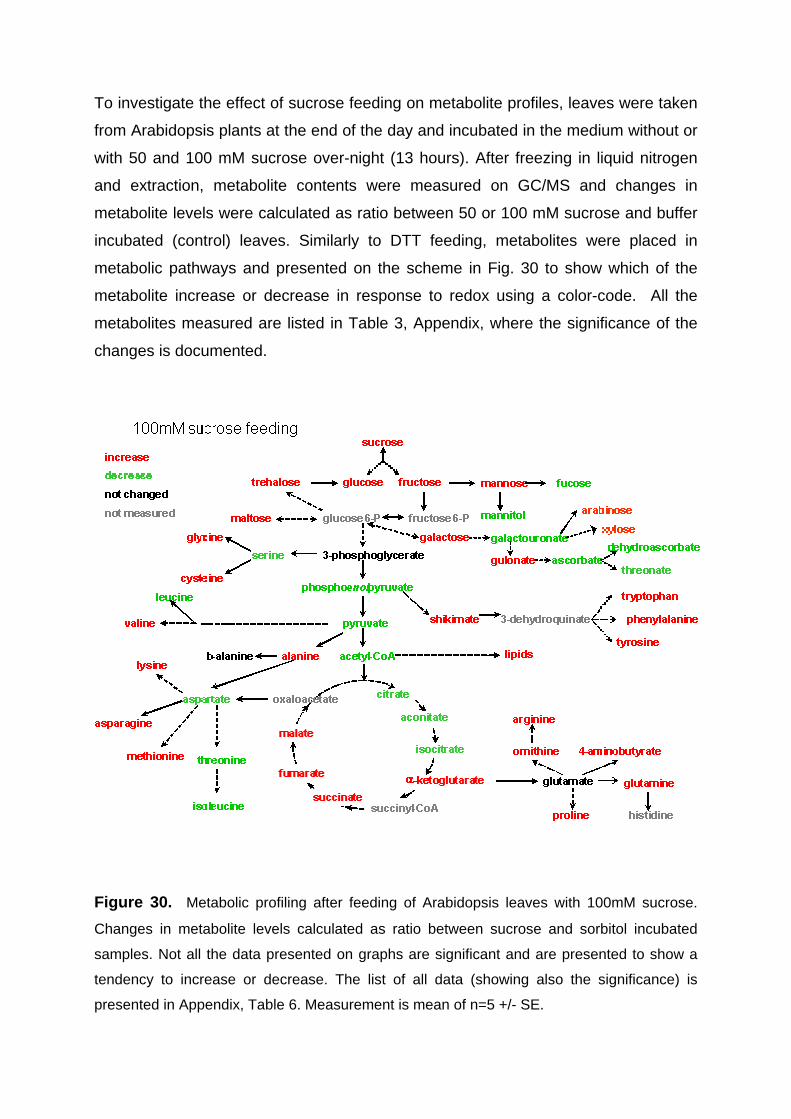
To investigate the effect of sucrose feeding on metabolite profiles, leaves were taken
from Arabidopsis plants at the end of the day and incubated in the medium without or
with 50 and 100 mM sucrose over-night (13 hours). After freezing in liquid nitrogen
and extraction, metabolite contents were measured on GC/MS and changes in
metabolite levels were calculated as ratio between 50 or 100 mM sucrose and buffer
incubated (control) leaves. Similarly to DTT feeding, metabolites were placed in
metabolic pathways and presented on the scheme in Fig. 30 to show which of the
metabolite increase or decrease in response to redox using a color-code. All the
metabolites measured are listed in Table 3, Appendix, where the significance of the
changes is documented.
Figure 30. Metabolic profiling after feeding of Arabidopsis leaves with 100mM sucrose.
Changes in metabolite levels calculated as ratio between sucrose and sorbitol incubated
samples. Not all the data presented on graphs are significant and are presented to show a
tendency to increase or decrease. The list of all data (showing also the significance) is
presented in Appendix, Table 6. Measurement is mean of n=5 +/- SE.
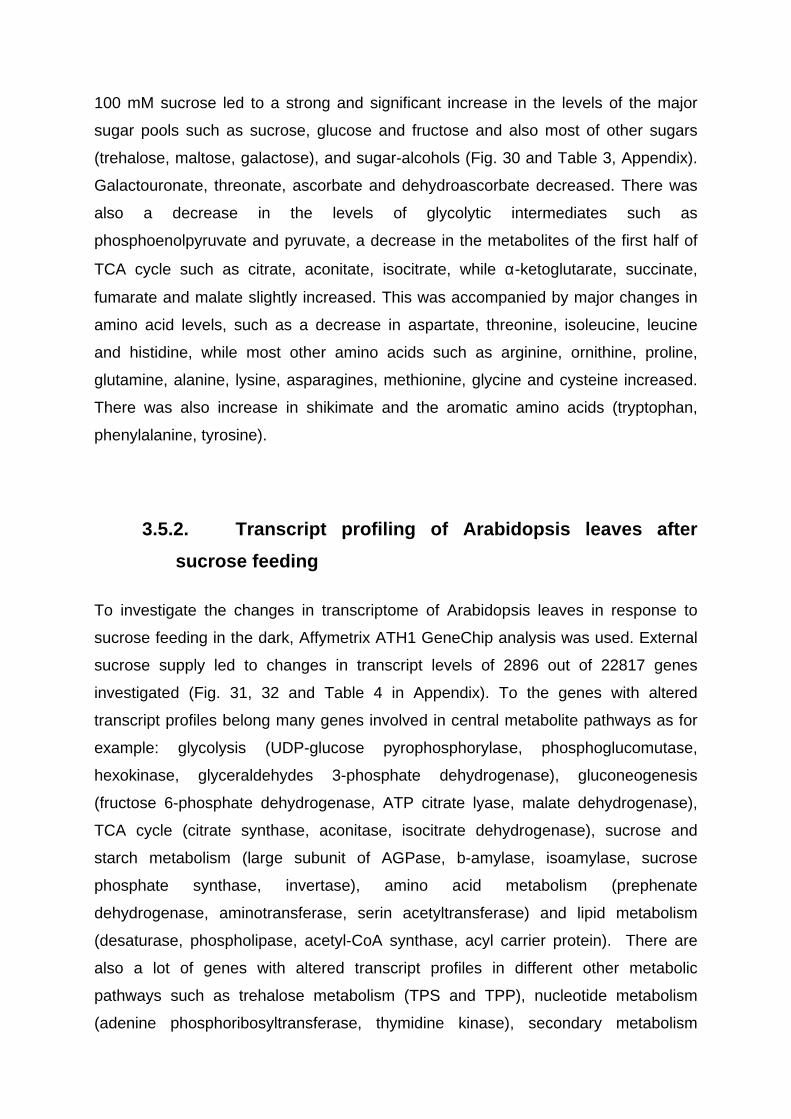
100 mM sucrose led to a strong and significant increase in the levels of the major
sugar pools such as sucrose, glucose and fructose and also most of other sugars
(trehalose, maltose, galactose), and sugar-alcohols (Fig. 30 and Table 3, Appendix).
Galactouronate, threonate, ascorbate and dehydroascorbate decreased. There was
also a decrease in the levels of glycolytic intermediates such as
phosphoenolpyruvate and pyruvate, a decrease in the metabolites of the first half of
TCA cycle such as citrate, aconitate, isocitrate, while α-ketoglutarate, succinate,
fumarate and malate slightly increased. This was accompanied by major changes in
amino acid levels, such as a decrease in aspartate, threonine, isoleucine, leucine
and histidine, while most other amino acids such as arginine, ornithine, proline,
glutamine, alanine, lysine, asparagines, methionine, glycine and cysteine increased.
There was also increase in shikimate and the aromatic amino acids (tryptophan,
phenylalanine, tyrosine).
3.5.2. Transcript profiling of Arabidopsis leaves after
sucrose feeding
To investigate the changes in transcriptome of Arabidopsis leaves in response to
sucrose feeding in the dark, Affymetrix ATH1 GeneChip analysis was used. External
sucrose supply led to changes in transcript levels of 2896 out of 22817 genes
investigated (Fig. 31, 32 and Table 4 in Appendix). To the genes with altered
transcript profiles belong many genes involved in central metabolite pathways as for
example: glycolysis (UDP-glucose pyrophosphorylase, phosphoglucomutase,
hexokinase, glyceraldehydes 3-phosphate dehydrogenase), gluconeogenesis
(fructose 6-phosphate dehydrogenase, ATP citrate lyase, malate dehydrogenase),
TCA cycle (citrate synthase, aconitase, isocitrate dehydrogenase), sucrose and
starch metabolism (large subunit of AGPase, b-amylase, isoamylase, sucrose
phosphate synthase, invertase), amino acid metabolism (prephenate
dehydrogenase, aminotransferase, serin acetyltransferase) and lipid metabolism
(desaturase, phospholipase, acetyl-CoA synthase, acyl carrier protein). There are
also a lot of genes with altered transcript profiles in different other metabolic
pathways such as trehalose metabolism (TPS and TPP), nucleotide metabolism
(adenine phosphoribosyltransferase, thymidine kinase), secondary metabolism
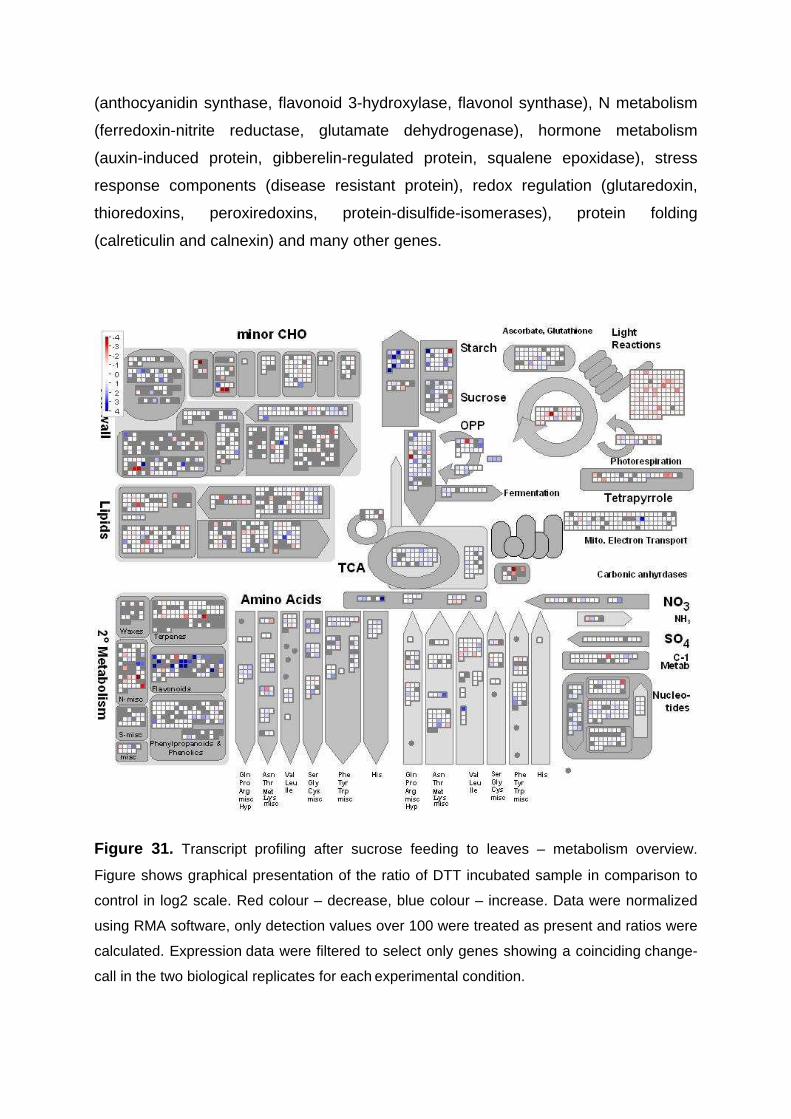
(anthocyanidin synthase, flavonoid 3-hydroxylase, flavonol synthase), N metabolism
(ferredoxin-nitrite reductase, glutamate dehydrogenase), hormone metabolism
(auxin-induced protein, gibberelin-regulated protein, squalene epoxidase), stress
response components (disease resistant protein), redox regulation (glutaredoxin,
thioredoxins, peroxiredoxins, protein-disulfide-isomerases), protein folding
(calreticulin and calnexin) and many other genes.
Figure 31. Transcript profiling after sucrose feeding to leaves – metabolism overview.
Figure shows graphical presentation of the ratio of DTT incubated sample in comparison to
control in log2 scale. Red colour – decrease, blue colour – increase. Data were normalized
using RMA software, only detection values over 100 were treated as present and ratios were
calculated. Expression data were filtered to select only genes showing a coinciding change-
call in the two biological replicates for each experimental condition.
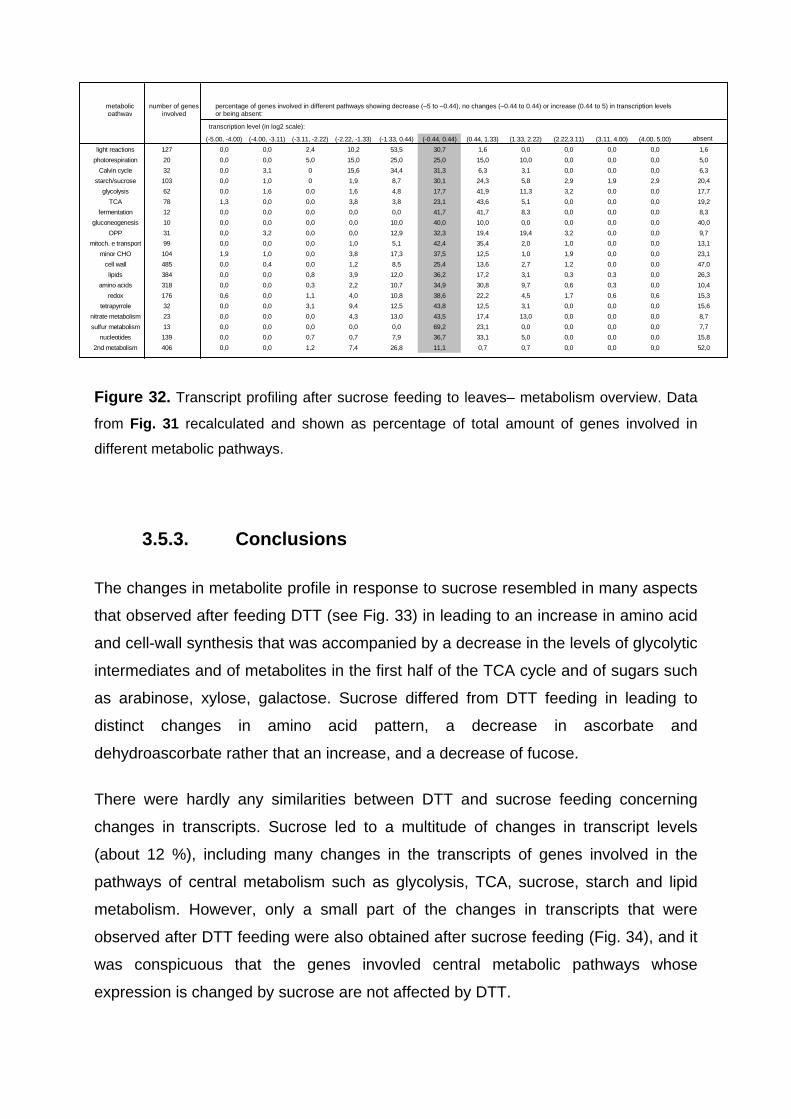
Figure 32. Transcript profiling after sucrose feeding to leaves– metabolism overview. Data
from Fig. 31 recalculated and shown as percentage of total amount of genes involved in
different metabolic pathways.
3.5.3. Conclusions
The changes in metabolite profile in response to sucrose resembled in many aspects
that observed after feeding DTT (see Fig. 33) in leading to an increase in amino acid
and cell-wall synthesis that was accompanied by a decrease in the levels of glycolytic
intermediates and of metabolites in the first half of the TCA cycle and of sugars such
as arabinose, xylose, galactose. Sucrose differed from DTT feeding in leading to
distinct changes in amino acid pattern, a decrease in ascorbate and
dehydroascorbate rather that an increase, and a decrease of fucose.
There were hardly any similarities between DTT and sucrose feeding concerning
changes in transcripts. Sucrose led to a multitude of changes in transcript levels
(about 12 %), including many changes in the transcripts of genes involved in the
pathways of central metabolism such as glycolysis, TCA, sucrose, starch and lipid
metabolism. However, only a small part of the changes in transcripts that were
observed after DTT feeding were also obtained after sucrose feeding (Fig. 34), and it
was conspicuous that the genes invovled central metabolic pathways whose
expression is changed by sucrose are not affected by DTT.
transcription level (in log2 scale):
absent (-5.00, -4.00) (-4.00, -3.11) (-3.11, -2.22) (-2.22, -1.33) (-1.33, 0.44) (-0.44, 0.44) (0.44, 1.33) (1.33, 2.22) (2.22,3.11) (3.11, 4.00) (4.00, 5.00)
light reactions 127 0,0 0,0 2,4 10,2 53,5 30,7 1,6 0,0 0,0 0,0 0,0 1,6
photorespiration 20 0,0 0,0 5,0 15,0 25,0 25,0 15,0 10,0 0,0 0,0 0,0 5,0
Calvin cycle 32 0,0 3,1 0 15,6 34,4 31,3 6,3 3,1 0,0 0,0 0,0 6,3
starch/sucrose 103 0,0 1,0 0 1,9 8,7 30,1 24,3 5,8 2,9 1,9 2,9 20,4
glycolysis 62 0,0 1,6 0,0 1,6 4,8 17,7 41,9 11,3 3,2 0,0 0,0 17,7
TCA 78 1,3 0,0 0,0 3,8 3,8 23,1 43,6 5,1 0,0 0,0 0,0 19,2
fermentation 12 0,0 0,0 0,0 0,0 0,0 41,7 41,7 8,3 0,0 0,0 0,0 8,3
gluconeogenesis 10 0,0 0,0 0,0 0,0 10,0 40,0 10,0 0,0 0,0 0,0 0,0 40,0
OPP 31 0,0 3,2 0,0 0,0 12,9 32,3 19,4 19,4 3,2 0,0 0,0 9,7
mitoch. e transport 99 0,0 0,0 0,0 1,0 5,1 42,4 35,4 2,0 1,0 0,0 0,0 13,1
minor CHO 104 1,9 1,0 0,0 3,8 17,3 37,5 12,5 1,0 1,9 0,0 0,0 23,1
cell wall 485 0,0 0,4 0,0 1,2 8,5 25,4 13,6 2,7 1,2 0,0 0,0 47,0
lipids 384 0,0 0,0 0,8 3,9 12,0 36,2 17,2 3,1 0,3 0,3 0,0 26,3
amino acids 318 0,0 0,0 0,3 2,2 10,7 34,9 30,8 9,7 0,6 0,3 0,0 10,4
redox 176 0,6 0,0 1,1 4,0 10,8 38,6 22,2 4,5 1,7 0,6 0,6 15,3
tetrapyrrole 32 0,0 0,0 3,1 9,4 12,5 43,8 12,5 3,1 0,0 0,0 0,0 15,6
nitrate metabolism 23 0,0 0,0 0,0 4,3 13,0 43,5 17,4 13,0 0,0 0,0 0,0 8,7
sulfur metabolism 13 0,0 0,0 0,0 0,0 0,0 69,2 23,1 0,0 0,0 0,0 0,0 7,7
nucleotides 139 0,0 0,0 0,7 0,7 7,9 36,7 33,1 5,0 0,0 0,0 0,0 15,8
2nd metabolism 406 0,0 0,0 1,2 7,4 26,8 11,1 0,7 0,7 0,0 0,0 0,0 52,0
metabolic pathway
number of genes involved
percentage of genes involved in different pathways showing decrease (–5 to –0.44), no changes (–0.44 to 0.44) or increase (0.44 to 5) in transcription levels or being absent:
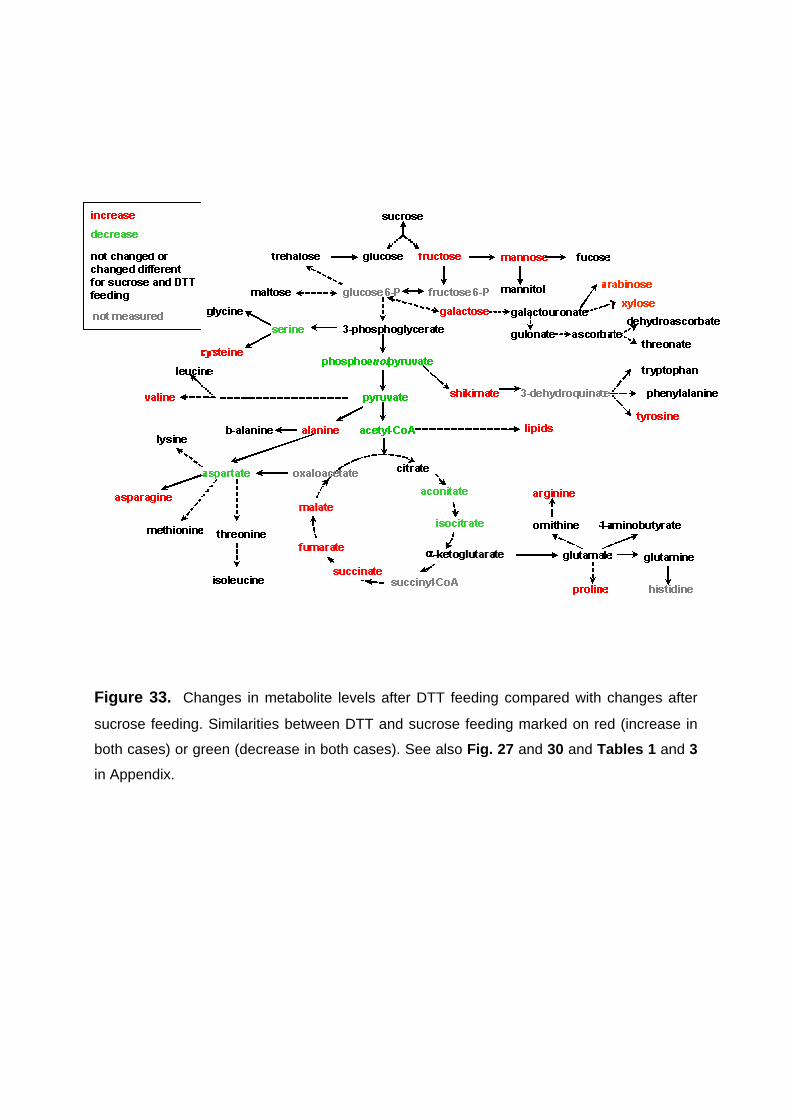
Figure 33. Changes in metabolite levels after DTT feeding compared with changes after
sucrose feeding. Similarities between DTT and sucrose feeding marked on red (increase in
both cases) or green (decrease in both cases). See also Fig. 27 and 30 and Tables 1 and 3
in Appendix.
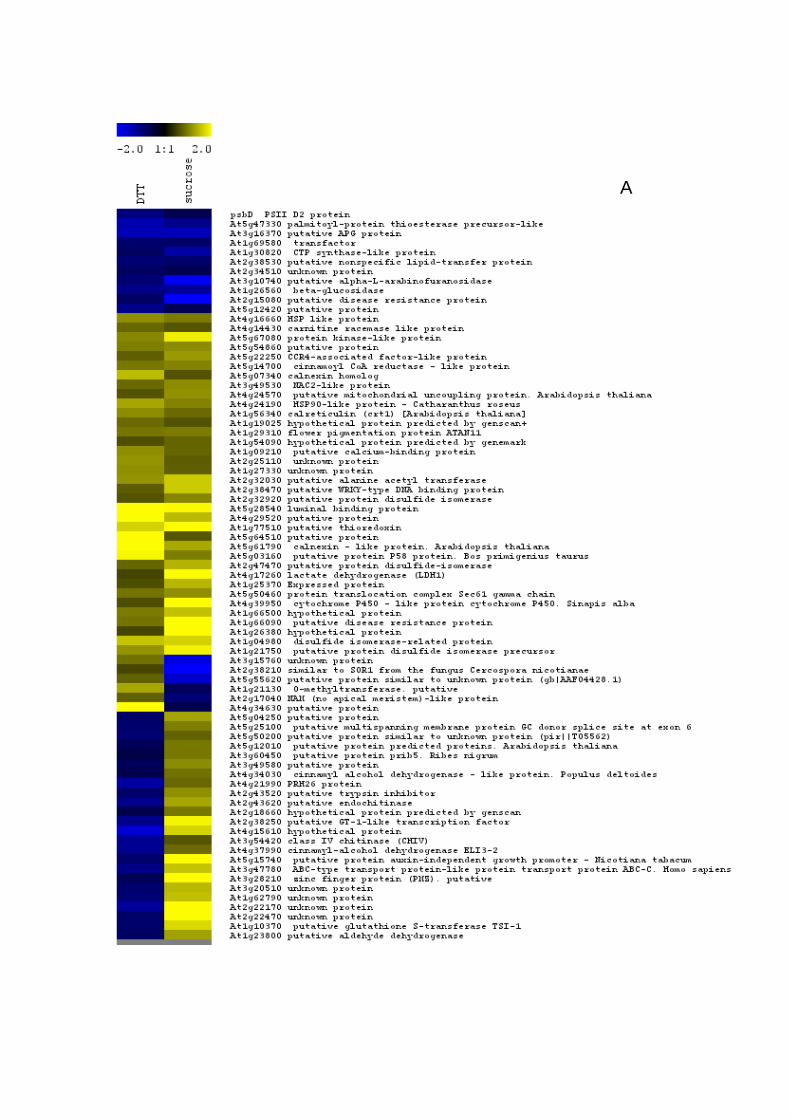
A
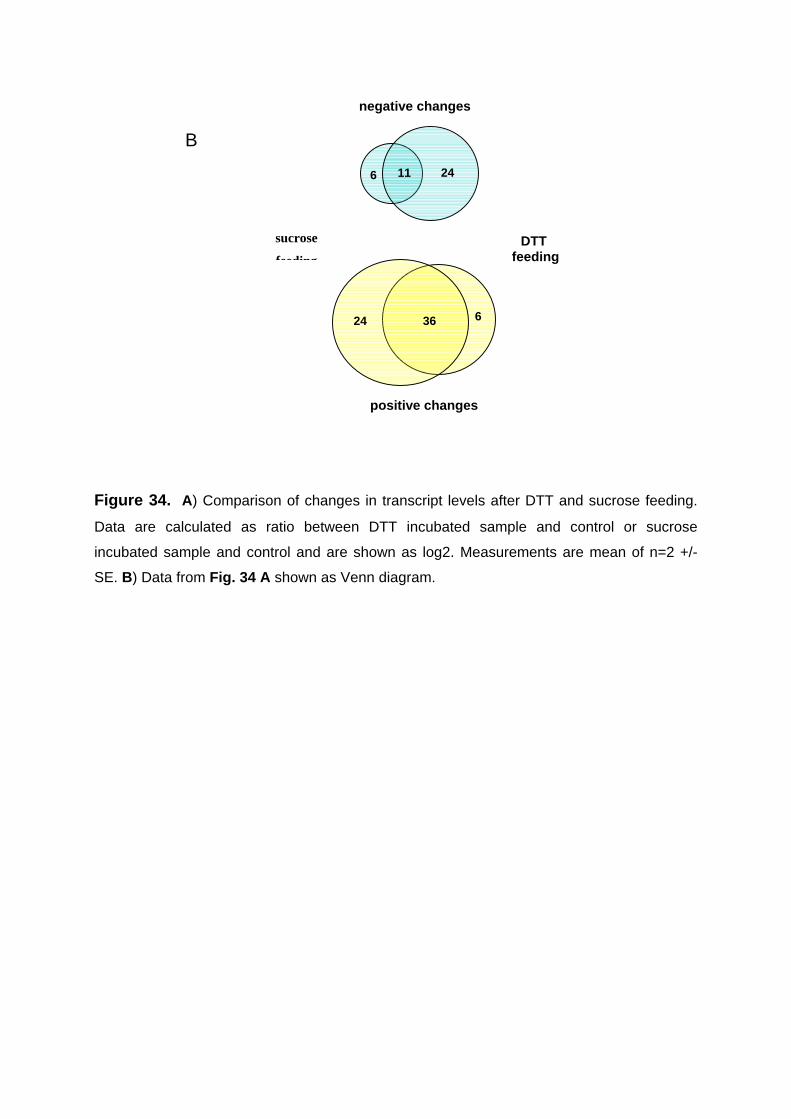
Figure 34. A) Comparison of changes in transcript levels after DTT and sucrose feeding.
Data are calculated as ratio between DTT incubated sample and control or sucrose
incubated sample and control and are shown as log2. Measurements are mean of n=2 +/-
SE. B) Data from Fig. 34 A shown as Venn diagram.
6 11 24
negative changes
sucrose
feeding
DTT feeding
24 6 36
positive changes
B
4. Discussion Posttranslational redox-regulation has been intensively researched during the last 25
years. This mechanism was found to regulate enzymes of the Calvin cycle, oxidative
pentose phosphate cycle, NADPH export and ATP synthesis in response to light
(Buchanan, 1980, 1991; Schürmann and Jacquot, 2000; Schürmann and Buchanan,
2001). The aim of this work was to investigate whether this concept can be extended
to the regulation of starch and lipid synthesis in leaves in vivo. In addition, prompted
by work showing that sugars regulate starch synthesis in potato tubers by post-
translational redox modulation of AGPase, a second aim was to investigate if sugars
regulate starch and lipid synthesis by an analogous mechanism in leaves. If so, this
would establish a immediate link between light regulation, sugar regulation and redox
regulation.
The results in the present thesis showed, that redox-modulation of AGPase provides
a powerful mechanism to regulate starch synthesis in leaves. It was overlooked until
now, because redox modification of AGPase is rapidly reversed under the standard
methods used to extract the protein and analyse its activity. Applying the new TCA-
diethyl ether extraction method followed by SDS-PAGE electrophoresis in non-
reducing conditions allowed the identification of changes in AGPase redox-activation
during day-night alterations. Light (chapter 3.1) and sugars (chapter 3.2) were shown
to provide two independent inputs leading to reductive activation of AGPase
accompanied by an increase in the rate of starch synthesis. It was also
demonstrated, that sucrose acts via trehalose 6-phosphate, which reports the
cytosolic sugar status to the plastid, without changing the redox-state of the cell.
At the start of this thesis there was in vitro evidence showing ACCase to be redox-
regulated in response to light. The development of a new protocol for ACCase activity
measurement enabled finding of changes in ACCase redox-state in-vivo. In
combination wioth flux analyses, this allowed the demonstration that fatty acid
synthesis is redox-regulated in leaves in a similar manner to starch synthesis
(chapter 3.3). ACCase activation decreased during the night and increased during
the day. Feeding of the reducing agent DTT to leaf discs led to re-activation of the
enzyme and stimulation of lipid synthesis in situ. Supply of external sugars to leaves
in the dark also led to post-translational redox-activation of ACCase and stimulation
of lipid synthesis.
Metabolic and transcript profiling (chapter 3.4) provided evidence that post-
translational redox-modification is an important regulatory mechanism in many
biosynthetic pathways, which acts independently of changes in transcript levels.
In the following section the importance of posttranslational redox-regulation in starch,
lipid and variety of other metabolic pathways occurring in leaf tissue will be
discussed.
4.1. Starch synthesis is regulated via redox-
modification of AGPase in response to light and sug ar
signals in leaves
The new extraction method presented in this work revealed that AGPase is subject to
posttranslational redox-regulation in leaves of Arabidopsis, potato and pea (Fig. 3).
When leaves were extracted under either dark or light conditions, using
trichloroacetic acid to quickly denature AGPase before separation on non-reducing
SDS gels, AGPB was found to be completely dimerised in the dark and partly
converted to monomer in the light. Fu et al. (1998) found that an intermolecular
bridge forms between the Cys-82 residues of the two AGPB subunits of the potato
AGPase, when heterologously overexpressed in E. coli. To obtain an active enzyme
it was necessary to incubate the complex with 1-5 mM DTT to break this link. DTT led
to monomerisation of AGPB also in potato tuber extracts (Tiessen et al. 2002).
The shift from a dimer to monomer was accompanied by an increase in AGPase
activity (Fig. 5). This involved the change in kinetic properties, including an increased
affinity for ATP and increased sensitivity to activation by 3PGA. The increase in the
activity is less marked than Tiessen et al. (2002) reported for potato tubers. This may
be due to technical difficulties in retaining AGPB in the in planta status in leaf
extracts. Alternatively, it may reflect a real difference in sensitivity between AGPase
in different plants and organs, due, for example, to association with a different AGPS
isoform.
Light-dependent signal modulates posttranslational redox-activation of AGPase.
Evidence for a light-dependent input is provided by two experiments: AGPB
monomerisation decreases rapidly after darkening wild-type leaves even though
sugar levels do not change (Fig. 6) and increases rapidly after illumination of isolated
chloroplasts (Fig. 7). This is analogous to the way that several Calvin cycle enzymes
and other proteins involved in photosynthesis are regulated (Scheibe, 1991;
Schürmann and Jacquot, 2000).
The light-dependent redox-activation of AGPase can be envisaged to be a direct
result of increased reduction by thioredoxin. To show this a desalted extract of
stromal proteins prepared from chloroplasts of dark-adapted pea leaves was used for
incubation with reduced thioredoxins (Fig. 8). Obtained data indicate that AGPB can
interact with thioredoxin f or m. Results presented in this thesis are also supported by
the studies Ballicora et al. (2000), who was able to show that reduced forms of both
thioredoxins f and m from spinach leaves were able to activate the recombinant
AGPase from potato tubers by up to 4-fold. Fifty percent activation was obtained at
4.5 and 8.7 µM for reduced thioredoxin f and m, respectively. Oxidised thioredoxins
reversed the activation.
However, in both studies the AGPB dimer was not completely converted to
monomers, even when higher concentrations of thioredoxins up to 100 µM were
supplied. One explanation for this is that other thioredoxin isoforms might be more
effective to activate AGPase than thioredoxin f and m. The degree of monomerisation
that was obtained after incubation with these thioredoxins is, however, similar to that
usually observed in illuminated leaves.
A second explanation is that interaction of thioredoxins with AGPase is modulated by
additional factors allowing a further degree of fine control. It has been found for
photosynthetic enzymes that activation by thioredoxin is modified by pH, Mg2+ and
the levels of substrates and products, all of which show marked changes upon light-
dark transitions (Scheibe, 1991). Interestingly, in vitro activation of potato AGPase by
DTT requires the presence of substrates: These are also needed to attain the active
conformation after reduction (Fu et al., 1998).
Monomerisation of AGPase in isolated chloroplasts was promoted by 3PGA but not
by ATP (Fig. 7). This indicates that the reductive activation of AGPase may be
promoted by high 3PGA in leaves. This could provide a mechanism to prevent
depletion of phosphorylated intermediates due to excessive posttranslational
activation of AGPase. The light-dependent activation of photosynthetic enzymes by
thioredoxin was also shown to be modulated by metabolites which modify the mid-
redox potential of the cysteine in the target protein (Sheibe, 1991; Schürmann and
Jacquot, 2000). This provides a mechanism to fine-tune the activity of enzymes at
different sites around the Calvin cycle and poise ATP and NADPH levels production
(Stitt, 1996). More detailed studies are necessary using purified AGPB enzyme to
investigate the affinities of leaf AGPase for different thioredoxin isoforms, and to
investigate whether interaction of AGPase with thioredoxins is modified by low
molecular weight factors.
Sugar-related signal is a second input which modulates AGPase redox-activation in
leaves. It acts independently of light, evidence is provided by experiments showing
that AGPase monomerisation and starch synthesis rate were increased by supplying
exogenous sugars to wild-type leaves in the dark, but 3PGA level was not involved in
the regulation (Fig. 9). When sugars and the light regime are both varied they can
interact in a additive or super-additive manner, as shown in the studies with the pgm
mutant (Appendix, Fig. 36 and Hendriks et al., 2003).
There are two ways how sugars can be linked to redox-regulation: First, via an
increase in the platidial redox-status, second via a signal metabolite that is produced
in the cytosol and transferred to the plastid. After illumination, the NADPH/NADP+
ratio increases, which will favour reductive activation of AGPase. After feeding
sucrose or trehalose, AGPase redox-activation increases even though the
NADPH/NADP+ ratio remained unaltered (Fig. 10). This resembles the situation when
sucrose leads to post-translational redox-activation of AGPase in non-photosynthetic
potato tubers (Tiessen et al. 2002). Studies in growing potato tubers showed that
sucrose and glucose lead to a redox-activation of AGPase via two different signalling
pathways involving an SNF 1-related protein kinase (SnRK1) and an endogenous
hexokinase, respectively (Tiessen et al., 2003). Glucose signalling, acting via
hexokinase, led to an increase in NADPH/NADP+ ratio, whereas sucrose did not
affect it (Tiessen et al., 2003). Both hexokinase and SnRK1 are part of regulatory
network that is proposed to control the expression and phosphorylation of cytosolic
enzymes in response to sugars (Smeekens et al., 2000).
The increased redox-state in response to light reflects the generation of NADPH by
photosynthetic electron transport. The increase after feeding glucose may be
indicative for a stimulation of the oxidative pentose phosphate cycle or other
processes leading to increased reduction of NADP+ to NADPH. An elevated NADPH/
NADP+ ratio will lead to an increase in the reduction state of thioredoxins via the
NADP/thioredoxin reductase or the ferredoxin/NADP reductase systems, and activate
AGPase.
The increase in the NADPH/NADP+ ratio after feeding glucose in the dark probably
involves a plastidic isoform of glucose-6-P dehydrogenase (P2-G6PDH) identified
recently in potato (Wendt et al., 2000) and tobacco (Debnam et al., 2004) that is
much less susceptible to inactivation by thioredoxin and to end-product inhibition by
NADPH (Wendt et al., 2000). It has been proposed that P2-G6PDH could play a role
in the provision of reductant in heterotrophic plastids, where photochemical
processes are absent or contribute to the capacity of chloroplasts to generate
NADPH. Interestingly, overexpression of P2-G6PDH in transgenic tobacco plants led
to an increase in the starch to soluble sugar ratio in leaves (Debnam et al, 2004).
More studies are needed to identify the thioredoxin isoforms in heterotrophic plastids
and the way they are reduced by the activity of the oxidative pentose phosphate
pathway.
Sucrose does not affect the redox-state, which indicates that the sucrose-signal
activates AGPase by modifying the redox-transfer form NADPH via thioredoxins to
AGPase by an unknown factor. In analogy to the well-characterised systems like the
NADP-MDH, these may act by lowering the mid redox point potential of the cysteines
involved in the reversiblke cystein bridge, allowing them to be reduced even though
the redox state of the NADP(H) and thioredoxin pools does not change. Alternatively,
if AGPase is reduced by a specific thioredoxin in situ, these unknown factors might
modulate transfer of reducing equivalents from NADPH or ferredoxin to this specific
thioredoxin.
It was proposed in this work that this additional factor is, or is closely linked to,
trehalose-6-phosphate. In previous studies, T6P has been identified as a cytosolic
signal metabolite that is indispensable for sugar utilisation in plants and other
organisms, but the site of action were largely unresolved (Schluepmann et al., 2003).
4.2. Trehalose 6-phosphate provides a link between
changes in sucrose status of the cytosol and redox-
regulation of AGPase in the plastid
Trehalose (α-D-glucopyranosyl-[1,1]-α-D-glucopyranoside) is a non-reducing sugar
that is made up of two glucose units joined by an α,α-1,1 linkage and is common in
the nature. It functions as a storage carbohydrate and can protect against cellular
damage caused by different stresses in invertebrates, microorganisms and fungi
(Goddijn and Dun, 1999). Recent studies show that the precursor of trehalose, T6P is
an indispensable regulator of sugar utilisation in eucariotic organisms as different as
yeasts and plants (Gacendo and Flores, 2004; Schluepmann et al., 2003). However,
apart from regulating glycolysis by inhibiting hexokinase in some yeast species, other
sites of T6P action are not known (Gacendo and Flores, 2004). No target of T6P has
been found in plants, where hexokinases are insensitive to T6P (Eastmond and
Graham, 2003). In this thesis independent lines of genetic and biochemical evidence
are provided that T6P acts on AGPase by promoting post-translational redox-
activation of the enzyme in response to sucrose thereby controlling starch synthesis
independently of light signals.
In Arabidopsis leaves short-term feeding of trehalose leads to increased T6P levels
within 30 minutes (Schluepmann et al., 2004). In the present work it was shown that
there is an increase in reductive activation of AGPase and starch synthesis following
a similar time frame after supplying trehalose (Fig. 10). This was not paralleled by an
increase in the levels of other sugars or glycolytic intermediates, making it unlikely
that the effect of trehalose was due to its metabolism to glucose, sucrose or
glycolysis. This is consistent with previous studies suggesting that trehalose affects
T6P levels via feedback inhibition of TPP (Schluepmann et al., 2004). Moreover, the
time-course of reductive activation of AGPase in response to sucrose feeding was
different to that of trehalose feeding, with 30 min of sucrose feeding having no effect
on redox-activation of AGPase. Sucrose feeding led to redox-activation of AGPase
and increased starch levels after 3 h, following a similar kinetic as the increase of
T6P under these conditions (Schluepmann et al., 2004).
Transgenic Arabidopsis and tobacco plants with alterations in T6P metabolism
provide genetic evidence that T6P rather than trehalose leads to redox-activation of
AGPase (Fig. 12 and 13). Compared to wild-type, Arabidopsis and tobacco leaves
with T6P levels increased by expression of E.coli TPS in their cytosol (Schluepmann
et al., 2003) showed increased redox-activation of AGPase and increased starch
accumulation during the day, while leaves with T6P levels decreased by
overexpression of TPP showed the opposite. These changes in redox-activation of
AGPase occurred independently of changes in sugars, sugar-phophates or
NADPH/NADP+ ratio, indicating that T6P overrides light-dependent changes in redox-
status and metabolite levels. While AGPase was activated and starch levels
increased by feeding sucrose to leaves of wild-type and TPS-expressing plants, this
response was strongly attenuated in TPP-expressing plants, providing evidence that
T6P links redox-activation of AGPase to sucrose (Fig. 14, 15).
Feeding experiments with isolated chloroplasts provide direct biochemical evidence
that T6P promotes redox-activation of AGPase independently of cytosolic elements
(Fig. 16). Incubation with T6P significantly and specifically increased AGPB
monomerisation and AGPase activity within 15 minutes, while no significant changes
were observed after feeding trehalose or sucrose to the chloroplasts (Fig. 17 A).
Taken together these different approaches provide cumulative evidence that T6P
promotes post-translational redox-activation of AGPase in leaves as a part of a rapid
sugar-signalling response that stimulates carbon storage in response to sugar
availability, reporting on metabolite status between cytosol and chloroplast. The
response most likely involves synthesis of T6P in the cytosol and its subsequent
perception at the chloroplast membrane or, after transport, within the chloroplast.
First, expression of TPS and TPP in the transgenic plants was targeted to the cytosol
which will perturb cytosolic levels of T6P. Second, feeding experiments show that
T6P in concentrations down to 100 µM can act on isolated chloroplasts leading to
redox-activation of AGPase. The T6P content in plants has been reported to be 3-12
nmol/gFW (Schluepmann et al., 2003; 2004). Assuming T6P is in the cytosol and
plastids, representing ca. 10% of the cell volume, 100 µM is within the physiological
range of cytosolic concentrations in plants. For comparison, internal T6P
concentrations in yeast cells have been determined to be in a similar range between
150 and 200 µM, and to transiently rise to 1.5 mM in response to sugars (Blazquez et
al., 1994; van Vaeck et al., 2001; Gacendo and Flores, 2004). T6P had no effect
when fed to chloroplasts that have been disrupted by hypo-osmotic shock showing
that intact chloroplast structures are needed for T6P action. This might be attributable
to specific transport characteristics leading to an accumulation of T6P in intact
chloroplasts, to the importance of T6P interacting factors being present
concentrations similar to those fund in intact chloroplast envelope, or to the
importance of interacting proteins such as thioredoxins being present in
concentrations usually found in intact chloroplast stroma. More experiments are
needed to define also the sensing and/or transport mechanisms of T6P to intact
chloroplasts.
Interestingly, changes in the chloroplast redox-state were not involved in the
reductive activation of AGPase in response to T6P. Neither sugar feeding to leaves
(Fig. 10) nor T6P supply to chloroplasts (Fig. 17 B) led to significant changes in the
platidial redox status. This indicates that T6P promotes redox-transfer from NADPH
or ferredoxin to AGPase rather than leading to increased reduction state of these
redox-systems.
Redox-activation of AGPase in response to sucrose feeding was strongly attenuated
in TPP-expressing plants, showing T6P to be a crucial element in the response of
AGPase to sucrose (Fig. 14, 15). There is evidence documenting that the sensing of
the sugar occurs in the cytosol rather than in the plastid. First, the response of
AGPase to sucrose was dependent on SnRK1 expression in the cytosol (Tiessen et
al., 2003). Second, in the present thesis it was shown that the effect of sucrose on
AGPase was absent in isolated chloroplasts (Fig. 17 A).
The link between sucrose and T6P has not been fully resolved yet, but may involve
regulation of enzymes of T6P metabolism at the transcriptional or post-transcriptional
levels. Arabidopsis contains a family of genes encoding TPS and/or TPP and recent
studies using transcript arrays indicate large diurnal fluctuations in the expression of
these genes (Gibon et al. 2004) which are probably due to changes in the carbon
status of the leaves (Schluepmann et al., 2004). Microarrays also show that
increased T6P levels in transgenic Arabidopsis lines and wild-type plants
exogenously supplied with sugars correlate with increased expression of SnRK1
(Schluepmann et al., 2004; and own data). Whether SnRK1 is acting upstream or
downstream of TPS can not be fully resolved at the moment. The presence of SnRK1
phosphorylation motives in TPS sequences (see Halford et al. 2003) and the finding
that T6P acts on isolated chloroplasts without requiring further cytosolic elements
would be consistent with SnRK1 being an upstream component in this signaling
pathway.
4.3. Importance of redox-regulation of AGPase in
other plant tissues
Almost all dicotyl plant AGPB sequences (with the exception of Citrus unshui) contain
a conserved SQTCLDPDAS motif at the N terminus, which includes the regulatory
cystein identified by Fu et al. (1998) in potato. The importance of redox-regulation of
AGPase for the synthesis of starch in other plant tissues still has to be investigated.
Starch is the major carbon store in cereal seeds, such as maize, rise and wheat.
Monocots contain two types of AGPB transcript: one encodes proteins that contain
this motif, and the other encodes proteins that lack it. The pathway of starch
synthesis in the cereal endosperm is different to other plant species and tissues,
such as leaves and tubers, and involves a cytosolic AGPase in addition to the
plastidic isoform (Teltow et al., 2004). The regulatory cystein is missing in these
cytosolic AGPB isoforms, indicating that the cytosolic AGPase of cereal endosperm
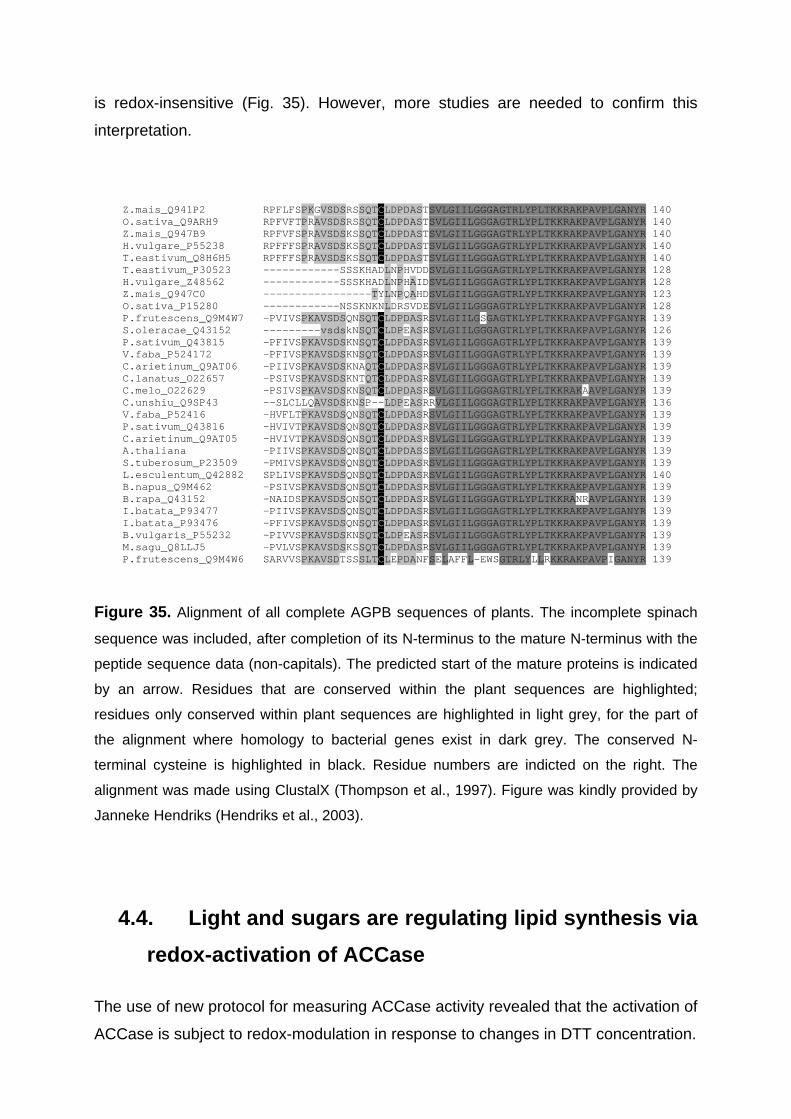
is redox-insensitive (Fig. 35). However, more studies are needed to confirm this
interpretation.
Z.mais_Q941P2 RPFLFSPKGVSDSRSSQTCLDPDASTSVLGIILGGGAGTRLYPLTKKRAKPAVPLGANYR 140 O.sativa_Q9ARH9 RPFVFTPRAVSDSRSSQTCLDPDASTSVLGIILGGGAGTRLYPLTKKRAKPAVPLGANYR 140 Z.mais_Q947B9 RPFVFSPRAVSDSKSSQTCLDPDASTSVLGIILGGGAGTRLYPLTKKRAKPAVPLGANYR 140 H.vulgare_P55238 RPFFFSPRAVSDSKSSQTCLDPDASTSVLGIILGGGAGTRLYPLTKKRAKPAVPLGANYR 140 T.eastivum_Q8H6H5 RPFFFSPRAVSDSKSSQTCLDPDASTSVLGIILGGGAGTRLYPLTKKRAKPAVPLGANYR 140 T.eastivum_P30523 ------------SSSKHADLNPHVDDSVLGIILGGGAGTRLYPLTKKRAKPAVPLGANYR 128 H.vulgare_Z48562 ------------SSSKHADLNPHAIDSVLGIILGGGAGTRLYPLTKKRAKPAVPLGANYR 128 Z.mais_Q947C0 -----------------TYLNPQAHDSVLGIILGGGAGTRLYPLTKKRAKPAVPLGANYR 123 O.sativa_P15280 ------------NSSKNKNLDRSVDESVLGIILGGGAGTRLYPLTKKRAKPAVPLGANYR 128 P.frutescens_Q9M4W7 -PVIVSPKAVSDSQNSQTCLDPDASRSVLGIILGSGAGTKLYPLTKKRAKPAVPFGANYR 139 S.oleracae_Q43152 ---------vsdskNSQTCLDPEASRSVLGIILGGGAGTRLYPLTKKRAKPAVPLGANYR 126 P.sativum_Q43815 -PFIVSPKAVSDSKNSQTCLDPDASRSVLGIILGGGAGTRLYPLTKKRAKPAVPLGANYR 139 V.faba_P524172 -PFIVSPKAVSDSKNSQTCLDPDASRSVLGIILGGGAGTRLYPLTKKRAKPAVPLGANYR 139 C.arietinum_Q9AT06 -PIIVSPKAVSDSKNAQTCLDPDASRSVLGIILGGGAGTRLYPLTKKRAKPAVPLGANYR 139 C.lanatus_O22657 -PSIVSPKAVSDSKNTQTCLDPDASRSVLGIILGGGAGTRLYPLTKKRAKPAVPLGANYR 139 C.melo_O22629 -PSIVSPKAVSDSKNSQTCLDPDASRSVLGIILGGGAGTRLYPLTKKRAKAAVPLGANYR 139 C.unshiu_Q9SP43 --SLCLLQAVSDSKNSP--LDPEASRRVLGIILGGGAGTRLYPLTKKRAKPAVPLGANYR 136 V.faba_P52416 -HVFLTPKAVSDSQNSQTCLDPDASRSVLGIILGGGAGTRLYPLTKKRAKPAVPLGANYR 139 P.sativum_Q43816 -HVIVTPKAVSDSQNSQTCLDPDASRSVLGIILGGGAGTRLYPLTKKRAKPAVPLGANYR 139 C.arietinum_Q9AT05 -HVIVTPKAVSDSQNSQTCLDPDASRSVLGIILGGGAGTRLYPLTKKRAKPAVPLGANYR 139 A.thaliana -PIIVSPKAVSDSQNSQTCLDPDASSSVLGIILGGGAGTRLYPLTKKRAKPAVPLGANYR 139 S.tuberosum_P23509 -PMIVSPKAVSDSQNSQTCLDPDASRSVLGIILGGGAGTRLYPLTKKRAKPAVPLGANYR 139 L.esculentum_Q42882 SPLIVSPKAVSDSQNSQTCLDPDASRSVLGIILGGGAGTRLYPLTKKRAKPAVPLGANYR 140 B.napus_Q9M462 -PSIVSPKAVSDSQNSQTCLDPDASRSVLGIILGGGAGTRLYPLTKKRAKPAVPLGANYR 139 B.rapa_Q43152 -NAIDSPKAVSDSQNSQTCLDPDASRSVLGIILGGGAGTRLYPLTKKRANRAVPLGANYR 139 I.batata_P93477 -PIIVSPKAVSDSQNSQTCLDPDASRSVLGIILGGGAGTRLYPLTKKRAKPAVPLGANYR 139 I.batata_P93476 -PFIVSPKAVSDSQNSQTCLDPDASRSVLGIILGGGAGTRLYPLTKKRAKPAVPLGANYR 139 B.vulgaris_P55232 -PIVVSPKAVSDSKNSQTCLDPEASRSVLGIILGGGAGTRLYPLTKKRAKPAVPLGANYR 139 M.sagu_Q8LLJ5 -PVLVSPKAVSDSKSSQTCLDPDASRSVLGIILGGGAGTRLYPLTKKRAKPAVPLGANYR 139 P.frutescens_Q9M4W6 SARVVSPKAVSDTSSSLTCLEPDANFSELAFFL-EWSGTRLYLLRKKRAKPAVPIGANYR 139
Figure 35. Alignment of all complete AGPB sequences of plants. The incomplete spinach
sequence was included, after completion of its N-terminus to the mature N-terminus with the
peptide sequence data (non-capitals). The predicted start of the mature proteins is indicated
by an arrow. Residues that are conserved within the plant sequences are highlighted;
residues only conserved within plant sequences are highlighted in light grey, for the part of
the alignment where homology to bacterial genes exist in dark grey. The conserved N-
terminal cysteine is highlighted in black. Residue numbers are indicted on the right. The
alignment was made using ClustalX (Thompson et al., 1997). Figure was kindly provided by
Janneke Hendriks (Hendriks et al., 2003).
4.4. Light and sugars are regulating lipid synthesi s via
redox-activation of ACCase The use of new protocol for measuring ACCase activity revealed that the activation of
ACCase is subject to redox-modulation in response to changes in DTT concentration.
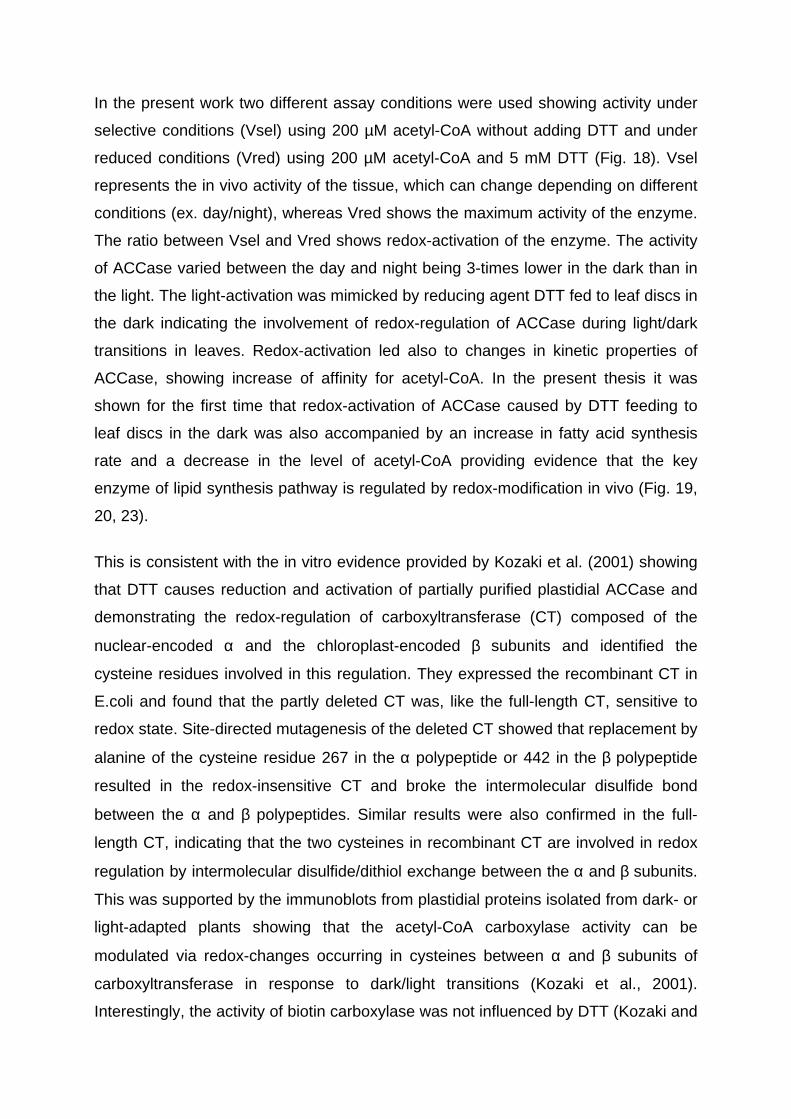
In the present work two different assay conditions were used showing activity under
selective conditions (Vsel) using 200 µM acetyl-CoA without adding DTT and under
reduced conditions (Vred) using 200 µM acetyl-CoA and 5 mM DTT (Fig. 18). Vsel
represents the in vivo activity of the tissue, which can change depending on different
conditions (ex. day/night), whereas Vred shows the maximum activity of the enzyme.
The ratio between Vsel and Vred shows redox-activation of the enzyme. The activity
of ACCase varied between the day and night being 3-times lower in the dark than in
the light. The light-activation was mimicked by reducing agent DTT fed to leaf discs in
the dark indicating the involvement of redox-regulation of ACCase during light/dark
transitions in leaves. Redox-activation led also to changes in kinetic properties of
ACCase, showing increase of affinity for acetyl-CoA. In the present thesis it was
shown for the first time that redox-activation of ACCase caused by DTT feeding to
leaf discs in the dark was also accompanied by an increase in fatty acid synthesis
rate and a decrease in the level of acetyl-CoA providing evidence that the key
enzyme of lipid synthesis pathway is regulated by redox-modification in vivo (Fig. 19,
20, 23).
This is consistent with the in vitro evidence provided by Kozaki et al. (2001) showing
that DTT causes reduction and activation of partially purified plastidial ACCase and
demonstrating the redox-regulation of carboxyltransferase (CT) composed of the
nuclear-encoded α and the chloroplast-encoded β subunits and identified the
cysteine residues involved in this regulation. They expressed the recombinant CT in
E.coli and found that the partly deleted CT was, like the full-length CT, sensitive to
redox state. Site-directed mutagenesis of the deleted CT showed that replacement by
alanine of the cysteine residue 267 in the α polypeptide or 442 in the β polypeptide
resulted in the redox-insensitive CT and broke the intermolecular disulfide bond
between the α and β polypeptides. Similar results were also confirmed in the full-
length CT, indicating that the two cysteines in recombinant CT are involved in redox
regulation by intermolecular disulfide/dithiol exchange between the α and β subunits.
This was supported by the immunoblots from plastidial proteins isolated from dark- or
light-adapted plants showing that the acetyl-CoA carboxylase activity can be
modulated via redox-changes occurring in cysteines between α and β subunits of
carboxyltransferase in response to dark/light transitions (Kozaki et al., 2001).
Interestingly, the activity of biotin carboxylase was not influenced by DTT (Kozaki and
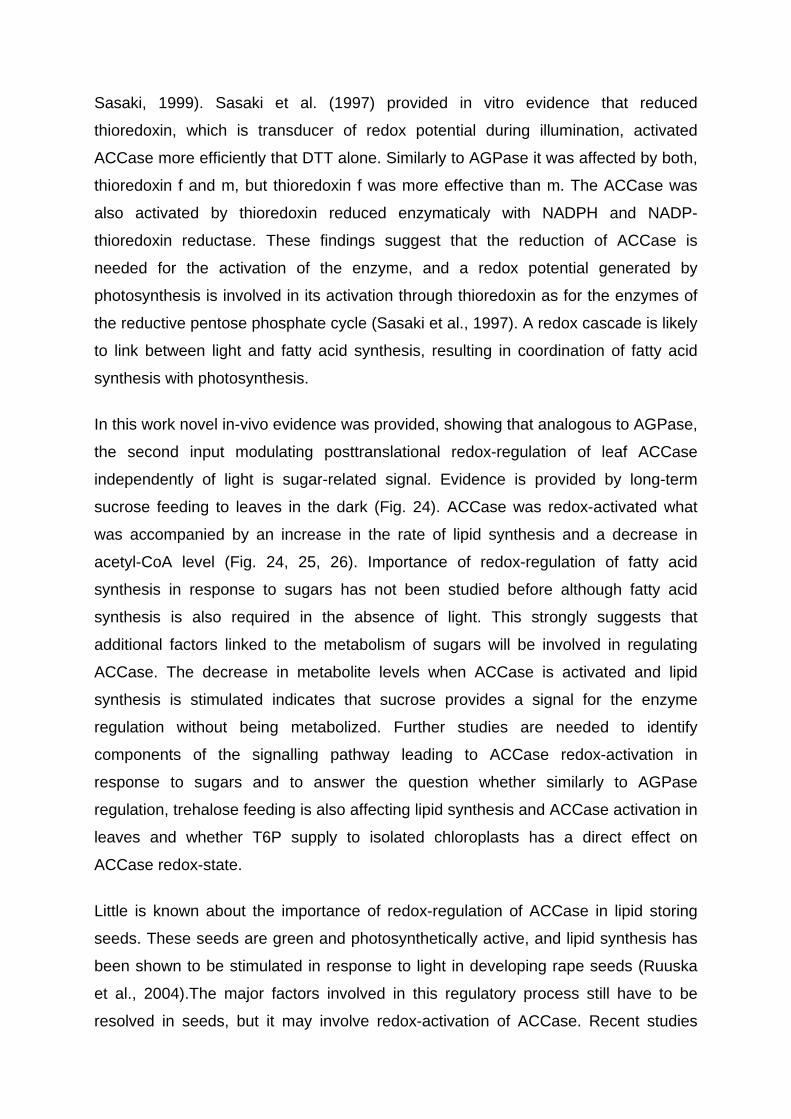
Sasaki, 1999). Sasaki et al. (1997) provided in vitro evidence that reduced
thioredoxin, which is transducer of redox potential during illumination, activated
ACCase more efficiently that DTT alone. Similarly to AGPase it was affected by both,
thioredoxin f and m, but thioredoxin f was more effective than m. The ACCase was
also activated by thioredoxin reduced enzymaticaly with NADPH and NADP-
thioredoxin reductase. These findings suggest that the reduction of ACCase is
needed for the activation of the enzyme, and a redox potential generated by
photosynthesis is involved in its activation through thioredoxin as for the enzymes of
the reductive pentose phosphate cycle (Sasaki et al., 1997). A redox cascade is likely
to link between light and fatty acid synthesis, resulting in coordination of fatty acid
synthesis with photosynthesis.
In this work novel in-vivo evidence was provided, showing that analogous to AGPase,
the second input modulating posttranslational redox-regulation of leaf ACCase
independently of light is sugar-related signal. Evidence is provided by long-term
sucrose feeding to leaves in the dark (Fig. 24). ACCase was redox-activated what
was accompanied by an increase in the rate of lipid synthesis and a decrease in
acetyl-CoA level (Fig. 24, 25, 26). Importance of redox-regulation of fatty acid
synthesis in response to sugars has not been studied before although fatty acid
synthesis is also required in the absence of light. This strongly suggests that
additional factors linked to the metabolism of sugars will be involved in regulating
ACCase. The decrease in metabolite levels when ACCase is activated and lipid
synthesis is stimulated indicates that sucrose provides a signal for the enzyme
regulation without being metabolized. Further studies are needed to identify
components of the signalling pathway leading to ACCase redox-activation in
response to sugars and to answer the question whether similarly to AGPase
regulation, trehalose feeding is also affecting lipid synthesis and ACCase activation in
leaves and whether T6P supply to isolated chloroplasts has a direct effect on
ACCase redox-state.
Little is known about the importance of redox-regulation of ACCase in lipid storing
seeds. These seeds are green and photosynthetically active, and lipid synthesis has
been shown to be stimulated in response to light in developing rape seeds (Ruuska
et al., 2004).The major factors involved in this regulatory process still have to be
resolved in seeds, but it may involve redox-activation of ACCase. Recent studies
made in our lab (P. Waldeck, H. Vigeolas, P. Geigenberger, unpublished) show, that,
both, redox-activation of ACCase and flux to storage lipids were increased in a
similar manner when rape seeds were subjected to light or to external feeding of DTT
or sucrose in planta.
4.5. Post-translational redox-regulation may contro l
different pathways in leaves
DTT feeding was used as a systemic strategy to identify redox-regulated sites of
metabolic pathways. In order to check if redox-modulation is of general consequence
in leaf tissue, DTT feeding experiments were performed and metabolic and transcript
profiles and carbon fluxes to variety of metabolites were analyzed. Obtained results
showed that a short-term increase in the redox-state led to an increased flux of
carbon into lipid, starch, cell wall, major respiratory pathways and amino acid
synthesis without involving significant changes in the levels of major sugars like
sucrose or glucose in leaves in vivo (Fig. 27). This provides the evidence that redox-
modification can be involved in variety of metabolic pathways and control the key
enzymes regulating these pathways in response to physiological and environmental
inputs. This is consistent with the recent proteomic studies, which allowed the
identification of a large number of redox-regulated targets that are involved in
different metabolic pathways inside and outside the plastid (Balmer et al., 2003; Lee
et al., 2004).
DTT feeding led to relatively small number of changes in the transcript profile, that
mainly involved transport of C, N and S-compuonds, mitochondrial electron transport,
some genes involved in amino acid transport and metabolism, protein folding and
disulfide-bond formation and some genes coding for proteins involved in cell wall
assembly. DTT also affected some of the genes coding for signalling components
that may be involved in mediating changes in redox-state to key regulatory sites of
metabolism (Fig. 28, 29 and Table 2, Appendix). Martinez and Chrispeels (2003)
showed that DTT is responsible for UPR (unfolded protein resoponse) in Arabidopsis
plants. When stress causes that protein folding in the endoplasmic reticulum slowes
down, the temporary presence of an aboundance of unfolded proteins triggers the
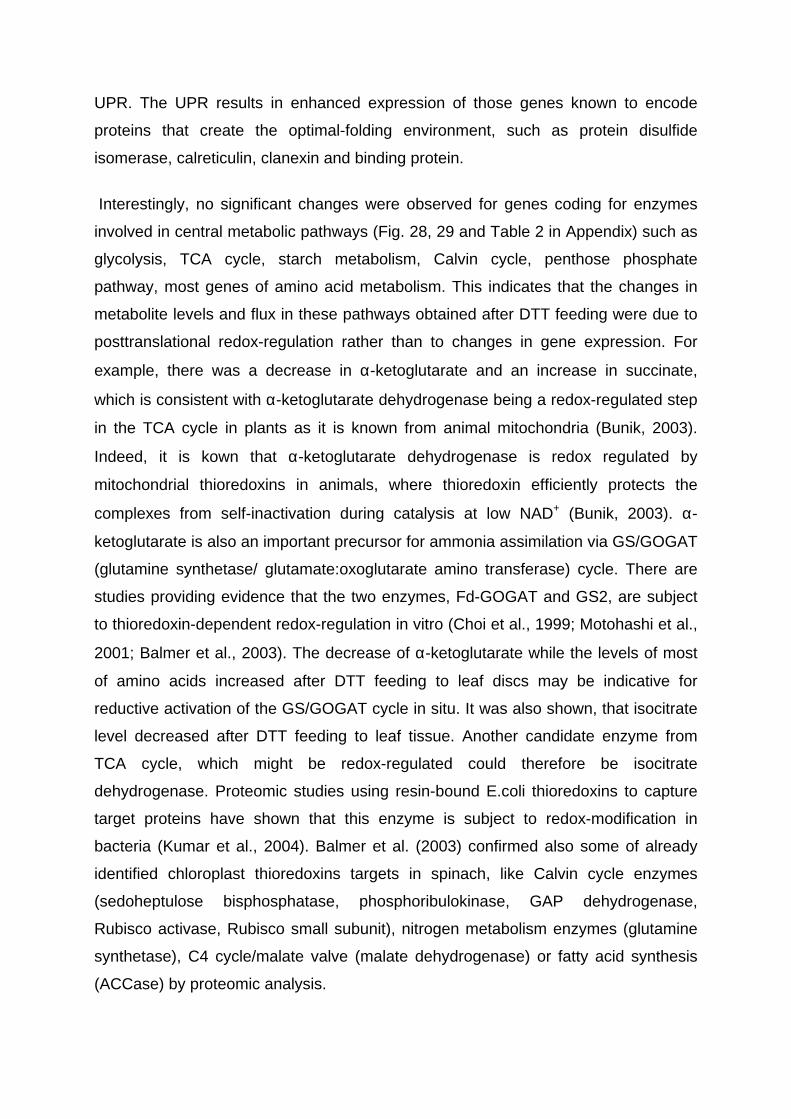
UPR. The UPR results in enhanced expression of those genes known to encode
proteins that create the optimal-folding environment, such as protein disulfide
isomerase, calreticulin, clanexin and binding protein.
Interestingly, no significant changes were observed for genes coding for enzymes
involved in central metabolic pathways (Fig. 28, 29 and Table 2 in Appendix) such as
glycolysis, TCA cycle, starch metabolism, Calvin cycle, penthose phosphate
pathway, most genes of amino acid metabolism. This indicates that the changes in
metabolite levels and flux in these pathways obtained after DTT feeding were due to
posttranslational redox-regulation rather than to changes in gene expression. For
example, there was a decrease in α-ketoglutarate and an increase in succinate,
which is consistent with α-ketoglutarate dehydrogenase being a redox-regulated step
in the TCA cycle in plants as it is known from animal mitochondria (Bunik, 2003).
Indeed, it is kown that α-ketoglutarate dehydrogenase is redox regulated by
mitochondrial thioredoxins in animals, where thioredoxin efficiently protects the
complexes from self-inactivation during catalysis at low NAD+ (Bunik, 2003). α-
ketoglutarate is also an important precursor for ammonia assimilation via GS/GOGAT
(glutamine synthetase/ glutamate:oxoglutarate amino transferase) cycle. There are
studies providing evidence that the two enzymes, Fd-GOGAT and GS2, are subject
to thioredoxin-dependent redox-regulation in vitro (Choi et al., 1999; Motohashi et al.,
2001; Balmer et al., 2003). The decrease of α-ketoglutarate while the levels of most
of amino acids increased after DTT feeding to leaf discs may be indicative for
reductive activation of the GS/GOGAT cycle in situ. It was also shown, that isocitrate
level decreased after DTT feeding to leaf tissue. Another candidate enzyme from
TCA cycle, which might be redox-regulated could therefore be isocitrate
dehydrogenase. Proteomic studies using resin-bound E.coli thioredoxins to capture
target proteins have shown that this enzyme is subject to redox-modification in
bacteria (Kumar et al., 2004). Balmer et al. (2003) confirmed also some of already
identified chloroplast thioredoxins targets in spinach, like Calvin cycle enzymes
(sedoheptulose bisphosphatase, phosphoribulokinase, GAP dehydrogenase,
Rubisco activase, Rubisco small subunit), nitrogen metabolism enzymes (glutamine
synthetase), C4 cycle/malate valve (malate dehydrogenase) or fatty acid synthesis
(ACCase) by proteomic analysis.
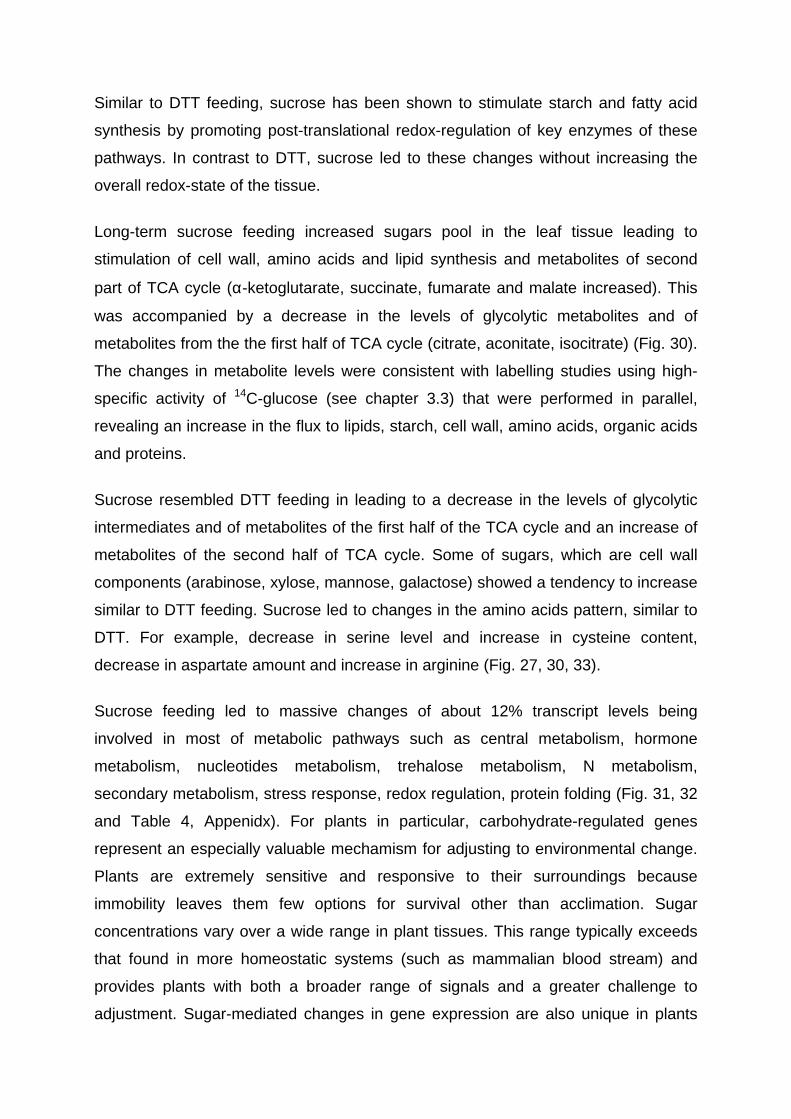
Similar to DTT feeding, sucrose has been shown to stimulate starch and fatty acid
synthesis by promoting post-translational redox-regulation of key enzymes of these
pathways. In contrast to DTT, sucrose led to these changes without increasing the
overall redox-state of the tissue.
Long-term sucrose feeding increased sugars pool in the leaf tissue leading to
stimulation of cell wall, amino acids and lipid synthesis and metabolites of second
part of TCA cycle (α-ketoglutarate, succinate, fumarate and malate increased). This
was accompanied by a decrease in the levels of glycolytic metabolites and of
metabolites from the the first half of TCA cycle (citrate, aconitate, isocitrate) (Fig. 30).
The changes in metabolite levels were consistent with labelling studies using high-
specific activity of 14C-glucose (see chapter 3.3) that were performed in parallel,
revealing an increase in the flux to lipids, starch, cell wall, amino acids, organic acids
and proteins.
Sucrose resembled DTT feeding in leading to a decrease in the levels of glycolytic
intermediates and of metabolites of the first half of the TCA cycle and an increase of
metabolites of the second half of TCA cycle. Some of sugars, which are cell wall
components (arabinose, xylose, mannose, galactose) showed a tendency to increase
similar to DTT feeding. Sucrose led to changes in the amino acids pattern, similar to
DTT. For example, decrease in serine level and increase in cysteine content,
decrease in aspartate amount and increase in arginine (Fig. 27, 30, 33).
Sucrose feeding led to massive changes of about 12% transcript levels being
involved in most of metabolic pathways such as central metabolism, hormone
metabolism, nucleotides metabolism, trehalose metabolism, N metabolism,
secondary metabolism, stress response, redox regulation, protein folding (Fig. 31, 32
and Table 4, Appenidx). For plants in particular, carbohydrate-regulated genes
represent an especially valuable mechamism for adjusting to environmental change.
Plants are extremely sensitive and responsive to their surroundings because
immobility leaves them few options for survival other than acclimation. Sugar
concentrations vary over a wide range in plant tissues. This range typically exceeds
that found in more homeostatic systems (such as mammalian blood stream) and
provides plants with both a broader range of signals and a greater challenge to
adjustment. Sugar-mediated changes in gene expression are also unique in plants
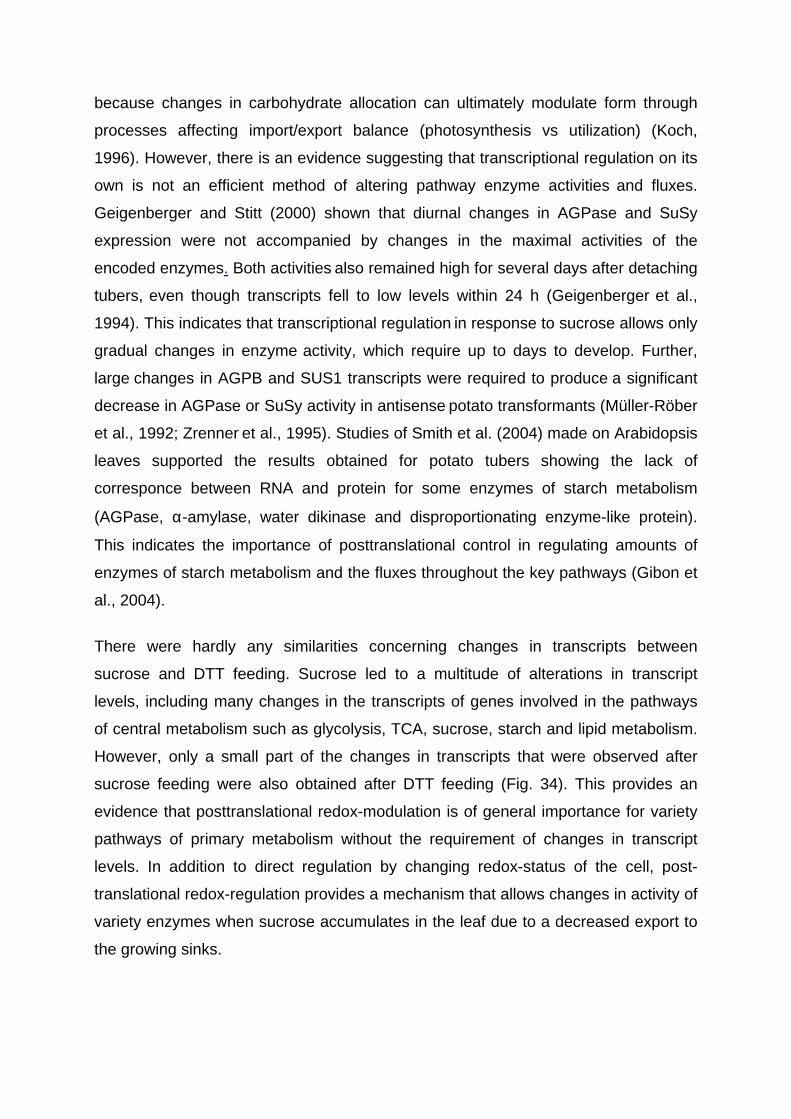
because changes in carbohydrate allocation can ultimately modulate form through
processes affecting import/export balance (photosynthesis vs utilization) (Koch,
1996). However, there is an evidence suggesting that transcriptional regulation on its
own is not an efficient method of altering pathway enzyme activities and fluxes.
Geigenberger and Stitt (2000) shown that diurnal changes in AGPase and SuSy
expression were not accompanied by changes in the maximal activities of the
encoded enzymes. Both activities also remained high for several days after detaching
tubers, even though transcripts fell to low levels within 24 h (Geigenberger et al.,
1994). This indicates that transcriptional regulation in response to sucrose allows only
gradual changes in enzyme activity, which require up to days to develop. Further,
large changes in AGPB and SUS1 transcripts were required to produce a significant
decrease in AGPase or SuSy activity in antisense potato transformants (Müller-Röber
et al., 1992; Zrenner et al., 1995). Studies of Smith et al. (2004) made on Arabidopsis
leaves supported the results obtained for potato tubers showing the lack of
corresponce between RNA and protein for some enzymes of starch metabolism
(AGPase, α-amylase, water dikinase and disproportionating enzyme-like protein).
This indicates the importance of posttranslational control in regulating amounts of
enzymes of starch metabolism and the fluxes throughout the key pathways (Gibon et
al., 2004).
There were hardly any similarities concerning changes in transcripts between
sucrose and DTT feeding. Sucrose led to a multitude of alterations in transcript
levels, including many changes in the transcripts of genes involved in the pathways
of central metabolism such as glycolysis, TCA, sucrose, starch and lipid metabolism.
However, only a small part of the changes in transcripts that were observed after
sucrose feeding were also obtained after DTT feeding (Fig. 34). This provides an
evidence that posttranslational redox-modulation is of general importance for variety
pathways of primary metabolism without the requirement of changes in transcript
levels. In addition to direct regulation by changing redox-status of the cell, post-
translational redox-regulation provides a mechanism that allows changes in activity of
variety enzymes when sucrose accumulates in the leaf due to a decreased export to
the growing sinks.
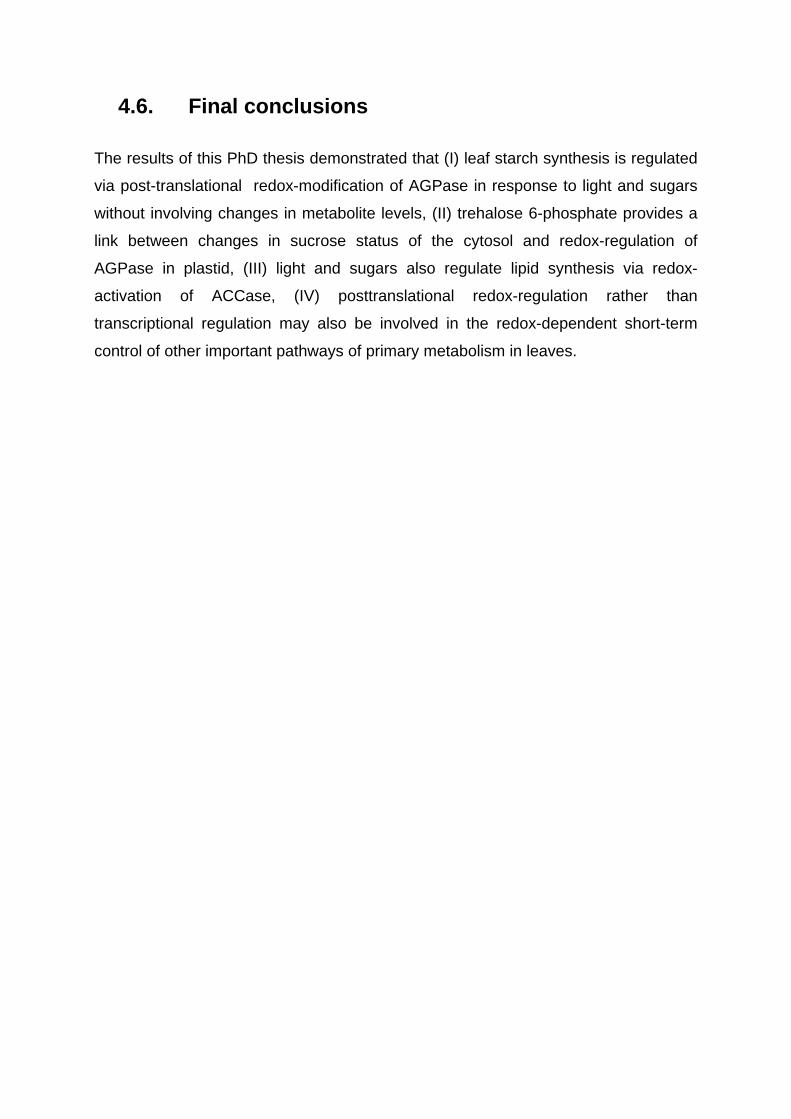
4.6. Final conclusions
The results of this PhD thesis demonstrated that (I) leaf starch synthesis is regulated
via post-translational redox-modification of AGPase in response to light and sugars
without involving changes in metabolite levels, (II) trehalose 6-phosphate provides a
link between changes in sucrose status of the cytosol and redox-regulation of
AGPase in plastid, (III) light and sugars also regulate lipid synthesis via redox-
activation of ACCase, (IV) posttranslational redox-regulation rather than
transcriptional regulation may also be involved in the redox-dependent short-term
control of other important pathways of primary metabolism in leaves.
Abbreviations
[U]-14C-glucose unilabelled 14-C glucose2PGA 2-phosphoglycerate3PGA 3-phosphoglycerateACBP ACP-binding proteinACC carnitine acetyltransferaseACCase acetyl-coenzyme A carboxylaseacetyl-CoA acetyl-coenzyme AACL ATP-citrate lyaseACP pantathein-containing acyl carrier proteinACS acetyl-coenzyme A synthetaseADP adenosine 5'-diphosphateADP-glucose adenosine 5'-diphospho-lucoseAGPase ADP-glucose pyrophosphorylaseAGPB catalycal subunit of AGPaseAGPS regulatory subunit of AGPaseAMP adenosine 5'-monophosphateATP adenosin 5'-triphosphateBC biotin carboxylaseBCCP biotin carboxyl carrier proteinBq bequerell (decays per second)BSA bovine serum albumineCAM crassulacean acid metabolismCF43 tris-(perfluorobutyl)-amineChl chlorophyllCoASH coenzyme ACol-0 Columbia-0CT carboxyltransferaseDAG diacylglycerolDHAP dihydroxyacetone phosphateDPM disintegrations per minuteDTT dithiotreitolE.coli Escherichia coliEDTA ethylenediamine tetraacetic acidEGTA ethylene glycol-bis(b-aminoethyl ether)-N,N,N,N-tetraacetic acidFBPase fructose 1.6-bisphosphataseFd ferredoxinFru1.6bisP fructose 1.6-bisphosphateFru6P fructose 6-phosphateFTR ferredoxin:thioredoxin reductaseFW fresh wieghtG3P glycerol 3-phosphateG6PDH glucose 6-phosphate dehydrogenaseGAP glyceraldehyde 3-phosphateGAPDH glyceraldehyde 3-phosphate dehydrogenaseGBSS granule-bound starch synthaseGC/MS gas chromatography/mass spectrometryGlc glucoseGlc1.6bisP glucose 1.6-bisphosphateGlc1P glucose 1-phosphateGlc6P glucose 6-phosphateGly3PDH gylcerol 3-phosphate dehydrogenaseGly3POX glycerol 3-phosphate oxidaseh hourHepes 4-(2-hydroxyethyl)-1-piperazine-ethanesulphonic acidHexose-P hexose phosphatesHK hexokinaseHPLC high performance liquid chromatographyKAS I β-ketoacyl-ACP reductase
KAS II β-ketoacyl-ACP synthetase IIKAS III β-ketoacyl-ACP synthetase IIIkDa kilodaltonKm Michaelis constantLPA lysophosphatidic acidM molar concentration (mol/litre)MDH malate dehydrogenaseMes 4-morpholine-ethanesulphonic acidMSTFA N-methyl-N-(trimetylsilyl)trifluoroacetamideMTT 3-[4.5-dimethylthiazol-2-yl]-2.5-diphenyl tetrazolium bromiden number of measurements used to calculate the meanNAD+ nicotinamide adenine dinucleotide (oxidized)NADH nicotinamide adenine dinucleotide (reduced)NADP+ nicotinamide adenine dinucleotide phosphate (oxidized)NADPH nicotinamide adenine dinucleotide phosphate (reduced)PAGE polyacryloamide gel electrophoresisPC phosphatydylcholinePDC pyruvate dehydrogenase complexPEP phosphoenolpyruvatePGI phosphoglucoisomerasePGM phosphoglucomutasepH negative decaic logarithm of the proton concentration in mol per litrePi inorganic orthophosphatePK pyruvate kinasePMS phenazine methosulphatePpi inorganic orthophosphatePyr DH pyruvate dehydrogenasePyr kinase pyruvate kinaseRNA ribonucleic acidRT room temperatureRubisco ribulose 1.5-bisphosphate carboxylaseSBE starch branching enzymeSD standard deviationSDS sodium dodecylsulfateSE standard errorSNF1 sucrose non-fermeting protein kinaseSnRK1 SNF-like protein kinaseSPPase sucrose-phosphate phosphataseSPS sucrose-phosphate synthaseSuc sucroseT6P trehalose 6-phosphateTAG triacylglycerolTCA trichloroacetic acidTEMED N,N,N,N-tetramethyl ethylenediamineTLC thin layer chromatographyTPP T6P phosphataseTPS T6P synthaseTPT triose-phosphate transporterTPT triose-phosphate transporterTRE trehalaseTricine N-[2-hydroxy-1,1-bis(hydroxymethyl)ethyl]glycineTris 2-amino-2-hydroxymethylpropane-1.3-diolU unit of enzyme activity (1µmol substrate per minute)UDP uridin diphosphateUGPase UDP-glucose pyrophosphorylasew/v weight per volume (g in 100 ml)w/w weight per weightWt wild type
Refferences Ainsworth C, Tarvis M, Clark J (1993). Isolation and analysis of a cDNA clone
encoding the small subunit of ADP-glucose pyrophosphorylase from wheat. Plant Mol Biol 23: 23-33.
Alban C, Baldet P, Douce R (1994). Localization and characterization of two structurally different forms of acetyl-CoA carboxylase in young pea leaves, of which one is sensitive to aryloxyphenoxypropionate herbicides. Biochem J 300: 557-565.
Ballicora MA, Frueauf J, Fu Y, Schürmann P, Preiss J (2000). Activation of the potato tuber ADP-glucose pyrophosphorylase by thioredoxin. J Biol Chem 275: 1315-1320.
Balmer Y, Koller A, del Val G, Manieri W, Schürmann P, Buchanan BB (2003). Proteomics gives insight into the regulatory function of chloroplast thioredoxins. Proc Nat Acad Sci 101: 2642-2647.
Baxter CJ, Foyer C, Rolfe SA, Quick WP (2001). A comparison of the carbochydrate composition and kinetic properties of sucrose phosphate synthase (SPS) in transgenic tobacco (Nicotiana tabacum) leaves expressing maize SPS protein with untransformed controls. Ann Appl Biol 138: 47-55.
Blazquez MA, Gacendo JM and Gacendo C (1994). Use of Yarrowia lipolytica hexokinase for the quantitative determination of trehalose 6-phopshate. FEMS Microbiol. Lett. 121: 223-228.
Bligh EG, Dyer WJ (1959). A rapid method of total lipid extraction and purification. Can J Biochem Phys 37: 911-917.
Buchanan BB, Wolosiuk RA (1978). Regulation of chloroplast phosphoribulokinase by ferredoxin/thioredoxin system. Arch Biochem Biophys 189(1): 97-101.
Buchanan BB (1980). Role of light in the regulation of chloroplast enzymes. Ann Rev of Plant Phys 31: 341-374.
Buchanan BB (1991). Regulation of CO2 assimilation in oxygenic photosynthesis: the ferredoxin/thioredoxin system. Perspective on its discovery, present status, and future development. Arch Biochem Biophys 288: 1-9.
Buchanan BB and Balmer Y (2005). Redox regulation: a broadening horizon. Annu Rev Plant Biol 56: 187-220.
Bunik VI (2003). 2-oxo acid dehydrogenase complexes in redox regulation. Role of the lipoate residues and thioredoxin. Eur J Biochem 270: 1036-1046.
Burton RA, Bewley J, Smith AM, Bhattacharyya MK, Tatge H, Ring S, Bull V, Hamilton WDO, Martin C (1995). Starch branching enzymes belonging to distinct enzyme families are differentially expressed during pea embryo development. Plant J 7: 3-15.
Burton RA, Johnson P, Beckles DM, Fincher GB, Jenner HL, Naldrett MJ, Deyner K (2002). Characterisation of the genes encoding the cytosolic and plastidial forms of ADP-glucose pyrophosphorylase in wheat endosperm. Plant Physiol 130: 1464-1475.
Caffrey JJ, Choi JK, Wurtele ES, Nikolau BJ (1998). Tissue distribution of acetyl-CoA carboxylase in leaves of leek (Allium porrum L.). J Plant Physiol 153: 265-269.
Caspar T, Huber S, Somerville C (1986). Alterations in growth, photosynthesis and respiration in a starch deficient mutant of Arabidopsis thaliana (L.) Heynh deficient in chloroplast phophoglucomutase activity. Plant Physiol 79: 1-7.
Castresana A (2000). Selection of conserved blocks from multiple alignments for their use in phylogenetic analysis. Mol Biol Evol 17: 540-552.
Choi YA, Kim SG, Kwon YM (1999). The plasitidic glutamine synthetase activity is directly modulated by means of redox change at two unique cystene residues. Plant Sci 149: 175-182.
Cui X, Wise RP, Schnable PS (1996). The rf2 nuclear restorer gene of male-sterile T- cytoplasm maize. Science 272: 1334-1336.Debnam PM, Fernie AR, Leisse A, Golding A, Bowsher CG, Grimshaw C, Knight JS, Emes MJ (2004). Altered activity of the P2 isoform of plastidic glucose 6-phosphate dehydrogenase in tobacco (Nicotiana tabacum cv. Samsun) causes changes in carbohydrate metabolism and response to oxidative stress in leaves. Plant J 38: 49-59.
Dennis DT, Layzell DB, Lefebre DD, Turpin DH (1997). Plant Metabolism (Essex, England: Addison Wesley Longman).
Dickinson DB Preiss J (1969). ADP-glucose pyrophosphorylase from maize endosperm. Arch Biochem Biophys 130: 119-128.
Draborg H, Villadsen D, Nielsen TH (2001). Transgenic Arabidopsis plants with decreased activity of fructose-6-phosphate, 2-kinase/fructose-2, 6-bisphosphatase have altered carbon partitionig. Plant Physiol 126: 750-758.
Eastmond PJ, Graham IA (2003). Trehalose metabolism: a regulatory role for trehalose 6-phosphate? Cur Opinion Plant Biol 6: 231-235.
Edwards G, Walker D (1983). C3, C4, mechanisms and cellular and environmental regulation of photosynthesis. Blackwell Scientific, Oxford.
Fischer BU, Frehner M, Hebeisen T, Zanetti S, Stadelmann F, Luescher A, Hartwig UA, Hendrey GR, Blum H, Nösberger J (1997). Source-sink relations in Lolium perenne L. as reflected by carbohydrate concentrations in leaves and pseudo-stems during regrowth in a free air carbon dioxide enrichment (FACE) experiment. Plant Cell Environ 20: 945-952
Frizius T, Aeschbacher R, Wiemken A, Wingler A (2001). Induction of ApL3 expression by trehalose complements the starch-deficient Arabidopsis mutant adg2-1 lacking ApL1, the large subunit of ADP-glucose pyrophosphorylase. Plant Physiol. 126: 883-889.
Fu Y, Ballicora M, Leykam JF, Preiss J (1998). Mechanism of reductive activation of potato tuber ADP-glucose pyrophosphorylase. J Biol Chem 273: 25045-25052.
Gacendo C, Flores CL (2004). The importance of functional trehalose biosynthetic pathway for the life of yeasts and fungi. FEMS Yeast Res 4: 351-359.
Geigenberger P, Merlo L, Reimholz R, Stitt M (1994). When growing potato tubers are detached from their mother plant there is a rapid inhibition of starch synthesis, involving inhibition of ADP-glucose pyrophosphorylase. Planta 193: 486-493.
Geigenberger P, Lerchl J, Stitt M, Sonnewald U (1996). Phloem-specific expression of pyrophosphorylase inhibits long distance transport of carbohydrates and amino acids in tobacco plants. Plant Cell Environ 19: 43-55.
Geigenberger P, Reimholz R, Geiger M, Merlo L, Canale V, Stitt M (1997). Regulation of sucrose and starch metabolism in potato tubers in response to short-term water deficit. Planta 201: 502-518.
Geigenberger P, Stitt M (2000). Diurnal changes in sucrose, nucleotides, starch synthesis and AGPS transcript in growing potato tubers that are suppressed by decreased expression of sucrose phosphate synthase. Plant J 23: 795-806.
Geiger DR, Servaites J (1994). Diurnal regulation of photosynthetic carbon metabolism in C3 plants. Annu Rev Plant Phys Plant Mol Biol 45: 235-256.
Geiger DR, Shieh W, Yu X-M (1995). Photosynthetic carbon metabolism and translocation in wild-type and starch-deficient mutant Nicotiana sylvestris L. Plant Physiol 107: 507-514.
Gibon Y, Vigeolas H, Tiessen A, Geigenberger P, Stitt M (2002). Sensitive and high throughput metabolic assays for inorganic pyrophosphate, ADPglc, nucleotide phosphates and glycolitic intermediates, based on a novel enzymic cycling system. Plant J 30: 221-235.
Gibon Y, Bläsing OE, Palacios-Rojas N, Pankovic D, Hendriks JHM, Fisahn J, Höhne M, Günther M, Stitt M (2004). Adjustment of diurnal starch turnover to short days: depletion of sugar during the night leads to a temporary inhibition of carbohydrate utilization, accumulation of sugars and post-translational activation of ADP-glucose pyrophosphorylase in the following light period. Plant J 39; 847-862.
Goddjin O, Smeekens S (1998). Sensing trehalose biosynthesis in plants. Plant J 14: 143-146.
Goddjin OJM, van Duk K (1999). Trehalose metabolism in plants. Trends Plant Sci 4: 315-319.
Goddjin OJM, Verwoerd T, Voogd E, Krutwagen RW, de Graaf PT, van Dun K, Poels J, Ponstein AS, Damm B, Pen J (1997). Inhibition of trehalase activity enhances trehalose accumulation in transgenic plants. Plant Physiol 113: 181-190.
Goldschmidt EE, Huber S (1992). Regulation of photosynthesis by endproduct accumulation in leaves of plants storing starch, sucrose and hexose sugars. Plant Physiol 99: 1443-1448.
Halford NG, Hey S, Jhurreea D, Laurie S, McKibbin RS, Paul M, Zhang Y (2003). Metabolic signalling and carbon partitioning: role of Snf-1 related (SnRK1) protein kinase. J of Exp Botany 54: 467-475.
Hartman H, Syvanen M, Buchana BB (1990). Contrasting evolutionary histories of chloroplast thioredoxins f and m. Mol Biol Evol 7(3): 247-254.
Harwood Jl (1988). Fatty acid metabolism. Ann Rev Plant Physiol Mol Biol 39: 101-138.
Häusler RE, Schlieben N, Flügge UI (2000). Control of carbon partitioning and photosynthesis by the triose phosphate/ phosphate translocator in transgenic tobacco plants (Nicotiana tabacum): II. Assessment of control coefficients of the triose phosphate/ phosphate translocator. Planta 210: 383-390.
Heldt HW, Chon C, Maronde D, Herold A, Stankovic ZS, Walker DA, Kraminer A, Kirk MR, Heber U (1977). Role of orthophosphate and other factors in the regulation of starch formation in leaves and isolated chloroplast. Plant Physiol 59: 1146-1155.
Herold (1980). Regulation of photosynthesis by sink activity: the missing link. New Phytol 86: 131-144.
Huber (1989). Biochemical mechanism for regulation of sucrose accumulation in leaves during photosynthesis. Plant Physiol 91: 656-662.
Hunter SC, Ohlrogge JB (1998). Regulation of spinach chloroplast acetyl-CoA carboxylase. Arch Biochem Biophys 359: 170-178.
Iglesisas AA, Barry GF, Meyer C, Bloksberg L, Nakata PA, Greene T, Laughlin MJ, Okita TW, Kishore GM, Preiss J (1993). Expression of the potato tuber ADP-glucose pyrophosphorylase in Escherichia coli. J Biol Chem 268: 1081–1086
Jacquot JP, Vidal J, Gadal P (1976). Identification of a protein factor involved in dithiotreitol activation of NADP-malate dehydrogenase. FEBS Lett 71: 223-227.
Jacquot JP, Vidal J, Gadal P, Schürmann P (1978). Evidence for the existence of several enzyme specific thioredoxins in plants. FEBS Lett 96: 243.246.
Ke J, Tuan-Nan W, Nikolau BJ, Wurtele ES (2000). Coordinate regulation of the nuclear and plastidic genes coding for the subunits of the heteromeric acetyl-CoA carboxylase. Plant Phys 122: 1057-1071.
Koch KE (1996). Carbohydrate-modulated gene expression in plants. Annu Rev Plant Physiol Plant Mol Biol 47: 509-540.
Kofler H, Häusler R, Schult B, Groner F, Flügge UI, Weber A (2000). Molecular characterisation of a new mutant allele of the plastid phosphoglucomutase in Arabidopsis, and complementation of the mutant with the wild-type cDNA. Mol Gen Genet 263: 978-986.
Kozaki A, Sasaki Y (1999). Light-dependent changes in redox status of the plastidic acetyl-CoA carboxylase and its regulatory component. Biochem J 339: 541-546.
Kozaki A, Mayumi K, Sasaki Y (2001). Thiol-disulfide between nuclear-encoded and chloroplast-encoded subunits of pea acetyl-CoA carboxylase. J Biol Chem, Manuscript M103525200.
Krapp A, Quick W, Stitt M (1991). Rubisco, other Calvin cycle enzymes and chlorophyll decrease when glucose is supplied to mature spinach leaves via the transpiration stream. Planta 186: 58-69.
Krapp A, Stitt M (1995). An evaluation of direct and indirect mechanisms for the "sink regulation" of photosynthesis of spinach: changes in gas-exchange, carbohydrates, metabolites, enzyme activities and steady-state transcript levels after cold girdling of suorce leaves. Planta 195: 313-323.
Kuhn DN, Knauf MJ, Stumpf PK (1981). Subcellular localization of acetyl-CoA synthesis in leaf protoplasts of Spinachia olearca. Arch Biochem Biophys 209: 441-450.
La Cognata U, Willmitzer L, and Müller-Rober B (1995). Molecular cloning and characterization of novel isoforms of potato ADP-glucose pyrophosphorylase. Mol Gen Genet 246: 538–548.
Laemmli (1970). Cleavage of structural proteins during assembly of the head of bacteriophage T4. Nature 227: 680-685.
Laporte MM, Galagan J, Prasch AL, Vanderveer PJ, Hanson DT, Shew-maker CK, Sharkey TD (2001). Promoter strength and tissue specificity effects on growth of tomato plants transformed with maize sucrose-phosphate synthase. Planta 212: 817-822.
Lee K, Lee J, Kim Y, Bae D, Kang KY, Yoon SC, Lim D (2004). Proteomic analysis of thioredoxin-targeted proteins in Escherichia coli. Biochem Biophys Acta 1659: 212-220.
Lemaire SD, Collin V, Keryer E, Quasada A, Miginiac-Maslow M (2003). Characterisation of thioredoxin y, a new type of thioredoxin identified in Chlamydomonas reinhardtii. FEBS Lett 543: 87-92.
Leustek T, Saito K (1999). Sulfate transport and assimilation in plants. Plant Physiol 120: 637-644.
Lunn JE, Droux M, Martin J, Douce R (1990). Localisation of ATP sulfurylase and O-
acetylserine(thiol)lyase in spinach leaves. Plant Physiol 94: 1345-1352.
Lunn JE, Douce R (1993). Transport of inorganic pyrophosphate across the spinach chloroplast envelope. Biochem J 290: 375-379.
Markham JE, Kruger N (2002). Kinetic properties of bifunctional 6-phosphofructo-2-kinase/fructose-2, 6-bisphosphatase from spinach leaves. Eur J Biochem 269: 1267-1277.
Martin C, Smith A (1995). Starch biosynthesis. Plant Cell Environ 7: 971-985. Merlo L, Geigenberger P, Hajirezaei M, Stitt M (1993). Changes of carbohydrates,
metabolites and enzyme activities in potato tubers during development, and within a single tuber along a stolon-apex gradient. J of Plant Physiol 142: 392-402.
Mestres-Ortega D, Meyer Y (1999). The Arabidopsis thaliana genome encodes at least four thioredoxins m and a new procariotic-like thioredoxin. Gene 240: 307-316.
Morell MK, Bloom M, Knowles V, Preiss J (1987). Subunit structure of spinach leaf ADPglucose pyrophosphorylase. Plant Physiol 85: 182-187.
Motohashi K, Kondoh A, Stumpp MT, Hisabori T (2001). Comprehensive survey of proteins targeted by chloroplast thioredoxin. Proc Nat Acad Sci 98: 11224-11229.
Müller J, Boller T, Wiemken A (1995). Trehalose and trehalase in plants: recent developments. Plant Sci 112: 1-9.
Müller-Röber BT, Kossmann J, Hannah LC, Willmitzer L, Sonnewald U (1990). One of two different ADP-glucose pyrophosphorylase genes from potato responds strongly to elevated levels of sucrose. Mol Gen Genet 224: 136-146.
Müller-Röber B, Sonnewald U, Willmitzer L (1992). Inhibition of ADP-glucose pyrophosphorylase leads to sugar storing tubers and influences tuber formation and expression of tuber storage protein genes. EMBO J 11: 1229-1238.
Müller-Röber B, La Cognata U, Sonnewald U, Willmitzer L (1994). A truncated version of an ADP-glucose pyrophosphorylase promoter from potato specifies guard-cell selective expression in transgenic plants. Plant Cell 6: 601-612.
Neuhaus H, Stitt M (1990). Control analysis of photosynthate partitioning: impact of reduced activity of ADP-glucose pyrophosphorylase or plastid phosphoglucomutase on the fluxes to starch and sucrose in Arabidopsis thaliana L. Heynh. Planta 182: 445-454.
Neuhaus HE, Kruckeberg A, Feil R, Gottlieb L, Stitt M (1989). Dosage mutants of phosphoglucose isomerase in the cytosol and chloroplasts of Clarkia xantiana: II. Study of the mechanisms which regulate photosynthate partitioning. Planta 178: 110-122.
Neuhaus HE, Quick W, Siegl G, Stitt M (1990). Control of photosynthate partitioning in spinach leaves: analysis of the interaction between feed-forward and feedback regulation of sucrose synthesis. Planta 181: 583-592.
Nielsen TH, Krapp A, Röper-Schwarz U, Stitt M (1998). The sugar-mediated regulation of genes encoding the small subunit of Rubisco and the regulatory subunit of ADP glucose pyrophosphorylase is modified by nitrogen and phosphate. Plant Cell Environ 21: 443-455.
Nikolau BJ, Wurtele ES, Stumpf PK (1984). Subcellular distribution of acetyl-CoA carboxylase in mesophyll cells of barley and sorghum leaves. Arch Biochem Biophys 235: 555-561.
Nikolau BJ Hawke JC (1984). Purification and characterisation of maize leaf acetyl-coenzyme A carboxylase. Arch Biochem Biophys 228: 86-96.
Ohlrogge J, Browse J (1995). Lipid biosynthesis. Plant Cell 7: 957-970.
Ohlrogge JB, Jaworski JG (1997). Regulation of fatty acid synthesis. Annu Rev Plant Physiol Plant Mol Biol 48: 109-136.
Okita TW, Nakata P, Anderson JM, Sowokinos J, Morell M, Preiss J (1990). The subunit structure of potato tuber ADPglucose pyrophosphorylase. Plant Physiol 93: 785-790.
Page RA, Okada S, Harwood JL (1994). Acetyl-CoA carboxylase exerts strong flux control over lipid synthesis in plants. Biochem Biophys Acta 1210: 369-372.
Pellny TK, Ghannoum O, Conroy JP, Schluepmann H, Smeekens S, Andralojc J, Krause KP, Goddijn O, Paul MJ (2004). Genetic modification of photosynthesis with E. coli genes for trehalose synthesis. Plant Biotech J 2: 71-82.
Porra RJ, Thompson W, Kriedemann PE (1989). Determination of accurate extinction coefficients and simultaneous equations for assaying chlorophylls a and b extracted with four different solvents: verification of the concentration of chlorophyll standards by atomic absorption spectroscopy. Biochem Biophys Acta 975: 384-394.
Preiss J (1984). Starch, sucrose Biosynthesis and partition of carbon in plants are regulated by ortho-phosphate and triose-phosphates. Trends Biochem Sci 9: 24-27.
Preiss J (1988). Biosynthesis of starch and its regulation. The Biochemistry of Plants 14: 181-254.
Preiss J, Sivak M (1996). Starch synthesis insinks and sources. Photoassimilate Distribution in Plants and Crops: 63-94.
Rawsthorne S (2002). Carbon flux and fatty acid synthesis in plants. Progr in Lipid Res 41: 182-196.
Ritte G, Stitt M, Heldt HW (1987). Subcellular metabolite levels in spinach leaves: regulation of sucrose synthesis during diurnal alterations in photosynthesis. Plant Physiol 83: 399-407.
Rook F, Gerrits N, Kortstee A, van Kampen M, Borrias M, Weisbeek P, Smeekens S (1998). Sucrose-specific signalling represses translation of the Arabidopsis ATB2 bZIP transcription factor gene. Plant J 15:253-263.
Roughan G, Post-Beittenmiller D, Ohlrogge J, Browse J (1993). Is acetyl-carnitine transferase a substratefor fatty acid synthesis in plants? Plant Physiol 101: 1157-1162.
Ruuska S, Schwender J, Ohlrogge JB (2004). The capacity of green oilseeds to utilize photosynthesis to drive biosynthetic processes. Plant Physiol 136: 2700–2709.Salanoubat M, Belliard G. (1989). The steady-state level of potato sucrose synthase mRNA is dependent on wounding, anaerobiosis and sucrose. Gene 84: 181-185.
Sasaki Y, Konishi T, Nagano Y (1995). The compartmentation of acetyl-CoA carboxylase in plants. Plant Physiol 108: 445-449.
Sasaki Y, Kozaki A, Hatano M (1997). Link between light and fatty acid synthesis: Thioredoxin-linked reductive activation of plastidic acetyl-CoA carboxylase. Proc of the Nat Acad of Science USA 94: 11096-11101.
Sauer A, Heisse K (1983). The procaryotic nature of the fatty-acid synthetase of developing Carthamus tinctorius L (safflower) seeds. Plant Physiol 73: 11-15.
Savage LJ, Ohlrogge JB (1999). Phosphorylation of pea chloroplast acetyl-CoA carboxylase. Plant J 18: 521-527.
Scheibe (1991). Redox-modulation of chloroplast enzymes: a common principle for individual control. Plant Physiol 96: 1-3.
Scheible WR, Gonzalez-Fontes A, Lauerer M, Müller-Röber B, Caboche M, Stitt M (1997). Nitrate acts as a signal to induce organic acid metabolism and repress starch metabolism in tobacco. Plant Cell 9: 783-798.
Schluepmann H, Pellny T, van Dijken A, Smeekens S, Paul M (2003). Trehalose 6-phosphate is indispensable for carbohydrate utilization and growth in Arabidopsis thaliana. Proceedings of the National Academy of Science USA 100: 6849-6854.
Schluepmann H, Pellny T, van Dijken A, Aghdasi M, Wobbes B, Paul M, Smeekens S (2004). Trehalose mediated growth inhibition of Arabidopsis seedlings is due to trehalose-6-phosphate accumulation. Plant Physiology 135: 879-890.
Schulze W, Stitt M, Schulze ED, Neuhaus HE, Fichtner K (1991). A quantification of the significance of assimilatory starch for growth of Arabidopsis thaliana L. Heynh. Plant Physiol 95: 890-895.
Schürmann P, Jacquot J-P (2000). Plant thioredoxin systems revisited. Annu Rev Plant Physiol Plant Mol Biol 51: 371-400.
Scott P, Lange A, Kruger NJ (2000). Photosynthetic carbon metabolism in leaves of transgenic tobacco (Nicotiana tabacum L.) containing decreased amounts of fructose 2,6-bisphosphate. Planta 211: 864-873.
Sheen J (1990). Metabolic repression of transcription in higher plants. Plant Cell 2: 1027-1038.
Sheen J, Zhou L, Jang JC (1999). Sugars as signalling molecules. Curr Opin Plant Biol 2: 410-418.
Shintani DK, Ohlrogge JB (1995). Feedback inhibition of fatty acid synthesis in tobacco suspention cells. Plant J 7: 577-587.
Sikka VK, Choi S, Kavakli IH, Sakulsingharoj C, Gupta S, Hioyuki I, Okita TW (2001). Subcellular compartmentation and allosteric regulation of the rice endosperm ADPglucose pyrophosphorylase. Plant Sci 161: 461-468.
Sivak MN and Preiss J (1995). Progress in the Genetic manipulation of crops aimed at changing starch structure and increasing starch accumulation. J Environ Degradation 3: 145-152.
Smeekens S (2000). Sugar-induced signal transduction in plants. Annu Rev Plant Physiol Plant Mol Biol 51: 49-81.
Smith AM (2001). The biosynthesis of the starch granule. Biomacromolecule 2: 335-341.
Smith AM, Martin C (1993). Starch biosynthesis and the potential for its manipulation. Plant Biotechnology Series 3: 1-44.
Smith SM, Fulton DC, Chia T, Thorneycroft D, Chapple A, Dunstan H, Hylton C, Zeeman SC, Smith AM (2004). Diurnal changes in the transcriptome encoding enzymes af starch metabolism provide evidence for both transcriptional and posttranscriptional regulation of starch metabolism in Arabidopsis leaves. Plant Physiology 136: 2687-2699.
Smith-White BJ and Preiss J (1992). Comparison of Proteins of ADP-Glucose Pyrophosphorylase from diverse sources. J Mol Evolution 34: 449-464.
Sokolov LN, Dejardin A, Kleczkowski LA (1998). Sugars and light/dark exposure trigger differential regulation of ADP-glucose pyrophosphorylase genes in Arabidopsis thaliana (thale cress). Biochem J 336: 681-687.
Sowokinos JR (1981). Pyrophosphorylases in Solanum tuberosum: II. Catalytic properties and regulation of ADP-glucose and UDP-glucose pyrophosphorylase activities in potatoes. Plant Physiol 68: 924-929.
Sowokinos JR, Preiss J (1982). Pyrophosphorylases in Solanum tuberosum III: purification, physical, and catalytic properties of ADPglucose pyrophosphoryase in potatoes. Plant Physiol 69: 1459-1466.
Stark D, Timmermann K, Barry G, Preiss J, Kishore G (1992). Regulation of the amount of starch in plant tissues by ADP-glucose pyrophosphorylase. Science 258: 287-292.
Stitt M (1996). Metabolic regulation of photosynthesis. In N Baker, ed, Advances in Photosynthesis. Environmental Stress and Photosynthesis 3: 151-190.
Stitt M, Grosse H (1988). Interactions between sucrose synthesis and CO2 fixation 4: temperature-dependent adjustment of the relation between sucrose synthesis and CO2 fixation. Plant Physiol 133: 392-400.
Stitt M, Huber S, Kerr P (1987). Control of photosynthetic sucrose synthesis. The Biochemistry of Plants 10: 327-409.
Stitt M, Krapp A (1999). The interaction between elevated carbon dioxide and nitrogen nutrition: The physiological and molecular background. Plant Cell Environ 22: 583-621.
Stitt M, Wilke I, Feil R, Heldt HW (1988). Coarse control of sucrose phosphate synthase in leaves: alterations in the kinetic properties in response to the rate of photosynthesis and the accumulation of sucrose. Planta 174: 217-230.
Stitt M, Lilley RM, Gerhardt R, Heldt HW (1989). Metabolite levels in specific cells and subcellular compartments of plant leaves. Method Enzymol 174: 518-552.
Strand A, Zrenner R, Stitt M, Gardestrom P (2000). Antisense inhibition of two key enzymes in the sucrose biosynthesis pathway, cytosolic fructosebisphosphatase and sucrose phosphate synthase, has different consequences for photosynthetic carbon metabolism in transgenic Arabidopsis thaliana. Plant J 23: 751-770.
Stumpf PK, Bove JM, Goffeau A (1987). Fat metabolism in higher plants. XX. Relation of fatty acid synthesis and photophosphorylation in lettuce chloroplast. Biochem Biophys Acta 70: 260-270.
Sun JD, Gibson K, Kiirats O, Okita TW, Edwards GE (2002). Interactions of nitrate and CO2 enrichment on growth, carbohydrates, and Rubisco in Arabidopsis starch mutants. Plant Physiol 130: 1573-1583.
Thimm O, Blasing O, Gibon Y, Nagel A, Meyer S, Kruger P, Selbig J, Muller LA, Rhee SY, Stitt M (2004) MAPMAN: a user-driven tool to display genomics data sets onto diagrams of metabolic pathways and other biological processes. The Plant Journal 37: 914-939
Tetlow IJ, Morell MK, Emes MJ (2004). Recent developments in understanding the regulation of starch metabolism in higher plants. Journal of Experimental Botany 55: 2131-2145.
Thomas DR, Masterson C, Miernyk JA, Jalil MNH, Ariffin A, Burgess NE, McNeil PH, Fox SR, Toroser D, Wood C (1993). Carnitine and its role in the plant cell. In PR Shewry, K Stobart, eds, Seed Storage Compounds, Biosynthesis, Interactions, and Manipulation. Oxford Science Publishing, Oxford, 276-303.
Thompson JD, Gibson T, Plewniak F, Jeanmougin F, Higgins DG (1997). The CLUSTAL_X windows interface: flexible strategies for multiple sequence alignment aided by quality analysis tools. Nucleic Acids Res 25: 4876-4882.
Tiessen A, Hendriks J, Stitt M, Branscheid A, Gibon Y, Farré EM, Geigenberger P (2002). Starch synthesis in potato tubers is regulated by post-translational redox-modification of ADP-glucose pyrophosphorylase: a novel regulatory mechanism linking starch synthesis to the sucrose supply. Plant Cell 14: 2191-2213.
Tiessen A, Prescha K, Branscheid A, Palacios N, McKibbin R, Halford NG, Geigenberger P (2003). Evidence that SNF1-related kinase and hexokinase are involved in separate sugar-signalling pathways modulating post-translational redox activation of ADP-glucose pyrophosphorylase in potato tubers. Plant J 35: 490-500.
Toroser D, Plaut Z, Huber SC (2000). Regulation of a plant SNF1-related protein kinase by glucose-6-phosphate. Plant Physiol 123: 403-411.
Tsai CY, and Nelson OE (1966). Starch-deficient maize mutant lacking adenosine diphosphate glucose pyrophosphorylase activity. Science 151: 341-343.
van Vaeck C, Wera S, van Dijck P, Thevelein JM (2001). Analysis and modification of trehalose 6-phosphate levels in the yeast Saccaromyces cerevisiae with the use of Bacillus subtilis phosphotrehalase. Biochem J 353: 157-162.
Villadsen D, Nielsen T (2001). N-terminal truncation affects the kinetics and structure of fructose-6-phosphate 2-kinase/fructose-2,6-bisphosphatase from Arabidopsis thaliana. Biochem J 359: 591-597.
Weber H, Borisjuk L, Wobus U (1997). Sugar import and metabolism during seed development. Trends in Plant Sci 2: 169-174.
Wendt CH, Gick G, Sharma R, Zhuang Y, Deng W, Ingbar DH (2000). Up-regulation of Na,K-ATPase beta 1 transcription by hyperoxia is mediated by SP1/SP3 binding. J Biol Chem 275: 41396-41404.
Westram A, Lloyd J, Roessner U, Riesmeier JW, Kossmann J (2002). Increases of 3-phosphoglyceric acid in potato plants through antisense reduction of cytoplasmic phosphoglycerate mutase impairs photosynthesis and growth, but does not increase starch contents. Plant Cell Environ 25: 1133-1143.
Vigeolas H, Möhlmann T, Martini N, Neuhaus HE, Geigenberger P (2004). Embryo-specific reduction of ADP-glucose pyrophosphorylase leads to an inhibition of starch synthesis and a delay in oil-accumulation in developing seeds of Brassica napus L. Plant Physiology 136: 2676-2686.
Wingler A, Frizius T, Wiemken A, Boller T, Aeschbacher RA (2000). Trehalose induces the ADP-glucose pyrophosphorylase gene, ApL3, and starch synthesis in Arabidopsis. Plant Physiol 124: 105-114.
Winter H, Huber S (2000). Regulation of sucrose metabolism in higher plants: localization and regulation of activity of key enzymes. Crit Rev Biochem Mol Biol 35: 253-289.
Zrenner R, Salanoubat M, Willmitzer L, Sonnewald U (1995). Evidence of the crucial role of sucrose synthase for sink strength using transgenic potato plants (Solanum tuberosum L.). Plant J 7: 97-107.
Zrenner R, Krause K, Apel P, Sonnewald U (1996). Reduction of the cytosolic fructose-1,6-bisphosphatase in transgenic potato plants limits photosynthetic sucrose biosynthesis with no impact on plant growth and tuber yield. Plant J 9: 671-687.
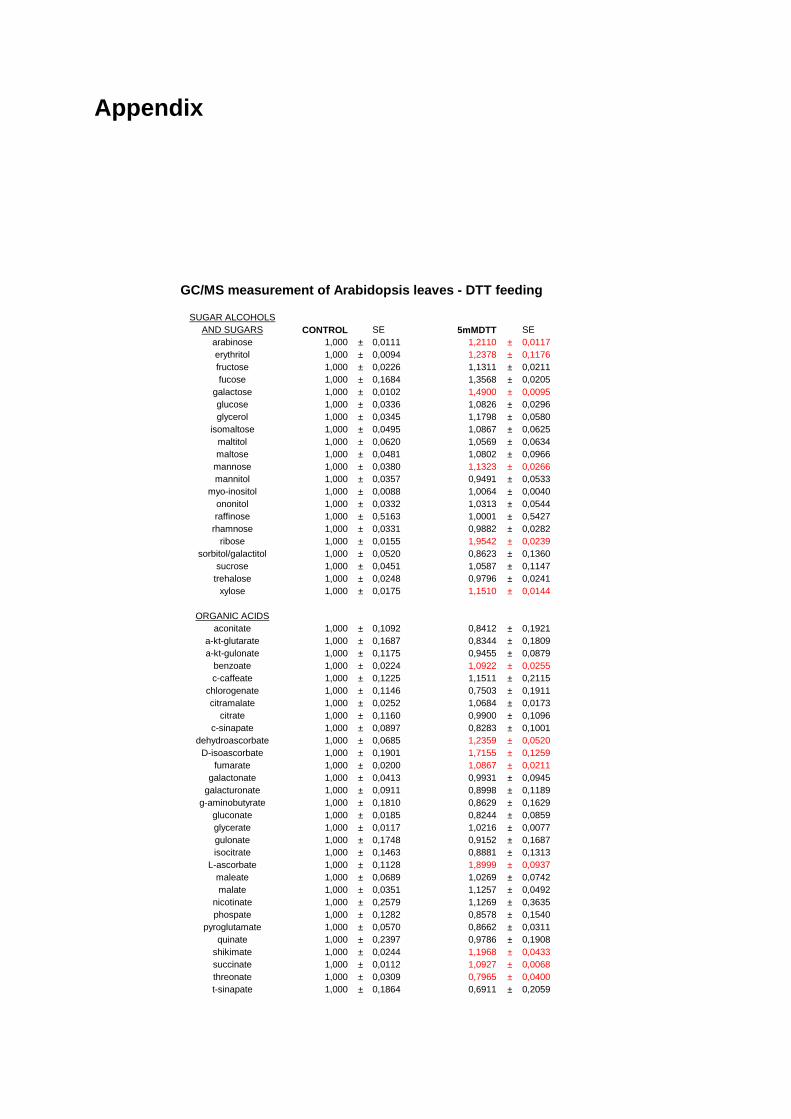
Appendix
GC/MS measurement of Arabidopsis leaves - DTT feedi ng
SUGAR ALCOHOLSAND SUGARS CONTROL SE 5mMDTT SE
arabinose 1,000 ± 0,0111 1,2110 ± 0,0117erythritol 1,000 ± 0,0094 1,2378 ± 0,1176fructose 1,000 ± 0,0226 1,1311 ± 0,0211fucose 1,000 ± 0,1684 1,3568 ± 0,0205
galactose 1,000 ± 0,0102 1,4900 ± 0,0095glucose 1,000 ± 0,0336 1,0826 ± 0,0296glycerol 1,000 ± 0,0345 1,1798 ± 0,0580
isomaltose 1,000 ± 0,0495 1,0867 ± 0,0625maltitol 1,000 ± 0,0620 1,0569 ± 0,0634maltose 1,000 ± 0,0481 1,0802 ± 0,0966
mannose 1,000 ± 0,0380 1,1323 ± 0,0266mannitol 1,000 ± 0,0357 0,9491 ± 0,0533
myo-inositol 1,000 ± 0,0088 1,0064 ± 0,0040ononitol 1,000 ± 0,0332 1,0313 ± 0,0544raffinose 1,000 ± 0,5163 1,0001 ± 0,5427
rhamnose 1,000 ± 0,0331 0,9882 ± 0,0282ribose 1,000 ± 0,0155 1,9542 ± 0,0239
sorbitol/galactitol 1,000 ± 0,0520 0,8623 ± 0,1360sucrose 1,000 ± 0,0451 1,0587 ± 0,1147
trehalose 1,000 ± 0,0248 0,9796 ± 0,0241xylose 1,000 ± 0,0175 1,1510 ± 0,0144
ORGANIC ACIDSaconitate 1,000 ± 0,1092 0,8412 ± 0,1921
a-kt-glutarate 1,000 ± 0,1687 0,8344 ± 0,1809a-kt-gulonate 1,000 ± 0,1175 0,9455 ± 0,0879
benzoate 1,000 ± 0,0224 1,0922 ± 0,0255c-caffeate 1,000 ± 0,1225 1,1511 ± 0,2115
chlorogenate 1,000 ± 0,1146 0,7503 ± 0,1911citramalate 1,000 ± 0,0252 1,0684 ± 0,0173
citrate 1,000 ± 0,1160 0,9900 ± 0,1096c-sinapate 1,000 ± 0,0897 0,8283 ± 0,1001
dehydroascorbate 1,000 ± 0,0685 1,2359 ± 0,0520D-isoascorbate 1,000 ± 0,1901 1,7155 ± 0,1259
fumarate 1,000 ± 0,0200 1,0867 ± 0,0211galactonate 1,000 ± 0,0413 0,9931 ± 0,0945
galacturonate 1,000 ± 0,0911 0,8998 ± 0,1189g-aminobutyrate 1,000 ± 0,1810 0,8629 ± 0,1629
gluconate 1,000 ± 0,0185 0,8244 ± 0,0859glycerate 1,000 ± 0,0117 1,0216 ± 0,0077gulonate 1,000 ± 0,1748 0,9152 ± 0,1687isocitrate 1,000 ± 0,1463 0,8881 ± 0,1313
L-ascorbate 1,000 ± 0,1128 1,8999 ± 0,0937maleate 1,000 ± 0,0689 1,0269 ± 0,0742malate 1,000 ± 0,0351 1,1257 ± 0,0492
nicotinate 1,000 ± 0,2579 1,1269 ± 0,3635phospate 1,000 ± 0,1282 0,8578 ± 0,1540
pyroglutamate 1,000 ± 0,0570 0,8662 ± 0,0311quinate 1,000 ± 0,2397 0,9786 ± 0,1908
shikimate 1,000 ± 0,0244 1,1968 ± 0,0433succinate 1,000 ± 0,0112 1,0927 ± 0,0068threonate 1,000 ± 0,0309 0,7965 ± 0,0400t-sinapate 1,000 ± 0,1864 0,6911 ± 0,2059
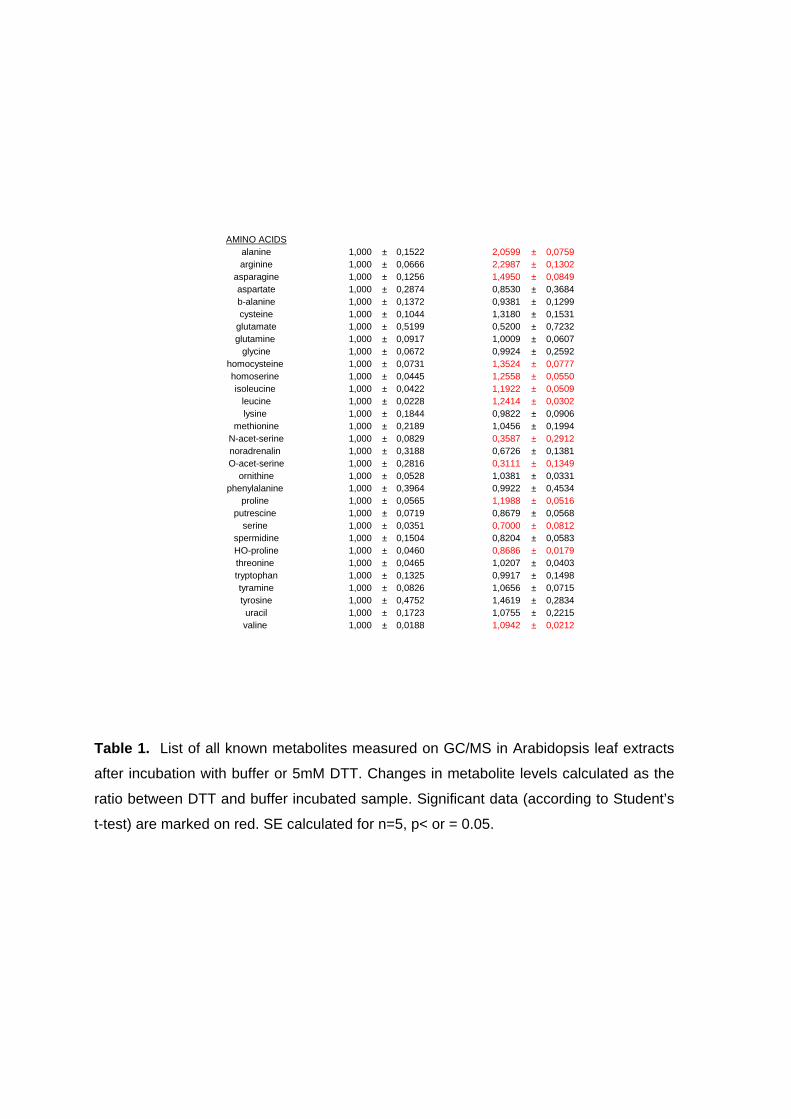
Table 1. List of all known metabolites measured on GC/MS in Arabidopsis leaf extracts
after incubation with buffer or 5mM DTT. Changes in metabolite levels calculated as the
ratio between DTT and buffer incubated sample. Significant data (according to Student’s
t-test) are marked on red. SE calculated for n=5, p< or = 0.05.
AMINO ACIDSalanine 1,000 ± 0,1522 2,0599 ± 0,0759arginine 1,000 ± 0,0666 2,2987 ± 0,1302
asparagine 1,000 ± 0,1256 1,4950 ± 0,0849aspartate 1,000 ± 0,2874 0,8530 ± 0,3684b-alanine 1,000 ± 0,1372 0,9381 ± 0,1299cysteine 1,000 ± 0,1044 1,3180 ± 0,1531
glutamate 1,000 ± 0,5199 0,5200 ± 0,7232glutamine 1,000 ± 0,0917 1,0009 ± 0,0607
glycine 1,000 ± 0,0672 0,9924 ± 0,2592homocysteine 1,000 ± 0,0731 1,3524 ± 0,0777homoserine 1,000 ± 0,0445 1,2558 ± 0,0550isoleucine 1,000 ± 0,0422 1,1922 ± 0,0509
leucine 1,000 ± 0,0228 1,2414 ± 0,0302lysine 1,000 ± 0,1844 0,9822 ± 0,0906
methionine 1,000 ± 0,2189 1,0456 ± 0,1994N-acet-serine 1,000 ± 0,0829 0,3587 ± 0,2912noradrenalin 1,000 ± 0,3188 0,6726 ± 0,1381O-acet-serine 1,000 ± 0,2816 0,3111 ± 0,1349
ornithine 1,000 ± 0,0528 1,0381 ± 0,0331phenylalanine 1,000 ± 0,3964 0,9922 ± 0,4534
proline 1,000 ± 0,0565 1,1988 ± 0,0516putrescine 1,000 ± 0,0719 0,8679 ± 0,0568
serine 1,000 ± 0,0351 0,7000 ± 0,0812spermidine 1,000 ± 0,1504 0,8204 ± 0,0583HO-proline 1,000 ± 0,0460 0,8686 ± 0,0179threonine 1,000 ± 0,0465 1,0207 ± 0,0403tryptophan 1,000 ± 0,1325 0,9917 ± 0,1498tyramine 1,000 ± 0,0826 1,0656 ± 0,0715tyrosine 1,000 ± 0,4752 1,4619 ± 0,2834uracil 1,000 ± 0,1723 1,0755 ± 0,2215valine 1,000 ± 0,0188 1,0942 ± 0,0212
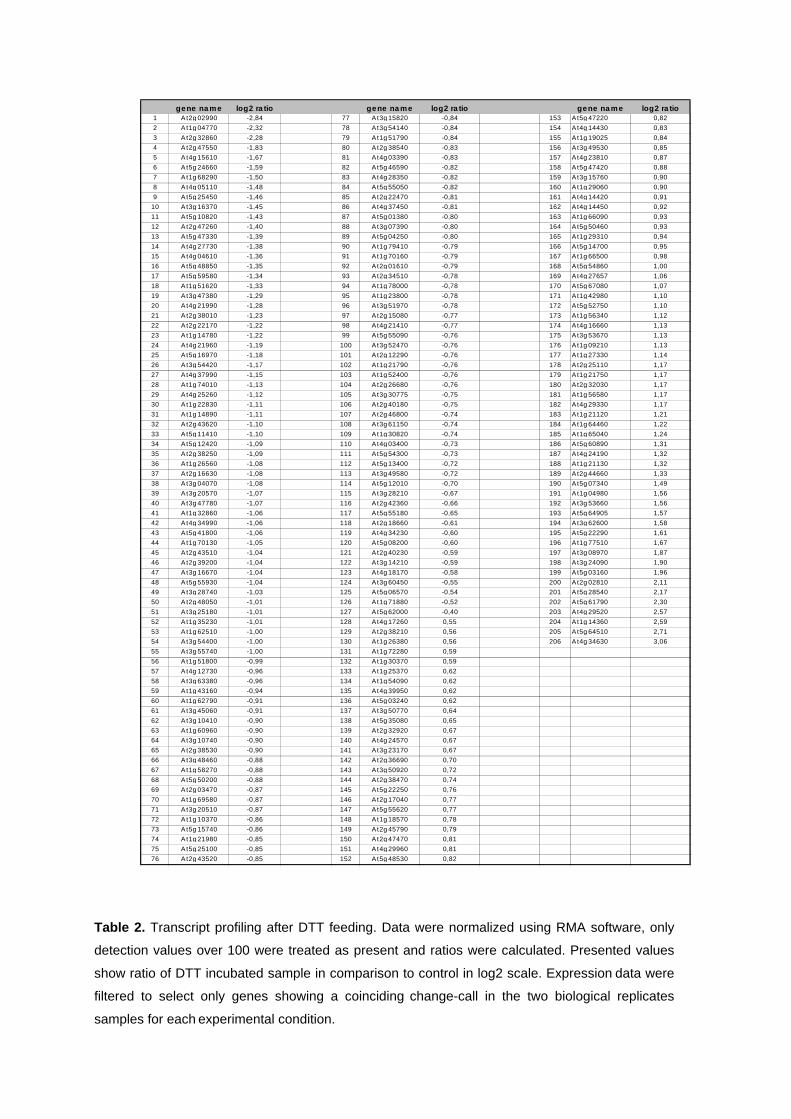
Table 2. Transcript profiling after DTT feeding. Data were normalized using RMA software, only
detection values over 100 were treated as present and ratios were calculated. Presented values
show ratio of DTT incubated sample in comparison to control in log2 scale. Expression data were
filtered to select only genes showing a coinciding change-call in the two biological replicates
samples for each experimental condition.
gene na me log2 ra tio gene na me log2 ra tio gene na me log2 ra tio1 At2g 02990 -2,84 77 A t3g 15820 -0,84 153 A t5g 47220 0,82
2 A t1g 04770 -2,32 78 A t3g 54140 -0,84 154 A t4g 14430 0,83
3 A t2g 32860 -2,28 79 A t1g 51790 -0,84 155 A t1g 19025 0,84
4 A t2g 47550 -1,83 80 A t2g 38540 -0,83 156 A t3g 49530 0,85
5 A t4g 15610 -1,67 81 A t4g 03390 -0,83 157 A t4g 23810 0,87
6 A t5g 24660 -1,59 82 A t5g 46590 -0,82 158 A t5g 47420 0,88
7 A t1g 68290 -1,50 83 A t4g 28350 -0,82 159 A t3g 15760 0,90
8 A t4g 05110 -1,48 84 A t5g 55050 -0,82 160 A t1g 29060 0,90
9 A t5g 25450 -1,46 85 A t2g 22470 -0,81 161 A t4g 14420 0,91
10 A t3g 16370 -1,45 86 A t4g 37450 -0,81 162 A t4g 14450 0,92
11 A t5g 10820 -1,43 87 A t5g 01380 -0,80 163 A t1g 66090 0,93
12 A t2g 47260 -1,40 88 A t3g 07390 -0,80 164 A t5g 50460 0,93
13 A t5g 47330 -1,39 89 A t5g 04250 -0,80 165 A t1g 29310 0,94
14 A t4g 27730 -1,38 90 A t1g 79410 -0,79 166 A t5g 14700 0,95
15 A t4g 04610 -1,36 91 A t1g 70160 -0,79 167 A t1g 66500 0,98
16 A t5g 48850 -1,35 92 A t2g 01610 -0,79 168 A t5g 54860 1,00
17 A t5g 59580 -1,34 93 A t2g 34510 -0,78 169 A t4g 27657 1,06
18 A t1g 51620 -1,33 94 A t1g 78000 -0,78 170 A t5g 67080 1,07
19 A t3g 47380 -1,29 95 A t1g 23800 -0,78 171 A t1g 42980 1,10
20 A t4g 21990 -1,28 96 A t3g 51970 -0,78 172 A t5g 52750 1,10
21 A t2g 38010 -1,23 97 A t2g 15080 -0,77 173 A t1g 56340 1,12
22 A t2g 22170 -1,22 98 A t4g 21410 -0,77 174 A t4g 16660 1,13
23 A t1g 14780 -1,22 99 A t5g 55090 -0,76 175 A t3g 53670 1,13
24 A t4g 21960 -1,19 100 A t3g 52470 -0,76 176 A t1g 09210 1,13
25 A t5g 16970 -1,18 101 A t2g 12290 -0,76 177 A t1g 27330 1,14
26 A t3g 54420 -1,17 102 A t1g 21790 -0,76 178 A t2g 25110 1,17
27 A t4g 37990 -1,15 103 A t1g 52400 -0,76 179 A t1g 21750 1,17
28 A t1g 74010 -1,13 104 A t2g 26680 -0,76 180 A t2g 32030 1,17
29 A t4g 25260 -1,12 105 A t3g 30775 -0,75 181 A t1g 56580 1,17
30 A t1g 22830 -1,11 106 A t2g 40180 -0,75 182 A t4g 29330 1,17
31 A t1g 14890 -1,11 107 A t2g 46800 -0,74 183 A t1g 21120 1,21
32 A t2g 43620 -1,10 108 A t3g 61150 -0,74 184 A t1g 64460 1,22
33 A t5g 11410 -1,10 109 A t1g 30820 -0,74 185 A t1g 65040 1,24
34 A t5g 12420 -1,09 110 A t4g 03400 -0,73 186 A t5g 60890 1,31
35 A t2g 38250 -1,09 111 A t5g 54300 -0,73 187 A t4g 24190 1,32
36 A t1g 26560 -1,08 112 A t5g 13400 -0,72 188 A t1g 21130 1,32
37 A t2g 16630 -1,08 113 A t3g 49580 -0,72 189 A t2g 44660 1,33
38 A t3g 04070 -1,08 114 A t5g 12010 -0,70 190 A t5g 07340 1,49
39 A t3g 20570 -1,07 115 A t3g 28210 -0,67 191 A t1g 04980 1,56
40 A t3g 47780 -1,07 116 A t2g 42360 -0,66 192 A t3g 53660 1,56
41 A t1g 32860 -1,06 117 A t5g 55180 -0,65 193 A t5g 64905 1,57
42 A t4g 34990 -1,06 118 A t2g 18660 -0,61 194 A t3g 62600 1,58
43 A t5g 41800 -1,06 119 A t4g 34230 -0,60 195 A t5g 22290 1,61
44 A t1g 70130 -1,05 120 A t5g 08200 -0,60 196 A t1g 77510 1,67
45 A t2g 43510 -1,04 121 A t2g 40230 -0,59 197 A t3g 08970 1,87
46 A t2g 39200 -1,04 122 A t3g 14210 -0,59 198 A t3g 24090 1,90
47 A t3g 16670 -1,04 123 A t4g 18170 -0,58 199 A t5g 03160 1,96
48 A t5g 55930 -1,04 124 A t3g 60450 -0,55 200 A t2g 02810 2,11
49 A t3g 28740 -1,03 125 A t5g 06570 -0,54 201 A t5g 28540 2,17
50 A t2g 48050 -1,01 126 A t1g 71880 -0,52 202 A t5g 61790 2,30
51 A t3g 25180 -1,01 127 A t5g 62000 -0,40 203 A t4g 29520 2,57
52 A t1g 35230 -1,01 128 A t4g 17260 0,55 204 At1g 14360 2,59
53 A t1g 62510 -1,00 129 A t2g 38210 0,56 205 At5g 64510 2,71
54 A t3g 54400 -1,00 130 A t1g 26380 0,56 206 At4g 34630 3,06
55 A t3g 55740 -1,00 131 A t1g 72280 0,59
56 A t1g 51800 -0,99 132 A t1g 30370 0,59
57 A t4g 12730 -0,96 133 A t1g 25370 0,62
58 A t3g 63380 -0,96 134 A t1g 54090 0,62
59 A t1g 43160 -0,94 135 A t4g 39950 0,62
60 A t1g 62790 -0,91 136 A t5g 03240 0,62
61 A t3g 45060 -0,91 137 A t3g 50770 0,64
62 A t3g 10410 -0,90 138 A t5g 35080 0,65
63 A t1g 60960 -0,90 139 A t2g 32920 0,67
64 A t3g 10740 -0,90 140 A t4g 24570 0,67
65 A t2g 38530 -0,90 141 A t3g 23170 0,67
66 A t3g 48460 -0,88 142 A t2g 36690 0,70
67 A t1g 58270 -0,88 143 A t3g 50920 0,72
68 A t5g 50200 -0,88 144 A t2g 38470 0,74
69 A t2g 03470 -0,87 145 A t5g 22250 0,76
70 A t1g 69580 -0,87 146 A t2g 17040 0,77
71 A t3g 20510 -0,87 147 A t5g 55620 0,77
72 A t1g 10370 -0,86 148 A t1g 18570 0,78
73 A t5g 15740 -0,86 149 A t2g 45790 0,79
74 A t1g 21980 -0,85 150 A t2g 47470 0,81
75 A t5g 25100 -0,85 151 A t4g 29960 0,81
76 A t2g 43520 -0,85 152 A t5g 48530 0,82
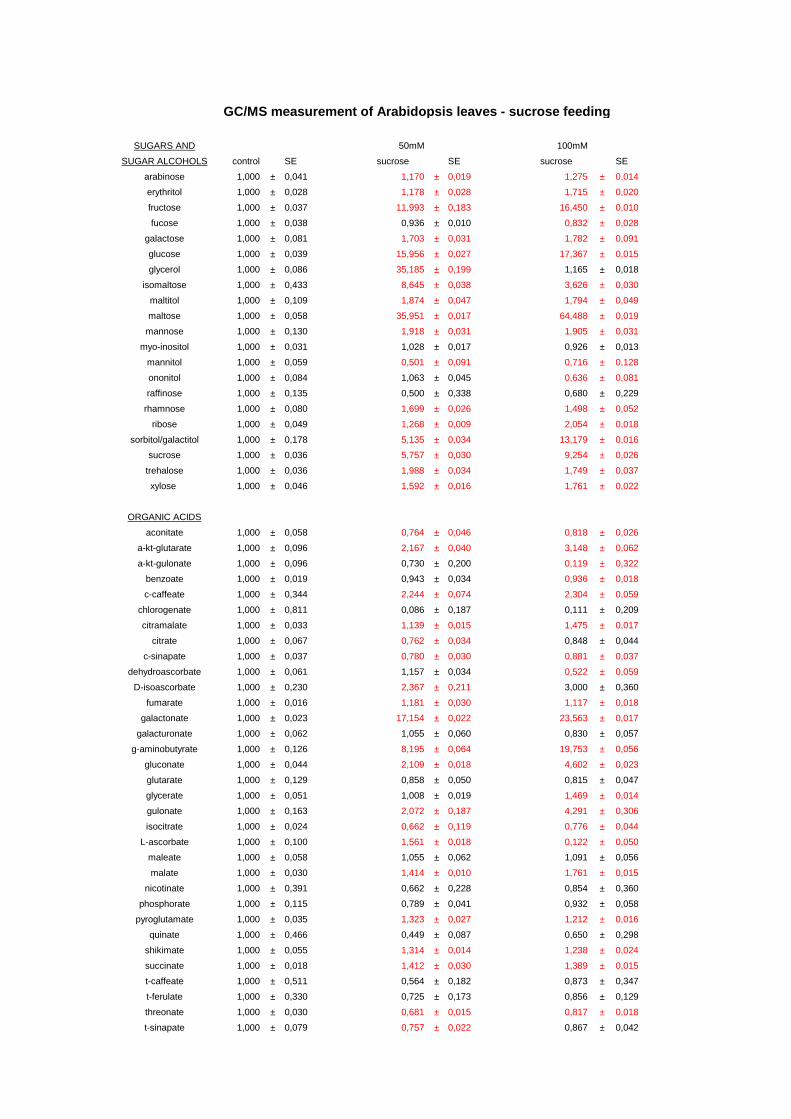
GC/MS measurement of Arabidopsis leaves - sucrose f eeding
SUGARS AND 50mM 100mM
SUGAR ALCOHOLS control SE sucrose SE sucrose SE
arabinose 1,000 ± 0,041 1,170 ± 0,019 1,275 ± 0,014
erythritol 1,000 ± 0,028 1,178 ± 0,028 1,715 ± 0,020
fructose 1,000 ± 0,037 11,993 ± 0,183 16,450 ± 0,010
fucose 1,000 ± 0,038 0,936 ± 0,010 0,832 ± 0,028
galactose 1,000 ± 0,081 1,703 ± 0,031 1,782 ± 0,091
glucose 1,000 ± 0,039 15,956 ± 0,027 17,367 ± 0,015
glycerol 1,000 ± 0,086 35,185 ± 0,199 1,165 ± 0,018
isomaltose 1,000 ± 0,433 8,645 ± 0,038 3,626 ± 0,030
maltitol 1,000 ± 0,109 1,874 ± 0,047 1,794 ± 0,049
maltose 1,000 ± 0,058 35,951 ± 0,017 64,488 ± 0,019
mannose 1,000 ± 0,130 1,918 ± 0,031 1,905 ± 0,031
myo-inositol 1,000 ± 0,031 1,028 ± 0,017 0,926 ± 0,013
mannitol 1,000 ± 0,059 0,501 ± 0,091 0,716 ± 0,128
ononitol 1,000 ± 0,084 1,063 ± 0,045 0,636 ± 0,081
raffinose 1,000 ± 0,135 0,500 ± 0,338 0,680 ± 0,229
rhamnose 1,000 ± 0,080 1,699 ± 0,026 1,498 ± 0,052
ribose 1,000 ± 0,049 1,268 ± 0,009 2,054 ± 0,018
sorbitol/galactitol 1,000 ± 0,178 5,135 ± 0,034 13,179 ± 0,016
sucrose 1,000 ± 0,036 5,757 ± 0,030 9,254 ± 0,026
trehalose 1,000 ± 0,036 1,988 ± 0,034 1,749 ± 0,037
xylose 1,000 ± 0,046 1,592 ± 0,016 1,761 ± 0,022
ORGANIC ACIDS
aconitate 1,000 ± 0,058 0,764 ± 0,046 0,818 ± 0,026
a-kt-glutarate 1,000 ± 0,096 2,167 ± 0,040 3,148 ± 0,062
a-kt-gulonate 1,000 ± 0,096 0,730 ± 0,200 0,119 ± 0,322
benzoate 1,000 ± 0,019 0,943 ± 0,034 0,936 ± 0,018
c-caffeate 1,000 ± 0,344 2,244 ± 0,074 2,304 ± 0,059
chlorogenate 1,000 ± 0,811 0,086 ± 0,187 0,111 ± 0,209
citramalate 1,000 ± 0,033 1,139 ± 0,015 1,475 ± 0,017
citrate 1,000 ± 0,067 0,762 ± 0,034 0,848 ± 0,044
c-sinapate 1,000 ± 0,037 0,780 ± 0,030 0,881 ± 0,037
dehydroascorbate 1,000 ± 0,061 1,157 ± 0,034 0,522 ± 0,059
D-isoascorbate 1,000 ± 0,230 2,367 ± 0,211 3,000 ± 0,360
fumarate 1,000 ± 0,016 1,181 ± 0,030 1,117 ± 0,018
galactonate 1,000 ± 0,023 17,154 ± 0,022 23,563 ± 0,017
galacturonate 1,000 ± 0,062 1,055 ± 0,060 0,830 ± 0,057
g-aminobutyrate 1,000 ± 0,126 8,195 ± 0,064 19,753 ± 0,056
gluconate 1,000 ± 0,044 2,109 ± 0,018 4,602 ± 0,023
glutarate 1,000 ± 0,129 0,858 ± 0,050 0,815 ± 0,047
glycerate 1,000 ± 0,051 1,008 ± 0,019 1,469 ± 0,014
gulonate 1,000 ± 0,163 2,072 ± 0,187 4,291 ± 0,306
isocitrate 1,000 ± 0,024 0,662 ± 0,119 0,776 ± 0,044
L-ascorbate 1,000 ± 0,100 1,561 ± 0,018 0,122 ± 0,050
maleate 1,000 ± 0,058 1,055 ± 0,062 1,091 ± 0,056
malate 1,000 ± 0,030 1,414 ± 0,010 1,761 ± 0,015
nicotinate 1,000 ± 0,391 0,662 ± 0,228 0,854 ± 0,360
phosphorate 1,000 ± 0,115 0,789 ± 0,041 0,932 ± 0,058
pyroglutamate 1,000 ± 0,035 1,323 ± 0,027 1,212 ± 0,016
quinate 1,000 ± 0,466 0,449 ± 0,087 0,650 ± 0,298
shikimate 1,000 ± 0,055 1,314 ± 0,014 1,238 ± 0,024
succinate 1,000 ± 0,018 1,412 ± 0,030 1,389 ± 0,015
t-caffeate 1,000 ± 0,511 0,564 ± 0,182 0,873 ± 0,347
t-ferulate 1,000 ± 0,330 0,725 ± 0,173 0,856 ± 0,129
threonate 1,000 ± 0,030 0,681 ± 0,015 0,817 ± 0,018
t-sinapate 1,000 ± 0,079 0,757 ± 0,022 0,867 ± 0,042
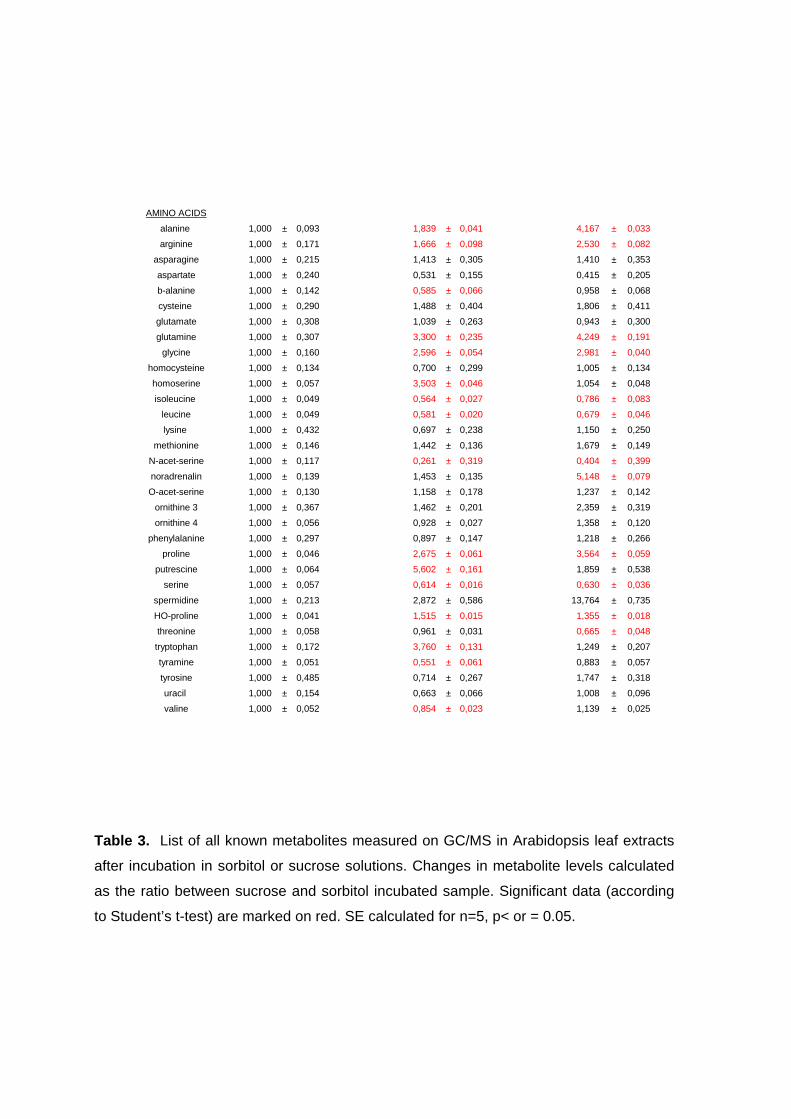
Table 3. List of all known metabolites measured on GC/MS in Arabidopsis leaf extracts
after incubation in sorbitol or sucrose solutions. Changes in metabolite levels calculated
as the ratio between sucrose and sorbitol incubated sample. Significant data (according
to Student’s t-test) are marked on red. SE calculated for n=5, p< or = 0.05.
AMINO ACIDS
alanine 1,000 ± 0,093 1,839 ± 0,041 4,167 ± 0,033
arginine 1,000 ± 0,171 1,666 ± 0,098 2,530 ± 0,082
asparagine 1,000 ± 0,215 1,413 ± 0,305 1,410 ± 0,353
aspartate 1,000 ± 0,240 0,531 ± 0,155 0,415 ± 0,205
b-alanine 1,000 ± 0,142 0,585 ± 0,066 0,958 ± 0,068
cysteine 1,000 ± 0,290 1,488 ± 0,404 1,806 ± 0,411
glutamate 1,000 ± 0,308 1,039 ± 0,263 0,943 ± 0,300
glutamine 1,000 ± 0,307 3,300 ± 0,235 4,249 ± 0,191
glycine 1,000 ± 0,160 2,596 ± 0,054 2,981 ± 0,040
homocysteine 1,000 ± 0,134 0,700 ± 0,299 1,005 ± 0,134
homoserine 1,000 ± 0,057 3,503 ± 0,046 1,054 ± 0,048
isoleucine 1,000 ± 0,049 0,564 ± 0,027 0,786 ± 0,083
leucine 1,000 ± 0,049 0,581 ± 0,020 0,679 ± 0,046
lysine 1,000 ± 0,432 0,697 ± 0,238 1,150 ± 0,250
methionine 1,000 ± 0,146 1,442 ± 0,136 1,679 ± 0,149
N-acet-serine 1,000 ± 0,117 0,261 ± 0,319 0,404 ± 0,399
noradrenalin 1,000 ± 0,139 1,453 ± 0,135 5,148 ± 0,079
O-acet-serine 1,000 ± 0,130 1,158 ± 0,178 1,237 ± 0,142
ornithine 3 1,000 ± 0,367 1,462 ± 0,201 2,359 ± 0,319
ornithine 4 1,000 ± 0,056 0,928 ± 0,027 1,358 ± 0,120
phenylalanine 1,000 ± 0,297 0,897 ± 0,147 1,218 ± 0,266
proline 1,000 ± 0,046 2,675 ± 0,061 3,564 ± 0,059
putrescine 1,000 ± 0,064 5,602 ± 0,161 1,859 ± 0,538
serine 1,000 ± 0,057 0,614 ± 0,016 0,630 ± 0,036
spermidine 1,000 ± 0,213 2,872 ± 0,586 13,764 ± 0,735
HO-proline 1,000 ± 0,041 1,515 ± 0,015 1,355 ± 0,018
threonine 1,000 ± 0,058 0,961 ± 0,031 0,665 ± 0,048
tryptophan 1,000 ± 0,172 3,760 ± 0,131 1,249 ± 0,207
tyramine 1,000 ± 0,051 0,551 ± 0,061 0,883 ± 0,057
tyrosine 1,000 ± 0,485 0,714 ± 0,267 1,747 ± 0,318
uracil 1,000 ± 0,154 0,663 ± 0,066 1,008 ± 0,096
valine 1,000 ± 0,052 0,854 ± 0,023 1,139 ± 0,025
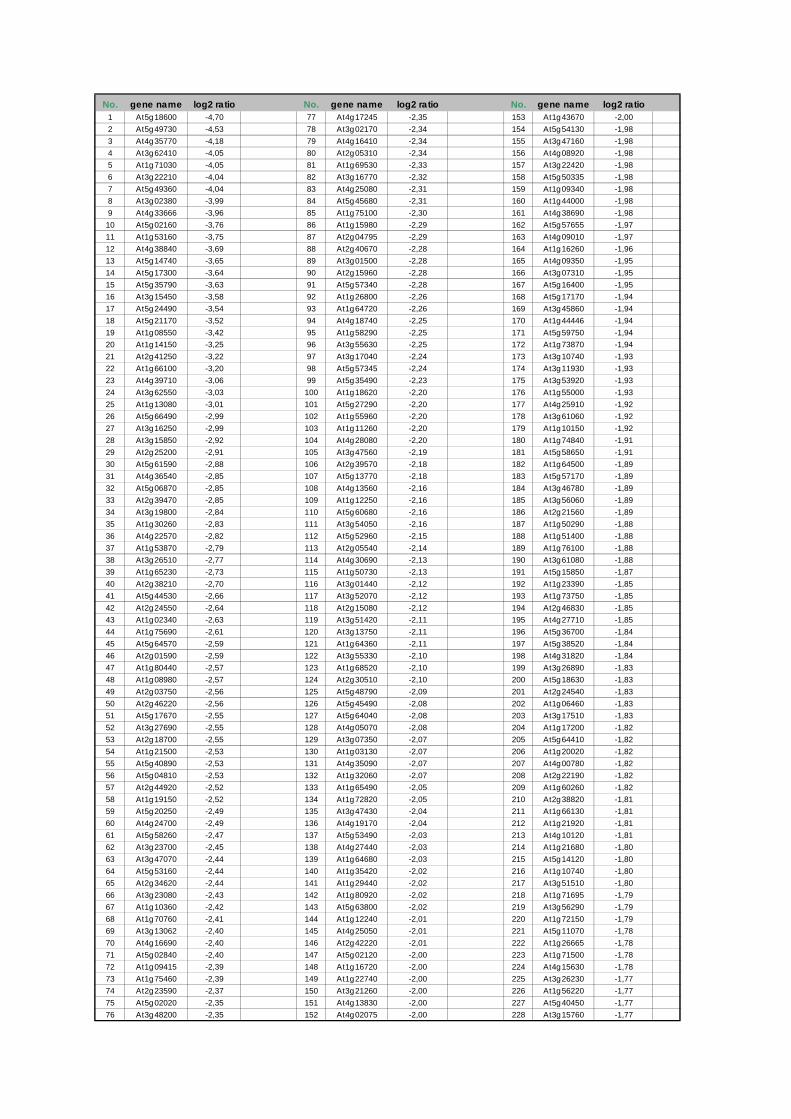
No. gene name log2 ratio No. gene name log2 ratio No. gene name log2 ratio1 At5g18600 -4,70 77 At4g17245 -2,35 153 At1g43670 -2,00
2 At5g49730 -4,53 78 At3g02170 -2,34 154 At5g54130 -1,98
3 At4g35770 -4,18 79 At4g16410 -2,34 155 At3g47160 -1,98
4 At3g62410 -4,05 80 At2g05310 -2,34 156 At4g08920 -1,98
5 At1g71030 -4,05 81 At1g69530 -2,33 157 At3g22420 -1,98
6 At3g22210 -4,04 82 At3g16770 -2,32 158 At5g50335 -1,98
7 At5g49360 -4,04 83 At4g25080 -2,31 159 At1g09340 -1,98
8 At3g02380 -3,99 84 At5g45680 -2,31 160 At1g44000 -1,98
9 At4g33666 -3,96 85 At1g75100 -2,30 161 At4g38690 -1,98
10 At5g02160 -3,76 86 At1g15980 -2,29 162 At5g57655 -1,97
11 At1g53160 -3,75 87 At2g04795 -2,29 163 At4g09010 -1,97
12 At4g38840 -3,69 88 At2g40670 -2,28 164 At1g16260 -1,96
13 At5g14740 -3,65 89 At3g01500 -2,28 165 At4g09350 -1,95
14 At5g17300 -3,64 90 At2g15960 -2,28 166 At3g07310 -1,95
15 At5g35790 -3,63 91 At5g57340 -2,28 167 At5g16400 -1,95
16 At3g15450 -3,58 92 At1g26800 -2,26 168 At5g17170 -1,94
17 At5g24490 -3,54 93 At1g64720 -2,26 169 At3g45860 -1,94
18 At5g21170 -3,52 94 At4g18740 -2,25 170 At1g44446 -1,94
19 At1g08550 -3,42 95 At1g58290 -2,25 171 At5g59750 -1,94
20 At1g14150 -3,25 96 At3g55630 -2,25 172 At1g73870 -1,94
21 At2g41250 -3,22 97 At3g17040 -2,24 173 At3g10740 -1,93
22 At1g66100 -3,20 98 At5g57345 -2,24 174 At3g11930 -1,93
23 At4g39710 -3,06 99 At5g35490 -2,23 175 At3g53920 -1,93
24 At3g62550 -3,03 100 At1g18620 -2,20 176 At1g55000 -1,93
25 At1g13080 -3,01 101 At5g27290 -2,20 177 At4g25910 -1,92
26 At5g66490 -2,99 102 At1g55960 -2,20 178 At3g61060 -1,92
27 At3g16250 -2,99 103 At1g11260 -2,20 179 At1g10150 -1,92
28 At3g15850 -2,92 104 At4g28080 -2,20 180 At1g74840 -1,91
29 At2g25200 -2,91 105 At3g47560 -2,19 181 At5g58650 -1,91
30 At5g61590 -2,88 106 At2g39570 -2,18 182 At1g64500 -1,89
31 At4g36540 -2,85 107 At5g13770 -2,18 183 At5g57170 -1,89
32 At5g06870 -2,85 108 At4g13560 -2,16 184 At3g46780 -1,89
33 At2g39470 -2,85 109 At1g12250 -2,16 185 At3g56060 -1,89
34 At3g19800 -2,84 110 At5g60680 -2,16 186 At2g21560 -1,89
35 At1g30260 -2,83 111 At3g54050 -2,16 187 At1g50290 -1,88
36 At4g22570 -2,82 112 At5g52960 -2,15 188 At1g51400 -1,88
37 At1g53870 -2,79 113 At2g05540 -2,14 189 At1g76100 -1,88
38 At3g26510 -2,77 114 At4g30690 -2,13 190 At3g61080 -1,88
39 At1g65230 -2,73 115 At1g50730 -2,13 191 At5g15850 -1,87
40 At2g38210 -2,70 116 At3g01440 -2,12 192 At1g23390 -1,85
41 At5g44530 -2,66 117 At3g52070 -2,12 193 At1g73750 -1,85
42 At2g24550 -2,64 118 At2g15080 -2,12 194 At2g46830 -1,85
43 At1g02340 -2,63 119 At3g51420 -2,11 195 At4g27710 -1,85
44 At1g75690 -2,61 120 At3g13750 -2,11 196 At5g36700 -1,84
45 At5g64570 -2,59 121 At1g64360 -2,11 197 At5g38520 -1,84
46 At2g01590 -2,59 122 At3g55330 -2,10 198 At4g31820 -1,84
47 At1g80440 -2,57 123 At1g68520 -2,10 199 At3g26890 -1,83
48 At1g08980 -2,57 124 At2g30510 -2,10 200 At5g18630 -1,83
49 At2g03750 -2,56 125 At5g48790 -2,09 201 At2g24540 -1,83
50 At2g46220 -2,56 126 At5g45490 -2,08 202 At1g06460 -1,83
51 At5g17670 -2,55 127 At5g64040 -2,08 203 At3g17510 -1,83
52 At3g27690 -2,55 128 At4g05070 -2,08 204 At1g17200 -1,82
53 At2g18700 -2,55 129 At3g07350 -2,07 205 At5g64410 -1,82
54 At1g21500 -2,53 130 At1g03130 -2,07 206 At1g20020 -1,82
55 At5g40890 -2,53 131 At4g35090 -2,07 207 At4g00780 -1,82
56 At5g04810 -2,53 132 At1g32060 -2,07 208 At2g22190 -1,82
57 At2g44920 -2,52 133 At1g65490 -2,05 209 At1g60260 -1,82
58 At1g19150 -2,52 134 At1g72820 -2,05 210 At2g38820 -1,81
59 At5g20250 -2,49 135 At3g47430 -2,04 211 At1g66130 -1,81
60 At4g24700 -2,49 136 At4g19170 -2,04 212 At1g21920 -1,81
61 At5g58260 -2,47 137 At5g53490 -2,03 213 At4g10120 -1,81
62 At3g23700 -2,45 138 At4g27440 -2,03 214 At1g21680 -1,80
63 At3g47070 -2,44 139 At1g64680 -2,03 215 At5g14120 -1,80
64 At5g53160 -2,44 140 At1g35420 -2,02 216 At1g10740 -1,80
65 At2g34620 -2,44 141 At1g29440 -2,02 217 At3g51510 -1,80
66 At3g23080 -2,43 142 At1g80920 -2,02 218 At1g71695 -1,79
67 At1g10360 -2,42 143 At5g63800 -2,02 219 At3g56290 -1,79
68 At1g70760 -2,41 144 At1g12240 -2,01 220 At1g72150 -1,79
69 At3g13062 -2,40 145 At4g25050 -2,01 221 At5g11070 -1,78
70 At4g16690 -2,40 146 At2g42220 -2,01 222 At1g26665 -1,78
71 At5g02840 -2,40 147 At5g02120 -2,00 223 At1g71500 -1,78
72 At1g09415 -2,39 148 At1g16720 -2,00 224 At4g15630 -1,78
73 At1g75460 -2,39 149 At1g22740 -2,00 225 At3g26230 -1,77
74 At2g23590 -2,37 150 At3g21260 -2,00 226 At1g56220 -1,77
75 At5g02020 -2,35 151 At4g13830 -2,00 227 At5g40450 -1,77
76 At3g48200 -2,35 152 At4g02075 -2,00 228 At3g15760 -1,77
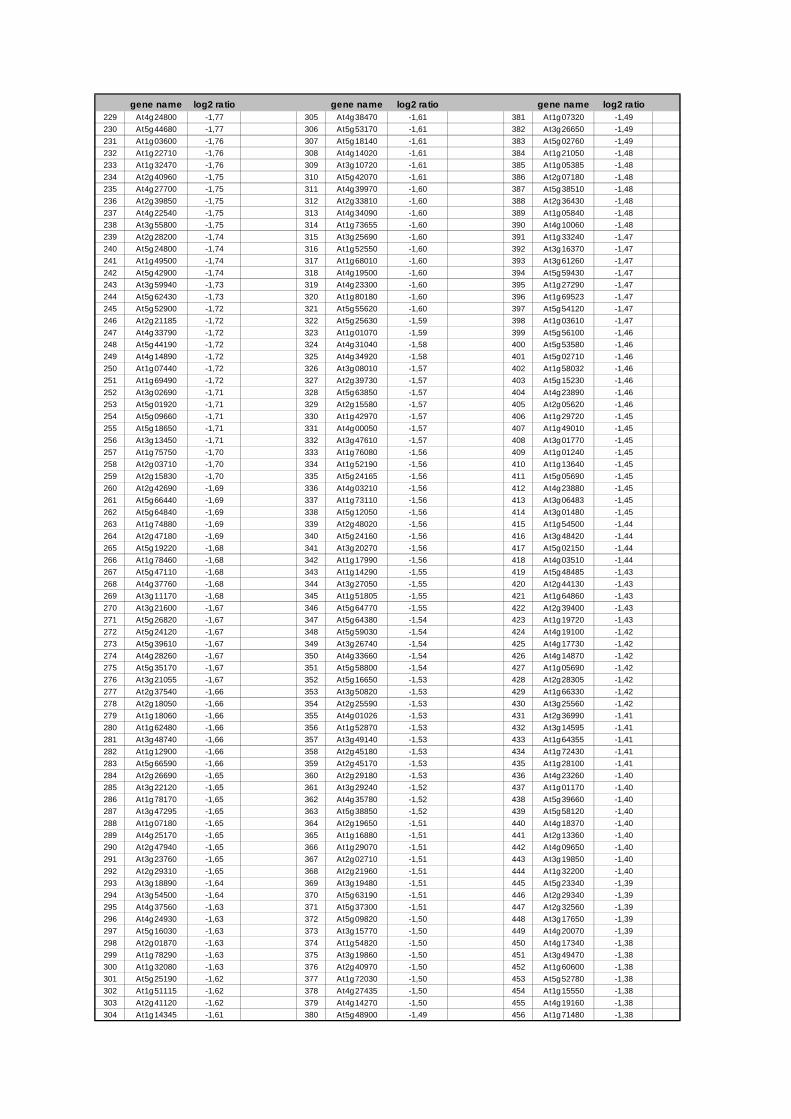
gene name log2 ratio gene name log2 ratio gene name log2 ratio229 At4g24800 -1,77 305 At4g38470 -1,61 381 At1g07320 -1,49
230 At5g44680 -1,77 306 At5g53170 -1,61 382 At3g26650 -1,49
231 At1g03600 -1,76 307 At5g18140 -1,61 383 At5g02760 -1,49
232 At1g22710 -1,76 308 At4g14020 -1,61 384 At1g21050 -1,48
233 At1g32470 -1,76 309 At3g10720 -1,61 385 At1g05385 -1,48
234 At2g40960 -1,75 310 At5g42070 -1,61 386 At2g07180 -1,48
235 At4g27700 -1,75 311 At4g39970 -1,60 387 At5g38510 -1,48
236 At2g39850 -1,75 312 At2g33810 -1,60 388 At2g36430 -1,48
237 At4g22540 -1,75 313 At4g34090 -1,60 389 At1g05840 -1,48
238 At3g55800 -1,75 314 At1g73655 -1,60 390 At4g10060 -1,48
239 At2g28200 -1,74 315 At3g25690 -1,60 391 At1g33240 -1,47
240 At5g24800 -1,74 316 At1g52550 -1,60 392 At3g16370 -1,47
241 At1g49500 -1,74 317 At1g68010 -1,60 393 At3g61260 -1,47
242 At5g42900 -1,74 318 At4g19500 -1,60 394 At5g59430 -1,47
243 At3g59940 -1,73 319 At4g23300 -1,60 395 At1g27290 -1,47
244 At5g62430 -1,73 320 At1g80180 -1,60 396 At1g69523 -1,47
245 At5g52900 -1,72 321 At5g55620 -1,60 397 At5g54120 -1,47
246 At2g21185 -1,72 322 At5g25630 -1,59 398 At1g03610 -1,47
247 At4g33790 -1,72 323 At1g01070 -1,59 399 At5g56100 -1,46
248 At5g44190 -1,72 324 At4g31040 -1,58 400 At5g53580 -1,46
249 At4g14890 -1,72 325 At4g34920 -1,58 401 At5g02710 -1,46
250 At1g07440 -1,72 326 At3g08010 -1,57 402 At1g58032 -1,46
251 At1g69490 -1,72 327 At2g39730 -1,57 403 At5g15230 -1,46
252 At3g02690 -1,71 328 At5g63850 -1,57 404 At4g23890 -1,46
253 At5g01920 -1,71 329 At2g15580 -1,57 405 At2g05620 -1,46
254 At5g09660 -1,71 330 At1g42970 -1,57 406 At1g29720 -1,45
255 At5g18650 -1,71 331 At4g00050 -1,57 407 At1g49010 -1,45
256 At3g13450 -1,71 332 At3g47610 -1,57 408 At3g01770 -1,45
257 At1g75750 -1,70 333 At1g76080 -1,56 409 At1g01240 -1,45
258 At2g03710 -1,70 334 At1g52190 -1,56 410 At1g13640 -1,45
259 At2g15830 -1,70 335 At5g24165 -1,56 411 At5g05690 -1,45
260 At2g42690 -1,69 336 At4g03210 -1,56 412 At4g23880 -1,45
261 At5g66440 -1,69 337 At1g73110 -1,56 413 At3g06483 -1,45
262 At5g64840 -1,69 338 At5g12050 -1,56 414 At3g01480 -1,45
263 At1g74880 -1,69 339 At2g48020 -1,56 415 At1g54500 -1,44
264 At2g47180 -1,69 340 At5g24160 -1,56 416 At3g48420 -1,44
265 At5g19220 -1,68 341 At3g20270 -1,56 417 At5g02150 -1,44
266 At1g78460 -1,68 342 At1g17990 -1,56 418 At4g03510 -1,44
267 At5g47110 -1,68 343 At1g14290 -1,55 419 At5g48485 -1,43
268 At4g37760 -1,68 344 At3g27050 -1,55 420 At2g44130 -1,43
269 At3g11170 -1,68 345 At1g51805 -1,55 421 At1g64860 -1,43
270 At3g21600 -1,67 346 At5g64770 -1,55 422 At2g39400 -1,43
271 At5g26820 -1,67 347 At5g64380 -1,54 423 At1g19720 -1,43
272 At5g24120 -1,67 348 At5g59030 -1,54 424 At4g19100 -1,42
273 At5g39610 -1,67 349 At3g26740 -1,54 425 At4g17730 -1,42
274 At4g28260 -1,67 350 At4g33660 -1,54 426 At4g14870 -1,42
275 At5g35170 -1,67 351 At5g58800 -1,54 427 At1g05690 -1,42
276 At3g21055 -1,67 352 At5g16650 -1,53 428 At2g28305 -1,42
277 At2g37540 -1,66 353 At3g50820 -1,53 429 At1g66330 -1,42
278 At2g18050 -1,66 354 At2g25590 -1,53 430 At3g25560 -1,42
279 At1g18060 -1,66 355 At4g01026 -1,53 431 At2g36990 -1,41
280 At1g62480 -1,66 356 At1g52870 -1,53 432 At3g14595 -1,41
281 At3g48740 -1,66 357 At3g49140 -1,53 433 At1g64355 -1,41
282 At1g12900 -1,66 358 At2g45180 -1,53 434 At1g72430 -1,41
283 At5g66590 -1,66 359 At2g45170 -1,53 435 At1g28100 -1,41
284 At2g26690 -1,65 360 At2g29180 -1,53 436 At4g23260 -1,40
285 At3g22120 -1,65 361 At3g29240 -1,52 437 At1g01170 -1,40
286 At1g78170 -1,65 362 At4g35780 -1,52 438 At5g39660 -1,40
287 At3g47295 -1,65 363 At5g38850 -1,52 439 At5g58120 -1,40
288 At1g07180 -1,65 364 At2g19650 -1,51 440 At4g18370 -1,40
289 At4g25170 -1,65 365 At1g16880 -1,51 441 At2g13360 -1,40
290 At2g47940 -1,65 366 At1g29070 -1,51 442 At4g09650 -1,40
291 At3g23760 -1,65 367 At2g02710 -1,51 443 At3g19850 -1,40
292 At2g29310 -1,65 368 At2g21960 -1,51 444 At1g32200 -1,40
293 At3g18890 -1,64 369 At3g19480 -1,51 445 At5g23340 -1,39
294 At3g54500 -1,64 370 At5g63190 -1,51 446 At2g29340 -1,39
295 At4g37560 -1,63 371 At5g37300 -1,51 447 At2g32560 -1,39
296 At4g24930 -1,63 372 At5g09820 -1,50 448 At3g17650 -1,39
297 At5g16030 -1,63 373 At3g15770 -1,50 449 At4g20070 -1,39
298 At2g01870 -1,63 374 At1g54820 -1,50 450 At4g17340 -1,38
299 At1g78290 -1,63 375 At3g19860 -1,50 451 At3g49470 -1,38
300 At1g32080 -1,63 376 At2g40970 -1,50 452 At1g60600 -1,38
301 At5g25190 -1,62 377 At1g72030 -1,50 453 At5g52780 -1,38
302 At1g51115 -1,62 378 At4g27435 -1,50 454 At1g15550 -1,38
303 At2g41120 -1,62 379 At4g14270 -1,50 455 At4g19160 -1,38
304 At1g14345 -1,61 380 At5g48900 -1,49 456 At1g71480 -1,38
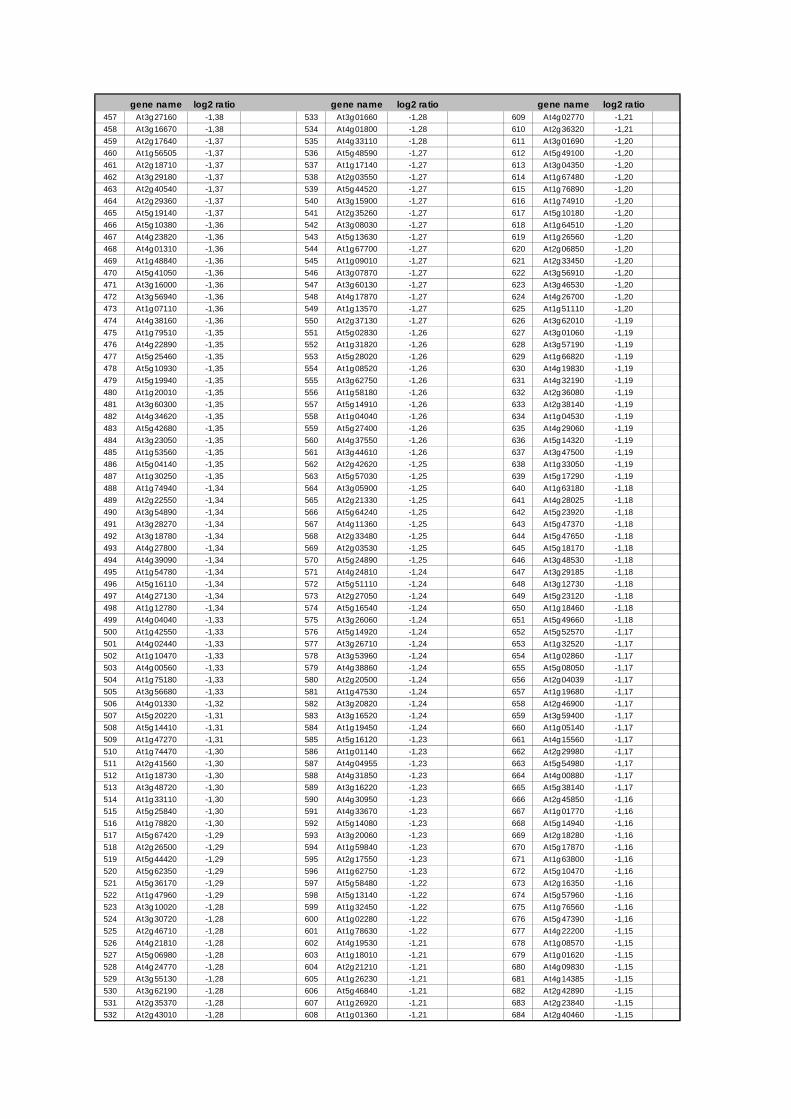
gene name log2 ratio gene name log2 ratio gene name log2 ratio457 At3g27160 -1,38 533 At3g01660 -1,28 609 At4g02770 -1,21
458 At3g16670 -1,38 534 At4g01800 -1,28 610 At2g36320 -1,21
459 At2g17640 -1,37 535 At4g33110 -1,28 611 At3g01690 -1,20
460 At1g56505 -1,37 536 At5g48590 -1,27 612 At5g49100 -1,20
461 At2g18710 -1,37 537 At1g17140 -1,27 613 At3g04350 -1,20
462 At3g29180 -1,37 538 At2g03550 -1,27 614 At1g67480 -1,20
463 At2g40540 -1,37 539 At5g44520 -1,27 615 At1g76890 -1,20
464 At2g29360 -1,37 540 At3g15900 -1,27 616 At1g74910 -1,20
465 At5g19140 -1,37 541 At2g35260 -1,27 617 At5g10180 -1,20
466 At5g10380 -1,36 542 At3g08030 -1,27 618 At1g64510 -1,20
467 At4g23820 -1,36 543 At5g13630 -1,27 619 At1g26560 -1,20
468 At4g01310 -1,36 544 At1g67700 -1,27 620 At2g06850 -1,20
469 At1g48840 -1,36 545 At1g09010 -1,27 621 At2g33450 -1,20
470 At5g41050 -1,36 546 At3g07870 -1,27 622 At3g56910 -1,20
471 At3g16000 -1,36 547 At3g60130 -1,27 623 At3g46530 -1,20
472 At3g56940 -1,36 548 At4g17870 -1,27 624 At4g26700 -1,20
473 At1g07110 -1,36 549 At1g13570 -1,27 625 At1g51110 -1,20
474 At4g38160 -1,36 550 At2g37130 -1,27 626 At3g62010 -1,19
475 At1g79510 -1,35 551 At5g02830 -1,26 627 At3g01060 -1,19
476 At4g22890 -1,35 552 At1g31820 -1,26 628 At3g57190 -1,19
477 At5g25460 -1,35 553 At5g28020 -1,26 629 At1g66820 -1,19
478 At5g10930 -1,35 554 At1g08520 -1,26 630 At4g19830 -1,19
479 At5g19940 -1,35 555 At3g62750 -1,26 631 At4g32190 -1,19
480 At1g20010 -1,35 556 At1g58180 -1,26 632 At2g36080 -1,19
481 At3g60300 -1,35 557 At5g14910 -1,26 633 At2g38140 -1,19
482 At4g34620 -1,35 558 At1g04040 -1,26 634 At1g04530 -1,19
483 At5g42680 -1,35 559 At5g27400 -1,26 635 At4g29060 -1,19
484 At3g23050 -1,35 560 At4g37550 -1,26 636 At5g14320 -1,19
485 At1g53560 -1,35 561 At3g44610 -1,26 637 At3g47500 -1,19
486 At5g04140 -1,35 562 At2g42620 -1,25 638 At1g33050 -1,19
487 At1g30250 -1,35 563 At5g57030 -1,25 639 At5g17290 -1,19
488 At1g74940 -1,34 564 At3g05900 -1,25 640 At1g63180 -1,18
489 At2g22550 -1,34 565 At2g21330 -1,25 641 At4g28025 -1,18
490 At3g54890 -1,34 566 At5g64240 -1,25 642 At5g23920 -1,18
491 At3g28270 -1,34 567 At4g11360 -1,25 643 At5g47370 -1,18
492 At3g18780 -1,34 568 At2g33480 -1,25 644 At5g47650 -1,18
493 At4g27800 -1,34 569 At2g03530 -1,25 645 At5g18170 -1,18
494 At4g39090 -1,34 570 At5g24890 -1,25 646 At3g48530 -1,18
495 At1g54780 -1,34 571 At4g24810 -1,24 647 At3g29185 -1,18
496 At5g16110 -1,34 572 At5g51110 -1,24 648 At3g12730 -1,18
497 At4g27130 -1,34 573 At2g27050 -1,24 649 At5g23120 -1,18
498 At1g12780 -1,34 574 At5g16540 -1,24 650 At1g18460 -1,18
499 At4g04040 -1,33 575 At3g26060 -1,24 651 At5g49660 -1,18
500 At1g42550 -1,33 576 At5g14920 -1,24 652 At5g52570 -1,17
501 At4g02440 -1,33 577 At3g26710 -1,24 653 At1g32520 -1,17
502 At1g10470 -1,33 578 At3g53960 -1,24 654 At1g02860 -1,17
503 At4g00560 -1,33 579 At4g38860 -1,24 655 At5g08050 -1,17
504 At1g75180 -1,33 580 At2g20500 -1,24 656 At2g04039 -1,17
505 At3g56680 -1,33 581 At1g47530 -1,24 657 At1g19680 -1,17
506 At4g01330 -1,32 582 At3g20820 -1,24 658 At2g46900 -1,17
507 At5g20220 -1,31 583 At3g16520 -1,24 659 At3g59400 -1,17
508 At5g14410 -1,31 584 At1g19450 -1,24 660 At1g05140 -1,17
509 At1g47270 -1,31 585 At5g16120 -1,23 661 At4g15560 -1,17
510 At1g74470 -1,30 586 At1g01140 -1,23 662 At2g29980 -1,17
511 At2g41560 -1,30 587 At4g04955 -1,23 663 At5g54980 -1,17
512 At1g18730 -1,30 588 At4g31850 -1,23 664 At4g00880 -1,17
513 At3g48720 -1,30 589 At3g16220 -1,23 665 At5g38140 -1,17
514 At1g33110 -1,30 590 At4g30950 -1,23 666 At2g45850 -1,16
515 At5g25840 -1,30 591 At4g33670 -1,23 667 At1g01770 -1,16
516 At1g78820 -1,30 592 At5g14080 -1,23 668 At5g14940 -1,16
517 At5g67420 -1,29 593 At3g20060 -1,23 669 At2g18280 -1,16
518 At2g26500 -1,29 594 At1g59840 -1,23 670 At5g17870 -1,16
519 At5g44420 -1,29 595 At2g17550 -1,23 671 At1g63800 -1,16
520 At5g62350 -1,29 596 At1g62750 -1,23 672 At5g10470 -1,16
521 At5g36170 -1,29 597 At5g58480 -1,22 673 At2g16350 -1,16
522 At1g47960 -1,29 598 At5g13140 -1,22 674 At5g57960 -1,16
523 At3g10020 -1,28 599 At1g32450 -1,22 675 At1g76560 -1,16
524 At3g30720 -1,28 600 At1g02280 -1,22 676 At5g47390 -1,16
525 At2g46710 -1,28 601 At1g78630 -1,22 677 At4g22200 -1,15
526 At4g21810 -1,28 602 At4g19530 -1,21 678 At1g08570 -1,15
527 At5g06980 -1,28 603 At1g18010 -1,21 679 At1g01620 -1,15
528 At4g24770 -1,28 604 At2g21210 -1,21 680 At4g09830 -1,15
529 At3g55130 -1,28 605 At1g26230 -1,21 681 At4g14385 -1,15
530 At3g62190 -1,28 606 At5g46840 -1,21 682 At2g42890 -1,15
531 At2g35370 -1,28 607 At1g26920 -1,21 683 At2g23840 -1,15
532 At2g43010 -1,28 608 At1g01360 -1,21 684 At2g40460 -1,15
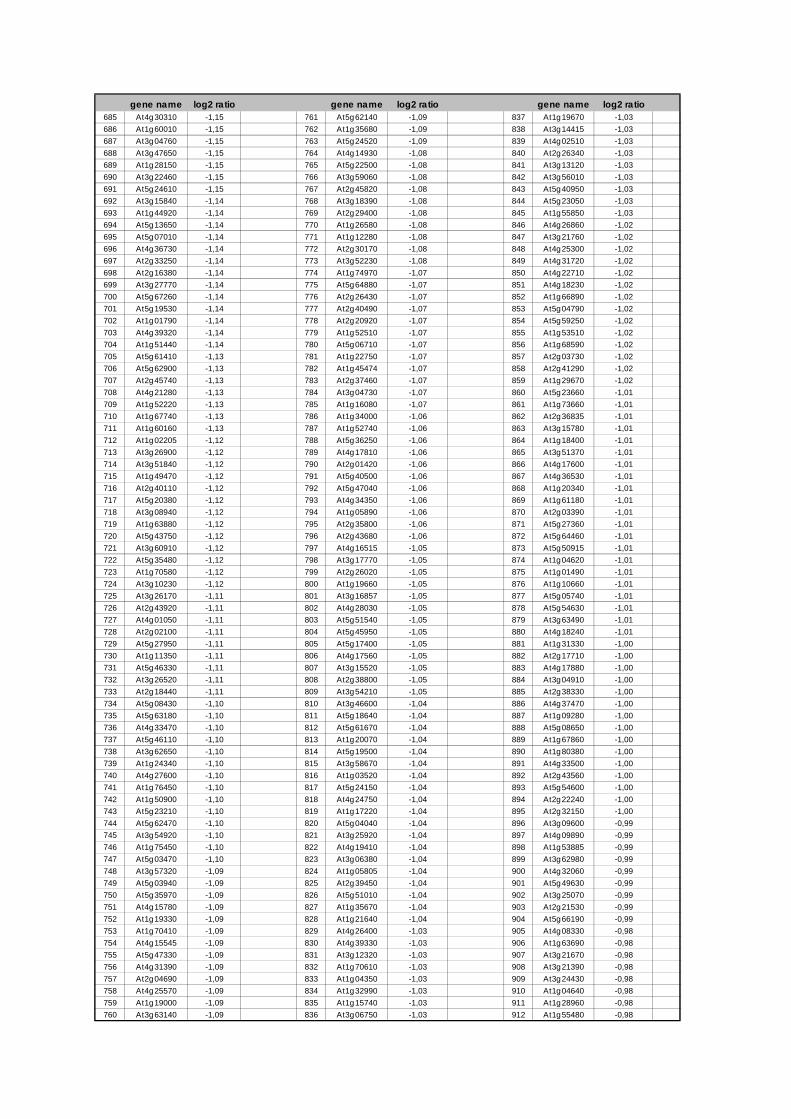
gene name log2 ratio gene name log2 ratio gene name log2 ratio685 At4g30310 -1,15 761 At5g62140 -1,09 837 At1g19670 -1,03
686 At1g60010 -1,15 762 At1g35680 -1,09 838 At3g14415 -1,03
687 At3g04760 -1,15 763 At5g24520 -1,09 839 At4g02510 -1,03
688 At3g47650 -1,15 764 At4g14930 -1,08 840 At2g26340 -1,03
689 At1g28150 -1,15 765 At5g22500 -1,08 841 At3g13120 -1,03
690 At3g22460 -1,15 766 At3g59060 -1,08 842 At3g56010 -1,03
691 At5g24610 -1,15 767 At2g45820 -1,08 843 At5g40950 -1,03
692 At3g15840 -1,14 768 At3g18390 -1,08 844 At5g23050 -1,03
693 At1g44920 -1,14 769 At2g29400 -1,08 845 At1g55850 -1,03
694 At5g13650 -1,14 770 At1g26580 -1,08 846 At4g26860 -1,02
695 At5g07010 -1,14 771 At1g12280 -1,08 847 At3g21760 -1,02
696 At4g36730 -1,14 772 At2g30170 -1,08 848 At4g25300 -1,02
697 At2g33250 -1,14 773 At3g52230 -1,08 849 At4g31720 -1,02
698 At2g16380 -1,14 774 At1g74970 -1,07 850 At4g22710 -1,02
699 At3g27770 -1,14 775 At5g64880 -1,07 851 At4g18230 -1,02
700 At5g67260 -1,14 776 At2g26430 -1,07 852 At1g66890 -1,02
701 At5g19530 -1,14 777 At2g40490 -1,07 853 At5g04790 -1,02
702 At1g01790 -1,14 778 At2g20920 -1,07 854 At5g59250 -1,02
703 At4g39320 -1,14 779 At1g52510 -1,07 855 At1g53510 -1,02
704 At1g51440 -1,14 780 At5g06710 -1,07 856 At1g68590 -1,02
705 At5g61410 -1,13 781 At1g22750 -1,07 857 At2g03730 -1,02
706 At5g62900 -1,13 782 At1g45474 -1,07 858 At2g41290 -1,02
707 At2g45740 -1,13 783 At2g37460 -1,07 859 At1g29670 -1,02
708 At4g21280 -1,13 784 At3g04730 -1,07 860 At5g23660 -1,01
709 At1g52220 -1,13 785 At1g16080 -1,07 861 At1g73660 -1,01
710 At1g67740 -1,13 786 At1g34000 -1,06 862 At2g36835 -1,01
711 At1g60160 -1,13 787 At1g52740 -1,06 863 At3g15780 -1,01
712 At1g02205 -1,12 788 At5g36250 -1,06 864 At1g18400 -1,01
713 At3g26900 -1,12 789 At4g17810 -1,06 865 At3g51370 -1,01
714 At3g51840 -1,12 790 At2g01420 -1,06 866 At4g17600 -1,01
715 At1g49470 -1,12 791 At5g40500 -1,06 867 At4g36530 -1,01
716 At2g40110 -1,12 792 At5g47040 -1,06 868 At1g20340 -1,01
717 At5g20380 -1,12 793 At4g34350 -1,06 869 At1g61180 -1,01
718 At3g08940 -1,12 794 At1g05890 -1,06 870 At2g03390 -1,01
719 At1g63880 -1,12 795 At2g35800 -1,06 871 At5g27360 -1,01
720 At5g43750 -1,12 796 At2g43680 -1,06 872 At5g64460 -1,01
721 At3g60910 -1,12 797 At4g16515 -1,05 873 At5g50915 -1,01
722 At5g35480 -1,12 798 At3g17770 -1,05 874 At1g04620 -1,01
723 At1g70580 -1,12 799 At2g26020 -1,05 875 At1g01490 -1,01
724 At3g10230 -1,12 800 At1g19660 -1,05 876 At1g10660 -1,01
725 At3g26170 -1,11 801 At3g16857 -1,05 877 At5g05740 -1,01
726 At2g43920 -1,11 802 At4g28030 -1,05 878 At5g54630 -1,01
727 At4g01050 -1,11 803 At5g51540 -1,05 879 At3g63490 -1,01
728 At2g02100 -1,11 804 At5g45950 -1,05 880 At4g18240 -1,01
729 At5g27950 -1,11 805 At5g17400 -1,05 881 At1g31330 -1,00
730 At1g11350 -1,11 806 At4g17560 -1,05 882 At2g17710 -1,00
731 At5g46330 -1,11 807 At3g15520 -1,05 883 At4g17880 -1,00
732 At3g26520 -1,11 808 At2g38800 -1,05 884 At3g04910 -1,00
733 At2g18440 -1,11 809 At3g54210 -1,05 885 At2g38330 -1,00
734 At5g08430 -1,10 810 At3g46600 -1,04 886 At4g37470 -1,00
735 At5g63180 -1,10 811 At5g18640 -1,04 887 At1g09280 -1,00
736 At4g33470 -1,10 812 At5g61670 -1,04 888 At5g08650 -1,00
737 At5g46110 -1,10 813 At1g20070 -1,04 889 At1g67860 -1,00
738 At3g62650 -1,10 814 At5g19500 -1,04 890 At1g80380 -1,00
739 At1g24340 -1,10 815 At3g58670 -1,04 891 At4g33500 -1,00
740 At4g27600 -1,10 816 At1g03520 -1,04 892 At2g43560 -1,00
741 At1g76450 -1,10 817 At5g24150 -1,04 893 At5g54600 -1,00
742 At1g50900 -1,10 818 At4g24750 -1,04 894 At2g22240 -1,00
743 At5g23210 -1,10 819 At1g17220 -1,04 895 At2g32150 -1,00
744 At5g62470 -1,10 820 At5g04040 -1,04 896 At3g09600 -0,99
745 At3g54920 -1,10 821 At3g25920 -1,04 897 At4g09890 -0,99
746 At1g75450 -1,10 822 At4g19410 -1,04 898 At1g53885 -0,99
747 At5g03470 -1,10 823 At3g06380 -1,04 899 At3g62980 -0,99
748 At3g57320 -1,09 824 At1g05805 -1,04 900 At4g32060 -0,99
749 At5g03940 -1,09 825 At2g39450 -1,04 901 At5g49630 -0,99
750 At5g35970 -1,09 826 At5g51010 -1,04 902 At3g25070 -0,99
751 At4g15780 -1,09 827 At1g35670 -1,04 903 At2g21530 -0,99
752 At1g19330 -1,09 828 At1g21640 -1,04 904 At5g66190 -0,99
753 At1g70410 -1,09 829 At4g26400 -1,03 905 At4g08330 -0,98
754 At4g15545 -1,09 830 At4g39330 -1,03 906 At1g63690 -0,98
755 At5g47330 -1,09 831 At3g12320 -1,03 907 At3g21670 -0,98
756 At4g31390 -1,09 832 At1g70610 -1,03 908 At3g21390 -0,98
757 At2g04690 -1,09 833 At1g04350 -1,03 909 At3g24430 -0,98
758 At4g25570 -1,09 834 At1g32990 -1,03 910 At1g04640 -0,98
759 At1g19000 -1,09 835 At1g15740 -1,03 911 At1g28960 -0,98
760 At3g63140 -1,09 836 At3g06750 -1,03 912 At1g55480 -0,98
gene name log2 ratio gene name log2 ratio gene name log2 ratio913 At1g67050 -0,98 989 At3g05890 -0,92 1065 At2g33800 -0,87
914 At5g35330 -0,98 990 At1g07700 -0,92 1066 At2g38780 -0,87
915 At5g08410 -0,98 991 At2g01620 -0,92 1067 At1g49380 -0,86
916 At2g38460 -0,97 992 At3g10770 -0,92 1068 At1g14270 -0,86
917 At5g64920 -0,97 993 At5g22875 -0,92 1069 At5g06290 -0,86
918 At2g05380 -0,97 994 At4g32980 -0,92 1070 At1g12520 -0,86
919 At4g35250 -0,97 995 At1g12800 -0,92 1071 At3g14660 -0,86
920 At2g03420 -0,97 996 At4g33010 -0,92 1072 At1g78150 -0,86
921 At1g07010 -0,97 997 At5g41700 -0,92 1073 At3g20230 -0,86
922 At2g23390 -0,97 998 At2g25080 -0,92 1074 At1g75080 -0,86
923 At3g60070 -0,97 999 At2g17040 -0,92 1075 At4g14480 -0,86
924 At2g30390 -0,97 1000 At3g20550 -0,92 1076 At1g24440 -0,86
925 At4g19510 -0,97 1001 At3g55080 -0,92 1077 At1g77490 -0,86
926 At1g60000 -0,97 1002 At1g23310 -0,92 1078 At2g39420 -0,86
927 At4g23400 -0,96 1003 At5g58770 -0,91 1079 At1g51500 -0,85
928 At1g70660 -0,96 1004 At5g23870 -0,91 1080 At2g27290 -0,85
929 At5g66030 -0,96 1005 At1g32700 -0,91 1081 At5g55300 -0,85
930 At2g15695 -0,96 1006 At5g47190 -0,91 1082 At3g23640 -0,85
931 At1g78180 -0,96 1007 At1g75220 -0,91 1083 At2g36900 -0,85
932 At2g28800 -0,96 1008 At4g14210 -0,91 1084 At2g37850 -0,85
933 At3g26590 -0,96 1009 At5g13740 -0,91 1085 At1g80960 -0,85
934 At5g42310 -0,96 1010 At1g15730 -0,91 1086 At4g31310 -0,85
935 At3g09210 -0,96 1011 At2g06520 -0,91 1087 At2g31750 -0,85
936 At2g46910 -0,96 1012 At5g05080 -0,91 1088 At4g29380 -0,85
937 At5g58570 -0,96 1013 At1g28410 -0,91 1089 At4g18910 -0,84
938 At1g65190 -0,96 1014 At1g14280 -0,91 1090 At5g07580 -0,84
939 At1g75410 -0,96 1015 At5g05800 -0,91 1091 At5g37260 -0,84
940 At5g19430 -0,96 1016 At2g31810 -0,91 1092 At1g66150 -0,84
941 At1g72450 -0,96 1017 At2g32500 -0,90 1093 At2g31040 -0,84
942 At1g50250 -0,96 1018 At5g44410 -0,90 1094 At1g01060 -0,84
943 At1g60950 -0,96 1019 At1g56280 -0,90 1095 At1g64150 -0,84
944 At5g39030 -0,96 1020 At4g16330 -0,90 1096 At1g34640 -0,84
945 At2g22310 -0,95 1021 At5g20935 -0,90 1097 At4g19985 -0,84
946 At1g67330 -0,95 1022 At2g20180 -0,90 1098 At2g42580 -0,84
947 At4g35020 -0,95 1023 At3g61490 -0,90 1099 At3g52380 -0,84
948 At1g48350 -0,95 1024 At2g32440 -0,90 1100 At1g73500 -0,83
949 At1g70530 -0,95 1025 At1g17160 -0,90 1101 At5g58250 -0,83
950 At1g10960 -0,95 1026 At4g37790 -0,90 1102 At1g70100 -0,83
951 At4g04830 -0,95 1027 At1g48100 -0,90 1103 At5g37055 -0,83
952 At1g56200 -0,95 1028 At3g50685 -0,90 1104 At1g54210 -0,83
953 At1g77480 -0,95 1029 At3g52150 -0,90 1105 At3g12080 -0,83
954 At4g31560 -0,95 1030 At1g77990 -0,90 1106 At5g14390 -0,83
955 At4g24340 -0,95 1031 At1g15170 -0,90 1107 At5g03430 -0,83
956 At2g30600 -0,94 1032 At1g75350 -0,90 1108 At1g14030 -0,82
957 At3g05640 -0,94 1033 At3g55770 -0,90 1109 At1g17650 -0,82
958 At5g58575 -0,94 1034 At3g43800 -0,90 1110 At1g32160 -0,82
959 At4g18160 -0,94 1035 At2g40100 -0,89 1111 At3g43540 -0,82
960 At4g37300 -0,94 1036 At2g24060 -0,89 1112 At5g57910 -0,82
961 At1g74730 -0,94 1037 At3g16140 -0,89 1113 At5g55910 -0,82
962 At4g28085 -0,94 1038 At4g03110 -0,89 1114 At1g71970 -0,82
963 At2g46820 -0,94 1039 At5g24420 -0,89 1115 At1g14210 -0,82
964 At1g03400 -0,94 1040 At3g52290 -0,89 1116 At2g38530 -0,82
965 At1g09770 -0,94 1041 At3g10060 -0,89 1117 At3g50530 -0,82
966 At4g30993 -0,94 1042 At4g35750 -0,89 1118 At4g04640 -0,82
967 At1g11860 -0,94 1043 At1g62250 -0,89 1119 At2g33830 -0,82
968 At3g03990 -0,94 1044 At5g65730 -0,89 1120 At2g45960 -0,82
969 At5g65220 -0,94 1045 At1g36980 -0,89 1121 At3g13360 -0,81
970 At5g54080 -0,94 1046 At3g44630 -0,89 1122 At1g70250 -0,81
971 At2g26080 -0,93 1047 At4g01120 -0,89 1123 At3g06510 -0,81
972 At1g75440 -0,93 1048 At4g32590 -0,89 1124 At3g59490 -0,81
973 At5g25120 -0,93 1049 At2g01320 -0,89 1125 At3g60340 -0,81
974 At5g55640 -0,93 1050 At5g64940 -0,88 1126 At3g45290 -0,81
975 At1g03630 -0,93 1051 At3g62910 -0,88 1127 At4g04350 -0,81
976 At2g21240 -0,93 1052 At3g16240 -0,88 1128 At5g53020 -0,81
977 At1g01120 -0,93 1053 At1g20160 -0,88 1129 At4g13670 -0,81
978 At4g28240 -0,93 1054 At5g47840 -0,88 1130 At4g29220 -0,81
979 At2g21320 -0,93 1055 At3g18980 -0,88 1131 At5g44250 -0,80
980 At5g67030 -0,93 1056 At1g33290 -0,88 1132 At4g25960 -0,80
981 At2g46340 -0,93 1057 At4g03280 -0,88 1133 At3g12610 -0,80
982 At3g49590 -0,93 1058 At2g35410 -0,87 1134 At4g26710 -0,80
983 At1g63980 -0,93 1059 At1g05160 -0,87 1135 At2g45530 -0,80
984 At2g42750 -0,93 1060 At5g23330 -0,87 1136 At5g52440 -0,80
985 At1g03675 -0,93 1061 At3g14560 -0,87 1137 At3g53130 -0,80
986 At1g28260 -0,93 1062 At1g04400 -0,87 1138 At5g13180 -0,80
987 At5g58330 -0,93 1063 At1g34310 -0,87 1139 At3g55310 -0,80
988 At2g20260 -0,92 1064 At3g26070 -0,87 1140 At5g16710 -0,80
gene name log2 ratio gene name log2 ratio gene name log2 ratio1141 At1g52230 -0,79 1217 At4g33220 -0,74 1293 At1g18880 -0,63
1142 At2g21385 -0,79 1218 At2g38310 -0,73 1294 At5g56860 -0,63
1143 At4g02210 -0,79 1219 At1g26180 -0,73 1295 At4g25700 -0,63
1144 At1g66940 -0,79 1220 At3g17590 -0,73 1296 At5g57100 -0,63
1145 At3g46630 -0,79 1221 At5g62790 -0,73 1297 At3g14650 -0,63
1146 At1g62030 -0,79 1222 At2g42590 -0,73 1298 At1g01725 -0,63
1147 At5g13240 -0,79 1223 At1g57790 -0,73 1299 At5g16140 -0,63
1148 At2g20890 -0,79 1224 At1g08110 -0,73 1300 At1g32070 -0,62
1149 At5g66570 -0,79 1225 At4g11100 -0,73 1301 At2g45990 -0,62
1150 At5g46270 -0,79 1226 At2g40020 -0,73 1302 At4g34630 -0,62
1151 At5g59780 -0,79 1227 At1g51270 -0,72 1303 At3g06590 -0,62
1152 At4g31030 -0,79 1228 At2g41870 -0,72 1304 At2g24280 -0,62
1153 At1g21065 -0,79 1229 At1g73170 -0,72 1305 At5g22620 -0,61
1154 At4g39620 -0,79 1230 At2g28950 -0,72 1306 At3g59780 -0,61
1155 At2g38400 -0,79 1231 At1g10900 -0,72 1307 At3g27170 -0,61
1156 At3g50790 -0,79 1232 At2g29720 -0,72 1308 At4g37200 -0,61
1157 At2g35810 -0,78 1233 At1g23400 -0,72 1309 At4g23180 -0,60
1158 At5g04490 -0,78 1234 At1g58200 -0,72 1310 At1g44575 -0,60
1159 At3g04940 -0,78 1235 At5g47435 -0,72 1311 At1g06500 -0,60
1160 At5g29771 -0,78 1236 At5g57930 -0,72 1312 At5g54730 -0,60
1161 At2g35760 -0,78 1237 At1g19700 -0,71 1313 At4g20380 -0,60
1162 At5g58870 -0,78 1238 At1g55670 -0,71 1314 At1g04550 -0,59
1163 At4g28290 -0,78 1239 At1g20650 -0,71 1315 At3g26580 -0,59
1164 At1g55260 -0,78 1240 At1g66980 -0,71 1316 At2g31450 -0,58
1165 At1g18650 -0,78 1241 At5g38990 -0,71 1317 At2g30350 -0,58
1166 At2g34860 -0,78 1242 At5g25770 -0,71 1318 At5g46420 -0,58
1167 At1g29700 -0,78 1243 At1g21130 -0,71 1319 At5g10460 -0,57
1168 At3g26280 -0,78 1244 At5g51140 -0,71 1320 At2g35920 -0,57
1169 At1g01540 -0,78 1245 At1g18170 -0,71 1321 At3g53410 -0,57
1170 At1g79670 -0,78 1246 At1g28440 -0,70 1322 At2g30520 -0,54
1171 At3g51820 -0,78 1247 At1g16810 -0,70 1323 At1g73060 -0,53
1172 At3g21510 -0,78 1248 At1g45976 -0,70 1324 At5g66460 -0,53
1173 At5g13090 -0,78 1249 At3g45780 -0,70 1325 At2g33310 -0,53
1174 At1g08380 -0,77 1250 At5g27350 -0,70 1326 At2g33255 -0,53
1175 At5g13410 -0,77 1251 At3g51895 -0,70 1327 At2g40000 -0,52
1176 At4g10300 -0,77 1252 At2g35960 -0,70 1328 At1g15670 -0,17
1177 At2g37220 -0,77 1253 At3g54900 -0,70 1329 At1g07590 -0,16
1178 At5g18590 -0,77 1254 At4g25620 -0,70 1330 At1g05560 -0,09
1179 At1g05810 -0,77 1255 At1g78895 -0,69 1331 At3g23550 -0,02
1180 At4g15110 -0,77 1256 At1g56500 -0,69 1332 At2g38240 0,15
1181 At3g04260 -0,77 1257 At1g29660 -0,69 1333 At4g31290 0,18
1182 At1g66920 -0,77 1258 At4g12010 -0,69 1334 At4g27410 0,25
1183 At5g55220 -0,77 1259 At5g64330 -0,69 1335 At3g21230 0,28
1184 At2g24090 -0,77 1260 At2g47910 -0,69 1336 At2g37970 0,52
1185 At5g42240 -0,77 1261 At1g08540 -0,69 1337 At4g30650 0,53
1186 At3g16010 -0,76 1262 At1g05900 -0,69 1338 At1g66250 0,53
1187 At1g78020 -0,76 1263 At5g28750 -0,68 1339 At1g13210 0,53
1188 At3g63190 -0,76 1264 At2g23610 -0,68 1340 At5g14790 0,54
1189 At5g06265 -0,76 1265 At5g13690 -0,68 1341 At4g33040 0,54
1190 At4g10770 -0,76 1266 At1g30360 -0,68 1342 At1g01250 0,54
1191 At4g38430 -0,76 1267 At4g11175 -0,68 1343 At3g55640 0,55
1192 At3g06770 -0,76 1268 At1g01080 -0,68 1344 At5g46910 0,55
1193 At3g52060 -0,76 1269 At5g27560 -0,67 1345 At4g02350 0,56
1194 At1g78510 -0,76 1270 At4g22753 -0,67 1346 At1g22650 0,56
1195 At5g58350 -0,76 1271 At5g42765 -0,67 1347 At5g18440 0,56
1196 At4g18210 -0,76 1272 At1g60140 -0,67 1348 At1g33940 0,56
1197 At4g15430 -0,76 1273 At1g13090 -0,66 1349 At3g05220 0,56
1198 At1g03820 -0,76 1274 At1g22050 -0,66 1350 At5g35980 0,57
1199 At5g07020 -0,75 1275 At1g63850 -0,66 1351 At1g08970 0,57
1200 At4g31530 -0,75 1276 At1g33590 -0,66 1352 At1g79560 0,57
1201 At3g19580 -0,75 1277 At4g24350 -0,66 1353 At3g09310 0,58
1202 At3g03710 -0,75 1278 At5g06060 -0,66 1354 At4g02280 0,58
1203 At4g30790 -0,75 1279 At4g02530 -0,65 1355 At1g76510 0,59
1204 At5g52550 -0,75 1280 At3g25805 -0,65 1356 At4g16990 0,59
1205 At3g52155 -0,75 1281 At4g05090 -0,65 1357 At5g01010 0,59
1206 At5g22270 -0,75 1282 At3g11090 -0,65 1358 At2g16480 0,59
1207 At1g20840 -0,75 1283 At5g12260 -0,65 1359 At4g27380 0,59
1208 At3g50440 -0,74 1284 At1g11410 -0,64 1360 At1g06380 0,59
1209 At5g42030 -0,74 1285 At2g34930 -0,64 1361 At1g59960 0,60
1210 At5g05480 -0,74 1286 At2g21280 -0,64 1362 At4g34555 0,60
1211 At3g61870 -0,74 1287 At4g17740 -0,64 1363 At2g32990 0,60
1212 At2g21540 -0,74 1288 At2g33050 -0,64 1364 At1g67940 0,60
1213 At5g16520 -0,74 1289 At3g02450 -0,64 1365 At1g09940 0,60
1214 At2g24820 -0,74 1290 At5g07690 -0,63 1366 At2g30140 0,61
1215 At3g07360 -0,74 1291 At5g03230 -0,63 1367 At5g42080 0,61
1216 At4g38530 -0,74 1292 At3g46900 -0,63 1368 At3g47450 0,61
gene name log2 ratio gene name log2 ratio gene name log2 ratio1369 At1g80410 0,62 1445 At5g53140 0,69 1521 At3g48250 0,75
1370 At2g37860 0,62 1446 At1g74810 0,69 1522 At5g66680 0,75
1371 At5g16040 0,62 1447 At4g39390 0,69 1523 At1g16900 0,75
1372 At5g22540 0,62 1448 At1g59910 0,69 1524 At4g33490 0,75
1373 At1g49400 0,62 1449 At3g23210 0,69 1525 At2g41180 0,75
1374 At3g49810 0,62 1450 At5g61310 0,69 1526 At5g45350 0,75
1375 At1g56120 0,62 1451 At2g45070 0,70 1527 At3g07230 0,75
1376 At4g30440 0,62 1452 At3g50480 0,70 1528 At4g25320 0,75
1377 At3g10520 0,62 1453 At5g40580 0,70 1529 At3g57090 0,75
1378 At3g49100 0,62 1454 At4g34135 0,70 1530 At3g54090 0,75
1379 At5g56610 0,63 1455 At1g30120 0,70 1531 At4g31985 0,75
1380 At2g33845 0,63 1456 At1g64600 0,70 1532 At1g63000 0,75
1381 At1g02500 0,63 1457 At1g22510 0,70 1533 At5g65880 0,75
1382 At2g17870 0,63 1458 At2g27580 0,70 1534 At1g16350 0,76
1383 At2g19860 0,63 1459 At2g32240 0,70 1535 At1g41830 0,76
1384 At3g10800 0,63 1460 At1g11700 0,71 1536 At4g35260 0,76
1385 At5g46350 0,64 1461 At1g68370 0,71 1537 At1g07430 0,76
1386 At1g13950 0,64 1462 At3g52580 0,71 1538 At3g53430 0,76
1387 At5g67600 0,64 1463 At3g14790 0,71 1539 At4g23600 0,76
1388 At1g73880 0,64 1464 At5g13460 0,71 1540 At4g00700 0,76
1389 At4g16250 0,64 1465 At2g18740 0,71 1541 At2g23930 0,76
1390 At4g01300 0,64 1466 At5g45410 0,71 1542 At1g08130 0,76
1391 At5g16060 0,64 1467 At5g49910 0,71 1543 At2g19120 0,76
1392 At5g51070 0,64 1468 At1g75390 0,71 1544 At3g22980 0,76
1393 At2g35605 0,64 1469 At3g08720 0,71 1545 At2g29550 0,76
1394 At3g53980 0,64 1470 At4g28640 0,71 1546 At1g27330 0,76
1395 At5g04170 0,65 1471 At2g39660 0,71 1547 At3g07630 0,76
1396 At5g39320 0,65 1472 At1g57660 0,71 1548 At4g23270 0,76
1397 At2g43500 0,65 1473 At3g05230 0,71 1549 At3g52800 0,76
1398 At1g04710 0,65 1474 At2g20900 0,71 1550 At1g19690 0,76
1399 At2g29120 0,65 1475 At1g15470 0,71 1551 At5g04540 0,76
1400 At3g12740 0,65 1476 At5g66070 0,72 1552 At2g46420 0,76
1401 At2g07687 0,65 1477 At3g02470 0,72 1553 At3g58700 0,77
1402 At2g43105 0,65 1478 At1g19180 0,72 1554 At3g25940 0,77
1403 At4g12720 0,65 1479 At2g39080 0,72 1555 At5g64860 0,77
1404 At2g46640 0,65 1480 At2g05990 0,72 1556 At4g24970 0,77
1405 At4g24270 0,65 1481 At1g64950 0,72 1557 At3g18820 0,77
1406 At2g37710 0,66 1482 At4g38360 0,72 1558 At4g12250 0,77
1407 At1g19025 0,66 1483 At5g65860 0,72 1559 At5g38530 0,77
1408 At5g41100 0,66 1484 At1g27680 0,72 1560 At1g07280 0,77
1409 At3g15090 0,66 1485 At3g03610 0,72 1561 At1g22270 0,77
1410 At4g28390 0,66 1486 At3g55450 0,72 1562 At4g21830 0,77
1411 At5g64300 0,66 1487 At1g30270 0,72 1563 At3g09840 0,77
1412 At2g34570 0,66 1488 At5g13610 0,73 1564 At4g27070 0,77
1413 At4g02130 0,66 1489 At3g28900 0,73 1565 At5g62530 0,77
1414 At1g72900 0,66 1490 At5g11790 0,73 1566 At3g26970 0,77
1415 At5g61220 0,66 1491 At4g34910 0,73 1567 At5g65660 0,77
1416 At5g59350 0,66 1492 At4g27490 0,73 1568 At1g24793 0,77
1417 At5g07340 0,66 1493 At3g18560 0,73 1569 At2g21160 0,78
1418 At3g57550 0,66 1494 At5g04800 0,73 1570 At2g24050 0,78
1419 At3g01160 0,66 1495 At5g51300 0,73 1571 At2g41090 0,78
1420 At5g38720 0,66 1496 At5g04930 0,73 1572 At2g39700 0,78
1421 At5g23310 0,66 1497 At5g66410 0,73 1573 At4g30270 0,78
1422 At3g11010 0,67 1498 At4g28540 0,73 1574 At1g57560 0,78
1423 At2g33700 0,67 1499 At1g48370 0,73 1575 At5g43980 0,78
1424 At5g11670 0,67 1500 At5g23690 0,73 1576 At3g02630 0,78
1425 At3g05200 0,67 1501 At2g04305 0,73 1577 At1g15430 0,78
1426 At3g01780 0,67 1502 At1g47550 0,73 1578 At1g73940 0,78
1427 At1g78280 0,67 1503 At5g64140 0,73 1579 At5g15870 0,78
1428 At5g56270 0,67 1504 At1g17620 0,73 1580 At3g10490 0,78
1429 At5g19820 0,67 1505 At2g27775 0,73 1581 At2g18220 0,78
1430 At5g42890 0,68 1506 At4g14220 0,74 1582 At1g72930 0,78
1431 At5g08415 0,68 1507 At3g19520 0,74 1583 At2g45860 0,78
1432 At3g07330 0,68 1508 At1g18390 0,74 1584 At4g38600 0,79
1433 At1g20270 0,68 1509 At3g13920 0,74 1585 At1g15140 0,79
1434 At4g14430 0,68 1510 At2g29990 0,74 1586 At5g23020 0,79
1435 At5g20540 0,68 1511 At3g18420 0,74 1587 At2g38860 0,79
1436 At5g46760 0,68 1512 At2g25110 0,74 1588 At1g26770 0,79
1437 At3g19950 0,68 1513 At5g12080 0,74 1589 At3g02190 0,79
1438 At4g08685 0,68 1514 At1g13250 0,74 1590 At3g48990 0,79
1439 At4g29490 0,68 1515 At1g08640 0,74 1591 At5g50200 0,79
1440 At5g43745 0,69 1516 At3g45620 0,74 1592 At4g15620 0,79
1441 At3g27080 0,69 1517 At1g70140 0,74 1593 At5g19750 0,79
1442 At3g15210 0,69 1518 At3g50210 0,74 1594 At2g35190 0,79
1443 At2g01710 0,69 1519 At3g55280 0,74 1595 At3g03270 0,80
1444 At2g20850 0,69 1520 At2g41410 0,74 1596 At3g57000 0,80
gene name log2 ratio gene name log2 ratio gene name log2 ratio1597 At2g30990 0,80 1673 At1g66260 0,85 1749 At1g07135 0,89
1598 At5g08380 0,80 1674 At1g48570 0,85 1750 At1g23490 0,89
1599 At1g54090 0,80 1675 At5g17520 0,85 1751 At1g16670 0,89
1600 At2g30050 0,80 1676 At3g27230 0,85 1752 At4g30340 0,89
1601 At5g03290 0,80 1677 At1g28680 0,85 1753 At3g27300 0,89
1602 At1g19850 0,80 1678 At5g57870 0,85 1754 At1g66430 0,89
1603 At5g02610 0,81 1679 At4g37990 0,85 1755 At5g17190 0,89
1604 At5g08630 0,81 1680 At3g27380 0,85 1756 At4g17520 0,89
1605 At1g24360 0,81 1681 At5g48970 0,85 1757 At5g45750 0,89
1606 At2g39220 0,81 1682 At5g26360 0,85 1758 At1g18540 0,89
1607 At1g09210 0,81 1683 At4g22530 0,85 1759 At3g24954 0,89
1608 At3g25860 0,81 1684 At2g17220 0,85 1760 At4g02400 0,89
1609 At4g36940 0,81 1685 At1g55690 0,85 1761 At1g10270 0,89
1610 At4g25640 0,81 1686 At4g25030 0,85 1762 At4g00790 0,89
1611 At1g67300 0,81 1687 At3g20050 0,85 1763 At5g13880 0,90
1612 At1g16780 0,81 1688 At2g25970 0,85 1764 At2g19730 0,90
1613 At3g51660 0,81 1689 At5g52540 0,85 1765 At1g70890 0,90
1614 At1g70190 0,81 1690 At5g35700 0,85 1766 At4g35490 0,90
1615 At1g73080 0,81 1691 At2g30360 0,85 1767 At2g05710 0,90
1616 At2g43320 0,81 1692 At4g36710 0,85 1768 At1g18850 0,90
1617 At3g27240 0,81 1693 At5g57050 0,86 1769 At4g18800 0,90
1618 At2g27260 0,81 1694 At3g46540 0,86 1770 At3g62810 0,90
1619 At4g29670 0,81 1695 At1g17510 0,86 1771 At5g57550 0,90
1620 At3g33530 0,81 1696 At3g22845 0,86 1772 At4g34230 0,90
1621 At1g47400 0,81 1697 At3g15350 0,86 1773 At3g28700 0,90
1622 At5g18790 0,81 1698 At4g24920 0,86 1774 At4g23490 0,90
1623 At2g46610 0,81 1699 At1g76160 0,86 1775 At3g58570 0,90
1624 At4g31480 0,82 1700 At1g55265 0,86 1776 At4g03550 0,90
1625 At2g28600 0,82 1701 At5g38890 0,86 1777 At3g59020 0,90
1626 At1g74560 0,82 1702 At2g37190 0,86 1778 At5g58710 0,90
1627 At3g04840 0,82 1703 At3g05560 0,86 1779 At3g15080 0,90
1628 At1g58080 0,82 1704 At1g76300 0,86 1780 At4g24820 0,90
1629 At3g03770 0,82 1705 At5g04660 0,86 1781 At4g39510 0,90
1630 At2g25210 0,82 1706 At5g14590 0,86 1782 At2g29690 0,91
1631 At1g22780 0,82 1707 At1g16740 0,87 1783 At4g39840 0,91
1632 At1g16060 0,82 1708 At1g34260 0,87 1784 At1g27400 0,91
1633 At3g60540 0,82 1709 At5g55400 0,87 1785 At2g04030 0,91
1634 At1g09970 0,82 1710 At2g11520 0,87 1786 At4g23010 0,91
1635 At5g39790 0,83 1711 At5g59690 0,87 1787 At1g05630 0,91
1636 At3g11670 0,83 1712 At5g50210 0,87 1788 At3g57560 0,91
1637 At2g21620 0,83 1713 At5g64960 0,87 1789 At2g39830 0,91
1638 At4g21990 0,83 1714 At5g09810 0,87 1790 At5g01270 0,91
1639 At4g30390 0,83 1715 At3g21110 0,87 1791 At4g38420 0,91
1640 At3g46620 0,83 1716 At5g65470 0,87 1792 At1g06180 0,91
1641 At3g05180 0,83 1717 At2g17840 0,87 1793 At4g26310 0,91
1642 At5g06460 0,83 1718 At1g75670 0,87 1794 At1g53760 0,91
1643 At1g71170 0,83 1719 At5g15750 0,87 1795 At5g58420 0,91
1644 At4g38580 0,83 1720 At3g22422 0,87 1796 At1g61250 0,91
1645 At3g49430 0,83 1721 At5g56710 0,87 1797 At1g55890 0,91
1646 At1g78380 0,83 1722 At1g77120 0,87 1798 At2g27730 0,91
1647 At2g11890 0,83 1723 At4g37090 0,87 1799 At3g27360 0,91
1648 At4g08180 0,83 1724 At5g20080 0,87 1800 At4g18900 0,91
1649 At1g55330 0,83 1725 At3g24080 0,87 1801 At5g40980 0,92
1650 At3g60420 0,83 1726 At4g24130 0,88 1802 At3g10500 0,92
1651 At4g30910 0,83 1727 At3g24770 0,88 1803 At2g44520 0,92
1652 At5g46280 0,83 1728 At5g08570 0,88 1804 At5g46160 0,92
1653 At1g33265 0,83 1729 At5g11520 0,88 1805 At2g37760 0,92
1654 At1g28670 0,83 1730 At2g41190 0,88 1806 At1g15710 0,92
1655 At3g56370 0,83 1731 At5g52650 0,88 1807 At5g65720 0,92
1656 At3g43810 0,83 1732 At5g54930 0,88 1808 At1g10410 0,92
1657 At2g16430 0,83 1733 At5g57990 0,88 1809 At5g37600 0,92
1658 At2g01970 0,84 1734 At5g18900 0,88 1810 At1g64610 0,92
1659 At4g20010 0,84 1735 At1g54630 0,88 1811 At3g09805 0,92
1660 At1g26690 0,84 1736 At5g61640 0,88 1812 At1g48850 0,92
1661 At3g26980 0,84 1737 At4g30220 0,89 1813 At2g25625 0,92
1662 At5g22440 0,84 1738 At5g08610 0,89 1814 At3g06930 0,92
1663 At1g18800 0,84 1739 At2g27020 0,89 1815 At4g12300 0,92
1664 At5g19320 0,84 1740 At3g53630 0,89 1816 At2g39390 0,92
1665 At1g54270 0,84 1741 At2g26730 0,89 1817 At1g67970 0,93
1666 At1g72970 0,84 1742 At2g46170 0,89 1818 At5g54650 0,93
1667 At5g06760 0,84 1743 At3g16080 0,89 1819 At1g80615 0,93
1668 At3g51860 0,84 1744 At4g24160 0,89 1820 At2g19385 0,93
1669 At1g56340 0,84 1745 At1g68470 0,89 1821 At5g09510 0,93
1670 At1g09830 0,84 1746 At3g52960 0,89 1822 At2g45030 0,93
1671 At1g29150 0,84 1747 At4g01220 0,89 1823 At1g66580 0,93
1672 At3g06540 0,84 1748 At2g20450 0,89 1824 At4g29210 0,93
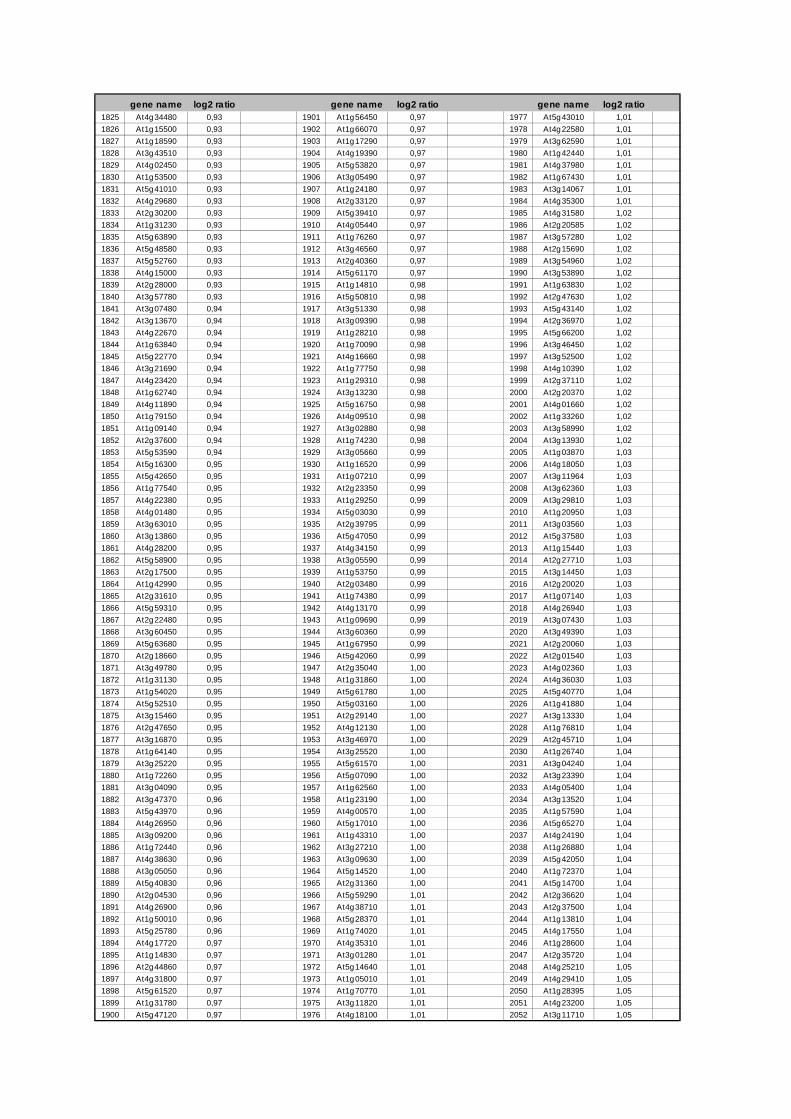
gene name log2 ratio gene name log2 ratio gene name log2 ratio1825 At4g34480 0,93 1901 At1g56450 0,97 1977 At5g43010 1,01
1826 At1g15500 0,93 1902 At1g66070 0,97 1978 At4g22580 1,01
1827 At1g18590 0,93 1903 At1g17290 0,97 1979 At3g62590 1,01
1828 At3g43510 0,93 1904 At4g19390 0,97 1980 At1g42440 1,01
1829 At4g02450 0,93 1905 At5g53820 0,97 1981 At4g37980 1,01
1830 At1g53500 0,93 1906 At3g05490 0,97 1982 At1g67430 1,01
1831 At5g41010 0,93 1907 At1g24180 0,97 1983 At3g14067 1,01
1832 At4g29680 0,93 1908 At2g33120 0,97 1984 At4g35300 1,01
1833 At2g30200 0,93 1909 At5g39410 0,97 1985 At4g31580 1,02
1834 At1g31230 0,93 1910 At4g05440 0,97 1986 At2g20585 1,02
1835 At5g63890 0,93 1911 At1g76260 0,97 1987 At3g57280 1,02
1836 At5g48580 0,93 1912 At3g46560 0,97 1988 At2g15690 1,02
1837 At5g52760 0,93 1913 At2g40360 0,97 1989 At3g54960 1,02
1838 At4g15000 0,93 1914 At5g61170 0,97 1990 At3g53890 1,02
1839 At2g28000 0,93 1915 At1g14810 0,98 1991 At1g63830 1,02
1840 At3g57780 0,93 1916 At5g50810 0,98 1992 At2g47630 1,02
1841 At3g07480 0,94 1917 At3g51330 0,98 1993 At5g43140 1,02
1842 At3g13670 0,94 1918 At3g09390 0,98 1994 At2g36970 1,02
1843 At4g22670 0,94 1919 At1g28210 0,98 1995 At5g66200 1,02
1844 At1g63840 0,94 1920 At1g70090 0,98 1996 At3g46450 1,02
1845 At5g22770 0,94 1921 At4g16660 0,98 1997 At3g52500 1,02
1846 At3g21690 0,94 1922 At1g77750 0,98 1998 At4g10390 1,02
1847 At4g23420 0,94 1923 At1g29310 0,98 1999 At2g37110 1,02
1848 At1g62740 0,94 1924 At3g13230 0,98 2000 At2g20370 1,02
1849 At4g11890 0,94 1925 At5g16750 0,98 2001 At4g01660 1,02
1850 At1g79150 0,94 1926 At4g09510 0,98 2002 At1g33260 1,02
1851 At1g09140 0,94 1927 At3g02880 0,98 2003 At3g58990 1,02
1852 At2g37600 0,94 1928 At1g74230 0,98 2004 At3g13930 1,02
1853 At5g53590 0,94 1929 At3g05660 0,99 2005 At1g03870 1,03
1854 At5g16300 0,95 1930 At1g16520 0,99 2006 At4g18050 1,03
1855 At5g42650 0,95 1931 At1g07210 0,99 2007 At3g11964 1,03
1856 At1g77540 0,95 1932 At2g23350 0,99 2008 At3g62360 1,03
1857 At4g22380 0,95 1933 At1g29250 0,99 2009 At3g29810 1,03
1858 At4g01480 0,95 1934 At5g03030 0,99 2010 At1g20950 1,03
1859 At3g63010 0,95 1935 At2g39795 0,99 2011 At3g03560 1,03
1860 At3g13860 0,95 1936 At5g47050 0,99 2012 At5g37580 1,03
1861 At4g28200 0,95 1937 At4g34150 0,99 2013 At1g15440 1,03
1862 At5g58900 0,95 1938 At3g05590 0,99 2014 At2g27710 1,03
1863 At2g17500 0,95 1939 At1g53750 0,99 2015 At3g14450 1,03
1864 At1g42990 0,95 1940 At2g03480 0,99 2016 At2g20020 1,03
1865 At2g31610 0,95 1941 At1g74380 0,99 2017 At1g07140 1,03
1866 At5g59310 0,95 1942 At4g13170 0,99 2018 At4g26940 1,03
1867 At2g22480 0,95 1943 At1g09690 0,99 2019 At3g07430 1,03
1868 At3g60450 0,95 1944 At3g60360 0,99 2020 At3g49390 1,03
1869 At5g63680 0,95 1945 At1g67950 0,99 2021 At2g20060 1,03
1870 At2g18660 0,95 1946 At5g42060 0,99 2022 At2g01540 1,03
1871 At3g49780 0,95 1947 At2g35040 1,00 2023 At4g02360 1,03
1872 At1g31130 0,95 1948 At1g31860 1,00 2024 At4g36030 1,03
1873 At1g54020 0,95 1949 At5g61780 1,00 2025 At5g40770 1,04
1874 At5g52510 0,95 1950 At5g03160 1,00 2026 At1g41880 1,04
1875 At3g15460 0,95 1951 At2g29140 1,00 2027 At3g13330 1,04
1876 At2g47650 0,95 1952 At4g12130 1,00 2028 At1g76810 1,04
1877 At3g16870 0,95 1953 At3g46970 1,00 2029 At2g45710 1,04
1878 At1g64140 0,95 1954 At3g25520 1,00 2030 At1g26740 1,04
1879 At3g25220 0,95 1955 At5g61570 1,00 2031 At3g04240 1,04
1880 At1g72260 0,95 1956 At5g07090 1,00 2032 At3g23390 1,04
1881 At3g04090 0,95 1957 At1g62560 1,00 2033 At4g05400 1,04
1882 At3g47370 0,96 1958 At1g23190 1,00 2034 At3g13520 1,04
1883 At5g43970 0,96 1959 At4g00570 1,00 2035 At1g57590 1,04
1884 At4g26950 0,96 1960 At5g17010 1,00 2036 At5g65270 1,04
1885 At3g09200 0,96 1961 At1g43310 1,00 2037 At4g24190 1,04
1886 At1g72440 0,96 1962 At3g27210 1,00 2038 At1g26880 1,04
1887 At4g38630 0,96 1963 At3g09630 1,00 2039 At5g42050 1,04
1888 At3g05050 0,96 1964 At5g14520 1,00 2040 At1g72370 1,04
1889 At5g40830 0,96 1965 At2g31360 1,00 2041 At5g14700 1,04
1890 At2g04530 0,96 1966 At5g59290 1,01 2042 At2g36620 1,04
1891 At4g26900 0,96 1967 At4g38710 1,01 2043 At2g37500 1,04
1892 At1g50010 0,96 1968 At5g28370 1,01 2044 At1g13810 1,04
1893 At5g25780 0,96 1969 At1g74020 1,01 2045 At4g17550 1,04
1894 At4g17720 0,97 1970 At4g35310 1,01 2046 At1g28600 1,04
1895 At1g14830 0,97 1971 At3g01280 1,01 2047 At2g35720 1,04
1896 At2g44860 0,97 1972 At5g14640 1,01 2048 At4g25210 1,05
1897 At4g31800 0,97 1973 At1g05010 1,01 2049 At4g29410 1,05
1898 At5g61520 0,97 1974 At1g70770 1,01 2050 At1g28395 1,05
1899 At1g31780 0,97 1975 At3g11820 1,01 2051 At4g23200 1,05
1900 At5g47120 0,97 1976 At4g18100 1,01 2052 At3g11710 1,05
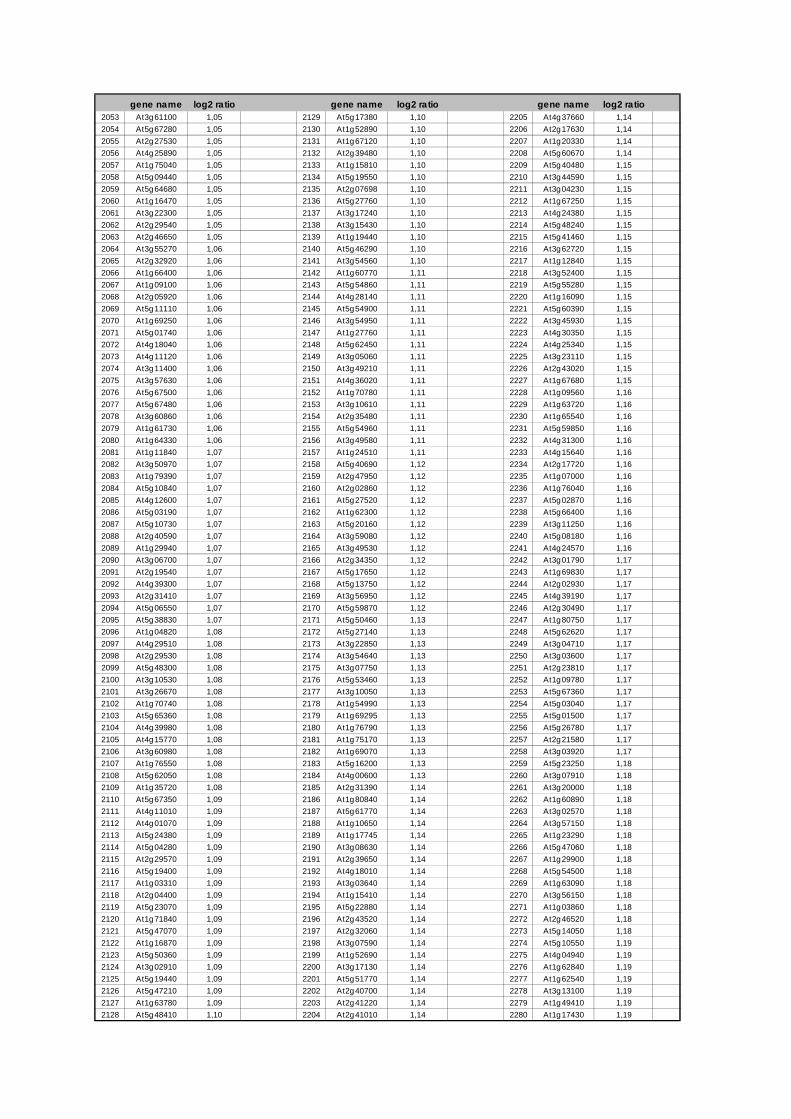
gene name log2 ratio gene name log2 ratio gene name log2 ratio2053 At3g61100 1,05 2129 At5g17380 1,10 2205 At4g37660 1,14
2054 At5g67280 1,05 2130 At1g52890 1,10 2206 At2g17630 1,14
2055 At2g27530 1,05 2131 At1g67120 1,10 2207 At1g20330 1,14
2056 At4g25890 1,05 2132 At2g39480 1,10 2208 At5g60670 1,14
2057 At1g75040 1,05 2133 At1g15810 1,10 2209 At5g40480 1,15
2058 At5g09440 1,05 2134 At5g19550 1,10 2210 At3g44590 1,15
2059 At5g64680 1,05 2135 At2g07698 1,10 2211 At3g04230 1,15
2060 At1g16470 1,05 2136 At5g27760 1,10 2212 At1g67250 1,15
2061 At3g22300 1,05 2137 At3g17240 1,10 2213 At4g24380 1,15
2062 At2g29540 1,05 2138 At3g15430 1,10 2214 At5g48240 1,15
2063 At2g46650 1,05 2139 At1g19440 1,10 2215 At5g41460 1,15
2064 At3g55270 1,06 2140 At5g46290 1,10 2216 At3g62720 1,15
2065 At2g32920 1,06 2141 At3g54560 1,10 2217 At1g12840 1,15
2066 At1g66400 1,06 2142 At1g60770 1,11 2218 At3g52400 1,15
2067 At1g09100 1,06 2143 At5g54860 1,11 2219 At5g55280 1,15
2068 At2g05920 1,06 2144 At4g28140 1,11 2220 At1g16090 1,15
2069 At5g11110 1,06 2145 At5g54900 1,11 2221 At5g60390 1,15
2070 At1g69250 1,06 2146 At3g54950 1,11 2222 At3g45930 1,15
2071 At5g01740 1,06 2147 At1g27760 1,11 2223 At4g30350 1,15
2072 At4g18040 1,06 2148 At5g62450 1,11 2224 At4g25340 1,15
2073 At4g11120 1,06 2149 At3g05060 1,11 2225 At3g23110 1,15
2074 At3g11400 1,06 2150 At3g49210 1,11 2226 At2g43020 1,15
2075 At3g57630 1,06 2151 At4g36020 1,11 2227 At1g67680 1,15
2076 At5g67500 1,06 2152 At1g70780 1,11 2228 At1g09560 1,16
2077 At5g67480 1,06 2153 At3g10610 1,11 2229 At1g63720 1,16
2078 At3g60860 1,06 2154 At2g35480 1,11 2230 At1g65540 1,16
2079 At1g61730 1,06 2155 At5g54960 1,11 2231 At5g59850 1,16
2080 At1g64330 1,06 2156 At3g49580 1,11 2232 At4g31300 1,16
2081 At1g11840 1,07 2157 At1g24510 1,11 2233 At4g15640 1,16
2082 At3g50970 1,07 2158 At5g40690 1,12 2234 At2g17720 1,16
2083 At1g79390 1,07 2159 At2g47950 1,12 2235 At1g07000 1,16
2084 At5g10840 1,07 2160 At2g02860 1,12 2236 At1g76040 1,16
2085 At4g12600 1,07 2161 At5g27520 1,12 2237 At5g02870 1,16
2086 At5g03190 1,07 2162 At1g62300 1,12 2238 At5g66400 1,16
2087 At5g10730 1,07 2163 At5g20160 1,12 2239 At3g11250 1,16
2088 At2g40590 1,07 2164 At3g59080 1,12 2240 At5g08180 1,16
2089 At1g29940 1,07 2165 At3g49530 1,12 2241 At4g24570 1,16
2090 At3g06700 1,07 2166 At2g34350 1,12 2242 At3g01790 1,17
2091 At2g19540 1,07 2167 At5g17650 1,12 2243 At1g69830 1,17
2092 At4g39300 1,07 2168 At5g13750 1,12 2244 At2g02930 1,17
2093 At2g31410 1,07 2169 At3g56950 1,12 2245 At4g39190 1,17
2094 At5g06550 1,07 2170 At5g59870 1,12 2246 At2g30490 1,17
2095 At5g38830 1,07 2171 At5g50460 1,13 2247 At1g80750 1,17
2096 At1g04820 1,08 2172 At5g27140 1,13 2248 At5g62620 1,17
2097 At4g29510 1,08 2173 At3g22850 1,13 2249 At3g04710 1,17
2098 At2g29530 1,08 2174 At3g54640 1,13 2250 At3g03600 1,17
2099 At5g48300 1,08 2175 At3g07750 1,13 2251 At2g23810 1,17
2100 At3g10530 1,08 2176 At5g53460 1,13 2252 At1g09780 1,17
2101 At3g26670 1,08 2177 At3g10050 1,13 2253 At5g67360 1,17
2102 At1g70740 1,08 2178 At1g54990 1,13 2254 At5g03040 1,17
2103 At5g65360 1,08 2179 At1g69295 1,13 2255 At5g01500 1,17
2104 At4g39980 1,08 2180 At1g76790 1,13 2256 At5g26780 1,17
2105 At4g15770 1,08 2181 At1g75170 1,13 2257 At2g21580 1,17
2106 At3g60980 1,08 2182 At1g69070 1,13 2258 At3g03920 1,17
2107 At1g76550 1,08 2183 At5g16200 1,13 2259 At5g23250 1,18
2108 At5g62050 1,08 2184 At4g00600 1,13 2260 At3g07910 1,18
2109 At1g35720 1,08 2185 At2g31390 1,14 2261 At3g20000 1,18
2110 At5g67350 1,09 2186 At1g80840 1,14 2262 At1g60890 1,18
2111 At4g11010 1,09 2187 At5g61770 1,14 2263 At3g02570 1,18
2112 At4g01070 1,09 2188 At1g10650 1,14 2264 At3g57150 1,18
2113 At5g24380 1,09 2189 At1g17745 1,14 2265 At1g23290 1,18
2114 At5g04280 1,09 2190 At3g08630 1,14 2266 At5g47060 1,18
2115 At2g29570 1,09 2191 At2g39650 1,14 2267 At1g29900 1,18
2116 At5g19400 1,09 2192 At4g18010 1,14 2268 At5g54500 1,18
2117 At1g03310 1,09 2193 At3g03640 1,14 2269 At1g63090 1,18
2118 At2g04400 1,09 2194 At1g15410 1,14 2270 At3g56150 1,18
2119 At5g23070 1,09 2195 At5g22880 1,14 2271 At1g03860 1,18
2120 At1g71840 1,09 2196 At2g43520 1,14 2272 At2g46520 1,18
2121 At5g47070 1,09 2197 At2g32060 1,14 2273 At5g14050 1,18
2122 At1g16870 1,09 2198 At3g07590 1,14 2274 At5g10550 1,19
2123 At5g50360 1,09 2199 At1g52690 1,14 2275 At4g04940 1,19
2124 At3g02910 1,09 2200 At3g17130 1,14 2276 At1g62840 1,19
2125 At5g19440 1,09 2201 At5g51770 1,14 2277 At1g62540 1,19
2126 At5g47210 1,09 2202 At2g40700 1,14 2278 At3g13100 1,19
2127 At1g63780 1,09 2203 At2g41220 1,14 2279 At1g49410 1,19
2128 At5g48410 1,10 2204 At2g41010 1,14 2280 At1g17430 1,19
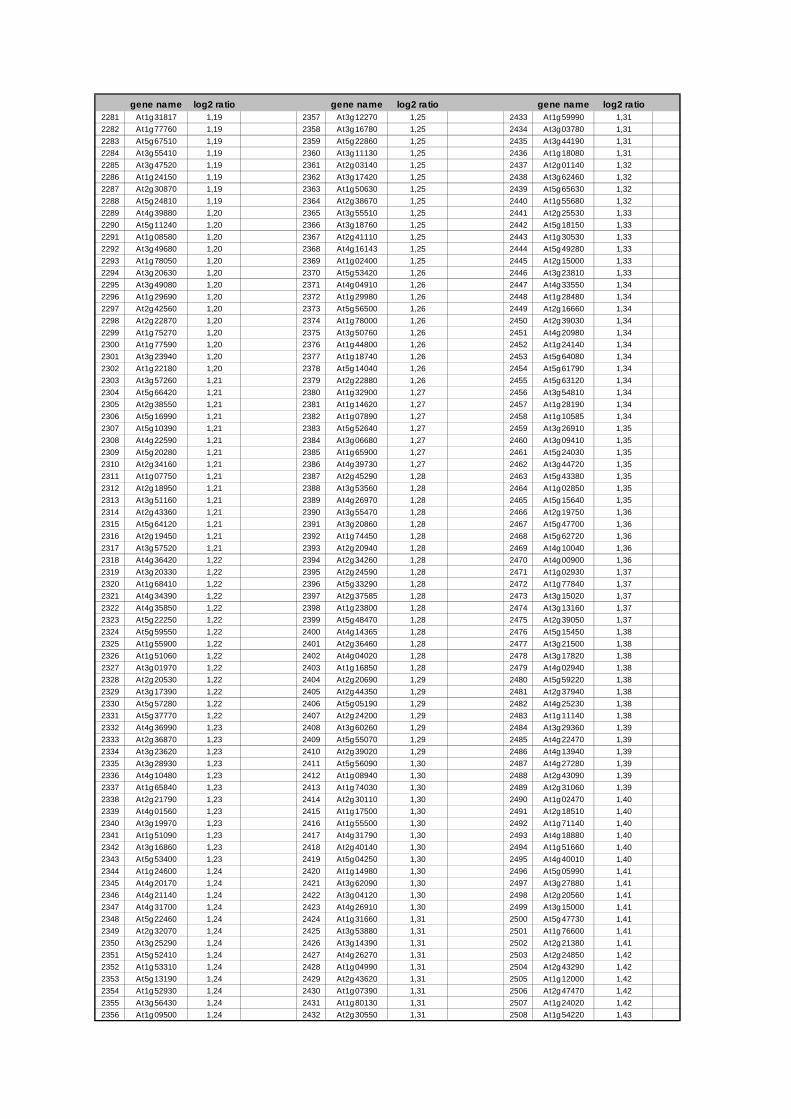
gene name log2 ratio gene name log2 ratio gene name log2 ratio2281 At1g31817 1,19 2357 At3g12270 1,25 2433 At1g59990 1,31
2282 At1g77760 1,19 2358 At3g16780 1,25 2434 At3g03780 1,31
2283 At5g67510 1,19 2359 At5g22860 1,25 2435 At3g44190 1,31
2284 At3g55410 1,19 2360 At3g11130 1,25 2436 At1g18080 1,31
2285 At3g47520 1,19 2361 At2g03140 1,25 2437 At2g01140 1,32
2286 At1g24150 1,19 2362 At3g17420 1,25 2438 At3g62460 1,32
2287 At2g30870 1,19 2363 At1g50630 1,25 2439 At5g65630 1,32
2288 At5g24810 1,19 2364 At2g38670 1,25 2440 At1g55680 1,32
2289 At4g39880 1,20 2365 At3g55510 1,25 2441 At2g25530 1,33
2290 At5g11240 1,20 2366 At3g18760 1,25 2442 At5g18150 1,33
2291 At1g08580 1,20 2367 At2g41110 1,25 2443 At1g30530 1,33
2292 At3g49680 1,20 2368 At4g16143 1,25 2444 At5g49280 1,33
2293 At1g78050 1,20 2369 At1g02400 1,25 2445 At2g15000 1,33
2294 At3g20630 1,20 2370 At5g53420 1,26 2446 At3g23810 1,33
2295 At3g49080 1,20 2371 At4g04910 1,26 2447 At4g33550 1,34
2296 At1g29690 1,20 2372 At1g29980 1,26 2448 At1g28480 1,34
2297 At2g42560 1,20 2373 At5g56500 1,26 2449 At2g16660 1,34
2298 At2g22870 1,20 2374 At1g78000 1,26 2450 At2g39030 1,34
2299 At1g75270 1,20 2375 At3g50760 1,26 2451 At4g20980 1,34
2300 At1g77590 1,20 2376 At1g44800 1,26 2452 At1g24140 1,34
2301 At3g23940 1,20 2377 At1g18740 1,26 2453 At5g64080 1,34
2302 At1g22180 1,20 2378 At5g14040 1,26 2454 At5g61790 1,34
2303 At3g57260 1,21 2379 At2g22880 1,26 2455 At5g63120 1,34
2304 At5g66420 1,21 2380 At1g32900 1,27 2456 At3g54810 1,34
2305 At2g38550 1,21 2381 At1g14620 1,27 2457 At1g28190 1,34
2306 At5g16990 1,21 2382 At1g07890 1,27 2458 At1g10585 1,34
2307 At5g10390 1,21 2383 At5g52640 1,27 2459 At3g26910 1,35
2308 At4g22590 1,21 2384 At3g06680 1,27 2460 At3g09410 1,35
2309 At5g20280 1,21 2385 At1g65900 1,27 2461 At5g24030 1,35
2310 At2g34160 1,21 2386 At4g39730 1,27 2462 At3g44720 1,35
2311 At1g07750 1,21 2387 At2g45290 1,28 2463 At5g43380 1,35
2312 At2g18950 1,21 2388 At3g53560 1,28 2464 At1g02850 1,35
2313 At3g51160 1,21 2389 At4g26970 1,28 2465 At5g15640 1,35
2314 At2g43360 1,21 2390 At3g55470 1,28 2466 At2g19750 1,36
2315 At5g64120 1,21 2391 At3g20860 1,28 2467 At5g47700 1,36
2316 At2g19450 1,21 2392 At1g74450 1,28 2468 At5g62720 1,36
2317 At3g57520 1,21 2393 At2g20940 1,28 2469 At4g10040 1,36
2318 At4g36420 1,22 2394 At2g34260 1,28 2470 At4g00900 1,36
2319 At3g20330 1,22 2395 At2g24590 1,28 2471 At1g02930 1,37
2320 At1g68410 1,22 2396 At5g33290 1,28 2472 At1g77840 1,37
2321 At4g34390 1,22 2397 At2g37585 1,28 2473 At3g15020 1,37
2322 At4g35850 1,22 2398 At1g23800 1,28 2474 At3g13160 1,37
2323 At5g22250 1,22 2399 At5g48470 1,28 2475 At2g39050 1,37
2324 At5g59550 1,22 2400 At4g14365 1,28 2476 At5g15450 1,38
2325 At1g55900 1,22 2401 At2g36460 1,28 2477 At3g21500 1,38
2326 At1g51060 1,22 2402 At4g04020 1,28 2478 At3g17820 1,38
2327 At3g01970 1,22 2403 At1g16850 1,28 2479 At4g02940 1,38
2328 At2g20530 1,22 2404 At2g20690 1,29 2480 At5g59220 1,38
2329 At3g17390 1,22 2405 At2g44350 1,29 2481 At2g37940 1,38
2330 At5g57280 1,22 2406 At5g05190 1,29 2482 At4g25230 1,38
2331 At5g37770 1,22 2407 At2g24200 1,29 2483 At1g11140 1,38
2332 At4g36990 1,23 2408 At3g60260 1,29 2484 At3g29360 1,39
2333 At2g36870 1,23 2409 At5g55070 1,29 2485 At4g22470 1,39
2334 At3g23620 1,23 2410 At2g39020 1,29 2486 At4g13940 1,39
2335 At3g28930 1,23 2411 At5g56090 1,30 2487 At4g27280 1,39
2336 At4g10480 1,23 2412 At1g08940 1,30 2488 At2g43090 1,39
2337 At1g65840 1,23 2413 At1g74030 1,30 2489 At2g31060 1,39
2338 At2g21790 1,23 2414 At2g30110 1,30 2490 At1g02470 1,40
2339 At4g01560 1,23 2415 At1g17500 1,30 2491 At2g18510 1,40
2340 At3g19970 1,23 2416 At1g55500 1,30 2492 At1g71140 1,40
2341 At1g51090 1,23 2417 At4g31790 1,30 2493 At4g18880 1,40
2342 At3g16860 1,23 2418 At2g40140 1,30 2494 At1g51660 1,40
2343 At5g53400 1,23 2419 At5g04250 1,30 2495 At4g40010 1,40
2344 At1g24600 1,24 2420 At1g14980 1,30 2496 At5g05990 1,41
2345 At4g20170 1,24 2421 At3g62090 1,30 2497 At3g27880 1,41
2346 At4g21140 1,24 2422 At3g04120 1,30 2498 At2g20560 1,41
2347 At4g31700 1,24 2423 At4g26910 1,30 2499 At3g15000 1,41
2348 At5g22460 1,24 2424 At1g31660 1,31 2500 At5g47730 1,41
2349 At2g32070 1,24 2425 At3g53880 1,31 2501 At1g76600 1,41
2350 At3g25290 1,24 2426 At3g14390 1,31 2502 At2g21380 1,41
2351 At5g52410 1,24 2427 At4g26270 1,31 2503 At2g24850 1,42
2352 At1g53310 1,24 2428 At1g04990 1,31 2504 At2g43290 1,42
2353 At5g13190 1,24 2429 At2g43620 1,31 2505 At1g12000 1,42
2354 At1g52930 1,24 2430 At1g07390 1,31 2506 At2g47470 1,42
2355 At3g56430 1,24 2431 At1g80130 1,31 2507 At1g24020 1,42
2356 At1g09500 1,24 2432 At2g30550 1,31 2508 At1g54220 1,43
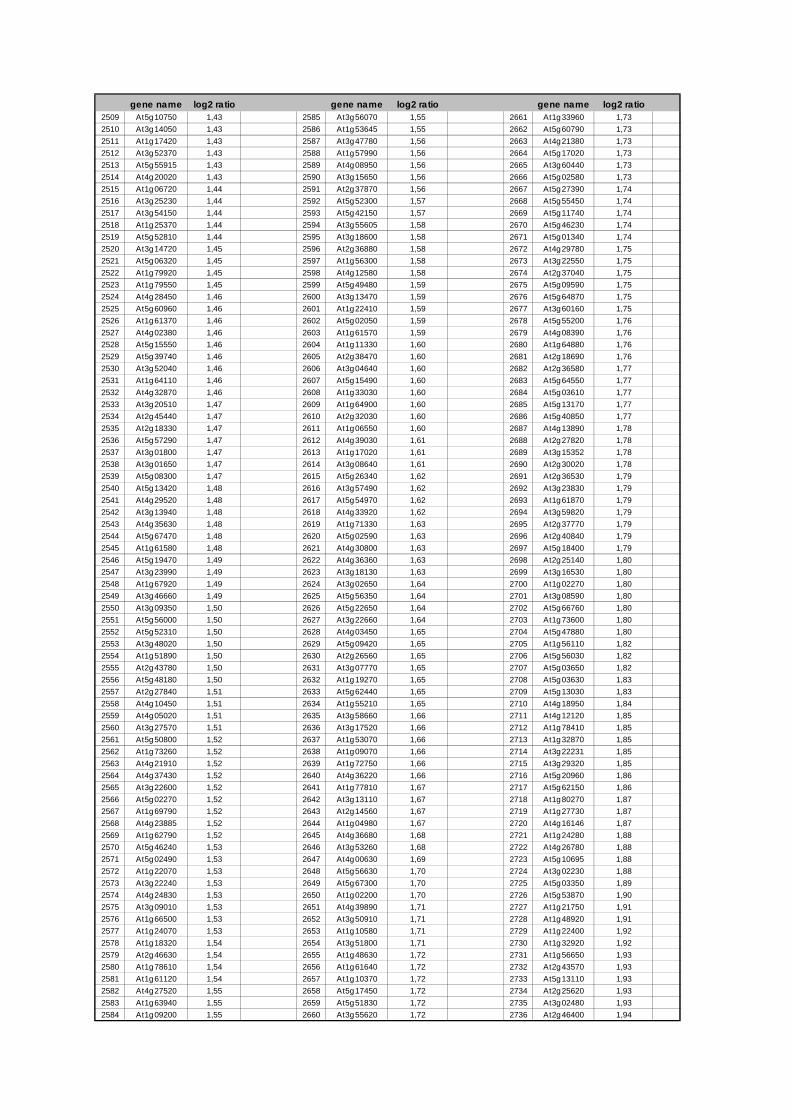
gene name log2 ratio gene name log2 ratio gene name log2 ratio2509 At5g10750 1,43 2585 At3g56070 1,55 2661 At1g33960 1,73
2510 At3g14050 1,43 2586 At1g53645 1,55 2662 At5g60790 1,73
2511 At1g17420 1,43 2587 At3g47780 1,56 2663 At4g21380 1,73
2512 At3g52370 1,43 2588 At1g57990 1,56 2664 At5g17020 1,73
2513 At5g55915 1,43 2589 At4g08950 1,56 2665 At3g60440 1,73
2514 At4g20020 1,43 2590 At3g15650 1,56 2666 At5g02580 1,73
2515 At1g06720 1,44 2591 At2g37870 1,56 2667 At5g27390 1,74
2516 At3g25230 1,44 2592 At5g52300 1,57 2668 At5g55450 1,74
2517 At3g54150 1,44 2593 At5g42150 1,57 2669 At5g11740 1,74
2518 At1g25370 1,44 2594 At3g55605 1,58 2670 At5g46230 1,74
2519 At5g52810 1,44 2595 At3g18600 1,58 2671 At5g01340 1,74
2520 At3g14720 1,45 2596 At2g36880 1,58 2672 At4g29780 1,75
2521 At5g06320 1,45 2597 At1g56300 1,58 2673 At3g22550 1,75
2522 At1g79920 1,45 2598 At4g12580 1,58 2674 At2g37040 1,75
2523 At1g79550 1,45 2599 At5g49480 1,59 2675 At5g09590 1,75
2524 At4g28450 1,46 2600 At3g13470 1,59 2676 At5g64870 1,75
2525 At5g60960 1,46 2601 At1g22410 1,59 2677 At3g60160 1,75
2526 At1g61370 1,46 2602 At5g02050 1,59 2678 At5g55200 1,76
2527 At4g02380 1,46 2603 At1g61570 1,59 2679 At4g08390 1,76
2528 At5g15550 1,46 2604 At1g11330 1,60 2680 At1g64880 1,76
2529 At5g39740 1,46 2605 At2g38470 1,60 2681 At2g18690 1,76
2530 At3g52040 1,46 2606 At3g04640 1,60 2682 At2g36580 1,77
2531 At1g64110 1,46 2607 At5g15490 1,60 2683 At5g64550 1,77
2532 At4g32870 1,46 2608 At1g33030 1,60 2684 At5g03610 1,77
2533 At3g20510 1,47 2609 At1g64900 1,60 2685 At5g13170 1,77
2534 At2g45440 1,47 2610 At2g32030 1,60 2686 At5g40850 1,77
2535 At2g18330 1,47 2611 At1g06550 1,60 2687 At4g13890 1,78
2536 At5g57290 1,47 2612 At4g39030 1,61 2688 At2g27820 1,78
2537 At3g01800 1,47 2613 At1g17020 1,61 2689 At3g15352 1,78
2538 At3g01650 1,47 2614 At3g08640 1,61 2690 At2g30020 1,78
2539 At5g08300 1,47 2615 At5g26340 1,62 2691 At2g36530 1,79
2540 At5g13420 1,48 2616 At3g57490 1,62 2692 At3g23830 1,79
2541 At4g29520 1,48 2617 At5g54970 1,62 2693 At1g61870 1,79
2542 At3g13940 1,48 2618 At4g33920 1,62 2694 At3g59820 1,79
2543 At4g35630 1,48 2619 At1g71330 1,63 2695 At2g37770 1,79
2544 At5g67470 1,48 2620 At5g02590 1,63 2696 At2g40840 1,79
2545 At1g61580 1,48 2621 At4g30800 1,63 2697 At5g18400 1,79
2546 At5g19470 1,49 2622 At4g36360 1,63 2698 At2g25140 1,80
2547 At3g23990 1,49 2623 At3g18130 1,63 2699 At3g16530 1,80
2548 At1g67920 1,49 2624 At3g02650 1,64 2700 At1g02270 1,80
2549 At3g46660 1,49 2625 At5g56350 1,64 2701 At3g08590 1,80
2550 At3g09350 1,50 2626 At5g22650 1,64 2702 At5g66760 1,80
2551 At5g56000 1,50 2627 At3g22660 1,64 2703 At1g73600 1,80
2552 At5g52310 1,50 2628 At4g03450 1,65 2704 At5g47880 1,80
2553 At3g48020 1,50 2629 At5g09420 1,65 2705 At1g56110 1,82
2554 At1g51890 1,50 2630 At2g26560 1,65 2706 At5g56030 1,82
2555 At2g43780 1,50 2631 At3g07770 1,65 2707 At5g03650 1,82
2556 At5g48180 1,50 2632 At1g19270 1,65 2708 At5g03630 1,83
2557 At2g27840 1,51 2633 At5g62440 1,65 2709 At5g13030 1,83
2558 At4g10450 1,51 2634 At1g55210 1,65 2710 At4g18950 1,84
2559 At4g05020 1,51 2635 At3g58660 1,66 2711 At4g12120 1,85
2560 At3g27570 1,51 2636 At3g17520 1,66 2712 At1g78410 1,85
2561 At5g50800 1,52 2637 At1g53070 1,66 2713 At1g32870 1,85
2562 At1g73260 1,52 2638 At1g09070 1,66 2714 At3g22231 1,85
2563 At4g21910 1,52 2639 At1g72750 1,66 2715 At3g29320 1,85
2564 At4g37430 1,52 2640 At4g36220 1,66 2716 At5g20960 1,86
2565 At3g22600 1,52 2641 At1g77810 1,67 2717 At5g62150 1,86
2566 At5g02270 1,52 2642 At3g13110 1,67 2718 At1g80270 1,87
2567 At1g69790 1,52 2643 At2g14560 1,67 2719 At1g27730 1,87
2568 At4g23885 1,52 2644 At1g04980 1,67 2720 At4g16146 1,87
2569 At1g62790 1,52 2645 At4g36680 1,68 2721 At1g24280 1,88
2570 At5g46240 1,53 2646 At3g53260 1,68 2722 At4g26780 1,88
2571 At5g02490 1,53 2647 At4g00630 1,69 2723 At5g10695 1,88
2572 At1g22070 1,53 2648 At5g56630 1,70 2724 At3g02230 1,88
2573 At3g22240 1,53 2649 At5g67300 1,70 2725 At5g03350 1,89
2574 At4g24830 1,53 2650 At1g02200 1,70 2726 At5g53870 1,90
2575 At3g09010 1,53 2651 At4g39890 1,71 2727 At1g21750 1,91
2576 At1g66500 1,53 2652 At3g50910 1,71 2728 At1g48920 1,91
2577 At1g24070 1,53 2653 At1g10580 1,71 2729 At1g22400 1,92
2578 At1g18320 1,54 2654 At3g51800 1,71 2730 At1g32920 1,92
2579 At2g46630 1,54 2655 At1g48630 1,72 2731 At1g56650 1,93
2580 At1g78610 1,54 2656 At1g61640 1,72 2732 At2g43570 1,93
2581 At1g61120 1,54 2657 At1g10370 1,72 2733 At5g13110 1,93
2582 At4g27520 1,55 2658 At5g17450 1,72 2734 At2g25620 1,93
2583 At1g63940 1,55 2659 At5g51830 1,72 2735 At3g02480 1,93
2584 At1g09200 1,55 2660 At3g55620 1,72 2736 At2g46400 1,94
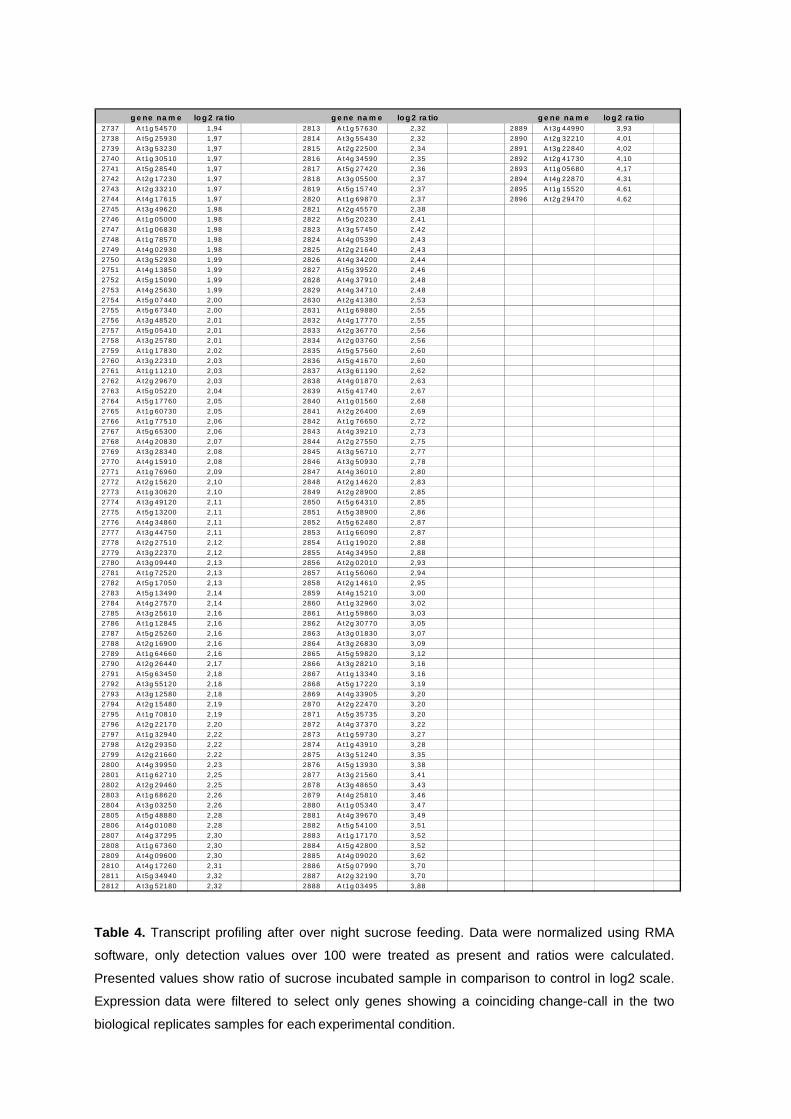
Table 4. Transcript profiling after over night sucrose feeding. Data were normalized using RMA
software, only detection values over 100 were treated as present and ratios were calculated.
Presented values show ratio of sucrose incubated sample in comparison to control in log2 scale.
Expression data were filtered to select only genes showing a coinciding change-call in the two
biological replicates samples for each experimental condition.
g e ne na m e lo g 2 ra tio g e ne na m e lo g 2 ra tio g e ne na m e lo g 2 ra tio2737 A t1g 54570 1,94 2813 A t1g 57630 2,32 2889 A t3g 44990 3,93
2738 A t5g 25930 1,97 2814 A t3g 55430 2,32 2890 A t2g 32210 4,01
2739 A t3g 53230 1,97 2815 A t2g 22500 2,34 2891 A t3g 22840 4,02
2740 A t1g 30510 1,97 2816 A t4g 34590 2,35 2892 A t2g 41730 4,10
2741 A t5g 28540 1,97 2817 A t5g 27420 2,36 2893 A t1g 05680 4,17
2742 A t2g 17230 1,97 2818 A t3g 05500 2,37 2894 A t4g 22870 4,31
2743 A t2g 33210 1,97 2819 A t5g 15740 2,37 2895 A t1g 15520 4,61
2744 A t4g 17615 1,97 2820 A t1g 69870 2,37 2896 A t2g 29470 4,62
2745 A t3g 49620 1,98 2821 A t2g 45570 2,38
2746 A t1g 05000 1,98 2822 A t5g 20230 2,41
2747 A t1g 06830 1,98 2823 A t3g 57450 2,42
2748 A t1g 78570 1,98 2824 A t4g 05390 2,43
2749 A t4g 02930 1,98 2825 A t2g 21640 2,43
2750 A t3g 52930 1,99 2826 A t4g 34200 2,44
2751 A t4g 13850 1,99 2827 A t5g 39520 2,46
2752 A t5g 15090 1,99 2828 A t4g 37910 2,48
2753 A t4g 25630 1,99 2829 A t4g 34710 2,48
2754 A t5g 07440 2,00 2830 A t2g 41380 2,53
2755 A t5g 67340 2,00 2831 A t1g 69880 2,55
2756 A t3g 48520 2,01 2832 A t4g 17770 2,55
2757 A t5g 05410 2,01 2833 A t2g 36770 2,56
2758 A t3g 25780 2,01 2834 A t2g 03760 2,56
2759 A t1g 17830 2,02 2835 A t5g 57560 2,60
2760 A t3g 22310 2,03 2836 A t5g 41670 2,60
2761 A t1g 11210 2,03 2837 A t3g 61190 2,62
2762 A t2g 29670 2,03 2838 A t4g 01870 2,63
2763 A t5g 05220 2,04 2839 A t5g 41740 2,67
2764 A t5g 17760 2,05 2840 A t1g 01560 2,68
2765 A t1g 60730 2,05 2841 A t2g 26400 2,69
2766 A t1g 77510 2,06 2842 A t1g 76650 2,72
2767 A t5g 65300 2,06 2843 A t4g 39210 2,73
2768 A t4g 20830 2,07 2844 A t2g 27550 2,75
2769 A t3g 28340 2,08 2845 A t3g 56710 2,77
2770 A t4g 15910 2,08 2846 A t3g 50930 2,78
2771 A t1g 76960 2,09 2847 A t4g 36010 2,80
2772 A t2g 15620 2,10 2848 A t2g 14620 2,83
2773 A t1g 30620 2,10 2849 A t2g 28900 2,85
2774 A t3g 49120 2,11 2850 A t5g 64310 2,85
2775 A t5g 13200 2,11 2851 A t5g 38900 2,86
2776 A t4g 34860 2,11 2852 A t5g 62480 2,87
2777 A t3g 44750 2,11 2853 A t1g 66090 2,87
2778 A t2g 27510 2,12 2854 A t1g 19020 2,88
2779 A t3g 22370 2,12 2855 A t4g 34950 2,88
2780 A t3g 09440 2,13 2856 A t2g 02010 2,93
2781 A t1g 72520 2,13 2857 A t1g 56060 2,94
2782 A t5g 17050 2,13 2858 A t2g 14610 2,95
2783 A t5g 13490 2,14 2859 A t4g 15210 3,00
2784 A t4g 27570 2,14 2860 A t1g 32960 3,02
2785 A t3g 25610 2,16 2861 A t1g 59860 3,03
2786 A t1g 12845 2,16 2862 A t2g 30770 3,05
2787 A t5g 25260 2,16 2863 A t3g 01830 3,07
2788 A t2g 16900 2,16 2864 A t3g 26830 3,09
2789 A t1g 64660 2,16 2865 A t5g 59820 3,12
2790 A t2g 26440 2,17 2866 A t3g 28210 3,16
2791 A t5g 63450 2,18 2867 A t1g 13340 3,16
2792 A t3g 55120 2,18 2868 A t5g 17220 3,19
2793 A t3g 12580 2,18 2869 A t4g 33905 3,20
2794 A t2g 15480 2,19 2870 A t2g 22470 3,20
2795 A t1g 70810 2,19 2871 A t5g 35735 3,20
2796 A t2g 22170 2,20 2872 A t4g 37370 3,22
2797 A t1g 32940 2,22 2873 A t1g 59730 3,27
2798 A t2g 29350 2,22 2874 A t1g 43910 3,28
2799 A t2g 21660 2,22 2875 A t3g 51240 3,35
2800 A t4g 39950 2,23 2876 A t5g 13930 3,38
2801 A t1g 62710 2,25 2877 A t3g 21560 3,41
2802 A t2g 29460 2,25 2878 A t3g 48650 3,43
2803 A t1g 68620 2,26 2879 A t4g 25810 3,46
2804 A t3g 03250 2,26 2880 A t1g 05340 3,47
2805 A t5g 48880 2,28 2881 A t4g 39670 3,49
2806 A t4g 01080 2,28 2882 A t5g 54100 3,51
2807 A t4g 37295 2,30 2883 A t1g 17170 3,52
2808 A t1g 67360 2,30 2884 A t5g 42800 3,52
2809 A t4g 09600 2,30 2885 A t4g 09020 3,62
2810 A t4g 17260 2,31 2886 A t5g 07990 3,70
2811 A t5g 34940 2,32 2887 A t2g 32190 3,70
2812 A t3g 52180 2,32 2888 A t1g 03495 3,88
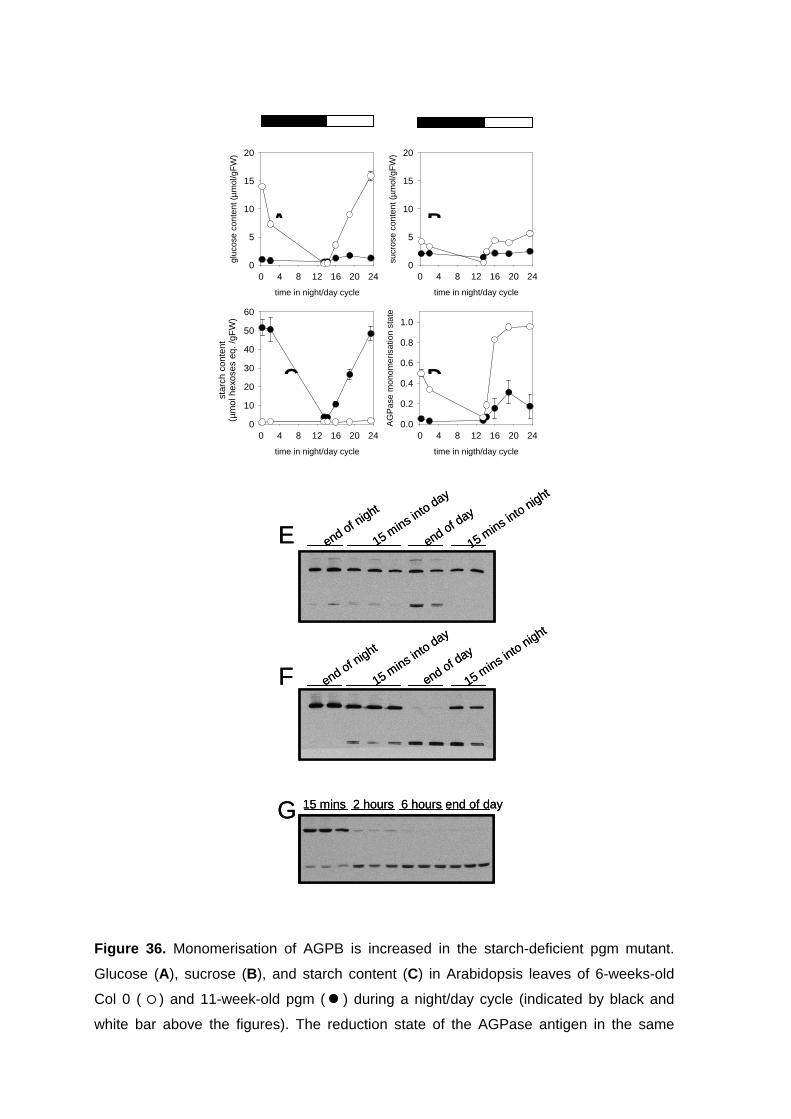
Figure 36. Monomerisation of AGPB is increased in the starch-deficient pgm mutant.
Glucose (A), sucrose (B), and starch content (C) in Arabidopsis leaves of 6-weeks-old
Col 0 ( ) and 11-week-old pgm ( ) during a night/day cycle (indicated by black and
white bar above the figures). The reduction state of the AGPase antigen in the same
time in night/day cycle
0 4 8 12 16 20 24
gluc
ose
cont
ent (
µm
ol/g
FW
)
0
5
10
15
20
time in night/day cycle
0 4 8 12 16 20 24
sucr
ose
cont
ent (
µm
ol/g
FW
)
0
5
10
15
20
time in night/day cycle
0 4 8 12 16 20 24
star
ch c
onte
nt(µ
mol
hex
oses
eq.
/gF
W)
0
10
20
30
40
50
60
time in nigth/day cycle
0 4 8 12 16 20 24
AG
Pas
e m
onom
eris
atio
n st
ate
0.0
0.2
0.4
0.6
0.8
1.0
15 mins in
to night
15 mins in
to night
end of night
15 mins in
to day
end of day
15 mins 2 hours 6 hours end of day
E
G
end of night
15 mins in
to day
end of day
F
15 mins in
to night
15 mins in
to night
end of night
15 mins in
to day
end of day
15 mins 2 hours 6 hours end of day
E
G
end of night
15 mins in
to day
end of day
F
A B
C D
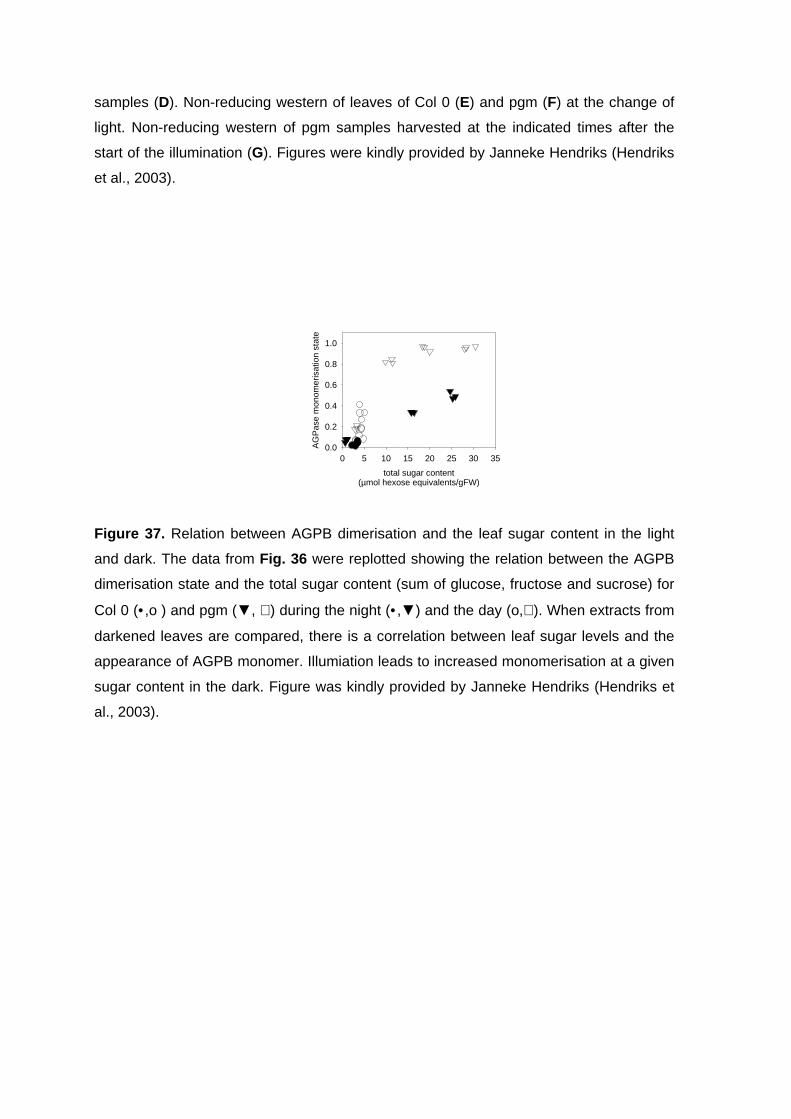
samples (D). Non-reducing western of leaves of Col 0 (E) and pgm (F) at the change of
light. Non-reducing western of pgm samples harvested at the indicated times after the
start of the illumination (G). Figures were kindly provided by Janneke Hendriks (Hendriks
et al., 2003).
Figure 37. Relation between AGPB dimerisation and the leaf sugar content in the light
and dark. The data from Fig. 36 were replotted showing the relation between the AGPB
dimerisation state and the total sugar content (sum of glucose, fructose and sucrose) for
Col 0 (•,ο ) and pgm (▼, ∇) during the night (•,▼) and the day (ο,∇). When extracts from
darkened leaves are compared, there is a correlation between leaf sugar levels and the
appearance of AGPB monomer. Illumiation leads to increased monomerisation at a given
sugar content in the dark. Figure was kindly provided by Janneke Hendriks (Hendriks et
al., 2003).
total sugar content(µmol hexose equivalents/gFW)
0 5 10 15 20 25 30 35
AG
Pas
e m
onom
eris
atio
n st
ate
0.0
0.2
0.4
0.6
0.8
1.0
Zusammenfassung Es ist bereits seit längerem bekannt, dass viele Enzyme des Calvinzyklus, des
oxidativen Pentosephosphatwegs, des NAD(P)H-Exports und der ATP-Synthese
durch post-translationale Redox-Modifikation in Antwort auf Licht reguliert werden. In
der vorliegenden Arbeit sollte untersucht werden, ob ein ähnlicher Mechanismus
auch die Kohlenstoffspeicherung in Blättern reguliert.
Vorangegangene Studien mit Kartoffelknollen zeigten, dass das Schlüsselenzym der
Stärkesynthese ADP-Glukose-Pyrophosphorylase (AGPase) durch die Bildung einer
Disulfidbrücke zwischen den zwei kleinen Untereinheiten (AGPB) des tetrameren
Proteins inaktiviert wird, die Bedeutung dieses Mechanismus für die Stärkesynthese
in Blättern blieb jedoch bislang ungeklärt. Die vorliegenden Arbeiten zeigen, das
AGPase in Erbsen-, Kartoffel- und Arabidopsis-Blättern über post-translationale
Redox-Modifikation in Antwort auf Tag-Nacht Änderungen reguliert wird. Dies erfolgt
über ein Licht-abhängiges Signal, da, erstens, AGPB in isolierten Chloroplasten
durch Belichtung sehr schnell von Dimer zu Monomer umgewandelt wird und,
zweitens, ein Abdunkeln der Blätter zu einer schnellen Umwandlung von AGPB von
Monomer zu Dimer führt. Die Monomerisierung von AGPB ging mit Änderungen in
den kinetischen Eigenschaften des Enzyms einher, die zu einer Aktivierung führten.
Studien mit Extrakten aus Erbsenchloroplasten zeigten, dass die AGPase-
Redoxaktivierung in-vitro durch die Thioredoxine f und m aus Spinat vermittelt wird.
In einem weiteren experimentellen Ansatz konnte gezeigt werden, dass auch Zucker
zu Redox-Aktivierung der AGPase und erhöhter Stärkesynthese in Blättern führen,
und dass diese unabhängig von Licht wirken. Externe Zugabe von Zuckern wie
Saccharose oder Trehalose an Arabidopsis-Blätter im Dunkeln führten zu
Monomerisierung von AGPB und einer Erhöhung der Stärkesyntheserate , während
die Spiegel des allosterischen Aktivators 3PGA unverändert blieben und keine
Änderungen im NADPH/NADP+-Verhältnis auftraten. Experimente mit transgenen
Arabidopsis-Pflanzen mit veränderten Spiegeln des Vorläufers der
Trehalosesynthese, Trehalose-6-phosphat (T6P), zeigten, dass T6P und nicht
Trehalose zu Redox-Aktivierung von AGPase führt. Expression einer E. coli T6P
synthase (TPS) im Zytosol führte zu erhöhter Redox-Aktivierung von AGPase und
erhöhter Stäreksynthese in Blättern, während die Expression einer T6P-Phosphatase
(TPP) gegenteilige Änderungen bewirkte. Diese Auswirkungen erfolgten unabhängig
von Änderungen in den Spiegeln von Zuckern und Zuckerphosphaten oder im
NADPH/NADP+-Verhältnis. Externe Zugabe von Saccharose führte zu
Monomerisierung von AGPB in Wildtyp und TPS exprimierenden Blättern, während
diese Antwort in TPP exprimierenden Blättern stark abgeschwächt war. Dies zeigt,
dass T6P eine wesentliche Komponente darstellt, die die Redox-Aktivierung der
AGPase in Antwort auf Saccharose vermittelt. T6P wurde auch für 15 min direkt an
intakte, isolierte Erbsenchloroplasten gefüttert. T6P Konzentrationen im Bereich von
100 µM bis 10 mM führten zu einem signifikanten und spezifischen Anstieg der
AGPB-Monomersierung und der AGPase Aktivität. Dies zeigt, dass T6P auch ohne
zytosolische Elemente die Redox-Aktivierung der AGPase stimuliert und somit ein
Signal zwischen Zytosol und Plastid darstellt. Diese Antwort erfolgte ohne
Änderungen im NADPH/NADP+-Verhältnis, was zeigt, dass T6P eher den Redox-
Transfer zu AGPase als den Redoxzustand des Chloroplasten moduliert.
Acetyl-CoA-Carboxylase (ACCase) ist als Schlüsselenzym der Fettsäure- und
Lipidsynthese in Pflanzen bekannt. Zu Beginn der vorliegenden Arbeit lagen
hauptsächlich in-vitro Befunde vor, die zeigten, dass ACCase durch DTT und
thioredoxine f und m über Redox-Modulation reguliert wird. In der Arbeit sollte daher
die in-vivo Relevanz dieses Mechanismus für die Regulation der Lipidsynthese in
Blättern untersucht werden. ACCase zeigte einen höheren Redox-
Aktivierungszustand in Arabidopsis-Blätter, die während des Tages im Vergleich zur
Nacht geerntet wurden. Die Redox-Aktivierung der ACCase wurde von Änderungen
in den kinetischen Eigenschaften begleitet und führte zu einer erhöhten Affinität des
Enzymes gegenüber Acetyl-CoA als Substrat. In weiteren Versuchen wurde sowohl
DTT als auch Saccharose an Blätter gefüttert, und beide Behandlungen führten zu
Redox-Aktivierung von ACCase, was mit erhöhten Lipidsynthesraten und einem
Rückgang des Acetyl-CoA-Spiegels einherging.
In einem abschließenden Ansatz, wurden Metabolit- und Transkriptprofile verglichen,
die nach DTT oder Saccharosefütterung an Blättern erhalten wurden. Sie zeigen,
dass auch andere zentrale Stoffwechselwegen in Pflanzen (wie TCA-Zyklus und
Aminosäuresynthese) über post-translationale Redoxregulation und unabhängig von
Änderungen in Transkriptspiegeln reguliert werden.

Acknowledgements I would like to thank Prof. Dr. Mark Stitt for his supervision, advice, support and
scientific discussions throughout the course of my work.
I would like to thank Dr. Peter Geigenberger for all his helpful supervision in
interpreting my collection of data, in discussing new experiments and in proof reading
of all my written work. He deserves special thanks for his patience and enthusiasm.
I am very gateful to Dr. Janneke Hendriks for cooperation, all help and patience.
Further I wish to thank all my mates in the lab for their support. I am especially
grateful to Silke Ulrich for excellent technical help and to Dr. Joost van Dongen for his
help in analysis of transcript data and for his interest in my project.
Special thanks to Dr. John Lunn for always useful comments and tips and interesting
discussions outside the science.
I would like to thank Zuza and Ania for their friendship and all my mates at the
institute for supporting me and my work, for technical assistance and for nice time
and fun.
My parents for their invaluable support throughout my studies and Przemek for all his
love and inspiration.
Curriculum vitae First name: Anna
Last name: Kolbe
Nationality: Polish
Date of birth: 05.03.1978
Place of birth: Wroclaw
Marital status: Single
Permanent address: Poland, Wroclaw, ul. Zemska 28/16
School education:
1994-1997 High school in Wroclaw, Poland
University education:
1997-2000 Wroclaw University, Department of Genetic Biochemistry
2000-2002 Diploma at Wroclaw University (Department of Genetic
Biochemistry) supervised by Prof. Dr. Jan Szopa.
Title: Selection and analysis of HD1A transgenic plants
04/2002-05/2005 PhD study in Max-Planck Institut for Molecular Plant
Physiology, Golm, Department of Prof. Dr. Mark Stitt,
supervised by Dr. Peter Geigenberger.
Title: Redox-regulation of starch and lipid synthesis in
leaves
Publications:
• Leggewie G, Kolbe A , Lemoine R, Roessner U, Lytovchenko A, Zuther E,
Kehr J, Frommer WB, Riesmeiner JW, Willmitzer L, Fernie AR (2003)
Overexpression of the sucrose transporter SoSUT1 in potato results in
alterations in leaf carbon partitioning and in tuber metabolism but has little
impact on tuber morphology, Planta, Vol. 217(1), 158-167
• Hendriks J, Kolbe A , Gibon Y, Stitt M, Geigenberger P (2003) ADP-Glucose
Pyrophosphorylase is activated by posttranslational redox-modification in
response to light and to sugars in leaves of Arabidopsis and other plant
species, Plant Physiology, Vol.133, 838-849
• Roessner U, Urbanczyk-Wochniak E, Czechowski T, Kolbe A , Willmitzer L,
Fernie AR (2003) De novo amino acid biosynthesis in potato tubers is
regulated by sucrose levels, Plant Physiology, Vol. 133, 683-692
• Geigenberger P, Kolbe A , Tiessen A (2005) Redox-regulation of carbon
storage and partitioning in response to light and sugars, Journal of
Experimental Botany, Vol. 178, 1-11.
In press:
• Urbanczyk-Wochniak E, Baxter C, Kolbe A , Kopka J, Sweetlove LJ, Fernie
AR Profiling of diurnal patterns of metabolite and transcript aboundance in
potato leaves reveals specific set of methabolic pathways are transcriptionally
regulated, but suggests that the majority of the metabolic network is under
post-transcriptional control, Planta
• Kolbe A , Tiessen A, Schluepmann H, Paul M, Ulrich S, Geigenberger P
Trehalose-6-phosphate regulates starch synthesis via post-translational redox-
activation of ADP-glucose pyrophosphorylase, PNAS
In preparation:
• Kolbe A , Waldeck P, Vigeolas H, Geigenberger P Redox-regulation of lipid
synthesis in Arabidopsis leaves and developing seeds from oil-seed rape in
response to light and sugars