
Schadensanfälligkeit und Anpassungsfähigkeit von...
83
Schadensanfälligkeit und Anpassungsfähigkeit von Kiefernplantagen in den Tropen und Subtropen im Kontext des Klimawandels Dissertation Zur Erlangung der Würde des Doktors der Naturwissenschaften des Fachbereichs Biologie, der Fakultät für Mathematik, Informatik und Naturwissenschaften, der Universität Hamburg vorgelegt von Christoph Leibing aus Hamburg Hamburg, November 2013
Transcript of Schadensanfälligkeit und Anpassungsfähigkeit von...
Schadensanfälligkeit und Anpassungsfähigkeit von Kiefernplantagen
in den Tropen und Subtropen im Kontext des Klimawandels
Dissertation
Zur Erlangung der Würde des Doktors der Naturwissenschaften
des Fachbereichs Biologie, der Fakultät für Mathematik, Informatik und Naturwissenschaften,
der Universität Hamburg
vorgelegt von
Christoph Leibing
aus Hamburg
Hamburg, November 2013


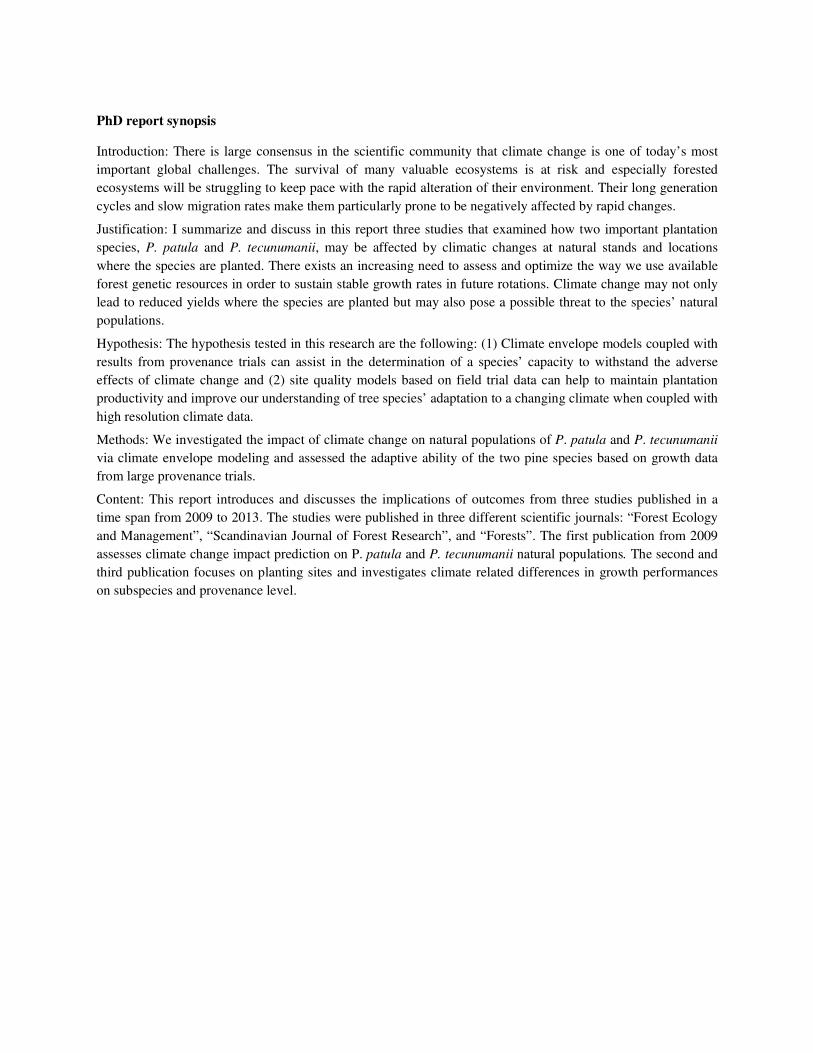
PhD report synopsis
Introduction: There is large consensus in the scientific community that climate change is one of today’s most
important global challenges. The survival of many valuable ecosystems is at risk and especially forested
ecosystems will be struggling to keep pace with the rapid alteration of their environment. Their long generation
cycles and slow migration rates make them particularly prone to be negatively affected by rapid changes.
Justification: I summarize and discuss in this report three studies that examined how two important plantation
species, P. patula and P. tecunumanii, may be affected by climatic changes at natural stands and locations
where the species are planted. There exists an increasing need to assess and optimize the way we use available
forest genetic resources in order to sustain stable growth rates in future rotations. Climate change may not only
lead to reduced yields where the species are planted but may also pose a possible threat to the species’ natural
populations.
Hypothesis: The hypothesis tested in this research are the following: (1) Climate envelope models coupled with
results from provenance trials can assist in the determination of a species’ capacity to withstand the adverse
effects of climate change and (2) site quality models based on field trial data can help to maintain plantation
productivity and improve our understanding of tree species’ adaptation to a changing climate when coupled with
high resolution climate data.
Methods: We investigated the impact of climate change on natural populations of P. patula and P. tecunumanii
via climate envelope modeling and assessed the adaptive ability of the two pine species based on growth data
from large provenance trials.
Content: This report introduces and discusses the implications of outcomes from three studies published in a
time span from 2009 to 2013. The studies were published in three different scientific journals: “Forest Ecology
and Management”, “Scandinavian Journal of Forest Research”, and “Forests”. The first publication from 2009
assesses climate change impact prediction on P. patula and P. tecunumanii natural populations. The second and
third publication focuses on planting sites and investigates climate related differences in growth performances
on subspecies and provenance level.
I
PhD report contents
1. Introduction ............................................................................................................................................... 1
1.1. Research objectives .......................................................................................................................... 2
1.2. Camcore provenance trial data ......................................................................................................... 2
1.3. Report structure and overview ......................................................................................................... 3
1. Current state of research .......................................................................................................................... 3
1.1. Genotype-environment interactions ................................................................................................. 4
1.2. Climate envelope modeling .............................................................................................................. 5
1.2.1. Maxent ...................................................................................................................................... 5
1.2.2. Model validation....................................................................................................................... 6
1.2.3. Shortcoming of climate envelope models ................................................................................ 6
1.2.4. Correlative - combined with mechanistic models .................................................................... 7
1.3. Forest growth models ....................................................................................................................... 8
1.3.1. Statistical models vs process based models .............................................................................. 8
1.3.2. Evaluation of forest growth models ......................................................................................... 9
1.3.3. Challenges for practical implementation ................................................................................ 10
2. The published manuscripts in context of the current research agenda ............................................. 10
2.1. Climate change impact predictions on Pinus patula and Pinus tecunumanii populations in Mexico and
Central America ..................................................................................................................................... 11
2.1.1. Objectives ............................................................................................................................... 11
2.1.2. Own contribution .................................................................................................................... 11
2.1.3. Methods .................................................................................................................................. 12
2.1.4. Key findings ........................................................................................................................... 13
2.1.5. Conclusion .............................................................................................................................. 14
2.2. Adaptation of tropical and subtropical pine plantation forestry to climate change: Realignment of Pinus
patula and Pinus tecunumanii genotypes to 2020 planting site climates ............................................... 14
2.2.1. Objectives ............................................................................................................................... 14
2.2.2. Own contribution .................................................................................................................... 14
2.2.3. Methods .................................................................................................................................. 15
2.2.4. Key findings ........................................................................................................................... 16
2.2.5. Conclusion .............................................................................................................................. 16
2.3. Selection of provenances to adapt tropical pine forestry to climate change on the basis of climate
analogs .................................................................................................................................................... 16
2.3.1. Objectives ............................................................................................................................... 16
2.3.2. Own contribution .................................................................................................................... 17
2.3.3. Methods .................................................................................................................................. 17
2.3.4. Key findings ........................................................................................................................... 18
2.3.5. Conclusion .............................................................................................................................. 19
3. Synthesis ................................................................................................................................................... 19
3.1. Implications of key findings ........................................................................................................... 20
3.2. Critical remarks and model shortcomings ...................................................................................... 21
3.2.1. Performance in trials compared to survival in natural populations ........................................ 21
3.2.2. The effect of extreme weather events ..................................................................................... 22
3.2.3. Environmental space covered by provenance trials ............................................................... 22
3.3. Future research questions ............................................................................................................... 22
3.4. Conclusion ...................................................................................................................................... 24
4. Acknowledgements .................................................................................................................................. 24
5. References ................................................................................................................................................ 25
II
Figures
Fig. 1. Climate envelope maps for the natural distribution of P. tecunumanii and the predicted impacts of climate
change on their distribution by 2050. ......................................................................................................................... 1
Fig. 2. Map of location of Camcore provenance trials. ........................................................................................................... 2
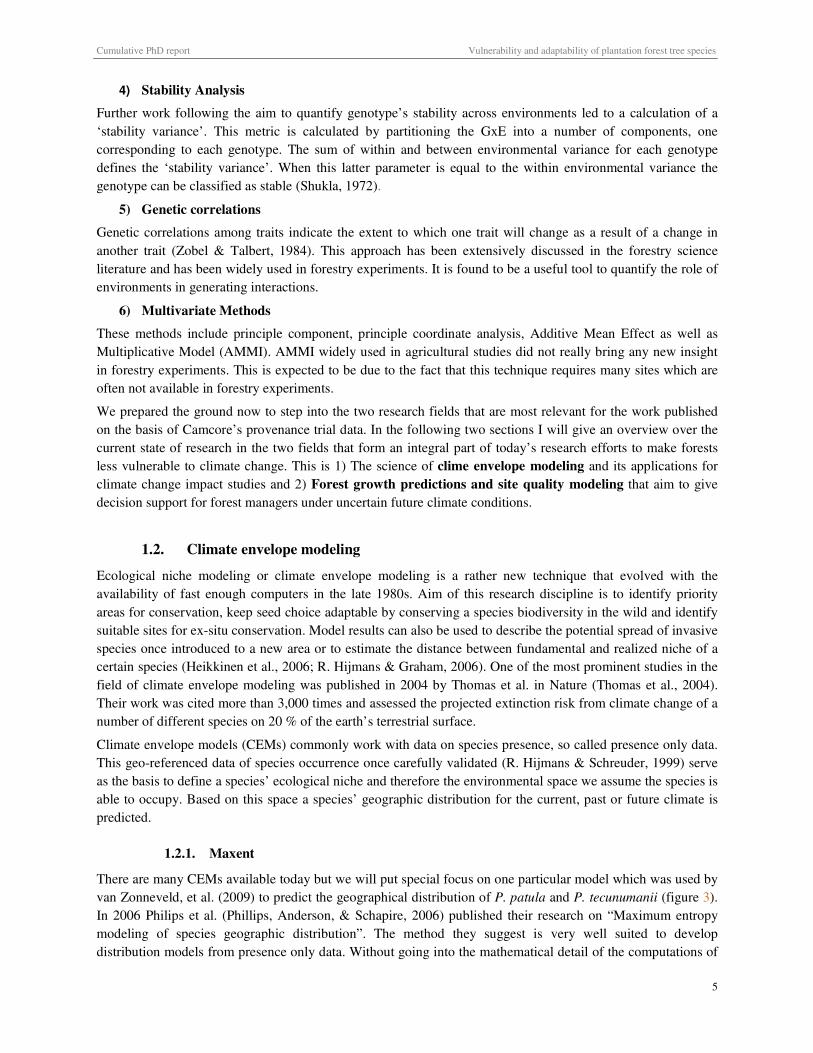
Fig. 3 Maxent’s climate change impact prediction for the natural distribution of Pinus patula and Pinus tecunumanii. ...... 6
Fig. 4: Congruence between mechanistic – and correlative model. Source: M. R. Kearney et al., 2010................................ 7
Fig. 5. The role of growth models and complementary data in providing decision support. Source: Vanclay, 1994 ............. 8
Fig. 6: Two dimensional linear combinations of variable range limits for natural pine habitat (in black) and the climatic
ranges in which the field trials were established (in grey). ...................................................................................... 12
Fig. 7: Correlation of CEM-generated suitability values for P. tecunumanii provenance locations with height growth
and survival rate on climatically similar sites where the species is grown as an exotic. .......................................... 13
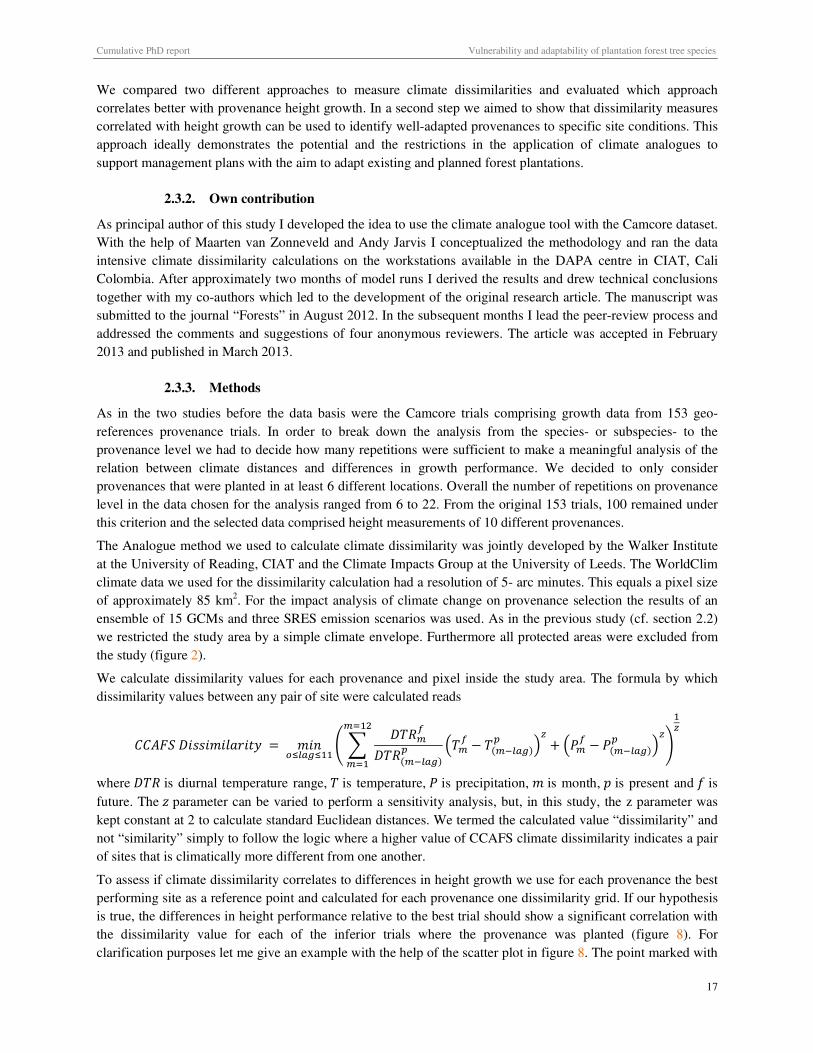
Fig. 8: Scatter plot showing the linear correlation of climate dissimilarity and height growth ............................................ 18
Fig. 9: Climate range covered by P. patula and P. tecunumanii trials .................................................................................. 22
Tables
Tab. 1: List of environmental variables used to build the site growth models ...................................................................... 15
Tab. 2: Percent of study area where the respective provenance is expected to be best seed choices under current and
future climate conditions. ......................................................................................................................................... 19

III
Abbreviations
Additive Mean Effect and Multiplicative Model AMMI
Analysis of Variance ANOVA
Area Under Curve AUC
Canadian Centre for Climate Modelling and Analysis CCCMA
Central America and Mexico Coniferous Resource Cooperative CAMCORE
Centro Internacional de Agricultura Tropical CIAT
Clean Development Mechanism CDM
Climate Change, Agriculture, and Food Security CCAFS
Climate change CC
Climate Envelope Modeling CEM
Conference of Parties COP
Decision and Policy Analysis DAPA
Diameter at Breast Height dbh
Forest Genetic Resources FGR
Free Air Carbon Dioxide Enrichment FACE
General Circulation Model GCM
Genetic Algorithm for Rules Set Production GARP
Genetic by Environment Interaction GxE
Geographic Information System GIS
Gesellschaft für International Zusammenarbeit GIZ
Gesellschaft für Technische Zusammenarbeit GTZ
Hadley Centre Coupled Model, version 3 HADCM3
Intergovernmental Panel on Climate Change IPCC
International Union for Conservation of Nature IUCN
Multiple Linear Regression MLR
Pinus patula var. longipedunculata LONGIP
Pinus patula var. patula PAT
Pinus tecunumanii high elevation population HIGH
Pinus tecunumanii low elevation population LOW
Receiver Operating Characteristic ROC
South African Pulp and Paper Industries SAPPI
Species Distribution Model SDM
Variance inflation Factor Vif
Cumulative PhD report Vulnerability and adaptability of plantation forest tree species
1
1. Introduction
The anthropogenic alteration of precipitation and temperature patterns is likely to be one of the most important
global challenges faced by ecosystems and societies alike (O’Neill & Oppenheimer, 2002; Parmesan, 2006;
Walther, Hughes, Vitousek, & Stenseth, 2005). The scientific basis for this “man-made” climate change is
established (Solomon, 2007) and evidence is mounting that especially forested ecosystems will be profoundly
affected (Hamrick, 2004; Köhl et al., 2010; Saxe, Cannell, Johnsen, Ryan, & Vourlitis, 2001). Important
plantation tree species are likely to be negatively affected in their natural habitat (Dvorak, Hodge, & Payn,
2008) and locations where species can be grown as exotics will have to be adjusted. Despite the importance of
climate change for the growth and survival of these tree stands, considerable uncertainty still exists on how
different species and genotypes will respond to changes in climate (Botkin et al., 2007; Kremer, Koskela, Buck,
& Cros, 2007). Climate change is predicted to rapidly alter growing conditions in an unprecedented way and
will force foresters to make decision under considerable uncertainty (Noss, 2002; D. L. Spittlehouse, 2005). In
combination with anthropogenic stressors such as pollution, habitat fragmentation, land-use changes, invasive
plants, animals, and pathogens, and altered fire regimes climate change demands for a novel approach to
sustainable forest management. If left unaltered forest ecosystems will likely not be able to maintain their
productivity and may become more susceptible to undesirable changes (Millar, Stephenson, & Stephens, 2007).
Climate envelope- and site quality models can help to indicate a way for the forestry sector to adequately cope
with the rapid alteration of growing conditions. Model results coupled with Geographic Information Systems
(GIS) are a widely-used tool to assist the management of forest resources in an uncertain environment. A
common approach assesses the potential climate change impact on natural populations based on the results of
climate envelope models (CEMs) (Gómez-Mendoza & Arriaga, 2007; Hamann & Wang, 2006; Iverson &
Prasad, 1998; Leibing, van Zonneveld, Jarvis, & Dvorak, 2009; Pearson & Dawson, 2003). The current
geographic distribution of a species is used to build a model of most suitable climate conditions for natural
species occurrence. This so called climate envelope aims to describe the species’ ecological niche and can be
projected into the future on the basis of results from general circulation models (GCMs). The outcome is a
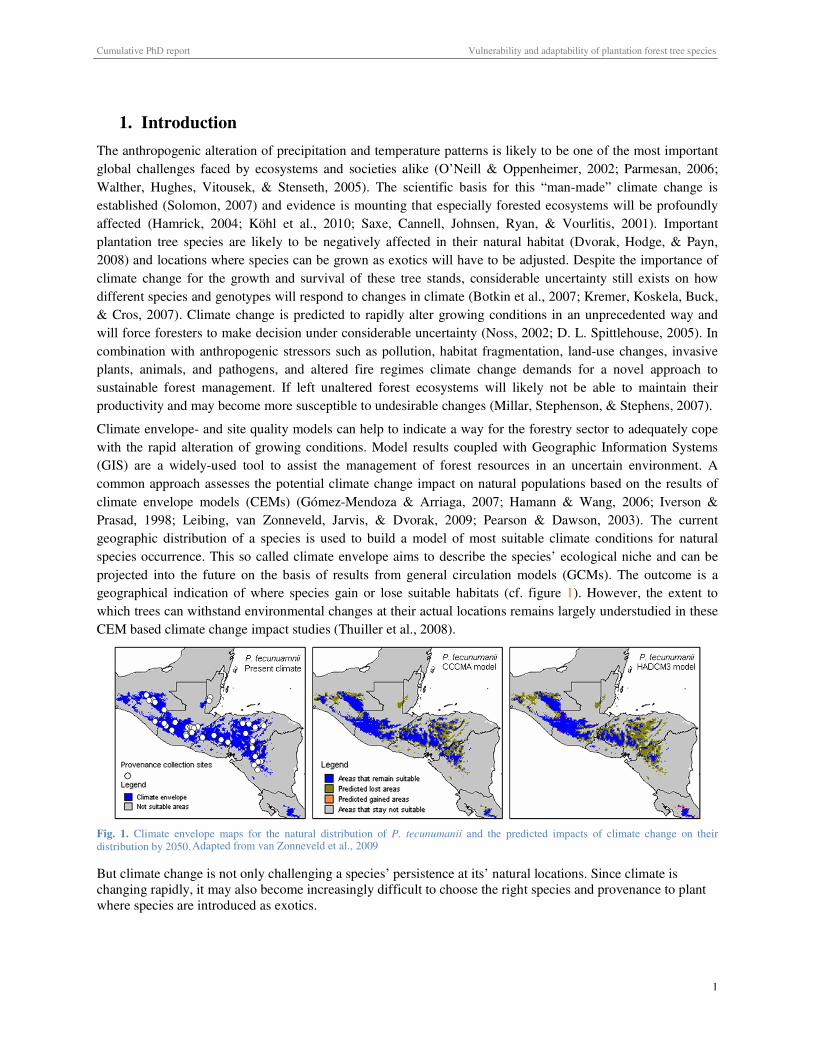
geographical indication of where species gain or lose suitable habitats (cf. figure 1). However, the extent to
which trees can withstand environmental changes at their actual locations remains largely understudied in these
CEM based climate change impact studies (Thuiller et al., 2008).
Fig. 1. Climate envelope maps for the natural distribution of P. tecunumanii and the predicted impacts of climate change on their distribution by 2050.
But climate change is not only challenging a species’ persistence at its’ natural locations. Since climate is changing rapidly, it may also become increasingly difficult to choose the right species and provenance to plant where species are introduced as exotics.
Adapted from van Zonneveld et al., 2009
Cumulative PhD report Vulnerability and adaptability of plantation forest tree species
2
1.1. Research objectives
The objective of the first of three studies presented and discussed in this report was to evaluate if CEM can
reliably assess the impact of climate change on the persistence of natural populations of Pinus patula and Pinus
tecunumanii at their actual locations. If successful this model could help to inform about conservation measures
with the aim to protect the species in their natural habitat. In a second step we developed decision support
models that (1) predict the impact of climate change on wood productivity at locations where the pines are
planted as exotic and (2) identify what kind of tree should be planted today that will be resilient to climate
changes 10 or 20 years in the future.
1.2. Camcore provenance trial data
The three studies discussed in this report were conducted at the International Centre for Tropical Agriculture
(CIAT) Cali, Colombia in cooperation with the International Tree Breeding and Conservation Program
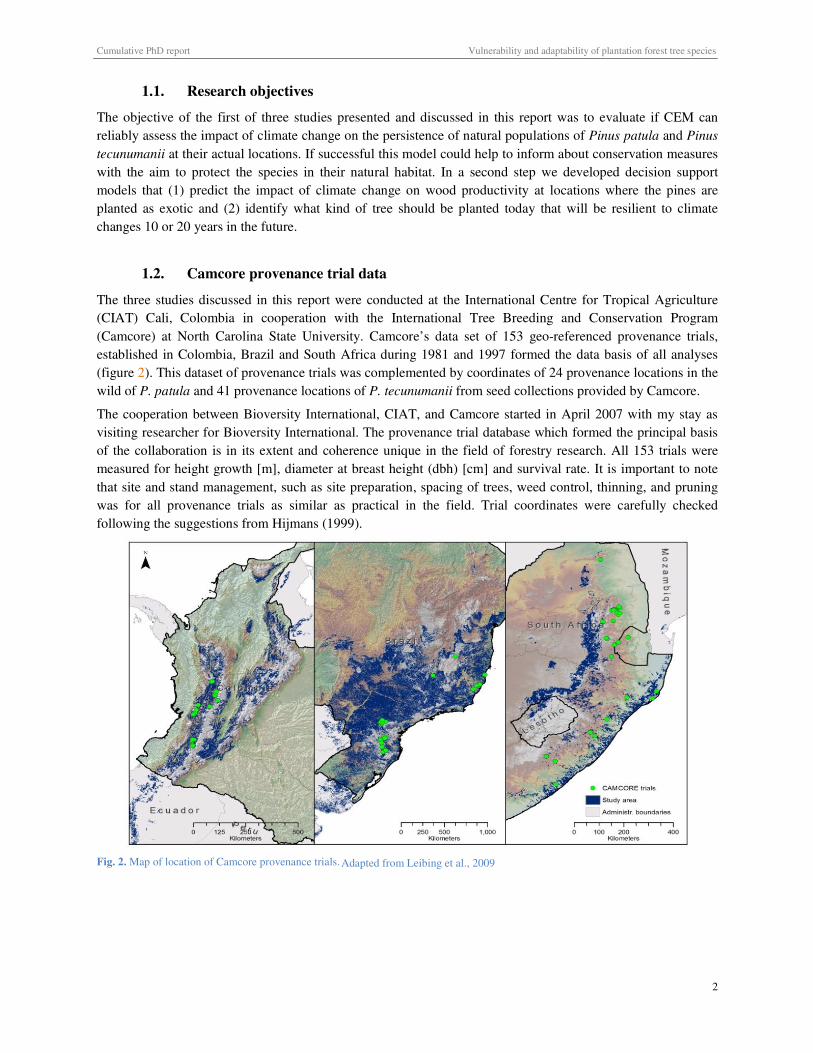
(Camcore) at North Carolina State University. Camcore’s data set of 153 geo-referenced provenance trials,
established in Colombia, Brazil and South Africa during 1981 and 1997 formed the data basis of all analyses
(figure 2). This dataset of provenance trials was complemented by coordinates of 24 provenance locations in the
wild of P. patula and 41 provenance locations of P. tecunumanii from seed collections provided by Camcore.
The cooperation between Bioversity International, CIAT, and Camcore started in April 2007 with my stay as
visiting researcher for Bioversity International. The provenance trial database which formed the principal basis
of the collaboration is in its extent and coherence unique in the field of forestry research. All 153 trials were
measured for height growth [m], diameter at breast height (dbh) [cm] and survival rate. It is important to note
that site and stand management, such as site preparation, spacing of trees, weed control, thinning, and pruning
was for all provenance trials as similar as practical in the field. Trial coordinates were carefully checked
following the suggestions from Hijmans (1999).
Fig. 2. Map of location of Camcore provenance trials.
Adapted from Leibing et al., 2009
Cumulative PhD report Vulnerability and adaptability of plantation forest tree species
3
1.3. Report structure and overview
This cumulative PhD report summarizes and reflects on implications of the findings of three research projects
(Leibing, Signer, van Zonneveld, Jarvis, & Dvorak, 2013; Leibing et al., 2009; van Zonneveld, Jarvis, Dvorak,
Lema, & Leibing, 2009). Together these projects shed light on the vulnerability and adaptive capacity of two
important pine plantation species, Pinus patula and Pinus tecunumanii. In a first step we analyzed the impact of
climate change on stands where the species naturally occurs. In the two subsequent steps we investigated the
vulnerability of productive forest plantations to climate change in terms of achievable growth rates.
I will review the methodology, key findings and implications that can be drawn from each of the three published
studies. In this report a close look will be taken on the current state of research the two main fields which are
relevant for the publications: (1) Climate envelope modeling and (2) Site quality- and forest growth modeling.
The first study, which was published in January 2009 in the journal “Forest Ecology and Management”,
describes the ecological niche of the two Mexican and Central American pine species. By projecting the results
of climate envelope modeling into the future, the impact of climate change on the persistence of the natural
population of these species at their actual locations was estimated. Model results were then used to inform about
appropriate conservation measures (van Zonneveld et al., 2009). The second study was published in December
2009 in the “Scandinavian Journal of Forest Research”. Here we assessed the need to adapt the choice of seed
material for forest plantations under changing climate of two P. patula varieties (P. patula var. patula and P.
patula var. longipedunculata) and two P. tecunumanii ecotypes (highland and lowland). The study area
comprises planting sites in Brazil, Colombia and South Africa (Leibing et al., 2009). The final and third study
made use of a statistical analysis tool called Analogue which was developed by the Climate Change,
Agriculture, and Food Security Program (CCAFS) in collaboration with the University of Reading in 2011
(Ramírez-Villegas et al., 2012). The manuscript was published in March 2013 in the scientific journal “Forests”.
The study’s focus lies on the evaluation of growth performance of plantings in Colombia, Brazil and South
Africa. With the help of the climate analogue tool we correlated the provenance trials’ height growth to the
degree of climatic dissimilarity between planting sites. The outcome of this analysis served as a measurement
for the suitability of seed material under a changing climate for four P. patula provenances and six P.
tecunumanii provenances (Leibing et al., 2013).
1. Current state of research
The last decade has seen very lively activity in the field of research on climate change impacts on the
exploitation of forest genetic resources (FGR). Much of the interest focuses on the direction of impact
predictions regarding FGR’s vulnerability to climate change in natural forests and forest plantations (Loo, Fady,
Dawson, Vinceti, & Baldinelli, 2011). Scientists’ opinion vary on the consequences of the rapid environmental
changes for FGR (Hamrick, 2004). Some consider that many trees have sufficient phenotypic plasticity and
genetic diversity at the population level to significantly reduce the negative effects of climate change, others
have taken a different viewpoint and predict severe negative impacts (Koskela, Buck, & Teissier du Cros, 2007;
Rehfeldt, Wykoff, & Ying, 2001). Different positions relate partly to the types of species and environments
being considered but also result from the difficulties to quantify the extent of phenotypic plasticity in a studied
species. In general scientists who make the more pessimistic forecasts often base their views on tropical trees
(Dawson et al., 2011) or on temperate species that grow on distribution margins (Mátyás, Vendramin, & Fady,
2009). More optimistic authors tend to make temperate and boreal taxa their object of research. Boreal and
temperate ecosystems are expected to benefit from higher temperatures. In these regions today’s low
temperatures and long winters are among the most important limiting abiotic growth factors (Lindner et al.,
2010).
Any study on forest yields needs information on tolerance and adaptability of tree species. A vital step in the
process to create forests that are well adapted to their environment is to find the right genotype to plant at a
Cumulative PhD report Vulnerability and adaptability of plantation forest tree species
4
certain site. This step includes not only choosing the adequate species but also the identification of the best
genotypes within a species for a specific environment (Kanzler, 2002). The correct choice of species and seed
source represents a vital decision in the process of sustainable forest management and is indispensable to realize
gain from plantation forestry (Zobel & Talbert, 1984). However, in the context of an unstable and rapidly
changing environment the exercise to choose the right tree to plant becomes more and more difficult.
1.1. Genotype-environment interactions
In order to take the right planting decision a forester needs to know about the differences in climate tolerance
among- and within tree species. In other words the so called genotype-environment interactions (GxE) have to
be assessed. Many and sometimes complex definitions of GxE exist which can all be reduced to one practical
implication: an optimal population or individual on one site is not necessarily the best for the others (Barnes,
Bunrsr, & Gibson, 1984). Most of the scientific work which provided the statistical methods to assess the extent
of GxE has been conducted in the 60’s 70’s and 80’s; most prominently by the researchers Freeman (1973) and
Shelbourne (1973). This report will not give a detailed summary of all the available techniques but rather
provide a brief overview on this important facet of FGR and climate change impact studies. The work to
summarize the most prominent statistical approaches was undertaken by Kanzler and the following description
draws from the review of techniques given in his PhD thesis (Kanzler, 2002).
1) Ranking entry means and phenotypic correlations
A helpful first step to assess GxE is to use simple comparative techniques. This will show if there are any rank
changes of entries under different environments. A look at entry means across environments can be helpful. If
there are rank changes or differences in relative performance of entries under different environments this may be
first evidence of GxE.
2) Analysis of Variance
The analysis of variance (ANOVA) is usually the most widely used technique in any GxE study. It allows the
partitioning of total phenotypic variation into components due a) genotype b) environment c) GxE interaction
and d) error. Since interactions may result to be statistically significant but need more analysis for better
interpretation, an ANOVA can be considered the basis for further data examination.
3) Regression Analysis
In the technique of regression analysis the genotypic means of each site are regressed against the mean value of
an environmental effect at each site. We will review this technique in somewhat more detail since it is of
specific relevance for the third publication “Selection of Provenances to Adapt Tropical Pine Forestry to
Climate Change on the Basis of Climate Analogs” (Leibing et al., 2013).
Finlay and Wilkinson developed in 1963 a methodology to assess the stability of genotypes across environments
for 277 barley varieties. In a comparison with several other methods, it produced similar results and in addition
it proved advantageous because it allowed for the prediction of performance in an untested environment
(Barnes, 1984). The method calculates the linear regression of one variety’s yield in a given environment on the
mean yield of all varieties in that environment. This allows each genotype to be classified into one of four
groups; a) high yielding, stable genotypes (high genotypic means with regression coefficients b1 < 1); b) high
yielding, unstable genotypes (high genotypic means with b1 > 1); c) low yielding, stable genotypes (low
genotypic means with b1 < 1) and d) low yielding, unstable genotypes (low genotypic means with b1 > 1)
(Finlay & Wilkinson, 1963). As stated in the article published in Forests in 2013, the underlying idea of this
method is that an unstable entry could have higher yields than the more reliable stable source in certain
locations. The breeder has to decide if it is better to choose stable or unstable genetic entries for the tree
improvement program. Especially with keeping climate change in mind a forester’s choice may very well turn
in favor of the lower yield but more reliable source (b1 << 1).
Cumulative PhD report Vulnerability and adaptability of plantation forest tree species
5
4) Stability Analysis
Further work following the aim to quantify genotype’s stability across environments led to a calculation of a
‘stability variance’. This metric is calculated by partitioning the GxE into a number of components, one
corresponding to each genotype. The sum of within and between environmental variance for each genotype
defines the ‘stability variance’. When this latter parameter is equal to the within environmental variance the
genotype can be classified as stable (Shukla, 1972).
5) Genetic correlations
Genetic correlations among traits indicate the extent to which one trait will change as a result of a change in
another trait (Zobel & Talbert, 1984). This approach has been extensively discussed in the forestry science
literature and has been widely used in forestry experiments. It is found to be a useful tool to quantify the role of
environments in generating interactions.
6) Multivariate Methods
These methods include principle component, principle coordinate analysis, Additive Mean Effect as well as
Multiplicative Model (AMMI). AMMI widely used in agricultural studies did not really bring any new insight
in forestry experiments. This is expected to be due to the fact that this technique requires many sites which are
often not available in forestry experiments.
We prepared the ground now to step into the two research fields that are most relevant for the work published
on the basis of Camcore’s provenance trial data. In the following two sections I will give an overview over the
current state of research in the two fields that form an integral part of today’s research efforts to make forests
less vulnerable to climate change. This is 1) The science of clime envelope modeling and its applications for
climate change impact studies and 2) Forest growth predictions and site quality modeling that aim to give
decision support for forest managers under uncertain future climate conditions.
1.2. Climate envelope modeling
Ecological niche modeling or climate envelope modeling is a rather new technique that evolved with the
availability of fast enough computers in the late 1980s. Aim of this research discipline is to identify priority
areas for conservation, keep seed choice adaptable by conserving a species biodiversity in the wild and identify
suitable sites for ex-situ conservation. Model results can also be used to describe the potential spread of invasive
species once introduced to a new area or to estimate the distance between fundamental and realized niche of a
certain species (Heikkinen et al., 2006; R. Hijmans & Graham, 2006). One of the most prominent studies in the
field of climate envelope modeling was published in 2004 by Thomas et al. in Nature (Thomas et al., 2004).
Their work was cited more than 3,000 times and assessed the projected extinction risk from climate change of a
number of different species on 20 % of the earth’s terrestrial surface.
Climate envelope models (CEMs) commonly work with data on species presence, so called presence only data.
This geo-referenced data of species occurrence once carefully validated (R. Hijmans & Schreuder, 1999) serve
as the basis to define a species’ ecological niche and therefore the environmental space we assume the species is
able to occupy. Based on this space a species’ geographic distribution for the current, past or future climate is
predicted.
1.2.1. Maxent
There are many CEMs available today but we will put special focus on one particular model which was used by
van Zonneveld, et al. (2009) to predict the geographical distribution of P. patula and P. tecunumanii (figure 3).
In 2006 Philips et al. (Phillips, Anderson, & Schapire, 2006) published their research on “Maximum entropy
modeling of species geographic distribution”. The method they suggest is very well suited to develop
distribution models from presence only data. Without going into the mathematical detail of the computations of
Cumulative PhD report Vulnerability and adaptability of plantation forest tree species
6
Maxent it is useful to note that the maximum entropy approach by
definition agrees with everything that is known but carefully avoids
assuming anything that is not known (Jaynes, 1991). More technically
expressed this means that a certain probability distribution maximizes
entropy while subject to certain constraints representing our incomplete
information. These constraints represent the fundamental property which
justifies use of that distribution for inference. The method’s origins lie in
statistical mechanics (Jaynes, 1957), and can be attributed to the school of
machine learning. Maximum entropy remains an active area of research
with an annual conference (Maximum Entropy and Bayesian Methods)
that explores applications in diverse areas such as astronomy, portfolio
optimization, image reconstruction, statistical physics and signal
processing (Phillips et al., 2006).
1.2.2. Model validation
The most common approach to validate predictions from CEMs separates
the collection of geo-referenced species occurrence into a test- and a train
dataset. Usually 80 % of the available data is used to run the climate
envelope model (train data) and the remaining 20 % are used to evaluate
the accuracy of the developed distribution model. This approach generally
follows the demand in statistics that robust measures of prediction success
make use of independent data that was not used to develop the model. The
best way how to partition data is still discussed among researchers.
Fielding and Bell (1997) state that the ecological research community
seems to have paid little attention to how the partitioning method can influence the error rates. Only Verbyla &
Litaitis (1989) reviewed a range of partitioning methods in their assessment of resampling methods for
evaluating classification accuracy (Fielding & Bell, 1997). It is in general believed to be beneficial in order to
make the accuracy estimate less dependent on one single partition to average results from several partitions.
This results into the so called k-fold cross validation of species distribution models, where “k” stands for the
times data was partitioned into a test and train dataset.
The standard method to assess the validity of predictive distribution models is the so called area under receiver
operating characteristic (ROC) curve also simply known as area under curve (AUC). ROC and AUC are
commonly used as measures of climate envelope model predictiveness (Fawcett, 2004) and yield a score
between 0 and 1. This score has been shown to be equivalent to the probability that a model assigns a higher
probability of occurrence to a location where the species actually occurs. An AUC score of 0.5 indicates poor
model performance, equal to random predictions of the so called “null model”. A score of 0.9 or above indicates
excellent model performance (Araújo, Pearson, Thuiller, & Erhard, 2005). The AUC validation technique is
subject to much criticism and remains an active field of research.
1.2.3. Shortcoming of climate envelope models
Doorman (Dormann, 2007) and Thuiller (Thuiller et al., 2008) reviewed the current state of science of
ecological niche modeling and took a critical look at the limits and shortcomings of global change projections of
species distributions. One major limitation of these models is considered to be that important evolutionary
processes are often overlooked when evaluating future species distribution. The vast majority of modeling
approaches do not take into account that a species’ climatic envelope is not consistent and that changes could
Fig. 3 Maxent’s climate change impact prediction for the natural distribution of Pinus patula and Pinus tecunumanii.
Adapted from van Zonneveld et al., 2009
Cumulative PhD report Vulnerability and adaptability of plantation forest tree species
7
alter the environmental niche considerably (Dormann, 2007; Kremer et al., 2007). This often results in an
overestimation of climate change’s impact and puts studies as a basis for decision making to question.
Another aspect that makes climate envelope models underestimate a species possible distribution is related to
unsaturated habitats or species interaction (Fielding & Bell, 1997). The realized and fundamental niche of a
species is often not congruent and CEMs making inferences from the one to the other often lead to erroneous
predictions.
Researchers who aim to develop and apply bioclimatic models in an informative way require a deeper
understanding of a wide range of methodologies, including the choice of modeling technique, model validation,
statistical phenomena such as colinearity, autocorrelation, biased sampling of explanatory variables or scaling
and impacts of non-climatic factors. Heikkinen, et al. (2006) state that the key challenge for future research in
the field of CEM is integrating factors such as land cover, direct CO2 effects, biotic interactions and dispersal
mechanisms. Bioclimatic envelope models have a number of important advantages but they should only be
applied when users of models have a thorough understanding of their limitations and uncertainties (Heikkinen et
al., 2006).
A more general point of criticism raises Knight (2008) by elaboration on the Knowing-Doing Gap in
conservation science as a whole. He states that given the woefully inadequate resources allocated for
conservation, his findings raise questions over the utility of conservation assessment science, as currently
practiced, to provide useful, pragmatic solutions to conservation planning problems. There is need to reevaluate
the conceptual and operational basis of conservation planning research. He concludes with 7 concrete
recommendation for actions to begin a process for bridging the research–implementation gap in conservation
research (Knight et al., 2008).
For a more detailed discussion of criticism on CEM predictions the reader is referred to the comprehensible
review “Promising the future? Global change projections of species distribution” (Dormann, 2007).
1.2.4. Correlative - combined with mechanistic models
A recent development aims to improve the quality of species distribution models (SDM) and climate change
impact predictions studies by integrating predictions from fundamentally different modeling strategies. By
combining correlative models (such as Maxent) with mechanistic models we try to capture a species physiology
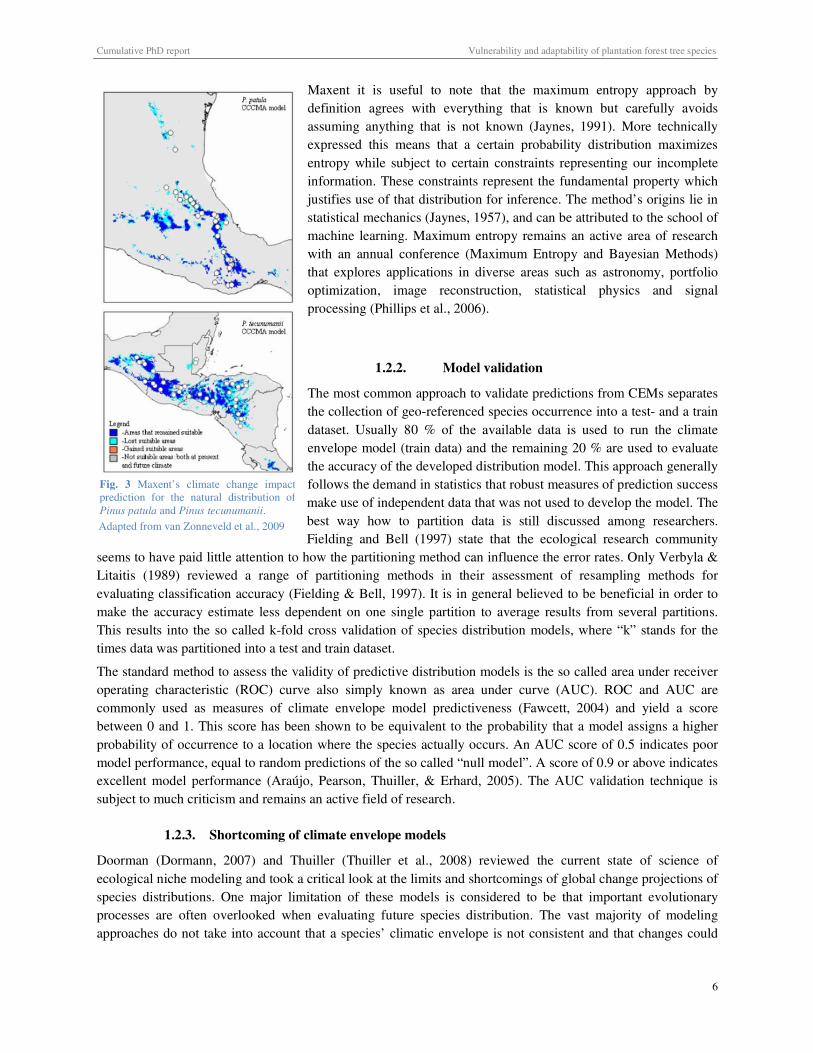
and make predictions on habitat and population parameters more robust and reliable. Kearney et al. (Kearney,
Wintle, & Porter, 2010) demonstrated this approach on the current and future distribution and fertility of an
Australian gliding possum. They used Maxent and another simple CEM, Bioclim, as correlative species
distribution models and Niche Mapper as mechanistic model.
The greater gliders that were modeled in this work are nocturnal
specialist feeders on Eucalyptus leaves. With the help of Niche
Mapper areas suitable for the species were modeled based on a
number of different physiological responses to the environment (e.g.
fur properties, core body temperature, digestive system and milk
production). Their correlative SDMs approach used app. 6,000
recorded sightings. They based the distribution model on gridded
layers of environmental data on mean annual temperature, mean
precipitation of the wettest/driest period and categorical data of land
cover a map of species’ suitability. Kearney’s et al. finding was that
Maxent and Niche Mapper both yield qualitatively identical results
(figure 4) suggesting that when temperature and species are main
direct driving factors influencing a species distribution correlative
SDM can yield reliable predictions.
Fig. 4: Congruence between mechanistic – and correlative model. Adapted from Kearney et al., 2010
Cumulative PhD report Vulnerability and adaptability of plantation forest tree species
8
Robertson, et al came to a similar conclusion in an earlier study (Robertson, Peter, Villet, & Ripley, 2003).
Their results suggest that correlative models can perform as well as or better than simple mechanistic models.
They draw the general conclusion that predictions generated from the different model designs are likely to
generate different insights into the potential distribution and biology of the target organism and thus each
approach may be appropriate in different situations (Robertson et al., 2003).
1.3. Forest growth models
The principle of sustainable forest management requires a profound
understanding of the factors controlling tree growth and an
understanding of the limitations of the sites on which trees are planted
(Louw, 1999). This insight can only come from a large amount of
information on parameters that influence growth dynamics and site
preferences. Especially when the aim is the production of commercially
valuable timber, it is important to estimate present growth or future
growth potential (Subasinghe, 2011). For this purpose forest growth
models offer an abstraction of the natural growth and stand dynamics.
They enable us to give information on important parameters such as
volume growth, mortality and changes in stand composition and
structure. The models have proven to be very useful tools for research
and management where they are mainly used for predictions of future
yields and for the exploration of different silvicultural management options (Vanclay, 1994). The models
designed for research tend to be more demanding in terms of input data and rely on information that is usually
not readily available for commercially managed forests. Models designed for management use simpler and more
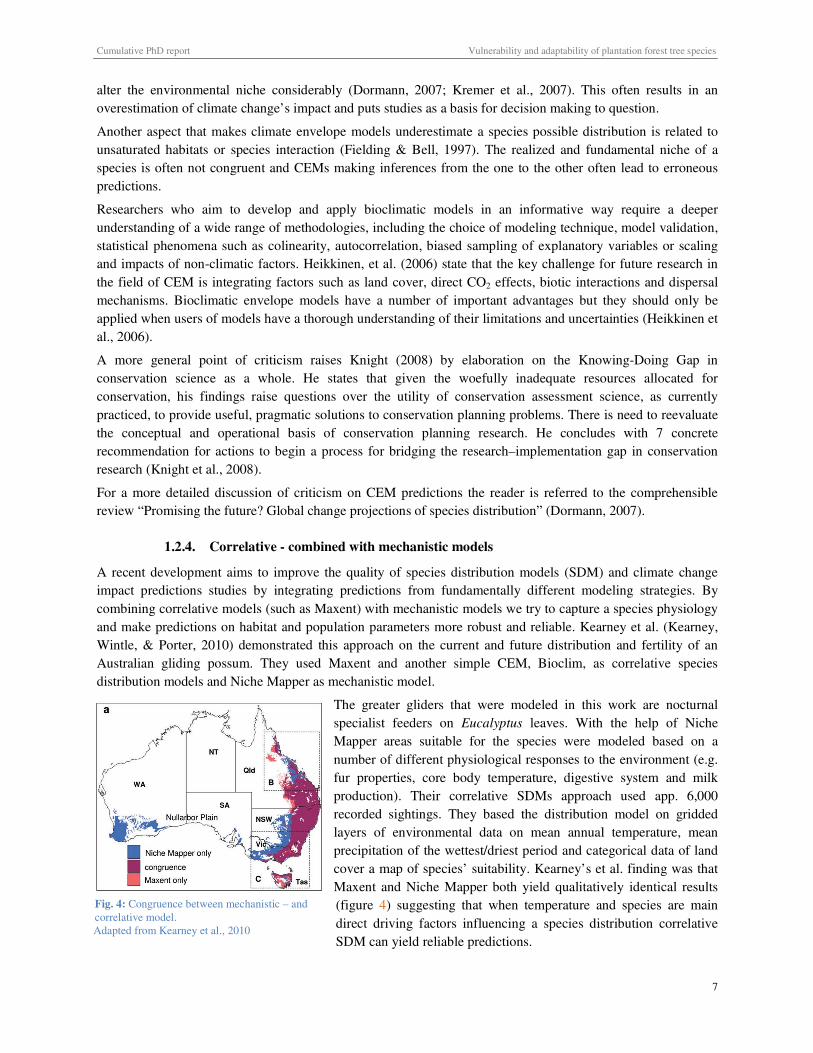
accessible data which can be obtained during common forest inventories. Figure 5 gives a schematic overview
of the process how forest growth models can facilitate decisions in sustainable forest management by giving a
realistic resource forecast.
The studies that form this cumulative PhD thesis deal with pure even-aged pine stands. The statistic modeling
techniques we implemented therefore do not apply for forest stands with trees of many ages or many species.
For possible solutions towards the realistic estimation of growth and stand dynamics in mixed forests the reader
is referred to Vanclay’s comprehensive work on “Modeling forest growth and yield: applications to mixed
tropical forests” (Vanclay, 1994).
1.3.1. Statistical models vs process based models
The three studies discussed in this report make use of statistical, correlative techniques to predict suitability of
species occurrence or as in the later two studies, to predict height growth under different environmental
conditions. These correlative techniques are very helpful when there is no, or not sufficient data on the studied
species’ physiology available. Process based models which rely on this physiological data are next to correlative
approaches the second important school of forest growth models. These process based models can be defined as
mathematical representations of biological systems that incorporate our understanding of physiological and
ecological mechanisms into predictive algorithms (Johnsen, Samuelson, Teskey, McNulty, & Fox, 2001).
There are many such models available and they are frequently used in yield predictions studies, which were still
mainly undertaken in a research context (3PG, Yield-Safe, FinnFor, CABALA, Formix 3-Q to name only a
few). Louw expects that the simulation of ecological processes influencing tree growth will, in future, receive
preference over the use of discrete site variables to predict the growth of trees (Louw, 1999). Nevertheless, the
prevalent perception remains that process based models are suited only for research applications and that
management questions will be solved primarily by using descriptive empirical models (Battaglia & Sands,
Fig. 5. The role of growth models and complementary data in providing decision support.
Adapted from Vanclay, 1994
Cumulative PhD report Vulnerability and adaptability of plantation forest tree species
9
1998). The reason for this impression lies mainly in the high demand process based models still have in terms of
quality and quantity of input data.
Matala et al. in their “Comparison of a physiological model and a statistical model for prediction of growth and
yield in boreal forests” (2003) assessed the structural and functional properties of a physiological model
(FinnFor) and a statistical model (Motti). They analyzed these two different model concepts in order to ascertain
whether a physiological process based model would provide the same prediction capacity as a statistical model,
which is based on long-term inventory data. The three criteria used for comparison were (1) stand-level
variables, (2) analysis of volume growth graphs, and (3) stand structure variables. The study comprised data for
Pinus sylvestris, Picea abies and Betula pendula all growing on medium-fertile sites in central Finland. Matala
et al. found that in general, the outputs of the models agreed well in terms of relative growth rates regardless of
tree species, with the implication that both models predicted competition within a stand and the effect of
position on tree growth in a similar way. The statistical model was stable in its predictions, but not as sensitive
to initial stand conditions as that based on physiological processes. Nevertheless it can be said that the two
models agreed well in their dynamics and predictions. This lead Matala to recommend that some elements of
process-model thinking could be incorporated into statistical models in order to make these responsive to
changing conditions (Matala et al., 2003).
Where detailed data from growth inventories are available statistical models can be used but especially where
the effect of different management options is to be analyzed, process based models react more sensitively to
changes in input parameters. Mechanistic models can be used to evaluate the impacts of thinning on mixed
species stands for example and multiple silvicultural regimes can be assessed without expensive and time-
consuming field trials (Bartelink, 2000). To benefit from the advantages of both model types so called hybrid
models are developed. These models are a mix of process-based and correlative models and can avoid some of
the shortcomings of both approaches. Hybrid models include a mechanistic description of the environmental
influences into a statistical growth and yield model. Hybrid models provide an increase in biological realism
over simple empirical growth models, yet do not require the level of parameterization of process-based models
(Mäkelä et al., 2000).
For a brief discussion of the comparison of process based models and correlative models for the estimation of
species distributions see also section 1.2.4.
1.3.2. Evaluation of forest growth models
An important part of any model building process is its evaluation in terms of how well it reflects the reality and
how well does the model enable us to make realistic predictions and forecasts. Validation and verification are
two important parts of this evaluation. The two step evaluation-process translates in forest growth modeling into
qualitative (verification) and quantitative (validation) tests (Vanclay & Skovsgaard, 1997). Vanclay and
Skovsgaard suggest the following framework to evaluate the quality of growth models: Examine (1) logic and
biologic assumptions, (2) statistical properties, (3) characteristics of errors, (4) residuals of the model, and (5)
conduct a sensitivity analyses.
Evaluation should not come as an afterthought to the model construction, but should be considered at every
stage of model building; during its conception, its design and construction. Primarily evaluation bases on
regression techniques (Vanclay & Skovsgaard, 1997). The quality demands on a model in terms of logic
structure and from theoretical and biological views are the following: Assumptions should be parsimonious,
biologically realistic, consistent with existing theories of forest growth, and the model should be able to predict
sensible responses to management actions.
The site quality models we developed for “Adaptation of tropical and subtropical pine plantation forestry to
climate change: Realignment of Pinus patula and Pinus tecunumanii genotypes to 2020 planting site climates“
(Leibing et al., 2009) and “Selection of Provenances to Adapt Tropical Pine Forestry to Climate Change on the
Basis of Climate Analogs” (Leibing et al., 2013) do not meet all of the above mentioned criteria. The reason for
Cumulative PhD report Vulnerability and adaptability of plantation forest tree species
10
this lies in the scope of these studies. Their target was not the realistic prediction of different silvicultural
management regimes. Furthermore, we dealt with in terms of species and age homogeneous stands and not with
heterogeneous natural forests. This made the prediction of growth potential less complicated and following the
parsimonious criteria some of Vanclay and Skovsgaard’s quality criteria for model evaluation could be
neglected.
1.3.3. Challenges for practical implementation
The most basic approach towards modeling forest yield is to make inferences from a site’s historic tree growth.
Historic growth records build the basis for a site index which is thought to inform about future yield
expectations. These traditional growth and yield models have the common disadvantage that they must assume a
site index to remain constant and are therefore insensitive to changes in environmental, site or silvicultural
conditions. This school of models might appear too simplistic and unrealistic but still today these are the
principal yield models used in forest management (Johnsen et al., 2001).
There exist, as discussed earlier, the modern process based models that try to realistically reflect important
parameters for tree growth such as rates of photosynthesis and stomatal conductance. They basically attempt to
estimate carbon gain at the cellular level and model the carbon balance of leaves based on calculated
microclimates within the canopy, canopy architecture, leaf area, leaf type (sun, shade) and the resource
composition of various portions of the canopy (Johnsen et al., 2001). This already makes clear why many
process based models are not suited for practical implementation. Simpler model versions that try to aggregate
processes and by this reduce data demand might be more applicable in a forestry management context.
Already today growth cannot be reliably predicted from past performance. Eutrophication from industrial
activities or climate change altered the abiotic environment in a way where future growth rates cannot be
accurately predicted from site indices. One good example for this are the intensively managed southern pine
plantations. By using competition control, fertilization, and superior genotypes, productivity increased in these
stands threefold (Borders & Bailey, 2001).
A way out of the trap between static site index models and complex process based models offer site quality
models that are not derived from past performance data but from biophysical climate and edaphic variables
(Ung et al., 2001). The underlying assumption is that the relation between height and age of the dominant trees
depends principally on a site’s bioclimatic set-up (degree days, aridity index and precipitation) and edaphic
properties (e.g. soil water holding capacity). Biophysical site index models based on this assumption enable us
to consistently predict site potentials under diverse- and changing conditions. This school of models is the
nearest equivalent to the height growth and site quality models we developed for Pinus patula and Pinus
tecunumanii in the second (2.2) and third (2.3) study. I will present the approach and methodology of these
studies in greater detail in the following paragraph.
2. The published manuscripts in context of the current research agenda
This chapter aims to put the publications which constitute the cumulative PhD thesis in context of the current
research agenda. The first study (van Zonneveld et al., 2009) evaluates techniques that estimate the persistence
of natural populations in the face of climate change. The second and third study (Leibing et al., 2013, 2009)
focus on climate change effects on growth potentials in productive forest plantations. The underlying research
question is how GxE can best be exploited by adapting the choice of seed material to future climate conditions.
Cumulative PhD report Vulnerability and adaptability of plantation forest tree species
11
2.1. Climate change impact predictions on Pinus patula and Pinus tecunumanii
populations in Mexico and Central America
Before the first study will be discussed I will give a brief and general overview over the expected impacts of
climate change on natural tree stands.
One major threat climate change poses on natural forest stands, is the exacerbation of migration problems of
marginal populations in fragmented landscapes (Mátyás et al., 2009). The unprecedented rate, at which the
abiotic environment changes, will exceed the migration speed of many tree species and may therefore threaten
the survival of valuable seed sources (Davis & Shaw, 2001). Climate change is further likely to alter species
composition (Dukes & Mooney, 1999) and negatively affect plant-herbivore relationships (Coley, 1998). These
alterations combined with anthropogenic pressure from habitat fragmentation, put natural population of many
tree species at risk.
In this context the study “Climate change impact predictions on Pinus patula and Pinus tecunumanii
populations in Mexico and Central America” aims to ascertain the impact of climate change on the persistence
of the natural populations of the two closed-cone pine species at their natural locations. Possible negative
impacts on populations should concern the forestry sector, as in the form of seeds, these are the source of
genetic diversity used to sustain and improve plantation productivity under both present and future conditions
(Dvorak et al., 2008). Natural stands of important plantation species hold the genetic variability needed to keep
the species adaptable to new climatic conditions. Information is needed that helps to identify where most
valuable genetic variations can be found and which seed sources will be under highest risk.
2.1.1. Objectives
The objective of the study was to evaluate the impact of climate change on the persistence of the natural
populations of P. patula and P. tecunumanii species at their actual locations in order to inform about appropriate
conservation actions. We aimed to (1) assess the adaptive ability of the two pine species based on the
evaluations of provenance trials and (2) use the results of these field trials to validate CEM impact assessment
studies on provenance collection sites in the wild.
2.1.2. Own contribution
The first step that laid the foundation for this study was the development of a work plan which formed the basis
for collaboration between the three institutes: Bioversity International, CIAT and Camcore. I developed this
work plan in May 2007 during my stay as visiting researcher at Bioversity International’s Americas office in
Cali, Colombia. This original plan was structured into three phases of which two were relevant for the studies
summarized in this report:
Phase 1
� Determine bioclimatic profiles for the two pine species based on their natural ranges, supplemented with climatic data from localities where the species have been successfully tested as exotics.
� Use DIVA GIS tool and its climate envelope modeling tool Bioclim in order to identify appropriate planting/collection sites for P. patula and P. tecunumanii.
� Investigate the impact climatic change on the species natural distribution, using the CCM3 global
circulation model.
Phase 2
� Determine the response (for wood volume production) of the two species and provenances to major climatic variables (average daily temperature, mean annual precipitation). Assess the extent of provenance x environment interaction.
� Identify options for selecting provenances with low provenance x environment and/or better adaptability to changed climates (higher temps, reduced precipitation).
Cumulative PhD report Vulnerability and adaptability of plantation forest tree species
12
� Assess the overall impact of two different climate scenarios on growth rates and productivity at sites
where the two species are being commercially grown.
[…]
The work plan was approved by the three participating institutes in June 2007 and subsequently Camcore shared
the provenance trial data for P. patula and P. tecunumanii with Bioversity and CIAT.
During my seven months stay at Bioversity International in 2007 I validated the province and trial location data
following Hijman’s suggestions (1999) and developed CEMs for the provenance location data. I noted that the
models rarely predicted sites to be suitable where the species was proven to successfully grow if planted. I
further elaborated on this finding by comparing climate ranges where the species exists in the wild with ranges
where the species was planted. Provenance trials were clearly planted outside the climatic ranges where the
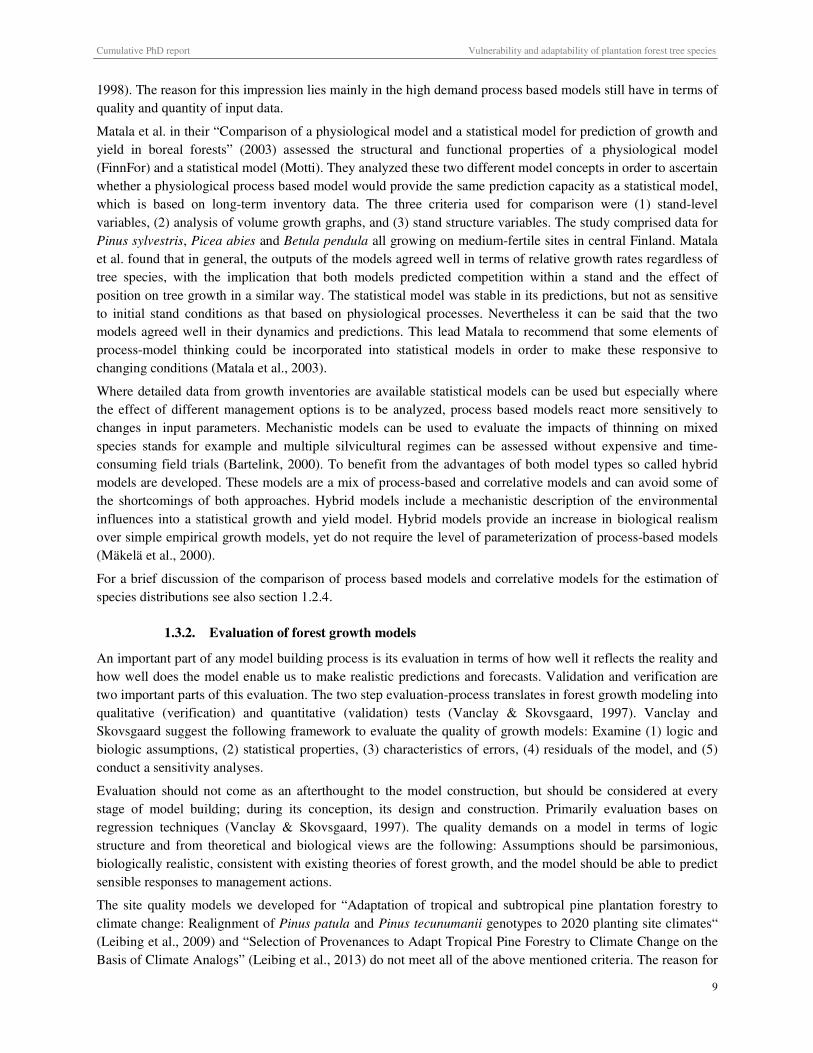
pines grow naturally. The result of this simple comparison between ecological niches can be seen in figure 6.
I then applied the AUC technique to CEM results and found that this classic validation approach yielded
excellent results for the niche model of P. tecunumanii and P. patula. But these high AUC scores well above 0.9
seemed to contradict the fact that trial growth and survival data indicated for both species stable growth rates
outside the species’ ecological niche. The CEMs did not seem to fulfill their purpose to realistically describe
areas and climates where the species is able to grow. This finding led to the development of the translocational
validation approach (see section 2.1.3).
I assisted Maarten van Zonneveld, German Lema and Andy Jarvis with the design of the appropriate
methodology and selection of statistical techniques to test CEM results against provenance trial performance.
We collaboratively conceptualized the methodology and addressed the comments of two peer-reviewers.
Fig. 6: Two dimensional linear combinations of variable range limits for natural pine habitat (in black) and the climatic ranges in which the field trials were established (in grey).
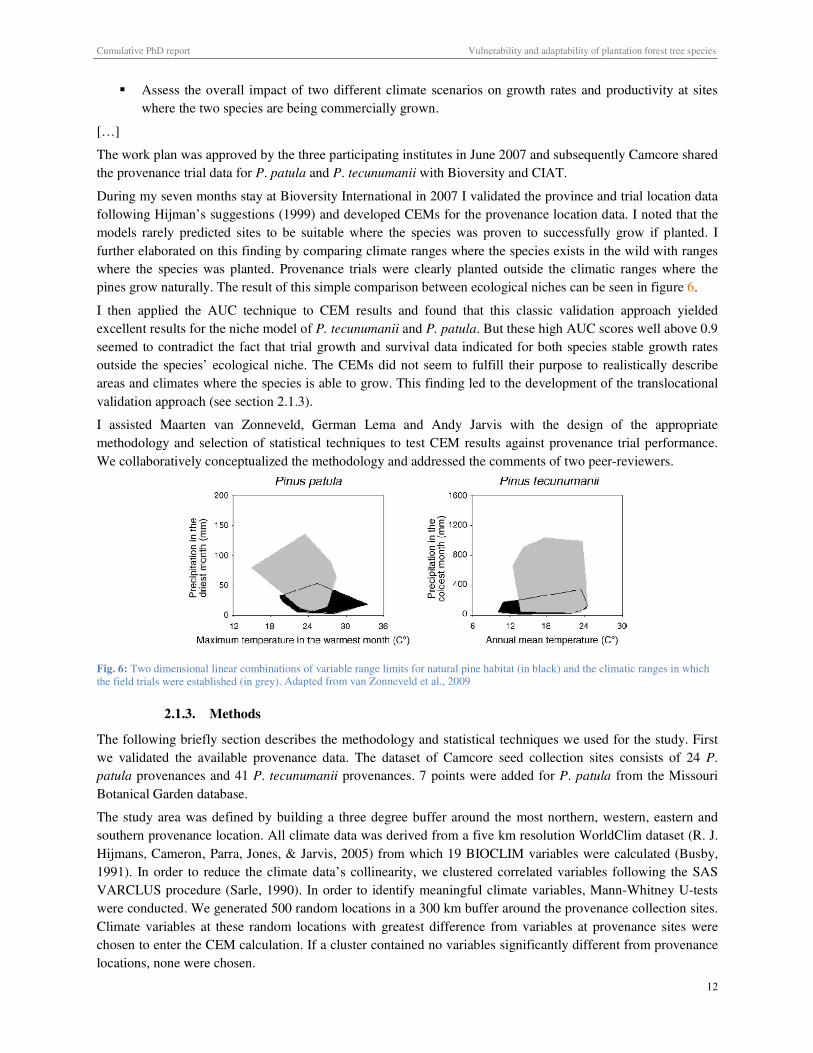
2.1.3. Methods
The following briefly section describes the methodology and statistical techniques we used for the study. First
we validated the available provenance data. The dataset of Camcore seed collection sites consists of 24 P.
patula provenances and 41 P. tecunumanii provenances. 7 points were added for P. patula from the Missouri
Botanical Garden database.
The study area was defined by building a three degree buffer around the most northern, western, eastern and
southern provenance location. All climate data was derived from a five km resolution WorldClim dataset (R. J.
Hijmans, Cameron, Parra, Jones, & Jarvis, 2005) from which 19 BIOCLIM variables were calculated (Busby,
1991). In order to reduce the climate data’s collinearity, we clustered correlated variables following the SAS
VARCLUS procedure (Sarle, 1990). In order to identify meaningful climate variables, Mann-Whitney U-tests
were conducted. We generated 500 random locations in a 300 km buffer around the provenance collection sites.
Climate variables at these random locations with greatest difference from variables at provenance sites were
chosen to enter the CEM calculation. If a cluster contained no variables significantly different from provenance
locations, none were chosen.
Adapted from van Zonneveld et al., 2009
Cumulative PhD report Vulnerability and adaptability of plantation forest tree species
13
The climate data for future conditions was extracted using Diva-GIS (R. Hijmans, Cruz, Rojas, & Guarino,
2001) from HADCM3, CCCMA climate model outputs for the year 2050 under the moderate emission scenario
A2a (Solomon, 2007). The machine learning algorithm MAXENT was used to develop the CEM for current and
2050 climate conditions. We conducted a Chi-square test to find out if under future climate conditions the
change in suitable area was significant. MAXENT’s probability values at provenance locations were extracted
using Diva-GIS and an AUC was calculated.
In the key part of this study, the translocational validation, we correlated CEM-generated suitability values for
natural occurrence with observed height growth and survival at provenance trials which were established in a
climate that matched with the climate at provenance locations. To identify sites with similar climates we
calculated Euclidean Distances between provenance sites and field trials. As a threshold to define if a
provenance site is a match to a trial site, 10 % of the smallest climate distances between natural provenances
locations were used. If more than one trial was identified as a match the average height- and survival growth
was calculated and used for the correlation.
To ascertain the natural and potential ranges of adaptive ability, two dimensional linear limits of variable ranges
were developed. These simplified climatic envelopes compare climatic range at provenance locations to
combinations of variable range limits at trial sites (figure 6).
2.1.4. Key findings
The key findings in terms of climate variable selection were that 5 climate parameters groups were clustered
from the initial 19 climatic variables. The Mann-Whitney U-Test helped to effectively reduce the input variables
that were fed into the CEM. It is important to note that this selection does not aim to identify important
physiological factors that constrain the species’ distribution. The aim was simply to identify a set of statistical
meaningful climate variables that best describe the species distribution data.
In terms of AUC values the CEM for both species performed excellent. MAXENT runs with climate data
derived from GCMs predict a significant decline in the number of suitable provenance collection sites for P.
patula and P. tecunumanii (fig. 3).
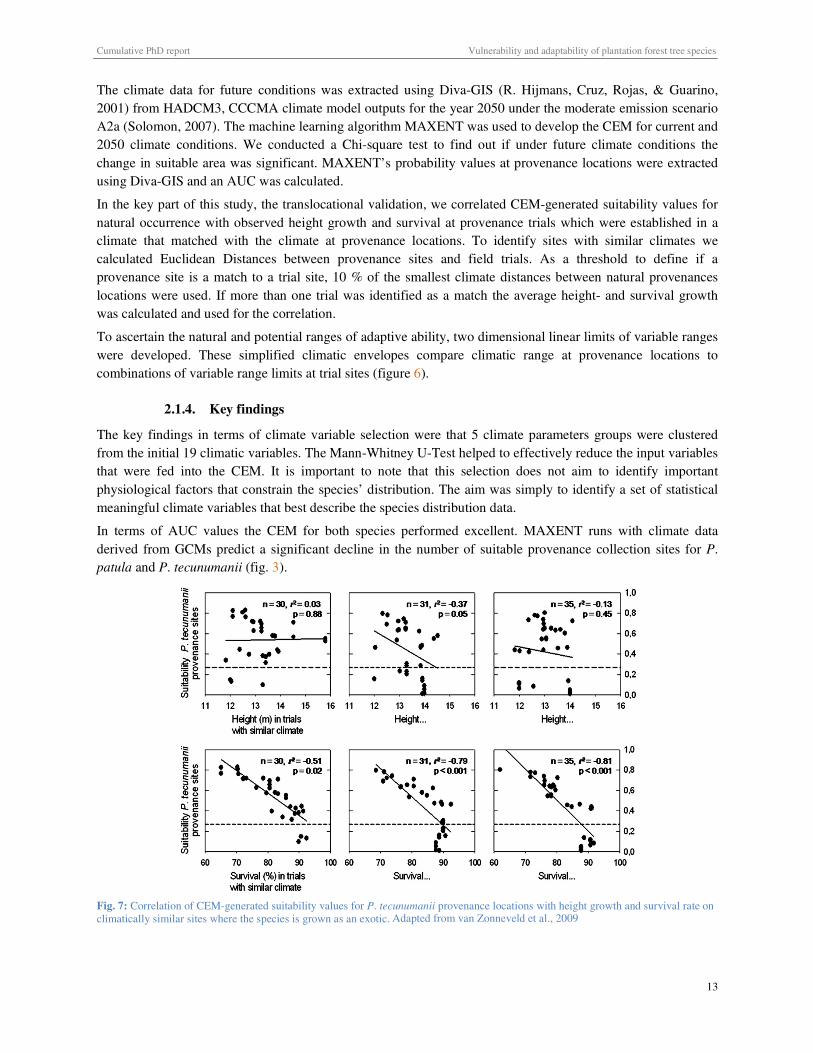
Fig. 7: Correlation of CEM-generated suitability values for P. tecunumanii provenance locations with height growth and survival rate on climatically similar sites where the species is grown as an exotic. Adapted from van Zonneveld et al., 2009
Cumulative PhD report Vulnerability and adaptability of plantation forest tree species
14
Interestingly enough CEM-assigned suitability values for natural pine occurrences did neither correlate
positively with height nor with survival at climatically similar trial sites (figure 7). Both species appear to be
adapted to a wider climatic niche than their natural distribution suggests.
2.1.5. Conclusion
The results clearly indicated that CEM results tend to underestimate the ability of pine provenances to thrive
under climates they do not encounter within their natural distribution range. We have to denote however that in
field trials where weeds are controlled and trees are planted as seedling, a species may perform well in a wider
range of environmental conditions compared to its natural habitat. In a species’ natural distribution range trees
have to propagate via natural regeneration which may somehow limit their ecological niche. We are going to
elaborate this point in greater detail in section “3.2.1 Performance in trials compared to survival in natural
populations”.
The data depicted in the scatter plots in figure 7 leave us confident to conclude that the investigated wild pine
stands are likely to persist through substantial changes in climate. For the time being land use changes inside the
species natural distribution range, urbanization, habitat fragmentation and livestock expansion appear to be
more urgent threats to the species than climate change.
2.2. Adaptation of tropical and subtropical pine plantation forestry to climate change:
Realignment of Pinus patula and Pinus tecunumanii genotypes to 2020 planting site
climates
Not only natural tree habitat’s but also planted forests are likely to be profoundly affected by altered
precipitation and temperature regimes. More severe abiotic calamities such as cyclones with high peak wind
speeds (Elsner, Kossin, & Jagger, 2008), wildfires (Wheaton, 2001) and droughts (Burke, Brown, & Christidis,
2006) are likely to threaten planted forests and put yield levels under pressure.
The International Tree Conservation & Domestication Program (Camcore), North Carolina State University,
established large, multisite provenance trials. The data provide height and diameter growth for two P. patula
varieties and two P. tecunumanii ecotypes. The measurements from these multisite provenance trials hold
valuable information about seed choice for plantation establishment in time of rapid environmental changes. We
developed a site quality model that statistically relates growth to environmental factors and couples the
predictions to the average 2020 climate projections of four GCMs.
2.2.1. Objectives
The aim of this study was to test the suitability of seed material under changing climate of the two P. patula
varieties P. patula var. patula and P. patula var. longipedunculata and P. tecunumanii highland- and lowland
ecotype. Our objective was to (1) predict the impact of climate change on wood productivity for new rotation
cycles that have an expected harvest time around 2025, and (2) identify the most suitable variety and ecotype of
P. patula and P. tecunumanii, respectively, to optimize wood productivity under new rotation cycles.
2.2.2. Own contribution
I conceptualized the study and principally developed the methodology. After a detailed literature research on
climate change impacts studies and model building techniques I developed the idea to use centered squared
value of environmental variables for the regression analysis. I presented the concept at the international seminar
“Bosques Tropicales y Desarrollo” in December 2008 in Colombia, Medellin when first preliminary results
were available. More mature results were later presented on the IARU International Scientific Congress on
Climate Change, Copenhagen in preparation to the Conference Of Parties (COP 15) in 2009. In April 2009,
assisted by my co-authors, I wrote the manuscript and submitted the original research article to the
Cumulative PhD report Vulnerability and adaptability of plantation forest tree species
15
“Scandinavian Journal of Forest Research”. From May to November 2009 the article was in peer review. I
improved the manuscript following the suggestions from two anonymous reviewers until the article was
accepted for publication in December 2009.
2.2.3. Methods
The dataset for this study comprises 153 provenance trials which were established by Camcore between 1981
and 1997 in Colombia, Brazil and South-Africa (Dvorak, Donahue, & Vasquez, 1995). The validation of
Camcore data showed errors in some of the geo-referencing. Site description did not match the information
obtained following the suggestions from Hijmans, et al. (1999). These errors needed to be corrected since they
could have seriously altered the results of the subsequent regression analyses. We extracted climate parameters,
variables on water balance, and soil and topography data at trial locations using ArcGis. Data sources for the
environmental data were WorldClim (R. J. Hijmans et al., 2005), for the Tropical Rainfall Measuring Mission
(TRMM), the FAO Harmonized World Soil database (FAO & ISRIC, 2010) and digital elevation data (Jarvis,
Reuter, Nelson, & Guevara, 2009). All variables, except those related to water balance from TRMM, were
rescaled to raster data with a resolution of 30 arc-seconds. TRMM data was kept in its original resolution of 15
arc-minutes.
Tab. 1: List of environmental variables used to build the site growth models.
The study was restricted to areas that have a similar bioclimatic set-up as the locations where trials were
planted. The grid that was calculated to restrict the study area only contains locations where the 19 Bioclim
variables (table 1) are in between maximum and minimum values of the values at trial sites.
In order to develop the site growth prediction models we built multiple linear regressions (MLR) models with
centered normalized squared predictor variables. We used the forward stepwise regression method to identify
statistically significant correlations between site growth and environmental variables. The linear regression
models were cross-validated by setting 20 % of the data aside for model testing. The adjusted coefficient of
determinations of the correlation (R2) served as indicator for the quality of the model.
Adapted from Leibing et al., 2009
Cumulative PhD report Vulnerability and adaptability of plantation forest tree species
16
Based on the MLR models the ArcGis grid calculator was used to derive a spatial prediction of height growth.
The equations used to derive the spatial predictions had the general form:
�ℎ�8 = �� + �� + ���� + ⋯ �������� = 1,2,… �
where �ℎ�8 is predicted average height performance at age 8, �� is the intercept, � is the Pearson’s correlation
coefficient with the dependant of first environmental variable, � is the value of first environmental
variable[...],�� is Pearson’s correlation coefficient with the dependant of nth environmental variable, and �� is
the value of nth environmental variable.
To calculate the climate change projection grids we used the outcomes of four GCMs and two emission
scenarios. The GCMs available for this study were Canadian Centre for Climate Modeling and Analysis
(CCCMA), Commonwealth Scientific & Industrial Research Organization (CSIRO), Hadley Centre Coupled
Climate Model (HADCM) and National Institute for Environmental Studies (NIES). We calculated, based on
the developed MLR models, height growth under current and future climate by 2020. Changes in performance
for the best seed choice under current and future climate conditions were tested for their significance based on
the results of a t-test. This approach showed where an adapted planting decision was predicted to bring
significant improvement in height growth.
2.2.4. Key findings
Three of the four developed models were significant and robust. No reliable model could be developed for P.
patula var. longipedunculata. Under current climate P. tecunumanii low elevation provenances are predicted to
exhibit fastest growth in the majority of the study area. Overall climate change until 2020 is not changing height
growth significantly. Nevertheless, in 7.3 % of the study area the current best seed changes under novel climate
conditions of the year 2020.
This underlines two facts: (1) provenances are indeed adapted to their specific environmental conditions; and (2)
it is important to conserve a wide range of seed sources to sustain the value of diversity for plantation forestry in
heterogeneous environments and in face of changing site conditions.
2.2.5. Conclusion
Among others Spittlehouse suggests significant production losses if forestry does not adapt their management to
climate change (e.g. D. Spittlehouse, 2008). The developed site quality models for two P. tecunumanii ecotypes
and P. patula var. patula were statistically significant. Especially the goodness to fit (R2 adj.) of the model for the
P. tecunumanii lowland ecotype was excellent. Due to the ecotype’s good survival and fast growth in warm and
wet climates, these seed sources are likely to become more important in the near future.
Results of these and similar growth models based on geophysical site parameters may provide valuable decision
support and help in the development of site-specific models for plantation forestry in general and pine
plantations specifically.
2.3. Selection of provenances to adapt tropical pine forestry to climate change on the
basis of climate analogs
2.3.1. Objectives
In the study “Selection of Provenances to Adapt Tropical Pine Forestry to Climate Change on the Basis of
Climate Analogs” we assessed if the computation of climate dissimilarities can provide specific
recommendations to adapt planted forests to climate change through a better use of forest genetic resources. By
statistically relating trial’s growth performance to climate dissimilarities between pairs of sites we aimed at
identifying appropriate seed material of P. patula and P. tecunumanii in Colombia, Brazil and South Africa.
Cumulative PhD report Vulnerability and adaptability of plantation forest tree species
17
We compared two different approaches to measure climate dissimilarities and evaluated which approach
correlates better with provenance height growth. In a second step we aimed to show that dissimilarity measures
correlated with height growth can be used to identify well-adapted provenances to specific site conditions. This
approach ideally demonstrates the potential and the restrictions in the application of climate analogues to
support management plans with the aim to adapt existing and planned forest plantations.
2.3.2. Own contribution
As principal author of this study I developed the idea to use the climate analogue tool with the Camcore dataset.
With the help of Maarten van Zonneveld and Andy Jarvis I conceptualized the methodology and ran the data
intensive climate dissimilarity calculations on the workstations available in the DAPA centre in CIAT, Cali
Colombia. After approximately two months of model runs I derived the results and drew technical conclusions
together with my co-authors which led to the development of the original research article. The manuscript was
submitted to the journal “Forests” in August 2012. In the subsequent months I lead the peer-review process and
addressed the comments and suggestions of four anonymous reviewers. The article was accepted in February
2013 and published in March 2013.
2.3.3. Methods
As in the two studies before the data basis were the Camcore trials comprising growth data from 153 geo-
references provenance trials. In order to break down the analysis from the species- or subspecies- to the
provenance level we had to decide how many repetitions were sufficient to make a meaningful analysis of the
relation between climate distances and differences in growth performance. We decided to only consider
provenances that were planted in at least 6 different locations. Overall the number of repetitions on provenance
level in the data chosen for the analysis ranged from 6 to 22. From the original 153 trials, 100 remained under
this criterion and the selected data comprised height measurements of 10 different provenances.
The Analogue method we used to calculate climate dissimilarity was jointly developed by the Walker Institute
at the University of Reading, CIAT and the Climate Impacts Group at the University of Leeds. The WorldClim
climate data we used for the dissimilarity calculation had a resolution of 5- arc minutes. This equals a pixel size
of approximately 85 km2. For the impact analysis of climate change on provenance selection the results of an
ensemble of 15 GCMs and three SRES emission scenarios was used. As in the previous study (cf. section 2.2)
we restricted the study area by a simple climate envelope. Furthermore all protected areas were excluded from
the study (figure 2).
We calculate dissimilarity values for each provenance and pixel inside the study area. The formula by which
dissimilarity values between any pair of site were calculated reads
������������ !���" = ���#$%&'$ ( ) �*+,-�*+.,/%&'01,2�
,23*,- − *.,/%&'01 56 + 37,- − 7.,/%&'01 568
6
where �*+ is diurnal temperature range, * is temperature, 7 is precipitation, � is month, � is present and � is
future. The 9 parameter can be varied to perform a sensitivity analysis, but, in this study, the z parameter was
kept constant at 2 to calculate standard Euclidean distances. We termed the calculated value “dissimilarity” and
not “similarity” simply to follow the logic where a higher value of CCAFS climate dissimilarity indicates a pair
of sites that is climatically more different from one another.
To assess if climate dissimilarity correlates to differences in height growth we use for each provenance the best
performing site as a reference point and calculated for each provenance one dissimilarity grid. If our hypothesis
is true, the differences in height performance relative to the best trial should show a significant correlation with
the dissimilarity value for each of the inferior trials where the provenance was planted (figure 8). For
clarification purposes let me give an example with the help of the scatter plot in figure 8. The point marked with
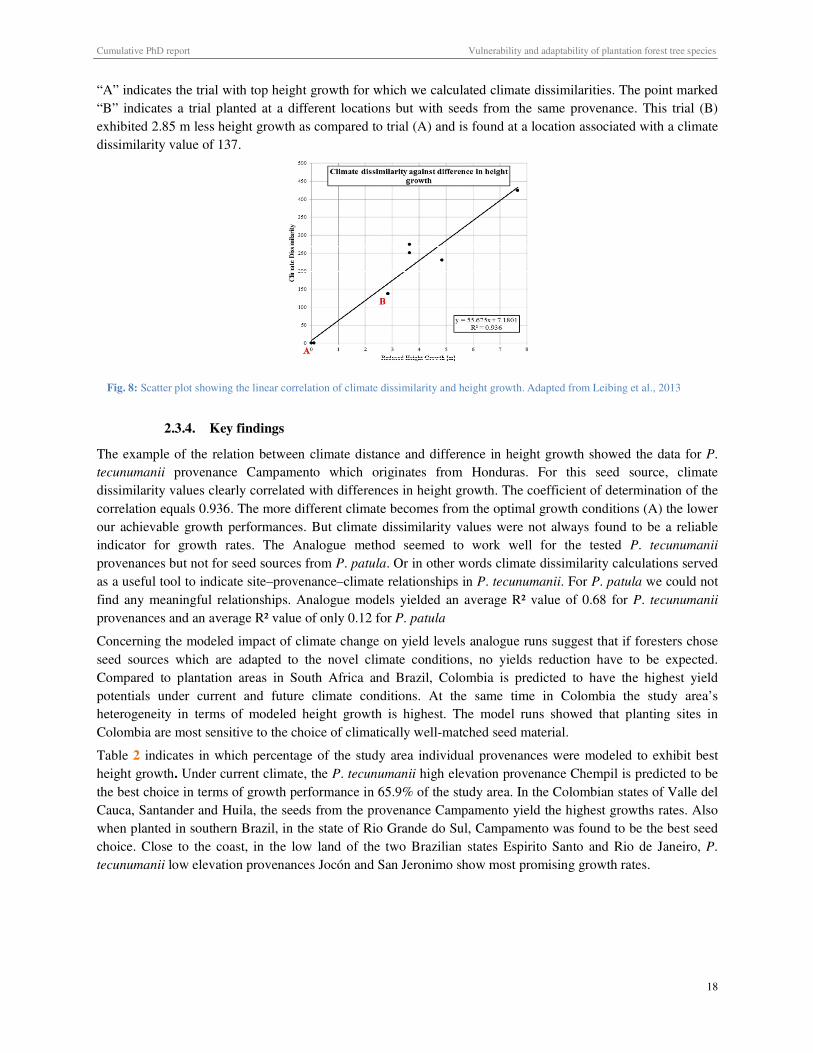
Cumulative PhD report Vulnerability and adaptability of plantation forest tree species
18
“A” indicates the trial with top height growth for which we calculated climate dissimilarities. The point marked
“B” indicates a trial planted at a different locations but with seeds from the same provenance. This trial (B)
exhibited 2.85 m less height growth as compared to trial (A) and is found at a location associated with a climate
dissimilarity value of 137.
2.3.4. Key findings
The example of the relation between climate distance and difference in height growth showed the data for P.
tecunumanii provenance Campamento which originates from Honduras. For this seed source, climate
dissimilarity values clearly correlated with differences in height growth. The coefficient of determination of the
correlation equals 0.936. The more different climate becomes from the optimal growth conditions (A) the lower
our achievable growth performances. But climate dissimilarity values were not always found to be a reliable
indicator for growth rates. The Analogue method seemed to work well for the tested P. tecunumanii
provenances but not for seed sources from P. patula. Or in other words climate dissimilarity calculations served
as a useful tool to indicate site–provenance–climate relationships in P. tecunumanii. For P. patula we could not
find any meaningful relationships. Analogue models yielded an average R² value of 0.68 for P. tecunumanii
provenances and an average R² value of only 0.12 for P. patula
Concerning the modeled impact of climate change on yield levels analogue runs suggest that if foresters chose
seed sources which are adapted to the novel climate conditions, no yields reduction have to be expected.
Compared to plantation areas in South Africa and Brazil, Colombia is predicted to have the highest yield
potentials under current and future climate conditions. At the same time in Colombia the study area’s
heterogeneity in terms of modeled height growth is highest. The model runs showed that planting sites in
Colombia are most sensitive to the choice of climatically well-matched seed material.
Table 2 indicates in which percentage of the study area individual provenances were modeled to exhibit best
height growth. Under current climate, the P. tecunumanii high elevation provenance Chempil is predicted to be
the best choice in terms of growth performance in 65.9% of the study area. In the Colombian states of Valle del
Cauca, Santander and Huila, the seeds from the provenance Campamento yield the highest growths rates. Also
when planted in southern Brazil, in the state of Rio Grande do Sul, Campamento was found to be the best seed
choice. Close to the coast, in the low land of the two Brazilian states Espirito Santo and Rio de Janeiro, P.
tecunumanii low elevation provenances Jocón and San Jeronimo show most promising growth rates.
Fig. 8: Scatter plot showing the linear correlation of climate dissimilarity and height growth. Adapted from Leibing et al., 2013
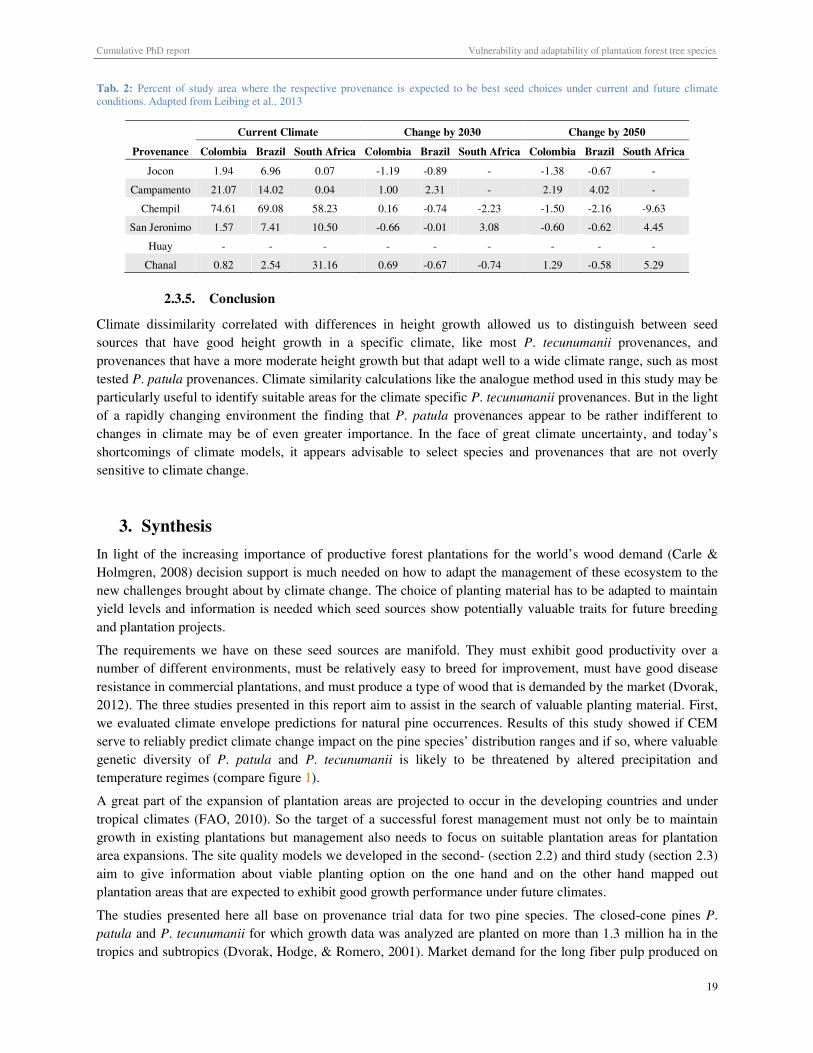
Cumulative PhD report Vulnerability and adaptability of plantation forest tree species
19
Tab. 2: Percent of study area where the respective provenance is expected to be best seed choices under current and future climate conditions.
Current Climate Change by 2030 Change by 2050
Provenance Colombia Brazil South Africa Colombia Brazil South Africa Colombia Brazil South Africa
Jocon 1.94 6.96 0.07 -1.19 -0.89 - -1.38 -0.67 -
Campamento 21.07 14.02 0.04 1.00 2.31 - 2.19 4.02 -
Chempil 74.61 69.08 58.23 0.16 -0.74 -2.23 -1.50 -2.16 -9.63
San Jeronimo 1.57 7.41 10.50 -0.66 -0.01 3.08 -0.60 -0.62 4.45
Huay - - - - - - - - -
Chanal 0.82 2.54 31.16 0.69 -0.67 -0.74 1.29 -0.58 5.29
2.3.5. Conclusion
Climate dissimilarity correlated with differences in height growth allowed us to distinguish between seed
sources that have good height growth in a specific climate, like most P. tecunumanii provenances, and
provenances that have a more moderate height growth but that adapt well to a wide climate range, such as most
tested P. patula provenances. Climate similarity calculations like the analogue method used in this study may be
particularly useful to identify suitable areas for the climate specific P. tecunumanii provenances. But in the light
of a rapidly changing environment the finding that P. patula provenances appear to be rather indifferent to
changes in climate may be of even greater importance. In the face of great climate uncertainty, and today’s
shortcomings of climate models, it appears advisable to select species and provenances that are not overly
sensitive to climate change.
3. Synthesis
In light of the increasing importance of productive forest plantations for the world’s wood demand (Carle &
Holmgren, 2008) decision support is much needed on how to adapt the management of these ecosystem to the
new challenges brought about by climate change. The choice of planting material has to be adapted to maintain
yield levels and information is needed which seed sources show potentially valuable traits for future breeding
and plantation projects.
The requirements we have on these seed sources are manifold. They must exhibit good productivity over a
number of different environments, must be relatively easy to breed for improvement, must have good disease
resistance in commercial plantations, and must produce a type of wood that is demanded by the market (Dvorak,
2012). The three studies presented in this report aim to assist in the search of valuable planting material. First,
we evaluated climate envelope predictions for natural pine occurrences. Results of this study showed if CEM
serve to reliably predict climate change impact on the pine species’ distribution ranges and if so, where valuable
genetic diversity of P. patula and P. tecunumanii is likely to be threatened by altered precipitation and
temperature regimes (compare figure 1).
A great part of the expansion of plantation areas are projected to occur in the developing countries and under
tropical climates (FAO, 2010). So the target of a successful forest management must not only be to maintain
growth in existing plantations but management also needs to focus on suitable plantation areas for plantation
area expansions. The site quality models we developed in the second- (section 2.2) and third study (section 2.3)
aim to give information about viable planting option on the one hand and on the other hand mapped out
plantation areas that are expected to exhibit good growth performance under future climates.
The studies presented here all base on provenance trial data for two pine species. The closed-cone pines P.
patula and P. tecunumanii for which growth data was analyzed are planted on more than 1.3 million ha in the
tropics and subtropics (Dvorak, Hodge, & Romero, 2001). Market demand for the long fiber pulp produced on
Adapted from Leibing et al., 2013
Cumulative PhD report Vulnerability and adaptability of plantation forest tree species
20
the majority of this area will increase rapidly. Smurfit Kappa Colombia, Camcore member responsible for the
provenance trials in Colombia, estimates that demand for pulp from pine plantation will grow twice as fast as
demand for short fiber from Eucalyptus spp. plantations (Smurfit Kappa Colombia, personal communication
July 21, 2010). This once more emphasizes the special importance of stable and high yielding pine seed sources
and the need to identify suitable areas for plantation expansions under future climate conditions.
3.1. Implications of key findings
The most prominent finding of the three studies is that, in general, in order to be able to adapt commercial
plantation forests to expected climate change, seed sources from natural stands with the right set of traits
(drought resistance, tolerance against high temperatures etc.) have to be collected and conserved. This implies
that provenances which exhibit valuable traits have to be identified in large scale-field trials. Provenances,
populations and families of important plantation species need to be tested in a wide range of environments. In a
subsequent analysis of GxE interactions seed sources with desirable traits for climate change adaptation plans
can be identified and selected for tree conservation and breeding programs. Often valuable seed sources belong
to populations that exist at the species’ distribution margin. Unfortunately, it is in many cases these marginal
populations that are under most pressure. As in the case with P. tecunumanii, the pine is already under threat in
Central America and southern Mexico and is classified as vulnerable according to the criteria of IUCN (Hilton-
Taylor & Mittermeier, 2000). Individual populations are even critically endangered (Dvorak et al., 2000). But
the chief concerns is not only that there are many of the populations of P. tecunumanii being destroyed in
Central America and Chiapas, but that it is nearly impossible to get research amounts of seed out of Mexico.
Complex paper work and bureaucracy impede the necessary flow of genetic material. The dangers and corrupt
structures related to active drug traffic in the region make the continued easy flow of genetic material between
countries a thing of the past in Mexico (Dvorak, W. personal communication March 22, 2012). The flow of seed
material across the borders in Central America is still working fine.
Results of CEM are frequently referred to in scientific literature to direct conservation efforts and identify seeds
from provenances with valuable traits that grow at a species’ margin (R. Hijmans & Graham, 2006; Thuiller et
al., 2008). These sources and their resistance to unfavorable climates such as frequent droughts and or high
temperatures are expected to be of great value for future plantation efforts. The findings of our study “Climate
change impact predictions on P. patula and P. tecunumanii populations in Mexico and Central America”
published in Forest Ecology and Management in 2009 shed a somewhat distinct light on the validity of CEM
outcomes. The results of the CEM Maxent do not account for the true adaptive capacity of the studied pine
species. In our translocational validation we show that Camcore provenance trials are growing well in climates
that Maxent predicts to be unsuitable (fig. 7). This implies that conservation actions guided by the results of
CEM may well lead to misdirected efforts. In order to enable an efficient adaptation of forest management to
climate change, forest genetic- and ecology research has to be synthesized to better elucidate the requirements
of stability and response of forest ecosystems (Mátyás, 2006). It is important to mention that results in this sense
are not only valid for the two studied pine species. Results from provenance trials can serve as the basis for
translocational validation of CEM outcomes for other important pine plantation species (e.g. Pinus kesiya and
Pinus radiata or e.g. Eucalyptus spp). For these species the forestry industry and its research cooperatives
established multisite international provenance trials and the translocational validation method provides a way to
validate CEM outcomes. In this sense the statistical comparison of CEM results with field data from provenance
trials can help us to directly assess the true adaptive capacity of a range of important forest plantation tree
species.
The forestry sector urgently needs decision support for sustainable management under climate uncertainty
(Lindner et al., 2010; D. L. Spittlehouse, 2005). The assessment of options for intensively managed forests in
terms of regeneration, tending, harvesting, protection, conservation and planning is no easy task. The results of
“Adaptation of tropical and subtropical pine plantation forestry to climate change: Realignment of Pinus patula
Cumulative PhD report Vulnerability and adaptability of plantation forest tree species
21
and Pinus tecunumanii genotypes to 2020 planting site climates” and “Selection of Provenances to Adapt
Tropical Pine Forestry to Climate Change on the Basis of Climate Analogs” aim to facilitate a part of a decision
model for managing forests under rapid environmental change. In view of expected climate instability,
adaptability of forest trees causes serious concern due to the trees’ long lifespan compared to the rapidity of
expected changes in environmental conditions (Davis & Shaw, 2001; Mátyás, 2006). Our analogue method
enabled the distinction between species and provenances with a fast growth but a narrow climate niche and
those that are more “generalist”. When selecting a seed source for planting in the context of climate change a
forester’s choice may very well turn in favor of a lower yielding but more reliable source. This way climate
analogues could be a very valuable tool for foresters, not only helping to locate areas of highest suitability for a
timber species with desirable characteristics, but identify what kind of tree should be planted now that will be
resilient to climate changes 10 or 20 years in the future.
I would like to stress that findings from the three studies which constitute this cumulative PhD thesis could only
be derived thanks to results from the homogenous growth trials established by Camcore members. This fact
emphasizes the strategic importance of applied tree conservation programs and provenance trials to the forest
industry. In a time where rapid environmental changes are eminent these programs are indispensable and
provide a golden opportunity to get to grips with the adaptation processes of important plantation species to
climate change.
There has, however, been a general decline in the establishment of provenance trials in recent years for a variety
of reasons, including increased difficulty in international germplasm transfer (Koskela et al., 2007), their cost to
maintain and measure, greater emphasis on social issues in the forestry sector and more attention to new
technologies such as molecular marker analysis of genetic variation. Loo et al. (2011) nevertheless emphasize in
their report on the state of knowledge of climate change and forest genetic resources that these molecular
marker analysis should be seen as complementary to field trials and not as an alternative.
3.2. Critical remarks and model shortcomings
Even though we developed the methodology with great care and best available knowledge we cannot avoid that
the models suffer from a number of shortcomings. The points of criticism I will summarize in this section do not
question the validity of the previous discussed results or conclusions but aim to put the outputs somewhat into
perspective.
3.2.1. Performance in trials compared to survival in natural populations
An important point of criticism to the study “Climate change impact predictions on Pinus patula and Pinus
tecunumanii populations in Mexico and Central America” that is worth to be discusses is if we can say that a
certain performance in trials is comparable to survival in natural populations. It can be argued that we mix up
two different aspects when we look at areas where a species can compete and survive in the wild, and areas
where it can be commercially produced. We show that the species are economically viable in environments that
are different from the areas where it grows. That might be interesting albeit unsurprising if we look at common
English gardens for example. Or we might think of any major crop; they have all moved outside their areas of
origin into new environments. Thus an important research question that follows from this is why do the wild
stands of the species not fill the "commercial niche"? Is it because that niche space is simply not available in the
geographic range? Or is it because the species are out-competed by other species (or other land use)? The
answer to this question has important implications for our analysis of the species’ capacity to withstand climate
change. In the first case, our conclusions remain reasonable, in principle. In the second case they do not make
much sense, because the species will be competed out of the environments that they are not in now. If an in-
depth analysis of this issue points towards the latter, this would severely undermine our thesis. This important
point was not discussed in much detail in the published manuscript. A subsequent analysis of the niche space
where the species performed well in trials has shown that this space is not available anywhere close to the pines’
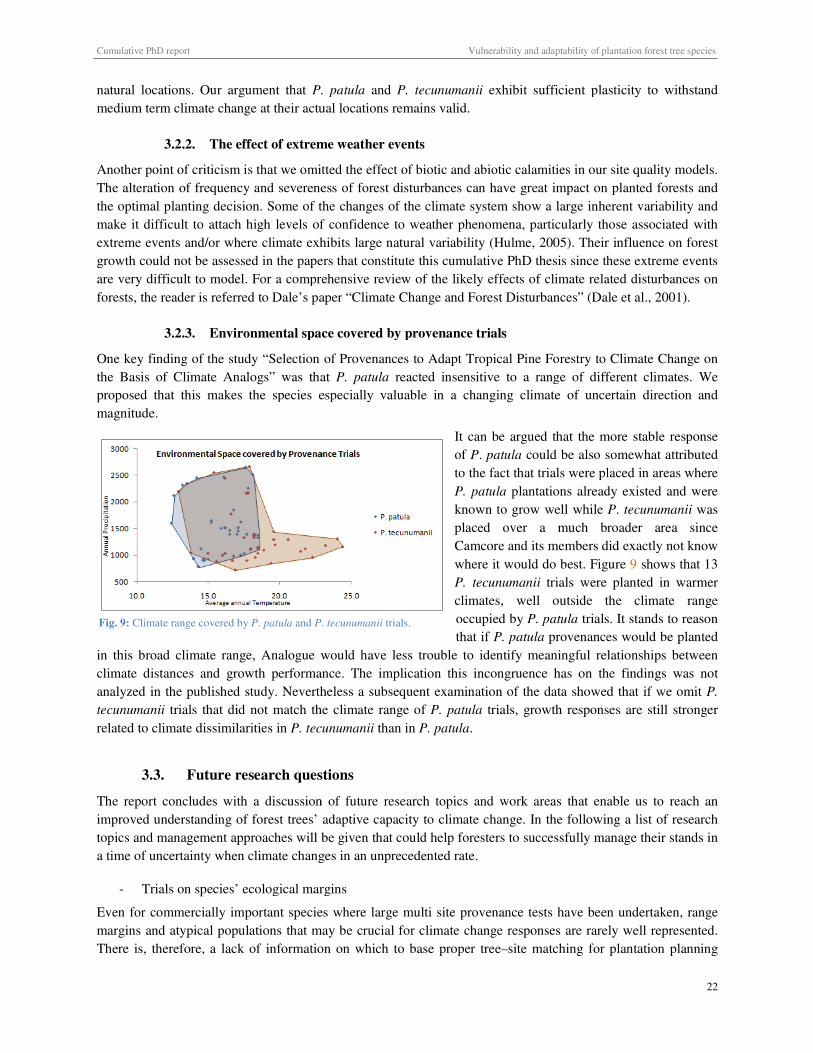
Cumulative PhD report
natural locations. Our argument that P.
medium term climate change at their actu
3.2.2. The effect of extrem
Another point of criticism is that we omit
The alteration of frequency and severene
the optimal planting decision. Some of t
make it difficult to attach high levels of
extreme events and/or where climate exh
growth could not be assessed in the pape
are very difficult to model. For a compre
forests, the reader is referred to Dale’s pa
3.2.3. Environmental spa
One key finding of the study “Selection
the Basis of Climate Analogs” was tha
proposed that this makes the species e
magnitude.
in this broad climate range, Analogue w
climate distances and growth performa
analyzed in the published study. Neverth
tecunumanii trials that did not match th
related to climate dissimilarities in P. tecu
3.3. Future research ques
The report concludes with a discussion
improved understanding of forest trees’
topics and management approaches will b
a time of uncertainty when climate chang
- Trials on species’ ecological mar
Even for commercially important specie
margins and atypical populations that m
There is, therefore, a lack of informatio
Fig. 9: Climate range covered by P. patula and P
Vulnerability and adaptability of pl
P. patula and P. tecunumanii exhibit sufficient plas
ctual locations remains valid.
eme weather events
itted the effect of biotic and abiotic calamities in our
ness of forest disturbances can have great impact on
f the changes of the climate system show a large inhe
of confidence to weather phenomena, particularly th
xhibits large natural variability (Hulme, 2005). Their
pers that constitute this cumulative PhD thesis since th
prehensive review of the likely effects of climate rela
paper “Climate Change and Forest Disturbances” (Dal
ace covered by provenance trials
n of Provenances to Adapt Tropical Pine Forestry to
that P. patula reacted insensitive to a range of diff
especially valuable in a changing climate of unce
It can be argued that the m
of P. patula could be also s
to the fact that trials were pl
P. patula plantations alread
known to grow well while
placed over a much br
Camcore and its members d
where it would do best. Figu
P. tecunumanii trials were
climates, well outside t
occupied by P. patula trials
that if P. patula provenance
e would have less trouble to identify meaningful rel
ance. The implication this incongruence has on th
rtheless a subsequent examination of the data showed
the climate range of P. patula trials, growth respons
ecunumanii than in P. patula.
estions
on of future research topics and work areas that ena
adaptive capacity to climate change. In the followin
l be given that could help foresters to successfully ma
nges in an unprecedented rate.
argins
ies where large multi site provenance tests have been
may be crucial for climate change responses are rarel
tion on which to base proper tree–site matching for
P. tecunumanii trials.
plantation forest tree species
22
lasticity to withstand
ur site quality models.
n planted forests and
herent variability and
those associated with
ir influence on forest
hese extreme events
lated disturbances on
ale et al., 2001).
to Climate Change on
ifferent climates. We
certain direction and
more stable response
somewhat attributed
placed in areas where
ady existed and were
e P. tecunumanii was
broader area since
did exactly not know
igure 9 shows that 13
re planted in warmer
the climate range
ls. It stands to reason
ces would be planted
relationships between
the findings was not
ed that if we omit P.
nses are still stronger
nable us to reach an
ing a list of research
anage their stands in
een undertaken, range
rely well represented.
r plantation planning
Cumulative PhD report Vulnerability and adaptability of plantation forest tree species
23
(Loo et al., 2011). Trials tend to be established in environments where a certain species is already known to
grow well. Bio-physical site quality models would benefit greatly from trials in environments that represent the
margin of a species’ true fundamental niche. At these locations the species needs to exploits its full phenotypic
plasticity and for a researcher the genotype’s capacity to adapt to different climates becomes quantifiable.
- Change the seed source or create an adapted land race?
An interesting point was raised by Professor William Dvorak who is not only co-author for all three studies but
also Director of the International Tree Breeding and Conservation Program. He asks to consider and evaluate
two different strategies that would both lead to an improved adaptation of forest plantations.
The first option takes a forester back to a species’ natural stands to plant a different seed source when climate
change occurs. A second option would be to select trees in a plantation where the climate is changing to create
an adapted landrace for planting in the next generation. The fundamental point the second strategy touches is
that trees are known to adapt to their climatic setting very quickly (Dvorak, W. personal communication
October 2013). The methodologies we developed are only able to evaluate the effectiveness of the first option,
where we rely on seed material from natural stands. Which one of the two options eventually yield the better
results in terms of high and stable growth performance in planted forests, cannot be answered with the available
data. The results of a study based on the question if one should change the seed source or rather create an
adapted landrace would sure be of great practicable importance for the forestry sector.
- Closer collaboration between practitioners and research institutes
One problem that circumvents the implementation of research results into practice is the missing coordination
between research institutes and the forestry industry. Research that has the aim to change behavior in the
forestry sector should correspond to current needs for decision support of forest companies. This may seem self-
explanatory but experience shows that many forest growth models are too far away from reality for
practitioners. Chances are high that if companies play a participatory part in the process of model building, they
are more willing to implement results in their forest management programs.
- Long term Free Air Caron Dioxide Enrichment (FACE) experiments
There are virtually no yield models available that account for direct CO2 effects on forest growth. This is largely
due to a lack of quantitative data on CO2 fertilization effects on seedlings, young plants and adult trees. FACE
experiments especially in the tropics would help researchers to gain knowledge on this important effect of
anthropogenic climate change on forest growth. Only then direct CO2 effects can be included in growth models
that more realistically predict climate change impacts on forest ecosystems.
- Validation of site quality models
The statistical validation techniques we use for our site quality models are often not considered proof enough for
the forestry industry to adopt results for their management plans. One way to increase the trust of the forestry
sector into developed decision support tools would be a so called ground-proofing of results. Small trials could
be established that introduce a seed source into a climate that it is expected to encounter in its natural ecological
niche or on plantation sites in the future. Growth rates and survival of the trees at these locations would be
valuable evidence of the tree species’ true adaptive capacity.
- Accuracy of General Circulation Models (GCMs)
In order to base decisions and forest management on the outcomes of climate change impact studies the
accuracy of GCMs need to be improved considerably. Particular shortcomings of the models that impede a
direct implementation of results into forestry practice are models’ inability to account for micro climates such as
cold pockets or the occurrence of infrequent extreme events such as heat waves or severe cyclones.
Cumulative PhD report Vulnerability and adaptability of plantation forest tree species
24
- Ex-sito conservation for conservation of valuable seed material
Seeds sources that exhibit valuable traits for climate change adaption need to be conserved ex-sito if
anthropogenic pressure threatens their survival in the wild. Particularly seeds with traits that facilitate the
adaptation of plantation forestry to novel climate conditions and to new threats arising from increased pest and
disease occurrences need to be planted in areas where their long-term viability can be ensured.
- Synthesis of ecology and genetics in climate change studies
Diverse soil conditions and nutritional limitations remain, for model approaches, the most difficult parameters
in predicting growth responses (Johnsen et al., 2001). The trend has to be not to only rely on pure statistical
analysis but to investigate mixed models that combine knowledge about physiological process with empirical
data obtained by field trials.
- Hybrid of P. patula and P. tecunumanii to reduce pest pressure.
The recently observed renewed interest in conservation has been brought about by the increase of diseases and
pests in forest plantations and the need to have alternate species available in case of problems (Dvorak, 2012).
Special focus in terms of pine plantation forestry lies in the breeding of hybrids of P. patula and P. tecunumanii.
Site quality modeling for these hybrids could bring to light relevant results for the forestry sector especially in
South Africa where pest pressure on P. patula plantation is particularly high.
3.4. Conclusion
This cumulative PhD project covers two main pillars of research relevant for the tropical forestry sector (1) We
analyzed climate change impacts on the persistence of natural pine species populations at their actual locations
and (2) we identified future growth potentials of different seed sources and identified climatically suitable areas
for commercial pine plantations in Colombia, Brazil and South-Africa. The statistical tools we used to assess
these climate change impacts were CEM and biophysical site quality models. The methods developed in this
study can be applied to other tree species for which large provenance by environment experiments exist and
offer a way to better understand and assess climate change impacts on subtropical and tropical plantation tree
species.
4. Acknowledgements
I would like to thank the Camcore members in Brazil, Colombia and South Africa for establishing, maintaining
and measuring the research field plantings. Their field work is the basis that made this PhD project possible. I
would also like to thank William Woodbridge, Camcore data manager, for his assistance in preparing the large
datasets for analysis. The study on climate change’s impact on plantation forestry was enabled by the financial
support of the “Ausgleichsstifung Landwirtschaft und Umwelt”. I would like to express my gratitude to Dr.
Marlene Diekmann from GIZ for her help and facilitation of the author’s first stay as a visiting researcher in
Colombia with Bioversity International. Also the comments of eight anonymous reviewers were very helpful
and improved the quality of the published manuscripts considerably. I would like to give special thanks to my
PhD supervisor Professor Michael Koehl whose unbureaucratic help and excellent steering were of great value
for the research project. Finally I would like to give thanks to the Decision and Policy Analysis (DAPA) team at
CIAT for their help and advice on the computation and implementation of the developed models and growth
predictions.
Cumulative PhD report Vulnerability and adaptability of plantation forest tree species
25
5. References
Araújo, M. B., Pearson, R. G., Thuiller, W., & Erhard, M. (2005). Validation of species–climate impact models under climate change. Global Change Biology, 11(9), 1504–1513.
Barnes, R. D. (1984). Genotype-environment interaction in the genetic improvement of fast-growing plantation trees. In Symposium on Site and Productivity of Fast Growing Plantations. Pretoria.
Barnes, R. D., Bunrsr, J., & Gibson, G. L. (1984). Genotype-Environment Interactions in Tropical Pines and their Effects on the Structure of Breeding Populations. Silvae Genetica, 33, 6.
Bartelink, H. H. (2000). Effects of stand composition and thinning in mixed-species forests: a modeling approach applied to Douglas-fir and beech. Tree Physiology, 20(5-6), 399–406.
Battaglia, M., & Sands, P. J. (1998). Process-based forest productivity models and their application in forest management. Forest Ecology and Management, 102(1), 13–32.
Borders, B. E., & Bailey, R. L. (2001). Loblolly pine-pushing the limits of growth. Southern Journal of Applied
Forestry, 25(2), 69–74.
Botkin, D. B., Saxe, H., Araujo, M. B., Betts, R., Bradshaw, R. H., Cedhagen, T., … Faith, D. P. (2007). Forecasting the effects of global warming on biodiversity. Bioscience, 57(3), 227–236.
Burke, E. J., Brown, S. J., & Christidis, N. (2006). Modeling the recent evolution of global drought and projections for the twenty-first century with the Hadley Centre climate model. Journal of Hydrometeorology, 7(5), 1113–1125.
Busby, J. R. (1991). BIOCLIM–A bioclimatic analysis and prediction system. In “Nature Conservation: Cost
Effective Biological Surveys and Data Analysis”.(Eds CR Margules and MP Austin.) pp. 64–68. CSIRO: Melbourne.
Carle, J., & Holmgren, P. (2008). Wood from planted forests. Forest Products Journal, 58(12), 7.
Coley, P. D. (1998). Possible effects of climate change on plant/herbivore interactions in moist tropical forests. Climatic change, 39(2-3), 455–472.
Dale, V. H., Joyce, L. A., McNulty, S., Neilson, R. P., Ayres, M. P., Flannigan, M. D., … Peterson, C. J. (2001). Climate Change and Forest Disturbances: Climate change can affect forests by altering the frequency, intensity, duration, and timing of fire, drought, introduced species, insect and pathogen outbreaks, hurricanes, windstorms, ice storms, or landslides. BioScience, 51(9), 723–734.
Davis, M. B., & Shaw, R. G. (2001). Range shifts and adaptive responses to Quaternary climate change. Science, 292(5517), 673–679.
Dawson, I. K., Vinceti, B., Weber, J. C., Neufeldt, H., Russell, J., Lengkeek, A. G., … Roshetko, J. (2011). Climate change and tree genetic resource management: maintaining and enhancing the productivity and value of smallholder tropical agroforestry landscapes. A review. Agroforestry systems, 81(1), 67–78.
Dormann, C. F. (2007). Promising the future? Global change projections of species distributions. Basic and
Applied Ecology, 8(5), 387–397.
Dukes, J. S., & Mooney, H. A. (1999). Does global change increase the success of biological invaders? Trends
in Ecology & Evolution, 14(4), 135–139.
Dvorak, W. S. (2012). The strategic importance of applied tree conservation programs to the forest industry in South Africa. Southern Forests: a Journal of Forest Science, 74(1), 1–6.
Dvorak, W. S., Donahue, J. K., & Vasquez, J. A. (1995). Early performance of CAMCORE introductions of Pinus patula in Brazil, Colombia and South Africa. South African Forestry Journal, 174(1), 23–33.
Cumulative PhD report Vulnerability and adaptability of plantation forest tree species
26
Dvorak, W. S., Hodge, G. R., Gutiérrez, E. A., Osorio, L. F., Malan, F. S., & Stanger, T. K. (2000). Pinus tecunumanii. Conservation and testing of tropical and subtropical forest tree species by the CAMCORE
Cooperative, 188–209.
Dvorak, W. S., Hodge, G. R., & Payn, K. G. (2008). The conservation and breeding of Eucalyptus urophylla: a case study to better protect important populations and improve productivity. Southern Forests: a Journal of
Forest Science, 70(2), 77–85.
Dvorak, W. S., Hodge, G. R., & Romero, J. L. (2001). Results of twenty years of research on Pinus tecunumanii by the CAMCORE Cooperative. Forest Genetic Resources.
Elsner, J. B., Kossin, J. P., & Jagger, T. H. (2008). The increasing intensity of the strongest tropical cyclones. Nature, 455(7209), 92–95.
FAO. (2010). Global Forest Resources Assessment 2010. Food & Agriculture Org.
FAO, I., & ISRIC, I. (2010). Harmonized World Soil Database (version 1.1). FAO, Rome, Italy and IIASA,
Laxenburg, Austria.
Fawcett, T. (2004). ROC graphs: Notes and practical considerations for researchers. Machine Learning, 31, 1–38.
Fielding, A. H., & Bell, J. F. (1997). A review of methods for the assessment of prediction errors in conservation presence/absence models. Environmental conservation, 24(1), 38–49.
Finlay, K. W., & Wilkinson, G. N. (1963). The analysis of adaptation in a plant-breeding programme. Crop and
Pasture Science, 14(6), 742–754.
Freeman, G. H. (1973). Statistical methods for the analysis of genotype-environment interactions. Heredity, 31(3), 339–354.
Gómez-Mendoza, L., & Arriaga, L. (2007). Modeling the effect of climate change on the distribution of oak and pine species of Mexico. Conservation Biology, 21(6), 1545–1555.
Hamann, A., & Wang, T. (2006). Potential effects of climate change on ecosystem and tree species distribution in British Columbia. Ecology, 87(11), 2773–2786.
Hamrick, J. L. (2004). Response of forest trees to global environmental changes. Forest Ecology and
Management, 197(1), 323–335.
Heikkinen, R. K., Luoto, M., Araújo, M. B., Virkkala, R., Thuiller, W., & Sykes, M. T. (2006). Methods and uncertainties in bioclimatic envelope modelling under climate change. Progress in Physical Geography, 30(6), 751–777.
Hijmans, R., Cruz, M., Rojas, E., & Guarino, L. (2001). DIVA-GIS version 1.4: A geographic information system for the analysis of biodiversity data, manual.
Hijmans, R., & Graham, C. H. (2006). The ability of climate envelope models to predict the effect of climate change on species distributions. Global change biology, 12(12), 2272–2281.
Hijmans, R. J., Cameron, S. E., Parra, J. L., Jones, P. G., & Jarvis, A. (2005). Very high resolution interpolated climate surfaces for global land areas. International journal of climatology, 25(15), 1965–1978.
Hijmans, R., & Schreuder, J. (1999). Using GIS to check coordinates of genebank accessions. Genetic
Resources and Crop Evolution, 46, 291–296.
Hilton-Taylor, C., & Mittermeier, R. A. (2000). 2000 IUCN red list of threatened species. Iucn.
Hulme, P. E. (2005). Adapting to climate change: is there scope for ecological management in the face of a global threat? Journal of Applied Ecology, 42(5), 784–794.
Iverson, L. R., & Prasad, A. M. (1998). Predicting abundance of 80 tree species following climate change in the eastern United States. Ecological Monographs, 68(4), 465–485.
Cumulative PhD report Vulnerability and adaptability of plantation forest tree species
27
Jarvis, A., Reuter, H. I., Nelson, A., & Guevara, E. (2009). Hole-filled seamless SRTM data V4. 2008. International Centre for Tropical Agriculture (CIAT), 5.
Jaynes, E. T. (1957). Information theory and statistical mechanics. Physical review, 106(4), 620.
Jaynes, E. T. (1991). Notes on present status and future prospects. In Maximum entropy and Bayesian methods (pp. 1–13). Springer.
Johnsen, K., Samuelson, L., Teskey, R., McNulty, S., & Fox, T. (2001). Process models as tools in forestry research and management. Forest Science, 47(1), 2–8.
Kanzler, A. (2002). Genotype x Environment Interaction in Pinus patula and its implications in South Africa. Retrieved from http://repository.lib.ncsu.edu/ir/handle/1840.16/3058
Kearney, M. R., Wintle, B. A., & Porter, W. P. (2010). Correlative and mechanistic models of species distribution provide congruent forecasts under climate change. Conservation Letters, 3(3), 203–213.
Knight, A. T., Cowling, R. M., Rouget, M., Balmford, A., Lombard, A. T., & Campbell, B. M. (2008). Knowing But Not Doing: Selecting Priority Conservation Areas and the Research–Implementation Gap. Conservation
Biology, 22(3), 610–617.
Köhl, M., Hildebrandt, R., Olschofksy, K., Köhler, R., Rötzer, T., Mette, T., … Abiy, M. (2010). Combating the effects of climatic change on forests by mitigation strategies. Carbon balance and management, 5(1), 1–9.
Koskela, J., Buck, A., & Teissier du Cros, E. (2007). Climate change and forest genetic diversity. Implications
for sustainable forest management in Europe. European Forest Genetic Resources Programme.
Kremer, A., Koskela, J., Buck, A., & Cros, T. du. (2007). How well can existing forests withstand climate change? In EUFORGEN Climate Change and Forest Genetic Diversity: implications for sustainable forest
management in Europe, Paris, France, 15-16 March 2006. (pp. 3–17).
Leibing, C., Signer, J., van Zonneveld, M., Jarvis, A., & Dvorak, W. (2013). Selection of Provenances to Adapt Tropical Pine Forestry to Climate Change on the Basis of Climate Analogs. Forests, 4(1), 155–178. doi:10.3390/f4010155
Leibing, C., van Zonneveld, M., Jarvis, A., & Dvorak, W. (2009). Adaptation of tropical and subtropical pine plantation forestry to climate change: Realignment of Pinus patula and Pinus tecunumanii genotypes to 2020 planting site climates. Scandinavian Journal of Forest Research, 24(6), 483–493.
Lindner, M., Maroschek, M., Netherer, S., Kremer, A., Barbati, A., Garcia-Gonzalo, J., … Kolström, M. (2010). Climate change impacts, adaptive capacity, and vulnerability of European forest ecosystems. Forest Ecology
and Management, 259(4), 698–709.
Loo, J., Fady, B., Dawson, I., Vinceti, B., & Baldinelli, G. (2011). Climate change and Forest Genetic Resources: State of Knowledge, Risks and Opportunities.
Louw, J. H. (1999). A review of site-growth studies in South Africa. Southern African Forestry Journal, 185(1), 57–65.
Mäkelä, A., Landsberg, J., Ek, A. R., Burk, T. E., Ter-Mikaelian, M., \AAgren, G. I., … Puttonen, P. (2000). Process-based models for forest ecosystem management: current state of the art and challenges for practical implementation. Tree Physiology, 20(5-6), 289–298.
Matala, J., Hynynen, J., Miina, J., Ojansuu, R., Peltola, H., Sievänen, R., … Kellomäki, S. (2003). Comparison of a physiological model and a statistical model for prediction of growth and yield in boreal forests. Ecological Modelling, 161(1–2), 95–116.
Mátyás, C. (2006). Migratory, genetic and phenetic response potential of forest tree populations facing climate change. Acta Silvatica et Lignaria Hungarica, 2, 33–46.

Cumulative PhD report Vulnerability and adaptability of plantation forest tree species
28
Mátyás, C., Vendramin, G. G., & Fady, B. (2009). Forests at the limit: evolutionary–genetic consequencesof environmental changes at the receding (xeric) edge of distribution. Report from a research workshop. Annals
of Forest Science, 66(8).
Millar, C. I., Stephenson, N. L., & Stephens, S. L. (2007). Climate change and forests of the future: managing in the face of uncertainty. Ecological applications, 17(8), 2145–2151.
Noss, R. F. (2002). Beyond Kyoto: forest management in a time of rapid climate change. Conservation Biology, 15(3), 578–590.
O’Neill, B. C., & Oppenheimer, M. (2002). Climate change: dangerous climate impacts and the Kyoto Protocol. Science, 296(5575), 1971–1972.
Parmesan, C. (2006). Ecological and evolutionary responses to recent climate change. Annual Review of
Ecology, Evolution, and Systematics, 637–669.
Pearson, R. G., & Dawson, T. P. (2003). Predicting the impacts of climate change on the distribution of species: are bioclimate envelope models useful? Global ecology and biogeography, 12(5), 361–371.
Phillips, S. J., Anderson, R. P., & Schapire, R. E. (2006). Maximum entropy modeling of species geographic distributions. Ecological modelling, 190(3), 231–259.
Ramírez-Villegas, J., Lau, C., Köhler, A.-K., Signer, J., Jarvis, A., Arnell, N., … Lau, C. (2012). Climate analogues: A glimpse of tomorrow’s agricultural future, today. Working Paper no. 12.
Rehfeldt, G. E., Wykoff, W. R., & Ying, C. C. (2001). Physiologic plasticity, evolution, and impacts of a changing climate on Pinus contorta. Climatic Change, 50(3), 355–376.
Robertson, M. P., Peter, C. I., Villet, M. H., & Ripley, B. S. (2003). Comparing models for predicting species’ potential distributions: a case study using correlative and mechanistic predictive modelling techniques. Ecological Modelling, 164(2), 153–167.
Sarle, W. S. (1990). The VARCLUS procedure. SAS/STAT User’s Guide,.
Saxe, H., Cannell, M. G., Johnsen, Ø., Ryan, M. G., & Vourlitis, G. (2001). Tree and forest functioning in response to global warming. New Phytologist, 149(3), 369–399.
Shelbourne, C. J. A. (1973). Genotype-environment interaction: its study and its implications in forest tree improvement. In IUFRO Genetics-SABRAO joint Symposia (pp. 1–28). Tokio: New Zealand Forest Service.
Shukla, G. K. (1972). Some statistical aspects of partitioning genotype-environmental components of variability. Heredity, 29(2), 237.
Solomon, S. (2007). Climate change 2007-the physical science basis: Working group I contribution to the
fourth assessment report of the IPCC (Vol. 4). Cambridge University Press.
Spittlehouse, D. (2008). Climate Change, Impacts and Adaptation Scenarios: Climate change and forest and range management in British Columbia.
Spittlehouse, D. L. (2005). Integrating climate change adaptation into forest management. The Forestry
Chronicle, 81(5), 691–695.
Subasinghe, U. (2011). Growth Models and Their Use in Plantation Forestry. In Proceedings of International
Forestry and Environment Symposium.
Thomas, C. D., Cameron, A., Green, R. E., Bakkenes, M., Beaumont, L. J., Collingham, Y. C., … Hannah, L. (2004). Extinction risk from climate change. Nature, 427(6970), 145–148.
Thuiller, W., Albert, C., Araújo, M. B., Berry, P. M., Cabeza, M., Guisan, A., … Schurr, F. M. (2008). Predicting global change impacts on plant species’ distributions: future challenges. Perspectives in Plant
Ecology, Evolution and Systematics, 9(3), 137–152.
Cumulative PhD report Vulnerability and adaptability of plantation forest tree species
29
Ung, C.-H., Bernier, P. Y., Raulier, F., Fournier, R. A., Lambert, M.-C., & Régnière, J. (2001). Biophysical site indices for shade tolerant and intolerant boreal species. Forest Science, 47(1), 83–95.
Van Zonneveld, M., Jarvis, A., Dvorak, W., Lema, G., & Leibing, C. (2009). Climate change impact predictions on Pinus patula and Pinus tecunumanii populations in Mexico and Central America. Forest Ecology and
Management, 257(7), 1566–1576.
Vanclay, J. K. (1994). Modelling forest growth and yield: applications to mixed tropical forests. School of
Environmental Science and Management Papers, 537.
Vanclay, J. K., & Skovsgaard, J. P. (1997). Evaluating forest growth models. Ecological Modelling, 98(1), 1–12.
Verbyla, D. L., & Litvaitis, J. A. (1989). Resampling methods for evaluating classification accuracy of wildlife habitat models. Environmental Management, 13(6), 783–787.
Walther, G.-R., Hughes, L., Vitousek, P., & Stenseth, N. C. (2005). Consensus on climate change. Biotropica, 19, 216–227.
Wheaton, E. E. (2001). Changing fire risk in a changing climate: a literature review and assessment. Saskatoon: Saskatchewan Research Council.
Zobel, B., & Talbert, J. (1984). Applied forest tree improvement. Weinheim: Wiley.
Climate change impact predictions on Pinus patula and Pinus tecunumanii
populations in Mexico and Central America
Maarten van Zonneveld a,*, Andy Jarvis a,b, William Dvorak c, German Lema b, Christoph Leibing d
a Bioversity International, Americas Office, km 17 recta Cali/Palmira, PO 6713, Cali, Colombiab International Centre of Tropical Agriculture (CIAT), km 17 recta Cali/Palmira, PO 6713, Cali, ColombiacCentral America and Mexico Coniferous Resources Cooperative (CAMCORE), North Carolina State University, 2720 Faucette Drive, 3229 Jordan Hall Addition,
Raleigh, NC 27695-8008, United Statesd Zentrum Holzwirtschaft, Universitat Hamburg, Leuschnerstrasse 91, D-21031 Hamburg, Germany
1. Introduction
The scientific basis of climate change is now well established.
Climate change has occurred in the past century and is likely to
continue into the future (IPCC, 2007). Changing climate will most
probably affect the geographic range of native trees and the
locations where they can be grown in plantations as exotic species.
The possible negative impacts on natural populations of important
tree species should concern the forestry sector, as these are the
source of genetic diversity (seeds) used to sustain and improve
plantation productivity under both present and future conditions
(Dvorak et al., 2008). Despite the importance of alterations in
global temperature and precipitation patterns, considerable
uncertainty still exists on how tree species will respond to changes
in climate (Hamrick, 2004; Botkin et al., 2007; Kremer, 2007). It is
therefore important and relevant to better understand the threats
of climate change to natural populations of tree species.
Many studies have used climate envelope models (CEMs) to
assess the potential impact on ecosystems from climate change by
using their current geographic distribution to develop a model of
most suitable climate conditions for natural species occurrence, and
projecting this into the future on the basis of results from general
circulation models (GCMs). Their predictions show significant
impacts and shifts in the actual distribution of many tree species
(e.g. Gomez-Mendoza and Arriaga, 2007; Leng et al., 2008; Iverson
et al., 2008). The extent towhich trees canwithstand environmental
changes at their actual locations remains understudied in CEM-
based climate change impact studies (Thuiller et al., 2007).
Although CEM modeling techniques have proved to be a
valuable tool in the prediction of natural species distribution and
the impact of climate change on their abundance (Guisan and
Thuiller, 2005; Dormann, 2007), they face serious restrictions
(Thuiller et al., 2004, 2007; Araujo et al., 2005; Dormann, 2007).
One major problem with these approaches when applied to
climate change research is that validation is difficult as the results
Forest Ecology and Management 257 (2009) 1566–1576
A R T I C L E I N F O
Article history:
Received 29 July 2008
Received in revised form 19 December 2008
Accepted 22 December 2008
Keywords:
Adaptive ability
Climate change
Climate envelope models
Model validation
Provenance trials
Species distribution ranges
A B S T R A C T
Climate change is likely to have a negative impact on natural populations of Pinus patula and Pinus
tecunumanii, two globally important tree species in plantation forestry. The objective of this work was to
evaluate the impact of climate change on the persistence of the natural populations of these species at
their actual locations in order to take appropriate conservation measurements. A common approach to
assess the impact of climate change on species natural distributions is climate envelopemodeling (CEM).
CEMs suggest significant impacts of climate change on the natural distribution of the two pine species,
but their predictions contain considerable uncertainty related to the adaptive ability of tree populations
towithstand future climate conditions.We assessed the adaptive ability of the two pine species based on
the evaluations of provenance trials and used the results of these field trials to validate CEM impact
assessment studies on provenance collection sites in the wild. The two pine species performed well in a
wide range of climates, including conditions that were recorded by CEM as unsuitable for natural pine
occurrence. The climate conditions where the two pine species naturally occur are predicted to become
in the futuremore similar to the present climate of some areas where they are successfully established in
field trials. These findings suggest that these pine species are in their natural habitat better adapted to
climate change than CEM predicts. For the most vulnerable species, P. tecunumanii, human disturbances
such as fragmentation fromurbanization and conversion to agriculture that are occurring today aremore
urgent threats requiring action compared to the threat from climate change.
� 2009 Elsevier B.V. All rights reserved.
* Corresponding author. Tel.: +57 2 4450048x118; fax: +57 2 4450096.
E-mail addresses: [email protected], [email protected]
(M. van Zonneveld).
Contents lists available at ScienceDirect
Forest Ecology and Management
journal homepage: www.elsev ier .com/ locate / foreco
0378-1127/$ – see front matter � 2009 Elsevier B.V. All rights reserved.
doi:10.1016/j.foreco.2008.12.027
are future projections (Araujo and Rahbek, 2006). Dormann (2007)
highlights this as one of the top priorities for improving CEM
predictions. Some authors use ‘‘hindcasting’’ to validate their
models, whereby the past is used as a key to the future (e.g.
Graham et al., 2004; Araujo et al., 2005). Another less used but
potentially powerful approach is to couple the modeling with
results from field evaluations where species survival and
performance are measured under different climate conditions in
so-called translocational experiments, including observations of
trees planted outside their natural climate range as exotics
(Zavaleta, 2006) or on sites where already moderate levels of
climate change are observed (Thuiller et al., 2007).
It can be expected that the ability of tree species to persist at
their actual locations under new climate conditions is key to their
survival in the face of climate change. With the help of
translocational experiments their adaptability to these new
climate conditions can be quantified. In comparison to other plant
life forms like herbs, ferns and mosses, trees are limited in their
ability to shift to new areas of suitable climate due to their long
growth cycle (Hamrick, 2004; Lenoir et al., 2008). Fragmentation
due to human activities such as agriculture and urbanization
further limits colonization of new areas that have potentially
suitable climate (Davis and Shaw, 2001; Pearson and Dawson,
2003). Even if human disturbance is neglected, migration capacity
of many tree species, especially those that are long-lived and form
climax forest communities, might be too slow to keep pace with
the predicted rapid changes in climate (e.g. Malcolm et al., 2002;
McLachlan et al., 2005).
Provenance trials can be used to perform translocational
experiments. Such experiments have been used in several studies
to learn the niche breadth of tree species natural populations and
niche variation between populations (e.g. Rehfeldt et al., 2002;
Saenz-Romero et al., 2006). Provenance trials are often established
across a wider range of climate conditions than found in natural
stands to determine the limits of their adaptability in new
environments. Retrospectively they can be used to better climatic
limits of populations in the wild.
Provenance trials exist for a number of economically important
temperate and tropical tree species. For example, seed collections of
40 tropical and subtropical species in natural stands have been
carried out by Camcore, North Carolina State University (Interna-
tional Tree Conservation and Domestication Program) for the last 3
decades andmore than 1000 ha of field trials have been established
(Dvorak et al., 2001). Results from these large scale field trials offer a
unique dataset for better understanding the impacts of climate
changeonnatural populationsof the species, througha combination
of climate envelope modeling and translocational validation based
on provenance survival and growth.
This study aims to evaluate the performance of a climate
envelope model for predicting climate change impacts by 2050 on
natural populations of two important Mexican and Central
American pines, Pinus patula and Pinus tecunumanii using results
from provenance trials in Brazil, Colombia and South Africa as a
means of validation. P. patula is native to eastern and southern
Mexico (Perry, 1991) and P. tecunumanii is found predominantly in
Central America and Chiapas, Mexico (Dvorak and Donahue, 1992).
Nearly one million hectares of P. patula have been established in
plantations, primarily in southern Africa (Birks and Barnes, 1991).
Lesser amounts of P. tecunumanii are used in plantations, but it is
an important plantation species in Colombia, and is gaining in
importance in Brazil and South Africa (Dvorak et al., 2000a).
Numerous provenance trials of P. patula and P. tecunumanii have
been established by Camcore members in different tropical and
subtropical regions. The specific objectives of this paper are to
evaluate potential impact by 2050 of climate change on the wild
distribution of the two species, to validate future predictions of
species distribution based on translocational trial data and to
define the conservation implications of the findings for the two
species under study.
2. Materials and methods
For each pine species, suitable areas for natural species
occurrencewere predicted under present climate and the expected
climate in 2050 using the CEM modeling program ‘‘Maxent’’
developed by Phillips et al. (2006).We identified trial sites that had
a present climate close to the present and predicted future climate
of provenance locations in the wild, and used field evaluations
from those trial sites as an independent source for validation of the
CEM predictions on natural pine distribution. The adaptive ability
of both pine species was assessed based on the natural climate
ranges and the climate ranges in which the two species
successfully were established in field trials.
2.1. Location data
Wederived coordinates of 24 provenance locations in thewild of
P. patula and 41 provenance locations of P. tecunumanii from seed
collections provided by Camcore (Hodge and Dvorak, 1999; Dvorak
etal., 2000b).Thedata setofP.patulaprovenancecollectionsiteswas
complemented with a further seven points from the herbarium of
Missouri Botanical Garden (Tropicos.org., 2008), providing a total of
31 geo-referenced locations representing natural populations of P.
patula. Coordinates of all locationswere checked following Hijmans
et al. (1999) and are considered to be correct.
2.2. Study area
The study area was defined for each pine species based on the
geographic range of the provenance collection sites. For the
predictions of natural species occurrence and climate change
impact, these areas were limited with a buffer of 38 from themost
eastern, western, northern and southern provenance collection
sites. The largest group of populations of P. patula occurs in the
Sierra Madre Oriental in the eastern part of Mexico between 188N
and 248N latitude, while outlier populations occur in the
southern Mexican states Guerrero and Oaxaca between 168N
and 178N latitude (Dvorak et al., 2000b). Natural stands are
normally found in cloud forests at altitudes of 2100–2800 m
(Perry, 1991). Natural stands of P. tecunumanii are found from
Chiapas, Mexico (178N) to central Nicaragua (128N) (Dvorak and
Donahue, 1992). P. tecunumanii distribution can be divided into
two sub-population groups based on altitude of the collection
sites: high elevation populations that are commonly found in
cloud forests between altitudes of 1500–2900 m, and low
elevation populations that occur between altitudes of 450 and
1500 m (Dvorak et al., 1989).
The climate change impact predictions from CEM on natural
occurrence of the two pine species were validated based on height
and survival data from eight-year-old established provenance
trials planted in Colombia, Brazil and South Africa by Camcore
members between 1982 and 1996 (Hodge and Dvorak, 1999;
Dvorak et al., 2000a,b). In order of the 3 countries, data of P. patula
provenances came from 8, 11 and 9 trial locations and of P.
tecunumanii provenances from 11, 7 and 17 trial locations. Trial
management (site preparation, spacing of trees, weed control, etc.)
among studies was as similar as practical in the field.
2.3. Climate variable selection
CEM predictions become more biased by climate variables
when they are extrapolated to areas outside the study area where
M. van Zonneveld et al. / Forest Ecology and Management 257 (2009) 1566–1576 1567
they were calibrated (Phillips et al., 2006; Randin et al., 2006). This
happens also when applied into the future under climate change
projections as climate moves beyond the bounds of the original
calibration and in some areas enters into globally novel climates
(Williams et al., 2007). These challenges occur in our study, and
therefore we aimed to select only the most characteristic climate
variables for use in the modeling, capturing those most significant
in defining the natural species range, which also reduces model
redundancy.
The 19 Bioclim variables (Busby, 1991), derived from the
WorldClim database developed by Hijmans et al. (2005) were
chosen to describe the climate in our study area. The WorldClim
surfaces had a resolution of 5 km. Since climate variables are often
highly correlated (e.g. Dormann, 2007), we first aimed tominimize
redundancy by selecting single variables that are representative of
other variables. To achieve this, correlating climate variables were
clustered following the SAS VARCLUS procedure (SAS, 2003). In this
multivariate technique, the clusters are chosen to maximize the
variation at the first component of each cluster, and can be used to
reduce the number of variables (SAS, 2003).
We then did a second filter of variable selection by using
random distributions and Mann–Whitney U-tests. 500 random
locations in a buffer of 300 km around the provenance collection
sites were generated in ArcView 3.2. We then compared the
climate of the provenance locations with the climate conditions of
the random points, and the variables with the greatest differences
from the Mann–Whitney U-tests were considered to be of most
importance in defining the species range, as the species are not
distributed randomly in their natural distribution.
To define the final variable set for the analysis, we selected from
each cluster the climate variable that varied most significantly
from the Mann–Whitney U-test (Table 1). The selected variables
were considered to be representative of the other variables in the
clusters, and were used in all further analyses. Some clusters did
not contain any variables that distinguished significantly prove-
nance locations from surrounding areas, so no variables from those
clusters were included. Climate values at the random and
provenance locations were extracted in DIVA-GIS 5.4.
Future climate data was derived from GCM projections of 2050
climate from the HADCM3 and CCCMA models under the A2a
emission scenario (IPCC, 2007). This scenario describes aworldwith
continued population growth, slow economic growth, and slow
advances in technological solutions (Nakicenovic and Swart, 2000).
The coarse GCM outputs were downscaled to 5 km resolution using
smoothing (spatial interpolation), and added to the current
WorldClim climatic surfaces to provide surfaces of 2050 climate.
Climate values at the provenance locations and trial sites were
extracted in DIVA-GIS 5.4 from the WorldClim climate grids of
present climate, and the CCCMA and HADCM3 model outputs.
2.4. Climate envelope modeling
Maxent is a CEM modeling program which calculates the
distribution of maximum entropy for a species within a given area
based on observed climate values at locations where that species
has been reported, and produces a climate envelope map that
consists of probability values for suitable natural habitat (Phillips
et al., 2006). Only introduced recently in CEM modeling, Maxent
has performed well when compared with other CEM methods
(Elith et al., 2006; Graham and Hijmans, 2006), and has been used
in several studies to predict species distribution (e.g. Miller and
Knouft, 2006; Prates-Clark et al., 2007).
The climate envelope maps that predict natural species
distribution under the present climate were evaluated for their
accuracy using the ROC Area Under Curve (AUC) statistic. This is a
common evaluation method in CEM studies (e.g. Elith et al., 2006;
Phillips et al., 2006). AUC were interpreted following Araujo et al.
(2005): AUC near 0.5 are similar to random prediction and indicate
poor model performance, AUC above 0.9 indicate excellent model
performance.
To predict the climate change impacts, the developed climate
envelopes of natural species distribution were projected by
Maxent to the future climate models CCCMA and HADCM3.
Suitable areas of natural species occurrence were defined
following the threshold of when 90 percent of the provenance
locations were included in the climate envelope at present climate.
To obtain an indication of the predicted impact of climate change
on natural species occurrence, we calculated the change in
superficies of suitable area and verified with x2 homogeneity
tests if the proportion of suitable provenance locations signifi-
cantly changed in 2050 following the predictions from CEM. The
probability values of suitable natural habitat at the provenance
locations were extracted in DIVA-GIS 5.4 from the grids that were
generated byMaxent for the present climate and the future climate
models.
2.5. Translocational validation
Validation pointswere identified for assessing the quality of the
predictions in the climate envelope derived from Maxent. These
validation points were acquired by correlating CEM-generated
suitability values for natural pine occurrence with the observed
height and survival at trials established in a present climate that
matched respectively with the present climate and predicted
future climate at provenance locations. To measure climatic
distances between provenance collection sites and field trials,
Euclidean distances based on the standardized sub-sampled
climate variables were calculated. As a threshold for matching
climates, the 10 percent of smallest distances between provenance
collection sites themselves was used. When the climate of more
than one trial site matched with the climate at a provenance
collection site, the average height and survival from those siteswas
used in the correlation. Provenance collection sites that did not
climatically match with trial sites, and vice versa, were not
included in the correlation.
Further, we correlated CEM-generated suitability values for
natural pine occurrence with the climate conditions at provenance
locations and examined if pine performance at the field trials
responded in a similar way to these climate conditions. For each
species, the suitability values from the CEM predictions under
present and the predicted future climates were taken together in
one analysis and correlated to the corresponding climate values
(suitability values from each CEM prediction are equally related to
the sub-sampled climate variables as the CEM calculations are
based in all cases on the same climate envelope). To examine if pine
performance did relate in a similar way to the climate conditions at
the provenance collection sites, the height and survival values from
the climatically matching trial sites were correlated to the same
climate values as the suitability values were.
2.6. Natural and potential climate ranges of adaptive ability
We conceptualized a simpler version of the climate envelope of
natural species occurrence of the two pine species by making two-
dimensional relations between the sub-sampled variables. The
climate envelopes were bounded by constraints that show the
linear combinations of the variable range limits. The climatic
ranges in which trial sites were established were compared to the
natural climate envelopes to identify the potential climate ranges
to which the species is adapted. Climatic differences between
provenance collection sites and trial locations were tested with
ANOVA.
M. van Zonneveld et al. / Forest Ecology and Management 257 (2009) 1566–15761568
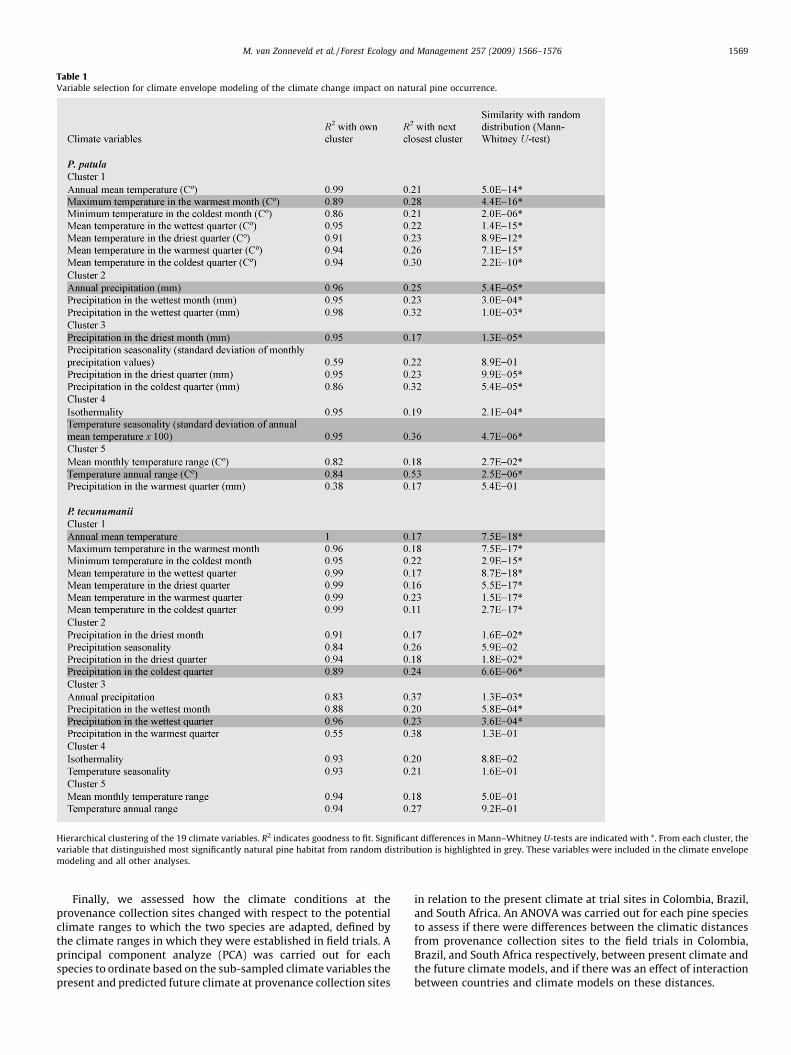
Finally, we assessed how the climate conditions at the
provenance collection sites changed with respect to the potential
climate ranges to which the two species are adapted, defined by
the climate ranges in which they were established in field trials. A
principal component analyze (PCA) was carried out for each
species to ordinate based on the sub-sampled climate variables the
present and predicted future climate at provenance collection sites
in relation to the present climate at trial sites in Colombia, Brazil,
and South Africa. An ANOVA was carried out for each pine species
to assess if there were differences between the climatic distances
from provenance collection sites to the field trials in Colombia,
Brazil, and South Africa respectively, between present climate and
the future climate models, and if there was an effect of interaction
between countries and climate models on these distances.
Table 1
Variable selection for climate envelope modeling of the climate change impact on natural pine occurrence.
Hierarchical clustering of the 19 climate variables. R2 indicates goodness to fit. Significant differences in Mann–Whitney U-tests are indicated with *. From each cluster, the
variable that distinguished most significantly natural pine habitat from random distribution is highlighted in grey. These variables were included in the climate envelope
modeling and all other analyses.
M. van Zonneveld et al. / Forest Ecology and Management 257 (2009) 1566–1576 1569
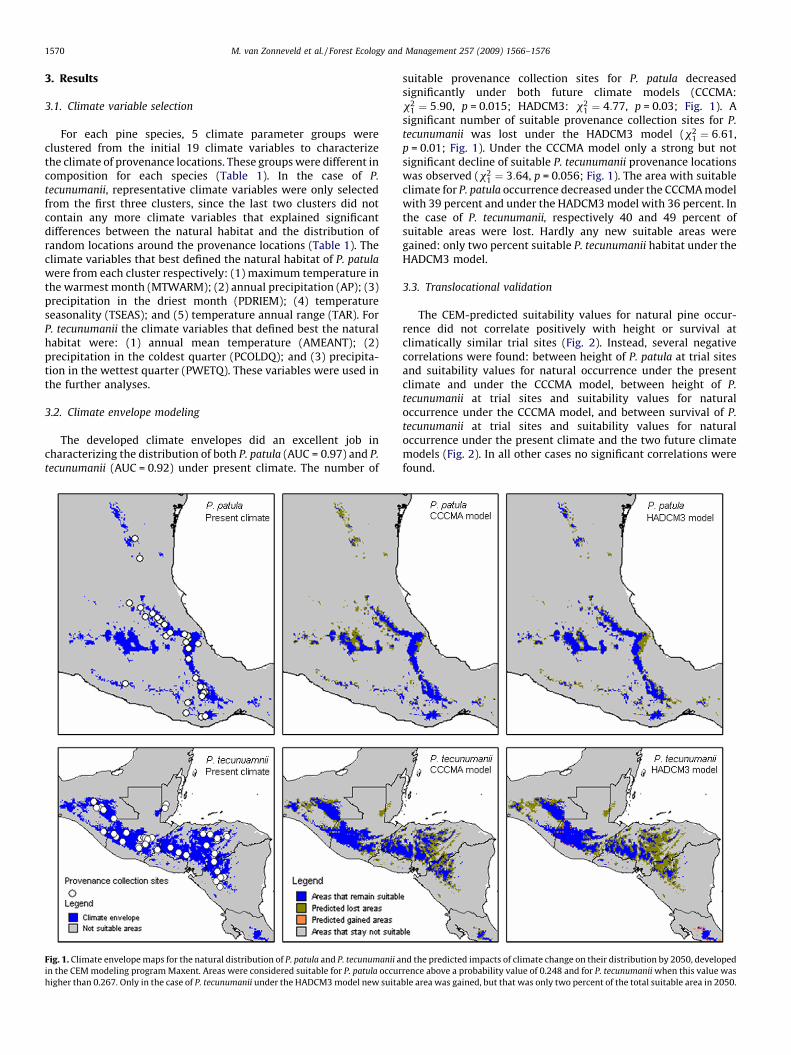
3. Results
3.1. Climate variable selection
For each pine species, 5 climate parameter groups were
clustered from the initial 19 climate variables to characterize
the climate of provenance locations. These groupswere different in
composition for each species (Table 1). In the case of P.
tecunumanii, representative climate variables were only selected
from the first three clusters, since the last two clusters did not
contain any more climate variables that explained significant
differences between the natural habitat and the distribution of
random locations around the provenance locations (Table 1). The
climate variables that best defined the natural habitat of P. patula
were from each cluster respectively: (1) maximum temperature in
the warmest month (MTWARM); (2) annual precipitation (AP); (3)
precipitation in the driest month (PDRIEM); (4) temperature
seasonality (TSEAS); and (5) temperature annual range (TAR). For
P. tecunumanii the climate variables that defined best the natural
habitat were: (1) annual mean temperature (AMEANT); (2)
precipitation in the coldest quarter (PCOLDQ); and (3) precipita-
tion in the wettest quarter (PWETQ). These variables were used in
the further analyses.
3.2. Climate envelope modeling
The developed climate envelopes did an excellent job in
characterizing the distribution of both P. patula (AUC = 0.97) and P.
tecunumanii (AUC = 0.92) under present climate. The number of
suitable provenance collection sites for P. patula decreased
significantly under both future climate models (CCCMA:
x21 ¼ 5:90, p = 0.015; HADCM3: x2
1 ¼ 4:77, p = 0.03; Fig. 1). A
significant number of suitable provenance collection sites for P.
tecunumanii was lost under the HADCM3 model (x21 ¼ 6:61,
p = 0.01; Fig. 1). Under the CCCMA model only a strong but not
significant decline of suitable P. tecunumanii provenance locations
was observed (x21 ¼ 3:64, p = 0.056; Fig. 1). The area with suitable
climate for P. patula occurrence decreased under the CCCMAmodel
with 39 percent and under the HADCM3model with 36 percent. In
the case of P. tecunumanii, respectively 40 and 49 percent of
suitable areas were lost. Hardly any new suitable areas were
gained: only two percent suitable P. tecunumanii habitat under the
HADCM3 model.
3.3. Translocational validation
The CEM-predicted suitability values for natural pine occur-
rence did not correlate positively with height or survival at
climatically similar trial sites (Fig. 2). Instead, several negative
correlations were found: between height of P. patula at trial sites
and suitability values for natural occurrence under the present
climate and under the CCCMA model, between height of P.
tecunumanii at trial sites and suitability values for natural
occurrence under the CCCMA model, and between survival of P.
tecunumanii at trial sites and suitability values for natural
occurrence under the present climate and the two future climate
models (Fig. 2). In all other cases no significant correlations were
found.
Fig. 1. Climate envelopemaps for the natural distribution of P. patula and P. tecunumanii and the predicted impacts of climate change on their distribution by 2050, developed
in the CEMmodeling programMaxent. Areas were considered suitable for P. patula occurrence above a probability value of 0.248 and for P. tecunumaniiwhen this value was
higher than 0.267.Only in the case of P. tecunumanii under the HADCM3model new suitable area was gained, but that was only two percent of the total suitable area in 2050.
M. van Zonneveld et al. / Forest Ecology and Management 257 (2009) 1566–15761570
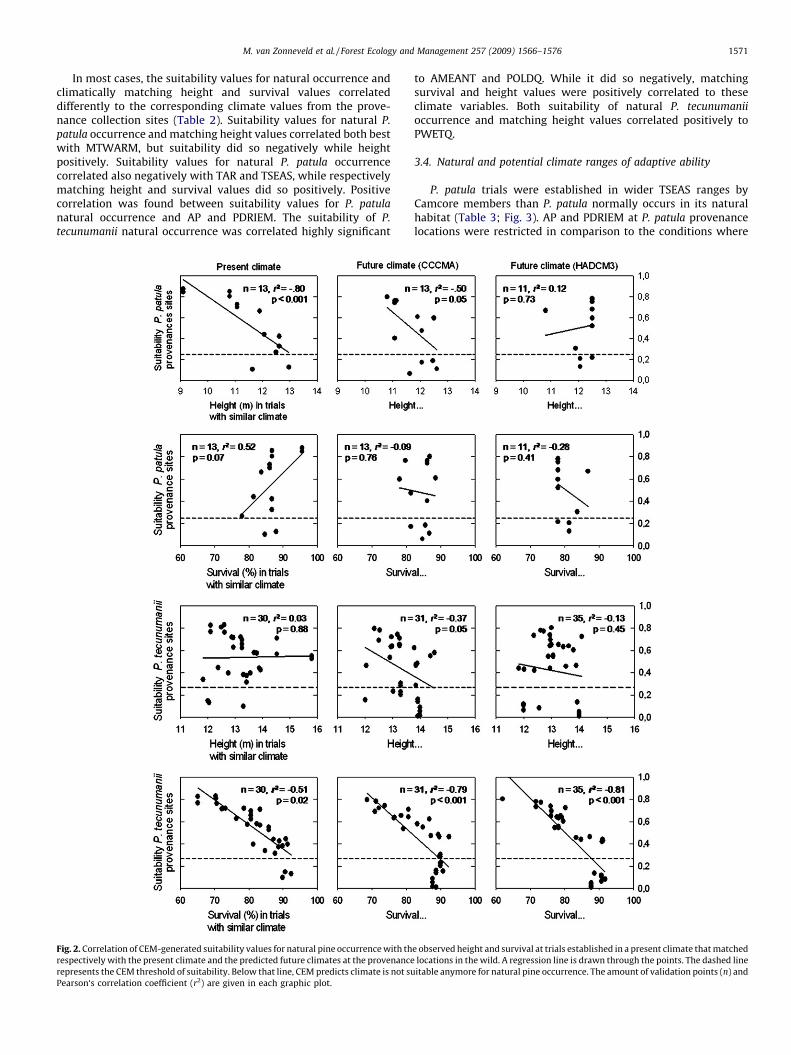
In most cases, the suitability values for natural occurrence and
climatically matching height and survival values correlated
differently to the corresponding climate values from the prove-
nance collection sites (Table 2). Suitability values for natural P.
patula occurrence andmatching height values correlated both best
with MTWARM, but suitability did so negatively while height
positively. Suitability values for natural P. patula occurrence
correlated also negatively with TAR and TSEAS, while respectively
matching height and survival values did so positively. Positive
correlation was found between suitability values for P. patula
natural occurrence and AP and PDRIEM. The suitability of P.
tecunumanii natural occurrence was correlated highly significant
to AMEANT and POLDQ. While it did so negatively, matching
survival and height values were positively correlated to these
climate variables. Both suitability of natural P. tecunumanii
occurrence and matching height values correlated positively to
PWETQ.
3.4. Natural and potential climate ranges of adaptive ability
P. patula trials were established in wider TSEAS ranges by
Camcore members than P. patula normally occurs in its natural
habitat (Table 3; Fig. 3). AP and PDRIEM at P. patula provenance
locations were restricted in comparison to the conditions where
Fig. 2. Correlation of CEM-generated suitability values for natural pine occurrencewith the observed height and survival at trials established in a present climate thatmatched
respectively with the present climate and the predicted future climates at the provenance locations in the wild. A regression line is drawn through the points. The dashed line
represents the CEM threshold of suitability. Below that line, CEM predicts climate is not suitable anymore for natural pine occurrence. The amount of validation points (n) and
Pearson‘s correlation coefficient (r2) are given in each graphic plot.
M. van Zonneveld et al. / Forest Ecology and Management 257 (2009) 1566–1576 1571
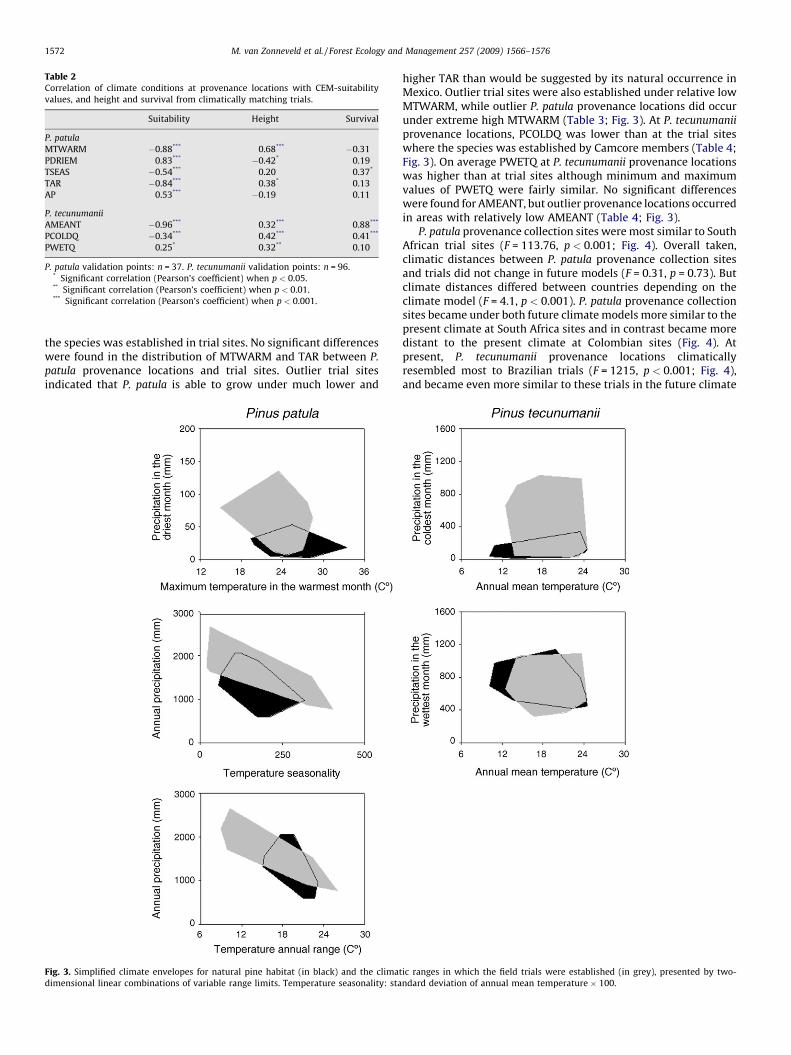
the species was established in trial sites. No significant differences
were found in the distribution of MTWARM and TAR between P.
patula provenance locations and trial sites. Outlier trial sites
indicated that P. patula is able to grow under much lower and
higher TAR than would be suggested by its natural occurrence in
Mexico. Outlier trial sites were also established under relative low
MTWARM, while outlier P. patula provenance locations did occur
under extreme high MTWARM (Table 3; Fig. 3). At P. tecunumanii
provenance locations, PCOLDQ was lower than at the trial sites
where the species was established by Camcore members (Table 4;
Fig. 3). On average PWETQ at P. tecunumanii provenance locations
was higher than at trial sites although minimum and maximum
values of PWETQ were fairly similar. No significant differences
were found for AMEANT, but outlier provenance locations occurred
in areas with relatively low AMEANT (Table 4; Fig. 3).
P. patula provenance collection sites were most similar to South
African trial sites (F = 113.76, p < 0.001; Fig. 4). Overall taken,
climatic distances between P. patula provenance collection sites
and trials did not change in future models (F = 0.31, p = 0.73). But
climate distances differed between countries depending on the
climate model (F = 4.1, p < 0.001). P. patula provenance collection
sites became under both future climatemodels more similar to the
present climate at South Africa sites and in contrast became more
distant to the present climate at Colombian sites (Fig. 4). At
present, P. tecunumanii provenance locations climatically
resembled most to Brazilian trials (F = 1215, p < 0.001; Fig. 4),
and became even more similar to these trials in the future climate
Table 2
Correlation of climate conditions at provenance locations with CEM-suitability
values, and height and survival from climatically matching trials.
Suitability Height Survival
P. patula
MTWARM �0.88*** 0.68*** �0.31
PDRIEM 0.83*** �0.42* 0.19
TSEAS �0.54*** 0.20 0.37*
TAR �0.84*** 0.38* 0.13
AP 0.53*** �0.19 0.11
P. tecunumanii
AMEANT �0.96*** 0.32*** 0.88***
PCOLDQ �0.34*** 0.42*** 0.41***
PWETQ 0.25* 0.32** 0.10
P. patula validation points: n = 37. P. tecunumanii validation points: n = 96.* Significant correlation (Pearson’s coefficient) when p < 0.05.** Significant correlation (Pearson’s coefficient) when p < 0.01.*** Significant correlation (Pearson’s coefficient) when p < 0.001.
Fig. 3. Simplified climate envelopes for natural pine habitat (in black) and the climatic ranges in which the field trials were established (in grey), presented by two-
dimensional linear combinations of variable range limits. Temperature seasonality: standard deviation of annual mean temperature � 100.
M. van Zonneveld et al. / Forest Ecology and Management 257 (2009) 1566–15761572
models, especially under the HADCM3 model, but became more
distinct to the present climate in South African and Colombian
trials (F = 10.10, p < 0.001; Fig. 4).
4. Discussion
It is argued that CEMs overestimate the impact of climate change
on tree species (Kremer, 2007;Botkinet al., 2007). Validationof CEM
results for future climate change is identified as a research priority
(Dormann, 2007; Thuiller et al., 2007). We used a series of
international provenance trials as amean of validating CEM climate
change impact predictions on natural pine occurrence. Predictions
from CEM suggest a big impact by climate change on the natural
occurrence of both pine species. More than a third of the actual
suitable area is predicted to be lost by 2050 for both species under
both GCM models and hardly any new suitable areas were gained.
Based on the results from CEM, the number of suitable provenance
collection sites is expected to decrease significantly, except for P.
tecunumanii under the CCCMA model, although in that case there
was still a clear tendency in decline. The outcomes of the
translocational validations however suggest that natural stands of
P. patula and P. tecunumanii have a broader adaptation to climate
change than CEM predicts. The results from the field evaluations
showedthat thepines speciesperformwell inawider range than the
limits of the climate envelopes developed by CEM.
4.1. Climate variable selection
With the help of the variable clustering and theMann–Whitney
U-test, the number of variables for the analyses of P. patula was
reduced to five, and in the case of P. tecunumanii to three variables.
The method does not pretend to identify causal environmental
factors for species occurrence, but given the lack of plant
physiological and phenological parameters, we consider this to
be a valid method to select variables for CEM predictions,
minimizing redundancy and selecting the variables that best
define the current geographic distribution.
4.2. Translocational validation and adaptive ability to changes in
climate
The CEM-generated suitability values for natural species
occurrence did not correlate positively with height and survival
from climatically matching field trials, and in several cases they
were negatively correlated. Such contrary responses were also
observedwhen suitability values andmatching height and survival
values were correlated to the same climate values from the
corresponding provenance collection sites. For instance, suitability
values for natural species occurrence were negatively correlated to
increasing temperature whereas matching height and survival
values were positively related to that increase. This suggests that
despite the negative CEMpredictions the species are adapted to the
foreseen temperature increment in their natural habitat.
In the case of several climate variables, the two pine species
performed well in wider ranges than those found in their natural
habitat. For instance, successful establishment of trial sites of P.
patula outside normal climatic boundaries that characterize its
occurrence inMexico indicates that this species is adapted tomuch
wider ranges of temperature seasonality (TSEAS) than found in its
natural habitat. P. tecunumanii appeared to perform well under
Table 3
Differences in climate ranges between P. patula provenance locations in the wild and field trials.
Climate variables MTWARM PDRIEM*** TSEAS* AP* TAR
Sites Wild Trials Wild Trials Wild Trials Wild Trials Wild Trials
Mean 24.4 24.9 18.6 62.6 165 225.6 1215.3 1466.7 19.7 18.3
SD 3.1 2.9 10.5 39.5 57.8 130.5 375.2 479.5 2.1 4.9
Minimum 19.4 14.9 3.0 7.0 56.9 20.5 590 774 15.1 9.0
Maximum 33.4 28.4 53 135 317.9 404.7 2059 2658 23.2 26
Wild (provenance collection sites): n = 31. Trial sites: n = 28. SD: Standard deviation.* Significant differences in ANOVA when p < 0.05.*** Significant differences in ANOVA when p < 0.001.
Table 4
Differences in climate ranges between P. tecunumanii provenance locations in the
wild and field trials.
Climate variable AMEANT PWETQ*** PCOLDQ***
Sites Wild Trials Wild Trials Wild Trials
Mean 18.8 18.5 694.7 565.3 130.3 284.7
SD 3.7 2.7 155.8 200.4 90.9 317.8
Minimum 10.2 12.5 419 323 17 30
Maximum 24.5 24.5 1144 1092 340 1026
Wild (provenance collection sites): n = 41. Trial sites: n = 34. SD: Standard
deviation.*Significant differences in ANOVA when p < 0.05.
*** Significant differences in ANOVA when p < 0.001.
Fig. 4.Ordination with the help of principal component analyses (PCA) of average present climate and future climates (HADCM3 and CCCMAmodel) of provenance collection
sites and the average present climate of field trials established in South Africa (ZA), Brazil (BR) and Colombia (CO) respectively.
M. van Zonneveld et al. / Forest Ecology and Management 257 (2009) 1566–1576 1573
precipitation patterns different from its natural habitat. Due to the
wide ranges of adaptability it can be expected thatwild pine stands
are able to persist substantial changes in climate. These results are
in line with similar studies. Four Rhododendron tree species, native
to the Himalayas, proved to survive well at higher temperature
values than occur in their natural niches (Vetaas, 2002). Miller and
Knouft (2006) found that natural populations of the fruit tree
Spondias purpurea in Middle America occurred in a relatively
narrow niche of marginal areas, whereas this species was
successfully introduced in much wider climate ranges.
In general, the length of the growing season (temperature) has a
positive effect on tree development (Aitken et al., 2008). Often tree
species are more tolerant to high temperatures than to minimum
temperatures (Vetaas, 2002). But it is difficult to assess to which
limit tree species can tolerate or respond positively to high
temperatures (Saxe et al., 2001). This depends also on the effect of
the combined changes in temperature and precipitation (Aitken
et al., 2008).
In the case of P. patula, the climate ranges in which field trials
were established did not cover the hot and relatively dry
conditions where some outlier provenance locations occur in
thewild. Itwould be relevant to learn how P. patula performs under
these conditions and include that information in the validation of
climate change impact predictions. Climate change impact studies
done for other tropical and subtropical pine species show that the
performance of those pines is affected negatively by such
conditions (Koskela, 2001; Saenz-Romero et al., 2006). It can be
expected that a combination of temperature increment and
drought has also a negative impact on the growth and survival
of P. patula and P. tecunumanii and consequently on the natural
occurrence of these species.
Yet the 2050 climate of the P. patula provenance locations is
predicted to become on average more similar to the present
climate of South African field trials where the species successfully
was established. In the case of P. tecunumanii, climate at the
provenance locations is predicted to become closer to the present
climate at Brazilian sites. These results suggest that trees of wild P.
patula and P. tecunumanii stands are sufficiently adapted to
acclimatize to the new ecological climate niches at their locations
defined by the predicted climate conditions in 2050.
4.3. The role of climate and other factors in changes of natural
species distribution
Besides the broad adaptation found for the pine species in our
study, the reason that pine performance at trial sites did not concur
with the CEM-predicted climate change impacts on natural species
occurrence may be due to climate is not the only factor that shapes
the natural geographic ranges of natural pine areas. In fact, to what
extent climate determines changes in natural species distribution
and the role of other factors like biotic interactions and dispersal
ability are important points of discussion in climate change impact
studies on natural species distribution (Pearson andDawson, 2003).
Biotic interactions, such as competition, were not taken in
account in the translocational validation of natural species
occurrence with the results from field trails. Camcore trials are
managed under favorable conditions (fire and weed control) while
in their natural habitat competitionwith other tree species is likely
to limit pine distribution. This implies that successful pine growth
and survival at trial sites tend to overvalue suitable areas for
natural species occurrence.
To what extent stands of tree species are to be pushed out by
competitionwith other tree species at their actual locations during
the expected climate changes in the next 50–100 years, depends on
the ability of climatically better suited tree species to invade these
locations. But invasion by better suitable tree species is often
substantially delayed by dispersal limitations of these species
(Svenning and Skov, 2004; Kramer, 2007). Further do trees prolong
their existence in changing ecosystems because of their longevity
(Hamrick, 2004). It can be anticipated that most tree species not
going to be driven out by other tree species before climate severely
weaken them. In case of the pine species in our study, the climate
in their natural habitat is predicted to become closer to several
areaswhere the species performwell at the trial sites, whichmakes
it even less likely they will be pushed out by other tree species.
A factor of importance for these pine species is the frequency
and intensity of fires. Both P. patula and P. tecunumanii are closed-
cone pines. They have developed in an environment where fires
have greatly affected patterns of evolution and play an important
role in the dynamics of recruitment andmortality for these species
(e.g. Rodrıguez-Trejo and Fule, 2003; Styles and McCarter, 1988).
The present day natural range of both species might not reflect
historic occurrences. To provide more insight into the impact of
climate change on future regenerations of these pine species, the
impact of climate change on these fire events should be understood
and included in the predictions of climate change impact on
natural species distribution. As an example, high frequency of fires
in the mountains of Central America would favor Pinus oocarpa
over P. tecunumanii. P. oocarpa has evolved to produce sprouts from
the base of its stem after fires as a survival mechanism while P.
tecunumanii has not (Dvorak et al., 2001; Dvorak, 2002).
Climate change is also likely to influence the occurrence of
forest pest outbreaks. This has not been included in our analysis
but this could have a potentially high impact on the natural
distribution of the pine species in our study. Billings et al. (2004)
report that between 1999 and 2003 about 90,000 ha of pine forests
from Central America were killed by bark beetles, including P.
tecunumanii stands. The outbreak was preceded by intense
wildfires and extent droughts caused by the climate dynamics
of El Nino Southern Oscillation (Billings et al., 2004). This
demonstrates how extreme climate events can trigger pest
outbreaks. There are strong indications that recent pest outbreaks
killing large areas of temperate pine forests in Canada have
happened because of a temperature increment that is related to
global climate change (Kurz et al., 2008). CEM modeling can help
assessing the risk of these outbreaks under the foreseen changes in
climate (Logan et al., 2003).
4.4. Genetic variation
Dormann (2007), Kremer (2007) and Aitken et al. (2008) stress
the importance to include genetic variation in predictions of
climate change impact on natural species distribution. We
assumed in our validation methods that trees from different wild
pine species standswill respond in a similarway to climate change.
However, trees from genetically divergent stands are expected to
respond differently to changes in climate conditions. Indeed, in
many fitness-related provenance tests for tree species, prove-
nances performdifferentially under similar climate conditions (e.g.
Rehfeldt et al., 1999, 2002). The difference in provenance
performance from best to worst for productivity across a number
of environments for P. tecunumanii in the Camcore testing program
is approximately 30 percent (Hodge and Dvorak, 1999). This trend
has been found for a number of other tropical and subtropical pines
(e.g. Hodge and Dvorak, 2001).
For some pines species, adaptation to new environments is
apparently very rapid.P. patula, originally sampled inMexico, grown
in South Africa for one generation, and returned to Mexico, grew
faster than local sources, but was more susceptible to cold attacks
(Saenz-Romero et al., 1994). Fast adaptation have been reported for
several other pine and conifer species (see Saxe et al., 2001; Kremer,
2007; Aitken et al., 2008), but the mechanisms behind are
M. van Zonneveld et al. / Forest Ecology and Management 257 (2009) 1566–15761574
unfortunately not fully understood (Aitken et al., 2008). There are
high expectations from combining population genetics with
climate change modeling (Davis and Shaw, 2001; Thuiller et al.,
2007), but more research must be carried out to better understand
adaptation mechanisms at the genetic level (Kremer, 2007).
4.5. Conservation implications
Immediate-term threats might require more urgent action to
ensure the long-term protection of these pine species, when
compared to the long-term threat of climate change. At the
moment for many natural pine populations in Mexico and Central
America no effective conservation measurements exist. Saenz-
Romero et al. (2003) for instance, propose the establishment of a
network of in situ forest genetic resources conservation units to
protect the genetic variation of Mexican pine species against
immediate-term threats like fragmentation and deforestation. P.
tecunumanii is already under threat in Central America and
southern Mexico and is classified as vulnerable according the
criteria of IUCN (2007) and some populations are critically
endangered (Dvorak et al., 2000a). Human pressure is likely to
continue to be high since this species occurs naturally in areas that
suit agriculture and urbanization (Styles and McCarter, 1988).
Among possible measurements to protect P. tecunumanii prove-
nances, conservation parks outside its natural distribution range
are currently being planned in South Africa and other countries by
the Camcore membership (Camcore, 2005). CEM modeling can
help identifying areas for these conservation parks that are suitable
and remain low-impacted by climate change.
The time scope of our study is until 2050. It can be anticipated
that in the second half of the 21st century the climate in the natural
pine areas moves further away from the present climate and that
pine provenance locations will become more seriously affected.
Further climate modeling in combination with research on the
performance of the pine species under the predicted climate
conditions after 2050 can contribute to a better understanding of
the implications of climate change for natural pine occurrence on
such a long-term time scale.
5. Conclusions
CEM predictions suggest significant impacts of climate change
on the natural species distribution of the two pine species. The pine
species however demonstrate they can perform well in a wide
range of climates, including conditions that are predicted by CEM
as unsuitable for natural pine occurrence. The climate conditions
where the two pine species naturally occur are expected to become
in the future closer to the present climate of some areas where the
pine species are successfully established in field trials. These
findings suggest that the pine species are in their natural habitat
better adapted to climate change than is predicted from CEM. The
outcomes of CEM climate change impact predictions should
therefore be interpreted with caution. In the short term,
fragmentation by urbanization and agriculture seem to be more
urgent threats for the vulnerable species P. tecunumanii than
climate change.
Translocational validation can give already more insight into
the adaptive ability of tree species populations to climate change.
The inclusion of factors other than climate, in climate change
modeling will help us better understand the distribution dynamics
of tree species in changing environments. Such factors are invasion
by better suited tree species, disturbance events like fire
occurrences and pest outbreaks, and genetic variation.
Translocational validation can be applied to other tree species
for which large provenance x environment experiments exist.
These experiments exist mostly for temperate and boreal forest
species of the northern hemisphere but more data is becoming
available for tree species from tropical and subtropical regions
(Gapare et al., 2001; Kanzler et al., 2003). This opens the way for a
better assessment of climate change impact on subtropical and
tropical tree species.
Acknowledgements
We would like to thank the Camcore members in Brazil,
Colombia and South Africa for establishing, maintaining and
measuring the research field plantings of P. patula and P.
tecunumanii. We would also like to thank William Woodbridge,
Camcore data manager, for his assistance in preparing the large
data sets for analysis. We appreciate the valuable comments of
Xavier Scheldeman and two anonymous reviewers.
References
Aitken, S.N., Yeaman, S., Holliday, J.A.,Wang, T., Curtis-McLane, S., 2008. Adaptation,migration or extirpation: climate change outcomes for tree populations. Evolu-tionary Applications 1, 95–111.
Araujo,M.B.,Pearson,R.G.,Thuiller,W.,Erhard,M.,2005.Validationofspecies–climateimpact models under climate change. Global Change Biology 11, 1504–1513.
Araujo, M.B., Rahbek, C., 2006. How does climate change affect biodiversity?Science 313, 1396–1397.
Billings, R.F., Clarke, S.R., Espino Mendoza, V., Cordon Cabrera, P., Melendez Fig-ueroa, B., Ramon Campos, J., Baeza, G., 2004. Bark beetle outbreaks and fire: adevastating combination for Central America’s pine forest. Unasylva 55, 15–21.
Birks, J.S., Barnes, R.D., 1991. TheGenetic Control ofWoodQuality inPinus patula. ODAResearch Scheme R4616. Oxford Forestry Institute, University of Oxford, UK.
Botkin, D.B., Saxe, H., Araujo, M.B., Betts, R., Bradshaw, R.H.W., Cedhagen, T.,Chesson, P., Dawson, T.P., Etterson, J.R., Faith, D.P., Ferier, S., Guisan, A., Skjold-borg Hansen, A., Hilbert, D.W., Loehle, C., Margules, C., New, M., Sobel, M.J.,Stockwell, D.R.B., 2007. Forecasting the effects of global warming on biodiver-sity. BioScience 57, 227–236.
Busby, J.R., 1991. BIOCLIM—a bioclimatic analysis and prediction system. In:Margules, C.R., Austin, M.P. (Eds.), Nature Conservation: Cost Effective Biolo-gical Surveys and Data Analysis. CSIRO, Canberra, pp. 64–68.
Camcore, 2005. Camcore members make strong commitment to conservation. In:Camcore Annual Report 2005. College of Natural Resources, North CarolinaState University, Raleigh, NC, USA.
Davis, M.B., Shaw, R.G., 2001. Range shifts and adaptive responses to quaternaryclimate change. Science 292, 673–679.
Dormann, C.F., 2007. Promising the future? Global change projections of speciesdistributions. Basic and Applied Ecology 8, 387–397.
Dvorak, W.S., 2002. Pinus oocarpa Schiede ex Schltdl. In: Vozzo, J.A. (ed.) Tropicaltree seedmanual. Agriculture Handbook 721, USDA Forest Service, WashingtonDC, USA, pp. 628–631.
Dvorak, W.S., Balocchi, C.E., Raymond, R.H., 1989. Performance and stability ofprovenances and families of Pinus tecunumanii in the tropics and subtropics. In:Gibson, G.L., Griffin, A.R., Matheson, A.C. (Eds.), Breeding tropical trees: Popula-tion structure and genetic improvement strategies in clonal and seedlingforestry. Proceedings IUFRO conference, Pattaya, Thailand, November 1988,Oxford Forestry Institute, Oxford, UK, andWinrock International, Arlington, VA,USA, pp. 187–196.
Dvorak,W.S., Donahue, J.K., 1992. Twelve year review of the CAMCORE Cooperative:1980–1992. College of Forest Resources, North Carolina State University,Raleigh, NC, USA.
Dvorak, W.S., Hodge, G.R., Gutierrez, E.A., Osorio, L.F., Malan, F.S., Stanger, T.K.,2000a. Pinus tecunumanii. In: Conservation & Testing of Tropical & SubtropicalForest Tree Species by the CAMCORE Cooperative, College of Natural Resources,North Carolina State University, Raleigh, NC, USA, pp. 188–209.
Dvorak, W.S., Hodge, G.R., Kietzka, J.E., Malan, F., Osorio, L.F., Stanger, T.K., 2000b.Pinus patula. In: Conservation & Testing of Tropical & Subtropical Forest TreeSpecies by the CAMCORE Cooperative, College of Natural Resources, NorthCarolina State University, Raleigh, NC, USA, pp. 148–173.
Dvorak, W.S., Hodge, G.R., Romero, J.L., 2001. Results of twenty years of research onPinus tecunumanii by the CAMCORE Cooperative. Forest Genetic Resources 29.
Dvorak, W.S., Hodge, G.R., Payn, K.G., 2008. The conservation and breeding ofEucalyptus urophylla: a case study to better protect important populations andimprove productivity. Southern Forests: a Journal of Forest Science 70, 77–85.
Elith, J., Graham, C.H., Anderson, R.P., Dudık, M., Ferrier, S., Guisan, A., Hijmans, R.J.,Huettmann, F., Leathwick, J.R., Lehmann, A., Li, J., Lohmann, L.G., Loiselle, B.A.,Manion, G., Moritz, C., Nakamura, M., Nakazawa, Y., Overton, J.McC., TownsendPeterson, A., Phillips, S.J., Richardson, K., Scachetti-Pereira, R., Schapire, R.E.,Soberon, J., Williams, S., Wisz, M.S., Zimmermann, N.E., 2006. Novel methodsimprove prediction of species’ distributions from occurrence data. Ecography29, 129–151.
Gapare, W., Hodge, G.R., Dvorak, W.S., 2001. Genetic parameters and provenancevariation of Pinus maximinoi in Brazil, Colombia, and South Africa. ForestGenetics 8, 159–170.
M. van Zonneveld et al. / Forest Ecology and Management 257 (2009) 1566–1576 1575
Gomez-Mendoza, L., Arriaga, L., 2007. Modeling the effect of climate change onthe distribution of oak and pine species of Mexico. Conservation Biology 21,1545–1555.
Graham, C.H., Ferrier, S., Huettman, F., Moritz, C., Townsend Peterson, A., 2004. Newdevelopments in museum-based informatics and applications in biodiversityanalysis. Trends in Ecology and Evolution 19, 497–503.
Graham, C.H., Hijmans, R.J., 2006. A comparison of methods for mapping speciesranges and species richness. Global Ecology and Biogeography 15, 578–587.
Guisan, A., Thuiller, W., 2005. Predicting species distribution: offering more thansimple habitat models. Ecology Letters 8, 993–1009.
Hamrick, J.L., 2004. Response of forest trees to global environmental changes. ForestEcology and Management 197, 323–335.
Hijmans, R.J., Schreuder, M., De la Cruz, J., Guarino, L., 1999. Using GIS to check co-ordinates of genebank accessions. Genetic Resources and Crop Evolution 46,291–296.
Hijmans, R.J., Cameron, S.E., Parra, J.L., Jones, P.G., Jarvis, A., 2005. Very highresolution interpolated climate surfaces for global land areas. InternationalJournal of Climatology 25, 1965–1978.
Hodge, G.R., Dvorak, W.S., 1999. Genetic parameters and provenance variation ofPinus tecunumanii in 78 international trials. Forest Genetics 6, 157–180.
Hodge, G.R., Dvorak, W.S., 2001. Genetic parameters and provenance variation ofPinus caribaea var. hondurensis in 48 international trials. Canadian Journal ofForest Research 31, 496–511.
IPCC, 2007. Climate Change 2007: Synthesis Report. Cambridge University Press,New York, USA.
IUCN, 2007. IUCNRed List of Threatened Species, 17 July 2008 hwww.iucnredlist.orgi.Iverson, L.R., Prasad, A.M., Matthews, S.N., Peters, M., 2008. Estimating potential
habitat for 134 eastern US tree species under six climate scenarios. ForestEcology and Management 254, 390–406.
Kanzler, A., Hagedorn, S.F., Hodge, G.R., Dvorak, W.S., 2003. Genotype by environ-ment interaction for volume growth at 6 years of age in a series of five Pinus
patula progeny trials in southern Africa. Southern Hemisphere Forestry Journal198, 3–16.
Koskela, J., 2001. Responses of gas exchange and growth inMerkus pine seedlings toexpected climatic changes in Thailand. Global Change Biology 7, 641–656.
Kramer, K., 2007. Resilience of European forests: towards a non-equilibrium viewfor the management of diversity. In: Koskela, J., Buck, A., Teissier du Cros, E.(Eds.),Climate Change and Forest Genetic Diversity: Implications for SustainableForest Management in Europe. Bioversity International, Rome, Italy, pp. 43–52.
Kremer, A., 2007. How well can existing forests withstand climate change? In:Koskela, J., Buck, A., Teissier du Cros, E. (Eds.), Climate Change and ForestGenetic Diversity: Implications for Sustainable Forest Management in Europe.Bioversity International, Rome, Italy, pp. 3–17.
Kurz, W.A., Dymond, C.C., Stinson, G., Rampley, G.J., Neilson, E.T., Carroll, A.L., Ebata,T., Safranyik, L., 2008. Mountain pine beetle and forest carbon feedback toclimate change. Nature 452, 987–990.
Leng,W., He, H.S., Bu, R., Dai, L., Hu, Y.,Wang, X., 2008. Predicting the distributions ofsuitable habitat for three larch species under climate warming in NortheasternChina. Forest Ecology and Management 25, 420–428.
Lenoir, J., Gegout, J.C., Marquet, P.A., de Ruffray, P., Brisse, H., 2008. A significantupward shift in plant species optimum elevation during the 20th Century.Science 320, 1768–1770.
Logan, J.A., Regniere, J., Powell, J.A., 2003. Assessing the impacts of global warmingon forest pest dynamics. Frontiers in Ecology and Environment 1, 130–137.
Malcolm, J.R., Markham, A., Neilson, R.P., Garaci, M., 2002. Estimated migrationrates under scenarios of global climate change. Journal of Biogeography 29,835–849.
McLachlan, J.S., Clark, J.S., Manos, P.S., 2005. Molecular indicators of tree migrationcapacity under rapid climate change. Ecology 86, 2088–2098.
Miller, A.J., Knouft, J.H., 2006. GIS-based characterization of the geographic char-acterization of wild and cultivated populations of the Mesoamerican fruit treeSpondias purpurea (Anacardiaceae). American Journal of Botany 93, 1757–1767.
Nakicenovic, N., Swart, R. (Eds.), 2000. IPCC Special Report on Emissions Scenarios.Cambridge University Press, New York, USA.
Pearson, R.G., Dawson, T.P., 2003. Predicting the impacts of climate change on thedistribution of species: are bioclimate envelope models useful? Global Ecologyand Biogeography 12, 361–371.
Perry Jr., J.P., 1991. The Pines ofMexico and Central America. Timber Press, Portland,OR, USA.
Phillips, S.J., Anderson, R.P., Schapire, R.E., 2006. Maximum entropy modeling ofspecies geographic distributions. Ecological Modeling 190, 231–259.
Prates-Clark, C.C., Saatchi, S.S., Agosti, D., 2007. Predicting geographical distributionmodels of high-value timber trees in the Amazon Basin using remotely senseddata. Ecological Modeling 211, 309–323.
Randin, C.F., Dirnbock, T., Dullinger, S., Zimmermann, N.E., Zappa, M., Guisan, A.,2006. Are niche-based species distribution models transferable in space?Journal of Biogeography 33, 1689–1703.
Rehfeldt, G.E., Ying, C.C., Spittlehouse, S.P., Hamilton Jr., D.A., 1999. Geneticresponses to climate in Pinus contorta: niche breadth, climate change andreforestation. Ecological Monographs 69, 375–407.
Rehfeldt, G.E., Tchebakova, N.M., Parfenova, Y.I., Wykoff, W.R., Kuzmina, N.A.,Milyutin, L.I., 2002. Intraspecific responses to climate in Pinus sylvestris. GlobalChange Biology 8, 912–929.
Rodrıguez-Trejo, D.A., Fule, P.Z., 2003. Fire ecology of Mexican pines and a firemanagement proposal. International Journal of Wildland Fire 13, 23–37.
Saenz-Romero, C., Nienstaedt, H., Vargas-Hernandez, J., 1994. Performance of Pinuspatula genotypes selected in South Africa and growing in their native Mexicanenvironment. Silvae Genetica 43, 73–81.
Saenz-Romero, C., Snively, A.E., Lindig-Cisneros, 2003. Conservation and restorationof pine forest genetic resources in Mexico. Silvae Genetica 52, 233–237.
Saenz-Romero, C., Guzman-Reyna, R.R., Rehfeldt, G.E., 2006. Altitudinal geneticvariation among Pinus oocarpa populations in Michoacan, Mexico Implicationsfor seed zoning, conservation, tree breeding and global warming. Forest Ecologyand Management 229, 340–350.
SAS, 2003. The VARCLUS procedure. In: Clark, V. (Eds.), SAS/STAT User’s Guide,Version 9, vol. 2, 2002–2003. SAS Institute Inc., Cary, NC, USA, pp. 1641–1659.
Saxe, H., Cannell, M.G.R., Johnsen, Ø., Ryan, M.G., Vourlitis, G., 2001. Tree and forestfunctioning in response to global warming. New Phytologist 149, 369–399.
Styles, B.T., McCarter, P.S., 1988. The botany, ecology, distribution and conserva-tion status of Pinus patula ssp. tecunumanii in the republic of Honduras. CEIBA29, 3–30.
Svenning, J., Skov, F., 2004. Limited filling of the potential range in European treespecies. Ecology Letters 7, 565–573.
Thuiller, W., Araujo, M.B., Pearson, R.G., Whittaker, R.J., Brotons, L., Lavorel, S., 2004.Biodiversity conservation: uncertainty in predictions of extinction risk. Nature430, 34.
Thuiller, W., Albert, C., Araujo, M.B., Berry, P.M., Cabeza, M., Guisan, G., Hickler, T.,Midgley, G.F., Paterson, J., Schurr, F.M., Sykes, M.T., Zimmermann, N.E., 2007.Predicting global change impacts on plant species distributions: future chal-lenges. Perspectives in Plant Ecology, Evolution and Systematics 9, 137–152.
Tropicos.org. 17 July 2008. Missouri Botanical Garden hwww.tropicos.orgi.Vetaas, O.R., 2002. Realized and potential climate niches: a comparison of four
Rhododendron tree species. Journal of Biogeography 29, 545–554.Williams, J.W., Jackson, S.T., Kutzbach, J.E., 2007. Projected distributions of novel
and disappearing climates by 2100 AD. Proceedings of the National Academy ofSciences of the USA 104, 5738–5742.
Zavaleta, E., 2006. Shrub establishment under experimental global changes in aCalifornian grassland. Plant Ecology 184, 53–63.
M. van Zonneveld et al. / Forest Ecology and Management 257 (2009) 1566–15761576
ORIGINAL ARTICLE
Adaptation of tropical and subtropical pine plantation forestry to
climate change: Realignment of Pinus patula and Pinus tecunumanii
genotypes to 2020 planting site climates
CHRISTOPH LEIBING1, MAARTEN VAN ZONNEVELD2, ANDREW JARVIS3 &
WILLIAM DVORAK4
1Zentrum Holzwirtschaft, Universitat Hamburg, Leuschnerstrasse 91, D-21031, Hamburg, Germany,
2Bioversity
International, Americas office, km 17 recta Cali/Palmira, PO 6713, Cali, Colombia,3International Centre of Tropical
Agriculture (CIAT) and Bioversity International, km 17 recta Cali/Palmira, PO 6713, Cali, Colombia, and4Central
America and Mexico Coniferous Resources Cooperative (CAMCORE), North Carolina State University, 2720 Faucette
Drive, 3229 Jordan Hall Addition, Raleigh, NC 12 27695-8008, USA
Abstract
Pinus patula and Pinus tecunumanii, two pines native to Mexico and Central America, are important plantation species forthe forestry sector in the tropics and subtropics. In recent decades, members of the International Tree Conservation &Domestication Program (CAMCORE), North Carolina State University, have established large, multisite provenance trialsfor these pine species. The data provide valuable information about species and provenance choice for plantationestablishment in many regions with different climates. However, since climate is changing rapidly, it may becomeincreasingly difficult to choose the right species and provenance to plant. The aim of this study is to test the suitability ofseed material under changing climate of two P. patula varieties (P. patula var. patula and P. patula var. longipedunculata) andtwo P. tecunumanii ecotypes (highland and lowland). For each variety and ecotype, a site quality model was developed thatstatistically relates growth to environmental factors and couples the predictions to the average 2020 climate prediction offour general circulation models. Three developed models were significant and robust. Provenances of P. tecunumanii fromlowland areas in Central America are expected to be most productive in 2020 because of their promising performance underrather hot and wet climates.
Keywords: Climate change impact predictions, height growth, management decision support tools, provenance trials, site
quality modelling.
Introduction
Global climate alterations are likely to affect the
productivity of plantation forestry in the coming
decades. Forest growth models suggest a substantial
loss of production in the core area of current
forestry if no appropriate action is taken (Fairbanks,
1999; Spittlehouse & Stewart, 2003; Savolainen
et al., 2007). At the same time planted forests are
becoming increasingly important to satisfy global
wood demand (Carle & Holmgren, 2008). Planted
forests may also indirectly reduce pressures in
natural forests and are potential sources for carbon
sequestration (Carle & Holmgren, 2008), and in
that way contribute to the mitigation of climate
change. To ensure the supply of the expected
products and services from planted forests in the
future under a changing climate, plantation forest
management needs to be adapted accordingly
(Kremer, 2007).
The selection of species and provenances that are
most suitable to grow under the new climates that
are expected to occur is an important aspect of a
management plan that aims to adapt plantation
forests (Spittlehouse & Stewart, 2003). It can be
anticipated that seed material used in the past to
establish new plantations will not be optimal under
Correspondence: C. Leibing, ZentrumHolzwirtschaft, Universitat Hamburg, Leuschnerstrasse 91, D-21031, Hamburg, Germany. E-mail: [email protected]
Scandinavian Journal of Forest Research, 2009; 24: 483�493
(Received 18 May 2009; accepted 2 September 2009)
ISSN 0282-7581 print/ISSN 1651-1891 online # 2009 Taylor & Francis
DOI: 10.1080/02827580903378642
Downloaded By: [North Carolina State University] At: 14:50 13 September 2010
the changing climate in the future. New sources of
seed will need to be found to optimize wood
productivity.
In recent decades multisite provenance trials
have been established to identify the most suitable
species and provenances to plant in different
climates (e.g. Dvorak et al., 1995; Hodge &
Dvorak, 1999; Kanzler, 2002). Site growth model-
ling has proven to be a practical and accurate
method to predict the performance of species and
provenances in these experiments (Louw & Scholes,
2006). Support decision models that couple site
growth modelling to future climate predictions
based on general circulation models (GCMs) can
be a useful tool for forest managers to choose which
provenances and species to plant today in order to
yield optimal growth during the rotations in future
decades.
Significant areas of planted forests are grown in
tropical and subtropical areas of Colombia, Brazil
and South Africa (FAO, 2007). Pinus patula and
Pinus tecunumanii, two pine species native to Mexico
and Central America, are important plantation
species for the forestry sector in the tropics and
austral regions. Members of the International Tree
conservation & Domestication Program (CAM-
CORE) have established multisite provenance trials
on a global level that include 74 trials and 79 trials of
P. patula and P. tecunumanii, respectively, to identify
the growth and survival of these species and prove-
nances across different environments. The results
from these trials represent a treasure trove of data
suitable for understanding how trees are adapted to
their abiotic environment, and how they adapt to
different conditions.
Pinus patula is one of the most important pine
plantation species in tropical and subtropical re-
gions, with close to 1 million ha established in
plantations (Birks & Barnes, 1991). It is of primary
importance in South Africa, where the pine is the
most commonly planted species, accounting for
25% of the country’s entire forest plantation area
(FAO, 2007). Lesser amounts of P. tecunumanii
are used in plantations, but it is an important
plantation species in Colombia, and owing to its
favourable growth characteristics and comparatively
high resistance against pitch canker (Hodge &
Dvorak, 2006) the species is also gaining impor-
tance in Brazil and southern Africa (Dvorak et al.,
2000).
Pinus patula occurs naturally in the mountainous
regions of eastern and southernMexico. Two varieties
can be distinguished: P. patula var. patula, which
occurs in the eastern mountain ranges of the Sierra
Madre Oriental, and P. patula var. longipedunculata,
which occurs in the southern Mexican states of
Guerrero and Oaxaca in the Sierra Madre del Sur
(Dvorak et al., 2000). The geographical distribution
of P. patula var. longipedunculata borders with the
western distribution range of P. tecunumanii. The
distribution of P. tecunumanii extends from Chiapas,
Mexico, in the north to Honduras in the south and
can be divided into two ecotypes based on altitude: a
highland ecotype found in cloud forests at altitudes
between 1500 and 2900 m, and a lowland ecotype
that occurs at altitudes between 450 and 1500 m
(Dvorak et al., 1989).
This study aims to contribute to the development
of management plans to adapt existing planted
forests in Colombia, Brazil and South Africa to
the expected climate changes in the next few
decades. It is hypothesized that in several areas,
species and provenance choice of seed material will
have to be changed in order to sustain the produc-
tivity of these planted forests. The objective of this
study is to develop a decision support model that
(1) predicts the impact of climate change on wood
productivity for new rotation cycles that have an
expected harvest time around 2025, and (2) iden-
tifies the most suitable variety and ecotype of
P. patula and P. tecunumanii, respectively, to optimize
wood productivity in the period of these new
rotation cycles.
Materials and methods
To develop the decision support model, 8-year-old
P. patula and P. tecunumanii height growth data were
retrieved from a database of 153 provenance trials
that were established by CAMCORE members in
Colombia, Brazil and South Africa during 1981 and
1997 (Dvorak et al., 1995, 2001b). For each of
the two P. patula varieties, P. patula var. patula
and P. patula var. longipedunculata, and the two
P. tecunumanii ecotypes, lowland and highland
P. tecunumanii, three different site quality model
types that examined relations between height growth
and environmental conditions were developed. The
models were cross-validated with an independent set
of test data as an indication of model robustness.
The model types that scored best in the cross-
validation were used in the final growth prediction.
Geographical Information Systems (GIS) were used
to spatialize model predictions to other plantation
areas and project them into the future. The average
of four GCM climate projections for the year 2020
were used to calculate the expected impact of climate
change on a plantation’s growth performance in a
time span that falls below the common rotation cycle
of 17 years.
484 C. Leibing et al.
Downloaded By: [North Carolina State University] At: 14:50 13 September 2010
Study area
The study area comprises areas suitable for P. patula
and P. tecunumanii plantations in current and future
(2020) climates inColombia, Brazil and SouthAfrica.
The areas include a topographic range from 25 to
2850 m of altitude and diverse climates that range
from tropical conditions in the Colombian highlands,
where annual rainfall frequently exceeds 3000 mm, to
the dry, subtropical conditions characterized by cold
and dry winters in South Africa, where the maximum
annual mean temperature exceeds 208Cbut tempera-
ture seasonality is more than 10 times as high as in
Colombia. In South Africa in the coldest quarter of
the year the temperature drops below 18C. The trials
were planted in parts of the northern tropical Andes in
Colombia, and in southern Brazil, where trials are
established in the states of Minas Gerais, Epirito
Santo, Parana and SantaCatarina. Trial sites in South
Africa are located in the country’s eastern escarpment
from the Eastern Cape Province to the Northern
Province. Management (site preparation, spacing of
trees, weed control, etc.) among trialswas as similar as
practical in the field.
Data
The aim was to predict average observed height
growth at the age of 8 years and select through
stepwise regression the environmental variables that
best explain height performance at trial sites. The
pool of variables that were used as input consisted of
grid-based climate, soil and topographical variables
(Table I). Data for the 153 provenance trial locations
were extracted using ArcInfo (ESRI, 2006). The 19
Bioclim candidate variables (Busby, 1991) were
chosen to describe the climate in the study area.
The data were derived from the WorldClim database
developed by Hijmans et al. (2005). In addition,
two water balance variables, water availability and
potential to actual evapotranspiration, were calculated
using satellite-based observation of rainfall from the
Tropical Rainfall Measurement Mission (TRMM).
Soil conditions (topsoil) were described by variables
of the Harmonized World Soil database (FAO, 2009).
Topographical variables were derived from the Shut-
tle Radar Topography Mission 90m Digital Elevation
Data (Jarvis et al., 2008). All variable grids were
scaled to the same spatial resolution of 30 arc-
seconds, except for the TRMM-based variables,
which have a resolution of 15 arc-minutes.
Model selection
Single regression analyses showed that some envi-
ronmental variables predicted height growth best
following a linear relation, while others did so
Table I. List of climatic, edaphic and topographic variables that were incorporated in the data table for the stepwise regression runs.
Climate Soil Topography
Temperature variables Structure variables General variables
Annual mean temperature (8C) Available water capacity (mm m�1) Elevation (m a.s.l.)
Mean diurnal range (8C) Reference bulk density (kg dm�3) Slope (degree)
Isothermality (unitless) Clay fraction (% wt) Aspect (degree)
Temperature seasonality (%) Gravel fraction (% wt)
Max. temperature of warmest period (8C) Sand fraction (% wt)
Min. temperature of coldest period (8C) Chemical composition variables
Temperature annual range (8C) Organic carbon (% wt)
Mean temperature of wettest quarter (8C) pH (H2O) (�log (H�))
Mean temperature of driest quarter (8C) Cation-exchange capacity (cmol kg�1)
Mean temperature of warmest quarter (8C)
Mean temperature of coldest quarter (8C)
Precipitation variables
Annual precipitation (mm)
Precipitation of wettest period (mm)
Precipitation of driest period (mm)
Precipitation seasonality (%)
Precipitation of wettest quarter (mm)
Precipitation of driest quarter (mm)
Precipitation of warmest quarter (mm)
Precipitation of coldest quarter (mm)
Water balance variables
Consecutive dry months (no. months)
Actual to potential evapotranspiration (%)
Water availability (%)
Note: The table lists the environmental variables that were used to build the site growth prediction models.
Tropical pine plantations and climate change 485
Downloaded By: [North Carolina State University] At: 14:50 13 September 2010
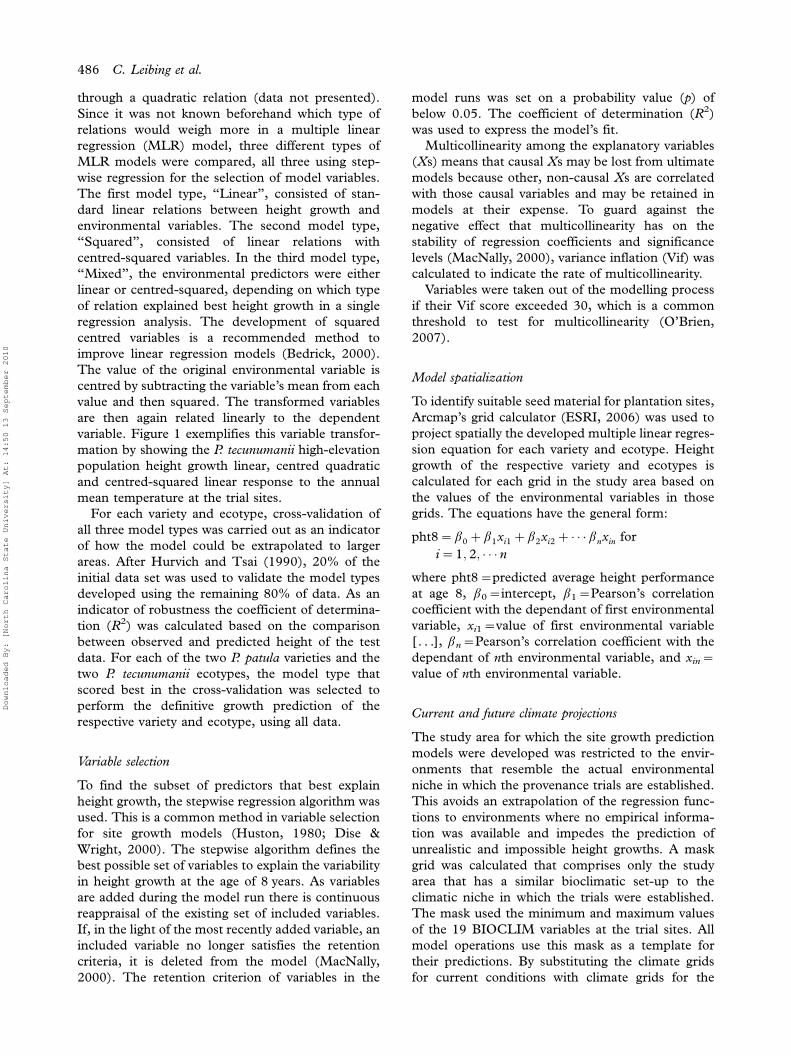
through a quadratic relation (data not presented).
Since it was not known beforehand which type of
relations would weigh more in a multiple linear
regression (MLR) model, three different types of
MLR models were compared, all three using step-
wise regression for the selection of model variables.
The first model type, ‘‘Linear’’, consisted of stan-
dard linear relations between height growth and
environmental variables. The second model type,
‘‘Squared’’, consisted of linear relations with
centred-squared variables. In the third model type,
‘‘Mixed’’, the environmental predictors were either
linear or centred-squared, depending on which type
of relation explained best height growth in a single
regression analysis. The development of squared
centred variables is a recommended method to
improve linear regression models (Bedrick, 2000).
The value of the original environmental variable is
centred by subtracting the variable’s mean from each
value and then squared. The transformed variables
are then again related linearly to the dependent
variable. Figure 1 exemplifies this variable transfor-
mation by showing the P. tecunumanii high-elevation
population height growth linear, centred quadratic
and centred-squared linear response to the annual
mean temperature at the trial sites.
For each variety and ecotype, cross-validation of
all three model types was carried out as an indicator
of how the model could be extrapolated to larger
areas. After Hurvich and Tsai (1990), 20% of the
initial data set was used to validate the model types
developed using the remaining 80% of data. As an
indicator of robustness the coefficient of determina-
tion (R2) was calculated based on the comparison
between observed and predicted height of the test
data. For each of the two P. patula varieties and the
two P. tecunumanii ecotypes, the model type that
scored best in the cross-validation was selected to
perform the definitive growth prediction of the
respective variety and ecotype, using all data.
Variable selection
To find the subset of predictors that best explain
height growth, the stepwise regression algorithm was
used. This is a common method in variable selection
for site growth models (Huston, 1980; Dise &
Wright, 2000). The stepwise algorithm defines the
best possible set of variables to explain the variability
in height growth at the age of 8 years. As variables
are added during the model run there is continuous
reappraisal of the existing set of included variables.
If, in the light of the most recently added variable, an
included variable no longer satisfies the retention
criteria, it is deleted from the model (MacNally,
2000). The retention criterion of variables in the
model runs was set on a probability value (p) of
below 0.05. The coefficient of determination (R2)
was used to express the model’s fit.
Multicollinearity among the explanatory variables
(Xs) means that causal Xs may be lost from ultimate
models because other, non-causal Xs are correlated
with those causal variables and may be retained in
models at their expense. To guard against the
negative effect that multicollinearity has on the
stability of regression coefficients and significance
levels (MacNally, 2000), variance inflation (Vif) was
calculated to indicate the rate of multicollinearity.
Variables were taken out of the modelling process
if their Vif score exceeded 30, which is a common
threshold to test for multicollinearity (O’Brien,
2007).
Model spatialization
To identify suitable seed material for plantation sites,
Arcmap’s grid calculator (ESRI, 2006) was used to
project spatially the developed multiple linear regres-
sion equation for each variety and ecotype. Height
growth of the respective variety and ecotypes is
calculated for each grid in the study area based on
the values of the environmental variables in those
grids. The equations have the general form:
pht8�b0�b1xi1�b2xi2� � � �bnxin for
i�1; 2; � � � n
where pht8�predicted average height performance
at age 8, b0�intercept, b1�Pearson’s correlation
coefficient with the dependant of first environmental
variable, xi1�value of first environmental variable
[. . .], bn�Pearson’s correlation coefficient with the
dependant of nth environmental variable, and xin�
value of nth environmental variable.
Current and future climate projections
The study area for which the site growth prediction
models were developed was restricted to the envir-
onments that resemble the actual environmental
niche in which the provenance trials are established.
This avoids an extrapolation of the regression func-
tions to environments where no empirical informa-
tion was available and impedes the prediction of
unrealistic and impossible height growths. A mask
grid was calculated that comprises only the study
area that has a similar bioclimatic set-up to the
climatic niche in which the trials were established.
The mask used the minimum and maximum values
of the 19 BIOCLIM variables at the trial sites. All
model operations use this mask as a template for
their predictions. By substituting the climate grids
for current conditions with climate grids for the
486 C. Leibing et al.
Downloaded By: [North Carolina State University] At: 14:50 13 September 2010
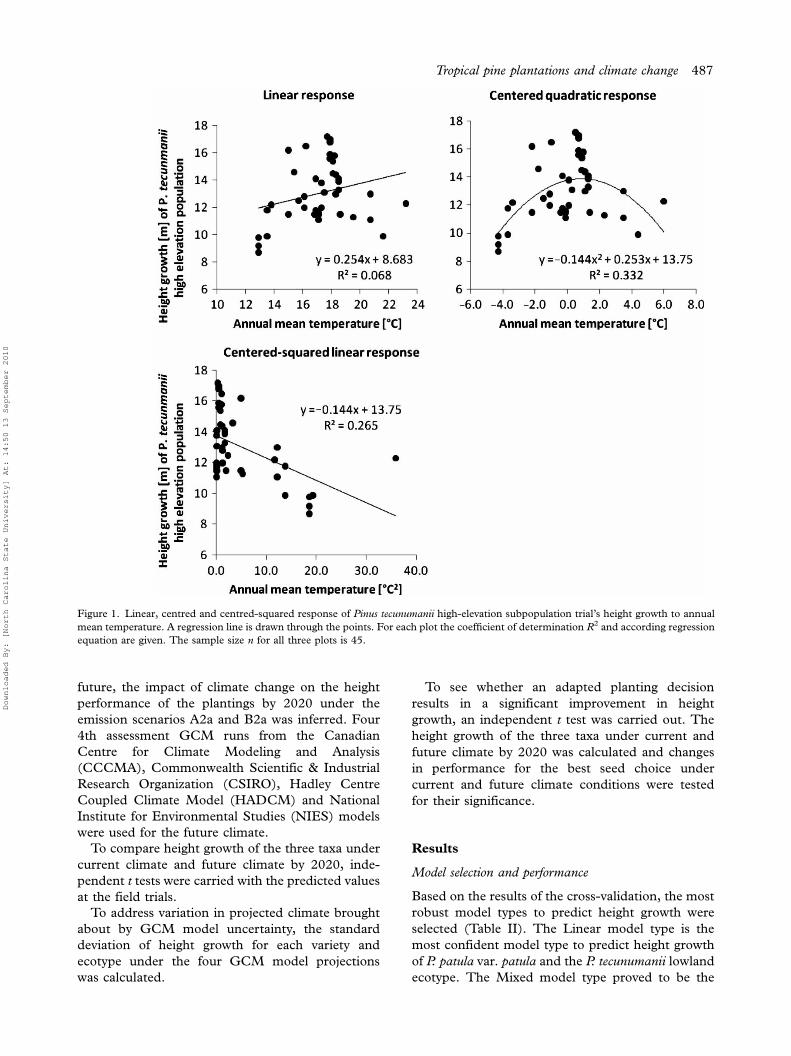
future, the impact of climate change on the height
performance of the plantings by 2020 under the
emission scenarios A2a and B2a was inferred. Four
4th assessment GCM runs from the Canadian
Centre for Climate Modeling and Analysis
(CCCMA), Commonwealth Scientific & Industrial
Research Organization (CSIRO), Hadley Centre
Coupled Climate Model (HADCM) and National
Institute for Environmental Studies (NIES) models
were used for the future climate.
To compare height growth of the three taxa under
current climate and future climate by 2020, inde-
pendent t tests were carried with the predicted values
at the field trials.
To address variation in projected climate brought
about by GCM model uncertainty, the standard
deviation of height growth for each variety and
ecotype under the four GCM model projections
was calculated.
To see whether an adapted planting decision
results in a significant improvement in height
growth, an independent t test was carried out. The
height growth of the three taxa under current and
future climate by 2020 was calculated and changes
in performance for the best seed choice under
current and future climate conditions were tested
for their significance.
Results
Model selection and performance
Based on the results of the cross-validation, the most
robust model types to predict height growth were
selected (Table II). The Linear model type is the
most confident model type to predict height growth
of P. patula var. patula and the P. tecunumanii lowland
ecotype. The Mixed model type proved to be the
Figure 1. Linear, centred and centred-squared response of Pinus tecunumanii high-elevation subpopulation trial’s height growth to annual
mean temperature. A regression line is drawn through the points. For each plot the coefficient of determination R2 and according regression
equation are given. The sample size n for all three plots is 45.
Tropical pine plantations and climate change 487
Downloaded By: [North Carolina State University] At: 14:50 13 September 2010
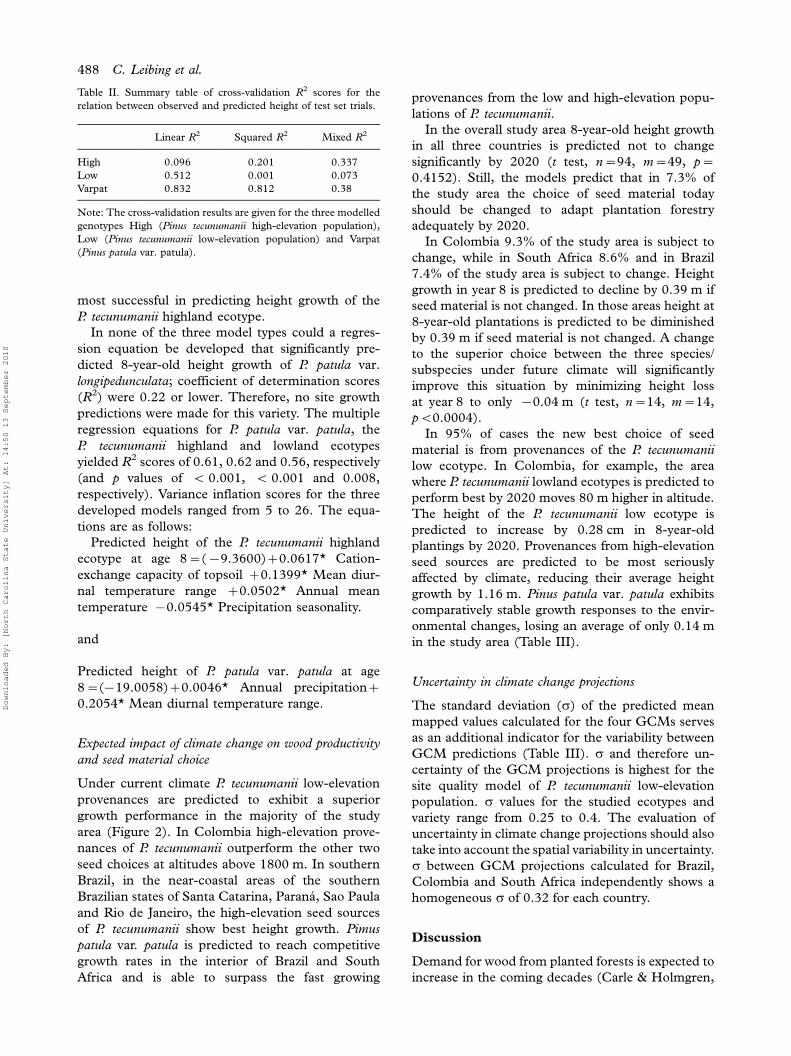
most successful in predicting height growth of the
P. tecunumanii highland ecotype.
In none of the three model types could a regres-
sion equation be developed that significantly pre-
dicted 8-year-old height growth of P. patula var.
longipedunculata; coefficient of determination scores
(R2) were 0.22 or lower. Therefore, no site growth
predictions were made for this variety. The multiple
regression equations for P. patula var. patula, the
P. tecunumanii highland and lowland ecotypes
yielded R2 scores of 0.61, 0.62 and 0.56, respectively
(and p values of B 0.001, B 0.001 and 0.008,
respectively). Variance inflation scores for the three
developed models ranged from 5 to 26. The equa-
tions are as follows:
Predicted height of the P. tecunumanii highland
ecotype at age 8�(�9.3600)�0.0617* Cation-
exchange capacity of topsoil �0.1399* Mean diur-
nal temperature range �0.0502* Annual mean
temperature �0.0545* Precipitation seasonality.
and
Predicted height of P. patula var. patula at age
8�(�19.0058)�0.0046* Annual precipitation�
0.2054* Mean diurnal temperature range.
Expected impact of climate change on wood productivity
and seed material choice
Under current climate P. tecunumanii low-elevation
provenances are predicted to exhibit a superior
growth performance in the majority of the study
area (Figure 2). In Colombia high-elevation prove-
nances of P. tecunumanii outperform the other two
seed choices at altitudes above 1800 m. In southern
Brazil, in the near-coastal areas of the southern
Brazilian states of Santa Catarina, Parana, Sao Paula
and Rio de Janeiro, the high-elevation seed sources
of P. tecunumanii show best height growth. Pimus
patula var. patula is predicted to reach competitive
growth rates in the interior of Brazil and South
Africa and is able to surpass the fast growing
provenances from the low and high-elevation popu-
lations of P. tecunumanii.
In the overall study area 8-year-old height growth
in all three countries is predicted not to change
significantly by 2020 (t test, n�94, m�49, p�
0.4152). Still, the models predict that in 7.3% of
the study area the choice of seed material today
should be changed to adapt plantation forestry
adequately by 2020.
In Colombia 9.3% of the study area is subject to
change, while in South Africa 8.6% and in Brazil
7.4% of the study area is subject to change. Height
growth in year 8 is predicted to decline by 0.39 m if
seed material is not changed. In those areas height at
8-year-old plantations is predicted to be diminished
by 0.39 m if seed material is not changed. A change
to the superior choice between the three species/
subspecies under future climate will significantly
improve this situation by minimizing height loss
at year 8 to only �0.04 m (t test, n�14, m�14,
pB0.0004).
In 95% of cases the new best choice of seed
material is from provenances of the P. tecunumanii
low ecotype. In Colombia, for example, the area
where P. tecunumanii lowland ecotypes is predicted to
perform best by 2020 moves 80 m higher in altitude.
The height of the P. tecunumanii low ecotype is
predicted to increase by 0.28 cm in 8-year-old
plantings by 2020. Provenances from high-elevation
seed sources are predicted to be most seriously
affected by climate, reducing their average height
growth by 1.16 m. Pinus patula var. patula exhibits
comparatively stable growth responses to the envir-
onmental changes, losing an average of only 0.14 m
in the study area (Table III).
Uncertainty in climate change projections
The standard deviation (s) of the predicted mean
mapped values calculated for the four GCMs serves
as an additional indicator for the variability between
GCM predictions (Table III). s and therefore un-
certainty of the GCM projections is highest for the
site quality model of P. tecunumanii low-elevation
population. s values for the studied ecotypes and
variety range from 0.25 to 0.4. The evaluation of
uncertainty in climate change projections should also
take into account the spatial variability in uncertainty.
s between GCM projections calculated for Brazil,
Colombia and South Africa independently shows a
homogeneous s of 0.32 for each country.
Discussion
Demand for wood from planted forests is expected to
increase in the coming decades (Carle & Holmgren,
Table II. Summary table of cross-validation R2 scores for the
relation between observed and predicted height of test set trials.
Linear R2 Squared R2 Mixed R2
High 0.096 0.201 0.337
Low 0.512 0.001 0.073
Varpat 0.832 0.812 0.38
Note: The cross-validation results are given for the three modelled
genotypes High (Pinus tecunumanii high-elevation population),
Low (Pinus tecunumanii low-elevation population) and Varpat
(Pinus patula var. patula).
488 C. Leibing et al.
Downloaded By: [North Carolina State University] At: 14:50 13 September 2010
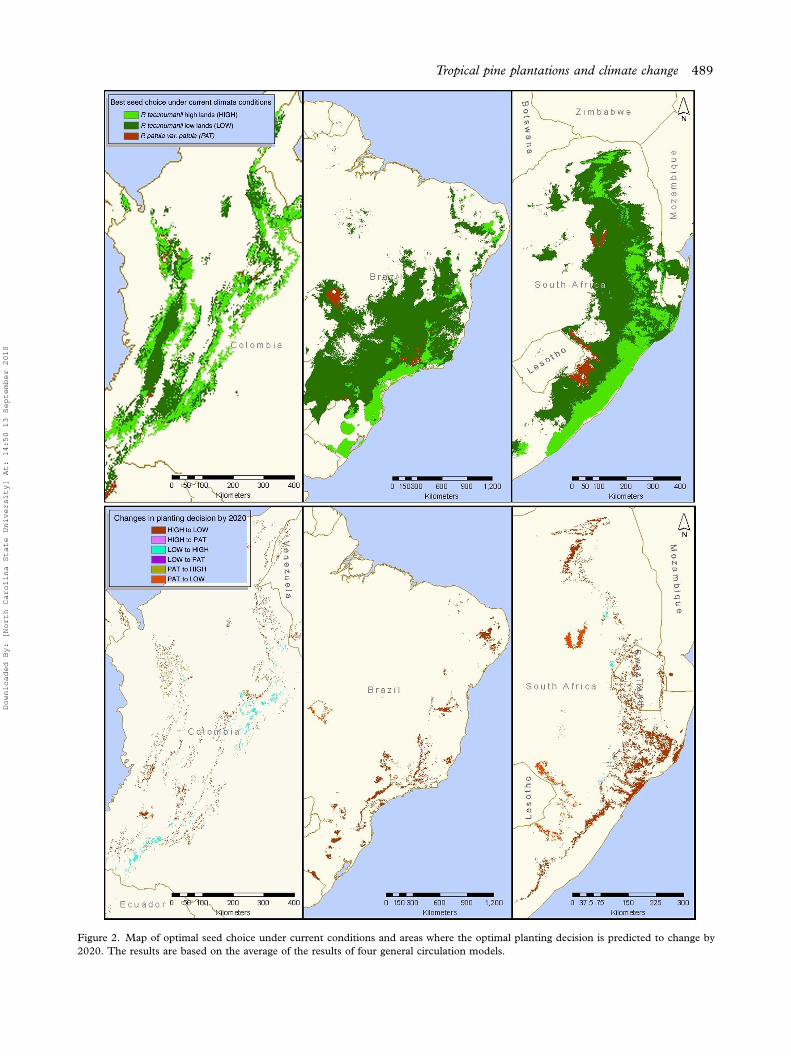
Figure 2. Map of optimal seed choice under current conditions and areas where the optimal planting decision is predicted to change by
2020. The results are based on the average of the results of four general circulation models.
Tropical pine plantations and climate change 489
Downloaded By: [North Carolina State University] At: 14:50 13 September 2010
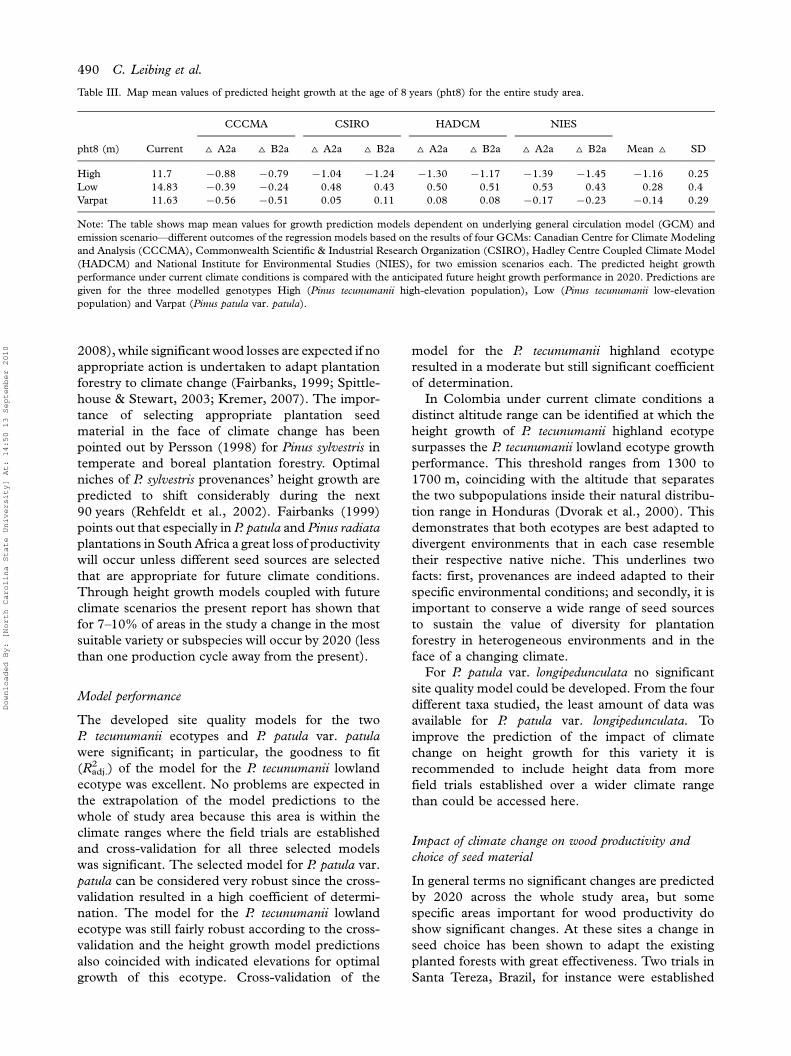
2008), while significant wood losses are expected if no
appropriate action is undertaken to adapt plantation
forestry to climate change (Fairbanks, 1999; Spittle-
house & Stewart, 2003; Kremer, 2007). The impor-
tance of selecting appropriate plantation seed
material in the face of climate change has been
pointed out by Persson (1998) for Pinus sylvestris in
temperate and boreal plantation forestry. Optimal
niches of P. sylvestris provenances’ height growth are
predicted to shift considerably during the next
90 years (Rehfeldt et al., 2002). Fairbanks (1999)
points out that especially in P. patula and Pinus radiata
plantations in South Africa a great loss of productivity
will occur unless different seed sources are selected
that are appropriate for future climate conditions.
Through height growth models coupled with future
climate scenarios the present report has shown that
for 7�10% of areas in the study a change in the most
suitable variety or subspecies will occur by 2020 (less
than one production cycle away from the present).
Model performance
The developed site quality models for the two
P. tecunumanii ecotypes and P. patula var. patula
were significant; in particular, the goodness to fit
(R2adj.) of the model for the P. tecunumanii lowland
ecotype was excellent. No problems are expected in
the extrapolation of the model predictions to the
whole of study area because this area is within the
climate ranges where the field trials are established
and cross-validation for all three selected models
was significant. The selected model for P. patula var.
patula can be considered very robust since the cross-
validation resulted in a high coefficient of determi-
nation. The model for the P. tecunumanii lowland
ecotype was still fairly robust according to the cross-
validation and the height growth model predictions
also coincided with indicated elevations for optimal
growth of this ecotype. Cross-validation of the
model for the P. tecunumanii highland ecotype
resulted in a moderate but still significant coefficient
of determination.
In Colombia under current climate conditions a
distinct altitude range can be identified at which the
height growth of P. tecunumanii highland ecotype
surpasses the P. tecunumanii lowland ecotype growth
performance. This threshold ranges from 1300 to
1700 m, coinciding with the altitude that separates
the two subpopulations inside their natural distribu-
tion range in Honduras (Dvorak et al., 2000). This
demonstrates that both ecotypes are best adapted to
divergent environments that in each case resemble
their respective native niche. This underlines two
facts: first, provenances are indeed adapted to their
specific environmental conditions; and secondly, it is
important to conserve a wide range of seed sources
to sustain the value of diversity for plantation
forestry in heterogeneous environments and in the
face of a changing climate.
For P. patula var. longipedunculata no significant
site quality model could be developed. From the four
different taxa studied, the least amount of data was
available for P. patula var. longipedunculata. To
improve the prediction of the impact of climate
change on height growth for this variety it is
recommended to include height data from more
field trials established over a wider climate range
than could be accessed here.
Impact of climate change on wood productivity and
choice of seed material
In general terms no significant changes are predicted
by 2020 across the whole study area, but some
specific areas important for wood productivity do
show significant changes. At these sites a change in
seed choice has been shown to adapt the existing
planted forests with great effectiveness. Two trials in
Santa Tereza, Brazil, for instance were established
Table III. Map mean values of predicted height growth at the age of 8 years (pht8) for the entire study area.
CCCMA CSIRO HADCM NIES
pht8 (m) Current ^ A2a ^ B2a ^ A2a ^ B2a ^ A2a ^ B2a ^ A2a ^ B2a Mean ^ SD
High 11.7 �0.88 �0.79 �1.04 �1.24 �1.30 �1.17 �1.39 �1.45 �1.16 0.25
Low 14.83 �0.39 �0.24 0.48 0.43 0.50 0.51 0.53 0.43 0.28 0.4
Varpat 11.63 �0.56 �0.51 0.05 0.11 0.08 0.08 �0.17 �0.23 �0.14 0.29
Note: The table shows map mean values for growth prediction models dependent on underlying general circulation model (GCM) and
emission scenario*different outcomes of the regression models based on the results of four GCMs: Canadian Centre for Climate Modeling
and Analysis (CCCMA), Commonwealth Scientific & Industrial Research Organization (CSIRO), Hadley Centre Coupled Climate Model
(HADCM) and National Institute for Environmental Studies (NIES), for two emission scenarios each. The predicted height growth
performance under current climate conditions is compared with the anticipated future height growth performance in 2020. Predictions are
given for the three modelled genotypes High (Pinus tecunumanii high-elevation population), Low (Pinus tecunumanii low-elevation
population) and Varpat (Pinus patula var. patula).
490 C. Leibing et al.
Downloaded By: [North Carolina State University] At: 14:50 13 September 2010
using seeds from high-elevation populations of
P. tecunumanii. Observed and predicted heights on
this site differ by just 0.05 m. The regression model
predicts that on this site low-elevation seed sources
would yield the same height growth under current
climate conditions. Height growth predictions for
the 2020 projections suggest that provenances from
the low-elevation population of P. tecunumanii will
reach 13.7 m in height at 8 years, while the high-
elevation population will reach only 12.09 m. This is
a significant difference and should be an important
criterion used today in selecting seed material for
this site.
Pinus tecunumanii lowland ecotype is expected to
be the most suitable seed material to plant for the
next rotation because of its promising performance
under rather hot and wet climates. On sites in South
Africa where P. patula var. patula is planted, seed
material from P. tecunumanii lowland provenances is
either already more suitable or will become more
suitable by 2020 (Figure 2).
This analysis concentrated on 2020 climates in
order to capture the climate during rotations being
planted today. However, the impacts of climate
change are expected to become more drastic in the
second half of the twenty-first century. The results of
this analysis could form the basis for exploring the
longer term future of plantation forestry in tropical
sites, and evaluate what seed materials are necessary
to sustain plantation forestry in Colombia, Brazil
and South Africa.
Implications for the conservation of genetic resources
In most plantation areas of Colombia, Brazil and
South Africa, seed material of P. tecunumanii lowland
ecotypes appears to be the best seed choice for wood
productivity under the current climate and becomes
even more important in the next two decades.
However, the analysis also shows the value of
diversity, at both the genetic and the species level.
Unfortunately, the lowland ecotypes of P. tecunumanii
in the wild are most threatened by predicted climate
change (van Zonneveld et al., 2009a). This coincides
with studies about the impact of climate change on
the natural distribution of other tropical pines that
demonstrate that lowland provenances will be most
negatively affected by climate change (Saenz-Romero
et al., 2006; van Zonneveld et al., 2009b). Appro-
priate action needs to be taken to conserve these
valuable genetic resources. Saenz-Romero et al.
(2006) propose seed transfer of lowland P. oocarpa
provenances in the wild to higher altitudes in the
natural distribution of this species. Another possibi-
lity is conservation outside its natural distribution
ranges in climate-proofed conservation parks (van
Zonneveld et al., 2009a). CAMCORE members are
currently establishing conservation parks to protect
provenances of economically important tree species
(CAMCORE, 2009). Further studies could broaden
the analysis to look at other factors, and link with
economic models to evaluate the true cost of adapta-
tion of plantation forestry and support management
plans.
Evaluation criteria for tree performance
The site quality models in this study only incorpo-
rate height growth to assess the quality of the sites.
This is one of the most important commercial
characteristics, but other criteria are also important
when evaluating the potential of different prove-
nances. These include stem form, aberrant growth
appearances, disease tolerance, resin content and
branching or rooting characteristics. Of particular
importance is the issue of frequent stem breakage,
which is frequently observed in P. tecunumanii
plantations, where on the worst sites 30�40% of
the trees are affected. The propensity for the main
stem to break in its upper crown is thought to be the
greatest limitation to using P. tecunumanii in the
tropics and subtropics (Dvorak et al., 2001a).
Disease tolerance is another critical characteristic
that eventually determines the value of the seed
material for future plantation projects. The success
of exotic tree species has generally been attributed
to effective species�site matching and their freedom
from insect pests and diseases in tropical planta-
tions. There is now the fear that climate change
will induce catastrophic outbreaks of pests and
diseases in native and exotic forest plantations. The
consideration of biotic risk factors could greatly
improve the applicability of future site quality
models.
Conclusions
In this study the need to change the currently used
seed material of P. patula and P. tecunumanii in the
existing plantation areas was evaluated to optimize
wood productivity in the face of climate change in
the next rotations. Overall, no significant changes in
wood productivity are predicted. Still, several for-
estry areas are substantially impacted. In those areas
a change to a better adapted seed material is
expected to sustain wood products under a changing
climate. Provenances of P. tecunumanii low-elevation
ecotypes are already important sources of seed
material and are predicted to be become an even
more important seed material by 2020 because of
their good performance under the warmer and
wetter climate conditions predicted for the future.
Tropical pine plantations and climate change 491
Downloaded By: [North Carolina State University] At: 14:50 13 September 2010
The models presented here form the basis for
developing site-specific decision support models
for selecting planting material under a dynamic
climate.
Acknowledgements
The corresponding author would like to express his
gratitude to the Ausgleichsstiftung Landwirtschaft
und Umwelt, whose financial support enabled
his thesis. We would further like to thank the
CAMCORE members in Brazil, Colombia and
South Africa for establishing, maintaining and mea-
suring the research field plantings of P. patula and
P. tecunumanii. We would like to thank William
Woodbridge, Camcore data manager, for his assis-
tance in preparing the large data sets for analysis and
for providing support and updates throughout the
course of the study. We thank Arjan de Bruijn for his
valuable advice in the development of the site quality
models and appreciate the valuable comments of two
anonymous reviewers. Finally, we would like to
thank Julian Ramirez Villegas, Edward Guevara
and James Garcia from the agro-ecosystems resi-
lience office in CIAT for their help and advice on the
computation and implementation of the regression
functions.
References
Bedrick, E. J. (2000). Checking for lack of fit in linear models with
parametric variance functions. Technometrics, 42, 227�236.
Birks, J. S. & Barnes, R. D. (1990). Provenance variation in Pinus
caribaea, P. oocarpa and P. patula ssp. P. tecunumanii. Tropical
Forestry Papers.
Busby, J. R. (1991). BIOCLIM��A bioclimatic analysis and
prediction system. In C. R. Margules, & M. P. Austin
(Eds.), Nature conservation: Cost effective biological surveys
and data analysis (pp. 64�68). Canberra: CSIRO.
Carle, J. & Holmgren, P. (2008). Wood from planted forests: A
global outlook 2005�2030. Forest Products Journal, 58(12),
6�18.
Dise, N. B. & Wright, R. F. (2000). Nitrogen leaching from
European forests in relation to nitrogen deposition. Forest
Ecology and Management, 71, 153�161.
Dvorak, W. S., Balocchi, C. E. & Raymond, R. H. (1989).
Performance and stability of provenances and families of
Pinus tecunumanii in the tropics and subtropics. In G. L.
Gibson, A. R. Griffin & A. C. Matheson (Eds.), Breeding
tropical trees: Population structure and genetic improvement
strategies in clonal and seedling forestry. Proceedings of the
IUFRO Conference, Pattaya, Thailand, November 1988.
Oxford: Oxford Forestry Institute; Arlington, VA: Winrock
International (pp. 187�196).
Dvorak, W. S., Donahue, J. H. & Vasquez, J. A. (1995). Early
performance of CAMCORE introductions of Pinus patula in
Brazil, Colombia and South Africa. South African Forestry
Journal, 174, 23�32.
Dvorak, W. S., Hodge, G. R., Kietzka, J. E., Malan, F., Osorio, L.
F. & Stanger, T. K. (2000). Pinus patula. In Conservation and
testing of tropical and subtropical forest tree species by the
CAMCORE Cooperative (pp. 148�173). Raleigh, NC: Col-
lege of Natural Resources, North Carolina State University.
Dvorak, W. S., Hodge, G. R. & Romero, J. L. (2001a). Results of
twenty years of research on Pinus tecunumanii by the
CAMCORE Cooperative. Forest Genetic Resources, 29.
Dvorak, W. S., Jordan, A. P., Romero, J. L., Hodge, G. R. &
Furman, B. J. (2001b). Quantifying the geographic range of
Pinus patula var longipedunculata in southern Mexico using
morphologic and RAPD marker data. South African Forestry
Journal, 192, 19�30.
ESRI (1982�2006). Arc 9.2 Arc/Info. Environmental Systems
Research Institute.
Fairbanks, D. (1999). South African country study on climate
change: Vulnerability and adaptation assessment for plantation
forestry. Pretoria: National Research Foundation.
FAO (2007). State of the world’s forests 2007. Rome: Food and
Agriculture Organization of the United Nations.
FAO/IIASA/ISRIC/ISSCAS/JRC (2009). Harmonized world soil
database (version 1.1). Rome: Food and Agriculture Organi-
zation of the United Nations; Laxenburg: IIASA.
Hijmans, R. J., Cameron, S. E., Parra, J. L., Jones, P. G. & Jarvis,
A. (2005). Very high resolution interpolated climate surfaces
for global land areas. International Journal of Climatology, 25,
1965�1978.
Hodge, G. R. & Dvorak, W. S. (1999). Genetic parameters and
provenance variation of Pinus tecunumanii in 78 international
trials. Forest Genetics, 6, 157�180.
Hurvich, C. M. & Tsai, C. L. (1990). The impact of model
selection on inference in linear regression. American Statis-
tician, 44, 214�217.
Huston, M. (1980). Soil nutrients and tree species richness in
Costa Rican forests. Journal of Biogeography, 7, 147�157.
Jarvis, A., Reuter, H. I., Nelson, A. & Guevara, E. (2008). Hole-
filled seamless SRTM data V4. International Centre for
Tropical Agriculture (CIAT), available from http://
srtm.csi.cgiar.org
Kanzler, A. (2002). Genotype�environment interaction in Pinus
patula and its implications in South Africa. PhD dissertation,
Department of Forestry, North Carolina State University,
Raleigh, NC.
Kremer, A. (2007). How well can existing forests withstand
climate change? In J. Koskela, A. Buck, & E. Teissier du
Cros (Eds.), Climate change and forest genetic diversity:
Implications for sustainable forest management in Europe
(pp. 3�17). Rome: Bioversity International.
Louw, J. H. & Scholes, M. C. (2006). Site index functions using
site descriptors for Pinus patula plantations in South Africa.
Forest Ecology and Management, 225, 94�103.
MacNally, R. (2000). Regression and model-building in conser-
vation biology, biogeography and ecology: The distinction
between*and reconciliation of*‘‘predictive’’ and ‘‘explana-
tory’’ models. Biodiversity and Conservation, 9, 655�671.
O’Brien, R. M. (2007). A caution regarding rules of thumb for
variance inflation factors. Quality and Quantity, 41, 673�690.
Persson, B. (1998). Will climate change affect the optimal choice
of Pinus sylvestris provenances? Silva Fennica, 32, 121�128.
Rehfeldt, G. E., Tchebakova, N. M., Parfenova, Y. I., Wykoff,
W. R., Kuzmina, N. A. & Milyutin, L. I. (2002). Intraspecific
responses to climate in Pinus sylvestris. Global Change Biology,
8, 912�929.
Saenz-Romero, C., Guzman-Reyna, R. R. & Rehfeldt, G. E.
(2006). Altitudinal genetic variation among Pinus oocarpa
populations in Michoacan, Mexico: Implications for seed
zoning, conservation, tree breeding and global warming.
Forest Ecology and Management, 229, 340�350.
Savolainen, O., Bokma, F., Knurr, T., Karkkainen, K., Pyhajarvi,
T. & Wachowiak, W. (2007). Adaptation of forest trees to
492 C. Leibing et al.
Downloaded By: [North Carolina State University] At: 14:50 13 September 2010

climate change. Climate change and forest genetic diversity.
In J. Koskela, A. Buck, & E. Teissier du Cros (Eds.), Climate
change and forest genetic diversity: Implications for sustainable
forest management in Europe (pp. 19�30). Rome: Bioversity
International.
Spittlehouse, D. L. & Stewart, R. B. (2003). Adaptation to climate
change in forest management. BC Journal of Ecosystems and
Management, 4(1), 1�11.
van Zonneveld, M. J., Jarvis, A., Dvorak, W., Lema, G. & Leibing,
C. (2009a). Validation of climate change impact predictions
on Mexican and Central American pine species. Forest
Ecology and Management, 257, 1566�1576.
van Zonneveld, M., Koskela, J., Vinceti, B. & Jarvis, A. (2009b).
Impact of climate change on the distribution of tropical pines
in Southeast Asia. Unasylva, 231/232, 24�29.
Tropical pine plantations and climate change 493
Downloaded By: [North Carolina State University] At: 14:50 13 September 2010
Forests 2013, 4, 155-178; doi:10.3390/f4010155
forests
ISSN 1999-4907
www.mdpi.com/journal/forests
Article
Selection of Provenances to Adapt Tropical Pine Forestry to
Climate Change on the Basis of Climate Analogs
Christoph Leibing 1,*, Johannes Signer
2, Maarten van Zonneveld
3,4, Andrew Jarvis
2 and
William Dvorak 5
1 Centre for Wood Science and Technology, University of Hamburg, Hamburg, Germany 2 International Centre of Tropical Agriculture (CIAT), Cali, Colombia;
E-Mails: [email protected] (J.S.); [email protected] (A.J.) 3 Bioversity International, Americas Office, Cali, Colombia; E-Mail: [email protected] 4 Ghent University, Faculty of Bioscience Engineering, Coupure Links 653, 9000 Gent, Belgium 5 International Tree Breeding and Conservation Program (Camcore), North Carolina State University,
Raleigh, NC, USA; E-Mail: [email protected]
* Author to whom correspondence should be addressed; E-Mail: [email protected];
Tel.: +421-915-394396; Fax: +421-232-782111.
Received: 14 August 2012; in revised form: 20 February 2013 / Accepted: 25 February 2013 /
Published: 20 March 2013
Abstract: Pinus patula and Pinus tecunumanii play an important role in the forestry sector
in the tropics and subtropics and, in recent decades, members of the International Tree
Breeding and Conservation Program (Camcore) at North Carolina State University have
established large, multi-site provenance trials for these pine species. The data collected in
these trials provide valuable information about species and provenance choice for plantation
establishment in many regions with different climates. Since climate is changing rapidly, it
may become increasingly difficult to choose the right species and provenance to plant. In this
study, growth performance of plantings in Colombia, Brazil and South Africa was correlated
to the degree of climatic dissimilarity between planting sites. Results are used to assess the
suitability of seed material under a changing climate for four P. patula provenances and six
P. tecunumanii provenances. For each provenance, climate dissimilarities based on
standardized Euclidean distances were calculated and statistically related to growth
performances. We evaluated the two methods of quantifying climate dissimilarity with
extensive field data based on the goodness of fit and statistical significance of the climate
distance relation to differences in height growth. The best method was then used as a
predictor of a provenance change in height growth. The provenance-specific models were
OPEN ACCESS
Forests 2013, 4 156
used to predict provenance performance under different climate change scenarios. The
developed provenance-specific models were able to significantly relate climate similarity to
different growth performances for five out of six P. tecunumanii provenances. For P. patula
provenances, we did not find any correlation. Results point towards the importance of the
identification of sites with stable climates where high yields are achievable. In such sites,
fast-growing P. tecunumanii provenances with a high but narrow growth optimum can be
planted. At sites with climate change of uncertain direction and magnitude, the choice of
P. patula provenances, with greater tolerance towards different temperature and
precipitation regimes, is recommended. Our results indicate that the analysis of provenance
trial data with climate similarity models helps us to (1) maintain plantation productivity in a
rapidly changing environment; and (2) improve our understanding of tree species’
adaptation to a changing climate.
Keywords: provenance trials; site quality modelling; management decision support tools;
climate similarity; growth prediction
1. Introduction
1.1. Background
Climate change, and the associated shifts and changes in temperature and precipitation patterns, are
likely to affect substantial areas of forest plantation production in the tropics and subtropics. Progressive
climate change may make the choice of which species and provenance to plant increasingly difficult.
Statistical models, as well as process- and ecophysiologically-based models, suggest a substantial loss of
production in plantation forestry, unless appropriate action is taken. It is common practice to choose seed
material which is climatically suited to the planting site. However, if climate change proceeds as
predicted [1], seed material that is well matched under the current climate will grow in sub-optimal
conditions within the production cycles of the upcoming decades [2]. Forest plantations will need to take
anticipated climate conditions into account in order to maintain productivity in future harvest cycles.
Therefore, seed material, adapted to the novel climate conditions, needs to be immediately identified and
selected [3,4]. Sustaining production by identifying the right seed sources for specific sites needs to
happen in a time where planted forests become increasingly important to meeting global wood demand
and potentially relieving pressure on natural forests in the face of growing demand and dwindling
supplies [5–7]. Furthermore, the potential of planted forests to sequester substantial amounts of carbon
constitutes an important cornerstone in global climate change mitigation strategies (e.g., [8,9]).
International multi-site provenance trials that measure growth performances of different seed sources
in a range of different climates, provide a wealth of information on the adaptive capacity of species
provenances that may facilitate selection of seed material for changing climate conditions. Camcore,
North Carolina State University (International Tree Breeding and Conservation Program) collected
seeds from 40 tropical and subtropical tree species in natural stands. In the last three decades, these seed
collections were used to establish more than 1000 ha of field trials [10]. Data from these trials, coupled
Forests 2013, 4 157
with high resolution climate data, provides useful information to predict how the growth of
economically important plantation tree species is affected by progressive climate change.
1.2. The Analogue Method
Climate analogs are a promising approach to assess differences in provenance performance and their
relation to climatic factors. A spatial climate analog in our context, where we want to know which
provenance to plant in future climates, draws insights from a location where knowledge on the
interaction of climate and tree growth exists and relates these insights to locations in other areas with a
similar climate. A temporal climate analog analyses knowledge on past interactions between climate and
growth performance to develop an understanding of the present day and make inferences about the
future [11,12]. The analog method can help to identify spatial and temporal analog sites to provide
insights into the vulnerability of crops or species to climate change, support field evaluation, and create a
network through which knowledge on well-adapted cultivars can be passed on. The analog method may
also prove to be a very useful tool in pointing decision makers in the forestry sector in the right
direction—to support a rational planting decision and sustain, or even improve, wood production in a
rapidly changing environment.
Calculating climate dissimilarities (identifying locations which resemble current climate conditions
that are expected to be encountered at another location in the future) for the purpose of providing
decision support in a changing environment has lately received a great deal of attention (e.g., [13–15]).
In the forestry sector, the concept of identifying similarities in climate to match forest seed material to
certain sites, in order to assist species selection, is a well-established approach (e.g., [16–18]).
1.3. Research Objectives
In this study, we assess the extent to which the climate analog method can provide concrete
recommendations to adapt planted forests to climate change through a better use of forest genetic
resources. We ascertain this question in a case study in which we test the ability of this approach to relate
climate dissimilarity to the trial’s growth performance. This approach lets us identify appropriate seed
material of P. patula and P. tecunumanii for degraded areas and established planted forests in Colombia,
Brazil and South Africa.
First, we evaluated with P. patula and P. tecunumanii provenance trial data, which, with two ways to
measure climate dissimilarity, correlates better with provenance height growth. Secondly, we show how
the analog method that resulted in dissimilarity measures that correlated better with height can be used to
identify well-adapted provenances for specific plantation sites. We use P. patula and P. tecunumanii as
model species to demonstrate the potential and the restrictions in the application of climate analogs to
support management plans to adapt existing and planned forest plantations with expected harvest times
around 2030 and 2050.
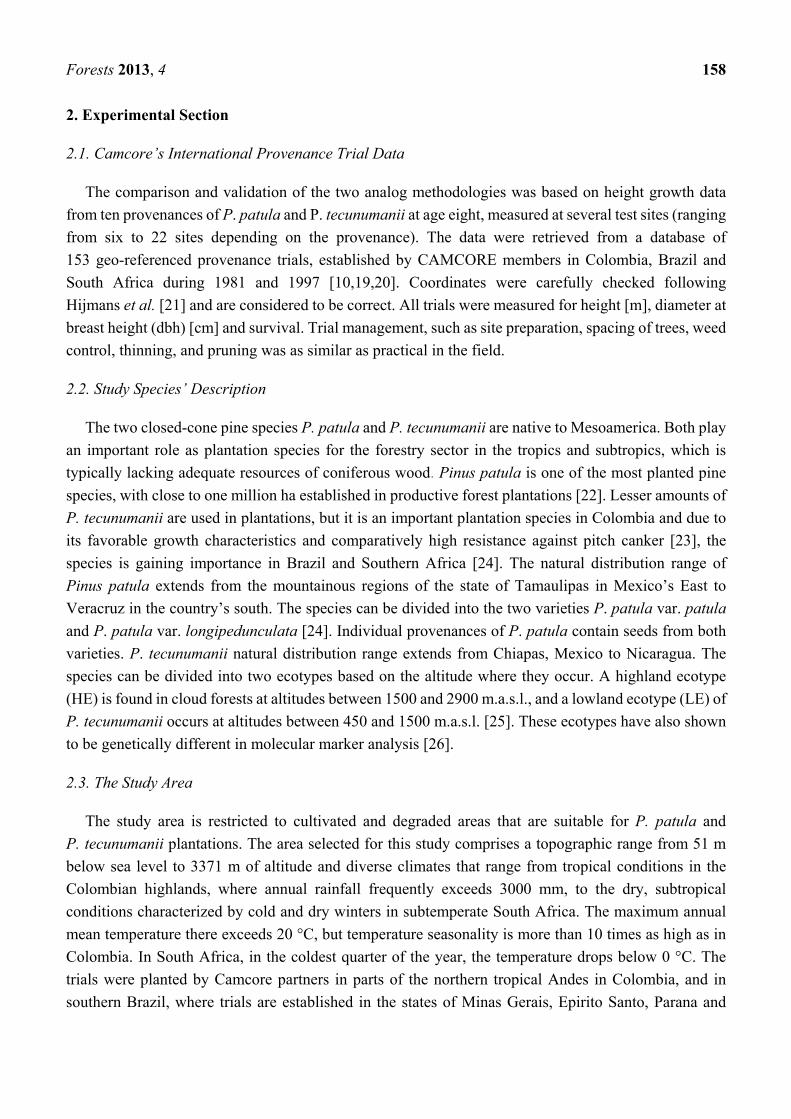
Forests 2013, 4 158
2. Experimental Section
2.1. Camcore’s International Provenance Trial Data
The comparison and validation of the two analog methodologies was based on height growth data
from ten provenances of P. patula and P. tecunumanii at age eight, measured at several test sites (ranging
from six to 22 sites depending on the provenance). The data were retrieved from a database of
153 geo-referenced provenance trials, established by CAMCORE members in Colombia, Brazil and
South Africa during 1981 and 1997 [10,19,20]. Coordinates were carefully checked following
Hijmans et al. [21] and are considered to be correct. All trials were measured for height [m], diameter at
breast height (dbh) [cm] and survival. Trial management, such as site preparation, spacing of trees, weed
control, thinning, and pruning was as similar as practical in the field.
2.2. Study Species’ Description
The two closed-cone pine species P. patula and P. tecunumanii are native to Mesoamerica. Both play
an important role as plantation species for the forestry sector in the tropics and subtropics, which is
typically lacking adequate resources of coniferous wood. Pinus patula is one of the most planted pine
species, with close to one million ha established in productive forest plantations [22]. Lesser amounts of
P. tecunumanii are used in plantations, but it is an important plantation species in Colombia and due to
its favorable growth characteristics and comparatively high resistance against pitch canker [23], the
species is gaining importance in Brazil and Southern Africa [24]. The natural distribution range of
Pinus patula extends from the mountainous regions of the state of Tamaulipas in Mexico’s East to
Veracruz in the country’s south. The species can be divided into the two varieties P. patula var. patula
and P. patula var. longipedunculata [24]. Individual provenances of P. patula contain seeds from both
varieties. P. tecunumanii natural distribution range extends from Chiapas, Mexico to Nicaragua. The
species can be divided into two ecotypes based on the altitude where they occur. A highland ecotype
(HE) is found in cloud forests at altitudes between 1500 and 2900 m.a.s.l., and a lowland ecotype (LE) of
P. tecunumanii occurs at altitudes between 450 and 1500 m.a.s.l. [25]. These ecotypes have also shown
to be genetically different in molecular marker analysis [26].
2.3. The Study Area
The study area is restricted to cultivated and degraded areas that are suitable for P. patula and
P. tecunumanii plantations. The area selected for this study comprises a topographic range from 51 m
below sea level to 3371 m of altitude and diverse climates that range from tropical conditions in the
Colombian highlands, where annual rainfall frequently exceeds 3000 mm, to the dry, subtropical
conditions characterized by cold and dry winters in subtemperate South Africa. The maximum annual
mean temperature there exceeds 20 °C, but temperature seasonality is more than 10 times as high as in
Colombia. In South Africa, in the coldest quarter of the year, the temperature drops below 0 °C. The
trials were planted by Camcore partners in parts of the northern tropical Andes in Colombia, and in
southern Brazil, where trials are established in the states of Minas Gerais, Epirito Santo, Parana and
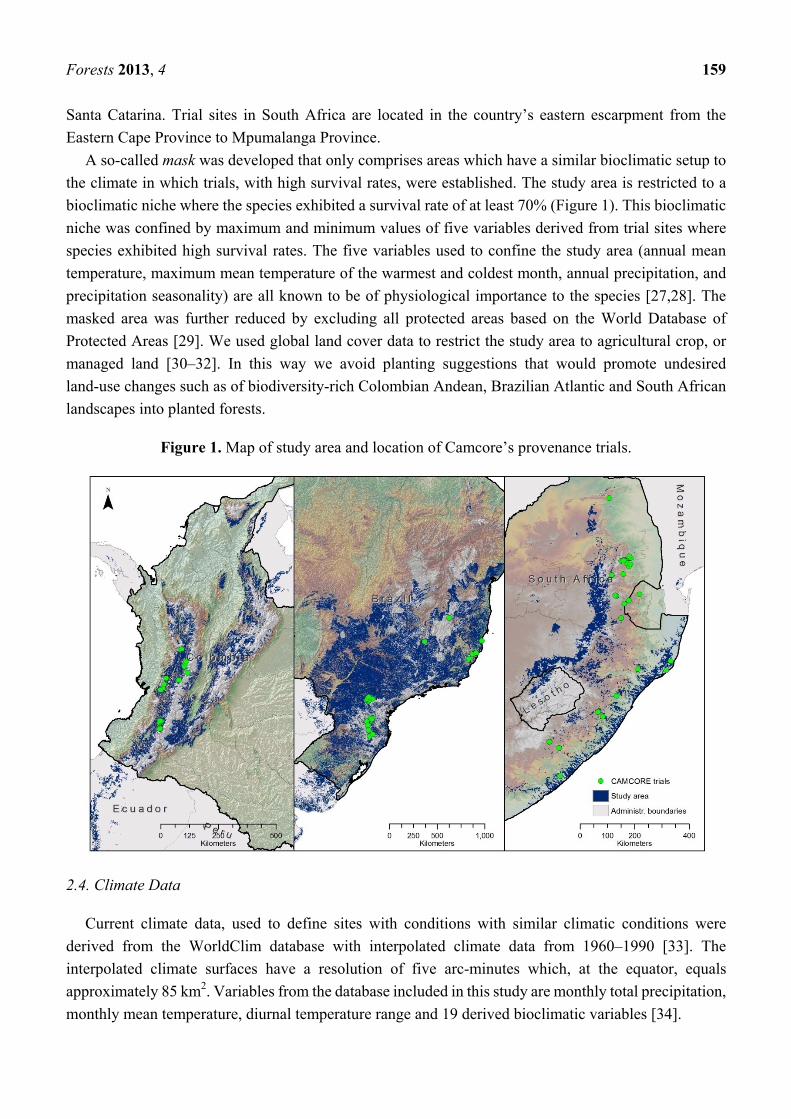
Forests 2013, 4 159
Santa Catarina. Trial sites in South Africa are located in the country’s eastern escarpment from the
Eastern Cape Province to Mpumalanga Province.
A so-called mask was developed that only comprises areas which have a similar bioclimatic setup to
the climate in which trials, with high survival rates, were established. The study area is restricted to a
bioclimatic niche where the species exhibited a survival rate of at least 70% (Figure 1). This bioclimatic
niche was confined by maximum and minimum values of five variables derived from trial sites where
species exhibited high survival rates. The five variables used to confine the study area (annual mean
temperature, maximum mean temperature of the warmest and coldest month, annual precipitation, and
precipitation seasonality) are all known to be of physiological importance to the species [27,28]. The
masked area was further reduced by excluding all protected areas based on the World Database of
Protected Areas [29]. We used global land cover data to restrict the study area to agricultural crop, or
managed land [30–32]. In this way we avoid planting suggestions that would promote undesired
land-use changes such as of biodiversity-rich Colombian Andean, Brazilian Atlantic and South African
landscapes into planted forests.
Figure 1. Map of study area and location of Camcore’s provenance trials.
2.4. Climate Data
Current climate data, used to define sites with conditions with similar climatic conditions were
derived from the WorldClim database with interpolated climate data from 1960–1990 [33]. The
interpolated climate surfaces have a resolution of five arc-minutes which, at the equator, equals
approximately 85 km2. Variables from the database included in this study are monthly total precipitation,
monthly mean temperature, diurnal temperature range and 19 derived bioclimatic variables [34].
Forests 2013, 4 160
We use an ensemble of General Circulation Models (GCMs) to develop climate layers for 2030’s and
2050’s future climate (Table 1). We use three emission scenarios to account for uncertainties in
global socioeconomic developments (15 GCM for scenario A1b, 12 for A2 and 14 for B1). These
scenarios allow for variations in variables that are related to human population and economic growth and
the degree at which technological advances are developed, implemented and exchanged. The three
scenarios used in this study are taken from IPCCs 4th special report on Emission Scenarios [3] and
reflect the following:
1. a homogeneous world with rapid economic growth that relies on a balance of all energy sources
(emission scenario A1b);
2. a more divided world with focus on regionally oriented economic development and slower and
more fragmented technological changes (emission scenario A2);
3. an integrated world that is more ecologically friendly and emphasizes global solutions to achieve
economic, social and environmental stability (emission scenario B1) [3].
Table 1. List of 20 GCMs used to calculate of climatic dissimilarities for the year 2030
and 2050.
GCM Developed by Institute-/Model Name
BCCR-BCM 2.0 Bjerknes Centre for Climate Research University of Bergen, Norway
CNRM-CM 3
Centre Européen de Recherche et de
Formation Avancée en Calcul
Scientifique
Centre National de la Recherche
Scientifique
GFDL CM 2.0 and 2.1 Geophysical Fluid Dynamics LaboratoryNational Oceanic and Atmospheric
Administration
GISS Model ER and
AOM Goddard Institute for Space Studies
National Aeronautics and Space
Administration
IPSL CM 4 Institute Pierre Simon Laplace Centre National de la Recherche
Scientifique
MIUB ECHO-G Meteorologisches Institut der Universität
Bonn Friedrich-Wilhelms Universität Bonn
NCAR CCM 3.0 National Center for Atmospheric
Research Community Climate System Model
CCCMA CGCM 3.1
t46 and t63
Canadian Centre for Climate Modelling
and Analysis Meteorological Service of Canada
CSIRO Mk 3.0 and 3.5 Commonwealth Scientific and Industrial
Research Organisation
Marine and Atmospheric Research
Laboratories
IAP FGOALS g1.0 Institute of Atmospheric Physics Chinese Academy of Sciences
MIROC 3.2 Hires and
Medres
Centre for Climate System Research,
Tokyo
Model for Interdisciplinary Research On
Climate
MPI ECHAM 5 Max Planck Institute for Meteorology European Centre Hamburg Model
UKMO HADCM 3 United Kingdom Meteorological Office Hadley Centre Climate Model
INM CM 3.0 Institute of Numerical Mathematics Russian Academy of Science
MRI CGCM 2.3 2a Meteorological Research Institute, Japan Coupled General Circulation Model
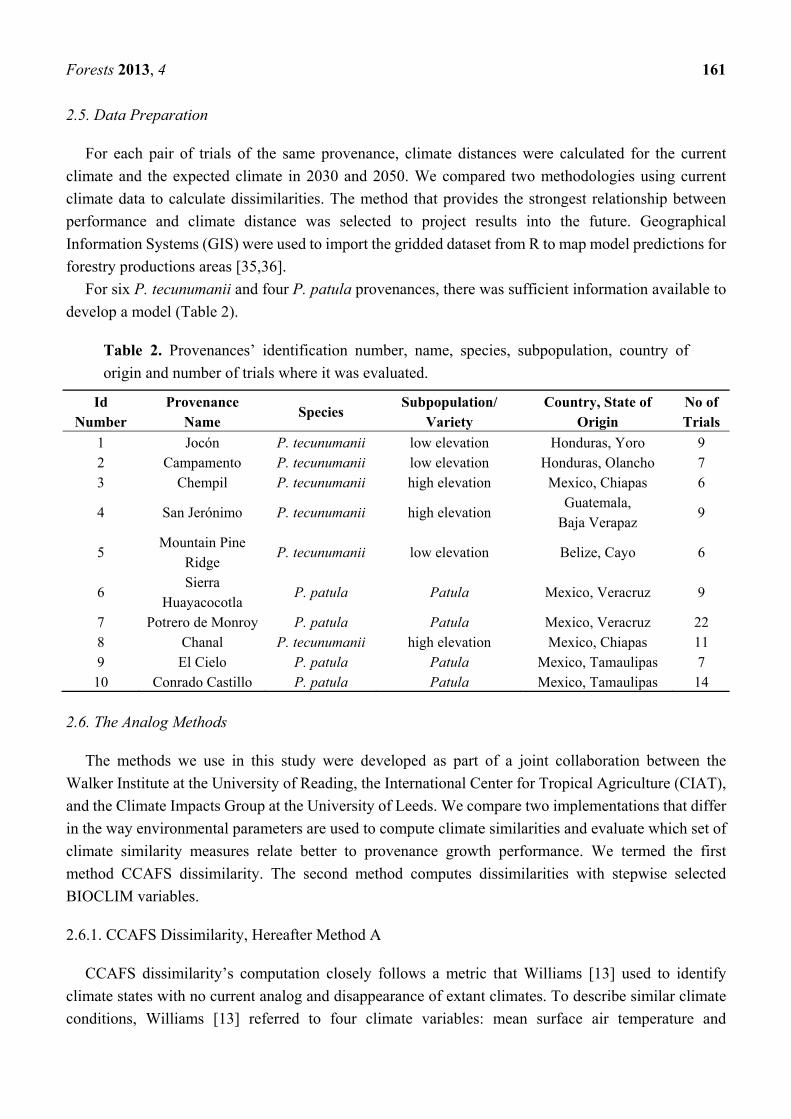
Forests 2013, 4 161
2.5. Data Preparation
For each pair of trials of the same provenance, climate distances were calculated for the current
climate and the expected climate in 2030 and 2050. We compared two methodologies using current
climate data to calculate dissimilarities. The method that provides the strongest relationship between
performance and climate distance was selected to project results into the future. Geographical
Information Systems (GIS) were used to import the gridded dataset from R to map model predictions for
forestry productions areas [35,36].
For six P. tecunumanii and four P. patula provenances, there was sufficient information available to
develop a model (Table 2).
Table 2. Provenances’ identification number, name, species, subpopulation, country of
origin and number of trials where it was evaluated.
Id
Number
Provenance
Name Species
Subpopulation/
Variety
Country, State of
Origin
No of
Trials
1 Jocón P. tecunumanii low elevation Honduras, Yoro 9
2 Campamento P. tecunumanii low elevation Honduras, Olancho 7
3 Chempil P. tecunumanii high elevation Mexico, Chiapas 6
4 San Jerónimo P. tecunumanii high elevation Guatemala,
Baja Verapaz 9
5 Mountain Pine
Ridge P. tecunumanii low elevation Belize, Cayo 6
6 Sierra
Huayacocotla P. patula Patula Mexico, Veracruz 9
7 Potrero de Monroy P. patula Patula Mexico, Veracruz 22
8 Chanal P. tecunumanii high elevation Mexico, Chiapas 11
9 El Cielo P. patula Patula Mexico, Tamaulipas 7
10 Conrado Castillo P. patula Patula Mexico, Tamaulipas 14
2.6. The Analog Methods
The methods we use in this study were developed as part of a joint collaboration between the
Walker Institute at the University of Reading, the International Center for Tropical Agriculture (CIAT),
and the Climate Impacts Group at the University of Leeds. We compare two implementations that differ
in the way environmental parameters are used to compute climate similarities and evaluate which set of
climate similarity measures relate better to provenance growth performance. We termed the first
method CCAFS dissimilarity. The second method computes dissimilarities with stepwise selected
BIOCLIM variables.
2.6.1. CCAFS Dissimilarity, Hereafter Method A
CCAFS dissimilarity’s computation closely follows a metric that Williams [13] used to identify
climate states with no current analog and disappearance of extant climates. To describe similar climate
conditions, Williams [13] referred to four climate variables: mean surface air temperature and
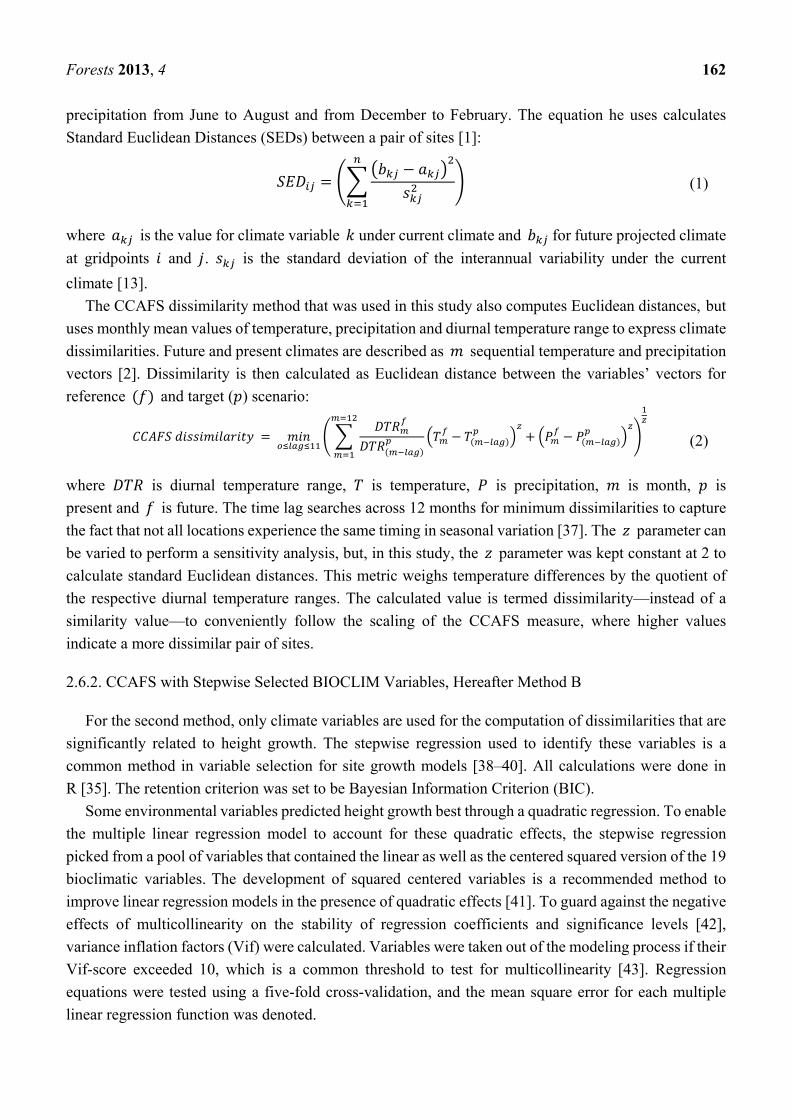
Forests 2013, 4 162
precipitation from June to August and from December to February. The equation he uses calculates
Standard Euclidean Distances (SEDs) between a pair of sites [1]:
(1)
where is the value for climate variable under current climate and for future projected climate
at gridpoints and . is the standard deviation of the interannual variability under the current
climate [13].
The CCAFS dissimilarity method that was used in this study also computes Euclidean distances, but
uses monthly mean values of temperature, precipitation and diurnal temperature range to express climate
dissimilarities. Future and present climates are described as sequential temperature and precipitation
vectors [2]. Dissimilarity is then calculated as Euclidean distance between the variables’ vectors for
reference and target ( ) scenario:
(2)
where is diurnal temperature range, is temperature, is precipitation, is month, is
present and is future. The time lag searches across 12 months for minimum dissimilarities to capture
the fact that not all locations experience the same timing in seasonal variation [37]. The parameter can
be varied to perform a sensitivity analysis, but, in this study, the parameter was kept constant at 2 to
calculate standard Euclidean distances. This metric weighs temperature differences by the quotient of
the respective diurnal temperature ranges. The calculated value is termed dissimilarity—instead of a
similarity value—to conveniently follow the scaling of the CCAFS measure, where higher values
indicate a more dissimilar pair of sites.
2.6.2. CCAFS with Stepwise Selected BIOCLIM Variables, Hereafter Method B
For the second method, only climate variables are used for the computation of dissimilarities that are
significantly related to height growth. The stepwise regression used to identify these variables is a
common method in variable selection for site growth models [38–40]. All calculations were done in
R [35]. The retention criterion was set to be Bayesian Information Criterion (BIC).
Some environmental variables predicted height growth best through a quadratic regression. To enable
the multiple linear regression model to account for these quadratic effects, the stepwise regression
picked from a pool of variables that contained the linear as well as the centered squared version of the 19
bioclimatic variables. The development of squared centered variables is a recommended method to
improve linear regression models in the presence of quadratic effects [41]. To guard against the negative
effects of multicollinearity on the stability of regression coefficients and significance levels [42],
variance inflation factors (Vif) were calculated. Variables were taken out of the modeling process if their
Vif-score exceeded 10, which is a common threshold to test for multicollinearity [43]. Regression
equations were tested using a five-fold cross-validation, and the mean square error for each multiple
linear regression function was denoted.
Forests 2013, 4 163
The climate variables found by the stepwise regression for each provenance were then used as input
variables to compute SEDs following the CCAFS method adapted to the variables selected via stepwise
regression [2].
2.7. Evaluating Dissimilarities in Climate as a Provenance Performance Indicator
We calculate dissimilarity values for each provenance and method for the gridded study area.
We use for each provenance the best performing site as a reference point for the grid calculation
(point A) because of the following reasons. (1) Practically, the forestry sector should be interested in
climate analogs in order to optimize performance at each location; and (2) We therefore hypothesize that
each provenance has an optimum climate for height growth and that height growth reduces when climate
varies drastically from the optimal climate. To test our hypothesis, we calculated 10 dissimilarity grids,
one for each provenance, and in each case used the coordinates of the most successful trial as a reference.
Climate dissimilarity values calculated for coordinates where remaining trials of the same provenance
were planted should be clearly related to differences in height growth. If our hypothesis is true, the
differences in height performance relative to the best trial should show a significant correlation with the
calculated dissimilarity value for each of the trials where the provenance was planted. The goodness of
fit of this correlation expresses how well the calculation of climate dissimilarities relates to provenance
performance (Figure 2). The linear regression example accounts for 93.6% of the variability in the
variable height growth (R2 = 0.936). The point marked A indicates the reference trial with top height
growth for which climate dissimilarities have been calculated. The point marked B indicates a trial
planted with seeds from the same provenance, in this case P. tecunumanii provenance Campamento, at
another location. This trial B exhibited 2.85 m less height growth as compared to the top trial (A) and is
found at a location associated with a climate dissimilarity value of 137 as compared to the climate found
at the location of the top trial.
Figure 2. Scatter plot exemplifying the linear correlation of climate dissimilarity and height
growth for one single provenance.
Forests 2013, 4 164
2.8. Spatialization of Results and Growth Predictions
The analog method that is found to provide climate dissimilarity values that most successfully relate
to provenance growth differences is used to predict provenances’ height growths under current and
future climate conditions. The evaluation was based on goodness of fit (R2) and statistical significance of
the relationship.
To estimate growth performances during the next two rotations, the study considers projected climate
conditions for the years 2030 and 2050 [44]. Three global socioeconomic development paths are
considered by running the analog tool for three SRES emission scenarios: A1b, A2, and B1 for each
GCM [45].
Climate dissimilarity was computed in two ASCII grids for every provenance (10 in total), time step
(current climate conditions, 2030s, 2050s) and for each GCM model. The first grid indicates which trial
is climatically most similar to a site of interest. The second grid calculates a dissimilarity value for this
site of interest and the trial indicated by the first grid. Each GCM yields a slightly different dissimilarity
value for a pair of sites. The first grid’s value can be directly linked to one certain Camcore trial
indicating a climatically most similar provenance and, with this, an expected height growth.
The projections of the dissimilarity values are all done with climate grids that have a spatial resolution of
five arc minutes.
The dissimilarity value from the second grid is used to further refine the result and to estimate height
growth of climatically most similar provenance in that specific grid cell. The provenance-specific
response functions developed for the analog methodology indicate how sensible the height growth of
specific provenances is to climate dissimilarities from their optimal climate (Figure 2). The slope of the
linear regression trend line serves as an estimator of this sensitivity. The steeper this slope the less
sensitive height growth of a specific provenance is to climate dissimilarities from their optimal climate.
Following the linear regression equation [3]:
(3)
where Y, the dependent variable, is the dissimilarity in climate from the reference trial, a the intercept
and b the slope.
By dividing the slope (b) of the provenance response function with the dissimilarity value (Y) of a
certain site, we compute the deviation from the height estimation brought about by climate dissimilarity
(x). This deviation subtracted from the height, measured at the climatically most similar trial, gives us
the minimum height a provenance is expected to yield at any site inside the study area.
Uncertainties in the simulations of future climate are addressed by comparing the outcomes of the
multiple model runs using the different GCMs (listed under Table 1) We assumed that analog
predictions are reliable across the climate models if at least 11 (more than two-thirds) of the individual
GCMs calculate the same trial to be the best climate analog for a site. In order to take spatial variability
in climate model uncertainty into account [46] uncertainties were individually calculated for Colombia,
Brazil and South Africa.
Forests 2013, 4 165
3. Results
3.1. Definition of Study Area
Trials exhibited a survival rate of at least 70% where mean annual temperature was between 12.4 and
24.6 °C, maximum temperature of warmest month does not exceed 33.1 °C and average minimum
temperature of the coldest month does not fall below 0 °C. Annual rainfall was in the range of 720 and
2666 mm and precipitation seasonality between 88 and 13. The cultivated and degraded areas comprised
in this climatic niche cover an area of 2.37 million km2. Of this area, 5.75% lies inside the administrative
boundaries of Colombia, 84.53% in Brazil, and 9.72% in South Africa, Lesotho, and Swaziland.
3.2. Comparison of Analog Methods in Their Ability to Predict Provenance Performance
The method that provided climate dissimilarity measures that best correlated with growth
performance was selected. Selection criteria included the average R2 of the climate dissimilarity growth
performance models by species and whether the provenance-specific relationships between climate
dissimilarity and growth performance were statistically significant. Models resulting from using climate
dissimilarity measures from method A yielded an average coefficient of determination of 0.68 for
P. tecunumanii provenances and an average coefficient of determination of 0.12 for P. patula
provenances. Models resulting from using climate dissimilarity measures from method B had a similar
average R2 value for P. tecunumanii provenances of 0.59 and P. patula provenances of 0.15 (Table 3).
Cross-validation of the method relying on stepwise selected climate variables yielded an average square
root residual error of 0.92 m corresponding to an error of 7.5% (mean height of 10 provenances equals
12.28 m) which is considered to fall inside an acceptable error margin. Climate dissimilarity measure
from both analog methods can thus be seen to relate equally well to growth differences. It has to be noted
that while the stepwise regression algorithm is still commonly used in the field of ecological modeling,
its advantages and shortcomings are a topic of recent debate among statisticians [40,47,48]. Since no
method is found to be clearly superior in terms of scored R2 values, method A resulted in a relationship
with a larger number of provenances. With respect to Pinus patula, only regression functions for the
provenance Sierra Huayacocotla (6) for standard method A and Conrado Castillo (10) for method B
were not significant at α 0.1 (Table 3). The values in the table indicate coefficient of determination
scores of the 10 regression function developed to validate the two methods. The level of significance is
coded according to the regression’s p-value: 0.001(***), 0.01(**), 0.05(*), 0.1(.), 1( ). All regressions
for P. tecunumanii developed using the standard CCAFS method, except Mountain Pine Ridge (ID 5),
are significant at the 0.1 level. Four out of five of these regressions are significant at the 0.01 level.
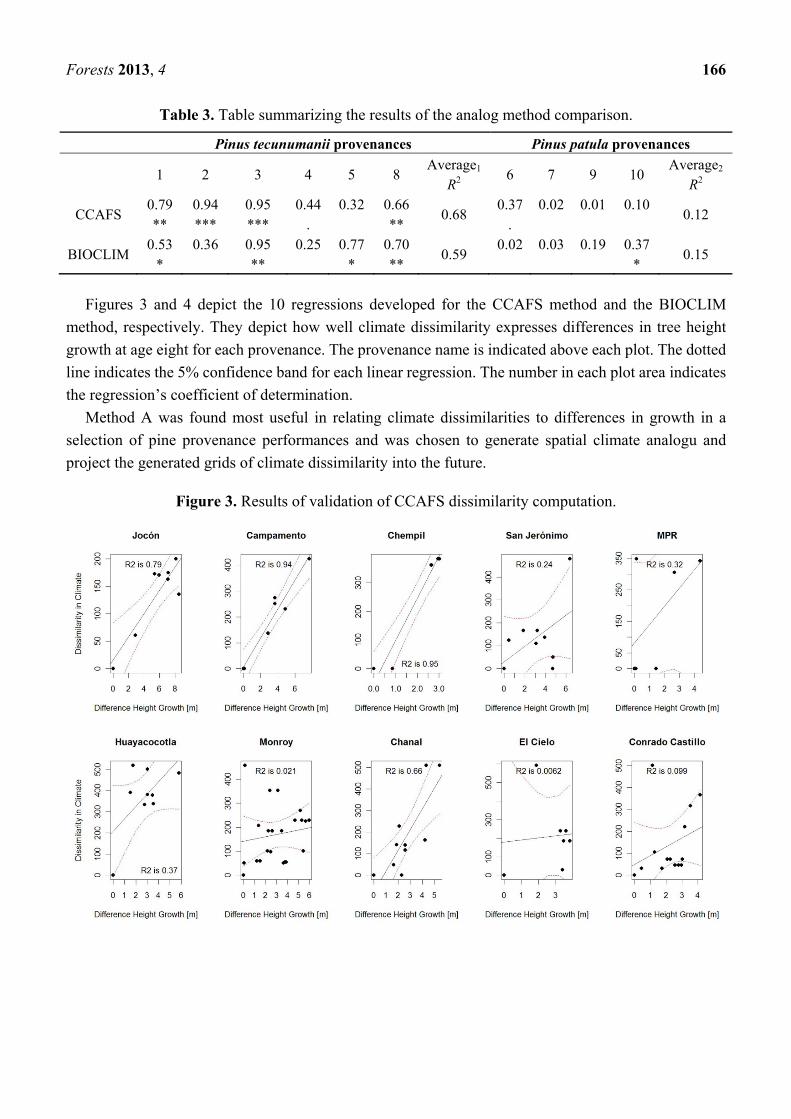
Forests 2013, 4 166
Table 3. Table summarizing the results of the analog method comparison.
Pinus tecunumanii provenances Pinus patula provenances
1 2 3 4 5 8 Average1
R2 6 7 9 10
Average2
R2
CCAFS 0.79
**
0.94
***
0.95
***
0.44
.
0.32
0.66
** 0.68
0.37
.
0.02
0.01
0.10
0.12
BIOCLIM 0.53
*
0.36
0.95
**
0.25
0.77
*
0.70
** 0.59
0.02
0.03
0.19
0.37
* 0.15
Figures 3 and 4 depict the 10 regressions developed for the CCAFS method and the BIOCLIM
method, respectively. They depict how well climate dissimilarity expresses differences in tree height
growth at age eight for each provenance. The provenance name is indicated above each plot. The dotted
line indicates the 5% confidence band for each linear regression. The number in each plot area indicates
the regression’s coefficient of determination.
Method A was found most useful in relating climate dissimilarities to differences in growth in a
selection of pine provenance performances and was chosen to generate spatial climate analogu and
project the generated grids of climate dissimilarity into the future.
Figure 3. Results of validation of CCAFS dissimilarity computation.
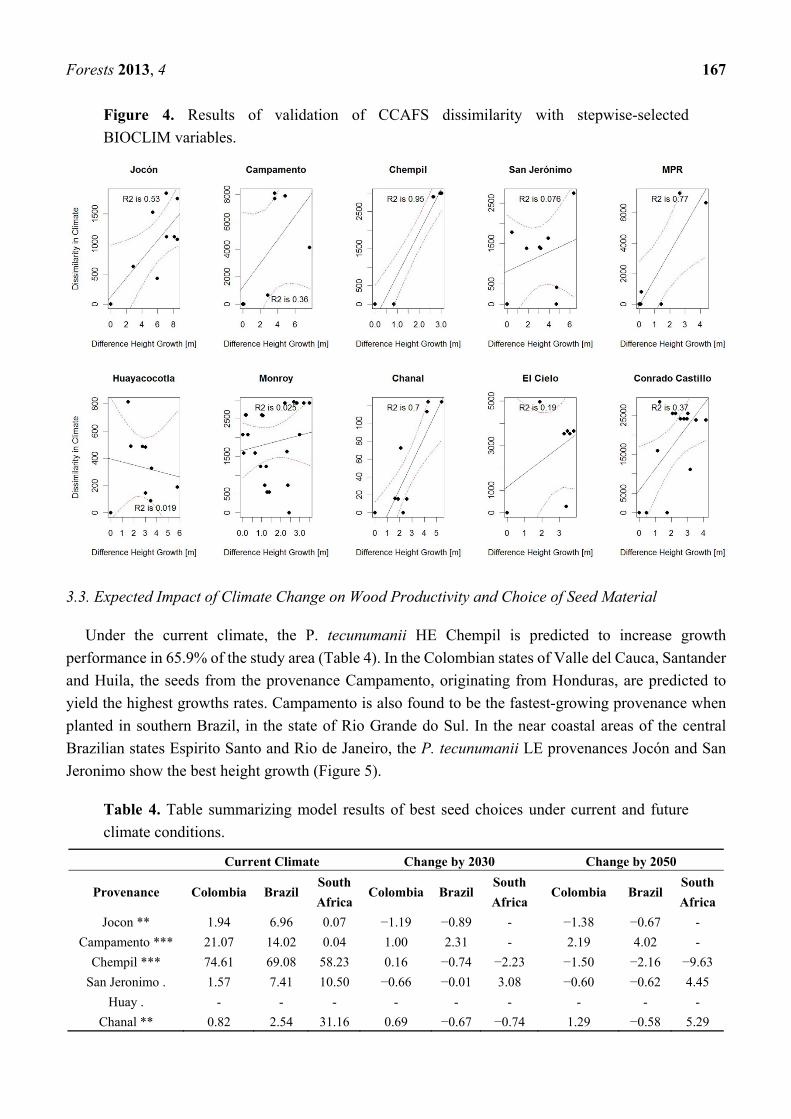
Forests 2013, 4 167
Figure 4. Results of validation of CCAFS dissimilarity with stepwise-selected
BIOCLIM variables.
3.3. Expected Impact of Climate Change on Wood Productivity and Choice of Seed Material
Under the current climate, the P. tecunumanii HE Chempil is predicted to increase growth
performance in 65.9% of the study area (Table 4). In the Colombian states of Valle del Cauca, Santander
and Huila, the seeds from the provenance Campamento, originating from Honduras, are predicted to
yield the highest growths rates. Campamento is also found to be the fastest-growing provenance when
planted in southern Brazil, in the state of Rio Grande do Sul. In the near coastal areas of the central
Brazilian states Espirito Santo and Rio de Janeiro, the P. tecunumanii LE provenances Jocón and San
Jeronimo show the best height growth (Figure 5).
Table 4. Table summarizing model results of best seed choices under current and future
climate conditions.
Current Climate Change by 2030 Change by 2050
Provenance Colombia Brazil South
AfricaColombia Brazil
South
AfricaColombia Brazil
South
Africa
Jocon ** 1.94 6.96 0.07 −1.19 −0.89 - −1.38 −0.67 -
Campamento *** 21.07 14.02 0.04 1.00 2.31 - 2.19 4.02 -
Chempil *** 74.61 69.08 58.23 0.16 −0.74 −2.23 −1.50 −2.16 −9.63
San Jeronimo . 1.57 7.41 10.50 −0.66 −0.01 3.08 −0.60 −0.62 4.45
Huay . - - - - - - - - -
Chanal ** 0.82 2.54 31.16 0.69 −0.67 −0.74 1.29 −0.58 5.29
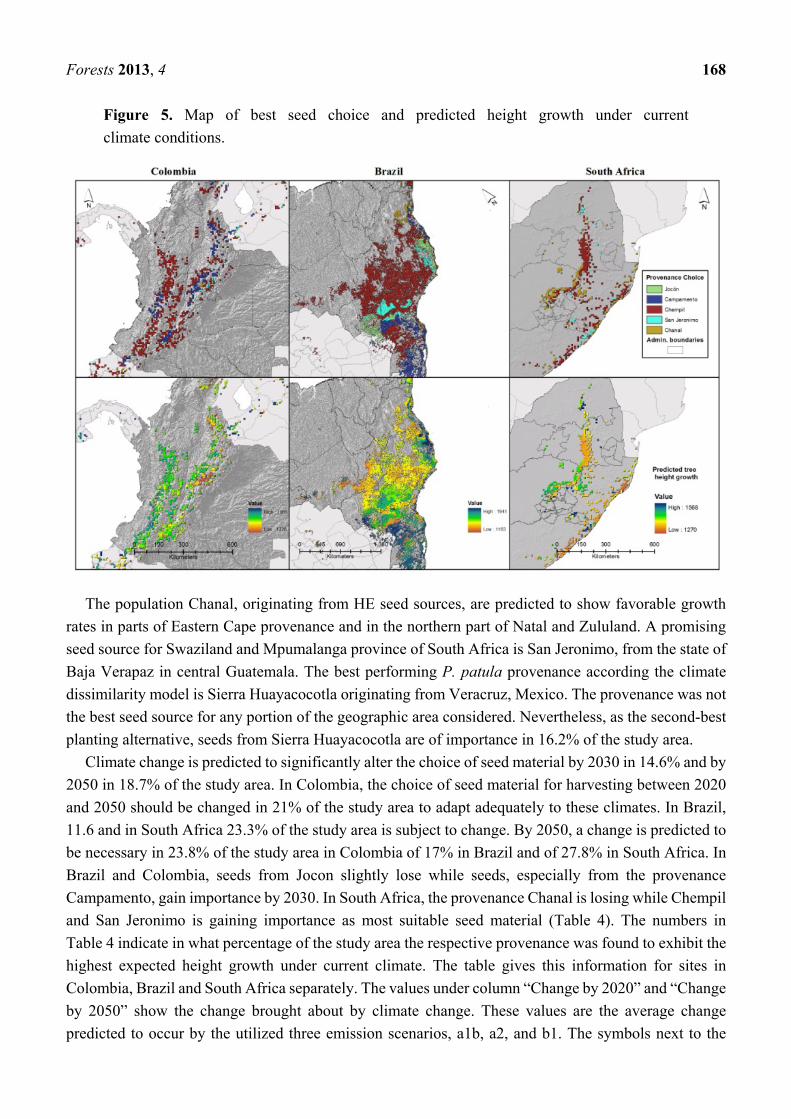
Forests 2013, 4 168
Figure 5. Map of best seed choice and predicted height growth under current
climate conditions.
The population Chanal, originating from HE seed sources, are predicted to show favorable growth
rates in parts of Eastern Cape provenance and in the northern part of Natal and Zululand. A promising
seed source for Swaziland and Mpumalanga province of South Africa is San Jeronimo, from the state of
Baja Verapaz in central Guatemala. The best performing P. patula provenance according the climate
dissimilarity model is Sierra Huayacocotla originating from Veracruz, Mexico. The provenance was not
the best seed source for any portion of the geographic area considered. Nevertheless, as the second-best
planting alternative, seeds from Sierra Huayacocotla are of importance in 16.2% of the study area.
Climate change is predicted to significantly alter the choice of seed material by 2030 in 14.6% and by
2050 in 18.7% of the study area. In Colombia, the choice of seed material for harvesting between 2020
and 2050 should be changed in 21% of the study area to adapt adequately to these climates. In Brazil,
11.6 and in South Africa 23.3% of the study area is subject to change. By 2050, a change is predicted to
be necessary in 23.8% of the study area in Colombia of 17% in Brazil and of 27.8% in South Africa. In
Brazil and Colombia, seeds from Jocon slightly lose while seeds, especially from the provenance
Campamento, gain importance by 2030. In South Africa, the provenance Chanal is losing while Chempil
and San Jeronimo is gaining importance as most suitable seed material (Table 4). The numbers in
Table 4 indicate in what percentage of the study area the respective provenance was found to exhibit the
highest expected height growth under current climate. The table gives this information for sites in
Colombia, Brazil and South Africa separately. The values under column “Change by 2020” and “Change
by 2050” show the change brought about by climate change. These values are the average change
predicted to occur by the utilized three emission scenarios, a1b, a2, and b1. The symbols next to the
Forests 2013, 4 169
provenance names are used to depict the level of significance according to the regression’s p-value
0.001(***), 0.01(**), 0.05(*), 0.1(.), 1( ).
Selection of material adapted to climate change enables foresters to maintain yield levels. In none of
the three studied countries does change in expected height growth exceed 1%. The standard deviation of
height predictions, not denoted in Table 5, indicate that while yields are highest in Colombia, so is the
study area’s heterogeneity in terms of modeled height growth. The numbers in Table 5 indicate
expectable height growth (row 1) or change in height growth compared to current climate (row 2 and 3)
if seeds from provenances are planted that show best height growth according to the analog model
results. The level of significance according to the regression’s p-value range from 0.05 to 0.001.
Table 5. Estimated average height growth of the most suitable seed sources under current
climate and expected change by 2030 and 2050.
Colombia Brazil South Africa
current climate [m] 15.27 13.62 13.44
change by 2030 [Δm] −0.19 −0.07 −0.12
change by 2050 [Δm] −0.35 −0.04 0.02
3.4. Influence of Socioeconomic Scenarios on the Prediction’s Outcome
Differences in driving forces and emissions that underlie the projected climates for 2030 and 2050
lead to different predictions in 5.2% of the study areas. The predicted climate in year 2030 for the
different emission scenarios influences the planting decision in 5% of study area. Per country, these
differences make up 2.1, 5.2 and 12% in Colombia, Brazil and South Africa, respectively. By 2050 the
scenario influence on planting decisions more than doubles to 13% of the study area. By 2050, these
differences increase to 8.4% globally, or 6.1% in Colombia, 9% in Brazil, and 12.3% in South Africa.
Differences in the predictions based on the scenarios A1b and A2 are not significant.
3.5. Available Viable Seed Choices
An important aspect for foresters to select good planting material is not only the height a provenance
choice can be expected to grow under certain climates. Many other site factors such as soil
characteristics or pressures from biotic threats play an important role, as well. For example, P. patula
and P. tecunumanii do not grow well on poorly drained soils that remain moist. Because our approach
does not account for these site factors, we evaluated and here present the best three provenances
climatically suitable for a given site. These provenances should be further evaluated for pest resistance
or suitability in terms of non-climatic site effects (Figure 6).
The model runs indicate that planting sites in Colombia are most sensitive to the choice of
climatically well-matched seed material. Achievable yields are high but seeds should be well adapted to
local climate conditions. Expected differences in height growth from the first to second-best seed choice
are 4 m and 4.7 m from the 1st to 3rd choice. These differences are predicted to increase slightly until
2030. For sites in South Africa, the model runs predict that difference between the top three seed choices
are low with only 1.1 m from best to third choice. Brazil exhibits with 2.1 m an average difference in
expected height growth from first to third seed choice.
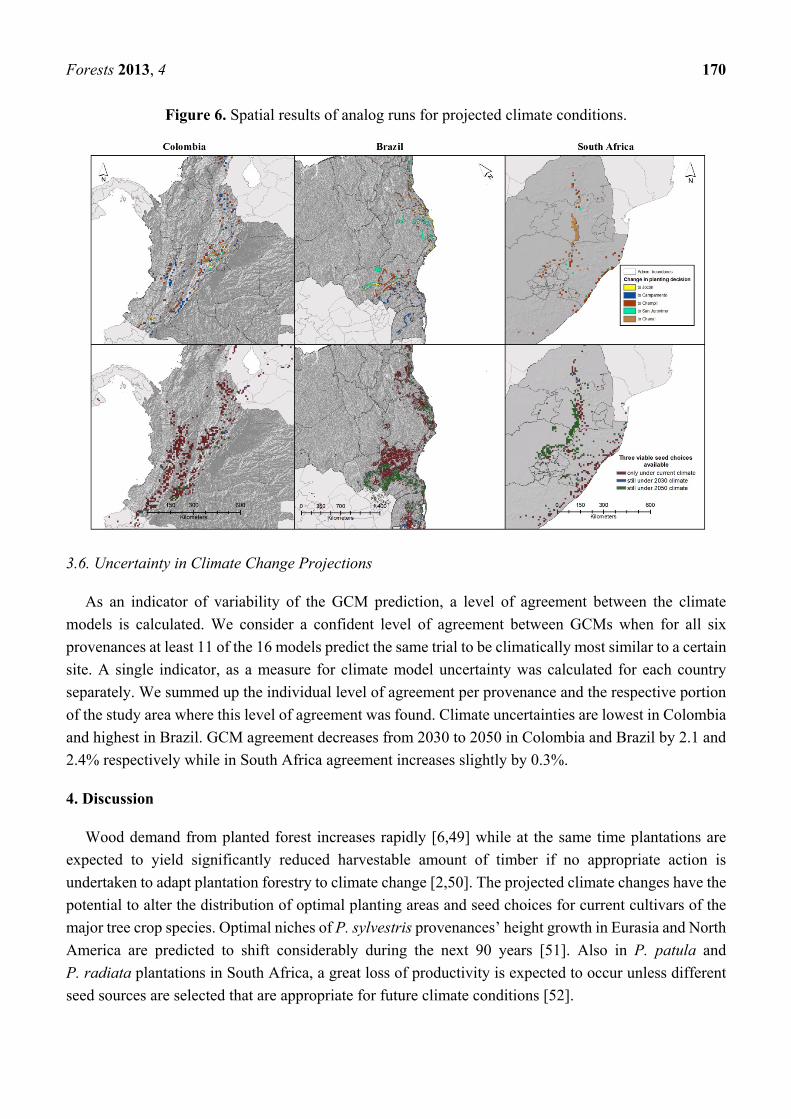
Forests 2013, 4 170
Figure 6. Spatial results of analog runs for projected climate conditions.
3.6. Uncertainty in Climate Change Projections
As an indicator of variability of the GCM prediction, a level of agreement between the climate
models is calculated. We consider a confident level of agreement between GCMs when for all six
provenances at least 11 of the 16 models predict the same trial to be climatically most similar to a certain
site. A single indicator, as a measure for climate model uncertainty was calculated for each country
separately. We summed up the individual level of agreement per provenance and the respective portion
of the study area where this level of agreement was found. Climate uncertainties are lowest in Colombia
and highest in Brazil. GCM agreement decreases from 2030 to 2050 in Colombia and Brazil by 2.1 and
2.4% respectively while in South Africa agreement increases slightly by 0.3%.
4. Discussion
Wood demand from planted forest increases rapidly [6,49] while at the same time plantations are
expected to yield significantly reduced harvestable amount of timber if no appropriate action is
undertaken to adapt plantation forestry to climate change [2,50]. The projected climate changes have the
potential to alter the distribution of optimal planting areas and seed choices for current cultivars of the
major tree crop species. Optimal niches of P. sylvestris provenances’ height growth in Eurasia and North
America are predicted to shift considerably during the next 90 years [51]. Also in P. patula and
P. radiata plantations in South Africa, a great loss of productivity is expected to occur unless different
seed sources are selected that are appropriate for future climate conditions [52].
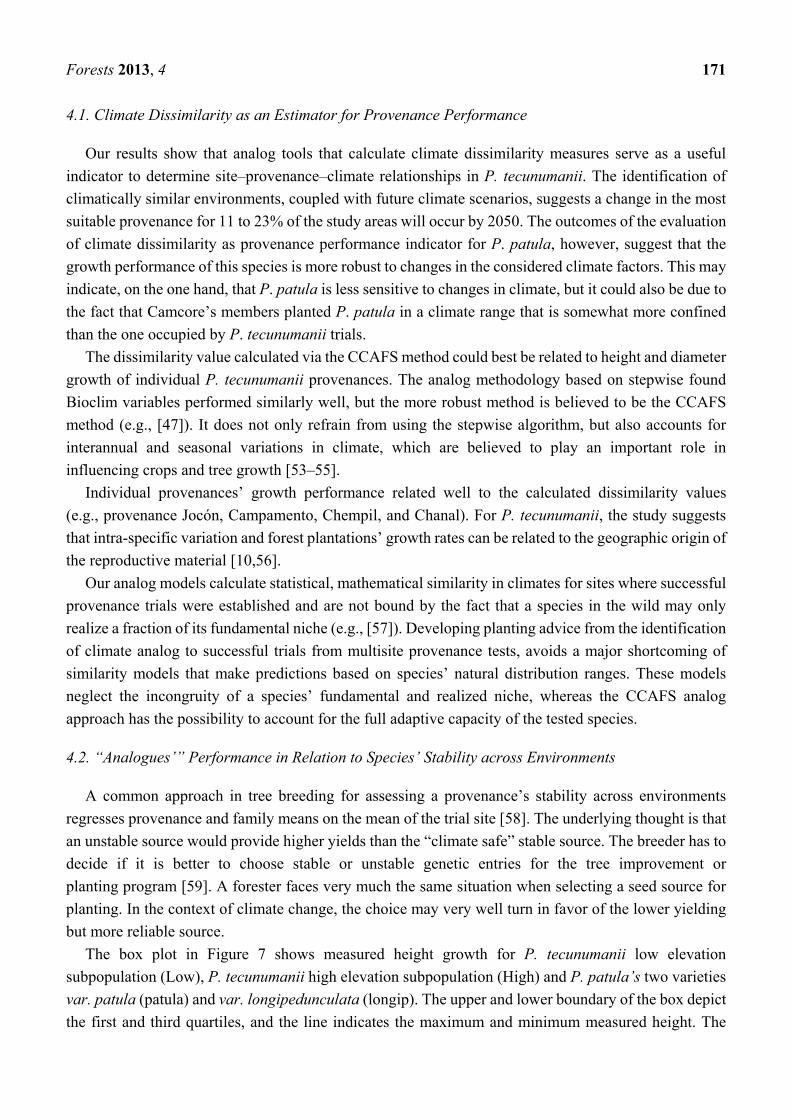
Forests 2013, 4 171
4.1. Climate Dissimilarity as an Estimator for Provenance Performance
Our results show that analog tools that calculate climate dissimilarity measures serve as a useful
indicator to determine site–provenance–climate relationships in P. tecunumanii. The identification of
climatically similar environments, coupled with future climate scenarios, suggests a change in the most
suitable provenance for 11 to 23% of the study areas will occur by 2050. The outcomes of the evaluation
of climate dissimilarity as provenance performance indicator for P. patula, however, suggest that the
growth performance of this species is more robust to changes in the considered climate factors. This may
indicate, on the one hand, that P. patula is less sensitive to changes in climate, but it could also be due to
the fact that Camcore’s members planted P. patula in a climate range that is somewhat more confined
than the one occupied by P. tecunumanii trials.
The dissimilarity value calculated via the CCAFS method could best be related to height and diameter
growth of individual P. tecunumanii provenances. The analog methodology based on stepwise found
Bioclim variables performed similarly well, but the more robust method is believed to be the CCAFS
method (e.g., [47]). It does not only refrain from using the stepwise algorithm, but also accounts for
interannual and seasonal variations in climate, which are believed to play an important role in
influencing crops and tree growth [53–55].
Individual provenances’ growth performance related well to the calculated dissimilarity values
(e.g., provenance Jocón, Campamento, Chempil, and Chanal). For P. tecunumanii, the study suggests
that intra-specific variation and forest plantations’ growth rates can be related to the geographic origin of
the reproductive material [10,56].
Our analog models calculate statistical, mathematical similarity in climates for sites where successful
provenance trials were established and are not bound by the fact that a species in the wild may only
realize a fraction of its fundamental niche (e.g., [57]). Developing planting advice from the identification
of climate analog to successful trials from multisite provenance tests, avoids a major shortcoming of
similarity models that make predictions based on species’ natural distribution ranges. These models
neglect the incongruity of a species’ fundamental and realized niche, whereas the CCAFS analog
approach has the possibility to account for the full adaptive capacity of the tested species.
4.2. “Analogues’” Performance in Relation to Species’ Stability across Environments
A common approach in tree breeding for assessing a provenance’s stability across environments
regresses provenance and family means on the mean of the trial site [58]. The underlying thought is that
an unstable source would provide higher yields than the “climate safe” stable source. The breeder has to
decide if it is better to choose stable or unstable genetic entries for the tree improvement or
planting program [59]. A forester faces very much the same situation when selecting a seed source for
planting. In the context of climate change, the choice may very well turn in favor of the lower yielding
but more reliable source.
The box plot in Figure 7 shows measured height growth for P. tecunumanii low elevation
subpopulation (Low), P. tecunumanii high elevation subpopulation (High) and P. patula’s two varieties
var. patula (patula) and var. longipedunculata (longip). The upper and lower boundary of the box depict
the first and third quartiles, and the line indicates the maximum and minimum measured height. The
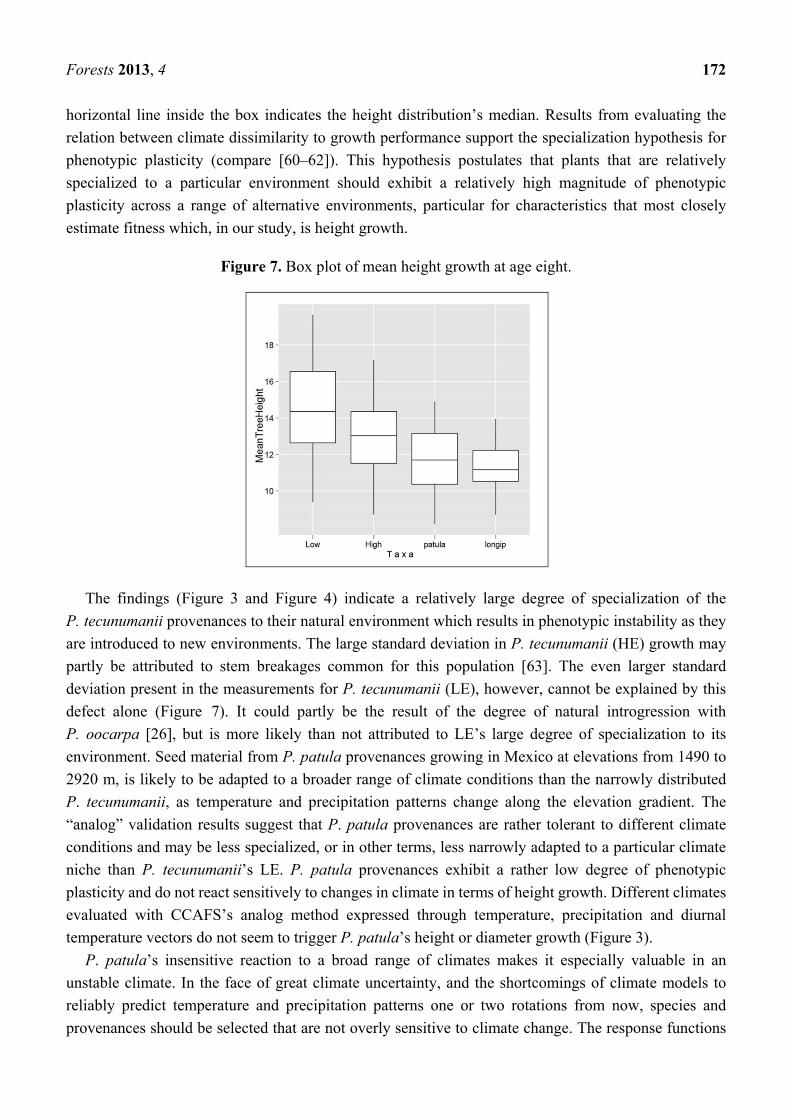
Forests 2013, 4 172
horizontal line inside the box indicates the height distribution’s median. Results from evaluating the
relation between climate dissimilarity to growth performance support the specialization hypothesis for
phenotypic plasticity (compare [60–62]). This hypothesis postulates that plants that are relatively
specialized to a particular environment should exhibit a relatively high magnitude of phenotypic
plasticity across a range of alternative environments, particular for characteristics that most closely
estimate fitness which, in our study, is height growth.
Figure 7. Box plot of mean height growth at age eight.
The findings (Figure 3 and Figure 4) indicate a relatively large degree of specialization of the
P. tecunumanii provenances to their natural environment which results in phenotypic instability as they
are introduced to new environments. The large standard deviation in P. tecunumanii (HE) growth may
partly be attributed to stem breakages common for this population [63]. The even larger standard
deviation present in the measurements for P. tecunumanii (LE), however, cannot be explained by this
defect alone (Figure 7). It could partly be the result of the degree of natural introgression with
P. oocarpa [26], but is more likely than not attributed to LE’s large degree of specialization to its
environment. Seed material from P. patula provenances growing in Mexico at elevations from 1490 to
2920 m, is likely to be adapted to a broader range of climate conditions than the narrowly distributed
P. tecunumanii, as temperature and precipitation patterns change along the elevation gradient. The
“analog” validation results suggest that P. patula provenances are rather tolerant to different climate
conditions and may be less specialized, or in other terms, less narrowly adapted to a particular climate
niche than P. tecunumanii’s LE. P. patula provenances exhibit a rather low degree of phenotypic
plasticity and do not react sensitively to changes in climate in terms of height growth. Different climates
evaluated with CCAFS’s analog method expressed through temperature, precipitation and diurnal
temperature vectors do not seem to trigger P. patula’s height or diameter growth (Figure 3).
P. patula’s insensitive reaction to a broad range of climates makes it especially valuable in an
unstable climate. In the face of great climate uncertainty, and the shortcomings of climate models to
reliably predict temperature and precipitation patterns one or two rotations from now, species and
provenances should be selected that are not overly sensitive to climate change. The response functions
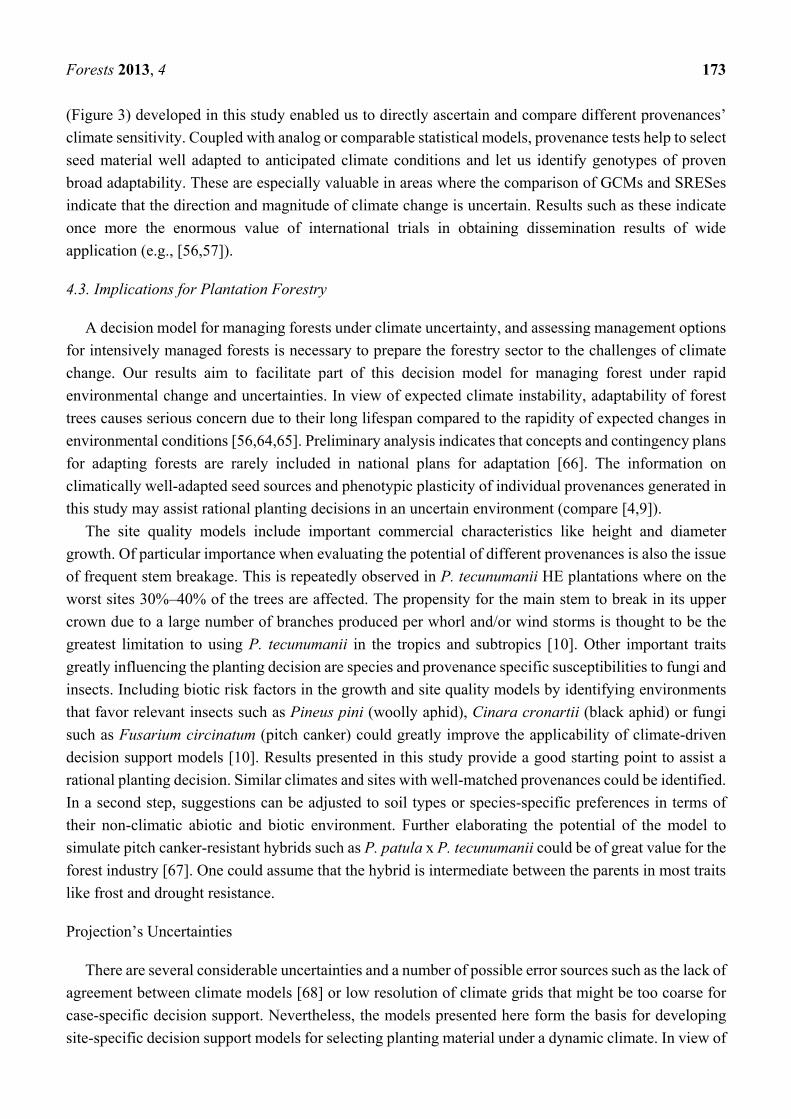
Forests 2013, 4 173
(Figure 3) developed in this study enabled us to directly ascertain and compare different provenances’
climate sensitivity. Coupled with analog or comparable statistical models, provenance tests help to select
seed material well adapted to anticipated climate conditions and let us identify genotypes of proven
broad adaptability. These are especially valuable in areas where the comparison of GCMs and SRESes
indicate that the direction and magnitude of climate change is uncertain. Results such as these indicate
once more the enormous value of international trials in obtaining dissemination results of wide
application (e.g., [56,57]).
4.3. Implications for Plantation Forestry
A decision model for managing forests under climate uncertainty, and assessing management options
for intensively managed forests is necessary to prepare the forestry sector to the challenges of climate
change. Our results aim to facilitate part of this decision model for managing forest under rapid
environmental change and uncertainties. In view of expected climate instability, adaptability of forest
trees causes serious concern due to their long lifespan compared to the rapidity of expected changes in
environmental conditions [56,64,65]. Preliminary analysis indicates that concepts and contingency plans
for adapting forests are rarely included in national plans for adaptation [66]. The information on
climatically well-adapted seed sources and phenotypic plasticity of individual provenances generated in
this study may assist rational planting decisions in an uncertain environment (compare [4,9]).
The site quality models include important commercial characteristics like height and diameter
growth. Of particular importance when evaluating the potential of different provenances is also the issue
of frequent stem breakage. This is repeatedly observed in P. tecunumanii HE plantations where on the
worst sites 30%–40% of the trees are affected. The propensity for the main stem to break in its upper
crown due to a large number of branches produced per whorl and/or wind storms is thought to be the
greatest limitation to using P. tecunumanii in the tropics and subtropics [10]. Other important traits
greatly influencing the planting decision are species and provenance specific susceptibilities to fungi and
insects. Including biotic risk factors in the growth and site quality models by identifying environments
that favor relevant insects such as Pineus pini (woolly aphid), Cinara cronartii (black aphid) or fungi
such as Fusarium circinatum (pitch canker) could greatly improve the applicability of climate-driven
decision support models [10]. Results presented in this study provide a good starting point to assist a
rational planting decision. Similar climates and sites with well-matched provenances could be identified.
In a second step, suggestions can be adjusted to soil types or species-specific preferences in terms of
their non-climatic abiotic and biotic environment. Further elaborating the potential of the model to
simulate pitch canker-resistant hybrids such as P. patula x P. tecunumanii could be of great value for the
forest industry [67]. One could assume that the hybrid is intermediate between the parents in most traits
like frost and drought resistance.
Projection’s Uncertainties
There are several considerable uncertainties and a number of possible error sources such as the lack of
agreement between climate models [68] or low resolution of climate grids that might be too coarse for
case-specific decision support. Nevertheless, the models presented here form the basis for developing
site-specific decision support models for selecting planting material under a dynamic climate. In view of
Forests 2013, 4 174
the rapid increase of area covered with tree plantations from 264 Mio ha 2010 to more than 300 Mio ha
by 2020 [7] the analog tool may provide much-needed decision support for the forest sector in a time
where rapid climate change makes the choice of the right seed source increasingly difficult.
The dependence of climate projections on the chosen emission scenario is believed to be low, at least
up to the year 2035 [69]. There is no reason to believe that including CO2 fertilization effects would alter
results since there is no scientific evidence that intraspecific variation at the provenance level would
exhibit different physiological responses to altered concentrations of CO2. No problems are expected in
the extrapolation of the model predictions to the whole study area because the area is within the climate
ranges where the field trials are established.
5. Conclusions
In this study, Analogue, a statistical tool to quantify climate distances, was tested with growth data
from international provenance trials. After careful validation, the tool was used to evaluate the need to
change the currently used seed material of P. patula and P. tecunumanii provenances to optimize wood
productivity in the face of climate change in the next rotations. Correlation of climate dissimilarity with
differences in height growth per provenance allowed us to distinguish between seed sources that have
high height growth in a specific climate, like most P. tecunumanii provenances, and provenances that
have a more moderate height growth but that are adapted to a wide climate range, such as most tested
P. patula provenances. Although the climate analog may be particularly useful to identify suitable areas
for P. tecunumanii provenances, P. patula provenances may be more convenient to plant in a rapidly
changing environment because of their ability to adapt to a wide range of climates.
Competing Interests
The interpretation of data, presentation of results or the conclusions drawn are not influenced by any
of the authors’ personal or financial relationships.
Acknowledgements
The corresponding author would like to express his gratitude to the Decision and Policy Analysis
(Dapa) Team at CIAT, especially to Julian Ramirez Villegas whose support and technical advice was of
great help in elaborating the study’s methodology. We would further like to thank the Camcore members
in Brazil, Colombia and South Africa for establishing, maintaining and measuring the research field
plantings. We thank also William Woodbridge, Camcore data manager, for his assistance in preparing
the large data sets for this analysis. Our gratitude goes also to four anonymous reviewers. For their
constructive review, we would like to say thank you and believe that their detailed comments
significantly contributed to improving the quality of the publication. MJvZ thanks the CGIAR
consortium research programs CCAFS and Forest, Trees and Agroforestry for financial support.
References
1. IPCC. Climate Change 2007: Synthesis Report; Cambridge University Press: New York, NY,
USA, 2007.
Forests 2013, 4 175
2. McKenney, D.; Pedlar, J.; O’Neill, G. Climate change and forest seed zones: Past trends, future
prospects and challenges to ponder. For. Chron. 2009, 85, 258–266.
3. Fairbanks, D. South African Country Study on Climate Change: Vulnerability and Adaptation
Assessment for Plantation Forestry; National Research Foundation: Pretoria, South Africa, 1999.
4. Spittlehouse, D.L.; Stewart, R.G. Adaptation to climate change in forest management. BC J.
Ecosyst. Manag. 2003, 4, 1–11.
5. Maginnis, S.; Jackson, W. The Role of Planted Forests in Forest Landscape Restoration.
In Proceedings of the UNFF Intersessional Experts Meeting on the Role of Planted Forests in
Sustainable Forest Management, Christchurch, New Zealand, 25–27 March 2003; pp. 87–99.
6. Carle, J.; Holmgren, P. Wood from planted forests: A global outlook 2005–2030. For. Prod. J.
2008, 58, 6–18.
7. FRA. Global Forest Resources Assessment 2010; Forestry Paper for FAO: Rome, Italy, 2010;
p. 136.
8. IPCC. Land Use, Land Use Change and Forestry; Cambridge University Press: Cambridge,
UK, 2000.
9. Guariguata, M.R.; Cornelius, J.P.; Locatelli, B.; Forner, C.; Sánchez-Azofeifa, G.A. Mitigation
needs adaptation: Tropical forestry and climate change. Mitig. Adapt. Strategy Glob. Chang. 2008,
13, 793–808.
10. Dvorak, W.S.; Hodge, G.R.; Romero, J.L. Results of twenty years of research on Pinus tecunumanii
by the CAMCORE Cooperative. For. Genet. Resour. 2001, 29, 2–6.
11. Glantz, M.H. Societal Responses to Climate Change: Forecasting by Analogy; Westview Press:
Boulder, CO, USA, 1988.
12. Glantz, M.H. Does history have a future—Forecasting climate change effects on fisheries by
analogy. Fisheries 1990, 15, 39–44.
13. Williams, J.W.; Jackson, S.T.; Kutzbach, J.E. Projected distributions of novel and disappearing
climates by 2100 AD. Proc. Natl. Acad. Sci. USA 2007, 104, 5738–5742.
14. Hallegatte, S.; Hourcade, J.C.; Ambrosi, P. Using climate analogues for assessing climate change
economic impacts in urban areas. Clim. Chang. 2007, 82, 47–60.
15. Ford, J.D.; Keskitalo, E.C.H.; Smith, T.; Pearce, T.; Berrang-Ford, L.; Duerden, F.; Smit, B. Case
study and analogue methodologies in climate change vulnerability research. Wiley Interdiscip. Rev.
2010, 3, 374–392.
16. Robertson, C.C. A Reconnaissance of The Forest Trees of Australia from the Point of View of Their
Cultivation in South Africa; South African Government Printer: Capetown, South Africa, 1926.
17. Golfari, L.; Caser, R.L.; Moura, V.P.G. Zoneamento ecologico esquematico para reflorestamento
no Brasil. Série Técnica 1978, 11, 1–66.
18. Booth, T.H. A new method for assisting species selection. Commonw. For. Rev. 1985, 64, 241–250.
19. Dvorak, W.S.; Donahue, J.H.; Vásquez, J.A. Early performance of CAMCORE introductions of
Pinus patula in Brazil, Colombia and South Africa. S. Afr. For. J. 1995, 174, 23–33.
20. Dvorak, W.S.; Jordan, A.P.; Romero, J.L.; Hodge, G.R.; Furman, B.J. Quantifying the geographic
range of Pinus patula var longipedunculata in southern Mexico using morphologic and RAPD
marker data. S. Afr. For. J. 2001, 192, 19–30.
Forests 2013, 4 176
21. Hijmans, R.J.; Schreuder, M.; de la Cruz, J.; Guarino, L. Using GIS to check coordinates of
genebank accessions. Genet. Resour. Crop Evol. 1999, 46, 291–296.
22. Birks, J.S.; Barnes, R.D. The Genetic Control of Wood Quality in Pinus patula; ODA Research
Scheme R4616; Oxford Forestry Institute, University of Oxford: Oxford, UK, 1991.
23. Hodge, G.R.; Dvorak, W.S. Growth potential and genetic parameters of four mesoamerican pine
planted in the southern hemisphere. South. For. 2012, 74, in press.
24. Dvorak, W.S.; Hodge, G.R.; Gutiérrez, E.A.; Osorio, L.F.; Malan, F.S.; Stanger, T.K.
Pinus tecunumanii. In Conservation and Testing of Tropical and Subtropical Forest Tree Species;
CAMCORE Cooperative: Raleigh, NC, USA, 2000; pp. 188–209.
25. Dvorak, W.S.; Balocchi, C.E.; Raymond, R.H. Performance and Stability of Provenances and
Families of Pinus tecunumanii in the Tropics and Subtropics. In Breeding Tropical Trees:
Population Structure And Genetic Improvement Strategies In Clonal And Seedling Forestry;
Gibson, G.L., Griffin, A.R., Matheson, A.C., Eds.; Oxford Forestry Institute: Oxford, UK, 1989;
pp. 187–196.
26. Dvorak, W.S.; Potter, K.M.; Hipkins, V.D.; Hodge, G.R. Genetic diversity and gene exchange in
Pinus oocarpa, a Mesoamerican pine with resistance to the pitch canker fungus (Fusarium
circinatum). Int. J. Plant Sci. 2009, 170, 609–626.
27. Kanzler, A. Genotype × environment interaction in Pinus patula and its implications in
South Africa. PhD thesis, Department of Forestry, North Carolina State University, Raleigh, NC,
USA, 2010.
28. Louw, J.H. Site Classification and Evaluation for Commercial Forestry in the Crocodile River
Catchment; University of Stellenbosch: Stellenbosch, South Africa, 1995.
29. IUCN and UNEP. The World Database on Protected Areas (WDPA); UNEP-WCMC: Cambridge,
UK, 2009.
30. Eva, H.D.; de Miranda, E.E.; di Bella, C.M.; Gond, V.; Sgrenzaroli, O.M.; Jones, S.; Coutinho, A.;
Dorado, A.; Guimarães, M.; Elvidge, C.; et al. A vegetation map of South America, European
Commission; EUR 20159 EN; Joint Research Centre: Brussels, Belgium, 2002.
31. Mayaux, P.; Bartholomé, E.; Massart, M.; van Cutsem, C.; Cabral, A.; Nonguierma, A.
A Land-Cover Map of Africa; EUR 20665 EN; Office for Official Publications of the European
Communities: Luxembourg, Luxembourg, 2003.
32. Bartholomé, E.; Belward, A.S.; Achard, F.; Bartalev, S.; Carmona Moreno, C.; Eva, H.; Fritz, S.;
Grégoire, J.M.; Mayaux, P.; Stibig, H.J. Global Land Cover Mapping for the Year 2000—Project
Status November 2002; ref EUR 20524; JRC: Ispra, Italy, 2003.
33. Hijmans, R.J.; Cameron, S.E.; Parra, J.L.; Jones, P.G.; Jarvis, A. Very high resolution interpolated
climate surfaces for global land areas. Int. J. Climatol. 2005, 25, 1965–1978.
34. Busby, J.R. BIOCLIM-A Bioclimatic Analysis and Prediction System. In Nature Conservation:
Cost Effective Biological Surveys and Data Analysis; Margules, C.R., Austin, M.P., Eds.; CSIRO:
Canberra, Australia, 1991; pp. 64–68.
35. R Development Core Team: R. A Language and Environment for Statistical Computing, Version
2.13.0; R Foundation for Statistical Computing: Vienna, Austria, 2011. Available online:
http://www.R-project.org/ (accessed on 6 May 2011).
36. Arc 9.3 Arc/Info; Environmental Systems Research Institute: Redlands, CA, USA, 2009.
Forests 2013, 4 177
37. Arnell, N.A.; Osborne, T.; Hiiker, J. Using Agriculturally Meaningful Measures of Climatic
Similarity to Identify Present and Future Analogue Climates; Report to CCAFS: Development of
Prototype Climate Analogue Tool 2011; Walker Institute for Climate System Research, University
of Reading: West Berkshire, UK, 2011.
38. Huston, M. Soil nutrients and tree species richness in Costa Rican forests. J. Biogeogr. 1980, 7,
147–157.
39. Dise, N.B.; Wright, R.F. Nitrogen leaching from European forests in relation to nitrogen deposition.
For. Ecol. Manag. 2000, 71, 153–161.
40. Yang, Y.; Watanabe, M.; Li, F.; Zhang, J.; Zhang, W.; Zhai, J. Factors affecting forest growth and
possible effects of climate change in the Taihang Mountains, northern China. Forestry 2006, 79,
135–147.
41. Bedrick, E.J. Checking for lack of fit in linear models with parametric variance functions.
Technometrics 2000, 42, 227–236.
42. Mac Nally, R. Regression and model-building in conservation biology, biogeography and ecology:
The distinction between—and reconciliation of—‘predictive’ and ‘explanatory’ models. Biodivers.
Conserv. 2000, 9, 665–671.
43. O’Brien, R.M. A caution regarding rules of thumb for variance inflation factors. Qual. Quant. 2007,
41, 673–690.
44. PCMDI, IPCC Model Output 2007. Available online: http://www-pcmdi.llnl.gov/ipcc/
about_ipcc.php (accessed on 20 June 2011).
45. IPCC Special Report on Emissions Scenarios (SRES); Nakicenovic, N., Swart, R., eds.;
Cambridge University Press: Cambridge, UK, 2000.
46. Lugo, A.E.; Brown, S.; Chapman, J. An analytical review of production rates and stemwood
biomass of tropical forest plantations. For. Ecol. Manag. 1988, 23, 189–200.
47. Mearns, L.O.; Rosenzweig, C.; Goldberg, R. Mean and variance change in climate scenarios:
Methods, agricultural applications, and measures of uncertainty. Clim. Chang. 1997, 34, 367–396.
48. Whittingham, M.J.; Stephens, P.A.; Bradbury, R.B.; Freckleton, R.P. Why do we still use stepwise
modeling in ecology and behaviour? J. Anim. Ecol. 2006, 75, 1182–1189.
49. Rencher, A.C.; Pun, F.C. Inflation of R2 in best subset regression. Technometrics 1980, 22, 49–53.
50. Gonzalez, R.W.; Salón, D.; Dasmohaptra, S.; Cubbage, F. South America industrial roundwood
supply potential. BioResources 2008, 3, 255–269.
51. Matalaa, J.; Ojansuu, R.; Peltola, H.; Sievänen, R.; Kellomäki, S. Introducing effects of temperature
and CO2 elevation on tree growth into a statistical growth and yield model. Ecol. Model. 2005, 181,
173–190.
52. Rehfeldt, G.E.; Tchebakova, N.M.; Parfenova, Y.I.; Wykoff, W.R.; Kuzmina, N.A.; Milyutin, L.I.
Intraspecific responses to climate in Pinus sylvestris. Glob. Chang. Biol. 2002, 8, 912–929.
53. Fairbanks, D. South African Country Study on Climate Change: Vulnerability and Adaptation
Assessment for Plantation Forestry; National Research Foundation: Pretoria, South Africa, 1999.
54. Rowhani, P.; Lobell, D.B.; Linderman, M.; Ramankutty, N. Climate variability and crop production
in Tanzania. Agric. For. Meteorol. 2001, 151, 449–460.
55. Brook, J.R.; Flanagan, L.B.; Ehleringer, J.R. Responses of boreal conifers to climate fluctuations:
Indications from tree-ring widths and carbon isotope analyses. Can. J. For. Res. 1998, 29, 524–533.
Forests 2013, 4 178
56. Clark, D.A.; Clark, D.B. Climate induces annual variation in canopy tree growth in a Costa Rican
tropical rain forest. J. Ecol. 1994, 82, 865–872.
57. Mátyás, C. Climatic adaptation of trees: Rediscovering provenance tests. Euphytica 1996, 92,
45–54.
58. William, R.L.; Barner, H. Matching Seed Source to Planting Site; Lecture Note B.3; Danida Forest
Seed Centre: Humlebaek, Denmark, 1993.
59. Finley, K.W.; Wilkinson, G.N. The analysis of adaptation in a plant‐breeding program. Aust. J.
Agric. Res. 1963, 14, 342–354.
60. Lortie, C.J.; Aarssen, L.W. The specialization hypothesis for phenotypic plasticity in plants. Int. J.
Plant Sci. 1996, 15, 484–487.
61. Via, S.; Gomulkiewicz, R.; de Jong, G.; Scheiner, S.M.; Schlichting, C.D. Adaptive phenotypic
plasticity: Consensus and controversy. Trends Ecol. Evol. 1995, 10, 212–217.
62. Emery, R.J.N.; Chinnappa, C.C.; Chmielewski, J.G. Specialization, plant strategies, and phenotypic
plasticity in populations of Stellaria longipes along an elevational gradient. Int. J. Plant Sci. 1994,
155, 203–219.
63. Hodge, G.R.; Dvorak, W.S. Genetic parameters and provenance variation of Pinus tecunumanii in
78 international trials. For. Genet. 1999, 6, 157–180.
64. Rosvall, O.; Ericsson, T. Förtlyttningseffekter I norrländska gran-proveniensförsörk. Föreningen
Skogrsträds-förädling; Institutet for Skogsförbättring: Årsbok, Sweden, 1981.
65. Davis, M.B.; Shaw, R.G. Range shifts and adaptive responses to quaternary climate change.
Science 2001, 292, 673–679.
66. FAO. Adaptation to Climate Change in Agriculture, Forestry and Fisheries: Perspective,
Framework and Priorities; Food Agricultural Organization of the United Nations: Rome, Italy,
2007; p. 2.
67. Mitchell, R.G.; Steenkamp, E.T.; Coutinho, T.A.; Wingfield, M.J. The pitch canker fungus,
Fusarium circinatum: Implications for South African forestry. South. For. 2011, 73, 1–13.
68. Wilby, R.; Dawson, C. SDSM 4.1–A Decision Support Tool for the Assessment of Regional Climate
Change Impacts; User Manual: London, UK, 2007; p. 93.
69. Stott, P.A.; Kettleborough, J.A. Origins and estimates of uncertainty in predictions of twenty-first
century temperature rise. Nature 2002, 416, 723–726.
© 2013 by the authors; licensee MDPI, Basel, Switzerland. This article is an open access article
distributed under the terms and conditions of the Creative Commons Attribution license
(http://creativecommons.org/licenses/by/3.0/).