
Second harmonic generation spectroscopy of plasmonic nanostructures and...
106
Second harmonic generation spectroscopy of plasmonic nanostructures and metamaterials Dissertation zur Erlangung des Doktorgrades (Dr. rer. nat.) der Mathematisch-Naturwissenschaftlichen Fakultät der Rheinischen Friedrich-Wilhelms-Universität Bonn vorgelegt von Heiko Linnenbank aus Warendorf Bonn 2015
Transcript of Second harmonic generation spectroscopy of plasmonic nanostructures and...
Second harmonic generation spectroscopy
of plasmonic nanostructures and
metamaterials
Dissertation
zur
Erlangung des Doktorgrades (Dr. rer. nat.)
der
Mathematisch-Naturwissenschaftlichen Fakultät
der
Rheinischen Friedrich-Wilhelms-Universität Bonn
vorgelegt von
Heiko Linnenbank
ausWarendorf
Bonn 2015


Angefertigt mit Genehmigung der Mathematisch-Naturwissenschaftlichen Fakultät derRheinischen Friedrich-Wilhelms-Universität Bonn
1. Gutachter: Prof. Dr. Stefan Linden2. Gutachter: Priv.-Doz. Dr. Elisabeth Soergel
Tag der Promotion: 27.07.2015Erscheinungsjahr: 2015

Abstract
Plasmonic nanostructures are subwavelength sized metallic structures which interact withelectromagnetic waves, e.g., light, on the basis of frequency selective, collective oscillationsof the conduction electrons, the so-called plasmonic resonances. These resonances can betailored by engineering the size and shape of the metallic structures and lead to a stronglocal intensity enhancement close to the metal structures for an incident electromagneticwave. Due to their tunable optical response, plasmonic nanostructures are frequently usedas the building blocks of metamaterials, which are man-made effective materials support-ing unprecedented optical properties. One class of optical processes, which can be stronglyenhanced by both, optical resonances in matter and local intensity enhancements, are nonlin-ear optical frequency conversion processes. The most prominent and also first demonstratedamong those is second harmonic generation, the instantaneous conversion of a strong electro-magnetic wave into a new wave with twice the frequency inside a material lacking inversionsymmetry. In this thesis, second harmonic generation from plasmonic nanostructures andmetamaterials will be investigated.
In order to perform second harmonic generation spectroscopy on plasmonic nanostructures,i.e., to analyse the second harmonic generation efficiency of these structures as a functionof the pump frequency, a novel light source for the generation of widely tunable ultrashortlaser pulses is developed. This light source is based on optical parametric generation andamplification in a single macroscopic lithium niobate crystal. This process converts anintense wave into two new waves, whereas the sum of the frequencies of the new waves hasto match the frequency of the original one. By this, femtosecond pulses generated by a42 MHz repetition rate passively mode-locked Yb:KGW oscillator are converted into morethan two watts of tunable near-infrared radiation between 1370 nm and at least 1650 nm.Beside its high average output power this device shows a high long term stability and allowsto achieve pulse durations down to below 200 fs. Thus it constitutes an ideal light source toinvestigate second harmonic generation from plasmonic nanostructures.
To analyse the interplay between the local intensity enhancement, inherent to plasmonicnanostructures, and the nonlinear optical response of dielectric matter, plasmonic nanoan-tennas and nonlinear dielectric nanoparticles are combined in a two-stage electron-beamlithography process. Second harmonic generation spectroscopy on the combined hybrid di-electric/plasmonic nanoantennas as well as on the individual constituents shows, that secondharmonic generation from the bare gold nanoantennas, even though it should be forbiddendue to symmetry reasons, is several orders of magnitude larger than that of the bare dielec-tric nanoparticles. As even stronger second harmonic signals are generated by the hybriddielectric/plasmonic nanoantennas, control experiments with nanoantennas containing linear
I
dielectric nanoparticles are performed to study the origin of the second harmonic generationenhancement. These experiments reveal that the increased second harmonic generation ef-ficiency of the hybrid dielectric/plasmonic nanoantennas does not depend on the nonlinearoptical susceptibility of the dielectric nanoparticles, but is an effect of the modification ofthe dielectric environment. Additional experiments show, that a simple combination of twonanoantennas to a nanoantenna system, resonant for both, the incoming pump light fieldand the generated light, provides not only a strong enhancement of the second harmonicgeneration efficiency but also offers control over the polarization properties of the generatedsecond harmonic light.
Inspired by the results from double resonant nanoantenna systems, plasmonic nanostruct-ures, which show only a resonance for the generated second harmonic light are investigated.By comparing a series of nanoantenna arrays, owning spectral distinct plasmonic resonances,it is shown, that the second harmonic generation efficiency of these structures is stronglydependent and resonantly enhanced by these two-photon resonances. This result is qual-itatively and in part also quantitatively explained in a metamaterial picture, connectingthe results of linear extinction spectroscopy with those of second harmonic spectroscopymeasurements via an anharmonic oscillator model. Furthermore noncentrosymmtric na-nostructures resonant for the generated light are studied. This study indicates that thegeneral symmetry selection rules for second harmonic generation can be also applied toplasmonic nanostructures. Through a comparison of noncentrosymmtric nanostructures ex-hibiting strongly distinct linear extinction spectra the previous result is reinforced, that afurther enhancement of the second harmonic generation efficiency is possible by designingnanostructures, which are not only resonant for either the pump or the generated secondharmonic light, but for both.
II
Contents
1 Introduction 1
2 Fundamentals 5
2.1 Maxwell’s equations and consequences . . . . . . . . . . . . . . . . . . . . . 5
2.2 Linear response of matter to electromagnetic waves . . . . . . . . . . . . . . 8
2.2.1 Dielectrics as harmonic oscillators . . . . . . . . . . . . . . . . . . . . 8
2.2.2 Metals in the Drude model . . . . . . . . . . . . . . . . . . . . . . . . 10
2.2.3 Surface plasmon polaritons . . . . . . . . . . . . . . . . . . . . . . . . 11
2.3 Nanoplasmonics . . . . . . . . . . . . . . . . . . . . . . . . . . . . . . . . . . 13
2.3.1 Optical properties of metal nanoparticles . . . . . . . . . . . . . . . . 13
2.3.2 Nanoantennas . . . . . . . . . . . . . . . . . . . . . . . . . . . . . . . 15
2.3.3 V-chaped nanostructures . . . . . . . . . . . . . . . . . . . . . . . . . 21
2.3.4 The metamaterial concept . . . . . . . . . . . . . . . . . . . . . . . . 22
2.4 Nonlinear optics . . . . . . . . . . . . . . . . . . . . . . . . . . . . . . . . . . 24
2.4.1 Nonlinear polarization and effects of second order . . . . . . . . . . . 24
2.4.2 Nonlinear susceptibility . . . . . . . . . . . . . . . . . . . . . . . . . . 26
2.4.3 Nonlinear response of plasmonic nanoparticles . . . . . . . . . . . . . 30
2.4.4 Wave description of nonlinear optics . . . . . . . . . . . . . . . . . . 32
2.4.5 Second harmonic generation . . . . . . . . . . . . . . . . . . . . . . . 33
2.4.6 Optical parametric generation and amplification . . . . . . . . . . . . 39
3 Optical parametric generator 45
3.1 Experimental setup . . . . . . . . . . . . . . . . . . . . . . . . . . . . . . . . 46
3.2 Results and discussion . . . . . . . . . . . . . . . . . . . . . . . . . . . . . . 48
3.2.1 Pump power influence . . . . . . . . . . . . . . . . . . . . . . . . . . 48
3.2.2 Wavelength tuning . . . . . . . . . . . . . . . . . . . . . . . . . . . . 50
III
CONTENTS
4 Nonlinear Plasmonics 53
4.1 Sample fabrication . . . . . . . . . . . . . . . . . . . . . . . . . . . . . . . . 53
4.1.1 Electron-beam lithography . . . . . . . . . . . . . . . . . . . . . . . . 53
4.1.2 Thin film deposition by thermal evaporation . . . . . . . . . . . . . . 56
4.2 Hybrid plasmonic/dielectric gap nanoantennas . . . . . . . . . . . . . . . . . 60
4.2.1 Investigated samples . . . . . . . . . . . . . . . . . . . . . . . . . . . 60
4.2.2 Experimental setup . . . . . . . . . . . . . . . . . . . . . . . . . . . . 61
4.2.3 Influence of dielectrics . . . . . . . . . . . . . . . . . . . . . . . . . . 64
4.2.4 Double resonant gap nanoantenna systems . . . . . . . . . . . . . . . 69
4.3 Two-photon resonant metamaterials . . . . . . . . . . . . . . . . . . . . . . . 71
4.3.1 Materials and experimental methods . . . . . . . . . . . . . . . . . . 71
4.3.2 Two-photon resonant nanoantennas . . . . . . . . . . . . . . . . . . . 73
4.3.3 Noncentrosymmetric structures . . . . . . . . . . . . . . . . . . . . . 77
5 Conclusions and Outlook 81
Literature 85
List of publications 95
Acknowledgements 97
IV
1
Introduction
...colours which appear through the prism are to be derived from the light of the white one...[1]
Sir I. Newton explained the appearance of the magnificent colours of the rainbow or flowerpetals by proposing that the white sunlight, or that of any thermal light source, is actuallycomposed of all colours and can be separated into those [1]. He concluded that the rainboworiginates from a colour selective refraction of light and that the petal colour is due to acolour selective absorption of light. This actually means, that the colour of light, or to usea more mathematical language, its frequency, is not converted by light matter interactions.Newton even gave a hint to the microscopic mechanism of the light matter interactions, as hestated that, "... Light [acts] upon Bodies... putting their parts into a vibrating motion..." [1].More than a hundred years later, H. A. Lorentz was able to completely explain those lightmatter interactions, by describing this "vibrating motion" as an oscillation of electrons inthe harmonic potential of the atomic cores [2].
Like any oscillating or vibrating system those electrons bound to the atomic core will showan inherent resonance. That means, if the system is periodically excited by an external force,the amplitude of the oscillation will depend on the frequency of the excitation and will showa maximum, when the excitation frequency matches the eigen- or resonance frequency of thesystem. By accepting light to be an electromagnetic wave,1 which excites those oscillations, itbecomes evident, that light matter interactions are strongly frequency dependent. Hence, itshould be possible to engineer the optical response of matter by manipulating the resonancefrequency of its constituents, i.e., the atoms.
Very similar to atoms, subwavelength sized metallic structures respond frequency selec-tive to an electromagnetic wave with a collective electron oscillation, called plasmonic reso-nance [3–5]. But in contrast to atoms, the resonance of those plasmonic structures dependson their geometry and can thus be engineered. By turning from optical to radiowave fre-quencies one realizes that subwavelength metallic objects are a very common tool for themanipulation of electromagnetic waves since the end of the nineteenth century. The anten-nas used in the pioneering experiments of H. Hertz and G. Marconi [6, 7] and enabling ourmodern ways of wireless communication, are also subwavelength metallic objects merely forsix orders of magnitude longer wavelengths. But it needed the development of high precisionnano-fabrication techniques in the last decades to controlled manufacture nanometer sized
1Actually Newton refused the theory of light being a wave, but that is another story.
1
1. INTRODUCTION
metallic structures [8], which exhibit resonances in the near-infrared and even in the visiblespectral regime [9, 10]. This analogy between radiowave antennas and plasmonic nanostruct-ures gives also an indication of an important property of the latter. When H. Hertz provedthe existence of electromagnetic waves, he used an antenna to convert a free propagatingwave with a wavelength of around one meter to a spark ignition in a micrometer gap [6].This actually corresponds to focussing into a deep subwavelength volume, not possible withclassic refractive optics [11], resulting in an enormous local field enhancement.
Roughly twenty years ago Sir J. B. Pendry et al. came up with the concept of not usingmatter composed of real atoms to influence light, but materials consisting of densely periodicarranged, plasmonic structures, so-called metamaterials [12, 13]. The idea behind this con-cept is, that the light does not resolve the response of the individual constituents, as they aremuch smaller and denser packed than the wavelength of light, but experiences a collectiveresponse of those. With the concept of metamaterials it was actually possible to realize lightmatter interactions not encountered in nature, e.g., magnetism at optical frequencies [14–16],a negative refractive index [17–19], or electromagnetic invisible cloaks [20–22].
In 1961, Newton’s finding, that the frequency of light is inalterable by light matter interac-tions, was refuted. P. Franken et al. demonstrated, that the interaction between a wave withhigh intensity and coherence, and a medium lacking inversion symmetry leads to the gener-ation of a new wave with twice the frequency of the original one [23], i.e., second harmonicgeneration. Even with the use of the only shortly before invented laser [24], representinga monochromatic light source with an intensity and coherence not encountered in nature,this effect was so weak, that the faint spot on the photoplate, resulting from the gener-ated second harmonic light, was removed during the editorial process of the correspondingpublication [25]. Second harmonic generation was only the first observed nonlinear opticalprocess out of a plethora [26], but it is still very well suited to investigate the basic proper-ties of nonlinear optical processes in general. By investigating second harmonic generationit was for example shown, that the conversion efficiency of nonlinear processes is completelydetermined by both, the magnitude of the (linear) optical response at the generated and theoriginal frequencies and that the employed material has to lack inversion symmetry to showsecond harmonic generation [23, 27, 28].
The term nonlinear optics in contrast to the former discussed linear optics can be under-stood from the microscopic origin. If the electron oscillation, responsible for the opticalresponse of matter, is excited by strong electric fields, its amplitude can get so strong, thatthe atomic potential can not be modelled as harmonic any more. Instead an anharmonicpotential describing a restoring force with a nonlinear dependency on the electron displace-ment has to be taken into account [29]. Therefore strong electric fields are mandatory toobserve nonlinear processes. By this it becomes evident, that due to their inherent local fieldenhancement plasmonic nanostructures and metamaterials consisting of those are promisingcandidates to enhance nonlinear light matter interactions [13] and also give rise to nonlinearwave interactions themselves [30, 31]. This opened the very active research field of nonlinearplasmonics. Here, several strategies to achieve high conversion efficiencies have been inves-tigated e.g., the comparison of differently shaped nanostructures [32, 33], the combinationof metallic nanostructures and nonlinear dielectrics [34, 35], variation of the nanostructurearrangement [36], or the combination of so called "acitve" and "passive" structures [37].But several aspects are still topics of discussions, as for example how plasmonic nanostruct-
2
ures interact with nanoscale nonlinear matter [38, 39] or how plasmonic resonances for thegenerated frequency influence nonlinear processes in plasmonic nanostructures [40–42].
In the majority of the previous quoted studies the nonlinear interactions were analysed ata fixed excitation frequency. This is somehow surprising, as the inherent local field en-hancement of plasmonic nanostructures is a resonant effect and the basic idea behind thesestructures is to obtain engineerable light matter interactions by tailoring their resonances.Accordingly a strongly frequency dependent nonlinear response can be expected. To eluci-date this connection, it is advisable to not only compare structures with distinct resonances,but to study the linear as well as the nonlinear interactions as a function of frequency. Thistechnique is in general termed spectroscopy [43]. Indeed, the above mentioned discussionsarose from the results of nonlinear spectroscopic studies [39, 40], which are contradictoryto studies at fixed frequencies [38, 41]. In the case of linear interactions spectroscopy canbe conducted with thermal light sources or just the sun light, as in Newton’s studies [44].But when it comes to nonlinear interactions a spectral intensity and coherence is needed toobserve these processes, which can be only achieved by lasers. As the tunability of lasersis strongly limited by the gain bandwidth of the respective active material, a common ap-proach is to convert the highly intense and coherent radiation of a laser to new frequencies.In this thesis an optical parametric generator, based on a macroscopic bulk crystal, hasbeen designed and used to perform second harmonic generation spectroscopy of plasmonicnanostructures.
3
1. INTRODUCTION
Outline of this Thesis
This thesis deals with the spectroscopic investigation of second harmonic generation fromplasmonic nanostructures and metamaterials. In the first part of chapter 2 the linear in-teraction mechanism between light and matter starting from Maxwell’s equations will bereviewed. This paves the way to allow an understanding of the basic properties of plas-monic nanostructures and metamaterials, summed up under the heading Nanoplasmonics,discussed in the second part. In the last part of chapter 2 nonlinear optics of second order ingeneral will be reviewed for a deeper understanding of the experimental results in the laterchapters.
In chapter 3 the light source, which will be used for the later experiments will be presented.Based on the process of optical parametric generation a novel frequency converter designwas implemented and analysed.
Chapter 4 will cover the linear and nonlinear spectroscopic investigation of plasmonic na-nostructures and metamaterials. In the first part the technique used to fabricate those willbe explained in detail. In the second part the interplay of gap nanoantennas and dielectricnanoparticles will be examined, with respect to their second harmonic generation efficiency.Here, both dielectrics with and without nonlinear properties will be used to determine theorigin of the nonlinearity of the hybrid plasmonic dielectric nanostructures. In the last part,second harmonic generation from metamaterials will be studied, which are composed of plas-monic structures that only exhibit a two-photon resonance, i.e., a plasmonic resonance forthe generated light.
This thesis is finally concluded in chapter 5 and an outlook into possible future researchesis given.
4
2
Fundamentals
In the following chapter the theoretical background of this thesis will be presented to thereader. As this thesis deals with the interaction between electromagnetic waves and mat-ter, both artificial and natural, this chapter will start with the most basic description ofelectromagnetism, which is given by Maxwell’s equations. Based on these, microscopic phe-nomenological models for dielectrics and metals will be presented in the first part of thischapter to finally understand the linear interaction between electromagnetic waves and plas-monic nanostructures or metamaterials. In the second part of this chapter the nonlinearinteraction between electromagnetic waves and matter will be discussed, which is the basisof both the investigation of nonlinear plasmonics and the provision of a suitable light sourcefor this purpose.
2.1 Maxwell’s equations and consequences
The properties of electromagnetic fields in media are thoroughly described by a set of equa-tions, derived by James Clark Maxwell in 1864. They read [45]:
∇ ·D(r,t) = ρ(r,t) (2.1)
∇ ·B(r,t) = 0 (2.2)
∇×E(r,t) = −∂B(r,t)
∂t(2.3)
∇×H(r,t) = j(r,t) +∂D(r,t)
∂t(2.4)
here and throughout this thesis D(r,t) denotes the dielectric displacement, B(r,t) the mag-netic induction, E(r,t) the electric field, H(r,t) the magnetic field, and ρ(r,t) and j(r,t)the external charge and current densities. Internal charge separations and currents lead to amacroscopic electric polarization P (r,t) and magnetization M (r,t), that can be connectedto the quantities mentioned before via the constitutive equations [11]:
D(r,t) = ǫ0E(r,t) + P (r,t) (2.5)
B(r,t) = µ0H(r,t) +M(r,t) (2.6)
5
2. FUNDAMENTALS
with ǫ0 = 8.85 × 10⁻¹² F/m the permittivity in free space and µ0 = 4π × 10−7 N/A2 thepermeability in free space. These two natural constants can be connected to the speed oflight in vacuum c0 = 1/
√µ0ǫ0.
By applying a rotation on equation (2.3) and combining equation (2.1) and (2.4) with theconstitutive equations (2.5) and (2.6) we achieve:
−∇2E(r,t) +1
c20
∂2E(r,t)
∂t2= − ∂
∂t
(
µ0j(r,t) + µ0∂P (r,t)
∂t+∇×M(r,t)
)
(2.7)
which is known as the inhomogeneous wave equation for the electric field. The left handside of equation (2.7) represents the homogeneous wave equation for the electric field invacuum. Whereas the terms on the right hand side act as source terms. From this wecan distinguish two types of sources: (i) the external source current density j(r,t) and
(ii) µ0∂P (r,t)
∂tand ∇×M(r,t) as polarization and magnetization current density, respectively.
The latter describe the interaction of electromagnetic radiation with matter. By restrictingourselves to dielectric or metallic but nonmagnetic materials, the magnetization M(r,t) canbe neglected and is set equal to zero. If we assume a vanishing external charge densityρ(r,t) and external current density j(r,t), i.e., all external sources which primary generate,e.g., the incoming electromagnetic fields are located outside our considered spatial domain,equation (2.7) further simplifies to:
∇2E(r,t)− 1
c20
∂2E(r,t)
∂t2= µ0
∂2P (r,t)
∂t2(2.8)
So far, the above derivation of the wave equation (2.8) in matter was carried out in thespatial and the temporal domain. For the following considerations it is more convenient toswitch to a frequency domain description. Hence, we define the Fourier transform betweenthe temporal and the frequency domain for the electric field E(r,t) as [45]:
E(r,ω) =
∫ ∞
−∞E(r,t)eıωtdt (2.9)
E(r,t) =1
2π
∫ ∞
−∞E(r,ω)eıωtdω (2.10)
With this we obtain the wave equation in matter in the frequency domain:
∇2E(r,ω) +ω2
c20E(r,ω) = −µ0ω
2P (r,ω) (2.11)
Obviously the polarization P (r,ω) in the medium is a function of the electric field E(r,ω)and can therefore be written as a power series of the electric field E(r,ω) [29]. At first wewill only consider the case of low electric field amplitudes, where the term linear in E(r,ω) isdominating, and all higher order contributions can be omitted. For strong field amplitudesthose higher order terms can of course not be neglected any more and will lead to several
6
2.1. MAXWELL’S EQUATIONS AND CONSEQUENCES
interesting effects, which will be discussed in section 2.4 about nonlinear optics.1 Hence, inthe limiting case of linear optics the polarization P (r,ω) can be expressed by:
P (r,ω) = ǫ0χ(1)(ω)E(r,ω) (2.12)
where χ(1)(ω) is the first order electric susceptibility. Here, a homogeneous, isotropic mate-rial was assumed, which means that χ(1)(ω) is a (in our considered spatial domain) spatiallyconstant scalar function. For anisotropic materials the electric field E(r,ω) and the polar-ization P (r,ω) are not necessarily parallel, in that case the electric susceptibility must then
be written as a tensor of second order: Pi = ǫ0∑3
j=1 χ(1)ij Ej . We will limit the following
discussion to the case of homogeneous, isotropic materials. By inserting equation (2.12) intothe wave equation in frequency domain (2.11) we obtain the Helmholtz equation:
∇2E(r,ω) + (1 + χ(1)(ω))ω2
c20E(r,ω) = (2.13)
∇2E(r,ω) + ǫr(ω)ω2
c20E(r,ω) = (2.14)
∇2E(r,ω) +ω2
c2E(r,ω) = 0 (2.15)
where we defined the relative permittivity ǫr(ω) = (1 + χ(1)(ω)), which connects the di-electric displacement with the electric field: D(r,ω)=ǫ0ǫrE(r,ω). With this the complexrefractive index n2(ω) = ǫr(ω), which defines the speed of light in matter c = c0/n, can bedefined. Analogous considerations starting from equation (2.4) lead to a wave equation forthe magnetic field, the magnetic susceptibility χm(ω) and the relative permeability µr(ω).Even as magnetic materials will be not considered in this thesis (and therefore we assumeµr(ω) = 1 in the following), it is important to mention, that in general the refractive indexis defined as n2(ω) = ǫr(ω)µr(ω).
Equation (2.15) can be solved by:
E(r,ω) =1
2
[E0e
ı(k·r−ωt) + cc.]
(2.16)
representing a plane wave oscillating in time with the frequency ω and propagating in thedirection of the wave vector k, cc. denotes the complex conjugate. Inserting the plane wavesolution into equation (2.15) leads to the dispersion relation of a free propagating wave:
ω2
|k|2 =c20n2
(2.17)
In general the refractive index and hence the relative permittivity ǫr(ω) are complex quan-tities. Assuming a plane wave propagating in z-direction we obtain:
kz =ω
c0nez =
ω
c0(n(ω) + ıκ(ω))ez (2.18)
1The term nonlinear optics originates in the nonlinear dependency of the polarization on the electricfield.
7
2. FUNDAMENTALS
where ez denotes the unit vector in z-direction. With this the electric field of a plane wavereads:
E(z,ω) = E0 · eı(ωc0
n(ω)z−ωt) · e−ωc0
κ(ω)z(2.19)
The first exponential function describes an oscillation and thus, the propagation of thewave through a medium is characterized by the real part n(ω) of the refractive index. Thesecond exponential function describes an exponential decay and thus, the attenuation of thewave through a medium is associated with the imaginary part κ(ω) of the refractive index.Therefore the term refractive index sometimes only refers to the real part n, whereas theimaginary part κ is known as extinction coefficient [46].
2.2 Linear response of matter to electromagnetic
waves
As we have seen before, in the limiting case of linear optics the propagation of an electromag-netic wave in a medium can be completely described by the complex refractive index n(ω),which in turn is given by the electric susceptibility χ(1)(ω). Therefore the goal of the nextparagraphs is to derive models which provide the frequency dependent electric susceptibilityχ(1)(ω) for different classes of materials.
2.2.1 Dielectrics as harmonic oscillators
The classical response of atoms to electromagnetic waves can be described in a driven oscil-lator picture, the so-called Lorentz model [2, 11]. Here, the atom is modelled as an electronwhich is bound to the atomic core. Applying an oscillating electric field leads to an oscil-lation of the electron around its rest position. For low light intensities, the electrons canbe regarded as bound in a harmonic potential. Therefore the equation of motion in onedimension for a single electron driven by the electric field E0e
−ıωt is given by:
me∂2x(t)
∂t2+meγL
∂x(t)
∂t+meω
20x(t) = −eE0e
−ıωt (2.20)
where x(t) is the displacement of the electron, γL the damping constant, ω0 the res-onance frequency, e = 1.6 × 10⁻¹⁹ As the elementary charge and me = 9.1 × 10⁻³¹
kg the electron mass. Here, we assume the incident plane wave to be polarized in x-direction: E(r,t) = exE0e
ı(k·r−ωt). The steady state solution of equation (2.20) is givenby x(t) = a(ω)e−ıωt leading to the electric dipole moment of a harmonic oscillator:
p(t) = −ex(t) =e2
me
1
(ω20 − ω2 − ıγLω)
E0e−ıωt (2.21)
Thus, the electric dipole moment is proportional to the electric field. The proportionalityfactor α(ω) is called polarizability. With a number of ne oscillating electrons per atom it
8
2.2. LINEAR RESPONSE OF MATTER TO ELECTROMAGNETIC WAVES
reads:
α(ω) =nee
2
me
1
(ω20 − ω2 − ıγLω)
(2.22)
If we consider only atoms of the same type with polarizability α(ω), arranged with a con-stant density na, we obtain with the electron number density Ne = ne · na the macroscopicpolarization P (ω):
P (ω) = naα(ω)E(ω) = ǫ0χ(ω)E(ω) (2.23)
In the case of a real dielectric we have to consider different types of atoms not necessarilyobeying the same microscopic polarizability α(ω). For an ordered crystal consisting of afinite number N of types of atoms, the macroscopic polarization P (ω) can be written as:
P (ω) = E(ω)
N∑
ν=1
nee2
me
fν(ω2
0,ν − ω2 − ıγL,νω)(2.24)
where the oscillator strength fν has to satisfy the sum rule∑N
ν=1 fν = na. Here, we neglectall modifications due to interaction between the atoms. This approximation holds true fordiluted gases but breaks down when the atoms are densely packed such that the electronicwave functions overlap and form electronic bands. Nevertheless, even for this case we candefine a new effective polarizability of the same form leading to a qualitatively good descrip-tion of the linear optical properties of nonmetallic solids. For this new effective polarizability,coupled atomic potentials have to be taken into account and not isolated atoms.
In the previous discussion only the one dimensional case was considered, i.e., electrons oscil-lating parallel to the applied electric field. As mentioned in section 2.1 both the macroscopicpolarization P (ω) and the applied electric field E(ω) have a vectorial character and there-fore the macroscopic susceptibility has to be written as a tensor: Pi(ω) = ǫ0
∑3j=1 χijEj(ω).
However, for isotropic media, e.g., ordered crystals consisting of finite types of atoms, thereis always a coordinate system, called the principal axis system, in which χ is diagonal.With the use of this coordinate system the individual diagonal components χii can then beevaluated analogously to the one dimensional case [47].
With the most simple approximation given by (2.22) and (2.23) we can calculate the realand the imaginary part of the complex refractive index:
n(ω) = 1− 1
2
e2Ne
ǫ0me
ω2 − ω20
(ω2 − ω20)
2 + γ2Lω
2(2.25)
κ(ω) =1
2
e2Ne
ǫ0me
γLω
(ω2 − ω20)
2 + γ2Lω
2(2.26)
For dielectric crystals modelled with a single Lorentz oscillator the resonance frequency ω0
can be identified with the band gap energy, which is typically located in the ultraviolet(isolators) up to the near-infrared region (semi-conductors). If the frequency ω is increasedtowards the resonance frequency ω0 we obviously get an overall increase of the susceptibilityand thus the complex refractive index, but this increase is connected to a strongly enhancedabsorption.
9
2. FUNDAMENTALS
2.2.2 Metals in the Drude model
In the case of metallic materials, in contrast to the previously discussed case of dielectricmaterials, at least a part of the electrons is not bound to a specific atom. Therefore, theseso-called conduction electrons can be treated in a basic microscopic model of metals asindividual freely moving electrons. It is called the free electron model or the Drude modelof metals [48]. Of course, the conduction electrons are not perfectly free in a metal anddifferent scattering events, like scattering at lattice defects, electron-electron scattering orelectron-phonon scattering, lead to an effective damping of the freely moving electrons. Inthe Drude model this damping is described by the damping parameter γD = 1/τ , where τdescribes the average time between two scattering events. The equation of motion for theDrude model can be directly obtained from that for the Lorentz model (2.20). For this theresonance frequency ω0 is set to zero, due to the lack of the restoring force resulting fromthe binding to the atomic core:
me∂2x(t)
∂t2+meγD
∂x(t)
∂t= −eE0e
−ıωt (2.27)
In analogy to the Lorentz oscillator model the electric susceptibility and the relative permit-tivity ǫ(ω) of the Drude model can be derived:
χ(ω) = −ω2p
ω(ω + ıγD)(2.28)
ǫ(ω) = 1−ω2p
ω(ω + ıγD)(2.29)
Here, the bulk metal plasma frequency ωp =√
e2Ne
ǫ0mewas introduced. Starting from equa-
tion (2.29) some basic properties for metals can be deduced. In the visible and near-infraredspectral regime the frequency ω is much larger than the Drude damping constant γD, butstill smaller than the plasma frequency ωp [49]. Therefore, the imaginary part of ǫ(ω) canbe neglected and the real part becomes negative. Thus, the complex refractive index n(ω)gets purely imaginary, meaning that no wave propagation but only evanescent waves are al-lowed in the metal. Therefore, a plane wave gets fully reflected at the interface of the metal.The 1/e decay length of the evanescent wave into the metal, called skin depth, defined viaequation (2.19) is for the discussed spectral regime in the order of some ten nanometers.
The Drude model is a fairly good description of the behaviour of metals at frequencies inthe near-infrared region. For shorter wavelengths (higher energies) one has to account forexcitations of electrons from lower bands into the conduction band, i.e., interband transi-tions [50]. These interband transitions occur for example in gold at an energy of 2.38 eV(522 nm), where an electron from the 5d-band (valence band) is excited into the 6s-band(conduction band). To improve the description of the permittivity for shorter wavelengths,a common ansatz is to combine the Drude model with Lorentz oscillators. The susceptibilitycorresponding to these excitations is then just added to the Drude permittivity.
10
2.2. LINEAR RESPONSE OF MATTER TO ELECTROMAGNETIC WAVES
2.2.3 Surface plasmon polaritons
Up to now we have discussed free propagating waves. But for an interface between twomaterials, with relative permittivities ǫ1 and ǫ2, lying in the xy-plane equation (2.14) can besolved by an ansatz of the form [5]:
E = E0e−i(kxx+kzz−ωt) (2.30)
The boundary conditions lead to
kz1ǫ1
+kz2ǫ2
= 0 (2.31)
and
k2x + k2
zi = ǫi
(ω
c0
)2
i = 1,2 (2.32)
Solving these two equations, the dispersion relation is given by:
kx =ω
c0
(ǫ1ǫ2
ǫ1 + ǫ2
)1/2
(2.33)
kz,i = =ω
c0
(ǫ2i
ǫ1 + ǫ2
)1/2
i = 1,2 (2.34)
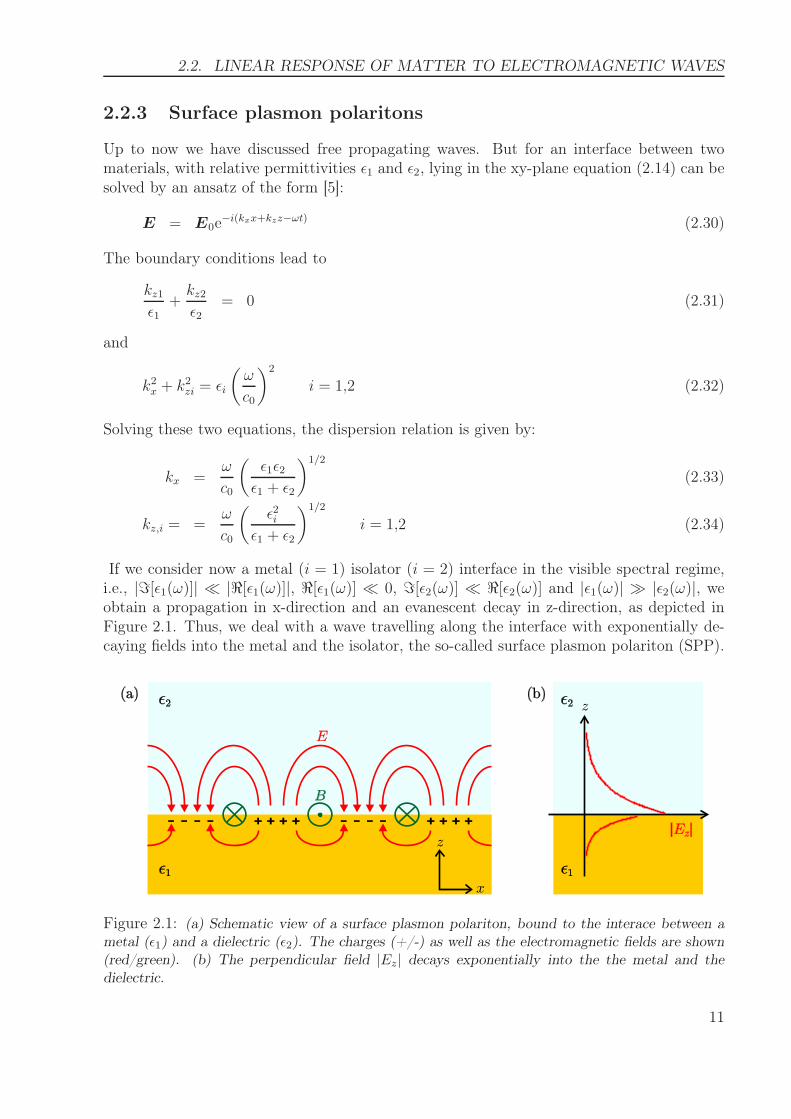
If we consider now a metal (i = 1) isolator (i = 2) interface in the visible spectral regime,i.e., |ℑ[ǫ1(ω)]| ≪ |ℜ[ǫ1(ω)]|, ℜ[ǫ1(ω)] ≪ 0, ℑ[ǫ2(ω)] ≪ ℜ[ǫ2(ω)] and |ǫ1(ω)| ≫ |ǫ2(ω)|, weobtain a propagation in x-direction and an evanescent decay in z-direction, as depicted inFigure 2.1. Thus, we deal with a wave travelling along the interface with exponentially de-caying fields into the metal and the isolator, the so-called surface plasmon polariton (SPP).
z
x
E
B
²1
²2 z
| |Ez
²1
²2(a) (b)
Figure 2.1: (a) Schematic view of a surface plasmon polariton, bound to the interace between ametal (ǫ1) and a dielectric (ǫ2). The charges (+/-) as well as the electromagnetic fields are shown(red/green). (b) The perpendicular field |Ez| decays exponentially into the the metal and thedielectric.
11
2. FUNDAMENTALS
1.0
0.0
0.8
0.6
0.4
0.2
0.00.5 1.0 1.5 2.0 2.5
!!
/p !SPP
c.kx
k [a.u.]x
! !SP P= = 2
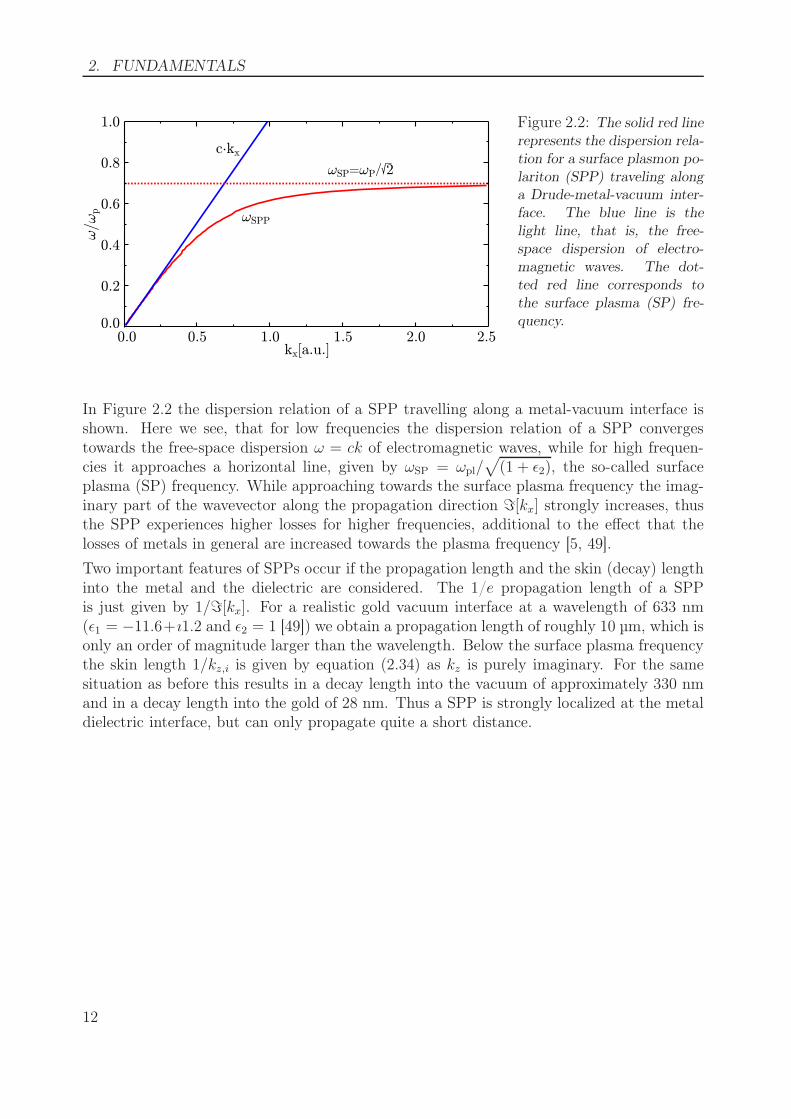
Figure 2.2: The solid red linerepresents the dispersion rela-tion for a surface plasmon po-lariton (SPP) traveling alonga Drude-metal-vacuum inter-face. The blue line is thelight line, that is, the free-space dispersion of electro-magnetic waves. The dot-ted red line corresponds tothe surface plasma (SP) fre-quency.
In Figure 2.2 the dispersion relation of a SPP travelling along a metal-vacuum interface isshown. Here we see, that for low frequencies the dispersion relation of a SPP convergestowards the free-space dispersion ω = ck of electromagnetic waves, while for high frequen-cies it approaches a horizontal line, given by ωSP = ωpl/
√
(1 + ǫ2), the so-called surfaceplasma (SP) frequency. While approaching towards the surface plasma frequency the imag-inary part of the wavevector along the propagation direction ℑ[kx] strongly increases, thusthe SPP experiences higher losses for higher frequencies, additional to the effect that thelosses of metals in general are increased towards the plasma frequency [5, 49].
Two important features of SPPs occur if the propagation length and the skin (decay) lengthinto the metal and the dielectric are considered. The 1/e propagation length of a SPPis just given by 1/ℑ[kx]. For a realistic gold vacuum interface at a wavelength of 633 nm(ǫ1 = −11.6+ı1.2 and ǫ2 = 1 [49]) we obtain a propagation length of roughly 10 µm, which isonly an order of magnitude larger than the wavelength. Below the surface plasma frequencythe skin length 1/kz,i is given by equation (2.34) as kz is purely imaginary. For the samesituation as before this results in a decay length into the vacuum of approximately 330 nmand in a decay length into the gold of 28 nm. Thus a SPP is strongly localized at the metaldielectric interface, but can only propagate quite a short distance.
12
2.3. NANOPLASMONICS
2.3 Nanoplasmonics
After the introduction to the optics of bulk metals in the last paragraph, we will now turn tothe optical properties of metal nanoparticles. Here, we will start with a brief overview of theinteraction of electromagnetic waves with metal nanoparticles in general, which will includea derivation of the title of this section: Nanoplasmonics. This overview will help us to un-derstand the optical properties of the specific geometries, which will be investigated in thisthesis. As it is not possible to solve Maxwell’s equations analytically for arbitrary nanopar-ticle geometries, a non-commercial numerical program package,2 based on the discontinuousGalerkin time domain method [51, 52] will be used to evaluate near-field distributions andplasmonic resonances if necessary. However, due to the need of actual modelling the geome-tries, these evaluations will only cover the limiting case of idealized geometries. Finally wewill treat the collective response of densely arranged metal particles, the so-called metama-terials, to electromagnetic waves.
2.3.1 Optical properties of metal nanoparticles
As was seen before, an external electric field accelerates the conduction band electrons ina metal in one direction. In a small metal particle, the free moving electrons thus travelto one side of the particle and form a negative charge density. On the opposite side ofthe particle the positive background remains and forms a positive charge density. Thischarge separation gives rise to an electric field and a restoring force, like in a mass springsystem (see Figure 2.3), acting on the electrons, resulting in a coherent plasma oscillation [3]comparable to that of electrons bound to a atom, which was discussed in section 2.2.1. Dueto the confinement to the metal particle, one refers to this oscillation as a particle plasmonor a localized surface plasmon in analogy with the surface plasmon polariton [4]. Hereby itbecomes evident that the term Nanoplasmonics refers to the optics of metal nanoparticlesin general.
The simplest approximation of an arbitrary shaped nanoparticle is a small metal spherewith radius a embedded in a dielectric medium with dielectric constant ǫm. If the sizeof the considered metal particles is reduced drastically down below the wavelength of theelectromagnetic wave, the electric field interacting with a single particle becomes quasi-static.Within the quasi static approximation, i.e., the electromagnetic wave has a constant spatialphase along the particle, an analytical expression for the polarizability α(ω) is given by [4]:
α(ω) = 4πa3ǫ(ω)− ǫm(ω)
ǫ(ω) + 2ǫm(ω)(2.35)
where ǫ(ω) is the relative permittivity of the metal and ǫm(ω) that of the surroundingdielectric. On the one hand, we can see that the polarizability is proportional to the thirdpower of the radius a and hence to the volume of the metal sphere. On the other hand, it isproportional to a fractional term which contains the dielectric constants of the metal sphereand the surrounding. This term can exhibit a resonance if the denominator becomes zero.
2Developed in the group of Prof. Dr. Kurt Busch at Karlsruhe Institute of Technology (KIT), Karlsruhe,Germany.
13

2. FUNDAMENTALS
¢x
¢x--- - -
+ ++
++--- - -
+ ++
++
¢x
¢x
jEE
F
F
p
Figure 2.3: (Upper row)Sketch of a metallic nanopar-ticle whose electron cloud hasbeen displaced by ∆x, due toan external oscillating electricfield, e.g., an electromagneticwave, giving rise to an inter-nal electric field E. (Lowerrow) Mechanical analogue ofa mass attached to affixedspring. The restoring forceF corresponds to the internalelectric field E, and the mo-mentum p to the electron cur-rent j, respectively.
In the case of small damping in the metal, we can neglect for the moment the imaginarypart of the dielectric constant ǫ(ω) of the metal sphere. The resonance then appears forℜ[ǫ(ω)] = −2ǫm(ω) , which is called Fröhlich condition [4]. When we use a Drude modelfor the dielectric constant of the metal, as introduced in paragraph 2.2.2, the resonancefrequency ω0 can be calculated for a sphere located in air (ǫm(ω) = 1) to ω0 = ωp/
√3.
Within the quasi-static approximation, we can also deal with ellipsoidal particles with theprincipal axes a, b, and c. In this formalism, the principal axes of the ellipsoids are rep-resented by the normalized geometry parameters Fi, with i = 1, 2, and 3, and
∑
i Fi = 1.Clearly, we obtain a tensorial polarizability leading to a vectorial equation for the polariza-tion:
pxpypz
= ǫm(ω)
α1 0 00 α2 00 0 α3
E0,x
E0,y
E0,z
(2.36)
Here, we assumed that the principal axes of the ellipsoidal particle are aligned along the unitvectors of the Cartesian coordinate system. For the elements of the polarization tensor, weobtain:
αi =ǫ(ω)− ǫm(ω)
ǫm(ω) + (ǫ(ω)− ǫm(ω))FiVellipsoid (2.37)
with Vellipsoid representing the volume of the ellipsoid. Here, the Fröhlich condition gives ageometry dependent resonance frequency of the particle due to the geometry parameter Fi.
Another inherent feature connected with the plasmonic resonances of metal nanoparticlesis the enhancement of the near field around the particle. The intensity of the local fieldIloc ∝ |Eloc|2 compared to the incoming field I0 ∝ |E0|2 differs by the frequency dependentenhancement factor L(ω) [4]:
Iloc = L(ω)I0 = LSP(ω)LLRI0 (2.38)
14
2.3. NANOPLASMONICS
Two physical effects are responsible for the field enhancement. The so-called lightning rodeffect is responsible for the frequency independent contribution LLR and is strongly depend-ing on the geometrical shape of the particle. The electric field on the surface of a perfectconductor points perpendicular to the surfaces normal, therefore leading to a concentrationof the electromagnetic field to areas of sharp edges or tips. The frequency dependent partL(ω)SP is due to the resonant excitation of localized surface plasmons in the structure andessentially resembles the polarizability α(ω).
Additionally the efficiency of scattering and absorption of light by metal nanoparticles be-comes resonantly enhanced. For small particles which are much smaller than the wave-length λ of light, the scattering and absorption cross sections Csca and Cabs, defining theextinction cross section Cext = Cabs + Csca, become [3, 4]:
Cabs =k
ǫ0ℑ(α) ∼ a3 (2.39)
Csca =k4
6πǫ20|α|2 ∼ a6 (2.40)
where k = |k| is the wavenumber. Due to the dependency of the particle size a we see, thatfor very small particles the extinction is dominated by absorption.
Before we turn to the specific geometries, which will be investigated in this thesis, we shortlywant to recapitulate the results of this paragraph:
i An increase of ǫm(ω), i.e., of the refractive index of the surrounding medium, leads toa decrease of the resonance frequency, i.e., a red-shift.
ii An elongation of the particle along the axis parallel to the incident polarisation leadsto a red-shift of the particle’s resonance.
iii An elongation of the particle along the axis perpendicular to the incident polarisationleads to a blue-shift of the particle’s resonance.
iv A resonant excitation of the particle plasmon leads to a local field enhancement aroundthe particle.
v For very small particles the extinction cross section is dominated by absorption.
2.3.2 Nanoantennas
In general the term antenna refers to a device which can radiate and receive electromagneticradiation. In this thesis we will refer to antennas, or to be more specific to nanoantennas,as wires with a finite length, and to gap nanoantennas as two finite wires separated by asmall gap. These nanoantennas can exhibit resonances in the visible or near-infrared spectralregime. From the radio frequency (RF) regime it is well known, that an electromagnetic waveimpinging on a metal wire orientated parallel to the wave’s polarization leads to a chargeseparation oscillating along the wire, like in the case of a metal nanoparticle discussed inthe previous section. A resonance in the excitation of those charge oscillations is observed,
15
2. FUNDAMENTALS
when the length of the wire L corresponds to half of the wavelength of the impinging wavein vacuum: Lres = λvac/2. This linear scaling between the length of the antenna and itsresonance wavelength, resembles the finding of the previous section where a elongation ofmetal particle along the axis parallel to the incident polarisation led to a red-shift of theparticle’s resonance. However, no absolute size scaling for the resonance wavelength wasprovided by the quasi-static approximation.
Fabry-Perot model
In order to get an understanding of the resonances and eigenmodes of a nanoantenna and ofplasmonic nanostructures in general a Fabry-Perot like model will be presented, which willalso resemble the findings from the RF regime [10]. In paragraph 2.2.3 the basic propertiesof surface plasmon polaritons, waves propagating along a metal dielectric surface, werediscussed. SPPs are not limited to planar surfaces but can be also found for metal stripesor cylindrical wires. For an infinite long metal cylinder the basic properties of SPPs stayqualitatively the same, thus presenting a kind of plasmonic waveguide. Especially if thelimiting case of a large cylinder diameter is considered, the dispersion relation, propagationlength and decay length approach the limiting values of a planar interface. But as thediameter is decreased towards the skin length both the imaginary part and the real part ofthe wavevector kSPPM
3 in propagation direction increase, which means that the propagationlength as well as the velocity become smaller. Furthermore it can be shown, that a decreaseof the diameter results in a larger confinement of the fields inside the metal wire and thereforeincreases the losses due to Ohmic damping [53].
A single wire antenna of length L as illustrated in Figure 2.4 can be pictured as a finite pieceof such a wire waveguide. The two open ends represent mirror-like discontinuities with anear unity reflection coefficient. In such an one-dimensional cavity, a standing wave buildsup once the accumulated phase per round trip equals an integer multiple of 2π, similar tothe case of mirror based Fabry-Perot resonator [46]. For plasmonic nanoantennas the fieldsextend outside the physical boundaries of the metal structure, which results in a phase shiftφR upon reflection [54], that has the same effect as some additional length of propagation [55].With this, the resonant antenna length Lres for the m-th order resonance can be connectedto the wavelength of the waveguide mode λSPPM = 2π/ℜ[kSPPM], via the simple relation:
Lres · ℜ[kSPPM] + φR = mπ (2.41)
As, following Figure 2.2, for low, e.g., RF frequencies the dispersion of a SPP approachesthat of vacuum, the above equation becomes Lres = mλvac/2, thus resembling the findingsfrom the RF regime. Here, we made the assumption kSPPM = kSPP, which is justified as fortypical RF wavelengths (∼ 1 m) the antenna diameter can be much larger than the skinlength still obeying a wire like shape. Additionally φR can be neglected compared the overallantenna length at RF wavelengths [54].
However, for optical and near-infrared radiation the wavelength of the waveguide modeλSPPM will be shorter than the wavelength in vacuum, as can be seen from Figure 2.2 and the
3In order to distinguish between a SPP on a planer surface and a SPP on guided a cylinder the abbre-viation SPPM for surface plasmon polariton mode was introduced.
16
2.3. NANOPLASMONICS
°L
°L
©R ©R
m=1 m=2
m=3 m=4
L
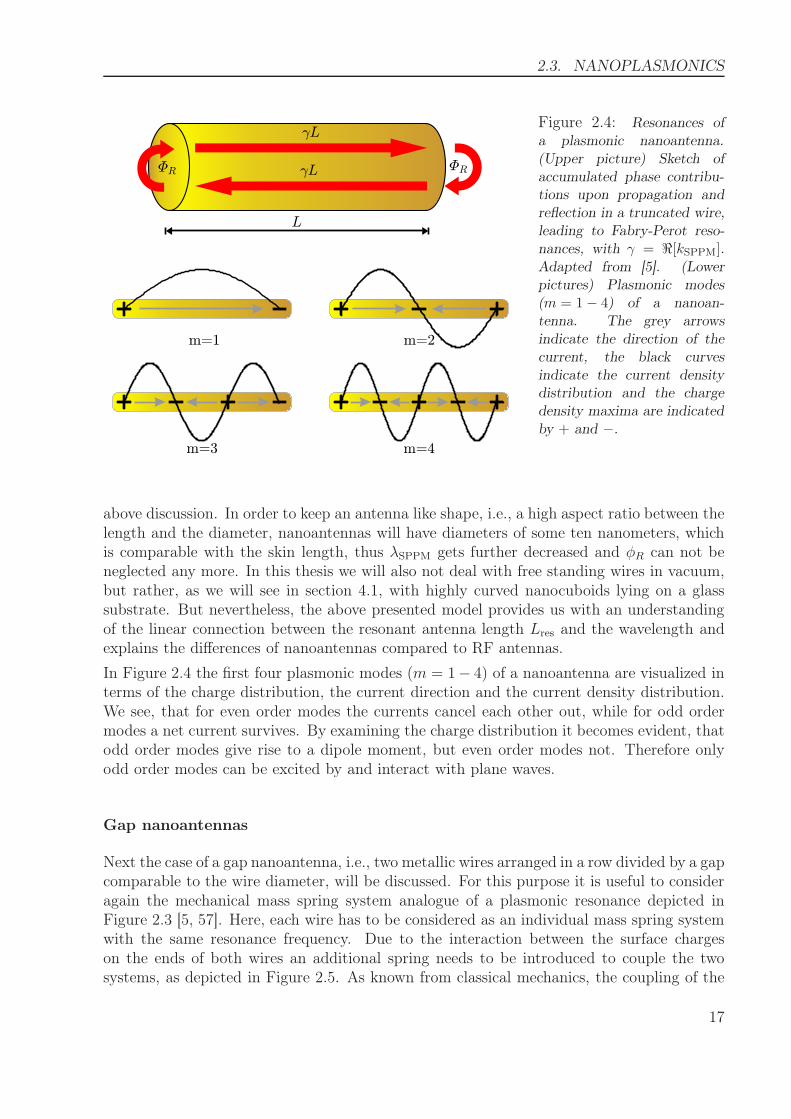
Figure 2.4: Resonances ofa plasmonic nanoantenna.(Upper picture) Sketch ofaccumulated phase contribu-tions upon propagation andreflection in a truncated wire,leading to Fabry-Perot reso-nances, with γ = ℜ[kSPPM].Adapted from [5]. (Lowerpictures) Plasmonic modes(m = 1− 4) of a nanoan-tenna. The grey arrowsindicate the direction of thecurrent, the black curvesindicate the current densitydistribution and the chargedensity maxima are indicatedby + and −.
above discussion. In order to keep an antenna like shape, i.e., a high aspect ratio between thelength and the diameter, nanoantennas will have diameters of some ten nanometers, whichis comparable with the skin length, thus λSPPM gets further decreased and φR can not beneglected any more. In this thesis we will also not deal with free standing wires in vacuum,but rather, as we will see in section 4.1, with highly curved nanocuboids lying on a glasssubstrate. But nevertheless, the above presented model provides us with an understandingof the linear connection between the resonant antenna length Lres and the wavelength andexplains the differences of nanoantennas compared to RF antennas.
In Figure 2.4 the first four plasmonic modes (m = 1− 4) of a nanoantenna are visualized interms of the charge distribution, the current direction and the current density distribution.We see, that for even order modes the currents cancel each other out, while for odd ordermodes a net current survives. By examining the charge distribution it becomes evident, thatodd order modes give rise to a dipole moment, but even order modes not. Therefore onlyodd order modes can be excited by and interact with plane waves.
Gap nanoantennas
Next the case of a gap nanoantenna, i.e., two metallic wires arranged in a row divided by a gapcomparable to the wire diameter, will be discussed. For this purpose it is useful to consideragain the mechanical mass spring system analogue of a plasmonic resonance depicted inFigure 2.3 [5, 57]. Here, each wire has to be considered as an individual mass spring systemwith the same resonance frequency. Due to the interaction between the surface chargeson the ends of both wires an additional spring needs to be introduced to couple the twosystems, as depicted in Figure 2.5. As known from classical mechanics, the coupling of the
17
2. FUNDAMENTALS
!0
Res
onance
fre
quen
cy
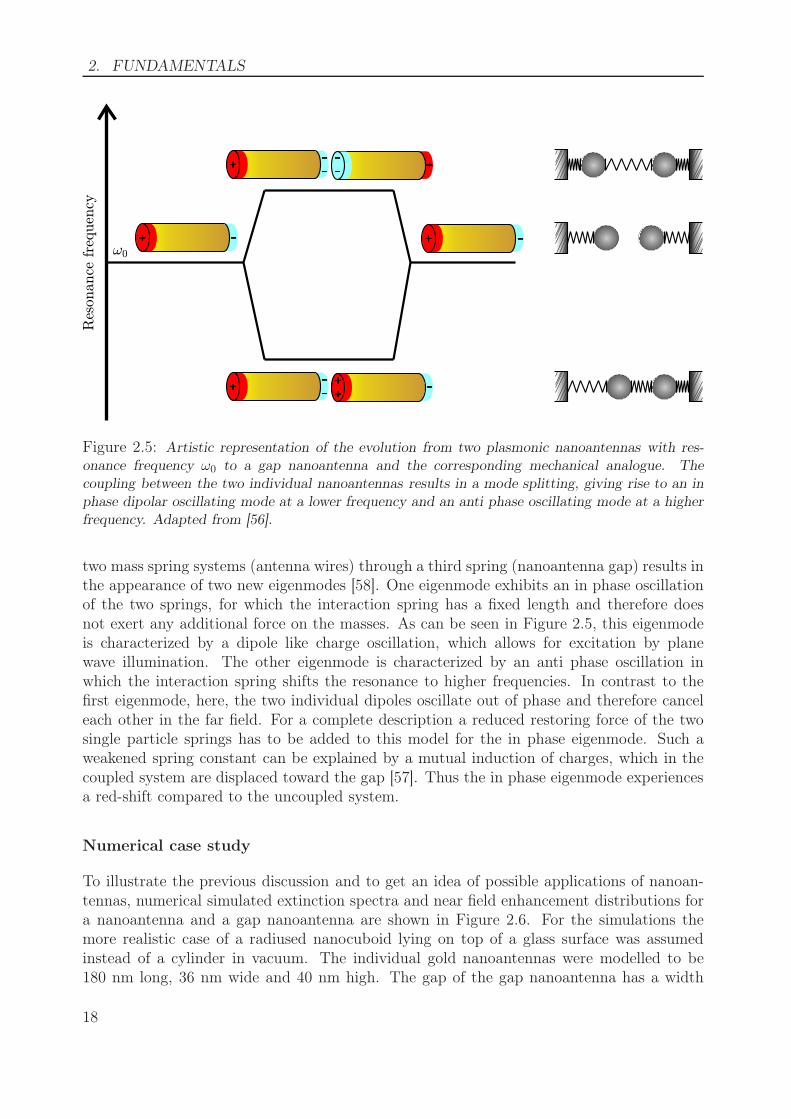
Figure 2.5: Artistic representation of the evolution from two plasmonic nanoantennas with res-onance frequency ω0 to a gap nanoantenna and the corresponding mechanical analogue. Thecoupling between the two individual nanoantennas results in a mode splitting, giving rise to an inphase dipolar oscillating mode at a lower frequency and an anti phase oscillating mode at a higherfrequency. Adapted from [56].
two mass spring systems (antenna wires) through a third spring (nanoantenna gap) results inthe appearance of two new eigenmodes [58]. One eigenmode exhibits an in phase oscillationof the two springs, for which the interaction spring has a fixed length and therefore doesnot exert any additional force on the masses. As can be seen in Figure 2.5, this eigenmodeis characterized by a dipole like charge oscillation, which allows for excitation by planewave illumination. The other eigenmode is characterized by an anti phase oscillation inwhich the interaction spring shifts the resonance to higher frequencies. In contrast to thefirst eigenmode, here, the two individual dipoles oscillate out of phase and therefore canceleach other in the far field. For a complete description a reduced restoring force of the twosingle particle springs has to be added to this model for the in phase eigenmode. Such aweakened spring constant can be explained by a mutual induction of charges, which in thecoupled system are displaced toward the gap [57]. Thus the in phase eigenmode experiencesa red-shift compared to the uncoupled system.
Numerical case study
To illustrate the previous discussion and to get an idea of possible applications of nanoan-tennas, numerical simulated extinction spectra and near field enhancement distributions fora nanoantenna and a gap nanoantenna are shown in Figure 2.6. For the simulations themore realistic case of a radiused nanocuboid lying on top of a glass surface was assumedinstead of a cylinder in vacuum. The individual gold nanoantennas were modelled to be180 nm long, 36 nm wide and 40 nm high. The gap of the gap nanoantenna has a width
18
2.3. NANOPLASMONICS
Wavelength [nm]1000 1250 1500750
1-T
ransm
issi
on
0.0
0.2
0.4
0.6
0.8
0 40j j j jE E/ 0
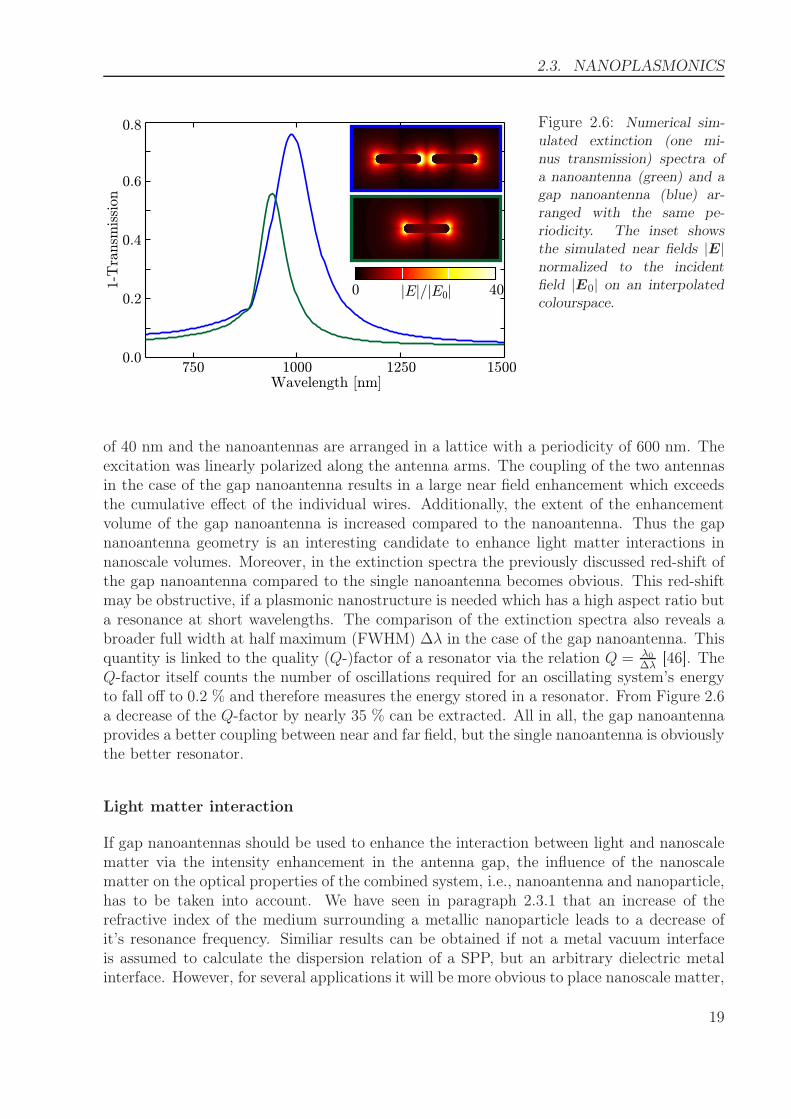
Figure 2.6: Numerical sim-ulated extinction (one mi-nus transmission) spectra ofa nanoantenna (green) and agap nanoantenna (blue) ar-ranged with the same pe-riodicity. The inset showsthe simulated near fields |E|normalized to the incidentfield |E0| on an interpolatedcolourspace.
of 40 nm and the nanoantennas are arranged in a lattice with a periodicity of 600 nm. Theexcitation was linearly polarized along the antenna arms. The coupling of the two antennasin the case of the gap nanoantenna results in a large near field enhancement which exceedsthe cumulative effect of the individual wires. Additionally, the extent of the enhancementvolume of the gap nanoantenna is increased compared to the nanoantenna. Thus the gapnanoantenna geometry is an interesting candidate to enhance light matter interactions innanoscale volumes. Moreover, in the extinction spectra the previously discussed red-shift ofthe gap nanoantenna compared to the single nanoantenna becomes obvious. This red-shiftmay be obstructive, if a plasmonic nanostructure is needed which has a high aspect ratio buta resonance at short wavelengths. The comparison of the extinction spectra also reveals abroader full width at half maximum (FWHM) ∆λ in the case of the gap nanoantenna. Thisquantity is linked to the quality (Q-)factor of a resonator via the relation Q = λ0
∆λ[46]. The
Q-factor itself counts the number of oscillations required for an oscillating system’s energyto fall off to 0.2 % and therefore measures the energy stored in a resonator. From Figure 2.6a decrease of the Q-factor by nearly 35 % can be extracted. All in all, the gap nanoantennaprovides a better coupling between near and far field, but the single nanoantenna is obviouslythe better resonator.
Light matter interaction
If gap nanoantennas should be used to enhance the interaction between light and nanoscalematter via the intensity enhancement in the antenna gap, the influence of the nanoscalematter on the optical properties of the combined system, i.e., nanoantenna and nanoparticle,has to be taken into account. We have seen in paragraph 2.3.1 that an increase of therefractive index of the medium surrounding a metallic nanoparticle leads to a decrease ofit’s resonance frequency. Similiar results can be obtained if not a metal vacuum interfaceis assumed to calculate the dispersion relation of a SPP, but an arbitrary dielectric metalinterface. However, for several applications it will be more obvious to place nanoscale matter,
19
2. FUNDAMENTALS
Wavelength [nm]1000 1500
1-T
ransm
issi
on
0.0
0.2
0.4
0.6
0.8
500
0 80j j j jE E/ 00 80j j j jE E/ 0
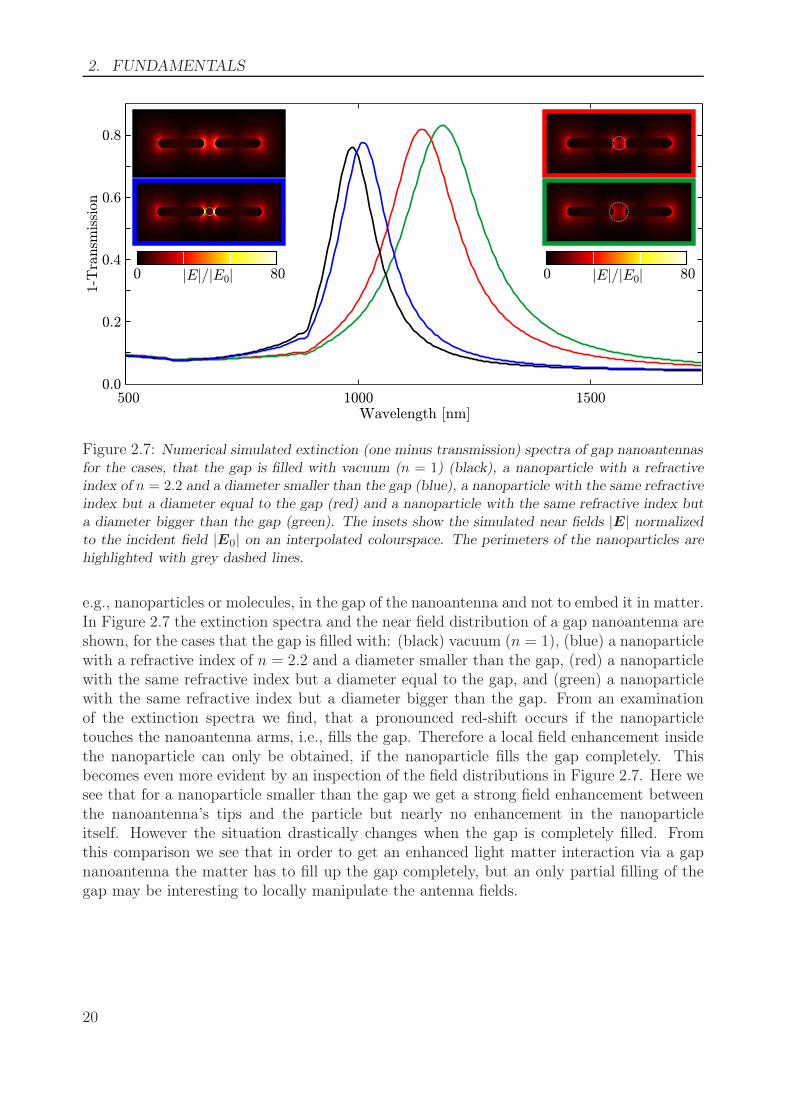
Figure 2.7: Numerical simulated extinction (one minus transmission) spectra of gap nanoantennasfor the cases, that the gap is filled with vacuum (n = 1) (black), a nanoparticle with a refractiveindex of n = 2.2 and a diameter smaller than the gap (blue), a nanoparticle with the same refractiveindex but a diameter equal to the gap (red) and a nanoparticle with the same refractive index buta diameter bigger than the gap (green). The insets show the simulated near fields |E| normalizedto the incident field |E0| on an interpolated colourspace. The perimeters of the nanoparticles arehighlighted with grey dashed lines.
e.g., nanoparticles or molecules, in the gap of the nanoantenna and not to embed it in matter.In Figure 2.7 the extinction spectra and the near field distribution of a gap nanoantenna areshown, for the cases that the gap is filled with: (black) vacuum (n = 1), (blue) a nanoparticlewith a refractive index of n = 2.2 and a diameter smaller than the gap, (red) a nanoparticlewith the same refractive index but a diameter equal to the gap, and (green) a nanoparticlewith the same refractive index but a diameter bigger than the gap. From an examinationof the extinction spectra we find, that a pronounced red-shift occurs if the nanoparticletouches the nanoantenna arms, i.e., fills the gap. Therefore a local field enhancement insidethe nanoparticle can only be obtained, if the nanoparticle fills the gap completely. Thisbecomes even more evident by an inspection of the field distributions in Figure 2.7. Here wesee that for a nanoparticle smaller than the gap we get a strong field enhancement betweenthe nanoantenna’s tips and the particle but nearly no enhancement in the nanoparticleitself. However the situation drastically changes when the gap is completely filled. Fromthis comparison we see that in order to get an enhanced light matter interaction via a gapnanoantenna the matter has to fill up the gap completely, but an only partial filling of thegap may be interesting to locally manipulate the antenna fields.
20
2.3. NANOPLASMONICS
2.3.3 V-chaped nanostructures
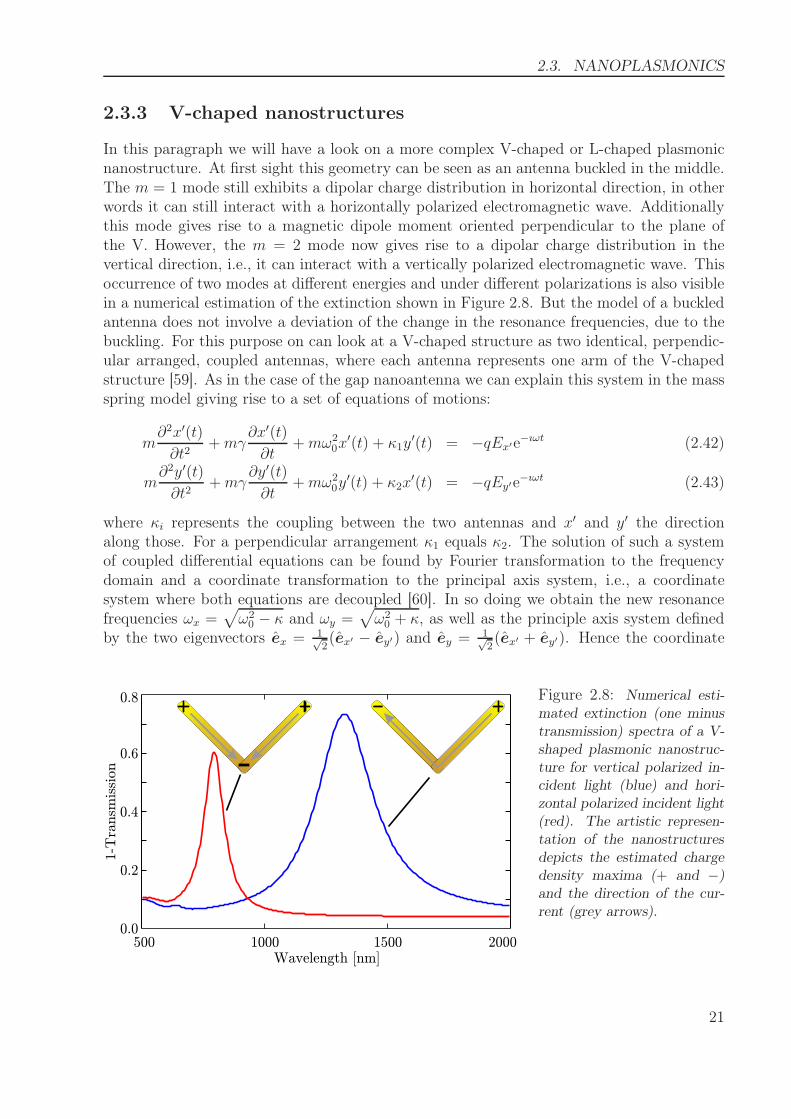
In this paragraph we will have a look on a more complex V-chaped or L-chaped plasmonicnanostructure. At first sight this geometry can be seen as an antenna buckled in the middle.The m = 1 mode still exhibits a dipolar charge distribution in horizontal direction, in otherwords it can still interact with a horizontally polarized electromagnetic wave. Additionallythis mode gives rise to a magnetic dipole moment oriented perpendicular to the plane ofthe V. However, the m = 2 mode now gives rise to a dipolar charge distribution in thevertical direction, i.e., it can interact with a vertically polarized electromagnetic wave. Thisoccurrence of two modes at different energies and under different polarizations is also visiblein a numerical estimation of the extinction shown in Figure 2.8. But the model of a buckledantenna does not involve a deviation of the change in the resonance frequencies, due to thebuckling. For this purpose on can look at a V-chaped structure as two identical, perpendic-ular arranged, coupled antennas, where each antenna represents one arm of the V-chapedstructure [59]. As in the case of the gap nanoantenna we can explain this system in the massspring model giving rise to a set of equations of motions:
m∂2x′(t)
∂t2+mγ
∂x′(t)
∂t+mω2
0x′(t) + κ1y
′(t) = −qEx′e−ıωt (2.42)
m∂2y′(t)
∂t2+mγ
∂y′(t)
∂t+mω2
0y′(t) + κ2x
′(t) = −qEy′e−ıωt (2.43)
where κi represents the coupling between the two antennas and x′ and y′ the directionalong those. For a perpendicular arrangement κ1 equals κ2. The solution of such a systemof coupled differential equations can be found by Fourier transformation to the frequencydomain and a coordinate transformation to the principal axis system, i.e., a coordinatesystem where both equations are decoupled [60]. In so doing we obtain the new resonancefrequencies ωx =
√
ω20 − κ and ωy =
√
ω20 + κ, as well as the principle axis system defined
by the two eigenvectors ex = 1√2(ex′ − ey′) and ey = 1√
2(ex′ + ey′). Hence the coordinate
Wavelength [nm]1000 1500
1-T
ransm
issi
on
0.0
0.2
0.4
0.6
0.8
500 2000
Figure 2.8: Numerical esti-mated extinction (one minustransmission) spectra of a V-shaped plasmonic nanostruc-ture for vertical polarized in-cident light (blue) and hori-zontal polarized incident light(red). The artistic represen-tation of the nanostructuresdepicts the estimated chargedensity maxima (+ and −)and the direction of the cur-rent (grey arrows).
21
2. FUNDAMENTALS
system is rotated by 45◦ and points along the horizontal and vertical direction as discussedpreviously. Here, only the m = 1 mode of each antenna was regarded, but the coupling andsplitting can be described analogously for the higher order modes.
Obviously the V-shaped nanostructures will offer some properties not encountered bynanoantennas. First, they posses two dipolar modes at distinct resonance frequencies andpolarizations. Second, they posses a mode giving rise to a magnetic dipole. And last butnot least they possess a lower symmetry than the nanoantennas, i.e., they do not possessa horizontal mirror plane. Especially the last point will become important in section 2.4about nonlinear optics.
2.3.4 The metamaterial concept
In paragraph 2.2.1 we have seen, that the macroscopic response of dielectric materials can bedescribed by the microscopic dipolar response of its building blocks, i.e., the atoms formingthe dielectric. This is due to the fact, that both the size of a single atom, as well asthe distance between the atoms in a crystal lattice are much smaller than the wavelength oflight. This suggests itself, that by tailoring the dipolar response of the atoms the macroscopicresponse of materials could be tailored. We have seen in the previous paragraphs, that theoptical response, especially the resonance frequency of plasmonic nanostructures can be quiteeasily tuned by adjusting their geometry. Thus, by arranging plasmonic nanostructures in aperiodic fashion with an inter particle distance below the wavelength of light one can achievean artificial material with a specific optical response, a so-called plasmonic metamaterial [13].With this approach several fascinating features can be obtained like for example magnetismat optical frequencies [14–16], a negative refractive index [17–19] or electromagnetic invisiblecloaks [20–22].
In this thesis the concept of plasmonic metamaterials will be used to obtain materials witha specific dispersion of the susceptibility. A straight forward approach would be to investi-gate isolated plasmonic nanostructures to choose a specific geometry as building block for ametamaterial. However, it has been shown that the coupling between the individual nano-structures in a metamaterial strongly influences the optical properties of the nanostructuresand thereby the effective optical response of a metamaterial [61–63]. Therefore it is more rea-sonable to directly investigate metamaterials and to only deal with their effective response.As we have seen before, the linear interaction between an electromagnetic wave and mat-ter can be completely described with the help of the susceptibility. In order to determinethis quantity experimentally we have to turn to Lambert-Beer’s law, which describes theattenuation of the intensity I(ω,z) = I0e
−β(ω)z of a plane wave with initial intensity I0 whenpropagating in a medium [64]. With the well known relation between the electric field E andthe intensity I = cǫ0
2|E|2 [46], we see that a frequency resolved measurement of the intensity
extinction provides us with the knowledge of the imaginary part of the susceptibility:
1− I(ω,z)
I0≈ β(ω)z = 2
ω
c0κ(ω)z ≈ ω
c0ℑ[χ1(ω)]z (2.44)
This is of course not a specific result for metamaterials, but holds true for any kind of matter.For simplicity we define the absolute extinction coefficient B(ω) = β(ω)z. In the following
22
2.3. NANOPLASMONICS
discussion we assume, that the constituting plasmonic nanostructures are all of the samekind and exhibit a single Lorentzian shaped resonance, with a resonance frequency ω0 andthe damping γ.
χ(ω) =na
ǫ0
nee2
me
(ω20 − ω2) + ıγω
(ω20 − ω2)2 + γ2ω2
(2.45)
Now, the resonance frequency ω0 is not that of an isolated nanostructure, but accounts forthe shifted resonance due to inter particle coupling. Likewise the damping γ describes theOhmic and radiative losses of the particles theirselves, as well as the damping due to inter-particle coupling. The number density of the atoms na now describes the number density ofthe particles. In the following we will deal with a 2D metamaterial, i.e., plasmonic nanopar-ticles arranged on lattice with interparticle distances dx and dy. The number density timesthe propagation length z through the metamaterial is then just given by the interparticledistances na · z = 1/(dx · dy). Hereby equation (2.44) and (2.45) can be rewritten to:
B(ω) =ω
c0ǫ0
1
dxdyA
γω
(ω20 − ω2)2 + γ2ω2
(2.46)
χ(ω) =1
ǫ0
1
dxdyzA
(ω20 − ω2) + ıγω
(ω20 − ω2)2 + γ2ω2
(2.47)
where A = nee2
medescribes the individual oscillator strength. Close to the resonance, i.e.,
ω ≈ ω0, we can approximate this to:
B(ω) =1
c0ǫ0
1
dxdyA1
γ=
1
c0ǫ0
1
dxdyAQ
ωo(2.48)
χ(ω) =1
ǫ0
1
dxdyzA
ı
γω0=
1
ǫ0
1
dxdyzAıQ
ω20
(2.49)
Thus the susceptibility of a metamaterial can be estimated by a quite simple measurement.
By using Lambert-Beer’s law we assumed, that an electromagnetic wave propagating througha metamaterial only experiences absorption, but no scattering by the plasmonic nanostruct-ures. To justify this assumption one can also connect the total extinction of a 2D metamate-rial to the individual extinction cross sections of the constituting plasmonic nanostructuresvia their area density: 1 − T = Cext/(dx · dy). This approach will exactly reproduce theresult obtained above, if we use the outcome of the quasi-static approximation presented inparagraph 2.3.1, that the absorption cross section dominates the extinction cross section.However, even if the quasi-static approximation is not valid for the plasmonic nanostructuresconstituting the metamaterial, we can at least assume for a given nanostructure geometryin a limited spectral range, that the ratio of scattering and absorption is constant.
23
2. FUNDAMENTALS
2.4 Nonlinear optics
In the previous section we discussed linear interactions between light and matter. These in-teractions are linear in the sense, that the response of matter, described by the polarization,shows a linear dependence on the electric field. However, in general also nonlinear depen-dencies can occur, giving rise to a hole variety of effects, from which two will be used andinvestigated in this thesis: Second harmonic generation, which is the conversion of a waveinto a new wave with twice the frequency, and optical parametric generation, which is theconversion of a wave into two new waves, whereas the sum of their frequencies correspondsto the frequency of the original wave. Due to a superlinear dependency on the amplitudes ofthe incident fields, those effects can only be observed in the presence of very intense opticalfields, not encountered in nature. Therefore nonlinear optical effects where not perceiveduntil the invention of the laser [23].
In this thesis second harmonic generation with plasmonic nanostructures and metamaterialswill be investigated. Therefore the properties of this effect will be evaluated in this section onthe basis of nonlinear light matter interaction in general. As shown in the previous section,one interesting aspect of plasmonic nanostructures is the ability to engineer their dispersionwhich will lead to a strongly frequency dependent nonlinear response. In order to investigatethis, a tunable light source will be designed and used in this thesis, based itself on opticalparametric generation, which will consequently be also discussed in this section.
2.4.1 Nonlinear polarization and effects of second order
From equation (2.8) it becomes evident, that the polarization P (t) of a medium is a functionof the electric field E(t) and can thus be written as a power series of the electric field:
P (t) = ǫ0χ(1)E
︸ ︷︷ ︸
PL
+ ǫ0χ(2)EE + ǫ0χ
(3)EEE + ...︸ ︷︷ ︸
PNL
(2.50)
Here, the first term corresponds to the linear polarization P L(t), discussed in detail pre-viously. The following terms, which are of higher order in E than the linear term, aresummarized in the nonlinear polarization P NL(t), where the proportionality constants χ(n)
are the susceptibilities of n-th order. As in the linear case, the susceptibilities of anisotropicmaterials are in general tensors of the order (n+1). For isotropic materials, or when only onetensorial component is of interest, the tensorial character can often be neglected. Putting thesum of linear and nonlinear polarization into Maxwell’s equations (2.1-2.4) leads to a sourceterm in the wave equation (2.8). Now, the nonlinear wave equation in time and frequencydomain read [29]:
∇2E(r,t)− ǫ(ω)
c20
∂2E(r,t)
∂t2=
1
ǫ0c20
∂2P NL(r,t)
∂t2(2.51)
∇2E(r,ω) +ǫ(ω)ω2
c20E(r,ω) = − ω2
ǫ0c20P NL(r,ω) (2.52)
In this thesis only nonlinear processes of second order will be investigated, hence, equa-tion (2.50) is truncated after the second summand. To derive the nonlinear processes of
24
2.4. NONLINEAR OPTICS
second order, a scalar description will be used for the moment. In general the second ordernonlinear polarization is not given by the electric field of an incoming wave squared, but bytwo not necessarily identical waves, which can be represented in the form:
E(t) = E1e−ıω1t + E2e
−ıω2t + c.c. (2.53)
With this approach we find that the nonlinear polarization is of the form:
PNL(t) = ǫ0χ(2)[E2
1e−ı2ω1t + E2
2e−ı2ω2t + 2E1E2e
−ı(ω1+ω2)t (2.54)
+2E1E∗2e
−ı(ω1−ω2)t + c.c.] + 2ǫ0χ(2)[E1E
∗1 + E2E
∗2 ] (2.55)
It is convenient to express the nonlinear polarization PNL(t) as a sum over its differentpositive and negative frequency components
∑
n P (ωn)eıωnt, in order to sort the complex
amplitudes:
P (2ω1) = ǫ0χ(2)E2
1 (2.56)
P (2ω2) = ǫ0χ(2)E2
2 (2.57)
P (ω1 + ω2) = 2ǫ0χ(2)E1E2 (2.58)
P (ω1 − ω2) = 2ǫ0χ(2)E1E
∗2 (2.59)
P (0) = 2ǫ0χ(2)(E1E
∗1 + E2E
∗2) (2.60)
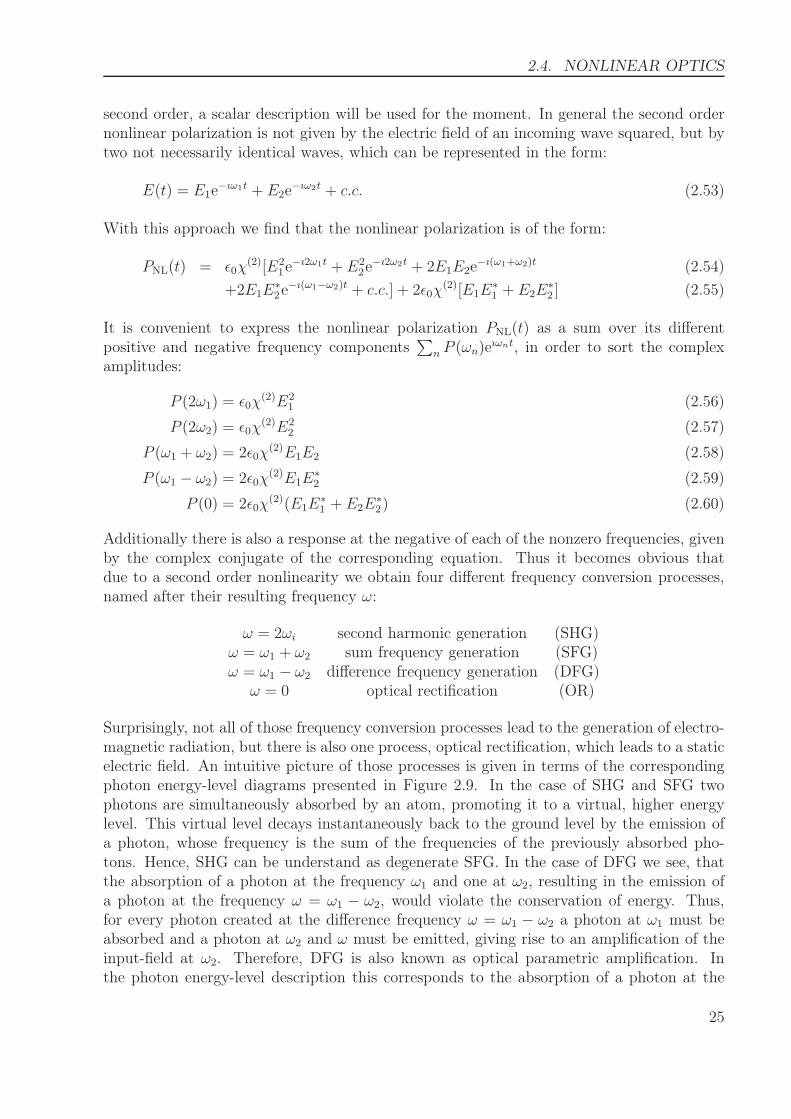
Additionally there is also a response at the negative of each of the nonzero frequencies, givenby the complex conjugate of the corresponding equation. Thus it becomes obvious thatdue to a second order nonlinearity we obtain four different frequency conversion processes,named after their resulting frequency ω:
ω = 2ωi second harmonic generation (SHG)ω = ω1 + ω2 sum frequency generation (SFG)ω = ω1 − ω2 difference frequency generation (DFG)
ω = 0 optical rectification (OR)
Surprisingly, not all of those frequency conversion processes lead to the generation of electro-magnetic radiation, but there is also one process, optical rectification, which leads to a staticelectric field. An intuitive picture of those processes is given in terms of the correspondingphoton energy-level diagrams presented in Figure 2.9. In the case of SHG and SFG twophotons are simultaneously absorbed by an atom, promoting it to a virtual, higher energylevel. This virtual level decays instantaneously back to the ground level by the emission ofa photon, whose frequency is the sum of the frequencies of the previously absorbed pho-tons. Hence, SHG can be understand as degenerate SFG. In the case of DFG we see, thatthe absorption of a photon at the frequency ω1 and one at ω2, resulting in the emission ofa photon at the frequency ω = ω1 − ω2, would violate the conservation of energy. Thus,for every photon created at the difference frequency ω = ω1 − ω2 a photon at ω1 must beabsorbed and a photon at ω2 and ω must be emitted, giving rise to an amplification of theinput-field at ω2. Therefore, DFG is also known as optical parametric amplification. Inthe photon energy-level description this corresponds to the absorption of a photon at the
25
2. FUNDAMENTALS
!
!
2! !1
!2
! !1 2+!1
!2
! !1 2-
! !
SHG SFG DFG OR
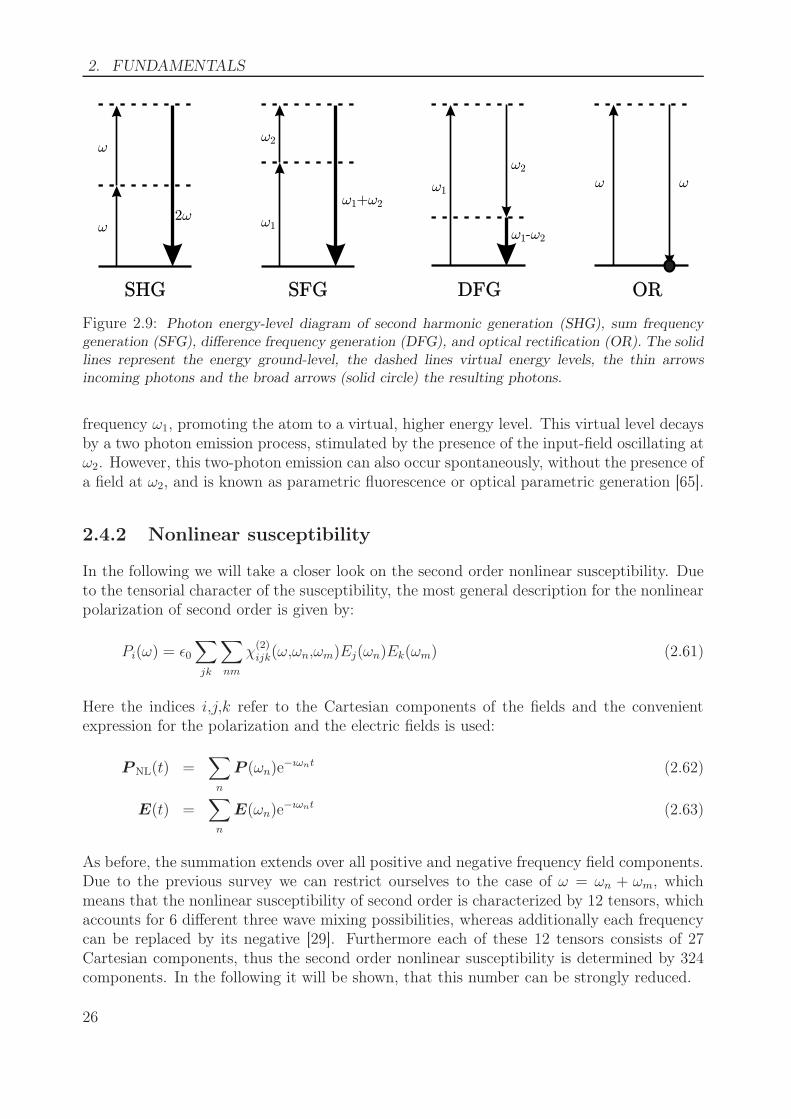
Figure 2.9: Photon energy-level diagram of second harmonic generation (SHG), sum frequencygeneration (SFG), difference frequency generation (DFG), and optical rectification (OR). The solidlines represent the energy ground-level, the dashed lines virtual energy levels, the thin arrowsincoming photons and the broad arrows (solid circle) the resulting photons.
frequency ω1, promoting the atom to a virtual, higher energy level. This virtual level decaysby a two photon emission process, stimulated by the presence of the input-field oscillating atω2. However, this two-photon emission can also occur spontaneously, without the presence ofa field at ω2, and is known as parametric fluorescence or optical parametric generation [65].
2.4.2 Nonlinear susceptibility
In the following we will take a closer look on the second order nonlinear susceptibility. Dueto the tensorial character of the susceptibility, the most general description for the nonlinearpolarization of second order is given by:
Pi(ω) = ǫ0∑
jk
∑
nm
χ(2)ijk(ω,ωn,ωm)Ej(ωn)Ek(ωm) (2.61)
Here the indices i,j,k refer to the Cartesian components of the fields and the convenientexpression for the polarization and the electric fields is used:
P NL(t) =∑
n
P (ωn)e−ıωnt (2.62)
E(t) =∑
n
E(ωn)e−ıωnt (2.63)
As before, the summation extends over all positive and negative frequency field components.Due to the previous survey we can restrict ourselves to the case of ω = ωn + ωm, whichmeans that the nonlinear susceptibility of second order is characterized by 12 tensors, whichaccounts for 6 different three wave mixing possibilities, whereas additionally each frequencycan be replaced by its negative [29]. Furthermore each of these 12 tensors consists of 27Cartesian components, thus the second order nonlinear susceptibility is determined by 324components. In the following it will be shown, that this number can be strongly reduced.
26
2.4. NONLINEAR OPTICS
Properties of the nonlinear susceptibility
First of all the polarization as well as the electric fields represent physical measurable quan-tities and therefore must be real, thus the positive and negative frequency components canbe related via [29]:
Pi(ω) = Pi(−ω)∗ (2.64)
Ej(ωn) = Ej(−ωn)∗ (2.65)
Ek(ωm) = Ek(−ωm)∗ (2.66)
leading to a relation for the tensor components of the form:
χ(2)ijk(ω,ωn,ωm) = χ
(2)ijk(−ω,− ωn,− ωm)
∗ (2.67)
As the order of the electric fields in equation (2.61) is arbitrary, we can conclude that:
χ(2)ijk(ω,ωn,ωm) = χ
(2)ikj(ω,ωm,ωn) (2.68)
This is known as intrinsic permutation symmetry. For example, for the case of SHG thenonlinear polarization is thus given by:
Px(2ω)Py(2ω)Pz(2ω)
=
χ(2)xxx χ
(2)xyy χ
(2)xzz χ
(2)xyz χ
(2)xxz χ
(2)xxy
χ(2)yxx χ
(2)yyy χ
(2)yzz χ
(2)yyz χ
(2)yxz χ
(2)yxy
χ(2)zxx χ
(2)zyy χ
(2)zzz χ
(2)zyz χ
(2)zxz χ
(2)zxy
Ex(ω)2
Ey(ω)2
Ez(ω)2
2Ey(ω)Ez(ω)2Ex(ω)Ez(ω)2Ex(ω)Ey(ω)
(2.69)
However, one can always move to a coordinate system in which one of the Cartesian coordi-nates describes the propagation direction, thus only two Cartesian components of the fieldscan be observed.
A very important feature of the second order nonlinear susceptibility arises, when the sym-metry of the nonlinear medium (crystal) is taken into account. In a medium owing inversionsymmetry, an inversion of the Cartesian coordinates will change the sign of the field ampli-tudes and the polarisation, e.g., Pi(−r) = −Pi(r) . For a nonlinear process of second orderthis leads to [46]:
Pi(−r) = ǫ0χ(2)ijkEj(−r)Ek(−r) (2.70)
= ǫ0χ(2)ijk(−Ej(r))(−Ek(r)) (2.71)
= ǫ0χ(2)ijkEj(r)Ek(r) (2.72)
= Pi(r) (2.73)
This can only be fulfilled if χ(2)ijk = 0. Therefore, nonlinear optical effects of second order, or
more general of even order, can only be found in non inversion symmetric media, or to usea crystallographic language, in noncentrosymmetric media.
27

2. FUNDAMENTALS
Let us, for example, consider a nonlinear material possessing a mirror symmetry in x-direction, i.e., a mirror plane in yz-plane, and a mirror symmetry in z-direction, but nomirror symmetry y-direction. These symmetries correspond for example to the V-shapedstructures depicted in Figure 2.8. If furthermore the incident light is propagating in thez-direction, i.e., the electric field has only components in x- and y-direction, the nonlinearpolarization for SHG is reduced to:
Px(2ω)Py(2ω)Pz(2ω)
=
0 0 0 0 0 χ(2)xxy
χ(2)yxx χ
(2)yyy χ
(2)yzz 0 0 0
0 0 0 χ(2)zyz 0 0
Ex(ω)2
Ey(ω)2
000
2Ex(ω)Ey(ω)
(2.74)
Thus, one only has to deal with five tensor elements, but two are not accessible in thediscussed situation.
Anharmonic oscillator model
In paragraph 2.2.1 the Lorentz model of an atom was used to describe linear response ofnonmetallic matter to an incident electromagnetic wave. In the following this model willbe extended by allowing a nonlinearity in the restoring force exerted on the electron. Asstated above, second order nonlinear optical effects can only occur in noncentrosymmetricmedia. Due to the noncentrosymmetry, the equation of motion for an electron will take thefollowing form [47, 66]:
qi + γL,iqi + ω20,iqi +
∑
jk
aijkqjqk = − e
meEi(t) (2.75)
where qi is the displacement of the electron in the i-th direction, thus i,j,k account again forthe Cartesian coordinates, and aijk describes the asymmetry of the atomic potential. Theapplied optical field has the same form as in equation (2.53). To solve equation (2.75) it isconvenient to use a perturbative ansatz, where E(t) is replaced by λE(t), with λ rangingbetween zero and one. Now, one has to deal with:
qi + γL,iqi + ω20,iqi +
∑
jk
aijkqjqk = − e
meλEi(t) (2.76)
which can be solved using a power series ansatz:
qi = λq(1)i + λ2q
(2)i + λ3q
(3)i + ... (2.77)
Insertion and sorting by powers of the expansion parameter results in the equations:
q(1)i + γL,iq
(1)i + ω2
0,iq(1)i = − e
meEi(t) (2.78)
q(2)i + γL,iq
(2)i + ω2
0,iq(2)i +
∑
jk
aijkq(1)j q
(1)k = 0 (2.79)
etc. (2.80)
28
2.4. NONLINEAR OPTICS
The lowest order contribution q(1)i is obviously governed by the same equation as the linear
Lorentz model and is thus solved by:
q(1)i (t) = q
(1)i (ω1)e
−ıω1t + q(1)i (ω2)e
−ıω2t + c.c. (2.81)
with the amplitudes:
q(1)i (ωα) = − e
me
Ei(ωα)
Di(ωα)(2.82)
and the complex denominator Di(ωα) = ω20,i − ω2
α − ıωαγL,i. Hence, we can reproduce thelinear susceptibility:
χ(1)i (ωα) = Ne
e2
ǫ0me
1
Di(ωα)(2.83)
where the principal axis coordinate system was assumed, i.e., χ(1)ij = δijχ
(1)ii = δijχ
(1)i . The
expression for q(1)i is then substituted into equation (2.79) giving rise to the frequencies
±2ω1, ± 2ω2, ± (ω1 + ω2), ± (ω1 − ω2), and 0. As example, the response at frequency 2ω1,i.e., SHG will be determined. Hence,
q(2)i + γL,iq
(2)i + ω2
0,iq(2)i = −
∑
jk
aijk
(e
me
)2Ej
Dj(ω1)
Ek
Dk(ω1)e−ı2ω1t (2.84)
has to be solved, which can be done with the ansatz:
q(2)i (t) = q
(2)i (2ω1)e
−ı2ω1t + c.c. (2.85)
leading to the result:
q(2)i (2ω1) = −
∑
jk
aijkDi(2ω1)
(e
me
)2Ej
Dj(ω1)
Ek
Dk(ω1)(2.86)
In analogy with the linear case, the second order nonlinear susceptibility for SHG can nowbe written as:
χ(2)ijk(2ω1,ω1,ω1) =
aijkNee3
ǫ0m2eDi(2ω1)Dj(ω1)Dk(ω1)
(2.87)
Analogously the second order nonlinear susceptibilities at the other frequencies can be found.
29
2. FUNDAMENTALS
Miller’s law
A comparison of the resulting second order nonlinear susceptibility given by equation (2.87)with the linear susceptibility given by equation (2.83) shows, that the second order nonlinearsusceptibility can be expressed with the help of the linear susceptibilities at the correspondingfrequencies:
χ(2)ijk(2ω1,ω1,ω1) =
ǫ20meaijkN2
e e3
χ(1)ii (2ω1)χ
(1)jj (ω1)χ
(1)kk (ω1) (2.88)
An interesting consequence of this correlation is an enhancement of the second order nonlin-ear susceptibility in the case, that the linear susceptibility exhibits a resonance at either thedriving frequency (one-photon resonance) or at the second harmonic frequency (two-photonresonance). Already in the earlier years of nonlinear optics R. Miller empirically showedthat the ratio:
χ(2)ijk(2ω1,ω1,ω1)
χ(1)ii (2ω1)χ
(1)jj (ω1)χ
(1)kk (ω1)
(2.89)
is nearly constant for all noncentrosymmetric crystals [27]. This corresponds to the fact thatthe combination
ǫ20meaijkN2
e e3
(2.90)
is nearly constant. The parameters e,me and ǫ0 are of course fundamental constants. Forall condensed matter, the electron number density Ne is also nearly the same. Thus, aijkshould be the same for all condensed matter. C. Garret and F. Robinson gave the followingexplanation to this [28]: (i) The linear and nonlinear contributions to the restoring force willbe same, if the displacement of the electrons due to a driving field becomes comparable tothe size of the atom. (ii) The size of the atom is in the order of the separation between theatoms, given by the lattice constant d, thus meω
20d = mead
2. (iii) ω0 and d are roughly thesame for most solids.
2.4.3 Nonlinear response of plasmonic nanoparticles
Metallic nanoparticles can be used in at least two different ways for nonlinear frequencyconversion applications. The first method is to employ the dramatic near field enhancementinherent to plasmonic nanoparticles in order to boost nonlinear processes [42, 67]. As thenonlinear polarization of second order scales quadratically with the amplitude of the driv-ing field, an enhancement of the amplitude will also quadratically enhance the nonlinearpolarization. This gives rise to the idea of placing a second order nonlinear material at aposition close to a plasmonic nanostructure, where the field is enhanced in order to boost theresponse of the nonlinear material. Such a hybrid geometry could for example consist of agap nanoantenna, as presented in paragraph 2.3.2, whose gap is loaded with a second ordernonlinear dielectric nanostructure. But some care has to be taken with this approach. We
30
2.4. NONLINEAR OPTICS
have seen before, that the nonlinear response is anisotropic with respect to the driving field.This indicates that the dielectric nanostructure, or to be more precise its crystallographicaxis, has to be aligned with respect to the local field components and depending on the exactplasmonic geometry, only dielectrics with certain non vanishing elements of the nonlinearsusceptibility can be employed [68]. Furthermore, it was shown in paragraph 2.3.2 that atleast for gap nanoantennas a complete filling of the gap is necessary to obtain a significantfield enhancement in the dielectric.
In the presented concept a plasmonic nanostructure was used to enhance the nonlinearresponse of a dielectric nanostructure, i.e., the plasmonic nanostructure acts as a passiveelement. But plasmonic nanostructures can also give rise to an intrinsic second order non-linear response [42, 69]. This might sound counterintuitive as the building materials forplasmonic nanostructures, metals, show a inversion symmetric bulk atomic structure. How-ever, on a surface inversion symmetry is obviously broken, giving rise to a second ordernonlinearity, especially as plasmonic nanostructures have a high surface to volume ratio dueto their overall size. In the previous section it was furthermore shown that the electric fieldin plasmonic nanostructures is strongly confined to their surface. Additionally, when thenonlinear response of subwavelength objects is studied, the symmetry of the object itself hasalso to be taken into account [70, 71]. For example the V-chaped structures described inparagraph 2.3.3 show a lower symmetry than the nanoantennas discussed in paragraph 2.3.2,which is manifested in an several orders of magnitude stronger nonlinear response of the V-chaped structures [37]. All in all, the possibility of influencing their symmetry and resonancesby means of geometry design, together with their strong coupling to free space radiation,and their field enhancement abilities, have encouraged several studies on the nonlinear re-sponse of plasmonic nanostructures leading to frequency conversion efficiencies beyond thoseof dielectric materials [32].
In order to describe the nonlinear response of dielectrics the Lorentz model was just extendedto describe an anharmonic potential of the electrons. Unfortunately such an easy extensioncan not be done for metallic matter, as the Drude model, describing linear response of metals,depicts the electrons as unbound. However, a description of the free electron gas as a fluidleads to nonlinear effects of arbitrary order similar to nonlinearities in hydro-dynamics [72].In this approach not individual electrons are considered, but the free electron gas as a holeis characterized by a number density ne(r,t) and a velocity field v(r,t), which gives rise toa charge density ρ(r,t) and a current density j(r,t) [33]:
ρ(r,t) = e (n0 − ne(r,t)) (2.91)
j(r,t) = (ρ(r,t)− en0) v(r,t) (2.92)
Here n0 is the time independent number density of the positively charged background formedby the ions of the metal. The time derivative of the current density ∂
∂tj(r,t) representing a
source term in the inhomogeneous wave equation (2.7) can then be expressed as:
∂
∂tj(r,t) = −ene
dv
dt+∑
k
∂
∂rk
(jjk
eno − ρ
)
(2.93)
where the first term on the right hand side describes a force density based on the Lorentz
31
2. FUNDAMENTALS
force and can thus be related to:
−enedv
dt=
−e
me
[(ρ− en0)E + j ×B] (2.94)
Thus one finally obtains, by adding a phenomenological term γj describing the losses, andreplacing the charge density via ρ = ǫ0∇E:
∂
∂tj(r,t) =
e2n0
me
E − γj − e
me
[ǫ0(∇E)E + j ×B] +∑
k
∂
∂rk
(jjk
eno − ρ
)
(2.95)
The first two terms represent the linear oscillation of the electrons with respect to thepositive charged background, whereas the other describe the nonlinear sources. The threedifferent contributions can be accounted to different origins: (i) (∇E)E has only nonzerocontributions on the surface of the metal. (ii) j ×B has only nonzero contributions in the
volume of the metal. (iii)∑
k∂
∂rk
(jjk
eno−ρ
)
has contributions from both the surface and the
volume of the metal. In order to use this model for bulk metals or to describe nonlineareffects in metallic nanoparticles, it is sufficient to choose the number density ne(r,t) equal toa constant > 0 inside the metal and ne(r,t = 0 outside the metal. Following this approach,also the nonlinear response from metallic nanoparticles can be numerically calculated.
2.4.4 Wave description of nonlinear optics
To understand the evolution of electromagnetic waves in a nonlinear medium we will go backto the nonlinear wave equations given by equation (2.51) and (2.52). We will again separatethe electric fields and the nonlinear polarization according to their frequency components,but now also take their spatial dependence into account [46]:
P NL(r,t) =∑
i
(P i(r)e
−ıωit + P ∗i (r)e
ıωit)/2 (2.96)
E(r,t) =∑
i
(Ei(r)e
−ıωit +E∗i (r)e
ıωit)/2 (2.97)
with this the wave equation can be separated according to the different frequency compo-nents:
(
∇2 +ǫ(ω)ω2
i
c20
)
Ei(r) = − ω2i
ǫ0c20P i(r) (2.98)
Coupled wave equations
The above wave equation must hold for each frequency component and in particular for thesum frequency component at ω3 = ω1 +ω2. Thus we can propose a plane wave at frequencyω3 propagating in z-direction as solution. All fields will therefore be represented in the form:
Ei(z) = Aieikiz with ki =
niωi
c0(2.99)
32
2.4. NONLINEAR OPTICS
The amplitude of the nonlinear polarization can now be written as:
P3e−ık3z = 4ǫ0deffA1A2e
ı(k1+k2−k3)z (2.100)
P1e−ık1z = 4ǫ0deffA3A
∗2e
−ı(k1+k2−k3)z (2.101)
P2e−ık2z = 4ǫ0deffA3A
∗1e
−ı(k1+k2−k3)z (2.102)
where we introduced the effective nonlinear coefficient deff which can be used to simplify therelation between the nonlinear polarization and the fundamental waves and is connected tothe nonlinear susceptibility via the general nonlinear coefficient dijk = 1
2χ(2)ijk [73]. Plugging
this into the wave equation results in:[d2A3
dz2+ 2ık3
dA3
dz− k2
3A3 +ǫ(ω3)ω
23A3
c20
]
eı(k3z−ω3t) + c.c. =
−4deffω23
c20A1A2e
ı([k1+k2]z−ω3t) + c.c.
(2.103)
and analogous equations for A1 and A2. By using the slowly varying amplitude approxima-tion
∣∣∣∣
∂2Ai
∂z2
∣∣∣∣≪ k
∣∣∣∣
∂Ai
∂z
∣∣∣∣
(2.104)
we can finally obtain the coupled wave equations, with the wavevector mismatch∆k = k1 + k2 − k3:
dA3
dz=
2ıdeffω23
k3c20A1A2e
ı∆kz (2.105)
dA1
dz=
2ıdeffω21
k1c20
A3A∗2e
−ı∆kz (2.106)
dA2
dz=
2ıdeffω22
k2c20A3A
∗1e
−ı∆kz (2.107)
With these equations all nonlinear processes of second order can be described. However, itis important to carefully consider the initial conditions. For example, if SHG in a nonlinearcrystal should be described the initial conditions will read A1,A2 6= 0, A3 = 0, but if a partof the generated wave is coupled back to the medium via a cavity, the latter condition is notfulfilled.
2.4.5 Second harmonic generation
Second harmonic generation was not only the first observed nonlinear optical process [23] butcan be also seen as the lowest order nonlinear optical process, as it requires only one inputwave interacting with itself creating a new wave with twice the frequency. Therefore SHGhas already been used in the pioneering days of nonlinear optics to study the fundamentalnonlinear properties of different kinds of media [27, 28, 74, 75]. Analogously SHG frommetamaterials and plasmonic nanostructures will be investigated in this thesis. For thispurpose, the principles of SHG will be presented in the following. Additionally SHG will beused to present the effect of phase mismatch.
33
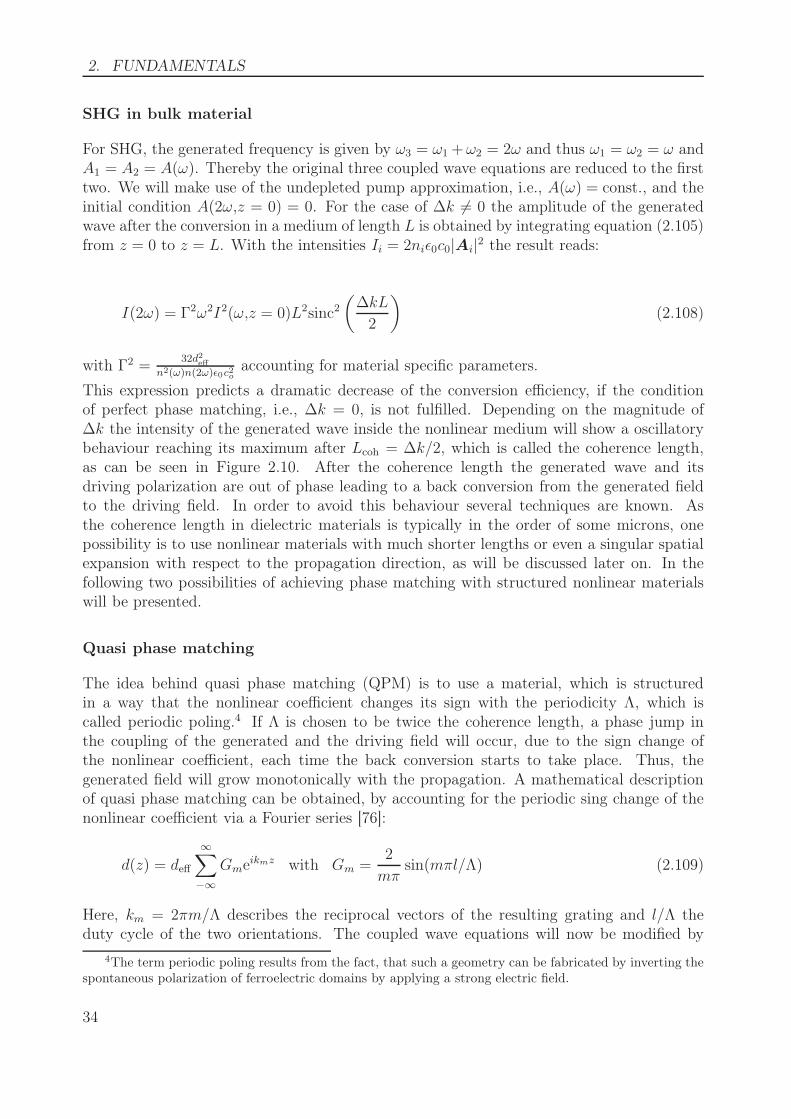
2. FUNDAMENTALS
SHG in bulk material
For SHG, the generated frequency is given by ω3 = ω1 +ω2 = 2ω and thus ω1 = ω2 = ω andA1 = A2 = A(ω). Thereby the original three coupled wave equations are reduced to the firsttwo. We will make use of the undepleted pump approximation, i.e., A(ω) = const., and theinitial condition A(2ω,z = 0) = 0. For the case of ∆k 6= 0 the amplitude of the generatedwave after the conversion in a medium of length L is obtained by integrating equation (2.105)from z = 0 to z = L. With the intensities Ii = 2niǫ0c0|Ai|2 the result reads:
I(2ω) = Γ2ω2I2(ω,z = 0)L2sinc2(∆kL
2
)
(2.108)
with Γ2 =32d2
eff
n2(ω)n(2ω)ǫ0c2oaccounting for material specific parameters.
This expression predicts a dramatic decrease of the conversion efficiency, if the conditionof perfect phase matching, i.e., ∆k = 0, is not fulfilled. Depending on the magnitude of∆k the intensity of the generated wave inside the nonlinear medium will show a oscillatorybehaviour reaching its maximum after Lcoh = ∆k/2, which is called the coherence length,as can be seen in Figure 2.10. After the coherence length the generated wave and itsdriving polarization are out of phase leading to a back conversion from the generated fieldto the driving field. In order to avoid this behaviour several techniques are known. Asthe coherence length in dielectric materials is typically in the order of some microns, onepossibility is to use nonlinear materials with much shorter lengths or even a singular spatialexpansion with respect to the propagation direction, as will be discussed later on. In thefollowing two possibilities of achieving phase matching with structured nonlinear materialswill be presented.
Quasi phase matching
The idea behind quasi phase matching (QPM) is to use a material, which is structuredin a way that the nonlinear coefficient changes its sign with the periodicity Λ, which iscalled periodic poling.4 If Λ is chosen to be twice the coherence length, a phase jump inthe coupling of the generated and the driving field will occur, due to the sign change ofthe nonlinear coefficient, each time the back conversion starts to take place. Thus, thegenerated field will grow monotonically with the propagation. A mathematical descriptionof quasi phase matching can be obtained, by accounting for the periodic sing change of thenonlinear coefficient via a Fourier series [76]:
d(z) = deff
∞∑
−∞
Gmeikmz with Gm =
2
mπsin(mπl/Λ) (2.109)
Here, km = 2πm/Λ describes the reciprocal vectors of the resulting grating and l/Λ theduty cycle of the two orientations. The coupled wave equations will now be modified by
4The term periodic poling results from the fact, that such a geometry can be fabricated by inverting thespontaneous polarization of ferroelectric domains by applying a strong electric field.
34
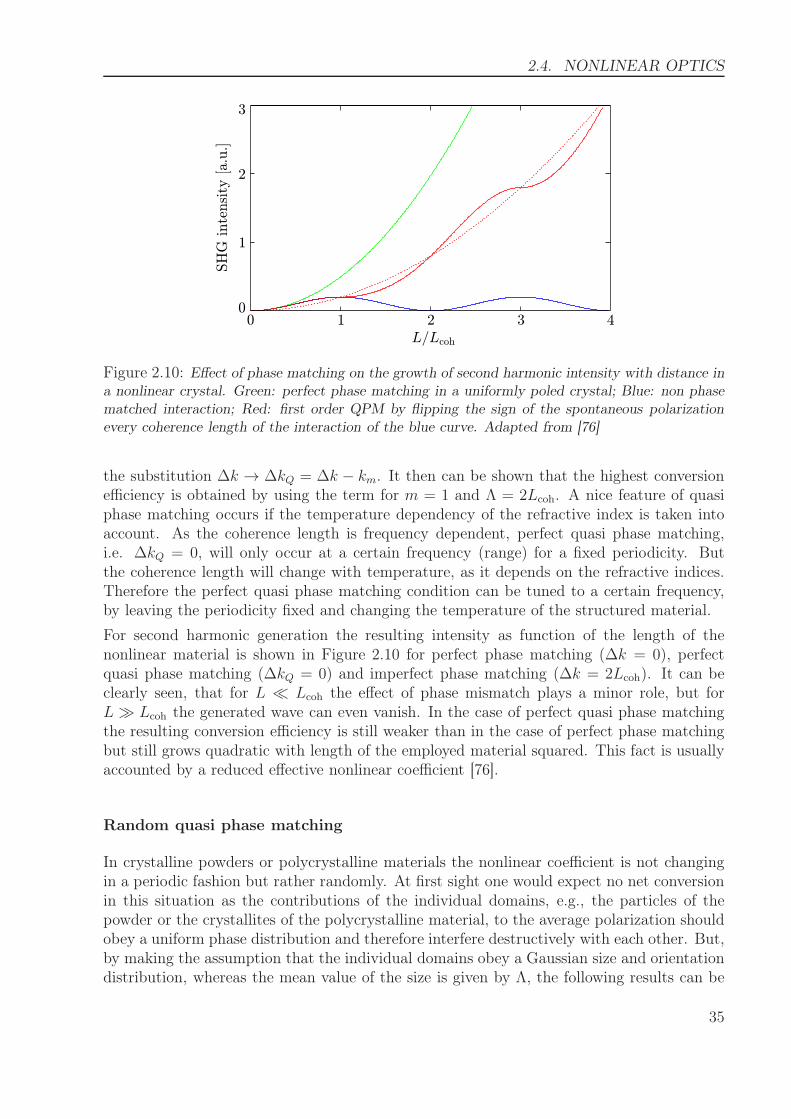
2.4. NONLINEAR OPTICS
L L/ coh
0 1 2 3 4
SH
G inte
nsi
ty [a.u
.]
0
1
2
3
Figure 2.10: Effect of phase matching on the growth of second harmonic intensity with distance ina nonlinear crystal. Green: perfect phase matching in a uniformly poled crystal; Blue: non phasematched interaction; Red: first order QPM by flipping the sign of the spontaneous polarizationevery coherence length of the interaction of the blue curve. Adapted from [76]
the substitution ∆k → ∆kQ = ∆k − km. It then can be shown that the highest conversionefficiency is obtained by using the term for m = 1 and Λ = 2Lcoh. A nice feature of quasiphase matching occurs if the temperature dependency of the refractive index is taken intoaccount. As the coherence length is frequency dependent, perfect quasi phase matching,i.e. ∆kQ = 0, will only occur at a certain frequency (range) for a fixed periodicity. Butthe coherence length will change with temperature, as it depends on the refractive indices.Therefore the perfect quasi phase matching condition can be tuned to a certain frequency,by leaving the periodicity fixed and changing the temperature of the structured material.
For second harmonic generation the resulting intensity as function of the length of thenonlinear material is shown in Figure 2.10 for perfect phase matching (∆k = 0), perfectquasi phase matching (∆kQ = 0) and imperfect phase matching (∆k = 2Lcoh). It can beclearly seen, that for L ≪ Lcoh the effect of phase mismatch plays a minor role, but forL ≫ Lcoh the generated wave can even vanish. In the case of perfect quasi phase matchingthe resulting conversion efficiency is still weaker than in the case of perfect phase matchingbut still grows quadratic with length of the employed material squared. This fact is usuallyaccounted by a reduced effective nonlinear coefficient [76].
Random quasi phase matching
In crystalline powders or polycrystalline materials the nonlinear coefficient is not changingin a periodic fashion but rather randomly. At first sight one would expect no net conversionin this situation as the contributions of the individual domains, e.g., the particles of thepowder or the crystallites of the polycrystalline material, to the average polarization shouldobey a uniform phase distribution and therefore interfere destructively with each other. But,by making the assumption that the individual domains obey a Gaussian size and orientationdistribution, whereas the mean value of the size is given by Λ, the following results can be
35
2. FUNDAMENTALS
obtained from the coupled wave equations [77, 78]: (i) The intensity of the wave generatedby the three-wave mixing process scales linear with the number of domains N , which iscorrelated to the sample thickness L and the illuminated area A by N = LA/Λ3. (ii) Theintensity shows a resonance behaviour with respect to the grain size, owing its maximumwhen the grain size equals the coherence length. (iii) The intensity scales quadratically withthe nonlinear coefficient averaged over all possible crystal orientations. (iv) The intensity ofthe generated wave still scales linear with the individual intensities of both driving waves.
Even if the random quasi phase matching only shows a linear scaling with the length of theemployed crystal, and therefore is less efficient than perfect quasi phase matching or perfectphase matching it shows some advantages. First of all polycrystalline thin films or crystalscan be fabricated quite easily as we will see later on, especially if it comes to nano or microstructured films. As the nonlinear coefficient averaged over all possible crystal orientationshas to be taken into account, no care has to be taken for an alignment of the polarization ofthe driving fields with respect to the orientation of the employed nonlinear material. Evenas random quasi phase matching shows a frequency dependence via the coherence length thisdependence is rather weak compared to other phase matching techniques, thus random quasiphase matching is quite interesting for broadband frequency conversion applications [79, 80].
SHG at interfaces
In the paragraph 2.4.5 an analytic expression for SHG in bulk material was obtained by onlyconsidering equation (2.52) in the medium. In a more detailed analysis also the interface ofthe medium has to be taken into account. This can be done by postulating a general solutionconsisting of any particular solution plus a solution to the homogeneous version of (2.52)obtained by setting its right hand side to zero [29]. The continuity of the Maxwell equationsrequire the tangential components of E and H to be continuous, which can only be fulfilledby the existence of a reflected second harmonic wave. A detailed analysis shows that thesecond harmonic wave inside the medium grows not from zero, but from a boundary value,i.e., a surface contribution, which is comparable to that of the bulk result for a thickness ofL = λ/4π. For the surface contribution propagation effects, in particular phase mismatch,does not influence the amplitude of the aforementioned boundary value, which is equalto that of the reflected second harmonic wave. This essentially means, that the reflectedsecond harmonic intensity will only show a spectral dependency with respect to the nonlinearcoefficient, which can be estimated by equation (2.88). Hence, surface SHG can be employedas a reference to measure the spectral dependency of the SHG from a material of interest.
It is important to mention that the surface contribution to SHG does not only occur atthe interface of noncentrosymmetric materials, but also at the interface of centrosymmetricmaterials. This can be understood by taking into account, that inversion symmetry isintrinsically broken at an interface. In a phenomenological treatment this process can bedescribed by modelling the centrosymmetric medium as a thick slab consisting of a materiallacking any kind of second order nonlinearity with a nonlinear polarization sheet sitting onits surface [81]. Within such a treatment it can be shown, that for a wave with frequency ωand intensity Iin(ω) impinging perpendicular on that model geometry, the intensity of the
36
2.4. NONLINEAR OPTICS
generated wave at frequency 2ω transmitted through the geometry is given by:
Iout(2ω) = ηω2∣∣e(2ω) · χ(2)(2ω,ω,ω) : e(ω)e(ω)
∣∣2I2in(ω) (2.110)
where η is just a proportionality constant, which can be obtained by taking the Fresnelequations into account. In the above equation the polarization of the incident wave isdescribed by e(ω) and the polarization of the nonlinear polarization is described by e(2ω)hence the tensorproduct e(2ω) · χ(2)(2ω,ω,ω) : e(ω)e(ω) can be evaluated according toequation (2.69).
SHG from metamaterials
In paragraph 2.3.4 2D metamaterials were introduced and examined as plasmonic nanopar-ticles arranged on lattice, giving rise to an effective, collective, linear response to incidentelectromagnetic waves. Due to fabrication issues these metamaterials, or to be more precisemetasurfaces are lying on a substrate, made for example out of glass. The building blocksof these materials, i.e., the plasmonic nanostructures, can give rise to second order nonlin-ear optical processes, which includes SHG. Hence, like in the linear case, we can assign aneffective, collective, nonlinear response to a 2D metamaterial or metasurface. Obviously,the just described geometry resembles the model geometry of the previous paragraph aboutSHG at interfaces, if we restrict ourselves to a normal incident driving wave. Hence, we canmake use of equation (2.110) in order to approximate the intensity of the generated secondharmonic light from a metamaterial. For this purpose we first have to estimate the secondorder nonlinear susceptibility of a given metamaterial.
As a result of paragraph 2.4.2 Miller’s law was obtained, which can be used to estimate thesecond order nonlinear susceptibility from the linear susceptibility. By combining this withthe definition of the effective linear susceptibility of a metamaterial, given in equation (2.47),we obtain:
χ(2)ijk(2ω,ω,ω) = χSHG
ijk =aijkǫ0
(1
dxdyz
)
Ae
me
Dii(2ω)Djj(ω)Dkk(ω) (2.111)
with the resonance function:
Dii(ω) =(ω2
i,0 − ω2) + ıγiω
(ω2i,0 − ω2)2 + γ2
i ω2
(2.112)
For a given metamaterial dx and dy are known quantities, A and Dii can be obtained bymeasuring the absolute extinction B(ω) following paragraph 2.3.4, ǫ0, e, and me are naturalconstants, and z describes the singular thickness of a 2D metamaterial. Hence, the secondorder nonlinear susceptibility is completely determined except for aijk. It now appearslikely, to make use of the results obtained by R. Miller and assume aijk to be constantor even to use the well-known values. But one has to keep in mind that the theoreticaljustification of Miller’s law is based on specific properties of natural occurring crystals,which are fulfilled by all noncentrosymmetric matter but not necessarily by metamaterials.
37
2. FUNDAMENTALS
However, for metamaterials whose source of the nonlinear polarization, i.e., the geometry ofthe constituting nanostructures, is similar, aijk should be a constant quantity.
From the above equations one can picture, that the unique property of metamaterials, whichis the possibility to artificially tailor their linear dispersion, can be directly used to also tailortheir nonlinear response. The most often encountered situation for SHG from plasmonicmetamaterials is, that the driving field is in resonance with the metamaterial [37]. This isdue to the fact, that the strong near-field enhancement inherent to plasmonic nanostructuresis believed to be the source of their nonlinearity [42, 67, 69]. As in paragraph 2.3.4 we will nowbriefly approximate the second order nonlinear susceptibility for this specific case. Underthe assumption Q = ω0
γ≫ 1 the resonance functions at the frequencies of interest can be
approximated by:
Dii(ω0) =ıQi
ω20,i
(2.113)
Dii(2ω0) ≅−1
3ω20,i
(2.114)
Hence, the generated SHG intensity under this condition will scale with 4-th power of theQ-factor, but only quadratically with the oscillator strength A and the density of the plas-monic nanostructures. However, one should keep in mind that the density of the plasmonicnanostructures can also influence the Q-factor via inter particle coupling.
The assumption was tacitly made, that i = j = k, or at least ω0,i = ω0,j = ω0,k, which is notnecessarily fulfilled as seen in section 2.3. For a detailed analysis of the second order nonlinearsusceptibility the wave properties, or in more detail the polarization, of the driving wave(s)and the nonlinear polarization can be taken into account. Let us assume only linear polarizedtransverse electromagnetic waves as driving fields and restrict ourselves to the detection ofthose waves for the generated field. We furthermore assume, that the nonlinear polarizationsheet representing the metamaterial lies in xy-plane and excitation and detection is doneperpendicular, i.e., a restriction to waves propagating in z-direction. For the case of a singlewave input, we can describe the driving field as E(z,ω) = E0e
ı(ωt−kz) [ex cos θ + ey sin θ],with ex and ey being the unit vector in x- and y-direction and θ the polarization angle, i.e.the angle between e(ω) and ex. Obviously equation (2.110) can be rewritten to:
ISHG(ω) = ηω2
∣∣∣∣
P SHG(ω)
|E(ω)|
∣∣∣∣
2
I2in(2ω) (2.115)
which under the previous explained condition becomes:
ISHG(ω) = ηω2|P SHG
x (ω)|2 + |P SHGy (ω)|2
|E(ω)|2 I2in(2ω) (2.116)
with:
|P SHGx (ω)||E(ω)| = P SHG
x =∣∣χSHG
xxx cos2 θ + χSHGxyy sin2 θ + χSHG
xxy sin 2θ∣∣ (2.117)
|P SHGy (ω)||E(ω)| = P SHG
y =∣∣χSHG
yxx cos2 θ + χSHGyyy sin2 θ + χSHG
yxy sin 2θ∣∣ (2.118)
38
2.4. NONLINEAR OPTICS
Evaluating this for the angles θ = 0, π/4, π/2 results in the following table:
θ 0 π/4 π/2
P SHGx χSHG
xxx 0,5χSHGxxx + 0,5χSHG
xyy + χSHGxxy χSHG
xyy
P SHGy χSHG
yxx 0,5χSHGyxx + 0,5χSHG
yyy + χSHGyxy χSHG
yyy
Thus, a polarization selective measurement of ISHG(ω) for a variation of the polarization ofthe driving field, can be employed to evaluate the individual tensor elements of the secondorder nonlinear susceptibility for second harmonic generation.
2.4.6 Optical parametric generation and amplification
Next difference frequency generation as depicted by the third diagram in Figure 2.9 will bediscussed. In this process two waves at frequencies ω1 and ω2 interact in a nonlinear mediumand generate a new output wave at ω = ω1 − ω2. In order to use the general formalismobtained through equations (2.96)-(2.107) for sum frequency generation, i.e., ω3 = ω1 + ω2,the index substitution 3 → p, 2 → s and 1 → i is performed. Under the assumption thatthe higher energy wave is undepleted, i.e., Ap = const the coupled wave equations describingthe interaction can be written down:
dAi
dz=
2ıdeffω2i
kiApA
∗se
ı∆kz (2.119)
dAs
dz= 2ıdeffω
2s
ksApA
∗i e
ı∆kz (2.120)
For the case of perfect phase matching, these equations can be solved by differentiating thelatter with respect to z and inserting the complex conjugate of the first leading to [29]:
d2As
dz2=
4d2eff
ω2sω
2i
kskic40ApA
∗pAs (2.121)
and a similar equation for Ai. A general solution of such a equation has the form:
As(z) = Csinh(√
Ipκz) +Dcosh(√
Ipκz) (2.122)
with the integration constant C and D, depending on the boundary conditions and:
κ2 =8d2effω
2sω
2i
kskic50ǫ0
(2.123)
By assuming the boundary condition Ai(0) = 0 and As(0) arbitrary (or the other wayaround), the following result can be obtained:
As(z) = As(0)cosh(√
Ipκz) (2.124)
Ai(z) = ı
√nsωi
niωs
Ap
|Ap|A∗
s(0)sinh(√
Ipκz) (2.125)
39
2. FUNDAMENTALS
With a large gain approximation, i.e., κ√
IpL ≫ 1 where L describes the length of theemployed nonlinear medium, the evolution of the intensities can be simplified to [82]:
Is(L) ≅1
4Is(0)e
(2κL√
Ip) (2.126)
Ii(L) ≅ωi
4ωs
Is(0)e(2κL
√Ip) (2.127)
Now we see that the process introduced as difference frequency generation at the beginningof this chapter, does not only generate a new wave at the frequency ωi but also amplifies thelower energy input wave at ωs. Therefore, this process is also known as optical parametricamplification. Hence, p denotes the pump wave, s the amplified signal wave and i due tohistorical reasons the idler wave. Interestingly the ratio of signal and idler intensities is suchthat an equal number of signal and idler photons are generated, as predicted in the photonpicture at the beginning of this section. Surprisingly this process even works if no inputwave is explicitly present at the entrance of the nonlinear medium. In this situation whichis known as optical parametric generation, both the signal and the idler wave are seeded byzero-point fluctuations [83].
In the case of amplification, the resulting frequency ωi is determined by the input frequenciesvia the conservation of energy ωp = ωs + ωi, which explains the name parametric amplifica-tion. But if the process is seeded by zero-point fluctuations, which is in principle broadbandnoise, the resulting frequencies are not a priori determined. In this case also phase matchinghas to be taken into account, which parametrizes the generation up to a certain bandwidth.This bandwidth, called phase matching bandwidth can be treated, by adding a phase mis-match ∆k = kp − ks − ki via the substitution Ipκ
2 → Ipκ2 + (∆k/2)2 in the previous
equations [82, 84]. The FWHM of the conversion efficiency curve then corresponds to aphase mismatch of ∆kL = 2.7831 rad. By now varying the signal frequency, while the pumpfrequency is kept fixed, the phase mismatch is varied according to:
∂
∂ωs∆k =
∂ks∂ωs
− ∂ki∂ωi
=1
vg,s− 1
vg,i(2.128)
where the group velocity vg was introduced. With this the phase matching bandwidth resultsin:
∆ω =2.7831
∣∣∣
1vg,s
− 1vg,i
∣∣∣L
(2.129)
Thus optical parametric generation/amplification represents the basis of a light source whosebandwidth and central output frequency is adjustable via the phase matching condition.
There are at least three different schemes, how an OPG process can be used to provide atunable light source [85, 86], which are depicted in Figure 2.11. The most wide spread isthe use of an optical cavity, which feeds back the generated signal and/or idler light to thenonlinear crystal in order to further amplify it, as depicted in Figure 2.11(a). Dependingon the cavity, the signal and/or idler light get amplified in up to several hundreds of passesthrough the nonlinear crystal, thus a strong net amplification can be achieved even with a
40

2.4. NONLINEAR OPTICS
Â(2)!s
!i
!p !p
Â(2)!s
!i
!p !p
!s
(a) (b) (c)
Â(2)!s
!i
!p !p
!s
Figure 2.11: Frequency conversion schemes based on optical parametric generation: (a) Opti-cal parametric oscillator (OPO), (b) Optical parametric amplifier (OPA), (c) Optical parametricgenerator (OPG). The boxes represent a second order nonlinear crystal, whereas the grey barsrepresent dichroic mirrors.
low gain per single pass through the nonlinear medium. Furthermore, the cavity can also beused to manipulate the spectral and spatial properties of the generated light. Such devicesare called optical parametric oscillators (OPO). OPOs have proven their functionality andreliability in research laboratories all over the world and are nowadays a standard tool forphysicists nearly as common as lasers [85, 87]. But the use of an optical cavity has also somedrawbacks. An instability of the cavity will obviously influence the stability of the OPOprocess and depending on the needed cavity configuration, the setup of an OPO can getquite complicated, unhandy and expensive. A common alternative are optical parametricamplifiers (OPAs), as depicted in Figure 2.11(b). Here, a not too weak light source, operatingat the signal frequency, is seeded in the nonlinear crystal together with a very strong pumpsource and gets amplified. But in such a setup the complexity of the cavity, in the caseof an OPO, is just transferred to the provision of a suitable seed source. However, someresearch results suggest, that with a suitable pump source a high conversion efficiency can beachieved without the use of a cavity or an external seed [88, 89], as depicted in Figure 2.11(c).Such devices are known as optical parametric generators (OPG) and will be discussed in thefollowing.
By assuming that the OPG process is initiated by zero-point fluctuations, a strongly fluc-tuating output, i.e., signal and idler intensities, can be expected. In contrast to this, theoutput stabilizes when the OPG process is driven into saturated conversion [83]. In thissituation the main fraction of the pump light is converted into signal and idler light5 andthe conversion will stop, or even back conversion to the pump light can occur [90]. Thus theprocess will stabilize itself to a certain output power regardless of the seeding power - in afirst approximation.
As the seeding power of zero-point fluctuations will be vanishingly small the OPG conversionprocess of the pump light to the signal or idler light will inherently be very weak, whichis obviously undesirable especially if a strongly fluctuating output is not preferable. Anexamination of equation (2.126) and (2.127) shows, that a high gain can be achieved bythe use of high pump intensities and/or long crystals. In principle, also the choice of thenonlinear material has a strong influence via the factor κ, but unfortunately the choiceof nonlinear materials is rather limited, especially if periodic poling has to be taken intoaccount [91]. The use of very long crystals might be an option, but there will be definitely
5Obviously the assumption of undepleted pump intensity is not valid in this situation.
41
2. FUNDAMENTALS
a limit due to fabrication issues. So, a straight forward approach is the use of high intensitylasers as a pump source. Here the limit is of course the onset of thermal damage of thenonlinear materials, as all materials will show some kind of residual absorption. As thethermal damage scales in a first approximation with the average power, a possibility toovercome this limit is the use of a laser, which does not emit its power continuously in time,but squeezed to short intervals in time - to ultrashort pulses [92]. For example, if a lasersystem has an average output power of 10 W and emits, with a periodicity of 50 MHz,pulses as short as 500 fs this would result in a peak power of 400 kW, which should increasethe efficiency of any nonlinear frequency conversion process tremendously while keeping theheating due to absorption on the level of a 10 W laser.
In the following some basic properties of ultrashort laser pulses will be reviewed in order toestimate how the use of those as pump source will influence an OPG. For this purpose, asecant hyperbolic pulse shape will be assumed [93]:
I(t) = I0sech2
(1.76t
τp
)
(2.130)
Here τp is the pulse duration, accounting for the FWHM of the intensity profile. Such apulse form is typically achieved by passive mode locking in a laser resonator. By Fouriertransforming the corresponding electric field from the time domain to the frequency domain,the spectral intensity profile can be obtained [93]:
I(ω) ∝ sech2
(1.76ω
∆ω
)
(2.131)
Thus, a pulsed laser is not truly monochromatic but has a certain spectral width ∆ω. Forsecant hyperbolic shaped pulses the dependency between pulse length and bandwidth isgiven by the time bandwidth product (TBWP) ∆ωτp = 2π · ∆ντp ≥ 2π · 0.315, whereasexact equality is obtained if the pulse is Fourier limited. This term describes the conditionof a frequency-independent spectral phase, i.e., all frequency components constituting thespectral intensity profile show the same phase relationship. For a given spectral width ∆ωthis condition leads to the maximum possible peak power and is hence favourable.
In equation (2.129) a phase matching bandwidth with respect to the signal and idler frequen-cies was defined. In a similar way an acceptance bandwidth for the pump pulse frequenciescan be defined. Thus the maximum usable length of the nonlinear material is limited. How-ever, the length is usually much more limited by a phenomena called temporal walk off, whichis illustrated in the left part of Figure 2.12. Due dispersion, waves of different frequenciespropagate with different velocities inside a medium, which can be taken into account via thegroup velocity vg(ω). A mismatch between the group velocities of the signal and idler wavewith respect to the pump wave, called group velocity mismatch (GVM), results in a temporaland spatial separation of the pulses, while propagating through the nonlinear medium. Asthis will obviously stop the nonlinear interaction the GVM defines a maximum interactionlength Lmax, which can be approximated via [82]:
Lmax ≈τAC,pump
min[GVMj]j = s,i (2.132)
42
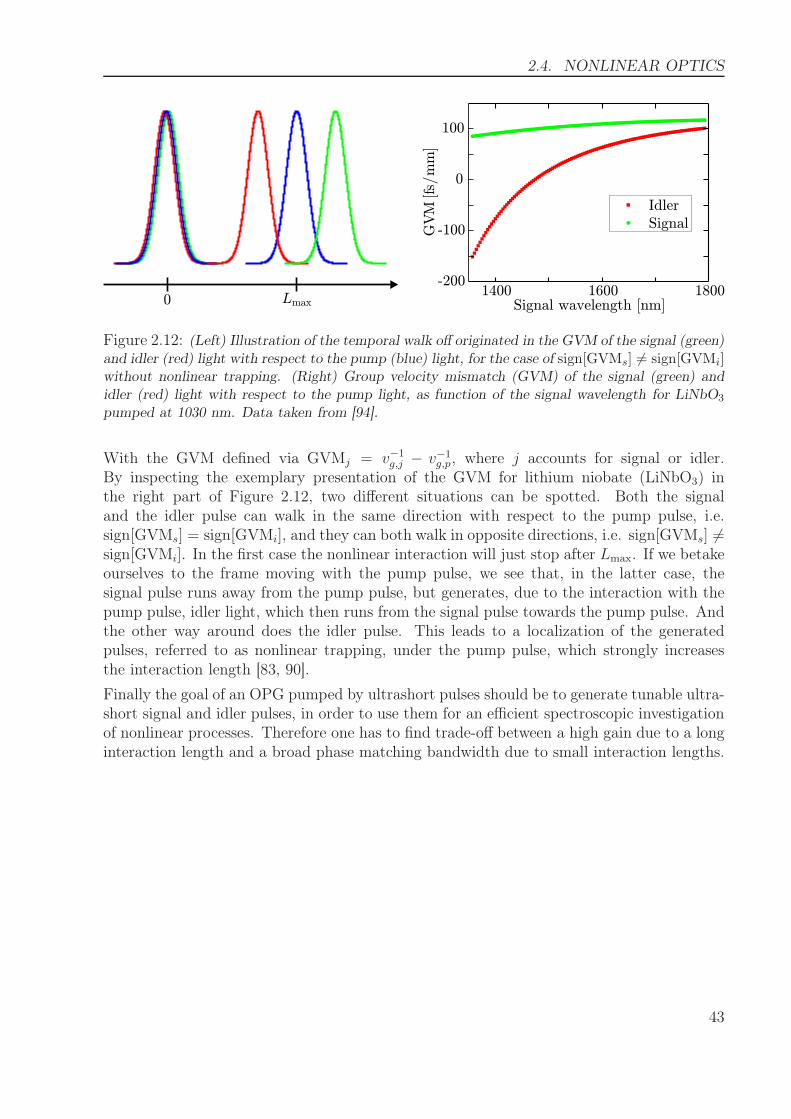
2.4. NONLINEAR OPTICS
1400 1600 1800-200
-100
0
100
IdlerSignal
[/
GVM
fsm
m]
Signal wavelength [nm]0 Lmax
Figure 2.12: (Left) Illustration of the temporal walk off originated in the GVM of the signal (green)and idler (red) light with respect to the pump (blue) light, for the case of sign[GVMs] 6= sign[GVMi]without nonlinear trapping. (Right) Group velocity mismatch (GVM) of the signal (green) andidler (red) light with respect to the pump light, as function of the signal wavelength for LiNbO3
pumped at 1030 nm. Data taken from [94].
With the GVM defined via GVMj = v−1g,j − v−1
g,p, where j accounts for signal or idler.By inspecting the exemplary presentation of the GVM for lithium niobate (LiNbO3) inthe right part of Figure 2.12, two different situations can be spotted. Both the signaland the idler pulse can walk in the same direction with respect to the pump pulse, i.e.sign[GVMs] = sign[GVMi], and they can both walk in opposite directions, i.e. sign[GVMs] 6=sign[GVMi]. In the first case the nonlinear interaction will just stop after Lmax. If we betakeourselves to the frame moving with the pump pulse, we see that, in the latter case, thesignal pulse runs away from the pump pulse, but generates, due to the interaction with thepump pulse, idler light, which then runs from the signal pulse towards the pump pulse. Andthe other way around does the idler pulse. This leads to a localization of the generatedpulses, referred to as nonlinear trapping, under the pump pulse, which strongly increasesthe interaction length [83, 90].
Finally the goal of an OPG pumped by ultrashort pulses should be to generate tunable ultra-short signal and idler pulses, in order to use them for an efficient spectroscopic investigationof nonlinear processes. Therefore one has to find trade-off between a high gain due to a longinteraction length and a broad phase matching bandwidth due to small interaction lengths.
43

3
Optical parametric generator
This chapter will deal with the provision of a light source, suitable to investigate the sec-ond harmonic generation from plasmonic nanostructures and metamaterials and is closelyfollowing [95]. In the previous chapter plasmonic nanostructures and metamaterials were in-troduced as artificial objects, whose linear, and thereby also their nonlinear, spectral responseto electromagnetic radiation, e.g., visible or near-infrared light, can be tailored. Thus it isadvisable to investigate second harmonic generation from those spectrally resolved, thereforea tunable light source is needed.
As the length of plasmonic nanostructures and metamaterials, which enters the SHG ef-ficiency quadratically, will be vanishingly small one has to employ highest possible pumpintensities, to obtain a measurable nonlinear signal. But high average intensities would leadto a melting after a short period of time, due to strong absorption in resonance. To reducethe heat exposure it is possible to utilize laser pulses, which exhibit high intensities onlyfor a period of time in the range of several femtoseconds. If a time averaged detection isused for the nonlinear signal, a pulsed excitation will result in a low signal-to-noise ratio.A usual procedure to maximize the signal-to-noise ratio is to perform the excitation with ahigh pulse repetition rate.
Following paragraph 2.4.6, the process of optical parametric generation and amplificationshould be capable to achieve spectral tunable, ultrashort pulses. So far, the research activitiescarried out on OPGs are mainly focused on picosecond pulse durations and/or kilohertzrepetition rates [96–102]. The reason for this is that OPGs need a high parametric gain, inorder to achieve a measurable output and to suppress intensity fluctuations [83, 88, 89, 102].The high parametric gain is usually achieved by the use of an amplified laser system as apump source or rather long nonlinear crystals. However, long crystals are usually no optionfor the generation of femtosecond pulses as discussed in paragraph 2.4.6.
The development of high average power passively mode-locked solid state and fiber lasers[103–105] allowed for the realization of single pass optical parametric generators based onrather short LiNbO3 and LiTaO3 crystals with repetition rates of several tens of megahertzand pulse durations in the femtosecond regime [88, 89]. In these experiments the averagesignal power and the conversion efficiency for long term operation was limited due to theonset of laser damage inside the crystal after a few minutes.
45
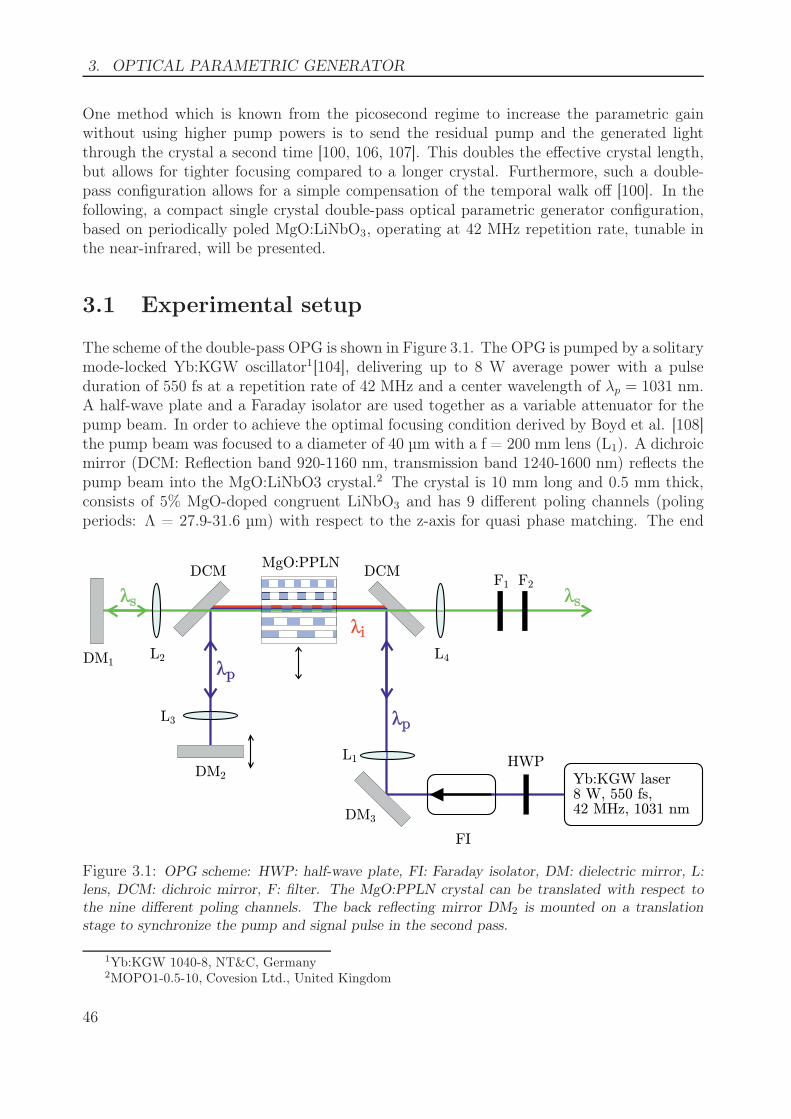
3. OPTICAL PARAMETRIC GENERATOR
One method which is known from the picosecond regime to increase the parametric gainwithout using higher pump powers is to send the residual pump and the generated lightthrough the crystal a second time [100, 106, 107]. This doubles the effective crystal length,but allows for tighter focusing compared to a longer crystal. Furthermore, such a double-pass configuration allows for a simple compensation of the temporal walk off [100]. In thefollowing, a compact single crystal double-pass optical parametric generator configuration,based on periodically poled MgO:LiNbO3, operating at 42 MHz repetition rate, tunable inthe near-infrared, will be presented.
3.1 Experimental setup
The scheme of the double-pass OPG is shown in Figure 3.1. The OPG is pumped by a solitarymode-locked Yb:KGW oscillator1[104], delivering up to 8 W average power with a pulseduration of 550 fs at a repetition rate of 42 MHz and a center wavelength of λp = 1031 nm.A half-wave plate and a Faraday isolator are used together as a variable attenuator for thepump beam. In order to achieve the optimal focusing condition derived by Boyd et al. [108]the pump beam was focused to a diameter of 40 µm with a f = 200 mm lens (L1). A dichroicmirror (DCM: Reflection band 920-1160 nm, transmission band 1240-1600 nm) reflects thepump beam into the MgO:LiNbO3 crystal.2 The crystal is 10 mm long and 0.5 mm thick,consists of 5% MgO-doped congruent LiNbO3 and has 9 different poling channels (polingperiods: Λ = 27.9-31.6 µm) with respect to the z-axis for quasi phase matching. The end
MgO:PPLN
Yb:KGW laser8 W, 550 fs,42 MHz, 1031 nm
HWP
FI
DM3
DM2
DM1
DCM DCM
L2 L4
L3
L1
F1 F2
λp
λs
λi
λp
λs
Figure 3.1: OPG scheme: HWP: half-wave plate, FI: Faraday isolator, DM: dielectric mirror, L:lens, DCM: dichroic mirror, F: filter. The MgO:PPLN crystal can be translated with respect tothe nine different poling channels. The back reflecting mirror DM2 is mounted on a translationstage to synchronize the pump and signal pulse in the second pass.
1Yb:KGW 1040-8, NT&C, Germany2MOPO1-0.5-10, Covesion Ltd., United Kingdom
46
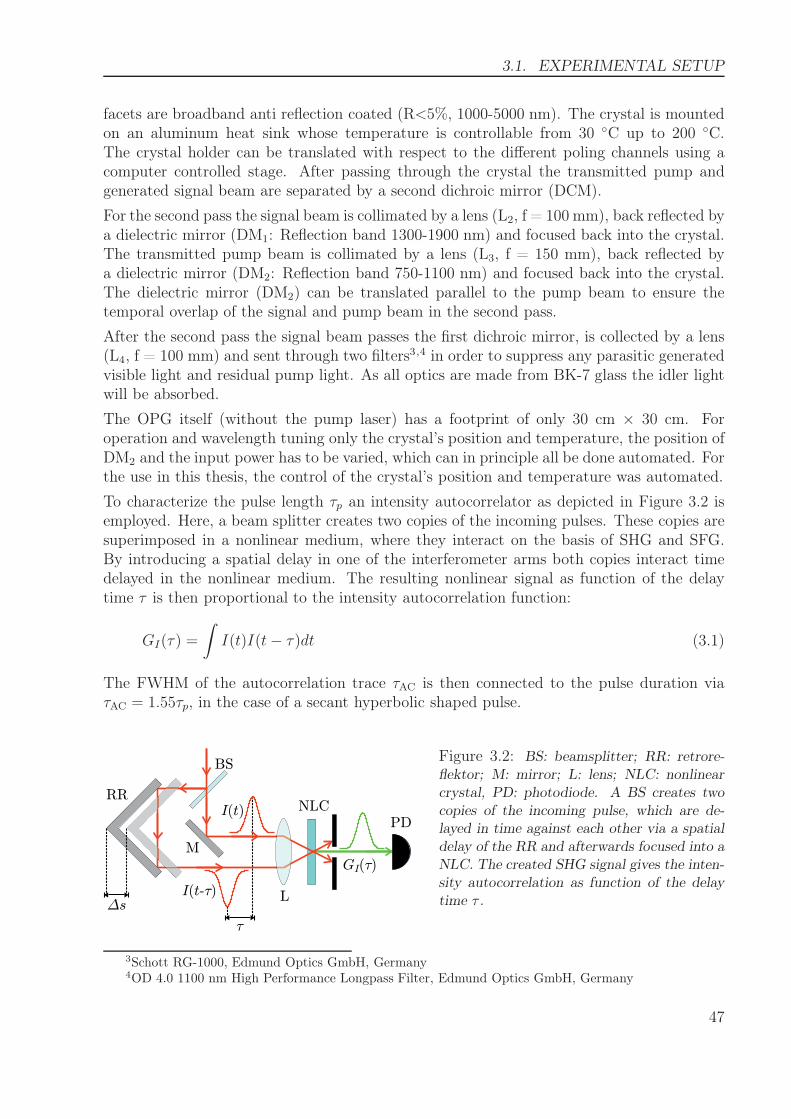
3.1. EXPERIMENTAL SETUP
facets are broadband anti reflection coated (R<5%, 1000-5000 nm). The crystal is mountedon an aluminum heat sink whose temperature is controllable from 30 ◦C up to 200 ◦C.The crystal holder can be translated with respect to the different poling channels using acomputer controlled stage. After passing through the crystal the transmitted pump andgenerated signal beam are separated by a second dichroic mirror (DCM).
For the second pass the signal beam is collimated by a lens (L2, f = 100 mm), back reflected bya dielectric mirror (DM1: Reflection band 1300-1900 nm) and focused back into the crystal.The transmitted pump beam is collimated by a lens (L3, f = 150 mm), back reflected bya dielectric mirror (DM2: Reflection band 750-1100 nm) and focused back into the crystal.The dielectric mirror (DM2) can be translated parallel to the pump beam to ensure thetemporal overlap of the signal and pump beam in the second pass.
After the second pass the signal beam passes the first dichroic mirror, is collected by a lens(L4, f = 100 mm) and sent through two filters3,4 in order to suppress any parasitic generatedvisible light and residual pump light. As all optics are made from BK-7 glass the idler lightwill be absorbed.
The OPG itself (without the pump laser) has a footprint of only 30 cm × 30 cm. Foroperation and wavelength tuning only the crystal’s position and temperature, the position ofDM2 and the input power has to be varied, which can in principle all be done automated. Forthe use in this thesis, the control of the crystal’s position and temperature was automated.
To characterize the pulse length τp an intensity autocorrelator as depicted in Figure 3.2 isemployed. Here, a beam splitter creates two copies of the incoming pulses. These copies aresuperimposed in a nonlinear medium, where they interact on the basis of SHG and SFG.By introducing a spatial delay in one of the interferometer arms both copies interact timedelayed in the nonlinear medium. The resulting nonlinear signal as function of the delaytime τ is then proportional to the intensity autocorrelation function:
GI(τ) =
∫
I(t)I(t− τ)dt (3.1)
The FWHM of the autocorrelation trace τAC is then connected to the pulse duration viaτAC = 1.55τp, in the case of a secant hyperbolic shaped pulse.
¢s
¿
I t ¿( - )
I t( )
G ¿I( )
RR
BS
M
L
NLCPD
Figure 3.2: BS: beamsplitter; RR: retrore-flektor; M: mirror; L: lens; NLC: nonlinearcrystal, PD: photodiode. A BS creates twocopies of the incoming pulse, which are de-layed in time against each other via a spatialdelay of the RR and afterwards focused into aNLC. The created SHG signal gives the inten-sity autocorrelation as function of the delaytime τ .
3Schott RG-1000, Edmund Optics GmbH, Germany4OD 4.0 1100 nm High Performance Longpass Filter, Edmund Optics GmbH, Germany
47
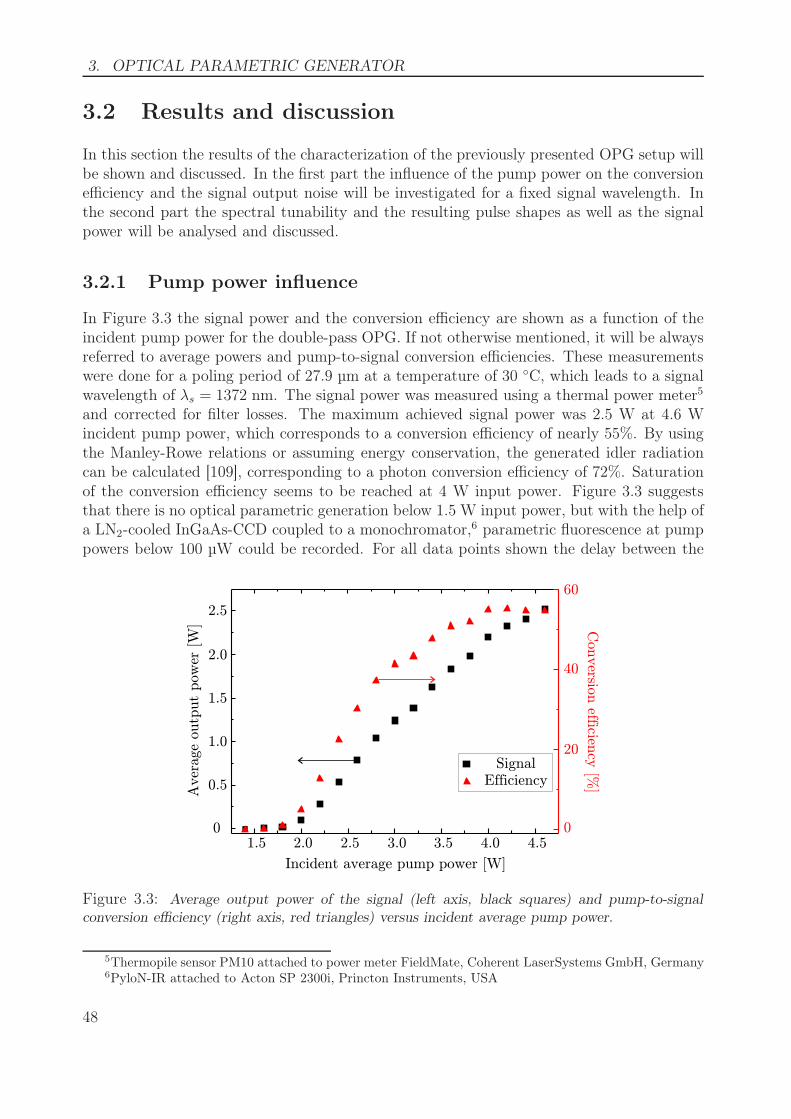
3. OPTICAL PARAMETRIC GENERATOR
3.2 Results and discussion
In this section the results of the characterization of the previously presented OPG setup willbe shown and discussed. In the first part the influence of the pump power on the conversionefficiency and the signal output noise will be investigated for a fixed signal wavelength. Inthe second part the spectral tunability and the resulting pulse shapes as well as the signalpower will be analysed and discussed.
3.2.1 Pump power influence
In Figure 3.3 the signal power and the conversion efficiency are shown as a function of theincident pump power for the double-pass OPG. If not otherwise mentioned, it will be alwaysreferred to average powers and pump-to-signal conversion efficiencies. These measurementswere done for a poling period of 27.9 µm at a temperature of 30 ◦C, which leads to a signalwavelength of λs = 1372 nm. The signal power was measured using a thermal power meter5
and corrected for filter losses. The maximum achieved signal power was 2.5 W at 4.6 Wincident pump power, which corresponds to a conversion efficiency of nearly 55%. By usingthe Manley-Rowe relations or assuming energy conservation, the generated idler radiationcan be calculated [109], corresponding to a photon conversion efficiency of 72%. Saturationof the conversion efficiency seems to be reached at 4 W input power. Figure 3.3 suggeststhat there is no optical parametric generation below 1.5 W input power, but with the help ofa LN2-cooled InGaAs-CCD coupled to a monochromator,6 parametric fluorescence at pumppowers below 100 µW could be recorded. For all data points shown the delay between the
Con
versio
n efficien
cy [%
]A
ver
age
outp
ut
pow
er [W
]
Incident average pump power [W]
1.5 2.0 2.5 3.0 3.5 4.0 4.50
0.5
1.0
1.5
2.0
2.5
0
20
40
60
SignalEfficiency
Figure 3.3: Average output power of the signal (left axis, black squares) and pump-to-signalconversion efficiency (right axis, red triangles) versus incident average pump power.
5Thermopile sensor PM10 attached to power meter FieldMate, Coherent LaserSystems GmbH, Germany6PyloN-IR attached to Acton SP 2300i, Princton Instruments, USA
48
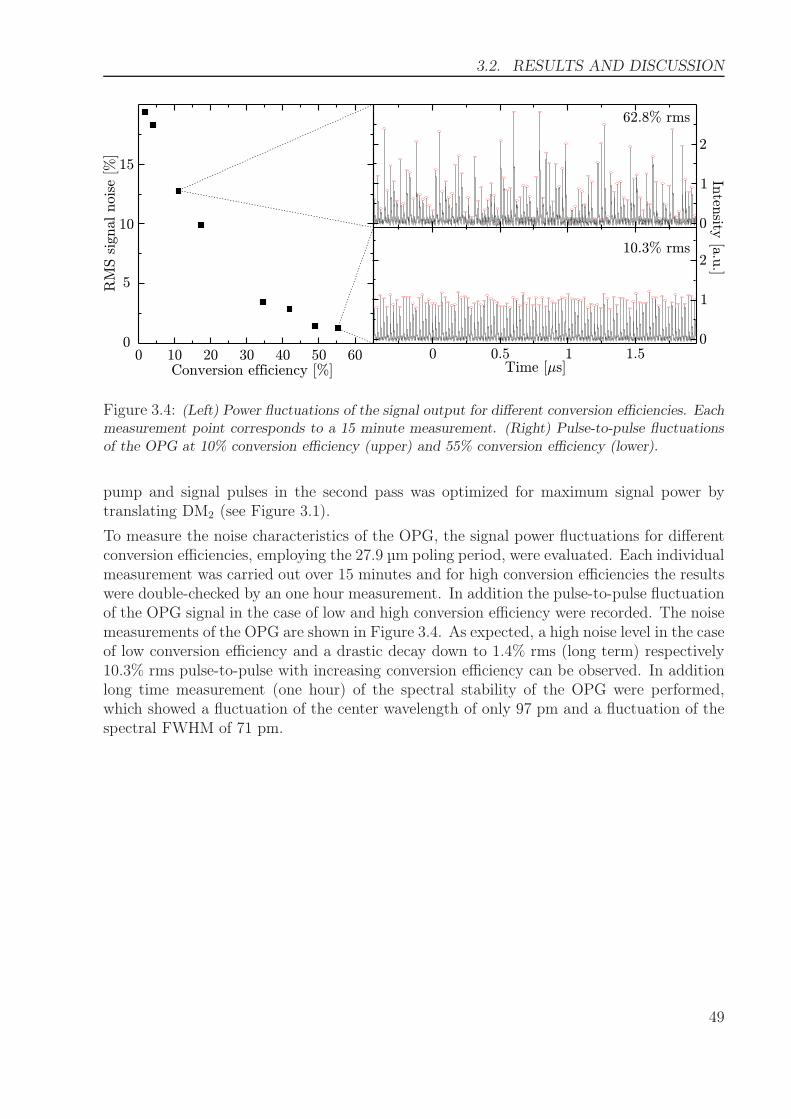
3.2. RESULTS AND DISCUSSION
Conversion efficiency [%]
RM
S s
ignal nois
e [%
]
0 10 20 30 40 50 600
5
10
15
0.50 1 1.5
0
1
2
Inten
sity [a
.u.]
Time [ s]¹
10.3% rms
62.8% rms
0
1
2
Figure 3.4: (Left) Power fluctuations of the signal output for different conversion efficiencies. Eachmeasurement point corresponds to a 15 minute measurement. (Right) Pulse-to-pulse fluctuationsof the OPG at 10% conversion efficiency (upper) and 55% conversion efficiency (lower).
pump and signal pulses in the second pass was optimized for maximum signal power bytranslating DM2 (see Figure 3.1).
To measure the noise characteristics of the OPG, the signal power fluctuations for differentconversion efficiencies, employing the 27.9 µm poling period, were evaluated. Each individualmeasurement was carried out over 15 minutes and for high conversion efficiencies the resultswere double-checked by an one hour measurement. In addition the pulse-to-pulse fluctuationof the OPG signal in the case of low and high conversion efficiency were recorded. The noisemeasurements of the OPG are shown in Figure 3.4. As expected, a high noise level in the caseof low conversion efficiency and a drastic decay down to 1.4% rms (long term) respectively10.3% rms pulse-to-pulse with increasing conversion efficiency can be observed. In additionlong time measurement (one hour) of the spectral stability of the OPG were performed,which showed a fluctuation of the center wavelength of only 97 pm and a fluctuation of thespectral FWHM of 71 pm.
49
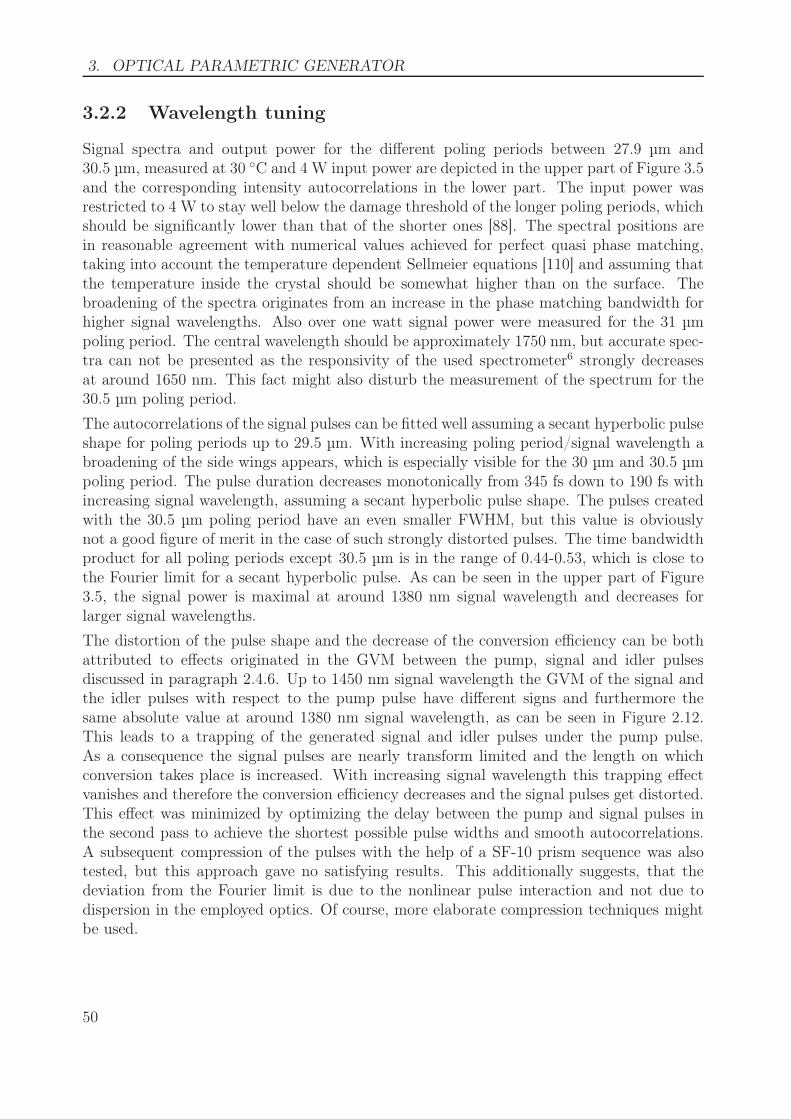
3. OPTICAL PARAMETRIC GENERATOR
3.2.2 Wavelength tuning
Signal spectra and output power for the different poling periods between 27.9 µm and30.5 µm, measured at 30 ◦C and 4 W input power are depicted in the upper part of Figure 3.5and the corresponding intensity autocorrelations in the lower part. The input power wasrestricted to 4 W to stay well below the damage threshold of the longer poling periods, whichshould be significantly lower than that of the shorter ones [88]. The spectral positions arein reasonable agreement with numerical values achieved for perfect quasi phase matching,taking into account the temperature dependent Sellmeier equations [110] and assuming thatthe temperature inside the crystal should be somewhat higher than on the surface. Thebroadening of the spectra originates from an increase in the phase matching bandwidth forhigher signal wavelengths. Also over one watt signal power were measured for the 31 µmpoling period. The central wavelength should be approximately 1750 nm, but accurate spec-tra can not be presented as the responsivity of the used spectrometer6 strongly decreasesat around 1650 nm. This fact might also disturb the measurement of the spectrum for the30.5 µm poling period.
The autocorrelations of the signal pulses can be fitted well assuming a secant hyperbolic pulseshape for poling periods up to 29.5 µm. With increasing poling period/signal wavelength abroadening of the side wings appears, which is especially visible for the 30 µm and 30.5 µmpoling period. The pulse duration decreases monotonically from 345 fs down to 190 fs withincreasing signal wavelength, assuming a secant hyperbolic pulse shape. The pulses createdwith the 30.5 µm poling period have an even smaller FWHM, but this value is obviouslynot a good figure of merit in the case of such strongly distorted pulses. The time bandwidthproduct for all poling periods except 30.5 µm is in the range of 0.44-0.53, which is close tothe Fourier limit for a secant hyperbolic pulse. As can be seen in the upper part of Figure3.5, the signal power is maximal at around 1380 nm signal wavelength and decreases forlarger signal wavelengths.
The distortion of the pulse shape and the decrease of the conversion efficiency can be bothattributed to effects originated in the GVM between the pump, signal and idler pulsesdiscussed in paragraph 2.4.6. Up to 1450 nm signal wavelength the GVM of the signal andthe idler pulses with respect to the pump pulse have different signs and furthermore thesame absolute value at around 1380 nm signal wavelength, as can be seen in Figure 2.12.This leads to a trapping of the generated signal and idler pulses under the pump pulse.As a consequence the signal pulses are nearly transform limited and the length on whichconversion takes place is increased. With increasing signal wavelength this trapping effectvanishes and therefore the conversion efficiency decreases and the signal pulses get distorted.This effect was minimized by optimizing the delay between the pump and signal pulses inthe second pass to achieve the shortest possible pulse widths and smooth autocorrelations.A subsequent compression of the pulses with the help of a SF-10 prism sequence was alsotested, but this approach gave no satisfying results. This additionally suggests, that thedeviation from the Fourier limit is due to the nonlinear pulse interaction and not due todispersion in the employed optics. Of course, more elaborate compression techniques mightbe used.
50
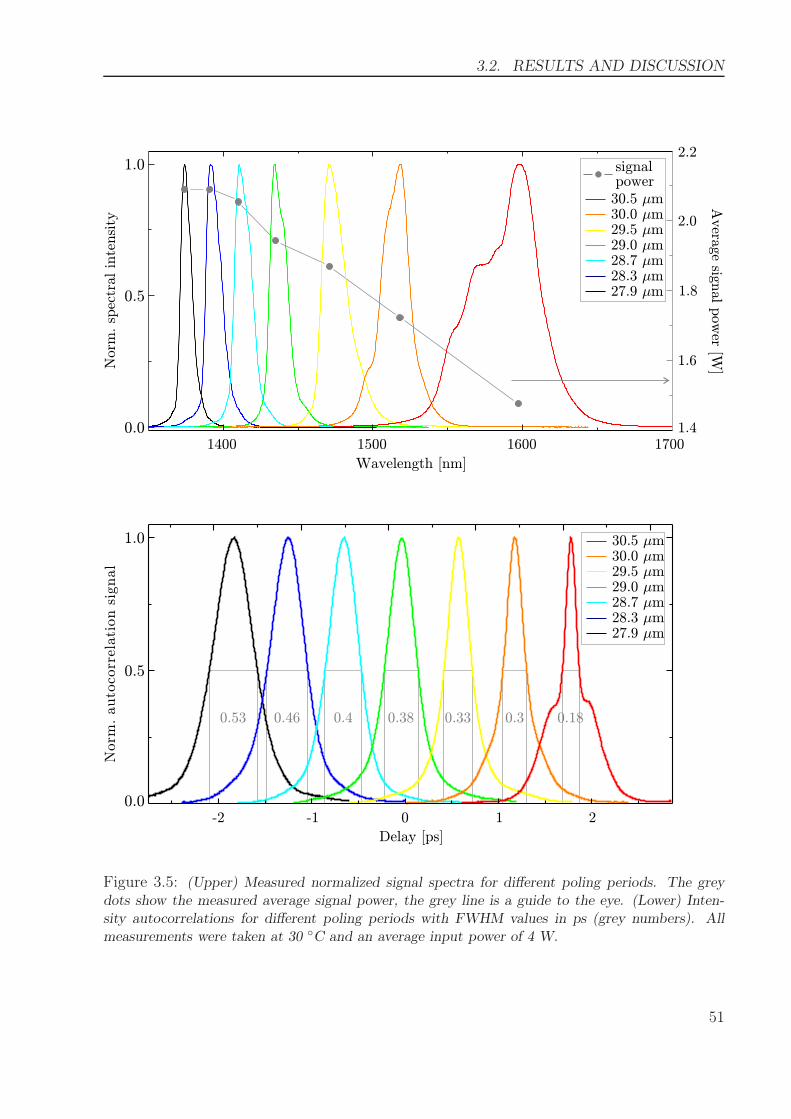
3.2. RESULTS AND DISCUSSION
Norm
.auto
corr
elati
on
signal
Delay [ps]
30.5 m¹30.0 m¹29.5 m¹29.0 m¹28.7 m¹28.3 m¹27.9 m¹
0.0
0.5
1.0
-2 -1 0 1 2
Norm
. sp
ectr
al in
tensi
ty
Wavelength [nm]
Avera
ge sig
nal p
ow
er [W]
30.5 m¹30.0 m¹29.5 m¹29.0 m¹28.7 m¹28.3 m¹27.9 m¹
signalpower
1400 1500 1600 17000.0
0.5
1.0
1.4
1.6
1.8
2.0
2.2
0.53 0.46 0.4 0.38 0.33 0.3 0.18
Figure 3.5: (Upper) Measured normalized signal spectra for different poling periods. The greydots show the measured average signal power, the grey line is a guide to the eye. (Lower) Inten-sity autocorrelations for different poling periods with FWHM values in ps (grey numbers). Allmeasurements were taken at 30 ◦C and an average input power of 4 W.
51
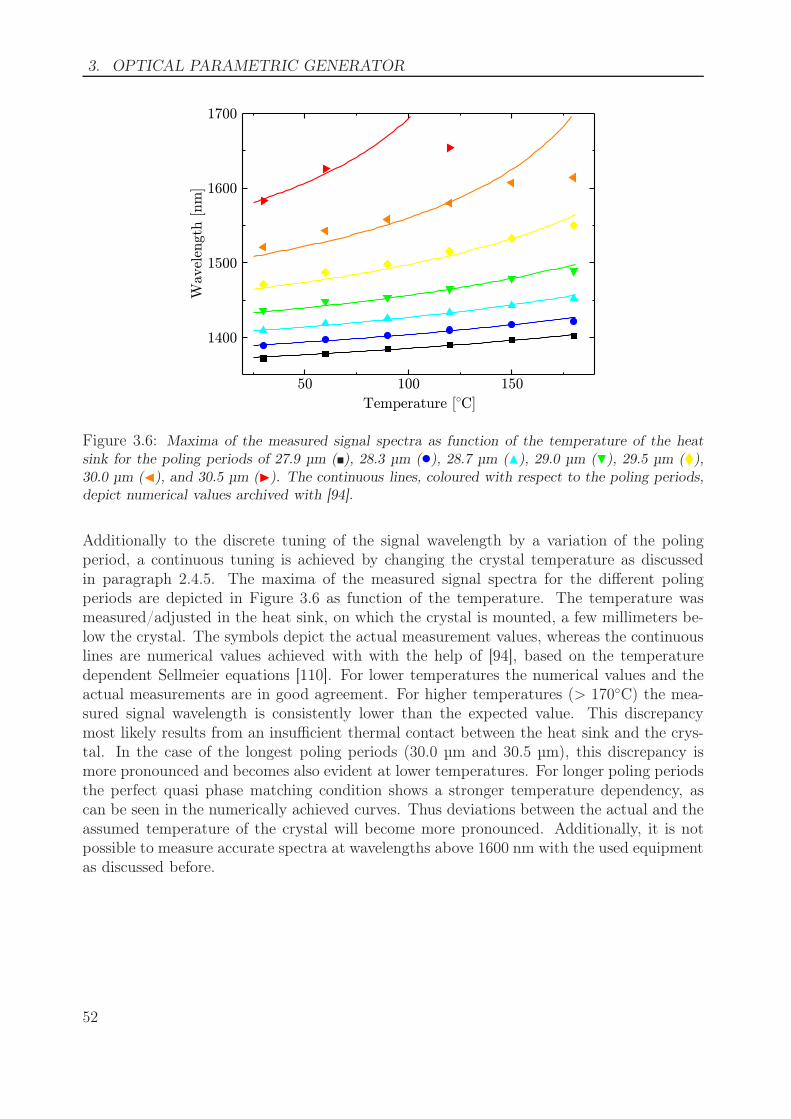
3. OPTICAL PARAMETRIC GENERATOR
50 100 150
1400
1500
1600
1700
Temperature [ C]±
Wavel
ength
[nm
]
Figure 3.6: Maxima of the measured signal spectra as function of the temperature of the heatsink for the poling periods of 27.9 µm (�), 28.3 µm (•), 28.7 µm (N), 29.0 µm (H), 29.5 µm (�),30.0 µm (◭), and 30.5 µm (◮). The continuous lines, coloured with respect to the poling periods,depict numerical values archived with [94].
Additionally to the discrete tuning of the signal wavelength by a variation of the polingperiod, a continuous tuning is achieved by changing the crystal temperature as discussedin paragraph 2.4.5. The maxima of the measured signal spectra for the different polingperiods are depicted in Figure 3.6 as function of the temperature. The temperature wasmeasured/adjusted in the heat sink, on which the crystal is mounted, a few millimeters be-low the crystal. The symbols depict the actual measurement values, whereas the continuouslines are numerical values achieved with with the help of [94], based on the temperaturedependent Sellmeier equations [110]. For lower temperatures the numerical values and theactual measurements are in good agreement. For higher temperatures (> 170◦C) the mea-sured signal wavelength is consistently lower than the expected value. This discrepancymost likely results from an insufficient thermal contact between the heat sink and the crys-tal. In the case of the longest poling periods (30.0 µm and 30.5 µm), this discrepancy ismore pronounced and becomes also evident at lower temperatures. For longer poling periodsthe perfect quasi phase matching condition shows a stronger temperature dependency, ascan be seen in the numerically achieved curves. Thus deviations between the actual and theassumed temperature of the crystal will become more pronounced. Additionally, it is notpossible to measure accurate spectra at wavelengths above 1600 nm with the used equipmentas discussed before.
52
4
Nonlinear Plasmonics
In this chapter the nonlinear response of plasmonic nanostructures and metamaterials will beinvestigated by means of linear spectroscopy and second harmonic generation spectroscopy.In the first section the methods used in this thesis to fabricate plasmonic nanostructuresand metamaterials will be introduced. In the second section the experiments carried out onhybrid plasmonic/dielectric nanostructures will be presented and the corresponding resultswill be discussed. The last section will deal with second harmonic generation from two-photon resonant metamaterials, i.e., metamaterials composed of nanostructures which onlyshow a plasmonic resonance for the generated second harmonic field, but not for the drivingfield.
4.1 Sample fabrication
In this section the methods used to fabricate plasmonic nanostructures and metamaterialswill be discussed. In the first paragraph the principle fabrication scheme based on electron-beam lithography will be presented step by step, whereas the second paragraph focusseson thin film deposition by thermal evaporation which is used for the material depositioninvolved in the fabrication process.
4.1.1 Electron-beam lithography
In Figure 4.1 the essential fabrication steps of a double-stage electron-beam lithographyprocess are shown. As electron-beam lithography cannot provide levitating nanostructures,the first step (indicated in (a)) is the provision of a substrate, suitable for both, the furtherexperiments and the fabrication process. For the optical experiments the substrate has tobe transparent in the visible and near-infrared spectral range and a low refractive index isdesirable. As the goal is the fabrication of structures with submicron dimensions the sub-strate has obviously to be as smooth and clean as possible. For the fabrication process thesubstrate has to be chemically inert to organic solvents and resistant to heat treatments.These properties can be fulfilled by borosilicate glass. However electron-beam lithographyalso requires a conducting substrate or at least a conducting layer on top of it to avoid
53
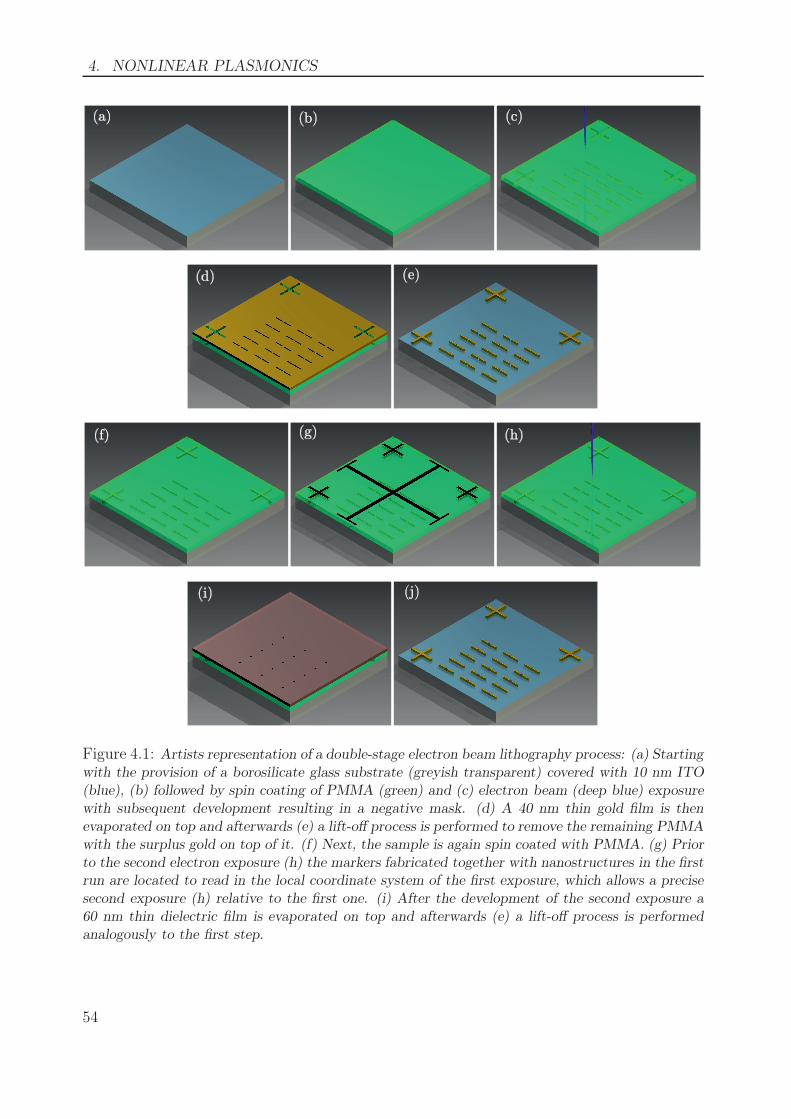
4. NONLINEAR PLASMONICS
(a) (b) (c)
(d) (e)
(f) (g) (h)
(i) (j)
Figure 4.1: Artists representation of a double-stage electron beam lithography process: (a) Startingwith the provision of a borosilicate glass substrate (greyish transparent) covered with 10 nm ITO(blue), (b) followed by spin coating of PMMA (green) and (c) electron beam (deep blue) exposurewith subsequent development resulting in a negative mask. (d) A 40 nm thin gold film is thenevaporated on top and afterwards (e) a lift-off process is performed to remove the remaining PMMAwith the surplus gold on top of it. (f) Next, the sample is again spin coated with PMMA. (g) Priorto the second electron exposure (h) the markers fabricated together with nanostructures in the firstrun are located to read in the local coordinate system of the first exposure, which allows a precisesecond exposure (h) relative to the first one. (i) After the development of the second exposure a60 nm thin dielectric film is evaporated on top and afterwards (e) a lift-off process is performedanalogously to the first step.
54
4.1. SAMPLE FABRICATION
charge accumulation. In order to obtain a large amount of substrates with identical prop-erties a permanent, 10 nm thin indium tin oxide (ITO) layer is deposited via electron beamevaporation (see paragraph 4.1.2) on a complete 4 inch wafer of borosilicate glass,1 which issubsequently cut into pieces with a size of 10 mm × 10 mm. ITO is one of the few materialswhich is transparent in the optical and near-infrared range, but has a high DC-conductivity.After the cutting, the substrate(s) is cleaned via mechanically polishing and a more than onehour ultrasonic bath with acetone and isopropyl alcohol subsequently and finally thoroughlyblown dry with clean nitrogen.
Directly afterwards the electron beam resist is applied to the substrate by spin coating(indicated in (b)). As electron beam resist PMMA with a molecular weight of 950 k dilutedto 4 % in anisole, is used.2 The spin coating is done in the following steps: (i) The substrateis rotated at 500 rpm for 5 s in order to dispense 50 µl of the PMMA/anisole solution overthe substrate, (ii) and then rotated at 4000 rpm for 90 s in order to obtain an approximately200 nm thick film. (iii) At last the substrate is baked for 45 minutes at 175 ◦C in a convectionoven to remove the residual solvent and to smooth the PMMA film.
The substrate is then transferred to a scanning electron microscope3 (SEM) equipped witha fast electrostatic beam blanker and an external scan control and pattern generator.4 Thissystem allows for a controlled selective exposure (see (c)) of the PMMA film, defining thecross sections of the desired structures. For the exposure an acceleration voltage of 20 kV,an aperture size of 10 µm and a working distance of 8 mm, resulting in a current of 40 pA,was used. Due to the electron bombardment the molecular chains of the PMMA get reducedto smaller chains, which are less resistive to organic solvents. Thus, after the exposure,the PMMA is developed by swivelling the substrate for 45 seconds in a 8 ◦C cold, 1:3methyl isobutyl ketone to isopropyl alcohol mixture with 1.5 vol-% butanone, resulting inthe negative PMMA mask depicted in (c). The development is stopped by blowing dry thesubstrate with clean nitrogen.
On top of the negative mask a 40 nm thin gold film (depicted in (d)) is thermally evaporated(see paragraph 4.1.2). Afterwards a lift-off process is performed, in which the hole substrateis soaked in 60 ◦C hot N-methyl-2-pyrrolidone in order to dissolve the remaining PMMA.After 3 hours the softened PMMA and the surplus gold on top of it are washed away,by carefully spraying the substrate with N-methyl-2-pyrrolidone. In order to obtain cleansamples and nanostructures, as depicted in (e), the substrate is afterwards rinsed in acetone,isopropyl alcohol and distilled water, baked for 45 minutes at 175 ◦C in a convection oven,and finally exposed for 1 hour to an Ar/O2-plasma.
If only gold nanostructures are desired the sample is now finished. For several purposesthe combination of nanostructures consisting of different materials is needed, for examplethe combination of plasmonic nanostructures with dielectrics. To fabricate those a secondelectron-beam lithography run is applied to the previously fabricated sample. The sample isagain spin coated with PMMA (depicted in (f)), but this time with a double layer. The firstlayer consists of 600 k PMMA spun with 4000 rpm and the second layer consists of 950 k
1Supplied by Plan Optik AG, Germany2Supplied by micro resist technology GmbH, Germany3Type Sigma, Carl Zeiss Microscopy GmbH, Germany4Type ELPHY Plus, Raith GmbH, Germany
55
4. NONLINEAR PLASMONICS
PMMA spun at 6000 rpm. Between the two spin coating steps, an intermediate bakingis performed for 10 minutes on a hot plate at 175 ◦C. The lower, thicker layer, consistingof PMMA with a lower molecular weight is more sensitive to electron exposure, than theupper, thinner layer. Thus an electron exposure and subsequent development results in aPMMA cross section profile with a deep undercut, which makes the lift-off easier in the caseof structures with a bigger height. Prior to the second exposure, the exact coordinate systemof the first exposure has to be retrieved. For this purpose, not only the desired nanostructureswere fabricated in the first electron-beam lithography run, but also three cross like markersaround the nanostructure arrays. By selectively scanning those makers, the coordinatesystem of the first exposure can be determined (see (g)). Thus the cross sections of the secondset of nanostructures can be exposed with a high precision relative to the nanostructuresfabricated in the first run (see (h)). For the scanning of the markers and the subsequentexposure an acceleration voltage of 30 kV, an aperture size of 15 µm and a working distanceof 13 mm is used, resulting in a current of 130 pA. These parameters, different from thoseused in the first exposure, are used, as the PMMA appears more transparent at 30 kV andthe higher current provides a better contrast, thus the makers can be read in more precisely.After the second exposure the sample is developed analogously to the first exposure. Thistime a 60 nm thin dielectric film is thermally evaporated on the obtained hole mask (see(i)). Last but not least the same lift-off procedure as before is performed, resulting in thehybrid metallic/dielectric nanostructures depicted in (j). However, the baking and plasmacleaning are left out, as these might damage the dielectric nanostructures.
The artists representation of the above explained process in Figure 4.1 might suggest, thatonly a single array of nanostructures per substrate is fabricated. In reality both, the fabri-cation of the metallic nanostructure geometries and the relative positioning of the dielectricnanostructures is not as reproducible as desired. Therefore several arrays are fabricated ona single substrate, with variations of both parameters form array to array. The maximumdeflection of the electron beam limits the area, which can be exposed to 100 µm × 100 µm.Therefore the retrieval of the original coordinate system has to be done for each array ofnanostructures individually, which is a quite time consuming and wearing process. Hence, anautomatization of this step was implemented in the process. By this the number of nanos-tructure arrays per substrate is only limited by the substrate size resulting in maximumnumber of areas per substrate of roughly 600.
4.1.2 Thin film deposition by thermal evaporation
In the previous paragraph the deposition of thin films consisting of three different inorganicmaterials was mentioned: gold, ITO, and not yet specified dielectrics. While there areseveral possible methods for thin film deposition, in this thesis thermal evaporation underhigh vacuum is solely used and will be shortly reviewed in the following. A schematic sketchof an evaporation plant is shown in Figure 4.2(a). In the evaporation process the startingmaterial (target material) is heated slightly above its boiling or sublimation point in a highvacuum chamber.5 This leads to the liberation of atoms, atomic clusters or molecules,i.e., evaporation, from the target material. These will then travel undirected away from
5Typical pressures are below 10−6 mbar.
56
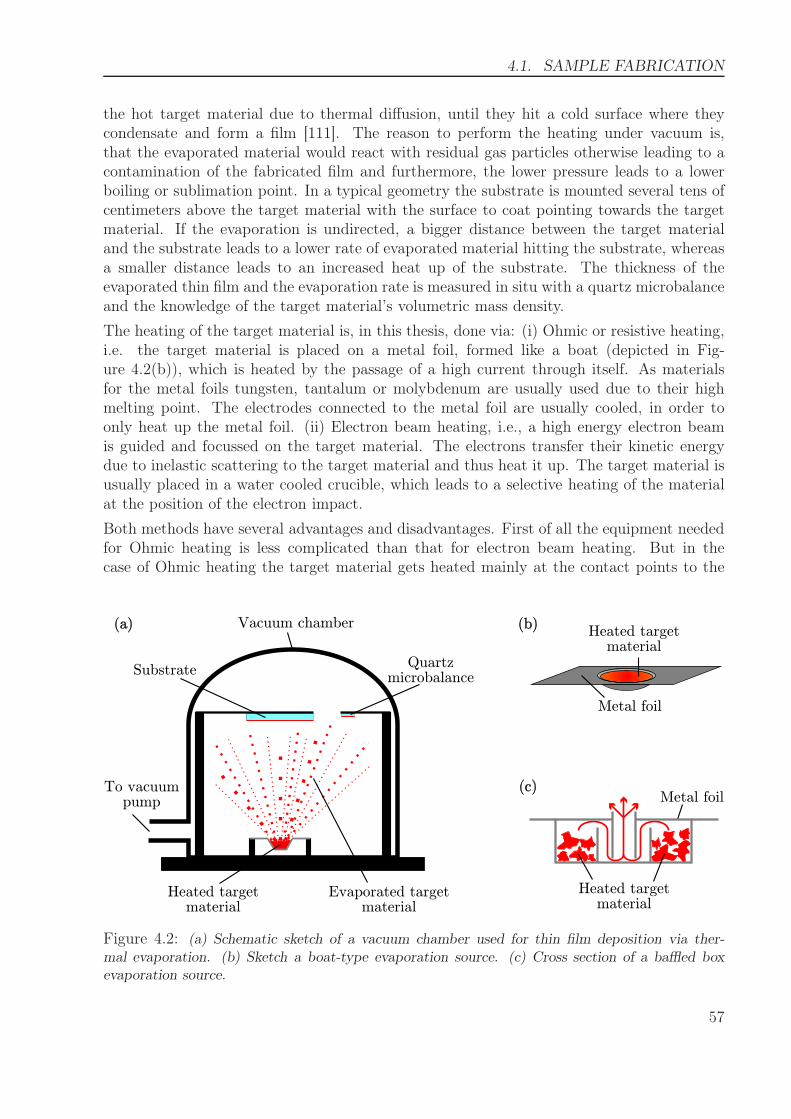
4.1. SAMPLE FABRICATION
the hot target material due to thermal diffusion, until they hit a cold surface where theycondensate and form a film [111]. The reason to perform the heating under vacuum is,that the evaporated material would react with residual gas particles otherwise leading to acontamination of the fabricated film and furthermore, the lower pressure leads to a lowerboiling or sublimation point. In a typical geometry the substrate is mounted several tens ofcentimeters above the target material with the surface to coat pointing towards the targetmaterial. If the evaporation is undirected, a bigger distance between the target materialand the substrate leads to a lower rate of evaporated material hitting the substrate, whereasa smaller distance leads to an increased heat up of the substrate. The thickness of theevaporated thin film and the evaporation rate is measured in situ with a quartz microbalanceand the knowledge of the target material’s volumetric mass density.
The heating of the target material is, in this thesis, done via: (i) Ohmic or resistive heating,i.e. the target material is placed on a metal foil, formed like a boat (depicted in Fig-ure 4.2(b)), which is heated by the passage of a high current through itself. As materialsfor the metal foils tungsten, tantalum or molybdenum are usually used due to their highmelting point. The electrodes connected to the metal foil are usually cooled, in order toonly heat up the metal foil. (ii) Electron beam heating, i.e., a high energy electron beamis guided and focussed on the target material. The electrons transfer their kinetic energydue to inelastic scattering to the target material and thus heat it up. The target material isusually placed in a water cooled crucible, which leads to a selective heating of the materialat the position of the electron impact.
Both methods have several advantages and disadvantages. First of all the equipment neededfor Ohmic heating is less complicated than that for electron beam heating. But in thecase of Ohmic heating the target material gets heated mainly at the contact points to the
To vacuumpump
Heated targetmaterial
Substrate Quartzmicrobalance
Evaporated targetmaterial
Vacuum chamber(a) (b)
(c)
Heated targetmaterial
Metal foil
Heated targetmaterial
Metal foil
Figure 4.2: (a) Schematic sketch of a vacuum chamber used for thin film deposition via ther-mal evaporation. (b) Sketch a boat-type evaporation source. (c) Cross section of a baffled boxevaporation source.
57
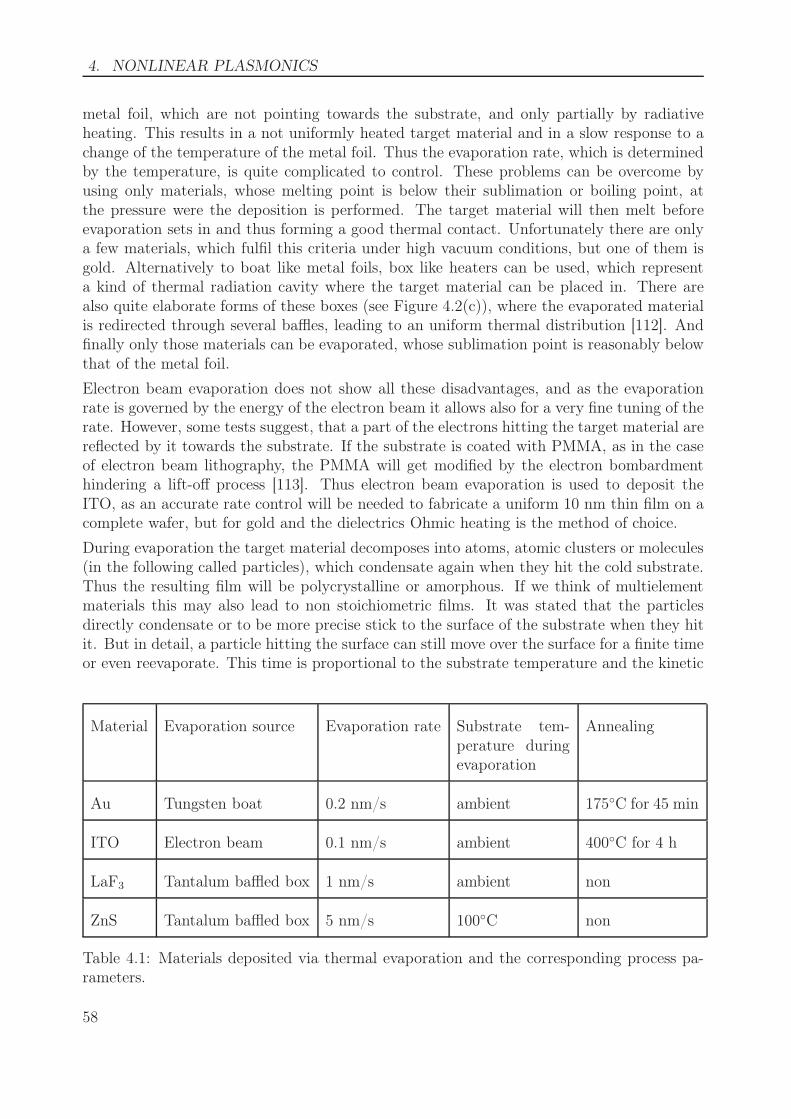
4. NONLINEAR PLASMONICS
metal foil, which are not pointing towards the substrate, and only partially by radiativeheating. This results in a not uniformly heated target material and in a slow response to achange of the temperature of the metal foil. Thus the evaporation rate, which is determinedby the temperature, is quite complicated to control. These problems can be overcome byusing only materials, whose melting point is below their sublimation or boiling point, atthe pressure were the deposition is performed. The target material will then melt beforeevaporation sets in and thus forming a good thermal contact. Unfortunately there are onlya few materials, which fulfil this criteria under high vacuum conditions, but one of them isgold. Alternatively to boat like metal foils, box like heaters can be used, which representa kind of thermal radiation cavity where the target material can be placed in. There arealso quite elaborate forms of these boxes (see Figure 4.2(c)), where the evaporated materialis redirected through several baffles, leading to an uniform thermal distribution [112]. Andfinally only those materials can be evaporated, whose sublimation point is reasonably belowthat of the metal foil.
Electron beam evaporation does not show all these disadvantages, and as the evaporationrate is governed by the energy of the electron beam it allows also for a very fine tuning of therate. However, some tests suggest, that a part of the electrons hitting the target material arereflected by it towards the substrate. If the substrate is coated with PMMA, as in the caseof electron beam lithography, the PMMA will get modified by the electron bombardmenthindering a lift-off process [113]. Thus electron beam evaporation is used to deposit theITO, as an accurate rate control will be needed to fabricate a uniform 10 nm thin film on acomplete wafer, but for gold and the dielectrics Ohmic heating is the method of choice.
During evaporation the target material decomposes into atoms, atomic clusters or molecules(in the following called particles), which condensate again when they hit the cold substrate.Thus the resulting film will be polycrystalline or amorphous. If we think of multielementmaterials this may also lead to non stoichiometric films. It was stated that the particlesdirectly condensate or to be more precise stick to the surface of the substrate when they hitit. But in detail, a particle hitting the surface can still move over the surface for a finite timeor even reevaporate. This time is proportional to the substrate temperature and the kinetic
Material Evaporation source Evaporation rate Substrate tem-perature duringevaporation
Annealing
Au Tungsten boat 0.2 nm/s ambient 175◦C for 45 min
ITO Electron beam 0.1 nm/s ambient 400◦C for 4 h
LaF3 Tantalum baffled box 1 nm/s ambient non
ZnS Tantalum baffled box 5 nm/s 100◦C non
Table 4.1: Materials deposited via thermal evaporation and the corresponding process pa-rameters.
58
4.1. SAMPLE FABRICATION
energy of the incoming particle [114]. If this time is sufficiently long for another particle tocollide with it these particle can interact and form a compound. Hence, a higher substratetemperature and evaporation rate will in general lead to a more crystalline film [115]. Insome cases the evaporated films can be also improved by a heat treatment following theevaporation. For example in the case of gold, the melting point will strongly decrease withdecreasing particle size, thus a heat treatment can lead to a smoothing of the evaporatedfilms [116]. In the case of oxides, evaporated films usually show a lack of oxide. This canbe also overcome by just annealing those films under normal air, as they will oxidise [117].Indeed, it is even possible to obtain thin metal oxide films by evaporating thin metal filmsand a subsequent oxidation procedure [118].
Finally, the appropriate parameters for the film deposition via thermal evaporation haveto be determined empirically and matched to the demands on the films to fabricate andthe available equipment. The relevant parameters for the deposition used in this thesis aregiven in the following Table 4.1.
59
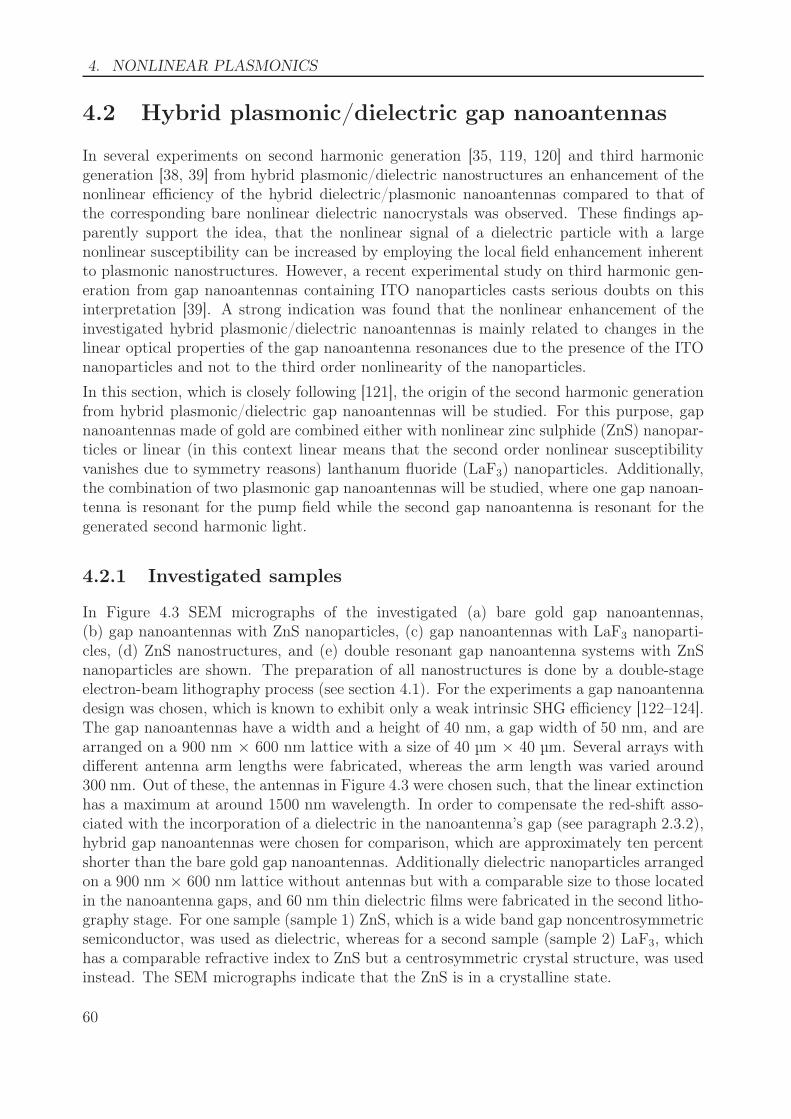
4. NONLINEAR PLASMONICS
4.2 Hybrid plasmonic/dielectric gap nanoantennas
In several experiments on second harmonic generation [35, 119, 120] and third harmonicgeneration [38, 39] from hybrid plasmonic/dielectric nanostructures an enhancement of thenonlinear efficiency of the hybrid dielectric/plasmonic nanoantennas compared to that ofthe corresponding bare nonlinear dielectric nanocrystals was observed. These findings ap-parently support the idea, that the nonlinear signal of a dielectric particle with a largenonlinear susceptibility can be increased by employing the local field enhancement inherentto plasmonic nanostructures. However, a recent experimental study on third harmonic gen-eration from gap nanoantennas containing ITO nanoparticles casts serious doubts on thisinterpretation [39]. A strong indication was found that the nonlinear enhancement of theinvestigated hybrid plasmonic/dielectric nanoantennas is mainly related to changes in thelinear optical properties of the gap nanoantenna resonances due to the presence of the ITOnanoparticles and not to the third order nonlinearity of the nanoparticles.
In this section, which is closely following [121], the origin of the second harmonic generationfrom hybrid plasmonic/dielectric gap nanoantennas will be studied. For this purpose, gapnanoantennas made of gold are combined either with nonlinear zinc sulphide (ZnS) nanopar-ticles or linear (in this context linear means that the second order nonlinear susceptibilityvanishes due to symmetry reasons) lanthanum fluoride (LaF3) nanoparticles. Additionally,the combination of two plasmonic gap nanoantennas will be studied, where one gap nanoan-tenna is resonant for the pump field while the second gap nanoantenna is resonant for thegenerated second harmonic light.
4.2.1 Investigated samples
In Figure 4.3 SEM micrographs of the investigated (a) bare gold gap nanoantennas,(b) gap nanoantennas with ZnS nanoparticles, (c) gap nanoantennas with LaF3 nanoparti-cles, (d) ZnS nanostructures, and (e) double resonant gap nanoantenna systems with ZnSnanoparticles are shown. The preparation of all nanostructures is done by a double-stageelectron-beam lithography process (see section 4.1). For the experiments a gap nanoantennadesign was chosen, which is known to exhibit only a weak intrinsic SHG efficiency [122–124].The gap nanoantennas have a width and a height of 40 nm, a gap width of 50 nm, and arearranged on a 900 nm × 600 nm lattice with a size of 40 µm × 40 µm. Several arrays withdifferent antenna arm lengths were fabricated, whereas the arm length was varied around300 nm. Out of these, the antennas in Figure 4.3 were chosen such, that the linear extinctionhas a maximum at around 1500 nm wavelength. In order to compensate the red-shift asso-ciated with the incorporation of a dielectric in the nanoantenna’s gap (see paragraph 2.3.2),hybrid gap nanoantennas were chosen for comparison, which are approximately ten percentshorter than the bare gold gap nanoantennas. Additionally dielectric nanoparticles arrangedon a 900 nm × 600 nm lattice without antennas but with a comparable size to those locatedin the nanoantenna gaps, and 60 nm thin dielectric films were fabricated in the second litho-graphy stage. For one sample (sample 1) ZnS, which is a wide band gap noncentrosymmetricsemiconductor, was used as dielectric, whereas for a second sample (sample 2) LaF3, whichhas a comparable refractive index to ZnS but a centrosymmetric crystal structure, was usedinstead. The SEM micrographs indicate that the ZnS is in a crystalline state.
60
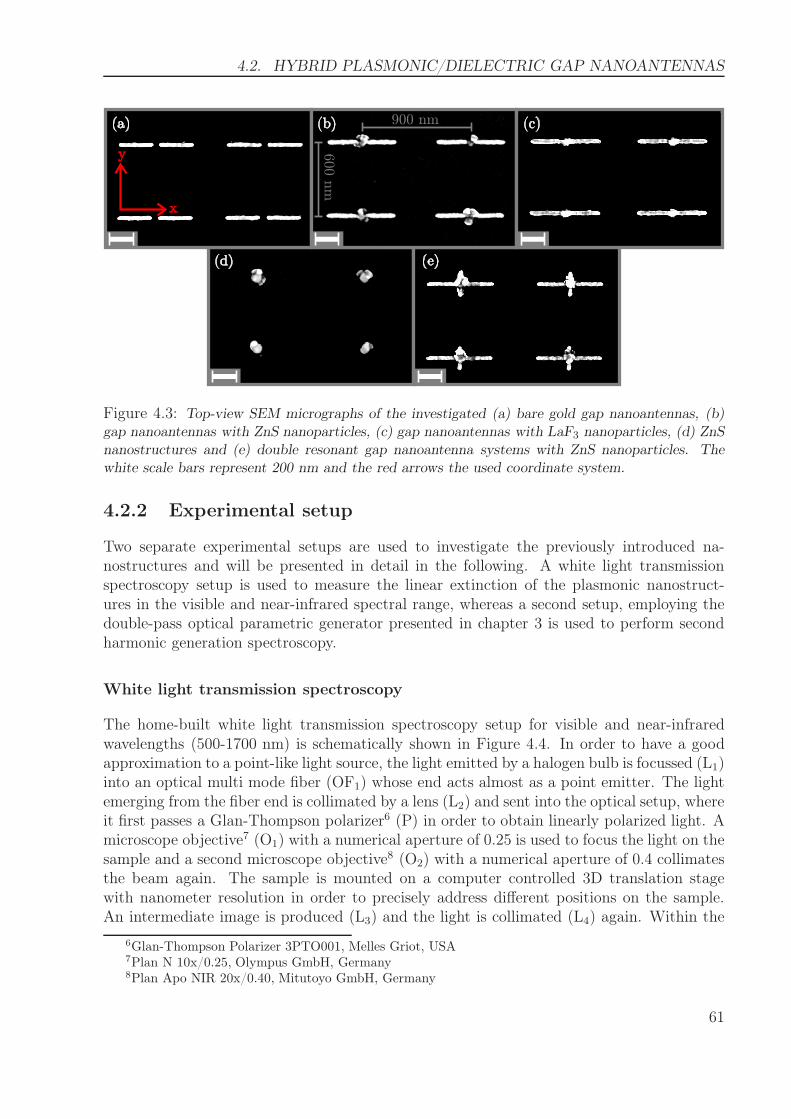
4.2. HYBRID PLASMONIC/DIELECTRIC GAP NANOANTENNAS
(d)
(a)
(e)
(b) (c)
y
x
900 nm
600 n
m
Figure 4.3: Top-view SEM micrographs of the investigated (a) bare gold gap nanoantennas, (b)gap nanoantennas with ZnS nanoparticles, (c) gap nanoantennas with LaF3 nanoparticles, (d) ZnSnanostructures and (e) double resonant gap nanoantenna systems with ZnS nanoparticles. Thewhite scale bars represent 200 nm and the red arrows the used coordinate system.
4.2.2 Experimental setup
Two separate experimental setups are used to investigate the previously introduced na-nostructures and will be presented in detail in the following. A white light transmissionspectroscopy setup is used to measure the linear extinction of the plasmonic nanostruct-ures in the visible and near-infrared spectral range, whereas a second setup, employing thedouble-pass optical parametric generator presented in chapter 3 is used to perform secondharmonic generation spectroscopy.
White light transmission spectroscopy
The home-built white light transmission spectroscopy setup for visible and near-infraredwavelengths (500-1700 nm) is schematically shown in Figure 4.4. In order to have a goodapproximation to a point-like light source, the light emitted by a halogen bulb is focussed (L1)into an optical multi mode fiber (OF1) whose end acts almost as a point emitter. The lightemerging from the fiber end is collimated by a lens (L2) and sent into the optical setup, whereit first passes a Glan-Thompson polarizer6 (P) in order to obtain linearly polarized light. Amicroscope objective7 (O1) with a numerical aperture of 0.25 is used to focus the light on thesample and a second microscope objective8 (O2) with a numerical aperture of 0.4 collimatesthe beam again. The sample is mounted on a computer controlled 3D translation stagewith nanometer resolution in order to precisely address different positions on the sample.An intermediate image is produced (L3) and the light is collimated (L4) again. Within the
6Glan-Thompson Polarizer 3PTO001, Melles Griot, USA7Plan N 10x/0.25, Olympus GmbH, Germany8Plan Apo NIR 20x/0.40, Mitutoyo GmbH, Germany
61
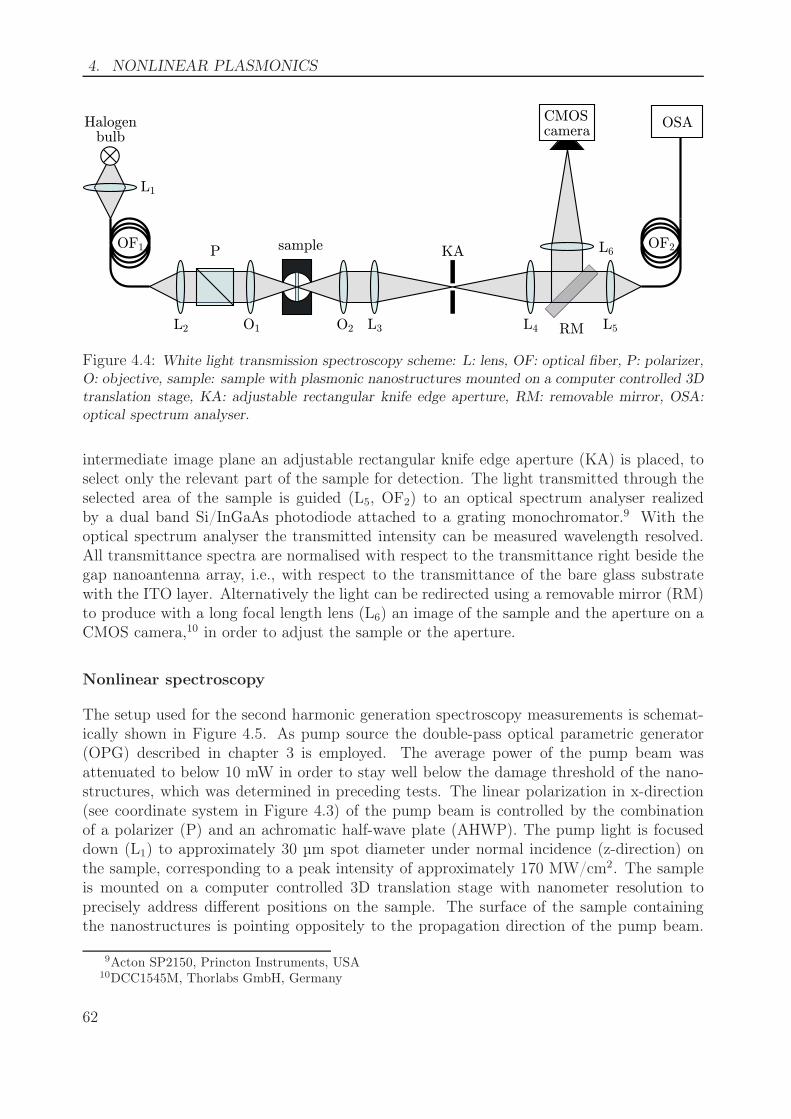
4. NONLINEAR PLASMONICS
sample
CMOScamera
OSAHalogenbulb
O1 O2 L3L2 L4 L5
L6
L1
RM
KAOF1 OF2P
Figure 4.4: White light transmission spectroscopy scheme: L: lens, OF: optical fiber, P: polarizer,O: objective, sample: sample with plasmonic nanostructures mounted on a computer controlled 3Dtranslation stage, KA: adjustable rectangular knife edge aperture, RM: removable mirror, OSA:optical spectrum analyser.
intermediate image plane an adjustable rectangular knife edge aperture (KA) is placed, toselect only the relevant part of the sample for detection. The light transmitted through theselected area of the sample is guided (L5, OF2) to an optical spectrum analyser realizedby a dual band Si/InGaAs photodiode attached to a grating monochromator.9 With theoptical spectrum analyser the transmitted intensity can be measured wavelength resolved.All transmittance spectra are normalised with respect to the transmittance right beside thegap nanoantenna array, i.e., with respect to the transmittance of the bare glass substratewith the ITO layer. Alternatively the light can be redirected using a removable mirror (RM)to produce with a long focal length lens (L6) an image of the sample and the aperture on aCMOS camera,10 in order to adjust the sample or the aperture.
Nonlinear spectroscopy
The setup used for the second harmonic generation spectroscopy measurements is schemat-ically shown in Figure 4.5. As pump source the double-pass optical parametric generator(OPG) described in chapter 3 is employed. The average power of the pump beam wasattenuated to below 10 mW in order to stay well below the damage threshold of the nano-structures, which was determined in preceding tests. The linear polarization in x-direction(see coordinate system in Figure 4.3) of the pump beam is controlled by the combinationof a polarizer (P) and an achromatic half-wave plate (AHWP). The pump light is focuseddown (L1) to approximately 30 µm spot diameter under normal incidence (z-direction) onthe sample, corresponding to a peak intensity of approximately 170 MW/cm2. The sampleis mounted on a computer controlled 3D translation stage with nanometer resolution toprecisely address different positions on the sample. The surface of the sample containingthe nanostructures is pointing oppositely to the propagation direction of the pump beam.
9Acton SP2150, Princton Instruments, USA10DCC1545M, Thorlabs GmbH, Germany
62
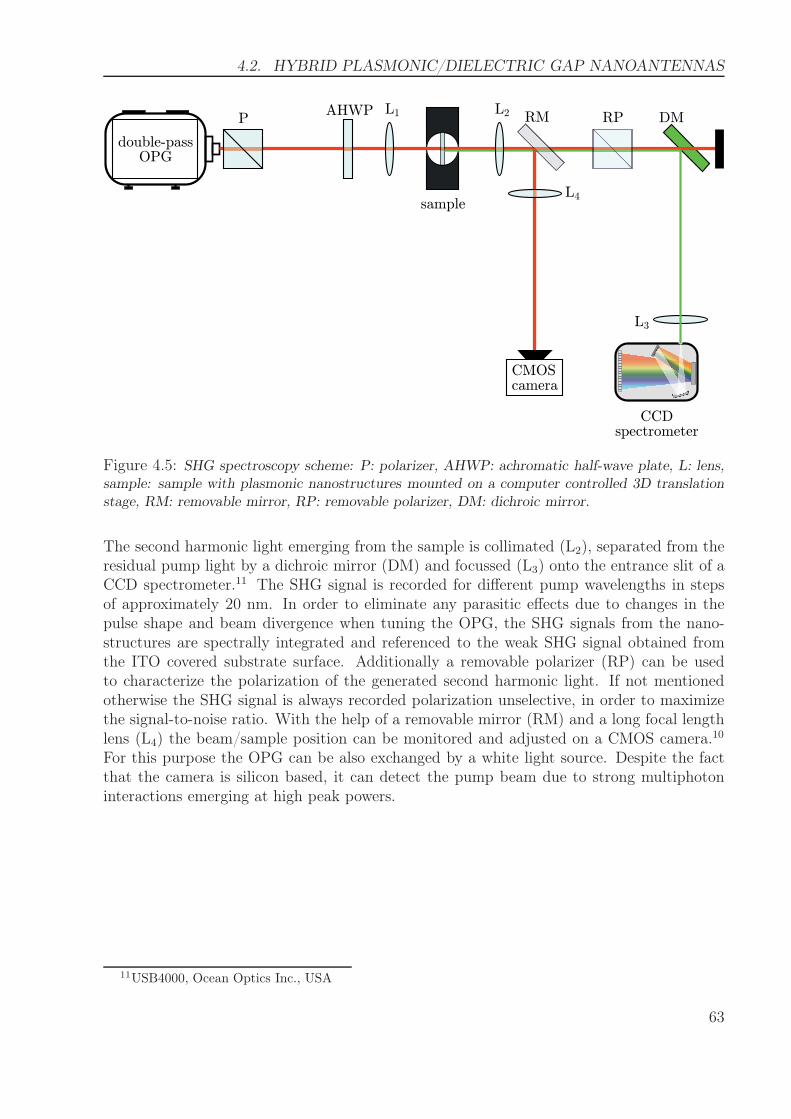
4.2. HYBRID PLASMONIC/DIELECTRIC GAP NANOANTENNAS
double-passOPG
DML1 L2
sample
L3
CCDspectrometer
CMOScamera
RM
L4
P RPAHWP
Figure 4.5: SHG spectroscopy scheme: P: polarizer, AHWP: achromatic half-wave plate, L: lens,sample: sample with plasmonic nanostructures mounted on a computer controlled 3D translationstage, RM: removable mirror, RP: removable polarizer, DM: dichroic mirror.
The second harmonic light emerging from the sample is collimated (L2), separated from theresidual pump light by a dichroic mirror (DM) and focussed (L3) onto the entrance slit of aCCD spectrometer.11 The SHG signal is recorded for different pump wavelengths in stepsof approximately 20 nm. In order to eliminate any parasitic effects due to changes in thepulse shape and beam divergence when tuning the OPG, the SHG signals from the nano-structures are spectrally integrated and referenced to the weak SHG signal obtained fromthe ITO covered substrate surface. Additionally a removable polarizer (RP) can be usedto characterize the polarization of the generated second harmonic light. If not mentionedotherwise the SHG signal is always recorded polarization unselective, in order to maximizethe signal-to-noise ratio. With the help of a removable mirror (RM) and a long focal lengthlens (L4) the beam/sample position can be monitored and adjusted on a CMOS camera.10
For this purpose the OPG can be also exchanged by a white light source. Despite the factthat the camera is silicon based, it can detect the pump beam due to strong multiphotoninteractions emerging at high peak powers.
11USB4000, Ocean Optics Inc., USA
63
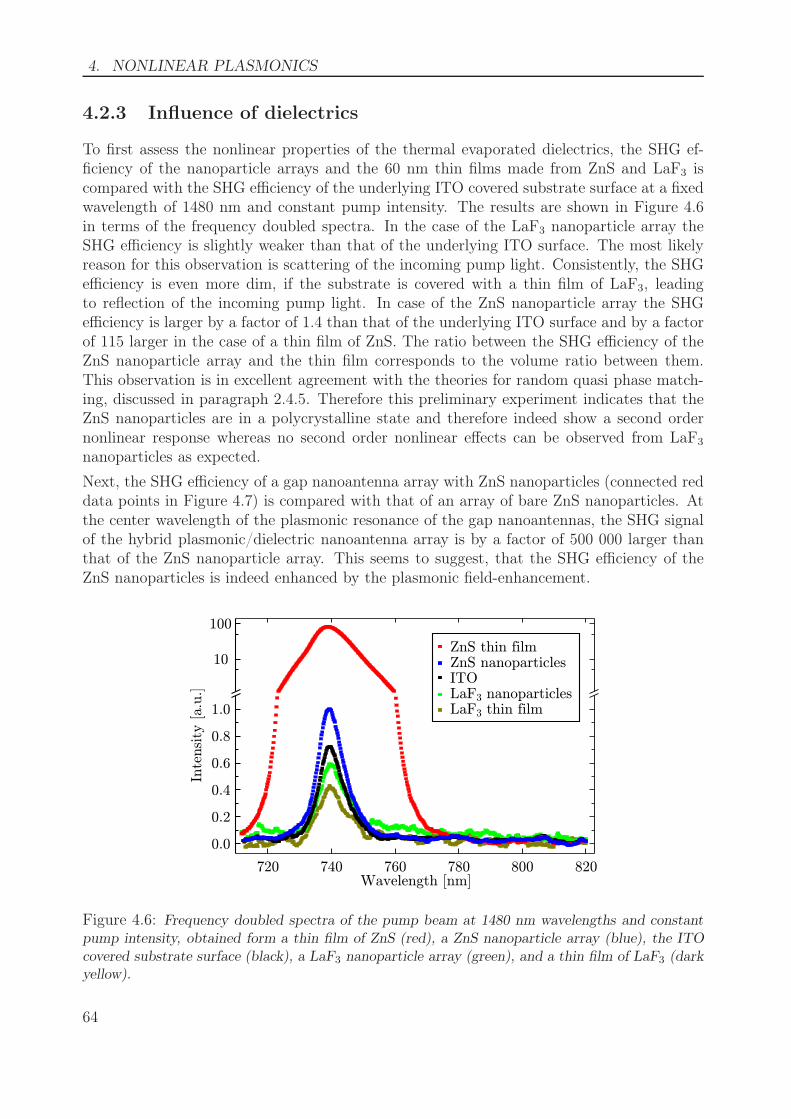
4. NONLINEAR PLASMONICS
4.2.3 Influence of dielectrics
To first assess the nonlinear properties of the thermal evaporated dielectrics, the SHG ef-ficiency of the nanoparticle arrays and the 60 nm thin films made from ZnS and LaF3 iscompared with the SHG efficiency of the underlying ITO covered substrate surface at a fixedwavelength of 1480 nm and constant pump intensity. The results are shown in Figure 4.6in terms of the frequency doubled spectra. In the case of the LaF3 nanoparticle array theSHG efficiency is slightly weaker than that of the underlying ITO surface. The most likelyreason for this observation is scattering of the incoming pump light. Consistently, the SHGefficiency is even more dim, if the substrate is covered with a thin film of LaF3, leadingto reflection of the incoming pump light. In case of the ZnS nanoparticle array the SHGefficiency is larger by a factor of 1.4 than that of the underlying ITO surface and by a factorof 115 larger in the case of a thin film of ZnS. The ratio between the SHG efficiency of theZnS nanoparticle array and the thin film corresponds to the volume ratio between them.This observation is in excellent agreement with the theories for random quasi phase match-ing, discussed in paragraph 2.4.5. Therefore this preliminary experiment indicates that theZnS nanoparticles are in a polycrystalline state and therefore indeed show a second ordernonlinear response whereas no second order nonlinear effects can be observed from LaF3
nanoparticles as expected.
Next, the SHG efficiency of a gap nanoantenna array with ZnS nanoparticles (connected reddata points in Figure 4.7) is compared with that of an array of bare ZnS nanoparticles. Atthe center wavelength of the plasmonic resonance of the gap nanoantennas, the SHG signalof the hybrid plasmonic/dielectric nanoantenna array is by a factor of 500 000 larger thanthat of the ZnS nanoparticle array. This seems to suggest, that the SHG efficiency of theZnS nanoparticles is indeed enhanced by the plasmonic field-enhancement.
0.0
0.2
0.4
0.6
0.8
1.0
10
100
Inte
nsi
ty [a.u
.]
720 740 760 780 800 820Wavelength [nm]
LaF3 thin filmLaF3 nanoparticlesITO
ZnS thin filmZnS nanoparticles
Figure 4.6: Frequency doubled spectra of the pump beam at 1480 nm wavelengths and constantpump intensity, obtained form a thin film of ZnS (red), a ZnS nanoparticle array (blue), the ITOcovered substrate surface (black), a LaF3 nanoparticle array (green), and a thin film of LaF3 (darkyellow).
64
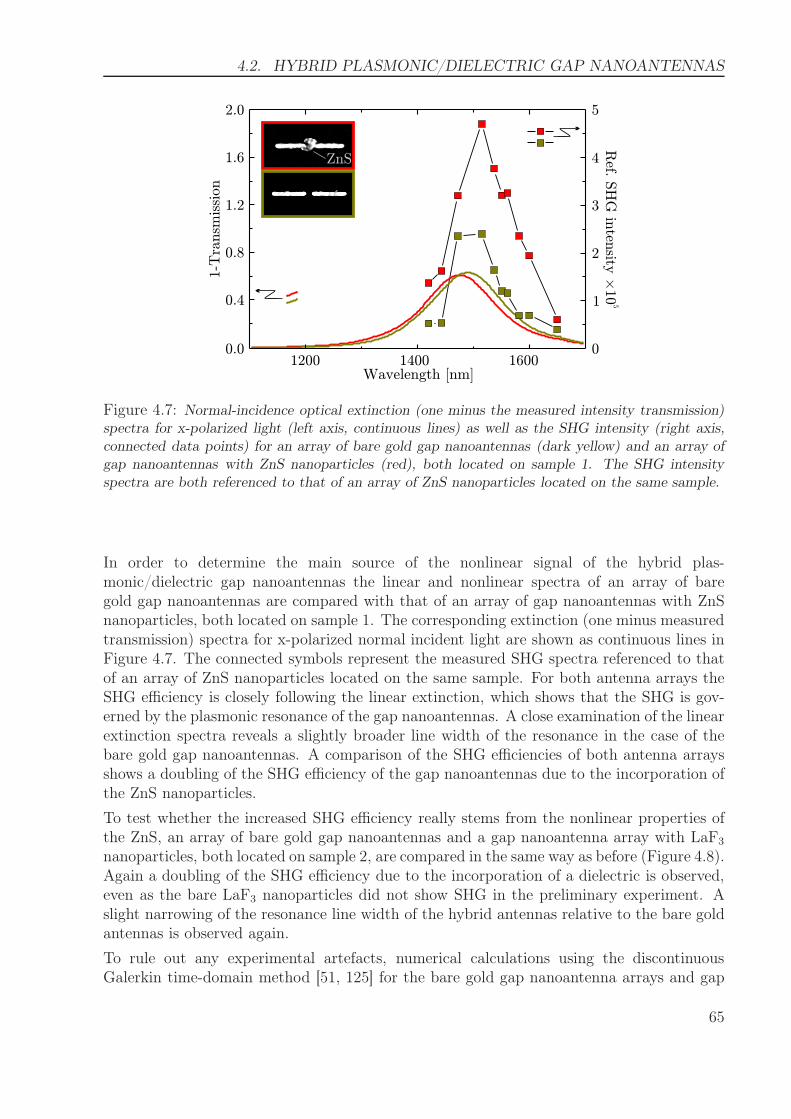
4.2. HYBRID PLASMONIC/DIELECTRIC GAP NANOANTENNAS
5
4
2
3
1
01200 1400 1600
Wavelength [nm]
0.0
0.4
0.8
1.2
1.6
2.0
1-T
ransm
issi
on
Ref. S
HG
inten
sity10
£5
ZnS
Figure 4.7: Normal-incidence optical extinction (one minus the measured intensity transmission)spectra for x-polarized light (left axis, continuous lines) as well as the SHG intensity (right axis,connected data points) for an array of bare gold gap nanoantennas (dark yellow) and an array ofgap nanoantennas with ZnS nanoparticles (red), both located on sample 1. The SHG intensityspectra are both referenced to that of an array of ZnS nanoparticles located on the same sample.
In order to determine the main source of the nonlinear signal of the hybrid plas-monic/dielectric gap nanoantennas the linear and nonlinear spectra of an array of baregold gap nanoantennas are compared with that of an array of gap nanoantennas with ZnSnanoparticles, both located on sample 1. The corresponding extinction (one minus measuredtransmission) spectra for x-polarized normal incident light are shown as continuous lines inFigure 4.7. The connected symbols represent the measured SHG spectra referenced to thatof an array of ZnS nanoparticles located on the same sample. For both antenna arrays theSHG efficiency is closely following the linear extinction, which shows that the SHG is gov-erned by the plasmonic resonance of the gap nanoantennas. A close examination of the linearextinction spectra reveals a slightly broader line width of the resonance in the case of thebare gold gap nanoantennas. A comparison of the SHG efficiencies of both antenna arraysshows a doubling of the SHG efficiency of the gap nanoantennas due to the incorporation ofthe ZnS nanoparticles.
To test whether the increased SHG efficiency really stems from the nonlinear properties ofthe ZnS, an array of bare gold gap nanoantennas and a gap nanoantenna array with LaF3
nanoparticles, both located on sample 2, are compared in the same way as before (Figure 4.8).Again a doubling of the SHG efficiency due to the incorporation of a dielectric is observed,even as the bare LaF3 nanoparticles did not show SHG in the preliminary experiment. Aslight narrowing of the resonance line width of the hybrid antennas relative to the bare goldantennas is observed again.
To rule out any experimental artefacts, numerical calculations using the discontinuousGalerkin time-domain method [51, 125] for the bare gold gap nanoantenna arrays and gap
65
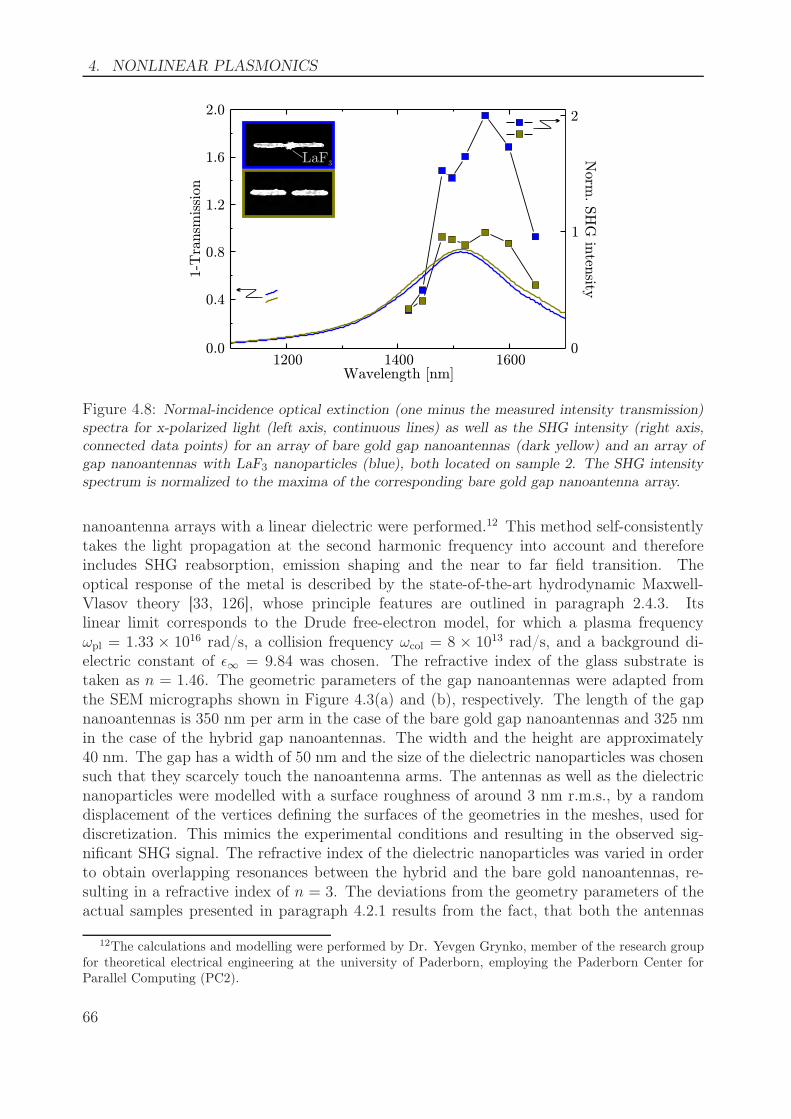
4. NONLINEAR PLASMONICS
0
2
1
Norm
. SH
G in
tensity
LaF3
1200 1400 1600Wavelength [nm]
0.0
0.4
0.8
1.2
1.6
2.0
1-T
ransm
issi
on
Figure 4.8: Normal-incidence optical extinction (one minus the measured intensity transmission)spectra for x-polarized light (left axis, continuous lines) as well as the SHG intensity (right axis,connected data points) for an array of bare gold gap nanoantennas (dark yellow) and an array ofgap nanoantennas with LaF3 nanoparticles (blue), both located on sample 2. The SHG intensityspectrum is normalized to the maxima of the corresponding bare gold gap nanoantenna array.
nanoantenna arrays with a linear dielectric were performed.12 This method self-consistentlytakes the light propagation at the second harmonic frequency into account and thereforeincludes SHG reabsorption, emission shaping and the near to far field transition. Theoptical response of the metal is described by the state-of-the-art hydrodynamic Maxwell-Vlasov theory [33, 126], whose principle features are outlined in paragraph 2.4.3. Itslinear limit corresponds to the Drude free-electron model, for which a plasma frequencyωpl = 1.33 × 10¹⁶ rad/s, a collision frequency ωcol = 8 × 10¹³ rad/s, and a background di-electric constant of ǫ∞ = 9.84 was chosen. The refractive index of the glass substrate istaken as n = 1.46. The geometric parameters of the gap nanoantennas were adapted fromthe SEM micrographs shown in Figure 4.3(a) and (b), respectively. The length of the gapnanoantennas is 350 nm per arm in the case of the bare gold gap nanoantennas and 325 nmin the case of the hybrid gap nanoantennas. The width and the height are approximately40 nm. The gap has a width of 50 nm and the size of the dielectric nanoparticles was chosensuch that they scarcely touch the nanoantenna arms. The antennas as well as the dielectricnanoparticles were modelled with a surface roughness of around 3 nm r.m.s., by a randomdisplacement of the vertices defining the surfaces of the geometries in the meshes, used fordiscretization. This mimics the experimental conditions and resulting in the observed sig-nificant SHG signal. The refractive index of the dielectric nanoparticles was varied in orderto obtain overlapping resonances between the hybrid and the bare gold nanoantennas, re-sulting in a refractive index of n = 3. The deviations from the geometry parameters of theactual samples presented in paragraph 4.2.1 results from the fact, that both the antennas
12The calculations and modelling were performed by Dr. Yevgen Grynko, member of the research groupfor theoretical electrical engineering at the university of Paderborn, employing the Paderborn Center forParallel Computing (PC2).
66
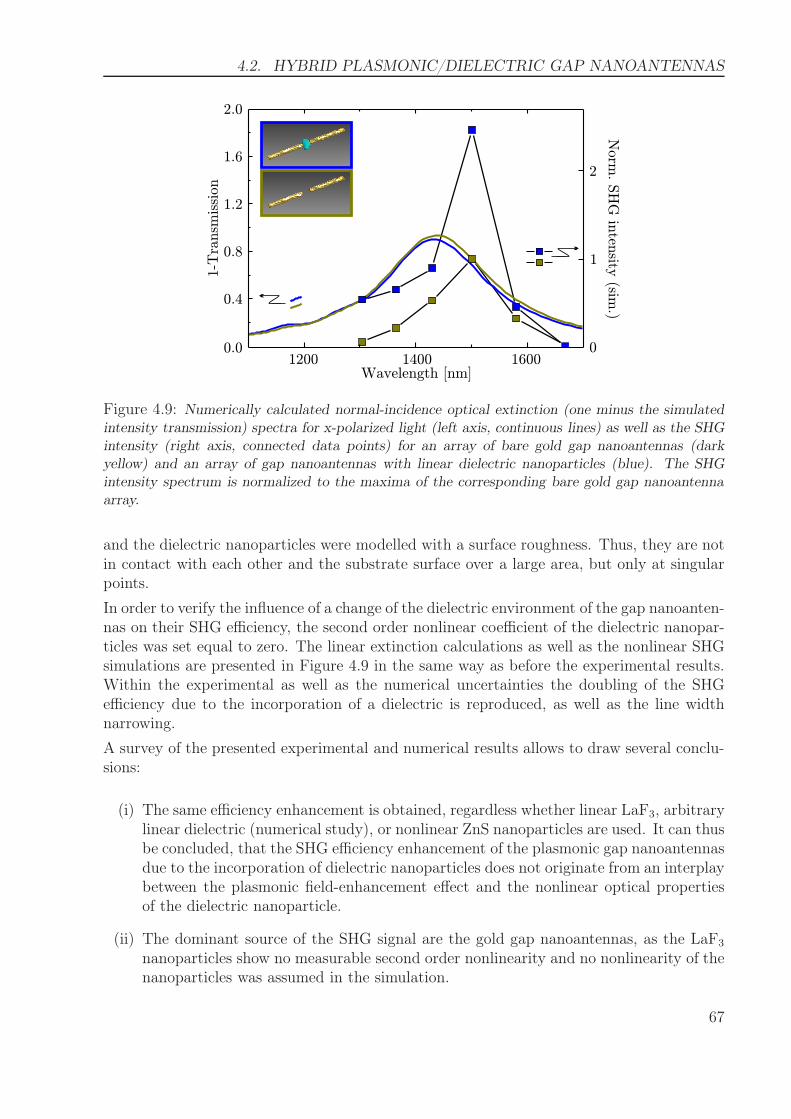
4.2. HYBRID PLASMONIC/DIELECTRIC GAP NANOANTENNAS
0
2
1
Norm
. SH
G in
tensity
(sim.)
1200 1400 1600Wavelength [nm]
0.0
0.4
0.8
1.2
1.6
2.0
1-T
ransm
issi
on
Figure 4.9: Numerically calculated normal-incidence optical extinction (one minus the simulatedintensity transmission) spectra for x-polarized light (left axis, continuous lines) as well as the SHGintensity (right axis, connected data points) for an array of bare gold gap nanoantennas (darkyellow) and an array of gap nanoantennas with linear dielectric nanoparticles (blue). The SHGintensity spectrum is normalized to the maxima of the corresponding bare gold gap nanoantennaarray.
and the dielectric nanoparticles were modelled with a surface roughness. Thus, they are notin contact with each other and the substrate surface over a large area, but only at singularpoints.
In order to verify the influence of a change of the dielectric environment of the gap nanoanten-nas on their SHG efficiency, the second order nonlinear coefficient of the dielectric nanopar-ticles was set equal to zero. The linear extinction calculations as well as the nonlinear SHGsimulations are presented in Figure 4.9 in the same way as before the experimental results.Within the experimental as well as the numerical uncertainties the doubling of the SHGefficiency due to the incorporation of a dielectric is reproduced, as well as the line widthnarrowing.
A survey of the presented experimental and numerical results allows to draw several conclu-sions:
(i) The same efficiency enhancement is obtained, regardless whether linear LaF3, arbitrarylinear dielectric (numerical study), or nonlinear ZnS nanoparticles are used. It can thusbe concluded, that the SHG efficiency enhancement of the plasmonic gap nanoantennasdue to the incorporation of dielectric nanoparticles does not originate from an interplaybetween the plasmonic field-enhancement effect and the nonlinear optical propertiesof the dielectric nanoparticle.
(ii) The dominant source of the SHG signal are the gold gap nanoantennas, as the LaF3
nanoparticles show no measurable second order nonlinearity and no nonlinearity of thenanoparticles was assumed in the simulation.
67
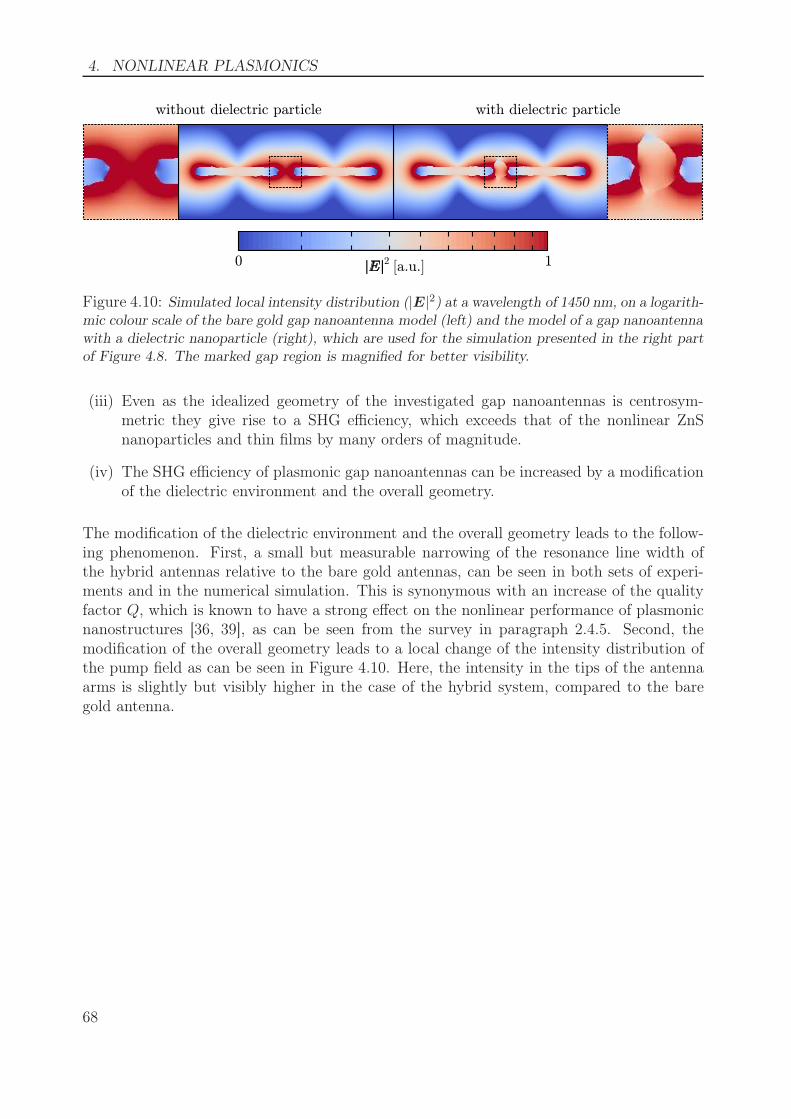
4. NONLINEAR PLASMONICS
| |2 [a.u.]E0 1
without dielectric particle with dielectric particle
Figure 4.10: Simulated local intensity distribution (|E|2) at a wavelength of 1450 nm, on a logarith-mic colour scale of the bare gold gap nanoantenna model (left) and the model of a gap nanoantennawith a dielectric nanoparticle (right), which are used for the simulation presented in the right partof Figure 4.8. The marked gap region is magnified for better visibility.
(iii) Even as the idealized geometry of the investigated gap nanoantennas is centrosym-metric they give rise to a SHG efficiency, which exceeds that of the nonlinear ZnSnanoparticles and thin films by many orders of magnitude.
(iv) The SHG efficiency of plasmonic gap nanoantennas can be increased by a modificationof the dielectric environment and the overall geometry.
The modification of the dielectric environment and the overall geometry leads to the follow-ing phenomenon. First, a small but measurable narrowing of the resonance line width ofthe hybrid antennas relative to the bare gold antennas, can be seen in both sets of experi-ments and in the numerical simulation. This is synonymous with an increase of the qualityfactor Q, which is known to have a strong effect on the nonlinear performance of plasmonicnanostructures [36, 39], as can be seen from the survey in paragraph 2.4.5. Second, themodification of the overall geometry leads to a local change of the intensity distribution ofthe pump field as can be seen in Figure 4.10. Here, the intensity in the tips of the antennaarms is slightly but visibly higher in the case of the hybrid system, compared to the baregold antenna.
68
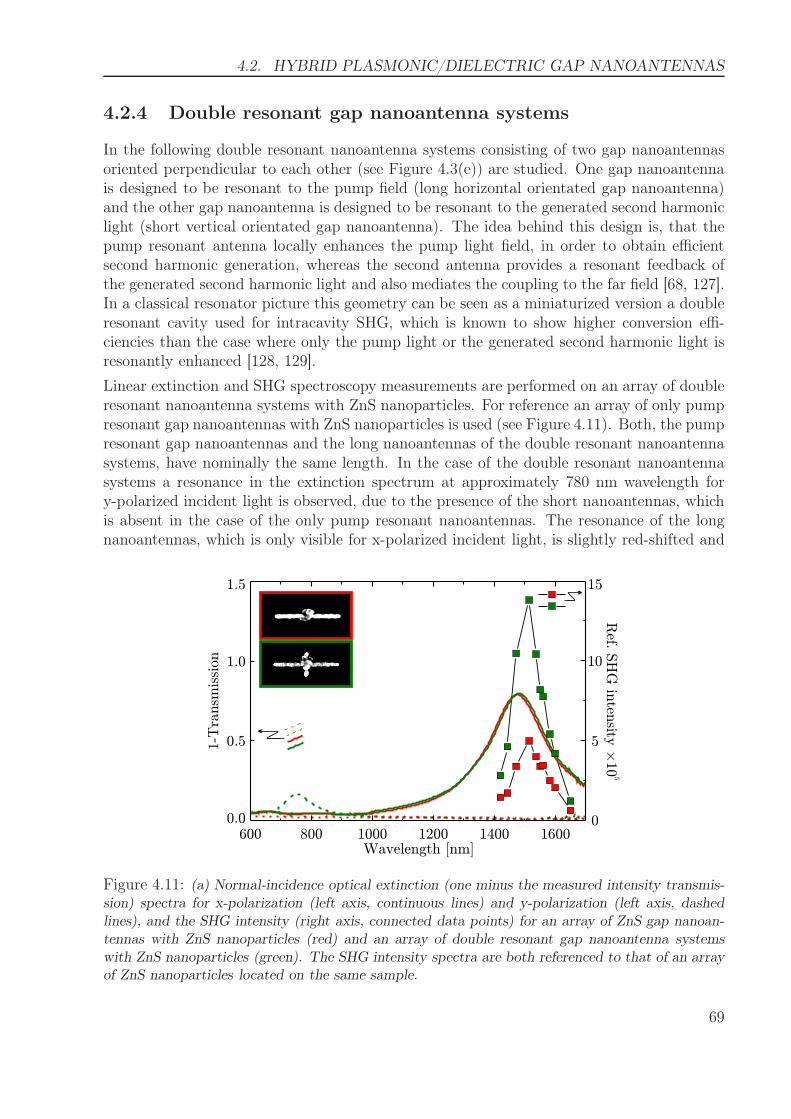
4.2. HYBRID PLASMONIC/DIELECTRIC GAP NANOANTENNAS
4.2.4 Double resonant gap nanoantenna systems
In the following double resonant nanoantenna systems consisting of two gap nanoantennasoriented perpendicular to each other (see Figure 4.3(e)) are studied. One gap nanoantennais designed to be resonant to the pump field (long horizontal orientated gap nanoantenna)and the other gap nanoantenna is designed to be resonant to the generated second harmoniclight (short vertical orientated gap nanoantenna). The idea behind this design is, that thepump resonant antenna locally enhances the pump light field, in order to obtain efficientsecond harmonic generation, whereas the second antenna provides a resonant feedback ofthe generated second harmonic light and also mediates the coupling to the far field [68, 127].In a classical resonator picture this geometry can be seen as a miniaturized version a doubleresonant cavity used for intracavity SHG, which is known to show higher conversion effi-ciencies than the case where only the pump light or the generated second harmonic light isresonantly enhanced [128, 129].
Linear extinction and SHG spectroscopy measurements are performed on an array of doubleresonant nanoantenna systems with ZnS nanoparticles. For reference an array of only pumpresonant gap nanoantennas with ZnS nanoparticles is used (see Figure 4.11). Both, the pumpresonant gap nanoantennas and the long nanoantennas of the double resonant nanoantennasystems, have nominally the same length. In the case of the double resonant nanoantennasystems a resonance in the extinction spectrum at approximately 780 nm wavelength fory-polarized incident light is observed, due to the presence of the short nanoantennas, whichis absent in the case of the only pump resonant nanoantennas. The resonance of the longnanoantennas, which is only visible for x-polarized incident light, is slightly red-shifted and
0.0
0.5
1.5
1-T
ransm
issi
on
1600140012001000800600Wavelength [nm]
1.0
0
5
10
15
Ref. S
HG
inten
sity10
£5
Figure 4.11: (a) Normal-incidence optical extinction (one minus the measured intensity transmis-sion) spectra for x-polarization (left axis, continuous lines) and y-polarization (left axis, dashedlines), and the SHG intensity (right axis, connected data points) for an array of ZnS gap nanoan-tennas with ZnS nanoparticles (red) and an array of double resonant gap nanoantenna systemswith ZnS nanoparticles (green). The SHG intensity spectra are both referenced to that of an arrayof ZnS nanoparticles located on the same sample.
69
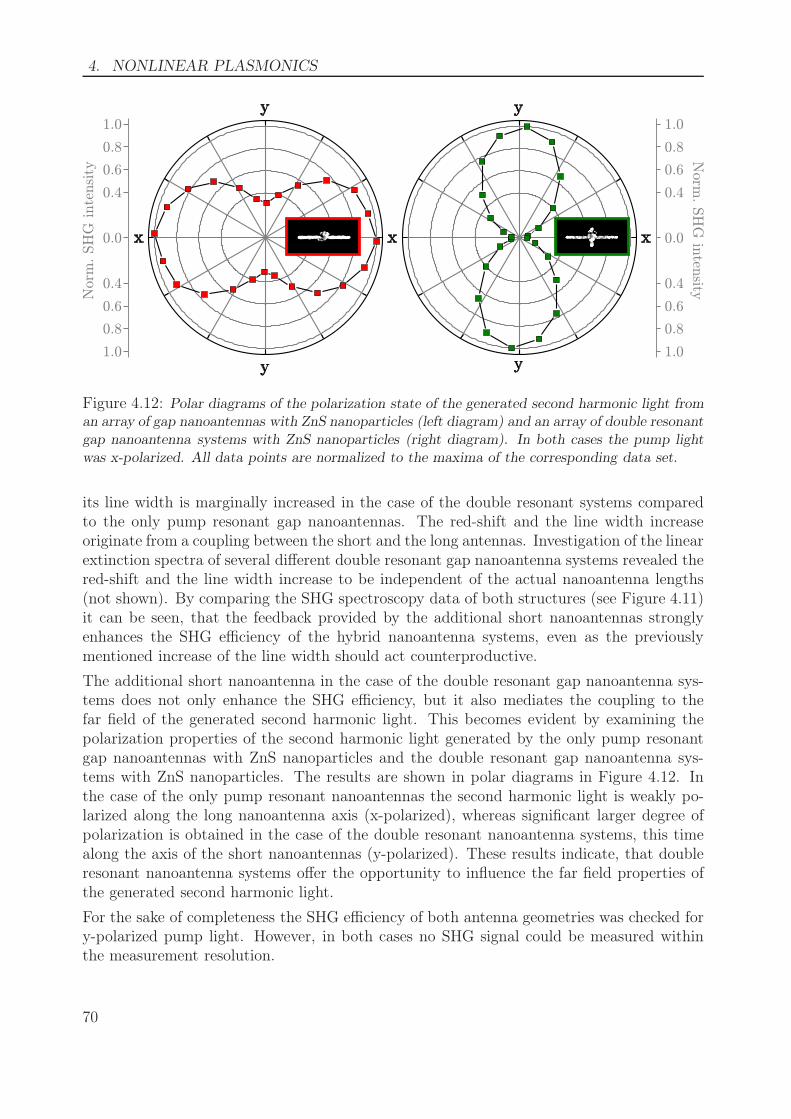
4. NONLINEAR PLASMONICS
1.0
0.8
0.6
0.4
0.0
0.4
0.6
0.8
1.0
Norm
. SH
G inte
nsi
ty
y
x
y
xx
y
y
1.0
0.8
0.6
0.4
0.0
0.4
0.6
0.8
1.0
Norm
. SH
G in
tensity
Figure 4.12: Polar diagrams of the polarization state of the generated second harmonic light froman array of gap nanoantennas with ZnS nanoparticles (left diagram) and an array of double resonantgap nanoantenna systems with ZnS nanoparticles (right diagram). In both cases the pump lightwas x-polarized. All data points are normalized to the maxima of the corresponding data set.
its line width is marginally increased in the case of the double resonant systems comparedto the only pump resonant gap nanoantennas. The red-shift and the line width increaseoriginate from a coupling between the short and the long antennas. Investigation of the linearextinction spectra of several different double resonant gap nanoantenna systems revealed thered-shift and the line width increase to be independent of the actual nanoantenna lengths(not shown). By comparing the SHG spectroscopy data of both structures (see Figure 4.11)it can be seen, that the feedback provided by the additional short nanoantennas stronglyenhances the SHG efficiency of the hybrid nanoantenna systems, even as the previouslymentioned increase of the line width should act counterproductive.
The additional short nanoantenna in the case of the double resonant gap nanoantenna sys-tems does not only enhance the SHG efficiency, but it also mediates the coupling to thefar field of the generated second harmonic light. This becomes evident by examining thepolarization properties of the second harmonic light generated by the only pump resonantgap nanoantennas with ZnS nanoparticles and the double resonant gap nanoantenna sys-tems with ZnS nanoparticles. The results are shown in polar diagrams in Figure 4.12. Inthe case of the only pump resonant nanoantennas the second harmonic light is weakly po-larized along the long nanoantenna axis (x-polarized), whereas significant larger degree ofpolarization is obtained in the case of the double resonant nanoantenna systems, this timealong the axis of the short nanoantennas (y-polarized). These results indicate, that doubleresonant nanoantenna systems offer the opportunity to influence the far field properties ofthe generated second harmonic light.
For the sake of completeness the SHG efficiency of both antenna geometries was checked fory-polarized pump light. However, in both cases no SHG signal could be measured withinthe measurement resolution.
70
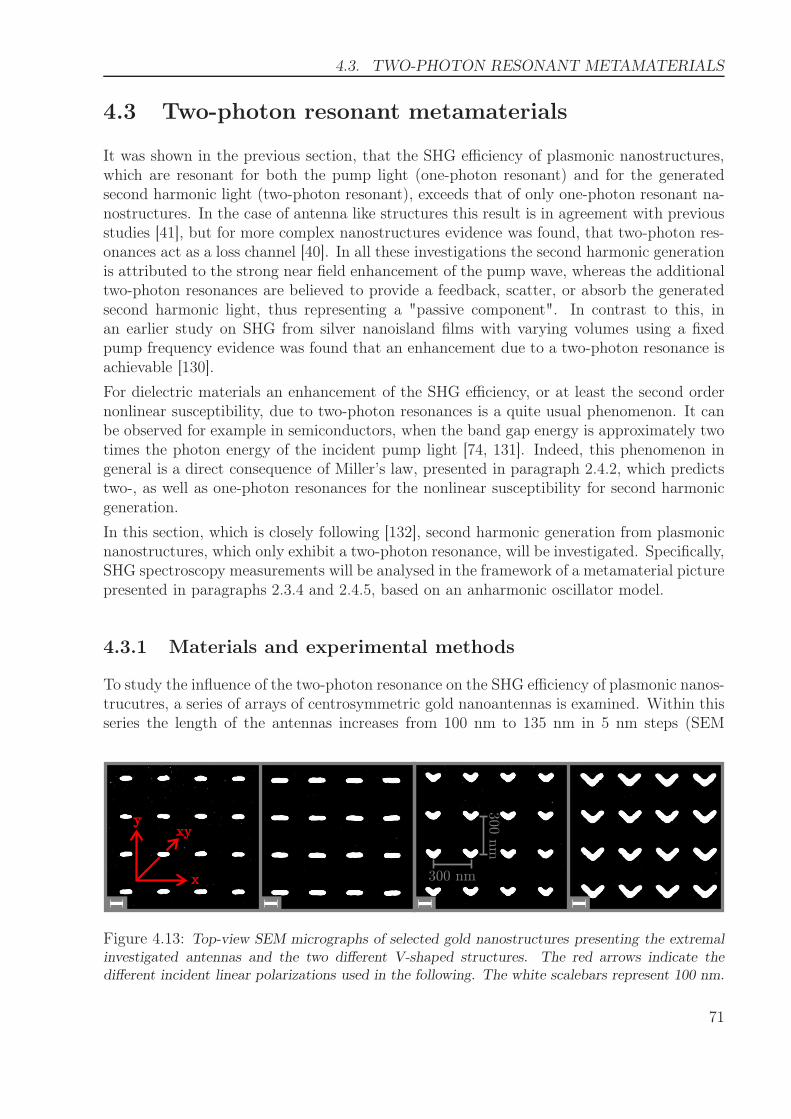
4.3. TWO-PHOTON RESONANT METAMATERIALS
4.3 Two-photon resonant metamaterials
It was shown in the previous section, that the SHG efficiency of plasmonic nanostructures,which are resonant for both the pump light (one-photon resonant) and for the generatedsecond harmonic light (two-photon resonant), exceeds that of only one-photon resonant na-nostructures. In the case of antenna like structures this result is in agreement with previousstudies [41], but for more complex nanostructures evidence was found, that two-photon res-onances act as a loss channel [40]. In all these investigations the second harmonic generationis attributed to the strong near field enhancement of the pump wave, whereas the additionaltwo-photon resonances are believed to provide a feedback, scatter, or absorb the generatedsecond harmonic light, thus representing a "passive component". In contrast to this, inan earlier study on SHG from silver nanoisland films with varying volumes using a fixedpump frequency evidence was found that an enhancement due to a two-photon resonance isachievable [130].
For dielectric materials an enhancement of the SHG efficiency, or at least the second ordernonlinear susceptibility, due to two-photon resonances is a quite usual phenomenon. It canbe observed for example in semiconductors, when the band gap energy is approximately twotimes the photon energy of the incident pump light [74, 131]. Indeed, this phenomenon ingeneral is a direct consequence of Miller’s law, presented in paragraph 2.4.2, which predictstwo-, as well as one-photon resonances for the nonlinear susceptibility for second harmonicgeneration.
In this section, which is closely following [132], second harmonic generation from plasmonicnanostructures, which only exhibit a two-photon resonance, will be investigated. Specifically,SHG spectroscopy measurements will be analysed in the framework of a metamaterial picturepresented in paragraphs 2.3.4 and 2.4.5, based on an anharmonic oscillator model.
4.3.1 Materials and experimental methods
To study the influence of the two-photon resonance on the SHG efficiency of plasmonic nanos-trucutres, a series of arrays of centrosymmetric gold nanoantennas is examined. Within thisseries the length of the antennas increases from 100 nm to 135 nm in 5 nm steps (SEM
y
x
xy
300 nm
300 nm
Figure 4.13: Top-view SEM micrographs of selected gold nanostructures presenting the extremalinvestigated antennas and the two different V-shaped structures. The red arrows indicate thedifferent incident linear polarizations used in the following. The white scalebars represent 100 nm.
71
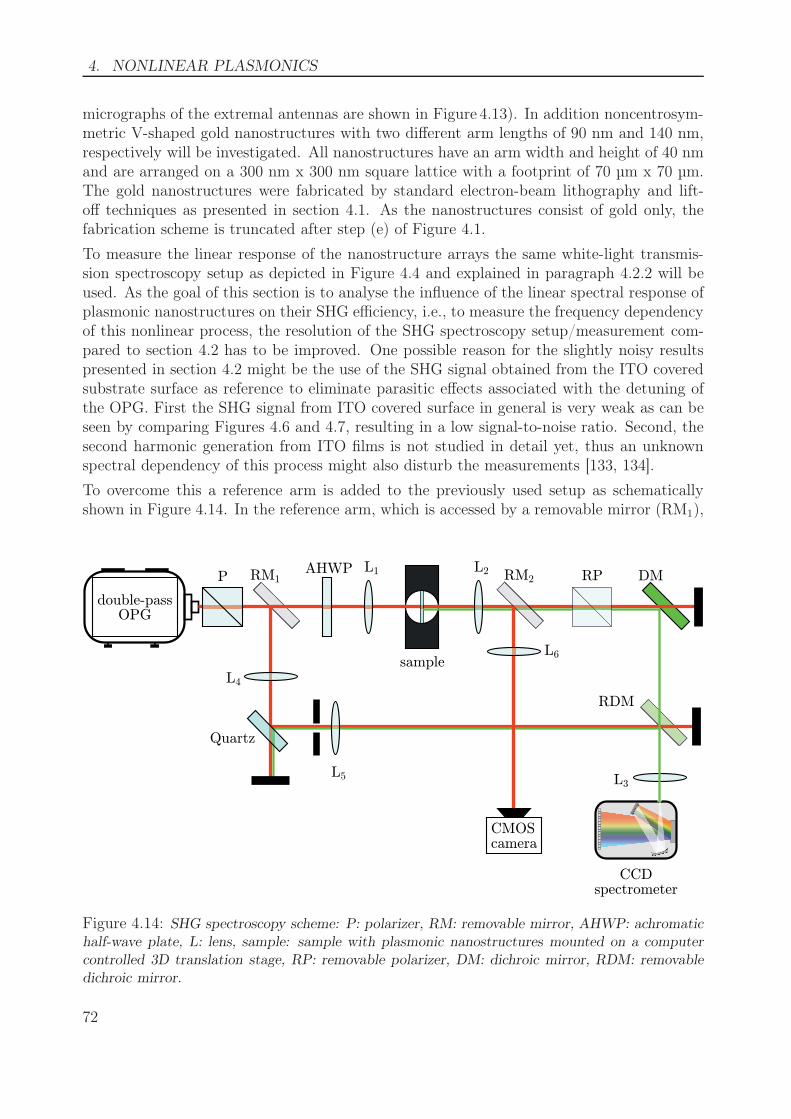
4. NONLINEAR PLASMONICS
micrographs of the extremal antennas are shown in Figure 4.13). In addition noncentrosym-metric V-shaped gold nanostructures with two different arm lengths of 90 nm and 140 nm,respectively will be investigated. All nanostructures have an arm width and height of 40 nmand are arranged on a 300 nm x 300 nm square lattice with a footprint of 70 µm x 70 µm.The gold nanostructures were fabricated by standard electron-beam lithography and lift-off techniques as presented in section 4.1. As the nanostructures consist of gold only, thefabrication scheme is truncated after step (e) of Figure 4.1.
To measure the linear response of the nanostructure arrays the same white-light transmis-sion spectroscopy setup as depicted in Figure 4.4 and explained in paragraph 4.2.2 will beused. As the goal of this section is to analyse the influence of the linear spectral response ofplasmonic nanostructures on their SHG efficiency, i.e., to measure the frequency dependencyof this nonlinear process, the resolution of the SHG spectroscopy setup/measurement com-pared to section 4.2 has to be improved. One possible reason for the slightly noisy resultspresented in section 4.2 might be the use of the SHG signal obtained from the ITO coveredsubstrate surface as reference to eliminate parasitic effects associated with the detuning ofthe OPG. First the SHG signal from ITO covered surface in general is very weak as can beseen by comparing Figures 4.6 and 4.7, resulting in a low signal-to-noise ratio. Second, thesecond harmonic generation from ITO films is not studied in detail yet, thus an unknownspectral dependency of this process might also disturb the measurements [133, 134].
To overcome this a reference arm is added to the previously used setup as schematicallyshown in Figure 4.14. In the reference arm, which is accessed by a removable mirror (RM1),
double-passOPG
RM1 DML1 L2
sampleL4
L5
Quartz
L3
RDM
CCDspectrometer
CMOScamera
RM2
L6
P RPAHWP
Figure 4.14: SHG spectroscopy scheme: P: polarizer, RM: removable mirror, AHWP: achromatichalf-wave plate, L: lens, sample: sample with plasmonic nanostructures mounted on a computercontrolled 3D translation stage, RP: removable polarizer, DM: dichroic mirror, RDM: removabledichroic mirror.
72
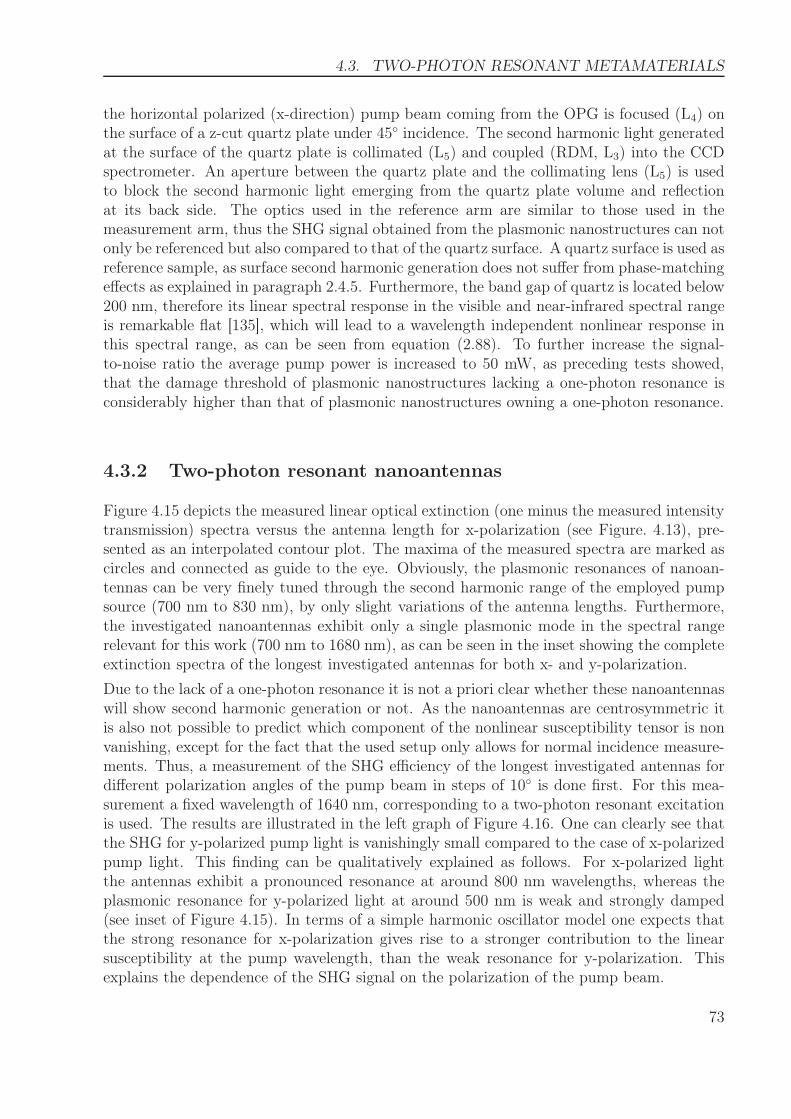
4.3. TWO-PHOTON RESONANT METAMATERIALS
the horizontal polarized (x-direction) pump beam coming from the OPG is focused (L4) onthe surface of a z-cut quartz plate under 45◦ incidence. The second harmonic light generatedat the surface of the quartz plate is collimated (L5) and coupled (RDM, L3) into the CCDspectrometer. An aperture between the quartz plate and the collimating lens (L5) is usedto block the second harmonic light emerging from the quartz plate volume and reflectionat its back side. The optics used in the reference arm are similar to those used in themeasurement arm, thus the SHG signal obtained from the plasmonic nanostructures can notonly be referenced but also compared to that of the quartz surface. A quartz surface is used asreference sample, as surface second harmonic generation does not suffer from phase-matchingeffects as explained in paragraph 2.4.5. Furthermore, the band gap of quartz is located below200 nm, therefore its linear spectral response in the visible and near-infrared spectral rangeis remarkable flat [135], which will lead to a wavelength independent nonlinear response inthis spectral range, as can be seen from equation (2.88). To further increase the signal-to-noise ratio the average pump power is increased to 50 mW, as preceding tests showed,that the damage threshold of plasmonic nanostructures lacking a one-photon resonance isconsiderably higher than that of plasmonic nanostructures owning a one-photon resonance.
4.3.2 Two-photon resonant nanoantennas
Figure 4.15 depicts the measured linear optical extinction (one minus the measured intensitytransmission) spectra versus the antenna length for x-polarization (see Figure. 4.13), pre-sented as an interpolated contour plot. The maxima of the measured spectra are marked ascircles and connected as guide to the eye. Obviously, the plasmonic resonances of nanoan-tennas can be very finely tuned through the second harmonic range of the employed pumpsource (700 nm to 830 nm), by only slight variations of the antenna lengths. Furthermore,the investigated nanoantennas exhibit only a single plasmonic mode in the spectral rangerelevant for this work (700 nm to 1680 nm), as can be seen in the inset showing the completeextinction spectra of the longest investigated antennas for both x- and y-polarization.
Due to the lack of a one-photon resonance it is not a priori clear whether these nanoantennaswill show second harmonic generation or not. As the nanoantennas are centrosymmetric itis also not possible to predict which component of the nonlinear susceptibility tensor is nonvanishing, except for the fact that the used setup only allows for normal incidence measure-ments. Thus, a measurement of the SHG efficiency of the longest investigated antennas fordifferent polarization angles of the pump beam in steps of 10◦ is done first. For this mea-surement a fixed wavelength of 1640 nm, corresponding to a two-photon resonant excitationis used. The results are illustrated in the left graph of Figure 4.16. One can clearly see thatthe SHG for y-polarized pump light is vanishingly small compared to the case of x-polarizedpump light. This finding can be qualitatively explained as follows. For x-polarized lightthe antennas exhibit a pronounced resonance at around 800 nm wavelengths, whereas theplasmonic resonance for y-polarized light at around 500 nm is weak and strongly damped(see inset of Figure 4.15). In terms of a simple harmonic oscillator model one expects thatthe strong resonance for x-polarization gives rise to a stronger contribution to the linearsusceptibility at the pump wavelength, than the weak resonance for y-polarization. Thisexplains the dependence of the SHG signal on the polarization of the pump beam.
73
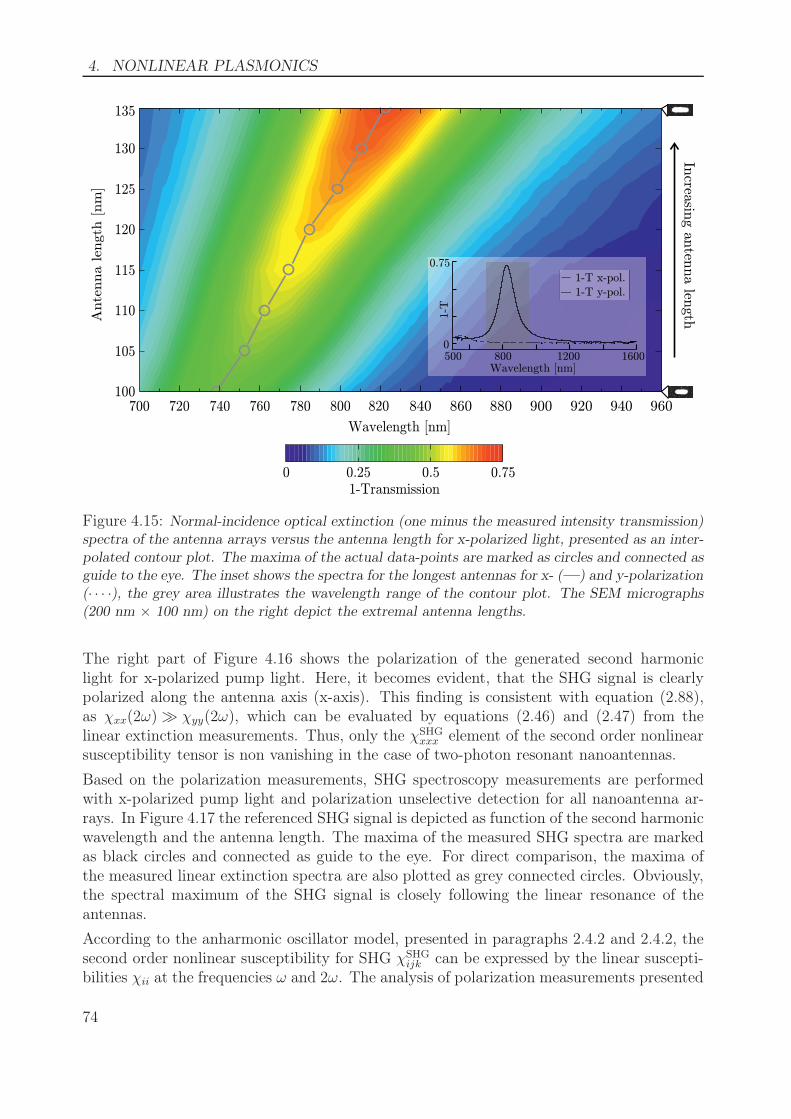
4. NONLINEAR PLASMONICS
800 1200 16000
0.75
Wavelength [nm]
1-T
500
1-T x-pol.1-T y-pol.
700 720 740 760 780 800100
105
110
115
120
125
130
135A
nte
nna len
gth
[nm
]
820
Increasin
g anten
na len
gth
940840 860 880 900 920 960
0 0.25 0.5 0.751-Transmission
Wavelength [nm]
Figure 4.15: Normal-incidence optical extinction (one minus the measured intensity transmission)spectra of the antenna arrays versus the antenna length for x-polarized light, presented as an inter-polated contour plot. The maxima of the actual data-points are marked as circles and connected asguide to the eye. The inset shows the spectra for the longest antennas for x- (—) and y-polarization(· · · ·), the grey area illustrates the wavelength range of the contour plot. The SEM micrographs(200 nm × 100 nm) on the right depict the extremal antenna lengths.
The right part of Figure 4.16 shows the polarization of the generated second harmoniclight for x-polarized pump light. Here, it becomes evident, that the SHG signal is clearlypolarized along the antenna axis (x-axis). This finding is consistent with equation (2.88),as χxx(2ω) ≫ χyy(2ω), which can be evaluated by equations (2.46) and (2.47) from thelinear extinction measurements. Thus, only the χSHG
xxx element of the second order nonlinearsusceptibility tensor is non vanishing in the case of two-photon resonant nanoantennas.
Based on the polarization measurements, SHG spectroscopy measurements are performedwith x-polarized pump light and polarization unselective detection for all nanoantenna ar-rays. In Figure 4.17 the referenced SHG signal is depicted as function of the second harmonicwavelength and the antenna length. The maxima of the measured SHG spectra are markedas black circles and connected as guide to the eye. For direct comparison, the maxima ofthe measured linear extinction spectra are also plotted as grey connected circles. Obviously,the spectral maximum of the SHG signal is closely following the linear resonance of theantennas.
According to the anharmonic oscillator model, presented in paragraphs 2.4.2 and 2.4.2, thesecond order nonlinear susceptibility for SHG χSHG
ijk can be expressed by the linear suscepti-bilities χii at the frequencies ω and 2ω. The analysis of polarization measurements presented
74
4.3. TWO-PHOTON RESONANT METAMATERIALS
0.5
1
fixed pumppolarizationN
orm
. to
tal SH
G s
ignal
Norm
. SH
G sig
nal
Linear pump polarizationdirection
SHG output polarizerdirection
x0°
xy45°
y90°
yx135°
x180°
x0°
xy45°
y90°
yx135°
x180°
0
0.5
1
0
0°
45°90°
135°
180° 0°
45°90°
135°
180°
Figure 4.16: (Left) Normalized total SHG signal of the longest antennas as function of the angleof polarization of the linearly polarized incident pump beam. (Right) Corresponding normalizedSHG signal as function of the linear output polarizer. The red vertical lines indicate the fixedlinear polarization of the respective pump light. All data points are normalized to the maximumof the individual measurement and connected as guide to the eye. The SEM micrographs show a275 nm x 275 nm section of the investigated arrays.
in Figure 4.16 revealed, that both the pump light and the generated second harmonic lightaddress the same plasmonic mode, in the case of second harmonic generation from thenanoantennas. Therefore the linear susceptibilities have not to be evaluated explicitly toobtain χSHG
xxx . Instead, the measured extinction spectra have been fitted to a Lorentzian lineshape, regarding equation (2.46), to obtain χSHG
xxx with the help of equation (2.111). Thethickness z of the metamaterial composed by the antennas, the factor axxx describing thenonlinear restoring force, and the nonlinear susceptibility and the proportionality constantη in the case of the reference measurements, i.e., the overall proportionality between thegenerated second harmonic intensity and the pump intensity for the reference, are still un-known. We note that z is, due to the used fabrication method, the same for all nanoantennaarrays and the proportionality factor to the quartz reference is wavelength independent.In the spirit of R. Miller’s findings for solid state matter (see paragraph 2.4.2), it will beassumed in the following that axxx is constant for a specific metamaterial design, i.e., forthe investigated nanoantenna arrays. Thus, the discussed factors can be combined and ob-tained by first evaluating the spectral dependency of second harmonic generation from asingle nanoantenna array through the linear extinction measurement and second, comparingthis result to the referenced SHG spectrum, measured for that nanoantenna array. Finally,the SHG spectra of all other nanoantenna arrays can then be predicted from their linearextinction spectra.
In the right part of Figure 4.17 the referenced SHG signals calculated with the above dis-cussed method from the linear extinction measurements and the SHG spectrum of thenanoantennas with a length of 115 nm are presented in the same way as the actual mea-surements. The spectral positions of the maxima of the SHG signal from the measurementsand the calculations are in good agreement (compare black circles in the left part of Fig-
75
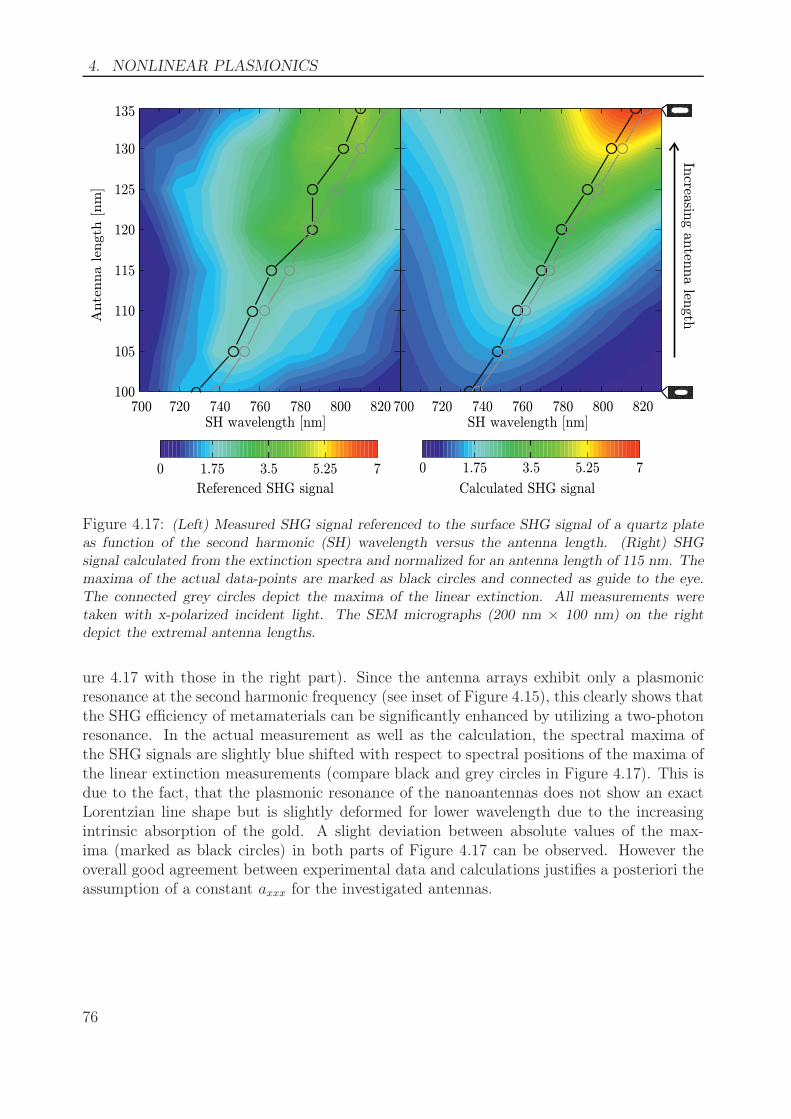
4. NONLINEAR PLASMONICS
SH wavelength [nm]
0 1.75 3.5 75.25
Referenced SHG signal
Increasin
g anten
na len
gth
700 720 740 760 780 800 820SH wavelength [nm]
0 1.75 3.5 75.25
Calculated SHG signal
700 720 740 760 780 800 820100
105
110
115
120
125
130
135A
nte
nna len
gth
[nm
]
Figure 4.17: (Left) Measured SHG signal referenced to the surface SHG signal of a quartz plateas function of the second harmonic (SH) wavelength versus the antenna length. (Right) SHGsignal calculated from the extinction spectra and normalized for an antenna length of 115 nm. Themaxima of the actual data-points are marked as black circles and connected as guide to the eye.The connected grey circles depict the maxima of the linear extinction. All measurements weretaken with x-polarized incident light. The SEM micrographs (200 nm × 100 nm) on the rightdepict the extremal antenna lengths.
ure 4.17 with those in the right part). Since the antenna arrays exhibit only a plasmonicresonance at the second harmonic frequency (see inset of Figure 4.15), this clearly shows thatthe SHG efficiency of metamaterials can be significantly enhanced by utilizing a two-photonresonance. In the actual measurement as well as the calculation, the spectral maxima ofthe SHG signals are slightly blue shifted with respect to spectral positions of the maxima ofthe linear extinction measurements (compare black and grey circles in Figure 4.17). This isdue to the fact, that the plasmonic resonance of the nanoantennas does not show an exactLorentzian line shape but is slightly deformed for lower wavelength due to the increasingintrinsic absorption of the gold. A slight deviation between absolute values of the max-ima (marked as black circles) in both parts of Figure 4.17 can be observed. However theoverall good agreement between experimental data and calculations justifies a posteriori theassumption of a constant axxx for the investigated antennas.
76
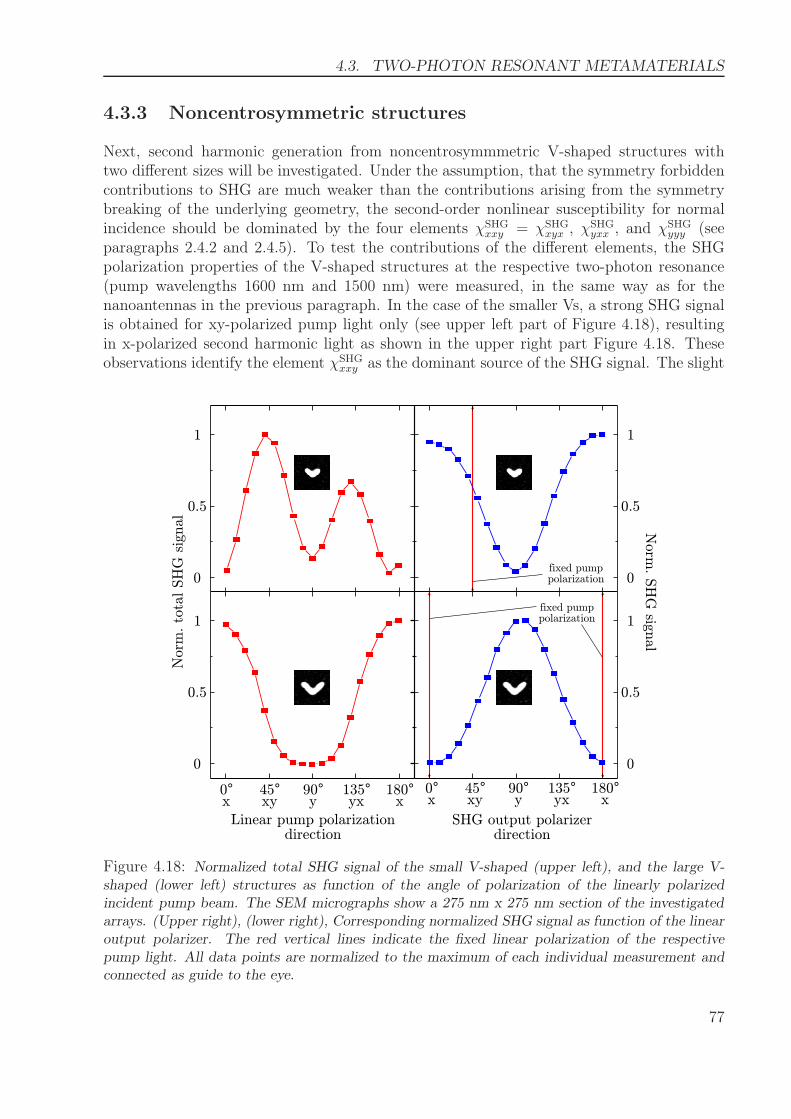
4.3. TWO-PHOTON RESONANT METAMATERIALS
4.3.3 Noncentrosymmetric structures
Next, second harmonic generation from noncentrosymmmetric V-shaped structures withtwo different sizes will be investigated. Under the assumption, that the symmetry forbiddencontributions to SHG are much weaker than the contributions arising from the symmetrybreaking of the underlying geometry, the second-order nonlinear susceptibility for normalincidence should be dominated by the four elements χSHG
xxy = χSHGxyx , χSHG
yxx , and χSHGyyy (see
paragraphs 2.4.2 and 2.4.5). To test the contributions of the different elements, the SHGpolarization properties of the V-shaped structures at the respective two-photon resonance(pump wavelengths 1600 nm and 1500 nm) were measured, in the same way as for thenanoantennas in the previous paragraph. In the case of the smaller Vs, a strong SHG signalis obtained for xy-polarized pump light only (see upper left part of Figure 4.18), resultingin x-polarized second harmonic light as shown in the upper right part Figure 4.18. Theseobservations identify the element χSHG
xxy as the dominant source of the SHG signal. The slight
0.5
1
Nor
m. to
tal SH
G s
ignal N
orm. S
HG
signal
Linear pump polarizationdirection
SHG output polarizerdirection
x0°
xy45°
y90°
yx135°
x180°
x0°
xy45°
y90°
yx135°
x180°
0
0.5
1
0
0.5
1
0
0.5
1
0fixed pumppolarization
fixed pumppolarization
Figure 4.18: Normalized total SHG signal of the small V-shaped (upper left), and the large V-shaped (lower left) structures as function of the angle of polarization of the linearly polarizedincident pump beam. The SEM micrographs show a 275 nm x 275 nm section of the investigatedarrays. (Upper right), (lower right), Corresponding normalized SHG signal as function of the linearoutput polarizer. The red vertical lines indicate the fixed linear polarization of the respectivepump light. All data points are normalized to the maximum of each individual measurement andconnected as guide to the eye.
77
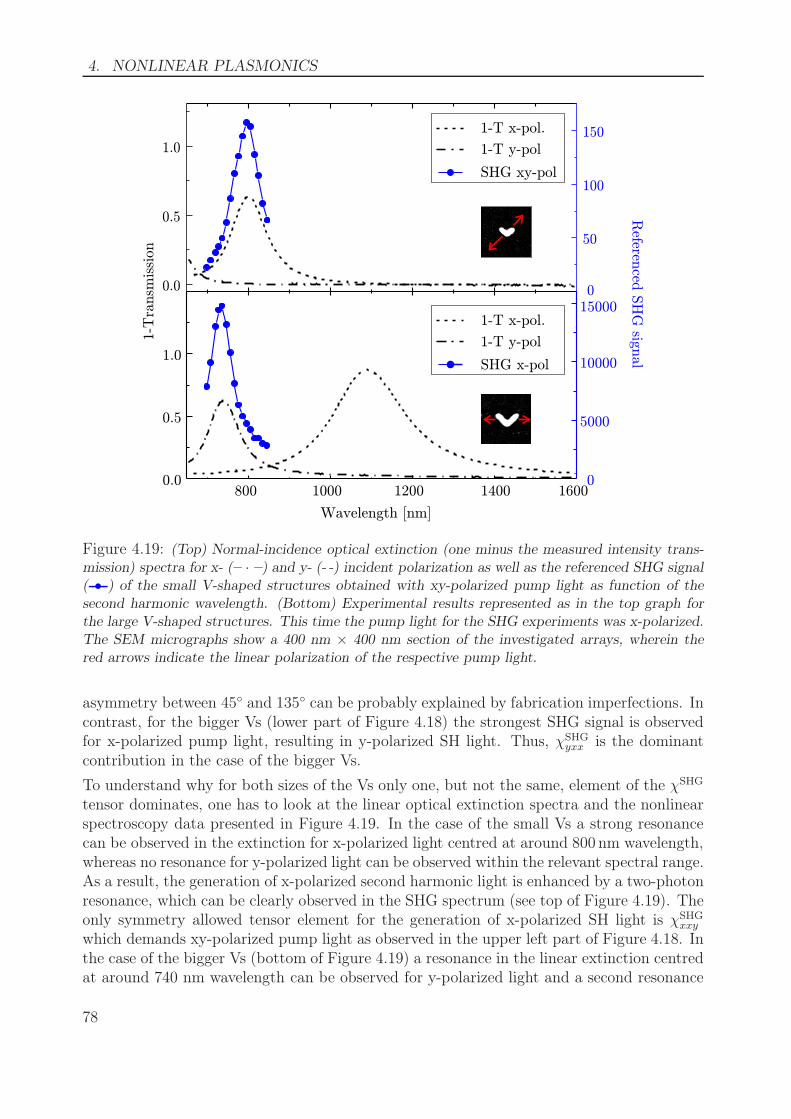
4. NONLINEAR PLASMONICS
0.0
0.5
1.0
0
50
100
1501-T
ransm
issi
on
Referen
ced S
HG
signal
1-T x-pol.
1-T y-pol
SHG xy-pol
0.0
0.5
1.0
800 1000 1200 1400 1600
Wavelength [nm]
0
5000
10000
150001-T x-pol.
1-T y-pol
SHG x-pol
Figure 4.19: (Top) Normal-incidence optical extinction (one minus the measured intensity trans-mission) spectra for x- (– · –) and y- (- -) incident polarization as well as the referenced SHG signal(--•--) of the small V-shaped structures obtained with xy-polarized pump light as function of thesecond harmonic wavelength. (Bottom) Experimental results represented as in the top graph forthe large V-shaped structures. This time the pump light for the SHG experiments was x-polarized.The SEM micrographs show a 400 nm × 400 nm section of the investigated arrays, wherein thered arrows indicate the linear polarization of the respective pump light.
asymmetry between 45◦ and 135◦ can be probably explained by fabrication imperfections. Incontrast, for the bigger Vs (lower part of Figure 4.18) the strongest SHG signal is observedfor x-polarized pump light, resulting in y-polarized SH light. Thus, χSHG
yxx is the dominantcontribution in the case of the bigger Vs.
To understand why for both sizes of the Vs only one, but not the same, element of the χSHG
tensor dominates, one has to look at the linear optical extinction spectra and the nonlinearspectroscopy data presented in Figure 4.19. In the case of the small Vs a strong resonancecan be observed in the extinction for x-polarized light centred at around 800 nm wavelength,whereas no resonance for y-polarized light can be observed within the relevant spectral range.As a result, the generation of x-polarized second harmonic light is enhanced by a two-photonresonance, which can be clearly observed in the SHG spectrum (see top of Figure 4.19). Theonly symmetry allowed tensor element for the generation of x-polarized SH light is χSHG
xxy
which demands xy-polarized pump light as observed in the upper left part of Figure 4.18. Inthe case of the bigger Vs (bottom of Figure 4.19) a resonance in the linear extinction centredat around 740 nm wavelength can be observed for y-polarized light and a second resonance
78
4.3. TWO-PHOTON RESONANT METAMATERIALS
centred at 1100 nm wavelength for x-polarized light. The extinction-resonance at 740 nmgives rise to a two-photon resonance for both the χSHG
yxx and the χSHGyyy element. However, the
linear extinction-resonance at 1100 nm has a non-negligible overlap with the pump light forx-polarization. Since χxx(ω) enters quadratically in χSHG
yxx but not in χSHGyyy , one finds that
χSHGyxx ≫ χSHG
yyy .
Inspection of Figure 4.19 shows that the maximum SHG signal of the large Vs is approx-imately two orders of magnitude larger than that of the small Vs. This can not only beexplained by the larger amount of gold, which enters equations (2.88) and (2.111) via theelectron number density. Rather, one has to keep in mind, that the large Vs represent adouble resonant plasmonic nanostructure, as discussed above, while in the case of the smallVs the second order nonlinear susceptibility is only two-photon resonant. In contrast to theresults of paragraph 4.2.4 and earlier studies on second harmonic generation from doubleresonant plasmonic nanostructures [40, 41, 136] this result clearly demonstrates the construc-tive influence of a two-photon resonance on the SHG efficiency, as the spectral evolution ofthe SHG signal is governed by the two-photon resonance and is not superimposed by a strongone-photon resonance.
It is also interesting to compare the maximal obtained SHG signal from the small Vs to thatof the measurements on the antennas. Even as both geometries exhibit comparable linearextinction spectra, a 30 times stronger SHG signal is observed from the noncentrosymmetricVs. This shows that the symmetry selection rules for the second order nonlinear suscepti-bility tensor elements play, as expected, a dominant role for metamaterials. However, theobserved ratio is significant smaller than those presented in comparisons on one-photon res-onant centro- and noncentrosymmetric plasmonic nanostructures [32, 33, 37], where ratiosof more than 100 are reported. This is quite surprising as the dependency of the nonlinearsusceptibility on the resonance frequency and on the symmetry of the electron potential, ac-counted by aijk in equation (2.88), are segregated in the anharmonic oscillator model. Thisdiscrepancy is more likely due to the fact, that deviations from the idealized geometry andsymmetry of plasmonic nanostructures, originated in fabrication method associated issues,are more pronounced for small structures, which give rise to two-photon resonances, thanfor large structures which give rise to one-photon resonances.
79

5
Conclusions
In this thesis second harmonic generation (SHG) from plasmonic nanostructures and meta-materials composed of those have been experimentally investigated with spectroscopic meth-ods. The experimental findings are furthermore supported by either numerical or analyticalcalculations. The main results of this thesis are: (i) The design, implementation and charac-terization of a frequency tunable, high intensity light source, suitable for the spectroscopicinvestigation of nonlinear processes; (ii) the clarification of the origin of the nonlinear re-sponse of hybrid plasmonic/dielectric nanoantennas; (iii) the exposition of the influence oftwo-photon resonances, i.e., resonances for the generated second harmonic light, on the spec-tral dependency and the efficiency of SHG from plasmonic nanostructures and metamaterialscomposed of those.
For the SHG spectroscopy experiments conducted in this thesis, a high power double-passfemtosecond optical parametric generator (OPG) operating with long term stability at arepetition rate of 42 MHz has been designed and demonstrated. A signal output of morethan two watts average power and nearly 55% pump to signal conversion efficiency has beenobtained by pumping the setup based on a magnesium oxide doped periodically poled lithiumniobate crystal directly with an Yb:KGW laser oscillator, without any further amplification.The signal is tunable from 1370 nm to at least 1650 nm and pulse durations below 200 fswere achieved without further compression techniques. The setup consists completely ofcommercial of the shelf available parts, which had not to be optimized for ultra short pulseapplications, resulting in a very cost effective system. Compared to alternative frequencytunable short pulse systems, i.e., commercial optical parametric oscillators and amplifiers,the presented OPG is also very compact and insensitive to external perturbations and thusan interesting alternative to those. Finally this system proofed its usability and reliabilityin the experiments conducted in this thesis, far more than in the actual characterization.
Prior to the actual experiments on plasmonic nanostructures a fabrication method based onelectron beam lithography and thin film deposition by thermal evaporation was developed,which allows to combine different metallic and dielectric nanostructures with nanometerprecision. Due to a high degree of automation and parallelization the used method allowsthe reproducible fabrication of samples, also for further research projects. Furthermore it isapplicable for a large variety of materials.
81
5. CONCLUSIONS AND OUTLOOK
To analyse the interplay between the plasmonic field-enhancement effect, inherent to plas-monic nanostructures, and the nonlinear optical properties of dielectric nanoparticles a com-parison of the SHG efficiency of nonlinear dielectric nanoparticles with bare gold nanoan-tennas, and hybrid dielectric/plasmonic nanoantennas containing either linear or nonlineardielectric nanoparticles was conducted. By combining the results of linear extinction mea-surements and SHG spectroscopy it was shown, that an increase of the SHG efficiency ofplasmonic nanoantennas, obtained by filling their feed gaps with dielectric nanoparticles,is independent of the nonlinear properties of the dielectric. This experimental result wasalso supported by numerical simulations. Furthermore these experiments showed that theSHG efficiency of plasmonic nanoantennas is several orders of magnitude higher than thatof the used nonlinear dielectric nanoparticles. Additional experiments showed, that a simplecombination of two nanoantennas to a double resonant nanoantenna system provides notonly a strong enhancement of the SHG efficiency but also offers control over the polarizationproperties of the generated second harmonic light.
Inspired by the results from double resonant nanoantenna systems, plasmonic nanostruct-ures were investigated which show only a resonance for the generated second harmonic light.With the help of linear and SHG spectroscopy on a rather large series of nanoantenna arrays,exhibiting spectral distinct plasmonic resonances, it was shown, that these two-photon res-onances enhance the SHG efficiency. Furthermore two-photon resonant noncentrosymmtricnanostructures with and without a weak one-photon resonance were studied. This studyproofed the validity of the general symmetry selection rules for SHG in the case of plas-monic nanostructures. It allowed also to analyse the spectral influence of a two-photonresonance in the case of a double resonant plasmonic system without the interference of astrong one-photon resonance for the pump light. With this, the previous result, that a fur-ther enhancement of the SHG efficiency is possible by designing nanostructures, which arenot only resonant for either the pump or the generated second harmonic light, but for both,is reinforced. Finally the results were qualitatively and in part also quantitatively explainedin a metamaterial picture, connecting the results of the linear extinction spectra with thoseof the SHG spectroscopy measurements via an anharmonic oscillator model.
82
Outlook
The presented double-pass OPG showed a superior performance, but is still a prototype. Apossibility to decrease the size of the system would be to replace all lenses by curved mirrors.With this upgrade also changes of the beam divergence occurring when the signal wavelengthis detuned would be diminished. As part of a complete automation of the system it wouldbe also interesting to replace the nonlinear crystal equipped with discrete poling periods bya crystal with a so called fan out poling design. In such a design the poling period is notchanged in discrete steps but continuously over the crystal. With such a crystal a continuoustuning could be achieved avoiding a temperature control of the crystal. A combination ofthese improvements would also allow to directly integrate the OPG in the housing of thepump laser. For several applications it would be also interesting to change the setup in a waythat the idler light can be used. For this purpose optics could be employed which are nonabsorptive in the wavelength range from 2000 nm to 4500 nm, but it is questionable whetherdichroic mirrors can be fabricated, which work over the combined signal and idler wavelengthrange. Furthermore the feedback for the signal and idler light has to be separated due totheir unequal group velocities, which would make the system more complicated. The mainadvantage of the double-pass OPG compared to optical parametric oscillators and amplifiersoperating in the femto- and picosecond regime is, that it does not need to be synchronisedto the pump or seed source. Therefore it would be highly interesting to test this setup withother pump sources. Several industrial grade high average power femtosecond lasers witha central wavelength of 1030 nm and 1040 nm work at repetition rates of several MHz andnot several tens of MHz. The peak intensity of these lasers is accordingly higher, thus theOPG should work without any changes. The main disadvantage of the OPG compared toan optical parametric oscillator are the pulse to pulse fluctuations as well in the intensity,as in time. To overcome this, the double-pass optical parametric generator could be used asan optical parametric amplifier seeded by a tunable continuous wave external cavity diodelaser, to start the parametric amplification not from vacuum noise, but from a well definedconstant intensity. This approach would also increase the conversion efficiency and/or lowerthe operation threshold. Thereby it might be possible to use shorter nonlinear crystalsand in turn to use compact fiber lasers operating with lower average output powers, higherrepetition rates and shorter pulse length than the used Yb:KGW oscillator.
The idea of enhancing the nonlinear conversion efficiency of nonlinear dielectric nanostruct-ures by combining them with plasmonic nanostructures did not work out in the presentedstudies. But the situation might be different, if nonlinear dielectrics possessing higher secondorder nonlinear coefficients could be employed. For example zinc selenide or gallium arsenidewould be interesting candidates, as they posses a 10/100 times higher second order nonlinearcoefficient and are compatible with the used fabrication scheme. But within this work itwas abstained from their usage, as both materials are rather hazardous. Furthermore theirhigher nonlinear coefficient is accompanied by a strong absorption for at least the generatedsecond harmonic light, which could act counterproductive. Another alternative could be theuse of monocrystalline nonlinear dielectrics with their crystal axis aligned with respect tothe local field distributions. However this approach would be extremely demanding from thefabrication point of view. Finally one should keep in mind that it was shown in this work,that noncentrosymmetric bare plasmonic nanostructures show an orders of magnitude higher
83
5. CONCLUSIONS AND OUTLOOK
conversion efficiency and the effort to fabricate hybrid structures is similar to the effort forfabricating multilayer metamaterials with a double-stage electron beam lithography process.
Even as it was not explicitly measured in this thesis it is reasonable to assume that two-photon resonant plasmonic nanostructures show a weaker second harmonic generation effi-ciency than one-photon resonant structures, due to the structure of the nonlinear suscep-tibility. But one-photon resonances also lead to a strong suppression of the pump light,additional to the actual depletion by conversion. There might be applications, for examplein integrated optical networks, where (i) small SHG signals are sufficient and (ii) the residualpump light has to be used for additional purposes in the network. In such a scenario a strongsuppression of the pump light additional to the actual conversion is undesirable, thereforetwo-photon resonant plasmonic nanostructures represent a promising opportunity.
An interesting property of two-photon resonant plasmonic nanostructures and metamaterialscomposed of those, is their ability to influence the far field properties of the generated secondharmonic light, which was partially shown by controlling its polarization. In the light of theseresults one could also think about directional emission of the generated second harmonic lightby fabricating a Yagi-Uda like nanostructure system. Such a system is composed of threeantennas aligned parallel to each other, where the middle antenna is resonant for the lightfield to emit, the resonance of one of the other antennas is slightly red-shifted, acting asreflector, and the resonance of the last antenna is slightly blue-shifted acting as director.Such a system could be also composed of V-shaped structures, for example. Or one couldthink of a metamaterial which focusses the generated light to a specific position, like it isdone for radio frequencies with a phased-array radar.
Last but not least the research on multiresonant plasmonic nanostructures for nonlinearfrequency conversion processes is very promising, as it was shown in this thesis that theirperformance exceeds that of single resonant structures. If this approach can be combinedwith noncentrosymmetric nanostructures one cane hope for large conversion efficiencies. Thiscould for example be done by varying the opening angel of the V-shaped structures or bycombining two differently sized types of Vs in a metamaterial. This approach can then bealso combined with the concept of directionality. If these attempts work out, one could finallytry to reverse the process of second harmonic generation and to perform optical parametricgeneration, amplification and oscillation with plasmonic nanostructures and metamaterials.
84
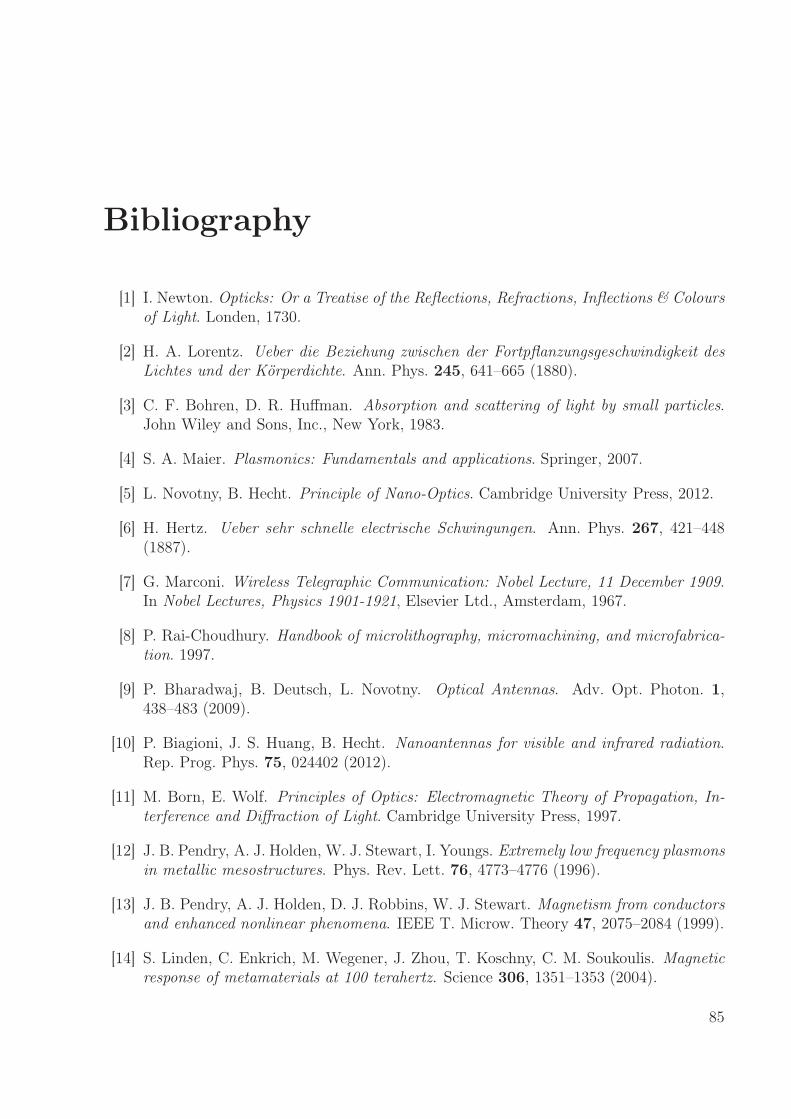
Bibliography
[1] I. Newton. Opticks: Or a Treatise of the Reflections, Refractions, Inflections & Coloursof Light. Londen, 1730.
[2] H. A. Lorentz. Ueber die Beziehung zwischen der Fortpflanzungsgeschwindigkeit desLichtes und der Körperdichte. Ann. Phys. 245, 641–665 (1880).
[3] C. F. Bohren, D. R. Huffman. Absorption and scattering of light by small particles.John Wiley and Sons, Inc., New York, 1983.
[4] S. A. Maier. Plasmonics: Fundamentals and applications. Springer, 2007.
[5] L. Novotny, B. Hecht. Principle of Nano-Optics. Cambridge University Press, 2012.
[6] H. Hertz. Ueber sehr schnelle electrische Schwingungen. Ann. Phys. 267, 421–448(1887).
[7] G. Marconi. Wireless Telegraphic Communication: Nobel Lecture, 11 December 1909.In Nobel Lectures, Physics 1901-1921, Elsevier Ltd., Amsterdam, 1967.
[8] P. Rai-Choudhury. Handbook of microlithography, micromachining, and microfabrica-tion. 1997.
[9] P. Bharadwaj, B. Deutsch, L. Novotny. Optical Antennas. Adv. Opt. Photon. 1,438–483 (2009).
[10] P. Biagioni, J. S. Huang, B. Hecht. Nanoantennas for visible and infrared radiation.Rep. Prog. Phys. 75, 024402 (2012).
[11] M. Born, E. Wolf. Principles of Optics: Electromagnetic Theory of Propagation, In-terference and Diffraction of Light. Cambridge University Press, 1997.
[12] J. B. Pendry, A. J. Holden, W. J. Stewart, I. Youngs. Extremely low frequency plasmonsin metallic mesostructures. Phys. Rev. Lett. 76, 4773–4776 (1996).
[13] J. B. Pendry, A. J. Holden, D. J. Robbins, W. J. Stewart. Magnetism from conductorsand enhanced nonlinear phenomena. IEEE T. Microw. Theory 47, 2075–2084 (1999).
[14] S. Linden, C. Enkrich, M. Wegener, J. Zhou, T. Koschny, C. M. Soukoulis. Magneticresponse of metamaterials at 100 terahertz. Science 306, 1351–1353 (2004).
85
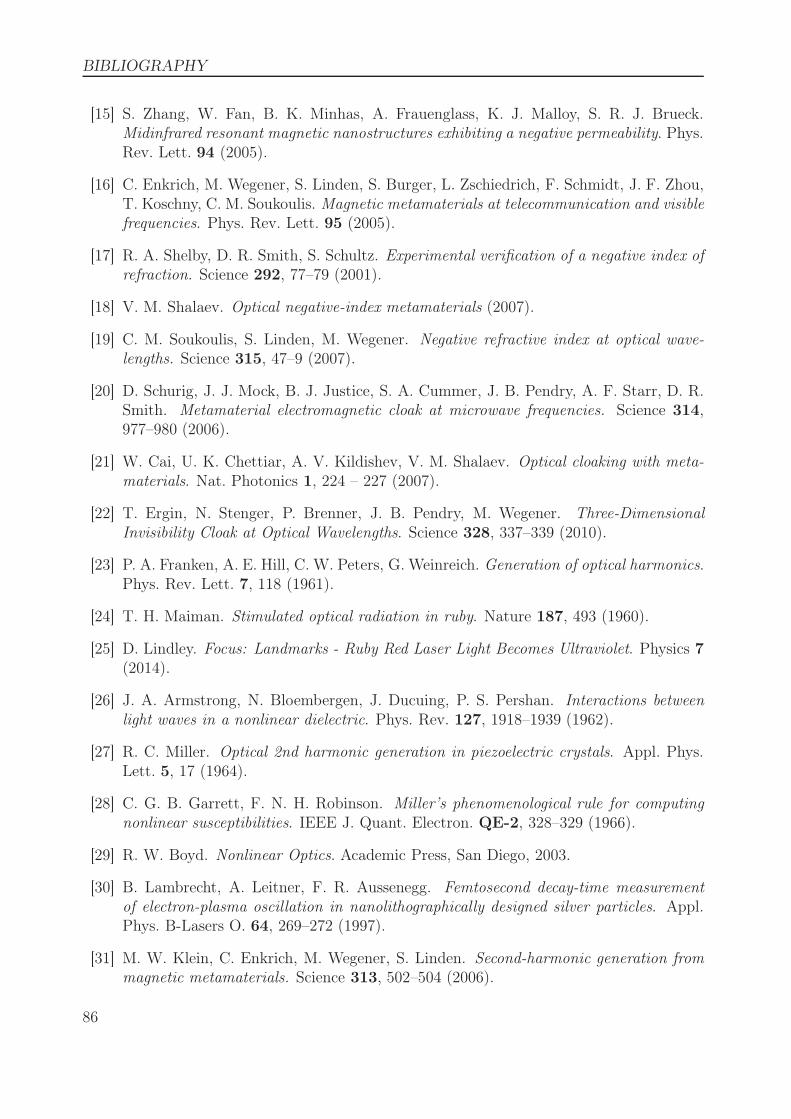
BIBLIOGRAPHY
[15] S. Zhang, W. Fan, B. K. Minhas, A. Frauenglass, K. J. Malloy, S. R. J. Brueck.Midinfrared resonant magnetic nanostructures exhibiting a negative permeability. Phys.Rev. Lett. 94 (2005).
[16] C. Enkrich, M. Wegener, S. Linden, S. Burger, L. Zschiedrich, F. Schmidt, J. F. Zhou,T. Koschny, C. M. Soukoulis. Magnetic metamaterials at telecommunication and visiblefrequencies. Phys. Rev. Lett. 95 (2005).
[17] R. A. Shelby, D. R. Smith, S. Schultz. Experimental verification of a negative index ofrefraction. Science 292, 77–79 (2001).
[18] V. M. Shalaev. Optical negative-index metamaterials (2007).
[19] C. M. Soukoulis, S. Linden, M. Wegener. Negative refractive index at optical wave-lengths. Science 315, 47–9 (2007).
[20] D. Schurig, J. J. Mock, B. J. Justice, S. A. Cummer, J. B. Pendry, A. F. Starr, D. R.Smith. Metamaterial electromagnetic cloak at microwave frequencies. Science 314,977–980 (2006).
[21] W. Cai, U. K. Chettiar, A. V. Kildishev, V. M. Shalaev. Optical cloaking with meta-materials. Nat. Photonics 1, 224 – 227 (2007).
[22] T. Ergin, N. Stenger, P. Brenner, J. B. Pendry, M. Wegener. Three-DimensionalInvisibility Cloak at Optical Wavelengths. Science 328, 337–339 (2010).
[23] P. A. Franken, A. E. Hill, C. W. Peters, G. Weinreich. Generation of optical harmonics.Phys. Rev. Lett. 7, 118 (1961).
[24] T. H. Maiman. Stimulated optical radiation in ruby. Nature 187, 493 (1960).
[25] D. Lindley. Focus: Landmarks - Ruby Red Laser Light Becomes Ultraviolet. Physics 7(2014).
[26] J. A. Armstrong, N. Bloembergen, J. Ducuing, P. S. Pershan. Interactions betweenlight waves in a nonlinear dielectric. Phys. Rev. 127, 1918–1939 (1962).
[27] R. C. Miller. Optical 2nd harmonic generation in piezoelectric crystals. Appl. Phys.Lett. 5, 17 (1964).
[28] C. G. B. Garrett, F. N. H. Robinson. Miller’s phenomenological rule for computingnonlinear susceptibilities. IEEE J. Quant. Electron. QE-2, 328–329 (1966).
[29] R. W. Boyd. Nonlinear Optics. Academic Press, San Diego, 2003.
[30] B. Lambrecht, A. Leitner, F. R. Aussenegg. Femtosecond decay-time measurementof electron-plasma oscillation in nanolithographically designed silver particles. Appl.Phys. B-Lasers O. 64, 269–272 (1997).
[31] M. W. Klein, C. Enkrich, M. Wegener, S. Linden. Second-harmonic generation frommagnetic metamaterials. Science 313, 502–504 (2006).
86
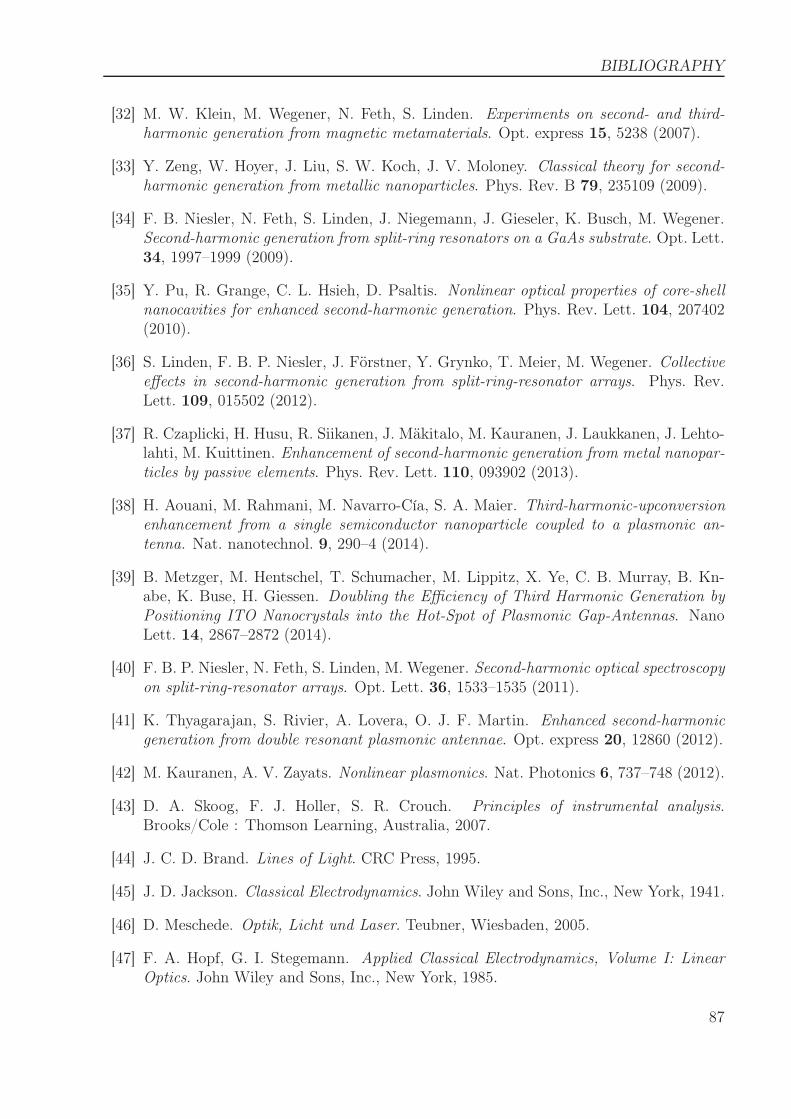
BIBLIOGRAPHY
[32] M. W. Klein, M. Wegener, N. Feth, S. Linden. Experiments on second- and third-harmonic generation from magnetic metamaterials. Opt. express 15, 5238 (2007).
[33] Y. Zeng, W. Hoyer, J. Liu, S. W. Koch, J. V. Moloney. Classical theory for second-harmonic generation from metallic nanoparticles. Phys. Rev. B 79, 235109 (2009).
[34] F. B. Niesler, N. Feth, S. Linden, J. Niegemann, J. Gieseler, K. Busch, M. Wegener.Second-harmonic generation from split-ring resonators on a GaAs substrate. Opt. Lett.34, 1997–1999 (2009).
[35] Y. Pu, R. Grange, C. L. Hsieh, D. Psaltis. Nonlinear optical properties of core-shellnanocavities for enhanced second-harmonic generation. Phys. Rev. Lett. 104, 207402(2010).
[36] S. Linden, F. B. P. Niesler, J. Förstner, Y. Grynko, T. Meier, M. Wegener. Collectiveeffects in second-harmonic generation from split-ring-resonator arrays. Phys. Rev.Lett. 109, 015502 (2012).
[37] R. Czaplicki, H. Husu, R. Siikanen, J. Mäkitalo, M. Kauranen, J. Laukkanen, J. Lehto-lahti, M. Kuittinen. Enhancement of second-harmonic generation from metal nanopar-ticles by passive elements. Phys. Rev. Lett. 110, 093902 (2013).
[38] H. Aouani, M. Rahmani, M. Navarro-Cía, S. A. Maier. Third-harmonic-upconversionenhancement from a single semiconductor nanoparticle coupled to a plasmonic an-tenna. Nat. nanotechnol. 9, 290–4 (2014).
[39] B. Metzger, M. Hentschel, T. Schumacher, M. Lippitz, X. Ye, C. B. Murray, B. Kn-abe, K. Buse, H. Giessen. Doubling the Efficiency of Third Harmonic Generation byPositioning ITO Nanocrystals into the Hot-Spot of Plasmonic Gap-Antennas. NanoLett. 14, 2867–2872 (2014).
[40] F. B. P. Niesler, N. Feth, S. Linden, M. Wegener. Second-harmonic optical spectroscopyon split-ring-resonator arrays. Opt. Lett. 36, 1533–1535 (2011).
[41] K. Thyagarajan, S. Rivier, A. Lovera, O. J. F. Martin. Enhanced second-harmonicgeneration from double resonant plasmonic antennae. Opt. express 20, 12860 (2012).
[42] M. Kauranen, A. V. Zayats. Nonlinear plasmonics. Nat. Photonics 6, 737–748 (2012).
[43] D. A. Skoog, F. J. Holler, S. R. Crouch. Principles of instrumental analysis.Brooks/Cole : Thomson Learning, Australia, 2007.
[44] J. C. D. Brand. Lines of Light. CRC Press, 1995.
[45] J. D. Jackson. Classical Electrodynamics. John Wiley and Sons, Inc., New York, 1941.
[46] D. Meschede. Optik, Licht und Laser. Teubner, Wiesbaden, 2005.
[47] F. A. Hopf, G. I. Stegemann. Applied Classical Electrodynamics, Volume I: LinearOptics. John Wiley and Sons, Inc., New York, 1985.
87
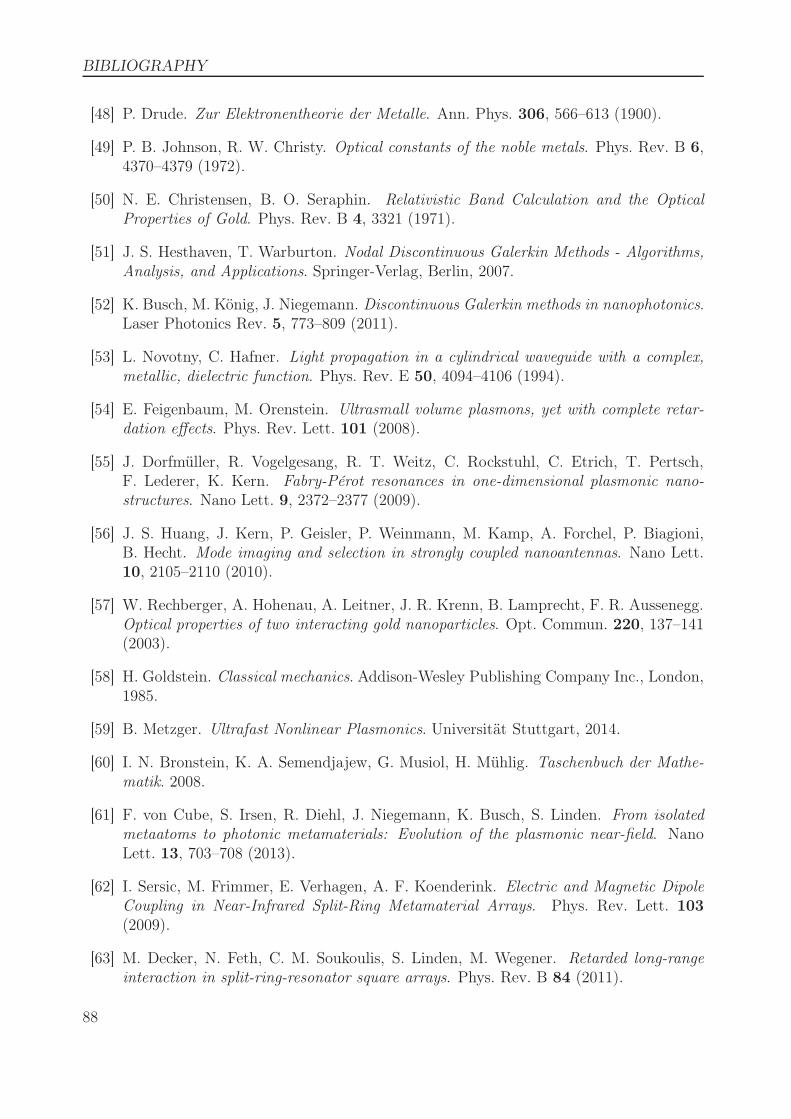
BIBLIOGRAPHY
[48] P. Drude. Zur Elektronentheorie der Metalle. Ann. Phys. 306, 566–613 (1900).
[49] P. B. Johnson, R. W. Christy. Optical constants of the noble metals. Phys. Rev. B 6,4370–4379 (1972).
[50] N. E. Christensen, B. O. Seraphin. Relativistic Band Calculation and the OpticalProperties of Gold. Phys. Rev. B 4, 3321 (1971).
[51] J. S. Hesthaven, T. Warburton. Nodal Discontinuous Galerkin Methods - Algorithms,Analysis, and Applications. Springer-Verlag, Berlin, 2007.
[52] K. Busch, M. König, J. Niegemann. Discontinuous Galerkin methods in nanophotonics.Laser Photonics Rev. 5, 773–809 (2011).
[53] L. Novotny, C. Hafner. Light propagation in a cylindrical waveguide with a complex,metallic, dielectric function. Phys. Rev. E 50, 4094–4106 (1994).
[54] E. Feigenbaum, M. Orenstein. Ultrasmall volume plasmons, yet with complete retar-dation effects. Phys. Rev. Lett. 101 (2008).
[55] J. Dorfmüller, R. Vogelgesang, R. T. Weitz, C. Rockstuhl, C. Etrich, T. Pertsch,F. Lederer, K. Kern. Fabry-Pérot resonances in one-dimensional plasmonic nano-structures. Nano Lett. 9, 2372–2377 (2009).
[56] J. S. Huang, J. Kern, P. Geisler, P. Weinmann, M. Kamp, A. Forchel, P. Biagioni,B. Hecht. Mode imaging and selection in strongly coupled nanoantennas. Nano Lett.10, 2105–2110 (2010).
[57] W. Rechberger, A. Hohenau, A. Leitner, J. R. Krenn, B. Lamprecht, F. R. Aussenegg.Optical properties of two interacting gold nanoparticles. Opt. Commun. 220, 137–141(2003).
[58] H. Goldstein. Classical mechanics. Addison-Wesley Publishing Company Inc., London,1985.
[59] B. Metzger. Ultrafast Nonlinear Plasmonics. Universität Stuttgart, 2014.
[60] I. N. Bronstein, K. A. Semendjajew, G. Musiol, H. Mühlig. Taschenbuch der Mathe-matik. 2008.
[61] F. von Cube, S. Irsen, R. Diehl, J. Niegemann, K. Busch, S. Linden. From isolatedmetaatoms to photonic metamaterials: Evolution of the plasmonic near-field. NanoLett. 13, 703–708 (2013).
[62] I. Sersic, M. Frimmer, E. Verhagen, A. F. Koenderink. Electric and Magnetic DipoleCoupling in Near-Infrared Split-Ring Metamaterial Arrays. Phys. Rev. Lett. 103(2009).
[63] M. Decker, N. Feth, C. M. Soukoulis, S. Linden, M. Wegener. Retarded long-rangeinteraction in split-ring-resonator square arrays. Phys. Rev. B 84 (2011).
88
BIBLIOGRAPHY
[64] A. Beer. Bestimmung der Absorption des rothen Lichts in farbigen Flüssigkeiten. Ann.Phys. 162, 78–88 (1852).
[65] S. E. Harris, M. K. Oshman, R. L. Byer. Observation of tunable optical parametricfluorescence. Phys. Rev. Lett. 18, 732–734 (1967).
[66] F. A. Hopf, G. I. Stegemann. Applied Classical Electrodynamics, Volume II: NonlinearOptics. John Wiley and Sons, Inc., New York, 1986.
[67] P. Y. Chen, C. Argyropoulos, A. Alù. Enhanced nonlinearities using plasmonic nanoan-tennas. Nanophotonics 1, 221–233 (2012).
[68] U. K. Chettiar, N. Engheta. Optical frequency mixing through nanoantenna enhanceddifference frequency generation: Metatronic mixer. Phys. Rev. B 86 (2012).
[69] S. B. Hasan, F. Lederer, C. Rockstuhl. Nonlinear plasmonic antennas. MaterialsToday 17, 478–485 (2014).
[70] J. I. Dadap, J. Shan, K. B. Eisenthal, T. F. Heinz. Second-Harmonic Rayleigh Scat-tering from a Sphere of Centrosymmetric Material (1999).
[71] M. Finazzi, P. Biagioni, M. Celebrano, L. Duò. Selection rules for second-harmonicgeneration in nanoparticles. Phys. Rev. B 76 (2007).
[72] R. Dendy. Plasma Physics: An Introductory Course. Cambridge University Press,1993.
[73] J. E. Midwinter, J. Warner. The effects of phase matching method and of uniaxial crys-tal symmetry on the polar distribution of second-order non-linear optical polarization.Brit. J. Appl. Phys. 16, 1135–1142 (2002).
[74] R. Chang, J. Ducuing, N. Bloembergen. Dispersion of the Optical Nonlinearity inSemiconductors. Phys. Rev. Lett. 15, 415–418 (1965).
[75] C. Chen, A. de Castro, Y. Shen. Surface-Enhanced Second-Harmonic Generation.Phys. Rev. Lett. 46, 145–148 (1981).
[76] D. S. Hum, M. M. Fejer. Quasi-phasematching. C. R. Phys. 8, 180–198 (2007).
[77] M. Baudrier-Raybaut, R. Haidar, P. Kupecek, P. Lemasson, E. Rosencher. Randomquasi-phase-matching in bulk polycrystalline isotropic nonlinear materials. Nature 432,374–376 (2004).
[78] S. E. Skipetrov. Disorder is the new order. Nature 432 (2004).
[79] S. Helmfrid, G. Arvidsson. Influence of randomly varying domain lengths and nonuni-form effective index on second-harmonic generation in quasi-phase-matching waveg-uides. J. Opt. Soc. Am. B 8, 797 (1991).
[80] M. M. Fejer, G. A. Magel, D. H. Jundt, R. L. Byer. Quasi-phase-matched secondharmonic generation: tuning and tolerances. IEEE J. Quant. Electron. 28 (1992).
89
BIBLIOGRAPHY
[81] V. Mizrahi, J. E. Sipe. Phenomenological treatment of surface second-harmonic gen-eration. J. Opt. Soc. Am. B 5, 660 (1988).
[82] G. Cerullo, S. De Silvestri. Ultrafast optical parametric amplifiers. Rev. Sci. Instrum.74, 1–18 (2003).
[83] C. Manzoni, G. Cirmi, D. Brida, S. de Silvestri, G. Cerullo. Optical-parametric-generation process driven by femtosecond pulses: Timing and carrier-envelope phaseproperties. Phys. Rev. A 79, 033818 (2009).
[84] R. L. Byer, S. E. Harris. Power and bandwidth of spontaneous parametric emission.Phys. Rev. 168, 1064–1068 (1968).
[85] M. H. Dunn, M. Ebrahimzadeh. Parametric generation of tunable light from continous-wave to femtosecond pulses. Science 286, 1513–1517 (1999).
[86] V. Petrov. Parametric down-conversion devices: The coverage of the mid-infraredspectral range by solid-state laser sources. Opt. Mater. 34, 536–554 (2012).
[87] R. Sowade, J. Kieß ling, I. Breunig. CW laser light tunable from blue to red: OPOspave the way. Photonik int. 63–65 (2013).
[88] T. Südmeyer, J. Aus der Au, R. Paschotta, U. Keller, P. G. R. Smith, G. W. Ross,D. C. Hanna. Novel ultrafast parametric systems: high repetition rate single-pass OPGand fibre-feedback OPO. J. Phys. D Appl. Phys. 34, 2433–2439 (2001).
[89] S. V. Marchese, E. Innerhofer, R. Paschotta, S. Kurimura, K. Kitamura, G. Arisholm,U. Keller. Room temperature femtosecond optical parametric generation in MgO-dopedstoichiometric LiTaO3. Appl. Phys. B 81, 1049–1052 (2005).
[90] G. Arisholm. General analysis of group velocity effects in collinear optical parametricamplifiers and generators. Opt. Express 15, 4941–4947 (2007).
[91] R. L. Byer. Nonlinear Optical Phenomena and Materials. Annual Review of MaterialsScience 4, 147–190 (1974).
[92] S. M. Eaton, H. Zhang, P. R. Herman, F. Yoshino, L. Shah, J. Bovatsek, A. Y.Arai. Heat accumulation effects in femtosecond laser- written waveguides with variablerepetition rate. Opt. express 13, 2496–2504 (2005).
[93] J. C. Diels, W. Rudolph. Ultrashort Laser Pulse Phenomena. Academic Press, 2006.
[94] A. Smith. SNLO, http://www.as-photonics.com.
[95] H. Linnenbank, S. Linden. High repetition rate femtosecond double pass optical para-metric generator with more than 2 W tunable output in the NIR. Opt. express 22,18072 (2014).
[96] T. A. Rabson. Stimulated parametric fluorescence induced by picosecond pump pulses.Appl. Phys. Lett. 21, 129 (1972).
90
BIBLIOGRAPHY
[97] P. Zhao, B. Zhang, E. Li, R. Zhou, D. Xu, Y. Lu, T. Zhang, F. Ji, X. Zhu, P. Wang,J. Yao. Experimental study on a high conversion efficiency, low threshold, high-repetition-rate periodically poled lithium niobate optical parametric generator. Opt.express 14, 7224 (2006).
[98] M. Levenius, V. Pasiskevicius, F. Laurell, K. Gallo. Ultra-broadband optical parametricgeneration in periodically poled stoichiometric LiTaO3. Opt. express 19, 4121–8 (2011).
[99] S. Chaitanya Kumar, M. Jelínek, M. Baudisch, K. T. Zawilski, P. G. Schunemann,V. Kubeček, J. Biegert, M. Ebrahim-Zadeh. Tunable, high-energy, mid-infrared, pi-cosecond optical parametric generator based on CdSiP2. Opt. express 20, 15703–9(2012).
[100] F. Seifert, V. Petrov, F. Noack. Sub-100-fs optical parametric generator pumped by ahigh-repetition-rate Ti:sapphire regenerative amplifier system. Opt. Lett. 19, 837–839(1994).
[101] X. Xie, A. M. Schober, C. Langrock, R. V. Roussev, J. R. Kurz, M. M. Fejer. Picojoulethreshold, picosecond optical parametric generation in reverse proton-exchanged lithiumniobate waveguides. J. Opt. Soc. Am. B 21, 1397 (2004).
[102] M. Marangoni, R. Osellame, R. Ramponi, G. Cerullo, A. Steinmann, U. Morgner.Near-infrared optical parametric amplifier at 1 MHz directly pumped by a femtosecondoscillator. Opt. Lett. 32, 1489 (2007).
[103] F. Brunner, T. Südmeyer, E. Innerhofer, F. Morier-Genoud, R. Paschotta, V. E. Kisel,V. G. Shcherbitsky, N. V. Kuleshov, J. Gao, K. Contag, A. Giesen, U. Keller. 240-fspulses with 22-W average power from a mode-locked thin-disk Yb:KY(WO(4))(2) laser.Opt. Lett. 27, 1162–1164 (2002).
[104] A. Steinmann, B. Metzger, R. Hegenbarth, H. Giessen. Compact 7.4 W femtosecondoscillator for white-light generation and nonlinear microscopy. CLEO: 2011 - LaserScience to Photonic Applications 1–2 (2011).
[105] F. Hoos, T. P. Meyrath, S. Li, B. Braun, H. Giessen. Femtosecond 5-W Yb:KGW slablaser oscillator pumped by a single broad-area diode and its application as supercontin-uum source. Appl. Phys. B-Lasers O. 96, 5–10 (2009).
[106] G. P. Banfi, C. Solcia, P. D. Trapani, R. Danielius, A. Piskarskas, R. Righini, R. Torre.Travelling-wave parametric conversion of microjoule pulses with {LBO}. Opt. Com-mun. 118, 353–359 (1995).
[107] M. Koichi, K. Miyamoto, S. Ujita, T. Saito, H. Ito, T. Omatsu. Dual-frequency pi-cosecond optical parametric generator pumped by a Nd-doped vanadate bounce laser.Opt. express 19, 18523–8 (2011).
[108] G. D. Boyd, D. A. Kleinman. Parametric interaction of focused Gaussian light beams.J. Appl. Phys. 39, 3597–3639 (1968).
91
BIBLIOGRAPHY
[109] J. M. Manley, H. E. Rowe. Some general properties of nonlinear elements 1: generalenergy relations. Proc. Institute Radio Engineers 44, 904–913 (1956).
[110] O. Gayer, Z. Sacks, E. Galun, A. Arie. Temperature and wavelength dependent re-fractive index equations for MgO-doped congruent and stoichiometric LiNbO_3. Appl.Phys. B: Lasers Opt. 91, 343–348 (2008).
[111] L. Holland. Vacuum deposition of thin films. Chapman and Hall Ltd., London, 1963.
[112] E. R. Olson, R. D. Mathis. Silicon monoxide evaporation with the multi-baffled boxsource (1963).
[113] K. Cheng, M. Le, D. Mitchell, L. Hanes Effects of Electron Radiation Generated duringE-beam Evaporation on a Photoresist Liftoff Process. In GaAs Mantech Ceonference,2010.
[114] J. E. Lennard-Jones. The migration and aggregation of atoms on solid surfaces. P.Phys. Soc. 49, 140 (1937).
[115] M. N. Borah, P. C. Sarmah, A. Rahman. Effect of substrate temperature on structuralproperties of thermally evaporated ZnSe thin films. J. Optoelectron. Adv. M. 10, 427–433 (2008).
[116] P. Buffat, J. P. Borel. Size effect on the melting temperature of gold particles. Phys.Rev. A 13, 2287–2298 (1976).
[117] N. Bouhssira, S. Abed, E. Tomasella, J. Cellier, A. Mosbah, M. S. Aida, M. Jacquet.Influence of annealing temperature on the properties of ZnO thin films deposited bythermal evaporation. Appl. Surf. Sci. 252, 5594–5597 (2006).
[118] F. Khan, A. Mobin, M. Husain, G. Energy, S. Korea, J. M. Islamia. Formation ofZnO by Annealing of Thermally Evaporated Zinc in Oxygen Ambient for Solar CellApplication. Int. J. Electron. 2, 823–827 (2013).
[119] P. M. Jais, C. Von Bilderling, A. V. Bragas. Plasmon-enhanced second harmonicgeneration in semiconductor quantum dots close to metal nanoparticles. Papers inPhysics 3, 1–5 (2011).
[120] G. Grinblat, M. Rahmani, E. Cortés, M. Caldarola, D. Comedi, S. A. Maier, A. V.Bragas. High-Efficiency Second Harmonic Generation from a Single Hybrid ZnONanowire/Au Plasmonic Nano-Oligomer. Nano Lett. 14, 6660–6665 (2014).
[121] H. Linnenbank, Y. Grynko, J. Förstner, S. Linden. Second harmonic generation spec-troscopy on hybrid plasmonic/dielectric nanoantennas. Light: Science and Applicationssubmitted (2015).
[122] R. Jin, J. E. Jureller, H. Y. Kim, N. F. Scherer. Correlating Second Harmonic OpticalResponses of Single Ag Nanoparticles with Morphology. J. Am. Chem. Soc. 127, 12482–12483 (2005).
92
BIBLIOGRAPHY
[123] J. Butet, J. Duboisset, G. Bachelier, I. Russier-Antoine, E. Benichou, C. Jonin, P. F.Brevet. Optical Second Harmonic Generation of Single Metallic Nanoparticles Embed-ded in a Homogeneous Medium. Nano Lett. 10, 1717–1721 (2010).
[124] N. Accanto, L. Piatkowski, J. Renger, N. F. van Hulst. Capturing the Optical PhaseResponse of Nanoantennas by Coherent Second-Harmonic Microscopy. Nano Lett. 14,4078–4082 (2014).
[125] K. Stannigel, M. König, J. Niegemann, K. Busch. Discontinuous Galerkin time-domaincomputations of metallic nanostructures. Opt. express 17, 14934–14947 (2009).
[126] A. I. Akhiezer. Plasma electrodynamics - Vol.2: Nonlinear theory and fluctuations.Pergamon Press, 1975.
[127] H. Harutyunyan, G. Volpe, R. Quidant, L. Novotny. Enhancing the nonlinear opticalresponse using multifrequency gold-nanowire antennas. Phys. Rev. Lett. 108 (2012).
[128] A. Ashkin, G. D. Boyd, J. M. Dziedzic. Resonant Optical Second Harmonic GenerationAnd Mixing. IEEE J. Quantum. Electron. QE 2, 109–124 (1966).
[129] C. Zimmermann, R. Kallenbach, T. W. Hänsch, J. Sandberg. Doubly-resonant second-harmonic generation in beta-barium-borate. Opt. Commun. 71, 229–234 (1989).
[130] A. Wokaun, J. G. Bergman, J. P. Heritage, A. M. Glass, P. F. Liao, D. H. Olson. Surfacesecond-harmonic generation from metal island films and microlithographic structures.Phys. Rev. B 24, 849–856 (1981).
[131] H. P. Wagner, M. Kühnelt, W. Langbein, J. M. Hvam. Dispersion of the second-ordernonlinear susceptibility in ZnTe, ZnSe, and ZnS. Phys. Rev. B 58, 494–501 (1998).
[132] H. Linnenbank, S. Linden. Second harmonic generation with two-photon resonantplasmonic metamaterials. Optica submitted (2015).
[133] F. Ghebremichael, C. Poga, M. G. Kuzyk. Optical second harmonic characterizationof spontaneous symmetry-breaking at polymer/transparent conductor interfaces. Appl.Phys. Lett. 66 (1995).
[134] W. Wang, J. Xu, X. Liu, Y. Jiang, G. Wang, X. Lu. Second harmonic generationinvestigation of indium tin oxide thin films. Thin Solid Films 365, 116–118 (2000).
[135] G. Ghosh. Dispersion-equation coefficients for the refractive index and birefringenceof calcite and quartz crystals. Opt. Com. 163, 95–102 (1999).
[136] H. Aouani, M. Navarro-Cia, M. Rahmani, T. P. H. Sidiropoulos, M. Hong, R. F.Oulton, S. A. Maier. Multiresonant Broadband Optical Antennas As Efficient TunableNanosources of Second Harmonic Light. Nano Lett. 12, 4997–5002 (2012).
93

List of publications
Parts of this thesis have already been published in refereed scientific journals:
• H. Linnenbank, S. Linden. High repetition rate femtosecond double pass optical para-metric generator with more than 2 W tunable output in the NIR. Opt. express 22,18072 (2014).
Parts of this thesis have already been submitted to refereed scientific journals:
• H. Linnenbank, Y. Grynko, J. Förstner, S. Linden. Second harmonic generation spec-troscopy on hybrid plasmonic/dieletric nanoantennas. Light: Sience and Applicationssubmitted, (2015).
• H. Linnenbank, S. Linden. Second harmonic generation with two-photon resonantplasmonic metamaterials. Optica submitted, (2015).
Additional work on other topics has been published in refereed scientific journals
• T. Beckmann, H. Linnenbank, H. Steigerwald, B. Sturman, D. Haertle, K. Buse, I.Breunig. Highly tunable low-threshold optical parametric oscillation in radially poledwhispering gallery resonators. Phys. Rev. Lett. 106, 143903 (2011)
95

Acknowledgments
During the time of conducting my thesis a lot of people helped in many different ways. Here,I would like to take the opportunity of saying thank you to some of them:
First of all I would like to thank Prof. Dr. Stefan Linden for giving me the opportunityto write my PhD thesis in his research group and providing a remarkable environment forthis task. He was an excellent teacher and supervisor, whose responsibility for the success ofmy work should not be underestimated. He was always open for discussions also about mystrangest ideas and put an enormous trust in my abilities, regardless of the field of activity.
I want to thank PD Dr. Elisabeth Soergel for her kind readiness to take over the primaryreview of my thesis, but also for her regular friendly advices since the beginning of mydiploma thesis. Thanks also to PD Dr. Bernard Metsch and Prof. Dr. Werner Mader forthe secondary reviews.
Special thanks go to: Dr. Jens Niegemann and Dr. Yevgen Grynko, who not only supportedme with numerical calculations, but also tried to give me an understanding of numericalphysics. Dr. Johannes Overbuschmann and Angelika Rüttgers for their advisory in electronmicroscopy. Dr. Stephan Irsen and Carola Tröger for saving me from serious damage duringmy self-studies in the chemistry lab. Peter Holik and Bert Kann for introducing me intovacuum techniques and supporting me in the sample fabrication.
I am indebted to all proof readers of this thesis for their supporting comments and hintswhich improved the readability.
Thanks to the Nanophotonic group at the Rheinische Friedrich-Wilhelms-Universität Bonnand the EMA/konTEM group at the research center caesar, the current and the formermembers, for their support and the numerous discussions. Despite the science related stuffI will always look back at our coffee breaks, whiskey and video evenings, the barbecues andthe evenings at conferences, which embellished the working ambience during my hole thesis.
Last, but not least, I would like to thank my parents for their support throughout my life,but especially for letting me go my own way with a little prodding in the right direction. Ithank my entire club the Hard ’n Heavy’s Rhein-Sieg for all the occasions to clear my mindand I beg pardon for my decision to choose an academic career. I want to thank my wifeJessica from the bottom of my heart for her understanding, support, encouragement andlove during the past years, but also for bringing me back to earth if necessary. As I wroteat the end of my diploma thesis, without her I would have never made it this far.
To quote I. Newton for the last time: "If I have seen further it is by standing on the shouldersof Giants."
97