Simulation of Soot Filtration on the Nano-, Micro- and ...
24
Simulation of Soot Filtration on the Nano-, Micro- and Meso-scale L. Cheng 1 , S. Rief 1 , A. Wiegmann 1,3 , J. Adler 2 , L. Mammitzsch 2 and U. Petasch 2 1 Fraunhofer-Institut Techno- und Wirtschaftsmathematik, 2 Fraunhofer-Institut für Keramische Technologien und Systeme, 3 Math2Market GmbH
Transcript of Simulation of Soot Filtration on the Nano-, Micro- and ...

Simulation of Soot Filtration on the
Nano-, Micro- and Meso-scale
L. Cheng1, S. Rief1, A. Wiegmann1,3,
J. Adler2, L. Mammitzsch2 and U. Petasch2
1Fraunhofer-Institut Techno- und Wirtschaftsmathematik,2Fraunhofer-Institut für Keramische Technologien und Systeme,
3Math2Market GmbH
Outline
• Introduction
• Simulation of Filtration Processes for ceramic
Diesel Particulate Filter media
– Air flow simulation
– Soot transport simulation
– Soot particle deposition and conversion to porous media
– Determining soot layer packing density and flow resistivity
• Predicting the pressure drop for a new DPF media
• Outlook towards the macro scale
• Conclusions
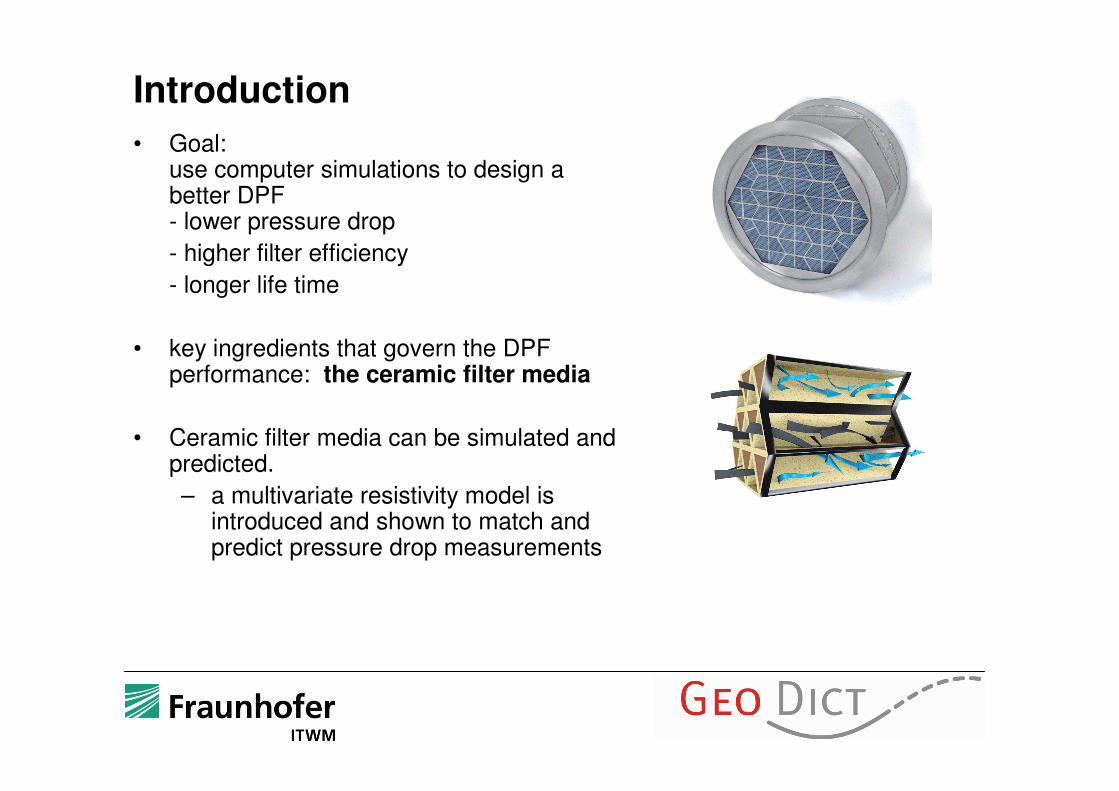
• Goal: use computer simulations to design a better DPF - lower pressure drop
- higher filter efficiency
- longer life time
• key ingredients that govern the DPF performance: the ceramic filter media
• Ceramic filter media can be simulated and predicted.
– a multivariate resistivity model is introduced and shown to match and predict pressure drop measurements
Introduction
_s
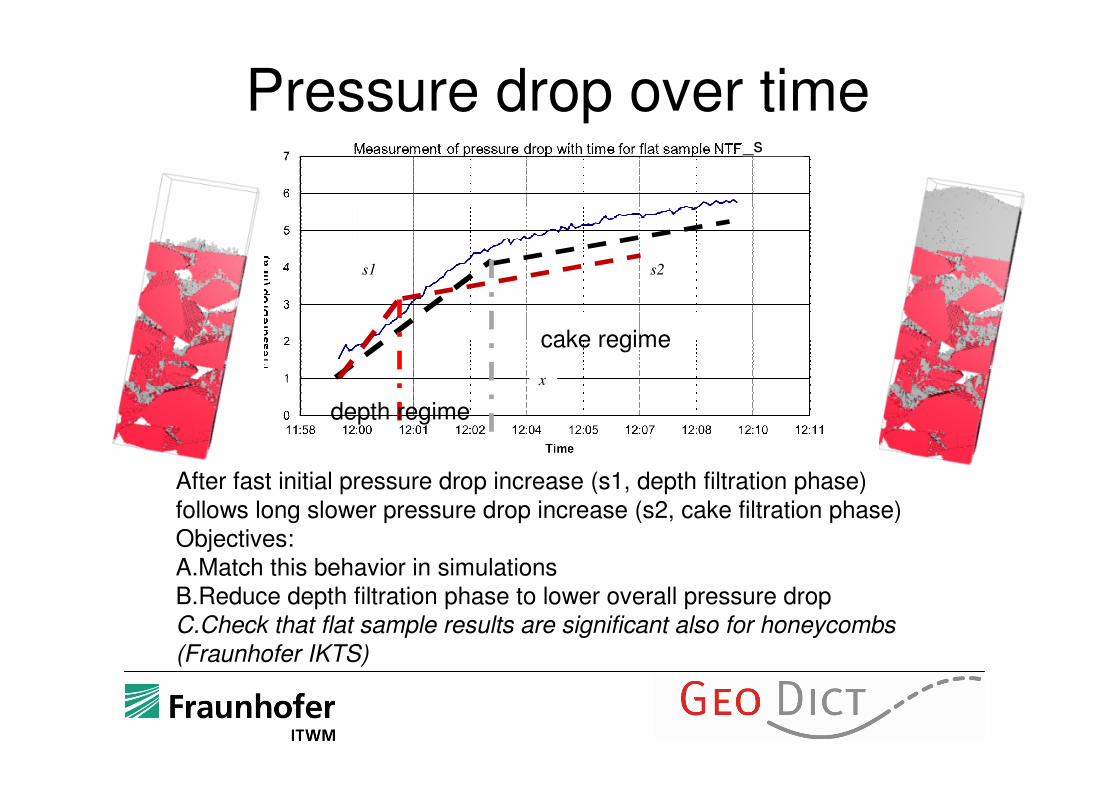
Pressure drop over time
s2s1
x
After fast initial pressure drop increase (s1, depth filtration phase)
follows long slower pressure drop increase (s2, cake filtration phase)Objectives:A.Match this behavior in simulationsB.Reduce depth filtration phase to lower overall pressure dropC.Check that flat sample results are significant also for honeycombs
(Fraunhofer IKTS)
depth regime
cake regime

Previous results
*K. Schmidt, S. Rief, A. Wiegmann, S. Ripperger. Simulation of DPF Media,
Soot Deposition and Pressure Drop Evolution. Filtech, Wiesbaden 2009.
Pre
ss
ure
Dro
p [
Pa
]
De
po
sit
ion
Ra
te [
%]
Time [s] Time [s]
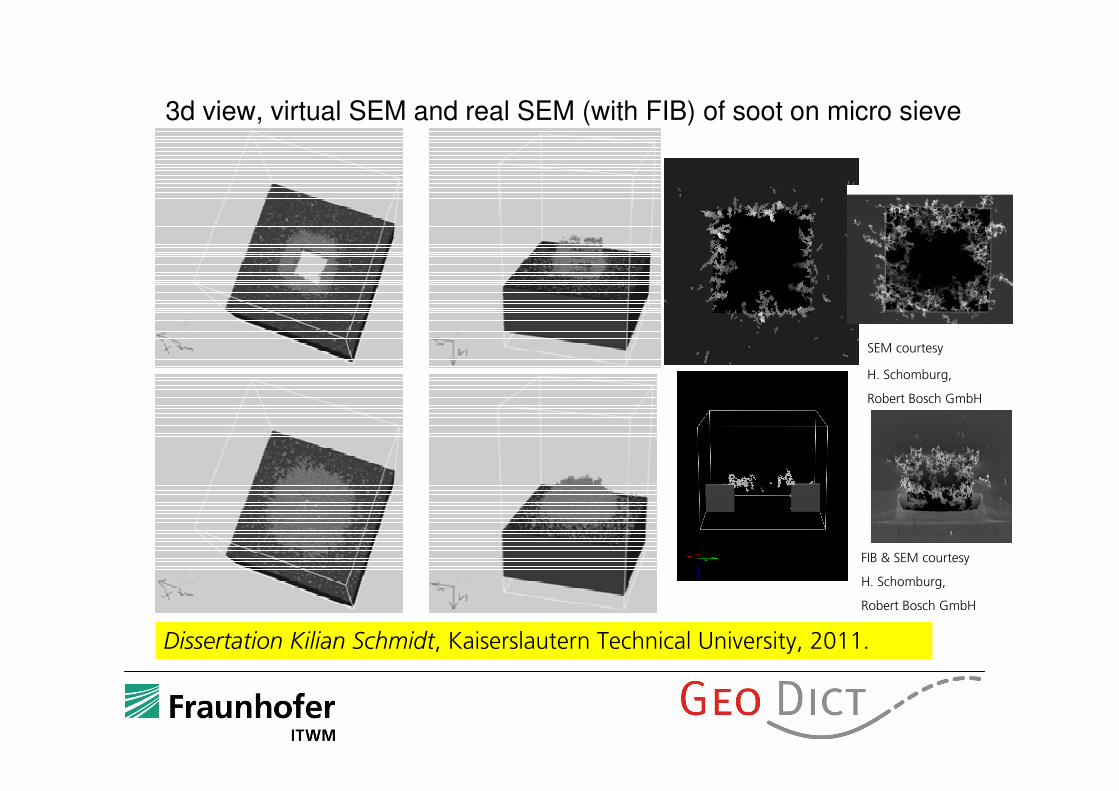
3d view, virtual SEM and real SEM (with FIB) of soot on micro sieve
FIB & SEM courtesy
H. Schomburg,
Robert Bosch GmbH
SEM courtesy
H. Schomburg,
Robert Bosch GmbH
Dissertation Kilian Schmidt, Kaiserslautern Technical University, 2011.
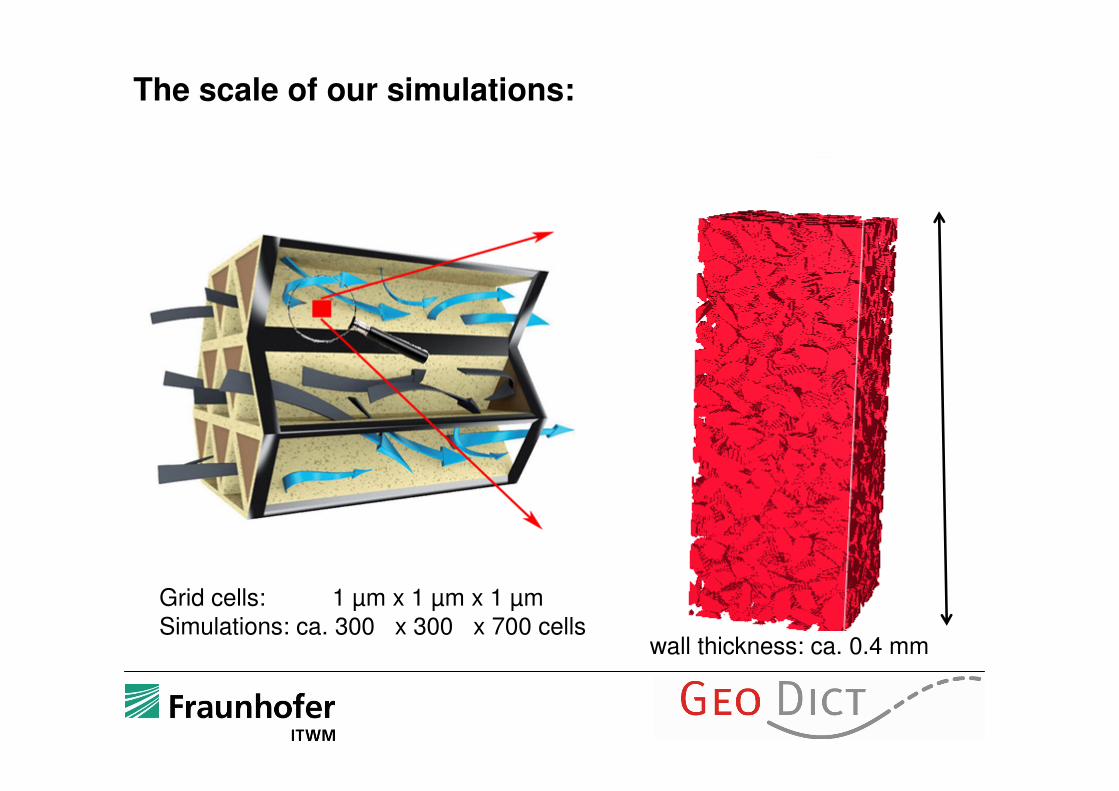
The scale of our simulations:
wall thickness: ca. 0.4 mm
Grid cells: 1 µm x 1 µm x 1 µmSimulations: ca. 300 x 300 x 700 cells
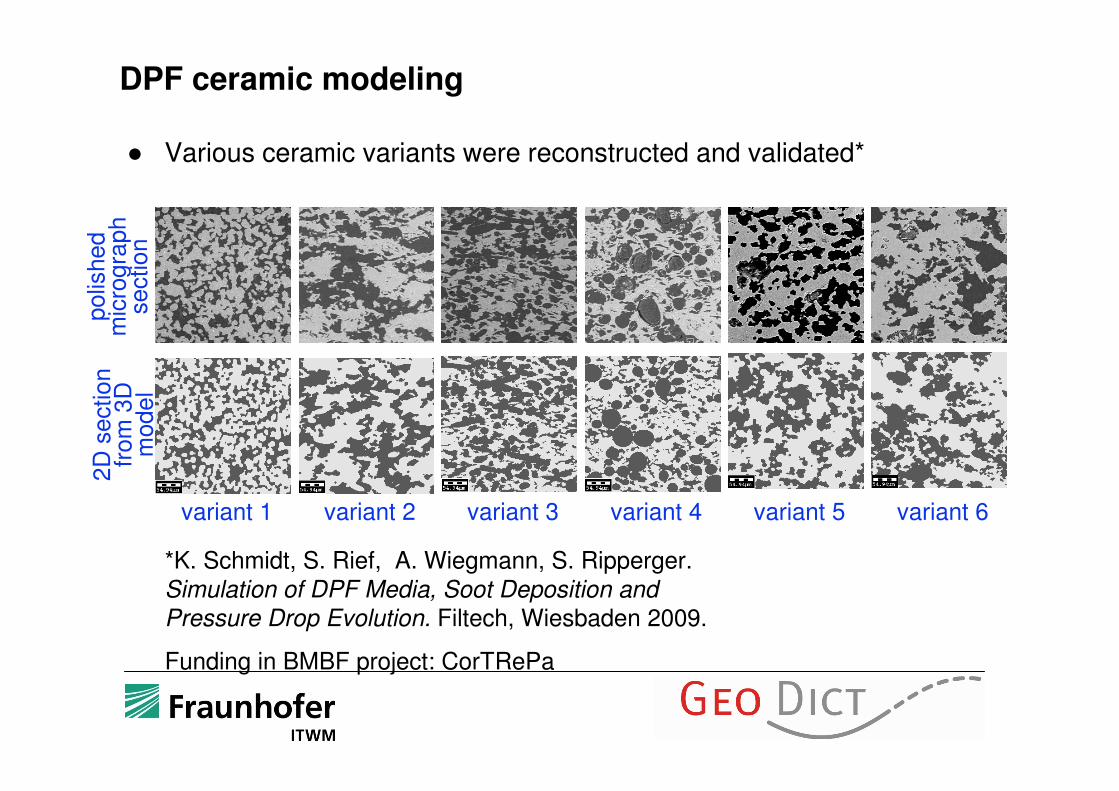
● Various ceramic variants were reconstructed and validated*
DPF ceramic modelingpolis
hed
mic
rogra
ph
section
2D
section
from
3D
m
odel
variant 1 variant 2 variant 3 variant 4 variant 5 variant 6
*K. Schmidt, S. Rief, A. Wiegmann, S. Ripperger.
Simulation of DPF Media, Soot Deposition and
Pressure Drop Evolution. Filtech, Wiesbaden 2009.
Funding in BMBF project: CorTRePa
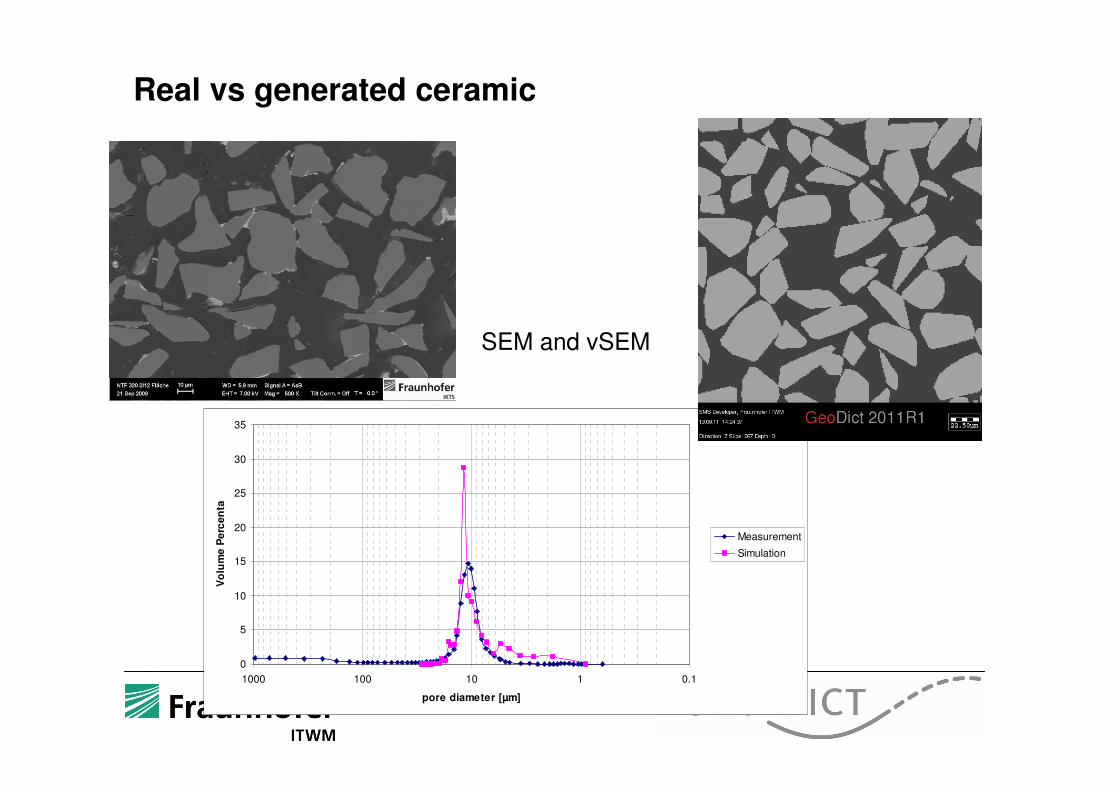
Real vs generated ceramic
0
5
10
15
20
25
30
35
0.11101001000
pore diameter [µm]
Vo
lum
e P
erc
en
tag
e
Measurement
Simulation
SEM and vSEM
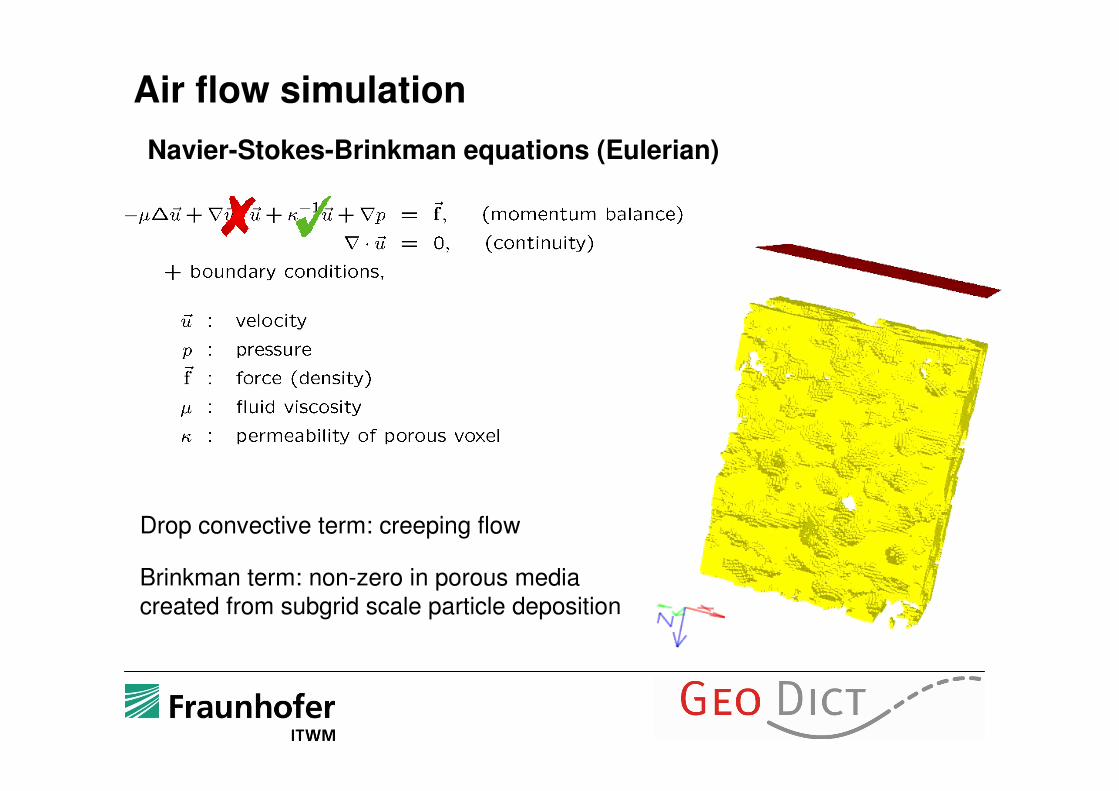
Air flow simulation
Navier-Stokes-Brinkman equations (Eulerian)
Drop convective term: creeping flow
Brinkman term: non-zero in porous media created from subgrid scale particle deposition

Soot transport simulation
Lagrangian Particle Transport
ED
D
A
A
BB
C CC
C
C
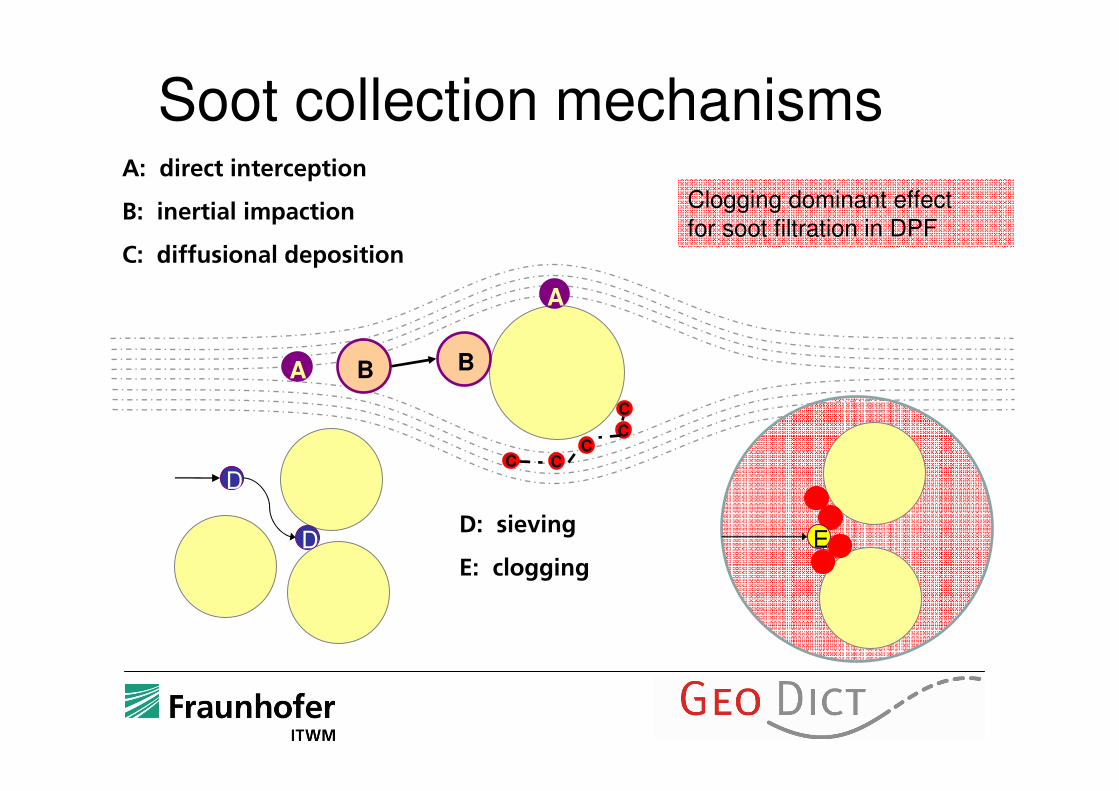
A: direct interception
B: inertial impaction
C: diffusional deposition
D: sieving
E: clogging
Soot collection mechanisms
Clogging dominant effect for soot filtration in DPF
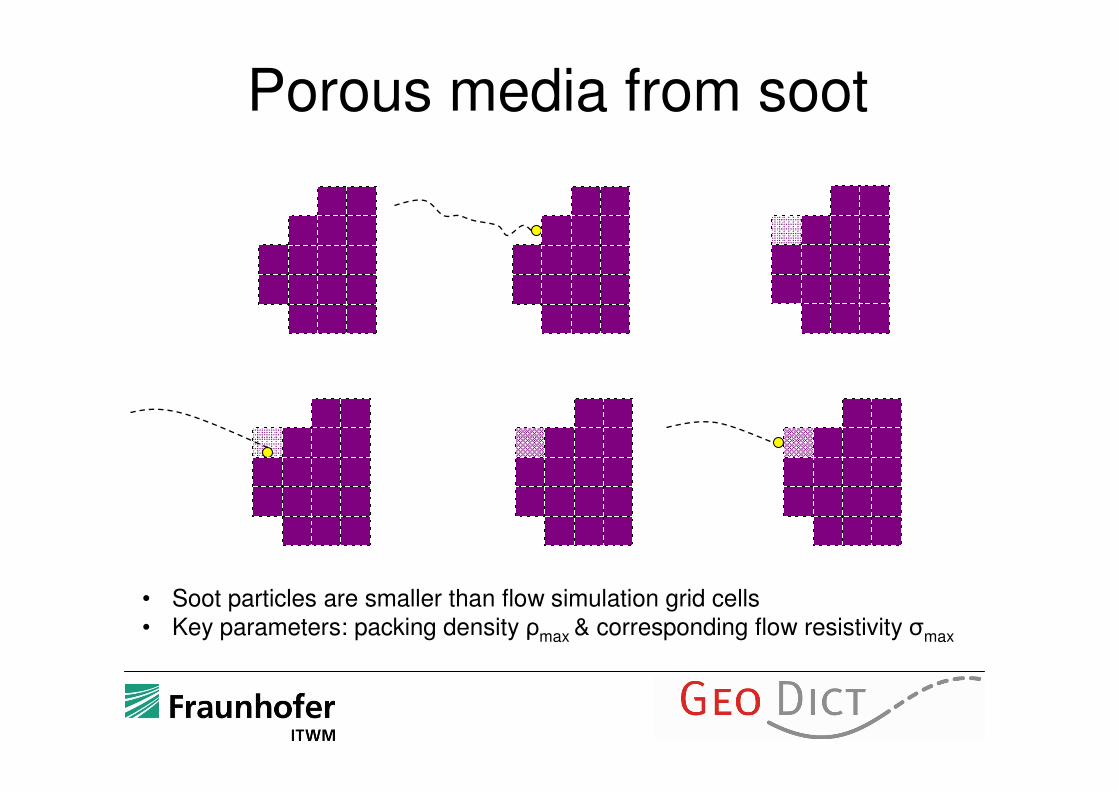
Porous media from soot
• Soot particles are smaller than flow simulation grid cells• Key parameters: packing density ρmax & corresponding flow resistivity σmax
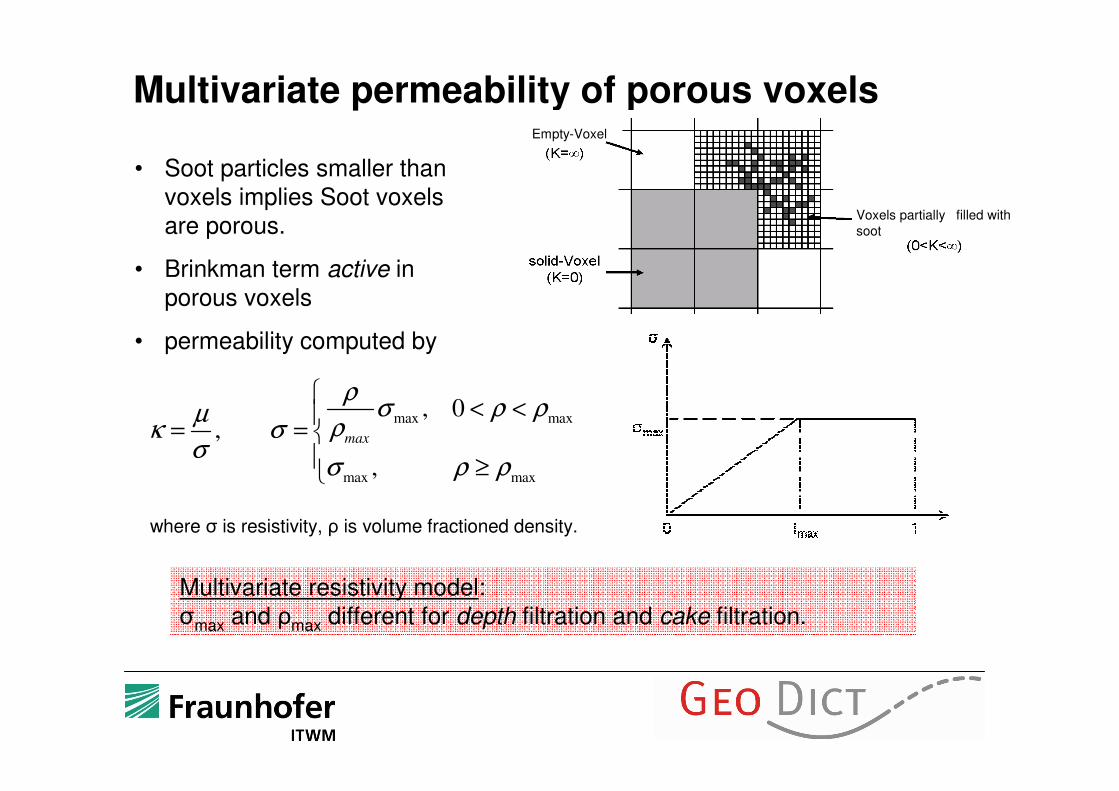
Multivariate permeability of porous voxels
• Soot particles smaller thanvoxels implies Soot voxelsare porous.
• Brinkman term active in porous voxels
• permeability computed by
Empty-Voxel
Voxels partially filled with
soot
where σ is resistivity, ρ is volume fractioned density.
max max
max max
, 0,
,
max
ρσ ρ ρµ
ρκ σσ
σ ρ ρ
< <
= = ≥
Multivariate resistivity model: σmax and ρmax different for depth filtration and cake filtration.
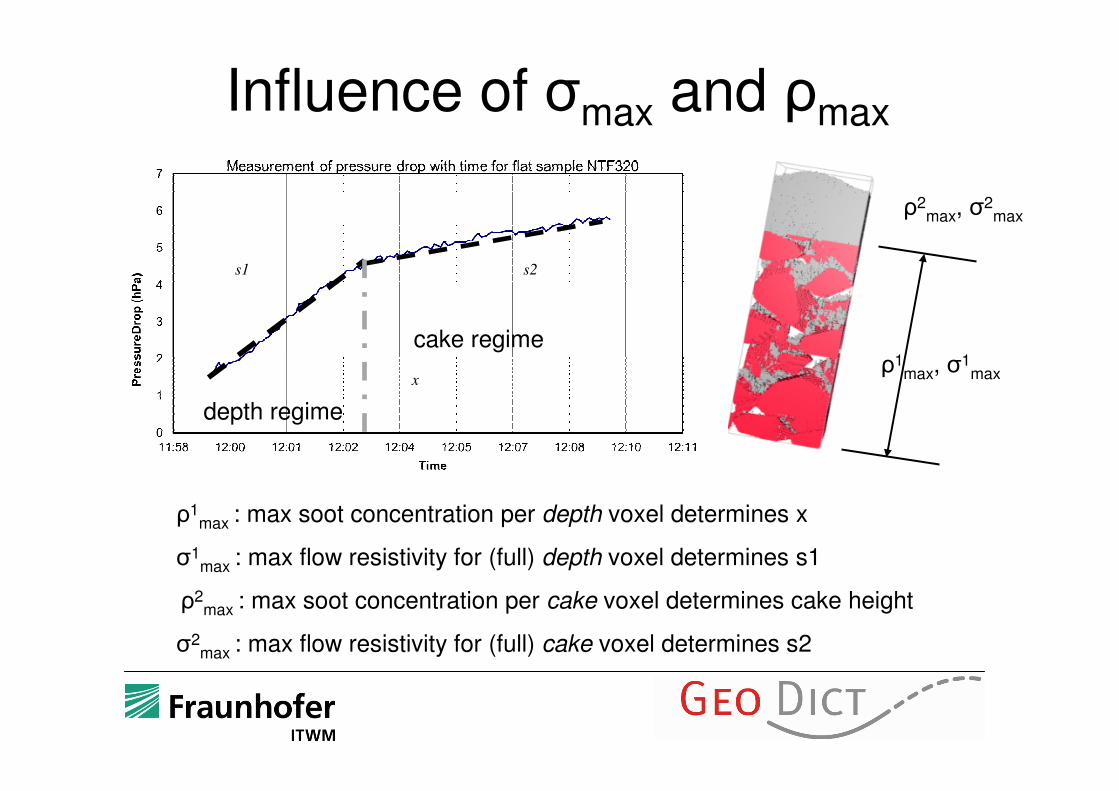
Influence of σmax and ρmax
s2s1
x
ρ1max : max soot concentration per depth voxel determines x
σ1max : max flow resistivity for (full) depth voxel determines s1
ρ2max : max soot concentration per cake voxel determines cake height
σ2max : max flow resistivity for (full) cake voxel determines s2
depth regime
cake regimeρ1
max, σ1
max
ρ2max, σ
2max
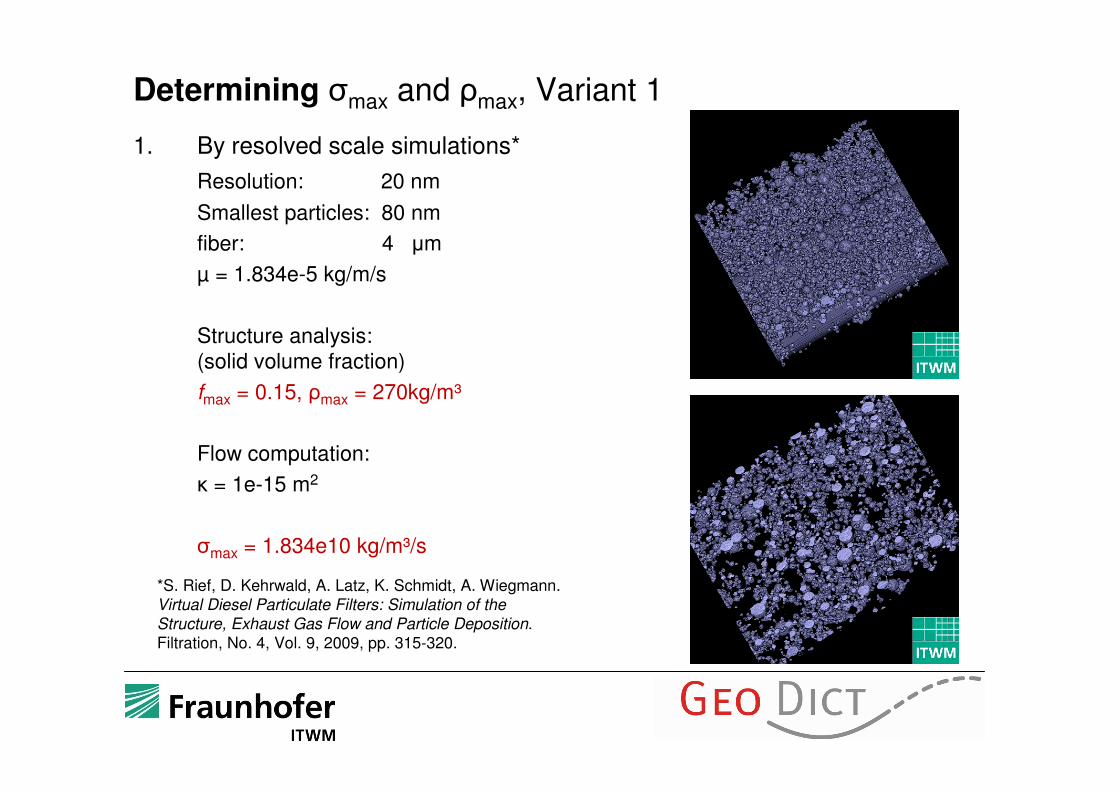
Determining σmax and ρmax, Variant 1
1. By resolved scale simulations*
Resolution: 20 nm
Smallest particles: 80 nm
fiber: 4 µm
µ = 1.834e-5 kg/m/s
Structure analysis:
(solid volume fraction)
fmax = 0.15, ρmax = 270kg/m³
Flow computation:
κ = 1e-15 m2
σmax = 1.834e10 kg/m³/s
*S. Rief, D. Kehrwald, A. Latz, K. Schmidt, A. Wiegmann. Virtual Diesel Particulate Filters: Simulation of the
Structure, Exhaust Gas Flow and Particle Deposition. Filtration, No. 4, Vol. 9, 2009, pp. 315-320.
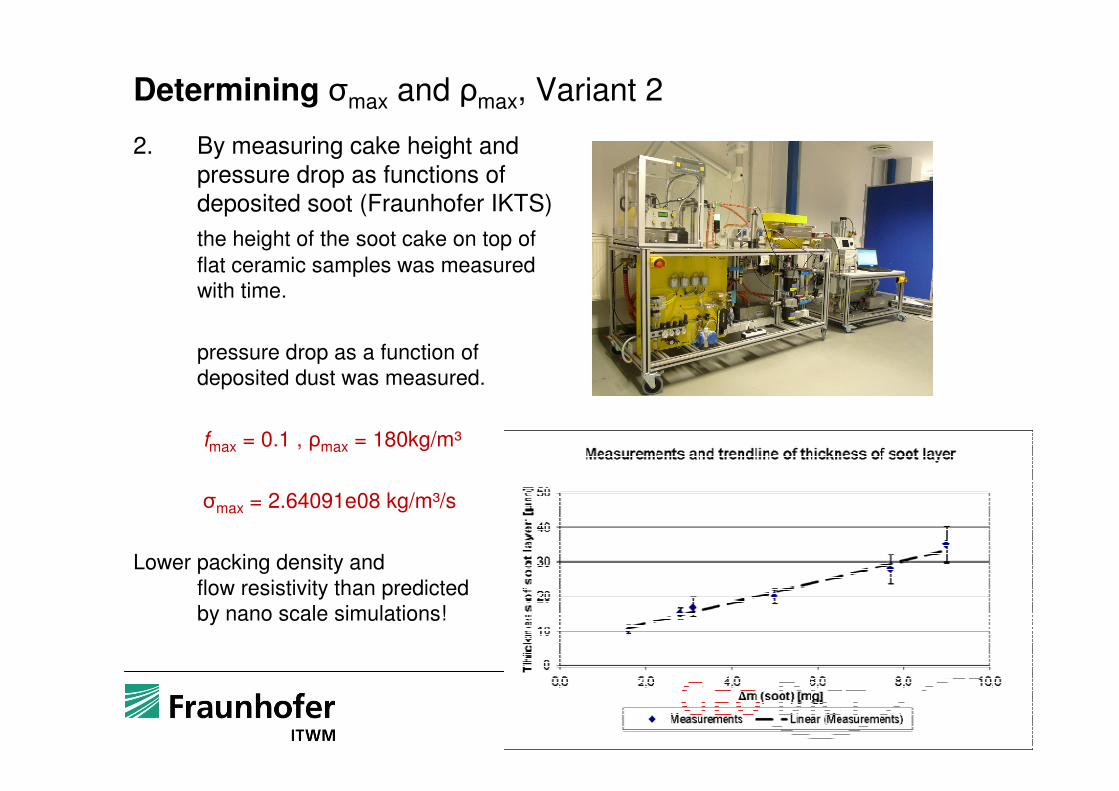
Determining σmax and ρmax, Variant 2
2. By measuring cake height and
pressure drop as functions of deposited soot (Fraunhofer IKTS)
the height of the soot cake on top of
flat ceramic samples was measured
with time.
pressure drop as a function of
deposited dust was measured.
fmax = 0.1 , ρmax = 180kg/m³
σmax = 2.64091e08 kg/m³/s
Lower packing density and
flow resistivity than predicted
by nano scale simulations!
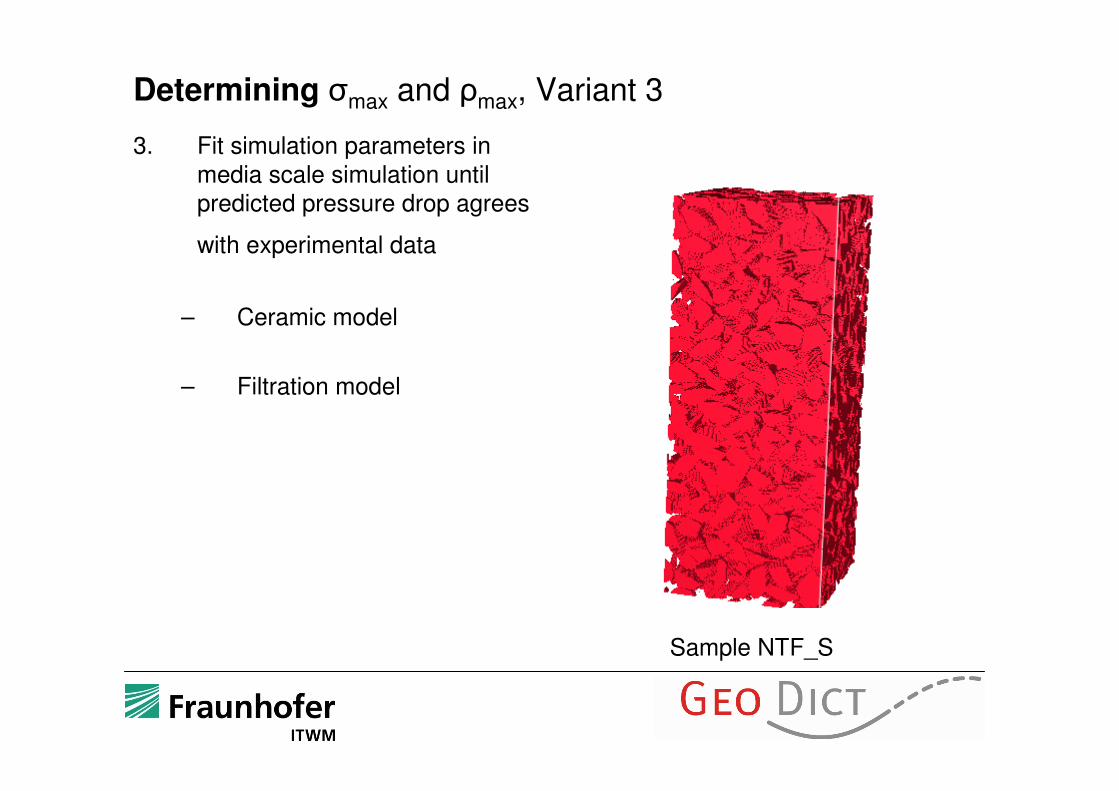
Determining σmax and ρmax, Variant 3
3. Fit simulation parameters in
media scale simulation until predicted pressure drop agrees
with experimental data
– Ceramic model
– Filtration model
Sample NTF_S
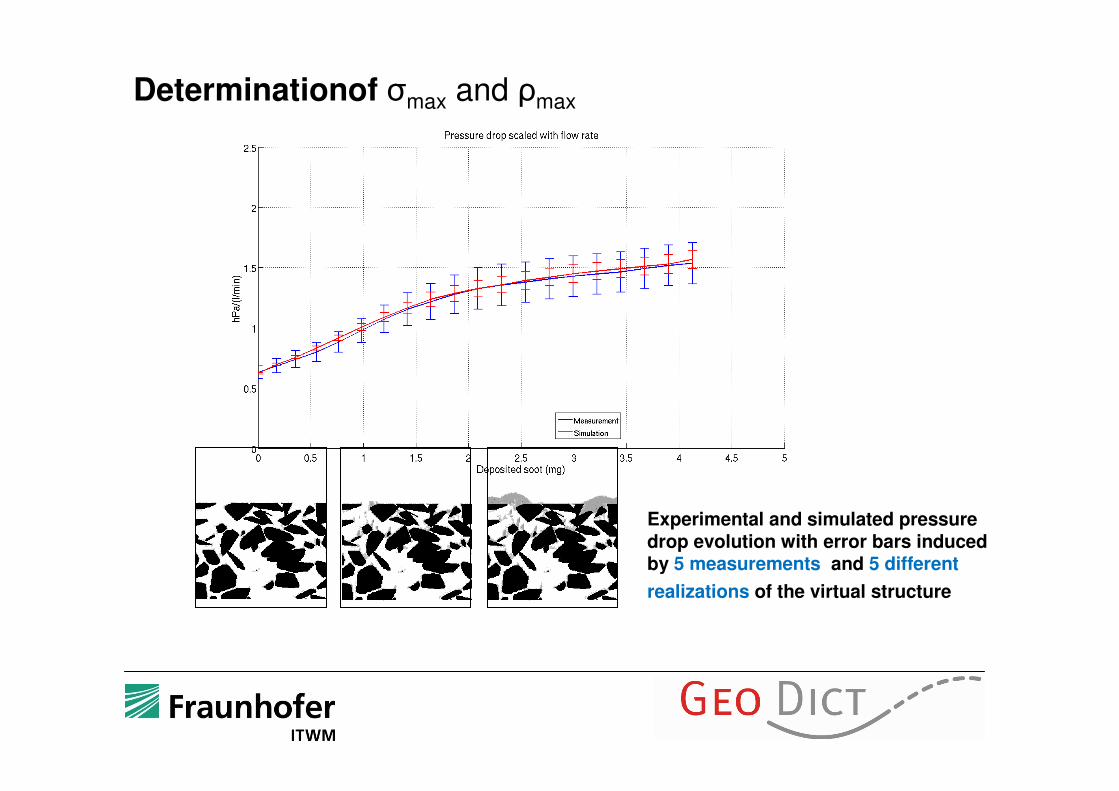
Experimental and simulated pressure drop evolution with error bars induced by 5 measurements and 5 different
realizations of the virtual structure
Determinationof σmax and ρmax

-2
-1
0
1
2
3
4
5
6
7
8
11:58 12:00 12:01 12:02 12:04 12:05 12:07 12:08 12:10 12:11
Messzeit
Messw
ert
e
Vol.-Strom
Diff.-Druck
Effect of σmax and ρmax
Pressure drop evolution with time for NTF_S
Fit [3]
ρd=150 kg/m3, fmax = 0.45,
ρ max = 67.5 kg/m3,
σ1max = 3.5e08 kg/m³/s
σ2max = 8.8e07 kg/m³/s
Density difference 150 vs 1800 arises from [1] considering primary particles, while [2] and [3] use agglomerates. ρmax relates to density of primary particles, 0.45 * 150/1800 = 0.0375, simulation
values even lower than estimates from cake height.
Cake height measurement [2]
ρd = 1800 kg/m3
ρmax= 180 kg/m3,
σmax = 2.64091e08 kg/m³/s
Micro simulation [1]
ρd = 1800 kg/m3
ρmax = 270 kg/m3
σmax = 1.834e10 kg/m³/s
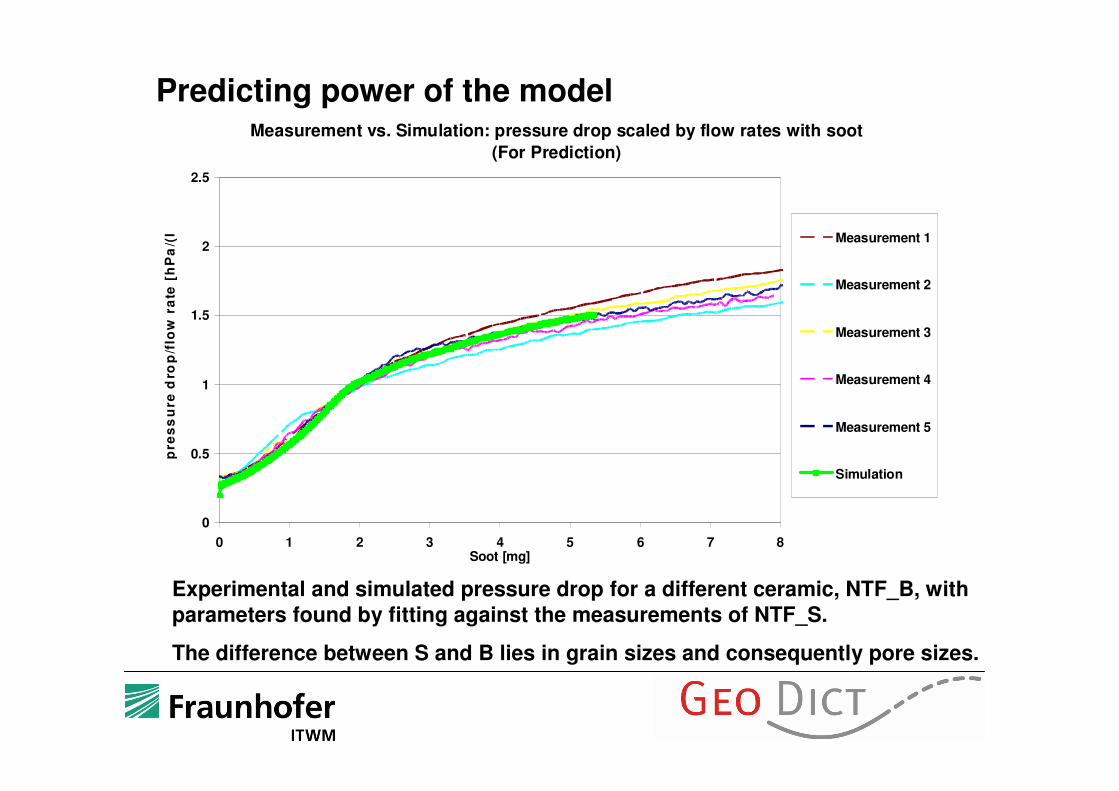
Predicting power of the model
Experimental and simulated pressure drop for a different ceramic, NTF_B, with
parameters found by fitting against the measurements of NTF_S.
The difference between S and B lies in grain sizes and consequently pore sizes.
Measurement vs. Simulation: pressure drop scaled by flow rates with soot
(For Prediction)
0
0.5
1
1.5
2
2.5
0 1 2 3 4 5 6 7 8Soot [mg]
pre
ss
ure
dro
p/f
low
ra
te [
hP
a/(
l/m
in)]
Measurement 1
Measurement 2
Measurement 3
Measurement 4
Measurement 5
Simulation
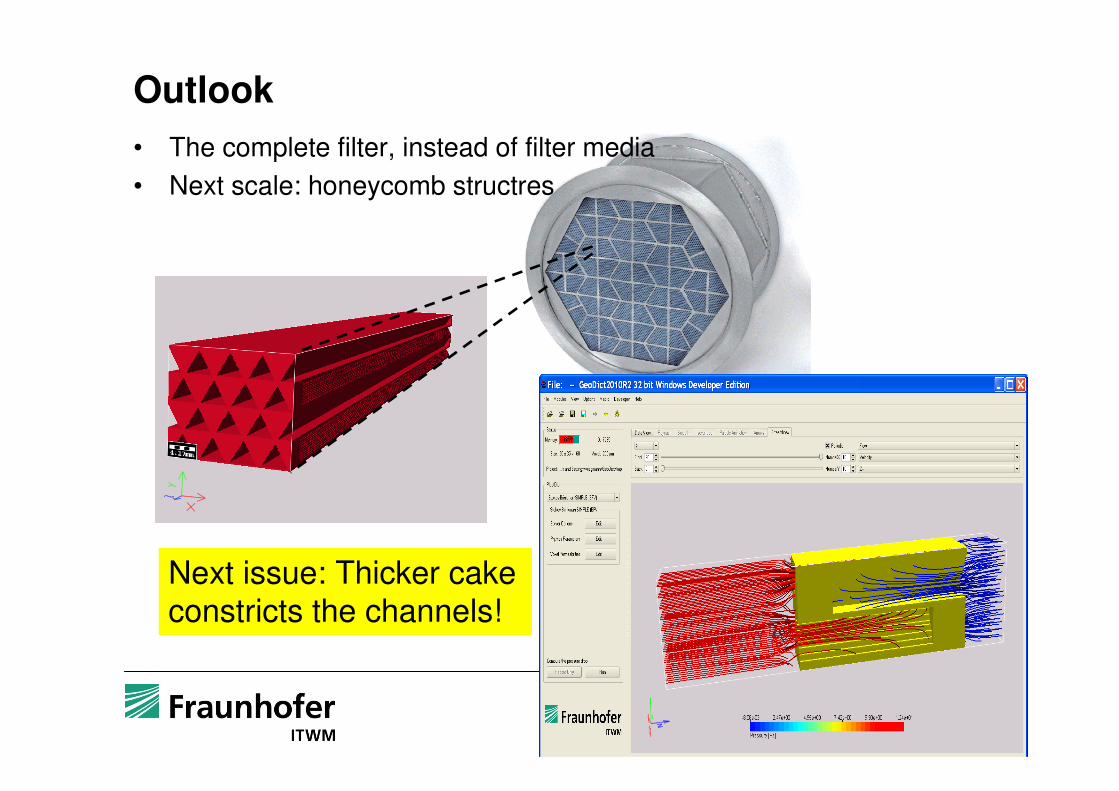
Outlook
• The complete filter, instead of filter media
• Next scale: honeycomb structres
Next issue: Thicker cake constricts the channels!

Conclusions
Multivariate resistivity model simple yet matches well against measurements
Parameters σmax and ρmax obtained by fitting against one ceramic predict correctly the pressure drop of a not too different but better DPF media.
This work confirms an important step in virtual material design:
The behavior of not yet existing materials can be predicted by
computer simulations, as long as the parameters were established
and validated against measurements of media that are not too
different from the new and virtual ones.
Acknowledgements
• We thank Fraunhofer Society for funding the FeiFilTools MEF project
• Media, flow, filtration and honeycomb simulations performed with GeoDict
Visit us at Booth F8 if you like
Thank you for your kind attention