
Stefan Greß, Marcus Tamm, Harald Tauchmann and …repec.rwi-essen.de/files/DP_05_028.pdf · 4...
26
Stefan Greß, Marcus Tamm, Harald Tauchmann and Jürgen Wasem A Dynamic Panel Data Approach No. 28 RWI ESSEN RWI : Discussion Papers
Transcript of Stefan Greß, Marcus Tamm, Harald Tauchmann and …repec.rwi-essen.de/files/DP_05_028.pdf · 4...

Stefan Greß, Marcus Tamm, Harald Tauchmannand Jürgen Wasem
A Dynamic Panel Data Approach
No. 28
RWIESSEN
RWI:
Dis
cuss
ion
Pape
rs

Rheinisch-Westfälisches Institutfür WirtschaftsforschungBoard of Directors:Prof. Dr. Christoph M. Schmidt, Ph.D. (President),Prof. Dr. Thomas K. BauerProf. Dr. Wim Kösters
Governing Board:Dr. Eberhard Heinke (Chairman);Dr. Dietmar Kuhnt, Dr. Henning Osthues-Albrecht, Reinhold Schulte
(Vice Chairmen);Prof. Dr.-Ing. Dieter Ameling, Manfred Breuer, Christoph Dänzer-Vanotti,Dr. Hans Georg Fabritius, Prof. Dr. Harald B. Giesel, Karl-Heinz Herlitschke,Dr. Thomas Köster, Hartmut Krebs, Tillmann Neinhaus, Dr. Günter Sander-mann, Dr. Gerd Willamowski
Advisory Board:Prof. David Card, Ph.D., Prof. Dr. Clemens Fuest, Prof. Dr. Walter Krämer,Prof. Dr. Michael Lechner, Prof. Dr. Till Requate, Prof. Nina Smith, Ph.D.,Prof. Dr. Harald Uhlig, Prof. Dr. Josef Zweimüller
Honorary Members of RWI EssenHeinrich Frommknecht, Prof. Dr. Paul Klemmer
RWI : Discussion PapersNo. 28Published by Rheinisch-Westfälisches Institut für Wirtschaftsforschung,Hohenzollernstrasse 1/3, D-45128 Essen, Phone +49 (0) 201/81 49-0All rights reserved. Essen, Germany, 2005Editor: Prof. Dr. Christoph M. Schmidt, Ph.D.ISSN 1612-3565 – ISBN 3-936454-45-0
The working papers published in the Series constitute work in progresscirculated to stimulate discussion and critical comments. Views expressedrepresent exclusively the authors’ own opinions and do not necessarilyreflect those of the RWI Essen.

RWI : Discussion PapersNo. 28
Stefan Greß, Marcus Tamm, Harald Tauchmannand Jürgen Wasem
RWIESSEN

Bibliografische Information Der Deutschen BibliothekDie Deutsche Bibliothek verzeichnet diese Publikation in der DeutschenNationalbibliografie; detaillierte bibliografische Daten sind im Internetüber http://dnb.ddb.de abrufbar.
ISSN 1612-3565ISBN 3-936454-45-0

Stefan Greß, Marcus Tamm, Harald Tauchmann and Jürgen Wasem*
Price Elasticities and Social Health Insurance Choicein Germany: A Dynamic Panel Data Approach
AbstractIn 1996 free choice of health insurers has been introduced in the German so-cial health insurance scheme. Competition between insurers was supposed toincrease efficiency. A crucial precondition for effective competition amonghealth insurers is that consumers search for lower-priced health insurers. Wetest this hypothesis by estimating the price elasticities of insurers’ marketshares. We use unique panel data and specify a dynamic panel model to ex-plain changes in market shares. Estimation results suggest that short-run priceelasticities are smaller than previously found by other studies. In the long-run,however, estimation results suggest substantial price effects.
JEL-Classification: I18, C33
Keywords: Competition, generalized method of moments, health insurance
* Stefan Greß, University Duisburg-Essen; Marcus Tamm, RWI Essen and Ruhr-UniversityBochum; Harald Tauchmann, RWI Essen; Jürgen Wasem, University Duisburg-Essen. Theauthors are grateful to Boris Augurzky, Jörg Breitung, Christoph M. Schmidt, and to participantsat the RAN (Risk Adjustment Network)-meeting for helpful comments and to Nadine Heck andMuhamed Kudic for research assistance. They also would like to thank Dostal & Partner(www.dostal-partner.de) for providing most of the data. All correspondence to Marcus Tamm,Rheinisch-Westfälisches Institut für Wirtschaftsforschung (RWI Essen), Hohenzollernstr. 1–3,45128 Essen, Germany, Fax: +49-201-8149236, Email: [email protected].

“The exit option is widely held to be uniquely powerful: by inflicting revenuelosses on delinquent management, exit is expected to induce that ‘wonderfulconcentration of the mind’ akin to the one Samuel Johnson attributed to theprospect of being hanged“ (Hirschman 1970).
1. Introduction
In the mid 1990s Germany and several other European countries such as theNetherlands and Switzerland undertook major reforms of their social healthinsurance systems. In Germany consumers were given free choice of socialhealth insurers starting in 1996. The concept of managed competition can beseen as blue print for reform in these countries (Enthoven 1988, 1993).1 Man-aged competition implies that risk-bearing health insurers compete with eachother based on price and quality. Furthermore, this concept presumes that in-surers induce non-efficient providers to work more efficiently and providegood quality. Otherwise, they are not contracted and drop out of the market.Finally managed competition assumes that consumers have free choice be-tween insurers and exercise their right to choose – at least to some degree.
This paper tests the last assumptions – for competition between health insur-ers to be effective, (i) consumers must have some choice between them. InHirschman’s terminology: consumers must have the exit option (Hirschman1970; Schlesinger 1995). At the same time, a crucial precondition for the suc-cess of reforms providing a higher degree of choice is that (ii) consumers areinclined to search for lower-priced health insurers or for insurers with higherquality. Our analysis focuses on the estimation of the price sensitivity of con-sumers.
In the German social health insurance market risk-bearing health insurerscompete for enrollees who are allowed to switch between companies on a reg-ular basis. In contrast to other countries with open enrolment such as Switzer-land or the Netherlands the enrolment period is not restricted to the end of theyear. Clients may switch at the end of each month if they stayed at their insur-ance company for at least 18 months or if the company has raised the pre-mium.
German social health insurers calculate income-dependent premiums that donot correspond to individual risks. Instead, they set contribution rates and cli-ents’ payments are equal to salaries times the contribution rate, up to an in-come ceiling. Half of the premium is paid by employers; the other half is paidby employees. Premiums are paid directly to the insurance companies. In prin-ciple, it is mandatory for all employed workers to acquire social health insur-ance. Yet, when the salary exceeds a threshold2 the person can choose whether
4 Stefan Greß, Marcus Tamm, Harald Tauchmann and Jürgen Wasem
1 At least in the Netherlands, health care reforms were based explicitly on Enthoven’s concept.

to remain in the social health insurance system or to opt out and acquire pri-vate health insurance. In this paper we do not address the choice between so-cial and private health insurance but focus on the choice within the socialhealth insurance system. I.e. our analysis does not explain the total number ofclients in the social health insurance system, but is based on the market sharesof insurance companies within this system.
The number of competing health insurance companies in Germany is quitehigh.3 Overall, there were 282 companies in 2004. Some companies operate ona national level, whereas the majority of health insurers operate in some re-gions only. Furthermore, access to several company-based health insurers(BKK) and guild-based health insurers (IKK) is restricted.4 Depending on therespective region (mostly states or Bundesländer), consumers can choose be-tween 50 and 100 health insurance companies. Thus, one requirement for man-aged competition to work is clearly fulfilled: consumers have free choice be-tween many insurers.
By legal restriction, competition among insurance companies is almost exclu-sively based on price (contribution rate), since more than 95 percent of thebenefits package is standardized across companies. Only for some services,such as alternative medicine, it is up to the insurance company to decidewhether or not and to what extent to include these services in the benefitspackage (Greß et al. 2005). Moreover, as a matter of principle, health insur-ance companies are obliged to contract collectively with all licensed healthcare providers. Legal opportunities to contract selectively are very limited.Hence, the quality of insurance is basically identical among companies andthus our analysis focuses on price differences, exclusively.
Consumers’ price sensitivity has been analyzed before, for Germany as well asfor other countries. Schwarze/Andersen (2001) use German micro-data andprovide a descriptive analysis of the socioeconomic background of switchersand non-switchers. Another study found that member losses and membergains of health insurers are closely correlated with contribution rates (Greß etal. 2002). Moreover, price elasticities of market shares between 1996 and 2001were found to be quite high (–2.90) and increasing over time (Schut et al.2003). This study by Schut et al. (2003) is quite closely related to ours. How-ever, they use data on health insurers aggregated by type of insurer and esti-
Price Elasticities and Social Health Insurance Choice in Germany 5
2 This threshold generally is somewhat higher than the income ceiling used for the calculation ofthe individual premiums, e.g. in 2004 persons with a monthly income of 3 862.50 ¤ were allowed tochoose between private and social health insurance and the income ceiling was equal to 3 487.50 ¤per month.3 In the remainder the term health insurer only refers to social health insurers.4 For a more detailed description of the origins of the quite peculiar German health insurancemarket see for example Greß et al. (2004).

mate a static panel data model only. Studies on price elasticities in other socialhealth insurance markets in Switzerland and in the Netherlands found muchsmaller price elasticities (Beck 2004;Schut,Hassink 2002;Schut et al. 2003).5
In our paper we apply a range of econometric techniques not applied to the re-search question before, in particular, we analyze dynamic models. Modeling adynamic process seems to be more appropriate than a static one because onlya small number of consumers is inclined to decide on their health insurer eachperiod and therefore the market is likely to display persistence. We use a newdata set which covers a quite recent period and is based on a complete panel ofindividual health insurers. So far, a complete panel has been available on anaggregated level only. Therefore our panel data on the level of individualhealth insurers is unique. Our findings support the notion that consumers dis-play a distinct sensitivity to differences in contribution rates.
The rest of the paper is organized as follows. Section 2 describes the data setthat has been collected for analyzing price sensitivity of consumers and sec-tion 3 specifies the econometric models used. Our estimation results are pre-sented in section 4. Finally section 5 concludes.
2. Data
This study is based on a complete panel of all individual health insurers thatwere active in the German social health insurance market between January2001 and April 2004.6 For each health insurer the panel includes the contribu-tion rate and the number of enrollees in each of seven waves. These sevenwaves are unequally spaced. The panel also contains information about merg-ers between health insurers. In our analysis, merged companies are consideredto be new entrants into the market, i.e. we use an unbalanced panel.
Because health insurers are not obliged to publish information on the numberof enrollees, data had to be collected by Dostal & Partner, a commercial mar-ket research company which is specialized in analyzing the German health in-surance market. The data have been validated by comparing them to informa-tion which was provided by several branch organizations of health insurersand by the Federal Ministry of Health. It is the first time that a complete panelof individual health insurers has been constructed. As a consequence, ourpanel covers the complete German social health insurance market. Otherstudies on price elasticities in Germany were only able to base their analysis
6 Stefan Greß, Marcus Tamm, Harald Tauchmann and Jürgen Wasem
5 There have been several studies on health plan choice in the US group health insurance market.Estimated out-of-pocket elasticities range from –0.2 (Feldman et al. 1989) to –1.8 (Royalty, Solo-mon 1999).6 Only those health insurers are excluded that did not have open enrolment and whose memberswere not allowed to switch – e.g a health insurer for miners and one insurer for sailors.

on aggregated data or on information about individual companies that cov-ered only a small part of the market (Schut et al. 2003).
Table 1 shows descriptive statistics about the development of contributionrates of health insurers. The mean of the contribution rate increased over thewhole period while the standard deviation decreased only after 2003. Thespread between the lowest and the highest contribution rate is quite large. In2004 switching from the company with the highest to the one with the lowestcontribution rate generates a combined annual saving of 2300 ¤ for an individ-ual and his employer if salaries meet the maximum income ceiling. However,most of the health insurers operate on a regional level.Accordingly, the spreadof contribution rates is much smaller in most regions. Thus, potential savingsmight be much smaller but are still substantial.
Table 2 describes the concentration of the market on a national level. Some ofthe biggest insurance companies lost market shares over time. Accordingly,the market share of the biggest 10 and the biggest 5 companies declined some-what from 2001 to 2004. On a national level, the biggest company has a marketshare of 11 percent.
3. Empirical Framework
3.1 The Model
The focus of this study is the choice among health insurers within the Germansocial health insurance system. Hence, this company-data based analysis tries
Price Elasticities and Social Health Insurance Choice in Germany 7
Contribution rates of health insumers2001 – 2004; %
1/2001 1/2002 7/2002 1/2003 7/2003 1/2004 4/2004
Mean 12.83 13.18 13.29 13.56 13.68 13.74 13.77SD 0.82 0.80 0.80 0.87 0.85 0.77 0.75Min 11.2 11.2 10.2 10.2 10.2 10.2 10.2Max 15.3 14.9 14.9 15.7 15.7 15.7 15.7
Authors’ calculations.
Table 1
Concentration of the social health insurance marketmarket shares of companies in %
1/2001 1/2002 7/2002 1/2003 7/2003 1/2004 4/2004
Top 10 59.8 59.2 58.3 57.7 56.8 56.5 56.5Top 5 43.8 43.2 42.5 42.0 41.0 40.7 40.7Min < 0.01 < 0.01 < 0.01 < 0.01 < 0.01 < 0.01 < 0.01Max 12.5 12.4 12.0 11.8 11.4 11.3 11.2
Authors’ calculations.
Table 2

to explain the market share of health insurer i in time t s it, . The number of in-surers in the market is N. To account for the fact that the endogenous variableis bounded between zero and one the model is specified as a conventional lo-gistic function
(1) sx
xiit
it i it
lt l ltl
N=′ + +
′ + +=
=∑
exp( )
exp( ), ...
β γ ε
β γ ε1
1 , N.
Here, xit represents a vector of explanatory variables, where i and l indicate in-surance companies. In our basic specification xit solely consists of the contri-bution rate pit . The parameter γ i captures unobserved heterogeneity acrossinsurance companies, and ε it is a random error term. Taking logarithms leadsto a quite convenient linear representation of the model,
(2) log( ) , ..., .s x i Nit it t i it= ′ + + + =β δ γ ε 1
δ t captures the logged numerator of equation (1) which is a time specific con-stant. By estimating a time-fixed-effects model any variation that is purelyacross periods and that affects all companies alike is removed.
It is important to keep in mind that the market shares of health insurers are ul-timately determined by consumers’ decisions. Our specification (1), therefore,directly relates to a discrete choice model for individual consumers (for detailssee Scanlon at al. 2002). However, consumers are not forced to explicitly de-cide on their health insurer each period and many are likely to avoid transac-tion and information costs by simply staying with their current insurer withoutconsidering any alternative. Therefore, the model should account for potentialpersistence of market shares and, correspondingly, is augmented by includingthe lagged endogenous variable on the right hand side
(3) log( ) log( ) , ..., ,s s x i Nit it it t i it= + ′ + + + =−α β δ γ ε1 1
with 0 1≤ ≤α capturing the degree of persistence. The resulting dynamic modelexhibits two quite interesting limiting cases.
If α = 0 holds, the model coincides with the simple static one. This correspondsto a world where each individual decides on its health insurance each period.Since company specific effects γ i reflect that the probability of being chosensystematically differs across companies, any persistence in market shares is –besides persistent deviations in premium rates – then solely due to these dif-ferences. Transitory variation in xit , i.e. in the contribution rate, has onlyshort-term and no long-term effect on market shares.
8 Stefan Greß, Marcus Tamm, Harald Tauchmann and Jürgen Wasem

If in contrastα = 1 holds, market shares are non-stationary, following a randomwalk. Hence, even if contribution rates remained stable no equilibrium of mar-ket shares exists and only changes in market shares but not their level can beexplained. Consequently, transitory changes in the explanatory variables havepermanent effects on market shares. A health insurer, for instance, whichlooses members because of a relatively high contribution rate, will not be ableto attract them again by simply closing the premium gap. By closing the gapthe insurer will only be able to prevent more clients from leaving. Finally, inthe intermediate case ( )0 1< <α transitory variation in explanatory variableshas long-lasting effects on market shares. However, these effects fade out overtime.
In correspondence to this discussion one might formulate different measuresfor consumers’ price sensitivity. Our primary interest is on short-run premiumelasticities of market shares η it , which are directly comparable to the resultsobtained from earlier work based on static models. According to our modelshort-run premium elasticities of market shares are equal to
(4) η∂∂
βitit
it
it
itp it it
s
p
p
ss p≡ = −( ) .1
β p denotes the coefficient referring to the contribution rate. In addition weare interested in long-run effects, i.e. in dynamic multipliers∂ ∂ α ηlog( ) / log( ) ,s p T tiT it
Tit= >−1 that capture the effect of a transitory
change in the contribution rate on future market shares and ultimately thelong-run effect of a permanent change
(5)∂∂
α ηα
ηlog( )
log( ).
s
piT
itt
TT t
t
T
it it= ≈−=
−
=∑ ∑
0 0
11
Here the approximation is accurate for small s it . Obviously, for the staticmodel, (5) equals (4) since changes in the contribution rate only have instanta-neous effects. In contrast, forα = 1 the long-run effect of a permanent change inthe contribution rate exceeds all limits, even if the short-term elasticity weresmall.
3.2 Estimation
While the limiting case specificationsα = 0 andα = 1 can easily be estimated us-ing conventional panel data techniques, this does not hold for the unrestricteddynamic specification. Therefore this subsection shortly discusses severalmethodological aspects for estimating this type of dynamic panel data model.An intuitive and more detailed survey on these models is given in Bond(2002).
Price Elasticities and Social Health Insurance Choice in Germany 9
limT→∞
limT→∞

By construction, in equation (3) the right hand side variable log( )s it−1 is corre-lated with the composite error ( )γ εi it+ , leading to inconsistent estimates, evenif individual heterogeneity is accounted for by either fixed- or random-effects(e.g. Baltagi 2001). When employing a simple instrumental variable estimator(Anderson, Hsiao 1982) consistency can be achieved under the assumption ofserially uncorrelated errorsε it . This estimator is based on first-differencing theregression equation and using twice lagged dependent variables as instru-ments for ∆ log( )s it−1 . If, however, the number of waves exceeds three and anyexplanatory variables xit are taken into account, the IV-estimator’s efficiencycan substantially be improved by using higher-order lagged endogenous vari-ables (i.e. log( ), log( )s sit it− −3 4 , ... instead of only log( )s it−2 ) and – potentially –past, present and future values of xit as additional instruments. This model isestimated within a GMM framework (Arellano, Bond 1991 for details). ForGMM, the number of valid instruments varies whether the explanatory vari-ables xit are exogenous, predetermined or endogenous with respect to the er-ror term ε it . That is, whether cov( , )xit iε τ = 0 holds for any t and τ, only for τ ≥ t,or just for τ > t, respectively.
Fortunately, as long as the model is over-identified, Sargan tests are availablefor testing the validity of the underlying assumptions (the so-called momentconditions) and therefore serve as a basis for selecting an appropriate specifi-cation. The basic Sargan test (Sargan 1958; Hansen 1982) examines whetherthe whole set of moment conditions is valid, e.g. if the instruments used for es-timation are valid and, hence, orthogonal to the error term. By contrast, thedifference Sargan test focuses on the validity of the additional moment condi-tions and the additional instruments, only. The difference Sargan test is ob-tained by comparing the Sargan statistics of a restricted and an unrestrictedmodel, the restricted also including the additional instruments and momentconditions.7
In this paper estimation of GMM is implemented using an efficient two-stepprocedure8. The conventional standard errors obtained from two-step GMMare likely to be underestimated in small samples. However, this can be ad-justed for by using a corrected variance estimator proposed by Windmeijer(2005). This corrected variance estimator has been shown to exhibit at leastequally good properties as the variance estimator obtained from one-stepGMM (Bond, Windmeijer 2002). Henceforth, in the reminder we only presentcorrected standard errors and focus on two-step GMM.
10 Stefan Greß, Marcus Tamm, Harald Tauchmann and Jürgen Wasem
7 In the sequel we stick to the conventional notation and refer to (difference) Sargan tests, al-though we actually present Hansen’s J-statistic based on robust estimates. Hansen’s J-statistic ispreferable due to bias of the original Sargan statistic in the presence of heteroskedasticity.8 The second step is based on a weighting matrix which is estimated from the results of a consis-tent first step estimation.
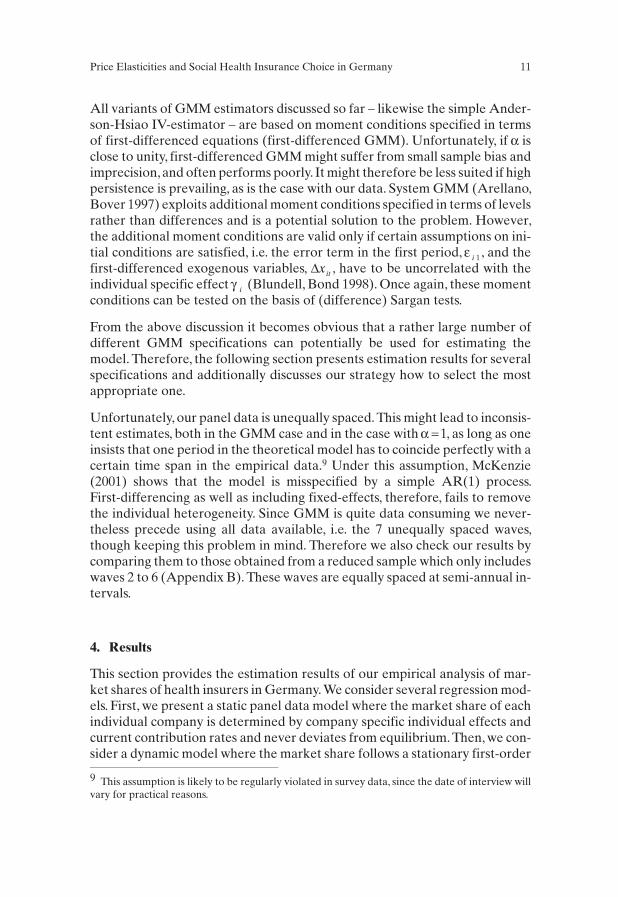
All variants of GMM estimators discussed so far – likewise the simple Ander-son-Hsiao IV-estimator – are based on moment conditions specified in termsof first-differenced equations (first-differenced GMM). Unfortunately, if α isclose to unity, first-differenced GMM might suffer from small sample bias andimprecision,and often performs poorly. It might therefore be less suited if highpersistence is prevailing, as is the case with our data. System GMM (Arellano,Bover 1997) exploits additional moment conditions specified in terms of levelsrather than differences and is a potential solution to the problem. However,the additional moment conditions are valid only if certain assumptions on ini-tial conditions are satisfied, i.e. the error term in the first period, ε i 1 , and thefirst-differenced exogenous variables, ∆xit , have to be uncorrelated with theindividual specific effect γ i (Blundell, Bond 1998). Once again, these momentconditions can be tested on the basis of (difference) Sargan tests.
From the above discussion it becomes obvious that a rather large number ofdifferent GMM specifications can potentially be used for estimating themodel. Therefore, the following section presents estimation results for severalspecifications and additionally discusses our strategy how to select the mostappropriate one.
Unfortunately, our panel data is unequally spaced. This might lead to inconsis-tent estimates, both in the GMM case and in the case with α = 1, as long as oneinsists that one period in the theoretical model has to coincide perfectly with acertain time span in the empirical data.9 Under this assumption, McKenzie(2001) shows that the model is misspecified by a simple AR(1) process.First-differencing as well as including fixed-effects, therefore, fails to removethe individual heterogeneity. Since GMM is quite data consuming we never-theless precede using all data available, i.e. the 7 unequally spaced waves,though keeping this problem in mind. Therefore we also check our results bycomparing them to those obtained from a reduced sample which only includeswaves 2 to 6 (Appendix B). These waves are equally spaced at semi-annual in-tervals.
4. Results
This section provides the estimation results of our empirical analysis of mar-ket shares of health insurers in Germany. We consider several regression mod-els. First, we present a static panel data model where the market share of eachindividual company is determined by company specific individual effects andcurrent contribution rates and never deviates from equilibrium. Then, we con-sider a dynamic model where the market share follows a stationary first-order
Price Elasticities and Social Health Insurance Choice in Germany 11
9 This assumption is likely to be regularly violated in survey data, since the date of interview willvary for practical reasons.

autoregressive process, i.e. market shares are persistent, yet differences in con-tribution rates can lead to long-lasting changes in the shares which fade out af-ter some time. Finally, we provide results for a model where market shares areconsidered to follow a non-stationary unit-root process ( )α = 1 , i.e. differencesin contribution rates lead to permanent changes in market shares and, hence,the model explains first differences of market shares. In order to discriminatebetween the stationary and the unit-root process we also provide results ofpanel unit-root tests. Subsequently, we test for differences in price elasticitiesfor different types of insurance companies and for varying time periods.
4.1 Static model
First, we present the results of a static panel data model. The market share ofeach individual company is solely determined by its current contribution rateand by company specific individual effects. The company specific effects rep-resent unobservable factors of health insurers which influence consumers intheir choice between companies and which might be correlated with the con-tribution rate. Examples for such factors not included in the data are the num-ber of branch offices, the quality of service the insurers provide, or any addi-tional medical treatments not compulsorily covered by the standard benefitpackage which, however, are covered by some of the companies.
The situation can be modeled as in equation (2).Here, it is assumed that the in-dividual specific effects are invariant over time. Depending on the assump-tions on the correlation between individual specific effects and contributionrates the model can either be estimated using random-effects or usingfixed-effects. The random-effects specification is clearly rejected by aHausman test (Hausman 1978). Therefore we only present results of thefixed-effects panel data model. As can be seen in Table 3 the sign of the coeffi-cient of the contribution rate is negative but the coefficient is clearly insignifi-cant. I.e. after controlling for company specific effects the contribution ratehas no influence on the market share.
4.2 Dynamic models
4.2.1 Generalized Method of Moments (GMM)
The dynamic model is equivalent to a world where only some consumers de-cide about staying with their health insurer or choosing a new one. Our estima-tion is based on equation (3). We compare several specifications based on dif-ferent moment conditions or sets of instruments.
Before reporting the GMM estimates we shortly mention the results of a sim-ple OLS regression and of a panel fixed-effects model (within-group-estima-tor) which both include the lagged market share as explanatory variable. The
12 Stefan Greß, Marcus Tamm, Harald Tauchmann and Jürgen Wasem

OLS estimates for the coefficient on the lagged market share are known to bebiased upwards, whereas for the panel fixed-effects model they are known tobe biased downwards. Hence, the two point estimates 1.0053 and 0.8122 (Ta-ble 8 in the Appendix) might serve as upper and lower bound for the true coef-ficient.10
The first two specifications in Table 4 are based on an Arellano-Bond typefirst-differenced GMM estimator. In column 1 we present the results for aspecification where the contribution rate is assumed to be predetermined, allavailable instruments are used and the estimation is done by two-step GMM(GMM1). The contribution rate has a negative effect on the market share butis clearly insignificant and the lagged market share has a coefficient (α) closeto one. Furthermore, the statistic of the Sargan test is highly significant, indi-cating that some of our over-identifying restrictions are not valid. A test wherethe matrix of possible instruments has been reduced to a minimum, i.e.∆ log( )s it−1 and ∆xit are instrumented by only one instrument each, indicatesthat the additional restrictions are not valid since the difference-Sargan test issignificant (χ ( ) .25
2 45 76= ).
Yet, when the contribution rate is treated as endogenous (GMM2) the Sarganstatistic becomes insignificant at the 5%-level. The difference-Sargan test be-tween GMM1 and GMM2 is significant and clearly confirms these findings( . )( )χ 5
2 17 38= . Therefore, we conclude that the contribution rate indeed is en-dogenous. In GMM2 the estimated coefficient for α is lower than before butstill relatively close to unity and the contribution rate is insignificant. Since thefirst-differenced GMM model is only weakly identified if α is close to unity wemight favor the system GMM estimator in this case. Therefore, we now go onconsidering an Arellano-Bover type system GMM estimator which includesadditional moment conditions and therefore allows identification of themodel even if α is close to unity.
Price Elasticities and Social Health Insurance Choice in Germany 13
Panel fixed-effects estimates for static model
Coefficient Std. error
Contribution rate –0.0045 0.0274Within-R² 0.1546F-Test 12.32***Observations 1960Hausman test (χ 2) 73.11***
Authors’ calculations. – Regression includes time dummies for each wave. Huber-White robuststandard errors given. – ***Indicates significance at 1% level; **at 5% level; *at 10% level.
Table 3
10 This procedure has been proposed and applied in Bond (2002), at least for models without ad-ditional explanatory variables.
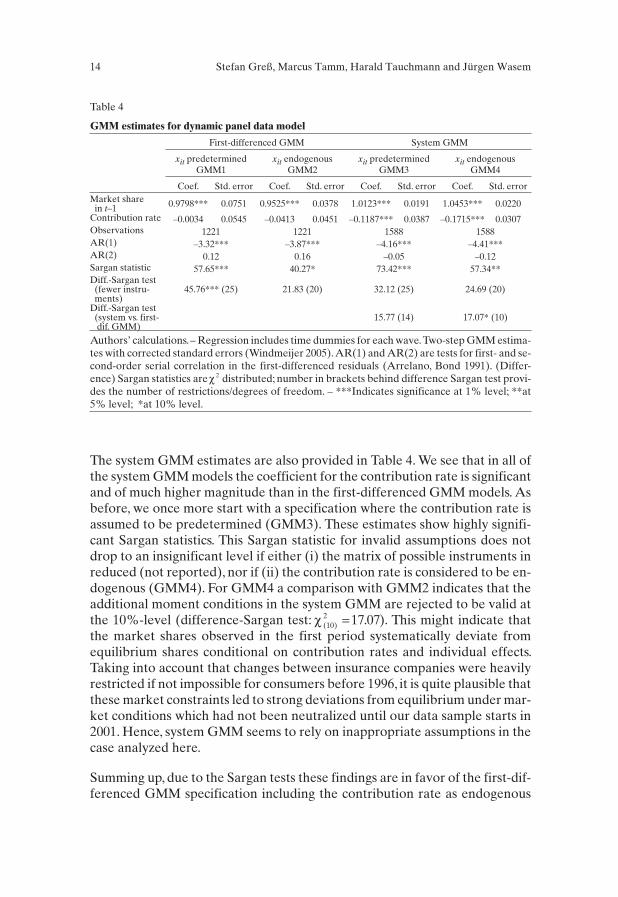
The system GMM estimates are also provided in Table 4. We see that in all ofthe system GMM models the coefficient for the contribution rate is significantand of much higher magnitude than in the first-differenced GMM models. Asbefore, we once more start with a specification where the contribution rate isassumed to be predetermined (GMM3). These estimates show highly signifi-cant Sargan statistics. This Sargan statistic for invalid assumptions does notdrop to an insignificant level if either (i) the matrix of possible instruments inreduced (not reported), nor if (ii) the contribution rate is considered to be en-dogenous (GMM4). For GMM4 a comparison with GMM2 indicates that theadditional moment conditions in the system GMM are rejected to be valid atthe 10%-level (difference-Sargan test: χ ( ) .10
2 17 07= ). This might indicate thatthe market shares observed in the first period systematically deviate fromequilibrium shares conditional on contribution rates and individual effects.Taking into account that changes between insurance companies were heavilyrestricted if not impossible for consumers before 1996, it is quite plausible thatthese market constraints led to strong deviations from equilibrium under mar-ket conditions which had not been neutralized until our data sample starts in2001. Hence, system GMM seems to rely on inappropriate assumptions in thecase analyzed here.
Summing up, due to the Sargan tests these findings are in favor of the first-dif-ferenced GMM specification including the contribution rate as endogenous
14 Stefan Greß, Marcus Tamm, Harald Tauchmann and Jürgen Wasem
GMM estimates for dynamic panel data model
First-differenced GMM System GMM
xit predeterminedGMM1
xit endogenousGMM2
xit predeterminedGMM3
xit endogenousGMM4
Coef. Std. error Coef. Std. error Coef. Std. error Coef. Std. errorMarket sharein t–1 0.9798*** 0.0751 0.9525*** 0.0378 1.0123*** 0.0191 1.0453*** 0.0220
Contribution rate –0.0034 0.0545 –0.0413 0.0451 –0.1187*** 0.0387 –0.1715*** 0.0307Observations 1221 1221 1588 1588AR(1) –3.32*** –3.87*** –4.16*** –4.41***AR(2) 0.12 0.16 –0.05 –0.12Sargan statistic 57.65*** 40.27* 73.42*** 57.34**Diff.-Sargan test(fewer instru-ments)
45.76*** (25) 21.83 (20) 32.12 (25) 24.69 (20)
Diff.-Sargan test(system vs. first-dif. GMM)
15.77 (14) 17.07* (10)
Authors’ calculations.– Regression includes time dummies for each wave.Two-step GMM estima-tes with corrected standard errors (Windmeijer 2005). AR(1) and AR(2) are tests for first- and se-cond-order serial correlation in the first-differenced residuals (Arrelano, Bond 1991). (Differ-ence) Sargan statistics areχ 2 distributed; number in brackets behind difference Sargan test provi-des the number of restrictions/degrees of freedom. – ***Indicates significance at 1% level; **at5% level; *at 10% level.
Table 4

regressor (GMM2), although being close to a unit-root process and, hence,poor precision of the estimates.
4.2.2 Model in first differences
In this subsection we finally provide the results for a model as in equation (2),however in this case our dependent variable is not the market share but thefirst difference of market shares, ∆ log( )s it . This refers to a world where transi-tory differences in contribution rates lead to permanent changes in marketshares. Once a consumer changed his insurance company he will stay with thenew company as long as no further differences in contribution rates prevail orany unsystematic effects occur. In the long-run there are no insurance compa-nies which are big because they started big and there are no companies whichare small because they started small,because as long as there are differences incontribution rates, market shares will change and these changes will be perma-nent.
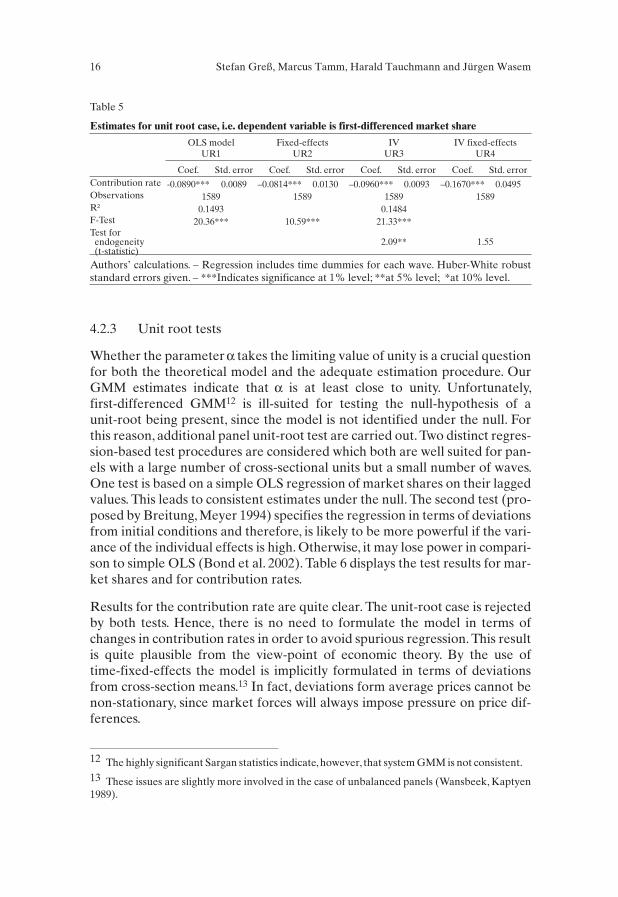
In this model, which explains changes in market shares rather than levels, indi-vidual effects represent company specific drifts. Such drifts might, for instance,be due to death rates that vary across companies. In fact, an F-test on joint sig-nificance of the company specific fixed-effects is highly significant indicatingthat a fixed-effects model (UR2) is preferable to a simple OLS regression(UR1).Results for the fixed-effects as well as the OLS regression are providedin Table 5. In both models the contribution rate is highly significant and themagnitude is comparable.
However, taking into account the results from the GMM estimates in the pre-ceding subsection one might doubt if the contribution rate is exogenous.Therefore we instrument the contribution rate by its own lagged value andprovide the results of IV estimations in Table 5, too. In the case withoutfixed-effects (UR3) we only observe a very small change in the coefficient forthe contribution rate. Yet, a test for endogeneity11 indicates that the variableindeed is endogenous. In contrast, in the case with fixed-effects (UR4) the co-efficient for the contribution rate almost doubles, there however a test forendogeneity is insignificant. Hence, we regard UR2 as our preferred specifica-tion in the class of the unit-root models and focus further discussion on UR2.
Price Elasticities and Social Health Insurance Choice in Germany 15
11 The test for endogeneity proposed in Wooldridge (2002) is based on the estimated residualfrom a regression of the instrumented variable on all other exogenous variables. These estimatedresiduals are then included in the original regression. The instrumented variable is concluded tobe endogenous if the estimated residuals have significant explanatory power in the original re-gression.
4.2.3 Unit root tests
Whether the parameter α takes the limiting value of unity is a crucial questionfor both the theoretical model and the adequate estimation procedure. OurGMM estimates indicate that α is at least close to unity. Unfortunately,first-differenced GMM12 is ill-suited for testing the null-hypothesis of aunit-root being present, since the model is not identified under the null. Forthis reason, additional panel unit-root test are carried out. Two distinct regres-sion-based test procedures are considered which both are well suited for pan-els with a large number of cross-sectional units but a small number of waves.One test is based on a simple OLS regression of market shares on their laggedvalues. This leads to consistent estimates under the null. The second test (pro-posed by Breitung, Meyer 1994) specifies the regression in terms of deviationsfrom initial conditions and therefore, is likely to be more powerful if the vari-ance of the individual effects is high. Otherwise, it may lose power in compari-son to simple OLS (Bond et al. 2002). Table 6 displays the test results for mar-ket shares and for contribution rates.
Results for the contribution rate are quite clear. The unit-root case is rejectedby both tests. Hence, there is no need to formulate the model in terms ofchanges in contribution rates in order to avoid spurious regression. This resultis quite plausible from the view-point of economic theory. By the use oftime-fixed-effects the model is implicitly formulated in terms of deviationsfrom cross-section means.13 In fact, deviations form average prices cannot benon-stationary, since market forces will always impose pressure on price dif-ferences.
16 Stefan Greß, Marcus Tamm, Harald Tauchmann and Jürgen Wasem
Estimates for unit root case, i.e. dependent variable is first-differenced market share
OLS modelUR1
Fixed-effectsUR2
IVUR3
IV fixed-effectsUR4
Coef. Std. error Coef. Std. error Coef. Std. error Coef. Std. errorContribution rate -0.0890*** 0.0089 –0.0814*** 0.0130 –0.0960*** 0.0093 –0.1670*** 0.0495Observations 1589 1589 1589 1589R² 0.1493 0.1484F-Test 20.36*** 10.59*** 21.33***Test forendogeneity(t-statistic)
2.09** 1.55
Authors’ calculations. – Regression includes time dummies for each wave. Huber-White robuststandard errors given. – ***Indicates significance at 1% level; **at 5% level; *at 10% level.
Table 5
12 The highly significant Sargan statistics indicate,however, that system GMM is not consistent.13 These issues are slightly more involved in the case of unbalanced panels (Wansbeek, Kaptyen1989).

Unfortunately, the different tests yield different results for market shares.While simple OLS clearly rejects the hypothesis of a unit-root being present inthe series of market shares, the Breitung-Meyer test does not reject the null atany plausible level of significance. Therefore, these test results do not unam-biguously answer the question whether the model has to be formulated interms of first differences of market shares or as a more general dynamic one.
Taking together the information from these panel unit-root tests and the esti-mated results from our GMM specification (GMM2) and the specification offirst-differenced market shares with fixed-effects (UR2), we conclude thatboth are quite similar. Although being found to be only weakly identified incomparable cases, the GMM2 estimates of α are not significantly differentfrom one and therefore overlap with the unit-root case. Furthermore, the con-fidence interval of the estimate for β in GMM2 includes the point estimate ofthe other specification (UR2). Hence, these results are comparable. We preferthe results of UR2, mostly because of identification problems with GMM2 insmall samples and its low precision in terms of large standard errors, but go onpresenting further results for both specifications. The preference for UR2 isreinforced by the results based on waves 2 to 6, only, i.e. the equally spacedpanel (Appendix B).
4.3 Model extensions
In order to check sensitivity of the price sensitivity of market shares with re-spect to (i) the chosen time period, (ii) the type of health insurance company,(iii) open vs. restricted enrolment in companies, and (iv) regional restrictionsof insurance companies we estimate several models where we include interac-tion terms between contribution rate and time, type of insurance company,and other group indicators, respectively. These sensitivity checks are per-formed for our preferred models from the above specifications, i.e. GMM2and UR2.
Sensitivity of price elasticities with respect to time is analyzed for two separatecases. First, we check for a time trend of the coefficient for the contribution
Price Elasticities and Social Health Insurance Choice in Germany 17
Panel Unit-Root Tests
Market share Contribution rate
Simple OLS Breitung-Meyer Simple OLS Breitung-Meyer
Coefficient lagged value 0.9844 1.2094 0.8743 0.9309t-statistic –6.2956 5.5407 –9.2923 –4.9029p-value(one sided t-test)
0.000 1.000 0.000 0.000
Authors’ calculations. – Regression includes time dummies for each wave. Regressions with/without uniform constant yield similar results. Heteroskedasticity-robust standard errors given.
Table 6

rate and then we estimate the coefficient for two different time periods, i.e. thebaseline coefficient represents waves 1–4 and an interaction term is includedfor period 2 which represents waves 5–7. For detailed results, see Table 9 in theAppendix. In both specifications, the GMM model seems to argue in favor of arecent increase in consumers’ price sensitivity, while the unit-roots specifica-tion does not indicate any significant change. Nevertheless, the insights fromthe GMM models are weak. F-tests on the overall price effect in later periodsdo not indicate a significant price sensitivity. That is, in model GMM2a, thesum of the coefficient for the contribution rate and the interaction term be-tween contribution rate and period 2 being different from zero is rejected( : . ),H Fp p period0 2 1 3240 062β β+ = =and . In the specification with timetrend (GMM2b), a comparable F-test ( : )H tp p trend0 0β β+ ⋅ = is also insignifi-cant for 0 < t ≤ 7.
We distinguish five types of insurance companies which are large regionalcompanies (Allgemeine Ortskrankenkassen AOK), two types of substitutecompanies (Ersatzkassen für Angestellte EAN and Ersatzkassen für ArbeiterEAR), guild-based insurance companies (Innungskrankenkassen IKK), andcompany-based insurance companies (Betriebskrankenkassen BKK). The lat-ter is our reference group. In the specification for the unit root case as well asin the GMM case, the interaction-terms between contribution rate and type ofinsurance company are all insignificant both individually and jointly (Table 10in the Appendix).
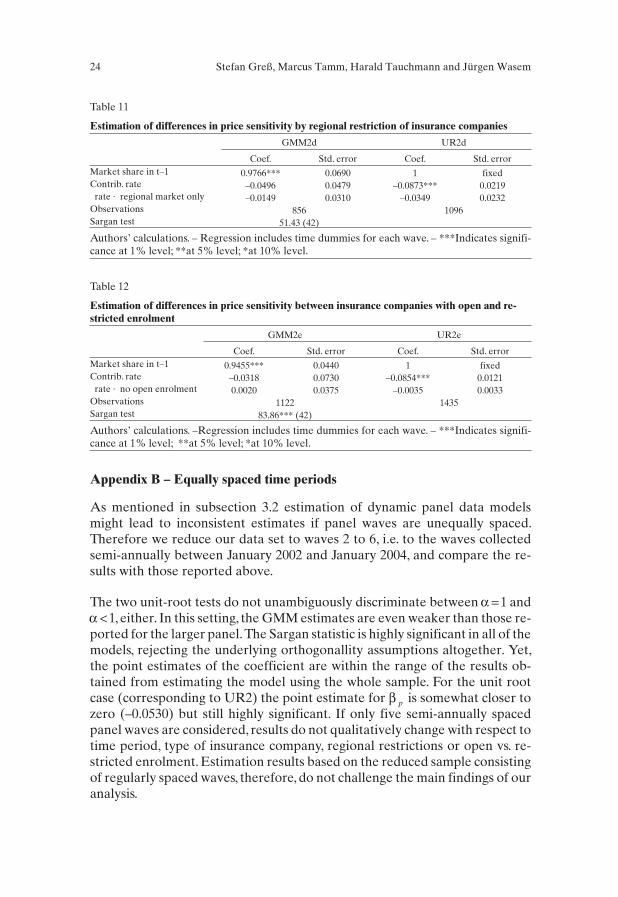
As already national, most companies operate only in one or few regions.Hence, the relevant market of companies with local restrictions is muchsmaller and might restrict their potential to attract new clients. Yet, our resultsshow no significant differences in consumers’ response to contribution ratesbetween companies with and without regional restrictions (Table 11 in theAppendix).
Although being able to opt for open enrolment some of the BKK and IKK de-cide to have restricted enrolment. This is due to their roots as company- andguild-based insurance companies respectively. Hence, only those consumersworking at the company or being member of a certain profession are eligibleto enroll in these insurance companies, though are not forced to do so. There-fore, the relevant market of these companies is much smaller than of thosewith open enrolment. However, we do not see any differences between thesecompanies either (Table 12 in the Appendix).
4.4 Elasticities
After having discussed several specifications for estimating the effect of priceon market share, we now present the premium elasticities of market shares im-plied by the estimated coefficients. The point estimates of the elasticities and
18 Stefan Greß, Marcus Tamm, Harald Tauchmann and Jürgen Wasem

the corresponding 95%-confidence intervals for the static model, GMM2 andUR2 are given in Table 7. The short-run premium elasticity is based on equa-tion (4) and calculated for the sample mean.
The point estimates of the elasticity for the static model and for GMM2 areboth negative, however, due to insignificance of β p , they are not significantlydifferent from zero. Yet, our preferred estimate for UR2, i.e. the unit-rootspecification with fixed-effects, is significant. At the one hand, UR2 is pre-ferred to the simple OLS unit-root specification. At the other, it displays morerobust results and by far smaller standard errors than competing dynamicspecifications estimated using GMM. Moreover, it is favored against the staticmodel.Finally,estimates presented in the preceding subsection do not argue infavor of including interaction terms of the premium rate and other explana-tory variables in the model.
At sample mean UR2 displays a short-term premium elasticity of about minusone. This indicates a distinct sensitivity of consumers to differences in contri-bution rates. Thus a crucial precondition for managed competition to work isfulfilled.
5. Conclusions
This paper provides two important elements that advance insights in the dy-namics of the German social health insurance market. First, it is based on aunique panel data set which covers the social health insurance market com-pletely on the level of individual insurance companies. Prior to this study, onlydata on an aggregated level with very few observations were available. Sec-ond, this paper uses an advanced econometric technique which takes into ac-count the dynamics of the market. So far, studies on price elasticities in theGerman social health insurance market have been based on static modelsonly.
The econometric analysis favors a dynamic model which explains changes inmarket shares by the level of premiums. For this specification we obtain ashort-run premium elasticity of market shares of approximately minus one.This indicates a moderate short-run sensitivity of consumers to differences in
Price Elasticities and Social Health Insurance Choice in Germany 19
Estimates of the short run premium elasticity
Static Model GMM2 UR2
Mean Premium elasticity –0.06 –0.55 –1.0995%-confidence interval –0.78 +0.66 –1.74 +0.64 –1.43 –0.75
Authors’ calculations. – Elasticity estimated for sample mean. Estimation based on result fromTables 3, 4 and 5.
Table 7

contribution rates. Compared to earlier analyses dealing with the Germancase, e.g. Schut et al. (2003), our elasticity is smaller than the one estimatedthere. Interestingly, our results are much closer to those obtained for othercountries like Switzerland (Beck 2004). However, from the point of view ofeconomic theory, the estimated short-run price sensitivity appears to be rathersmall keeping in mind that consumers can choose between almost perfect sub-stitutes; for perfect substitutes the price elasticity should approach infinity.Hence, one might hypothesize that different health insurers are not perceivedas perfect substitutes by many consumers.
Yet, in contrast to earlier analyses our results are based on a dynamic specifi-cation. Our results indicate that market shares follow a unit-root process orare, at least, close to non-stationarity. That is, even if the price sensitivity mightappear to be rather moderate in the short-term, in the long-run permanent rel-ative changes in contribution rates will have dramatic effects on the marketshares of health insurers. Insurers which permanently charge contributionrates that are higher than those of competitors and do not offset this by beingattractive to consumers for other reasons than price, will ultimately drop outof the market. However, this process might take some time.
Clearly, we have been able to show that consumers exert their right to chooseamong social health insurers, that the choice is sensitive to price, and thattherefore major conditions for managed competition to work are fulfilled.Furthermore, our results show that this will – at least in the long-run – imposesubstantial pressure on health insurers. In other words, “the prospect of beinghanged” is real. Yet, it is less clear whether this will ultimately lead to en-hanced efficiency as intended by the reform of 1996. Other – possibly morepromising – strategies to reduce the premium are available, e.g. risk selectionstrategies (Jacobs et al. 2002; Behrend et al. 2004). Analyzing gains and lossesin efficiency, therefore, remains a topic for future research.
20 Stefan Greß, Marcus Tamm, Harald Tauchmann and Jürgen Wasem

References
Anderson, T.W. and C. Hsiao (1982), Formulation and Estimation of Dynamic ModelsUsing Panel Data. Journal of Econometrics 18: 578–606.
Arellano, M. and S. Bond (1991), Some Tests of Specification for Panel Data: MonteCarlo Evidence and an Application to Employment Equations. Review of Eco-nomic Studies 58: 277–297.
Arellano, M. and O. Bover (1995), Another Look at the Instrumental-Variable Estima-tion of Error-Components Models. Journal of Econometrics 68: 29–52.
Baltagi, B.H. (2001), Econometric Analysis of Panel Data. Second ed. Chichester: JohnWiley & Sons.
Beck, K. (2004), Risiko Krankenversicherung – Risikomanagement in einem regulier-ten Krankenversicherungsmarkt. Bern: Haupt.
Behrend, C., S. Greß, R. Holle, P. Reitmeir, K. Tolksdorff and J. Wasem (2004), Zur Er-klärungskraft des heutigen soziodemografischen Risikostrukturausgleichsmodells.Ergebnisse empirischer Analysen an Prozessdaten einer ostdeutschen Regional-kasse. Journal of Public Health 12: 20–31.
Blundell, R. and S. Bond (1998), Initial Conditions and Moment Restrictions in Dy-namic Panel Data Models. Journal of Econometrics 87: 115–143.
Bond, S. (2002), Dynamic panel data models: a guide to micro data methods and prac-tice. Portuguese Economic Journal 1: 141–162.
Bond S, C. Nauges and F. Windmeijer (2002), Unit Roots and Identification inAutoregressive Panel Data Models: A Comparison of Alternative Tests. Institute forFiscal Studies, London. Internet: http://econpapers.hhs.se/cpd/2002/67_Nauges.pdf,downloaded Nov. 1, 2004.
Bond, S. and F. Windmeijer (2002), Finite Sample Inference for GMM Estimators inlinear Panel Data Models. Cemmap Working Paper 04/02. Institute for FiscalStudies, London.
Breitung, J. and W. Meyer (1994), Testing for unit roots in panel data: are wages on dif-ferent bargaining levels cointegrated? Applied Economics 26: 353–361.
Enthoven, A. (1988), Theory and practice of managed competition in health care fi-nance. Amsterdam: North Holland.
Enthoven, A. (1993), The history and principles of managed competition. Health Af-fairs 12: 24–48.
Feldman, R., M. Finch, B. Dowd and S. Cassou (1989), The demand for employ-ment-based health insurance. Journal of Human Resources 24: 115–142.
Greß, S., S. Gildemeister and J. Wasem (2004), The Social Transformation of AmericanMedicine – A Comparative View From Germany. Journal of Health Politics, Policyand Law 29: 679–699.
Greß, S., P. Groenewegen, J. Kerssens, B. Braun and J. Wasem (2002), Free choice ofsickness funds in regulated competition: evidence from Germany and the Nether-lands. Health Policy 60: 235–254.
Price Elasticities and Social Health Insurance Choice in Germany 21

Greß, S., D. Niebuhr, H. Rothgang and J. Wasem (2005), Benefit Decisions in GermanSocial Health Insurance. In T.S. Jost (ed.), Health Care Coverage Determinations:An International Comparative Study. London: Open University Press, 115–131.
Hansen, L. (1982), Large Sample Properties of Generalized Method of Moments Esti-mators. Econometrica 50: 1029–1054.
Hausman, J. (1978), Specification Tests in Econometrics. Econometrica 46: 1251–1271.
Hirschman, A. (1970), Exit, voice and loyalty – Responses to decline in firms, organiza-tions and states. Cambridge, MA: Harvard University Press.
Jacobs, K., P. Reschke, D. Cassel and J. Wasem (2002), Zur Wirkung des Risikostruktur-ausgleichs in der Gesetzlichen Krankenversicherung – Eine Untersuchung im Auf-trag des Bundesministeriums für Gesundheit: Endbericht. Schriftenreihe desBundesministeriums für Gesundheit 140. Baden-Baden: Nomos.
McKenzie, D.J. (2001), Estimation of AR(1) models with unequally spaced pseudo-panels. Econometrics Journal 4: 89–108.
Royalty, A.B. and N. Solomon (1999), Health plan choice. Price elasticities in a man-aged competition setting. Journal of Human Resources 34: 1–41.
Sargan, J. (1958), The Estimation of Economic Relationships using Instrumental Vari-ables. Econometrica 26: 393–415.
Scanlon, D.P., M. Chernew, C. McLaughlin and G. Solon (2002), The impact of healthplan report cards on managed care enrollment. Journal of Health Economics 21:19–41
Schlesinger, M. (1995), Choice, managed care and managed competition: interactionsand extrapolations. Unpublished manuscript, Department of Epidemiology andPublic Health, Yale University.
Schut, F.T., S. Greß and J. Wasem (2003), Consumer price sensitivity and social healthinsurer choice in Germany and the Netherlands. International Journal of HealthCare Finance and Economics 3: 117–138.
Schut, F.T. and W.H.J. Hassink (2002), Managed competition and consumer price sensi-tivity in social health insurance. Journal of Health Economics 21: 1009–1029.
Schwarze, J. and H.H. Andersen (2001), Kassenwechsel in der Gesetzlichen Kranken-versicherung: Welche Rolle spielt der Beitragssatz? Schmollers Jahrbuch 121:581–602.
Wansbeek,T.and A. Kaptyen (1989),Estimation of the Error-Components Model withIncomplete Panels. Journal of Econometrics 41: 341–361.
Windmeijer, F. (2005), A finite sample correction for the variance of linear effiecienttwo-step GMM estimators. Journal of Econometrics 126: 25–51.
Wooldridge, J. (2002), Econometric Analysis of Cross Section and Panel Data. Cam-bridge, MA: MIT Press, Cambridge.
22 Stefan Greß, Marcus Tamm, Harald Tauchmann and Jürgen Wasem
Appendix A – Tables
Price Elasticities and Social Health Insurance Choice in Germany 23
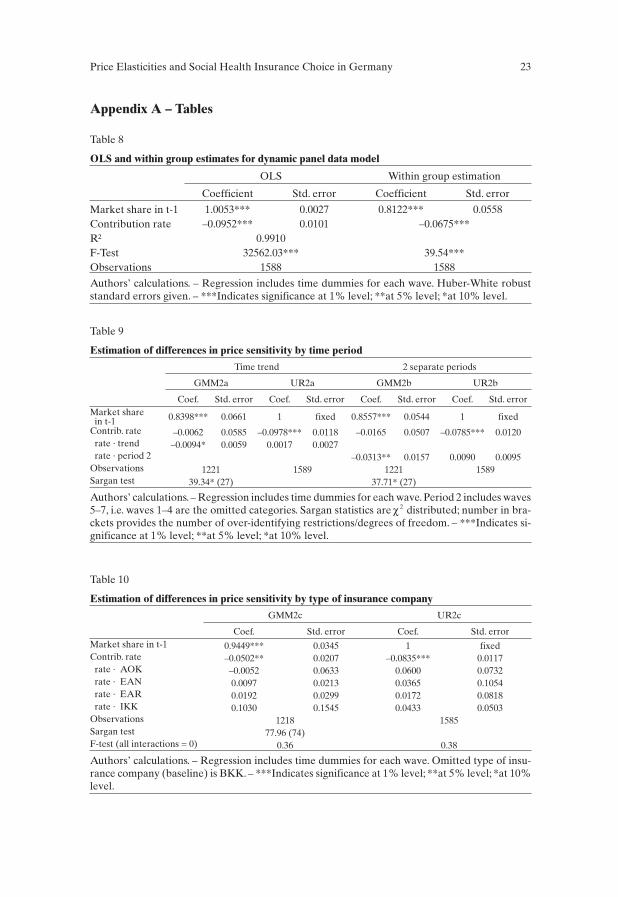
OLS and within group estimates for dynamic panel data model
OLS Within group estimation
Coefficient Std. error Coefficient Std. error
Market share in t-1 1.0053*** 0.0027 0.8122*** 0.0558Contribution rate –0.0952*** 0.0101 –0.0675***R² 0.9910F-Test 32562.03*** 39.54***Observations 1588 1588
Authors’ calculations. – Regression includes time dummies for each wave. Huber-White robuststandard errors given. – ***Indicates significance at 1% level; **at 5% level; *at 10% level.
Table 8
Estimation of differences in price sensitivity by time period
Time trend 2 separate periods
GMM2a UR2a GMM2b UR2b
Coef. Std. error Coef. Std. error Coef. Std. error Coef. Std. errorMarket sharein t-1 0.8398*** 0.0661 1 fixed 0.8557*** 0.0544 1 fixed
Contrib. rate –0.0062 0.0585 –0.0978*** 0.0118 –0.0165 0.0507 –0.0785*** 0.0120rate · trend –0.0094* 0.0059 0.0017 0.0027rate · period 2 –0.0313** 0.0157 0.0090 0.0095
Observations 1221 1589 1221 1589Sargan test 39.34* (27) 37.71* (27)
Authors’ calculations. – Regression includes time dummies for each wave. Period 2 includes waves5–7, i.e. waves 1–4 are the omitted categories. Sargan statistics are χ 2 distributed; number in bra-ckets provides the number of over-identifying restrictions/degrees of freedom. – ***Indicates si-gnificance at 1% level; **at 5% level; *at 10% level.
Table 9
Estimation of differences in price sensitivity by type of insurance company
GMM2c UR2c
Coef. Std. error Coef. Std. errorMarket share in t-1 0.9449*** 0.0345 1 fixedContrib. rate –0.0502** 0.0207 –0.0835*** 0.0117rate · AOK –0.0052 0.0633 0.0600 0.0732rate · EAN 0.0097 0.0213 0.0365 0.1054rate · EAR 0.0192 0.0299 0.0172 0.0818rate · IKK 0.1030 0.1545 0.0433 0.0503
Observations 1218 1585Sargan test 77.96 (74)F-test (all interactions = 0) 0.36 0.38
Authors’ calculations. – Regression includes time dummies for each wave. Omitted type of insu-rance company (baseline) is BKK. – ***Indicates significance at 1% level; **at 5% level; *at 10%level.
Table 10
Appendix B – Equally spaced time periods
As mentioned in subsection 3.2 estimation of dynamic panel data modelsmight lead to inconsistent estimates if panel waves are unequally spaced.Therefore we reduce our data set to waves 2 to 6, i.e. to the waves collectedsemi-annually between January 2002 and January 2004, and compare the re-sults with those reported above.
The two unit-root tests do not unambiguously discriminate between α = 1 andα < 1, either. In this setting, the GMM estimates are even weaker than those re-ported for the larger panel. The Sargan statistic is highly significant in all of themodels, rejecting the underlying orthogonallity assumptions altogether. Yet,the point estimates of the coefficient are within the range of the results ob-tained from estimating the model using the whole sample. For the unit rootcase (corresponding to UR2) the point estimate for β p is somewhat closer tozero (–0.0530) but still highly significant. If only five semi-annually spacedpanel waves are considered, results do not qualitatively change with respect totime period, type of insurance company, regional restrictions or open vs. re-stricted enrolment. Estimation results based on the reduced sample consistingof regularly spaced waves, therefore, do not challenge the main findings of ouranalysis.
24 Stefan Greß, Marcus Tamm, Harald Tauchmann and Jürgen Wasem
Estimation of differences in price sensitivity by regional restriction of insurance companies
GMM2d UR2d
Coef. Std. error Coef. Std. errorMarket share in t–1 0.9766*** 0.0690 1 fixedContrib. rate –0.0496 0.0479 –0.0873*** 0.0219rate · regional market only –0.0149 0.0310 –0.0349 0.0232
Observations 856 1096Sargan test 51.43 (42)
Authors’ calculations. – Regression includes time dummies for each wave. – ***Indicates signifi-cance at 1% level; **at 5% level; *at 10% level.
Table 11
Estimation of differences in price sensitivity between insurance companies with open and re-stricted enrolment
GMM2e UR2e
Coef. Std. error Coef. Std. errorMarket share in t–1 0.9455*** 0.0440 1 fixedContrib. rate –0.0318 0.0730 –0.0854*** 0.0121rate · no open enrolment 0.0020 0.0375 –0.0035 0.0033
Observations 1122 1435Sargan test 83.86*** (42)
Authors’ calculations. –Regression includes time dummies for each wave. – ***Indicates signifi-cance at 1% level; **at 5% level; *at 10% level.
Table 12