Study of supra-aggregates in catanionic surfactant systems
162
Naturwissenschaftliche Fakultät IV Chemie und Pharmazie Institute of Physical and Theoretical Chemistry University of Regensburg Study of supra-aggregates in catanionic surfactant systems Doctoral Dissertation Submitted for the Degree of Doktor der Naturwissenschaften (Dr. rerum naturalium) by Audrey Renoncourt Mai 2005 Ph.D. Supervisor: Prof. Dr. Werner Kunz Adjudicators : Prof. Dr. Werner Kunz Prof. Dr. Conxita Solans Prof. Dr. Otto S. Wolfbeis Chair : Prof. Dr. Em. Barthel
Transcript of Study of supra-aggregates in catanionic surfactant systems

Naturwissenschaftliche Fakultät IV
Chemie und Pharmazie
Institute of Physical and Theoretical Chemistry
University of Regensburg
Study of supra-aggregates in catanionic surfactant systems
Doctoral Dissertation
Submitted for the Degree of Doktor der Naturwissenschaften
(Dr. rerum naturalium)
by
Audrey Renoncourt
Mai 2005
Ph.D. Supervisor: Prof. Dr. Werner Kunz Adjudicators : Prof. Dr. Werner Kunz Prof. Dr. Conxita Solans Prof. Dr. Otto S. Wolfbeis
Chair : Prof. Dr. Em. Barthel

1
ACKNOWLEGMENTS
I want to express my profound gratitude to the following people who contributed to
the completion of my dissertation:
First of all, I am very grateful to my supervisor Prof. Dr. Werner Kunz, who gave me
the opportunity to carry out my thesis at the Institute of Physical and Theoretical Chemistry of
the University of Regensburg. He offered help and support whenever I needed it.
I gratefully acknowledge the extensive help of Prof. Dr. Conxita Solans, who enabled
me to work in her laboratory at the Department of surfactants from the Consejo Superior de
Investigaciones Cientificas in Barcelona. I want to thank her team as well for their warm
welcome and for the unique familiar atmosphere of her lab. It was a real pleasure for me to be
there.
I would also like to thank Prof. Dr. Barry W. Ninham, with whom I had the pleasure to
work during his stay in Regensburg in 2004, for his kindness and for his invaluable scientific
advice during my work.
I am likewise thankful to Dr. Markus Drechsler, from the Institute of Macromolecular
Chemistry of the University of Bayreuth, who introduced me in the cryo-transmission
electron microscopy technique, to Dr. Reinhard Rachel from the Institute of Microbiology of
the University of Regensburg for introducing me to the techniques of freeze-fracture and
freeze-etching transmission electron microscopy and to Dr. Jean-Marc Verbavatz from the
Commissariat à l’Energie Atomique (Saclay) who performed the freeze-fracture experiments.
Special thanks to Dr. Monique Dubois and to Prof. Dr. Thomas Zemb from the
Commissariat à l’Energie Atomique (Saclay) for the fruitful scientific discussions about
catanionic surfactant systems and for their constant kindness and helpfulness.
I would like to thank all the people who worked at the Institute of Physical and
Theoretical Chemistry during the course of my Ph.D. and particularly Dr. Didier Touraud.
Furthermore, I would like to thank my friends Caroline Segond, Sigrid Schüller,
Astrid Drexler, Alina Voinescu, Andreas Kopf, Andreas Grenzinger, for being my friends.
Last but not least, I would like to thank the two most important persons in my life, my
mother, Christelle Knop-Renoncourt, and Pierre Bauduin.
1
I AIM OF THIS THESIS.................................................................................... 3 II BINARY WATER-SURFACTANT SYSTEMS .......................................... 5 III CATANIONIC SYSTEMS: AN INTRODUCTION TO THEIR PROPERTIES AND PHASE BEHAVIOUR ................................................. 13
3.1. MAIN FEATURES OF THE CATANIONIC SYSTEMS.............................................................. 13 3.2. CATANIONIC SURFACTANT SYSTEMS WITH EXCESS SALT................................................ 18 3.3. ION PAIR AMPHIPHILES (IPA) ........................................................................................ 20 3.4. APPLICATIONS ................................................................................................................ 25
IV TECHNIQUES............................................................................................. 34 4.1. DYNAMIC LIGHT SCATTERING........................................................................................ 34 4.2. CRYOTRANSMISSION ELECTRON MICROSCOPY (CRYO-TEM) AND FREEZE-FRACTURE TEM (FF-TEM).................................................................................................................... 38
4.2.1. Cryo-TEM Methode................................................................................................ 38 4.2.2. Freeze – Fracture Methode.................................................................................... 41
4.3. PHASE DIAGRAM APPARATUS ......................................................................................... 43
V EFFECT OF TEMPERATURE ON THE REALMS OF EXISTENCE OF CATANIONIC VESICLES ....................................................................... 46
5.1. INTRODUCTION............................................................................................................... 46 5.2. EXPERIMENTAL .............................................................................................................. 48 5.3. RESULTS AND DISCUSSION.............................................................................................. 50
5.3.1 Anionic surfactants/DTAB/water systems ............................................................... 51 5.3.2 SDS/cationic surfactant/water systems ................................................................... 57
5.4. CONCLUSION .................................................................................................................. 60
VI TECHNICAL - GRADE SURFACTANT SYSTEMS ............................. 63 6.1. PHASE DIAGRAMS OF DIVERSE TECHNICAL-GRADE SURFACTANTS.................................. 64
6.1.1. Mixture of LES and cationic surfactants soluble at 25°C...................................... 65 6.1.2. Mixture of LES and cationic surfactants insoluble at 25°C................................... 73 6.1.3. Conclusion.............................................................................................................. 83
6.2. TRANSITION FROM MICELLES TO VESICLES BY SIMPLE DILUTION WITH WATER............... 84 6.2.1. LES/LPTC system................................................................................................... 85 6.2.2. LES/CTAM/H2O system.......................................................................................... 92 6.2.3. Conclusion............................................................................................................ 102
VII SALT-INDUCED MICELLE TO VESICLE TRANSITION ............ 105 7.1. INTRODUCTION............................................................................................................. 105 7.2. EXPERIMENTAL SECTION .............................................................................................. 106 7.3. SALT ADDITION: RESULTS AND DISCUSSION.................................................................. 108
7.3.1. Sodium salts with different anions ....................................................................... 108 7.3.2. Chloride salts with different cations .................................................................... 110 7.3.3. Different cations with other counterions............................................................. 119 7.3.4. Addition of salts to the LiDS/DTAB system.......................................................... 121
7.4. EFFECT OF SALT ADDITION ON THE KRAFFT TEMPERATURE OF SDS AND LIDS............ 124 7.4.1. Anionic salts on SDS ............................................................................................ 124
1

2
7.4.2.Cation effects on the Krafft temperature of SDS solutions ................................... 125 7.4.3. Cation salts on LiDS ............................................................................................ 126
7.5. CONCLUSION ................................................................................................................ 127
VIII CARBOXYLATE SURFACTANTS .................................................... 130 8.1. ALKYLETHERCARBOXYLATE SURFACTANTS................................................................. 132
8.1.1. Phase behaviour of alkylethercarboxylate / alkyltrimethylammonium catanionic surfactant systems .......................................................................................................... 133 8.1.2. Formation of vesicles by titration of an alkyethercarboxylate surfactant with HCl........................................................................................................................................ 137
8.2. ALKYLCARBOXYLATE SURFACTANTS WITH VARIOUS COUNTERIONS............................ 150 8.2.1. Phase behaviour of alkylcarboxylate/alkyltrimethylammonium catanionic surfactant systems .......................................................................................................... 150 8.2.2. Krafft temperature of the catanionic systems....................................................... 153 8.2.3. Conclusion............................................................................................................ 155
CONCLUSION AND OUTLOOK ................................................................ 159

I Aim of this thesis
3
I AIM OF THIS THESIS
The mixtures of cationic and anionic surfactants in aqueous solution, called catanionic
systems, display a large diversity of phases. Their phase behaviour depends mainly on the
ratio of cationic to anionic surfactant in the mixture, the overall surfactant concentration and
the nature of the surfactant, i.e. the chain length, the type of polar head and of counterion. An
outstanding property of theses systems is their ability to spontaneously form catanionic
vesicles which can remain stable for years. The general features concerning the catanionic
systems are given in chapter 3.
The general aim of this thesis was to study the phase behaviour of both pure and
technical-grade catanionic systems with a special focus on the different effects influencing the
formation of catanionic vesicles.
Firstly, the effect of temperature on catanionic vesicles was investigated. Cationic and
anionic surfactants are very temperature sensitive, since they precipitate in aqueous solution
below a specific temperature, called the Krafft temperature. Consequently the aggregates
resulting from the mixtures of cationic and anionic surfactants, such as vesicles, are also very
temperature sensitive. The Krafft temperature of catanionic systems was methodically studied
to determine which systems offered vesicle formation to the widest temperature range
(chapter 5) and thus to deduce a relation between surfactant structure and vesicle formation.
The simple mixing of cationic and anionic surfactants at a preselected ratio is a
possibility to obtain vesicles. Alternative ways of obtaining vesicles were studied in this
thesis:
• The transition from micelles to vesicles by simple dilution with water was
investigated. At a constant cationic / anionic mixing ratio, the addition of water to the solution
I Aim of this thesis
4
could lead to the spontaneous formation of vesicles (chapter 6). This phenomenon displays a
major interest as regards drug encapsulation, since a drug might be solubilized in the micellar
phase and undergo encapsulation in catanionic vesicles by simple dilution with water.
• The addition of salts to a catanionic solution consisting of mixed micelles proved to
lead to the transition from rod-like micelles to vesicles (chapter 7). Addition of salt on ionic
surfactants contributes to modify the area a occupied by the polar head and consequently
affects the packing parameter of the surfactants. This effect is different according to the type
of added salt. A specificity of the salts on the formation of vesicles could thus be established
according to the salting-in and salting-out properties of the studied salts.
• The titration of a single-chain carboxylate surfactant by hydrochloric acid proved to
lead to the transition from micelles to vesicles (chapter 8). When alkylcarboxylate surfactants
are completely dissociated, i.e. at a basic pH, the molecules aggregate into micelles. Along
titration with HCl, i.e. when the pH decreases, the conjugated acid formed plays the role of a
cosurfactant. It contributes thus to modify the packing parameter of the carboxylate surfactant
up to the formation of vesicles.

II Binary water-surfactant systems
5
II BINARY WATER-SURFACTANT SYSTEMS
Molecules possessing a hydrophobic as well as a hydrophilic part are called
amphiphiles. Surfactants belong to the group of such molecules and are usually constituted of
a hydrophobic hydrocarbon chain and a hydrophilic head. Surfactants are usually classified
according to the type of their polar head in non-ionic, anionic, cationic or zwitterionic
surfactants.
When diluted in aqueous solutions, surfactant molecules behave in such a way as to minimize
the area of contact between water and the hydrophobic part of the surfactant, keeping thus the
free energy of the system as low as possible. The surfactant molecules migrate to the air/water
interface so that the hydrocarbon chains find themselves in a non polar environment, i.e. the
air. The hydrophilic heads are attracted by a more polar environment, i.e. the water. When the
interface area is saturated, surfactant molecules in the water bulk self aggregate into micelles.
The hydrocarbon tails orientate in the inside of the micelles whereas the polar heads orientate
towards water, so that no contact occurs between water molecules and hydrocarbon chains.
This self-aggregation phenomenon takes place when the surfactant concentration in water
reaches a precise value called the critical micelle concentration (CMC). The CMC is strongly
affected by the chemical structure of the surfactant (1, 2), by the temperature (3) and by the
presence of cosolutes such as electrolytes (4) or alcohols (3) and is a most important
characteristic of a surfactant. Surfactants can aggregate into spherical or rod-like micelles.
The increase in the surfactant concentrations can lead to the aggregation of surfactants into a
hexagonal phase as well as the formation of liquid crystals among which the lamellar phases
and the vesicle phases can be classified. Each of these aggregation form influences the
macroscopic properties of an aqueous solution of surfactants. Besides surfactants can also
aggregate into the inverse structures, the outer phase being hydrophobic.

II Binary water-surfactant systems
6
The Packing Parameter
The theory of the packing parameter according to Israelachvili (5, 6) presents the best
explanation to understand in which form surfactants will self aggregate. This packing
parameter P is defined (Fig. 1) as the ratio between the volume ν of the hydrophobic tail of
the surfactant and the product of the area occupied by the polar head a with the chain length l
of the hydrophobic tail of the surfactant.
P = ν / a.L
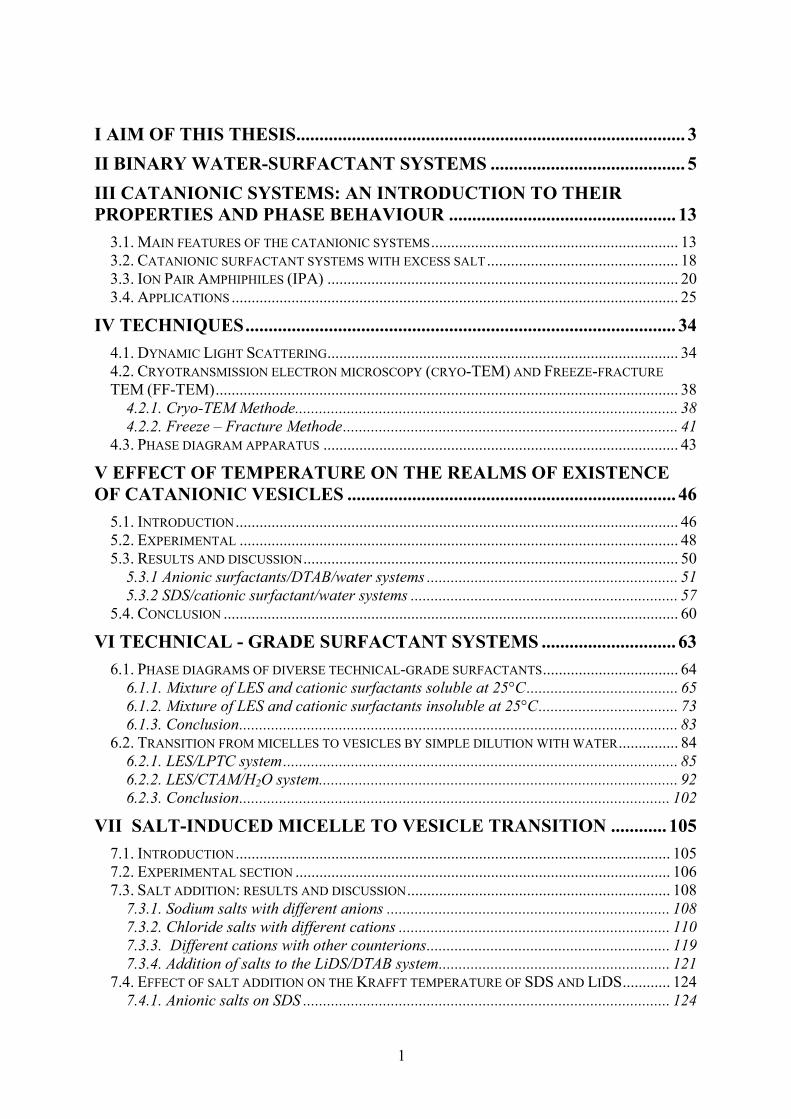
Figure 1: Schematic representation of the values involved in the theory of the packing
parameter.
The value of this packing parameter indicates the type of structure surfactants tend to
aggregate into (Fig. 2). If the amphiphile has the shape of a cone, then it tends to form
spherical micelles, for which the value of P should be approximately 0.33. If the shape is
more similar to a truncated cone, then it forms cylindrical micelles with a P value between
0.33 and 0.5. For the cylinder-shaped amphiphile the most favourable aggregate is the bilayer,
where P is around 1. Consequently, in disk-shaped structures and vesicles the value of P
should be somewhere in the range 0.5-1 but closer to unity. If the surfactant has the shape of a
truncated inverted cone, then it tends to form reverse structures for which P > 1. The
formation of vesicles is therefore possible when the packing parameter reaches an optimal
value which can lead to the formation of a double layer.
L (Å)
V (Å3) a (Å2)
II Binary water-surfactant systems
7
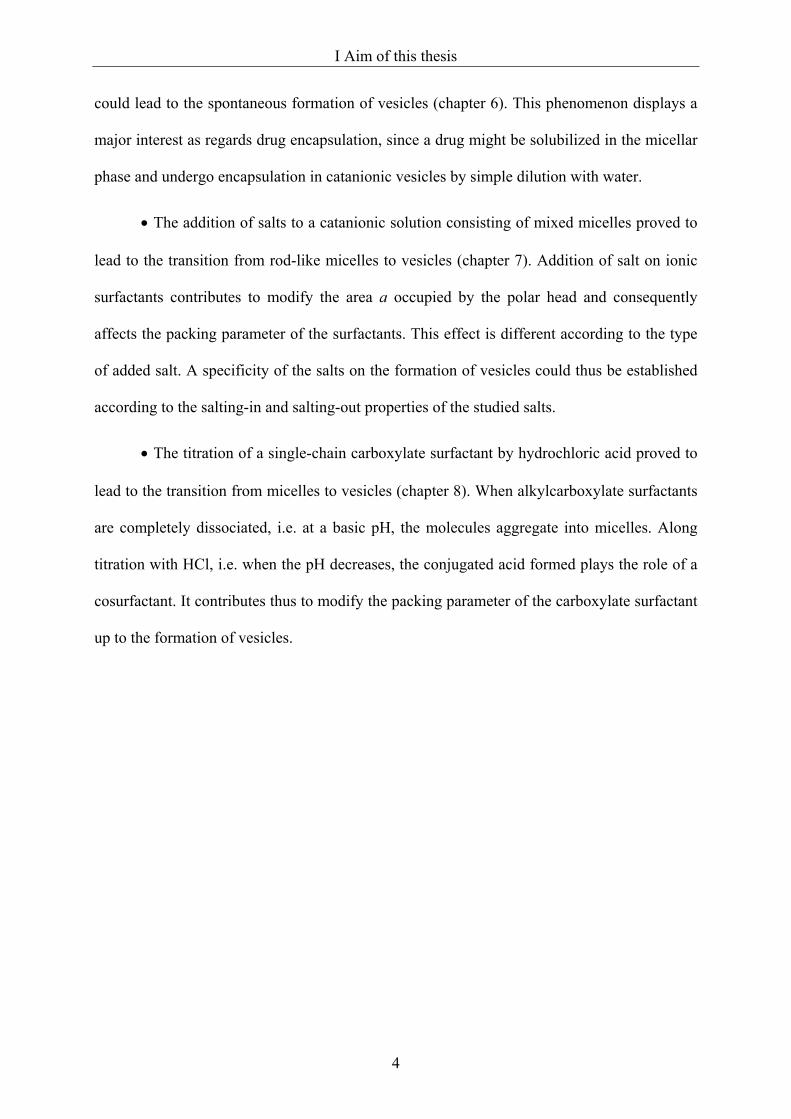
Figure 2: Representation of the correlation between the geometry of an amphiphile and the
type of structures it tends to aggregate into (reproduced from Ref. 7).
Aggregation of amphiphiles into vesicles
The formation of vesicles from single amphiphiles is enabled by many systems, in
which the mixture of the single components succeeds in reaching the wished CPP value of
about 1. Of special interest is this aggregation of amphiphile molecules into vesicle structures,
where the bulk water, in the inside of the vesicle, is separated from the outer water of the
solution by a bilayer of amphiphiles (Fig. 3).
CPP ≈ 0.33
CPP ≈ 0.5
CPP ≈ 1
CPP > 1

II Binary water-surfactant systems
8
Figure 3: Schematic representation of a vesicle. The aggregation of the surfactants into a
bilayer constitutes the membrane of the vesicles and separates the bulk water from the outer
water (reproduced from Ref. 7).
Vesicles are classified (8,9) according to their size and the number of their layers. For
one a difference is made between Small Unilamellar Vesicles (SUV) which sizes range
between 20 and 100 nm, Large Unilamellar Vesicles (LUV) with a diameter size between 100
and 2000 nm and Multilamellar Vesicles (MLV) which sizes range between 500 and 5000
nm. Vesicular systems represent a main interest for industrial applications, e.g. for the
cosmetic and pharmaceutical industries. Owing to the low permeability of the vesicle
membranes to ions or organic molecules, vesicles can be used as a medium to encapsulate and
carry drugs (10). Vesicles can be produced from different kinds of molecules. The best known
and most used vesicles (table 1) come from phospholipid molecules and are called liposomes
(11). Phospholipids are double-chained amphiphiles poorly soluble in water. Some input of
energy is therefore required to lead to the formation of liposomes, such as ultrasound
processing (12, 13) or extrusion (14) of the aqueous phospholipid dispersion. Liposomes are
consequently in an unstable state of equilibrium and tend to reverse over time to a lamellar
structure. Niosomes (15) consist mainly in mixtures of various kinds of non-ionic surfactants
II Binary water-surfactant systems
9
to which is often added cholesterol. Even though their utilization is not so widespread as
liposomes, they are considered as an alternative to liposomes owing to the lower cost of non-
ionic surfactants in comparison to phospholipids. Niosomes also require some input of energy
to be able to form and are consequently not in an equilibrium state. Catanionic vesicles,
which result from the mixture of cationic and anionic surfactants, are here our main concern
and will be described more in detail in the following chapter.
Owing to their ability to form vesicles, the group of double-chain amphiphiles, e.g.
the dialkyldimethylammonium surfactants, have been very much investigated (16-19). These
surfactants aggregate in aqueous solution in double layers which can lead to diverse phases.
With an increased concentration of surfactant a transition from small unilamellar to large
multilamellar vesicles can happen. At very high surfactant concentration the classical lamellar
phases with double layer surfactants can be observed.
Another possibility to form vesicular solutions is to use a cosurfactant or a
hydrotrope molecule in a surfactant system. Cosurfactants can be short chain alcohols (20,
21), semipolar esters (22) or monoglycerinether (23). In such systems, through the addition of
the cosurfactant, the packing parameter can be changed in order to obtain the formation of
vesicles. Aqueous solutions of hydrotropes have proven to be powerful systems for preparing
vesicles. In this case, the vesicle-forming compound has been mixed with water and the
hydrotrope, and dilution with water resulted in the formation of vesicles (24). Vesicles formed
by the non ionic surfactant Laureth 4 from an aqueous solution of sodium xylene sulfonate
(SXS) were more stable and smaller than vesicles prepared from the suspension of the
lamellar liquid crystal in water. Since a very low amount of hydrotropes is necessary in the
procedure of vesicle formation, the use of such compounds is considered to be a very
interesting process of formation for applications.

II Binary water-surfactant systems
10
Even though catanionic systems have been investigated for more than 15 years, so far
relatively few fundamental studies and no industrial patents exist on the subject, when
compared to well-known vesicle systems such as liposomes or niosomes (table 1). Catanionic
vesicles and more generally catanionic systems represent consequently a new field of
investigation from an applicative point of view.
Liposomes Niosomes Catanionic vesicles
Number of references 75763 407 198
Number of
publications 65629 345 177
Number of patents 7036 48 0
Table 1: Number of literature references obtained on SciFinder Scholar with key words
“liposomes”; “niosomes” and “catanionic”.
II Binary water-surfactant systems
11
References
1. Lindman, B.; Wennerström, H. Topics in Current Chemistry, Vol. 87, Springer-Verlag,
Germany, 1980, p.8.
2. Meguro, K.; Ueno, M.; Esumi, K. Nonionic Surfactants. Physical Chemistry, Marcel
Dekker, New York, 1987, p.134.
3. Shinoda, K.; Nakagawa, T.; Tamamush, B.-I.; Isemura, T. Colloidal surfactants, Some
physico-chemical properties, Academic Press, London, 1963
4. Gunnarsson, G.; Jönsson, B.; Wennerström, H., Journal of Physical Chemistry, 1980, 84,
3114.
5. Israelachvili, J.N.; Mitchell, D.J.; Ninham, B.W. Journal of the Chemical Society, Faraday
Transactions 2, 1976, 72, 1525.
6. Israelachvili, J.N. Intermolecular and Surface Forces, Academic Press, New York, 1985.
7. Evans, D. F.; Wennerström, H. The Colloidal Domain. Where Physics, Chemistry, Biology
and Technology meet. Wiley-VCH, New York, 1994.
8. Mollet, H.; Grubenmann, A. Formulation Technology: Emulsions, Suspensions, Solid
Forms, Wiley-VCH, Weinheim, Germany, 2000, chap.3.
9. Rosoff, M.; Vesicles .Surfactant Science Series 62, Marcel Dekker, New York, 1996.
10. Lasic, D.D. Angewandte Chemie, 1994, 106(17), 1765-79.
11. Bangham, A. D.; Standish, M. M.; Weissmann, G. Journal of Molecular Biology, 1965,
13(1), 253-9.
12. Huang, C.H. Biochemistry, 1969, 8, 344.
13. Papahadjopoulos, D. ; Miller, N. Biochimica et biophysica acta, 1967, 135, 624.
14. Mayer, L.D.; Hope, M.J.; Cullis, P.R. Biochimica et biophysica acta, 1986, 858, 161.
15. Uchegbu, I. F.; Vyas, S.P. International Journal of Pharmaceutics, 1998, 172, 33-70.
16. Ninham, B.W.; Evans, D.F.; Wei, G.J. Journal of Physical Chemistry, 1983, 87, 5020.

II Binary water-surfactant systems
12
17. Dubois, M.; Zemb, T. Langmuir, 1991, 7, 1352.
18. Miller, D.D.; Bellare, J.R.; Kaniko, T., Evans, D.F. Langmuir, 1988, 4, 1363.
19. Viseu, M.I.; Velazquez, M.M.; Campos, C.S.; Garcia-Mateos, I.; Costa, S.M.B. Langmuir,
2000, 16, 4882.
20. Hoffmann, H.; Thunig, C.; Schmiedel, P.; Munkert, U. Langmuir, 1994, 10, 3972.
21. Gradzielski, M.; Bergmeier, M.; Müller, M.; Hoffmann, H. Journal of Physical Chemistry
B, 1997, 101, 1719.
22. Hoffmann, H.; Horbaschek, K.; Witte, F. Journal of Colloid and Interface Science, 2001,
235, 33.
23. Beck, R.; Hoffmann, H. Physical Chemistry Chemical Physics, 2001, 3, 5438.
24. Friberg, S.E.; Yang, H.; Fei, L.; Sadasivan, S.; Rasmussen, D.H.; Aikens, P.A. Journal of
Dispersion Science and Technology, 1998, 19(1), 19-30.

III Catanionic systems : an introduction to their properties and phase behaviour
III CATANIONIC SYSTEMS: AN INTRODUCTION TO
THEIR PROPERTIES AND PHASE BEHAVIOUR
3.1. Main features of the catanionic systems
Mixed surfactants solutions
Mixtures of cationic and anionic surfactants used to be described as incompatible in
the formulation literature, since they may lead to a precipitate when brought together in
aqueous solution and could thus not be used as surface active agents (1). This is a major
disadvantage as far as their application prospects are considered. However they have aroused
an increased interest over the last 20 years among the scientific community. It was previously
proved (2, 3) that the combination of one anionic surfactant with one cationic surfactant
considerably improved the fat removal in the cleaning of hard surfaces as a function of the
mixing ratio of surfactants.
The Critical Micelle Concentration (CMC) of the mixture of two surfactants can be
much different from the CMC of the pure surfactants (4). When there is no net interaction
between two surfactants with similar head groups, the CMC of the mixture is an average of
the CMCs of the pure surfactants. However, for many surfactant mixtures such as mixtures of
non-ionics and anionics or anionics and cationics, there is a strong interaction between both
types of surfactants. This net interaction between the surfactant species in the micelle is
quantified by the interaction parameter β. β has positive or negative values when the
interaction between the surfactant is respectively repulsive or attractive. Typical β values for
mixtures of non-ionics and anionics are around –2 and for mixtures of cationics and anionics
between –10 and –20. The CMC of such mixtures decreases all the more quickly that the β
III Catanionic systems : an introduction to their properties and phase behaviour
14
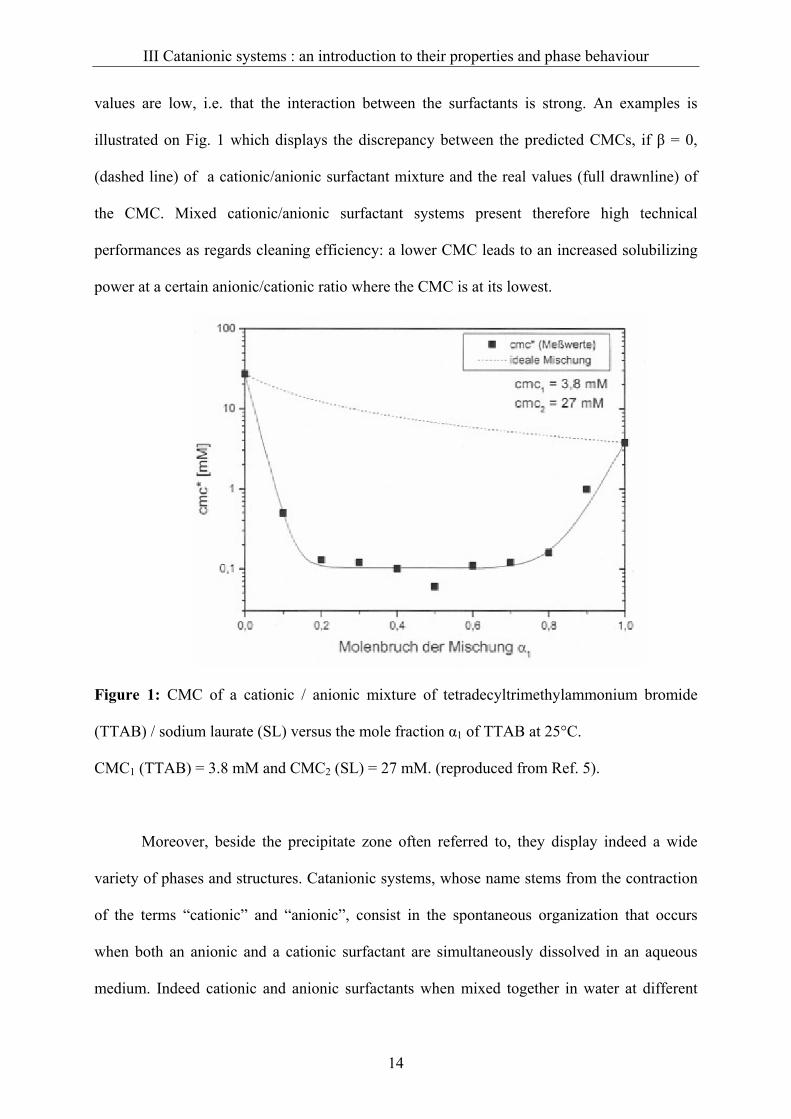
values are low, i.e. that the interaction between the surfactants is strong. An examples is
illustrated on Fig. 1 which displays the discrepancy between the predicted CMCs, if β = 0,
(dashed line) of a cationic/anionic surfactant mixture and the real values (full drawnline) of
the CMC. Mixed cationic/anionic surfactant systems present therefore high technical
performances as regards cleaning efficiency: a lower CMC leads to an increased solubilizing
power at a certain anionic/cationic ratio where the CMC is at its lowest.
Figure 1: CMC of a cationic / anionic mixture of tetradecyltrimethylammonium bromide
(TTAB) / sodium laurate (SL) versus the mole fraction α1 of TTAB at 25°C.
CMC1 (TTAB) = 3.8 mM and CMC2 (SL) = 27 mM. (reproduced from Ref. 5).
Moreover, beside the precipitate zone often referred to, they display indeed a wide
variety of phases and structures. Catanionic systems, whose name stems from the contraction
of the terms “cationic” and “anionic”, consist in the spontaneous organization that occurs
when both an anionic and a cationic surfactant are simultaneously dissolved in an aqueous
medium. Indeed cationic and anionic surfactants when mixed together in water at different

III Catanionic systems : an introduction to their properties and phase behaviour
15
ratios can self-assemble into a wide variety of microstructures such as spherical or rodlike
mixed micelles (6, 7, 8), lamellae (9) or vesicles (10). The classical topology of a catanionic
phase diagram is represented in Fig. 2 and the corresponding critical Packing Parameter
values obtained for different surfactant aggregates are schematized in Fig. 3. The cationic-
anionic surfactant systems tend to produce a precipitate when the stoechiometry between the
cationic and anionic surfactant is around 1 (11). For compositions slightly deviating from
equimolarity, usually for a 2:1 to 3:1 mixing molecular ratio, the phase diagrams of
catanionic systems show lamellar phases at high total surfactant concentrations (> 30wt%)
and vesicular phases for the most dilute solutions.
Figure 2: Schematic phase behaviour encountered in catanionic surfactant systems. Phase
notations: V- and V+: regions of negatively and positively charged vesicles; 2Φ: two-phase
regions, i.e. mostly demixing of phases between a vesicular and a lamellar phase or a vesicle
and a micellar phase; L- and L+: lamellar phase with an excess of respectively anionic and
cationic surfactants; P: precipitate region; I- and I+: mixed micellar solutions with an excess of
respectively anionic and cationic surfactants. (reproduced from Ref. 12).
III Catanionic systems : an introduction to their properties and phase behaviour
16
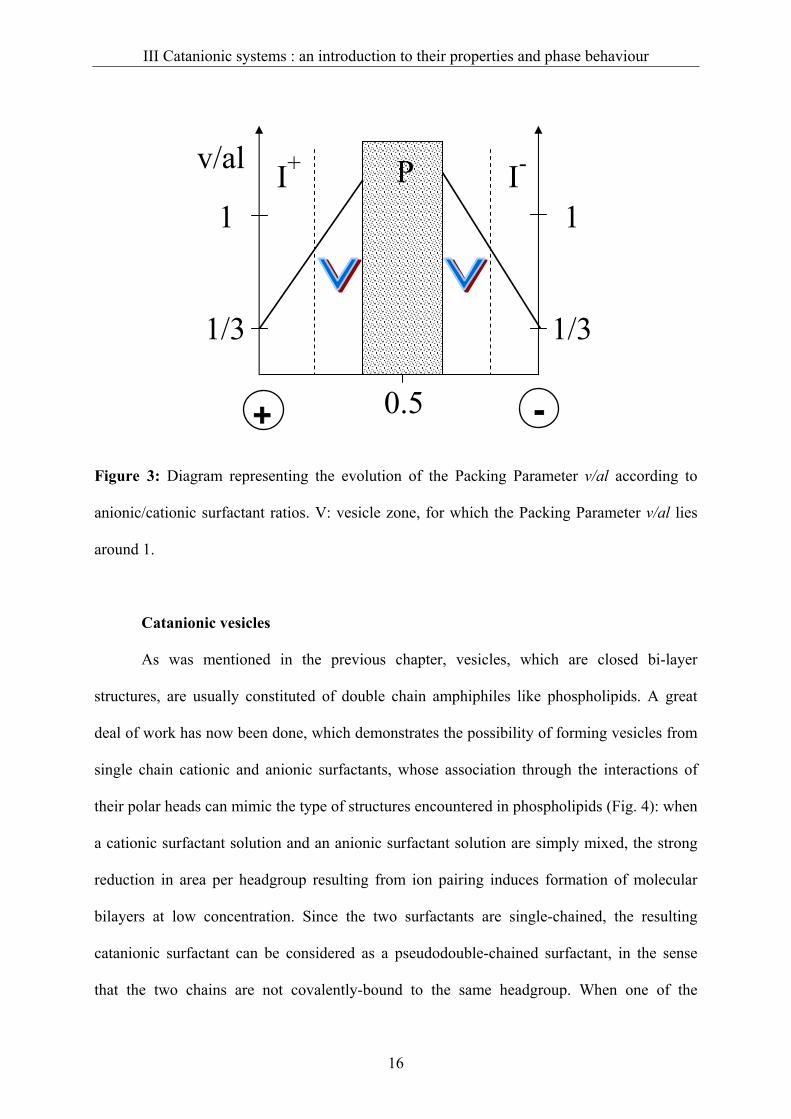
Figure 3: Diagram representing the evolution of the Packing Parameter ν/al according to
anionic/cationic surfactant ratios. V: vesicle zone, for which the Packing Parameter ν/al lies
around 1.
Catanionic vesicles
As was mentioned in the previous chapter, vesicles, which are closed bi-layer
structures, are usually constituted of double chain amphiphiles like phospholipids. A great
deal of work has now been done, which demonstrates the possibility of forming vesicles from
single chain cationic and anionic surfactants, whose association through the interactions of
their polar heads can mimic the type of structures encountered in phospholipids (Fig. 4): when
a cationic surfactant solution and an anionic surfactant solution are simply mixed, the strong
reduction in area per headgroup resulting from ion pairing induces formation of molecular
bilayers at low concentration. Since the two surfactants are single-chained, the resulting
catanionic surfactant can be considered as a pseudodouble-chained surfactant, in the sense
that the two chains are not covalently-bound to the same headgroup. When one of the
1
1/3
0.5 + -
v/al
1/3
1 P I-I+

III Catanionic systems : an introduction to their properties and phase behaviour
17
surfactants is present in a small excess, the cationic-anionic surfactant bilayers usually
spontaneously form closed vesicles (Fig. 2).
Figure 4: Representation of a catanionic surfactant and the correlation existing with the
formation of catanionic vesicles (picture of the vesicle reproduced from Ref. 13).
The catanionics bear an obvious similarity with double-chained amphiphiles,
particularly of the zwitterionic type, since both are overall neutral and possess two long alkyl
chains. For the catanionics, factors like deviation from equimolar ratios, increase of the chain
length of at least one of the two surfactants, asymmetry in chain length, all can break the
symmetry of the system and induce more or less dramatic changes in phase behaviour. By
changing these factors, the phase behaviour of catanionics can be varied at will.
A distinction is made in the literature between two types of catanionic systems: (1) In
the “simple mixtures” of cationic and anionic surfactants or catanionic surfactant systems
with excess salt, both surfactants still behold their own counterions. (2) The “true
catanionics”, also called Ion Pair Amphiphiles (I.P.A.), consist of surfactants systems where
the original counterions have been removed and replaced by hydroxide and hydronium ions.
The combination of the counterions at equimolarity forms thus water molecules. Each
surfactant stands as counterion for the surfactant of opposite charge.
+ - CPP ≈ 1 →

III Catanionic systems : an introduction to their properties and phase behaviour
18
3.2. Catanionic surfactant systems with excess salt
Catanionic surfactant mixtures with excess salt are mixtures of a cationic with an
anionic surfactant which have as counterion respectively an anion such as Br-, Cl- and a cation
such as Na+, K+, NH4+. Thus these systems, also called “simple catanionic systems”, contain
excess salts in aqueous solution formed from the combination of the two counterions, which
induce a high conductivity of the solutions.
The catanionic surfactant mixtures with excess salt are constituted of three
components but are five-species systems: the two ionic surfactants, the two types of
counterions and water. A rigorous phase analysis in such systems is intricate. However,
ternary phase diagrams are often used in the literature, in which the apexes of the triangle
represent respectively, the anionic surfactant, the cationic surfactant and water (Fig. 2). In
these conditions the vesicle domains are represented either by two lobes (10,14,15) when two
types of vesicles can exist with positive or negative excess charges or by one lobe (16,17) in
the diluted region of the phase diagram. A redundant remark formulated in the studies dealing
with the phase behaviour of these surfactant mixtures is that precipitation occurs in equimolar
conditions. Upon varying the ratio of the two surfactants, the precipitate dissolves to form
either a vesicular or a micellar phase (Fig. 2). The lobes of the vesicles are never crossed by
the equimolar line but they are situated on either side of this line. This implies that the
stability of these catanionic vesicles is ensured by one of the surfactants in excess.
III Catanionic systems : an introduction to their properties and phase behaviour
19
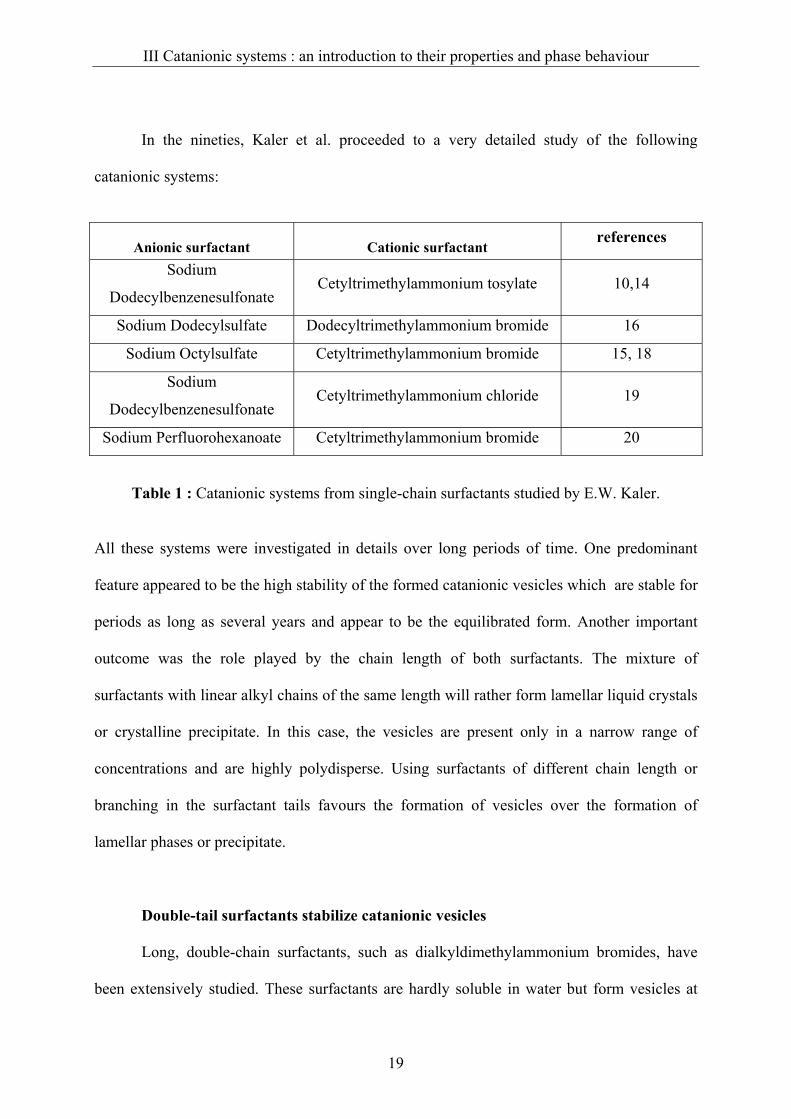
In the nineties, Kaler et al. proceeded to a very detailed study of the following
catanionic systems:
Anionic surfactant Cationic surfactant references
Sodium
Dodecylbenzenesulfonate Cetyltrimethylammonium tosylate 10,14
Sodium Dodecylsulfate Dodecyltrimethylammonium bromide 16
Sodium Octylsulfate Cetyltrimethylammonium bromide 15, 18
Sodium
Dodecylbenzenesulfonate Cetyltrimethylammonium chloride 19
Sodium Perfluorohexanoate Cetyltrimethylammonium bromide 20
Table 1 : Catanionic systems from single-chain surfactants studied by E.W. Kaler.
All these systems were investigated in details over long periods of time. One predominant
feature appeared to be the high stability of the formed catanionic vesicles which are stable for
periods as long as several years and appear to be the equilibrated form. Another important
outcome was the role played by the chain length of both surfactants. The mixture of
surfactants with linear alkyl chains of the same length will rather form lamellar liquid crystals
or crystalline precipitate. In this case, the vesicles are present only in a narrow range of
concentrations and are highly polydisperse. Using surfactants of different chain length or
branching in the surfactant tails favours the formation of vesicles over the formation of
lamellar phases or precipitate.
Double-tail surfactants stabilize catanionic vesicles
Long, double-chain surfactants, such as dialkyldimethylammonium bromides, have
been extensively studied. These surfactants are hardly soluble in water but form vesicles at

III Catanionic systems : an introduction to their properties and phase behaviour
20
low concentration. At high concentration, they form lamellar liquid crystalline phases. The
Packing Parameter of such surfactants is around 1. Thus they do not require an opposite
charged surfactant to form vesicles. However they have been much investigated in catanionic
systems. Quaternary ammonium surfactants are some of the most common double-chain
amphiphiles, among which didodecyltrimethylammonium bromide (DDAB) (Fig. 5), and
have been most extensively investigated (21-25). When an anionic surfactant is added to a
DDAB / water system, major changes in phase behaviour occur. Concerning the vesicular
structures, the presence of the anionic surfactant may be responsible for the thermodynamic
stabilization of the vesicles (26). The size of the DDAB-formed vesicles varies by adding an
anionic single-chain surfactant (26).
Figure 5: Representation of a double-tailed cationic surfactant, namely the
didodecyltrimethylammonium bromide DDAB.
3.3. Ion Pair Amphiphiles (IPA)
The Ion Pair Amphiphiles have been investigated in the eighties by Jokela et al.
(27,28,29), hence the denomination of “true catanionics” which were at that time the only
systems assumed to present a fundamental interest. In these systems the initial inorganic
counterions of the cationic and anionic surfactants have been replaced respectively by the
hydroxide and hydronium ions generally by using ion exchange resins (strongly basic for the
III Catanionic systems : an introduction to their properties and phase behaviour
21
cationic surfactant and strongly acid for the anionic one). In such systems, the polar head of
each surfactant is actually the counterion of the oppositely charged one. The removal of the
low molecular weight salt is expected to modify the electrostatic interactions between the two
surfactants by dramatically increasing the Debye screening length. As a result the ion-pair
interaction between the polar heads of oppositely charged surfactants are stronger than in
catanionic systems with excess salt and this changes the total area a occupied by the
surfactants polar heads. Moreover, with salt-free catanionic surfactant solutions, there is no
precipitation at the equimolar concentrations.
When the surfactants are mixed, no excess salt is being released but water molecules.
The surface charge density at 1:1 mixing of the formed aggregates is therefore so low that it
can be neglected. This permitted the investigation of the hydration force between the lamellae
formed by different aqueous catanionic systems at equimolarity with increasing size of the
polar heads (27). To this end, the following systems were investigated:
C12NH3+, C11COO- dodecylammonium dodecanoate (AD)
C12NH3+, C12SO4
- dodecylammonium dodecylsulfate (AS)
C12N(CH3)+, C12SO4- dodecyltrimethylammonium dodecylsulfate (TAS)
C12 N(CH3)2(C2H5)+, C12SO4- dodecylethyldimethylammonium dodecylsulfate
(EDAS)
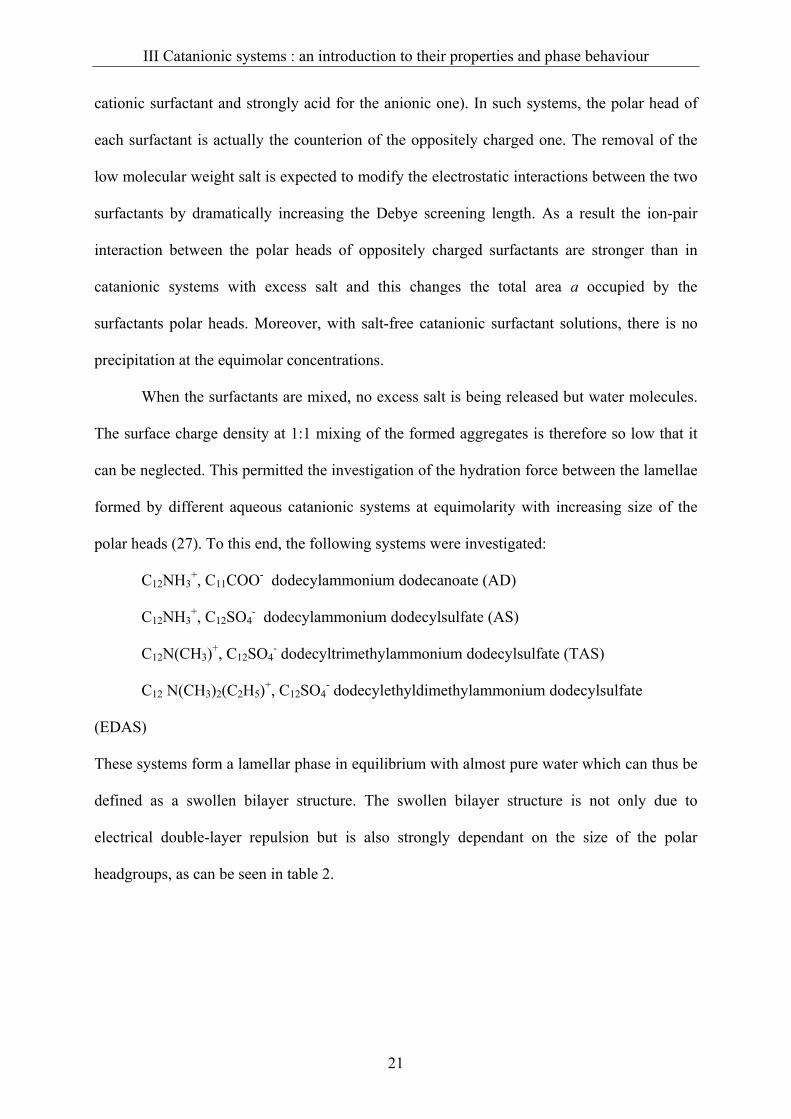
These systems form a lamellar phase in equilibrium with almost pure water which can thus be
defined as a swollen bilayer structure. The swollen bilayer structure is not only due to
electrical double-layer repulsion but is also strongly dependant on the size of the polar
headgroups, as can be seen in table 2.
III Catanionic systems : an introduction to their properties and phase behaviour
22
Catanionic surfactant Maximum water uptake (wt%) Maximum swelling of the
lamellae
AD 19% 6Å
AS 19% 6Å
TAS 30% 11Å
EDAS 35% 14Å
Table 2: Maximum lamellar swelling according to the type of cxatanionic system.
When comparing simple catanionic mixtures and IPA, the vesicles formed from IPA
appear to be less stable than the vesicles formed from surfactants with their counterions.
Fukuda et al. (30) investigated various IPA systems composed of alkylammonium hydroxide
and alkylcarboxylic acid with equal chain length in C14, C16 and C18. All IPA systems
proved to form vesicles at stoechiometric quantities but the formed structures showed only a
short-term stability (from 1h to maximum 48h). The stability is very different for vesicles
formed from mixed catanionic surfactants systems with excess salt. Catanionic vesicles are in
this case stable for periods as long as several years, since they appear to be the equilibrium
form of aggregation.
Hao et al. (31) investigated the IPA systems composed of
Tetradecyltrimethylammonium hydroxide TTAOH (C14N(CH3)3+OH-) as the cationic
component with different anionic surfactants of various chain length. The following salt-free
catanionic systems were thus investigated:
TTAOH/ Decanoic acid (C9COOH)
TTAOH/ Lauric acid (C11COOH)
TTAOH/ Myristic acid (C13COOH)
TTAOH/ Palmitic acid (C15COOH)

III Catanionic systems : an introduction to their properties and phase behaviour
23
Only the cationic high ratio side of the phase diagram was investigated, since the fatty
acids are insoluble in water at 25°C. The systems were first heated up to 70°C to be
homogenized and cooled down afterwards to 25°C. The formation of polydisperse vesicular
solutions with diameters ranging from 30nm to 200nm could be observed in all systems close
to equimolarity. The only difference when changing the chain length of the anionic surfactant
was that the longer the chain length, the closer the existence range of the vesicular phase
would start from equimolarity.
A successful control in size and shape of aggregates of a system of Ion Pair
Amphiphile catanionic system was realized by Zemb at al. (32-36). The model system used
was composed of cetyltrimethylammonium hydroxide CTAOH and of myristic acid
(C13COOH), mixed at a total surfactant concentration of 20g/L. In the absence of organic
counterions, the composition of the system is determined by two quantities: the total amount
of dry surfactant c (in wt%) and the molar fraction of anionic surfactant r.
r = [C13COO-H+]/ {[C16N(CH3)3+OH-]+[C13COO-H+]}
Along variation of the mixing ratios r, the surfactant systems can lead to different aggregates
structures, such as nanodisks or icosahedra. The catanionic mixtures are first warmed up. The
initial state of the dispersion at temperatures above 50°C are generally composed of
unilamellar vesicles in the fluid state. Upon cooling, nucleation and growth of planar crystals
occur in the form of frozen bilayers. Both nanodisks (32,33) and facetted objects, such as
icosahedra (34), assemble to form frozen aggregates.
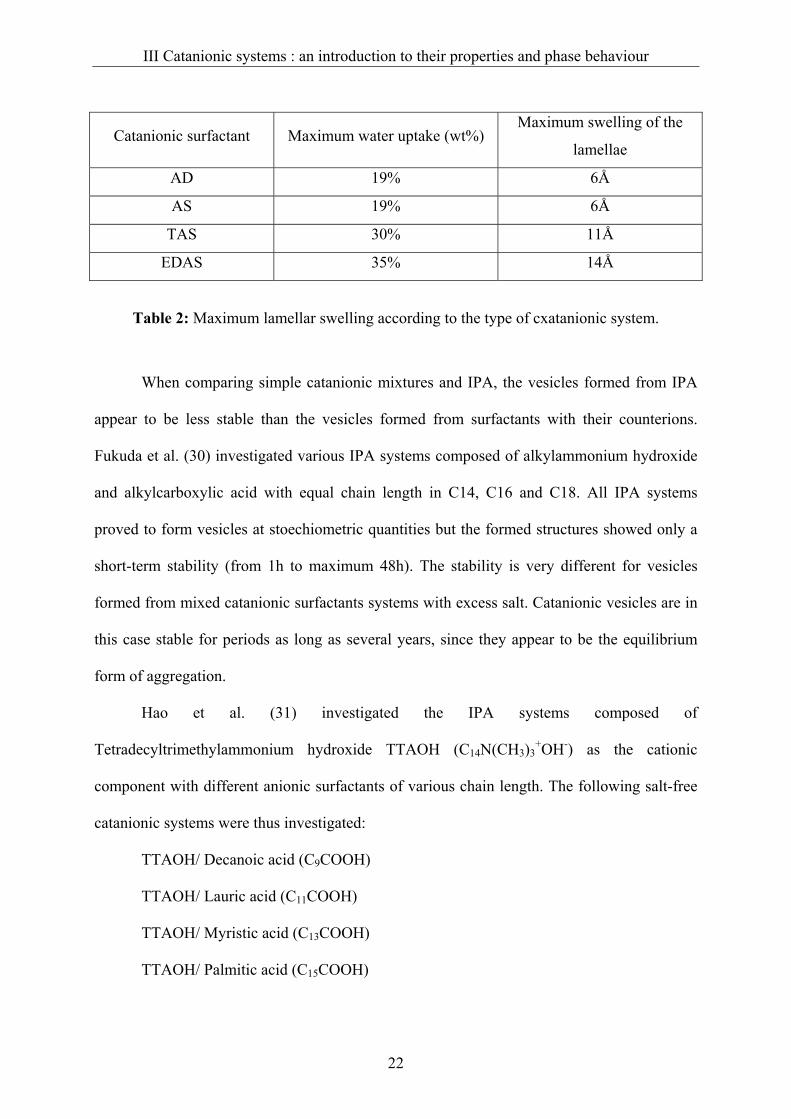
When the water insoluble anionic component (C13COOH) is in excess (r > 0.5),
micrometer-sized icosahedra are formed. Icosahedra (35) (Fig. 4) means here a closely
facetted object similar to true icosahedra, i.e. facetted objects with about 20 faces of similar
area and with an estimated number of vertices between 10 and 15. For catanionic solutions in
an excess of anionic component, icosahedra are formed by evacuation of the excess charges
III Catanionic systems : an introduction to their properties and phase behaviour
24
which are segregated into pores. The presence of insoluble excess fatty acid produces pores at
vertices.
Figure 4: A schematic model of a icosahedra. The triangular faces are composed of ion pairs.
The anionic component in excess has aggregated at the ends of the structures and forms the
pores of the icosahedra (reproduced from Ref. 34).
With a slight excess of water soluble cationic component, i.e. CTAOH (r < 0.5),
surfactants preferentially aggregate into nanodisks (32) which are sandwich-like
microstructures (Fig. 5). Nanodisks are thus formed by rejection of excess charges towards
the edges. The emphasis must be laid on the fact that, as regards catanionic systems, nanodisk
or icosahedra formation was reported so far only in the case of IPA.

III Catanionic systems : an introduction to their properties and phase behaviour
25
Figure 5: A schematic model of a nanodisk. The faces are composed of anionic/cationic ion
pairs. The cationic surfactant (in red) is in excess and forms the edge of the structure. The
inside of the nanodisk is composed of the hydrocarbon chains of the surfactants and are in a
frozen state (reproduced from Ref. 33).
3.4. Applications
Catanionic microstructures as template
Nanostructured materials are potentially useful in a variety of applications such as
catalysis or drug delivery. Catanionic assemblies can be used as a medium for chemical
reactions. An effective and simple approach to preparing nanostructured materials involves
template synthesis (37, 38, 39). Usually a nanostructured template directs the reaction of
precursors towards the final product. Catanionic vesicles can be tailored in size and bi-layer
thickness by changing the characteristics of the two surfactants, such as type of polar head,
chain length, presence of salt…etc. Owing to the vesicle structure, they compartmentalize the
aqueous domain in the inner core of the vesicles which is separated from the outer water by a
hydrophobic bi-layer. They display therefore interesting features as far as the synthesis of
III Catanionic systems : an introduction to their properties and phase behaviour
26
nanoparticles of a finite size are involved. The vesicle architecture is thus used as template for
polymerisation.
Catanionic vesicles have already been applied as template for the formation of nano-
objects such as hollow polymeric spheres or hollow silica spheres. Hollow polymeric spheres
could be synthesized in the hydrophobic double layer of the vesicle membrane (40).
Catanionic vesicles were first prepared from two different systems: (1)
cetyltrimethylammonium tosylate (CTAT) and sodium dodecylbenzenesulfonate (SDBS), (2)
cetyltrimethylammonium bromide and sodium octylsulfate. Hydrophobic monomers, styrene
and divinylbenzene, were then added to swell the bilayers of a vesicle solution and were
subsequently polymerised. Once polymerised, the surfactants were removed from the mixture
by dialysis and it remained hollow polymeric spheres. In two different catanionic systems
hollow silica spheres (41) could be prepared. These systems were: (1) CTAT/SDBS as before
and (2) cetyltrimethylammonium bromide (CTAB) and sodium perfluorooctanoate (FC7). In
contrast to the previous synthesis the reaction occurs on the vesicle surface by deposing the
precursor of silica, tetramethylsiloxane on the surface before reaction begins. A cryo-TEM
photograph of the hollow silica spheres obtained is shown on Fig. 6. Silicone nanocapsules
(42) could be prepared in the bilayer of catanionic vesicles as well by polycondensation
reaction. Silicone elastomers can be useful in biological or cosmetic applications, since they
are bio-friendly and the small capsule size is adapted to in-vivo vectorization. Moreover they
are non porous, a property which enables them to retain molecules such as perfume or vitamin
molecules in their core.

III Catanionic systems : an introduction to their properties and phase behaviour
27
Figure 6: Cryo-TEM photograph of silica hollow spheres templated from the CTAB/FC7
(Fig. a) and CTAT/SDB (Fig.b) system (reproduced from Ref. 41).
Aside from the vesicle structure, catanionic systems have also been used as template
for some polymerisation reactions in catanionic microemulsions (43,44). In a recent
investigation on the subject (45), the polymerisation of styrene was performed in a
microemulsion composed of a mixture of SDS, DTAB and styrene. The microemulsion
droplet are polymerised upon high energy irradiation and stabilized by the presence of
surfactants. This enables the formation of very monodisperse polymer particles.
Encapsulation
The closed structures spontaneously formed in catanionic systems represent a new
way of encapsulation. So far only nanodisks or icosahedra were not subject to any
encapsulation experiments. The properties of catanionic vesicles to encapsulate however have
been well investigated. Active molecules can thus be encapsulated in the bilayer membrane if
a
b

III Catanionic systems : an introduction to their properties and phase behaviour
28
they are lipophilic or in the core of the vesicle if they are hydrophilic. Encapsulation is useful
to protect actives in preventing any undesired reaction. Vesicles can thus be used as vectors to
deliver drugs to a specific place, without being destroyed.
The first encapsulation experiments were performed by Hargreaves and Deamer (46)
on the Cetyltrimethylammonium bromide / Sodium Dodecylsulfate system. The system was
heated up to 47°C but the vesicles observed at this temperature appeared impermeable to
sucrose. At lower temperatures, the vesicle degenerated into angular membrane fragments.
Temperature appears therefore a predominant parameter for the ability of catanionic vesicles
to encapsulate actives.
In 1989 (9) Kaler at al. proceeded to glucose entrapment experiments from vesicles
formed of Cetyltrimethylammonium tosylate and sodium dodecylbenzenesulfonate
(CTAT/SDBS) mixtures. Vesicles formed in the presence of glucose were equal in size to
those formed in pure water. No further quantitative detail concerning the entrapment rate of
glucose was mentioned but vesicles appeared to encapsulate and retain glucose. A more
comprehensive study of the entrapment ability of the SDBS/CTAT system was made by
Tondre et al. (47). The CTAT-rich vesicles appeared less efficient as regards entrapment as
the SDBS-rich vesicles. The overall surfactant weight percentage appeared to have a strong
influence as well on the encapsulation ratio, since increasing the total surfactant concentration
from 0.5wt% to 2.5wt% for SDBS-rich vesicular systems lead to an increase in the
encapsulation ratio from 0.5 to 3%.
Kondo et al. (48) investigated the ability of the system didodecyltrimethylammonium
bromide / sodium dodecylsulfate (DDAB / SDS) to encapsulate glucose. The separation of
free end entrapped glucose was achieved through dialysis experiments. Addition of Triton X-
100 (non-ionic surfactants being known to disrupt the membranes) was necessary to induce
the release of glucose. The maximum encapsulation percentage reached 7.9%.
III Catanionic systems : an introduction to their properties and phase behaviour
29
Another possibility for encapsulating a drug in a catanionic vesicle is to use a charged
drug as one of the components of the cationic / anionic mixture and induce a controlled
release of the drug in using a gel as a vehicle (49). Bramer et al. (50) studied a mixture of
SDS and positively charged drugs such as diphenhydramine, tetracaine or amitryptiline. Such
systems formed the same interesting phases as traditional catanionic mixtures. A Carbopol or
Agar gel containing the vesicles was used as a drug carrier and proved to be useful in
obtaining functional controlled-release systems.

III Catanionic systems : an introduction to their properties and phase behaviour
30
References
1. Schwartz A.M., Perry J.W. Surface Active Agents. Interscience. New York1949, Chapter
6.
2. Baeckstroem, K.; Lindman, B.; Engstroem, S. Langmuir, 1988, 4(4), 872-8.
3. Malmsten, M.; Lindman, B. Langmuir, 1989, 5(4), 1105-11.
4. Holmberg, K.; Jönsson, B.; Kronberg, B.; Lindman, B. Surfactants and Polymers in
aqueous solutions. Wiley, 2003.
5. Schmölzer, S. Dissertation “Kinetik der Vesikelbildung in katanionischen Tensidsystemen”,
Universität Bayreuth.
6. Raghavan, S.R.; Fritz, G.; Kaler, E.W. Langmuir, 2002, 18(10), 3797-3803.
7. Koehler, R.D.; Raghavan, S.R.; Kaler, E.W. Journal of Physical Chemistry B, 2000,
104(47), 11035-11044.
8. Li, X.; Kunieda, H. Current Opinion in Colloid & Interface Science, 2003, 8 (4,5), 327-336.
9. Dubois, M.; Zemb, T. Current Opinion in Colloid & Interface Science, 2000, 5, 27-37.
10. Kaler E W; Murthy A K; Rodriguez B E; Zasadzinski J. Science, 1989, 245 (4924), 1371-
4.
11. Horbaschek, K.; Hoffmann, H.; Hao, J. Journal of Physical Chemistry B, 2000, 104 (13),
2781-2784.
12. Khan, A. Current Opinion in Colloid & Interface Science, 1996, 1 (5), 614-623.
13. Evans, D.F.; Wennerström, H. The Colloidal Domain. Where Physics, Chemistry, Biology
and Technology meet. Wiley-VCH, New York, 1994.
14. Kaler, E.W.; Herrington, K.L.; Murthy, A.K.; Zasadzinski, J.A.N. Journal of Physical
Chemistry, 1992, 96 (16), 6698-707.
15. Yatcilla, M.T.; Herrington, K.L.; Brasher, L.L.; Kaler, E.W.; Chiruvolu, S.; Zasadzinski,
J.A. Journal of Physical Chemistry, 1996, 100 (14), 5874-9.

III Catanionic systems : an introduction to their properties and phase behaviour
31
16. Herrington, K.L.; Kaler, E.W.; Miller, D.D.; Zasadzinski, J.A.; Chiruvolu, S. Journal of
Physical Chemistry, 1993, 97(51), 13792-802.
17. Kondo, Y.; Uchiyama, H.; Yoshino, N.; Nishiyama, K.; Abe, M. Langmuir, 1995, 11 (7),
2380-4.
18. Brasher, L.L.; Herrington, K.L.; Kaler, E.W. Langmuir, 1995, 11 (11), 4267-77.
19. Soederman, O.; Herrington, K.L.; Kaler, E.W.; Miller, D.D. Langmuir, 1997, 13 (21),
5531-5538.
20. Iampietro, D.J.; Kaler, E.W. Langmuir, 1999, 15 (25), 8590-8601.
21. Marques,E.D.; Regev, O.; Khan,A.; Lindman,B. Advances in Colloid and Interface
Science, 2003, 100-102, 83-104.
22. Ninham, B.W.; Evans, D.F.; Wel, G.J. Journal of Physical Chemistry ,1983, 87, 5020.
23. Dubois, M.; Zemb, T. Langmuir, 1991, 7, 1352.
24. Miller, D.D.; Bellare, J.R.; Kaniko, T., Evans, D.F. Langmuir, 1988, 4, 1363.
25. Viseu, M.I.; Velazquez, M.M.; Campos, C.S.; Garcia-Mateos, I.; Costa, S.M.B. Langmuir,
2000, 16, 4882.
26. Marques, E.F.; Regev, O.; Khan, A.; Miguel, M.; Lindman, B. Journal of Physical
Chemistry B, 1999, 103 (39), 8353-8363.
27. Jokela, P.; Joensson, B.; Khan, A. Journal of Physical Chemistry, 1987, 91 (12), 3291-8.
28. Jokela, P.; Joensson, B.; Eichmueller, B.; Fontell, K. Langmuir, 1988, 4 (1), 187-92.
29. Joensson, B.; Jokela, P.; Khan, A.; Lindman, B.; Sadaghiani, A. Langmuir, 1991, 7 (5),
889-95.
30. Fukuda, H.; Kawata, K.; Okuda, H.; Regen, S.L. Journal of the American Chemical
Society, 1990, 112 (4), 1635-7.
31. Hao, J.; Liu, W.; Xu, G.; Zheng, L. Langmuir, 2003, 19 (26), 10635-10640.

III Catanionic systems : an introduction to their properties and phase behaviour
32
32. Dubois, M.; Gulik-Krzywicki, T.; Deme, B.; Zemb, T. Comptes Rendus de l'Academie
des Sciences, Serie IIc: Chimie, 1998, 1 (9), 567-575.
33. Zemb, T.; Dubois, M.; Demé, B.; Gulik-Krzywicki, T. Science, 1999, 283, 816-819.
34. Dubois M; Deme B; Gulik-Krzywicki T; Dedieu J C; Vautrin C; Desert S; Perez E; Zemb
T. Nature, 2001, 411 (6838), 672-5.
35. Dubois, M.; Lizunov, V.; Meister, A.; Gulik-Krzywicki, T.; Verbavatz, J.; Perez, E.;
Zimmerberg, J.; Zemb, T. Proceedings of the National Academy of Sciences of the United
States of America, 2004, 101 (42), 15082-15087.
36. Glinel, K.; Dubois, M.; Verbavatz, J.; Sukhorukov, G.B.; Zemb, T. Langmuir 2004, 20
(20), 8546-8551.
37. Mann, S.; Burkett, S.L.; Davis, S. A.; Fowler, C.E.; Mendelson, N.H.; Sims, S.D.; Walsh,
D.; Whilton, N.T. Chemistry of Materials, 1997, 9 (11), 2300-2310.
38. Goltner, C.G.; Antonietti, M. Advanced Materials, 1997, 9 (5), 431-436.
39. Hoss, R.; Voegtle, F. Angewandte Chemie, 1994, 106 (4), 389-98 40. McKelvey, C.A.; Kaler, E.W.; Zasadzinski, J.A.; Coldren, B.; Jung, H.-T. Langmuir,
2000, 16 (22), 8285-8290.
41. Hentze, H.; Raghavan, S.R.; McKelvey, C.A.; Kaler, E.W. Langmuir, 2003, 19 (4), 1069-
1074.
42. Kepczynski, M.; Ganachaud, F.; Hemery, P. Advanced Materials, 2004, 16 (20), 1861-
1863.
43. Li, X.; Lin, E.; Zhao, G.; Xiao, T. Journal of Colloid and Interface Science, 1996, 1841),
20-30.
44. Li, X.; Ueda, K.; Kunieda, H. Langmuir, 1999, 15 (23), 7973-7979. 45. Tieke, B. Colloid and Polymer Science, 2005, 283 (4), 421-430. 46. Hargreaves, W.R.; Deamer, D.W. Biochemistry, 1978, 17 (18), 3759-68.
III Catanionic systems : an introduction to their properties and phase behaviour
33
47. Tondre, C.; Caillet, C. Advances in Colloid and Interface Science, 2001, 931-3), 115-134.
48. Kondo, Y.; Uchiyama, H.; Yoshino, N.; Nishiyama, K.; Abe, M. Langmuir, 1995, 11 (7),
2380-4.
49. Paulsson, M.; Edsman, K. Pharmaceutical Research, 2001, 18, 1586-1592.
50. Bramer, T.; Paulsson, M.; Edwards, K.; Edsman, K. Pharmaceutical Research, 2003, 20
(10), 1661-1667.

IV Techniques
IV TECHNIQUES
4.1. Dynamic Light Scattering
Scattering techniques are often used to complete information concerning the size and
shape of the particles. They are less straightforward than imaging techniques such as cryo-
Transmission Electron Microscopy because the fitting of the scattering curves is model-
dependent and the inter-particle interactions cannot be ignored (1).
Light, i.e. an oscillating electromagnetic field, interacts in two ways with matter: by
absorption or by scattering. If light hits a particle with a wavelength corresponding to an
absorption band of the material, it absorbs it. If, on the contrary, light hits the particle with a
different wavelength, it will transmit or scatter it. This second radiation is the scattered light.
Light scattering is thus a mechanism of adsorption and re-emission of electromagnetic
radiation. (2). In a perfectly homogeneous and isotropic material, the radiation scattered by
the individual atoms or molecules interferes destructively, so that no scattered radiation is
observed. Hence scattering radiation is only observed when the investigated sample is only in
one or another way heterogeneous. For a multi-component system, such as the surfactant
systems investigated in this work, the main scattered signal is due to the differences in optical
properties, i.e. essentially the difference in refractive index, between the dispersion medium
and the dispersed phase.

IV Techniques
35
There are two different light scattering techniques: the static light scattering and the
dynamic light scattering. Static light scattering experiments consist in measuring time-
averaged properties, i.e. static properties, such as the determination of the average molecular
weight.
Dynamic Light Scattering was used in this work to determine the average size of the
particles present in solution, their polydispersity index as well as the intensity of light
scattered by the aggregates. In a Dynamic Light Scattering experiment, the incident light (Fig.
1) is a monochromatic laser source, i.e. a light source with a single wavelength. What is
registered in the DLS measurements is the temporal variation of the scattered light caused by
dynamical properties, such as the motion of dispersed particles. This technique is also called
quasi-elastic light scattering (QELS) since the frequency changes involved in the scattering
processes are usually very small compared to the frequency of the incident light.
Figure 1: Schema of the incident light hitting a particle and of the resulting scattered
light.
IV Techniques
36
The magnitude of the incident wave vector ik is: 01 /2 λπmki = , where λ0 is the
wavelength of the incident light and m1 the refractive index. An important description of the
scattered light is the scattering vector q , where si kkq −= , with ks scattered wave vector.
Since in typical QELS experiment the changes in frequency are very small compared to the
optical frequencies of the incident light, si kk = and )2
sin(4
0
1 θλπ
×=mq . The autocorrelation
function )(2 τG of the scattered intensity )(tI is an average value of the product of the
intensity registered at an arbitrary observation time t , )(tI , and the intensity registered at a
time delay τ later, )( τ+tI . For a dispersion of polydisperse particles in Brownian motion,
the intensity autocorrelation function is modelled by:
)().()(2 ττ += tItIG
The decay rate Γ of the curve )(2 τG is: Dq2=Γ , where D is the diffusion coefficient.
According to the Stokes-Einstein equation, the diffusion coefficient is: HR
kTDπθ6
= , where
RH is the hydrodynamic radius of the particles. A measurement of the size of the
aggregates can thus be deduced from DLS measurements.
The polydispersity index (P.I) is also deduced from the autocorrelation function and
evaluations of the measurements are made according to the following scale:
PI < 0.05 Monodisperse aggregates
0.1 < PI < 0.2 Narrow dispersion size
0.2 < PI < 0.5 Large dispersion size
0.5 < PI < 0.7 Very large dispersion size
0.7 < PI Correlation function cannot be interpreted and the results cannot be relied upon

IV Techniques
37
In the case of vesicular solutions, the possible cases can be summed up as follows:
Ideal case for measuring vesicle size: P.I.< 0.2
Non ideal case: vesicles + rod-like micelles: 0.3 < PI < 0.6
Non ideal case: vesicles + micelles + precipitate. No possible measurements.
Figure 2: Schemes of different cases possible in a vesicular solution.
hν hν
hν hν
hν
hν
hν

IV Techniques
38
4.2. Cryotransmission electron microscopy (cryo-TEM) and
Freeze-fracture TEM (FF-TEM)
Transmission Electron Microscopy (TEM) techniques are the most convincing proof
of the existence of vesicles, nanodisks, …etc, since they allow a direct visualization of the
formed aggregates (3, 4, 5). With these techniques, even micellar structures (~ 5-15 nm) could
be observed. Before analysing a sample by TEM, it is previously frozen so quickly (a few
milliseconds) that the microstructures in the solution do not have the time to rearrange in
other structures or to be destroyed and are like petrified. To this end, the fixation of the
sample is made by ultrafast cooling in liquid ethane or liquid propane.
4.2.1. Cryo-TEM Methode1
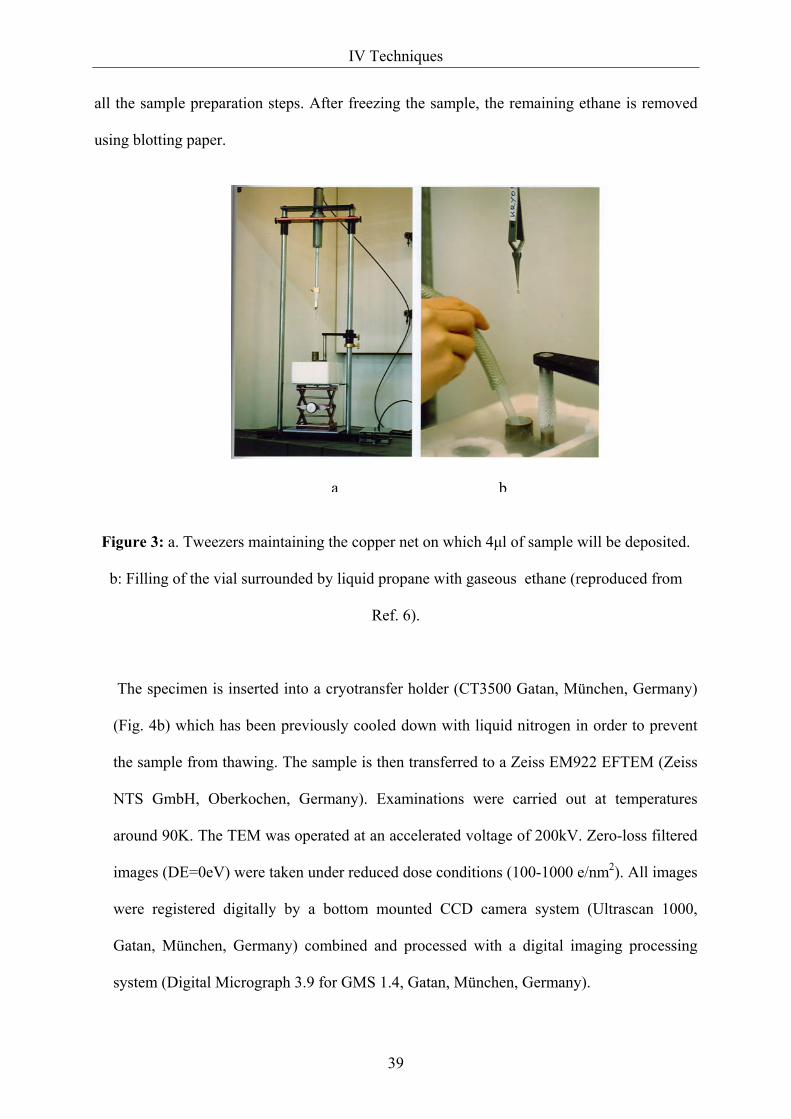
The freezing bath for cryo-TEM experiments is prepared in pouring gaseous ethane
into a vial surrounded by a pool of liquid nitrogen, to prevent the evaporation of ethane and
keep it liquid (Fig. 3 b). Then the preparation of the sample for cryo-TEM consists in taking a
small volume of sample (4μl) and placing it on an untreated bare copper TEM grid (600 mesh,
Science Services, München, Germany) (Fig. 3a). When the volume of sample has been
deposited on the net, the excess solution is gently blotted away with a filter paper, so that only
a thin film of solution remains on the copper grid. The specimen is instantly schock frozen by
rapid immersion into liquid ethane (Fig. 4a) and cooled to approximately 90K by liquid
nitrogen in a temperature-controlled freezing unit (Zeiss Cryobox, Zeiss NTS GmbH,
Oberkochen, Germany). The temperature is monitored and kept constant in a chamber during
1 All cryo-TEM pictures presented in this work were made at the Institute of Macromolecular Chemistry of the University of Bayreuth, Saclay.
IV Techniques
39
all the sample preparation steps. After freezing the sample, the remaining ethane is removed
using blotting paper.
Figure 3: a. Tweezers maintaining the copper net on which 4μl of sample will be deposited.
b: Filling of the vial surrounded by liquid propane with gaseous ethane (reproduced from
Ref. 6).
The specimen is inserted into a cryotransfer holder (CT3500 Gatan, München, Germany)
(Fig. 4b) which has been previously cooled down with liquid nitrogen in order to prevent
the sample from thawing. The sample is then transferred to a Zeiss EM922 EFTEM (Zeiss
NTS GmbH, Oberkochen, Germany). Examinations were carried out at temperatures
around 90K. The TEM was operated at an accelerated voltage of 200kV. Zero-loss filtered
images (DE=0eV) were taken under reduced dose conditions (100-1000 e/nm2). All images
were registered digitally by a bottom mounted CCD camera system (Ultrascan 1000,
Gatan, München, Germany) combined and processed with a digital imaging processing
system (Digital Micrograph 3.9 for GMS 1.4, Gatan, München, Germany).
a b

IV Techniques
40
Figure 4: a: Freezing of the sample by immersion into liquid ethane. b: cryotransfer holder
used to move the sample into the transmission electron microscope (reproduced from Ref. 6).
The appearance of the film of solution which has been frozen is represented in Fig. 5. Because
of the unequal repartition of the film thickness, the aggregates are sorted out by size, the
largest ones being at the edge of the film. This is the reason why the cryo-TEM technique is
not adapted to the observation of big aggregates such as icosahedra, which can measure
several micrometers. The technique was however perfectly adapted to this work to
characterize flat nanodisks or small-sized vesicles. A picture of vesicles realized by cryo-
TEM is represented in Fig. 6.
a b

IV Techniques
41
Figure 5: Frozen film containing liposomes. The uneven repartition of the spherical
structures can be clearly seen (reproduced from Ref. 6).
Figure 6: Cryo-TEM picture of well-formed spherical catanionic vesicles from the system
Cetyltrimethyammonium bromide / sodium octylsulfate (mass ratio 80/20). (reproduced from
Ref. 7)
4.2.2. Freeze – Fracture Methode2
The preparation of a sample for freeze-fracture TEM (FF-TEM) consists in depositing
a small quantity of sample on a sandwich-like copper grid. The solution is then frozen in
2 All FF-TEM pictures presented in this work were made at the Commissariat à l’Energie Atomique, Saclay, France.

IV Techniques
42
liquid propane but the preparation differs from cryo-TEM in so far as the solution is not
blotted away with a filter, so that a drop of solution is freezed and not a film. Once the drop is
frozen, its surface is fractured in vacuum (10-7 Torr) at -125°C with a liquid-nitrogen-cooled
knife in a Balzers 301 freeze-etching unit (Switzerland apparatus). A mixture of carbon and
platin is then poured down on this surface, so that an instantaneous metallic replica of the
sample is taken. After preparation, the sample remaining on the print is washed away with
water. Such a metallic replica is very stable and can be kept for years at room temperature
without any modification of the surface. The replica are then observed and photographed by
transmission electron microscopy3.
The FF-TEM is frequently used not only for determining the presence of vesicles but
also for nanodisks (Fig. 7) and for icosahedras (Fig. 8), where the edges can be seen with this
technique very distinctly.
Figure 7: Freeze fracture electron microscopy showing the coexistence of discs of finite
size with a lamellar phase (reproduced from Ref. 8).
3 In order to observe with more precision the volume of the structures present in the sample, freeze-
etching TEM (FE-TEM) can be used instead of freeze-fracture TEM. The preparation of the sample is the same. However, before pouring the mixture Carbon/Platin, the temperature of the sample is lightly increased, so that a small amount of water can evaporate. The structures will therefore jut out of the surface more distinctly.
IV Techniques
43
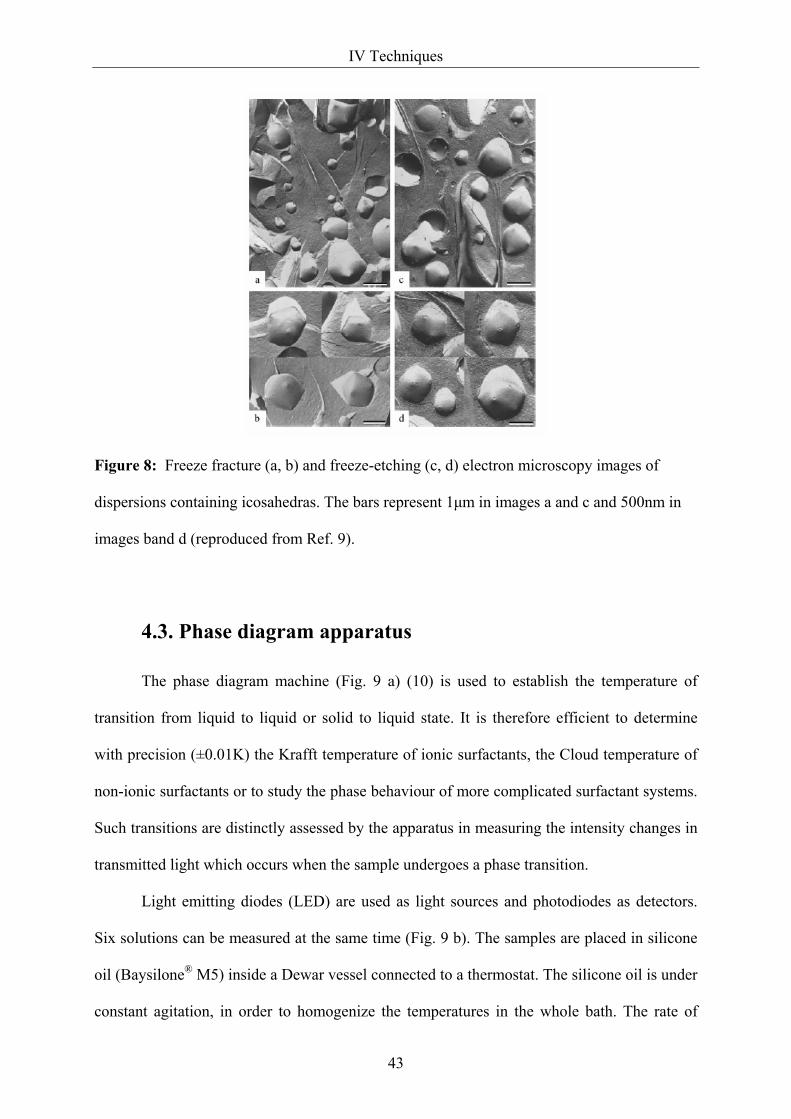
Figure 8: Freeze fracture (a, b) and freeze-etching (c, d) electron microscopy images of
dispersions containing icosahedras. The bars represent 1μm in images a and c and 500nm in
images band d (reproduced from Ref. 9).
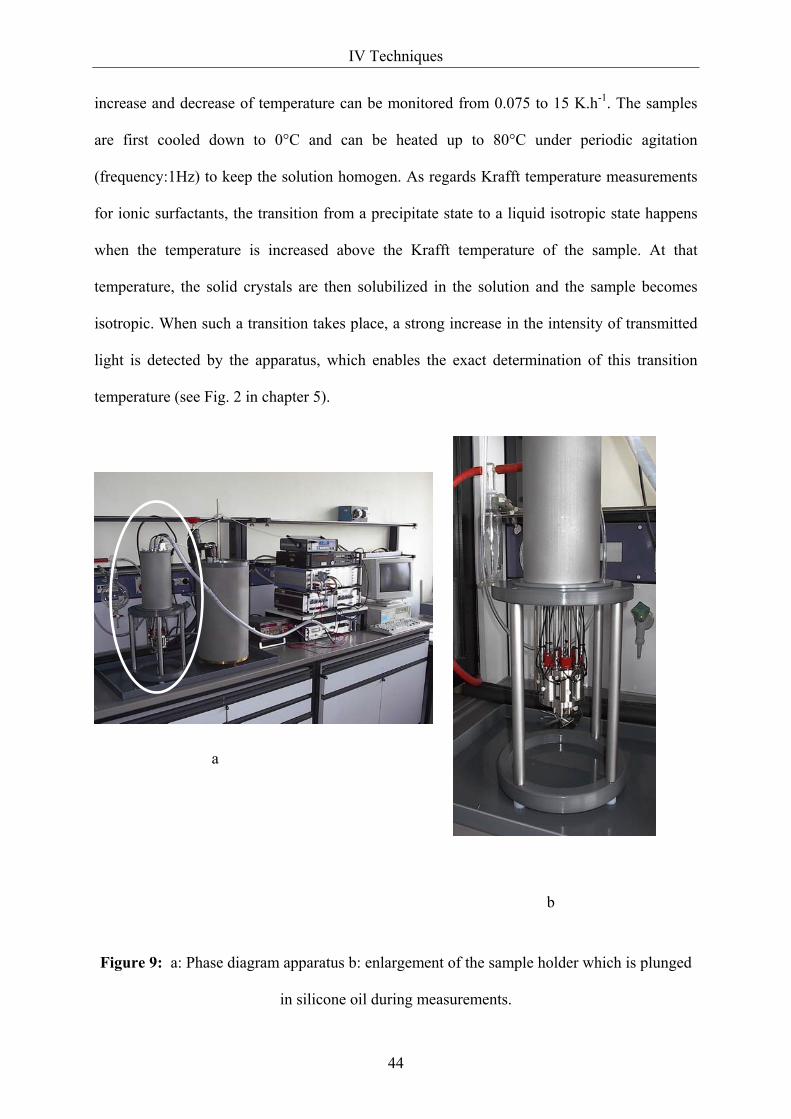
4.3. Phase diagram apparatus
The phase diagram machine (Fig. 9 a) (10) is used to establish the temperature of
transition from liquid to liquid or solid to liquid state. It is therefore efficient to determine
with precision (±0.01K) the Krafft temperature of ionic surfactants, the Cloud temperature of
non-ionic surfactants or to study the phase behaviour of more complicated surfactant systems.
Such transitions are distinctly assessed by the apparatus in measuring the intensity changes in
transmitted light which occurs when the sample undergoes a phase transition.
Light emitting diodes (LED) are used as light sources and photodiodes as detectors.
Six solutions can be measured at the same time (Fig. 9 b). The samples are placed in silicone
oil (Baysilone® M5) inside a Dewar vessel connected to a thermostat. The silicone oil is under
constant agitation, in order to homogenize the temperatures in the whole bath. The rate of
IV Techniques
44
increase and decrease of temperature can be monitored from 0.075 to 15 K.h-1. The samples
are first cooled down to 0°C and can be heated up to 80°C under periodic agitation
(frequency:1Hz) to keep the solution homogen. As regards Krafft temperature measurements
for ionic surfactants, the transition from a precipitate state to a liquid isotropic state happens
when the temperature is increased above the Krafft temperature of the sample. At that
temperature, the solid crystals are then solubilized in the solution and the sample becomes
isotropic. When such a transition takes place, a strong increase in the intensity of transmitted
light is detected by the apparatus, which enables the exact determination of this transition
temperature (see Fig. 2 in chapter 5).
Figure 9: a: Phase diagram apparatus b: enlargement of the sample holder which is plunged
in silicone oil during measurements.
a
b

IV Techniques
45
References
1. Bergström, M.; Pedersen, J.S.; Schurtenberger, P.; Egelhaaf, S.U. Journal of Physical
Chemistry B, 1999, 103, 9888.
2. Finsy, R. Advances in Colloid and Interface Science, 1994, 52, 79-143.
3. Miller, D.D.; Bellare, J.R.; Evans, D.F.; Talmon, Y.; Ninham, B.W. Journal of Physical
Chemistry, 1987, 91, 674-685.
4. Talmon, Y.; Mohwald, H. Current Opinion in Colloid & Interface Science, 1996, 1 (2),
241-242.
5. Talmon, Y. Berichte der Bunsen-Gesellschaft, 1996, 100 (3), 364-372.
6. Gräber, S. Diplomarbeit: Elektronenmikroskopie Untersuchungen an Membranlipiden von
Methanopyrus Kandleri. 1995, Lehrstuhl für Mikrobiologie, Universität Regensburg.
7. Yatcilla, M.T.; Herrington, K.L.; Brasher, L.L.; Kaler, E.W.; Chiruvolu, S.; Zasadzinski,
J.A. Journal of Physical Chemistry, 1996, 100 (14), 5874-9.
8. Zemb, T.; Dubois, M.; Demé, B.; Gulik-Krzywicki, T. Science, 1999, 283, 816-819.
9. Dubois M; Deme B; Gulik-Krzywicki T; Dedieu J C; Vautrin C; Desert S; Perez E; Zemb
T. Nature, 2001, 411 (6838), 672-5.
10. Schroedle, S.; Buchner, R.; Kunz, W. Fluid Phase Equilibria, 2004, 175.

V Effect of temperature on the realms of existence of catanionic vesicles
V EFFECT OF TEMPERATURE ON THE REALMS OF
EXISTENCE OF CATANIONIC VESICLES4
5.1. Introduction
The Krafft temperature of ionic single surfactants
The change of temperature strongly affects the surfactant systems. On polyethoxylated
surfactants (CiEOj) cloud point temperatures can be observed, i.e. upon heating liquid-liquid
phase separation occurs (1, 2). This is attributed to the dehydration of the hydrophilic groups
of surfactants upon heating.
On the contrary in ionic surfactant systems the solubility increases when temperature
increases. At a certain temperature, different for each ionic surfactant, a precipitation of the
surfactant is observed. Below this temperature, the surfactant becomes insoluble in water and
crystallizes out of solution as a hydrated crystal. It loses consequently its surface activity.
Above the Krafft point the surfactant molecules are soluble and can freely self-aggregate f.i.
into micelles or vesicles.
This phenomenon is generally denoted as the “Krafft temperature” (or “Krafft point”),
which is the temperature where the solubility of the surfactant is equal to its critical micelle
concentration (3, 4, 5) (Fig. 1). However, this method of determination of the Krafft point, too
much time-consuming, is seldom used. The Krafft temperatures corresponds usually to the
temperature above which an aqueous solution containing 1wt% ionic surfactant forms a
dispersed phase and becomes isotropic.
4 Renoncourt, A. ; Bauduin, P. ; Touraud, D. ; Azemar, N. ; Solans, C. ; Kunz, W. Colloids and Surfaces A (2005) Accepted.

V Effect of temperature on the realms of existence of catanionic vesicles
47
It has been shown that the Krafft point of ionic surfactants can be changed by varying
the counterion (6), the size of the polar head (7, 8) or by increasing the degree of insaturation
(9) or branching in the hydrocarbon tail (6).
Figure 1: Evolution of an ionic surfactant solubility in water versus temperature.
(reproduced from Ref. 5).
The Krafft temperature of catanionic surfactant systems
In classical catanionic phase diagrams a more or less extended zone of precipitate
predominates around equimolarity (10, 11, 12). When the systems are heated, the precipitate
zone tends to shrink (13) to give way to micellar or vesicular solutions. The influence of
temperature seems to be not only crucial in precipitation phenomena but also in the stability
of the vesicles formed in catanionic systems. This is why vesicle formation only occurs over a
limited anionic/cationic ratio and temperature range, where there is sufficient solubility in
V Effect of temperature on the realms of existence of catanionic vesicles
48
solution of catanionic species to enable this formation and avoid any precipitation. Below the
Krafft temperature, precipitation into a solid in equilibrium with a molecular solution occurs.
No other structure than a hydrated crystal can thus be observed below this temperature in
catanionic systems. Only above this temperature can the formation of finite structures take
place. It is therefore of obvious interest to study the parameters which could extend this
temperature range over which catanionic vesicles are stable. Indeed stability of vesicles at
room temperature and below is the absolute precondition to any further experiment aiming at
an eventual application of catanionic vesicles.
In this study three different anionic surfactants sodium dodecylsulfate (SDS), lithium
dodecylsulfate (LiDS) and sodium laurylethersulfate (LES) were first mixed with
dodecyltrimethylammonium bromide (DTAB). The Krafft temperatures at different mixing
ratios along with the stability of vesicles with temperature were studied. To see the influence
of the cation chain length, counterion and polar head size on the formation of catanionic
vesicle systems, SDS was mixed with DTAB as well as with octyltrimethylammonium
bromide (OTAB), cetyltrimethylammonium bromide (CTAB), dodecyltrimethylammonium
chloride (DTAC) and hexadecylbenzyldimethylammonium chloride (HBAC).
5.2. Experimental
LiDS, OTAB, DTAC, CTAB were purchased from Fluka (Germany), SDS from
Merck (Germany), DTAB from Aldrich (Germany) and HBAC from Sigma (Germany) and
were provided at the purity of minimum 99%. LES which possesses an average oxyethylene
number of two was obtained from Cognis Germany. All surfactants were used as received.
Stock solutions of all surfactants were made at 1 wt% in Millipore water and were left to
equilibrate at 25°C. All systems were observed at a total surfactant concentration of 1wt%

V Effect of temperature on the realms of existence of catanionic vesicles
49
through mixing the surfactant solutions at different anionic/cationic surfactant mass ratios
every 5%. The different zones were assigned after leaving the samples to equilibrate 1 week
at 25°C (Fig. 4 and Fig. 9). The phase evolution as a function of temperature (5°C and 45°C)
of the systems SDS/DTAB, LiDS/DTAB, LES/DTAB (Fig. 4) were determined by
equilibrating the samples in a thermostated water bath at the selected temperature and making
visual observations after 24 hours. The phase diagrams of the systems SDS/DTAB and
LES/DTAB (Fig. 5) were made in mixing the oppositely charged surfactant at 1wt% and
diluting afterwards with Millipore water. About 150 samples for each phase diagram were
prepared and left to equilibrate one week at 25°C before any observations or measurements
were performed on the solutions. The limits of the different phases were definitely attributed
if the appearnce of the samples did not changed for one month at 25°C.
The Krafft temperatures were determined for all systems at 1wt% by turbidity measurements
using an automated home-built apparatus conceived for the determination of liquid-liquid and
solid-liquid phase transitions (14) already described in chapter 4. Krafft temperatures were
determined at the melting of the last surfactant crystal with a precision ΔT of ±0.01°C. This
was observed when the transmitted intensity through the solutions reached a maximum and
remained constant over time (Fig. 2 taken from our measurements). The measured Krafft
temperatures correspond to the transition from precipitate to isotropic solution i.e. to micellar
or to vesicular solution.

V Effect of temperature on the realms of existence of catanionic vesicles
50
Figure 2: Light transmission through the sample SDS/HBAC at the weight composition of
20/80 during constant heating. A clear transition from a precipitate state with low light
transmission to a clear isotropic solution with a maximum intensity can be observed. The
Krafft temperature of the solution is here determined at 54.23°C.
5.3. Results and discussion
A phenomenon observed for all systems measured (Fig. 3 and Fig. 8) is that Krafft
temperatures (TK) are higher for catanionic mixtures than for the corresponding single ionic
surfactants. Around equimolarity of cationic and anionic surfactants a maximum of TK is
reached in most cases. This maximum lies within the zone of precipitation usually observed at
room temperature. The first part of the study consisted in assessing the influence on
catanionic Krafft temperatures of the cationic counterion of the anionic surfactant as well as
the presence of ethylene oxide groups on the anionic surfactant. The second part focused on
varying the cationic surfactant in mixture with SDS by changing the chain length, the anionic
counterion and the size of the polar head.

V Effect of temperature on the realms of existence of catanionic vesicles
51
5.3.1 Anionic surfactants/DTAB/water systems
The influence of the cationic counterion of the anionic surfactant on the Krafft point
and vesicle stability of a catanionic mixture was first investigated in the systems SDS/DTAB
and LiDS/DTAB, i.e. by replacing a sodium counterion Na+ by a lithium one Li+. The
experimentally determined Krafft temperatures of the single anionic systems SDS and LiDS
at 1wt% were measured to be 11.5°C and <0°C respectively. This pronounced difference in
TK makes sense because the more hydrated lithium ion (15) binds less strongly to the
dodecylsulfate (DS) than the sodium ion. This is reflected in the CMC (critical micellar
concentration) of LiDS (16) (8.92mM at 25°C) which is higher than the cmc of SDS
(8.32mM) at 25°C. The binding of Li+ ion with the polar head of the surfactant being weaker,
the hydrophilicity of the anionic surfactant in water is dramatically increased. The question
was thus to know whether this difference in binding and solubility would be reflected in the
stability on lower temperatures of the catanionic systems with DTAB. Krafft temperature
measurements were thus performed on these systems (Fig. 3) at different ratios from pure
cationic surfactant to pure anionic surfactant. It appears that the two curves are similar for the
cationic rich solutions whereas the Krafft temperatures are lower for the LiDS/DTAB
mixtures when the surfactant ratio exceeds 50wt% of the anionic surfactant. For solutions
having a ratio over 62wt% anionic surfactant, the difference becomes more significant since
Tk<0°C for the LiDS/DTAB solutions, while Krafft points remain higher than 11°C for
SDS/DTAB. This difference is directly linked with the Krafft temperature differences of the
single anionic surfactants SDS and LiDS. Anyway the influence of the replacement of the
counterion on the vesicle stability remains limited (Fig. 4) since the vesicle solutions
precipitate for both systems at lower temperatures (5°C) and the vesicle zone is as extended
for SDS/DTAB as for LiDS/DTAB. However the precipitate zone is as expected slightly more
reduced for the system LiDS/DTAB.

V Effect of temperature on the realms of existence of catanionic vesicles
52
LES differs from SDS by the presence of 2 ethylene oxide (EO) groups between the
hydrocarbon chain and the sulfate polar head. This difference in structure leads to a major
difference in their Krafft points (17), since TK (SDS) = 11.5°C and TK (LES) < 0°C. The
presence of two EO groups enables a better hydration of the polar head of the surfactant,
increasing thus strongly the surfactant’s hydrophilicity. The lower Krafft point of LES has its
consequences for the LES/DTAB system. As can be seen from Fig. 3, the Krafft points of the
LES/DTAB mixtures are lower than those corresponding to the SDS/DTAB systems over
nearly the whole composition range. At low LES contents (0-48%), this effect is particularly
pronounced with Krafft temperatures below 0°C. Surprisingly the zone of precipitation
between 48 and 56% LES does not vanish even at temperatures higher than 70°C. This
temperature is much higher than the Krafft temperatures of the SDS/DTAB or LiDS/DTAB
mixtures in the same composition region. Between 56% and 70%, TK is lower than 20°C and
above this temperature the solutions appear isotropic and blue as are solutions for anionic
surfactant ratios between 32% and 47%. At last, the ratios ranging from 70% LES to pure
LES give way to isotropic micellar solutions with Krafft temperatures below 0°C.
Consequently the vesicle zone for the system LES/DTAB appears much larger at all observed
temperatures than in the system SDS/DTAB/water (Fig. 4, 5, 6 and 7) and can be observed in
both cationic rich and anionic rich samples. An alkylethersulfate surfactant such as LES
appears thus to possess the appropriate balance between chain length and hydrophilicity to
enable the formation of vesicles at room temperature and even below over a wide range of
cationic/anionic ratios. This property of LES over SDS could be confirmed in comparing both
phase diagrams of the SDS/DTAB and LES/DTAB systems (Fig. 5) where the two-phase area
composed of precipitate and isotropic solution is much reduced in the LES/DTAB system,
whereas it occupies an important part of the phase diagram of the SDS/DTAB system.
Moreover, the overall vesicular zone is much larger for the LES/DTAB system than it is for

V Effect of temperature on the realms of existence of catanionic vesicles
53
the SDS/DTAB system. Dynamic Light Scattering measurements were performed on the
LES/DTAB system in the vesicular area at 0.8 wt% overall surfactant concentration for mass
ratios of LES/DTAB between 30/70 and 40/60. All vesicle sizes ranged between 110 and
180nm for polydispersity indexes of about 0.4.
6
11
16
21
26
31
36
41
46
0 10 20 30 40 50 60 70 80 90 100
anionic surfactant ratio (wt%)
Tk (°
C)
SDS/DTABLES/DTABLiDS/DTAB
Tk>70°
Tk<0°C(LES/DTAB)
(LES/DTAB)Tk<0°C
Figure 3: Krafft temperatures of the systems SDS/DTAB, LiDS/DTAB, LES/DTAB at a total
surfactant concentration of 1wt% at different anionic/cationic mixing ratios (in weight %).
Figure 4: Phase behaviour of the same systems at 1 wt% at 5°C, 25°C and 45°C.
I: isotropic colourless solution; D1: demixing isotropic colourless solution/white precipitate;
D2: demixing bluish solution/white precipitate; V: vesicular solution.

V Effect of temperature on the realms of existence of catanionic vesicles
54
Figure 5: Phase diagrams of the SDS/DTAB and LES/DTAB systems at 25°C. The phase equilibria can therefore be dramatically changed by incorporating ethylene oxide
groups into the polar head group of a surfactant molecule. It is possible, for equimolar
mixtures, to obtain an extended isotropic solution phase at the cost of the multiphase regions
if a sufficient number of ethylene oxide groups are present in the polar head group (18).

V Effect of temperature on the realms of existence of catanionic vesicles
55
Figure 6: Visual observations made for the system SDS/DTAB at 1wt% overall surractant
concentration for SDS/DTAB mass ratios from 10/90 to 80/20.
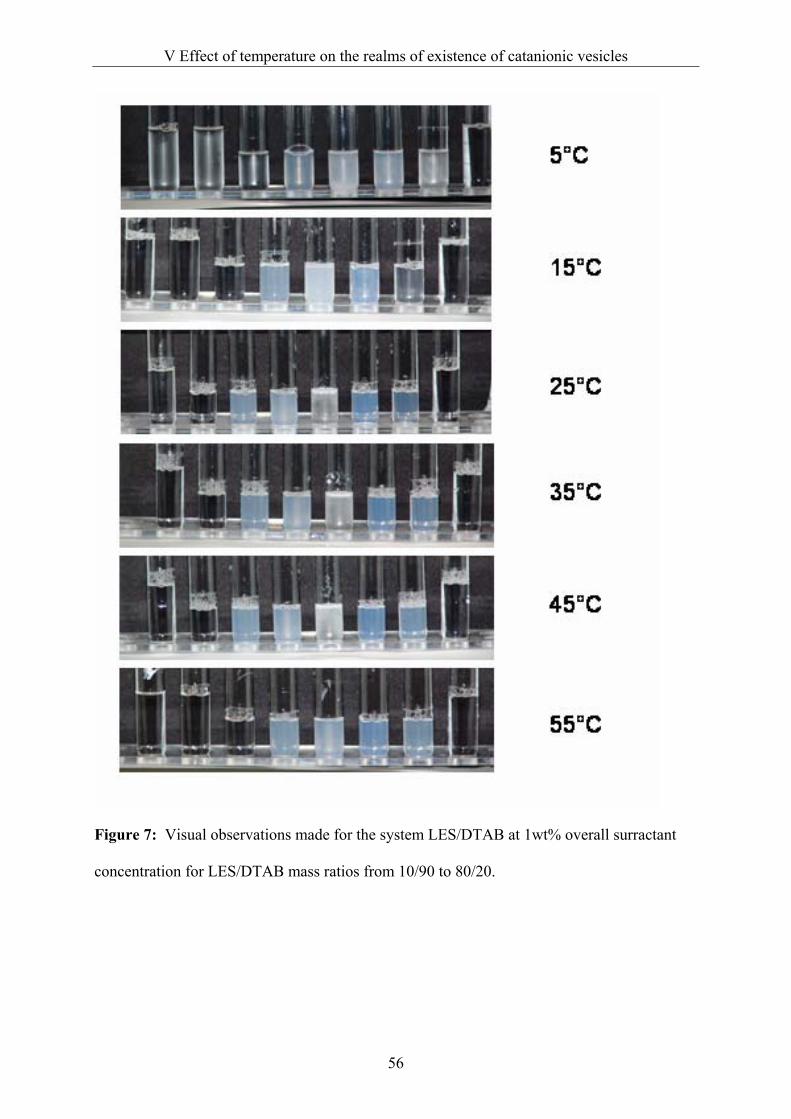
V Effect of temperature on the realms of existence of catanionic vesicles
56
Figure 7: Visual observations made for the system LES/DTAB at 1wt% overall surractant
concentration for LES/DTAB mass ratios from 10/90 to 80/20.

V Effect of temperature on the realms of existence of catanionic vesicles
57
5.3.2 SDS/cationic surfactant/water systems
The influence of the cationic surfactant chain length on catanionic Krafft temperatures
is now investigated. Cetyltrimethylammonium bromide (CTAB) and dodecyl-
trimethylammonium bromide (DTAB) have the same quaternary ammonium polar head
groups but CTAB has a longer chain length (16 carbon atoms) than DTAB (12 carbon atoms).
Owing to stronger hydrophobic repulsion forces of its hydrocarbon chain CTAB is therefore
less soluble in water than DTAB. The Krafft point of pure CTAB in water at 1 wt% is
consequently higher (25°C) than that of DTAB (<0°C). The corresponding catanionic
mixtures, i.e. SDS/DTAB and SDS/CTAB display the same marked differences in their Krafft
temperatures over the whole anionic/cationic ratios (Fig. 8). At 25°C most of the SDS/CTAB
systems are in a precipitate form for sample compositions from 0% to 75% SDS (Fig. 9).
Colourless and bluish isotropic solutions, i.e. micellar and vesicular solutions only appear for
all samples when these are heated up to temperatures as high as 50°C. Differences in the
hydrocarbon chain length has been proven to increase vesicle stability (19) in comparison to
other microstructures such as precipitate phases. Such a finding enables a tailoring of the
vesicle stability and size. However, according to the study of vesicles over temperature
performed here, the Krafft points of the ionic surfactants implied in such catanionic systems
must also be taken into account.
The temperature stability of another asymmetric catanionic system was studied for the
system SDS/OTAB, where the linear alkyl chain of the anionic and cationic surfactants
display respectively 12 and 8 carbon atoms. No precipitation occurs at 25°C and the vesicle
zone is considerably enlarged in both SDS-rich and OTAB-rich solutions. According to the
Krafft point diagram, precipitation occurs below 18°C for solution compositions of
SDS/OTAB from10% to 50% SDS and at even lower temperatures at the other catanionic
ratios.
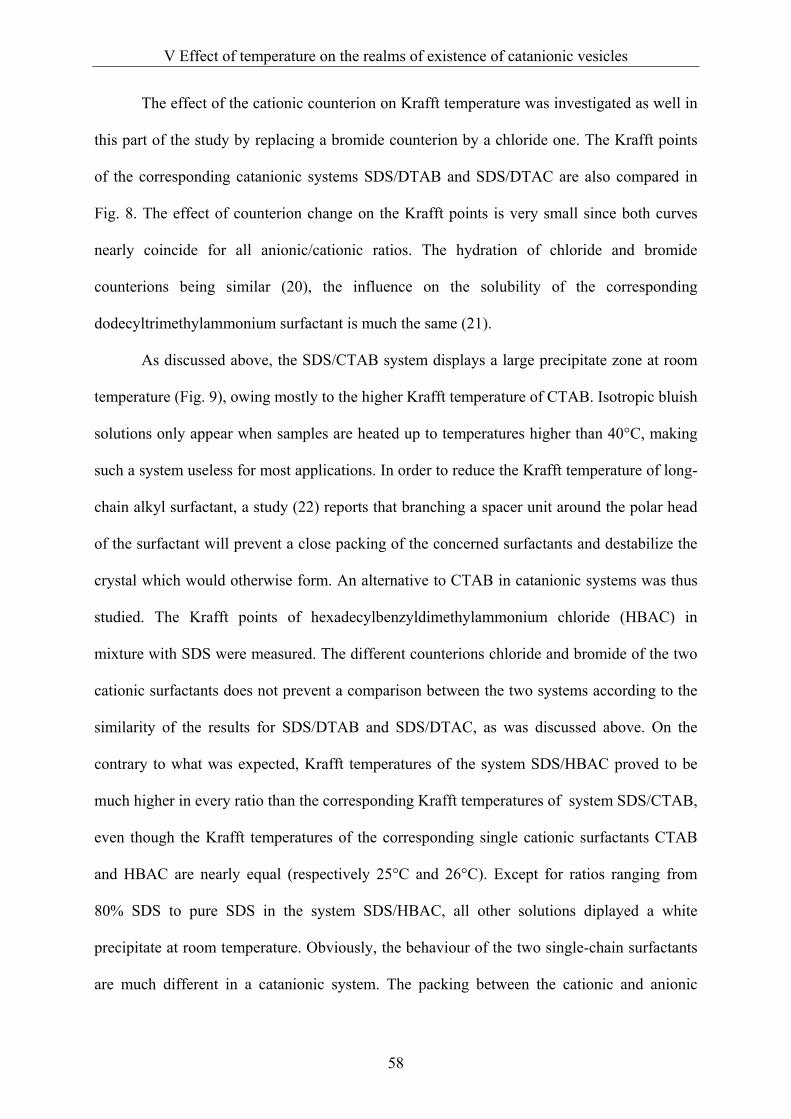
V Effect of temperature on the realms of existence of catanionic vesicles
58
The effect of the cationic counterion on Krafft temperature was investigated as well in
this part of the study by replacing a bromide counterion by a chloride one. The Krafft points
of the corresponding catanionic systems SDS/DTAB and SDS/DTAC are also compared in
Fig. 8. The effect of counterion change on the Krafft points is very small since both curves
nearly coincide for all anionic/cationic ratios. The hydration of chloride and bromide
counterions being similar (20), the influence on the solubility of the corresponding
dodecyltrimethylammonium surfactant is much the same (21).
As discussed above, the SDS/CTAB system displays a large precipitate zone at room
temperature (Fig. 9), owing mostly to the higher Krafft temperature of CTAB. Isotropic bluish
solutions only appear when samples are heated up to temperatures higher than 40°C, making
such a system useless for most applications. In order to reduce the Krafft temperature of long-
chain alkyl surfactant, a study (22) reports that branching a spacer unit around the polar head
of the surfactant will prevent a close packing of the concerned surfactants and destabilize the
crystal which would otherwise form. An alternative to CTAB in catanionic systems was thus
studied. The Krafft points of hexadecylbenzyldimethylammonium chloride (HBAC) in
mixture with SDS were measured. The different counterions chloride and bromide of the two
cationic surfactants does not prevent a comparison between the two systems according to the
similarity of the results for SDS/DTAB and SDS/DTAC, as was discussed above. On the
contrary to what was expected, Krafft temperatures of the system SDS/HBAC proved to be
much higher in every ratio than the corresponding Krafft temperatures of system SDS/CTAB,
even though the Krafft temperatures of the corresponding single cationic surfactants CTAB
and HBAC are nearly equal (respectively 25°C and 26°C). Except for ratios ranging from
80% SDS to pure SDS in the system SDS/HBAC, all other solutions diplayed a white
precipitate at room temperature. Obviously, the behaviour of the two single-chain surfactants
are much different in a catanionic system. The packing between the cationic and anionic

V Effect of temperature on the realms of existence of catanionic vesicles
59
surfactants is quite different from the single cationic one and contributes to increase the
stability of the catanionic crystal, leading thus to higher Krafft temperatures.
6
16
26
36
46
56
0 10 20 30 40 50 60 70 80 90 100
anionic surfactant ratio (wt%)
Tk (°
C)
SDS/DTAB
SDS/CTAB
SDS/DTAC
SDS/OTAB
SDS/HBAC
Figure 8: Krafft temperatures of the systems SDS/DTAB, SDS/DTAC, SDS/CTAB,
SDS/OTAB, SDS/HABC at a total surfactant concentration of 1wt% at different
anionic/cationic mixing ratios (in weight %).
Figure 9: Phase behaviour of the same systems at 1 wt% at 25°C.
I: isotropic colourless solution; D1: demixing isotropic colourless solution/white precipitate;
D2: demixing bluish solution/white precipitate; V: vesicle solution.

V Effect of temperature on the realms of existence of catanionic vesicles
60
5.4. Conclusion
As could be shown in this work, the Krafft temperature phenomenon appears to be
linked to formation of stable vesicles in catanionic systems. Catanionic systems with the
lowest Krafft point will more easily form vesicles, which remain stable over a larger
temperature range. Hydration seems to play an important role. Changing the counterion of
dodecylsulfate from sodium to lithium as well as branching two ethylene oxide groups on the
anionic surfactant increase the hydrophily of the molecule and reduce the Krafft temperature
in the single surfactant-water system. In contrast, the effect of hydrophily on the catanionic
Krafft temperatures is different, since the increase in stability of the vesicles is only
pronounced in the case of the LES/DTAB system compared to the SDS/DTAB system. Using
a cationic surfactant with a C8 (OTAB) hydrocarbon chain instead of a C12 (DTAB) or a C16
(CTAB) widely extends the zone of isotropic solution at room temperature. The effect of
increasing in the size of the cationic polar head is not predictable since in the case of
SDS/HBAC the Krafft points are much higher than in the SDS/CTAB systems.

V Effect of temperature on the realms of existence of catanionic vesicles
61
References 1. Robson, R.J.; Dennis, E.A. Journal of Physical Chemistry, 1977, 81 (11), 1075-8.
2. Corti, M.; Minero, C.; Degiorgio, V. Journal of Physical Chemistry, 1984, 88 (2), 309-17.
3. Moroi, Y. Progress in Colloid and Polymer Science, 1988, 77, 55-61.
4. Bales, B.L. Journal of Physical Chemistry, 2002, 106, 9033-9035.
5. Lindman,B.; Wennerström, H., Topics in Current Chemistry, Vol. 87, Springer-Verlag,
Berlin, 1980.
6. Shinoda, K.; Hato, M.; Hayashi, T. Journal of Physical Chemistry, 1972, 76, 909.
7. Davey, T.W.; Ducker, W.A.; Hayman, A.R.; Simpson, J. Langmuir, 1988, 14, 3210-3213.
8. Sjoebom, M.B.; Edlund, H.; Lindstroem, B. Langmuir, 1999, 15 (8), 2654-2660.
9. Yang, P.W.; Mantsch, H.H. Journal of Colloid and Interface Science, 1986, 113, 218.
10. Khan, A. Current Opinion in Colloid & Interface Science, 1996, 1 (5), 614-623.
11. Jokela, P.; Joensson, B.; Khan A. Journal of Physical Chemistry, 1987, 91, 3291. 12. Stellner, K.L; Amante, J.C.; Scamehorn, J.F.; Harwell, J.H. Journal of Colloid and
Interface Science, 1988, 123, 186.
13. Amante, J.C.; Scamehorn, J.F.; Harwell, J.F. Journal of Colloid and Interface Science,
1991, 144, 243.
14. Schroedle, S.; Buchner, R.; Kunz, W. Fluid Phase Equilibria, 2004, 175.
15. Kim, D.H.; Oh, S.G.; Cho, C.G. Colloid and Polymer Science, 2001, 279, 39.
16. Atwood, D.; Florence, A. Surfactant Systems: Their Chemistry, Pharmacy, and Biology,
Chapman and Hall, London, 1983.
17. Hato, M.; Shinoda, K. Journal of Physical Chemistry, 1973, 77, 378. 18. Li, X.-G.; Liu, F.-M. Colloids and Surfaces, 1995, 96, 113-119. 19. Yatcilla, M.T.; Herrington, K.L.; Brasher, L.L.; Kaler, E.W.; Chiruvolu, S.; Zasadzinski,
J.A. Journal of Physical Chemistry, 1996, 100 (14), 5874-9.

V Effect of temperature on the realms of existence of catanionic vesicles
62
20. Leontidis, E. Current Opinion in Colloid & Interface Science, 2002, 7, 81. 21. Kabalnov, A.; Olsson, U.; Wennerstroem, H. Journal of Physical Chemistry, 1995, 99,
6220.
22. Davey, T.W.; Ducker, W.A.; Hayman, A.R; Simpson, J. Langmuir, 1998, 14, 3210.

Technical-grade surfactant systems
VI TECHNICAL - GRADE SURFACTANT SYSTEMS
The possible applications of catanionic systems are often referred to in the literature.
Of particular interest is the possibility to spontaneously form closed structures such as
vesicles or icosahedras, which represents a new way of encapsulating actives. However, so far
most studies published in the literature on catanionic systems were made from purified
surfactants. To make a real step towards further applications, an investigation of technical-
grade, non purified surfactant systems seemed most relevant.
In this work we investigated several technical-grade catanionic surfactant systems to
know whether vesicle formation remained possible, though the surfactants used still contained
solvents and salts as well as a variety of different counterions. The interest of this work lies in
the fact that the surfactants studied were used as received from industrial suppliers and proved
nevertheless to form vesicles in the diluted zones of the phase diagrams, whatever the
impurities present in the solutions were. The first part of the work consisted in studying the
phase diagrams of various technical-grade surfactants with the same anionic surfactant, i.e.
sodium laurylethersulfate, but with different cationic surfactants having different chain
lengths, different polar heads or obtained by different suppliers. In the second part, two of
these catanionic systems were studied in more details. In both systems, the phenomenon of
direct transition from micelles to vesicles by simple dilution with water could be observed.

VI Technical-grade surfactant systems
64
6.1. Phase diagrams of diverse technical-grade surfactants
The technical-grade anionic surfactant used in all the catanionic systems was the
sodium lauryl ether sulfate (LES). LES seemed most relevant as far as the study of industrial
surfactants is concerned because of its wide-spread utilisation in formulations such as
shampoos and shower gels. The Krafft temperature of LES is below 0°C, making tests at
room temperature easy. It was provided by Cognis (Germany) at a concentration of 69.5wt%
active matter in an aqueous solution with less than 1wt% sodium sulfate and less than 0.1wt%
sodium chloride, under the trade name of TEXAPON® N 70, the average number of
ethyleneoxyde groups (EO) is n = 2 and the carbon chain distribution is about 70% of C12
and 30% of C14. Its chemical formula is :
C12_14
OO
SO
OO
n Na
+
We carried out the study of technical-grade catanionic systems by mixing to LES a
variety of different cationic surfactants. The first part consisted in studying catanionic systems
where the cationic surfactant was soluble at 25°C as well, i.e. having a Krafft temperature
below 25°C. The second part dealt with surfactants systems which had to be first heated to
solubilize them in water before mixing them with LES.

VI Technical-grade surfactant systems
65
6.1.1. Mixture of LES and cationic surfactants soluble at 25°C
Since all surfactants used here were soluble at 25°C, all the solutions could be
prepared without heating. The stock solutions of the surfactants were prepared with Millipore
water at 8wt% active matter and left to equilibrate at 25°C overnight. The cationic and anionic
surfactant solutions were then vortex-mixed at the desired ratios and diluted with water. They
were then left one week at 25°C before observations or measurements were made. The
determination of each phase diagram required the preparation of 150- 200 samples.
LES / CTAC
Two catanionic systems were made with LESNa as the anionic surfactant and
cetyltrimethylammonium chloride (CTAC) as the cationic surfactant from two different
suppliers.
Chemical Name Trade Name &
supplier Formula Impurities (if data
available)
Cetyltrimethylammonium Chloride
Quartamin 60L (Kao Chemicals)
C16 N+
Cl Isopropanol
Cetyltrimethylammonium Chloride
Incroquat CTC 30 (Croda)
C16 N+
Cl0.3% amine
hydrochloride
Table 1: Cetyltrimethylammonium chloride (CTAC) cationic surfactants from two different
suppliers.
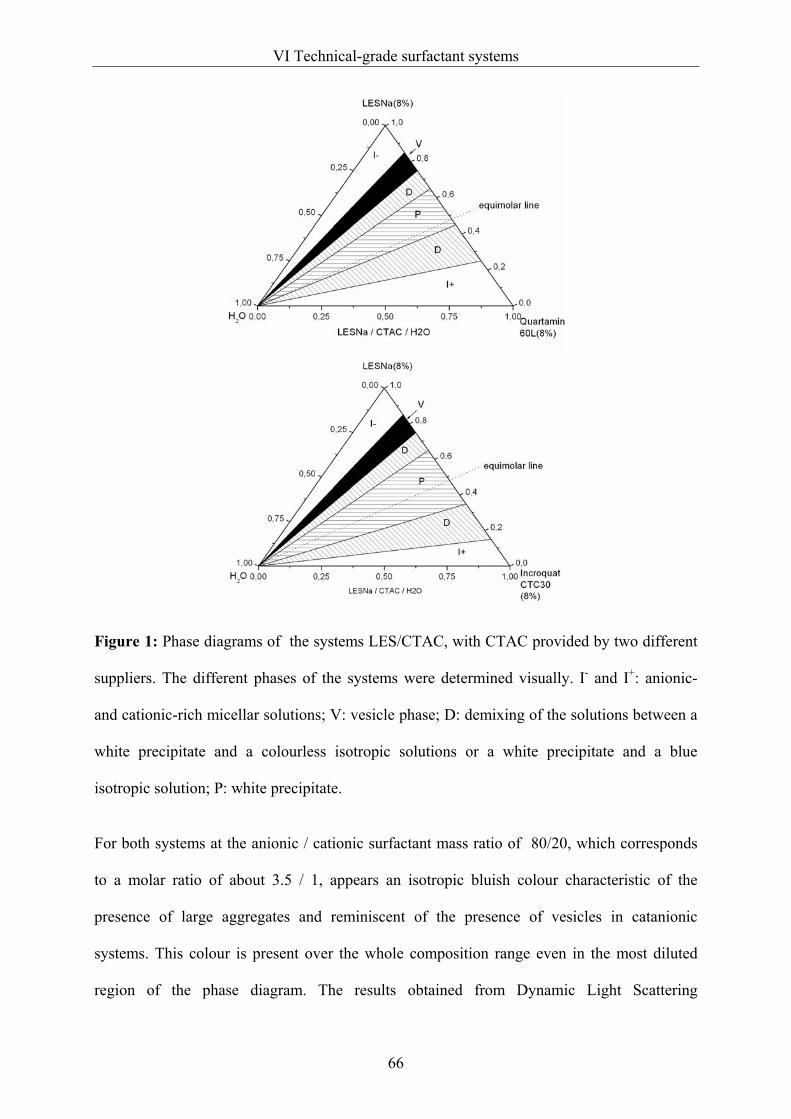
VI Technical-grade surfactant systems
66
Figure 1: Phase diagrams of the systems LES/CTAC, with CTAC provided by two different
suppliers. The different phases of the systems were determined visually. I- and I+: anionic-
and cationic-rich micellar solutions; V: vesicle phase; D: demixing of the solutions between a
white precipitate and a colourless isotropic solutions or a white precipitate and a blue
isotropic solution; P: white precipitate.
For both systems at the anionic / cationic surfactant mass ratio of 80/20, which corresponds
to a molar ratio of about 3.5 / 1, appears an isotropic bluish colour characteristic of the
presence of large aggregates and reminiscent of the presence of vesicles in catanionic
systems. This colour is present over the whole composition range even in the most diluted
region of the phase diagram. The results obtained from Dynamic Light Scattering
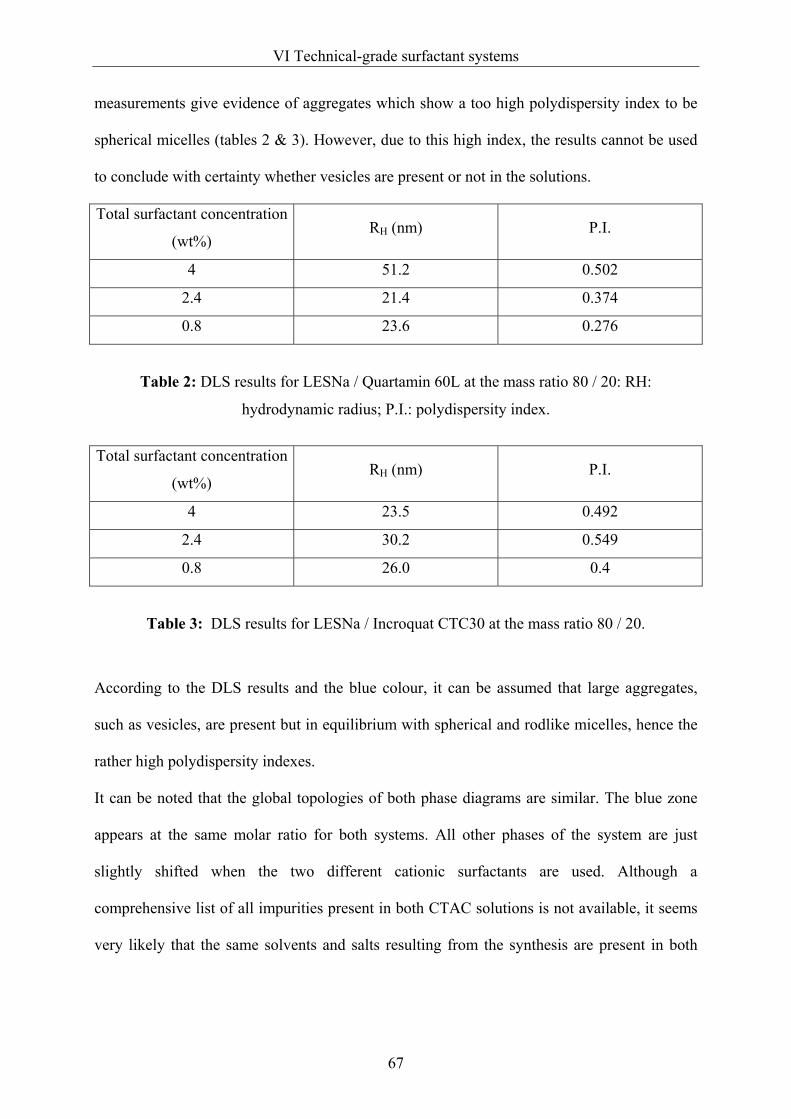
VI Technical-grade surfactant systems
67
measurements give evidence of aggregates which show a too high polydispersity index to be
spherical micelles (tables 2 & 3). However, due to this high index, the results cannot be used
to conclude with certainty whether vesicles are present or not in the solutions.
Total surfactant concentration
(wt%) RH (nm) P.I.
4 51.2 0.502
2.4 21.4 0.374
0.8 23.6 0.276
Table 2: DLS results for LESNa / Quartamin 60L at the mass ratio 80 / 20: RH:
hydrodynamic radius; P.I.: polydispersity index.
Total surfactant concentration
(wt%) RH (nm) P.I.
4 23.5 0.492
2.4 30.2 0.549
0.8 26.0 0.4
Table 3: DLS results for LESNa / Incroquat CTC30 at the mass ratio 80 / 20.
According to the DLS results and the blue colour, it can be assumed that large aggregates,
such as vesicles, are present but in equilibrium with spherical and rodlike micelles, hence the
rather high polydispersity indexes.
It can be noted that the global topologies of both phase diagrams are similar. The blue zone
appears at the same molar ratio for both systems. All other phases of the system are just
slightly shifted when the two different cationic surfactants are used. Although a
comprehensive list of all impurities present in both CTAC solutions is not available, it seems
very likely that the same solvents and salts resulting from the synthesis are present in both

VI Technical-grade surfactant systems
68
surfactant solutions. Otherwise, the topologies of the phase diagrams would have been much
more different from one another.
Five other technical-grade cationic surfactants with chain lengths ranging from 11 to
18 carbon atoms, which were soluble at room temperature, were mixed with LES. Their
corresponding phase diagrams are represented in Figs. 2-5. All five cationic surfactants have a
quaternary ammonium as polar head. They are listed below:
Chemical Name Trade Name & Supplier Most probable formula Impurities (if
available)
Undecylamidopropyltri-methylammonium
Methosulfate
Tetranyl U (Kao
Chemicals)
C10
O
NH N+
CH3OSO3-
ethanol
Sodium Coco PG-dimethylammonium Chloride Phosphate
Arlasilk Phospholipid
CDM (Uniqema)
C12/C14
Coco phosphatidyl
PG-Dimethylamm
onium Chloride
N-(2-Hydroxyhexadecyl-1)-
N,N-dimethyl-N-2-hydroxyethylammonium
Chloride
Dehyquart ECA
(Cognis) OH
OHCl
N+
C14
Dihydroxypropyl PEG 5 Linoleammonium
Chloride
Monaquat SL5(Uniqema) C18 :1
NaCl (3.9%)
Linoleamidopropyl PG dimethylammonium Chloride Phosphate
Arlasilk Phospholipid
EFA (Uniqema)
C18: 1
Propylene glycol
(propan-1,2-diol)
Table 4: List of the cationic surfactants used at 25°C classified according to their chain
lengths.
The system LES/Monaquat SL5 (Fig. 2) leads to a zone of large blue isotropic
solutions between the mass ratios 5/95 and 25/75, i.e. in the cationic-rich side of the phase

VI Technical-grade surfactant systems
69
diagram. An outstanding feature of this system is that it leads for mass ratios between 15/85
and 45/55 to an increased viscosity of the solutions, which have the consistency of a gel in the
most concentrated part of the phase diagram (> 4wt% total surfactant concentration).
Figure 2: Phase diagram of the system LES / Monaquat SL5 at 25°C. Dynamic Light Scattering measurements were performed on this system at the mass ratio
anionic / cationic surfactant 10/90, i.e. samples were taken from the isotropic blue zone but
the size obtained (< 15 nm) did not bring evidence of the presence of vesicles:
Total surfactant (wt%) RH (nm) P.I.
8 14.7 0.18
7.2 14 0.2
6.4 13.5 0.3
5.6 14 0.3
4.8 14 0.15
4 13.2 0.25
3.2 13.8 0.205
2.4 12.6 0.28
1.6 14.9 0.196
0.8 11.2 0.34
Table 5: DLS results for LESNa / Monaquat SL5 at the mass ratio 10 / 90.
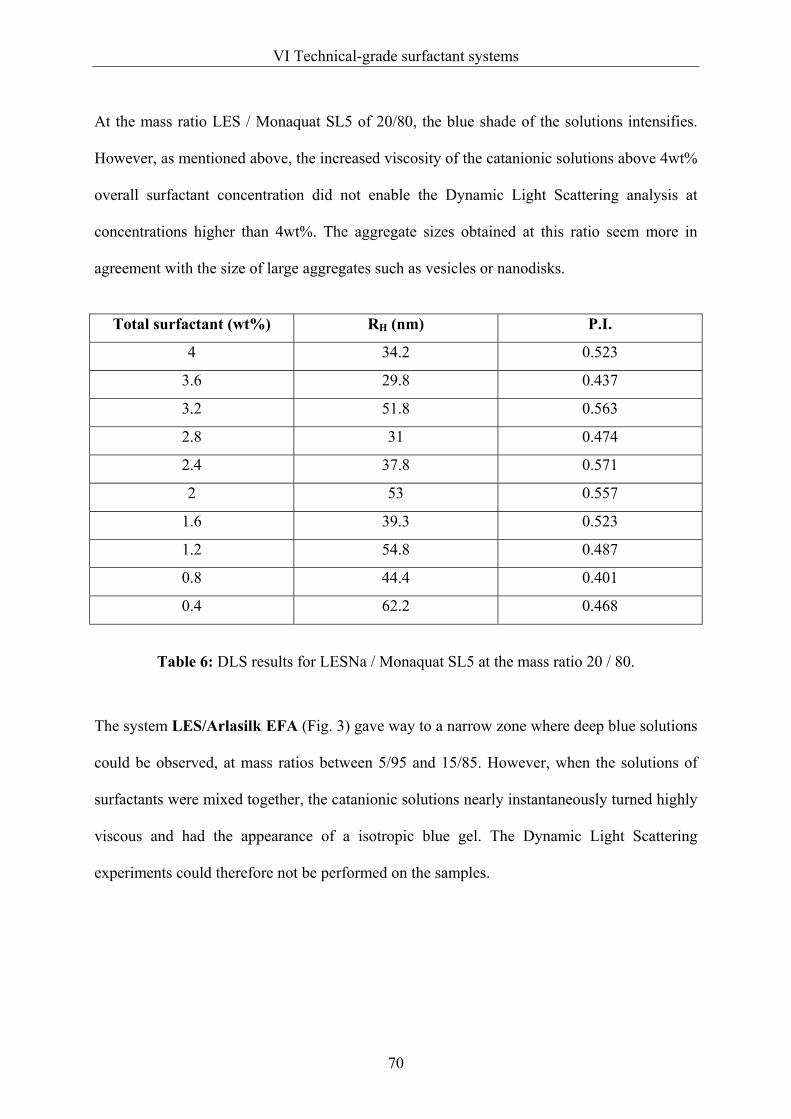
VI Technical-grade surfactant systems
70
At the mass ratio LES / Monaquat SL5 of 20/80, the blue shade of the solutions intensifies.
However, as mentioned above, the increased viscosity of the catanionic solutions above 4wt%
overall surfactant concentration did not enable the Dynamic Light Scattering analysis at
concentrations higher than 4wt%. The aggregate sizes obtained at this ratio seem more in
agreement with the size of large aggregates such as vesicles or nanodisks.
Total surfactant (wt%) RH (nm) P.I.
4 34.2 0.523
3.6 29.8 0.437
3.2 51.8 0.563
2.8 31 0.474
2.4 37.8 0.571
2 53 0.557
1.6 39.3 0.523
1.2 54.8 0.487
0.8 44.4 0.401
0.4 62.2 0.468
Table 6: DLS results for LESNa / Monaquat SL5 at the mass ratio 20 / 80.
The system LES/Arlasilk EFA (Fig. 3) gave way to a narrow zone where deep blue solutions
could be observed, at mass ratios between 5/95 and 15/85. However, when the solutions of
surfactants were mixed together, the catanionic solutions nearly instantaneously turned highly
viscous and had the appearance of a isotropic blue gel. The Dynamic Light Scattering
experiments could therefore not be performed on the samples.

VI Technical-grade surfactant systems
71
Figure 3: Phase diagram of the system LES / Arlasilk EFA at 25°C.
The system LES/Arlasilk CDM (Fig. 4) at 25°C leads to a similar overall topology of the
phase diagram, although the phases are slightly shifted towards the anionic-rich side. No
increase in viscosity could be observed in the solutions. The solutions with a cationic / anionic
mass ratio of 20/80, i.e. located in the phase diagram in the vesicle zone, were analysed by
Dynamic Light Scattering. The results however did not bring evidence of the presence of
large aggregates.
Figure 4: Phase diagram of the system LES / Arlasilk CDM at 25°C.

VI Technical-grade surfactant systems
72
Total surfactant (wt%) RH (nm) P.I.
8 29 0.352
7.2 24.8 0.360
6.4 21.9 0.3
5.6 17.7 0.273
4.8 15.4 0.286
4 14.2 0.278
3.2 15.3 0.281
2.4 18.2 0.205
1.6 21.1 0.194
0.8 16.9 0.212
Table 7: DLS results for LESNa / Arlasilk CDM at the mass ratio 20 / 80.
Two further catanionic systems were studied, LES/Tetranyl U and LES/Dehyquart ECA.
With both systems no presence of a vesicular phase could be detected, neither visually nor by
Dynamic Light Scattering.
Figure 5: Phase diagram of the system LES / Tetranyl U and LES/Dehyquart ECA at 25°C.

VI Technical-grade surfactant systems
73
6.1.2. Mixture of LES and cationic surfactants insoluble at 25°C
Five other cationic surfactants could not be solubilized in water at 25°C even when the
stock solutions were left under constant stirring overnight. This lack of solubility in water was
due to Krafft points higher than 25°C. The stock solutions had therefore to be heated above
their Krafft temperature prior to mixing with LES. All stock solutions were prepared at
0.5wt%. The Krafft points of these cationic surfactants in aqueous solution were determined
visually (table 8). Both anionic and cationic surfactant solutions, as well as the Millipore
water for the dilution of the solutions, were placed in a water bath and heated up to
temperature above the Krafft point of the cationic surfactant. The catanionic solutions were
then prepared in the same water bath at a constant temperature and left to equilibrate 24hours
before observations and analysis were performed. The samples (about 150 samples per phase
diagram) were then left one week at 25°C to see if the formed aggregates remained or if the
solutions precipitated. Three of these cationic surfactants are presented below, the other two
will be discussed in sub-section ”Systems LES/SDBAC”:
Chemical Name Trade Name
& Supplier
Chain Length or Formula (if available)
Impurities (if
available)
Krafft temperature
(0.5 wt% surfactant)
Cocamidopropyl PG Dimethylammonium Chloride Phosphate
Arlasilk Phospholipid
PTC (Uniqema)
C12/C14 56°C
Stearamidopropyldimethylammonium
Lactate
Incromate SDL
(Croda) C18
NH
O
NH+ -OOH
OStearamido
propyl Dimethyl
amine
50°C
DL-pyrrolidone carboxylic acid salt
of N-cocoyl-L-arginine ethyl ester
CAE (Ajinomoto)
H5C2OOCCH(CH2)3NHCNH2+
NH2
NH
-OOCH O
NHCOC12/C14
37°C
Table 8: List of three of the five cationic surfactants with a Krafft temperature above 25°C.
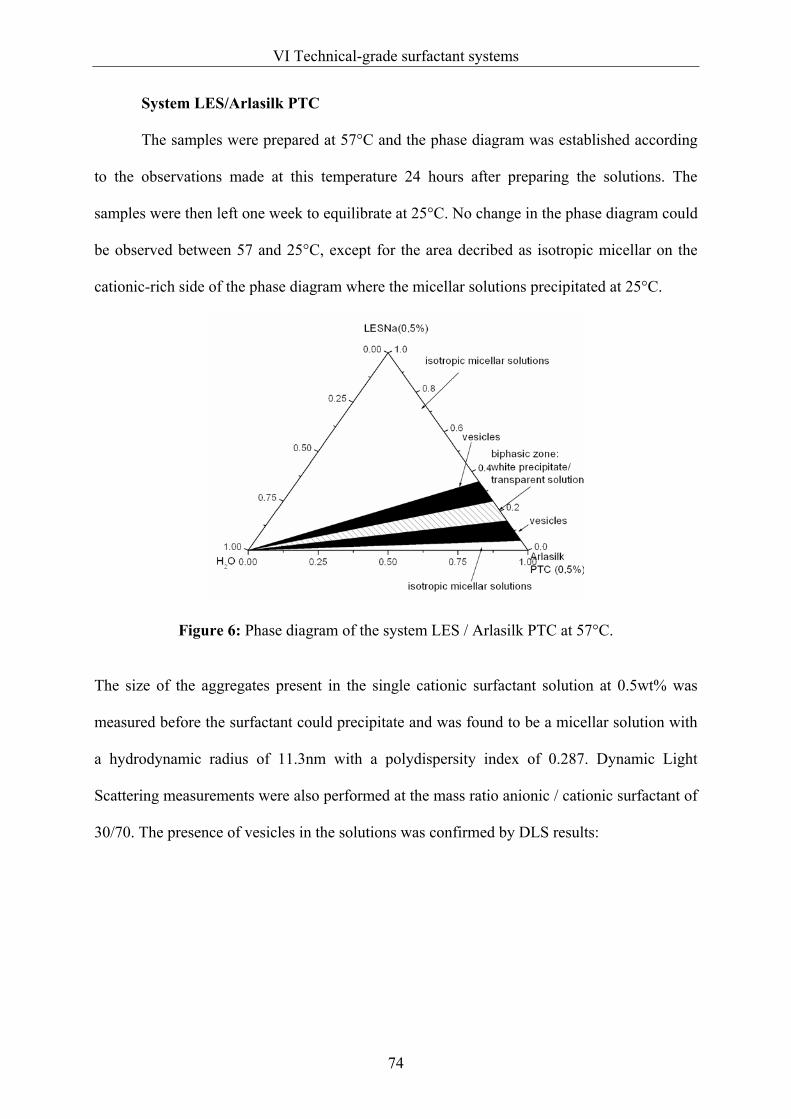
VI Technical-grade surfactant systems
74
System LES/Arlasilk PTC
The samples were prepared at 57°C and the phase diagram was established according
to the observations made at this temperature 24 hours after preparing the solutions. The
samples were then left one week to equilibrate at 25°C. No change in the phase diagram could
be observed between 57 and 25°C, except for the area decribed as isotropic micellar on the
cationic-rich side of the phase diagram where the micellar solutions precipitated at 25°C.
Figure 6: Phase diagram of the system LES / Arlasilk PTC at 57°C.
The size of the aggregates present in the single cationic surfactant solution at 0.5wt% was
measured before the surfactant could precipitate and was found to be a micellar solution with
a hydrodynamic radius of 11.3nm with a polydispersity index of 0.287. Dynamic Light
Scattering measurements were also performed at the mass ratio anionic / cationic surfactant of
30/70. The presence of vesicles in the solutions was confirmed by DLS results:

VI Technical-grade surfactant systems
75
Total surfactant (wt%) RH (nm) P.I.
0.5 91.1 0.427
0.4 57.9 0.444
0.3 62.4 0.29
0.15 55.2 0.333
0.1 59.2 0.333
0.05 76.3 0.333
Table 9: DLS results for LESNa / Arlasilk PTC at the mass ratio 30 / 70.
Photos were taken of samples at the ratio 30/70 along the dilution path from 0.5 to 0.05wt%
total surfactant. No precipitation occurred at 25°C one week after the preparation and the
samples remained as blue at 25°C as they had been at 57°C.
Figure 7: Photos of the system LES / Arlasilk PTC (mass ratio of 30/70) at 57°C and after
one week at 25°C.
System LES/Incromate SDL
The samples were prepared at 60°C. After mixing the cationic and anionic surfactants
at 60°C, the samples were left 24 hours in the water bath at 60°C to equilibrate before
observations were made. All samples were then left one week at 25°C. No precipitation
occurred at 25°C except in the cationic-rich side of the phase diagram at the mass ratio

VI Technical-grade surfactant systems
76
anionic/cationic between 0/100 and 10/90. However, the blue isotropic solutions became
slightly turbid after one week.
Figure 8: Phase diagram of the system LES / Incromate SDL at 60°C.
Dynamic Light Scattering measurements were performed at the mass ratio anionic / cationic
surfactant of 50/50. The presence of vesicles in the solutions was confirmed by DLS results.
Large-sized aggregates could be measured, particularly in the most diluted part of the phase
diagram at 0.05wt% overall surfactant concentration, where the hydrodynamic radius of the
aggregates reached 196.9nm. DLS measurements were performed as well at the mass ratio of
60/40 and size aggregates between 52.7 and 65.3 nm could be measured.
Total surfactant (wt%) RH (nm) P.I.
0.5 46.3 0.142
0.35 51.4 0.167
0.25 57.9 0.235
0.2 50.7 0.207
0.15 53.3 0.225
0.1 53.5 0.201
0.05 196.9 0.319
Table 10: DLS results for LESNa / Incromate SDL at the mass ratio 60 / 40.

VI Technical-grade surfactant systems
77
Photos were taken of the line of samples at the ratio 50/50 along the dilution path from 0.5 to
0.05wt%. Even if no precipitation occurred after one week at 25°C, it can be seen that the
solutions, although remaining blue, became turbid.
Figure 9: Photos of the system LES / Incromate SDL (mass ratio 50/50) at 60°C and after one
week at 25°C.
System LES/CAE
The samples were prepared at 57°C in a water bath for 24 hours. The solutions were
then left to equilibrate one week at 25°C. No further precipitation occurred after one week at
25°C except in the isotropic micellar phase of the cationic-rich side of the phase diagram.

VI Technical-grade surfactant systems
78
Figure 10: Phase diagram of the system LES / CAE at 60°C.
Dynamic Light Scattering measurements were performed at the mass ratio anionic / cationic
surfactant of 20/80, i.e. in the cationic-rich vesicle phase. The presence of vesicles in the
solutions was confirmed by DLS results. Very large-sized aggregates could be measured,
particularly in the most diluted part of the phase diagram at 0.05wt% overall surfactant
concentration, where the hydrodynamic radius of the aggregates reached 428.5nm.
Total surfactant (wt%) RH (nm) P.I.
0.5 107.5 0.248
0.45 113.1 0.259
0.4 121.4 0.276
0.35 181.9 0.454
0.3 115.7 0.269
0.25 104.6 0.267
0.2 114.1 0.287
0.15 322.3 0.229
0.1 431.4 0.117
0.05 428.5 0.124
Table 11: DLS results for LESNa / CAE at the mass ratio 20 / 80.
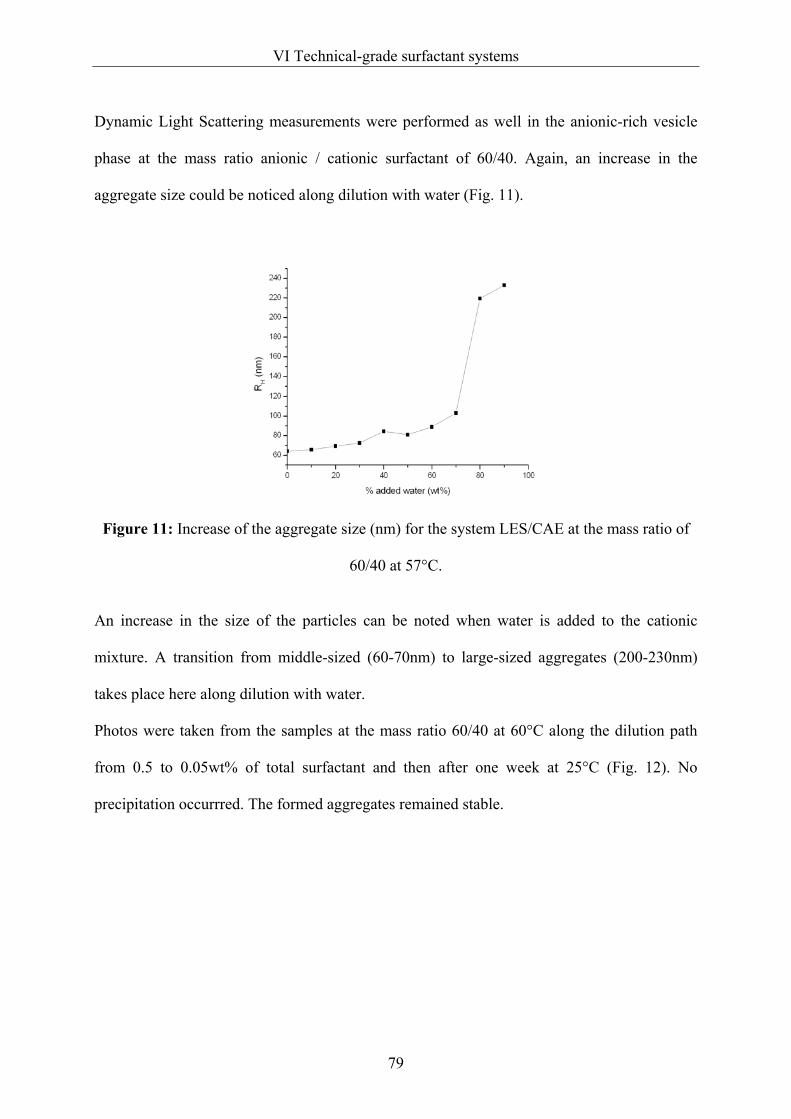
VI Technical-grade surfactant systems
79
Dynamic Light Scattering measurements were performed as well in the anionic-rich vesicle
phase at the mass ratio anionic / cationic surfactant of 60/40. Again, an increase in the
aggregate size could be noticed along dilution with water (Fig. 11).
Figure 11: Increase of the aggregate size (nm) for the system LES/CAE at the mass ratio of
60/40 at 57°C.
An increase in the size of the particles can be noted when water is added to the cationic
mixture. A transition from middle-sized (60-70nm) to large-sized aggregates (200-230nm)
takes place here along dilution with water.
Photos were taken from the samples at the mass ratio 60/40 at 60°C along the dilution path
from 0.5 to 0.05wt% of total surfactant and then after one week at 25°C (Fig. 12). No
precipitation occurrred. The formed aggregates remained stable.

VI Technical-grade surfactant systems
80
Figure 12: Photos of the system LES / CAE ( mass ratio 60/40) at 57°C and after one week at
25°C.
Systems LES/ SDBAC
Two catanionic systems were prepared with LES as the anionic surfactant and
Stearyldimethylbenzylammonium Chloride (SDBAC) as the cationic surfactant but from two
different suppliers. These systems also had to be heated because the Krafft point of both
cationic surfactants was well above room temperature. At 25°C they both precipitate again in
the cationic-rich side of the phase diagram (see photo).
Chemical Name Trade Name & supplier Formula Impurities (if
datas available)
Krafft point
(0.5 wt% surfactant
Stearyldimethyl benzylammonium
Chloride
Incroquat SDQ 25 (Croda)
C16/C18 N+
Cl
-Isopropanol -Cetearyl alcohol
-Amine hydrochloride
(3.8%)
60°C
Stearyldimethyl benzylammonium
Chloride
Tetranyl B-2MTH-R
(Kao Chemicals)
C16/C18 N+
ClPropan-2-ol 37°C
Table 12: SDBAC cationic surfactants from two different suppliers.
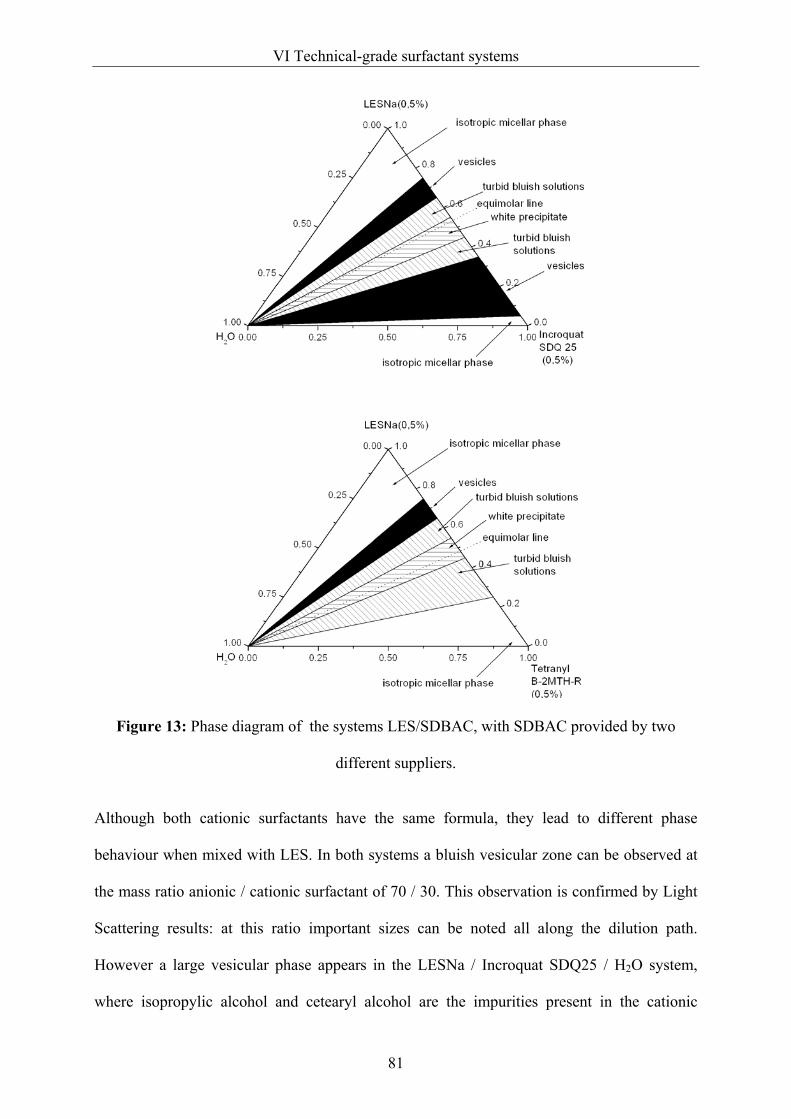
VI Technical-grade surfactant systems
81
Figure 13: Phase diagram of the systems LES/SDBAC, with SDBAC provided by two
different suppliers.
Although both cationic surfactants have the same formula, they lead to different phase
behaviour when mixed with LES. In both systems a bluish vesicular zone can be observed at
the mass ratio anionic / cationic surfactant of 70 / 30. This observation is confirmed by Light
Scattering results: at this ratio important sizes can be noted all along the dilution path.
However a large vesicular phase appears in the LESNa / Incroquat SDQ25 / H2O system,
where isopropylic alcohol and cetearyl alcohol are the impurities present in the cationic

VI Technical-grade surfactant systems
82
surfactant. According to the DLS results in the cationic rich side of this phase diagram even
particles twice as large as the sizes observed in the anionic rich side are obtained. It can also
be noted that the polydispersity index is there rather low (about 0.1): bigger vesicles but
homogeneous in size can thus be observed. The question is to know whether impurities can
here explain this difference.
Total surfactant (wt%) RH (nm) P.I.
0.5 130.6 0.169
0.35 117.4 0.135
0.25 129.2 0.106
0.15 115.8 0.115
0.1 125.7 0.118
0.05 128.7 0.119
Table 13: DLS results for LESNa / Incroquat SDQ 25 at the mass ratio of 20 / 80.
Total surfactant (wt%) RH (nm) P.I.
0.25 71.8 0.363
0.1 64 0.353
0.05 64.6 0.243
Table 14: DLS results for LESNa / Incroquat SDQ 25 at the mass ratio of 70 / 30.
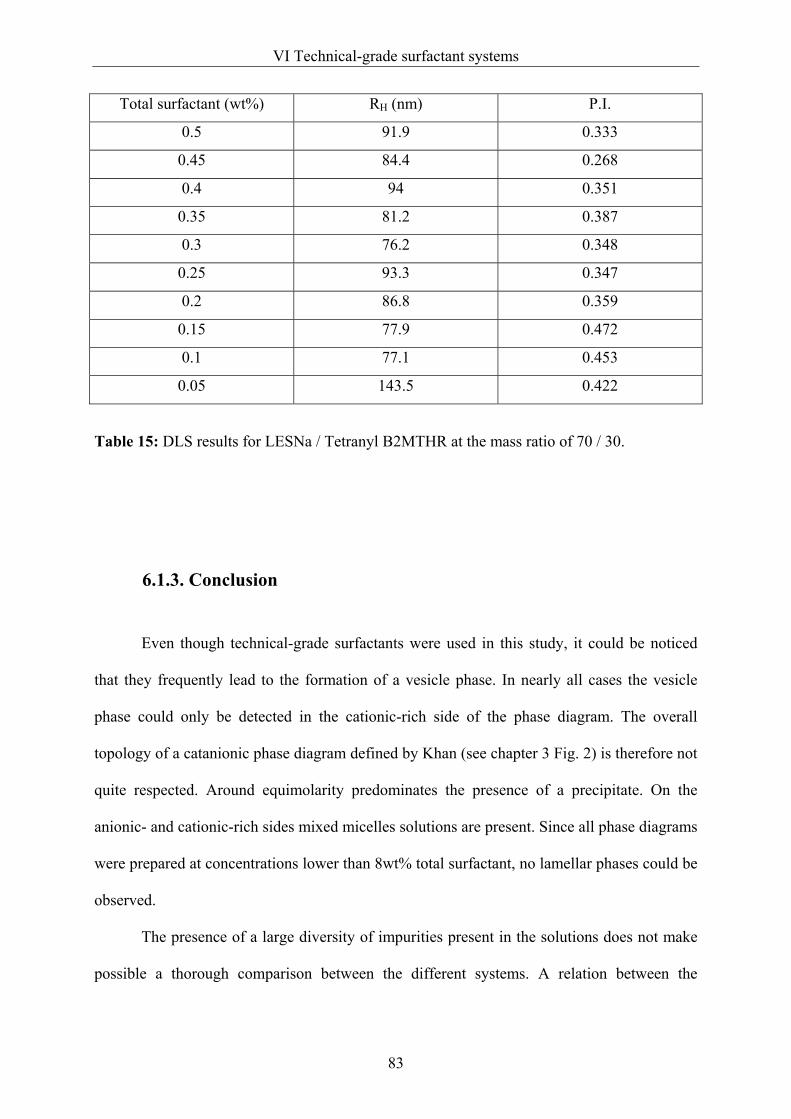
VI Technical-grade surfactant systems
83
Total surfactant (wt%) RH (nm) P.I.
0.5 91.9 0.333
0.45 84.4 0.268
0.4 94 0.351
0.35 81.2 0.387
0.3 76.2 0.348
0.25 93.3 0.347
0.2 86.8 0.359
0.15 77.9 0.472
0.1 77.1 0.453
0.05 143.5 0.422
Table 15: DLS results for LESNa / Tetranyl B2MTHR at the mass ratio of 70 / 30.
6.1.3. Conclusion
Even though technical-grade surfactants were used in this study, it could be noticed
that they frequently lead to the formation of a vesicle phase. In nearly all cases the vesicle
phase could only be detected in the cationic-rich side of the phase diagram. The overall
topology of a catanionic phase diagram defined by Khan (see chapter 3 Fig. 2) is therefore not
quite respected. Around equimolarity predominates the presence of a precipitate. On the
anionic- and cationic-rich sides mixed micelles solutions are present. Since all phase diagrams
were prepared at concentrations lower than 8wt% total surfactant, no lamellar phases could be
observed.
The presence of a large diversity of impurities present in the solutions does not make
possible a thorough comparison between the different systems. A relation between the

VI Technical-grade surfactant systems
84
structure of the surfactants and the topology of the phase diagrams is only relevant in the case
of purified surfactant systems.
The study of technical-grade surfactant in catanionic mixtures brings evidence that the
presence of salts or co-solvents, such as isopropanol, in the surfactant solutions does not
impair the formation of catanionic vesicles. On the contrary the vesicles zones observed with
technical grade surfactants are, for some systems, much larger than those observed with
purified surfactants. It makes therefore sense to consider such systems as potentially
applicable. It was seen, however, that the presence of impurities such as salts or solvents have
a non negligible influence on the overall topology of the phase diagrams and on the Krafft
temperature of the single surfactants. This has to be taken into account if further applications
are planned.
6.2. Transition from micelles to vesicles by simple dilution
with water
The transition from mixed micelles to vesicles by dilution with water is already known
for some systems composed of pure surfactants (1, 2) and has also been observed in pure
catanionic surfactant systems (3, 4, 5). In this study, the direct transition from mixed micelles
to vesicles was observed in two catanionic surfactant systems made of technical-grade
surfactants through dilution with water at a fixed anionic/cationic surfactant ratios. The ionic
surfactants are technical grade products provided by raw material industries: the anionic
surfactant used is the sodium lauryl ether sulfate (LES) as in section 6.1. and the cationic ones
the lauroyl PG trimethylammonium chloride and the cocoyltrimethylammonium
methosulfate. In most catanionic systems, at a constant anionic/cationic surfactant ratio, no

VI Technical-grade surfactant systems
85
direct transition from micelles to vesicles upon dilution with water is usually observed. In a
typical catanionic phase diagram (see Fig. 2 Chapter 3) the lamellar phase appearing at high
surfactant concentrations (>30wt%) leads upon dilution with water to liquid two-phase
systems containing lamellae and vesicles. A further dilution of these two-phase solutions
leads to the vesicular phase. The originality of the catanionic systems studied here lies in the
fact that, upon dilution, a direct transition from micelles to vesicles can be observed, without
any previous phase separation. A shift in the overall topology of the phase diagram, due to the
structure of one of the surfactants, induces this direct transition. Such a transition can be of
interest in encapsulation experiments. For instance, a drug could be solubilized in the
isotropic micellar phase and then be encapsulated in vesicles by simply diluting the micellar
solution with water.
6.2.1. LES/LPTC system
6.2.1.1. Introduction
We present first the phase diagram of the system sodium lauryl ether sulfate (LESNa),
Lauroyl PG-trimonium chloride (LPTC) and water. The phase diagram was determined at
25°C, up to 8% in mass of surfactants. The anionic surfactant (LESNa) is widely used in
washing formulations and the cationic one (LPTC) as conditioner in shampoo formulations.
The transition from mixed micelles to vesicles was estimated from quasielastic light scattering
experiments and also by visual observations. It was found that the bluish shade in a solution
of a catanionic surfactant may indicate the presence of vesicles (6). The presence of vesicles
was confirmed by quasielastic light scattering experiments.

VI Technical-grade surfactant systems
86
6.2.1.2. Materials and Methods
Sodium polyoxyethylene laurylether sulfate (LESNa) was supplied by Cognis at 70%
active matter under the trade name of TEXAPON® N 70, the average number of
ethyleneoxyde groups (EO) is 2 and the carbon chain distribution is about 70% of C12 and
30% of C14. The molar mass of LESNa is 360 g/mol and the formula of LESNa can be written
as follows:
C12_14
OO
SO
OO
n Na
+
Lauroyl PG-trimonium chloride (LPTC) was obtained from Kao Chemicals and is supplied in
a mixture composed of 70% active matter, 15-18% hexylene glycol, 12-15% water under the
trade name of AKYPO® QUAT 132. The molar mass of LPTC is about 352g/mol and its
apparent formula is:
C11
O
OOH
N Cl+
Samples and phase diagram preparation
Each product was diluted in distilled water to achieve a stock solution of 8%. The stock
solutions were left at room temperature and samples were prepared by adding water to a
mixture of the anionic and the cationic surfactants at a certain ratio. Then the samples were
mixed with a vortex to homogenize the solutions and were left to equilibrate at 25°C. Thus
the ternary phase diagram of aq. 8% LESNa/ aq. 8% LPTC/water was established between 0
and 100% for each component with a step of 10%. The blue colour of some samples was
determined by observing them against a black background.
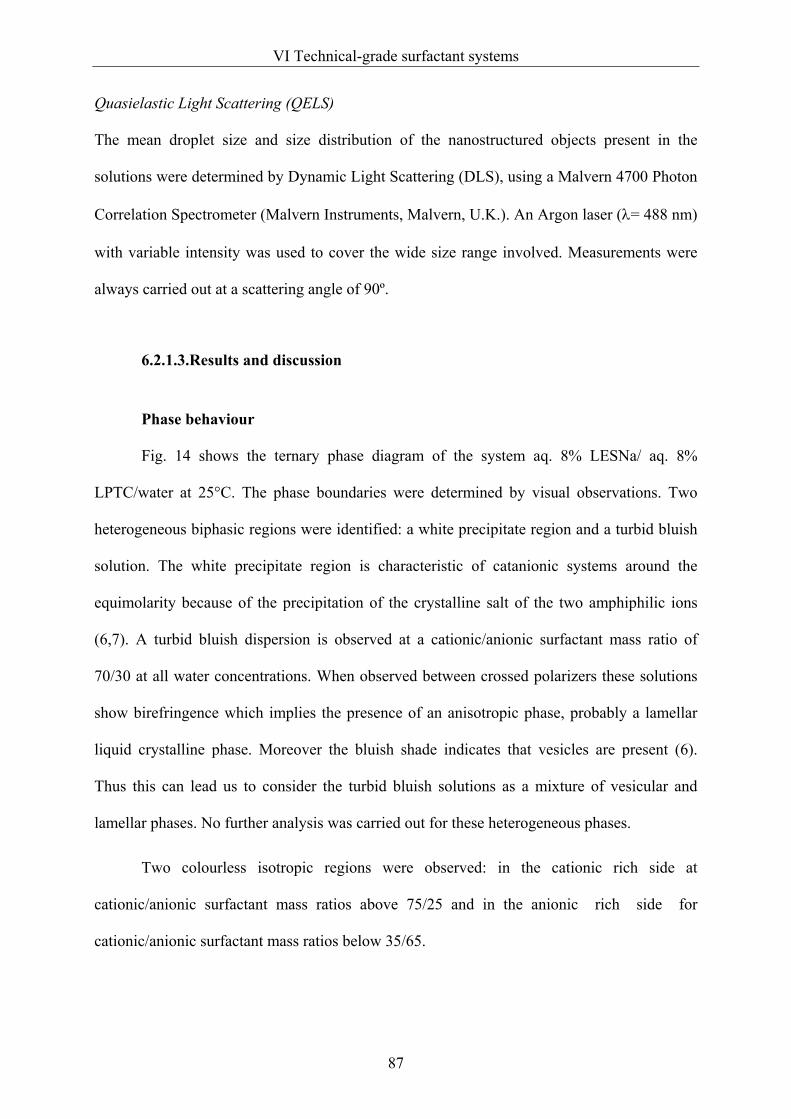
VI Technical-grade surfactant systems
87
Quasielastic Light Scattering (QELS)
The mean droplet size and size distribution of the nanostructured objects present in the
solutions were determined by Dynamic Light Scattering (DLS), using a Malvern 4700 Photon
Correlation Spectrometer (Malvern Instruments, Malvern, U.K.). An Argon laser (λ= 488 nm)
with variable intensity was used to cover the wide size range involved. Measurements were
always carried out at a scattering angle of 90º.
6.2.1.3.Results and discussion
Phase behaviour
Fig. 14 shows the ternary phase diagram of the system aq. 8% LESNa/ aq. 8%
LPTC/water at 25°C. The phase boundaries were determined by visual observations. Two
heterogeneous biphasic regions were identified: a white precipitate region and a turbid bluish
solution. The white precipitate region is characteristic of catanionic systems around the
equimolarity because of the precipitation of the crystalline salt of the two amphiphilic ions
(6,7). A turbid bluish dispersion is observed at a cationic/anionic surfactant mass ratio of
70/30 at all water concentrations. When observed between crossed polarizers these solutions
show birefringence which implies the presence of an anisotropic phase, probably a lamellar
liquid crystalline phase. Moreover the bluish shade indicates that vesicles are present (6).
Thus this can lead us to consider the turbid bluish solutions as a mixture of vesicular and
lamellar phases. No further analysis was carried out for these heterogeneous phases.
Two colourless isotropic regions were observed: in the cationic rich side at
cationic/anionic surfactant mass ratios above 75/25 and in the anionic rich side for
cationic/anionic surfactant mass ratios below 35/65.

VI Technical-grade surfactant systems
88
Figure 14: Phase diagram of the system LESNa(8%)/LPTC(8%)/water at 25°C
These two regions are supposed to be composed of mixed micelles for surfactant
concentration above the CMCs. The vesicle region was identified, on the basis of the
distinctive bluish shade of the solution, in the cationic rich side of the diagram around the
mass ratio 80/20 of cationic/anionic surfactant above 75% of water content as shown in the
phase diagram. For this particular surfactants ratio, as one goes along dilution with water, a
transition from mixed micelles to vesicles seems to happen. For a qualitative confirmation of
the trend discussed above, Quasi-elastic Light Scattering measurements were carried out.
Although the surfactants used in the system are technical grade, the phase diagram
obtained presents some similarities with those of pure surfactants such as SDS/DTAB/water
(6). The slight shift of the vesicle lobe towards the cationic rich-side may be due to the
presence of hexyleneglycol in the LPTC, which may play the role of a co-surfactant. The
interpretation of the role of each compound is anyway intricate because more than three active
components are present in the system.

VI Technical-grade surfactant systems
89
Particle size determinations
Some Quasi-elastic Light Scattering experiments were performed on the binary
LPTC/water system and on the LESNa aq. 8%/LPTC aq. 8%/water system, for solution
concentrations shown in the experimental dilution path with water presented in Fig. 14.
LPTC/water system
Surprisingly, a bluish shade is observed for dilute solutions of LPTC below
concentrations of 0.7 wt %, i.e. at a water content above 90% according to the phase diagram.
The measured hydrodynamic radius increases significantly for water contents above 90%
(Fig. 15) and confirms thus the visual observation. It seems that the LPTC alone already
forms some small vesicles when diluted in water. This may be attributed to the presence of
impurities in the industrial surfactant such as the sodium dodecanoate remaining from the
synthesis of LPTC. To confirm this assumption, further analysis will have to be performed.
Moreover, two maxima in the particles size are observed but remain, so far, unexplained.
Figure 15: Hydrodynamic radius (RH) obtained by Quasi-elastic Light Scattering of LPTC
solutions versus weight percent of water.
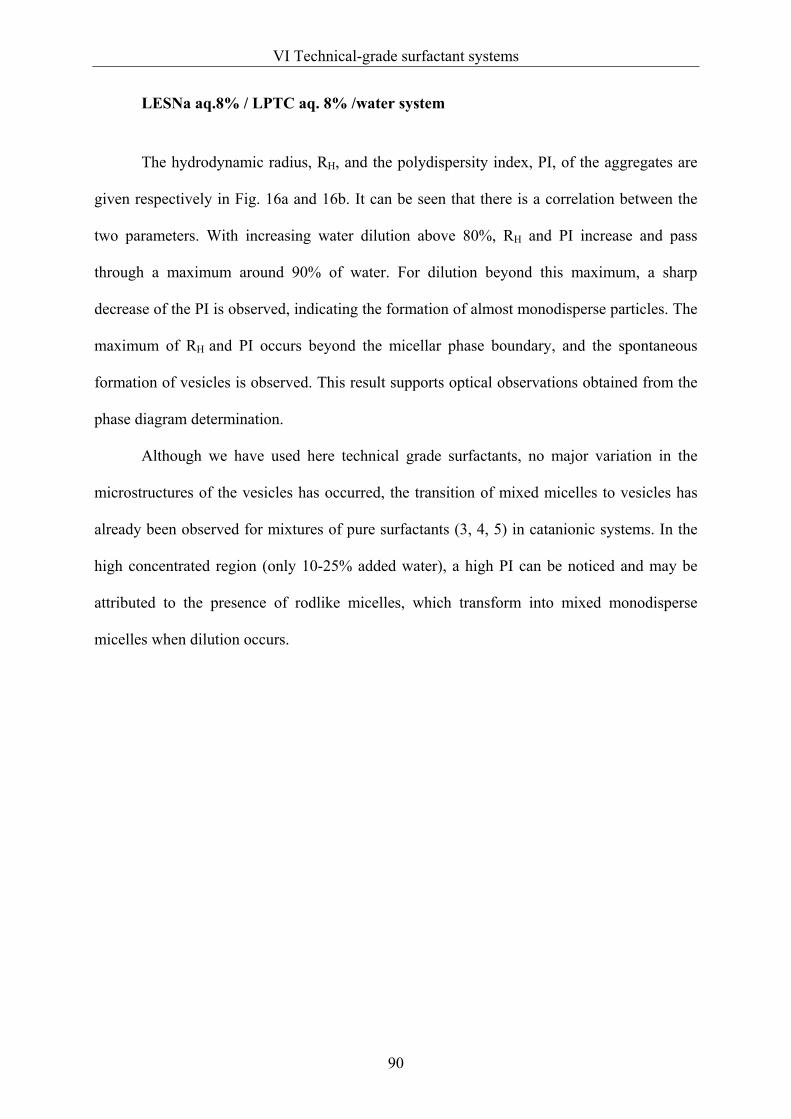
VI Technical-grade surfactant systems
90
LESNa aq.8% / LPTC aq. 8% /water system
The hydrodynamic radius, RH, and the polydispersity index, PI, of the aggregates are
given respectively in Fig. 16a and 16b. It can be seen that there is a correlation between the
two parameters. With increasing water dilution above 80%, RH and PI increase and pass
through a maximum around 90% of water. For dilution beyond this maximum, a sharp
decrease of the PI is observed, indicating the formation of almost monodisperse particles. The
maximum of RH and PI occurs beyond the micellar phase boundary, and the spontaneous
formation of vesicles is observed. This result supports optical observations obtained from the
phase diagram determination.
Although we have used here technical grade surfactants, no major variation in the
microstructures of the vesicles has occurred, the transition of mixed micelles to vesicles has
already been observed for mixtures of pure surfactants (3, 4, 5) in catanionic systems. In the
high concentrated region (only 10-25% added water), a high PI can be noticed and may be
attributed to the presence of rodlike micelles, which transform into mixed monodisperse
micelles when dilution occurs.

VI Technical-grade surfactant systems
91
Figure 16: a) Hydrodynamic radius (RH) obtained by Quasi-elastic Light Scattering of
LESNA/LPTC solutions versus weight percent of dilution water, (b) polydispersity
index (PI) of these samples versus weight percent of dilution water
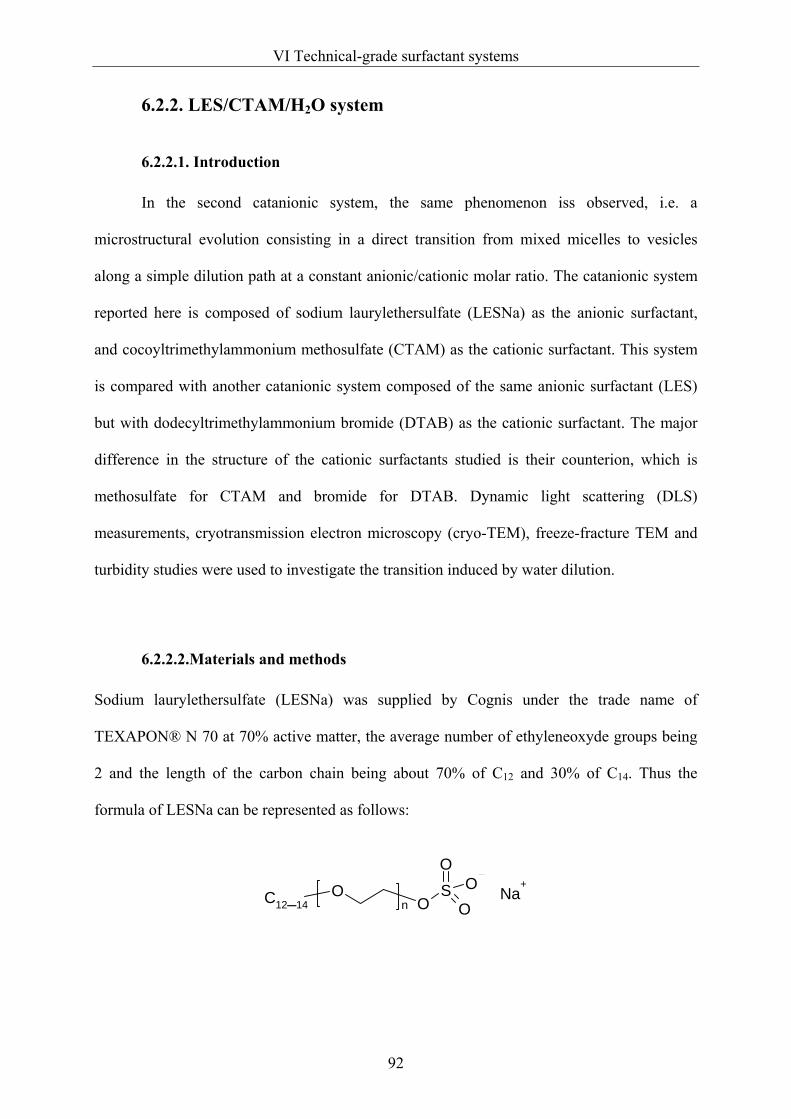
VI Technical-grade surfactant systems
92
6.2.2. LES/CTAM/H2O system
6.2.2.1. Introduction
In the second catanionic system, the same phenomenon iss observed, i.e. a
microstructural evolution consisting in a direct transition from mixed micelles to vesicles
along a simple dilution path at a constant anionic/cationic molar ratio. The catanionic system
reported here is composed of sodium laurylethersulfate (LESNa) as the anionic surfactant,
and cocoyltrimethylammonium methosulfate (CTAM) as the cationic surfactant. This system
is compared with another catanionic system composed of the same anionic surfactant (LES)
but with dodecyltrimethylammonium bromide (DTAB) as the cationic surfactant. The major
difference in the structure of the cationic surfactants studied is their counterion, which is
methosulfate for CTAM and bromide for DTAB. Dynamic light scattering (DLS)
measurements, cryotransmission electron microscopy (cryo-TEM), freeze-fracture TEM and
turbidity studies were used to investigate the transition induced by water dilution.
6.2.2.2.Materials and methods
Sodium laurylethersulfate (LESNa) was supplied by Cognis under the trade name of
TEXAPON® N 70 at 70% active matter, the average number of ethyleneoxyde groups being
2 and the length of the carbon chain being about 70% of C12 and 30% of C14. Thus the
formula of LESNa can be represented as follows:
C12_14O
OSO
OO
n Na
+

VI Technical-grade surfactant systems
93
Cocoyl trimethyl ammonium methosulfate (CTAM) was provided by BASF as an
aqueous solution under the trade name of Luviquat Mono LS with 30% of active matter and
2% of C12/C14 dimethylamine.
Its formula is:
C12/C14 N+ CH3OSO3-
Dodecyl trimethylammonium bromide (DTAB) was bought from Aldrich at 99%
active matter and differs from the previous surfactant mostly owing to its different counterion,
bromide, whereas the CTAM surfactant possesses a methosulfate as counterion. The
surfactants were used as received. Stock solutions were prepared in mixing the surfactants in
distilled water at 8 wt% concentration and filtered through 0.22 µm Millipore filters. They
were left to equilibrate at 25°C. Samples were then vortex-mixed at the desired
anionic/cationic/water ratios and were left to equilibrate with no further agitation for 1 week
at 25°C before observations or measurements were made.
Dynamic light scattering (DLS) measurements: So as to avoid dust in the samples for
DLS measurements, all stock solutions were filtered through 0.2μm Millipore membrane
filters prior to experiments. The evolution of the radius of the aggregates (nm) as well as the
intensity of diffused light (Kcount.s-1) of the solutions were recorded, using a Zetasizer Z3000
laser light scattering spectrometer equipped with a Helium-Neon laser operating at 630nm
(Malvern Instruments). All measurements were made at a constant scattering angle of 90°.
The intensity autocorrelation function was analyzed by the method of cumulants.
The turbidity of the solutions was measured on a Cary-3E UV/vis spectrophotometer
at a wavelength of 414nm.

VI Technical-grade surfactant systems
94
Cryotransmission (cryo-TEM) and Freeze-fracture electron microscopy
experiments (FF-TEM) were performed according to the same protocol as described in
chapter 4.
6.2.2.3. Results and Discussion
The LESNa/CTAM/water and LESNa/DTAB/water phase diagrams (Fig. 17) were
established through visual observation of the above described samples over several months
and the limits of the different phases were assigned when the visual aspect of the solutions
remained stable over time. Isotropic micellar phases are observed on both anionic- and
cationic-rich sides of the phase diagrams. Two types of macroscopic separation are to be
observed in the phase diagram. One two-phase area around equimolarity is composed of a
white precipitate phase and a colorless isotropic freely flowing one assumed to be a micellar
solution. Two areas on both sides of the previous one present a demixing between a turbid
bluish solution and a milky one that turns into a white precipitate in the most dilute part of the
phase diagram. The vesicle solutions on the anionic and cationic rich sides appear bluish to
the eyes (8).
On the cationic rich-side of the LESNa/CTAM/water phase diagram, there is a direct
transition from mixed micelles to vesicles, along the dilution line termed “experimental path”
in Fig. 17. This could be followed visually (Fig. 18). The colour of the solutions changes from
colorless to bluish along dilution with water at constant anionic/cationic molar ratio (1 / 2.3).
The aggregate size along this experimental path was probed by the DLS technique (Fig. 19).
The aggregate size remains stable, between 12 and 15nm, along the dilution path up to 87wt
% water added to the catanionic mixture at the same ratio. Then a sharp increase in the
hydrodynamic radius of the aggregates (up to 164 nm) can be observed when more water is
added to the solution, followed by a decrease in the highly diluted solutions (more than 97

VI Technical-grade surfactant systems
95
wt% added). The increase in the polydispersity index ( up to 0.365) at the same amount of
added water implies the existence of polydisperse aggregates. The decrease in the
polydispersity index to 0.049 in highly diluted solutions confirms also the destruction of the
previously formed vesicles in favour of mixed micelles.
Turbidity measurements are shown in Fig. 20. A marked increase takes place around 90% of
added water in line with the increase in RH. Such results were confirmed by the measurements
of the intensity scattered by the solutions (Fig. 21). A sharp increase could again be noticed at
the same composition where the transition from mixed micelles to vesicles takes place.
It is to be noticed that no direct transition from micelles to vesicles occurs upon dilution in the
LESNa/DTAB/water phase diagram, but the vesicle phases coexist on both sides with
biphasic solutions, assumed to demix, depending on the composition between a vesicle or
micellar phase and a more viscous lamellar phase. This can be explained by the different
bindings (9, 10) of the counterions of the cationic surfactants. The methosulfate counterions
present in the CTAM cationic surfactant have salting-out characteristics, which means that
they are more strongly hydrated and less bound to the cationic polar head than bromide ions
are. Thus methosulfate ions are less efficient in shielding the charges of the surfactant
aggregates. In the case of the LESNa/CTAM/water system the resulting strong electrostatic
repulsions prevent thus the formation of a lamellar phase. This is not the case in the
LESNa/DTAB/water system. The direct transition from micelles to vesicles observed in the
LESNa/CTAM/water system could be linked to this phenomenon.
In the LESNa/DTAB/water system, the bromide ions are effectively bound whereas in the
LESNa/CTAM/water system, the methosulfate ions are nearly not bound at all. Therefore the
studied system behaves as an aqueous mixture of didodecyldimethylammonium with an
hydroxyde or an acetate as counterion (11). The catanionic mixture is like a double chained
cationic surfactant system with a single charged unbound anion (MeOSO3-). The DDA+OH-

VI Technical-grade surfactant systems
96
system has been extensively studied and forms spontaneous vesicles at low concentration (<
10-3 M). At 10-2 M it forms micelles surrounded by one or two lamellae.
Figure 17: Phase diagram LESNa / CTAM / H2O: Phase diagram LESNa /DTAB /H2O
The different phases of the systems were determined visually. I- and I+: anionic- and cationic-
rich micellar solutions; D: two-phase solutions composed of a white precipitate and a
colourless isotropic solutions or a white precipitate and a blue isotropic solution; P: white
precipitate; Black area: vesicle zone.
Figure 18: Visual observations of the system LES/CTAM at a molar ratio of 1 / 2.3 along
dilution of the solution with water (corresponds to the observations made along the
“experimental path” in Fig. 17). Transition from a colourless to a blue solution.
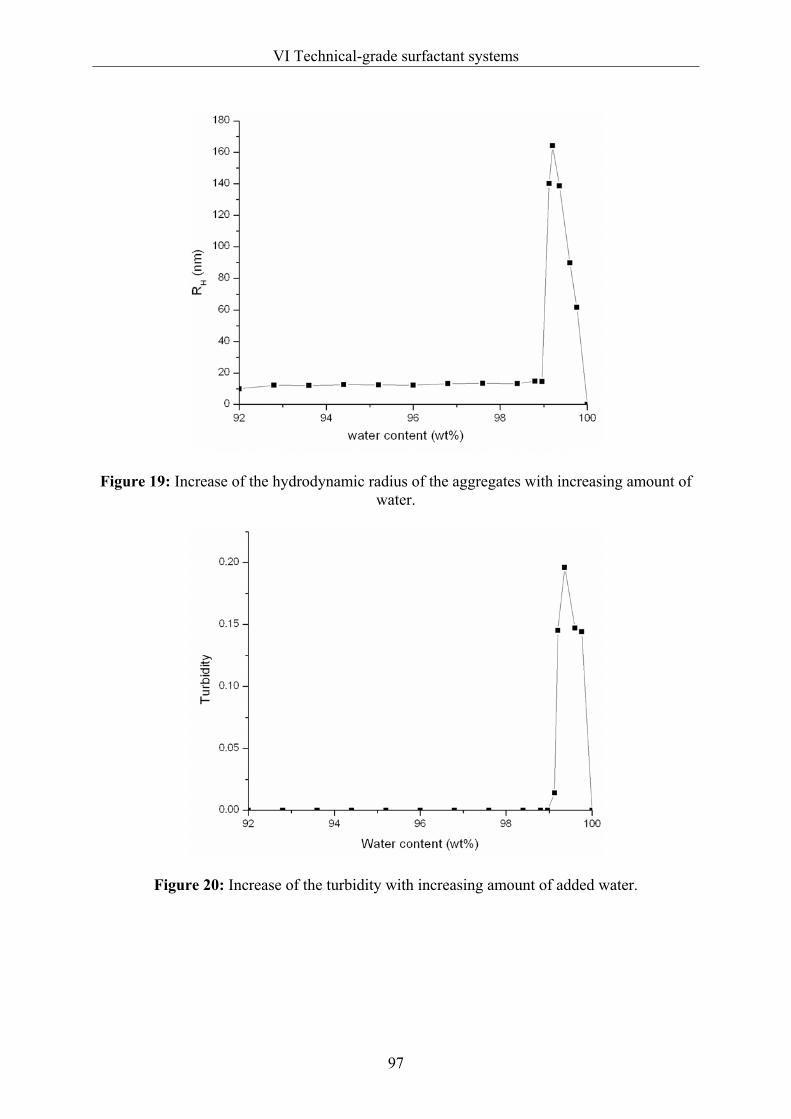
VI Technical-grade surfactant systems
97
Figure 19: Increase of the hydrodynamic radius of the aggregates with increasing amount of
water.
Figure 20: Increase of the turbidity with increasing amount of added water.

VI Technical-grade surfactant systems
98
Figure 21: Increase in the scattered intensity with increasing amount of added water.
Cryo-TEM and FF-TEM analysis
Cryo-TEM experiments were performed on the vesicle phase of the system at the
anionic/cationic surfactant molar ratio of about 1 / 2.3. Two samples were analyzed, which
had been previously measured by Dynamic Light Scattering. Both displayed hydrodynamic
radii above 110nm, which indicates the presence of large aggregates in the solution. However,
only very small-sized particles could ever be distinguished (<10nm) and look rather like a
mixture of spherical and small rod-like micelles (Fig. 22). On the contrary, freeze-fracture
photographs taken from a sample of the same composition and displaying similar sizes as
those inferred from DLS measurements confirmed the presence of vesicles (Fig. 23 and 24).
The vesicles observed here are not quite spherical but seem to have been flattened on one
side.

VI Technical-grade surfactant systems
99
Figure 22: Cryo-TEM photographs of the system LES/CTAM at the molar ratio 1/2.3 at an
overall surfactant concentration of 0.8wt%.
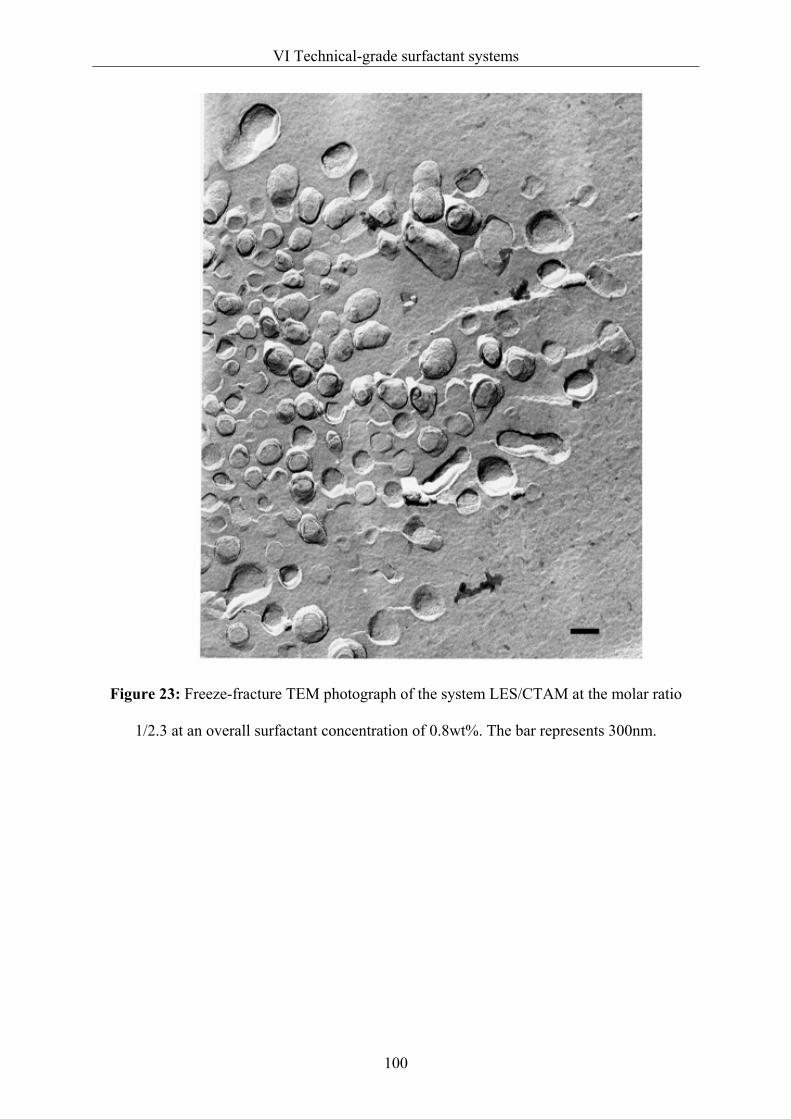
VI Technical-grade surfactant systems
100
Figure 23: Freeze-fracture TEM photograph of the system LES/CTAM at the molar ratio
1/2.3 at an overall surfactant concentration of 0.8wt%. The bar represents 300nm.
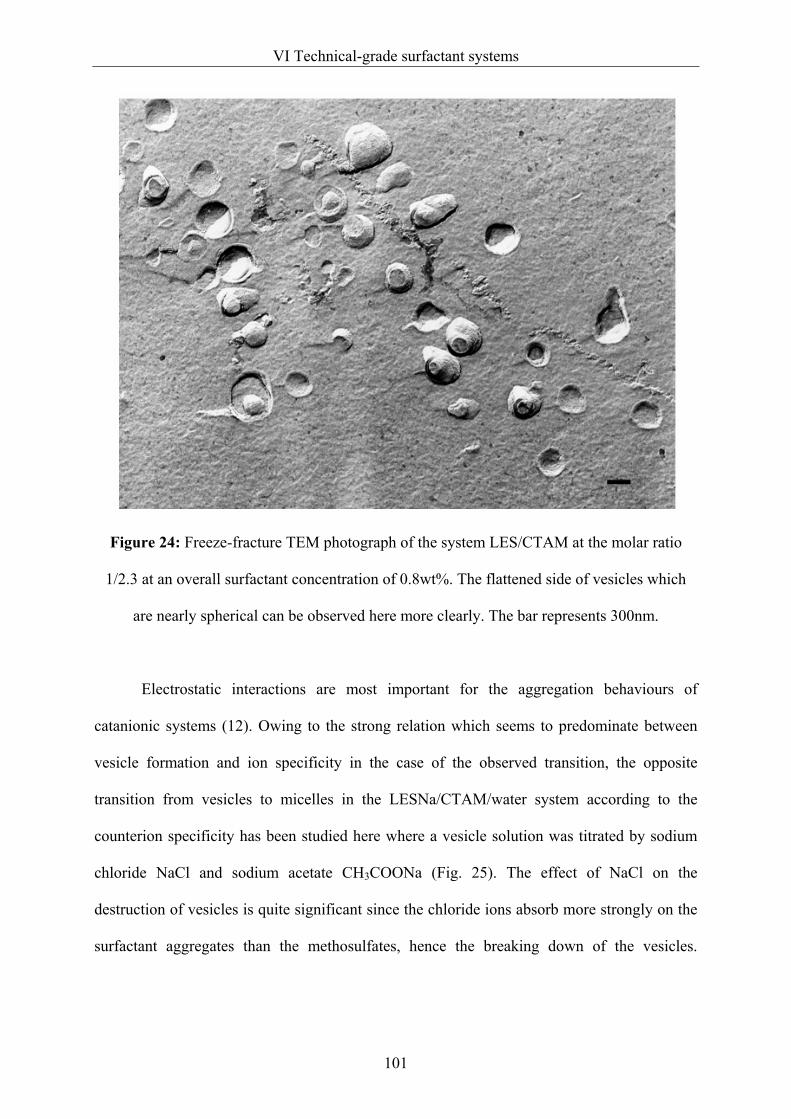
VI Technical-grade surfactant systems
101
Figure 24: Freeze-fracture TEM photograph of the system LES/CTAM at the molar ratio
1/2.3 at an overall surfactant concentration of 0.8wt%. The flattened side of vesicles which
are nearly spherical can be observed here more clearly. The bar represents 300nm.
Electrostatic interactions are most important for the aggregation behaviours of
catanionic systems (12). Owing to the strong relation which seems to predominate between
vesicle formation and ion specificity in the case of the observed transition, the opposite
transition from vesicles to micelles in the LESNa/CTAM/water system according to the
counterion specificity has been studied here where a vesicle solution was titrated by sodium
chloride NaCl and sodium acetate CH3COONa (Fig. 25). The effect of NaCl on the
destruction of vesicles is quite significant since the chloride ions absorb more strongly on the
surfactant aggregates than the methosulfates, hence the breaking down of the vesicles.

VI Technical-grade surfactant systems
102
Sodium acetate is more strongly hydrated than chloride. Thus the acetate effect on the vesicle
breakdown is not so pronounced although it is also visible at higher salt concentration.
Figure 25: Breakdown of vesicles of the LES/CTAM mixture upon salt addition.
6.2.3. Conclusion
In this work, a direct transition from spherical micelles to unilamellar vesicles could
be observed by simple dilution with water, i.e. by the decrease in the overall surfactant
concentration of the system at a constant anionic/cationic surfactant ratio. This transition was
characterized by visual observation, Dynamic Light Scattering experiments and microscopy
techniques.
In the first system LES/LPTC (section 5.2.1), the transition from micelles to vesicles
could not be explained, the complex structure of the LPTC being probably invoked. By
contrast, in the second system LES/CTAM, the weak binding of the methosulfate counterion
to the micelles was believed to be at the origin of the micelles to vesicles transition by

VI Technical-grade surfactant systems
103
preventing the formation of lamellar structures. Even if the phenomenon of transition from
micelles to vesicles by dilution with water was observed twice in this work, it is very rare in
catanionic systems. The conditions for its appearance are difficult to predict.
Such a phenomenon is quite interesting as far as encapsulation processes are involved
(13, 14). The mixing of either a hydrophilic or lipophilic active principle in the catanionic
mixed micelles could lead to self-encapsulation solely via simple dilution with water at the
same fixed mixing ratio of anionic/cationic surfactant. Another observation was that further
dilution of the vesicles so formed leads to their destruction. This suggests, following
encapsulation of an active principle, the possibility of controlled release again by simple
dilution with water.

VI Technical-grade surfactant systems
104
References
1. Yatcilla, M.T.; Herrington, K.L.; Brasher, L.L.; Kaler, E.W.; Chiruvolu, S.; Zasadzinski, J.
Journal of Physical Chemistry, 1996, 100 (14), 5874-9.
2. Kamenka, N.; El Amrani, M.; Appell, J.; Lindheimer, M. Journal of Colloid and Interface
Science, 1991, 143 (2), 463-71.
3. Salkar, R.A.; Mukesh, D.; Samant, S.D.; Manohar, C. Langmuir, 1998, 14, 3778-3782.
4. Filipovic-Vincekovic, N.; Bujan, M.; Smit, I.; Tusek-Bozic, Lj.; Stefanic, I. Journal of
Colloid and Interface Science, 1998, 201, 59-70.
5. Söderman, O.; Herrington, K.L.; Kaler, E.W.; Miller, D.D. Langmuir, 1997, 13, 5531-
5538.
6. Herrington, K.L.; Kaler, E.W.; Miller, D.D.; Zasadzinski, J.A.N.; Chiruvolu, S. Journal of
Physical Chemistry, 1993, 97, 13792.
7. Kondo, Y.; Uchiyama, H.; Yoshino, N; Nishiyama, K.; Abe, M. Langmuir, 1995, 1, 2380.
8. Herrington, K.L.; Kaler, E.W.; Miller, D.D.; Zasadzinski, J.A.; Chiruvolu, S. Journal of
Physical Chemistry, 1993, 97 (51), 13792-802.
9. Soederman, O.; Herrington, K.L.; Kaler, E.W.; Miller, D.D., Langmuir, 1997, 13 (21),
5531-5538.
10. Brady, J. E.; Evans, D. F.; Warr, G. G.; Grieser, F.; Ninham, B. W., Journal of Physical
Chemistry, 1986, 90 (9), 1853-9.
11. Ninham B.W., Talmon Y., Evans D.F. Science, 1983, 221, 1047-1048.
12. Brasher, L.L.; Herrington, K.L.; Kaler, E.W. Langmuir, 1995, 11 (11), 4267-77.
13. Carmona-Ribeiro, A.M.; Yoshida, L.S. ; Chaimovich, H.; Journal of Colloid and Interface
Science, 1984, 100, 433.
14. Fischer, A.; Hebrant, M.; Tondre, C., Journal of Colloid and Interface Science, 2002, 248
(1), 163-168.

VII Salt-induced micelle to vesicle transition
VII SALT-INDUCED MICELLE TO VESICLE
TRANSITION
7.1. Introduction
Catanionic aqueous systems display a wide variety of phase behaviours and structures
(1). Particularly, spontaneously formed catanionic vesicles have aroused a growing interest,
since they can be tailored at will by varying the anionic / cationic surfactant ratio, the size of
the chain length or of the polar heads (2). This interest lies mostly in the fact that catanionic
vesicles are easy to prepare and that they are thermodynamically stable. They can thus be
used as vehicles for controlled delivery of drugs (3, 4, 5) or as template for the synthesis of
hollow particles (6, 7). The way catanionic vesicles can form or break down represents
therefore a relevant field of investigation. Such structures are sensitive to parameters such as
temperature (8, 9) or presence of salt (10) which can induce transitions from vesicles to
micelles or to precipitation. Of particular interest is the direct transition from micelles to
vesicles. Such a phenomenon implies that the vesicle formation occurs without any phase
separation in the solution and offers consequently an easier way of encapsulating active
agents by dissolving them in the micellar phase prior to vesicle formation. Such a transition
has already been observed when diluting a micellar solution with water (11, 12, 13), changing
the anionic / cationic surfactant ratio (14, 15, 16), increasing the temperature (17), or adding a
salt (18).
Strong electrostatic interactions exist in mixtures of oppositely charged surfactants and
play a most important role in the phase behaviour of the catanionic system. A change in the
anionic / cationic surfactant composition leads to structural changes. Addition of salts alters as
well the electrostatic interactions and therefore leads to major changes, for example the
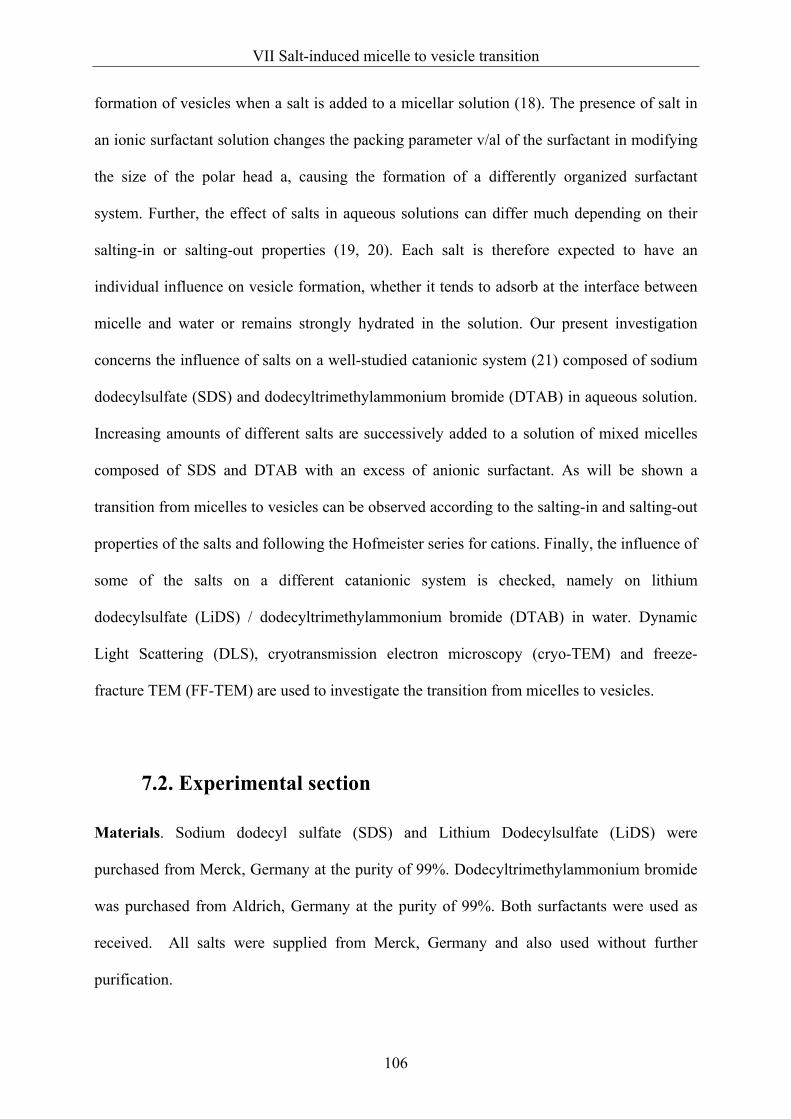
VII Salt-induced micelle to vesicle transition
106
formation of vesicles when a salt is added to a micellar solution (18). The presence of salt in
an ionic surfactant solution changes the packing parameter v/al of the surfactant in modifying
the size of the polar head a, causing the formation of a differently organized surfactant
system. Further, the effect of salts in aqueous solutions can differ much depending on their
salting-in or salting-out properties (19, 20). Each salt is therefore expected to have an
individual influence on vesicle formation, whether it tends to adsorb at the interface between
micelle and water or remains strongly hydrated in the solution. Our present investigation
concerns the influence of salts on a well-studied catanionic system (21) composed of sodium
dodecylsulfate (SDS) and dodecyltrimethylammonium bromide (DTAB) in aqueous solution.
Increasing amounts of different salts are successively added to a solution of mixed micelles
composed of SDS and DTAB with an excess of anionic surfactant. As will be shown a
transition from micelles to vesicles can be observed according to the salting-in and salting-out
properties of the salts and following the Hofmeister series for cations. Finally, the influence of
some of the salts on a different catanionic system is checked, namely on lithium
dodecylsulfate (LiDS) / dodecyltrimethylammonium bromide (DTAB) in water. Dynamic
Light Scattering (DLS), cryotransmission electron microscopy (cryo-TEM) and freeze-
fracture TEM (FF-TEM) are used to investigate the transition from micelles to vesicles.
7.2. Experimental section
Materials. Sodium dodecyl sulfate (SDS) and Lithium Dodecylsulfate (LiDS) were
purchased from Merck, Germany at the purity of 99%. Dodecyltrimethylammonium bromide
was purchased from Aldrich, Germany at the purity of 99%. Both surfactants were used as
received. All salts were supplied from Merck, Germany and also used without further
purification.

VII Salt-induced micelle to vesicle transition
107
Sample preparation. Stock solutions were prepared one day prior to sample preparation. The
surfactants were mixed in Millipore water at the desired concentration and left to equilibrate
at 25°C overnight. The catanionic solutions were then prepared by mixing the surfactants at a
fixed ratio. The required amount of salt was weighed and added to the micellar catanionic
solutions. The solutions were then vortex mixed and left to equilibrate one week at 25°C
before making measurements.
Dynamic Light Scattering. Measurements were made using a Zetasizer Z3000 spectrometer
with an Helium-Neon laser from the firm Malvern Instruments.
Spectrometry. Turbidity was measured on a Cary-3E UV/vis spectrophotometer at a
wavelength of 414nm.
Cryo-Transmission Electron Microscopy (cryo-TEM) and Freeze-Fracture TEM.
Specimens for cryo-TEM and FF-TEM were prepared according to the same process
described in chapter 4.
Phase Diagram Apparatus. Krafft temperatures were determined by turbidity measurements
using an automated home-built apparatus conceived for the determination of liquid-liquid and
solid-liquid phase transitions described in chapter 4. The samples were placed in the
thermostated silicone bath of the apparatus and cooled down to 0°C. They were then slowly
heated at a linear rate of 2°C/hour under periodic agitation (frequency 1Hz). Krafft
temperatures were determined at the melting of the last surfactant crystal with a precision ΔT
of ±0.01°C. This was observed when the transmitted intensity through the solutions reached a
maximum and remained constant over time.

VII Salt-induced micelle to vesicle transition
108
7.3. Salt addition: results and discussion
7.3.1. Sodium salts with different anions
The phase behaviour of the aqueous catanionic system SDS/DTAB was studied in
detail by Kaler et al (21) until a total surfactant concentration of 1wt%. In the present study,
the starting point was a colourless isotropic sample described as a micellar system in the
phase diagram (Fig. 1). All the salts of this study were added to this reference sample. Its
composition consisted of an anionic / cationic surfactant mass ratio of 70/30 which
corresponds approximatively to a molar ratio of 2.5 / 1 for a total surfactant concentration of
1wt%. The sodium iodide (NaI), sodium bromide (NaBr), sodium chloride (NaCl), sodium
hydroxide (NaOH), sodium perchlorate (NaClO4), sodium thyocyanate (NaSCN), sodium
acetate (NaAc) salts were added to the micellar solution with increasing concentrations. It
could be observed that when a certain salt concentration had been reached the solutions
became blue a few seconds after mixing. A transition from colourless to blue isotropic
solutions could be observed for all salts. Above a certain salt concentration a demixing of the
solutions into a blue isotropic phase and a turbid white phase took place.

VII Salt-induced micelle to vesicle transition
109
Figure 1: Schematic phase diagram of the SDS/DTAB system at 25°C. The black
cross and the black arrow show respectively the reference sample and the vesicular solution to
which all salts were added.
Dynamic Light Scattering experiments were only performed on perfectly isotropic
solutions. A significant increase in the hydrodynamic radius (RH) versus concentration of
added salt could be observed (Fig. 2) in agreement with visual observations. The salts proved
to have a strong influence on the growth of the aggregate size of the micelles. However all
curves overlap more or less and no real specificity could be found for the anions. The micellar
solutions to which the salts were added were in a strong excess of the anionic surfactant SDS.
The mixed micelles are thus negatively charged. Therefore it is reasonable to assume that the
interactions of the added anions with the micelles were too limited to show significant
specificities.

VII Salt-induced micelle to vesicle transition
110
Figure 2: Effect of adding different sodium salts upon the growth of the hydrodynamic radii
of the catanionic aggregates.
7.3.2. Chloride salts with different cations
The sodium chloride NaCl, cesium chloride CsCl, tetramethylammonium chloride
Me4NCl, ammonium chloride NH4Cl, potassium chloride KCl, rubidium chloride RbCl,
lithium chloride LiCl salts with a chloride counterion Cl- were added with increasing salt
concentration to the micellar solution of SDS / DTAB at the same molar ratio of 2.5 / 1 and an
overall surfactant concentration of 1wt% . The same protocol as for the anionic salts of the
previous experiment was used for this study.
A similar observation as for the anion salts could be made shortly after mixing the
chloride salts to the catanionic micellar solutions, i.e. above a certain salt concentration,
different for each salt, a blue shade appeared in the solutions. This can be seen on Fig. 3 for
increasing amounts of NaCl, CsCl, NH4Cl and Me4NCl. The samples were left to equilibrate
one week at 25°C and the perfectly isotropic ones were analysed by Dynamic Light
Scattering. A strong increase in the size of the hydrodynamic radius of the aggregates versus

VII Salt-induced micelle to vesicle transition
111
increasing concentration of added salt could be measured (Fig. 4). The rate of increase was
different for each salt. An ordering of the cation influence could be made according to the
amount of each salt required to obtain a ceratin growth in size of the aggregates present in the
solution. A small amount of cesium or potassium salts (< 0.02M) was sufficient to
dramatically increase the size of the aggregates, whereas even concentrations higher than
0.06M were not sufficient to reach big-sized aggregates when the tetramethylammonium salt
was added. The same ordering could be established when the index of polydispersity and the
intensity of light scattered by the aggregates were measured (Fig. 5 and Fig. 6). The transition
of the solutions from colourless to blue to an even deeper blue when salts were added was
recorded by turbidity measurements (Fig. 7) and the specificity of the series appeared to be
the same as in the previous measurements.
In order to highlight the specific effect of the salts on the size growth of the aggregates
in the catanionic solution, the amount of each salt necessary to get an aggregate size of 50nm
was determined from the graph of Fig. 4 and is reported in Fig. 8. The Hofmeister series for
the cations can be classified from right to left with increasing salting-in power:
N(CH3)4+ > NH4
+ > Cs+ > Rb+ > K+ > Na+ > Li+
What can be pointed out is that the classical cationic Hoffmeister series is not exactly
followed in a linear order. A classification can be made from the salt which can be added in
the smallest amount to the one which requires the largest amount so as to reach the same
aggregate size:
Rb+ ~ Cs+ > K+ > NH4+ > Na+ > Li+ > N(CH3)4+
The salts which have a marked salting-in or salting-out property have the weakest influence
on the growth of the aggregate size. The monoatomic salts Li+, Na+, K+, Rb+, Cs+ follow the
Hofmeister series. They are assumed to adsorb at the interface water / anionic polar head of

VII Salt-induced micelle to vesicle transition
112
the SDS and thus strongly decrease the surface a occupied by the polar head. The packing
parameter increases thus strongly. And the condition is fulfilled for vesicle formation to take
place. On the other hand, the polyatomic ions NH4+ and Me4N+ are more hydrophobic. They
do not adsorb at the charged surface of the micelle but tend to solubilize in the iterior of the
micelles as was schematised by Leontidis (19).
Figure 3: Visual observations of the SDS/DTAB solution with increasing salt concentration.
The catanionic solutions change from colourless to blue upon addition of NaCl, NH4Cl and
CsCl. The effect is much less obvious when (CH3)4Cl is added.
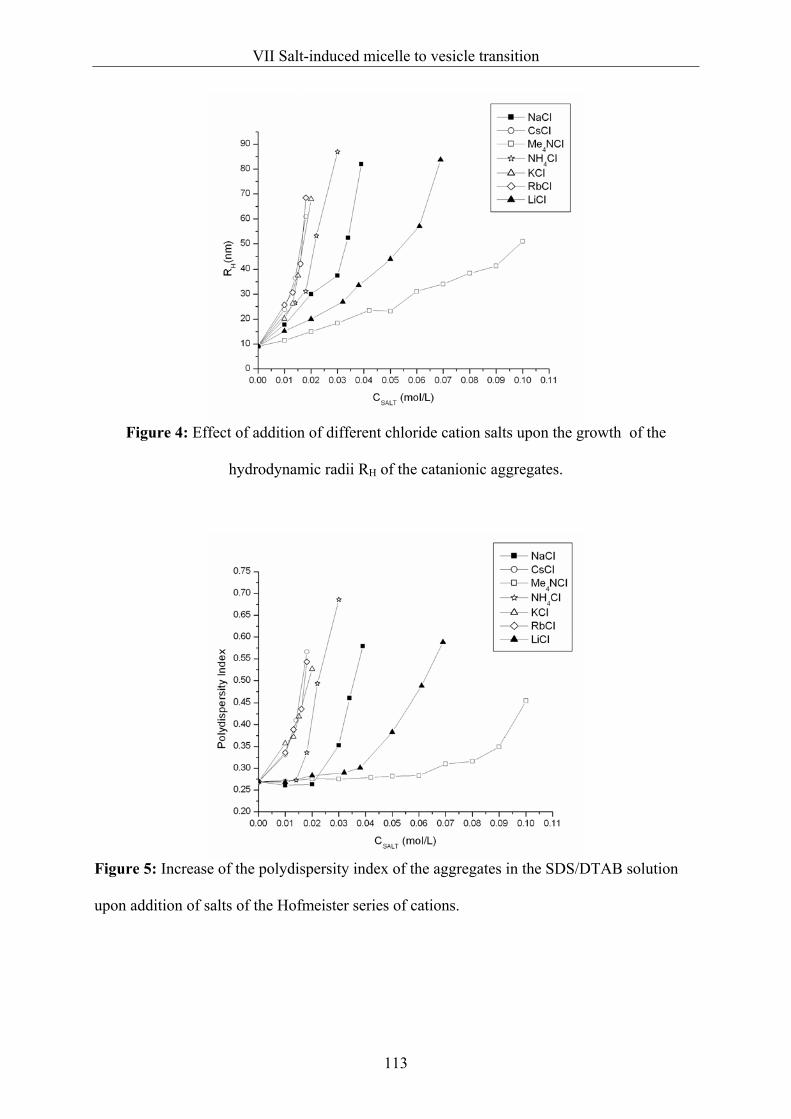
VII Salt-induced micelle to vesicle transition
113
Figure 4: Effect of addition of different chloride cation salts upon the growth of the
hydrodynamic radii RH of the catanionic aggregates.
Figure 5: Increase of the polydispersity index of the aggregates in the SDS/DTAB solution
upon addition of salts of the Hofmeister series of cations.

VII Salt-induced micelle to vesicle transition
114
Figure 6: Increase of the intensity of light5 scattered from SDS/DTAB solutions upon
addition of different chloride salts.
Figure 7: Increase of the turbidity of SDS/DTAB solutions upon addition of different
chloride salts.
5 Number of photons recorded by the detector per second.

VII Salt-induced micelle to vesicle transition
115
Figure 8: Amount of salt (mol/L) necessary to increase the size of the aggregates present in
the SDS/DTAB solutions from a micellar size to a 50nm aggregate size.
Cryo-TEM analysis
Some samples were analysed by cryotransmission electron microscopy to determine
the type of aggregates present in the solutions. In Fig. 9 are reported cryo-TEM photographs
of the sample without any addition of salt. Very long rod-like micelles also referred to as
ribbon-like micelles can be observed in equilibrium with spherical micelles, which explains
why the polydispersity index in the micellar solution is already high (0.269). Fig. 10 shows
photographs taken from a sample to which 0.044 mol/L (0.26 wt%) of sodium chloride
(NaCl) was added. The aggregates present appear to be vesicles in equilibrium with ribbon-
like micelles. The size of the hydrodynamic radius measured in Dynamic Light Scattering was
in rough agreement with the size of most vesicles present on the photographs. To a sample of
SDS/DTAB in water of the same composition was added 0.019 mol/L (0.32 wt%) of cesium
chloride. The cryo-TEM photographs taken from this sample are represented in Fig. 11. The
size of the hydrodynamic radius of the aggregates in this sample is determined to be about

VII Salt-induced micelle to vesicle transition
116
80nm. In this case, the sample appears highly polydisperse with small and big-sized vesicles
in equilibrium with ribbon-like micelles.
Figure 9: Cryo-TEM photographs of a SDS/DTAB aqueous solution at the molar ratio of
2.5/1 at a total surfactant concentration of 1wt%.
Figure 10: Cryo-TEM photographs representing the effect of the addition of 0.044mol/L
(0.26wt%) NaCl to a SDS/DTAB micellar solution.
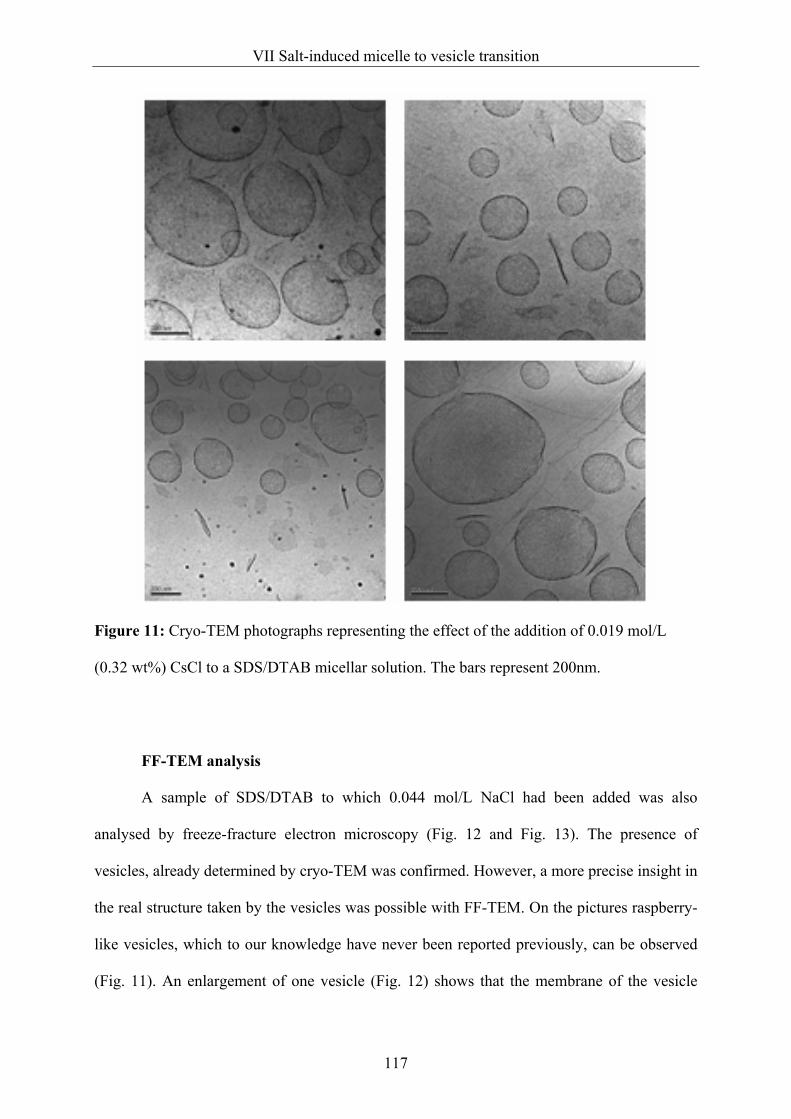
VII Salt-induced micelle to vesicle transition
117
Figure 11: Cryo-TEM photographs representing the effect of the addition of 0.019 mol/L
(0.32 wt%) CsCl to a SDS/DTAB micellar solution. The bars represent 200nm.
FF-TEM analysis
A sample of SDS/DTAB to which 0.044 mol/L NaCl had been added was also
analysed by freeze-fracture electron microscopy (Fig. 12 and Fig. 13). The presence of
vesicles, already determined by cryo-TEM was confirmed. However, a more precise insight in
the real structure taken by the vesicles was possible with FF-TEM. On the pictures raspberry-
like vesicles, which to our knowledge have never been reported previously, can be observed
(Fig. 11). An enlargement of one vesicle (Fig. 12) shows that the membrane of the vesicle

VII Salt-induced micelle to vesicle transition
118
seems to be decorated by smaller vesicles which have aggregated together and form a larger
vesicle.
Figure 12: FF-TEM photographs representing the effect of the addition of 0.044mol/L
(0.26wt%) NaCl to a SDS/DTAB micellar solution. Presence of raspberry-like vesicles. The
bar represents 300nm.

VII Salt-induced micelle to vesicle transition
119
Figure 13: Cryo-TEM photograph representing the effect of the addition of 0.044mol/L
(0.26wt%) NaCl to a SDS/DTAB micellar solution. Enlargement where the membrane of the
vesicle, constituted by an aggregation of several small vesicles can be seen. The bar
represents 300nm.
7.3.3. Different cations with other counterions
The influence of cations on anion-rich SDS/DTAB micelles is very strong and
specific. However, in order to assess the influence of the anionic counterion of the cation salt,
the influence on the same catanionic solution of a third series of salts was investigated. The
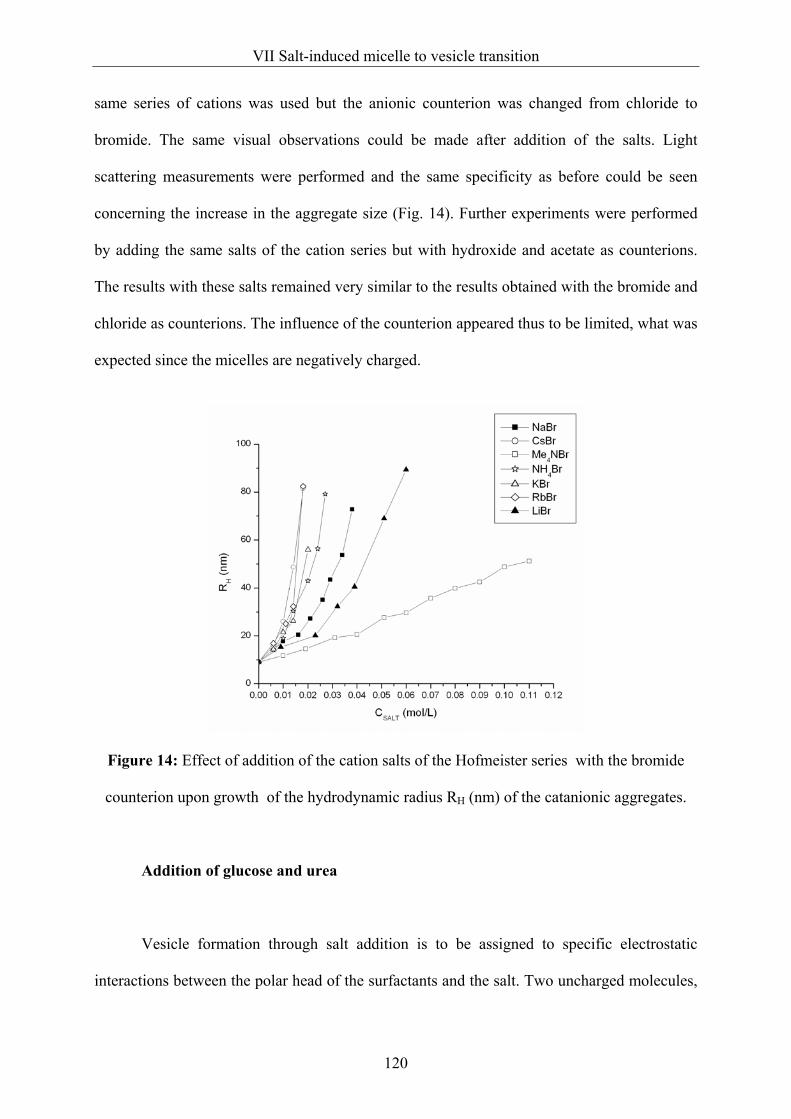
VII Salt-induced micelle to vesicle transition
120
same series of cations was used but the anionic counterion was changed from chloride to
bromide. The same visual observations could be made after addition of the salts. Light
scattering measurements were performed and the same specificity as before could be seen
concerning the increase in the aggregate size (Fig. 14). Further experiments were performed
by adding the same salts of the cation series but with hydroxide and acetate as counterions.
The results with these salts remained very similar to the results obtained with the bromide and
chloride as counterions. The influence of the counterion appeared thus to be limited, what was
expected since the micelles are negatively charged.
Figure 14: Effect of addition of the cation salts of the Hofmeister series with the bromide
counterion upon growth of the hydrodynamic radius RH (nm) of the catanionic aggregates.
Addition of glucose and urea
Vesicle formation through salt addition is to be assigned to specific electrostatic
interactions between the polar head of the surfactants and the salt. Two uncharged molecules,

VII Salt-induced micelle to vesicle transition
121
glucose and urea, having respectively salting-out and salting-in effects, were added to the
same mixed micelles solutions. No effect whatsoever on the growth of the aggregate size
could be noticed. Even though glucose and urea were added at a concentrattion as high as
1mol/L, no increase in the size of the micelles was found.
Addition of salts to a vesicular solution
To check if the specificity of the salts could also be determined for the opposite
microstructural evolution, i.e. for a transition from vesicles to rodlike micelles, sodium
chloride, cesium chloride and tetramethylammonium chloride were added to a vesicular
solution at a mass ratio SDS/DTAB of 65/35 which corresponds to a molar ratio of 2/1 at a
total surfactant concentration of 0.8wt% (see Fig. 1). The salts were added at concentrations
ranging from 0.5wt% to 4wt%. No vesicle breakdown occurred instantaneously, the solutions
remained blue and isotropic. After 24 hours at 25°C, a demixing of the solution into a slight
white cloud, whose intensity increased with the amount of added salt, and a blue isotropic
solution could be observed. However the blue vesicular solution remained stable over 2
month and no complete vesicle breakdown for any of the three added salts could be observed.
7.3.4. Addition of salts to the LiDS/DTAB system
The influence of the salts of the Hofmeister series was studied on another catanionic
system with the same cationic surfactant DTAB but with lithium dodecylsulfate LiDS as the
anionic surfactant. The substitution of the counterion of the anionic surfactant from sodium to
lithium changes its surface chemical properties, since the counterion binding to the surfactant
is different. This is evidenced by the fact that the CMC of LiDS is higher than the CMC of

VII Salt-induced micelle to vesicle transition
122
SDS (23) although the surfactant anions are exactly the same. The CMCs of LiDS and SDS
are respectively 8.92 and 8.32mM at 25°C (24). The counterion binding of lithium to the
surfactant is lower than for the sodium counterion and is probably due to the larger hydration
sphere of lithium ions. When mixed with DTAB to form catanionic mixed micelles, this
should lead to a more pronounced increase of the aggregate size when salt is added. The two
surfactants LiDS and DTAB were thus mixed at the same anionic / cationic mass ratio of
70/30, which corresponds to a molar ratio of 2.6 / 1. The total surfactant concentration was
also of 1wt%. The solution was colourless and isotropic. According to the DLS results this
solution was also a micellar solution (Rh=7.42 nm; P.I.=0.2). To the system were added four
different cationic salts: NaCl, CsCl, NH4Cl and LiCl. According to the DLS results (Fig. 15),
the order of the Hofmeister series for these four salts appeared to be the same as the
classification established before when the salts were added to the SDS/DTAB system:
Cs+ > NH4+ > Na+ > Li+
However, as can be seen from Fig. 16, a similar amount of salt added to the SDS/DTAB and
LiDS/DTAB systems does not lead to the same increase in the size of the aggregates. A larger
amount of salt is required to get the same size as for the system SDS/DTAB. The contrary
was expected, since the weaker binding of Li+ ions to the polar head should make the mixed
micelles more sensitive to any added electrolytes. An explanation for this difference could be
the different molar ratios between the anionic and cationic surfactants, the molar ratio of
SDS/DTAB being 2.5/1 and for LiDS/DTAB 2.6/1.
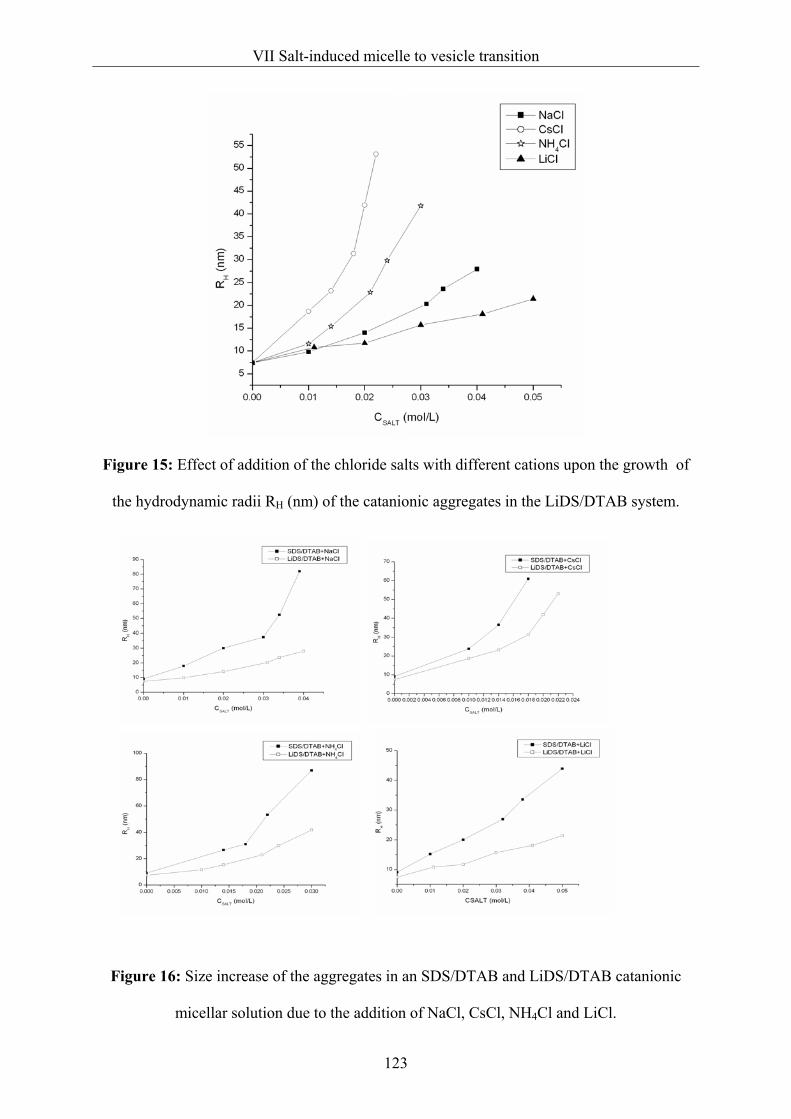
VII Salt-induced micelle to vesicle transition
123
Figure 15: Effect of addition of the chloride salts with different cations upon the growth of
the hydrodynamic radii RH (nm) of the catanionic aggregates in the LiDS/DTAB system.
Figure 16: Size increase of the aggregates in an SDS/DTAB and LiDS/DTAB catanionic
micellar solution due to the addition of NaCl, CsCl, NH4Cl and LiCl.

VII Salt-induced micelle to vesicle transition
124
7.4. Effect of salt addition on the Krafft temperature of SDS
and LiDS
The addition of salts to an ionic surfactant solution contributes to lower dramatically
the Critical Micelle Concentration of the surfactant (25), since the shielding of the charge of
the polar head decreases the solubility of the surfactant monomers in water. Consequently the
Krafft temperature of the surfactant increases with an increased amount of salt in the solution.
The question which arises though is to know whether all 1:1 salts have the same effect on the
increase of the Krafft temperature which would mean that this effect is only due to
electrostatic interactions or whether each salt has a specific effect according to its salting-in or
salting-out characteristic.
In the previous part, a specific cation effect was observed on the growth of mixed
micelles of SDS/DTAB and LiDS/DTAB, where SDS and LiDS were in excess. We will now
study the effect of salt addition on the Krafft temperature of isotropic micellar solutions of
SDS and LiDS at 1wt%. This is done in order to determine whether a salt specificity also
applies on Krafft temperature through salt addition.
7.4.1. Anionic salts on SDS
Three different salts were first added to a 1wt% SDS solution with increasing
concentration: NaCl, Na2SO4 and NaI (Fig. 17).

VII Salt-induced micelle to vesicle transition
125
Figure 17: Krafft temperature (°C) of 1wt% SDS solutions to which increasing
amounts of NsCl, Na2SO4 and NaI have been added.
As was expected, when a salt is added to SDS, the Krafft point of the SDS solutions increase.
Whatever the nature of the anion of the added salt, no marked difference in the TK increase
can be seen. As was the case for the catanionic micelles with excess of SDS or LiDS in the
previous experiments, this effect is not surprising, since the SDS micelles are negatively
charged. Moreover it can be pointed out that monovalent ions like Cl- or I- have a similar
effect on Krafft temperature than a divalent ion like SO42-.
7.4.2.Cation effects on the Krafft temperature of SDS solutions
Different salts with various cations were added to 1wt% SDS solutions: NaCl, CsCl,
RbCl, LiCl, NH4Cl. The effects on the Krafft temperature of this solution are reported in Fig.
18. Here a marked difference in the Krafft temperature can be noticed between the effects of
different cation salts. They can be classified from right to left according to their decreasing
power to increase the Krafft temperature:

VII Salt-induced micelle to vesicle transition
126
Rb+ > Cs+ > Na+ > NH4+ > Li+
This order is the same as the one established previously according to the influence of
the salts on the increase in the hydrodynamic radius of the mixed micelles, except that Na+
and NH4+ are inverted.
Figure 18: Krafft temperatures (°C) of 1wt% SDS solutions to which increasing
amounts of RbCl, CsCl, NaCl, NH4Cl, LiCl have been added.
7.4.3. Cation salts on LiDS
Similar experiments were reproduced with a 1wt% LiDS solution to see if the cation
specificity is the same as in the case of SDS. The results are reported in Fig. 19. The Krafft
point of a 1wt% LiDS solution is below 0°C. However, the influence of the salts on the
Krafft temperature of the solution was such that exactly the same order as previously for
the SDS solution could be found. Thus exchanging the counterion Na+ of dodecylsulfate by
Li+ does not influence the salt specificity.
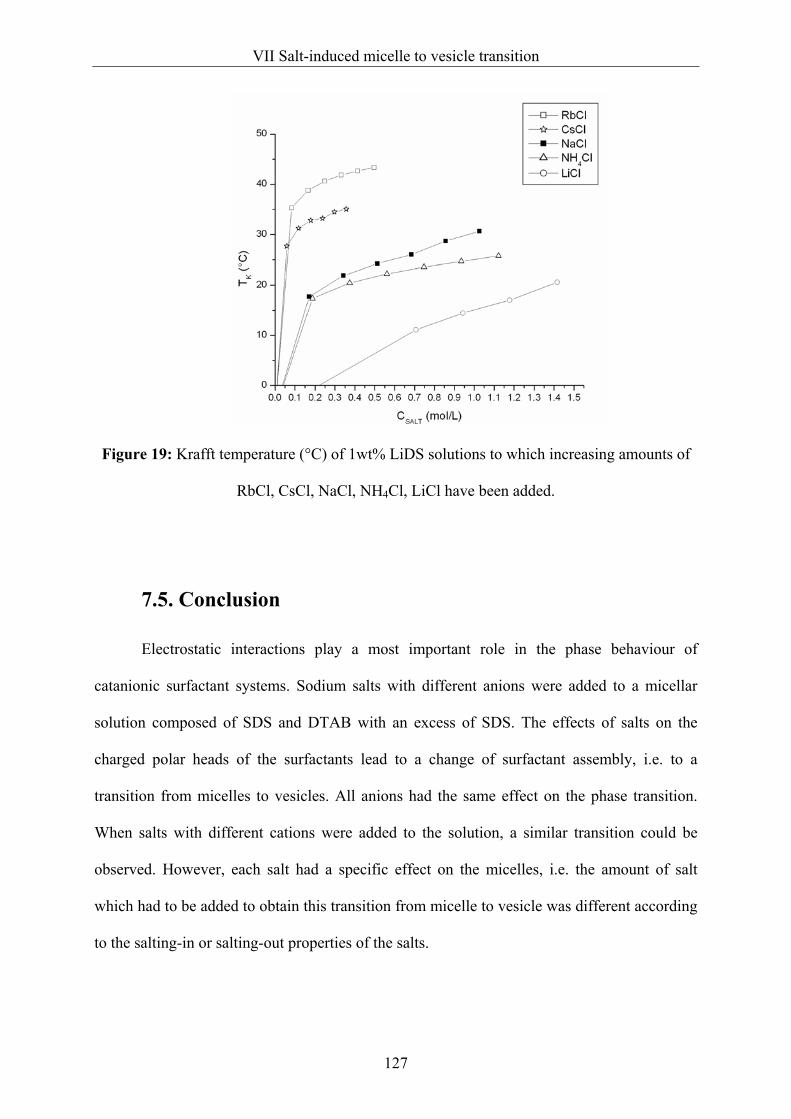
VII Salt-induced micelle to vesicle transition
127
Figure 19: Krafft temperature (°C) of 1wt% LiDS solutions to which increasing amounts of
RbCl, CsCl, NaCl, NH4Cl, LiCl have been added.
7.5. Conclusion
Electrostatic interactions play a most important role in the phase behaviour of
catanionic surfactant systems. Sodium salts with different anions were added to a micellar
solution composed of SDS and DTAB with an excess of SDS. The effects of salts on the
charged polar heads of the surfactants lead to a change of surfactant assembly, i.e. to a
transition from micelles to vesicles. All anions had the same effect on the phase transition.
When salts with different cations were added to the solution, a similar transition could be
observed. However, each salt had a specific effect on the micelles, i.e. the amount of salt
which had to be added to obtain this transition from micelle to vesicle was different according
to the salting-in or salting-out properties of the salts.

VII Salt-induced micelle to vesicle transition
128
References
1. Kaler E W; Murthy A K; Rodriguez B E; Zasadzinski J A Science, 1989, 245(4924), 1371-
4.
2. Yatcilla, M.T.; Herrington, K.L.; Brasher, L.L.; Kaler, E.W.; Chiruvolu, S.; Zasadzinski,
J.A. Journal of Physical Chemistry, 1996, 100(14), 5874-9.
3. Fischer, A.; Hebrant, M.; Tondre, C. Journal of Colloid and Interface Science, 2002, 248(1),
163-168.
4. Tondre, C.; Caillet, C. Advances in Colloid and Interface Science, 2001, 93(1-3), 115-134.
5. Bramer, T.; Paulsson, M.; Edwards, K.; Edsman, K. Pharmaceutical Research, 2003,
20(10), 1661-1667.
6. Hentze, H.-P.; Raghavan, S.R.; McKelvey, C.A.; Kaler, E.W. Langmuir, 2003, 19 (4),
1069-1074.
7. Kepczynski, M.; Ganachaud, F.; Hemery, P. Advanced Materials , 2004, 16 (20), 1861-
1863.
8. Renoncourt, A.; Bauduin, P.; Touraud, D.; Azemar, N.; Solans, C.; Kunz, W. Colloids and
Surfaces A, 2005, accepted.
9. Amante, J.C.; Scamehorn, J.F.; Harwell, J.F. Journal of Colloid and Interface Science,
1991, 144, 243.
10. Brasher, L.L.; Herrington, K.L.; Kaler, E.W. Langmuir, 1995, 11 (11), 4267-77.
11. Renoncourt, A.; Bauduin, P.; Touraud, D.; Kunz, W.; Azemar, N.; Solans, C.
Comunicaciones presentadas a las Jornadas del Comite Espanol de la Detergencia, 2004, 34,
273-282.
12. Kamenka, N.; El Amrani, M.; Appell, J.; Lindheimer, M. Journal of Colloid and Interface
Science, 1991, 143 (2), 463-71.

VII Salt-induced micelle to vesicle transition
129
13. Yatcilla, M.T.; Herrington, K.L.; Brasher, L.L.; Kaler, E.W.; Chiruvolu, S.; Zasadzinski,
J.A. Journal of Physical Chemistry, 1996, 100 (14), 5874-9.
14. Soederman, O.; Herrington, K.L.; Kaler, E.W.; Miller, D.D. Langmuir, 1997, 13 (21),
5531-5538.
15. O'Connor, A.J.; Hatton, T. A.; Bose, A. Langmuir, 1997, 13 (26), 6931-6940.
16. Filipovic-Vincekovic, N.; Bujan, M.; Smit, I.; Tusek-Bozic, Lj.; Stefanic, I. Journal of
Colloid and Interface Science, 1998, 201 (1), 59-70.
17. Yin, H.; Zhou, Z; Huang, J.; Zheng, R.; Zhang, Y. Angewandte Chemie, International
Edition, 2003, 42 (19), 2188-2191.
18. Zhai, L.; Li, G.; Sun, Z. Colloids and Surfaces, A: Physicochemical and Engineering
Aspects 2001, 190 (3), 275-283.
19. Leontidis, E. Current Opinion in Colloid & Interface Science, 2002, 7 (1,2), 81-91.
20. Kabalnov, A.; Olsson, U.; Wennerstroem, H. Journal of Physical Chemistry, 1995, 99
(16), 6220-30.
21. Herrington, K.L.; Kaler, E.W.; Miller, D.D.; Zasadzinski, J.A.; Chiruvolu, S. Journal of
Physical Chemistry, 1993, 97 (51), 13792-802.
22. Bauduin, P.; Renoncourt, A.; Touraud, D.; Kunz, W.; Ninham, B. W. Current Opinion in
Colloid & Interface Science, 2004, 9 (1,2), 43-47.
23. Kamenka, N., Lindman, B., Fontel, K. Acad. Science, 1977, 284.
24. Attwood, D., Florence A.T. Surfactant systems: their chemistry, pharmacy and biology,
1983, Chapman and Hall, London.
25. Jönsson, B.; Wennerström, H. Journal of Physical Chemistry, 1980, 84, 3114.

VIII Carboxylate surfactants
VIII CARBOXYLATE SURFACTANTS
Alkylcarboxylate surfactants have not been as extensively studied in catanionic
systems (except in ion pair amphiphiles) as alkylsulfate surfactants. However, the formation
of stable vesicles and the coexistence of vesicles and micelles are also observed for several
sodium alkylcarboxylate-alkyltrimethylammonium halide pairs.
Stable vesicles are claimed to be formed by the sonication of micellar solutions (1) in
the systems C9COONa-C10N(CH3)4Br and C11COONa-C8N(CH3)4Br. However these vesicles
are not stable over time and the solutions become opalescent within 1 to 4 weeks.
Regev and Khan (2) studied the asymmetric 6 catanionic pair
dodecyltrimethylammonium chloride (DoTAC) mixed to sodium nonanoate (SN) and
compared the phase behaviour of this system with DoTAC mixed to sodium dodecanoate
(SD). The phase diagrams of both systems are represented on Fig. 1. The system DoTAC/SN
exhibits only an extended isotropic micellar solution phase followed by liquid crystalline
phases at high surfactant concentration (above 25wt%). The system does not form any vesicle
phase. If the alkyl chain of the carboxylate surfactant is extended to a longer chain, i.e. a
decanoate, the catanionic pair yields a vesicle phase for the most diluted solutions and a
precipitate at equimolarity. Above 10 atoms carbon in the hydrocarbon chain, the mixture of a
cationic with a carboxylate surfactant leads to the typical phase organization already
encountered in other catanionic systems where a sulfate surfactant is the anionic surfactant.
6 An asymmetric catanionic pair is constituted of one anionic and one cationic with hydrocarbon chains of a different length.

VIII Carboxylate surfactants
131
Figure 1: Phase diagram at 25°C of the systems: (a) DoTAC / SN (b) DoTAC /SD. The
concentration is given in wt% surfactant. L1: isotropic micellar phase; V- and V+: vesicle
phases. Reprinted from reference (2).
Similar catanionic systems where studied by Sjöbom et Edlund (3), f.e. DoTAC in
mixtures with sodium hexanoate (SH), sodium octanoate (SO) and sodium decanoate (SD).
The only system where bluish solutions could be observed in the most diluted part of the
phase diagram was in the case of DoTAC / SD. The other two systems lead to isotropic
micellar solutions in the most diluted part of the phase diagram followed by liquid crystals in
the more concentrated solutions.
The major difficulty in using sodium alkylcarboxylates with chain lengths above 12
atom carbons is their Krafft temperatures which are higher than room temperature. This tends
to destabilise the formed aggregates such as vesicles when the temperature decreases below
room temperature, as was mentioned in chapter 4 for catanionic vesicles formed from
alkylsulfate surfactants. In order to decrease the Krafft temperature of carboxylate surfactants
without bringing in the system a fourth component such as a salt or a cosurfacatnt, two
options exist as regards the tailoring of the anionic surfactant: (a) ethylene oxide groups can
be incorporated into the polar head group of the surfactant. It becomes then possible to obtain
an extended isotropic phase at the cost of the multiphase regions, if a sufficient number of

VIII Carboxylate surfactants
132
ethylene oxide groups are present in the polar head group (4) (see chapter 5); (b) the
counterion of the carboxylate surfactant can be exchanged with ions having a lower binding
coefficient with the surfactant, thus increasing the solubility of the surfactant in water and
decreasing consequently its Krafft temperature. The following work deals with both
possibilities. In the first part, alkylether carboxylates instead of alkylcarboxylate surfactants
were studied in catanionic systems in mixtures with dodecyltrimethylammonium bromide
(DTAB) and in binary systems anionic surfactant / water at different pH values of the
solution. Then a study of the effect of the counterion exchange of the carboxylate surfactant
was performed in catanionic systems.
8.1. Alkylethercarboxylate surfactants
Although known for a long time, alkylethercarboxylate surfactants became relevant
for industrial applications only in the 1980s (5), when environmental properties of surfactants
became important along with other properties of ethercarboxylates such as chlorine stability,
anticorrosiveness (6), lime soap dispersibilty (7, 8), electrolyte stability or alkaline stability.
At the same time, in cosmetics more and more emphasis was made on mildness, so that the
use of ether carboxylates in such products as shampoos, foam baths, and shower baths (9, 10)
began to increase. According to pKa studies described by Aalbers (11), an internal
neutralization of the ether carboxylate micelles can result in a less anionic character than
alkylsulfates have. The ethercarboxylate surfactants are weakly dissociated acids with a non-
ionic behaviour at low pH and with anionic properties in neutralized or alkaline solutions. As
a consequence the combination with cationic surfactants, even in equimolar mixtures, will not
lead to precipitation.

VIII Carboxylate surfactants
133
8.1.1. Phase behaviour of alkylethercarboxylate /
alkyltrimethylammonium catanionic surfactant systems
8.1.1.1. Introduction
In contrast to alkylsulfate surfactants, alkylcarboxylate surfactants are very pH-
sensitive components. According to the pH value of the surfactant solution, they will
therefore present an equilibrium between the carboxylate form and the conjugated acid form.
Their study within a catanionic surfactant system is interesting in so far as they bring another
component to the system, which is the conjugated acid. Two different catanionic systems
were studied here: (1) sodium dodecylethercarboxylate with an average number of 6 ethylene
oxide groups (SDEC1) mixed with dodecyltrimethylammonium bromide DTAB and (2)
sodium dodecylethercarboxylate with an average number of 11 ethylene oxide groups
(SDEC2) with DTAB. The phase diagrams were studied at pH values of 9, 7, 5 and 4 in order
to see the influence of the ratio carboxylate surfactant/conjugated acid on the phase behaviour
of the catanionic system and particularly on the vesicle zone.
8.1.1.2. Materials
Sodium dodecylethercarboxylate with an average number of 6 ethylene oxide groups
(SDEC1) and 11 ethylene oxide groups (SDEC2) were both gifts from Kao Chemicals
(Germany) and were provided under the trade name of Akypo RLM 45N and Akypo Soft
100NV as aqueous solutions with respectively 80% and 25% of active matter. The cationic
surfactant used in this study was dodecyltrimethylammonium bromide DTAB supplied by
Aldrich, Germany at the purity of 99%. All surfactants were used as received. Stock solutions
of surfactants were prepared at 1wt% in Millipore water and left to equilibrate overnight at
25°C. The pH values of the anionic surfactant, the cationic surfactant and water were adjusted
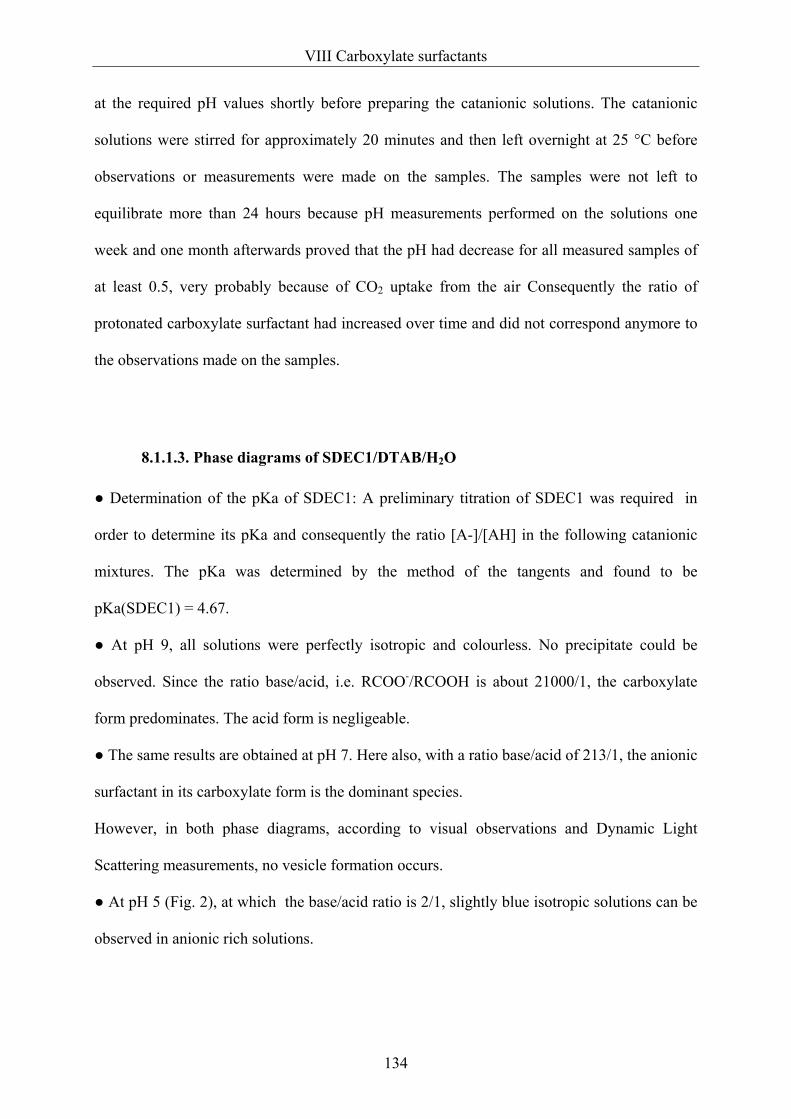
VIII Carboxylate surfactants
134
at the required pH values shortly before preparing the catanionic solutions. The catanionic
solutions were stirred for approximately 20 minutes and then left overnight at 25 °C before
observations or measurements were made on the samples. The samples were not left to
equilibrate more than 24 hours because pH measurements performed on the solutions one
week and one month afterwards proved that the pH had decrease for all measured samples of
at least 0.5, very probably because of CO2 uptake from the air Consequently the ratio of
protonated carboxylate surfactant had increased over time and did not correspond anymore to
the observations made on the samples.
8.1.1.3. Phase diagrams of SDEC1/DTAB/H2O
● Determination of the pKa of SDEC1: A preliminary titration of SDEC1 was required in
order to determine its pKa and consequently the ratio [A-]/[AH] in the following catanionic
mixtures. The pKa was determined by the method of the tangents and found to be
pKa(SDEC1) = 4.67.
● At pH 9, all solutions were perfectly isotropic and colourless. No precipitate could be
observed. Since the ratio base/acid, i.e. RCOO-/RCOOH is about 21000/1, the carboxylate
form predominates. The acid form is negligeable.
● The same results are obtained at pH 7. Here also, with a ratio base/acid of 213/1, the anionic
surfactant in its carboxylate form is the dominant species.
However, in both phase diagrams, according to visual observations and Dynamic Light
Scattering measurements, no vesicle formation occurs.
● At pH 5 (Fig. 2), at which the base/acid ratio is 2/1, slightly blue isotropic solutions can be
observed in anionic rich solutions.

VIII Carboxylate surfactants
135
Figure 2: Phase diagram of the SDEC1/DTAB catanionic system at pH 5 and at pH 4.
Dynamic Light Scattering experiments were performed at the mass ratio SDEC1 / DTAB of
80/20 along a dilution path. The results show the presence of large aggregates (up to 67.5 nm
for the hydrodynamic radius). The last two values can not be taken into account owing to the
too high polydispersity index (> 0.7) of the aggregates in solution.
Overall surfactant
concentration (wt%) Hydrodynamic Radius RH (nm)
Polydispersity Index Scattered Intensity (Kc.s-1)7
1 14.8 0.218 42.8 0.9 14.2 0.228 35.6 0.8 13.3 0.261 31.1 0.7 12.4 0.211 22.8 0.6 33.3 0.401 31.6 0.5 39.1 0.438 28.2 0.4 56.7 0.588 25.7 0.3 69.5 0.695 23.5 0.2 155.8 0.98 21.3 0.1 163.3 0.987 16.5
Table 1: DLS results of the SDEC1/DTAB system at 80 / 20 mass ratio.
● At pH 4, at a base acid ratio of 0.2/1, i.e. where the acid form predominates, the phase
behaviour does not change (Fig. 2) and similar results in Dynamic Light Scattering at the
same SDEC1/DTAB mass ratio are obtained with the difference that the intensity of the
scattered light increases (above 500Kc.s-1). This proves the existence of large aggregates.
7 Number of photons recorded by the detector per second.
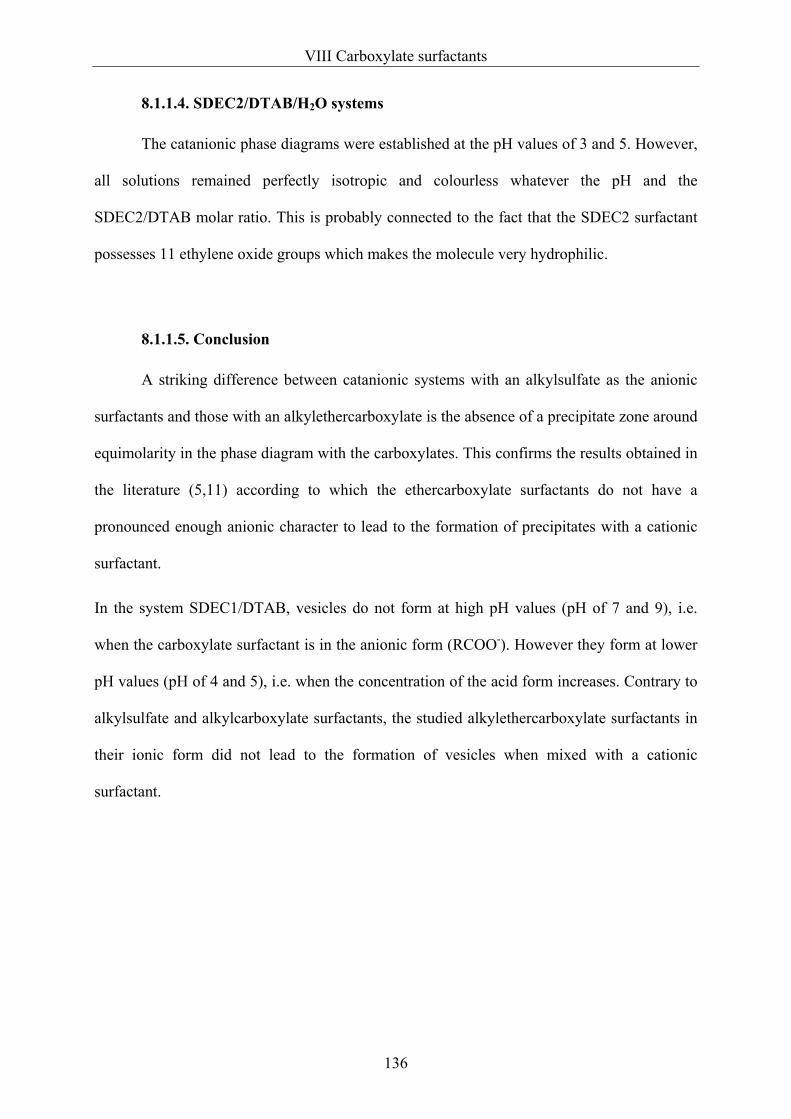
VIII Carboxylate surfactants
136
8.1.1.4. SDEC2/DTAB/H2O systems
The catanionic phase diagrams were established at the pH values of 3 and 5. However,
all solutions remained perfectly isotropic and colourless whatever the pH and the
SDEC2/DTAB molar ratio. This is probably connected to the fact that the SDEC2 surfactant
possesses 11 ethylene oxide groups which makes the molecule very hydrophilic.
8.1.1.5. Conclusion
A striking difference between catanionic systems with an alkylsulfate as the anionic
surfactants and those with an alkylethercarboxylate is the absence of a precipitate zone around
equimolarity in the phase diagram with the carboxylates. This confirms the results obtained in
the literature (5,11) according to which the ethercarboxylate surfactants do not have a
pronounced enough anionic character to lead to the formation of precipitates with a cationic
surfactant.
In the system SDEC1/DTAB, vesicles do not form at high pH values (pH of 7 and 9), i.e.
when the carboxylate surfactant is in the anionic form (RCOO-). However they form at lower
pH values (pH of 4 and 5), i.e. when the concentration of the acid form increases. Contrary to
alkylsulfate and alkylcarboxylate surfactants, the studied alkylethercarboxylate surfactants in
their ionic form did not lead to the formation of vesicles when mixed with a cationic
surfactant.

VIII Carboxylate surfactants
137
8.1.2. Formation of vesicles by titration of an alkyethercarboxylate
surfactant with HCl
8.1.2.1. Introduction
The discovery of the spontaneous formation of vesicles from mixtures of single-
chained cationic and anionic surfactants (12) constituted in the late nineties a real
breakthrough as far as the investigation about catanionic aggregates are concerned. Beside
their spontaneous formation, catanionic vesicles present the advantage of being produced by
mixtures of water-soluble single-chained surfactants, easily available and enabling a tailoring
of their physico-chemical properties (13). Vesicles created beforehand from double-chained
amphiphiles such as phospholipids (14, 15) or dialkyldimethylammonium halides (16)
required some input of energy for their formation since the surfactants involved were poorly
soluble in water. Some alternatives were found to enable the spontaneous formation of
vesicles from double-chained surfactants, such as substituting the halide counterion of
didodecyldimethylammonium bromide by hydroxides or acetates, increasing thus the
solubility of such surfactants in water (17, 18, 19). All categories of catanionic vesicles are in
a liquid state, i.e. the chains of the surfactants which aggregate into vesicles are above their
melting point.
A very interseting alternative is the formation of large aggregates with only one single
chain anionic surfactant. The reason is that cationic surfactants can have
immunosuppressive and bactericidal properties (20, 21). However, only very few studies are
published about the formation of aggregates such as vesicles from ionic single chain
surfactants. Since a packing parameter of about one is required for amphiphiles to favour the

VIII Carboxylate surfactants
138
formation of vesicles (22), nanodisks or icosahedra, classical ionic single-tailed surfactants
will not form vesicles alone in water. To reach this packing parameter when starting from one
single-chain surfactant, a cosurfactant such as a short chain alcohol is required (23). Another
way to form vesicles from a single-chained surfactant consists in titrating aqueous solutions
of pH-sensitive surfactants such as carboxylate (24) or phosphate (25) surfactants. The
anionic surfactant is titrated by a strong acid such as hydrochloric acid (HCl) to obtain a
certain ratio of conjugated acid of the anionic surfactant. The conjugated acid formed can
thus be assimilated to a cosurfactant which drives the system to form vesicles. However
carboxylates tend to have high Krafft temperatures (TK). Vesicles formed are thus unstable at
lower temperatures and form crystals when left at room temperature. To decrease TK, systems
with carboxylate surfactants possessing a hydrocarbon chain length smaller than twelve
carbon atoms can be used such as the sodium decylcarboxylate, which at 25°C forms a liquid
solution in water (26). This unfortunately reduces the choice of systems to tailor vesicles and
increases the harmfulness with such small chain surfactants, reducing thus the range of
possibility for possible applications.
A decrease of the TK of longer-chained carboxylate surfactants can be achieved by
enlarging the size of the polar head. This big polar head hampers crystal formation, increases
the water solubility and decreases thus the TK (27). An elegant way to tune this polar head
size effect consists in using polyethoxylated carboxylate surfactants. The presence of ethylene
oxide groups between the hydrocarbon chain and the polar head significantly decreases the TK
of a carboxylate.
We report here the spontaneous formation of a vesicle phase at room temperature by
simply titrating a diluted aqueous solution of a sodium dodecylethercarboxylate by the
hydrochloric acid HCl. The presence of 6 ethylene oxide groups considerably improves the
surfactant solubility. The Krafft temperature of such a sodium alkylethercarboxylate is much

VIII Carboxylate surfactants
139
lower than that of the corresponding sodium alkylcarboxylate having the same alkyl chain
length. When titrated with HCl, sodium alkylcarboxylate surfactants with different chain
lengths (24) between twelve and eighteen atoms of carbon led to the formation of vesicles.
These vesicular solutions however were unstable at 25°C and precipitated into needle-formed
crystals. In contrast the sodium dodecylethercarboxylate surfactant used in this study, owing
to the presence of oxide ethylene groups, forms vesicles which are stable down to
temperatures below room temperature and opens new perspectives for applications of
spontaneously forming vesicles. It should be noted that this surfactant is easily commercially
available and does not need any purification step. The microstructures present in the
surfactant solutions were probed by Dynamic Light Scattering (DLS), cryo-TEM and freeze-
etching microscopy.
8.1.2.2. Experimental section
Chemicals. Sodium dodecanoate (SD) was provided by Sigma-Aldrich (Germany) at
a purity of 99%. Sodium dodecylethercarboxylate with an average number of 6 ethylene oxide
groups (SDEC1) and 11 ethylene oxide groups (SDEC2) were both gifts from Kao Chemicals
(Germany) and were provided under the trade name of Akypo RLM 45N and Akypo Soft
100NV in aqueous solutions at respectively 80% and 25% of active matter. All surfactants
were used as received.
Preparation of Samples and Phase Diagram. Stock solutions were prepared by
mixing each surfactant at different weight percentages in Millipore water. The solutions of
carboxylate surfactants were then titrated at 25°C with hydrochloric acid HCl 0.1M or 1M
depending on the concentration of the surfactant solution, while pH measurements of the
solution were taken. A phase diagram (Fig. 1) could then be obtained through titration from

VIII Carboxylate surfactants
140
visual observations of the surfactant solutions at 25°C while decreasing pH. The pH
measurements were performed with a standard glass electrode C831 of the firm Consort.
Dynamic Light Scattering Measurements (DLS). So as to avoid dust in the samples
for DLS measurements, all stock solutions were filtered through 0.2μm Millipore membrane
filters prior to experiments. The evolution of the radius of the aggregates (nm) as well as the
intensity of diffused light (Kcount.s-1) of the solutions with decreasing pH were recorded (Fig.
2 and Fig. 3). A Zetasizer Z3000 laser light scattering spectrometer equipped with a Helium-
Neon laser operating at 630nm was used for the DLS experiments. All measurements were
made at a constant scattering angle of 90° and at 25°C.
Krafft temperature determination. The Krafft temperatures of SD, SDEC1 and
SDEC2 were determined at different concentrations ranging from 0.75wt% to 12.4wt% by
turbidity measurements using an automated home-built apparatus (28) designed for the
determination of liquid-liquid and solid-liquid phase transitions, already described in chpater
4. The measured Krafft temperatures correspond to the transition from precipitate to isotropic
solutions.
Cryo-TEM and Freeze-Fracture TEM (FF-TEM). The microstructures of a blue
isotropic sample at 0.25wt% SDEC1 were investigated by cryo-TEM and FF-TEM according
to the process described in chapter 4.
8.1.2.3. Results and discussion
Formation of vesicles by titration of SDEC1
SDEC1 was titrated at room temperature with HCl at different mass ratios between
0.25wt% and 15wt%. From the visual observations made during these titrations, the phase
behaviour of SDEC1 along titration with HCl could be established and is reported in Fig. 3.
The delimitations of the transitions from isotropic to bluish solution and from bluish to white

VIII Carboxylate surfactants
141
turbid solutions are therefore approximative. It should be stressed that bluish solutions could
be observed at concentrations as high as 10wt% surfactant. However, the presence of
aggregates of larger sizes can be accounted for and measured by DLS or microscopy
techniques only at lower concentrations, due to too high particle interactions in more
concentrated areas.
At surfactant concentrations below 10wt% and above pH values of around 5, clear
isotropic colourless solutions could be observed and were identified as micellar solutions of
the carboxylate surfactant. The DLS measurements suggests for these solutions hydrodynamic
radii between 10 and 30 nm, which is typical of the presence of small aggregates such as
micelles. With decreasing pH a progressive transition could be observed from the above-
mentioned colourless solution to a clear isotropic bluish one, which is typical of the presence
of larger aggregates (29). The pH value, at which the transition takes place, is dependent on
the surfactant concentration and lies between pH values of 3.4 and 4.8 for the whole
concentration range studied. With an increasing amount of HCl, a transition from the bluish
solution to a cloudy opalescent solution and precipitation takes place at all concentrations
between 0.25 and 10%. This precipitation is very probably due to a too high amount of
conjugated acid formed with titration. The excess amount of acid is not solubilized anymore
by the carboxylate surfactants and precipitates thus from the solution.
Dynamic light scattering measurements were performed on SDEC1 solutions at
different concentrations along pH (Fig. 4 and Fig. 5) and show evidence of the transition from
small sized aggregates to larger aggregates with decreasing pH. This evidence is further
supported by the diffused intensity curves (Fig. 5). The intensity of light diffused by the
surfactant solutions at pH values above 5 is at all investigated concentrations very low. It
increases strongly when pH decreases and a bluish shade appears in the solutions. At 0.25wt%
of SDEC1, the solution at a pH value of 2.97 and a hydrodynamic radius of about 67nm

VIII Carboxylate surfactants
142
displays a polydispersity index of 0.057 which hints at monodisperse aggregates. This sample
was further examined under an optical microscope and was found to be perfectly
homogeneous. No crystals could be observed in the sample. It should be noticed that DLS
measurements were performed on diluted solutions, since measurements done on more
concentrated solutions (5wt%) gave similar results but owing to stronger interactions between
the aggregates formed, the polydispersity index reached too high values to be relied upon.
At surfactant concentrations above 10%, no isotropic blue solution could be
unambiguously observed. The turbidity of the solutions happened before any isotropic blue
shade could be noticed. The transition from colourless isotropic to turbid solutions could be
observed all the more quickly than the surfactant concentration increased from 10 to 14%.
Figure 3: Binary phase diagram of SDEC1 in water at 25°C along titration with HCl.
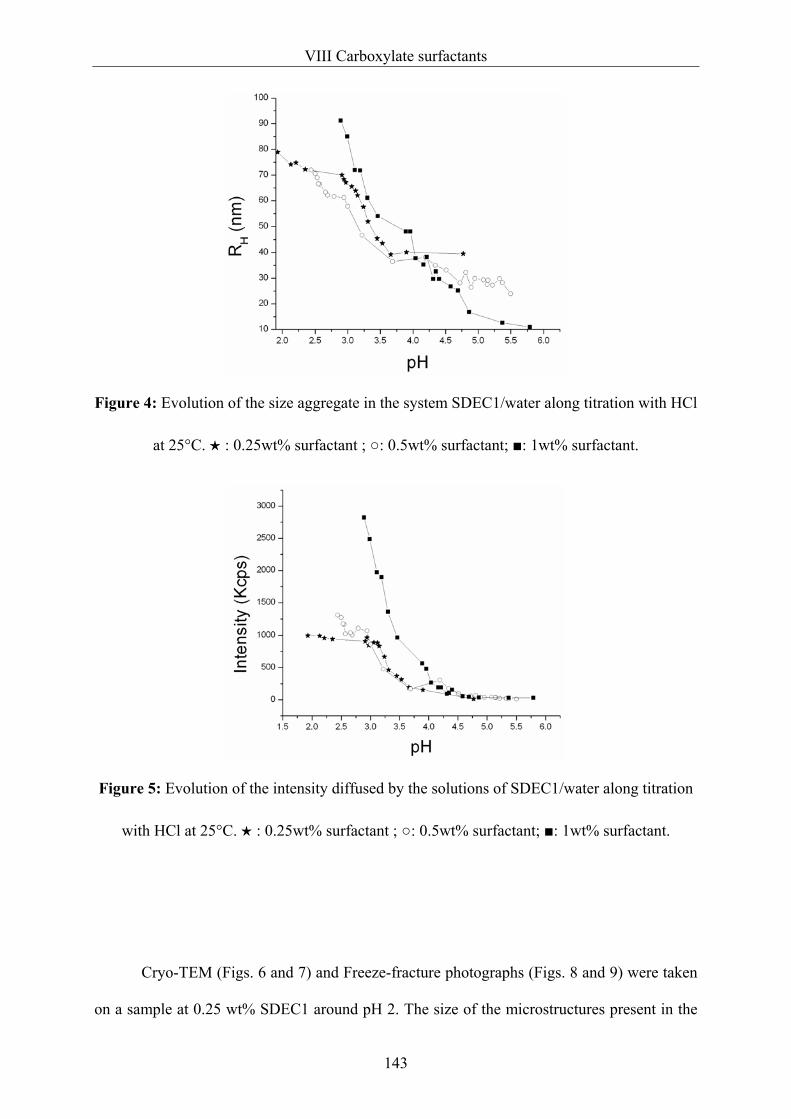
VIII Carboxylate surfactants
143
Figure 4: Evolution of the size aggregate in the system SDEC1/water along titration with HCl
at 25°C. ★ : 0.25wt% surfactant ; ○: 0.5wt% surfactant; ■: 1wt% surfactant.
Figure 5: Evolution of the intensity diffused by the solutions of SDEC1/water along titration
with HCl at 25°C. ★ : 0.25wt% surfactant ; ○: 0.5wt% surfactant; ■: 1wt% surfactant.
Cryo-TEM (Figs. 6 and 7) and Freeze-fracture photographs (Figs. 8 and 9) were taken
on a sample at 0.25 wt% SDEC1 around pH 2. The size of the microstructures present in the

VIII Carboxylate surfactants
144
solution given by Dynamic Light Scattering measurements was 74.8 nm with a polydispersity
index of 0.071. The sample was blue and isotropic. The density of microstructures present in
the photos taken after freeze fracture seems to be much higher than with cryo-TEM. This is
due to the fact that freezing of the sample in cryo-TEM is made on a very thin film and photos
can only be made on the thinnest part of this film with maximum thickness of 1μm. The
largest microstructures are assumed to migrate in the thicker and more diluted part of the film.
Fig. 6 showing a cryo-TEM pictures suggests the presence of unevenly circular
aggregates whose outline appears flexible, since the borders are either orientated forward
(darker border) or backward (border not visible) of the observation plan. In Fig. 7 the
presence of ribbon-like flexible micelles are visible. They seem to be stuck to the vesicles.
This is a hint at the transition from micelles to vesicles through titration with HCl.
Freeze-fracture photographs (Fig. 8 and 9) show the presence of multilamellar vesicles
which are not spherical but oval-shaped.
Figure 6: Cryo-TEM photographs of the system SDEC1/water at 0.25wt% total surfactant
concentration. Presence of flexible, oval-shaped aggregates. The bars represent for the right
hand-side picture 50nm and for the left hand-side 100nm.

VIII Carboxylate surfactants
145
Figure 7: Cryo-TEM photographs of the system SDEC1/water at 0.25wt% total surfactant
concentration. Ribbon-like micelles in equilibrium with vesicles. The bars represent 100nm.

VIII Carboxylate surfactants
146
Figure 8: Freeze-fracture photograph of a multi-layer (onion-like) vesicle for the system
SDEC1/water at 0.25wt% total surfactant concentration. The bar represents 300nm.
Figure 9: Freeze-fracture photograph of a multi-layer (onion-like), oval-shaped vesicle for
the system SDEC1/water at 0.25wt% total surfactant concentration.
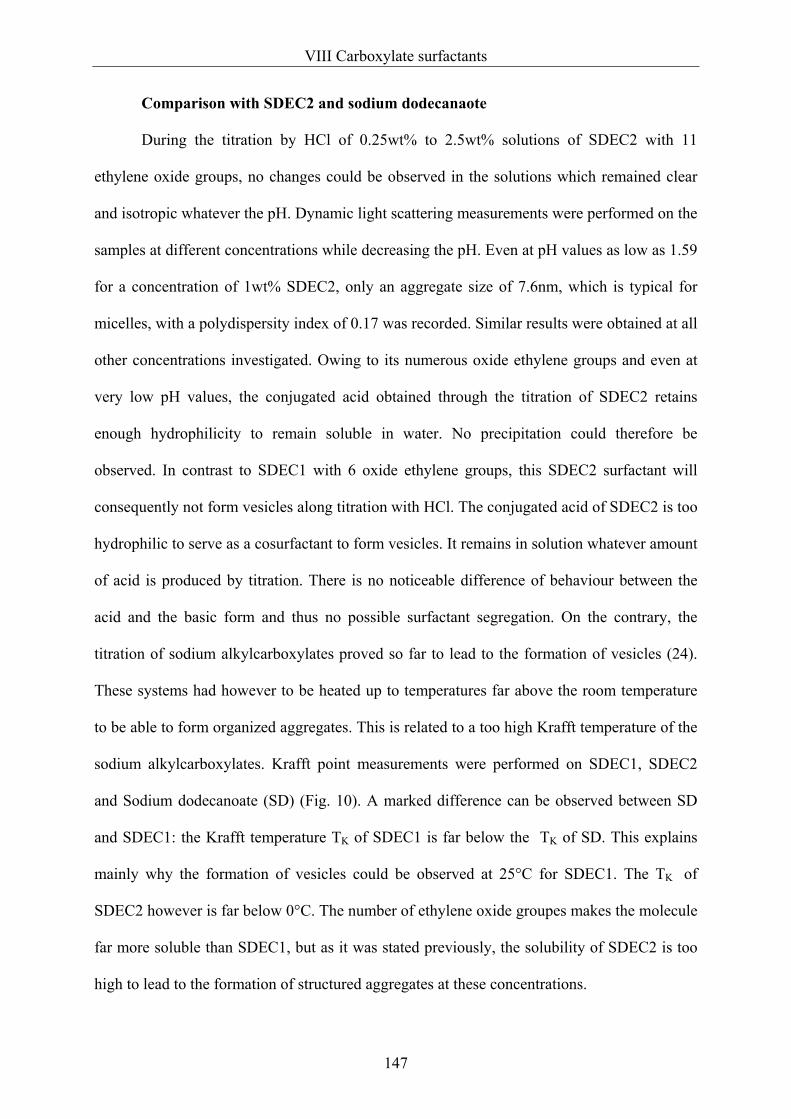
VIII Carboxylate surfactants
147
Comparison with SDEC2 and sodium dodecanaote
During the titration by HCl of 0.25wt% to 2.5wt% solutions of SDEC2 with 11
ethylene oxide groups, no changes could be observed in the solutions which remained clear
and isotropic whatever the pH. Dynamic light scattering measurements were performed on the
samples at different concentrations while decreasing the pH. Even at pH values as low as 1.59
for a concentration of 1wt% SDEC2, only an aggregate size of 7.6nm, which is typical for
micelles, with a polydispersity index of 0.17 was recorded. Similar results were obtained at all
other concentrations investigated. Owing to its numerous oxide ethylene groups and even at
very low pH values, the conjugated acid obtained through the titration of SDEC2 retains
enough hydrophilicity to remain soluble in water. No precipitation could therefore be
observed. In contrast to SDEC1 with 6 oxide ethylene groups, this SDEC2 surfactant will
consequently not form vesicles along titration with HCl. The conjugated acid of SDEC2 is too
hydrophilic to serve as a cosurfactant to form vesicles. It remains in solution whatever amount
of acid is produced by titration. There is no noticeable difference of behaviour between the
acid and the basic form and thus no possible surfactant segregation. On the contrary, the
titration of sodium alkylcarboxylates proved so far to lead to the formation of vesicles (24).
These systems had however to be heated up to temperatures far above the room temperature
to be able to form organized aggregates. This is related to a too high Krafft temperature of the
sodium alkylcarboxylates. Krafft point measurements were performed on SDEC1, SDEC2
and Sodium dodecanoate (SD) (Fig. 10). A marked difference can be observed between SD
and SDEC1: the Krafft temperature TK of SDEC1 is far below the TK of SD. This explains
mainly why the formation of vesicles could be observed at 25°C for SDEC1. The TK of
SDEC2 however is far below 0°C. The number of ethylene oxide groupes makes the molecule
far more soluble than SDEC1, but as it was stated previously, the solubility of SDEC2 is too
high to lead to the formation of structured aggregates at these concentrations.

VIII Carboxylate surfactants
148
Figure 10: Krafft temperatures of SD, SDEC1, SDEC2, at different concentrations.
○: Sodium Dodecanoate; ■: SDEC1.
Similarities with catanionic surfactant systems
The pKa of Sodium Dodecylether Carboxylate 1 (SDEC1) was determined by pH
measurements and evaluated to be 4.67. The resulting phase diagram of SDEC1 in the
mixtures with its conjugated acid and water is represented in Fig. 11 according to the diagram
previously obtained from visual observations along titration of SDEC1 with HCl. The phase
diagram is represented according to the total dry surfactant concentration c in weight percent
and the ratio r of ionised surfactant RCOO-, where r = [|RCOO-]/ ([RCOO-] + [RCOOH]), i.e.
the molar ratio of the surfactant in its ionised form.
At the highest molar ratios (1> r > 0.56) the amount of ionic surfactant in its
carboxylate form is enough to solubilize the conjugated acid formed along HCl titration. At a
surfactant concentration c < 10% and a ratio r < 0.56, the formation of vesicles in equilibrium
with ribbon-like micelles occurs, mainly located in the anionic poor part of the phase diagram.
At the lowest molar ratios (r < 0.32) and at c < 10%, a precipitate zone is observed. The
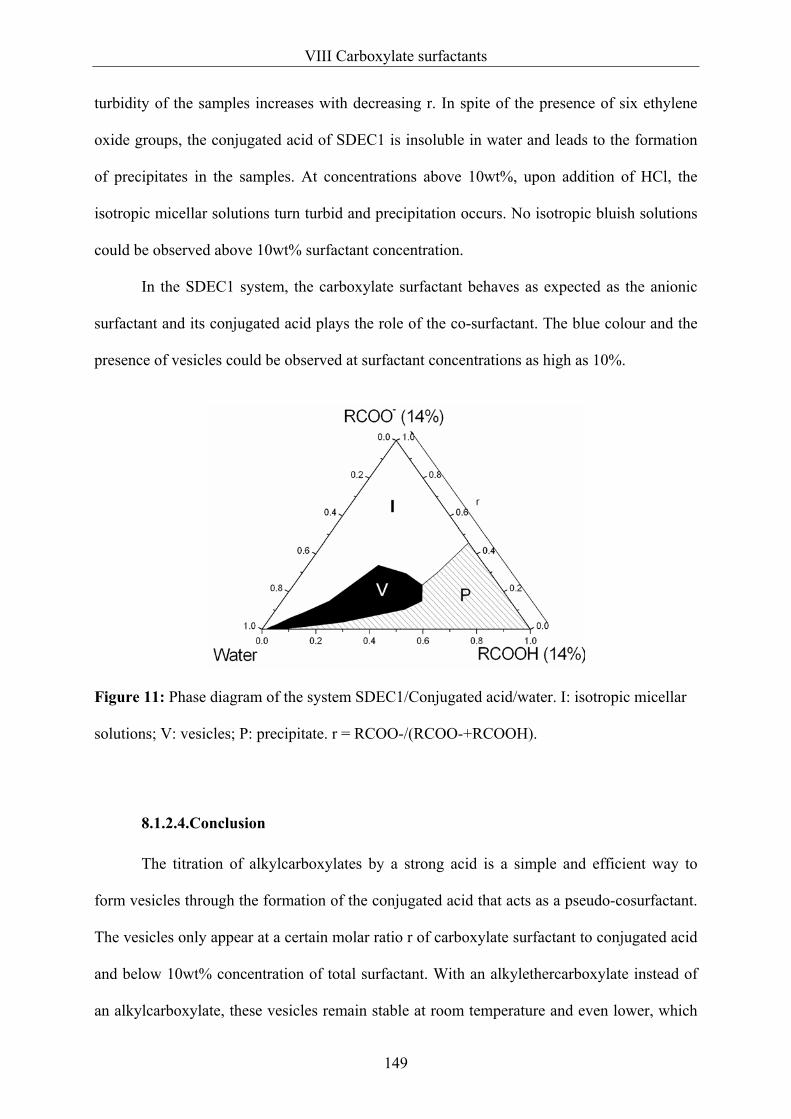
VIII Carboxylate surfactants
149
turbidity of the samples increases with decreasing r. In spite of the presence of six ethylene
oxide groups, the conjugated acid of SDEC1 is insoluble in water and leads to the formation
of precipitates in the samples. At concentrations above 10wt%, upon addition of HCl, the
isotropic micellar solutions turn turbid and precipitation occurs. No isotropic bluish solutions
could be observed above 10wt% surfactant concentration.
In the SDEC1 system, the carboxylate surfactant behaves as expected as the anionic
surfactant and its conjugated acid plays the role of the co-surfactant. The blue colour and the
presence of vesicles could be observed at surfactant concentrations as high as 10%.
Figure 11: Phase diagram of the system SDEC1/Conjugated acid/water. I: isotropic micellar
solutions; V: vesicles; P: precipitate. r = RCOO-/(RCOO-+RCOOH).
8.1.2.4.Conclusion
The titration of alkylcarboxylates by a strong acid is a simple and efficient way to
form vesicles through the formation of the conjugated acid that acts as a pseudo-cosurfactant.
The vesicles only appear at a certain molar ratio r of carboxylate surfactant to conjugated acid
and below 10wt% concentration of total surfactant. With an alkylethercarboxylate instead of
an alkylcarboxylate, these vesicles remain stable at room temperature and even lower, which

VIII Carboxylate surfactants
150
paves the way for useful applications of such systems. What must however be taken into
account is the hydrophily of the carboxylate used, since a too hydrophilic surfactant such as
SDEC2 with 11 ethylene hydroxide groups is too soluble in water to aggregate into finite
structures.
8.2. Alkylcarboxylate surfactants with various counterions8
8.2.1. Phase behaviour of alkylcarboxylate/alkyltrimethylammonium
catanionic surfactant systems
The valency of the counterion of ionic surfactants and the degree of counterion
binding have profound effects on the phase behaviour of ionic surfactants (30). They play a
direct role on the area a occupied by the polar head of the surfactant as well as on the
surfactant solubility in water. For instance, sodium dodecanoate is not soluble in water at
room temperature, its Krafft point at 1wt % being above 30°C. If the sodium counterion is
replaced by another one with a weaker binding to the polar head, such as the
trimethylammonium ion, the polar carboxylate heads of the surfactant are more hydrated.
Therefore the solubility of this surfactant in water is higher.
The aim of this study was thus to replace the sodium counterion of the dodecanoate
surfactant by counterions which bind more weakly than sodium to the polar head of the
dodecanoate. In order to compare the influence of the counterion on the overall phase
topology of the systems, these new surfactants were studied in catanionic systems in mixtures
with dodecyltrimethylammonium bromide.
8 This work was mainly performed by Astrid Drexler during the time of her Diplom-work at the Intitute of Physical and Theoretical Chemistry, University of Regensburg (2005).

VIII Carboxylate surfactants
151
Materials
Alkylcarboxylate surfactants with different counterions were obtained in titrating
lauric acid, Fluka, Germany (99% purity) with different bases in stoechiometric ratios. The
bases used were NaOH, LiOH, CsOH, CholineOH, N(CH3)4OH. Consequently, the different
anionic surfactants used in this study were: Sodium Dodecanoate C11COO- Na+ (SD); Cesium
Dodecanoate C11COO- Cs+ (CsD); Choline Dodecanoate C11COO- +N(CH3)3CH2CH2OH
(ChD); Tetramethylammonium Dodecanoate C11COO- N(CH3)4+ (TAD) and Lithium
Dodecanoate C11COO- Li+. These surfactants were studied within catanionic mixtures with
DTAB. All stock solutions were prepared at concentrations of 1wt% of surfactant in Millipore
water and left to equilibrate overnight at 25°C. The samples were then prepared by vortex-
mixing the stock solutions at the desired ratio. All samples were equilibrated for several
months in a thermostated room at 25°C. Samples were examined under normal light and
between crossed polarizers to determine the topology of the phase diagrams.
Phase diagrams at 25°C
Owing to its too high Krafft temperature (> 100°C), the LiD surfactant could not be
studied in aqueous mixtures with DTAB.
The schematic phase diagrams of the catanionic systems are represented in Fig. 12. The
precision of the areas is ± 10%.

VIII Carboxylate surfactants
152
Figure 12: Schematic phase diagrams of the catanionic systems SD/DTAB;
CsD/DTAB, ChD/DTAB; TAD/DTAB at 25°C. V: vesicle phase; D: two-phase solutions; I-
and I+: micellar solutions.
The change of the dodecanoate counterion from sodium to cesium,
tetramethylammonium or choline caused a shrinking of the precipitate zone in the phase

VIII Carboxylate surfactants
153
diagrams at 25°C. In comparison to SD/DTAB systems, the anionic rich side of the phase
diagrams of the CsD/DTAB, ChD/DTAB and TAD/DTAB systems is constituted by an
isotropic micellar phase. For each of the three new counterions used, the formation of vesicles
in the diluted part of the phase diagrams could be observed and is probably connected to the
lower Krafft temperatures of CsD, ChD and TAD9.
8.2.2. Krafft temperature of the catanionic systems
The Krafft temperatures of these catanionic systems were measured at an overall
surfactant concentration of 1wt% by varying the anionic/cationic surfactant ratio, see Figs. 13,
14 and 15.
The Krafft temperature curves of the catanionic systems CsD/DTAB, ChD/DTAB,
TAD/DTAB present the same overall aspect (Fig. 13). A maximum TK value is obtained
around equimolarity as it was observed with alkylsulfate/cationic systems (see chapter 4).
However, the TK are much lower than those observed for the catanionic systems with the
dodecylsulfate surfactants. This is why no pronounced precipitate zone is observed at 25°C in
the phase diagrams CsD/DTAB, ChD/DTAB, TAD/DTAB (Fig. 12), since the maximum TK
around equimolarity is lower than 11°C.
The Krafft temperatures of the systems SD / alkyltrimethylammonium bromide (C12,
C14 and C16) are represented in Fig. 14. The curves are quite different from the previous
ones. A significant decrease in the Krafft temperature of the SD is observed by adding small
amounts of the cationic surfactant. A striking phenomenon is the precipitation gap (TK < 0°C)
observed for the SD mole ratios around 0.75. To our knowledge this is the first time that such
a phenomenon has been observed in catanionic mixtures.
9 The influence of the TK of the surfactants in catanionic systems has already been connected to the formation of vesicles in chapter 5.
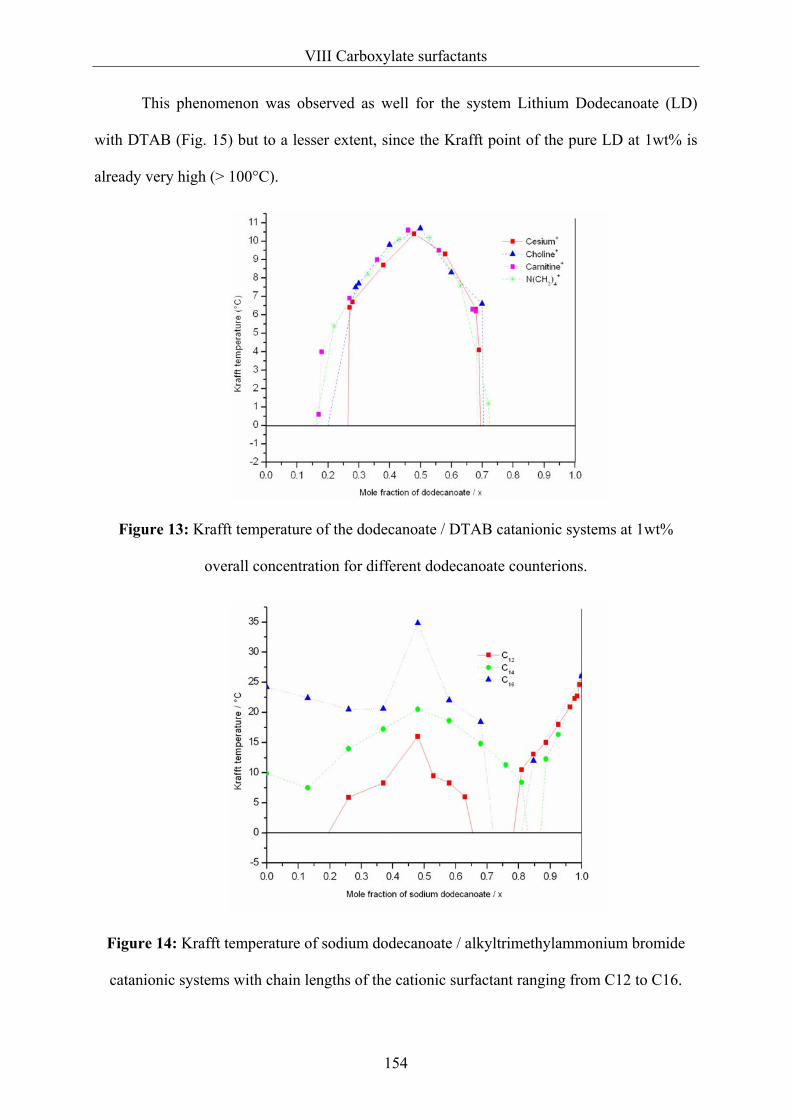
VIII Carboxylate surfactants
154
This phenomenon was observed as well for the system Lithium Dodecanoate (LD)
with DTAB (Fig. 15) but to a lesser extent, since the Krafft point of the pure LD at 1wt% is
already very high (> 100°C).
Figure 13: Krafft temperature of the dodecanoate / DTAB catanionic systems at 1wt%
overall concentration for different dodecanoate counterions.
Figure 14: Krafft temperature of sodium dodecanoate / alkyltrimethylammonium bromide
catanionic systems with chain lengths of the cationic surfactant ranging from C12 to C16.

VIII Carboxylate surfactants
155
Figure 15: Krafft temperature of the lithium and sodium dodecanoate/DTAB systems at
1wt% overall surfactant concentration.
8.2.3. Conclusion
Replacing the sodium counterion of an alkylcarboxylate surfactant by a less bound
counterion, such as cesium or choline, decreases the Krafft temperature of the surfactant.
Consequently the topology of the room temperature phase diagrams of the catanionic system
composed of alkylcarboxylate and DTAB surfactants are strongly dependent on the nature of
the alkylcarboxylate counterion. For counterions with a weaker binding to the carboxylate
polar head, the formation of vesicles can take place in these catanionic systems at 25°C.
Further, even for alkylcarboxylate surfactants with high Krafft points (SD, LD),
certain ratios of a cationic and anionic surfactants can lead to a dramatic decrease of the
Krafft temperature. This ratio corresponds to a strong increase of the solubility of the
catanionic surfactant pair and could be of great advantage in the soap industry for the

VIII Carboxylate surfactants
156
solubilization of the sparingly-soluble alkylcarboxylates e.g. having lithium or sodium as
counterion.

VIII Carboxylate surfactants
157
References
1. Huang, J.-B.; Zhao, G.-X.; He, X.; Zhu, B.-Y.; Fu, H.-L. Chinese Journal of Chemistry,
2000,18, 3,.
2. Regev O., Khan A. Journal of Colloid and Interface Science, 1996, 182, 95-109.
3. Sjöbom M., Edlund H., Langmuir, 2002, 18, 8309-8317.
4. Li X-G., Liu F-M., Colloid and Surfaces, 1995, 96 113-119.
5. Meijer H., Smid J.K. Anionic surfactants, Surfactant Science Series, 56, Chapter 6.
6. Meijer, H. Chemische Industrie, 1988, 4:58-61.
7. Stroink, E. Jahrbuch für den Praktiker, Verlag für chemische Industrie, Augsburg, 1989,
217-219.
8. Meijer, H. SÖFW, 1990,116: 251-257.
9. Felletschin G. Journal of the Society of Cosmetic Chemists, 1964, 15, 245-253.
10. Meijer, H. 1st International Congress on Cosmetics and Houshold Chemicals, Budapest,
1987, 14616.
11. Aalbers, J.G. Lauryl(poly-1-oxapropene oxa ethane) carboxylic acids, Dissertation, 1966,
Drukkerij Wed. G. van Soest N.V., Amsterdam.
12. Kaler E W; Murthy A K; Rodriguez B E; Zasadzinski J A; Science,1989, 245 (4924),
1371-4.
13. M.T. Yatcilla, K.L. Herrington, L.L. Brasher, E.W. Kaler, S. Chiruvolu, J.A. Zasadzinski,
Journal of Physical Chemistry, 1996, 100, 5874.
14. Sornette, D.; Ostrowsky, N. NATO Advanced Study Institutes Series, Series B: Physics,
1981, 73, 351-62.
15. Tsuchida, E.; Sakai, H. Microspheres, Microcapsules & Liposomes, 1999, 2, 463-502.
16. Marques, E.F.; Regev, O.; Khan, A.; Miguel, M.; Lindman, B. Journal of Physical
Chemistry B, 1999, 103 (39), 8353-8363.

VIII Carboxylate surfactants
158
17. Talmon, Y.; Evans, D. F.; Ninham, B. W. Science, 1983, 221 (4615), 1047-8.
18. Regev, O.; Kang, C.; Khan, A. Journal of Physical Chemistry, 1994, 98 (26), 6619-25.
19. Kang, C.; Khan, A. Journal of Colloid and Interface Science, 1993, 156 (1), 218-28.
20. Drobeck, H.P. Current topics on the toxicity of cationic surfactants. Surfactant Science
Series, 1994, 53, 61-94
21. Ninham, B.W.; Evans, D. F. Faraday Discussions of the Chemical Society, 1986, 81 (1),
1-17
22. Israelachvilli, J.N.; Mitchell, D.J.; Ninham, B.W. Journal of the Chemical Society,
Faraday Transactions 2: Molecular and Chemical Physics, 1976, 72 (9), 1525-68.
23. Gradzielski, M.; Bergmeier, M.; Mueller, M.; Hoffmann, H. Journal of Physical
Chemistry B, 1997, 101 (10), 1719-1722.
24. Hargreaves, W.R.; Deamer, D.W. Biochemistry, 1978, 17 (18), 3759-68.
25. Chen, W.-J.; Li, G.-Z.; Zhou, G.-W.; Zhai, L.-M.; Li, Z.-M. Chemical Physics Letters,
2003, 374 (5,6), 482-486.
26. Morigaki, K.; Walde, P.; Misran, M.; Robinson, B.H. Colloids and Surfaces, A:
Physicochemical and Engineering Aspects, 2003, 213 (1), 37-44.
27. Sjoebom, M.B.; Edlund, H.; Lindstroem, B. Langmuir, 1999, 15 (8), 2654-2660.
28. Schroedle, S.; Buchner, R.; Kunz, W. Fluid Phase Equilibria, 2004, 175, 175.
29. Herrington, K.L.; Kaler, E.W.; Miller, D.D.; Zasadzinski, J.A.; Chiruvolu, S. Journal of
Physical Chemistry, 1993, 97 (51), 13792-802.
30. Wennerström, H.; Khan, A.; Lindman, B. Adv ance in Colloid and Interface Science,
1991, 34, 433-448

Conclusion and outlook
CONCLUSION AND OUTLOOK
The aim of this Ph.D. thesis was to study the various parameters which influence the
phase behaviour of catanionic systems in aqueous solutions with a special focus on catanionic
vesicles.
A first step was taken in analysing the Krafft temperature (TK) of catanionic systems
when the anionic is an alkylsulfate surfactant and the cationic a quaternary ammonium. The
influence on the anionic / cationic surfactant ratio, the type of counterion, the size of the polar
head, the presence of ethylene oxides (EO) in the polar head as well as the chain lengths of
the surfactants were investigated. There appeared to be a direct correlation between the TK of
the pure surfactants and the extent of the vesicle and of the precipitate zone which could be
summed up as follows: the lower the TK of the pure surfactants was, the more extended the
vesicle zone and the narrower the precipitate zone. The best results, i.e. the largest vesicle
zones, were obtained, even at temperatures lower than 25°C, when EO groups were present in
the polar head of the anionic surfactant.
Different ways to obtain vesicles from the usual mixing of a cationic and an anionic
surfactant at a chosen ratio were then investigated. The direct transition from micelles to
vesicles by simple dilution with water could be observed. This phenomenon presents a major
interest for further applications. It constitutes an easy way to encapsulate drugs, since they can
be solubilized in the micellar solution and encapsulated in the vesicle afterwards by simple
dilution of the solution with water.
The addition of salts to mixed micelles composed of sodium dodecylsulfate (SDS) and
dodecyltrimethylammonium bromide (DTAB) is another way to induce a direct transition
from micelles to vesicles. Addition of salts to ionic surfactants contributes to screen the
charge of the surfactants and thus to decrease the area a occupied by the polar head of the
surfactants. Consequently the packing parameter ν/al increases with salt addition up to a value
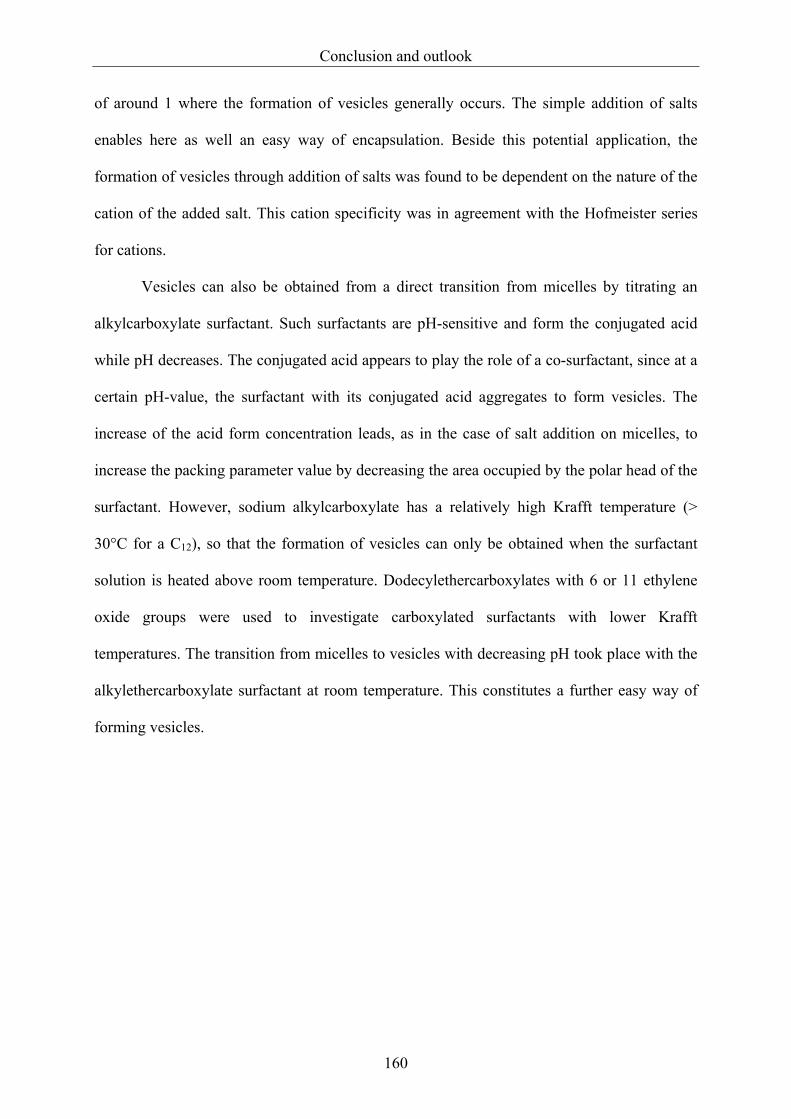
Conclusion and outlook
160
of around 1 where the formation of vesicles generally occurs. The simple addition of salts
enables here as well an easy way of encapsulation. Beside this potential application, the
formation of vesicles through addition of salts was found to be dependent on the nature of the
cation of the added salt. This cation specificity was in agreement with the Hofmeister series
for cations.
Vesicles can also be obtained from a direct transition from micelles by titrating an
alkylcarboxylate surfactant. Such surfactants are pH-sensitive and form the conjugated acid
while pH decreases. The conjugated acid appears to play the role of a co-surfactant, since at a
certain pH-value, the surfactant with its conjugated acid aggregates to form vesicles. The
increase of the acid form concentration leads, as in the case of salt addition on micelles, to
increase the packing parameter value by decreasing the area occupied by the polar head of the
surfactant. However, sodium alkylcarboxylate has a relatively high Krafft temperature (>
30°C for a C12), so that the formation of vesicles can only be obtained when the surfactant
solution is heated above room temperature. Dodecylethercarboxylates with 6 or 11 ethylene
oxide groups were used to investigate carboxylated surfactants with lower Krafft
temperatures. The transition from micelles to vesicles with decreasing pH took place with the
alkylethercarboxylate surfactant at room temperature. This constitutes a further easy way of
forming vesicles.