Synthesis and Biological Evaluation of Novel Folic Acid ...
21
Synthesis and Biological Evaluation of Novel Folic Acid Receptor-Targeted, #-Cyclodextrin-Based Drug Complexes for Cancer Treatment Author Yin, Juan-Juan, Sharma, Sonali, Shumyak, Stepan P, Wang, Zhi-Xin, Zhou, Zhi-Wei, Zhang, Yangde, Guo, Peixuan, Li, Chen-Zhong, Kanwar, Jagat R, Yang, Tianxin, Mohapatra, Shyam S, Liu, Wanqing, Duan, Wei, Wang, Jian-Cheng, Li, Qi, Zhang, Xueji, Tan, Jun, Jia, Lee, Liang, Jun, Wei, Ming Q, Li, Xiaotian, Zhou, Shu-Feng Published 2013 Journal Title PloS One DOI https://doi.org/10.1371/journal.pone.0062289 Copyright Statement © 2013 Yin et al. This is an Open Access article distributed under the terms of the Creative Commons Attribution License CCAL. (http://www.plos.org/journals/license.html) Downloaded from http://hdl.handle.net/10072/54761 Griffith Research Online https://research-repository.griffith.edu.au
Transcript of Synthesis and Biological Evaluation of Novel Folic Acid ...
Synthesis and Biological Evaluation of Novel Folic AcidReceptor-Targeted, #-Cyclodextrin-Based Drug Complexesfor Cancer Treatment
Author
Yin, Juan-Juan, Sharma, Sonali, Shumyak, Stepan P, Wang, Zhi-Xin, Zhou, Zhi-Wei, Zhang,Yangde, Guo, Peixuan, Li, Chen-Zhong, Kanwar, Jagat R, Yang, Tianxin, Mohapatra, ShyamS, Liu, Wanqing, Duan, Wei, Wang, Jian-Cheng, Li, Qi, Zhang, Xueji, Tan, Jun, Jia, Lee, Liang,Jun, Wei, Ming Q, Li, Xiaotian, Zhou, Shu-Feng
Published
2013
Journal Title
PloS One
DOI
https://doi.org/10.1371/journal.pone.0062289
Copyright Statement
© 2013 Yin et al. This is an Open Access article distributed under the terms of the CreativeCommons Attribution License CCAL. (http://www.plos.org/journals/license.html)
Downloaded from
http://hdl.handle.net/10072/54761
Griffith Research Online
https://research-repository.griffith.edu.au
Synthesis and Biological Evaluation of Novel Folic AcidReceptor-Targeted, b-Cyclodextrin-Based DrugComplexes for Cancer TreatmentJuan-Juan Yin1, Sonali Sharma1, Stepan P. Shumyak1, Zhi-Xin Wang1, Zhi-Wei Zhou1, Yangde Zhang2,
Peixuan Guo3, Chen-Zhong Li4, Jagat R. Kanwar5, Tianxin Yang6, Shyam S. Mohapatra7, Wanqing Liu8,
Wei Duan9, Jian-Cheng Wang10, Qi Li11, Xueji Zhang12, Jun Tan13,14,15, Lee Jia16, Jun Liang1,
Ming Q. Wei17, Xiaotian Li18, Shu-Feng Zhou1*
1 Department of Pharmaceutical Sciences, College of Pharmacy, University of South Florida, Tampa, Florida, United States of America, 2 National Hepatobiliary and Enteric
Surgery Research Center, Xiangya Hospital, Central South University, Changsha, Hunan, China, 3 Nanobiotechnology Center and Markey Cancer Center, College of
Pharmacy, University of Kentucky, Lexington, Kentucky, United States of America, 4 Nanobioengineering and Bioelectronics Laboratory, Department of Biomedical
Engineering, Florida International University, Miami, Florida, United States of America, 5 Nanomedicine-Laboratory of Immunology and Molecular Biomedical Research
(LIMBR), Centre for Biotechnology and Interdisciplinary Biosciences and Institute for Frontier Materials (IFM), Deakin University, Waurn Ponds, Victoria, Australia,
6 Department of Internal Medicine, University of Utah and Salt Lake Veterans Affairs Medical Center, Salt Lake City, Utah, United States of America, 7 Nanomedicine
Research Center and Division of Translational Medicine, Department of Internal Medicine, Morsani College of Medicine, University of South Florida, Tampa, Florida, United
States of America, 8 Department of Medicinal Chemistry and Molecular Pharmacology, College of Pharmacy, Purdue University, West Lafayette, Indiana, United States of
America, 9 School of Medicine, Deakin University, Waurn Ponds, Victoria, Australia, 10 State Key Laboratory of Natural and Biomimetic Drugs, School of Pharmaceutical
Science, Peking University, Beijing, China, 11 Department of Oncology, Shuguang Hospital (Western Campus), Shanghai University of Traditional Chinese Medicine,
Shanghai, China, 12 Research Center for Bioengineering and Sensing Technology, University of Science and Technology Beijing, Beijing, China, 13 James A. Haley
Veterans’ Administration Hospital, Tampa, Florida, United States of America, 14 Department of Neurosurgery and Brain Repair, Center of Excellence for Aging and Brain
Repair, Morsani College of Medicine, University of South Florida, Tampa, Florida, United States of America, 15 Department of Psychiatry and Behavioral Neurosciences,
Silver Child Development Center, Rashid Laboratory for Developmental Neurobiology, Morsani College of Medicine, University of South Florida, Tampa, Florida, United
States of America, 16 Cancer Metastasis Alert and Prevention Center, College of Chemistry and Chemical Engineering, Fuzhou University, Fuzhou, China, 17 School of
Medical Science, Division of Molecular and Gene Therapies, Griffith Health Institute, Griffith University, Gold Coast Campus, Australia, 18 Obstetrics and Gynecology
Hospital and Institute of Biomedicine, Fudan University, Shanghai, China
Abstract
Drug targeting is an active area of research and nano-scaled drug delivery systems hold tremendous potential for thetreatment of neoplasms. In this study, a novel cyclodextrin (CD)-based nanoparticle drug delivery system has beenassembled and characterized for the therapy of folate receptor-positive [FR(+)] cancer. Water-soluble folic acid (FA)-conjugated CD carriers (FACDs) were successfully synthesized and their structures were confirmed by 1D/2D nuclearmagnetic resonance (NMR), matrix-assisted laser desorption ionization time-of-flight mass spectrometer (MALDI-TOF-MS),high performance liquid chromatography (HPLC), Fourier transform infrared spectroscopy (FTIR), and circular dichroism.Drug complexes of adamatane (Ada) and cytotoxic doxorubicin (Dox) with FACD were readily obtained by mixed solventprecipitation. The average size of FACD-Ada-Dox was 1.5–2.5 nm. The host-guest association constant Ka was 1,639 M21 asdetermined by induced circular dichroism and the hydrophilicity of the FACDs was greatly enhanced compared tounmodified CD. Cellular uptake and FR binding competitive experiments demonstrated an efficient and preferentiallytargeted delivery of Dox into FR-positive tumor cells and a sustained drug release profile was seen in vitro. The delivery ofDox into FR(+) cancer cells via endocytosis was observed by confocal microscopy and drug uptake of the targetednanoparticles was 8-fold greater than that of non-targeted drug complexes. Our docking results suggest that FA, FACD andFACD-Ada-Dox could bind human hedgehog interacting protein that contains a FR domain. Mouse cardiomyocytes as wellas fibroblast treated with FACD-Ada-Dox had significantly lower levels of reactive oxygen species, with increased content ofglutathione and glutathione peroxidase activity, indicating a reduced potential for Dox-induced cardiotoxicity. These resultsindicate that the targeted drug complex possesses high drug association and sustained drug release properties with goodbiocompatibility and physiological stability. The novel FA-conjugated b-CD based drug complex might be promising as ananti-tumor treatment for FR(+) cancer.
Citation: Yin J-J, Sharma S, Shumyak SP, Wang Z-X, Zhou Z-W, et al. (2013) Synthesis and Biological Evaluation of Novel Folic Acid Receptor-Targeted, b-Cyclodextrin-Based Drug Complexes for Cancer Treatment. PLoS ONE 8(5): e62289. doi:10.1371/journal.pone.0062289
Editor: Caterina Cinti, Institute of Clinical Physiology, c/o Toscana Life Sciences Foundation, Italy
Received December 6, 2012; Accepted March 19, 2013; Published May 2, 2013
Copyright: � 2013 Yin et al. This is an open-access article distributed under the terms of the Creative Commons Attribution License, which permits unrestricteduse, distribution, and reproduction in any medium, provided the original author and source are credited.
Funding: Dr JJY is supported by a postdoctoral scholarship from the College of Pharmacy, University of South Florida, 12901 Bruce B Downs Blvd., Tampa,Florida. The funders had no role in study design, data collection and analysis, decision to publish, or preparation of the manuscript.
Competing Interests: The authors have declared that no competing interests exist.
* E-mail: [email protected]
PLOS ONE | www.plosone.org 1 May 2013 | Volume 8 | Issue 5 | e62289
Introduction
Cancer is a leading killer of human beings worldwide,
accounting for 7.6 million deaths (around 13% of all deaths) in
2008 [1]. Overall, an estimated 12.7 million new cancer cases and
7.6 million cancer deaths occurred in 2008, with 56% of new
cancer cases and 63% of the cancer deaths occurring in the less
developed regions of the world [2]. The most commonly
diagnosed cancers worldwide are lung (1.61 million, 12.7% of
the total), breast (1.38 million, 10.9%) and colorectal cancers (1.23
million, 9.7%). Novel, safe and effective treatments are clearly and
urgently needed to curtail these high mortality statistics. The four
major modules of cancer treatment include surgery, radiation,
chemotherapy and immunotherapy [3]. However, these therapies
are only successful when the cancer is detected at an early stage, or
limited to certain types of cancer (e.g., leukemia). Due to the
inability of detecting cancer at an early stage, most patients present
in the advanced stage with extensive local infiltration and
metastasis. For advanced tumors, in particular those tumors
developed from epithelial tissues such as lung, colon, breast,
prostate and pancreas, these therapies are less successful.
Chemotherapy represents one of the major means for cancer
treatment, which aims to kill tumor cells or to inhibit their
proliferation while preserving the normal cells in the body [3].
Chemotherapeutic agents generally have a narrow margin of
safety, and are used in combination usually given at a maximum
tolerated dose to achieve maximum cancer cell killing [4]. They
kill tumor cells by direct cytotoxicity, or activating host immune
response, inhibiting the proliferation processes of tumor cells, and
inducing apoptosis [5]. However, most patients do not respond to
these drugs and they often experience severe adverse effects such
as severe diarrhea and loss of hairs. The primary reason for this is
because the drug kills both normal and tumor cells due to low drug
selectivity and drug levels within tumor cells are too low. Drug
resistance and dose-limiting toxicities are the major problems for
the success of cancer chemotherapy [6]. In the past decade, nano-
scaled, targeted drug delivery has attracted much attention as a
means to improve the curative effect of existing chemotherapeutic
agents while reducing their adverse effects [7,8]. Recent dramatic
developments in nanotechnology have created a myriad of
anticancer nano-drugs; however, most current nano-drug systems
fall short in ease of purification, reproducibility and batch-to-batch
consistency [9,10]. The preparation and characterization of nano-
drug formulations especially for aqueous drug complexes remains
a major challenge.
The anthracycline glycoside antibiotic, doxorubicin (Dox), is a
potent, broad-spectrum anticancer agent that acts by intercalating
within DNA and inhibiting DNA synthesis [11]. Dox is often used
to treat some leukemias and Hodgkin’s lymphoma, as well as
cancers of the bladder, breast, stomach, lung, ovaries, thyroid, and
soft tissue sarcoma. At the usual chemotherapeutic doses, Dox is
cardiotoxic and it may also increase the risk of leukemia especially
when it is given at high doses or together with certain other
chemotherapeutic agents or radiation therapy [11–16].
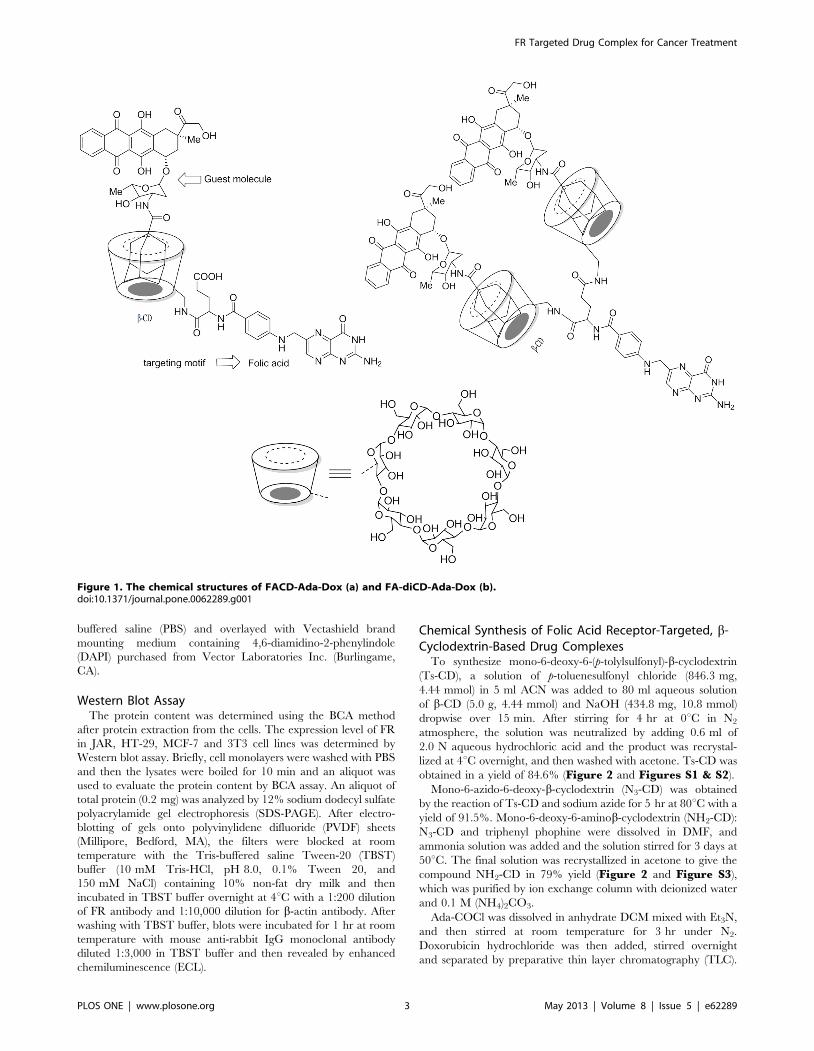
The aim of this report is to present a method for synthesizing a
novel and effective drug complex for targeted drug delivery
(Figure 1). Combining targeting molecules, drug carriers and
cytotoxic agents into a complex should guarantee the stability of
the conjugate in circulation and insure cleavability to release the
drug. The b-CD was vectorized with folic acid (FA) to target folate
receptors (FRs) on the tumor cell surface. Dox-containing FR-
targeting b-CDs were synthesized by a multi-step reaction in
which a- and c-amide monomers as well as the di-CD substituted
FA carrier were purified and fully characterized by a panel of
spectral techniques. The in vitro drug release profile was
determined by dialysis and fluorescence measurement, and
targeted drug binding in vitro was quantitated by flow cytometry
and confocal microscopy. The cytotoxicity of the different drug
complexes was measured and the biomarkers related to free Dox-
induced cardiotoxicity were also examined at the cellular level.
Materials and Methods
Chemicals and Reagentsb-Cyclodextrin hydrate and cerim (IV) sulphate tetrahydrate
were purchased from Acros Organics (Thermo Fisher Scientific,
Waltham, MA). Ammonium molybdate (para) tetrahydrate was
purchased from Alfa Aesar Inc. (Ward Hill, MA). p-Toluenesulfonyl
chloride, N, N’-dicyclohexyl-carbodiimide (DCC), folic acid (FA), N-
hydroxysuccinimide (NHS), doxorubicin hydrochloride, 1-adaman-
tanecarbonyl chloride, ammonium bicarbonate, sodium azide,
triphenylphosphine, 29, 79-dichlorofluorescein diacetate (DCFH-
DA), 5, 59-dithiobis(2-nitrobenzoic acid) (DTNB), reduced gluta-
thione (GSH), hydrogen peroxide, potassium hydroxide, sodium
hydroxide, phosphoric acid, ammonia hydroxide, ninhydrin,
hydrochloric acid, iodine, sulfuric acid, acetic acid, deuterium
oxide, chloroform-d, dimethyl sulfoxide-d6, and CM sephadex C25
were all purchased from Sigma-Aldrich Chemicals Co. (St. Louis,
MO). Paraformaldehyde was obtained from EMD Chemicals Inc.
(Gibbstown, NJ). The bicinchoninic acid (BCA) assay kit was
purchased from Pierce (Rockford, IL). CM-H2DCFDA was
purchased from Invitrogen (Carlsbad, CA). The Pro-prep (TM)
Protein extraction kit was purchased from iNtRon Biotechnology
Inc. (Kyungki-Do, Korea). The glutathione peroxidase (GPx) assay
kit was obtained from BioVision Inc. (Milpitas, CA). Spectra/Por
dialysis membrane with a molecular weight cutoff of 3,000 Da was
purchased from Spectrum Laboratories (Rancho Dominguez, CA).
All solvents for chromatographic isolation were of analytical grade.
HPLC-grade acetone, butanol, acetonitrile (ACN), ethyl acetate
(EtOAc), hexane, methanol, 1-propanol (1-PA), 2-propanol,
dichloromethane (DCM), pyridine, dimethylformamide (DMF),
dimethyl sulfoxide (DMSO) and thin layer chromatography plates
(1,000 mm and 200 mm) were purchased from Fisher Scientific Co.
(Fair lawn, NJ). Heat-inactivated fetal bovine serum, fetal bovine
serum, and newborn calf serum were purchased from Hyclone
Laboratories Inc. (Logan, UT). FR and b-actin antibody were
purchased from Santa Cruz Biotechnology (Santa Cruz, CA). HRP
mouse anti-rabbit IgG monoclonal antibody was purchased from
ProSci Inc. (San Diego, CA). Pierce ECL western blotting substrate
was purchased from Thermo Fisher Scientific Inc. (Waltham, MA).
Cells and Cell CultureJEG-3 and JAR (both derived from human placenta choriocar-
cinoma), HT-29 (human colon cancer), MCF-7 (human breast
cancer), H9C2(2-1) cells (mouse cardiomyocytes) and 3T3 (mouse
fibroblast) cell lines were purchased from American Type Culture
Collection (ATCC, Rockville, MD). JEG-3 cells were cultured in
Dulbecco’s modified Eagle medium (DMEM) with 10% newborn
calf serum; JAR and MCF-7 cells were cultured in RPMI-1640
with 10% newborn calf serum; HT-29 cells were cultured in
McCoy’s 5A with 10% newborn calf serum; and 3T3 cells were
cultured in DMEM with 10% fetal calf serum. All cell lines were
incubated in 5% CO2 and 90–100% relative humidity at 37uC.
Medium renewal was carried out 2–3 times per week, and cells
were subcultured when they achieved 80–90% confluence. For
slide preparation, 26104 cells were plated on 0.7 cm60.7 cm
Nunc brand chamber slides from Thermo Fisher Scientific
(Waltham, MA). Cells were washed three times in phosphate-
FR Targeted Drug Complex for Cancer Treatment
PLOS ONE | www.plosone.org 2 May 2013 | Volume 8 | Issue 5 | e62289
buffered saline (PBS) and overlayed with Vectashield brand
mounting medium containing 4,6-diamidino-2-phenylindole
(DAPI) purchased from Vector Laboratories Inc. (Burlingame,
CA).
Western Blot AssayThe protein content was determined using the BCA method
after protein extraction from the cells. The expression level of FR
in JAR, HT-29, MCF-7 and 3T3 cell lines was determined by
Western blot assay. Briefly, cell monolayers were washed with PBS
and then the lysates were boiled for 10 min and an aliquot was
used to evaluate the protein content by BCA assay. An aliquot of
total protein (0.2 mg) was analyzed by 12% sodium dodecyl sulfate
polyacrylamide gel electrophoresis (SDS-PAGE). After electro-
blotting of gels onto polyvinylidene difluoride (PVDF) sheets
(Millipore, Bedford, MA), the filters were blocked at room
temperature with the Tris-buffered saline Tween-20 (TBST)
buffer (10 mM Tris-HCl, pH 8.0, 0.1% Tween 20, and
150 mM NaCl) containing 10% non-fat dry milk and then
incubated in TBST buffer overnight at 4uC with a 1:200 dilution
of FR antibody and 1:10,000 dilution for b-actin antibody. After
washing with TBST buffer, blots were incubated for 1 hr at room
temperature with mouse anti-rabbit IgG monoclonal antibody
diluted 1:3,000 in TBST buffer and then revealed by enhanced
chemiluminescence (ECL).
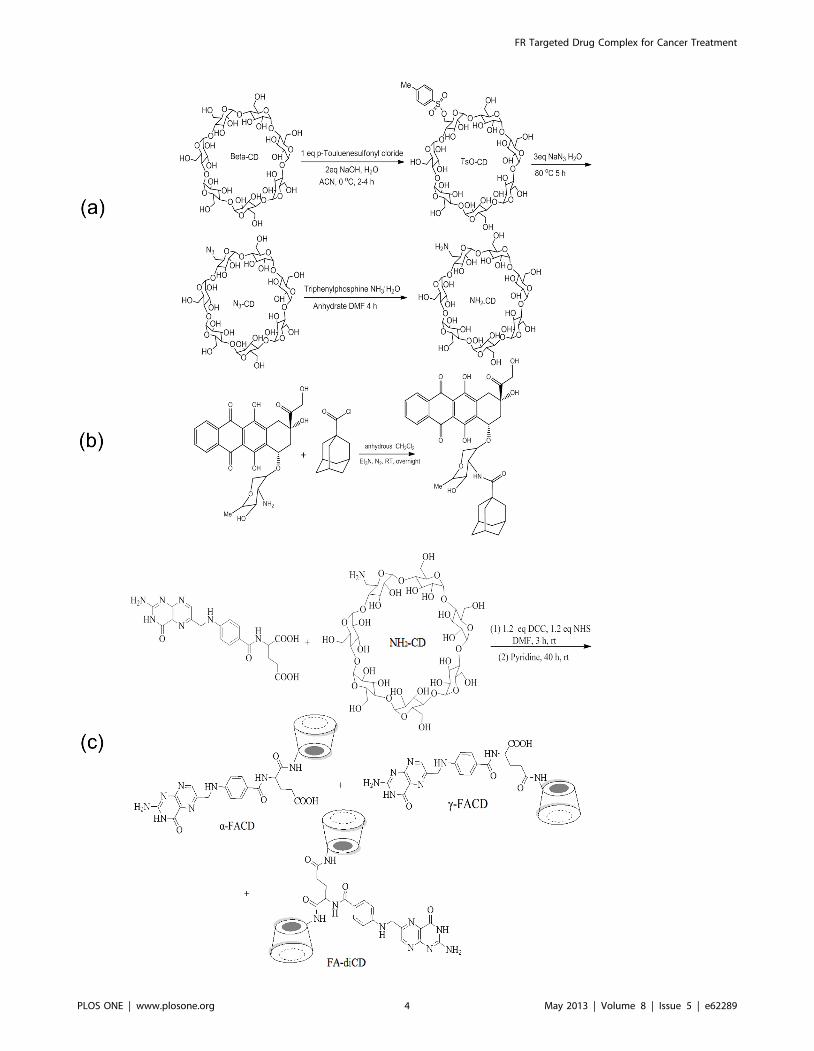
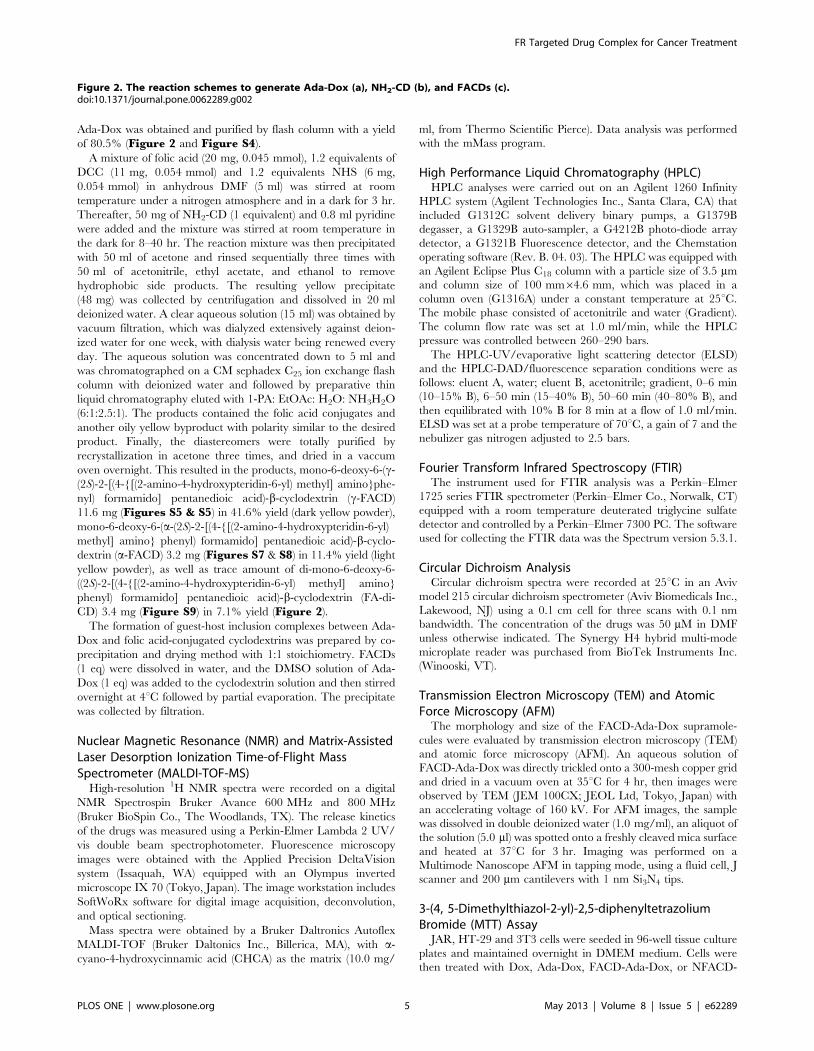
Chemical Synthesis of Folic Acid Receptor-Targeted, b-Cyclodextrin-Based Drug Complexes
To synthesize mono-6-deoxy-6-(p-tolylsulfonyl)-b-cyclodextrin
(Ts-CD), a solution of p-toluenesulfonyl chloride (846.3 mg,
4.44 mmol) in 5 ml ACN was added to 80 ml aqueous solution
of b-CD (5.0 g, 4.44 mmol) and NaOH (434.8 mg, 10.8 mmol)
dropwise over 15 min. After stirring for 4 hr at 0uC in N2
atmosphere, the solution was neutralized by adding 0.6 ml of
2.0 N aqueous hydrochloric acid and the product was recrystal-
lized at 4uC overnight, and then washed with acetone. Ts-CD was
obtained in a yield of 84.6% (Figure 2 and Figures S1 & S2).
Mono-6-azido-6-deoxy-b-cyclodextrin (N3-CD) was obtained
by the reaction of Ts-CD and sodium azide for 5 hr at 80uC with a
yield of 91.5%. Mono-6-deoxy-6-aminob-cyclodextrin (NH2-CD):
N3-CD and triphenyl phophine were dissolved in DMF, and
ammonia solution was added and the solution stirred for 3 days at
50uC. The final solution was recrystallized in acetone to give the
compound NH2-CD in 79% yield (Figure 2 and Figure S3),
which was purified by ion exchange column with deionized water
and 0.1 M (NH4)2CO3.
Ada-COCl was dissolved in anhydrate DCM mixed with Et3N,
and then stirred at room temperature for 3 hr under N2.
Doxorubicin hydrochloride was then added, stirred overnight
and separated by preparative thin layer chromatography (TLC).
Figure 1. The chemical structures of FACD-Ada-Dox (a) and FA-diCD-Ada-Dox (b).doi:10.1371/journal.pone.0062289.g001
FR Targeted Drug Complex for Cancer Treatment
PLOS ONE | www.plosone.org 3 May 2013 | Volume 8 | Issue 5 | e62289
FR Targeted Drug Complex for Cancer Treatment
PLOS ONE | www.plosone.org 4 May 2013 | Volume 8 | Issue 5 | e62289
Ada-Dox was obtained and purified by flash column with a yield
of 80.5% (Figure 2 and Figure S4).
A mixture of folic acid (20 mg, 0.045 mmol), 1.2 equivalents of
DCC (11 mg, 0.054 mmol) and 1.2 equivalents NHS (6 mg,
0.054 mmol) in anhydrous DMF (5 ml) was stirred at room
temperature under a nitrogen atmosphere and in a dark for 3 hr.
Thereafter, 50 mg of NH2-CD (1 equivalent) and 0.8 ml pyridine
were added and the mixture was stirred at room temperature in
the dark for 8–40 hr. The reaction mixture was then precipitated
with 50 ml of acetone and rinsed sequentially three times with
50 ml of acetonitrile, ethyl acetate, and ethanol to remove
hydrophobic side products. The resulting yellow precipitate
(48 mg) was collected by centrifugation and dissolved in 20 ml
deionized water. A clear aqueous solution (15 ml) was obtained by
vacuum filtration, which was dialyzed extensively against deion-
ized water for one week, with dialysis water being renewed every
day. The aqueous solution was concentrated down to 5 ml and
was chromatographed on a CM sephadex C25 ion exchange flash
column with deionized water and followed by preparative thin
liquid chromatography eluted with 1-PA: EtOAc: H2O: NH3H2O
(6:1:2.5:1). The products contained the folic acid conjugates and
another oily yellow byproduct with polarity similar to the desired
product. Finally, the diastereomers were totally purified by
recrystallization in acetone three times, and dried in a vaccum
oven overnight. This resulted in the products, mono-6-deoxy-6-(c-
(2S)-2-[(4-{[(2-amino-4-hydroxypteridin-6-yl) methyl] amino}phe-
nyl) formamido] pentanedioic acid)-b-cyclodextrin (c-FACD)
11.6 mg (Figures S5 & S5) in 41.6% yield (dark yellow powder),
mono-6-deoxy-6-(a-(2S)-2-[(4-{[(2-amino-4-hydroxypteridin-6-yl)
methyl] amino} phenyl) formamido] pentanedioic acid)-b-cyclo-
dextrin (a-FACD) 3.2 mg (Figures S7 & S8) in 11.4% yield (light
yellow powder), as well as trace amount of di-mono-6-deoxy-6-
((2S)-2-[(4-{[(2-amino-4-hydroxypteridin-6-yl) methyl] amino}
phenyl) formamido] pentanedioic acid)-b-cyclodextrin (FA-di-
CD) 3.4 mg (Figure S9) in 7.1% yield (Figure 2).
The formation of guest-host inclusion complexes between Ada-
Dox and folic acid-conjugated cyclodextrins was prepared by co-
precipitation and drying method with 1:1 stoichiometry. FACDs
(1 eq) were dissolved in water, and the DMSO solution of Ada-
Dox (1 eq) was added to the cyclodextrin solution and then stirred
overnight at 4uC followed by partial evaporation. The precipitate
was collected by filtration.
Nuclear Magnetic Resonance (NMR) and Matrix-AssistedLaser Desorption Ionization Time-of-Flight MassSpectrometer (MALDI-TOF-MS)
High-resolution 1H NMR spectra were recorded on a digital
NMR Spectrospin Bruker Avance 600 MHz and 800 MHz
(Bruker BioSpin Co., The Woodlands, TX). The release kinetics
of the drugs was measured using a Perkin-Elmer Lambda 2 UV/
vis double beam spectrophotometer. Fluorescence microscopy
images were obtained with the Applied Precision DeltaVision
system (Issaquah, WA) equipped with an Olympus inverted
microscope IX 70 (Tokyo, Japan). The image workstation includes
SoftWoRx software for digital image acquisition, deconvolution,
and optical sectioning.
Mass spectra were obtained by a Bruker Daltronics Autoflex
MALDI-TOF (Bruker Daltonics Inc., Billerica, MA), with a-
cyano-4-hydroxycinnamic acid (CHCA) as the matrix (10.0 mg/
ml, from Thermo Scientific Pierce). Data analysis was performed
with the mMass program.
High Performance Liquid Chromatography (HPLC)HPLC analyses were carried out on an Agilent 1260 Infinity
HPLC system (Agilent Technologies Inc., Santa Clara, CA) that
included G1312C solvent delivery binary pumps, a G1379B
degasser, a G1329B auto-sampler, a G4212B photo-diode array
detector, a G1321B Fluorescence detector, and the Chemstation
operating software (Rev. B. 04. 03). The HPLC was equipped with
an Agilent Eclipse Plus C18 column with a particle size of 3.5 mm
and column size of 100 mm64.6 mm, which was placed in a
column oven (G1316A) under a constant temperature at 25uC.
The mobile phase consisted of acetonitrile and water (Gradient).
The column flow rate was set at 1.0 ml/min, while the HPLC
pressure was controlled between 260–290 bars.
The HPLC-UV/evaporative light scattering detector (ELSD)
and the HPLC-DAD/fluorescence separation conditions were as
follows: eluent A, water; eluent B, acetonitrile; gradient, 0–6 min
(10–15% B), 6–50 min (15–40% B), 50–60 min (40–80% B), and
then equilibrated with 10% B for 8 min at a flow of 1.0 ml/min.
ELSD was set at a probe temperature of 70uC, a gain of 7 and the
nebulizer gas nitrogen adjusted to 2.5 bars.
Fourier Transform Infrared Spectroscopy (FTIR)The instrument used for FTIR analysis was a Perkin–Elmer
1725 series FTIR spectrometer (Perkin–Elmer Co., Norwalk, CT)
equipped with a room temperature deuterated triglycine sulfate
detector and controlled by a Perkin–Elmer 7300 PC. The software
used for collecting the FTIR data was the Spectrum version 5.3.1.
Circular Dichroism AnalysisCircular dichroism spectra were recorded at 25uC in an Aviv
model 215 circular dichroism spectrometer (Aviv Biomedicals Inc.,
Lakewood, NJ) using a 0.1 cm cell for three scans with 0.1 nm
bandwidth. The concentration of the drugs was 50 mM in DMF
unless otherwise indicated. The Synergy H4 hybrid multi-mode
microplate reader was purchased from BioTek Instruments Inc.
(Winooski, VT).
Transmission Electron Microscopy (TEM) and AtomicForce Microscopy (AFM)
The morphology and size of the FACD-Ada-Dox supramole-
cules were evaluated by transmission electron microscopy (TEM)
and atomic force microscopy (AFM). An aqueous solution of
FACD-Ada-Dox was directly trickled onto a 300-mesh copper grid
and dried in a vacuum oven at 35uC for 4 hr, then images were
observed by TEM (JEM 100CX; JEOL Ltd, Tokyo, Japan) with
an accelerating voltage of 160 kV. For AFM images, the sample
was dissolved in double deionized water (1.0 mg/ml), an aliquot of
the solution (5.0 ml) was spotted onto a freshly cleaved mica surface
and heated at 37uC for 3 hr. Imaging was performed on a
Multimode Nanoscope AFM in tapping mode, using a fluid cell, J
scanner and 200 mm cantilevers with 1 nm Si3N4 tips.
3-(4, 5-Dimethylthiazol-2-yl)-2,5-diphenyltetrazoliumBromide (MTT) Assay
JAR, HT-29 and 3T3 cells were seeded in 96-well tissue culture
plates and maintained overnight in DMEM medium. Cells were
then treated with Dox, Ada-Dox, FACD-Ada-Dox, or NFACD-
Figure 2. The reaction schemes to generate Ada-Dox (a), NH2-CD (b), and FACDs (c).doi:10.1371/journal.pone.0062289.g002
FR Targeted Drug Complex for Cancer Treatment
PLOS ONE | www.plosone.org 5 May 2013 | Volume 8 | Issue 5 | e62289
Ada-Dox at different concentrations and incubated for 24 hr at
37uC. The absorbance was measured after adding MTT. MTT is
reduced by mitochondrial dehydrogenases in living cells to a blue-
mageta coloured formazan precipitate. The absorbance of
dissolved formazan in the visible region correlates with the
number of intact active cells. The cytotoxicity was evaluated with
reference to the IC50 value that was defined as the concentration
needed for a 50% reduction of survival based on the survival
curves. IC50 values were calculated from dose-response curves (i.e.,
cell survival fraction vs. drug concentration) obtained in multi-
replicated experiments.
Drug Release AssayThe in vitro release profiles and kinetics of the targeting drug
FACD-Ada-Dox and prodrug Ada-Dox were determined by a
dialysis method. Briefly, 3 ml of aqueous drug was added to 1 ml
PBS (pH 7.4, 0.01 M). The mixture was suspended in a dialysis
bag (molecular weight cutoff: 3,000 Dal) and dialyzed against
10 ml of PBS containing 50% fetal bovine serum (FBS) at 37uCwith gentle shaking for three days. A 20 ml aliquot of the sample
was withdrawn from the incubation medium at designated time
points and stored frozen for analysis. The released Ada-Dox was
quantified by microplate reader at lEx = 490 nm and
lEm = 600 nm. A calibration curve was prepared using different
concentrations of free Ada-Dox.
Flow CytometryFlow cytometric analysis was performed on a FACS (Becton
Dickinson Immunocytometry Systems, San Jose, CA) by counting
10,000 events. To evaluate the apoptosis of cells treated with
various drugs at equivalent concentrations, Dox, Ada-Dox,
FACD-Ada-Dox and NFACD-Ada-Dox at a final concentration
of 5.0 mM were added into the prepared 35-mm petri dishes
containing 26105 HT-29, MCF-7, or JAR cells in 3.0 ml culture
medium. The cells were incubated for 2 hr to allow uptake of the
drugs. Before analysis, the cells were carefully washed with PBS
three times, trypsinized and resuspended in the medium after
incubation. The collected cells were re-dispersed in 500 ml of fresh
PBS and stained with 20 ml DAPI at 1.0 mM for flow cytometric
analysis. The fluorescence of Dox-related molecule was measured
with lEX at 490 nm and lEM at 600 nm. The untreated cells
incubated with DMEM alone (containing 10% FBS, supplement-
ed with 1% of penicillin) were used as the controls.
Folate Receptor-Binding Competition AssayIn the drug uptake competition assay, JAR cells (FR positive)
were seeded into 35-mm petri dishes containing 56105 cells and
incubated at 37 uC with FACD-Ada-DOX at 2 mM for 5 hr in the
presence of FA at 5, 10 or 50 mM. Afterwards, the cells were
washed with PBS three times, trypsinized and resuspended in the
PBS. The collected cells were re-dispersed and the fluorescence
intensities were determined by flow cytometer.
Confocal Laser Scanning MicroscopyConfocal images were recorded with a PerkinElmer ultraview
ERS spinning disk confocal microscope (PerkinElmer Inc.,
Waltham, MA). JAR or JEG-3 cells were seeded on cover slips
in two-well plates, and cultured overnight. Cells were then
incubated with or without 5.0 mM drugs for 2 hr. The cells were
washed with PBS three times to remove unbound drugs and fixed
in 2 ml of 4% paraformade at room temperature for 15 min.
Fixed cells were washed three times and then mounted with
medium containing DAPI (1.5 mg/ml). Slides were cured over-
night in the dark. To study the uptake of drugs over 2 hr in cells
treated with different drug complexes, the cells were exposed to
drugs with different incubation times (15 min increment). The
images were collected and analyzed.
Molecular Docking of the Binding of FA and ItsConjugates to Human Hedgehog Interacting Protein(HHIP)
Unfortunately, the crystal structures of human and animal
RCF/SLC19A1, FR/FRa/FLOR1, FRb/FLOR2, FRc/
FLOR3, FRd/FLOR4 and PCFT/SLC46A1 have not been
resolved so far. No structures of bacterial and yeast homologs have
been reported and thus it is unlikely to build up a homology
model. We conducted preliminary docking study of FA and its
conjugates to HIPP that contains a FRa domain was examined
using the Discovery Studio 3.1 (Accelrys Software Inc., San Diego,
CA) as described by us previously [17,18]. Several functional
Modules in Discovery Studio 2.1 were applied, including Diverse
Conformation Generation, Calculate Molecular Properties, Cre-
ate Multiple Linear Regression Model, and CDOCKER. The
program was run using a Dell optiplex755 server and Chemof-
fice2002 (CambridgeSoft, Cambridge, MA) was used for com-
pound structural refinement. The crystal structure of HHIP was
selected from the Protein Data Bank (http://www.rcsb.org/pdb/)
with the PDB ID of 2WFT [19] that was found to contain a FRadomain when we searched the Pcam 26.0 database (http://pfam.
sanger.ac.uk/). The Pfam database is a large collection of protein
families, each represented by multiple sequence alignments and
hidden Markov models. The molecular dynamics (MD) simulated
annealing process was performed using a rigid protein and flexible
ligand. The ligand-FRa interactions were computed from either
GRID I, GRID II, or the full force field. A final minimization step
was applied to each of the ligand’s docking poses. During ligand
preparation, the duplicate structure was deleted. The options for
ionization change, tautomer or isomer generation, Lipinski filter
and 3D generator were all set true [20]. After refined with
CHARMM, the compounds were docked into the possible binding
site of the protein. The docking was carried out with consideration
of electrostatic energy and van der Waals (vdW) force, which were
softened at different levels during the docking process, but this
softening is removed for the final minimization [21].For each
defined vdW or electrostatic probe, the interactions with all
protein atoms were stored at these grid points. For ligand atoms
located between grid points, a tri-linear interpolation was used to
approximate the energies. A harmonic potential with the force
constant of 300 kcal/mol was applied outside the grid boundary.
Determination of Cellular Reactive Oxygen Species (ROS)Levels
The intracellular ROS levels in mouse H9C2(2-1) cells were
quantified using CM-H2DCFDA as the probe for ROS produc-
tion [22]. CM-H2DCFDA is a chloromethyl derivative of
H2DCFDA, useful as an indicator for ROS in cells. H9C2(2-1)
cells were seeded on a dish at a density of 36106 cells per well and
cultured in 5% CO2 at 37uC for 24 hr. The cells were treated with
Dox, Ada-Dox, FACD-Ada-Dox, or NFACD-Ada-Dox, and then
rinsed with PBS. Afterward, the fluorescence intensity was
measured. The drug concentration was 2.0 mM in H9C2(2-1)
cells. The control cells were treated with the vehicle DMSO at a
final concentration of 0.05% (v/v).
Intracellular ROS levels in mouse 3T3 cells were quantified
using the dichlorofluorescein assay [23]. 3T3 cells were seeded on
a 96-well plate at a density of 105 cells per well and cultured in 5%
FR Targeted Drug Complex for Cancer Treatment
PLOS ONE | www.plosone.org 6 May 2013 | Volume 8 | Issue 5 | e62289
CO2 at 37uC for 24 hr. The cells were treated with Dox, Ada-
Dox, or FACD-Ada-Dox at 5.0 mM, then the cells were then
rinsed by PBS, subsequently 75 ml of PBS, and 25 ml solution of
2’,7’-dichlorfluorescein-diacetate (DFCH-DA) at a final concen-
tration 62.5 mM in PBS buffer was added to each well. The
fluorescence from each well was measured at 35uC immediately
after incorporation of the reagent and every 5 min for 1 hr with
1 sec integration time, using 485 and 535 nm as excitation and
emission wavelengths. Recording of the fluorescence intensity with
time was used as an index of the individual intracellular levels of
ROS in 3T3 cells. The response of the method was checked using
a H2O2 curve. Five independent experiments were performed per
treatment.
Measurement of Glutathione Peroxidase (GPx) Activityand GSH Content
The protein content was determined using the BCA method
after protein extraction from the cells. The activities of GPx and
the content of GSH were scaled to protein content to correct for
differences in biomass of the diverse homogenates. The levels of
GSH in the cells were determined according to the method of
Beutler et al. [24] based on the formation of 2-nitro-5-tiobenzoic
acid from DTNB in the presence of GSH. In brief, 25 ml of
trichloroacetic acid (15%) was added to 50 ml of the homogenate,
followed by centrifugation at 13, 000 g for 5 min at 4uC. A
supernatant aliquot (50 ml) was mixed with 50 ml of 3.4 mM
ethylenediaminetetraacetic acid (EDTA) dissolved in PBS, 1 ml of
PBS, and 250 ml of DTNB in PBS (20 mg/ml). The absorbance
was measured at 412 nm after 15 min and compared to a
standard curve of GSH (0.01–0.5 mM). The GPx activity was
measured based on the oxidation of GSH by GPx coupled to the
disappearance of reduced nicotinamide adenine dinucleotide
phosphate (NADPH) by glutathione reductase.
Statistical AnalysisData are expressed as the mean 6 standard deviation (SD). The
comparison of values for multiple treatment groups was performed
by one- or two-way analysis of variance (ANOVA) followed by
Bonferroni multiple comparison test at P,0.05. Differences
between two groups were analyzed using unpaired Student’s t-
test. A P value of ,0.05 was considered statistically significant.
Results
Synthesis of FACDs and FACD-Ada-Dox and TheirStructural Determination by Spectral Techniques
The synthetic procedure for FR targeting b-CD based
adamantane-Dox supramolecule is depicted in Figure 2. To
construct the supremolecule, the targeting drug carriers were
prepared firstly. Mono-6-amino-6-deoxy-CD (NH2-CD) was
synthesized as the starting material according to the method of
Petter et al. [25] with some modifications. Mono-[6-O-(p-
tolylsulfonyl)]-b-CD (Ts-CD) was prepared by the reaction of b-
CD with p-toluenesulfonyl, and then Ts-CD was transferred to 6-
azido-6-amino-b-CD (N3-CD) through nucleophilic reaction.
Finally, 6-deoxy-6-amino-b-CD (NH2-CD) was obtained by a
reaction of N3-CD and ammioum hydroxide. The resultant water-
soluble FACD isomers (a,c and double CD substituted folic acid)
were prepared by the coupling of NHS activated NH2-CD and
folic acid using DCC, the FACDs were purified through ion
exchange column, dialysis method, and preparative thin layer
chromatography and recrystallization. In addition, the guest
molecule Ada-Dox was synthesized according to the reaction of
Figure 2b in which Dox was grafted to the adamantine through
amide bonding.
The resultant water-soluble FACD isomers were prepared and
isolated in a multi-step reaction and the structure of each isomer
was characterized by 1D/2D NMR including gradient-selected
correlation spectroscopy (g-COSY), heteronuclear multiple-bond
correlation spectroscopy (HMBC), and heteronuclear multiple-
quantum correlation spectroscopy (HMQC), UV spectroscopy,
FTIR, HR-MALDI-TOF-MS, and HPLC. The structure of a and
c isomers exhibited the stereochemistry as indicated in Figure 2c.
The activation energy of diastereomer c-FACD
(EAc = 2729.26 kJ/mol, as modeled by Spartan 08 1. 2. 0) was
slightly lower than that of a-FACD (EAa = 2,736.52 kJ/mol).
Lengthening the reaction time up to over 48 hr at 40uC favored
the formation of a-FACD, which is taken as the thermodynamic
product. In contrast, shortening the reaction time to 8 hr at room
temperature (about 20uC) resulted in c-FACD as the dominant
product under kinetic control.
The HR-MALDI-TOF-MS spectra of the c-FACD and a-
FACD diastereomers as well as FA-conjugated b-CD dimer (FA-
diCD) showed the strong molecular ion peaks of C61H88N8NaO39
at m/z 1,579.414 (intensity 100%), C61H89N8NaO39 at m/z
1,580.255 (intensity 100%), and C103H158N9NaO72 at m/z
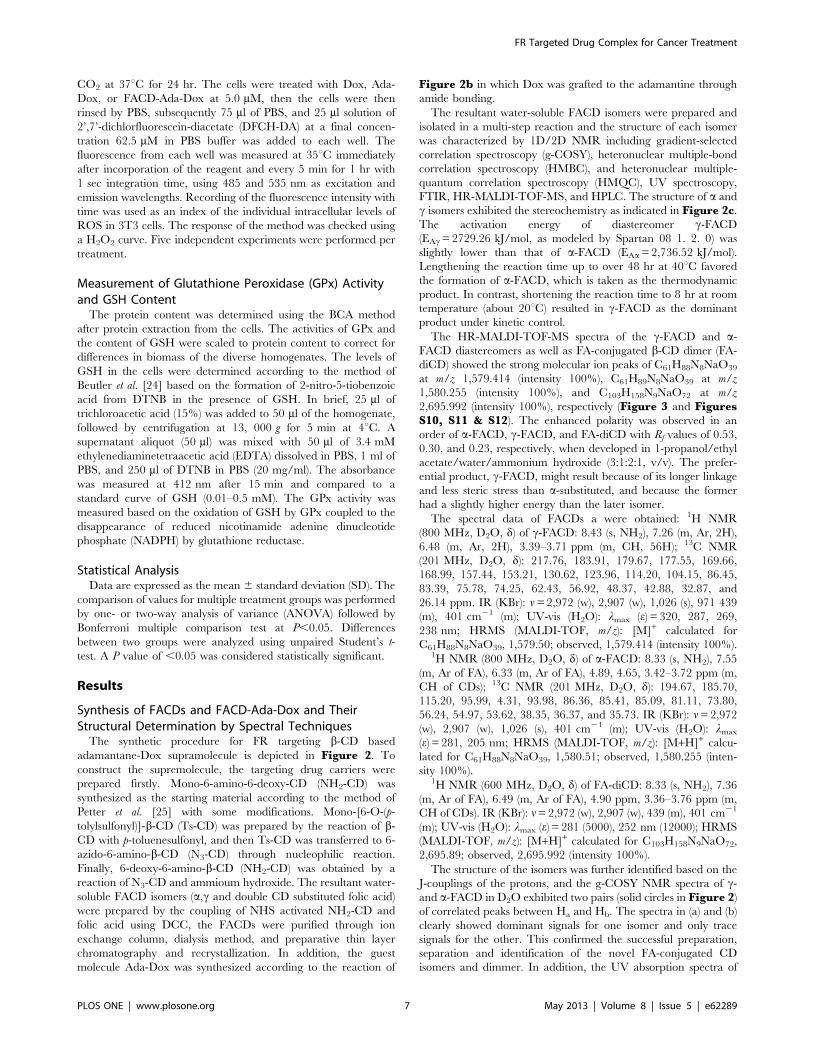
2,695.992 (intensity 100%), respectively (Figure 3 and FiguresS10, S11 & S12). The enhanced polarity was observed in an
order of a-FACD, c-FACD, and FA-diCD with Rf values of 0.53,
0.30, and 0.23, respectively, when developed in 1-propanol/ethyl
acetate/water/ammonium hydroxide (3:1:2:1, v/v). The prefer-
ential product, c-FACD, might result because of its longer linkage
and less steric stress than a-substituted, and because the former
had a slightly higher energy than the later isomer.
The spectral data of FACDs a were obtained: 1H NMR
(800 MHz, D2O, d) of c-FACD: 8.43 (s, NH2), 7.26 (m, Ar, 2H),
6.48 (m, Ar, 2H), 3.39–3.71 ppm (m, CH, 56H); 13C NMR
(201 MHz, D2O, d): 217.76, 183.91, 179.67, 177.55, 169.66,
168.99, 157.44, 153.21, 130.62, 123.96, 114.20, 104.15, 86.45,
83.39, 75.78, 74.25, 62.43, 56.92, 48.37, 42.88, 32.87, and
26.14 ppm. IR (KBr): n = 2,972 (w), 2,907 (w), 1,026 (s), 971 439
(m), 401 cm21 (m); UV-vis (H2O): lmax (e) = 320, 287, 269,
238 nm; HRMS (MALDI-TOF, m/z): [M]+ calculated for
C61H88N8NaO39, 1,579.50; observed, 1,579.414 (intensity 100%).1H NMR (800 MHz, D2O, d) of a-FACD: 8.33 (s, NH2), 7.55
(m, Ar of FA), 6.33 (m, Ar of FA), 4.89, 4.65, 3.42–3.72 ppm (m,
CH of CDs); 13C NMR (201 MHz, D2O, d): 194.67, 185.70,
115.20, 95.99, 4.31, 93.98, 86.36, 85.41, 85.09, 81.11, 73.80,
56.24, 54.97, 53.62, 38.35, 36.37, and 35.73. IR (KBr): n = 2,972
(w), 2,907 (w), 1,026 (s), 401 cm21 (m); UV-vis (H2O): lmax
(e) = 281, 205 nm; HRMS (MALDI-TOF, m/z): [M+H]+ calcu-
lated for C61H88N8NaO39, 1,580.51; observed, 1,580.255 (inten-
sity 100%).1H NMR (600 MHz, D2O, d) of FA-diCD: 8.33 (s, NH2), 7.36
(m, Ar of FA), 6.49 (m, Ar of FA), 4.90 ppm, 3.36–3.76 ppm (m,
CH of CDs). IR (KBr): n = 2,972 (w), 2,907 (w), 439 (m), 401 cm21
(m); UV-vis (H2O): lmax (e) = 281 (5000), 252 nm (12000); HRMS
(MALDI-TOF, m/z): [M+H]+ calculated for C103H158N9NaO72,
2,695.89; observed, 2,695.992 (intensity 100%).
The structure of the isomers was further identified based on the
J-couplings of the protons, and the g-COSY NMR spectra of c-
and a-FACD in D2O exhibited two pairs (solid circles in Figure 2)
of correlated peaks between Ha and Hb. The spectra in (a) and (b)
clearly showed dominant signals for one isomer and only trace
signals for the other. This confirmed the successful preparation,
separation and identification of the novel FA-conjugated CD
isomers and dimmer. In addition, the UV absorption spectra of
FR Targeted Drug Complex for Cancer Treatment
PLOS ONE | www.plosone.org 7 May 2013 | Volume 8 | Issue 5 | e62289
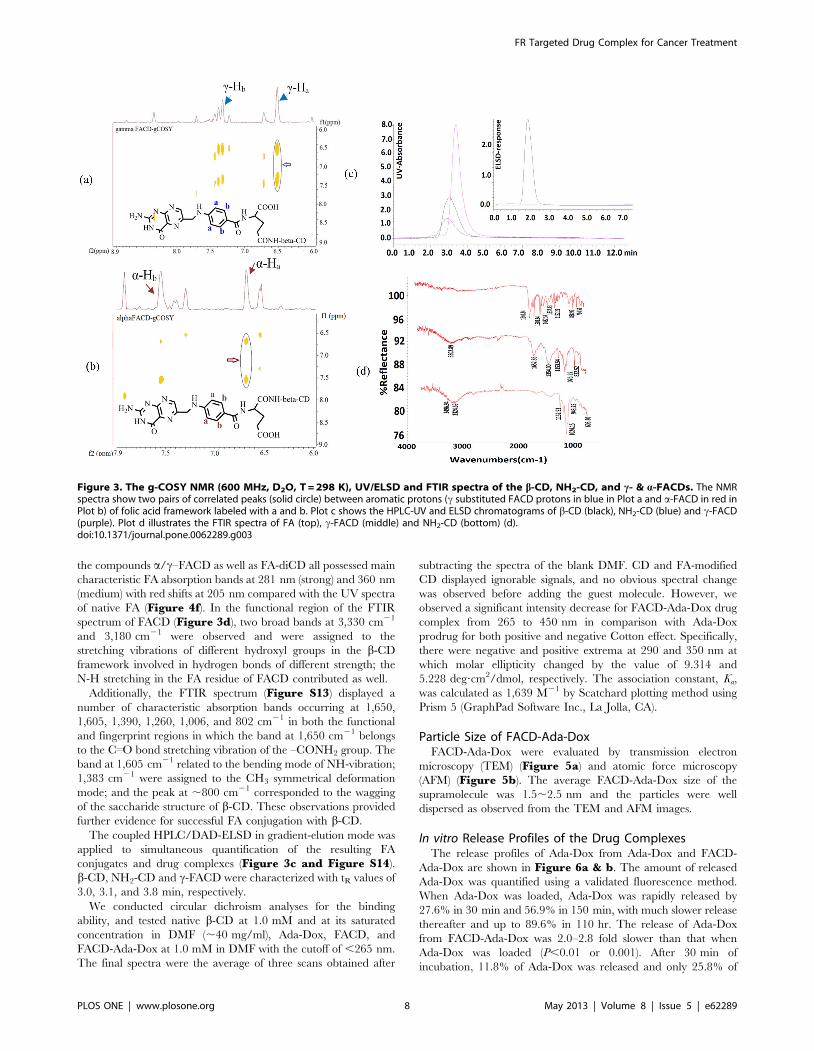
the compounds a/c–FACD as well as FA-diCD all possessed main
characteristic FA absorption bands at 281 nm (strong) and 360 nm
(medium) with red shifts at 205 nm compared with the UV spectra
of native FA (Figure 4f). In the functional region of the FTIR
spectrum of FACD (Figure 3d), two broad bands at 3,330 cm21
and 3,180 cm21 were observed and were assigned to the
stretching vibrations of different hydroxyl groups in the b-CD
framework involved in hydrogen bonds of different strength; the
N-H stretching in the FA residue of FACD contributed as well.
Additionally, the FTIR spectrum (Figure S13) displayed a
number of characteristic absorption bands occurring at 1,650,
1,605, 1,390, 1,260, 1,006, and 802 cm21 in both the functional
and fingerprint regions in which the band at 1,650 cm21 belongs
to the C––O bond stretching vibration of the –CONH2 group. The
band at 1,605 cm21 related to the bending mode of NH-vibration;
1,383 cm21 were assigned to the CH3 symmetrical deformation
mode; and the peak at ,800 cm21 corresponded to the wagging
of the saccharide structure of b-CD. These observations provided
further evidence for successful FA conjugation with b-CD.
The coupled HPLC/DAD-ELSD in gradient-elution mode was
applied to simultaneous quantification of the resulting FA
conjugates and drug complexes (Figure 3c and Figure S14).
b-CD, NH2-CD and c-FACD were characterized with tR values of
3.0, 3.1, and 3.8 min, respectively.
We conducted circular dichroism analyses for the binding
ability, and tested native b-CD at 1.0 mM and at its saturated
concentration in DMF (,40 mg/ml), Ada-Dox, FACD, and
FACD-Ada-Dox at 1.0 mM in DMF with the cutoff of ,265 nm.
The final spectra were the average of three scans obtained after
subtracting the spectra of the blank DMF. CD and FA-modified
CD displayed ignorable signals, and no obvious spectral change
was observed before adding the guest molecule. However, we
observed a significant intensity decrease for FACD-Ada-Dox drug
complex from 265 to 450 nm in comparison with Ada-Dox
prodrug for both positive and negative Cotton effect. Specifically,
there were negative and positive extrema at 290 and 350 nm at
which molar ellipticity changed by the value of 9.314 and
5.228 deg?cm2/dmol, respectively. The association constant, Ka,
was calculated as 1,639 M21 by Scatchard plotting method using
Prism 5 (GraphPad Software Inc., La Jolla, CA).
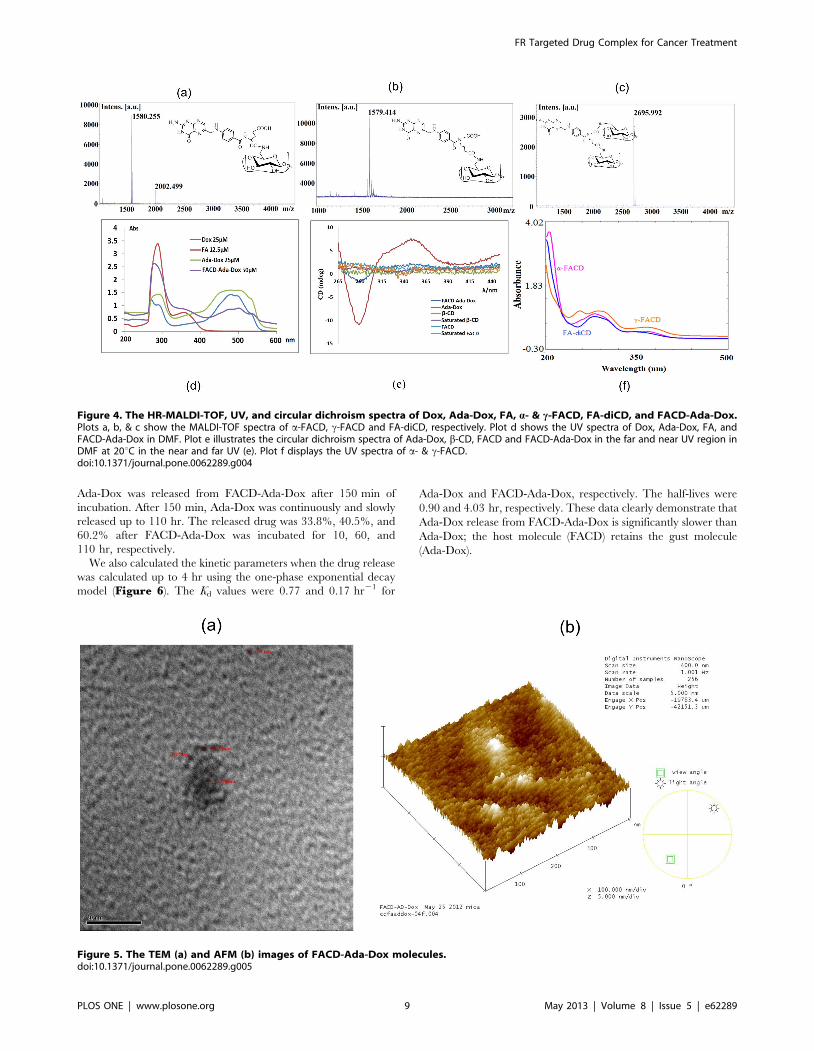
Particle Size of FACD-Ada-DoxFACD-Ada-Dox were evaluated by transmission electron
microscopy (TEM) (Figure 5a) and atomic force microscopy
(AFM) (Figure 5b). The average FACD-Ada-Dox size of the
supramolecule was 1.5,2.5 nm and the particles were well
dispersed as observed from the TEM and AFM images.
In vitro Release Profiles of the Drug ComplexesThe release profiles of Ada-Dox from Ada-Dox and FACD-
Ada-Dox are shown in Figure 6a & b. The amount of released
Ada-Dox was quantified using a validated fluorescence method.
When Ada-Dox was loaded, Ada-Dox was rapidly released by
27.6% in 30 min and 56.9% in 150 min, with much slower release
thereafter and up to 89.6% in 110 hr. The release of Ada-Dox
from FACD-Ada-Dox was 2.0–2.8 fold slower than that when
Ada-Dox was loaded (P,0.01 or 0.001). After 30 min of
incubation, 11.8% of Ada-Dox was released and only 25.8% of
Figure 3. The g-COSY NMR (600 MHz, D2O, T = 298 K), UV/ELSD and FTIR spectra of the b-CD, NH2-CD, and c- & a-FACDs. The NMRspectra show two pairs of correlated peaks (solid circle) between aromatic protons (c substituted FACD protons in blue in Plot a and a-FACD in red inPlot b) of folic acid framework labeled with a and b. Plot c shows the HPLC-UV and ELSD chromatograms of b-CD (black), NH2-CD (blue) and c-FACD(purple). Plot d illustrates the FTIR spectra of FA (top), c-FACD (middle) and NH2-CD (bottom) (d).doi:10.1371/journal.pone.0062289.g003
FR Targeted Drug Complex for Cancer Treatment
PLOS ONE | www.plosone.org 8 May 2013 | Volume 8 | Issue 5 | e62289
Ada-Dox was released from FACD-Ada-Dox after 150 min of
incubation. After 150 min, Ada-Dox was continuously and slowly
released up to 110 hr. The released drug was 33.8%, 40.5%, and
60.2% after FACD-Ada-Dox was incubated for 10, 60, and
110 hr, respectively.
We also calculated the kinetic parameters when the drug release
was calculated up to 4 hr using the one-phase exponential decay
model (Figure 6). The Kd values were 0.77 and 0.17 hr21 for
Ada-Dox and FACD-Ada-Dox, respectively. The half-lives were
0.90 and 4.03 hr, respectively. These data clearly demonstrate that
Ada-Dox release from FACD-Ada-Dox is significantly slower than
Ada-Dox; the host molecule (FACD) retains the gust molecule
(Ada-Dox).
Figure 4. The HR-MALDI-TOF, UV, and circular dichroism spectra of Dox, Ada-Dox, FA, a- & c-FACD, FA-diCD, and FACD-Ada-Dox.Plots a, b, & c show the MALDI-TOF spectra of a-FACD, c-FACD and FA-diCD, respectively. Plot d shows the UV spectra of Dox, Ada-Dox, FA, andFACD-Ada-Dox in DMF. Plot e illustrates the circular dichroism spectra of Ada-Dox, b-CD, FACD and FACD-Ada-Dox in the far and near UV region inDMF at 20uC in the near and far UV (e). Plot f displays the UV spectra of a- & c-FACD.doi:10.1371/journal.pone.0062289.g004
Figure 5. The TEM (a) and AFM (b) images of FACD-Ada-Dox molecules.doi:10.1371/journal.pone.0062289.g005
FR Targeted Drug Complex for Cancer Treatment
PLOS ONE | www.plosone.org 9 May 2013 | Volume 8 | Issue 5 | e62289
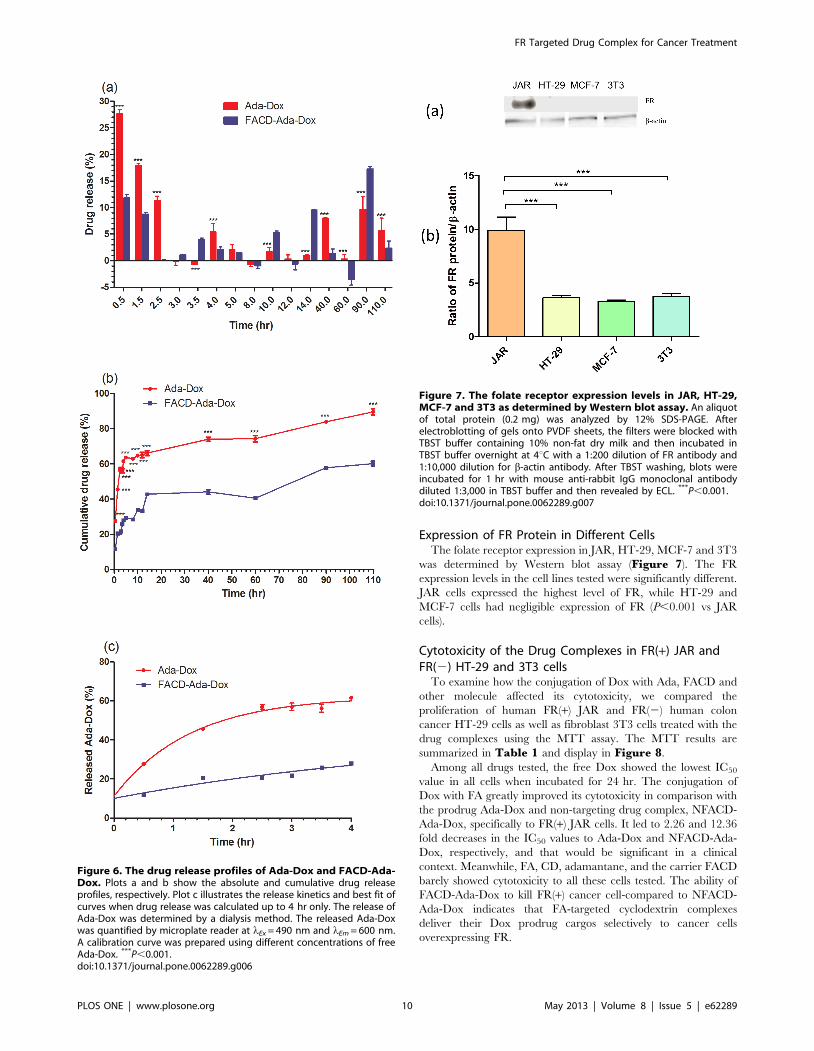
Expression of FR Protein in Different CellsThe folate receptor expression in JAR, HT-29, MCF-7 and 3T3
was determined by Western blot assay (Figure 7). The FR
expression levels in the cell lines tested were significantly different.
JAR cells expressed the highest level of FR, while HT-29 and
MCF-7 cells had negligible expression of FR (P,0.001 vs JAR
cells).
Cytotoxicity of the Drug Complexes in FR(+) JAR andFR(2) HT-29 and 3T3 cells
To examine how the conjugation of Dox with Ada, FACD and
other molecule affected its cytotoxicity, we compared the
proliferation of human FR(+) JAR and FR(2) human colon
cancer HT-29 cells as well as fibroblast 3T3 cells treated with the
drug complexes using the MTT assay. The MTT results are
summarized in Table 1 and display in Figure 8.
Among all drugs tested, the free Dox showed the lowest IC50
value in all cells when incubated for 24 hr. The conjugation of
Dox with FA greatly improved its cytotoxicity in comparison with
the prodrug Ada-Dox and non-targeting drug complex, NFACD-
Ada-Dox, specifically to FR(+) JAR cells. It led to 2.26 and 12.36
fold decreases in the IC50 values to Ada-Dox and NFACD-Ada-
Dox, respectively, and that would be significant in a clinical
context. Meanwhile, FA, CD, adamantane, and the carrier FACD
barely showed cytotoxicity to all these cells tested. The ability of
FACD-Ada-Dox to kill FR(+) cancer cell-compared to NFACD-
Ada-Dox indicates that FA-targeted cyclodextrin complexes
deliver their Dox prodrug cargos selectively to cancer cells
overexpressing FR.
Figure 6. The drug release profiles of Ada-Dox and FACD-Ada-Dox. Plots a and b show the absolute and cumulative drug releaseprofiles, respectively. Plot c illustrates the release kinetics and best fit ofcurves when drug release was calculated up to 4 hr only. The release ofAda-Dox was determined by a dialysis method. The released Ada-Doxwas quantified by microplate reader at lEx = 490 nm and lEm = 600 nm.A calibration curve was prepared using different concentrations of freeAda-Dox. ***P,0.001.doi:10.1371/journal.pone.0062289.g006
Figure 7. The folate receptor expression levels in JAR, HT-29,MCF-7 and 3T3 as determined by Western blot assay. An aliquotof total protein (0.2 mg) was analyzed by 12% SDS-PAGE. Afterelectroblotting of gels onto PVDF sheets, the filters were blocked withTBST buffer containing 10% non-fat dry milk and then incubated inTBST buffer overnight at 4uC with a 1:200 dilution of FR antibody and1:10,000 dilution for b-actin antibody. After TBST washing, blots wereincubated for 1 hr with mouse anti-rabbit IgG monoclonal antibodydiluted 1:3,000 in TBST buffer and then revealed by ECL. ***P,0.001.doi:10.1371/journal.pone.0062289.g007
FR Targeted Drug Complex for Cancer Treatment
PLOS ONE | www.plosone.org 10 May 2013 | Volume 8 | Issue 5 | e62289
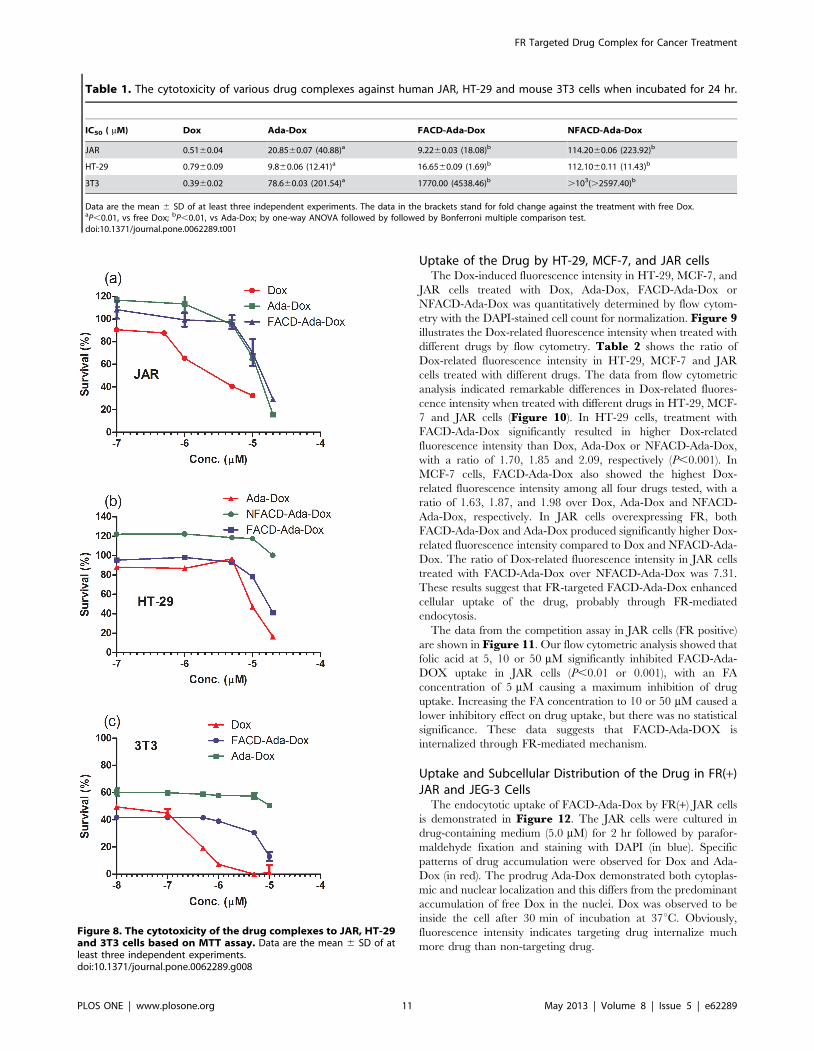
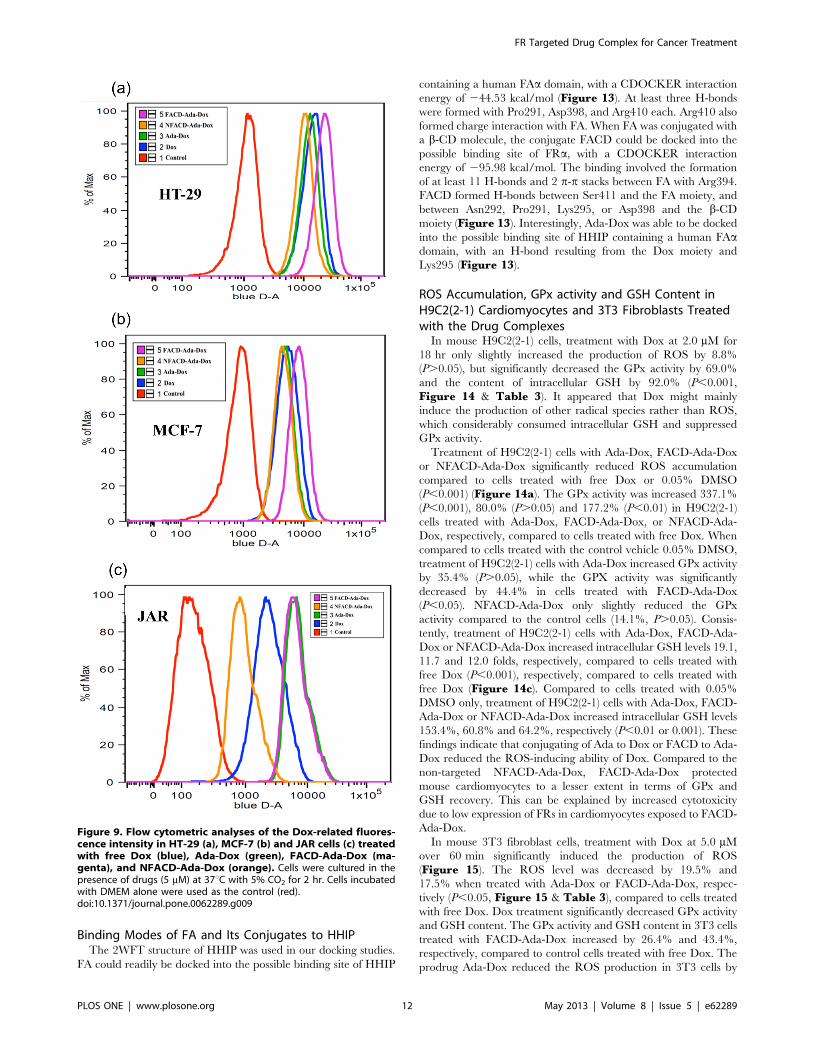
Uptake of the Drug by HT-29, MCF-7, and JAR cellsThe Dox-induced fluorescence intensity in HT-29, MCF-7, and
JAR cells treated with Dox, Ada-Dox, FACD-Ada-Dox or
NFACD-Ada-Dox was quantitatively determined by flow cytom-
etry with the DAPI-stained cell count for normalization. Figure 9illustrates the Dox-related fluorescence intensity when treated with
different drugs by flow cytometry. Table 2 shows the ratio of
Dox-related fluorescence intensity in HT-29, MCF-7 and JAR
cells treated with different drugs. The data from flow cytometric
analysis indicated remarkable differences in Dox-related fluores-
cence intensity when treated with different drugs in HT-29, MCF-
7 and JAR cells (Figure 10). In HT-29 cells, treatment with
FACD-Ada-Dox significantly resulted in higher Dox-related
fluorescence intensity than Dox, Ada-Dox or NFACD-Ada-Dox,
with a ratio of 1.70, 1.85 and 2.09, respectively (P,0.001). In
MCF-7 cells, FACD-Ada-Dox also showed the highest Dox-
related fluorescence intensity among all four drugs tested, with a
ratio of 1.63, 1.87, and 1.98 over Dox, Ada-Dox and NFACD-
Ada-Dox, respectively. In JAR cells overexpressing FR, both
FACD-Ada-Dox and Ada-Dox produced significantly higher Dox-
related fluorescence intensity compared to Dox and NFACD-Ada-
Dox. The ratio of Dox-related fluorescence intensity in JAR cells
treated with FACD-Ada-Dox over NFACD-Ada-Dox was 7.31.
These results suggest that FR-targeted FACD-Ada-Dox enhanced
cellular uptake of the drug, probably through FR-mediated
endocytosis.
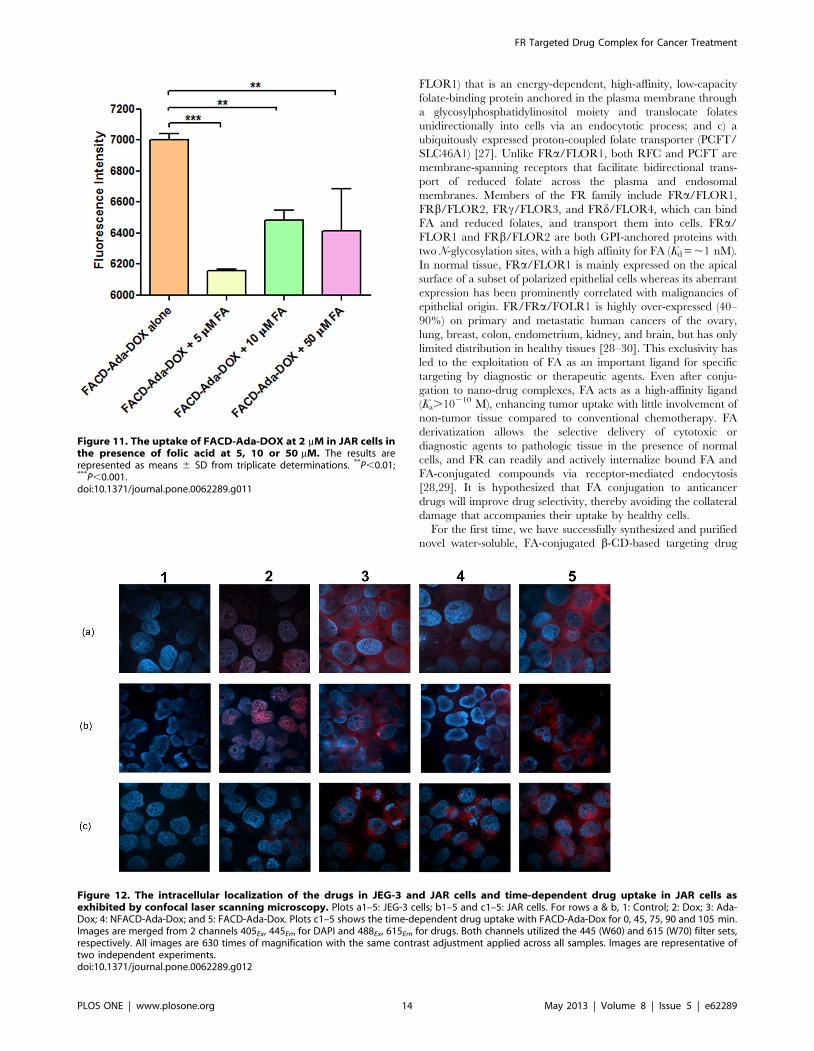
The data from the competition assay in JAR cells (FR positive)
are shown in Figure 11. Our flow cytometric analysis showed that
folic acid at 5, 10 or 50 mM significantly inhibited FACD-Ada-
DOX uptake in JAR cells (P,0.01 or 0.001), with an FA
concentration of 5 mM causing a maximum inhibition of drug
uptake. Increasing the FA concentration to 10 or 50 mM caused a
lower inhibitory effect on drug uptake, but there was no statistical
significance. These data suggests that FACD-Ada-DOX is
internalized through FR-mediated mechanism.
Uptake and Subcellular Distribution of the Drug in FR(+)JAR and JEG-3 Cells
The endocytotic uptake of FACD-Ada-Dox by FR(+) JAR cells
is demonstrated in Figure 12. The JAR cells were cultured in
drug-containing medium (5.0 mM) for 2 hr followed by parafor-
maldehyde fixation and staining with DAPI (in blue). Specific
patterns of drug accumulation were observed for Dox and Ada-
Dox (in red). The prodrug Ada-Dox demonstrated both cytoplas-
mic and nuclear localization and this differs from the predominant
accumulation of free Dox in the nuclei. Dox was observed to be
inside the cell after 30 min of incubation at 37uC. Obviously,
fluorescence intensity indicates targeting drug internalize much
more drug than non-targeting drug.
Figure 8. The cytotoxicity of the drug complexes to JAR, HT-29and 3T3 cells based on MTT assay. Data are the mean 6 SD of atleast three independent experiments.doi:10.1371/journal.pone.0062289.g008
Table 1. The cytotoxicity of various drug complexes against human JAR, HT-29 and mouse 3T3 cells when incubated for 24 hr.
IC50 ( mM) Dox Ada-Dox FACD-Ada-Dox NFACD-Ada-Dox
JAR 0.5160.04 20.8560.07 (40.88)a 9.2260.03 (18.08)b 114.2060.06 (223.92)b
HT-29 0.7960.09 9.860.06 (12.41)a 16.6560.09 (1.69)b 112.1060.11 (11.43)b
3T3 0.3960.02 78.660.03 (201.54)a 1770.00 (4538.46)b .103(.2597.40)b
Data are the mean 6 SD of at least three independent experiments. The data in the brackets stand for fold change against the treatment with free Dox.aP,0.01, vs free Dox; bP,0.01, vs Ada-Dox; by one-way ANOVA followed by followed by Bonferroni multiple comparison test.doi:10.1371/journal.pone.0062289.t001
FR Targeted Drug Complex for Cancer Treatment
PLOS ONE | www.plosone.org 11 May 2013 | Volume 8 | Issue 5 | e62289
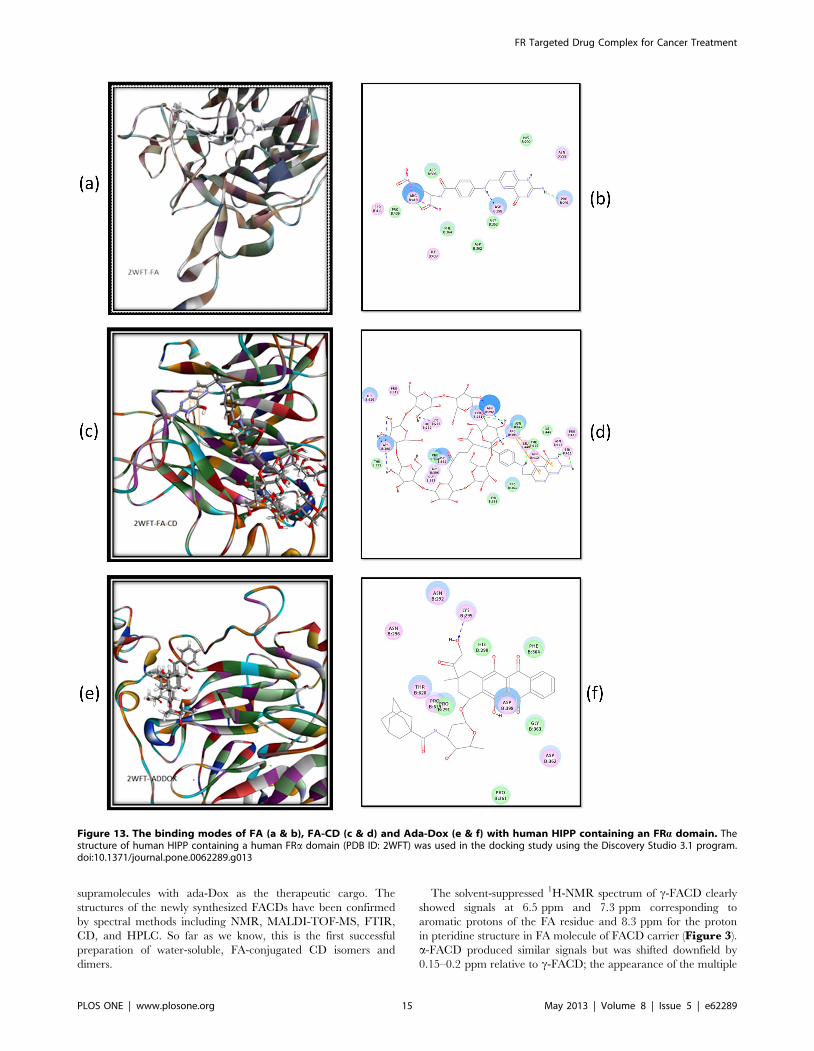
Binding Modes of FA and Its Conjugates to HHIPThe 2WFT structure of HHIP was used in our docking studies.
FA could readily be docked into the possible binding site of HHIP
containing a human FAa domain, with a CDOCKER interaction
energy of 244.53 kcal/mol (Figure 13). At least three H-bonds
were formed with Pro291, Asp398, and Arg410 each. Arg410 also
formed charge interaction with FA. When FA was conjugated with
a b-CD molecule, the conjugate FACD could be docked into the
possible binding site of FRa, with a CDOCKER interaction
energy of 295.98 kcal/mol. The binding involved the formation
of at least 11 H-bonds and 2 p-p stacks between FA with Arg394.
FACD formed H-bonds between Ser411 and the FA moiety, and
between Asn292, Pro291, Lys295, or Asp398 and the b-CD
moiety (Figure 13). Interestingly, Ada-Dox was able to be docked
into the possible binding site of HHIP containing a human FAadomain, with an H-bond resulting from the Dox moiety and
Lys295 (Figure 13).
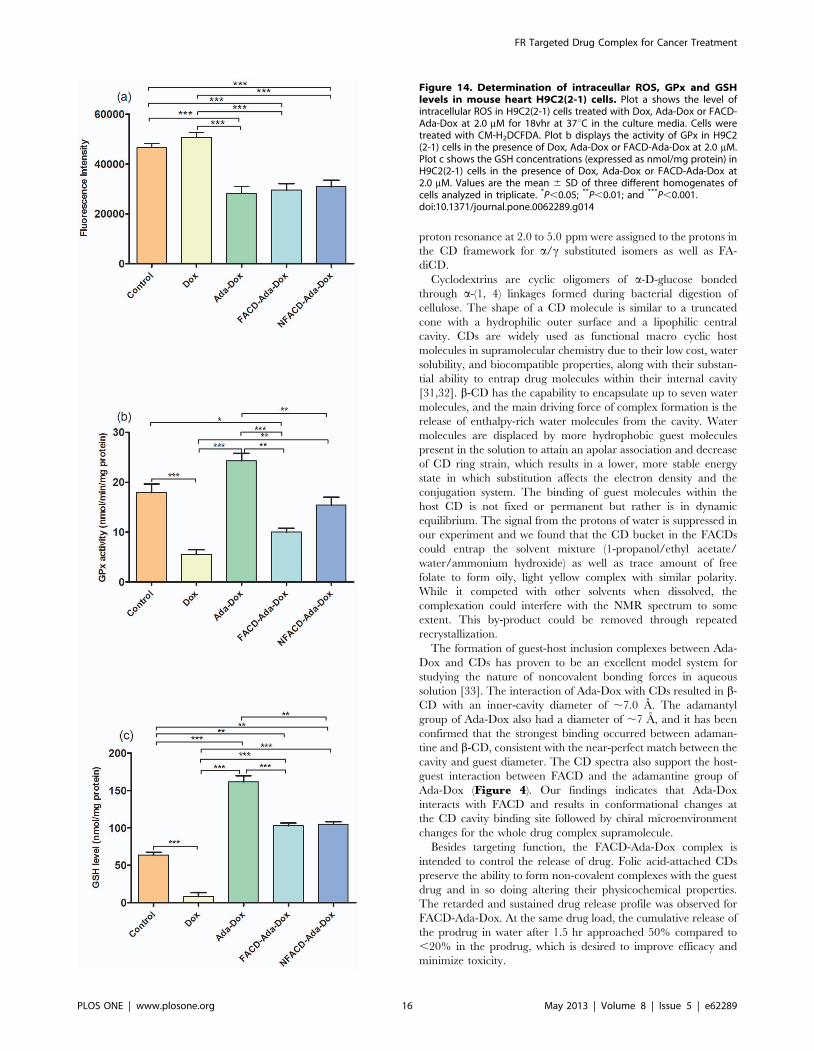
ROS Accumulation, GPx activity and GSH Content inH9C2(2-1) Cardiomyocytes and 3T3 Fibroblasts Treatedwith the Drug Complexes
In mouse H9C2(2-1) cells, treatment with Dox at 2.0 mM for
18 hr only slightly increased the production of ROS by 8.8%
(P.0.05), but significantly decreased the GPx activity by 69.0%
and the content of intracellular GSH by 92.0% (P,0.001,
Figure 14 & Table 3). It appeared that Dox might mainly
induce the production of other radical species rather than ROS,
which considerably consumed intracellular GSH and suppressed
GPx activity.
Treatment of H9C2(2-1) cells with Ada-Dox, FACD-Ada-Dox
or NFACD-Ada-Dox significantly reduced ROS accumulation
compared to cells treated with free Dox or 0.05% DMSO
(P,0.001) (Figure 14a). The GPx activity was increased 337.1%
(P,0.001), 80.0% (P.0.05) and 177.2% (P,0.01) in H9C2(2-1)
cells treated with Ada-Dox, FACD-Ada-Dox, or NFACD-Ada-
Dox, respectively, compared to cells treated with free Dox. When
compared to cells treated with the control vehicle 0.05% DMSO,
treatment of H9C2(2-1) cells with Ada-Dox increased GPx activity
by 35.4% (P.0.05), while the GPX activity was significantly
decreased by 44.4% in cells treated with FACD-Ada-Dox
(P,0.05). NFACD-Ada-Dox only slightly reduced the GPx
activity compared to the control cells (14.1%, P.0.05). Consis-
tently, treatment of H9C2(2-1) cells with Ada-Dox, FACD-Ada-
Dox or NFACD-Ada-Dox increased intracellular GSH levels 19.1,
11.7 and 12.0 folds, respectively, compared to cells treated with
free Dox (P,0.001), respectively, compared to cells treated with
free Dox (Figure 14c). Compared to cells treated with 0.05%
DMSO only, treatment of H9C2(2-1) cells with Ada-Dox, FACD-
Ada-Dox or NFACD-Ada-Dox increased intracellular GSH levels
153.4%, 60.8% and 64.2%, respectively (P,0.01 or 0.001). These
findings indicate that conjugating of Ada to Dox or FACD to Ada-
Dox reduced the ROS-inducing ability of Dox. Compared to the
non-targeted NFACD-Ada-Dox, FACD-Ada-Dox protected
mouse cardiomyocytes to a lesser extent in terms of GPx and
GSH recovery. This can be explained by increased cytotoxicity
due to low expression of FRs in cardiomyocytes exposed to FACD-
Ada-Dox.
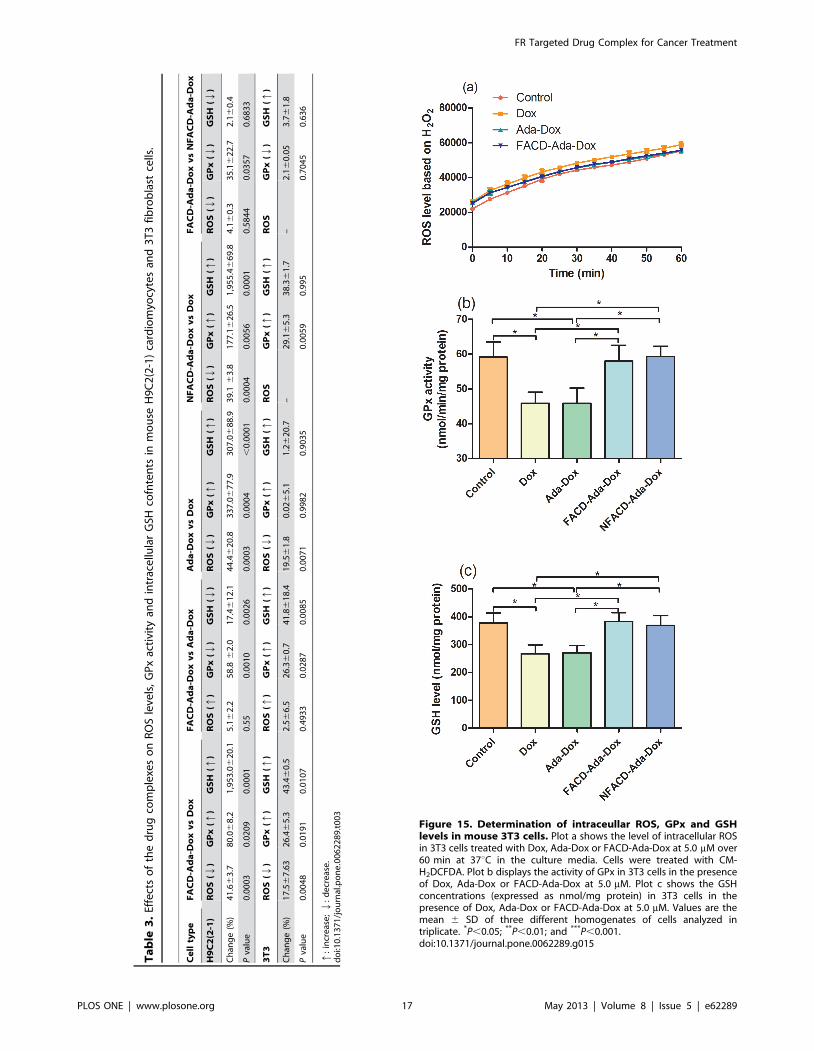
In mouse 3T3 fibroblast cells, treatment with Dox at 5.0 mM
over 60 min significantly induced the production of ROS
(Figure 15). The ROS level was decreased by 19.5% and
17.5% when treated with Ada-Dox or FACD-Ada-Dox, respec-
tively (P,0.05, Figure 15 & Table 3), compared to cells treated
with free Dox. Dox treatment significantly decreased GPx activity
and GSH content. The GPx activity and GSH content in 3T3 cells
treated with FACD-Ada-Dox increased by 26.4% and 43.4%,
respectively, compared to control cells treated with free Dox. The
prodrug Ada-Dox reduced the ROS production in 3T3 cells by
Figure 9. Flow cytometric analyses of the Dox-related fluores-cence intensity in HT-29 (a), MCF-7 (b) and JAR cells (c) treatedwith free Dox (blue), Ada-Dox (green), FACD-Ada-Dox (ma-genta), and NFACD-Ada-Dox (orange). Cells were cultured in thepresence of drugs (5 mM) at 37uC with 5% CO2 for 2 hr. Cells incubatedwith DMEM alone were used as the control (red).doi:10.1371/journal.pone.0062289.g009
FR Targeted Drug Complex for Cancer Treatment
PLOS ONE | www.plosone.org 12 May 2013 | Volume 8 | Issue 5 | e62289
19.5%, but did not alter the GPx activity and GSH content,
compared to cells treated with free Dox. Compared to the
treatment with Dox or Ada-Dox, both FACD-Ada-Dox and
NFACD-Ada-Dox significantly increased the GPx activity and
GSH content (P,0.05) in 3T3 cells. Since 3T3 cells lack FR
expression, the recovering ability of FACD-Ada-Dox and
NFACD-Ada-Dox for GPx and GSH is comparable.
Discussion
A variety of receptors have been identified as markers for
carcinomas. FA is a hydrophilic B-complex vitamin which plays an
essential role in mammalian cell survival by participating in the
biosynthesis of purines, thymidylate, and certain amino acids [26].
Leucovorin (5-formyl-tetrahydrofolate) and reduced folates (e.g. 5-
methyl-tetrahydrofolate) are precursors of one-carbon donors in
the de novo biosynthesis of purines and thymidylate. FA and its
derivatives can cross cells by three mechanisms: a) the reduced
folate carrier (RFC/SLC19A1), a bidirectional anion exchanger
that has a high affinity for reduced folate co-factors and antifolates
(e.g. methotrexate), but a low affinity for FA; RFC can take up
folate cofactors and export various organic anions, including
thiamine pyrophosphate; b) the folate receptor-a (FRa/FR/
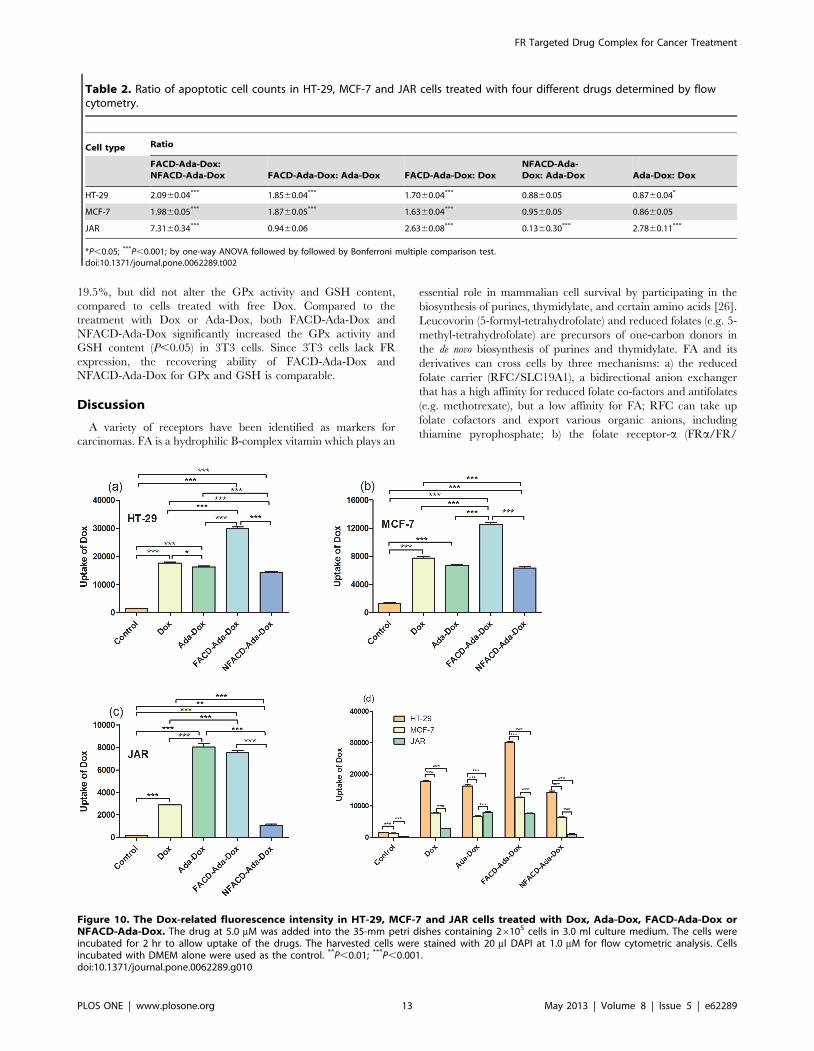
Figure 10. The Dox-related fluorescence intensity in HT-29, MCF-7 and JAR cells treated with Dox, Ada-Dox, FACD-Ada-Dox orNFACD-Ada-Dox. The drug at 5.0 mM was added into the 35-mm petri dishes containing 26105 cells in 3.0 ml culture medium. The cells wereincubated for 2 hr to allow uptake of the drugs. The harvested cells were stained with 20 ml DAPI at 1.0 mM for flow cytometric analysis. Cellsincubated with DMEM alone were used as the control. **P,0.01; ***P,0.001.doi:10.1371/journal.pone.0062289.g010
Table 2. Ratio of apoptotic cell counts in HT-29, MCF-7 and JAR cells treated with four different drugs determined by flowcytometry.
Cell type Ratio
FACD-Ada-Dox:NFACD-Ada-Dox FACD-Ada-Dox: Ada-Dox FACD-Ada-Dox: Dox
NFACD-Ada-Dox: Ada-Dox Ada-Dox: Dox
HT-29 2.0960.04*** 1.8560.04*** 1.7060.04*** 0.8860.05 0.8760.04*
MCF-7 1.9860.05*** 1.8760.05*** 1.6360.04*** 0.9560.05 0.8660.05
JAR 7.3160.34*** 0.9460.06 2.6360.08*** 0.1360.30*** 2.7860.11***
*P,0.05; ***P,0.001; by one-way ANOVA followed by followed by Bonferroni multiple comparison test.doi:10.1371/journal.pone.0062289.t002
FR Targeted Drug Complex for Cancer Treatment
PLOS ONE | www.plosone.org 13 May 2013 | Volume 8 | Issue 5 | e62289
FLOR1) that is an energy-dependent, high-affinity, low-capacity
folate-binding protein anchored in the plasma membrane through
a glycosylphosphatidylinositol moiety and translocate folates
unidirectionally into cells via an endocytotic process; and c) a
ubiquitously expressed proton-coupled folate transporter (PCFT/
SLC46A1) [27]. Unlike FRa/FLOR1, both RFC and PCFT are
membrane-spanning receptors that facilitate bidirectional trans-
port of reduced folate across the plasma and endosomal
membranes. Members of the FR family include FRa/FLOR1,
FRb/FLOR2, FRc/FLOR3, and FRd/FLOR4, which can bind
FA and reduced folates, and transport them into cells. FRa/
FLOR1 and FRb/FLOR2 are both GPI-anchored proteins with
two N-glycosylation sites, with a high affinity for FA (Kd = ,1 nM).
In normal tissue, FRa/FLOR1 is mainly expressed on the apical
surface of a subset of polarized epithelial cells whereas its aberrant
expression has been prominently correlated with malignancies of
epithelial origin. FR/FRa/FOLR1 is highly over-expressed (40–
90%) on primary and metastatic human cancers of the ovary,
lung, breast, colon, endometrium, kidney, and brain, but has only
limited distribution in healthy tissues [28–30]. This exclusivity has
led to the exploitation of FA as an important ligand for specific
targeting by diagnostic or therapeutic agents. Even after conju-
gation to nano-drug complexes, FA acts as a high-affinity ligand
(Ka.10210 M), enhancing tumor uptake with little involvement of
non-tumor tissue compared to conventional chemotherapy. FA
derivatization allows the selective delivery of cytotoxic or
diagnostic agents to pathologic tissue in the presence of normal
cells, and FR can readily and actively internalize bound FA and
FA-conjugated compounds via receptor-mediated endocytosis
[28,29]. It is hypothesized that FA conjugation to anticancer
drugs will improve drug selectivity, thereby avoiding the collateral
damage that accompanies their uptake by healthy cells.
For the first time, we have successfully synthesized and purified
novel water-soluble, FA-conjugated b-CD-based targeting drug
Figure 11. The uptake of FACD-Ada-DOX at 2 mM in JAR cells inthe presence of folic acid at 5, 10 or 50 mM. The results arerepresented as means 6 SD from triplicate determinations. **P,0.01;***P,0.001.doi:10.1371/journal.pone.0062289.g011
Figure 12. The intracellular localization of the drugs in JEG-3 and JAR cells and time-dependent drug uptake in JAR cells asexhibited by confocal laser scanning microscopy. Plots a1–5: JEG-3 cells; b1–5 and c1–5: JAR cells. For rows a & b, 1: Control; 2: Dox; 3: Ada-Dox; 4: NFACD-Ada-Dox; and 5: FACD-Ada-Dox. Plots c1–5 shows the time-dependent drug uptake with FACD-Ada-Dox for 0, 45, 75, 90 and 105 min.Images are merged from 2 channels 405Ex, 445Em for DAPI and 488Ex, 615Em for drugs. Both channels utilized the 445 (W60) and 615 (W70) filter sets,respectively. All images are 630 times of magnification with the same contrast adjustment applied across all samples. Images are representative oftwo independent experiments.doi:10.1371/journal.pone.0062289.g012
FR Targeted Drug Complex for Cancer Treatment
PLOS ONE | www.plosone.org 14 May 2013 | Volume 8 | Issue 5 | e62289
supramolecules with ada-Dox as the therapeutic cargo. The
structures of the newly synthesized FACDs have been confirmed
by spectral methods including NMR, MALDI-TOF-MS, FTIR,
CD, and HPLC. So far as we know, this is the first successful
preparation of water-soluble, FA-conjugated CD isomers and
dimers.
The solvent-suppressed 1H-NMR spectrum of c-FACD clearly
showed signals at 6.5 ppm and 7.3 ppm corresponding to
aromatic protons of the FA residue and 8.3 ppm for the proton
in pteridine structure in FA molecule of FACD carrier (Figure 3).
a-FACD produced similar signals but was shifted downfield by
0.15–0.2 ppm relative to c-FACD; the appearance of the multiple
Figure 13. The binding modes of FA (a & b), FA-CD (c & d) and Ada-Dox (e & f) with human HIPP containing an FRa domain. Thestructure of human HIPP containing a human FRa domain (PDB ID: 2WFT) was used in the docking study using the Discovery Studio 3.1 program.doi:10.1371/journal.pone.0062289.g013
FR Targeted Drug Complex for Cancer Treatment
PLOS ONE | www.plosone.org 15 May 2013 | Volume 8 | Issue 5 | e62289
proton resonance at 2.0 to 5.0 ppm were assigned to the protons in
the CD framework for a/c substituted isomers as well as FA-
diCD.
Cyclodextrins are cyclic oligomers of a-D-glucose bonded
through a-(1, 4) linkages formed during bacterial digestion of
cellulose. The shape of a CD molecule is similar to a truncated
cone with a hydrophilic outer surface and a lipophilic central
cavity. CDs are widely used as functional macro cyclic host
molecules in supramolecular chemistry due to their low cost, water
solubility, and biocompatible properties, along with their substan-
tial ability to entrap drug molecules within their internal cavity
[31,32]. b-CD has the capability to encapsulate up to seven water
molecules, and the main driving force of complex formation is the
release of enthalpy-rich water molecules from the cavity. Water
molecules are displaced by more hydrophobic guest molecules
present in the solution to attain an apolar association and decrease
of CD ring strain, which results in a lower, more stable energy
state in which substitution affects the electron density and the
conjugation system. The binding of guest molecules within the
host CD is not fixed or permanent but rather is in dynamic
equilibrium. The signal from the protons of water is suppressed in
our experiment and we found that the CD bucket in the FACDs
could entrap the solvent mixture (1-propanol/ethyl acetate/
water/ammonium hydroxide) as well as trace amount of free
folate to form oily, light yellow complex with similar polarity.
While it competed with other solvents when dissolved, the
complexation could interfere with the NMR spectrum to some
extent. This by-product could be removed through repeated
recrystallization.
The formation of guest-host inclusion complexes between Ada-
Dox and CDs has proven to be an excellent model system for
studying the nature of noncovalent bonding forces in aqueous
solution [33]. The interaction of Ada-Dox with CDs resulted in b-
CD with an inner-cavity diameter of ,7.0 A. The adamantyl
group of Ada-Dox also had a diameter of ,7 A, and it has been
confirmed that the strongest binding occurred between adaman-
tine and b-CD, consistent with the near-perfect match between the
cavity and guest diameter. The CD spectra also support the host-
guest interaction between FACD and the adamantine group of
Ada-Dox (Figure 4). Our findings indicates that Ada-Dox
interacts with FACD and results in conformational changes at
the CD cavity binding site followed by chiral microenvironment
changes for the whole drug complex supramolecule.
Besides targeting function, the FACD-Ada-Dox complex is
intended to control the release of drug. Folic acid-attached CDs
preserve the ability to form non-covalent complexes with the guest
drug and in so doing altering their physicochemical properties.
The retarded and sustained drug release profile was observed for
FACD-Ada-Dox. At the same drug load, the cumulative release of
the prodrug in water after 1.5 hr approached 50% compared to
,20% in the prodrug, which is desired to improve efficacy and
minimize toxicity.
Figure 14. Determination of intraceullar ROS, GPx and GSHlevels in mouse heart H9C2(2-1) cells. Plot a shows the level ofintracellular ROS in H9C2(2-1) cells treated with Dox, Ada-Dox or FACD-Ada-Dox at 2.0 mM for 18vhr at 37uC in the culture media. Cells weretreated with CM-H2DCFDA. Plot b displays the activity of GPx in H9C2(2-1) cells in the presence of Dox, Ada-Dox or FACD-Ada-Dox at 2.0 mM.Plot c shows the GSH concentrations (expressed as nmol/mg protein) inH9C2(2-1) cells in the presence of Dox, Ada-Dox or FACD-Ada-Dox at2.0 mM. Values are the mean 6 SD of three different homogenates ofcells analyzed in triplicate. *P,0.05; **P,0.01; and ***P,0.001.doi:10.1371/journal.pone.0062289.g014
FR Targeted Drug Complex for Cancer Treatment
PLOS ONE | www.plosone.org 16 May 2013 | Volume 8 | Issue 5 | e62289
Ta
ble
3.
Effe
cts
of
the
dru
gco
mp
lexe
so
nR
OS
leve
ls,
GP
xac
tivi
tyan
din
trac
ellu
lar
GSH
cofn
ten
tsin
mo
use
H9
C2
(2-1
)ca
rdio
myo
cyte
san
d3
T3
fib
rob
last
cells
.
Ce
llty
pe
FA
CD
-Ad
a-D
ox
vs
Do
xF
AC
D-A
da
-Do
xv
sA
da
-Do
xA
da
-Do
xv
sD
ox
NF
AC
D-A
da
-Do
xv
sD
ox
FA
CD
-Ad
a-D
ox
vs
NF
AC
D-A
da
-Do
x
H9
C2
(2-1
)R
OS
(Q)
GP
x(q
)G
SH
(q)
RO
S(q
)G
Px
(Q)
GS
H(Q
)R
OS
(Q)
GP
x(q
)G
SH
(q)
RO
S(Q
)G
Px
(q)
GS
H(q
)R
OS
(Q)
GP
x(Q
)G
SH
(Q)
Ch
ang
e(%
)4
1.6
63
.78
0.0
68
.21
,95
3.0
62
0.1
5.1
62
.25
8.8
62
.01
7.4
61
2.1
44
.46
20
.83
37
.06
77
.93
07
.06
88
.93
9.1
63
.81
77
.16
26
.51
,95
5.4
66
9.8
4.1
60
.33
5.1
62
2.7
2.1
60
.4
Pva
lue
0.0
00
30
.02
09
0.0
00
10
.55
0.0
01
00
.00
26
0.0
00
30
.00
04
,0
.00
01
0.0
00
40
.00
56
0.0
00
10
.58
44
0.0
35
70
.68
33
3T
3R
OS
(Q)
GP
x(q
)G
SH
(q)
RO
S(q
)G
Px
(q)
GS
H(q
)R
OS
(Q)
GP
x(q
)G
SH
(q)
RO
SG
Px
(q)
GS
H(q
)R
OS
GP
x(Q
)G
SH
(q)
Ch
ang
e(%
)1
7.5
67
.63
26
.46
5.3
43
.46
0.5
2.5
66
.52
6.3
60
.74
1.8
61
8.4
19
.56
1.8
0.0
26
5.1
1.2
62
0.7
–2
9.1
65
.33
8.3
61
.7–
2.1
60
.05
3.7
61
.8
Pva
lue
0.0
04
80
.01
91
0.0
10
70
.49
33
0.0
28
70
.00
85
0.0
07
10
.99
82
0.9
03
50
.00
59
0.9
95
0.7
04
50
.63
6
q:
incr
eas
e;
Q:
de
cre
ase
.d
oi:1
0.1
37
1/j
ou
rnal
.po
ne
.00
62
28
9.t
00
3
Figure 15. Determination of intraceullar ROS, GPx and GSHlevels in mouse 3T3 cells. Plot a shows the level of intracellular ROSin 3T3 cells treated with Dox, Ada-Dox or FACD-Ada-Dox at 5.0 mM over60 min at 37uC in the culture media. Cells were treated with CM-H2DCFDA. Plot b displays the activity of GPx in 3T3 cells in the presenceof Dox, Ada-Dox or FACD-Ada-Dox at 5.0 mM. Plot c shows the GSHconcentrations (expressed as nmol/mg protein) in 3T3 cells in thepresence of Dox, Ada-Dox or FACD-Ada-Dox at 5.0 mM. Values are themean 6 SD of three different homogenates of cells analyzed intriplicate. *P,0.05; **P,0.01; and ***P,0.001.doi:10.1371/journal.pone.0062289.g015
FR Targeted Drug Complex for Cancer Treatment
PLOS ONE | www.plosone.org 17 May 2013 | Volume 8 | Issue 5 | e62289
The targeted drug FACD-Ada-Dox exhibits significantly
enhanced cellular uptake compared with the non-targeted drugs
by FR(+) JAR cells. The tumor targeting of FACD-Ada-Dox
facilitates faster and increased cellular internalization than
NFACD-Ada-Dox. The ligand binding strategy allows preferential
internalization of FACD-Ada-Dox into FR(+) cancer cells. FACD-
Ada-Dox is taken up at a rate of eight times faster than NFACD-
Ada-Dox, while for the HT-29 and MCF-7 cells on which FR is
poorly expressed, the binding affinity is comparable among Dox,
Ada-Dox, FACD-Ada-Dox, and NFACD-Ada-Dox, except that
targeting results in slightly higher drug uptake than non-targeted
drugs. The uptake of the targeted drug molecule in JAR cells was
significantly inhibited by folate at 5–50 mM. This offers further
evidence that the targeted nanoparticles are internalized through
FR-mediated pathway. Consistently, the cell killing effects of
FACD-Ada-Dox are significantly higher than NFACD-Ada-Dox
in FR(+) cells.
It is expected that alleviating cardiotoxicity and enhancing the
anticancer efficacy will be achieved when Dox is administered in a
slow-release targeting drug complex allowing specific accumula-
tion in tumor cells and reducing the free radicals thought to cause
cardiotoxicity. The classical strategies to improve the efficacy and
reduce organ toxicity of Dox include: a) enhancing Dox uptake by
tumor cells via proper targeting approach and nanotechnology; b)
Dox-based prodrugs that can readily activated within tumor cells
via liposomal encapsulation or conjugation with antibodies,
peptides, or synthetic polymers; c) diminishing Dox deactivation;
d) reducing Dox efflux from tumor cells that is often mediated by
active drug transporters such as MDR1; e) blocking the
antioxidant defense of tumor cells; and f) modulating signaling
pathways and cell cycles to sensitize tumor cells to Dox therapy
[34]. Each of these means has certain advantages and limitations
and sometimes a combination of these strategies may be required
to maximize tumor cell killing and minimize organ toxicity [35].
The clinical usage of Dox is limited by cumulative, dose-related,
progressive myocardial damage that may lead to congestive heart
failure in cancer patients [15]. The cardiotoxicity induced by Dox
appears to be a multi-factorial process caused primarily by
oxidative stress-induced free radicals involving both Dox and its
toxic metabolites such as doxorubicinol [13,15]. The mechanism
for the therapeutic effect of Dox is thought to be different from
that of its cardiotoxicity. The slow-releasing targeted drug complex
is expected to elicit less deleterious effects on normal cells. The
results showed that ROS accumulation inside cells after FACD-
Ada-Dox and Ada-Dox treatment was less than for free Dox in
both mouse H9C2(2-1) cardiomyocytes and fibroblast 3T3 cells.
Furthermore, the activity of GPx and GSH content were
significantly increased in H9C2(2-1) cells treated with FACD-
Ada-Dox compared to cells treated with free Dox. This suggests
that the higher GSH levels seen with FACD-Ada-Dox could be
sufficient to remarkably decrease ROS levels, thereby maintaining
the function and increasing survival for normal cardiomyocytes
under chemotherapy.
The protective effect of FACD-Ada-Dox is more apparent than
the prodrug Ada-Dox in both H9C2(2-1) cardiomyocytes and
fibroblast 3T3 cells. This suggests that targeting FR in FR(+)
cardiomyocytes is not the main determinant for Dox-induced
cardiotoxicity. A lower ROS production and higher increase in
GPx activity and GSH content in cells treated with FACD-Ada-
Dox than Ada-Dox can be ascribed to a lesser release of free Dox
from the FR-targeted complex than the prodrug Ada-Dox,
resulting in less uptake of cardiotoxic Dox. A more significant
protection of FACD-Ada-Dox and Ada-Dox in H9C2(2-1)
cardiomyocytes than fibroblasts is likely due to differential
expression of FR protein and binding affinity to FRs. In addition,
the distinct expression and activity levels of RFC and PCFT in
different types of cells that participate in FA transport across the
membrane may also contribute to the differential protection
observed in this study. Drug treatment time is another important
factor that can affect the Dox-induced ROS production and the
protective effect of FACD-Ada-Dox and Ada-Dox. A longer drug
exposure may facilitate the conversion of Dox to its cardiotoxic
metabolites such as 7-deoxy-doxorubicinone and doxorubicinol,
thereby enhancing the signaling transduction for the production of
ROS and reactive nitrogen species.
In this study, we synthesized the Ada-Dox conjugate rather than
Dox as the cargos. Adamantine has very strong host-guest
interaction by molecular recognization and high binding affinity
with the cyclodextrin cavity since the geometry of the adamantine
fits well with the inner cavity, and in this way the drug will be
entrapped tightly by CD molecules and thus reducing drug
release. Another reason is that Ada-Dox preserve strong fluores-
cence and we could readily trace the drug inside cells.
Based on the data from our MTT, cellular uptake and binding
and cardiomyocyte protection assays, the prodrug Ada-Dox has
showed totally different behaviors compared to free Dox. It is less
toxic to the cancer cells than Dox in vitro and can protect the
cardiomyocytes from Dox-induced injuries. These findings suggest
that design of prodrugs for Dox represents an alternative way to
ameliorate the organ toxicity and enhance the anticancer efficacy
of Dox. A number of Dox-based prodrugs have been synthesized
and reported [36–38], but their efficacy and safety profiles must be
validated in cancer patients.
Since the crystal structure of human FR members is not
resolved so far, we used the structure of HHIP containing a FRadomain to examine whether conjugation of b-CD could affect the
FA-FR binding. The results showed that both FA and FACD
could be readily docked into the possible binding site of HHIP and
Ada-Dox could form weak binding with HHIP. Because FACD-
Ada-Dox is a supramolecule with nonconvalent binding, we have
difficulties in generating this larger molecule and docking into
HHIP using the CDOCKER module in Discovery Studio 3.1.
Our docking results suggest that FA, FACD and FACD-Ada-Dox
could bind the FRs on the surface of cancer cells and thus facilitate
endocytosis.
In summary, we have reported the successful synthesis and
purification of novel water soluble, folic acid-conjugated b-
cyclodextrin-based targeting drug supramolecules with adaman-
tine-doxorubicin as the therapeutic cargo. The structures have been
rigorously characterized by HR-MALDI-TOF-MS, 1D/2D NMR,
FTIR, HPLC, and circular dichroism. The targeted drug complex
possesses high drug association and sustained drug release
properties with good biocompatibility and physiological stability.
Cellular uptake and FR binding competitive experiments demon-
strated an efficient and preferentially targeted delivery of Dox into
FR-positive carcinomatous cells. Moreover, the decrease in ROS
levels and increase in GPx activity and GSH content in
cardiomyocytes exposed to the targeted Dox complex indicate the
cardiotoxicity by doxorubicin could be ameliorated by the selective
targeting of FR. The novel folic acid-conjugated b-CD based drug
complex reported here might be promising as an anti-tumor
treatment. In vivo animal studies are undertaking at our laboratory.
Supporting Information
Figure S1 The 1H-NMR spectrum of Ts-CD (400 MHz,D2O).
(TIF)
FR Targeted Drug Complex for Cancer Treatment
PLOS ONE | www.plosone.org 18 May 2013 | Volume 8 | Issue 5 | e62289
Figure S2 The ESI-MS spectrum of Ts-CD.(TIF)
Figure S3 The ESI spectrum of b-CD (a) and NH2-CD(b).(TIF)
Figure S4 LC-MS spectra of Ada-DOX (a & b).(TIF)
Figure S5 The 1H-NMR (a, 800 MHz, D2O) and 13C-NMR (b, 201 MHz, D2O) spectra of c-FACD.(TIF)
Figure S6 The g-COSY spectra of c-FACD (a, 600 MHz,D2O, and when zoomed within 6–8 ppm, b).(TIF)
Figure S7 The 1H-NMR (a, 600 MHz, D2O) and 13C-NMR (b, 201 MHz, D2O) spectra of a-FACD.(TIF)
Figure S8 The g-COSY spectra of a-FACD (a, 600 MHz,D2O; when zoomed within 6–8 ppm, b).(TIF)
Figure S9 The 1H-NMR spectrum of FA-diCD(600 MHz, D2O).(TIF)
Figure S10 The original HR-MALDI-TOF spectrum ofFA-diCD.(TIF)
Figure S11 The original HR-MALDI-TOF spectrum of c-FACD.(TIF)
Figure S12 The original HR-MALDI-TOF spectrum of a-FACD.(TIF)
Figure S13 The FTIR spectra of b-CD (a), N3-CD (b),NH2-CD (c), FA (d), and c-FACD (e).(TIF)
Figure S14 (a) The HPLC-ELSD chromatogram of b-CD
(black), NH2-CD (blue) and c-FACD (Magenta); (b) HPLC-UV
chromatogram of b-CD (Magenta), NH2-CD (blue) and c-FACD
(black); and (c) HPLC-DAD chromatograms of Ada-Dox (35 min),
Dox (9 min) and FACD-Ada-Dox (1.5 min).
(TIF)
Acknowledgments
The authors wish to thank Drs. Szekeres Karoly and Amanda Garces at
the Lisa Muma Weitz Advanced Microscopy Core Laboratory, Dr. Robert
W. Buzzeo at the Department of Cell Biology, Microbiology and
Molecular Biology, College of Arts and Sciences, and Dr. Emirov Yusuf
at the Nanotechnology Research & Education Center, University of South
Florida, Tampa, Florida, USA. We also thank Drs. Edwin Rivera and
David Badge at the NMR Facility at the University of South Florida, and
appreciate Dr. Laurent Calcul for the performance of HPLC-ELSD and
Dr. Kumar Mohanraja for the technical assistance of Mass Spectrometer at
the Department of Chemistry, University of South Florida, Tampa,
Florida, USA.
Author Contributions
Conceived and designed the experiments: JJY ZWZ YZ PG CZL JRK TY
SSM WL WD JCW QL XZ JT LJ JL MQW XL SFZ. Performed the
experiments: JJY SS SPS ZXW. Analyzed the data: JJY XZ JT CZL
MQW SFZ. Wrote the paper: JJY SS SPS. Edited the paper: PG CZL JRK
TY SSM JT XZ SFZ.
References
1. Thun MJ, DeLancey JO, Center MM, Jemal A, Ward EM (2010) The globalburden of cancer: priorities for prevention. Carcinogenesis 31: 100–110.
2. Ferlay J, Shin HR, Bray F, Forman D, Mathers C, et al. (2010) Estimates of
worldwide burden of cancer in 2008: GLOBOCAN 2008. Int J Cancer 127:
2893–2917.
3. Gatenby RA (2009) A change of strategy in the war on cancer. Nature 459: 508–509.
4. Chabner BA, Roberts TG Jr (2005) Timeline: Chemotherapy and the war oncancer. Nat Rev Cancer 5: 65–72.
5. Cotter TG (2009) Apoptosis and cancer: the genesis of a research field. Nat RevCancer 9: 501–507.
6. Yague E, Raguz S (2005) Drug resistance in cancer. Br J Cancer 93: 973–976.
7. Petros RA, DeSimone JM (2010) Strategies in the design of nanoparticles fortherapeutic applications. Nat Rev Drug Discov 9: 615–627.
8. Muro S (2012) Challenges in design and characterization of ligand-targeted drugdelivery systems. J Control Release 164: 125–137.
9. Lammers T, Kiessling F, Hennink WE, Storm G (2012) Drug targeting to
tumors: principles, pitfalls and (pre-) clinical progress. J Control Release 161:
175–187.
10. Wang AZ, Langer R, Farokhzad OC (2012) Nanoparticle delivery of cancerdrugs. Annu Rev Med 63: 185–198.
11. Kizek R, Adam V, Hrabeta J, Eckschlager T, Smutny S, et al. (2012)Anthracyclines and ellipticines as DNA-damaging anticancer drugs: recent
advances. Pharmacol Ther 133: 26–39.
12. Octavia Y, Tocchetti CG, Gabrielson KL, Janssens S, Crijns HJ, et al. (2012)
Doxorubicin-induced cardiomyopathy: from molecular mechanisms to thera-peutic strategies. J Mol Cell Cardiol 52: 1213–1225.
13. Minotti G, Menna P, Salvatorelli E, Cairo G, Gianni L (2004) Anthracyclines:molecular advances and pharmacologic developments in antitumor activity and
cardiotoxicity. Pharmacol Rev 56: 185–229.
14. Dickey JS, Rao VA (2012) Current and proposed biomarkers of anthracycline
cardiotoxicity in cancer: emerging opportunities in oxidative damage andautophagy. Curr Mol Med 12: 763–771.
15. Menna P, Paz OG, Chello M, Covino E, Salvatorelli E, et al. (2012)
Anthracycline cardiotoxicity. Expert Opin Drug Saf 11 Suppl 1: S21–36.
16. Salas C, Perez-Vera P, Frias S (2011) Genetic abnormalities in leukemia
secondary to treatment in patients with Hodgkin’s disease. Rev Invest Clin 63:53–63.
17. Mo SL, Liu WF, Li CG, Zhou ZW, Luo HB, et al. (2012) Pharmacophore,
QSAR, and binding mode studies of substrates of human cytochrome P450 2D6
(CYP2D6) using molecular docking and virtual mutations and an application to
chinese herbal medicine screening. Curr Pharm Biotechnol 13: 1640–1704.
18. Mo SL, Liu WF, Chen Y, Luo HB, Sun LB, et al. (2012) Ligand- and protein-
based modeling studies of the inhibitors of human cytochrome P450 2D6 and a
virtual screening for potential inhibitors from the Chinese herbal medicine,
Scutellaria baicalensis (Huangqin,Baikal Skullcap). Comb Chem High Through-
put Screen 15: 36–80.
19. Bishop B, Aricescu AR, Harlos K, O’Callaghan CA, Jones EY, et al. (2009)
Structural insights into hedgehog ligand sequestration by the human hedgehog-
interacting protein HHIP. Nat Struct Mol Biol 16: 698–703.
20. Roy PP, Roy K (2010) Pharmacophore mapping, molecular docking and QSAR
studies of structurally diverse compounds as CYP2B6 inhibitors. Mol Simul 36:
887–905.
21. Wu G, Robertson DH, Brooks CL 3rd, Vieth M (2003) Detailed analysis of grid-
based molecular docking: A case study of CDOCKER-A CHARMm-based MD
docking algorithm. J Comput Chem 24: 1549–1562.
22. Eruslanov E, Kusmartsev S (2010) Identification of ROS using oxidized DCFDA
and flow-cytometry. Methods Mol Biol 594: 57–72.
23. Wang H, Joseph JA (1999) Quantifying cellular oxidative stress by dichloro-
fluorescein assay using microplate reader. Free Radic Biol Med 27: 612–616.
24. Beutler E, Duron O, Kelly BM (1963) Improved method for the determination
of blood glutathione. J Lab Clin Med 61: 882–888.
25. Petter RC, Salek JS, Sikorski CT, Kumaravel G, Lin FT (1990) Cooperative
binding by aggregated mono-6-(alkylamino)-b-cyclodextrins. J Am Chem Soc
112: 3860–3868.
26. Crider KS, Yang TP, Berry RJ, Bailey LB (2012) Folate and DNA methylation:
a review of molecular mechanisms and the evidence for folate’s role. Adv Nutr 3:
21–38.
27. Sabharanjak S, Mayor S (2004) Folate receptor endocytosis and trafficking. Adv
Drug Deliv Rev 56: 1099–1109.
28. Hilgenbrink AR, Low PS (2005) Folate receptor-mediated drug targeting: from
therapeutics to diagnostics. J Pharm Sci 94: 2135–2146.
29. Zhao X, Li H, Lee RJ (2008) Targeted drug delivery via folate receptors. Expert
Opin Drug Deliv 5: 309–319.
FR Targeted Drug Complex for Cancer Treatment
PLOS ONE | www.plosone.org 19 May 2013 | Volume 8 | Issue 5 | e62289
30. Weitman SD, Lark RH, Coney LR, Fort DW, Frasca V, et al. (1992)
Distribution of the folate receptor GP38 in normal and malignant cell lines andtissues. Cancer Res 52: 3396–3401.
31. Davis ME, Brewster ME (2004) Cyclodextrin-based pharmaceutics: past, present
and future. Nat Rev Drug Discov 3: 1023–1035.32. Chen G, Jiang M (2011) Cyclodextrin-based inclusion complexation bridging
supramolecular chemistry and macromolecular self-assembly. Chem Soc Rev40: 2254–2266.
33. Granadero D, Bordello J, Perez-Alvite MJ, Novo M, Al-Soufi W (2010) Host-
guest complexation studied by fluorescence correlation spectroscopy: adaman-tane-cyclodextrin inclusion. Int J Mol Sci 11: 173–188.
34. Hanusova V, Bousova I, Skalova L (2011) Possibilities to increase theeffectiveness of doxorubicin in cancer cells killing. Drug Metab Rev 43: 540–
557.
35. Kratz F, Warnecke A (2012) Finding the optimal balance: Challenges of
improving conventional cancer chemotherapy using suitable combinations withnano-sized drug delivery systems. J Control Release 164: 221–235.
36. Fan J, Fang G, Zeng F, Wang X, Wu S (2012) Water-dispersible fullerene
aggregates as a targeted anticancer prodrug with both chemo- and photody-namic therapeutic actions. Small.
37. Hochdorffer K, Abu Ajaj K, Schafer-Obodozie C, Kratz F (2012) Developmentof novel bisphosphonate prodrugs of doxorubicin for targeting bone metastases
that are cleaved pH dependently or by cathepsin B: synthesis, cleavage
properties, and binding properties to hydroxyapatite as well as bone matrix.J Med Chem 55: 7502–7515.
38. Legigan T, Clarhaut J, Renoux B, Tranoy-Opalinski I, Monvoisin A, et al.(2012) Synthesis and antitumor efficacy of a b-glucuronidase-responsive
albumin-binding prodrug of doxorubicin. J Med Chem 55: 4516–4520.
FR Targeted Drug Complex for Cancer Treatment
PLOS ONE | www.plosone.org 20 May 2013 | Volume 8 | Issue 5 | e62289