Synthesis of Functional Block Copolymers for use in Nano ...
216
Synthesis of Functional Block Copolymers for use in Nano-hybrids D I S S E R T A T I O N zur Erlangung des akademischen Grades Doctor rerum naturalium (Dr. rer. nat.) vorgelegt der Fakultät Mathematik und Naturwissenschaften der Technischen Universität Dresden von M.Sc. Saber Ibrahim geboren am 26.06.1976 in Cairo Eingereicht am 22 März 2011 Die Dissertation wurde in der Zeit von Januar 2007 bis Januar 2011 im Leibniz-Institut für Polymerforschung Dresden e.V. angefertigt.
Transcript of Synthesis of Functional Block Copolymers for use in Nano ...
Synthesis of Functional Block Copolymers for
use in Nano-hybrids
D I S S E R T A T I O N
zur Erlangung des akademischen Grades
Doctor rerum naturalium (Dr. rer. nat.)
vorgelegt
der Fakultät Mathematik und Naturwissenschaften der Technischen Universität Dresden
von
M.Sc. Saber Ibrahim
geboren am 26.06.1976 in Cairo
Eingereicht am 22 März 2011
Die Dissertation wurde in der Zeit von Januar 2007 bis Januar 2011 im Leibniz-Institut für Polymerforschung Dresden e.V. angefertigt.

dedicated to
My parents

Acknowledgement
I entered the Leibniz Institute of Polymer Research to get a degree, but what I gained is not
only a degree but experience, knowledge, friendship and hopefully wisdom. A lot of people
helped me and supported me to reach my goal; I would like to acknowledge their
contributions and offer my gratitude.
First, a special thanks to my supervisor, Professor Brigitte Voit, for his invaluable guidance
and support in both my academic and personal life. I believe I have been extremely lucky to
have her as my mentor. I consider her not only as a supervisor but also as a mother figure who
guided me and helped me to adapt myself to the new environment and the culture of
Germany. Many thanks also go to Dr. Klaus-Jochen Eichhorn for his help and support and
also for sharing his experience with me. I have learned a lot from our many discussions. I
would also like to express my appreciation to Dr. Frank Simon, for his generosity of patience
in answering my many questions.
I would like to specially thank Dr. Ulrich Oertel, Mrs. Bettina Pilch for carrying out the UV-
VIS experiments, Dr. Hartmut Komber for NMR examination, Dr. Peter Formanek for their
patience with me and for training me in TEM lab and Dr. Frank Simon and Mr. Dieter Pleul
for XPS measurements. These people did a lot of efforts to accomplish the performed task. I
appreciate Mr. Roland Schulze, Mrs. Gudrun Adam and Mr. Andreas Janke for ellipsometric
measurements, IR measurements and helpful discussions in AFM interpretation, respectively.
I am thankful to our institute secretary Mrs. Carmen Krause for a great help and support
during my staying in IPF institute. Also, I would like to acknowledge Mrs. Christine Krause,
Mr. Hellbach and Mr. Helfried Kunath for helping me out with chemicals, glass equipments
and technical support in the laboratory work.
I am indebted to my many of my colleagues to support me from the first day in my PhD
mission, especially Sven Fleishmann and Jan Stadermann. I extend my thanks to my friends
Hamed Elsayed and Tarek Salem for their always encouraging and motivating support
throughout my Ph.D.

I am extremely grateful for the support of my family. I would like to thank my brothers for
their moral support. Finally, and most importantly, Special thanks to my dear wife without her
generosity and determination I wouldn’t be able to come over live and research challenges. I
would like to thank the dearest person in my life, my mother and Father, for dedicating their
life to our family.
A final praise goes out to the Lord my God who is my source and has provided me with a
community of friends and family that has made my life here so enjoyable and worthwhile. I
know that outside of Him there is nothing that I can do.
Content .
i
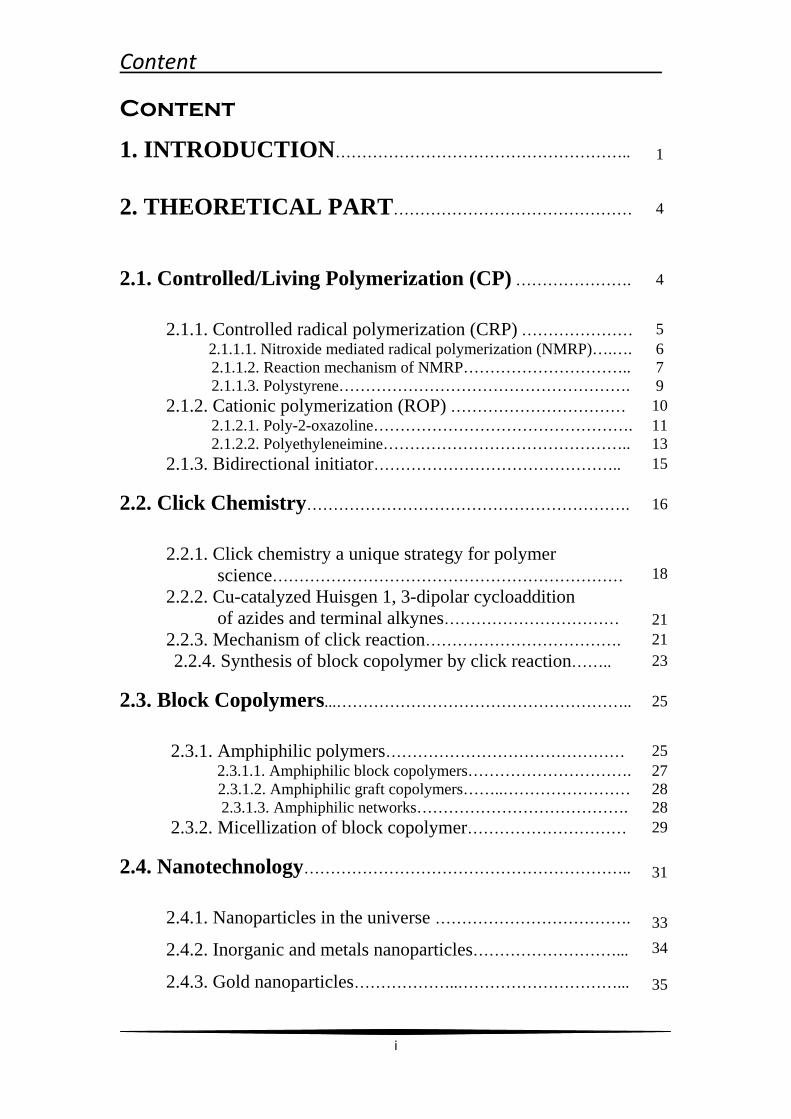
Content
1. INTRODUCTION………………………………………………..
1
2. THEORETICAL PART……………………………………… 4
2.1. Controlled/Living Polymerization (CP) …………………. 4
2.1.1. Controlled radical polymerization (CRP) ………………… 5 2.1.1.1. Nitroxide mediated radical polymerization (NMRP)….…. 6 2.1.1.2. Reaction mechanism of NMRP………………………….. 7 2.1.1.3. Polystyrene………………………………………………. 9 2.1.2. Cationic polymerization (ROP) …………………………… 10 2.1.2.1. Poly-2-oxazoline…………………………………………. 11 2.1.2.2. Polyethyleneimine……………………………………….. 13 2.1.3. Bidirectional initiator……………………………………….. 15
2.2. Click Chemistry……………………………………………………. 16
2.2.1. Click chemistry a unique strategy for polymer science…………………………………………………………
18
2.2.2. Cu-catalyzed Huisgen 1, 3-dipolar cycloaddition of azides and terminal alkynes…………………………… 21 2.2.3. Mechanism of click reaction………………………………. 21
2.2.4. Synthesis of block copolymer by click reaction…….. 23
2.3. Block Copolymers...……………………………………………….. 25
2.3.1. Amphiphilic polymers……………………………………… 25 2.3.1.1. Amphiphilic block copolymers…………………………. 27 2.3.1.2. Amphiphilic graft copolymers……..…………………… 28 2.3.1.3. Amphiphilic networks…………………………………. 28 2.3.2. Micellization of block copolymer………………………… 29
2.4. Nanotechnology…………………………………………………….. 31
2.4.1. Nanoparticles in the universe ………………………………. 33
2.4.2. Inorganic and metals nanoparticles………………………...
2.4.3. Gold nanoparticles………………..…………………………...
34
35
Content .
ii
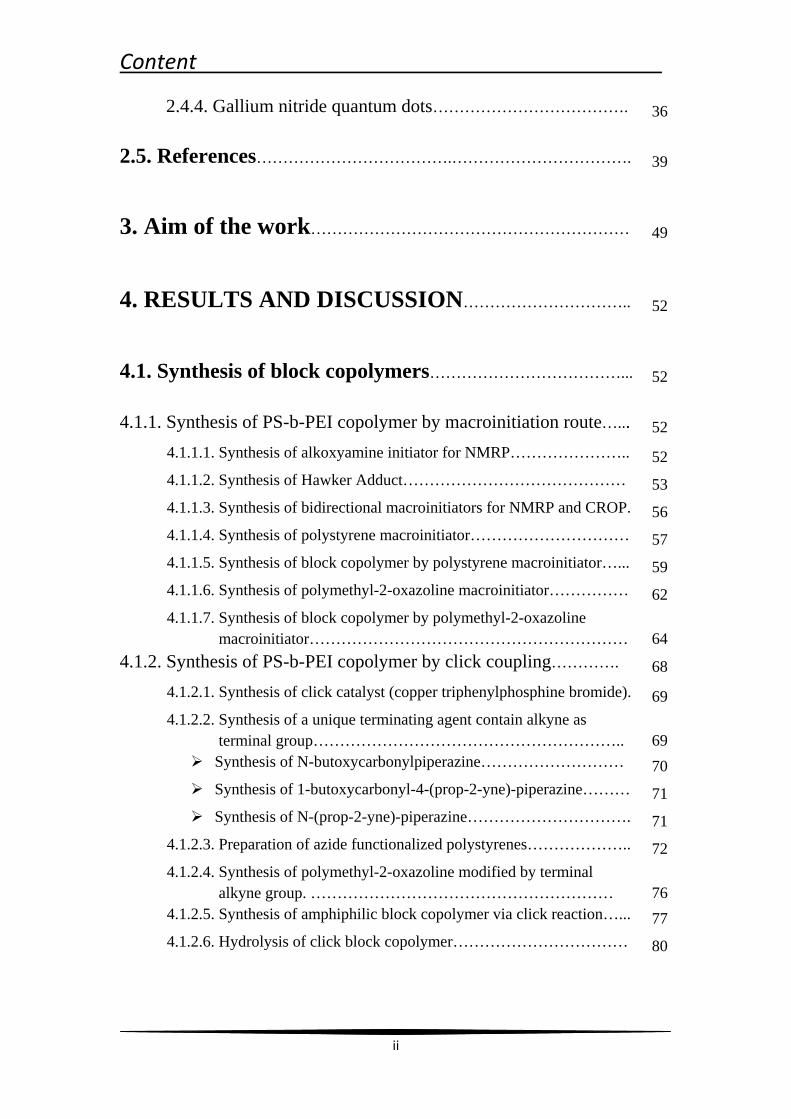
2.4.4. Gallium nitride quantum dots………………………………. 36
2.5. References……………………………….……………………………. 39
3. Aim of the work…………………………………………………… 49
4. RESULTS AND DISCUSSION………………………….. 52
4.1. Synthesis of block copolymers………………………………... 52
4.1.1. Synthesis of PS-b-PEI copolymer by macroinitiation route…... 52
4.1.1.1. Synthesis of alkoxyamine initiator for NMRP………………….. 52
4.1.1.2. Synthesis of Hawker Adduct…………………………………… 53
4.1.1.3. Synthesis of bidirectional macroinitiators for NMRP and CROP. 56
4.1.1.4. Synthesis of polystyrene macroinitiator………………………… 57
4.1.1.5. Synthesis of block copolymer by polystyrene macroinitiator…... 59
4.1.1.6. Synthesis of polymethyl-2-oxazoline macroinitiator…………… 62
4.1.1.7. Synthesis of block copolymer by polymethyl-2-oxazoline macroinitiator……………………………………………………
64
4.1.2. Synthesis of PS-b-PEI copolymer by click coupling…………. 68
4.1.2.1. Synthesis of click catalyst (copper triphenylphosphine bromide). 69
4.1.2.2. Synthesis of a unique terminating agent contain alkyne as terminal group…………………………………………………..
69
Synthesis of N-butoxycarbonylpiperazine……………………… 70
Synthesis of 1-butoxycarbonyl-4-(prop-2-yne)-piperazine……… 71
Synthesis of N-(prop-2-yne)-piperazine…………………………. 71
4.1.2.3. Preparation of azide functionalized polystyrenes……………….. 72
4.1.2.4. Synthesis of polymethyl-2-oxazoline modified by terminal alkyne group. …………………………………………………
76
4.1.2.5. Synthesis of amphiphilic block copolymer via click reaction…... 77
4.1.2.6. Hydrolysis of click block copolymer…………………………… 80
Content .
iii
4.1.3. Investigation of block copolymers………………………………… 84
4.1.3.1. FT-IR spectroscopy……………………………………………... 84
4.1.3.2. Thermal gravimetric analysis TGA……………………………. 86
4.1.3.3. Differential scanning calorimetric (DSC)……………………… 87
4.1.3.4. Ellipsometric measurement…………………………………….. 89
4.1.3.5. Atomic force microscopy (AFM) ……………………………… 89
4.1.3.6. Determination of critical micelles concentration (CMC) of block copolymers. ………………………………………………
92
4.1.4. Summary of block copolymers synthesis part………………….. 95
4.2. Nanoparticles/polymer twins…………………………………. 98
4.2.1. Gold nanoparticles / block copolymer hybrids…………………. 97
4.2.1.1. Synthesis and characterization of colloidal gold nanoparticles………………………………..……………………
99
4.2.1.2. Investigation of gold nanoparticles/block copolymer hybrids thin film………………………………………………………….
105
4.2.2. Gallium nitride quantum dots …………………………………..….. 123
4.2.2.1. Preparation of GaN (QDs)/block copolymer…………………… 123
4.2.2.2. Investigation of stabilized gallium nitride……………………… 126
4.3. SUMMARY………………………………………………………….. 139
5. EXPERIMENTAL PART…………………………………... 144
5.1. Starting materials and measurements……………………. 144
5.1.1. Analyses and measurements……………………………………….. 144
5.1.2. Reagents and solvents……………………………………………….. 161
Content .
iv
5.2. Synthesis of block copolymer………………………………….. 163
5.2.1. Synthesis of alkoxyamine initiator and macroinitiators……….. 163
5.2.1.1- Synthesis of alkoxyamine initiator……………………………… 163
5.2.1.2- Synthesis of polystyrene macroinitiator………………………… 166
5.2.1.3. Synthesis of polymethyl-2-oxazoline macroinitiator……………. 167
4.2.1.4. Hydrolysis of polymethyl-2-oxazoline………………………….. 168
5.2.2. Synthesis of block copolymer by macroinitiator route…………. 169
5.2.2.1. Synthesis of block copolymer by polystyrene or poly(2-methyl- 2- oxazoline) macroinitiator……………………………………..
169
5.2.3. Synthesis of block copolymer by click coupling……………….. 171
5.2.3.1. Synthesis of designed terminating agent containing terminal alkyne group……………………………………………………..
171
Synthesis of N-butoxycarbonylpiperazine protected with one side BOC group…………………………………………………..
171
Synthesis of 1-butoxycarbonyl-4-(prop-2-yne)-piperazine……… 172
Synthesis of N-(prop-2-yne)-piperazine by deprotecting of blocking BOC group……………………………………………...
173
5.2.3.2. Synthesis of click coupling catalyst…………………………….. 173
5.2.3.3. Click coupling block copolymer………………………………… 174
4.2.3.3.1. Transformation of the chlorine end group to an azide group in polystyrene…………………………………...
174
5.2.3.3.2. Alkyne- modified polymethyl-2-oxazoline…………… 175
5.2.3.3.3. Combining CROP and NMRP by click reaction……… 176
5.2.3.3.4. Hydrolysis of click block copolymer………………….. 177
5.3. Synthesis of stabilized nanoparticles………………………. 178
5.3.1. Preparation of gold nanoparticles/block polymer hybrids……... 178
5.3.2. Preparation of gallium nitride QDs………………………………... 178
5.3.2.1. Synthesis of lithium gallium hydride, LiGaH4…………………
178
5.3.2.2. Synthesis of trimethylamine gallane, (CH3)3NGaH3…………… 179
Content .
v
5.3.2.3. Synthesis of gallium nitride Quantum Dots…………………..
180
5.4. Polymer thin films..….………………………………………………… 180
5.4.1. Pre-cleaning of silicon-wafers……………………………………… 181
5.4.2. Preparation of thin layer of amphiphilic block copolymers…
181
6. References……………………………….………………………….…
183
7. List of symbols and abbreviations…………………...… 192
8. List of figures, schemes and tables…………….……… 199
Abstract
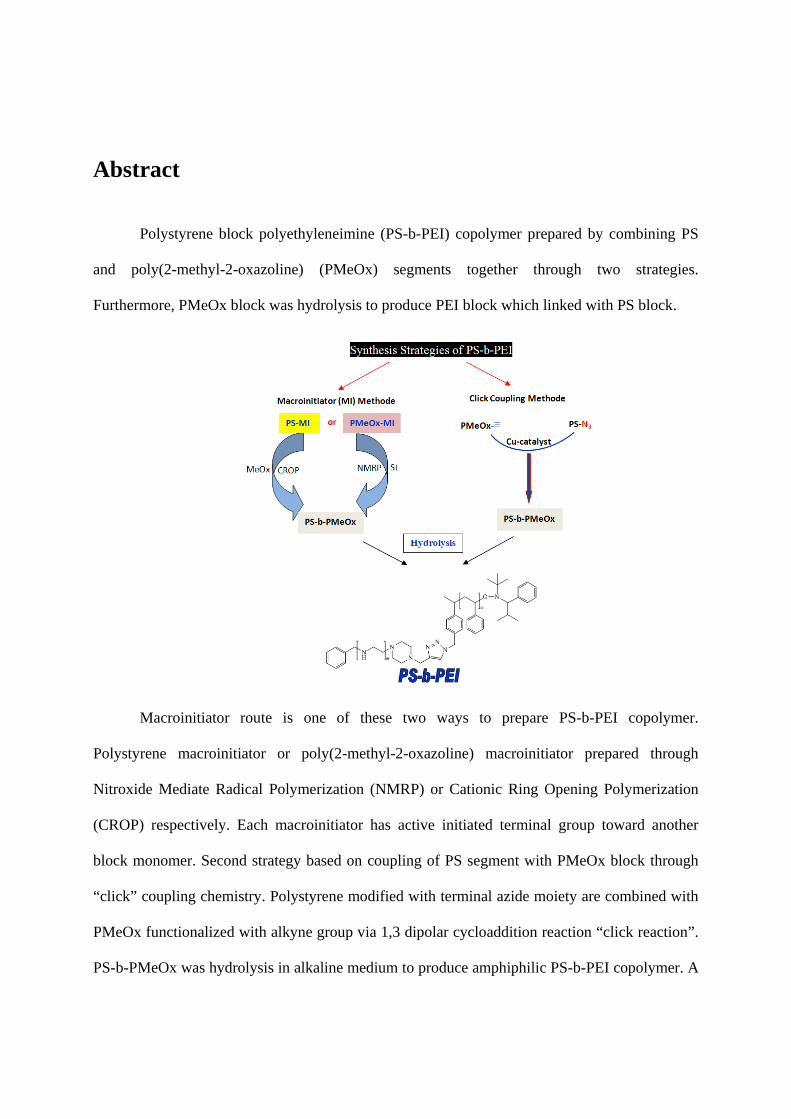
Polystyrene block polyethyleneimine (PS-b-PEI) copolymer prepared by combining PS
and poly(2-methyl-2-oxazoline) (PMeOx) segments together through two strategies.
Furthermore, PMeOx block was hydrolysis to produce PEI block which linked with PS block.
Macroinitiator route is one of these two ways to prepare PS-b-PEI copolymer.
Polystyrene macroinitiator or poly(2-methyl-2-oxazoline) macroinitiator prepared through
Nitroxide Mediate Radical Polymerization (NMRP) or Cationic Ring Opening Polymerization
(CROP) respectively. Each macroinitiator has active initiated terminal group toward another
block monomer. Second strategy based on coupling of PS segment with PMeOx block through
“click” coupling chemistry. Polystyrene modified with terminal azide moiety are combined with
PMeOx functionalized with alkyne group via 1,3 dipolar cycloaddition reaction “click reaction”.
PS-b-PMeOx was hydrolysis in alkaline medium to produce amphiphilic PS-b-PEI copolymer. A
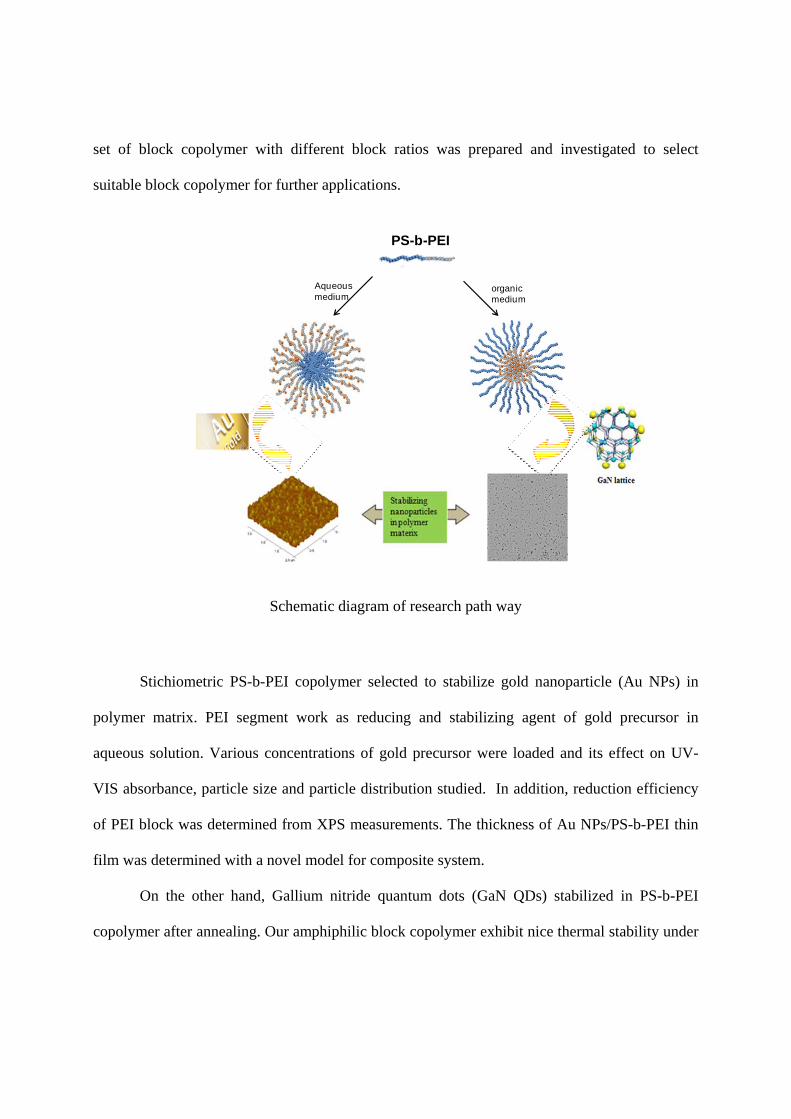
set of block copolymer with different block ratios was prepared and investigated to select
suitable block copolymer for further applications.
Schematic diagram of research path way
Stichiometric PS-b-PEI copolymer selected to stabilize gold nanoparticle (Au NPs) in
polymer matrix. PEI segment work as reducing and stabilizing agent of gold precursor in
aqueous solution. Various concentrations of gold precursor were loaded and its effect on UV-
VIS absorbance, particle size and particle distribution studied. In addition, reduction efficiency
of PEI block was determined from XPS measurements. The thickness of Au NPs/PS-b-PEI thin
film was determined with a novel model for composite system.
On the other hand, Gallium nitride quantum dots (GaN QDs) stabilized in PS-b-PEI
copolymer after annealing. Our amphiphilic block copolymer exhibit nice thermal stability under
Aqueousmedium
organicmedium
PS-b-PEI

annealing conditions. GaN QDs prepared in narrow nano-size with fine particle distribution.
Blue ray was observed as an indication to emission activity of GaN crystal.
Over all, PS-b-PEI copolymer synthesized through macroinitiator and click coupling
methods. It was successfully stabilized Au NPs and GaN QDs in polymer matrix with controlled
particle size which can be post applied in tremendous industrial and researcher fields.
Introduction and Theoretical Part 1
1. Introduction
“I am inclined to think that the development of polymerization is perhaps the
biggest thing chemistry has done, where it has had the biggest effect on
everyday life [1]”
When you get up and open your eyes, you can’t imagine your life without polymers.
Therefore, I agree with Lord Todd thinking. If polymers are absent in our live, we will loose
most of optional applications of polymers in daily life. For that reason, polymer chemistry is
one of the most beneficial sciences that have been done. For instance, polystyrene,
poly(ethylene), poly(propylene), poly(vinyl chloride) (PVC), poly(methyl methacrylate),
polyurethane, polyamide and polyester are only a few examples of the employed polymers
in everyday life. In the USA alone the production of plastic resin last year was more than
sixteen million tons. Furthermore, polymers have a wide use in industry, agriculture, and
medicine owing to their remarkable properties such as water solubility and potential
biocompatibility. Moreover, they are applied as coatings, adhesives, surfactants, blood
coagulants, polymeric antioxidants and photopolymers [2;3].
With growing specificity of polymer applications, increased synthetic control is
required in the preparation of materials for advanced technological purposes. Predictable
molecular weights and molecular weight distributions in addition to controlled chemical
compositions are essential for the design of systems for future technologies. Furthermore,
manipulation of polymer architecture is essential in the design of specific polymeric
materials. Research objectives will address both fundamental issues and the utility of living
polymerization techniques to produce new materials with tailored properties through the
control of the molecular weight, polydispersity, chemical composition, and design.
Today, uniform polymers with tailored size, block and graft copolymers, functional
polymers, and star and comb-shaped polymers can be produced by living and
controlled/living polymerization techniques. Additionally, there is a possibility to prepare
new polymers with controlled size, which are useful for a diversity of applications. Actually,
Introduction and Theoretical Part 2
the design and synthesis of well-defined structurally complex macromolecules has become a
major research direction in the field of materials science. However, many of the
transformation methods so far available exhibit the disadvantage of multistep syntheses,
which greatly reduces their practical applications. Future research must target the
simplification of transformation reactions as an objective that have the potential to achieve
materials with desired structures and properties [4].
A great attention is given to elucidate the stable free radical polymerization (SFRP)
or nitroxide mediate radical polymerization (NMRP) methodology. Recently, NMRP and
other controlled free radical polymerization techniques have been revealed to produce well-
defined polymerization reactions. These techniques enable researchers to control molecular
weights and polydispersities [5].
Nitroxide-mediated radical polymerization (NMRP) is one of three currently most
popular approaches towards a controlled radical polymerization. Polymeric materials which
synthesized by NMRP could be used as coatings, adhesives, surfactants, dispersants,
lubricants, gels, additives and thermoplastic elastomers, as well as materials for biomedical
applications.
The literature on NMRP is extensive and growing. Nowadays, the polymer chemistry
and other kinetic/mechanistic aspects of NMRP are considered as relatively well understood.
Detailed kinetic models that describe polymerization rate and molecular weight
development are available in the literature. However although NMRP is considered as
relatively well understood, there are no detailed/reliable experimental studies, conducted
over a range of reaction conditions, to validate/support mathematical models. The styrene
monomer is well known as a thermal polymerizable monomer. NMRP of styrene has proved
a high successful and controllable technique.
Cationic ring opening polymerization (CROP) is one of the most interesting
polymerization techniques under cationic polymerization. This appears as an important
technique beside anionic and radical polymerization. E.g. 2-alkyl-2-oxazolines are
polymerized by CROP. Poly(2-oxazoline)s based on methyl and ethyl 2-oxazolines have
Introduction and Theoretical Part 3
been found to be biocompatible and non toxic and are thus under intense study for biological
and biomedical applications, such as drug delivery systems and for the construction of
artificial cell membranes.
Gold nanoparticles were prepared by different methods. One of the most popular
techniques is based on reduction of gold salt HAuCl4 to a metal gold form and adds a
stabilizing agent to fix particles distribution and avoids coagulation of resultant
nanoparticles. Recently, a new approach was investigated based on, self-reducing and
stabilizing agents to prepare gold nanoparticles. Gold nanoparticles have tremendous
applications in biomedicine, electronics and cancer detection.
Gallium nitride (GaN) quantum dots (QDs) have recently received considerable
attention, because they are very promising materials for use in applications such as advanced
light emitting devices and high power electronic devices. The stability of gallium nitride is
our challenge by investigate a polymer cage to stabilize this evaluated benefits of GaN
(QDs).
In this work, polystyrene was prepared by NMRP with modified alkoxyamine
initiator, terminated with azide group, for further click reaction and an alkyne terminated
polyoxazoline was achieved through CROP. The polystyrene block was then combined with
poly-2-methyl-2-oxazoline through 1,3 dipolar cycloaddition reaction (click reaction). After
that, the click copolymer was subjected to hydrolysis to produce polystyrene-
polyethyleneimine block copolymer. Finally, gold nanoparticles and gallium nitride
quantum dots were stabilized in our amphiphilic block copolymer cage.
Introduction and Theoretical Part 4
2. Theoretical Background
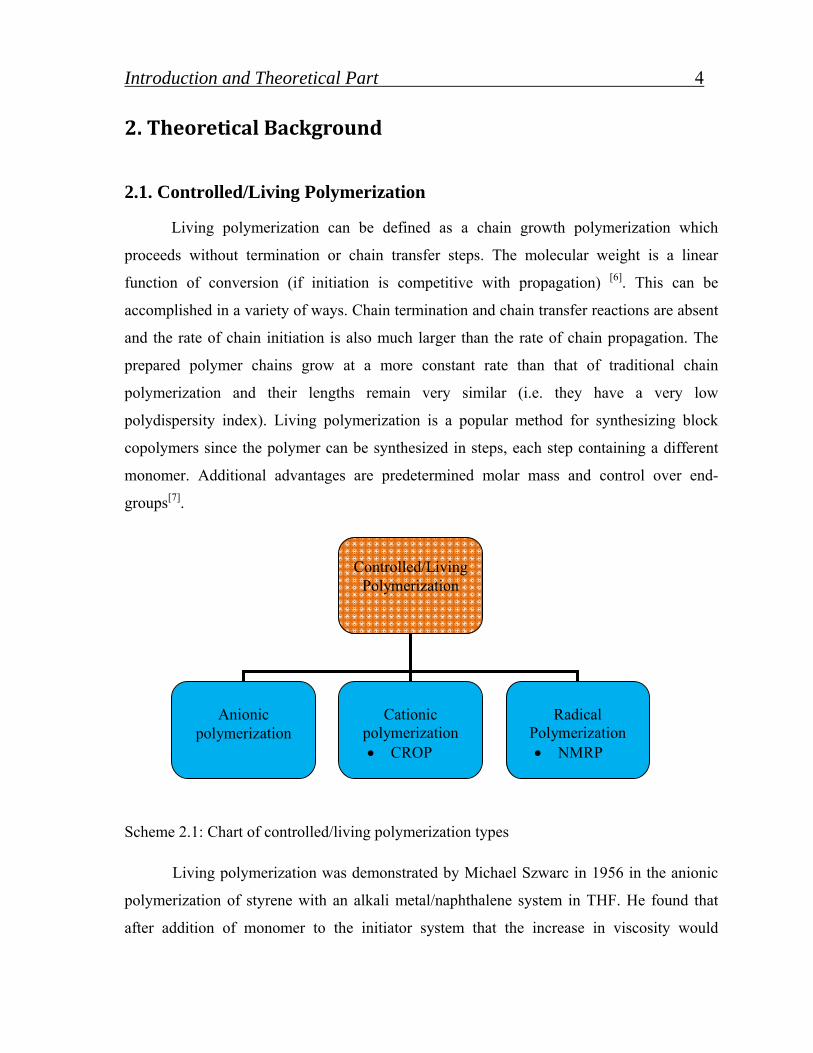
2.1. Controlled/Living Polymerization
Living polymerization can be defined as a chain growth polymerization which
proceeds without termination or chain transfer steps. The molecular weight is a linear
function of conversion (if initiation is competitive with propagation) [6]. This can be
accomplished in a variety of ways. Chain termination and chain transfer reactions are absent
and the rate of chain initiation is also much larger than the rate of chain propagation. The
prepared polymer chains grow at a more constant rate than that of traditional chain
polymerization and their lengths remain very similar (i.e. they have a very low
polydispersity index). Living polymerization is a popular method for synthesizing block
copolymers since the polymer can be synthesized in steps, each step containing a different
monomer. Additional advantages are predetermined molar mass and control over end-
groups[7].
Controlled/Living
Polymerization
Anionic
polymerization
Cationic
polymerization CROP
Radical
Polymerization NMRP
Scheme 2.1: Chart of controlled/living polymerization types
Living polymerization was demonstrated by Michael Szwarc in 1956 in the anionic
polymerization of styrene with an alkali metal/naphthalene system in THF. He found that
after addition of monomer to the initiator system that the increase in viscosity would
Introduction and Theoretical Part 5
eventually cease but that after addition of a new amount of monomer after some time the
viscosity would start to increase again [7-9].
Living polymerization can be presented by different types of polymerization
techniques as Anionic Polymerization (AP), Cationic Polymerization (CP) and Radical
Polymerization (RP) as shown in scheme 2.1. CROP of 2-alkyl-2-oxazoline and NMRP of
styrene are two sub-titles under cationic and radical polymerization, respectively. These
techniques are combined together to investigate a well-defined amphiphilic block copolymer
via click reaction. The basic principle of these two vital techniques will be discussed in the
following stages.
2.1.1 Controlled radical polymerization (CRP)
Until a little more than a decade ago, “controlled/living radical polymerization
(CRP/LRP)” would have been a highly impossible concept. Simultaneous control over all
aspects, including molecular weight distribution, end-functionality and macromolecular
architecture, is impossible for regular radical polymerization (RP) due to its slow initiation,
fast propagation and inevitable radical-radical termination. The success of CRP is an
integration of advances in synthetic organic chemistry, living ionic polymerization and
conventional radical polymerization.
From the point of view for easy practice and the number of monomers capable of
being polymerized, the use of radical polymerization methods appears more attractive than
the living anionic polymerization. The evolution of techniques of controlled radical
polymerization in recent years is an attempt to control the termination and transfer reaction
leading to greater control over chain ends and polydispersity. Among the most utilized types
of CRP are nitroxide-mediated radical polymerization (NMRP) or Stable Free Radical
Polymerization (SFRP) [10-13], atom transfer radical polymerization (ATRP) [14;15] and
reversible addition fragmentation transfer (RAFT) [16-18].
The three controlled radical polymerization NMRP, ATRP and RAFT are commonly
known by the control of the polymerization with fast equilibrium reached between active
Introduction and Theoretical Part 6
and inactive species [19]. Important criteria of controlled radical polymerization to see the
effect and advantage of being able to control polymerization are:
Molecular weight Mn is a function of conversion.
Constant number of polymer molecules that is independent of conversion
Narrow molecular weight distribution ( as long as all chains grow uniformly)
Can make end functionalized (telechelic) polymer.
Can control polymer architecture.
The methods of controlled radical polymerization don’t verify all characteristics that
are demanded of a true living polymerization. Nevertheless, the polydispersities of the
polymers represented by such techniques is usually in the range 1.2 to 1.3, which is perfectly
adequate for many applications. Also interfere traces of water; the polymerization does not
affected, so that the preparative polymerizations are carried out much easier than when using
the anionic polymerization [19;20].
All of these methodologies use a radical mechanism to establish equilibrium between
the active and dormant polymer chains. Nitroxide mediate radical polymerization is one of
the unique techniques, which can be used to synthesis a well defined and controlled block
copolymers.
2.1.1.1. Nitroxide Mediated Radical Polymerization (NMRP)
In the past two decades, living free radical polymerization (LFRP) has emerged as a
powerful tool for synthesizing polymers with well-controlled compositions, functionalities,
and morphologies [21]. Nitroxide-mediated polymerization (NMP) [7;12;22-24] is a very
attractive CRP system because it is metal free and effective in the polymerization of a broad
range of monomers with various functionalities. This system provides colorless and odorless
polymers with no demanding purification. The control of the NMP process relies on the
reversible capture of the propagating species by nitroxides with formation of dormant chains
(alkoxyamines) (Scheme 2.2). Whenever this equilibrium is shifted toward the dormant
form, the stationary concentration of the active species is low and the irreversible chain
termination is limited. An alkoxyamine releases both the initiating radical and the nitroxide
Introduction and Theoretical Part 7
in a 1/1 molar ratio. Therefore, the initiator efficiency is close to unity, and the structure of
the chain ends is well defined with the initiating fragment of the alkoxyamine being attached
at the α-chain end and the nitroxide at the ω-chain end of the chains.
NMRP mediated by TEMPO was limited by slow polymerization (25-70 h), high
polymerization temperature (125-145 °C), and a limited range of suitable monomers, mainly
styrene and derivatives. NMRP was extended to acrylates with success with the assistance of
additives or duly substituted TEMPO. The discovery of new types of nitroxides (such as N-
tert-butyl-N-(1- diethylphosphono-2,2-dimethylpropyl)-N-oxyl or DEPN, 2,2,5,5-
tetramethyl-4-phenyl-3-azahexane-3-oxyl or TIPNO, N-tert.-butyl-α-isopropyl-α-
phenylnitroxid, TIPNO, and N-tert-butyl-(1-tert-butyl-2-ethylsulfinyl)propyl nitroxide or
BESN) also contributed to overcoming the original limitations [10].
So, nitroxide mediate radical polymerization (NMRP) became one of the unique
CRP techniques, which can be used to synthesize a variety of well-defined and controlled
block copolymers. In addition, it has rapidly become one of the versatile methods in
polymer synthesis. Alkoxyamine initiator for NMRP has been successfully used in
controlling polymerization of many monomers e.g. styrenes, acrylates, methacrylates and
several other relatively reactive monomers such as acrylamides, vinyl pyridines, and
acrylonitrile [22].
2.1.1.2. Reaction mechanism of NMRP
NMRP uses a persistent nitroxide radical to reversibly cap the growing polymer
chain. An N-alkoxyamine is typically used as the initiator in the polymerization process as
shown in Figure 2.1. At elevated temperatures, the C-ON bond of the alkoxyamine
undergoes a reversible homolytic cleavage, producing a persistent nitroxide radical and a
propagating active polymer radical. Throughout the polymerization, the nitroxide caps and
uncaps the growing chain, converting it to either a dormant or active state [25].
This equilibrium lies far to one side; in addition most polymer chains exist in the
dormant state. This reduces the concentration of propagating radical chains and therefore
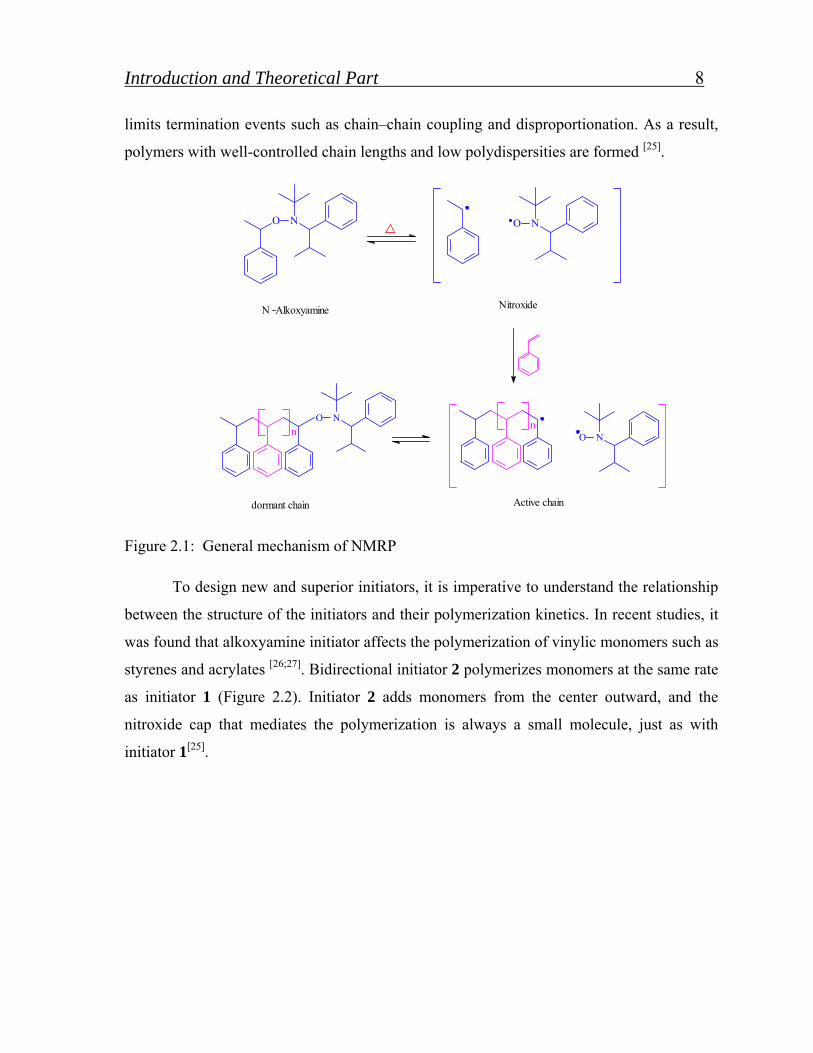
Introduction and Theoretical Part 8
limits termination events such as chain–chain coupling and disproportionation. As a result,
polymers with well-controlled chain lengths and low polydispersities are formed [25].
NO NO
N Alkoxyamine Nitroxide
nNO
NO
n
Active chaindormant chain
Figure 2.1: General mechanism of NMRP
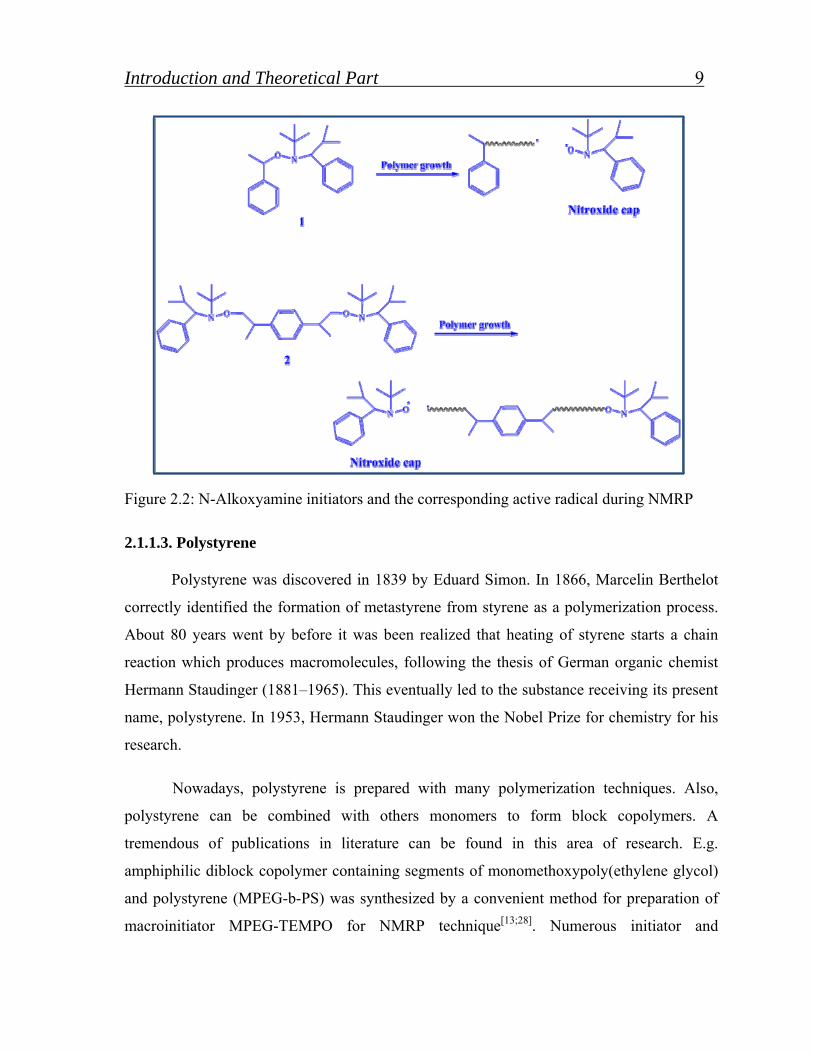
To design new and superior initiators, it is imperative to understand the relationship
between the structure of the initiators and their polymerization kinetics. In recent studies, it
was found that alkoxyamine initiator affects the polymerization of vinylic monomers such as
styrenes and acrylates [26;27]. Bidirectional initiator 2 polymerizes monomers at the same rate
as initiator 1 (Figure 2.2). Initiator 2 adds monomers from the center outward, and the
nitroxide cap that mediates the polymerization is always a small molecule, just as with
initiator 1[25].
Introduction and Theoretical Part 9
Figure 2.2: N-Alkoxyamine initiators and the corresponding active radical during NMRP
2.1.1.3. Polystyrene
Polystyrene was discovered in 1839 by Eduard Simon. In 1866, Marcelin Berthelot
correctly identified the formation of metastyrene from styrene as a polymerization process.
About 80 years went by before it was been realized that heating of styrene starts a chain
reaction which produces macromolecules, following the thesis of German organic chemist
Hermann Staudinger (1881–1965). This eventually led to the substance receiving its present
name, polystyrene. In 1953, Hermann Staudinger won the Nobel Prize for chemistry for his
research.
Nowadays, polystyrene is prepared with many polymerization techniques. Also,
polystyrene can be combined with others monomers to form block copolymers. A
tremendous of publications in literature can be found in this area of research. E.g.
amphiphilic diblock copolymer containing segments of monomethoxypoly(ethylene glycol)
and polystyrene (MPEG-b-PS) was synthesized by a convenient method for preparation of
macroinitiator MPEG-TEMPO for NMRP technique[13;28]. Numerous initiator and
Introduction and Theoretical Part 10
macroinitiator used to polymerized polystyrene via NMRP to prepare different types of
functionalized polymer of block copolymers were reported by Voit et al [23;29-32].
2.1.2. Cationic polymerization (CP)
The living cationic ring-opening polymerization (CROP) of 2-oxazolines was
discovered in 1966 [33-35] and it is nowadays a well-established method for the synthesis of
well-defined copolymers [36;37]. The polymerization can be initiated by electrophiles like
benzyl bromide and methyl tosylate resulting in the formation of a cationic oxazolinium
species as depicted in Figure 2.3. The C-O bond of the oxazolinium ring is weakened and
the propagation occurs by the nucleophilic attack of a second monomer to this carbon atom.
After consumption of all present monomer, a second monomer can be added for the
formation of a block copolymer or a nucleophile can be added for termination.
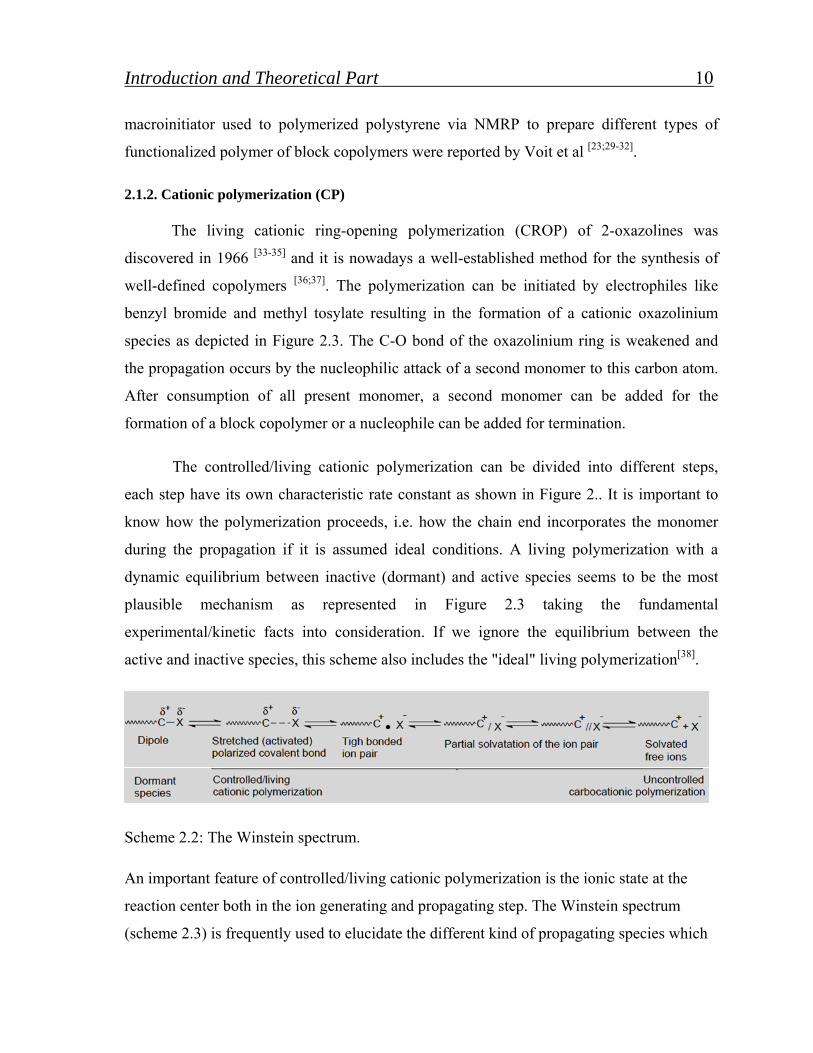
The controlled/living cationic polymerization can be divided into different steps,
each step have its own characteristic rate constant as shown in Figure 2.. It is important to
know how the polymerization proceeds, i.e. how the chain end incorporates the monomer
during the propagation if it is assumed ideal conditions. A living polymerization with a
dynamic equilibrium between inactive (dormant) and active species seems to be the most
plausible mechanism as represented in Figure 2.3 taking the fundamental
experimental/kinetic facts into consideration. If we ignore the equilibrium between the
active and inactive species, this scheme also includes the "ideal" living polymerization[38].
Scheme 2.2: The Winstein spectrum.
An important feature of controlled/living cationic polymerization is the ionic state at the
reaction center both in the ion generating and propagating step. The Winstein spectrum
(scheme 2.3) is frequently used to elucidate the different kind of propagating species which
Introduction and Theoretical Part 11
can exist in a polymerization system. One important aspect considering the equilibria is that
the rates of exchange between the species have a strong effect on molecular weight
distribution (MWD) of the end product [39].
Total control is not achieved until each step is mastered. This means initiation shall
only be performed by the added initiator and not by moisture or impurities like phosgene
(which can be formed by oxidation of the solvent, such as methylene chloride). If more than
one type of initiator is present, Poisson MWD cannot be attained, instead a polymodal
MWD will appear. Therefore, it is important to work under relatively pure conditions.
Furthermore, initiation has to be rapid, at least comparable to propagation, if narrow MWD
should be reached [40-43]. The next critical event is propagation (the nature of the propagating
chain end) which, considering the scheme 2.3 and the concept introduced in Figure 2.3 can
be guided into the wanted direction by additives like electron donors (EDs).
2.1.2.1. Poly-2-oxazoline
2-Oxazoline monomers are cyclic iminoethers typically substituted in the second
position (Figure 2.3). These monomers are polymerized by a ring-opening, cationic
mechanism which shows all typical features of a “living polymerization”. Starting at
temperatures above 40 °C, the propagation progresses via ionic or covalent active species,
the pathway strongly depends on the solvent and on the nature of the counter-ion. The more
nucleophilic counter-ion leads to ionic mechanism. The propagation follows a SN2
mechanism by nucleophilic attack of the nitrogen atom of the 2-oxazoline monomer onto the
carbon atom in 5-position of the propagating 2-oxazolinium ion through ring-opening. As
side reactions, chain transfer can take place. It proceeds via proton abstraction at the
propagating end by a monomer and an amine group [36;44;45].
Typical initiator reagents are Lewis acids as well as their stable salts (such as BF3,
Et3O+BF4¯), protonic acids, sulfonate esters and sulfonic anhydrides ((CH3)2SO4, p-
CH3C6·H4SO3CH3, CF3SO3CH3), alkyl halides (i.e. CH3I, C6H5CH2Br), electron acceptors
and oxazolinium salts [36;40;44]. Nucleophilic agents terminate the polymerization.
Termination reaction may occur in 2- and in 5-position, denoting the kinetic and the
Introduction and Theoretical Part 12
thermodynamic products, respectively. Secondary cyclic amines (e.g. piperidine) may
terminate selectively in the 5-position, hence they are the most commonly used[46].
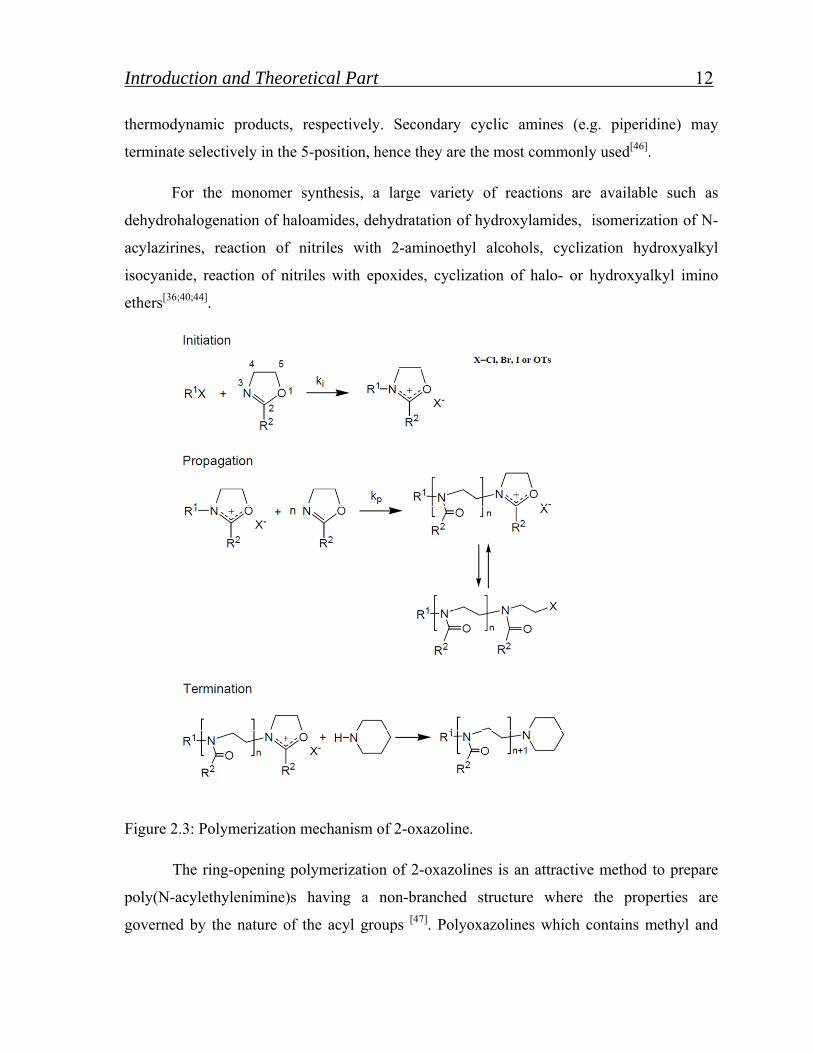
For the monomer synthesis, a large variety of reactions are available such as
dehydrohalogenation of haloamides, dehydratation of hydroxylamides, isomerization of N-
acylazirines, reaction of nitriles with 2-aminoethyl alcohols, cyclization hydroxyalkyl
isocyanide, reaction of nitriles with epoxides, cyclization of halo- or hydroxyalkyl imino
ethers[36;40;44].
Figure 2.3: Polymerization mechanism of 2-oxazoline.
The ring-opening polymerization of 2-oxazolines is an attractive method to prepare
poly(N-acylethylenimine)s having a non-branched structure where the properties are
governed by the nature of the acyl groups [47]. Polyoxazolines which contains methyl and
Introduction and Theoretical Part 13
ethyl acyl side-groups are water soluble polymers, whereas longer alkyl chains or aromatic
side chains result in hydrophobic polymers. Consequently, amphiphilic block copolymers
are easily accessible[48;49]. These “amphiphilic“ poly(2-oxazoline)s are an interesting class of
polymers[36;37] for applications as compatibilizers [37;50] , emulsifiers [37;51;52] or dispersants [37;53]. Moreover, poly(2-oxazoline)s have been used for micellar catalysis [54], the
preparation of hollow nanotubes [55] and for the modification of enzymes [56;57]. It is
generally known that the monomer distribution in a copolymer can have a significant
influence on the properties of the polymers as well, whereby the extreme cases are random
and block copolymers [58;59]. In literature, the synthesis and several structure-property
relationships (regarding properties such as glass transition, melting point, surface energy,
etc.) of random and block copoly(oxazoline)s with various side groups is described and
compared [60-64].
There are numerous publications on the polymerization of 2-oxazoline due to the
previously mentioned applications and attendance to combing its cationic ring opening
polymerization technique with another polymerization methods. Thus, the cationic ring-
opening polymerization and its kinetic studies of 2-methyl-2-oxazoline (2-MeOx) have been
reported [65;66]. Also, poly(2-methyl-, 2-anonyl- and 2-ethyl-2-oxazoline graft copolymers
were prepared by cationic macroinitiator containing benzyl chloride functions [67;68].
Luxenhofer et al. [69] were prepared poly(4-pentynyl-2-oxazoline) (PPynOx) with methyl
triflate as initiator and copolymerized with 2-methyl- or 2-ethyl-2-oxazoline as comonomers
generating well-defined water-soluble polymers of narrow molar mass distributions and
predefined degrees of polymerization. New poly-2-methyloxazoline hydrogels are
synthesized by the cationic ring-opening copolymerization of 2-methyl-2-oxazoline and
2,2`-tetramethylenebis(2-oxazoline), using random copolymers of chloromethylstyrene and
methyl methacrylate, or of chloromethylstyrene and styrene as macroinitiators [70].
2.1.2.2. Polyethyleneimine
Commercial polyethyleneimine (PEI) which is obtained by cationic ring-opening
polymerization of ethyleneimine has a highly branched structure containing primary,
Introduction and Theoretical Part 14
secondary and tertiary amino functions. Where PEI resultant from the hydrolysis of poly(2-
oxazoline) give on type of amino function group [71].
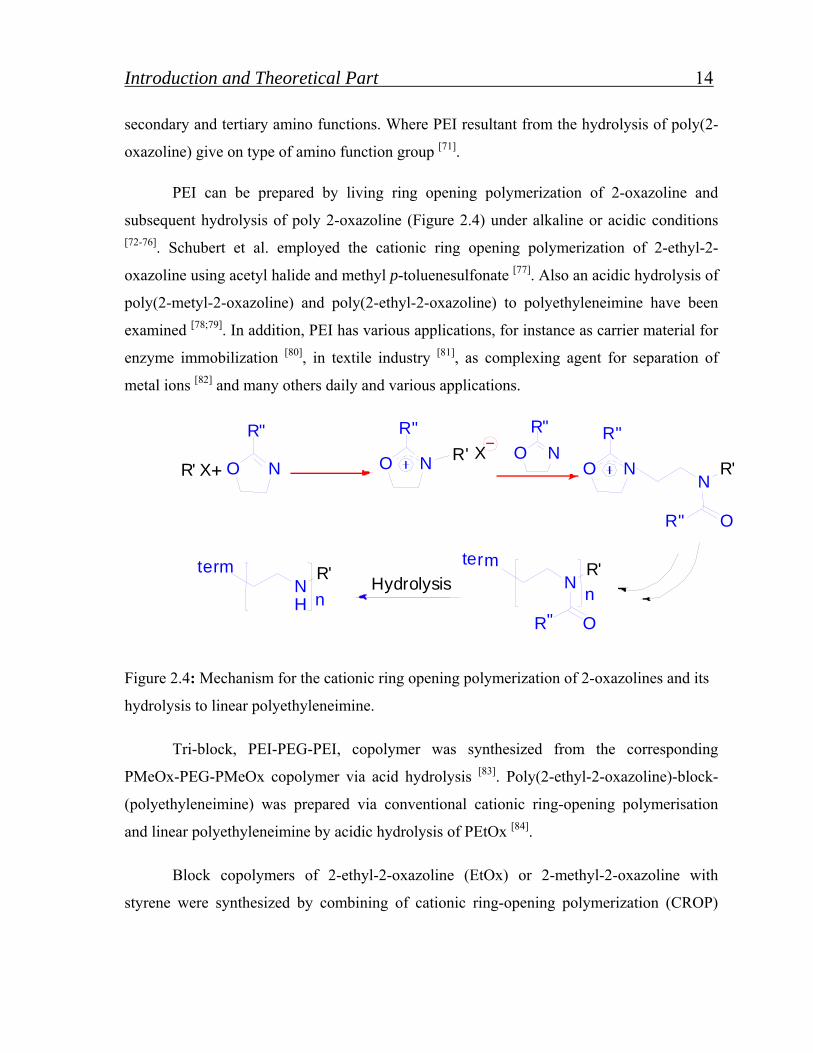
PEI can be prepared by living ring opening polymerization of 2-oxazoline and
subsequent hydrolysis of poly 2-oxazoline (Figure 2.4) under alkaline or acidic conditions [72-76]. Schubert et al. employed the cationic ring opening polymerization of 2-ethyl-2-
oxazoline using acetyl halide and methyl p-toluenesulfonate [77]. Also an acidic hydrolysis of
poly(2-metyl-2-oxazoline) and poly(2-ethyl-2-oxazoline) to polyethyleneimine have been
examined [78;79]. In addition, PEI has various applications, for instance as carrier material for
enzyme immobilization [80], in textile industry [81], as complexing agent for separation of
metal ions [82] and many others daily and various applications.
Figure 2.4: Mechanism for the cationic ring opening polymerization of 2-oxazolines and its
hydrolysis to linear polyethyleneimine.
Tri-block, PEI-PEG-PEI, copolymer was synthesized from the corresponding
PMeOx-PEG-PMeOx copolymer via acid hydrolysis [83]. Poly(2-ethyl-2-oxazoline)-block-
(polyethyleneimine) was prepared via conventional cationic ring-opening polymerisation
and linear polyethyleneimine by acidic hydrolysis of PEtOx [84].
Block copolymers of 2-ethyl-2-oxazoline (EtOx) or 2-methyl-2-oxazoline with
styrene were synthesized by combining of cationic ring-opening polymerization (CROP)
' X O N
R "
O N
R"
R' X O N
R"
O N
R "
NR'
OR"
NR'
"
n
termHydrolysisN
H
R'
n
te rm
R
OR
Introduction and Theoretical Part 15
and atom transfer radical polymerization (ATRP) [77] or nitroxide mediate radical
polymerization (NMRP) followed by hydrolysis of PMeOx segment to PEI [85] .
2.1.3. Bidirectional Initiator
Recently, Du Prez et al. discussed the combination of different polymerization
techniques using dual initiators to synthesize block copolymers which do not require any
intermediate transformation and protection steps [86]. Moreover, Yagci et al. reviewed the
mechanistic transformations of controlled/living polymerization techniques which provide a
facile route to the synthesis of block copolymers that cannot be performed by a single
polymerization method [4]. A dual initiator, or more general a heterofunctional initiator,
contains at least two initiation sites with selective and independent initiating groups for the
concurrent polymerization mechanisms. There are many researches that demonstrated the
importance of utilization and the improvement of the combination of different
polymerization techniques in order to obtain well-defined block copolymers [77].
Matyjaszewski et al. [87] examined a general method for the transformation of living
carbocationic polymerizations into living radical polymerizations without any modification
of the initiating sites, and they presented a successful synthesis of AB-type block
copolymers of tetrahydrofuran and styrene or methyl(meth)acrylate, respectively. Our
group employed a “grafting from” method for the synthesis of complex macromolecular
structures consisting of N-isopropylacrylamide and 2-alkyl-2-oxazolines and investigated
their lower critical solution temperature behavior [88].
OCROPinitiator O
CROP80 o
C ONMRP
120 o C
N PhN Ph N Ph
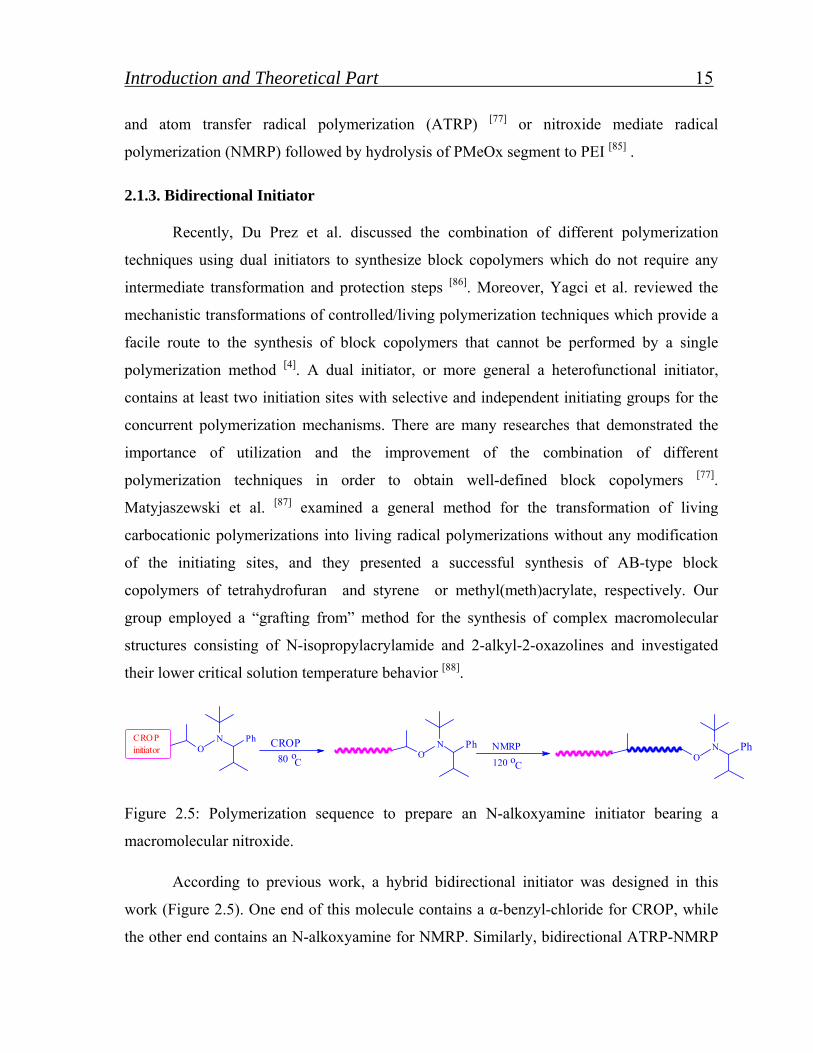
Figure 2.5: Polymerization sequence to prepare an N-alkoxyamine initiator bearing a
macromolecular nitroxide.
According to previous work, a hybrid bidirectional initiator was designed in this
work (Figure 2.5). One end of this molecule contains a α-benzyl-chloride for CROP, while
the other end contains an N-alkoxyamine for NMRP. Similarly, bidirectional ATRP-NMRP
Introduction and Theoretical Part 16
initiators have been synthesized and used in the formation of block copolymers [24;89-92].
miktoarm star polymers [93-95] and H-shaped terpolymers [96].
NMRP traditionally requires temperatures close to 120 oC [97]. The initiator that is
used in this study was specifically designed with the α-benzyl-chloride connected to the
nitroxide cap rather than to the phenethyl foot. After polymerization from the α-benzyl-
chloride end via CROP, the resulting structure was an N-alkoxyamine whose
macromolecular nitroxide cap is permanently attached to a long polymer chain. The rate of
polymerization of this macroinitiator in NMRP was then measured and compared with that
of alkoxyamine initiator.
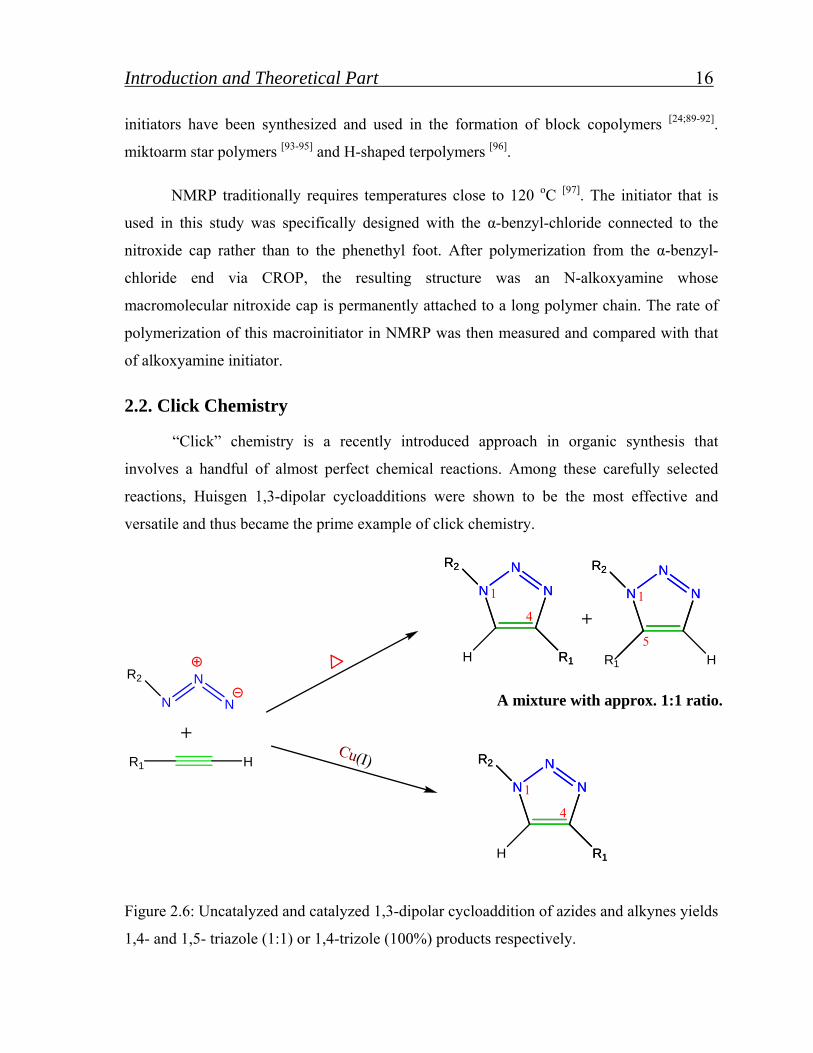
2.2. Click Chemistry
“Click” chemistry is a recently introduced approach in organic synthesis that
involves a handful of almost perfect chemical reactions. Among these carefully selected
reactions, Huisgen 1,3-dipolar cycloadditions were shown to be the most effective and
versatile and thus became the prime example of click chemistry.
R1 H
N
N
N
R2
N
N
N
R1
R2
N
N
N
R1
R2
N
N
N
R2
N
N
N
R2
R1
1
4
1
5H H
A mixture with approx. 1:1 ratio.
Cu(I)
N
N
N
R1
R2
N
N
N
R1
R2
1
4
H
Figure 2.6: Uncatalyzed and catalyzed 1,3-dipolar cycloaddition of azides and alkynes yields
1,4- and 1,5- triazole (1:1) or 1,4-trizole (100%) products respectively.
Introduction and Theoretical Part 17
Hence, these long-neglected reactions were suddenly re-established in organic
synthesis and, in particular, have gained popularity in materials science.
As already implicated, click chemistry encompasses a group of powerful linking
reactions that are simple to perform, have high yields, require no or minimal purification,
and are versatile in joining diverse structures without the prerequisite of protection steps. To
date, four major classifications of click reactions have been identified:
Cycloadditions - these primarily refer to 1,3-dipolar cycloadditions, but also include
hetero-Diels-Alder cycloadditions [98].
Nucleophilic ring-openings - these refer to the openings of strained heterocyclic
electrophiles, such as aziridines, epoxides, cyclic sulfates, aziridinium ions,
episulfonium ions, etc. [98].
Carbonyl chemistry of the non-aldol type- examples include the formations of ureas,
thioureas, hydrazones, oxime ethers, amides, aromatic heterocycles, etc. [99].
Additions to carbon-carbon multiple bonds - examples include epoxidations,
aziridinations, dihydroxylations, sulfenyl halide additions, nitrosyl halide additions,
and certain Michael additions [98;99].
From all identified click reactions, the heteroatom cycloaddition class of reactions is
the most reliable and versatile category. Within this category, the Huisgen 1,3-dipolar
cycloaddition of azides and alkynes is known for being closest to an “ideal” click reaction.
CuI-catalyzed Huisgen 1,3-dipolar cycloaddition of azides and alkynes yields 1,2,3-triazole
products. Traditionally, uncatalyzed cycloadditions of azides and alkynes require long
reaction time, high temperature and result in the formation of two products, 1,4- and 1,5-
regioisomers as shown in Figure 2.6 [100].
We observed a tremendous volume of recent literature in relation to click chemistry.
The premier transformation of click chemistry concerns the 1,3 - dipolar cycloaddition
reaction (1,3 - DCR) of organic azides with terminal acetylenes to yield 1,2,3 – triazoles [101;102], The reaction involves a stepwise Cu(I) - catalyzed dipolar cycloaddition of a
terminal acetylene to an organic azide. Azides (-N3) and acetylenes (–C≡CH) are small, each
Introduction and Theoretical Part 18
just three atoms (C, H, or N), and are kinetically stable, possessing high built - in energy, yet
are metabolically stable [103].
The click chemistry reaction between azides and acetylenes is biocompatible. It
operates in water at ambient temperature, is tolerant to a broad range of pH values, and is
bio - orthogonal-azides and acetylenes are inert in the biological milieu [104]. These reaction
aspects have underpinned the recent remarkable application of click chemistry in bioimaging [105]. The favorable size and inertness of azide and acetylene substrates have enabled their
incorporation into biomolecules in living cells with minimal physiological perturbation,
while subsequent chemoselective conjugation to small - molecule fluorescent probes allows
the visualization and elucidation of highly specific cellular mechanisms [21;106].
2.2.1. Click chemistry as a unique strategy in polymer science
The “click” concept, as proposed by Sharpless [99] in 2001, is undeniably one of the
most noticeable synthetic trends in the research area of chemistry and material science of
this new century [21;107]. The catchy term “click” refers to energetically favored, specific and
versatile chemical transformations, which lead to a single reaction product. In other words,
the essence of click chemistry is simplicity and efficiency. Therefore, click chemistry is a
term used for a class of reactions that are able to create complex molecules in a extremely
efficient manner [100].
This exciting concept seems to perfectly answer the requirements of modern
scientists who are working in research areas as diverse as molecular biology, drug design,
biotechnology, macromolecular chemistry or materials science [108-113]. It is indeed
noteworthy that over recent years, complicated reactions which require either complex
apparatus or harsh experimental conditions, have been less frequently studied than in the last
century and gradually have been replaced by more simple tools. In this context, the
straightforward click reactions have become tremendously popular in both academic and
industrial research [107].
Introduction and Theoretical Part 19
2000 2001 2002 2003 2004 2005 2006 2007 2008 20090
500
1000
1500
2000
Num
ber
of P
ubli
cati
ons
Years
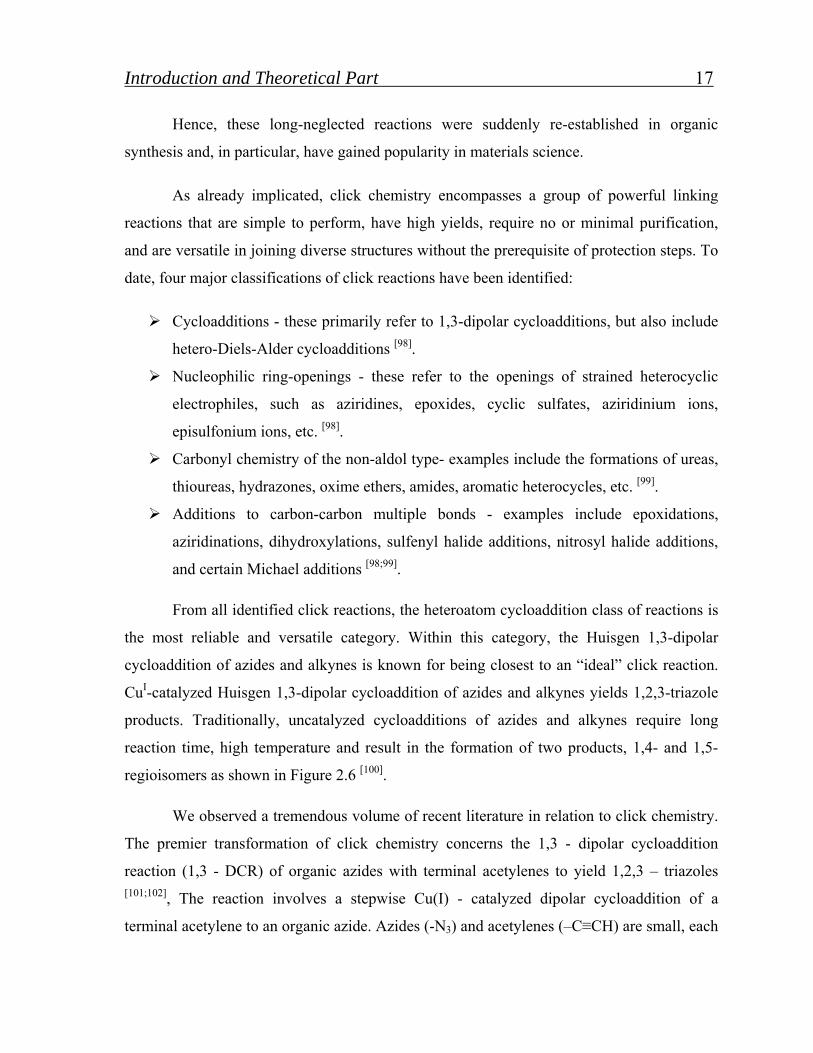
Figure 2.7: Number of scientific publications on click chemistry (search performed by SciFinder with the following keyword: click chemistry)
The outstanding success of click chemistry over the past years becomes apparent
when looking at the number of papers published over the last nine years (Figure 2.7). The
number of publications increases exponentially and shows the importance of these efficient
reactions in different fields of chemistry.
Click chemistry describes chemistry tailored to generate substances quickly and reliably by
joining small units together as the nature does. It is defined as a fast, modular, process-
driven approach to irreversible connections of the substrates involved in click reactions.
Click chemistry uses only the most reliable reactions to build complex molecules from
olefins, electrophiles, and heteroatom linkers [111].
The criteria for being classified as click chemistry, is that it contains a yield close to
100% as well as a preferential and rapidly occurring irreversible, highly selective and
orthogonal reaction. The reaction conditions should be mild, insensitive to oxygen and water
and use either no solvents or benign solvents like water. Click reactions in organic solvents
Introduction and Theoretical Part 20
have also a high significance in polymer and material science. The bonds which are
generated in the product should be chemically stable under a range of physiological
conditions. Additionally, for click reactions that are involved in polymerizations, the counter
functionalities of the reagents should be unreactive under free radical polymerization
conditions or be easily protected during the polymerization stage and functionalized
afterwards [114].
Drug Discovery Pharmaceutical Polymer Others0
10
20
30
40
Perc
ent
of P
ublic
atio
ns, %
Topic of research
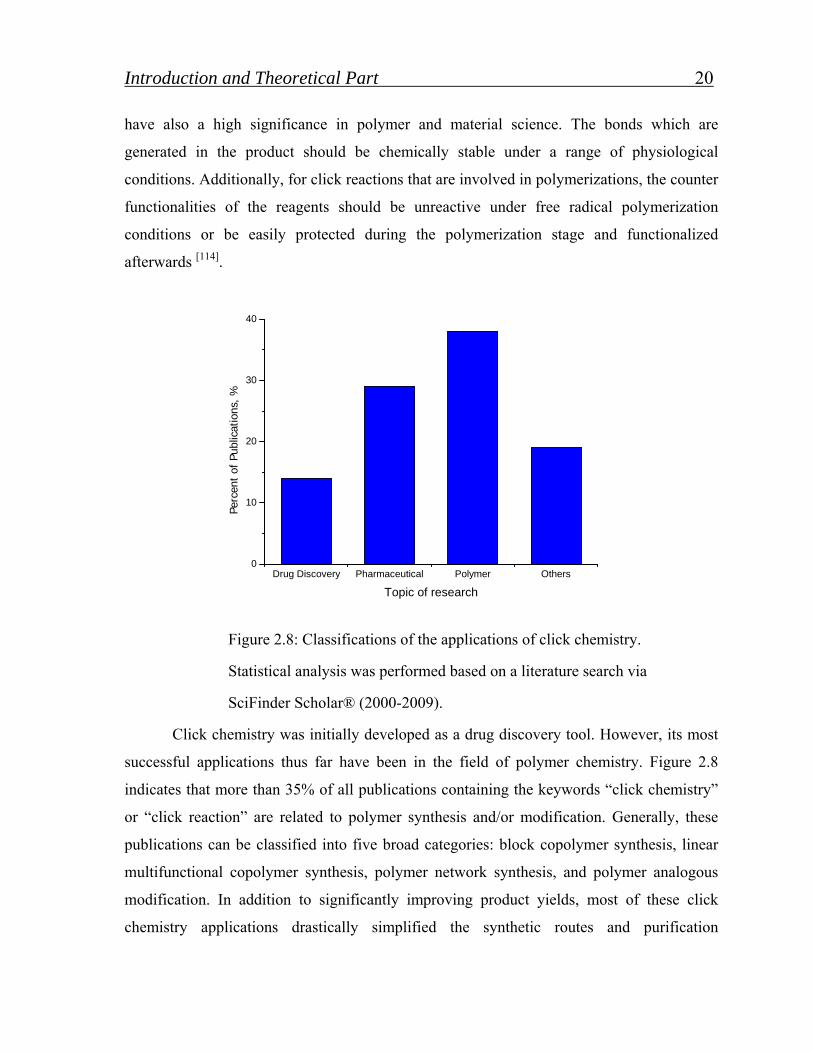
Figure 2.8: Classifications of the applications of click chemistry.
Statistical analysis was performed based on a literature search via
SciFinder Scholar® (2000-2009).
Click chemistry was initially developed as a drug discovery tool. However, its most
successful applications thus far have been in the field of polymer chemistry. Figure 2.8
indicates that more than 35% of all publications containing the keywords “click chemistry”
or “click reaction” are related to polymer synthesis and/or modification. Generally, these
publications can be classified into five broad categories: block copolymer synthesis, linear
multifunctional copolymer synthesis, polymer network synthesis, and polymer analogous
modification. In addition to significantly improving product yields, most of these click
chemistry applications drastically simplified the synthetic routes and purification
Introduction and Theoretical Part 21
procedures. Therefore, it is the belief of the authors that this new “tool in the box” may shift
the paradigm of polymer synthesis and lead to new strategies of polymer therapeutics
development [115].
2.2.2. Cu-Catalyzed Huisgen 1, 3-dipolar Cycloaddition of Azides and Terminal Alkynes
The Cu-catalyzed Huisgen 1,3-dipolar cycloaddition (HDC) of azides and terminal
alkynes to form 1,2,3-triazoles is the model example of a click reaction (Figure 2.5). It
fulfills all of the criteria of click chemistry perfectly, no matter how subjective they may be,
and is therefore extremely reliable and easy to use. This reaction exclusively forms 1,4-
substituted products, making it regiospecific. It typically does not require temperature
elevation but can be performed over a wide range of temperatures (0 -160°C), in a variety of
solvents (including water or organic solvent), and over a wide range of pH values (5 through
12). It proceeds as much as 107 times faster than the uncatalyzed version, and purification
essentially consists of product filtration [107;109;110;112]. Furthermore, it is unaffected by steric
factors. Variously substituted primary, secondary, tertiary, and aromatic azides readily
participate in this transformation. Tolerance for variations in the acetylene component is also
excellent [110]. All of these characteristics make this cycloaddition particularly popular
among the other click reactions. Two additional reasons for the popularity of this
cycloaddition are azides and terminal alkynes are fairly easy to install and are extremely
stable at standard conditions [21;99;107-110;112;113]. They both can tolerate oxygen, water,
common organic synthesis conditions, biological molecules, a large range of solvents and
pH’s, and the reaction conditions of living systems (reducing environment, hydrolysis,
etc.)[21;107-111]. Even though the decomposition of aliphatic azides is thermodynamically
favored, a kinetic barrier exists that allows them to be stable in the aforementioned
conditions. They will essentially remain “invisible” in solution until a dipolarophile, such as
an alkyne, comes into contact [21].
2.2.3. Mechanism of Click Reaction
In general, cycloadditions proceed through a concerted mechanism. However,
experimental kinetic data [111] and molecular modeling [112] performed on the HDC reaction
Introduction and Theoretical Part 22
seem to favor a stepwise reaction pathway [107;109]. It has been calculated that the activation
barrier for a catalyzed concerted HDC reaction is actually greater than that for an
uncatalyzed concerted reaction (27.8 kcal/mol vs. 26 kcal/mol in one particular reaction
using density functional theory calculations) [112]. Furthermore, a stepwise-catalyzed HDC
reaction has an activation barrier 11 kcal/mol lower than a concerted catalyzed reaction [107].
2CuLL
CuL
CuR1 H
R1 H
LCu
L
Cu
Cu Catalyst 1
B-
B-H
LCu
L
CuR1
2
R2-N3
L
Cu
L
Cu
R1
N
N
N
R2
3
MetallocycleL
Cu
L
Cu
N
N
N
R1
R2
4
B-H
B-
N
N
N
R1
R2
5H
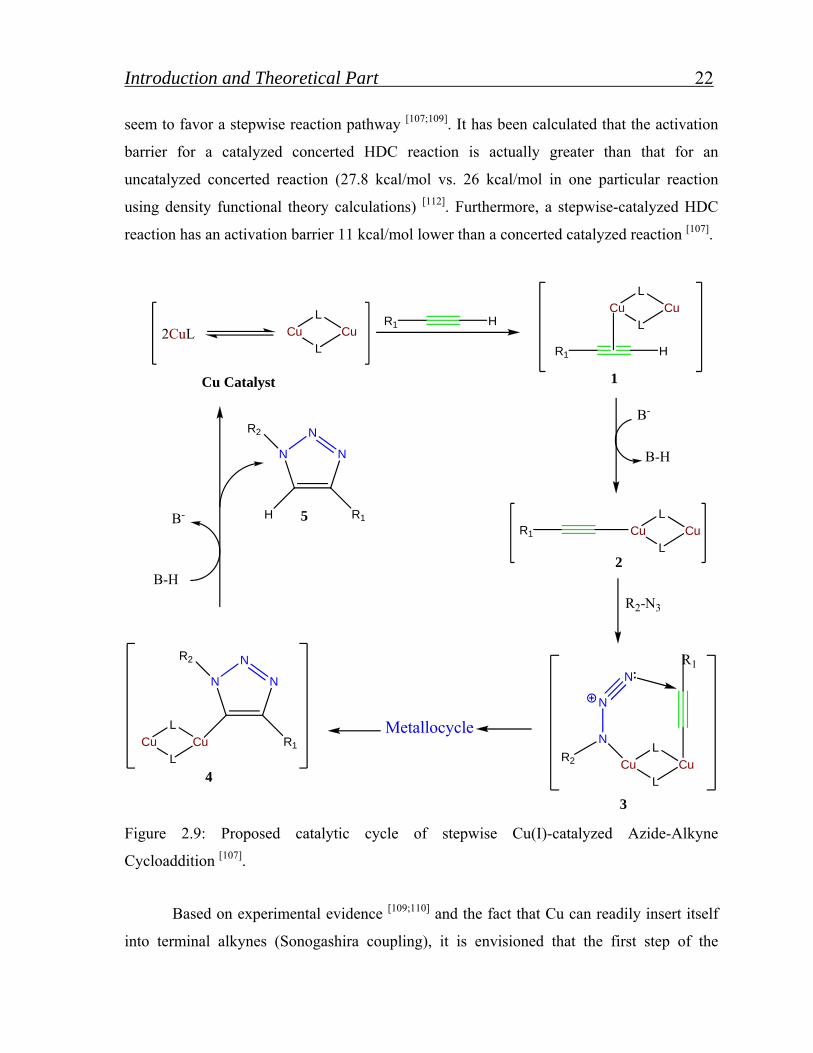
Figure 2.9: Proposed catalytic cycle of stepwise Cu(I)-catalyzed Azide-Alkyne
Cycloaddition [107].
Based on experimental evidence [109;110] and the fact that Cu can readily insert itself
into terminal alkynes (Sonogashira coupling), it is envisioned that the first step of the
Introduction and Theoretical Part 23
reaction involves π complexation of a Cu dimer to the alkyne (1 in Figure 2.9). Thereafter,
deprotonation of the terminal hydrogen occurs to form a Cu-acetylide [109]. There are
actually several different kinds of Cu-acetylide complexes that can be formed, depending on
the reaction conditions utilized; represent just one possibility [112]. The π complexation of Cu
lowers the pKa of the terminal alkyne by as much as 9.8 pH units, allowing deprotonation to
occur in an aqueous solvent without the addition of a base [107].
If a non-basic solvent such as acetonitrile was to be used then a base, such as 2,6-
lutidine or N,N’-diisopropylethylamine (DIPEA), would have to be added [116].
In the following step, N(1) displaces one of the ligands from the second Cu in the
Cu-acetylide complex to form 3. In turn, this “activates” the azide for nucleophilic attack
(5). Due to proximity and electronic factors, N(3) can now easily attack C(4)of the alkyne,
leading to a metallocycle. Then, The metallocycle contracts when the lone pair of electrons
of N(1) attacks C(5) to form the respective triazole 4. Once 4 was formed, the attached Cu
dimer immediately complexes to a second terminal alkyne. However, this second alkyne
cannot undergo a cycloaddition due to the unfavorable structure of the complex, and it
dissociates upon protonation to reform 4. One final protonation releases the CuI catalyst
from the 1,2,3-triazole product 5, to undergo a second catalytic cycle with different
substrates [115]. Both of those protonations are most likely the result of interactions with
protonated external base and/or solvent, but further studies are needed to conclusively
confirm [115].
2.2.4. Synthesis of Block Copolymer by Click Reaction
Typically, block copolymers are synthesized via two routes : (I) Sequential addition
of different monomers into polymerization reactions containing living reaction centers[117].
Living ionic polymerization, atom transfer free radical polymerization (ATRP), nitroxide
mediate radical polymerization (NMRP), reversible addition fragmentation chain transfer
(RAFT) polymerization, ring-opening polymerization (ROP), or their combination have all
been utilized to obtain well-defined block copolymers of different components. (II) Linking
different linear polymer chains via their terminal functionalities. While the latter method
Introduction and Theoretical Part 24
allows the combination of polymer blocks that might not be compatible with the first
method, the lack of efficient linker chemistry has made this route rarely used.
The emergence of click chemistry drastically changed the scientific community’s
views on block copolymer synthesis. Because of its extremely high reaction efficiency and
tolerance to a variety of functional groups, click chemistry has become the hallmark of
linker chemistry.
It is one of the most efficient ways to join two substances together and has thus been
used repeatedly to link well-defined homopolymers to form block copolymers. Recently,
Van Camp et al. reported a synthetic strategy for diverse amphiphilic copolymer structures
by combination of ATRP and the HDC (Huisgen 1,3-dipolar cycloaddition) reaction. Using
a modular approach, polymers with alkyne functionalities as well as polymers with azide
functionalities [e.g. poly(1-ethoxyethyl acrylate) and poly(acrylic acid)], were first
synthesized via ATRP. They were then subsequently “clicked” together to yield block
copolymers [118]. Similarly, Opsteen et al. described the synthesis of polystyrene (PS),
poly(tert-butyl acrylate) (PtBA), poly(methyl acrylate) (PMA) block copolymers using click
chemistry [119]. Using an initiator containing triisopropylsilyl (TIPS) protected acetylene, the
three homopolymer blocks were obtained via ATRP and the terminal bromides were then
converted to azides. Following TIPS deprotection, the heterotelechelic homopolymers were
joined together via HDC reactions. When RAFT polymerization was employed to obtain the
homopolymer blocks, however, specially functionalized chain transfer agents had to be
synthesized to allow the introduction of terminal azides or acetylenes [120;121]. Additionally,
this modular strategy of clicking different homopolymer blocks together has also been
exploited by numerous other research teams [122-124]. Among these works, Voit et al. [124]
presented well defined diblock copolymers prepared via Cu(I)-catalyzed 1,3-dipolar
cycloaddition reaction between polymeric azides and alkynes. Here, the synthesis of alkyne
end-functionalized polymers, which exhibit a linear relationship between calculated number-
averaged molecular weight and the experimental one and are characterized by a narrow
molecular weight distribution, could be shown. Therefore, different segments are completely
linked together to give diblock copolymers with narrow molecular weight distribution.
Introduction and Theoretical Part 25
Clearly, click chemistry has revitalized the second strategy of block copolymer
synthesis. Many monomers that cannot be used to produce block copolymers via living
polymerizations (due to extremely disparate reactivates or solubility differences) can now be
easily incorporated through the second strategy. Quite literally, with click chemistry, any
two homopolymer blocks can be joined together to form block copolymers. This opens the
door for combinatorial block copolymer synthesis, allowing a quick and easy synthesis of
diverse copolymers with extremely unique properties which could potentially lead to great
strides in the field of polymer sciences [115].
2.3. Block Copolymers
Block copolymers represent a subject of broad current research emphasis across the
full spectrum of macromolecular chemistry and physics, ranging from development of new
synthetic strategies and molecular architectures to application of advanced theoretical and
computational methods. Almost fifty years after the preparation of the first laboratory
samples by living anionic polymerization, scientific interest in these materials continues to
flourish, as does the global market for block copolymer materials.
2.3.1. Amphiphilic polymers
Amphiphilic copolymers are macromolecular substances containing segments of
opposite philicity, i.e. hydrophilic and hydrophobic, which are covalently bonded. If a
material is classified as hydrophilic it has a high affinity to water, therefore meaning that
water can be adsorbed by the material. Conversely, if a material is hydrophobic, it has no
affinity towards water and therefore, water cannot be adsorbed by such a material [125].
Amphiphilic copolymers have molecular architectures in which different domains,
both hydrophilic and hydrophobic, are included within the polymer molecules. This gives
rise to unique properties of these materials in selected solvents, at surfaces as well as in the
bulk, due to microphase separation [126]. The characteristic self-organization of these
materials in the presence of selective media often results in the formation of aggregates such
as micelles, microemulsions, and adsorbed polymer layers [127].
Introduction and Theoretical Part 26
Amphiphilic block copolymers have many different applications. They have been
extensively used in the formulation of various nanoparticles structures, such as micelles,
nanospheres, nanocapsules, polymersomes, etc. [128-130].
The application of amphiphilic polymers depends on the composition of the
copolymers in terms of molar mass, molar mass distribution (MMD) and the ratio of
hydrophilic to hydrophobic groups. In terms of chemical architecture, control is required in
the synthesis of these materials to obtain the desired properties for each application. An even
superior advantage than the control of the molar mass of these copolymers is the ability to
design systems where one can predetermine the resulting molar mass of each of the blocks
of the copolymerization product. Starting materials in the synthesis of these amphiphilic
copolymers are macromonomers and telechelics [125].
Macromonomers refer to macromolecules with a functional group that participates in
a polymerization reaction [131]. These functional groups include unsaturation, which can
participate in radical or ionic polymerization, heterocycles that are active in ring-opening
polymerization reactions, or functional groups that can participate in polycondensation
reactions. Depending on the nature of the functionality, the polymerization of
macromonomers generally results in graft copolymers or networks. Telechelics polymers are
defined as linear macromolecules bearing reactive functional groups at both ends.
Macromonomers and telechelics participate in chain extension reactions, which lead to the
formation of linear block copolymers or networks [125].
Amphiphilic copolymers are typically used as emulsifiers, surface-active agents,
phase transfer catalysts, solid polymer electrolytes (after complexing with alkali salts), and
antistatic agents [131].
Amphiphilic copolymers can therefore be divided into three general classes of copolymers
1- Linear block copolymers
2- Graft copolymers
3- Star/network polymers.
Introduction and Theoretical Part 27
2.3.1.1. Amphiphilic block copolymers
Traditionally, amphiphilic block copolymers, having well-defined character, are
formed by a number of synthetic routes including:
• Living anionic or sequential cationic polymerization;
• Reaction of telechelics having different backbones and suitable reactive end groups
• Chain extension of macromonomers.
Recent advances in controlled “living” free radical polymerization have also led to the
introduction of the new route of CRP for the synthesis of these materials. Controlled radical
polymerization includes techniques such as RAFT (reversible addition-fragmentation chain
transfer) polymerization, ATRP (atom transfer radical polymerization), and NMRP
(nitroxide mediated radical polymerization).
Amphiphilic block copolymers are mainly di- or tri-block copolymers where the
different blocks are incompatible, providing the polymer its unique properties. The most
extensively studied and industrially significant amphiphilic polymers usually contain PEG
or PEO as hydrophilic segment. PEG and PEO have the same repeat unit (CH2CH2O), but
the starting monomer and method of synthesis of both are different. PEO is synthesized from
ethylene oxide, while PEG is synthesized from ethylene glycol. The polymerization of these
different monomers generally yields a higher molar mass for the PEO compounds than for
the PEG compounds [125].
Other polymers used as hydrophilic segment in amphiphilic block copolymers
include poly (2-alkyl-2-oxazoline), poly (vinyl ether), polyacetal and poly (methyl) acrylate.
In terms of hydrophobic segments, the most generally used polymers are poly (propylene-
oxide) and polystyrene [132].
Velichkova and Christova [132] reported that, the first amphiphilic block copolymers
were prepared in the early 1950s by Lundsted on the basis of ethylene oxide and propylene
oxide. A series of AB and ABA type block copolymers were developed under the trademark
Pluronic®. These polymers were prepared by sequential addition of monomers.
Introduction and Theoretical Part 28
At first the dependence of the lengths of the hydrophilic and hydrophobic blocks on
the surfactant and detergent properties was established for the Pluronic®. Since the
introduction of Pluronics into the market, various advances have been made in the synthesis
of amphiphilic block copolymers. These advances were reviewed by Velichkova and
Christova [132].
2.3.1.2. Amphiphilic graft copolymers
Tailor-made graft copolymers can be prepared by a macro monomer technique or by
grafting telechelics onto preformed polymer backbones that contain sufficient reactive
functional groups randomly distributed along the polymer backbone. While these methods
offer full control over the graft length, there are disadvantages in using this technique to
synthesize well-defined copolymers. In the grafting process, although being able to control
the graft length, it is difficult to determine the amount of grafts and the distribution thereof
along the polymer backbone.
A proper orientation of the hydrophilic and hydrophobic components of those
materials in the solid state and in solution favors phase separation and micelle formation,
and affords surface activity, similar to the corresponding linear block copolymers. However,
because of their specific structures, in some features they differ considerably. Amphiphilic
graft copolymers have found applications as polymeric surfactants, phase transfer catalysts,
biocompatible materials, drug carriers, blending agents and thickening agents [132].
2.3.1.3. Amphiphilic networks
Among the variety of methods for the synthesis of polymer networks, attempts have
been made to synthesize networks with controlled structures. The use of telechelics makes it
possible to separate the polymerization process from network formation. The first step is
directed towards the preparation of linear prepolymers with well-defined chemical
architecture in terms of structure, functionality, molar mass and molar mass distribution.
The primary obstacle, especially in the case of blocks with opposite philicity, is to end link
these prepolymers in a defect-free network structure [132].
Introduction and Theoretical Part 29
2.3.2. Micellization of block copolymer
Block copolymers have a wide range of applications from surfactants and dispersants
to compatibilizer and thermoplastic elastomers and are found in areas as biomaterials, drug
delivery, nanocomposites and electronics. Many applications depend on the tendency of
block copolymers to self assemble into micelles and more complex supramolecular
structures [9].
Synthetic amphiphilic block copolymers also form aggregates in solutions, where the
solvent is selective to one block. This has been used widely in industrial applications, such
as detergents, dispersion, dispersion stabilization, foaming, emulsification, lubrication and
formulation of cosmetics and inks [125].
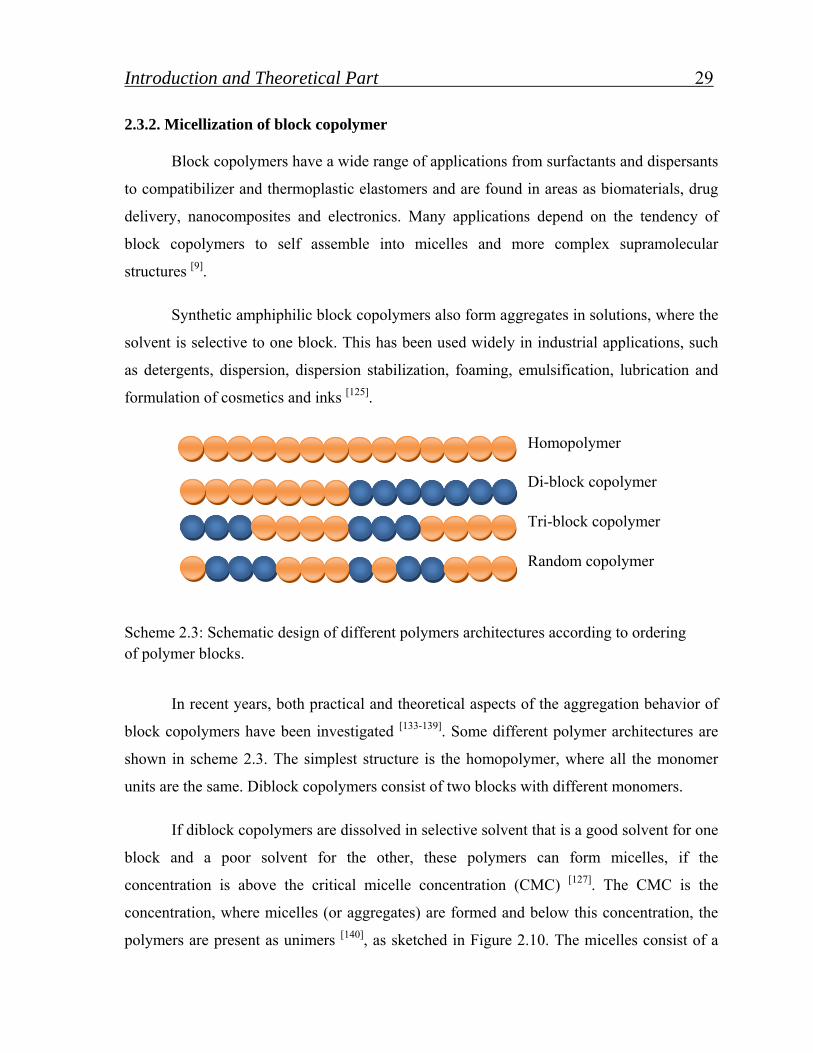
Homopolymer
Di-block copolymer
Tri-block copolymer
Random copolymer
Scheme 2.3: Schematic design of different polymers architectures according to ordering of polymer blocks.
In recent years, both practical and theoretical aspects of the aggregation behavior of
block copolymers have been investigated [133-139]. Some different polymer architectures are
shown in scheme 2.3. The simplest structure is the homopolymer, where all the monomer
units are the same. Diblock copolymers consist of two blocks with different monomers.
If diblock copolymers are dissolved in selective solvent that is a good solvent for one
block and a poor solvent for the other, these polymers can form micelles, if the
concentration is above the critical micelle concentration (CMC) [127]. The CMC is the
concentration, where micelles (or aggregates) are formed and below this concentration, the
polymers are present as unimers [140], as sketched in Figure 2.10. The micelles consist of a
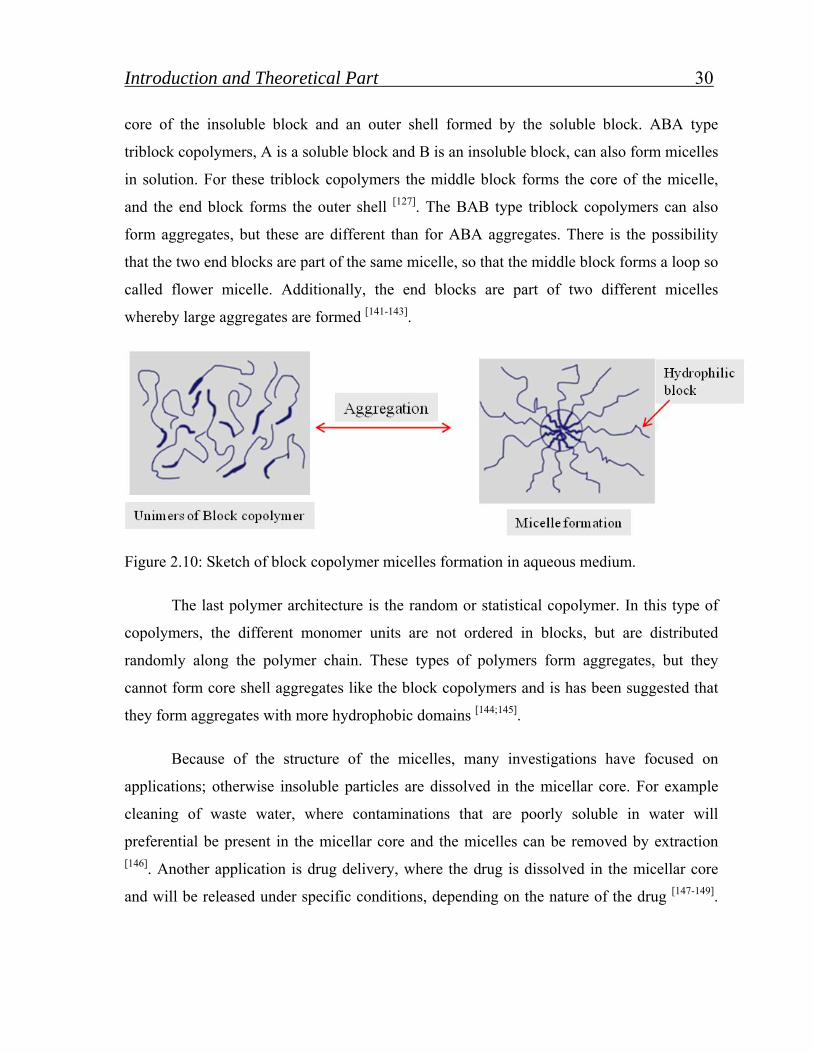
Introduction and Theoretical Part 30
core of the insoluble block and an outer shell formed by the soluble block. ABA type
triblock copolymers, A is a soluble block and B is an insoluble block, can also form micelles
in solution. For these triblock copolymers the middle block forms the core of the micelle,
and the end block forms the outer shell [127]. The BAB type triblock copolymers can also
form aggregates, but these are different than for ABA aggregates. There is the possibility
that the two end blocks are part of the same micelle, so that the middle block forms a loop so
called flower micelle. Additionally, the end blocks are part of two different micelles
whereby large aggregates are formed [141-143].
Figure 2.10: Sketch of block copolymer micelles formation in aqueous medium.
The last polymer architecture is the random or statistical copolymer. In this type of
copolymers, the different monomer units are not ordered in blocks, but are distributed
randomly along the polymer chain. These types of polymers form aggregates, but they
cannot form core shell aggregates like the block copolymers and is has been suggested that
they form aggregates with more hydrophobic domains [144;145].
Because of the structure of the micelles, many investigations have focused on
applications; otherwise insoluble particles are dissolved in the micellar core. For example
cleaning of waste water, where contaminations that are poorly soluble in water will
preferential be present in the micellar core and the micelles can be removed by extraction [146]. Another application is drug delivery, where the drug is dissolved in the micellar core
and will be released under specific conditions, depending on the nature of the drug [147-149].
Introduction and Theoretical Part 31
Block copolymer micelles have also been functionalized for specific purposes, as for
example nano reactors where chemical reactions take place locally in the micellar core [150].
Numerous methods have been applied to investigate the aggregation behavior of
different block copolymer systems, e.g. dynamic scanning calorimetry [151], electron
microscopy [152], small angel neutron [153], X-ray scattering [154], photon correlation
spectroscopy [155], static light scattering [156], pulsed field gradient NMR [157;158], dynamic
mechanical spectroscopy [159;160] and surface tension measurements [151].
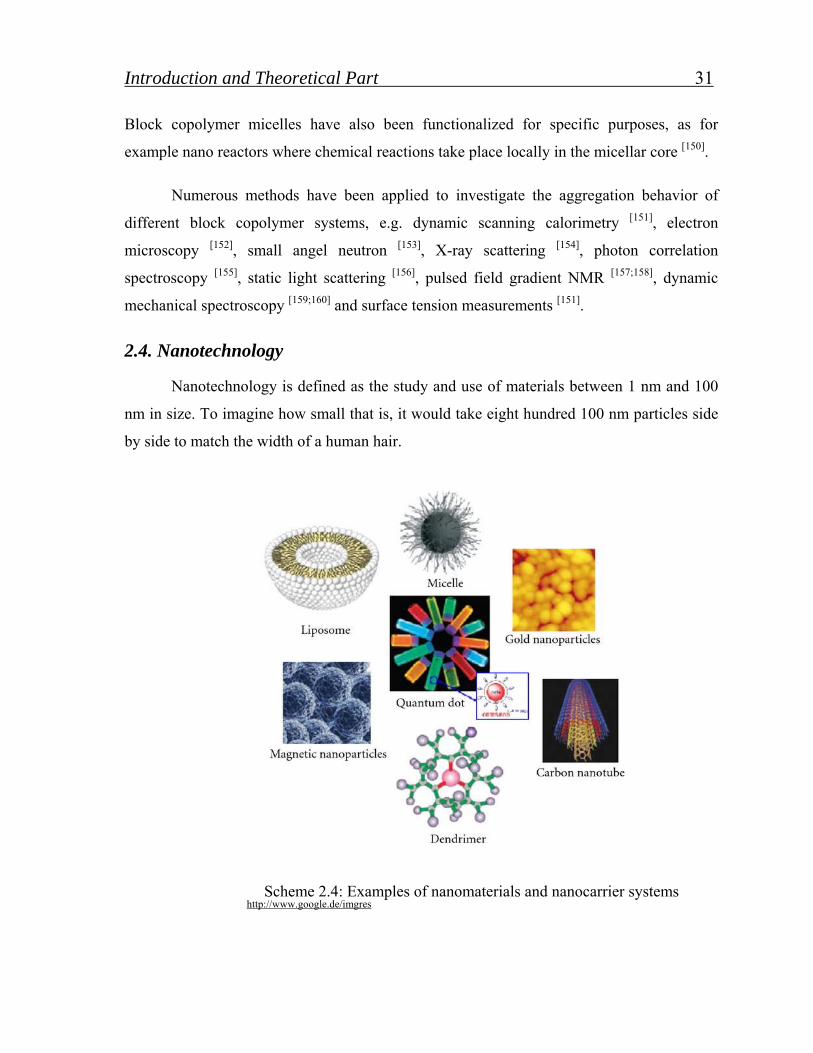
2.4. Nanotechnology
Nanotechnology is defined as the study and use of materials between 1 nm and 100
nm in size. To imagine how small that is, it would take eight hundred 100 nm particles side
by side to match the width of a human hair.
Scheme 2.4: Examples of nanomaterials and nanocarrier systems http://www.google.de/imgres
Introduction and Theoretical Part 32
Nanoscience has taken scientists around the world by storm. It claims to
revolutionize the world we live in with radical breakthroughs in areas such as materials and
manufacturing, electronics, medicine and healthcare, environment and energy, chemical and
pharmaceutical, biotechnology and agriculture, computation and information technology
(Scheme 2.4) [161].
There is a special and borderless science that deals with the nanostructural materials.
These nanostructural materials are derived from nanoparticles. The uses of these
nanostructural materials are immense and there are sufficient evidences that these
nanoparticles display distinct characteristics from the microcrystalline structures. There is no
scientific field where the nanomaterials are not being investigated and explored to find the
advantages of these materials to improve the desired characteristics [161].
Scientists have been studying and working with nanoparticles for centuries, but the
effectiveness of their work has been hampered by their inability to observe the structure of
nanoparticles. In recent decades the development of microscopes capable of displaying
particles as small as atoms has enabled scientists to distinguish what they are working with.
The ability to see nano-sized materials has opened up a world of possibilities in a variety of
industries and scientific endeavors. Because nanotechnology is essentially a set of
techniques that allow manipulation of properties at a very small scale, it may have many
applications, such as drug delivery, electronic devices, catalysis and many others essential
applications [161].
The fabrication of nanomaterials with strict control over size, shape, and crystalline
structure has inspired the application of nanochemistry to numerous fields including
catalysis, medicine, and electronics. The use of nanomaterials in such applications also
requires the development of methods for nanoparticles assembly or dispersion in various
media. A majority of studies have aimed at dispersion in aqueous media aimed at their use in
medical applications and studies of environmental effects, however, the principles of
nanoparticles fabrication and functionalization of nanoparticles transcends their eventual
application [162].
Introduction and Theoretical Part 33
2.4.1. Nanoparticles in the universe
“Nanoparticles – the small particles with a big future”
Nanoparticles, a unique subset of the broad field of nanotechnology, include any type
of particle with at least one dimension of less than 100 nanometers. Nanoparticles play an
important role in a wide variety of fields including advanced materials, pharmaceuticals, and
environmental detection and monitoring.
While nanoparticles are important in a diverse set of fields, they can generally be
classified into two types:
First one, nanoparticles are intentionally designed and created with physical
properties tailored to meet the needs of specific applications. They can be end products in
and of themselves, as in the case of quantum dots or pharmaceutical drugs, or they can be
components later incorporated into separate end products, such as carbon black in rubber
products. Either way, the particle’s physical properties are extremely important to their
performance and the performance of any product into which they are ultimately incorporated [161].
Secondly, nanoparticles are unintentionally generated or naturally produced, such as
atmospheric nanoparticles created during combustion. Depending on the application of
interest, nanoparticles may be known by a number of alternative and trade-specific names,
including particulate matter, aerosols, colloids, nanocomposites, nanopowders, and
nanoceramics [163].
The transition from microparticles to nanoparticles can lead to a number of changes
in physical properties. Two of the major factors are the increase in the ratio of surface area
to volume and the size of the particle moving into the quantum effects. The increase in the
surface-area-to volume ratio, which is a gradual progression as the particle gets smaller, lead
to an increasing dominance of the behavior of atoms on the surface of a particle over that of
those in the interior of the particle. This affects both the properties of the particles in
isolation and its interaction with other materials. High surface area is a critical factor in the
Introduction and Theoretical Part 34
performance of catalysis and structures such as electrodes, allowing improvement in the
performance of such technologies as fuel cell and batteries [161].
2.4.2. Inorganic and metals nanoparticles
The binding of nanoparticles (NPs) onto polymeric surfaces is an important step in
generating ordered particle arrays. Usually, self-assembly processes are required to direct
nanocrystals with sizes from 1 nm up to tens of nanometers onto functional surfaces. Critical
for this binding and deposition process is (a) the control of the chemical nature of the
surface onto which the NPs are bound, (b) the structure of the surface of the nanoparticles,
in particular the chemical moieties bound, and (c) the tuning of the supramolecular
interaction acting between the NP surface and the polymeric surface in terms of binding
strength, binding multiplicity, and binding kinetics [164].
In the past, several NP/surface systems relying on self-assembled monolayers have
been reported. Supramolecular interactions [165;166], hydrogen-bonding systems [167], DNA-
based systems [168] and purely electrostatically assembly [169] have been used for this
purpose. Besides other approaches as an interfacial assembly and crystallization of opals[170],
the supramolecular approach is still the most versatile in that it allows the spatially separated
use of several interactions and thus the binding of several NPs on different parts of a surface.
These supramolecular binding concepts have been transferred to the incorporation of NPs
into polymeric matrices [171], although using widely nonspecific interactions, i.e., purely
hydrophobic incorporation [172], polymer/polymer interactions [173], polymer/metal
interactions, and single hydrogen bond [174]. Another approach starts with block copolymeric
micelles in solution, into which nanoparticles have been incorporated and subsequently
deposited onto surfaces, presenting the nanoparticles at a specific interface [175].
Recently, numerous synthetic mechanisms have been employed for stabilized metal
nanoparticles (NPs) onto colloidal inorganic and organic spheres [176-178]. A particularly
successful method of depositing the metal NPs on the surface of the colloids involves the
use of an intermediate linker PEI which can bind both transition metal ions (GaN) and
negatively charged colloids [179-181]. Additionally, the PEI serves as selective reducing agent
Introduction and Theoretical Part 35
in the conversion of the metal ions to the metal NPs especially gold nanoparticles [182]. The
advantages derived from these hybrid materials can be seen in their remarkable attributes
which include enhanced conductivity, temperature stability, optical, and catalytic activity [183].
In the present research, we report on the binding of Au NPs onto microphase-
separated polymeric films deposited on/in ultra block copolymer thin film, where a strong
(highly specific) hydrogen-bonding interaction has been positioned in one of the polymeric
blocks of a block copolymer.
2.4.3. Gold nanoparticles
Nanoparticles offer a variety of opportunities to investigate the evolution of material
properties with particle dimensions. In fact, metal nanoparticles, especially gold, silver and
copper nanoparticles, have been extensively investigated over the past decade due to their
unique electronic, optical and catalytic properties [184-186]. These properties are neither those
of bulk metal nor those of molecular compounds as has been widely demonstrated in both
experimental and theoretical investigations, but they strongly depend on the particle size,
shape of the nanoparticles, and inter particle distance as well as the nature of the protecting
organic shell [187].
The chemical stability of the particles is crucial to avoid degradation processes such
as partial oxidation or undesired sintering of particles. The lack of sufficient stability of
many nanoparticles has to some extent impeded the development of real world applications
of nanomaterials. As it has been illustrated, gold plays a special role in nanoscience and
nanotechnology. This is due to; firstly, the fact that gold is the most stable noble metal at the
nanoscale, while most less noble metals will be oxidized to a depth of a thousand
nanometers or more, in many cases obliterating the nanoscale component. So the designers
of any nano-device requiring metallic components are likely to consider gold favorably.
Secondly, gold is a far better electron conductor than silicon, (whereas next to copper and
silver). Thirdly, gold offers a unique surface chemistry that allows it to be used as a platform
on which to self-assemble layers of organic molecules, usually bound to the gold by sulfur
Introduction and Theoretical Part 36
atoms. Such "self-assembled" structures may be used as sensitive biomedical or chemical
sensors [188;189]. Finally, gold is readily fabricated at the nanoscale by electrolytic or
electroless deposition and may be further modified by straightforward extensions of existing
lithographic technologies [190].
2.4.4. Gallium nitride quantum dots
Nanoparticles of semiconductors (quantum dots) were theorized in the 1970s and
initially created in the early 1980s. If semiconductor particles are made small enough,
quantum effects come into play, which limit the energies at which electrons and holes (the
absence of an electron) can exist in the particles. As energy is related to wavelength (or
color), this means that the optical properties of the particle can be finely tuned depending on
its size. Thus, particles can be made to emit or absorb specific wavelengths (colors) of light,
merely by controlling their size. Recently, quantum dots have found applications in
composites, solar cells and fluorescent biological labels (for example to trace a biological
molecule) which use both the small particle size and tunable energy levels. Recent advances
in chemistry have resulted in the preparation of monolayer-protected, high-quality,
monodispersed, crystalline quantum dots as small as 2 nm in diameter, which can be
conveniently treated and processed as a typical chemical reagent [191].
GaN and the related III–V nitride compound semiconductors have become the
subject of intense worldwide attention due to recent successes in commercial production of
blue/green light emitting diodes (LEDs), lasers, and other devices [192;193]. Reports of room
temperature violet light emission from III–V nitride heterostructures have further fueled
intense research into the synthesis, characterization, and properties of these materials. III–V
nitride semiconductor materials have a range of wide direct band gaps (2–6 eV) and form a
continuous range of solid solutions, allowing the tailoring of devices operating in the visible
to the deep ultraviolet (UV) region of the spectrum. The major driving force for the
development of these materials has been the promise of blue emitters appropriate for a
variety of applications such as high density optical memory storage (shorter wavelengths
dramatically increase the density of optical data storage) and full color flat panel displays.
GaN-based devices are used for high-frequency and/or high-power applications including
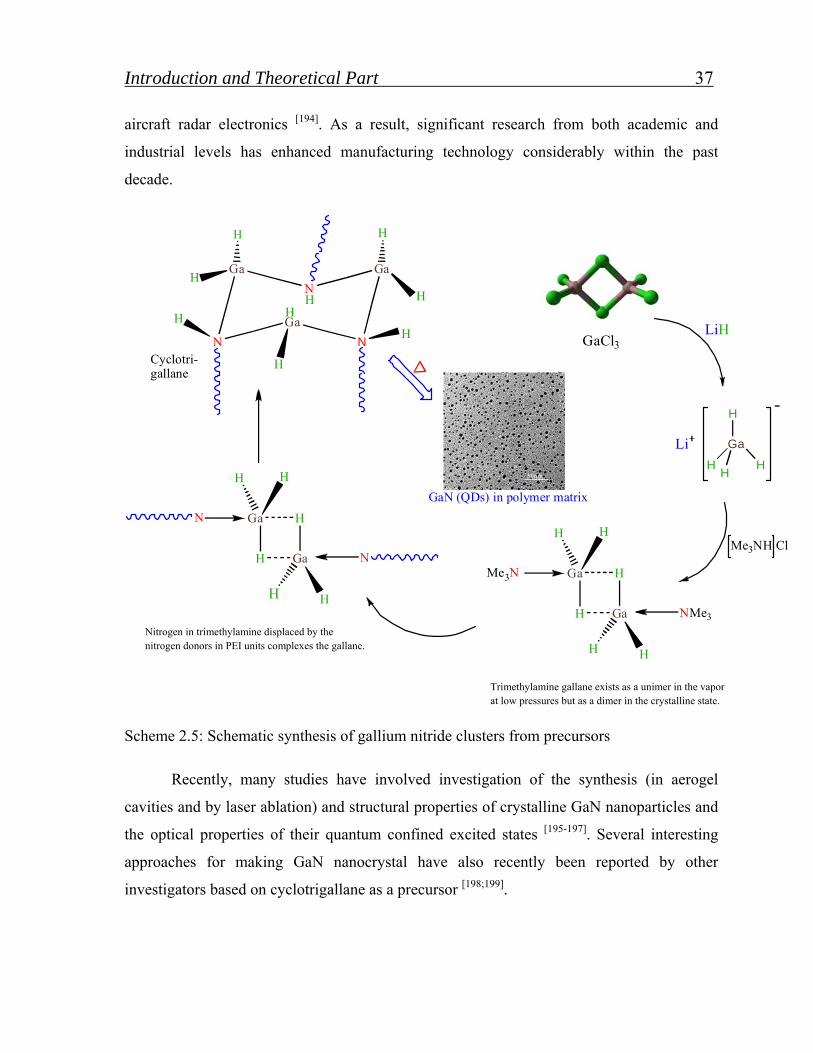
Introduction and Theoretical Part 37
aircraft radar electronics [194]. As a result, significant research from both academic and
industrial levels has enhanced manufacturing technology considerably within the past
decade.
GaCl3LiH
Li Ga
H
HHH
Ga NMe3
H
H
H
Ga
H
Me3N
H
H
Ga N
H
H
H
Ga
H
N
H
H
Trimethylamine Gallane exists as a uinomer in the vapourat low pressures but as adimer in the crystalline state.
Ga
N
N
Ga
Ga
N
HH
H
H
H
H
H
H
H
Nitrogen in trimethylamine displaced by the nitrogendonors in PEI units complexed the gallane.
GaN (QDs) in polymer matrix
Cyclotri-gallane
Me3NH Cl
Scheme 2.5: Schematic synthesis of gallium nitride clusters from precursors
Recently, many studies have involved investigation of the synthesis (in aerogel
cavities and by laser ablation) and structural properties of crystalline GaN nanoparticles and
the optical properties of their quantum confined excited states [195-197]. Several interesting
approaches for making GaN nanocrystal have also recently been reported by other
investigators based on cyclotrigallane as a precursor [198;199].
Trimethylamine gallane exists as a unimer in the vapor at low pressures but as a dimer in the crystalline state.
Nitrogen in trimethylamine displaced by the nitrogen donors in PEI units complexes the gallane.
Introduction and Theoretical Part 38
In the present work, we performed an in-situ synthesis by which gallium nitride
clusters were stabilized in a matrix of polystyrene-b-polyethyleneimine copolymer. Main
three steps are required to prepare GaN QDs impeded in amphiphilic block copolymer as
shown in scheme 2.5.
GaN thin films can be prepared by reactive sputtering of gallium in ambient nitrogen [200;201] and by an ion-beam technique [202], which suggest that GaN may have independent
promise as a useful electronic or optical material.
Introduction and Theoretical Part 39
2.5. References
[1] T. Lord, Chemical and Engineering News 1980, 58 29-30.
[2] B. Lohse, R. Vestberg, M. T. Ivanov, S. Hvilsted, R. H. Berg, C. J. Hawker, P. S. Ramanujam, Chemistry of Materials 2008, 20 6715-6720.
[3] P. M. Jean, C. Michel, C. Daniel, J.Macromol.Sci.., Rev.Macromol.Chem.Phys. 1992, 32 1-34.
[4] Y. Yagci, M. Atilla Tasdelen, Progress in Polymer Science 2006, 31 1133-1170.
[5] A. S. Lang, A. Neubig, M. Sommer, M. Thelakkat, Macromolecules 2010, 43 7001-7010.
[6] J. Smid, M. Van Beylen, T. E. Hogen-Esch, Progress in Polymer Science 2006, 31 1041-1067.
[7] K. Hakim, M. Francois Le, O. Olivier, T. Paul, Stable Radicals, (Ed.: H. R. G.) John Wiley ans Sons, Ltd., 2010, 173-220.
[8] M. SZWARC, Nature 1956, 178 1168-1169.
[9] M. Graeme, H. S. David, The Chemistry of Radical Polymerization , Second fully revised edition ed. Elsevier. 2006.
[10] C. J. Hawker, A. W. Bosman, E. Harth, Chemical Reviews 2001, 101 3661-3688.
[11.] W. Huang, R. Chiarelli, B. Charleux, A. Ñ. Rassat, J. P. Vairon, Macromolecules 2002, 35 2305-2317.
[12] Nicole L.Hill, B. Rebecca, J.Polym.Sci.: Part A: Polyme.Chem. 2007, 45 2015-2025.
[13] E. Beaudoin, P. E. Dufils, D. Gigmes, S. Marque, C. Petit, P. Tordo, D. Bertin, Polymer 2006, 47 98-106.
[14] M. Kamigaito, T. Ando, M. Sawamoto, Chemical Reviews 2001, 101 3689-3746.
[15] K. Matyjaszewski, J. Xia, Chemical Reviews 2001, 101 2921-2990.
[16] A. Kowalczuk-Bleja, B. Trzebicka, H. Komber, B. Voit, A. Dworak, Polymer 2004, 45 9-18.
[17] G. Moad, E. Rizzardo, S. H. Thang, Aust.J.Chem. 2005, 58 379-410.
[18] G. Moad, Aust.J.Chem. 2006, 59 661-662.
[19] K. Matyjaszewski, General Concepts and History of Living Radical Polymerization, John Wiley & Sons, Inc., 2002, 361-406.
Introduction and Theoretical Part 40
[20] W. A. Braunecker, K. Matyjaszewski, Progress in Polymer Science 2007, 32 93-146.
[21] C. J. Hawker, K. L. Wooley, Science 2005, 309 1200-1205.
[22] H. Axel, K. Matyjaszewski, E.Müller, Controlled and Living Polymerizations, WILEY-VCH Verlag GmbH & Co. KGaA, Weinheim, 2009.
[23] S. Fleischmann, H. Komber, B. Voit, Macromolecules 2008, 41 5255-5264.
[24] U. Tunca, B. KarlIga, S. Ertekin, A. L. Ugur, O. Sirkecioglu, G. Hizal, Polymer 2001, 42 8489-8493.
[25] R. Braslau, Journal of the American Chemical Society 2006, 128 13315-13316.
[26] N. L. Hill, R. Braslau, Macromolecules 2005, 38 9066-9074.
[27] G. O'Bryan, A. Nilsen, R. Braslau, Macromolecules 2007, 40 7848-7854.
[28] S. Parisa, A. Mojtaba, A. E. Ali, J.Polym.Res. 2007, 14 52.
[29] S. Fleischmann, K. Hinrichs, U. Oertel, S. Reichelt, K.-J. Eichhorn, B. Voit, Macromol.Rap.Comm. 2008, 29 1177-1185.
[30] S. Jan, F. Sven, M. Martin, K. Hartmut, V. Brigitte, Macromolecular Symposia 2009, 275-276 35-42.
[31] M. Messerschmidt, M. Millaruelo, H. Komber, L. Hüssler, B. Voit, T. Krause, M. Yin, W. D. Habicher, Macromolecules 2008, 41 2821-2831.
[32] S. Ibrahim, B. Voit, Macromolecular Symposia 2009, 275-276 59-66.
[33] T. T. Chiu, B. P. Thill, W. J. Fairchok, in Water-Soluble Polymers, American Chemical Society, 1986, p. pp. 425-433.
[34] W. Seeliger, E. Aufderhaar, W. Diepers, R. Nehring, W. Thier, H. Hellmann, Angew.Chem. 1966, 20 913-927.
[35] K. Tsutomu, N. Shizuo, Taneo Maeda, Kenichi Fukui, J.of Polym.Sci.Part B: Polym.Lett. 1966, 4 441-445.
[36] K. Aoi, M. Okada, Progress in Polymer Science 1996, 21 151-208.
[37] K. Shiro, U. Hiroshi, J.Polym.Sci.: Part A: Polym.Chem. 2002, 40 192-209.
[38] W. M. F. Martin, S. S. Ulrich, H. Richard, J.Polym.Sci.: Part A: Polym.Chem. 2008, 46 4804-4816.
[39] K. Matyjaszewski, Makromol.Chem., Macromol.Symp. 1991, 47 221-227.
[40] D. Held, B. Ivän, H. E. Müller Axel, J. F. de, T. Graafland, in Cationic Polymerization, American Chemical Society, 1997, 63-74.
Introduction and Theoretical Part 41
[41] J. P. Kennedy, B. van, Designed Polymers by Carbocationic Macromolecular Engineering: Theory and Practice, Oxford Univ Pr (Sd) , 1992.
[42] M. S. Kim, R. Faust, Macromolecules 2002, 35 5320-5322.
[43] S. V. Kostjuk, A. V. Radchenko, F. Ï. Ganachaud, Macromolecules 2007, 40 482-490.
[44] J. H. Braybrook, L. D. Hall, Progress in Polymer Science 1990, 15 715-734.
[45] S. Kobayashi, S. Iijima, T. Igarashi, T. Saegusa, Macromolecules 1987, 20 1729-1734.
[46] S. Kobayashi, H. Uyama, N. Higuchi, T. Saegusa, Macromolecules 1990, 23 54-59.
[47] S. Kobayashi, T. Tokuzawa, T. Saegusa, Macromolecules 1982, 15 707-710.
[48] R. H. Jin, Adv.Mater. 2002, 14 889-892.
[49] S. Kobayashi, T. Igarashi, Y. Moriuchi, T. Saegusa, Macromolecules 1986, 19 535-541.
[50] A. M. Lichkus, P. C. Painter, M. M. Coleman, Macromolecules 1988, 21 2636-2641.
[51] U. Hiroshi, H. Yoichiro, K. Shiro, J.Polym.Sci.: Part A: Polym.Chem. 1993, 31 123-128.
[52] M. H. Litt, B. R. Hsieh, I. M. Krieger, T. T. Chen, H. L. Lu, Journal of Colloid and Interface Science 1987, 115 312-329.
[53] A. Cirpan, S. Alkan, L. Toppare, G. David, Y. Yagci, European Polymer Journal 2001, 37 2225-2229.
[54] P. Persigehl, R. Jordan, O. Nuyken, Macromolecules 2000, 33 6977-6981.
[55] J. Grumelard, A. Taubert, W. Meier, Chem.Commun. 2004, 1462-1463.
[56] M. Miyamoto, K. Naka, M. Shiozaki, Y. Chujo, T. Saegusa, Macromolecules 1990, 23 3201-3205.
[57] K. Naka, A. Ohki, S. Maeda, Chemistry Letters 1991, 20 1303-1306.
[58] P. H. Goetz, D. Mathias, Macromol.Sym. 2001, 170 1-8.
[59] K. Sumi, F. C. Anson, The Journal of Physical Chemistry 1986, 90 3845-3850.
[60] M. W. M. Fijten, J. M. Kranenburg, H. M. L. Thijs, R. M. Paulus, B. M. van Lankvelt, J. de Hullu, M. Springintveld, D. J. G. Thielen, C. A. Tweedie, R. Hoogenboom, K. J. Van Vliet, U. S. Schubert, Macromolecules 2007, 40 5879-5886.
[61] C. Gangfeng, H. L. Morton, M. Irvin, J.Polym.Sci.: Part A: Polym.Phys. 1991, 29 773-784.
[62] C. Gangfeng, H. L. Morton, J.Polym.Sci.: Part A: Polym.Chem. 1992, 30 659-669.
[63] C. Gangfeng, H. L. Morton, J.Polym.Sci.: Part A: Polym.Chem. 1996, 34 2679-2688.
Introduction and Theoretical Part 42
[64] C. Gangfeng, H. L. Morton, J.Polym.Sci.: Part A: Polym.Chem. 1996, 34 2688-2699.
[65] T. Saegusa, H. Ikeda, H. Fujii, Macromolecules 1972, 5 359-362.
[66] T. Saegusa, H. Ikeda, Macromolecules 1973, 6 808-811.
[67] O. Nuyken, J. Rueda-Sanchez, B. Voit, Macromol.Rapid.Comm. 1997, 18 125-131.
[68] O. Nuyken, J. Rueda-Sanchez, B. Voit, Polymer Bulletin 1997, 38 657-664.
[69] R. Luxenhofer, R. Jordan, Macromolecules 2006, 39 3509-3516.
[70] R.-S. Juan, S. Raúl, B. Voit, Macromol.Chem.Phys. 2003, 204 954-960.
[71] K. F. Weyts, E. J. Goethals, Polymer Bulletin 1988, 19 13-19.
[72] H. M. L. Lambermont-Thijs, L. Bonami, F. E. Du Prez, R. Hoogenboom, Polymer Chemistry 2010, 1 747-754.
[73] H. M. L. Lambermont-Thijs, F. S. van der Woerdt, A. Baumgaertel, L. Bonami, F. E. Du Prez, U. S. Schubert, R. Hoogenboom, Macromolecules 2009, 43 927-933.
[74] O. Nuyken, J. R. Sanchez, B. Voit, Journal of Macromolecular Science-Pure and Applied Chemistry 1997, A34 1261-1267.
[75] K. S., T. S. "Ring-opening Polymerization", Elsevier Applied Science Publishers, London and New York , 1984.
[76] D. A. Tomalia, D. P. Sheetz, Journal of Polymer Science Part A- Polymer Chemistry 1966, 4 2253-&.
[77] C. R. Becer, R. M. Paulus, S. Hoêppener, R. Hoogenboom, C. A. Fustin, J. F. Ï. Gohy, U. S. Schubert, Macromolecules 2008, 41 5210-5215.
[78] G. P., R: Freder, W., unßer, Naturwissenschaften 1981, 68 525-526.
[79] H. M. L. Lambermont-Thijs, F. S. van der Woerdt, A. Baumgaertel, L. Bonami, F. E. Du Prez, U. S. Schubert, R. Hoogenboom, Macromolecules 2009, 43 927-933.
[80] K. Watanabe, G. P. Royer, Journal of Molecular Catalysis 1983, 22 145-152.
[81] H. Comas-Rojas, G. Fernndez-Cat, K. J. Edler, S. J. Roser, A. Prez-Gramatges, Journal of Colloid and Interface Science 2009, 339 495-501.
[82] I. Korus, K. Loska, Desalination 2009, 247 390-395.
[83] Z. Zhong, J. Feijen, M. C. Lok, W. E. Hennink, L. V. Christensen, J. W. Yockman, Y. H. Kim, S. W. Kim, Biomacromolecules 2005, 6 3440-3448.
[84] G. H. Hsiue, H. Z. Chiang, C. H. Wang, T. M. Juang, Bioconjugate Chemistry 2006, 17 781-786.
Introduction and Theoretical Part 43
[85] S. Ibrahim, B. Voit, Macromolecular Symposia 2009, 275-276 59-66.
[86] K. V. Bernaerts, F. E. Du Prez, Progress in Polymer Science 2006, 31 671-722.
[87] A. Kajiwara, K. Matyjaszewski, Macromolecules 1998, 31 3489-3493.
[88] J. Rueda, S. Zschoche, H. Komber, D. Schmaljohann, B. Voit, Macromolecules 2005, 38 7330-7336.
[89] A. Ozcan, Y. Ismail, H. Gurkan, T. Umit, J.Polym.Sci.: Part A: Polym.Chem. 2006, 44 3242-3249.
[90] K. Shanmugananda Murthy, Q. Ma, J. Clark, E. E. Remsen, K. L. Wooley, Chem.Commun. 2001, 773-774.
[91] U. l. Tunca, T. Erdogan, Hiza G., J.Polym.Sci.: Part A: Polym.Chem. 2002, 40 2025-2030.
[92] S. Yan, F. Zhifeng, L. Bingyi, Y. Wantai, J.Polym.Sci.: Part A: Polym.Chem. 2010, 44 2468-2475.
[93] C. Cigdem, H. Gurkan, T. Umit, J.Polym.Sci.: Part A: Polym.Chem. 2003, 41 2542-2548.
[94] T. Erdogan, E. Gungor, H. Durmaz, G. Hizal, U. Tunca, Journal of Polymer Science Part A-Polymer Chemistry 2006, 44 1396-1403.
[95.] T. He, D. Li, X. Sheng, B. Zhao, Macromolecules 2004, 37 3128-3135.
[96] H. Durmaz, F. Karatas, U. Tunca, G. Hizal, Journal of Polymer Science Part A-Polymer Chemistry 2006, 44 3947-3957.
[97] D. Benoit, V. Chaplinski, R. Braslau, C. J. Hawker, Journal of the American Chemical Society 1999, 121 3904-3920.
[98] H. C. Kolb, K. B. Sharpless, Drug Discovery Today 2003, 8 1128-1137.
[99] H. C. Kolb, M. G. Finn, K. B. Sharpless, Angewandte Chemie-International Edition 2001, 40 2004-2007.
[100] M. Takeshi, O. Hideyuki, T. tsushi, in Dynamic Combinatorial Chemistry: In Drug Discovery, Bioorganic Chemistry, and Materials ScienceEd.: L. M. Benjamin), John Wiley & Sons, Inc., Canada 2010, p. pp. 229-261.
[101] R. Huisgen, G. Szeimies, L. Mobius, Chemische Berichte-Recueil 1967, 100 2494-&.
[102] C. W. Tornöe, C. Christensen, M. Meldal, The Journal of Organic Chemistry 2002, 67 3057-3064.
[103] V. V. Rostovtsev, L. G. Green, V. V. Fokin, K. B. Sharpless, Angewandte Chemie-International Edition 2002, 41 2596-2603.
[104] K. B. Sharpless, R. Manetsch, Expert Opinion on Drug Discovery 2006, 1 525-538.
Introduction and Theoretical Part 44
[105] D. Rabuka, S. C. Hubbard, S. T. Laughlin, S. P. Argade, C. R. Bertozzi, Journal of the American Chemical Society 2006, 128 12078-12079.
[106] R. K. Iha, K. L. Wooley, A. M. Nystroêm, D. J. Burke, M. J. Kade, C. J. Hawker, Chemical Reviews 2009, 109 5620-5686.
[107] J. F. Lutz, Angewandte Chemie-International Edition 2008, 47 2182-2184.
[108] Y. L. Angell, K. Burgess, Chemical Society Reviews 2007, 36 1674-1689.
[109] W. H. Binder, R. Sachsenhofer, Macromolecular Rapid Communications 2007, 28 15-54.
[110] V. D. Bock, H. Hiemstra, J. H. van Maarseveen, European Journal of Organic Chemistry 2005, 51-68.
[111] C. J. Hawker, V. V. Fokin, M. G. Finn, K. B. Sharpless, Aust.J.Chem. 2007, 60 381-383.
[112] J. F. Lutz, Angewandte Chemie-International Edition 2007, 46 1018-1025.
[113] B. Voit, New Journal of Chemistry 2007, 31 1139-1151.
[114] L. Joerg, John Wiley & Sons, Ltd, Chichester, UK 2009, 1-34.
[115] H. B. Wolfgang, S. obert, John Wiley & Sons, Ltd, Chichester, UK 2009, 189-213.
[116] S. Hartwig, S. Hecht, Macromolecules 2009, 43 242-248.
[117] W. W. O., Science 1991, 251 887-893.
[118] W. Van Camp, V. Germonpre, L. Mespouille, P. Dubois, E. J. Goethals, F. E. Du Prez, Reactive and Functional Polymers 2007, 67 1168-1180.
[119] J. A. Opsteen, J. C. M. Van Hest, Journal of Polymer Science Part A-Polymer Chemistry 2007, 45 2913-2924.
[120] D. Quemener, T. P. Davis, C. Barner-Kowollik, M. H. Stenzel, Chem.Commun. 2006, 5051-5053.
[121] S. R. S. Ting, A. M. Granville, D. Qu Ñmener, T. P. Davis, M. H. Stenzel, C. Barner-Kowollik, Aust.J.Chem. 2007, 60 405-409.
[122] G. Deng, D. Ma, Z. Xu, European Polymer Journal 2007, 43 1179-1187.
[123] O. Altintas, G. Hizal, U. Tunca, Journal of Polymer Science Part A-Polymer Chemistry 2006, 44 5699-5707.
[124] S. Fleischmann, H. Komber, D. Appelhans, B. I. Voit, Macromolecular Chemistry and Physics 2007, 208 1050-1060.
[125] H. Ian, Block copolymer in Solution: Fundementals and Applications, John Wiley & Sons Inc., 2005.
Introduction and Theoretical Part 45
[126] R. Yoda, S. Komatsuzaki, T. Hayashi, European Polymer Journal 1996, 32 233-237.
[127] A. P. Gast, Current Opinion in Colloid & Interface Science 1997, 2 258-263.
[128] Y. Kakizawa, K. Kataoka, Advanced Drug Delivery Reviews 2002, 54 203-222.
[129] R. K. O'Reilly, C. J. Hawker, K. L. Wooley, Chemical Society Reviews 2006, 35 1068-1083.
[130] K. Letchford, H. Burt, European Journal of Pharmaceutics and Biopharmaceutics 2007, 65 259-269.
[131] G. Riess, Progress in Polymer Science 2003, 28 1107-1170.
[132] R. S. Velichkova, D. C. Christova, Progress in Polymer Science 1995, 20 819-887.
[133] A. Halperin, Macromolecules 1987, 20 2943-2946.
[134] P. Linse, M. Bjoerling, Macromolecules 1991, 24 6700-6711.
[135] R. Jiang, Q. Jin, B. Li, D. Ding, A. C. Shi, Macromolecules 2006, 39 5891-5896.
[136] L. Zhang, J. Lin, S. Lin, The Journal of Physical Chemistry B 2008, 112 9720-9728.
[137] A. Akinchina, N. P. Shusharina, P. Linse, Langmuir 2004, 20 10351-10360.
[138] P. Alexandridis, B. Lindman, amphiphilic block copolymers: self-assembly and applications, Elsevier, Amsterdam, 2000.
[139] A. Choucair, A. Eisenberg, The European Physical Journal E: Soft Matter and Biological Physics 2003, 10 37-44.
[140] P. Munk, John Wiley & Sons, Inc., 1989.
[141] D. Lairez, M. Adam, J. P. Carton, E. Raspaud, Macromolecules 1997, 30 6798-6809.
[142] G. Fleischer, C. Konak, A. Puhlmann, F. Rittig, J. Karger, Macromolecules 2000, 33 7066-7071.
[143] F. C. Giacomelli, I. C. Riegel, C. L. Petzhold, N. P. da Silveira, P. Sîteîpanek, Langmuir 2008, 25 731-738.
[144] L. A. Connal, Q. Li, J. F. Quinn, E. Tjipto, F. Caruso, G. G. Qiao, Macromolecules 2008, 41 2620-2626.
[145] Y. Sato, A. Hashidzume, Y. Morishima, Macromolecules 2001, 34 6121-6130.
[146] P. N. Hurter, T. A. Hatton, Langmuir 1992, 8 1291-1299.
[147] S. K. Glen, Advanced Drug Delivery Reviews 2002, 54 167.
Introduction and Theoretical Part 46
[148] A. Rösler, G. W. M. Vandermeulen, H. A. Klok, Advanced Drug Delivery Reviews 2001, 53 95-108.
[149] C. Allen, D. Maysinger, A. Eisenberg, Colloids and Surfaces B: Biointerfaces 1999, 16 3-27.
[150] S. N. Sidorov, L. M. Bronstein, P. M. Valetsky, J. r. Hartmann, H. Cölfen, H. Schnablegger, M. Antonietti, Journal of Colloid and Interface Science 1999, 212 197-211.
[151] G. Wanka, H. Hoffmann, W. Ulbricht, Macromolecules 1994, 27 4145-4159.
[152] D. F. Siqueira, S. P. Nunes, Polymer 1994, 35 490-495.
[153] L. Shen, H. Wang, G. Guerin, C. Wu, I. Manners, M. A. Winnik, Macromolecules 2008, 41 4380-4389.
[154] O. Glatter, G. Scherf, K. Schillen, W. Brown, Macromolecules 1994, 27 6046-6054.
[155] L. Lobry, N. Micali, F. Mallamace, C. Liao, S. H. Chen, Phys.Rev.E 1999, 60 7076.
[156] M. Pacovska, K. Prochazka, Z. Tuzar, P. Munk, Polymer 1993, 34 4585-4588.
[157] G. Fleischer, The Journal of Physical Chemistry 1993, 97 517-521.
[158] G. Fleischer, P. Blof, W. D. Hergeth, Colloid & Polymer Science 1993, 271 217-222.
[159] R. Ganguly, M. Kumbhakar, V. K. Aswal, The Journal of Physical Chemistry B 2009, 113 9441-9446.
[160] R. A. Lauten, A. L. Kjniksen, B. Nyström, Langmuir 2001, 17 924-930.
[161] S. Günter, Nanoparticles from Theory to Application, John Wiley & Sons Inc., 2004.
[162] J. Gopalakrishnan, Chemistry of Materials 1995, 7 1265-1275.
[163] R. L. Johnston, Taylor & Francis: London, 2002.
[164] W. H. Binder, Angewandte Chemie-International Edition 2005, 44 5172-5175.
[165] O. Crespo-Biel, B. Dordi, D. N. Reinhoudt, J. Huskens, Journal of the American Chemical Society 2005, 127 7594-7600.
[166] T. Auletta, B. Dordi, A. Mulder, A. Sartori, S. Onclin, C. M. Bruinink, M. Peter, C. A. Nijhuis, H. Beijleveld, H. Schonherr, G. J. Vancso, A. Casnati, R. Ungaro, B. J. Ravoo, J. Huskens, D. N. Reinhoudt, Angewandte Chemie-International Edition 2004, 43 369-373.
[167] A. K. Boal, F. Ilhan, J. E. DeRouchey, T. Thurn-Albrecht, T. P. Russell, V. M. Rotello, Nature 2000, 404 746-748.
[168] L. M. Demers, D. S. Ginger, S. J. Park, Z. Li, S. W. Chung, C. A. Mirkin, Science 2002, 296 1836-1838.
Introduction and Theoretical Part 47
[169] Rajendra, R. Bhat, Nanotechnology 2003,14 1145-1151. [170] A. L. Rogach, D. V. Talapin, E. V. Shevchenko, A. Kornowski, M. Haase, H. Weller,
Advanced Functional Materials 2002, 12 653-664.
[171] M. R. Bockstaller, R. A. Mickiewicz, E. L. Thomas, Advanced Materials 2005, 17 1331-1349.
[172] C. Minelli, I. Geissbuehler, R. Eckert, H. Vogel, H. Heinzelmann, M. Liley, Colloid & Polymer Science 2004, 282 1274-1278.
[173] S. W. Yeh, K. H. Wei, Y. S. Sun, U. S. Jeng, K. S. Liang, Macromolecules 2005, 38 6559-6565.
[174] A. K. Boal, B. L. Frankamp, O. Uzun, M. T. Tuominen, V. M. Rotello, Chemistry of Materials 2004, 16 3252-3256.
[175] S. W. Yeh, Y. T. Chang, C. H. Chou, K. H. Wei, Macromolecular Rapid Communications 2004, 25 1680-1686.
[176] F. Caruso, Advanced Materials 2001, 13 11-16.
[177] A. Dawson, P. V. Kamat, The Journal of Physical Chemistry B 2001, 105 960-966.
[178] M. Jakob, H. Levanon, P. V. Kamat, Nano Letters 2003, 3 353-358.
[179] T. Ji, V. G. Lirtsman, Y. Avny, D. Davidov, Advanced Materials 2001, 13 1253-1256.
[180] B. Sadtler, A. Wei, Chem.Commun. 2002, 1604-1605.
[181] L. A. Belfiore, E. M. Indra, J.Polym.Sci.B Polym.Phys. 2000, 38 552-561.
[182] X. Sun, S. Dong, E. Wang, Polymer 2004, 45 2181-2184.
[183] E. Prodan, C. Radloff, N. J. Halas, P. Nordlander, Science 2003, 302 419-422.
[184] A. N. Shipway, E. Katz, I. Willner, Chemphyschem 2000, 1 18-52.
[185] D. M. Adams, L. Brus, C. E. D. Chidsey, S. Creager, C. Creutz, C. R. Kagan, P. V. Kamat, M. Lieberman, S. Lindsay, R. A. Marcus, R. M. Metzger, M. E. Michel-Beyerle, J. R. Miller, M. D. Newton, D. R. Rolison, O. Sankey, K. S. Schanze, J. Yardley, X. Zhu, The Journal of Physical Chemistry B 2003, 107 6668-6697.
[186] M. C. Daniel, D. Astruc, Chemical Reviews 2003, 104 293-346.
[187] G. H. Woehrle, L. O. Brown, J. E. Hutchison, Journal of the American Chemical Society 2005, 127 2172-2183.
[188] M. B. Cortie, Gold Bulletin 2004, 37 12-19.
[189] M. B. Cortie, A. I. Maaroof, G. B. Smith, Gold Bulletin 2005, 38 14-22.
Introduction and Theoretical Part 48
[190] A. C. Templeton, W. P. Wuelfing, R. W. Murray, Accounts of Chemical Research 1999, 33 27-36.
[191] P. D. Steven, Eds.: N. Shuji, F. C. Shigefusa, CRC Press, Florida 2000.
[192] S. Nakamura, Laser Focus World 2000, 36 13.
[193] C. C. Kao, H. W. Huang, J. Y. Tsai, C. C. Yu, C. F. Lin, H. C. Kuo, S. C. Wang, Materials Science and Engineering B-Solid State Materials for Advanced Technology 2004, 107 283-288.
[194] A. A. BurkJr., M. J. O'Loughlin, R. R. Siergiej, A. K. Agarwal, S. Sriram, R. C. Clarke, M. F. MacMillan, V. Balakrishna, C. D. Brandt, Solid-State Electronics 1999, 43 1459-1464.
[195] V. J. Leppert, C. J. Zhang, H. W. H. Lee, I. M. Kennedy, S. H. Risbud, Applied Physics Letters 1998, 72 3035-3037.
[196] T. J. Goodwin, V. J. Leppert, S. H. Risbud, I. M. Kennedy, H. W. H. Lee, Applied Physics Letters 1997, 70 3122-3124.
[197] T. J. Goodwin, V. J. Leppert, C. A. Smith, S. H. Risbud, M. Niemeyer, P. P. Power, H. W. H. Lee, L. W. Hrubesh, Applied Physics Letters 1996, 69 3230-3232.
[198] K. E. Gonsalves, G. Carlson, S. P. Rangarajan, M. Benaissa, M. Jose-Yacaman, J.Mater.Chem. 1996, 6 1451-1453.
[199] A. C. Frank, F. Stowasser, H. Sussek, H. Pritzkow, C. R. Miskys, O. Ambacher, M. Giersig, R. A. Fischer, Journal of the American Chemical Society 1998, 120 3512-3513.
[200] T. Hariu, T. Usuba, H. Adachi, Y. Shibata, Applied Physics Letters 1978, 32 252-253.
[201] K. Abe, S. Nonomura, S. Kobayashi, M. Ohkubo, T. Gotoh, M. Nishio, S. Nitta, S. Okamoto, Y. Kanemitsu, Journal of Non-Crystalline Solids 1998, 227-230 1096-1100.
[202] E. Borsella, S. Dal Toe, G. Mattei, C. Maurizio, P. Mazzoldi, A. Saber, G. C. Battaglin, E. Cattaruzza, F. Gonella, A. Quaranta, F. D'Acapito, Materials Science and Engineering B 2001, 82 148-150.
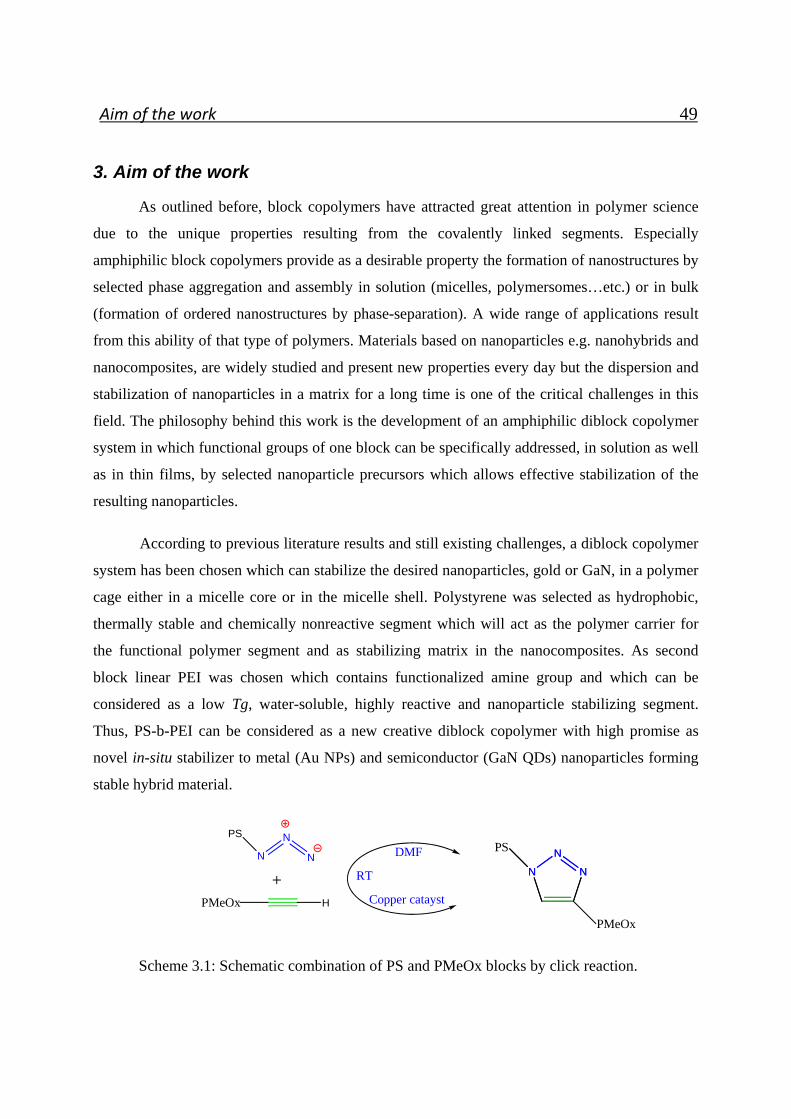
Aim of the work 49
3. Aim of the work
As outlined before, block copolymers have attracted great attention in polymer science
due to the unique properties resulting from the covalently linked segments. Especially
amphiphilic block copolymers provide as a desirable property the formation of nanostructures by
selected phase aggregation and assembly in solution (micelles, polymersomes…etc.) or in bulk
(formation of ordered nanostructures by phase-separation). A wide range of applications result
from this ability of that type of polymers. Materials based on nanoparticles e.g. nanohybrids and
nanocomposites, are widely studied and present new properties every day but the dispersion and
stabilization of nanoparticles in a matrix for a long time is one of the critical challenges in this
field. The philosophy behind this work is the development of an amphiphilic diblock copolymer
system in which functional groups of one block can be specifically addressed, in solution as well
as in thin films, by selected nanoparticle precursors which allows effective stabilization of the
resulting nanoparticles.
According to previous literature results and still existing challenges, a diblock copolymer
system has been chosen which can stabilize the desired nanoparticles, gold or GaN, in a polymer
cage either in a micelle core or in the micelle shell. Polystyrene was selected as hydrophobic,
thermally stable and chemically nonreactive segment which will act as the polymer carrier for
the functional polymer segment and as stabilizing matrix in the nanocomposites. As second
block linear PEI was chosen which contains functionalized amine group and which can be
considered as a low Tg, water-soluble, highly reactive and nanoparticle stabilizing segment.
Thus, PS-b-PEI can be considered as a new creative diblock copolymer with high promise as
novel in-situ stabilizer to metal (Au NPs) and semiconductor (GaN QDs) nanoparticles forming
stable hybrid material.
H
N
N
N
PS
Copper catayst
N
N
N N
N
N
PMeOx
PS
PMeOx
DMF
RT
Scheme 3.1: Schematic combination of PS and PMeOx blocks by click reaction.
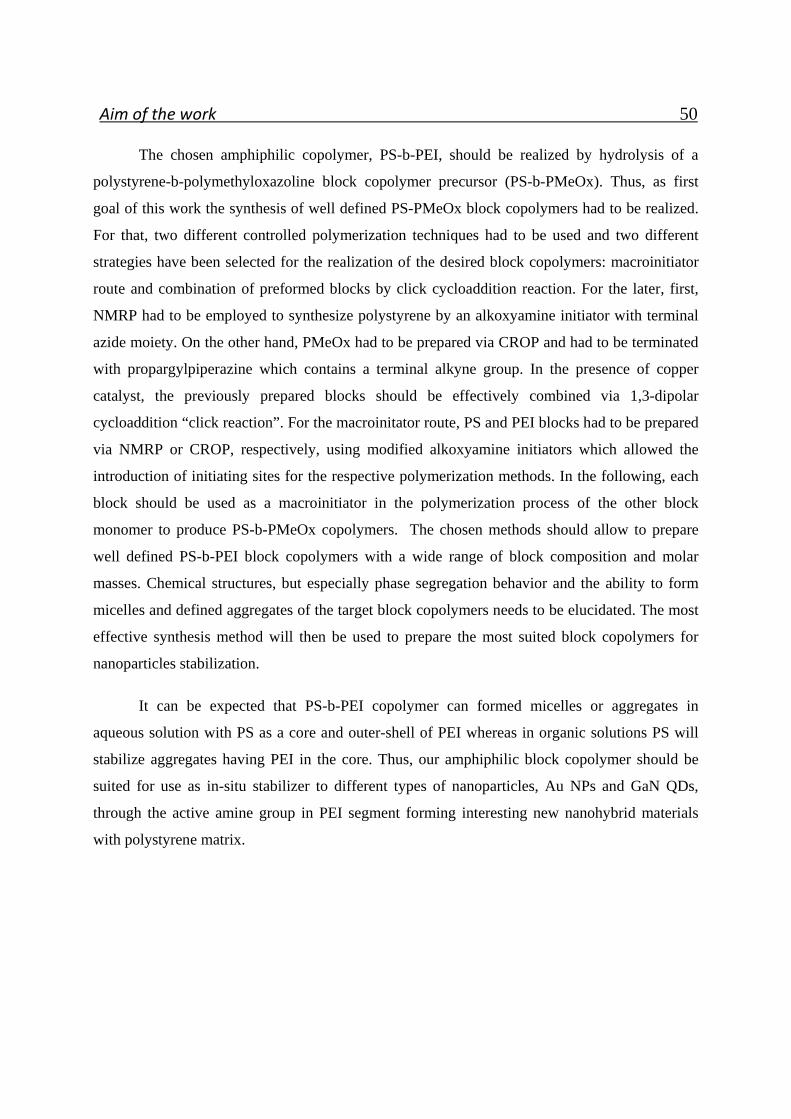
Aim of the work 50
The chosen amphiphilic copolymer, PS-b-PEI, should be realized by hydrolysis of a
polystyrene-b-polymethyloxazoline block copolymer precursor (PS-b-PMeOx). Thus, as first
goal of this work the synthesis of well defined PS-PMeOx block copolymers had to be realized.
For that, two different controlled polymerization techniques had to be used and two different
strategies have been selected for the realization of the desired block copolymers: macroinitiator
route and combination of preformed blocks by click cycloaddition reaction. For the later, first,
NMRP had to be employed to synthesize polystyrene by an alkoxyamine initiator with terminal
azide moiety. On the other hand, PMeOx had to be prepared via CROP and had to be terminated
with propargylpiperazine which contains a terminal alkyne group. In the presence of copper
catalyst, the previously prepared blocks should be effectively combined via 1,3-dipolar
cycloaddition “click reaction”. For the macroinitator route, PS and PEI blocks had to be prepared
via NMRP or CROP, respectively, using modified alkoxyamine initiators which allowed the
introduction of initiating sites for the respective polymerization methods. In the following, each
block should be used as a macroinitiator in the polymerization process of the other block
monomer to produce PS-b-PMeOx copolymers. The chosen methods should allow to prepare
well defined PS-b-PEI block copolymers with a wide range of block composition and molar
masses. Chemical structures, but especially phase segregation behavior and the ability to form
micelles and defined aggregates of the target block copolymers needs to be elucidated. The most
effective synthesis method will then be used to prepare the most suited block copolymers for
nanoparticles stabilization.
It can be expected that PS-b-PEI copolymer can formed micelles or aggregates in
aqueous solution with PS as a core and outer-shell of PEI whereas in organic solutions PS will
stabilize aggregates having PEI in the core. Thus, our amphiphilic block copolymer should be
suited for use as in-situ stabilizer to different types of nanoparticles, Au NPs and GaN QDs,
through the active amine group in PEI segment forming interesting new nanohybrid materials
with polystyrene matrix.
Aim of the work 51
Scheme 3.2: Schematic diagram of research path way
The research plan to stabilize gold and gallium nitride nanoparticles in amphiphilic block
copolymers matrices is presented in scheme 3.2. PS-PEI amphiphilic block copolymer will be
applied as a self-reducing and stabilizing agent to gold nanoparticles from gold salt in aqueous
solution making use of the secondary amine group in PEI block. Very small Au NPs (below 20
nm) are aimed for prepared in the polymer matrix since these have high importance in many
applications due to effectively and unique properties of nano-gold hybrids material.
Moreover, PS-b-PEI copolymers should also act as in-situ stabilizer for gallium nitride quantum
dots. Permanent fixation of GaN QDs in polymer domain and thus increased stability will
increase the utility of GaN as a blue ray source in electronic devices. The high value of stabilized
GaN QDs, long duration time and safe environment, will push their so far limited application
towards wide spread applications.
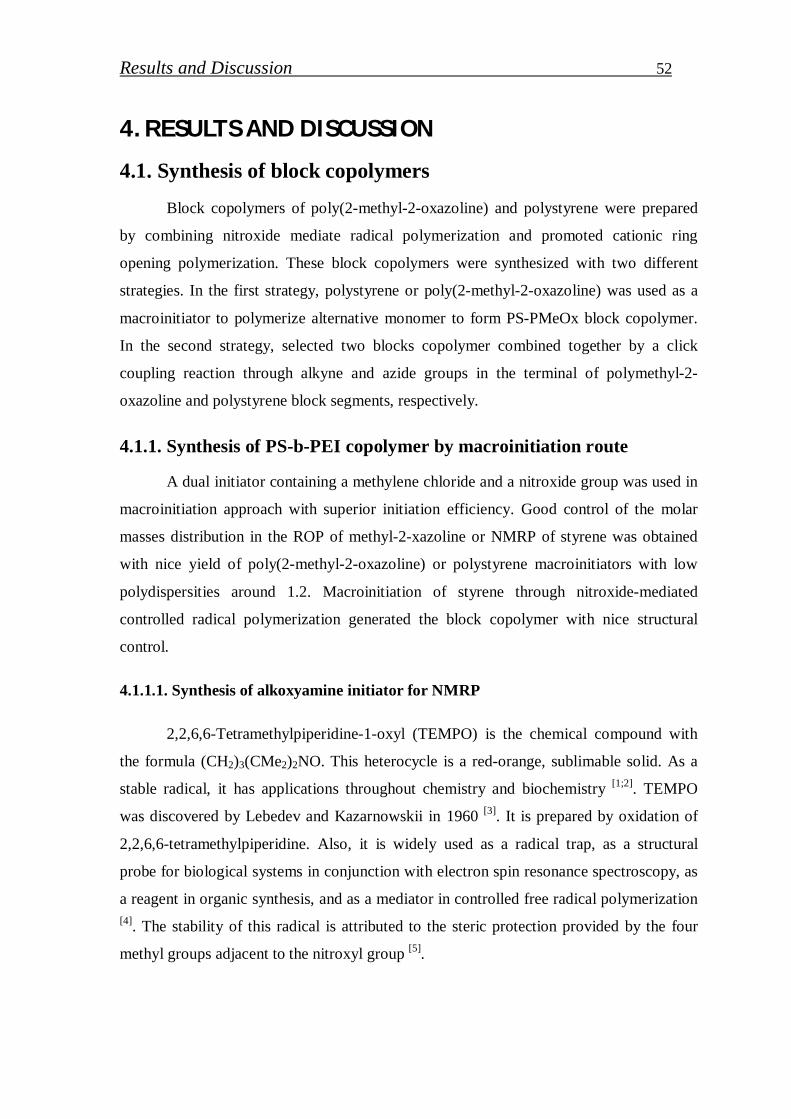
Results and Discussion 52
4. RESULTS AND DISCUSSION
4.1. Synthesis of block copolymers
Block copolymers of poly(2-methyl-2-oxazoline) and polystyrene were prepared
by combining nitroxide mediate radical polymerization and promoted cationic ring
opening polymerization. These block copolymers were synthesized with two different
strategies. In the first strategy, polystyrene or poly(2-methyl-2-oxazoline) was used as a
macroinitiator to polymerize alternative monomer to form PS-PMeOx block copolymer.
In the second strategy, selected two blocks copolymer combined together by a click
coupling reaction through alkyne and azide groups in the terminal of polymethyl-2-
oxazoline and polystyrene block segments, respectively.
4.1.1. Synthesis of PS-b-PEI copolymer by macroinitiation route
A dual initiator containing a methylene chloride and a nitroxide group was used in
macroinitiation approach with superior initiation efficiency. Good control of the molar
masses distribution in the ROP of methyl-2-xazoline or NMRP of styrene was obtained
with nice yield of poly(2-methyl-2-oxazoline) or polystyrene macroinitiators with low
polydispersities around 1.2. Macroinitiation of styrene through nitroxide-mediated
controlled radical polymerization generated the block copolymer with nice structural
control.
4.1.1.1. Synthesis of alkoxyamine initiator for NMRP
2,2,6,6-Tetramethylpiperidine-1-oxyl (TEMPO) is the chemical compound with
the formula (CH2)3(CMe2)2NO. This heterocycle is a red-orange, sublimable solid. As a
stable radical, it has applications throughout chemistry and biochemistry [1;2]. TEMPO
was discovered by Lebedev and Kazarnowskii in 1960 [3]. It is prepared by oxidation of
2,2,6,6-tetramethylpiperidine. Also, it is widely used as a radical trap, as a structural
probe for biological systems in conjunction with electron spin resonance spectroscopy, as
a reagent in organic synthesis, and as a mediator in controlled free radical polymerization [4]. The stability of this radical is attributed to the steric protection provided by the four
methyl groups adjacent to the nitroxyl group [5].
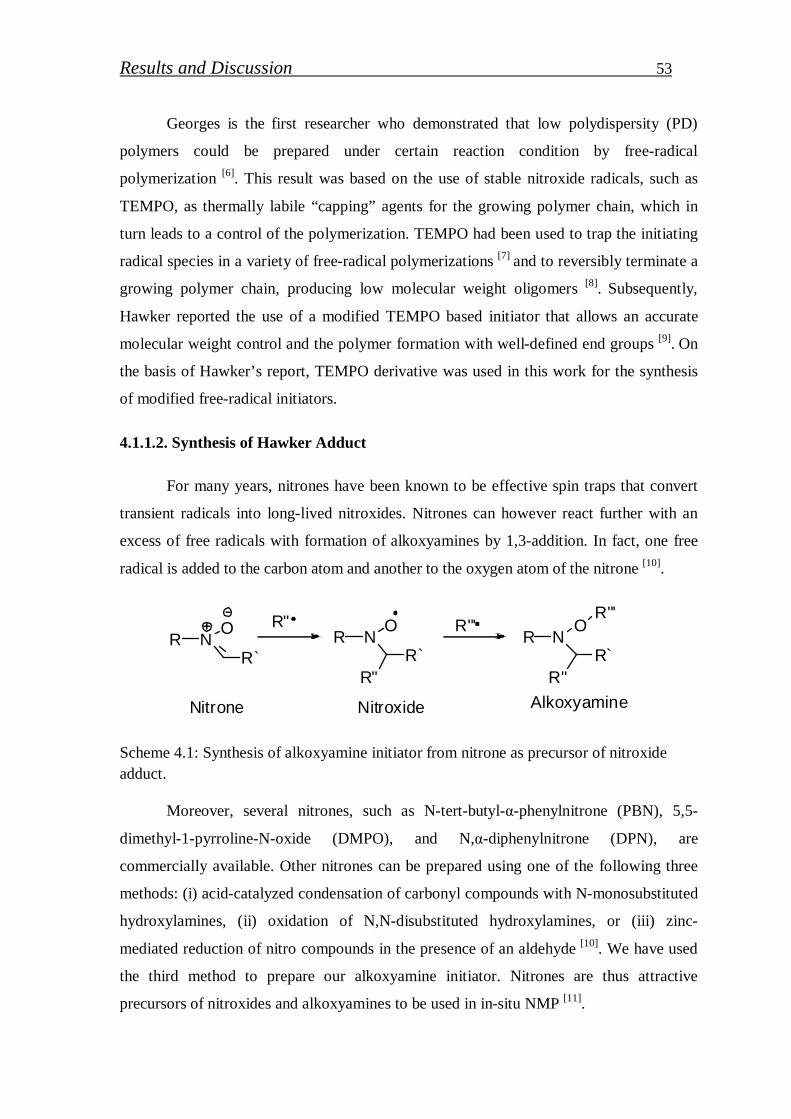
Results and Discussion 53
Georges is the first researcher who demonstrated that low polydispersity (PD)
polymers could be prepared under certain reaction condition by free-radical
polymerization [6]. This result was based on the use of stable nitroxide radicals, such as
TEMPO, as thermally labile “capping” agents for the growing polymer chain, which in
turn leads to a control of the polymerization. TEMPO had been used to trap the initiating
radical species in a variety of free-radical polymerizations [7] and to reversibly terminate a
growing polymer chain, producing low molecular weight oligomers [8]. Subsequently,
Hawker reported the use of a modified TEMPO based initiator that allows an accurate
molecular weight control and the polymer formation with well-defined end groups [9]. On
the basis of Hawker’s report, TEMPO derivative was used in this work for the synthesis
of modified free-radical initiators.
4.1.1.2. Synthesis of Hawker Adduct
For many years, nitrones have been known to be effective spin traps that convert
transient radicals into long-lived nitroxides. Nitrones can however react further with an
excess of free radicals with formation of alkoxyamines by 1,3-addition. In fact, one free
radical is added to the carbon atom and another to the oxygen atom of the nitrone [10].
NO
R`R
R"N
O
R`R
R"
R"'N
O
R`R
R"
R"'
Nitrone Nitroxide Alkoxyamine
Scheme 4.1: Synthesis of alkoxyamine initiator from nitrone as precursor of nitroxide adduct.
Moreover, several nitrones, such as N-tert-butyl-α-phenylnitrone (PBN), 5,5-
dimethyl-1-pyrroline-N-oxide (DMPO), and N,α-diphenylnitrone (DPN), are
commercially available. Other nitrones can be prepared using one of the following three
methods: (i) acid-catalyzed condensation of carbonyl compounds with N-monosubstituted
hydroxylamines, (ii) oxidation of N,N-disubstituted hydroxylamines, or (iii) zinc-
mediated reduction of nitro compounds in the presence of an aldehyde [10]. We have used
the third method to prepare our alkoxyamine initiator. Nitrones are thus attractive
precursors of nitroxides and alkoxyamines to be used in in-situ NMP [11].
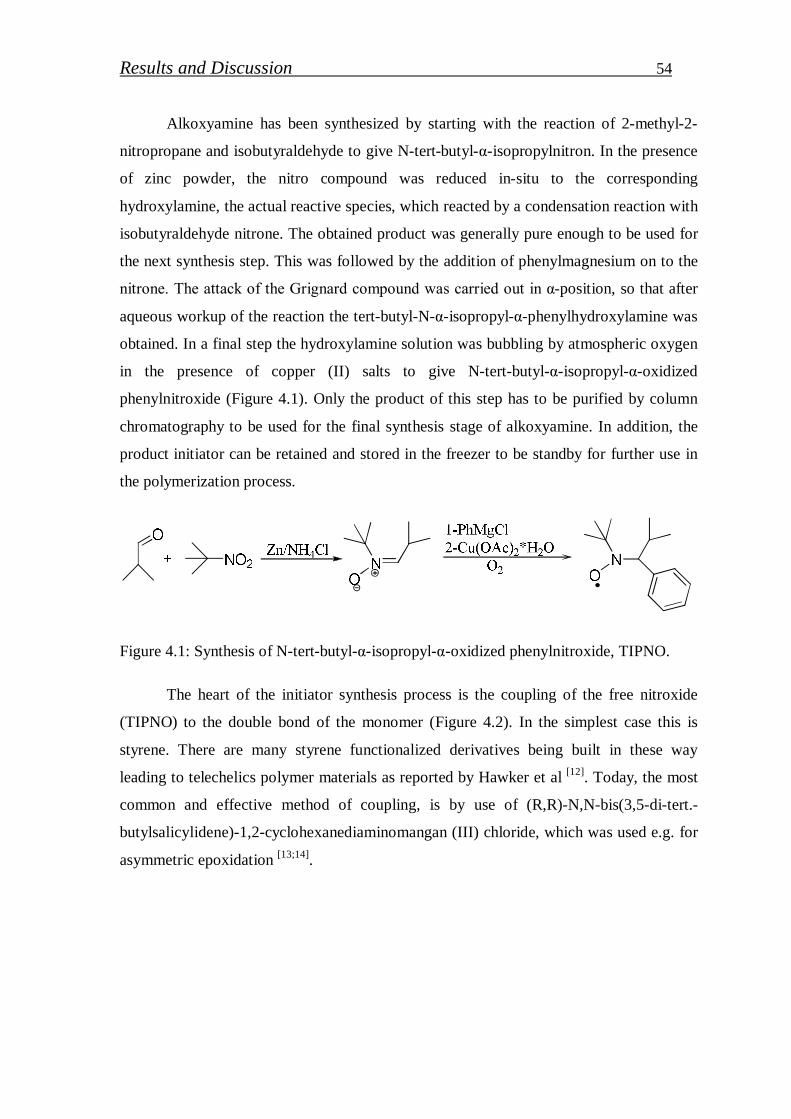
Results and Discussion 54
Alkoxyamine has been synthesized by starting with the reaction of 2-methyl-2-
nitropropane and isobutyraldehyde to give N-tert-butyl-α-isopropylnitron. In the presence
of zinc powder, the nitro compound was reduced in-situ to the corresponding
hydroxylamine, the actual reactive species, which reacted by a condensation reaction with
isobutyraldehyde nitrone. The obtained product was generally pure enough to be used for
the next synthesis step. This was followed by the addition of phenylmagnesium on to the
nitrone. The attack of the Grignard compound was carried out in α-position, so that after
aqueous workup of the reaction the tert-butyl-N-α-isopropyl-α-phenylhydroxylamine was
obtained. In a final step the hydroxylamine solution was bubbling by atmospheric oxygen
in the presence of copper (II) salts to give N-tert-butyl-α-isopropyl-α-oxidized
phenylnitroxide (Figure 4.1). Only the product of this step has to be purified by column
chromatography to be used for the final synthesis stage of alkoxyamine. In addition, the
product initiator can be retained and stored in the freezer to be standby for further use in
the polymerization process.
Figure 4.1: Synthesis of N-tert-butyl-α-isopropyl-α-oxidized phenylnitroxide, TIPNO.
The heart of the initiator synthesis process is the coupling of the free nitroxide
(TIPNO) to the double bond of the monomer (Figure 4.2). In the simplest case this is
styrene. There are many styrene functionalized derivatives being built in these way
leading to telechelics polymer materials as reported by Hawker et al [12]. Today, the most
common and effective method of coupling, is by use of (R,R)-N,N-bis(3,5-di-tert.-
butylsalicylidene)-1,2-cyclohexanediaminomangan (III) chloride, which was used e.g. for
asymmetric epoxidation [13;14].
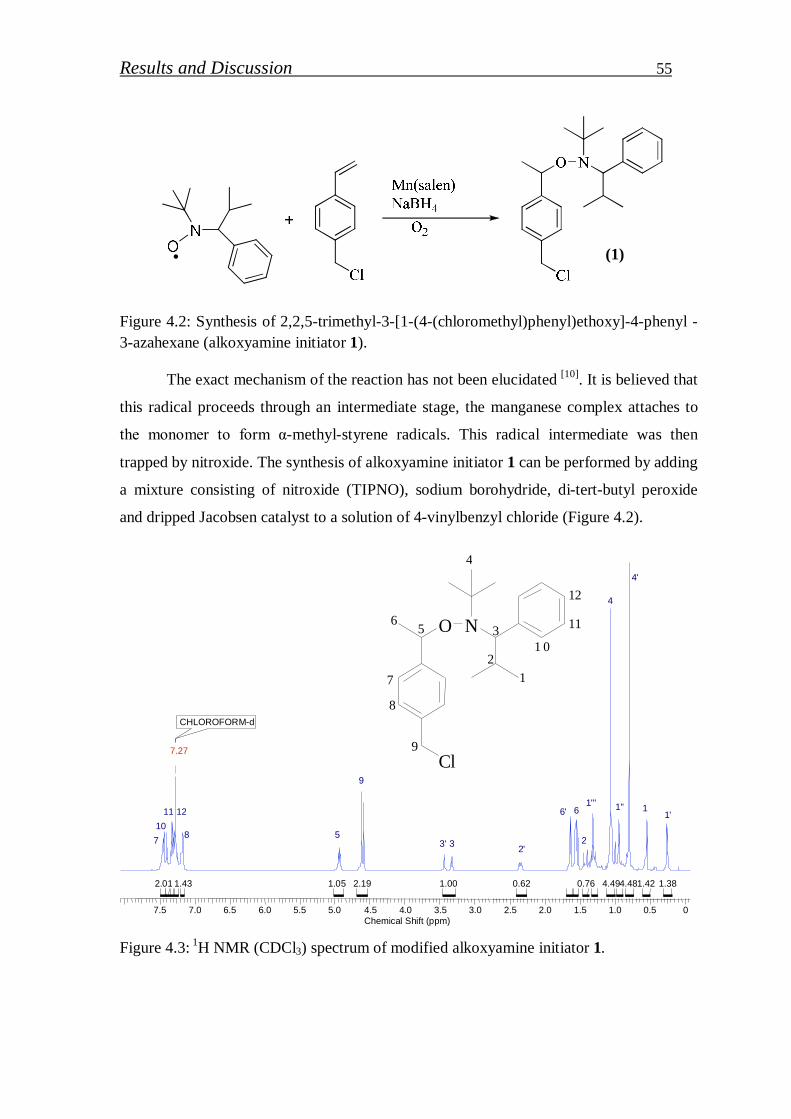
Results and Discussion 55
Figure 4.2: Synthesis of 2,2,5-trimethyl-3-[1-(4-(chloromethyl)phenyl)ethoxy]-4-phenyl -3-azahexane (alkoxyamine initiator 1).
The exact mechanism of the reaction has not been elucidated [10]. It is believed that
this radical proceeds through an intermediate stage, the manganese complex attaches to
the monomer to form α-methyl-styrene radicals. This radical intermediate was then
trapped by nitroxide. The synthesis of alkoxyamine initiator 1 can be performed by adding
a mixture consisting of nitroxide (TIPNO), sodium borohydride, di-tert-butyl peroxide
and dripped Jacobsen catalyst to a solution of 4-vinylbenzyl chloride (Figure 4.2).
7.5 7.0 6.5 6.0 5.5 5.0 4.5 4.0 3.5 3.0 2.5 2.0 1.5 1.0 0.5 0Chemical Shift (ppm)
1.381.424.484.490.760.621.002.191.051.432.01
CHLOROFORM-d
7.27
1'11''1'''
4'
4
2
66'
2'33'
9
57 10
11 12
8
NO
Cl
12
3
4
56
7
8
9
1 0
11
12
Figure 4.3: 1H NMR (CDCl3) spectrum of modified alkoxyamine initiator 1.
(1)
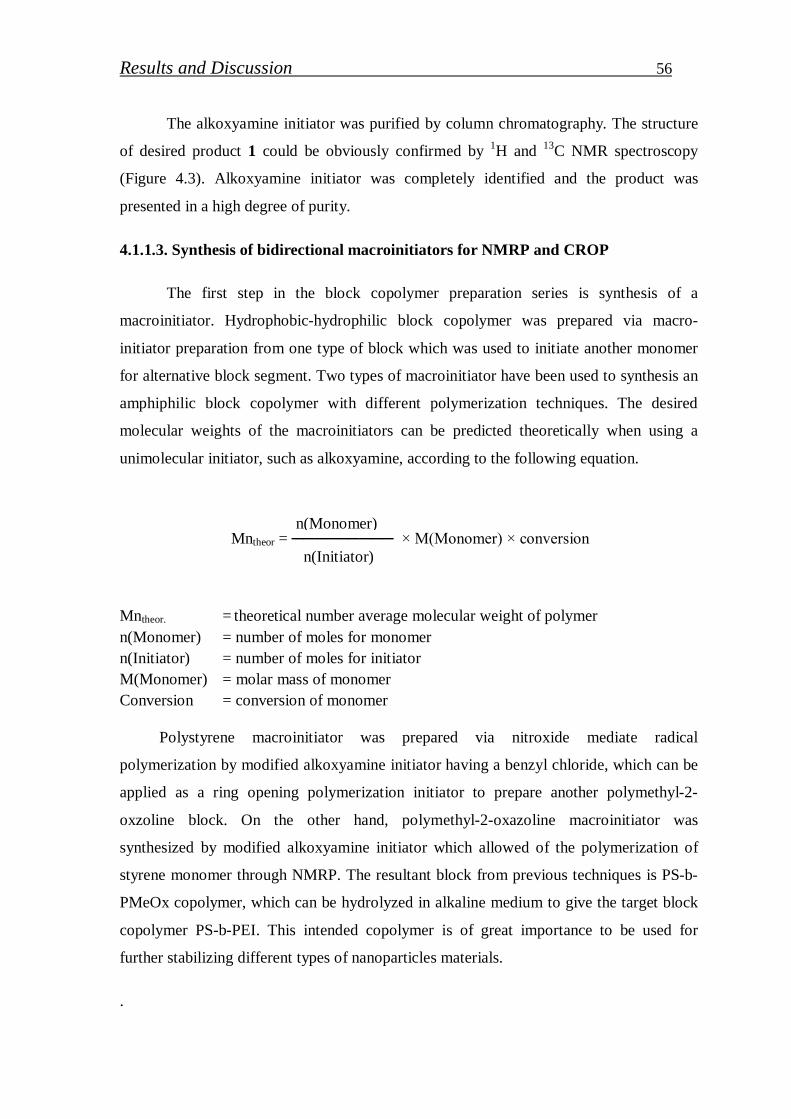
Results and Discussion 56
The alkoxyamine initiator was purified by column chromatography. The structure
of desired product 1 could be obviously confirmed by 1H and 13C NMR spectroscopy
(Figure 4.3). Alkoxyamine initiator was completely identified and the product was
presented in a high degree of purity.
4.1.1.3. Synthesis of bidirectional macroinitiators for NMRP and CROP
The first step in the block copolymer preparation series is synthesis of a
macroinitiator. Hydrophobic-hydrophilic block copolymer was prepared via macro-
initiator preparation from one type of block which was used to initiate another monomer
for alternative block segment. Two types of macroinitiator have been used to synthesis an
amphiphilic block copolymer with different polymerization techniques. The desired
molecular weights of the macroinitiators can be predicted theoretically when using a
unimolecular initiator, such as alkoxyamine, according to the following equation.
Mntheor = ───────── × M(Monomer) × conversion
Mntheor.
n(Monomer) n(Initiator) M(Monomer) Conversion
= theoretical number average molecular weight of polymer = number of moles for monomer = number of moles for initiator = molar mass of monomer = conversion of monomer
Polystyrene macroinitiator was prepared via nitroxide mediate radical
polymerization by modified alkoxyamine initiator having a benzyl chloride, which can be
applied as a ring opening polymerization initiator to prepare another polymethyl-2-
oxzoline block. On the other hand, polymethyl-2-oxazoline macroinitiator was
synthesized by modified alkoxyamine initiator which allowed of the polymerization of
styrene monomer through NMRP. The resultant block from previous techniques is PS-b-
PMeOx copolymer, which can be hydrolyzed in alkaline medium to give the target block
copolymer PS-b-PEI. This intended copolymer is of great importance to be used for
further stabilizing different types of nanoparticles materials.
.
n(Monomer)
n(Initiator)
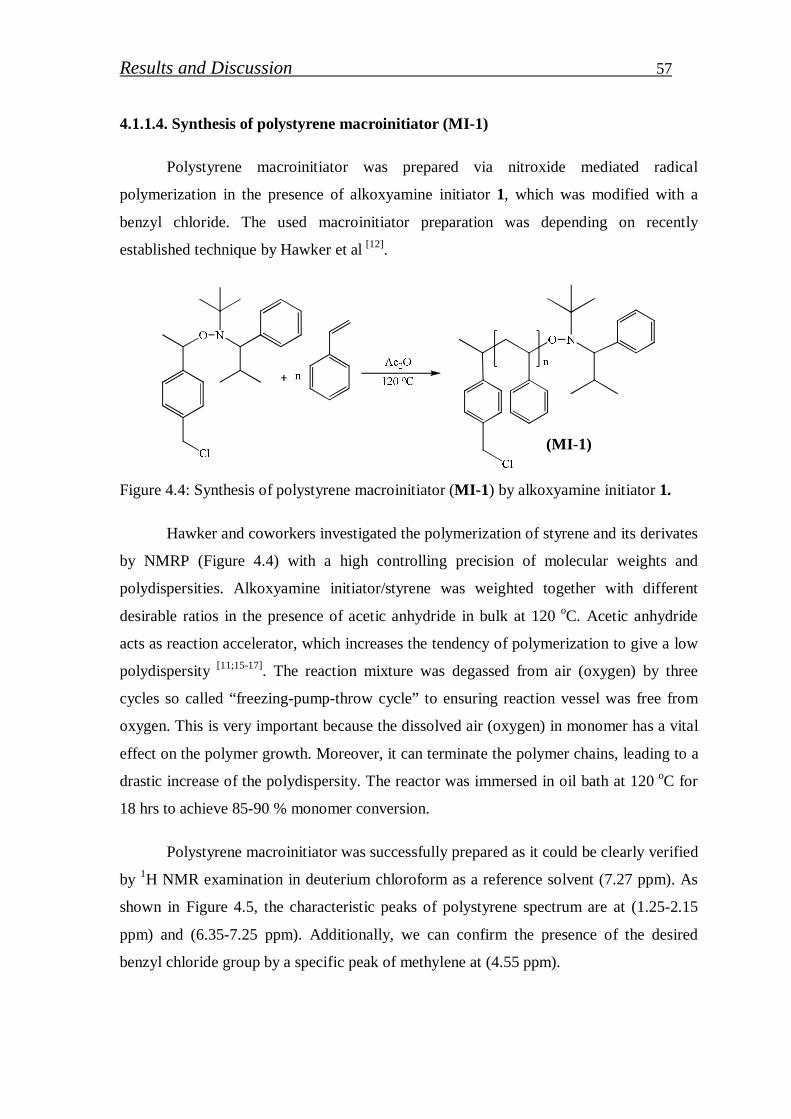
Results and Discussion 57
4.1.1.4. Synthesis of polystyrene macroinitiator (MI-1)
Polystyrene macroinitiator was prepared via nitroxide mediated radical
polymerization in the presence of alkoxyamine initiator 1, which was modified with a
benzyl chloride. The used macroinitiator preparation was depending on recently
established technique by Hawker et al [12].
Figure 4.4: Synthesis of polystyrene macroinitiator (MI-1) by alkoxyamine initiator 1.
Hawker and coworkers investigated the polymerization of styrene and its derivates
by NMRP (Figure 4.4) with a high controlling precision of molecular weights and
polydispersities. Alkoxyamine initiator/styrene was weighted together with different
desirable ratios in the presence of acetic anhydride in bulk at 120 oC. Acetic anhydride
acts as reaction accelerator, which increases the tendency of polymerization to give a low
polydispersity [11;15-17]. The reaction mixture was degassed from air (oxygen) by three
cycles so called “freezing-pump-throw cycle” to ensuring reaction vessel was free from
oxygen. This is very important because the dissolved air (oxygen) in monomer has a vital
effect on the polymer growth. Moreover, it can terminate the polymer chains, leading to a
drastic increase of the polydispersity. The reactor was immersed in oil bath at 120 oC for
18 hrs to achieve 85-90 % monomer conversion.
Polystyrene macroinitiator was successfully prepared as it could be clearly verified
by 1H NMR examination in deuterium chloroform as a reference solvent (7.27 ppm). As
shown in Figure 4.5, the characteristic peaks of polystyrene spectrum are at (1.25-2.15
ppm) and (6.35-7.25 ppm). Additionally, we can confirm the presence of the desired
benzyl chloride group by a specific peak of methylene at (4.55 ppm).
(MI-1)
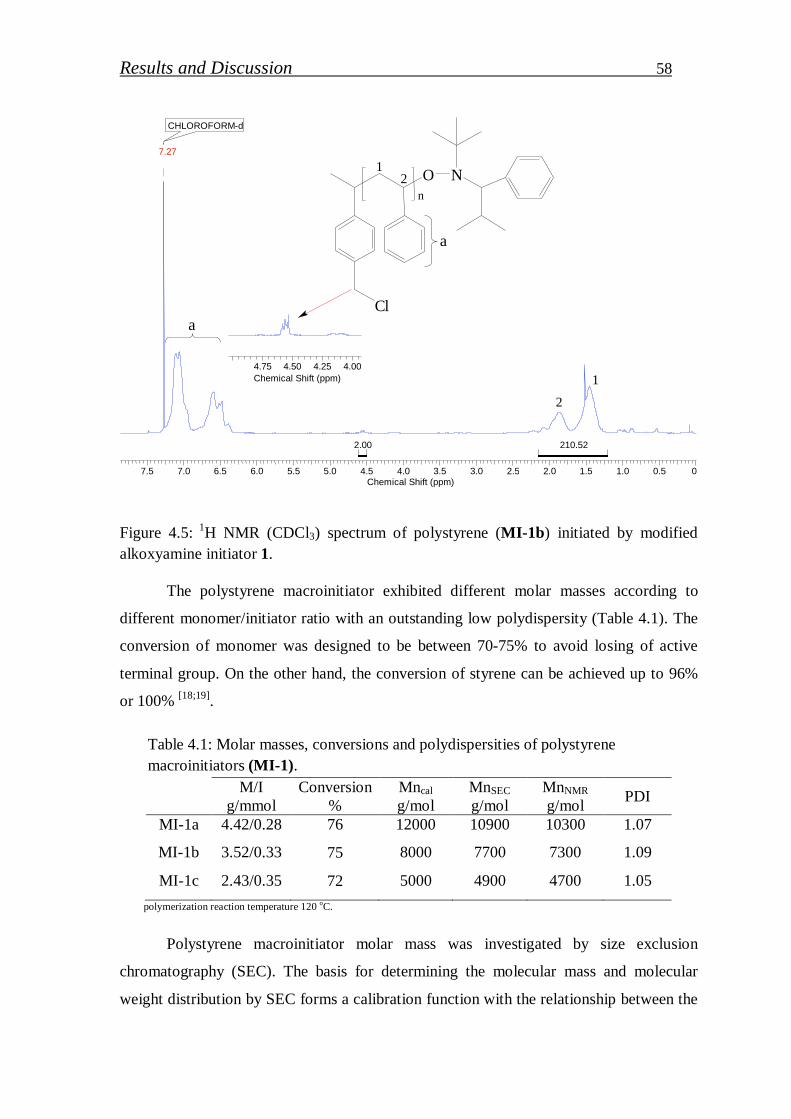
Results and Discussion 58
Figure 4.5: 1H NMR (CDCl3) spectrum of polystyrene (MI-1b) initiated by modified alkoxyamine initiator 1.
The polystyrene macroinitiator exhibited different molar masses according to
different monomer/initiator ratio with an outstanding low polydispersity (Table 4.1). The
conversion of monomer was designed to be between 70-75% to avoid losing of active
terminal group. On the other hand, the conversion of styrene can be achieved up to 96%
or 100% [18;19].
Table 4.1: Molar masses, conversions and polydispersities of polystyrene macroinitiators (MI-1).
M/I g/mmol
Conversion %
Mncal g/mol
MnSEC g/mol
MnNMR g/mol PDI
MI-1a 4.42/0.28 76 12000 10900 10300 1.07
MI-1b 3.52/0.33 75 8000 7700 7300 1.09
MI-1c 2.43/0.35 72 5000 4900 4700 1.05 polymerization reaction temperature 120 oC.
Polystyrene macroinitiator molar mass was investigated by size exclusion
chromatography (SEC). The basis for determining the molecular mass and molecular
weight distribution by SEC forms a calibration function with the relationship between the
7.5 7.0 6.5 6.0 5.5 5.0 4.5 4.0 3.5 3.0 2.5 2.0 1.5 1.0 0.5 0
Chemical Shift (ppm)
210.52 2.00
CHLOROFORM-d 7.27
4.75 4.50 4.25 4.00 Chemical Shift (ppm)
NOn
Cl
1
1
2
2
a
a
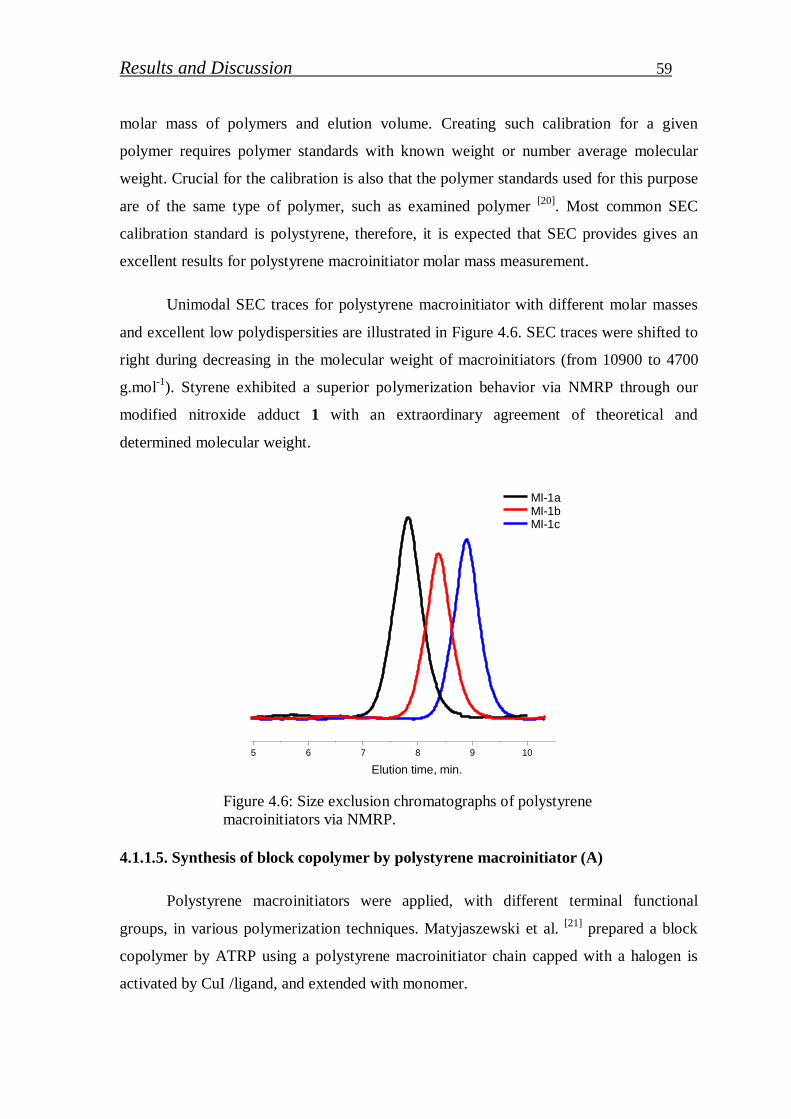
Results and Discussion 59
molar mass of polymers and elution volume. Creating such calibration for a given
polymer requires polymer standards with known weight or number average molecular
weight. Crucial for the calibration is also that the polymer standards used for this purpose
are of the same type of polymer, such as examined polymer [20]. Most common SEC
calibration standard is polystyrene, therefore, it is expected that SEC provides gives an
excellent results for polystyrene macroinitiator molar mass measurement.
Unimodal SEC traces for polystyrene macroinitiator with different molar masses
and excellent low polydispersities are illustrated in Figure 4.6. SEC traces were shifted to
right during decreasing in the molecular weight of macroinitiators (from 10900 to 4700
g.mol-1). Styrene exhibited a superior polymerization behavior via NMRP through our
modified nitroxide adduct 1 with an extraordinary agreement of theoretical and
determined molecular weight.
Elution time, min.
MI-1a MI-1b MI-1c
5 6 7 8 9 10
Figure 4.6: Size exclusion chromatographs of polystyrene macroinitiators via NMRP.
4.1.1.5. Synthesis of block copolymer by polystyrene macroinitiator (A)
Polystyrene macroinitiators were applied, with different terminal functional
groups, in various polymerization techniques. Matyjaszewski et al. [21] prepared a block
copolymer by ATRP using a polystyrene macroinitiator chain capped with a halogen is
activated by CuI /ligand, and extended with monomer.

Results and Discussion 60
Figure 4.7: Synthesis of PS-b-PMeOx (A) copolymer by polystyrene macroinitiator MI-1.
Nitroxide mediated polymerizations can be successfully used for synthesis of
block copolymers based on styrene macroinitiator and its derivatives [9;22-24]. Yoshida et
al. [25] prepared an aminoxy-terminated polystyrene, and used it to initiate the radical
polymerization of methyl, ethyl, and butyl acrylate to afford the corresponding block
copolymers. Listigovers et al. [26] synthesized low molecular weight polyacrylate
homopolymers as well as polystyrene-polyacrylate diblocks and polyacrylate-polystyrene-
polyacrylate triblocks via nitroxide-mediated living polymerization. Steenbock et al. [27]
attempted to initiate living radical polymerization of MMA using PS having a TEMPO
end group as a macroinitiator.
In this work, methyl-2- oxazoline was initiated by polystyrene macronitiators with
terminal N-tert-butyl-α-isopropyl-α-phenylnitroxid (TIPNO) and methylene chloride head
group as shown in Figure 4.7. Active methylene chloride group works as cationic ring
opening polymerization initiator for 2-oxazoilne [28]. The polymerization reaction was
applied at 110 oC with M/I 80 in benzonitrile medium. The monomer conversion is very
low and the resulting block ratio of PS-b-PMeOx ≈ 20:1.
(A)
110 oC
MI-1
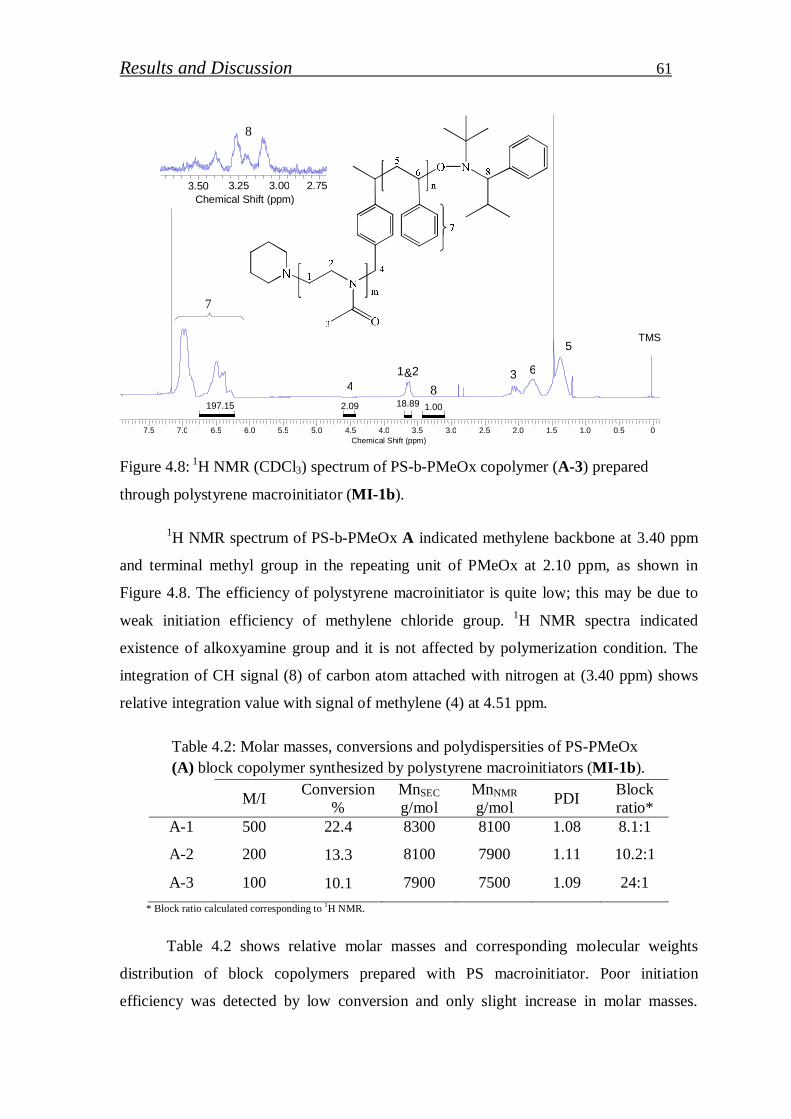
Results and Discussion 61
TMS
1&2 3 4
5
6
3.50 3.25 3.00 2.75Chemical Shift (ppm)
8
1.00 197.15
7
2.09
8 18.89
Figure 4.8: 1H NMR (CDCl3) spectrum of PS-b-PMeOx copolymer (A-3) prepared
through polystyrene macroinitiator (MI-1b).
1H NMR spectrum of PS-b-PMeOx A indicated methylene backbone at 3.40 ppm
and terminal methyl group in the repeating unit of PMeOx at 2.10 ppm, as shown in
Figure 4.8. The efficiency of polystyrene macroinitiator is quite low; this may be due to
weak initiation efficiency of methylene chloride group. 1H NMR spectra indicated
existence of alkoxyamine group and it is not affected by polymerization condition. The
integration of CH signal (8) of carbon atom attached with nitrogen at (3.40 ppm) shows
relative integration value with signal of methylene (4) at 4.51 ppm.
Table 4.2: Molar masses, conversions and polydispersities of PS-PMeOx (A) block copolymer synthesized by polystyrene macroinitiators (MI-1b).
M/I Conversion %
MnSEC g/mol
MnNMR g/mol PDI Block
ratio* A-1 500 22.4 8300 8100 1.08 8.1:1
A-2 200 13.3 8100 7900 1.11 10.2:1
A-3 100 10.1 7900 7500 1.09 24:1 * Block ratio calculated corresponding to 1H NMR.
Table 4.2 shows relative molar masses and corresponding molecular weights
distribution of block copolymers prepared with PS macroinitiator. Poor initiation
efficiency was detected by low conversion and only slight increase in molar masses.
7.5 7.0 6.5 6.0 5.5 5.0 4.5 4.0 3.5 3.0 2.5 2.0 1.5 1.0 0.5 0 Chemical Shift (ppm)
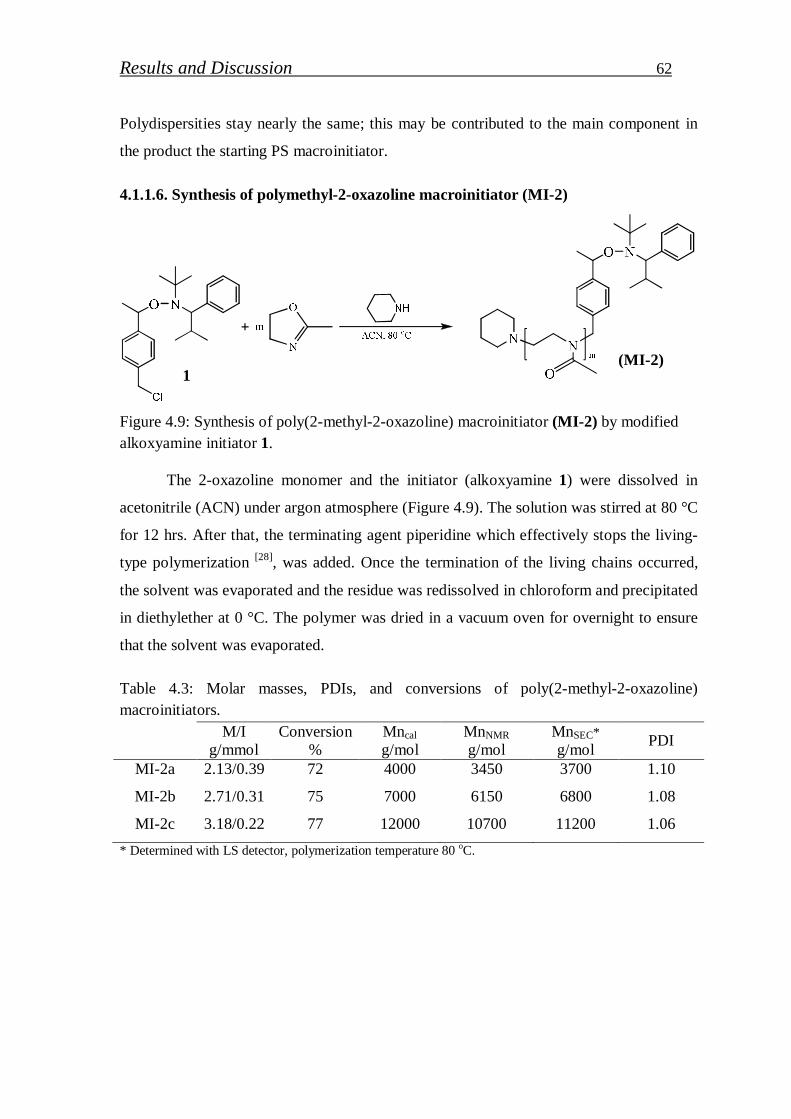
Results and Discussion 62
Polydispersities stay nearly the same; this may be contributed to the main component in
the product the starting PS macroinitiator.
4.1.1.6. Synthesis of polymethyl-2-oxazoline macroinitiator (MI-2)
Figure 4.9: Synthesis of poly(2-methyl-2-oxazoline) macroinitiator (MI-2) by modified alkoxyamine initiator 1.
The 2-oxazoline monomer and the initiator (alkoxyamine 1) were dissolved in
acetonitrile (ACN) under argon atmosphere (Figure 4.9). The solution was stirred at 80 °C
for 12 hrs. After that, the terminating agent piperidine which effectively stops the living-
type polymerization [28], was added. Once the termination of the living chains occurred,
the solvent was evaporated and the residue was redissolved in chloroform and precipitated
in diethylether at 0 °C. The polymer was dried in a vacuum oven for overnight to ensure
that the solvent was evaporated.
Table 4.3: Molar masses, PDIs, and conversions of poly(2-methyl-2-oxazoline) macroinitiators.
M/I g/mmol
Conversion %
Mncal g/mol
MnNMR g/mol
MnSEC* g/mol PDI
MI-2a 2.13/0.39 72 4000 3450 3700 1.10
MI-2b 2.71/0.31 75 7000 6150 6800 1.08
MI-2c 3.18/0.22 77 12000 10700 11200 1.06 * Determined with LS detector, polymerization temperature 80 oC.
(MI-2)
1
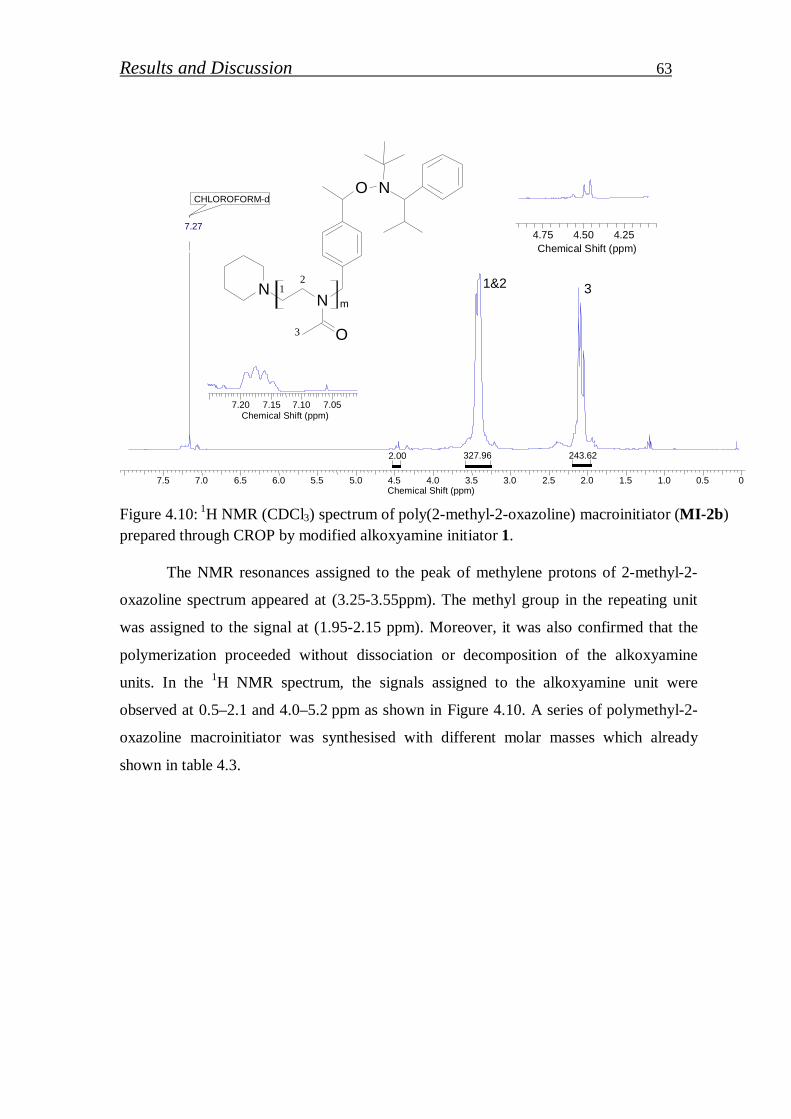
Results and Discussion 63
Figure 4.10: 1H NMR (CDCl3) spectrum of poly(2-methyl-2-oxazoline) macroinitiator (MI-2b) prepared through CROP by modified alkoxyamine initiator 1.
The NMR resonances assigned to the peak of methylene protons of 2-methyl-2-
oxazoline spectrum appeared at (3.25-3.55ppm). The methyl group in the repeating unit
was assigned to the signal at (1.95-2.15 ppm). Moreover, it was also confirmed that the
polymerization proceeded without dissociation or decomposition of the alkoxyamine
units. In the 1H NMR spectrum, the signals assigned to the alkoxyamine unit were
observed at 0.5–2.1 and 4.0–5.2 ppm as shown in Figure 4.10. A series of polymethyl-2-
oxazoline macroinitiator was synthesised with different molar masses which already
shown in table 4.3.
CHLOROFORM-d
7.27
7.20 7.15 7.10 7.05Chemical Shift (ppm)
NO
N
O
Nm
12
3
1&2 3
2.00 327.96 243.62
4.75 4.50 4.25Chemical Shift (ppm)
7.5 7.0 6.5 6.0 5.5 5.0 4.5 4.0 3.5 3.0 2.5 2.0 1.5 1.0 0.5 0 Chemical Shift (ppm)
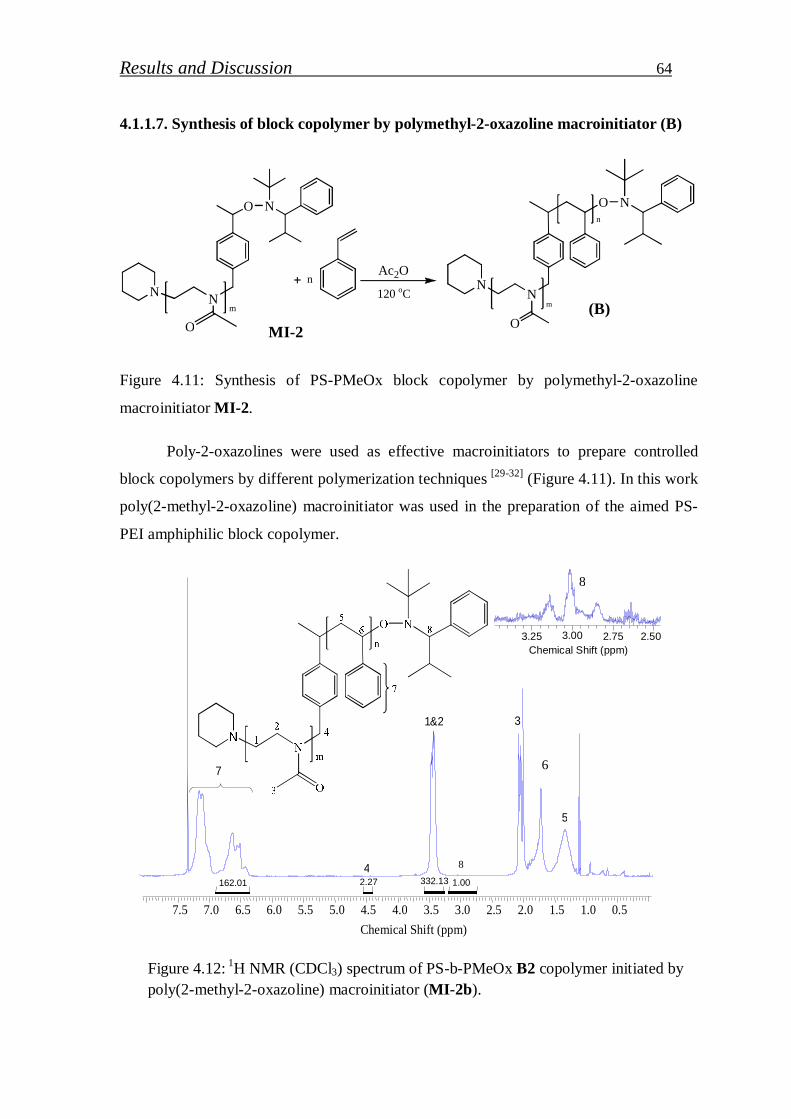
Results and Discussion 64
4.1.1.7. Synthesis of block copolymer by polymethyl-2-oxazoline macroinitiator (B)
O N
NNm
O
nAc2O
125 oC
NOn
NN
Om
Figure 4.11: Synthesis of PS-PMeOx block copolymer by polymethyl-2-oxazoline
macroinitiator MI-2.
Poly-2-oxazolines were used as effective macroinitiators to prepare controlled
block copolymers by different polymerization techniques [29-32] (Figure 4.11). In this work
poly(2-methyl-2-oxazoline) macroinitiator was used in the preparation of the aimed PS-
PEI amphiphilic block copolymer.
7.5 7.0 6.5 6.0 5.5 5.0 4.5 4.0 3.5 3.0 2.5 2.0 1.5 1.0 0.5
Chemical Shift (ppm)
1&2 3
4
5
7
Figure 4.12: 1H NMR (CDCl3) spectrum of PS-b-PMeOx B2 copolymer initiated by poly(2-methyl-2-oxazoline) macroinitiator (MI-2b).
(B)
3.25 3.00 2.75 2.50Chemical Shift (ppm)
8
1.00 2.27 332.13 162.01
6
8
120 oC
MI-2
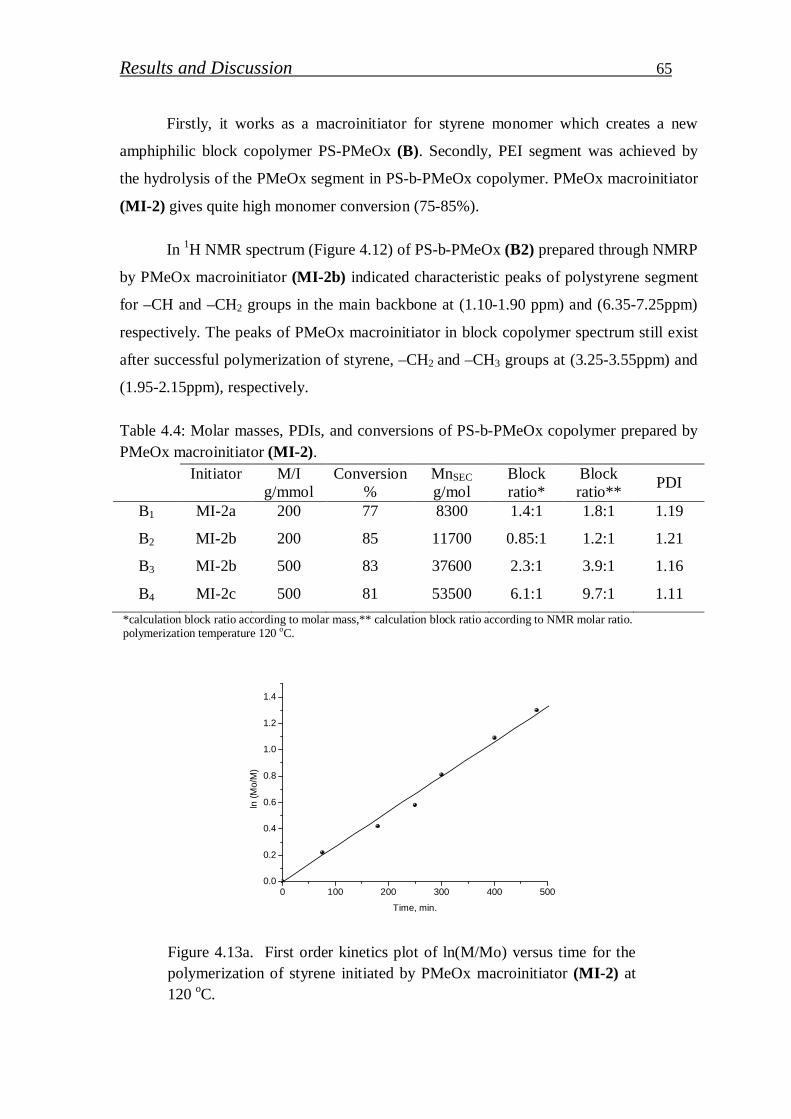
Results and Discussion 65
Firstly, it works as a macroinitiator for styrene monomer which creates a new
amphiphilic block copolymer PS-PMeOx (B). Secondly, PEI segment was achieved by
the hydrolysis of the PMeOx segment in PS-b-PMeOx copolymer. PMeOx macroinitiator
(MI-2) gives quite high monomer conversion (75-85%).
In 1H NMR spectrum (Figure 4.12) of PS-b-PMeOx (B2) prepared through NMRP
by PMeOx macroinitiator (MI-2b) indicated characteristic peaks of polystyrene segment
for –CH and –CH2 groups in the main backbone at (1.10-1.90 ppm) and (6.35-7.25ppm)
respectively. The peaks of PMeOx macroinitiator in block copolymer spectrum still exist
after successful polymerization of styrene, –CH2 and –CH3 groups at (3.25-3.55ppm) and
(1.95-2.15ppm), respectively.
Table 4.4: Molar masses, PDIs, and conversions of PS-b-PMeOx copolymer prepared by PMeOx macroinitiator (MI-2).
Initiator M/I g/mmol
Conversion %
MnSEC g/mol
Block ratio*
Block ratio** PDI
B1 MI-2a 200 77 8300 1.4:1 1.8:1 1.19
B2 MI-2b 200 85 11700 0.85:1 1.2:1 1.21
B3 MI-2b 500 83 37600 2.3:1 3.9:1 1.16
B4 MI-2c 500 81 53500 6.1:1 9.7:1 1.11 *calculation block ratio according to molar mass,** calculation block ratio according to NMR molar ratio. polymerization temperature 120 oC.
0 100 200 300 400 5000.0
0.2
0.4
0.6
0.8
1.0
1.2
1.4
ln (
Mo/
M)
Time, min.
Figure 4.13a. First order kinetics plot of ln(M/Mo) versus time for the polymerization of styrene initiated by PMeOx macroinitiator (MI-2) at 120 oC.
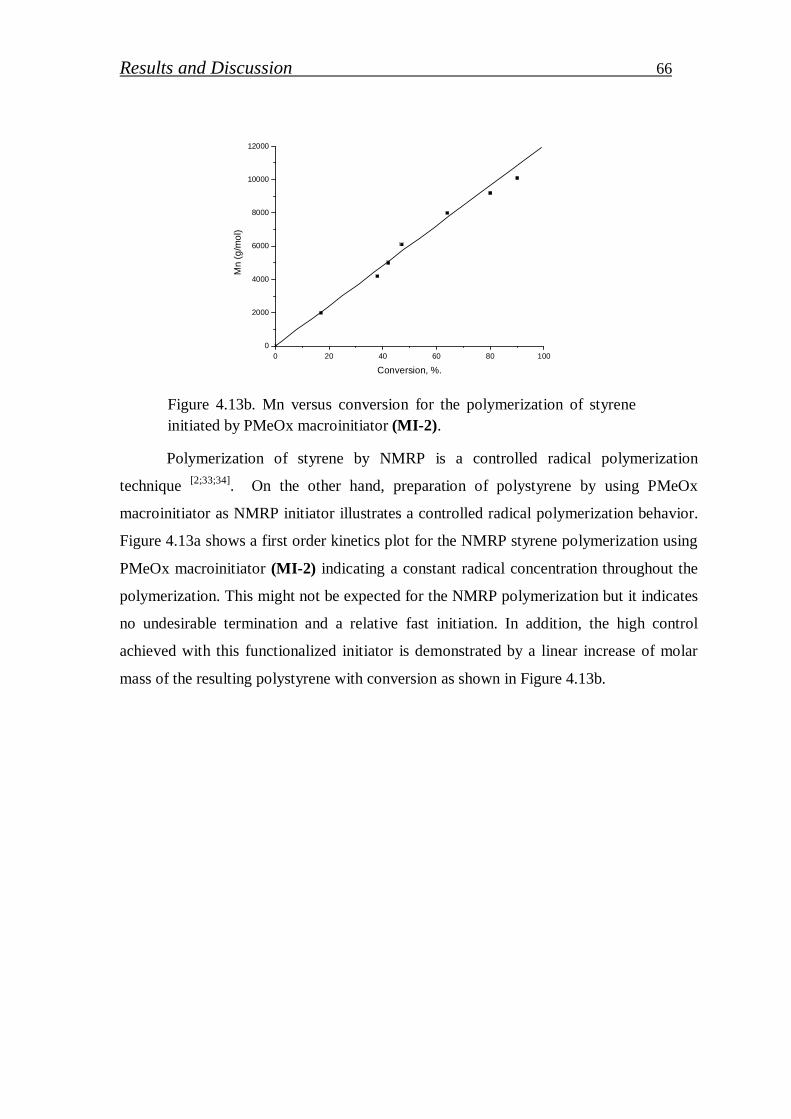
Results and Discussion 66
Polymerization of styrene by NMRP is a controlled radical polymerization
technique [2;33;34]. On the other hand, preparation of polystyrene by using PMeOx
macroinitiator as NMRP initiator illustrates a controlled radical polymerization behavior.
Figure 4.13a shows a first order kinetics plot for the NMRP styrene polymerization using
PMeOx macroinitiator (MI-2) indicating a constant radical concentration throughout the
polymerization. This might not be expected for the NMRP polymerization but it indicates
no undesirable termination and a relative fast initiation. In addition, the high control
achieved with this functionalized initiator is demonstrated by a linear increase of molar
mass of the resulting polystyrene with conversion as shown in Figure 4.13b.
0 20 40 60 80 1000
2000
4000
6000
8000
10000
12000
Mn
(g/m
ol)
Conversion, %.
Figure 4.13b. Mn versus conversion for the polymerization of styrene initiated by PMeOx macroinitiator (MI-2).
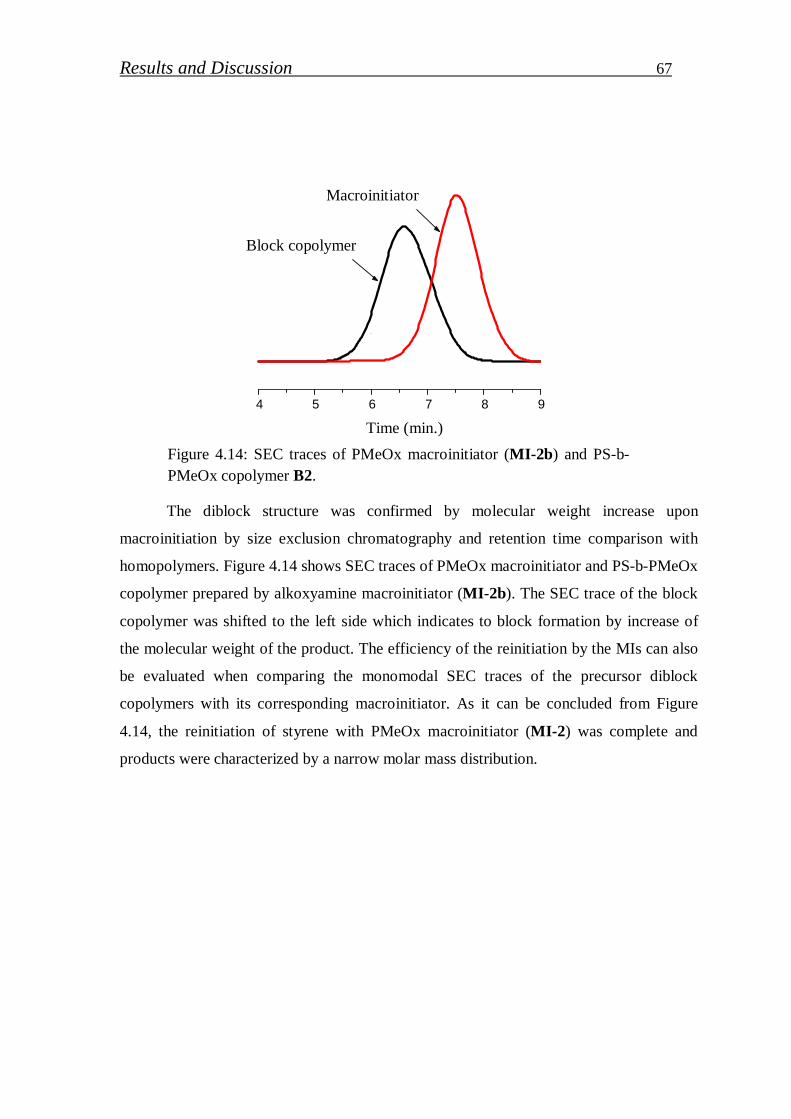
Results and Discussion 67
The diblock structure was confirmed by molecular weight increase upon
macroinitiation by size exclusion chromatography and retention time comparison with
homopolymers. Figure 4.14 shows SEC traces of PMeOx macroinitiator and PS-b-PMeOx
copolymer prepared by alkoxyamine macroinitiator (MI-2b). The SEC trace of the block
copolymer was shifted to the left side which indicates to block formation by increase of
the molecular weight of the product. The efficiency of the reinitiation by the MIs can also
be evaluated when comparing the monomodal SEC traces of the precursor diblock
copolymers with its corresponding macroinitiator. As it can be concluded from Figure
4.14, the reinitiation of styrene with PMeOx macroinitiator (MI-2) was complete and
products were characterized by a narrow molar mass distribution.
4 5 6 7 8 9
Time (min.)
Macroinitiator
Block copolymer
Figure 4.14: SEC traces of PMeOx macroinitiator (MI-2b) and PS-b-PMeOx copolymer B2.
Macroinitiator
Block copolymer
Time (min.)
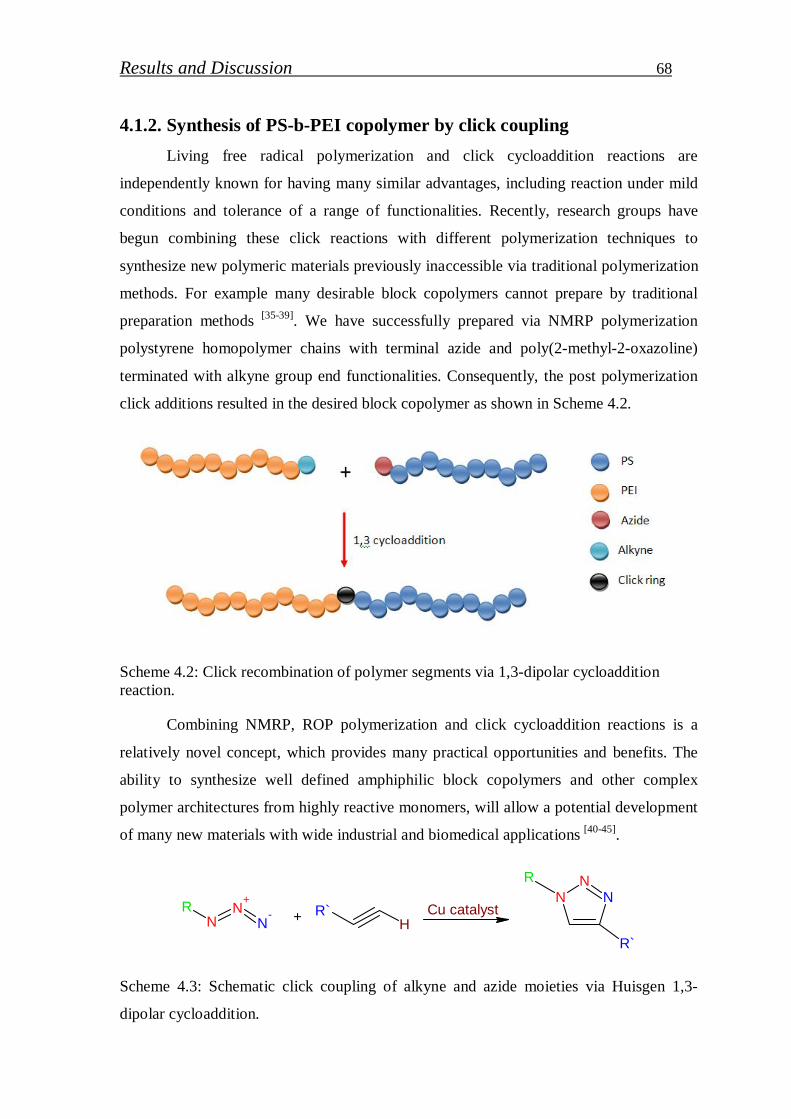
Results and Discussion 68
4.1.2. Synthesis of PS-b-PEI copolymer by click coupling Living free radical polymerization and click cycloaddition reactions are
independently known for having many similar advantages, including reaction under mild
conditions and tolerance of a range of functionalities. Recently, research groups have
begun combining these click reactions with different polymerization techniques to
synthesize new polymeric materials previously inaccessible via traditional polymerization
methods. For example many desirable block copolymers cannot prepare by traditional
preparation methods [35-39]. We have successfully prepared via NMRP polymerization
polystyrene homopolymer chains with terminal azide and poly(2-methyl-2-oxazoline)
terminated with alkyne group end functionalities. Consequently, the post polymerization
click additions resulted in the desired block copolymer as shown in Scheme 4.2.
Scheme 4.2: Click recombination of polymer segments via 1,3-dipolar cycloaddition reaction.
Combining NMRP, ROP polymerization and click cycloaddition reactions is a
relatively novel concept, which provides many practical opportunities and benefits. The
ability to synthesize well defined amphiphilic block copolymers and other complex
polymer architectures from highly reactive monomers, will allow a potential development
of many new materials with wide industrial and biomedical applications [40-45].
NN
N
R
R`
RN
N+
N- + H
R` Cu catalyst
Scheme 4.3: Schematic click coupling of alkyne and azide moieties via Huisgen 1,3-
dipolar cycloaddition.
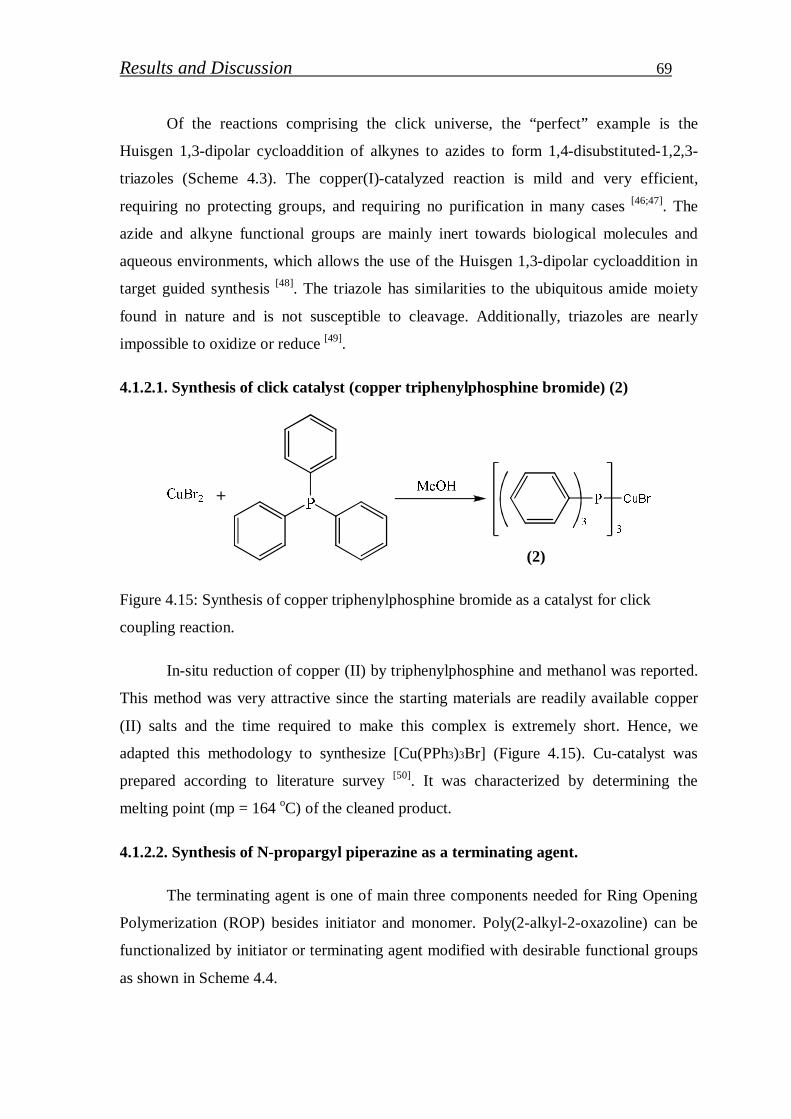
Results and Discussion 69
Of the reactions comprising the click universe, the “perfect” example is the
Huisgen 1,3-dipolar cycloaddition of alkynes to azides to form 1,4-disubstituted-1,2,3-
triazoles (Scheme 4.3). The copper(I)-catalyzed reaction is mild and very efficient,
requiring no protecting groups, and requiring no purification in many cases [46;47]. The
azide and alkyne functional groups are mainly inert towards biological molecules and
aqueous environments, which allows the use of the Huisgen 1,3-dipolar cycloaddition in
target guided synthesis [48]. The triazole has similarities to the ubiquitous amide moiety
found in nature and is not susceptible to cleavage. Additionally, triazoles are nearly
impossible to oxidize or reduce [49].
4.1.2.1. Synthesis of click catalyst (copper triphenylphosphine bromide) (2)
Figure 4.15: Synthesis of copper triphenylphosphine bromide as a catalyst for click
coupling reaction.
In-situ reduction of copper (II) by triphenylphosphine and methanol was reported.
This method was very attractive since the starting materials are readily available copper
(II) salts and the time required to make this complex is extremely short. Hence, we
adapted this methodology to synthesize [Cu(PPh3)3Br] (Figure 4.15). Cu-catalyst was
prepared according to literature survey [50]. It was characterized by determining the
melting point (mp = 164 oC) of the cleaned product.
4.1.2.2. Synthesis of N-propargyl piperazine as a terminating agent.
The terminating agent is one of main three components needed for Ring Opening
Polymerization (ROP) besides initiator and monomer. Poly(2-alkyl-2-oxazoline) can be
functionalized by initiator or terminating agent modified with desirable functional groups
as shown in Scheme 4.4.
(2)
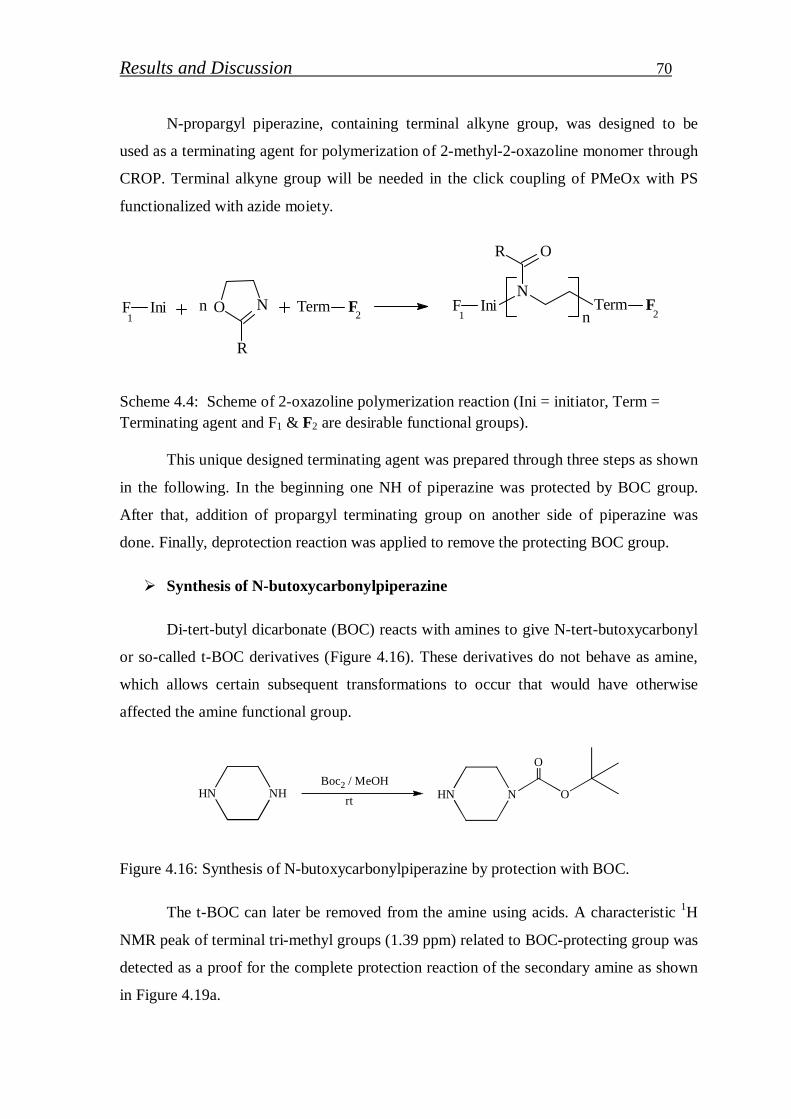
Results and Discussion 70
N-propargyl piperazine, containing terminal alkyne group, was designed to be
used as a terminating agent for polymerization of 2-methyl-2-oxazoline monomer through
CROP. Terminal alkyne group will be needed in the click coupling of PMeOx with PS
functionalized with azide moiety.
O N
R
nIniFN
OR
IniFn
Term FTerm F
Scheme 4.4: Scheme of 2-oxazoline polymerization reaction (Ini = initiator, Term = Terminating agent and F1 & F2 are desirable functional groups).
This unique designed terminating agent was prepared through three steps as shown
in the following. In the beginning one NH of piperazine was protected by BOC group.
After that, addition of propargyl terminating group on another side of piperazine was
done. Finally, deprotection reaction was applied to remove the protecting BOC group.
Synthesis of N-butoxycarbonylpiperazine
Di-tert-butyl dicarbonate (BOC) reacts with amines to give N-tert-butoxycarbonyl
or so-called t-BOC derivatives (Figure 4.16). These derivatives do not behave as amine,
which allows certain subsequent transformations to occur that would have otherwise
affected the amine functional group.
NHHNBoc2 / MeOH
rt NHN O
O
Figure 4.16: Synthesis of N-butoxycarbonylpiperazine by protection with BOC.
The t-BOC can later be removed from the amine using acids. A characteristic 1H
NMR peak of terminal tri-methyl groups (1.39 ppm) related to BOC-protecting group was
detected as a proof for the complete protection reaction of the secondary amine as shown
in Figure 4.19a.
1 1 2 2
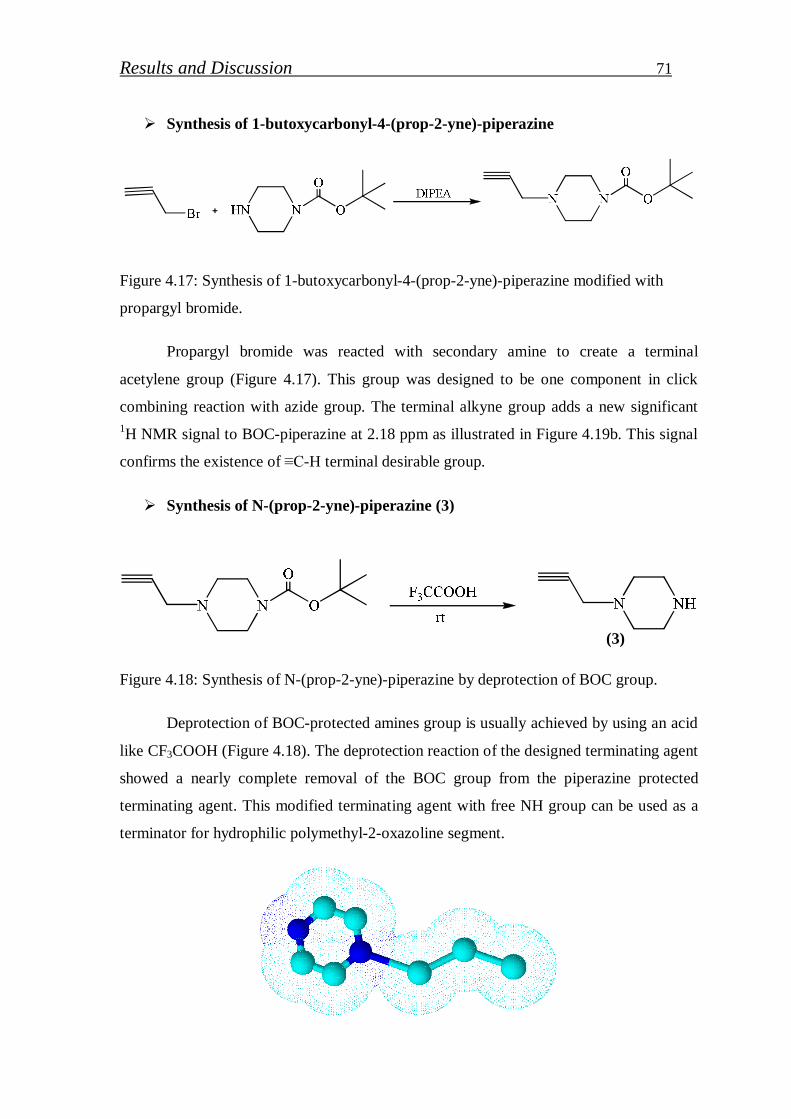
Results and Discussion 71
Synthesis of 1-butoxycarbonyl-4-(prop-2-yne)-piperazine
Figure 4.17: Synthesis of 1-butoxycarbonyl-4-(prop-2-yne)-piperazine modified with
propargyl bromide.
Propargyl bromide was reacted with secondary amine to create a terminal
acetylene group (Figure 4.17). This group was designed to be one component in click
combining reaction with azide group. The terminal alkyne group adds a new significant 1H NMR signal to BOC-piperazine at 2.18 ppm as illustrated in Figure 4.19b. This signal
confirms the existence of ≡C-H terminal desirable group.
Synthesis of N-(prop-2-yne)-piperazine (3)
Figure 4.18: Synthesis of N-(prop-2-yne)-piperazine by deprotection of BOC group.
Deprotection of BOC-protected amines group is usually achieved by using an acid
like CF3COOH (Figure 4.18). The deprotection reaction of the designed terminating agent
showed a nearly complete removal of the BOC group from the piperazine protected
terminating agent. This modified terminating agent with free NH group can be used as a
terminator for hydrophilic polymethyl-2-oxazoline segment.
(3)
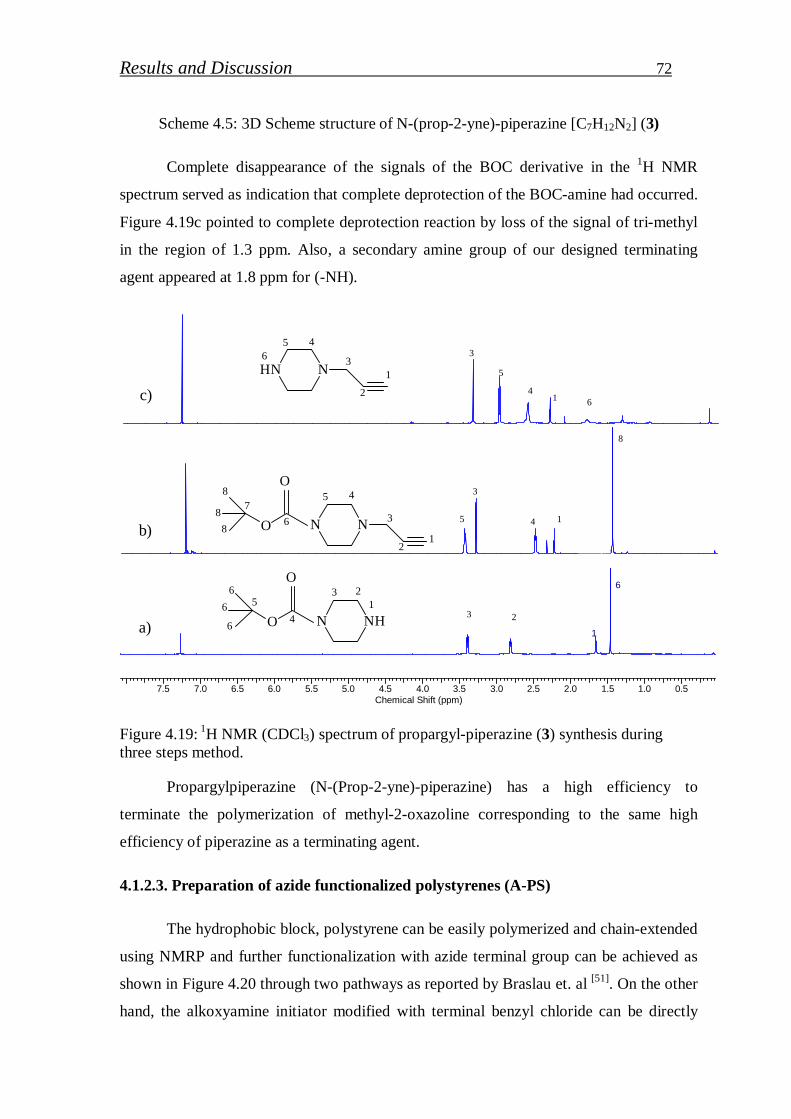
Results and Discussion 72
Scheme 4.5: 3D Scheme structure of N-(prop-2-yne)-piperazine [C7H12N2] (3)
Complete disappearance of the signals of the BOC derivative in the 1H NMR
spectrum served as indication that complete deprotection of the BOC-amine had occurred.
Figure 4.19c pointed to complete deprotection reaction by loss of the signal of tri-methyl
in the region of 1.3 ppm. Also, a secondary amine group of our designed terminating
agent appeared at 1.8 ppm for (-NH).
7.5 7.0 6.5 6.0 5.5 5.0 4.5 4.0 3.5 3.0 2.5 2.0 1.5 1.0 0.5Chemical Shift (ppm)
O
O NHN1
23
45
66
63 2
NNO
O
12
3
45
67
8
88
5
3
4 1
8
NN 1
2
3
45
H6 3
5
41 6
A)
B)
C)
1
6
Figure 4.19: 1H NMR (CDCl3) spectrum of propargyl-piperazine (3) synthesis during three steps method.
Propargylpiperazine (N-(Prop-2-yne)-piperazine) has a high efficiency to
terminate the polymerization of methyl-2-oxazoline corresponding to the same high
efficiency of piperazine as a terminating agent.
4.1.2.3. Preparation of azide functionalized polystyrenes (A-PS)
The hydrophobic block, polystyrene can be easily polymerized and chain-extended
using NMRP and further functionalization with azide terminal group can be achieved as
shown in Figure 4.20 through two pathways as reported by Braslau et. al [51]. On the other
hand, the alkoxyamine initiator modified with terminal benzyl chloride can be directly
a)
b)
c)
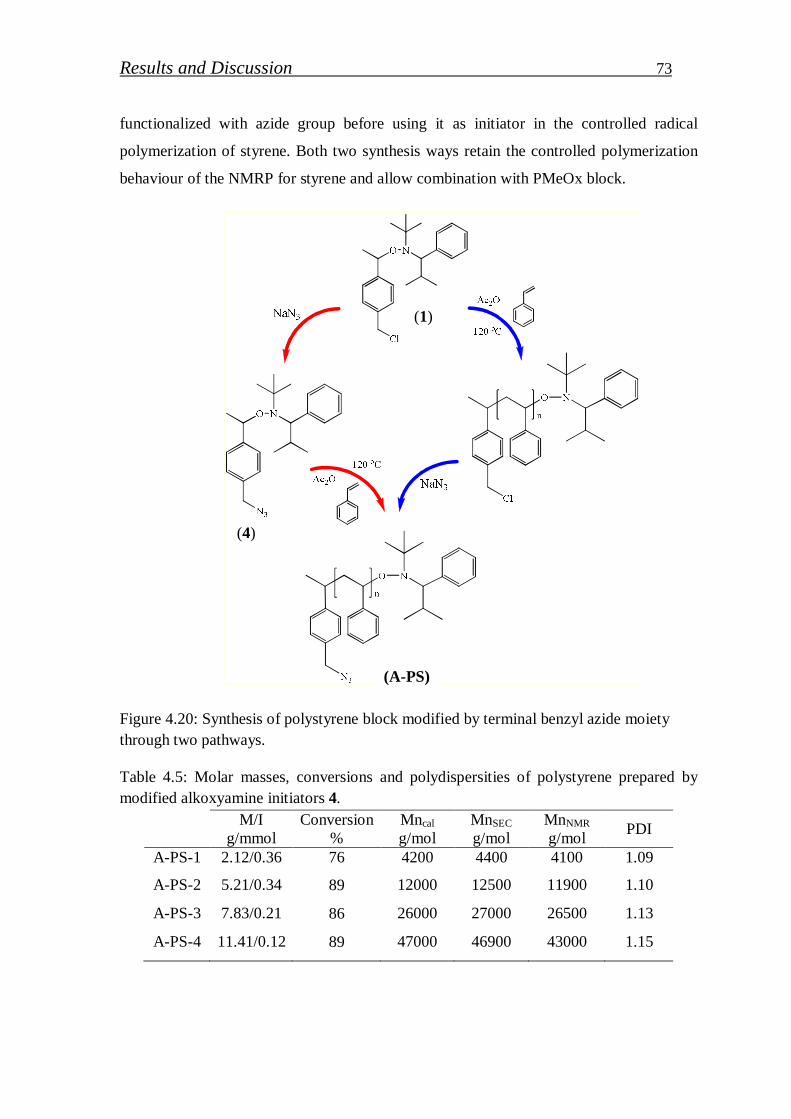
Results and Discussion 73
functionalized with azide group before using it as initiator in the controlled radical
polymerization of styrene. Both two synthesis ways retain the controlled polymerization
behaviour of the NMRP for styrene and allow combination with PMeOx block.
Figure 4.20: Synthesis of polystyrene block modified by terminal benzyl azide moiety through two pathways.
Table 4.5: Molar masses, conversions and polydispersities of polystyrene prepared by modified alkoxyamine initiators 4.
M/I g/mmol
Conversion %
Mncal g/mol
MnSEC g/mol
MnNMR g/mol PDI
A-PS-1 2.12/0.36 76 4200 4400 4100 1.09
A-PS-2 5.21/0.34 89 12000 12500 11900 1.10
A-PS-3 7.83/0.21 86 26000 27000 26500 1.13
A-PS-4 11.41/0.12 89 47000 46900 43000 1.15
(A-PS)
(4)
(1)
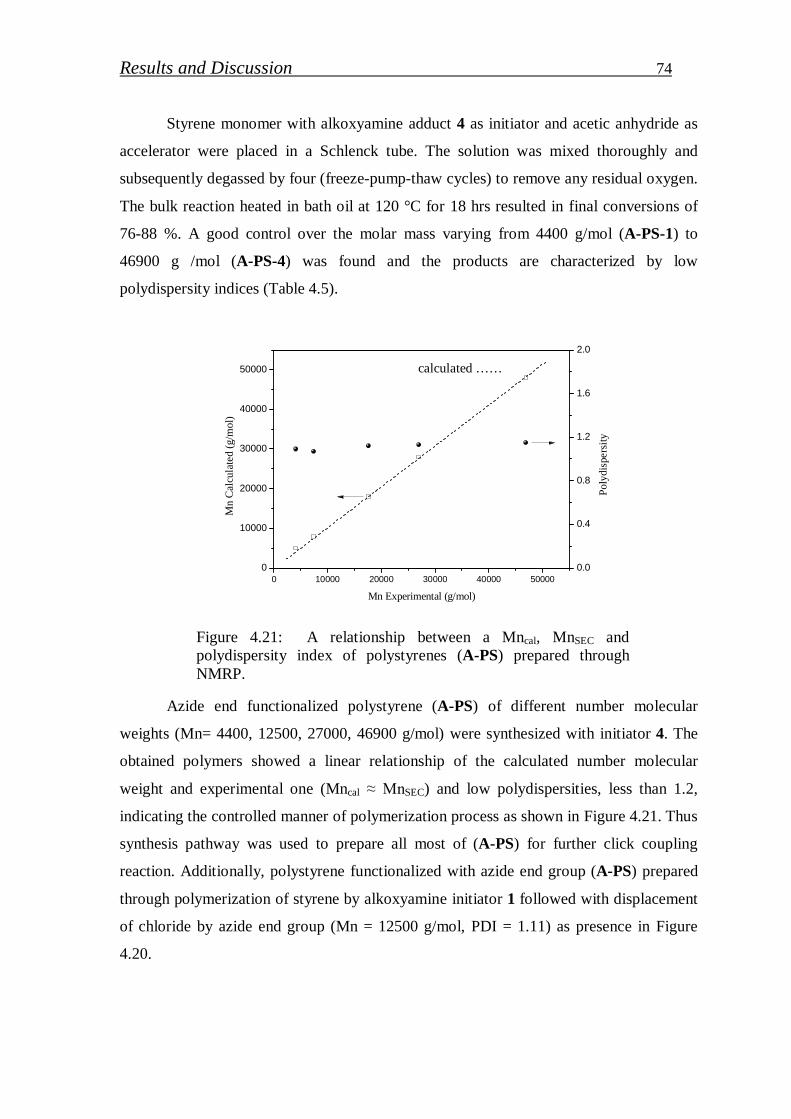
Results and Discussion 74
Styrene monomer with alkoxyamine adduct 4 as initiator and acetic anhydride as
accelerator were placed in a Schlenck tube. The solution was mixed thoroughly and
subsequently degassed by four (freeze-pump-thaw cycles) to remove any residual oxygen.
The bulk reaction heated in bath oil at 120 °C for 18 hrs resulted in final conversions of
76-88 %. A good control over the molar mass varying from 4400 g/mol (A-PS-1) to
46900 g /mol (A-PS-4) was found and the products are characterized by low
polydispersity indices (Table 4.5).
Azide end functionalized polystyrene (A-PS) of different number molecular
weights (Mn= 4400, 12500, 27000, 46900 g/mol) were synthesized with initiator 4. The
obtained polymers showed a linear relationship of the calculated number molecular
weight and experimental one (Mncal ≈ MnSEC) and low polydispersities, less than 1.2,
indicating the controlled manner of polymerization process as shown in Figure 4.21. Thus
synthesis pathway was used to prepare all most of (A-PS) for further click coupling
reaction. Additionally, polystyrene functionalized with azide end group (A-PS) prepared
through polymerization of styrene by alkoxyamine initiator 1 followed with displacement
of chloride by azide end group (Mn = 12500 g/mol, PDI = 1.11) as presence in Figure
4.20.
0 10000 20000 30000 40000 500000
10000
20000
30000
40000
50000
Mn Experimental (g/mol)
Mn
Cal
cula
ted
(g/m
ol)
0.0
0.4
0.8
1.2
1.6
2.0
Pol
ydis
pers
ity
Figure 4.21: A relationship between a Mncal, MnSEC and polydispersity index of polystyrenes (A-PS) prepared through NMRP.
calculated ……
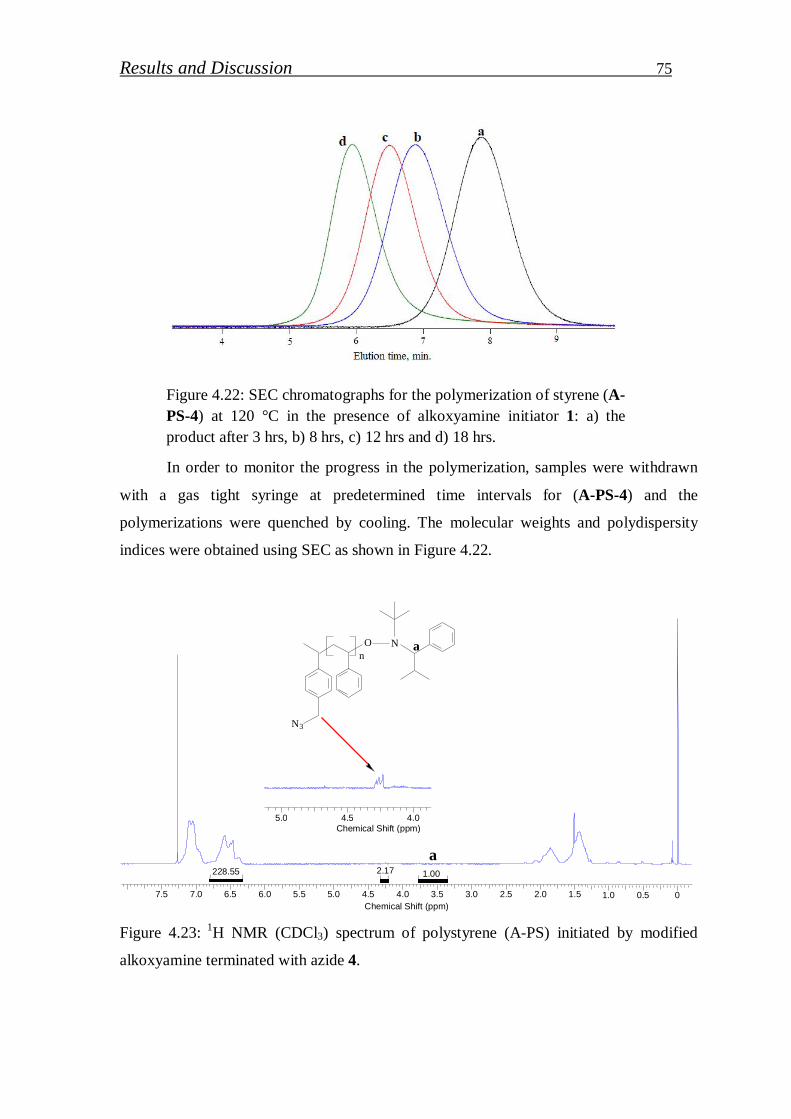
Results and Discussion 75
In order to monitor the progress in the polymerization, samples were withdrawn
with a gas tight syringe at predetermined time intervals for (A-PS-4) and the
polymerizations were quenched by cooling. The molecular weights and polydispersity
indices were obtained using SEC as shown in Figure 4.22.
1.0 0.5 0Chemical Shift (ppm)
nO N
N3
5.0 4.5 4.0 3.5Chemical Shift (ppm)
7.5 7.0 6.5 6.0 5.5 5.0 4.5 4.0 3.5 3.0 2.5 2.0 1.5
2.17 228.55 1.00
Figure 4.23: 1H NMR (CDCl3) spectrum of polystyrene (A-PS) initiated by modified
alkoxyamine terminated with azide 4.
Figure 4.22: SEC chromatographs for the polymerization of styrene (A-PS-4) at 120 °C in the presence of alkoxyamine initiator 1: a) the product after 3 hrs, b) 8 hrs, c) 12 hrs and d) 18 hrs.
a
a
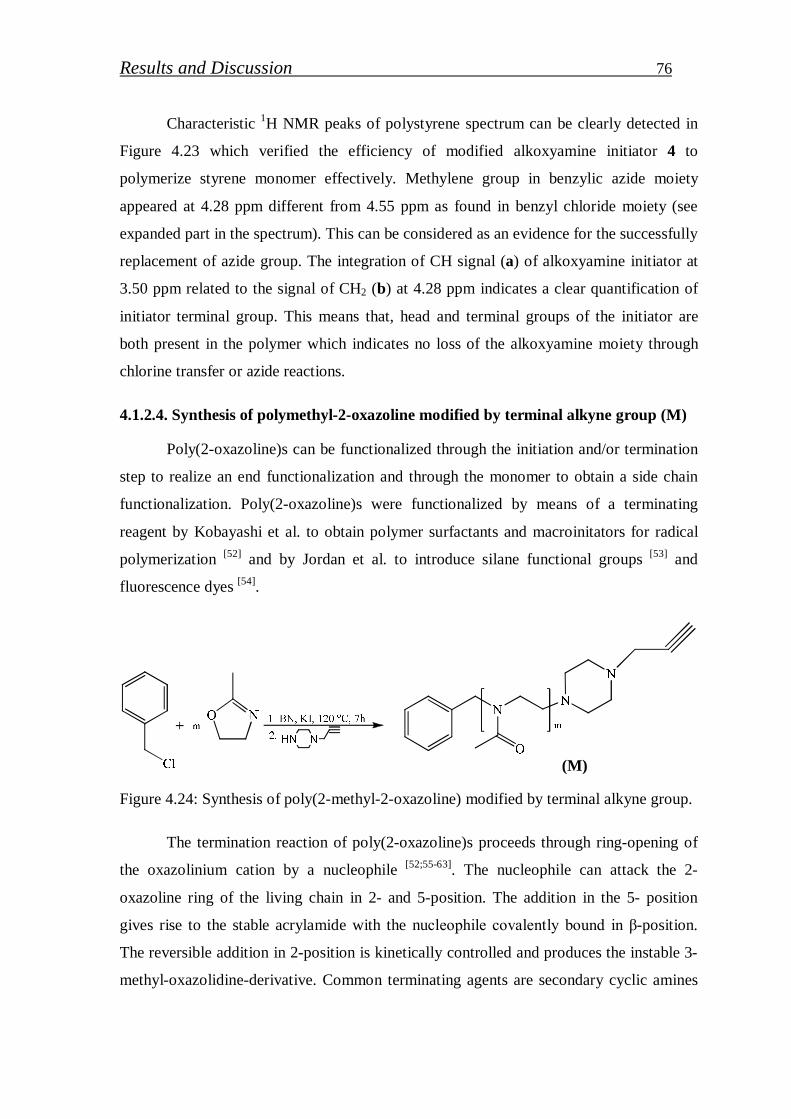
Results and Discussion 76
Characteristic 1H NMR peaks of polystyrene spectrum can be clearly detected in
Figure 4.23 which verified the efficiency of modified alkoxyamine initiator 4 to
polymerize styrene monomer effectively. Methylene group in benzylic azide moiety
appeared at 4.28 ppm different from 4.55 ppm as found in benzyl chloride moiety (see
expanded part in the spectrum). This can be considered as an evidence for the successfully
replacement of azide group. The integration of CH signal (a) of alkoxyamine initiator at
3.50 ppm related to the signal of CH2 (b) at 4.28 ppm indicates a clear quantification of
initiator terminal group. This means that, head and terminal groups of the initiator are
both present in the polymer which indicates no loss of the alkoxyamine moiety through
chlorine transfer or azide reactions.
4.1.2.4. Synthesis of polymethyl-2-oxazoline modified by terminal alkyne group (M)
Poly(2-oxazoline)s can be functionalized through the initiation and/or termination
step to realize an end functionalization and through the monomer to obtain a side chain
functionalization. Poly(2-oxazoline)s were functionalized by means of a terminating
reagent by Kobayashi et al. to obtain polymer surfactants and macroinitators for radical
polymerization [52] and by Jordan et al. to introduce silane functional groups [53] and
fluorescence dyes [54].
Figure 4.24: Synthesis of poly(2-methyl-2-oxazoline) modified by terminal alkyne group.
The termination reaction of poly(2-oxazoline)s proceeds through ring-opening of
the oxazolinium cation by a nucleophile [52;55-63]. The nucleophile can attack the 2-
oxazoline ring of the living chain in 2- and 5-position. The addition in the 5- position
gives rise to the stable acrylamide with the nucleophile covalently bound in β-position.
The reversible addition in 2-position is kinetically controlled and produces the instable 3-
methyl-oxazolidine-derivative. Common terminating agents are secondary cyclic amines
(M)
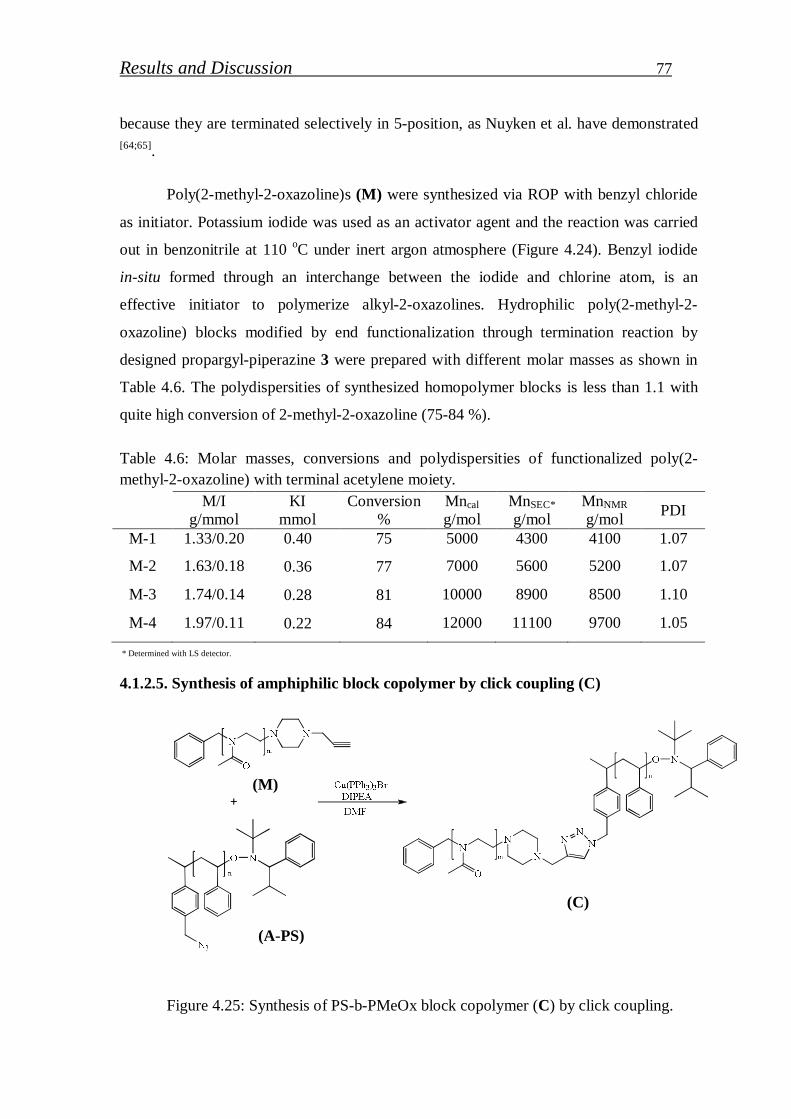
Results and Discussion 77
because they are terminated selectively in 5-position, as Nuyken et al. have demonstrated [64;65].
Poly(2-methyl-2-oxazoline)s (M) were synthesized via ROP with benzyl chloride
as initiator. Potassium iodide was used as an activator agent and the reaction was carried
out in benzonitrile at 110 oC under inert argon atmosphere (Figure 4.24). Benzyl iodide
in-situ formed through an interchange between the iodide and chlorine atom, is an
effective initiator to polymerize alkyl-2-oxazolines. Hydrophilic poly(2-methyl-2-
oxazoline) blocks modified by end functionalization through termination reaction by
designed propargyl-piperazine 3 were prepared with different molar masses as shown in
Table 4.6. The polydispersities of synthesized homopolymer blocks is less than 1.1 with
quite high conversion of 2-methyl-2-oxazoline (75-84 %).
Table 4.6: Molar masses, conversions and polydispersities of functionalized poly(2-methyl-2-oxazoline) with terminal acetylene moiety.
M/I g/mmol
KI mmol
Conversion %
Mncal g/mol
MnSEC* g/mol
MnNMR g/mol PDI
M-1 1.33/0.20 0.40 75 5000 4300 4100 1.07
M-2 1.63/0.18 0.36 77 7000 5600 5200 1.07
M-3 1.74/0.14 0.28 81 10000 8900 8500 1.10
M-4 1.97/0.11 0.22 84 12000 11100 9700 1.05
* Determined with LS detector.
4.1.2.5. Synthesis of amphiphilic block copolymer by click coupling (C)
Figure 4.25: Synthesis of PS-b-PMeOx block copolymer (C) by click coupling.
(C)
(A-PS)
(M)
Results and Discussion 78
A significant advantage of Huisgen cycloadditions is undoubtedly their very high
degree of selectivity. For instance, the copper-catalyzed reaction of organic azides with
terminal alkynes is tolerant to a wide variety of chemical functions [66]. This particular
feature makes these reactions particularly attractive for modifying highly functional
macromolecules.
Polystyrene segment terminated with azide moiety was combined with poly(2-
methyl-2-oxazoline) terminated with alkyne group via click reaction (Figure 4.25). An
excess amount of azide segment more than stichiometric ratio to alkyne segment was used
in the presence of diisopropylethylamine (DIPEA). The reaction was conducted at room
temperature by stirring overnight in dimethylformamide (DMF).The product (C) was
precipitated two times and dried under vacuum overnight. After that 1H NMR
spectroscopy shows a complete disappearance of benzylic azide moiety. The
characteristic 1H NMR peaks of PS spectrum at 1.25-1.9 ppm and 6.35-7.20 ppm can be
detected in the spectrum of the block copolymer (Figure 4.26). In addition, a specific peak
related to methyl group in PMeOx spectrum appeared at 2.05-2.20 ppm, where the
resonances assigned to methylene group peak in the backbone of the hydrophilic segment
spectrum can be shown at 3.35-3.55 ppm.
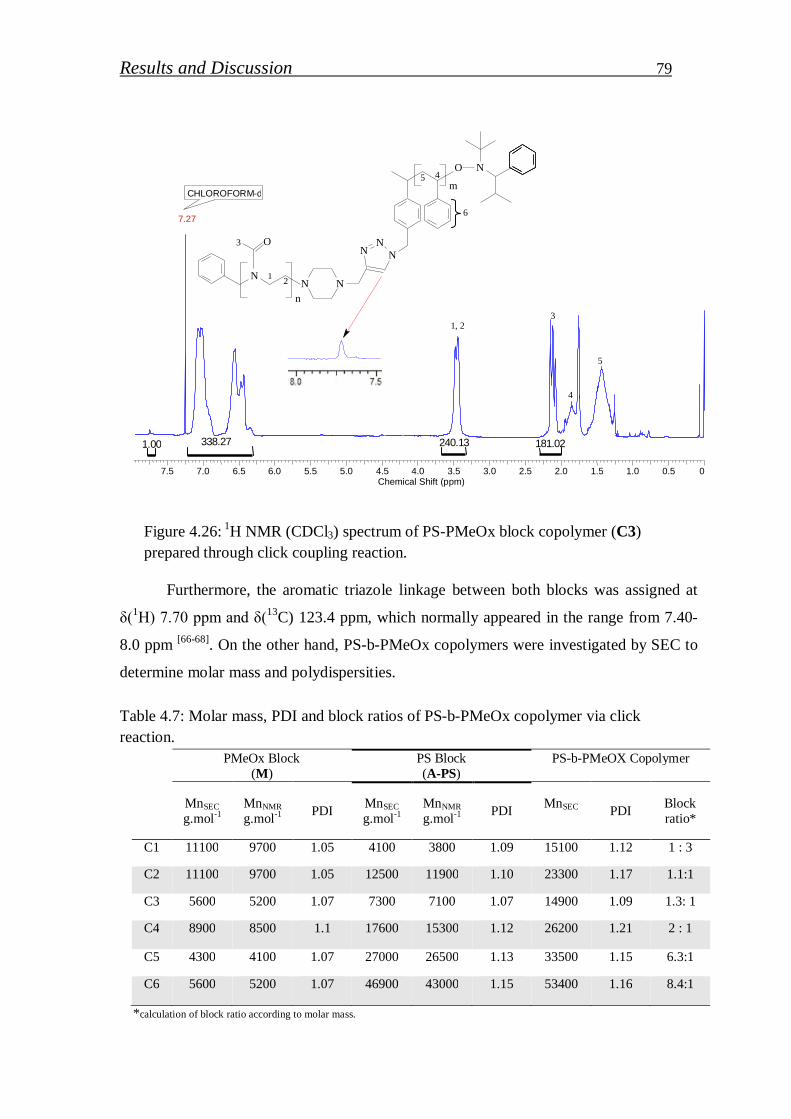
Results and Discussion 79
7.5 7.0 6.5 6.0 5.5 5.0 4.5 4.0 3.5 3.0 2.5 2.0 1.5 1.0 0.5 0
Chemical Shift (ppm)
O
N N
N
N N
N
N
O
m
n
CHLOROFORM-d 7.27
240.13 181.02 338.27 1.00
Figure 4.26: 1H NMR (CDCl3) spectrum of PS-PMeOx block copolymer (C3) prepared through click coupling reaction.
Furthermore, the aromatic triazole linkage between both blocks was assigned at
δ(1H) 7.70 ppm and δ(13C) 123.4 ppm, which normally appeared in the range from 7.40-
8.0 ppm [66-68]. On the other hand, PS-b-PMeOx copolymers were investigated by SEC to
determine molar mass and polydispersities.
Table 4.7: Molar mass, PDI and block ratios of PS-b-PMeOx copolymer via click reaction.
PMeOx Block (M)
PS Block (A-PS)
PS-b-PMeOX Copolymer
MnSEC g.mol-1
MnNMR g.mol-1 PDI MnSEC
g.mol-1 MnNMR g.mol-1 PDI MnSEC
PDI Block ratio*
C1 11100 9700 1.05 4100 3800 1.09 15100 1.12 1 : 3
C2 11100 9700 1.05 12500 11900 1.10 23300 1.17 1.1:1
C3 5600 5200 1.07 7300 7100 1.07 14900 1.09 1.3: 1
C4 8900 8500 1.1 17600 15300 1.12 26200 1.21 2 : 1
C5 4300 4100 1.07 27000 26500 1.13 33500 1.15 6.3:1
C6 5600 5200 1.07 46900 43000 1.15 53400 1.16 8.4:1
*calculation of block ratio according to molar mass.
1 2
3
4 5
6
1, 2 3
4
5
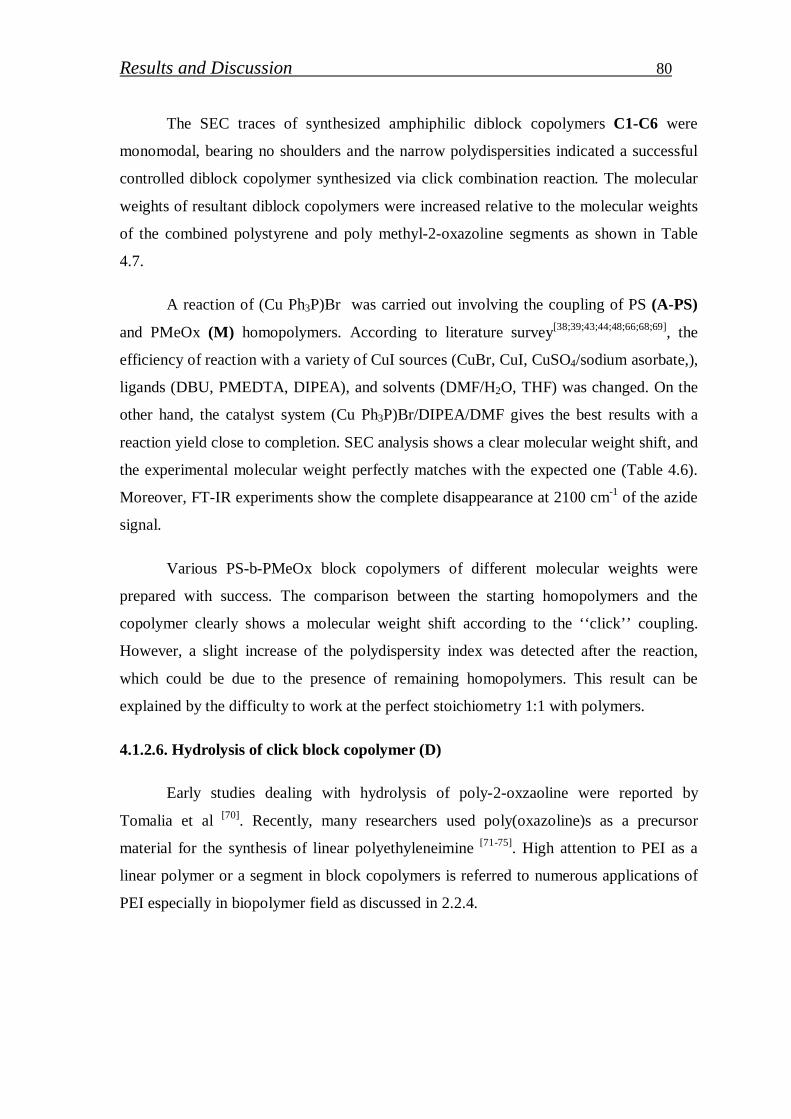
Results and Discussion 80
The SEC traces of synthesized amphiphilic diblock copolymers C1-C6 were
monomodal, bearing no shoulders and the narrow polydispersities indicated a successful
controlled diblock copolymer synthesized via click combination reaction. The molecular
weights of resultant diblock copolymers were increased relative to the molecular weights
of the combined polystyrene and poly methyl-2-oxazoline segments as shown in Table
4.7.
A reaction of (Cu Ph3P)Br was carried out involving the coupling of PS (A-PS)
and PMeOx (M) homopolymers. According to literature survey[38;39;43;44;48;66;68;69], the
efficiency of reaction with a variety of CuI sources (CuBr, CuI, CuSO4/sodium asorbate,),
ligands (DBU, PMEDTA, DIPEA), and solvents (DMF/H2O, THF) was changed. On the
other hand, the catalyst system (Cu Ph3P)Br/DIPEA/DMF gives the best results with a
reaction yield close to completion. SEC analysis shows a clear molecular weight shift, and
the experimental molecular weight perfectly matches with the expected one (Table 4.6).
Moreover, FT-IR experiments show the complete disappearance at 2100 cm-1 of the azide
signal.
Various PS-b-PMeOx block copolymers of different molecular weights were
prepared with success. The comparison between the starting homopolymers and the
copolymer clearly shows a molecular weight shift according to the ‘‘click’’ coupling.
However, a slight increase of the polydispersity index was detected after the reaction,
which could be due to the presence of remaining homopolymers. This result can be
explained by the difficulty to work at the perfect stoichiometry 1:1 with polymers.
4.1.2.6. Hydrolysis of click block copolymer (D)
Early studies dealing with hydrolysis of poly-2-oxzaoline were reported by
Tomalia et al [70]. Recently, many researchers used poly(oxazoline)s as a precursor
material for the synthesis of linear polyethyleneimine [71-75]. High attention to PEI as a
linear polymer or a segment in block copolymers is referred to numerous applications of
PEI especially in biopolymer field as discussed in 2.2.4.
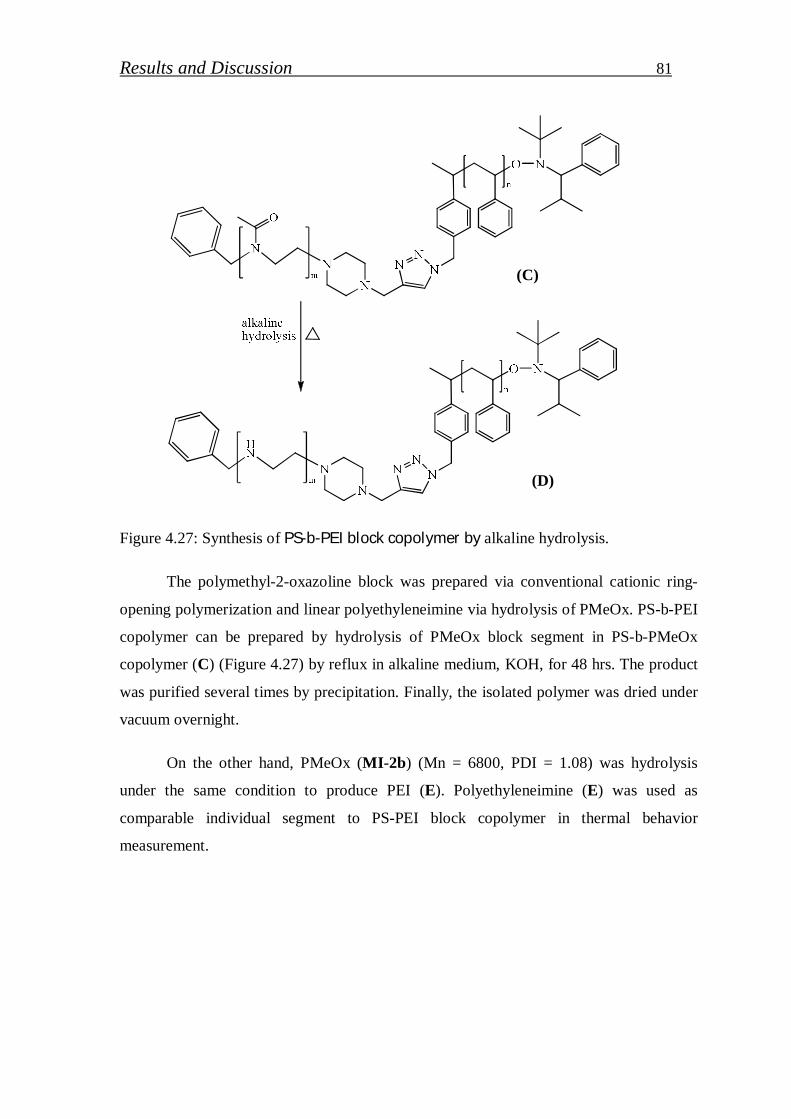
Results and Discussion 81
Figure 4.27: Synthesis of PS-b-PEI block copolymer by alkaline hydrolysis.
The polymethyl-2-oxazoline block was prepared via conventional cationic ring-
opening polymerization and linear polyethyleneimine via hydrolysis of PMeOx. PS-b-PEI
copolymer can be prepared by hydrolysis of PMeOx block segment in PS-b-PMeOx
copolymer (C) (Figure 4.27) by reflux in alkaline medium, KOH, for 48 hrs. The product
was purified several times by precipitation. Finally, the isolated polymer was dried under
vacuum overnight.
On the other hand, PMeOx (MI-2b) (Mn = 6800, PDI = 1.08) was hydrolysis
under the same condition to produce PEI (E). Polyethyleneimine (E) was used as
comparable individual segment to PS-PEI block copolymer in thermal behavior
measurement.
(D)
(C)
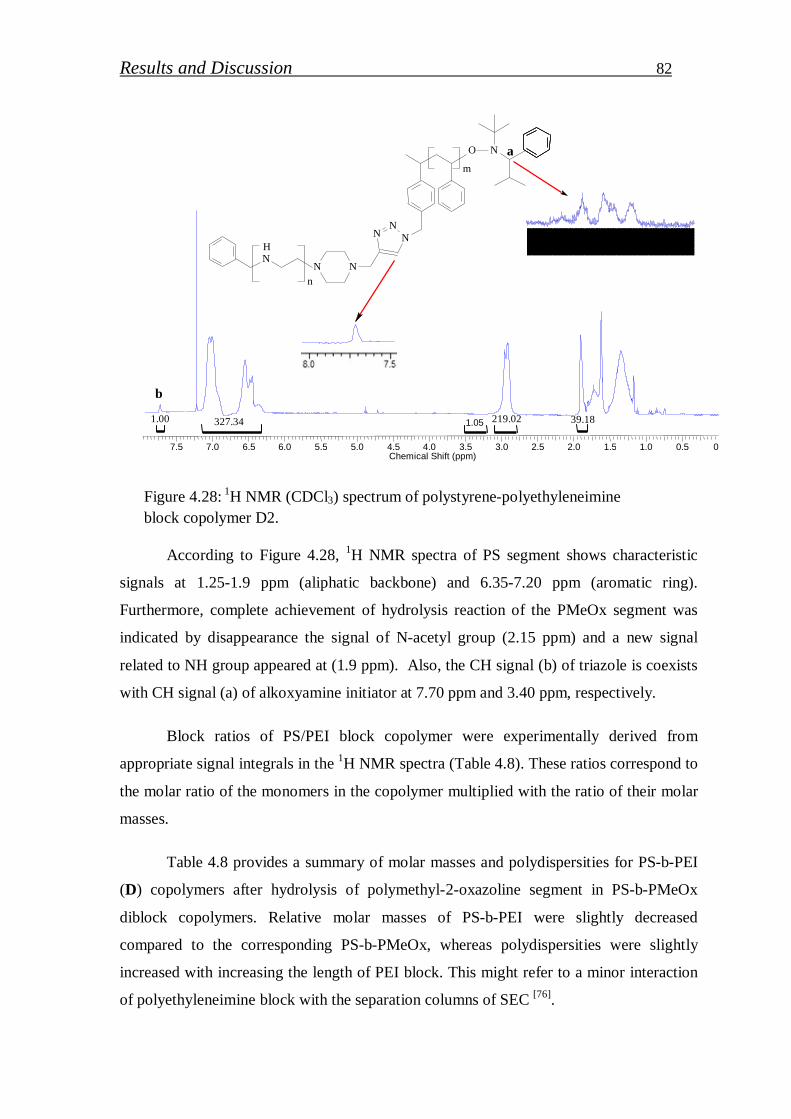
Results and Discussion 82
Figure 4.28: 1H NMR (CDCl3) spectrum of polystyrene-polyethyleneimine block copolymer D2.
According to Figure 4.28, 1H NMR spectra of PS segment shows characteristic
signals at 1.25-1.9 ppm (aliphatic backbone) and 6.35-7.20 ppm (aromatic ring).
Furthermore, complete achievement of hydrolysis reaction of the PMeOx segment was
indicated by disappearance the signal of N-acetyl group (2.15 ppm) and a new signal
related to NH group appeared at (1.9 ppm). Also, the CH signal (b) of triazole is coexists
with CH signal (a) of alkoxyamine initiator at 7.70 ppm and 3.40 ppm, respectively.
Block ratios of PS/PEI block copolymer were experimentally derived from
appropriate signal integrals in the 1H NMR spectra (Table 4.8). These ratios correspond to
the molar ratio of the monomers in the copolymer multiplied with the ratio of their molar
masses.
Table 4.8 provides a summary of molar masses and polydispersities for PS-b-PEI
(D) copolymers after hydrolysis of polymethyl-2-oxazoline segment in PS-b-PMeOx
diblock copolymers. Relative molar masses of PS-b-PEI were slightly decreased
compared to the corresponding PS-b-PMeOx, whereas polydispersities were slightly
increased with increasing the length of PEI block. This might refer to a minor interaction
of polyethyleneimine block with the separation columns of SEC [76].
O
NN
N
NN
N
NH
m
n
39.18 327.34 1.00 219.02
7.5 7.0 6.5 6.0 5.5 5.0 4.5 4.0 3.5 3.0 2.5 2.0 1.5 1.0 0.5 0 Chemical Shift (ppm)
1.05
3.203.50 3.40 3.30Chemical Shift (ppm)
a
b
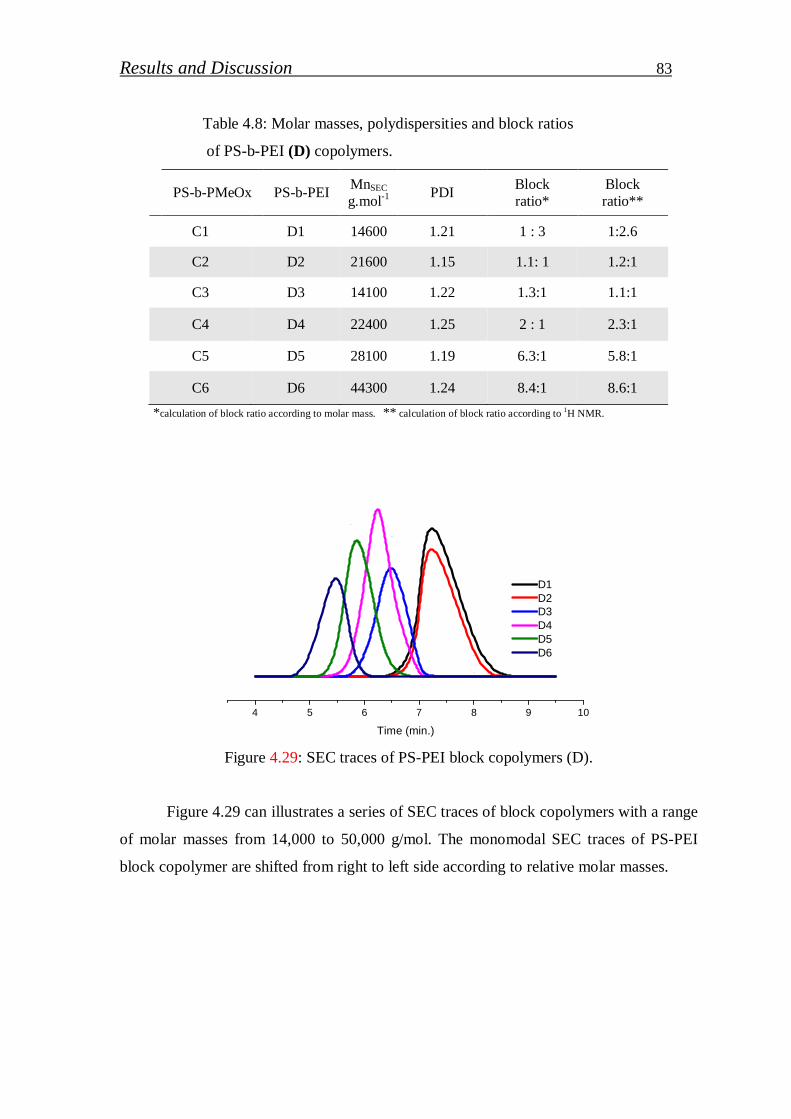
Results and Discussion 83
Table 4.8: Molar masses, polydispersities and block ratios
of PS-b-PEI (D) copolymers.
PS-b-PMeOx PS-b-PEI MnSEC g.mol-1 PDI Block
ratio* Block ratio**
C1 D1 14600 1.21 1 : 3 1:2.6
C2 D2 21600 1.15 1.1: 1 1.2:1
C3 D3 14100 1.22 1.3:1 1.1:1
C4 D4 22400 1.25 2 : 1 2.3:1
C5 D5 28100 1.19 6.3:1 5.8:1
C6 D6 44300 1.24 8.4:1 8.6:1 *calculation of block ratio according to molar mass. ** calculation of block ratio according to 1H NMR.
Figure 4.29 can illustrates a series of SEC traces of block copolymers with a range
of molar masses from 14,000 to 50,000 g/mol. The monomodal SEC traces of PS-PEI
block copolymer are shifted from right to left side according to relative molar masses.
4 5 6 7 8 9 10
Time (min.)
D1D2D3D4D5D6
Figure 4.29: SEC traces of PS-PEI block copolymers (D).
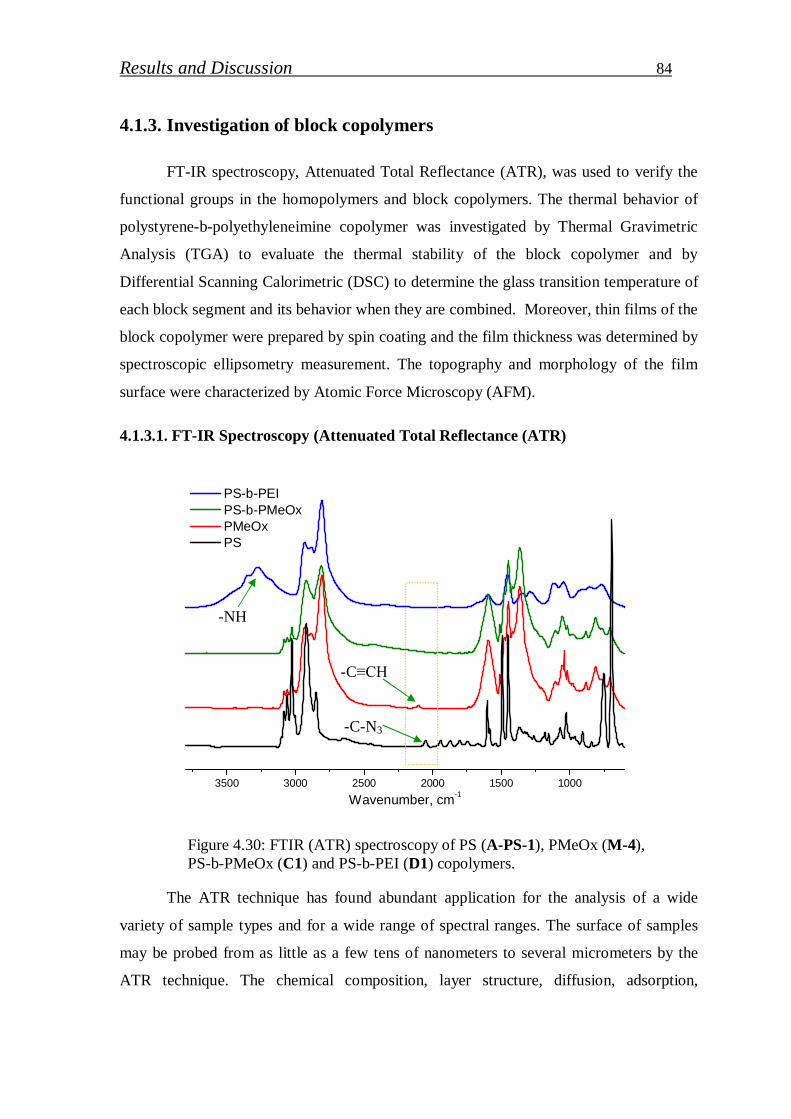
Results and Discussion 84
4.1.3. Investigation of block copolymers
FT-IR spectroscopy, Attenuated Total Reflectance (ATR), was used to verify the
functional groups in the homopolymers and block copolymers. The thermal behavior of
polystyrene-b-polyethyleneimine copolymer was investigated by Thermal Gravimetric
Analysis (TGA) to evaluate the thermal stability of the block copolymer and by
Differential Scanning Calorimetric (DSC) to determine the glass transition temperature of
each block segment and its behavior when they are combined. Moreover, thin films of the
block copolymer were prepared by spin coating and the film thickness was determined by
spectroscopic ellipsometry measurement. The topography and morphology of the film
surface were characterized by Atomic Force Microscopy (AFM).
4.1.3.1. FT-IR Spectroscopy (Attenuated Total Reflectance (ATR)
3500 3000 2500 2000 1500 1000
PS-b-PEI PS-b-PMeOx PMeOx PS
Wavenumber, cm-1
Figure 4.30: FTIR (ATR) spectroscopy of PS (A-PS-1), PMeOx (M-4), PS-b-PMeOx (C1) and PS-b-PEI (D1) copolymers.
The ATR technique has found abundant application for the analysis of a wide
variety of sample types and for a wide range of spectral ranges. The surface of samples
may be probed from as little as a few tens of nanometers to several micrometers by the
ATR technique. The chemical composition, layer structure, diffusion, adsorption,
-C-N3
-C≡CH
-NH
Results and Discussion 85
chemical reaction monitoring, orientation and physical state of surfaces are a few of the
types of qualitative and quantitative analyses that can be performed by ATR [77;78].
Further confirmation of the ‘‘click’’ coupling can be taken from FT-IR
spectroscopy. In Figure 4.30, the IR spectra of PS and PMeOx homopolymers are
compared to the spectrums after the click reaction. The strong signals at 2145 cm-1
assigned to the azide group and at 2095 cm-1 assigned to alkyne group disappeared
completely in the copolymer, proving the efficiency of the ‘‘click’’ reaction.
In details, the PS block end functionalized with azide moiety (A-PS-1) spectrum,
the absorption bands at 2978 and 2851 cm–1 are the asymmetric and symmetric stretching
vibrations of CH2 (aliph.), respectively. The CH (aromatic) out of plane bending vibration
appeared at 695 cm−1 and 759 cm−1 where the stretching band was clearly detected at 3150
cm−1. At 2095 cm–1 the stretching vibration of N3 groups. The band at 1475 cm–1 and 1525
cm–1 may result from stretching vibration of C=C of the benzene ring. Overtone or
combination weak bands appear between 2000 cm–1 and 1680 cm–1 can also be related to
C=C groups vibration.
The FT-IR spectrum of PMeOx which end functionalized (M-4) shows bands at
2952 and 2862 cm−1 that can be attributed to asymmetric and symmetric vibrations of the
CH2 group, respectively, and the band at 1453 cm−1 corresponds to in-plane bending of
CH2 [79]. The peaks for the bending vibration and stretching vibration of the (CH aromatic
group) can be observed at 3115 cm−1 and 1585 cm−1, respectively. The stretching
vibration of the C-N groups of PMeOx can be seen at and 1122 cm−1 [80]. A characteristic
band of the C≡C group related to propargyl terminal group can be detected at 2145 cm−1
where the corresponding ≡CH group shows a weak band at 3310 cm−1. The stretching
vibration of the C=O groups of PMeOx can be seen at 1639 cm−1.
The main observation in the PS-b-PMeOx spectrum is the disappearance of a weak
bands corresponding to alkyl and azide group at 2145 cm–1 and 2095 cm–1, respectively.
In addition, the characteristic peak of ≡CH group which was detected at 3310 cm−1 also
disappeared. The stretching vibration peaks of CH2 group in PS and PMeOx are
overlapped at 2950 cm−1 and 2865 cm−1 whereas the CH (Aromatic) in polystyrene are
still observed at 3150 cm−1. A characteristic peak at 1475 cm–1 and 1525 cm–1 of C=C in
PS are combined together in a double peak.
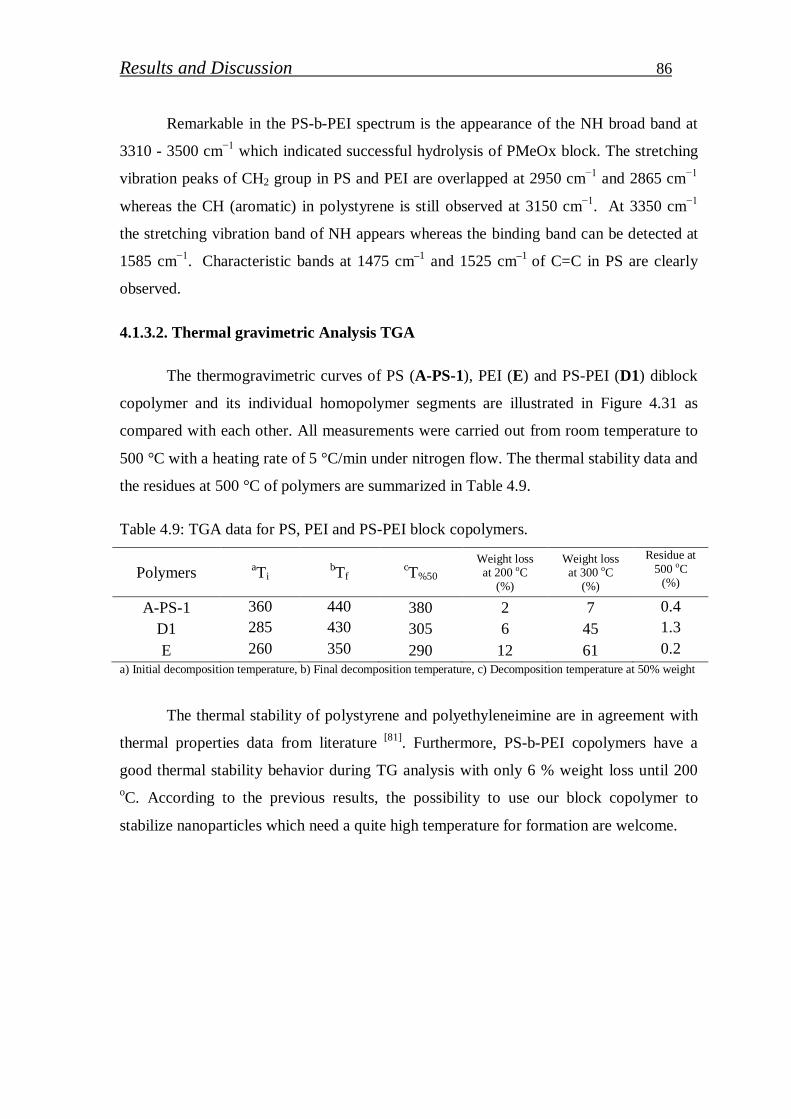
Results and Discussion 86
Remarkable in the PS-b-PEI spectrum is the appearance of the NH broad band at
3310 - 3500 cm−1 which indicated successful hydrolysis of PMeOx block. The stretching
vibration peaks of CH2 group in PS and PEI are overlapped at 2950 cm−1 and 2865 cm−1
whereas the CH (aromatic) in polystyrene is still observed at 3150 cm−1. At 3350 cm−1
the stretching vibration band of NH appears whereas the binding band can be detected at
1585 cm−1. Characteristic bands at 1475 cm–1 and 1525 cm–1 of C=C in PS are clearly
observed.
4.1.3.2. Thermal gravimetric Analysis TGA
The thermogravimetric curves of PS (A-PS-1), PEI (E) and PS-PEI (D1) diblock
copolymer and its individual homopolymer segments are illustrated in Figure 4.31 as
compared with each other. All measurements were carried out from room temperature to
500 °C with a heating rate of 5 °C/min under nitrogen flow. The thermal stability data and
the residues at 500 °C of polymers are summarized in Table 4.9.
Table 4.9: TGA data for PS, PEI and PS-PEI block copolymers.
Polymers aTi bTf cT%50 Weight loss
at 200 oC (%)
Weight loss at 300 oC
(%)
Residue at 500 oC
(%)
A-PS-1 360 440 380 2 7 0.4 D1 285 430 305 6 45 1.3 E 260 350 290 12 61 0.2
a) Initial decomposition temperature, b) Final decomposition temperature, c) Decomposition temperature at 50% weight
The thermal stability of polystyrene and polyethyleneimine are in agreement with
thermal properties data from literature [81]. Furthermore, PS-b-PEI copolymers have a
good thermal stability behavior during TG analysis with only 6 % weight loss until 200 oC. According to the previous results, the possibility to use our block copolymer to
stabilize nanoparticles which need a quite high temperature for formation are welcome.
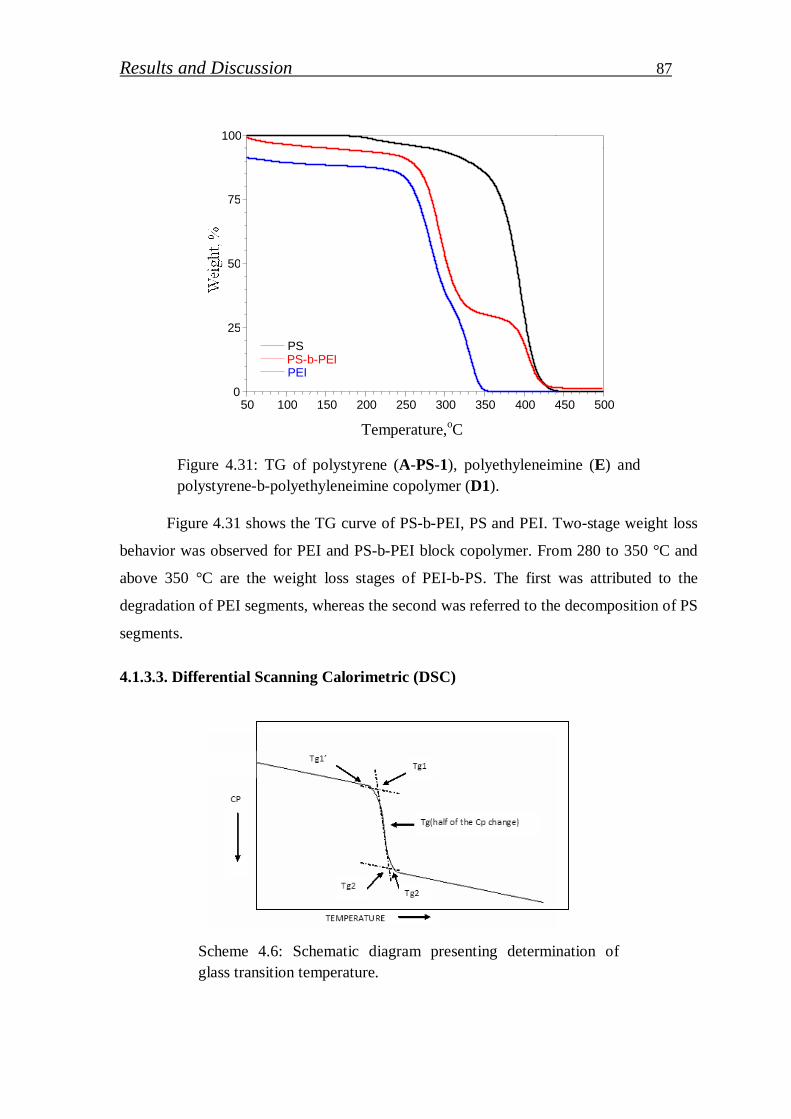
Results and Discussion 87
Figure 4.31: TG of polystyrene (A-PS-1), polyethyleneimine (E) and polystyrene-b-polyethyleneimine copolymer (D1).
Figure 4.31 shows the TG curve of PS-b-PEI, PS and PEI. Two-stage weight loss
behavior was observed for PEI and PS-b-PEI block copolymer. From 280 to 350 °C and
above 350 °C are the weight loss stages of PEI-b-PS. The first was attributed to the
degradation of PEI segments, whereas the second was referred to the decomposition of PS
segments.
4.1.3.3. Differential Scanning Calorimetric (DSC)
Scheme 4.6: Schematic diagram presenting determination of glass transition temperature.
500
PS PS-b-PEI PEI
0
25
50
75
100
50 100 150 200 250 300 350 400 450
Temperature,oC
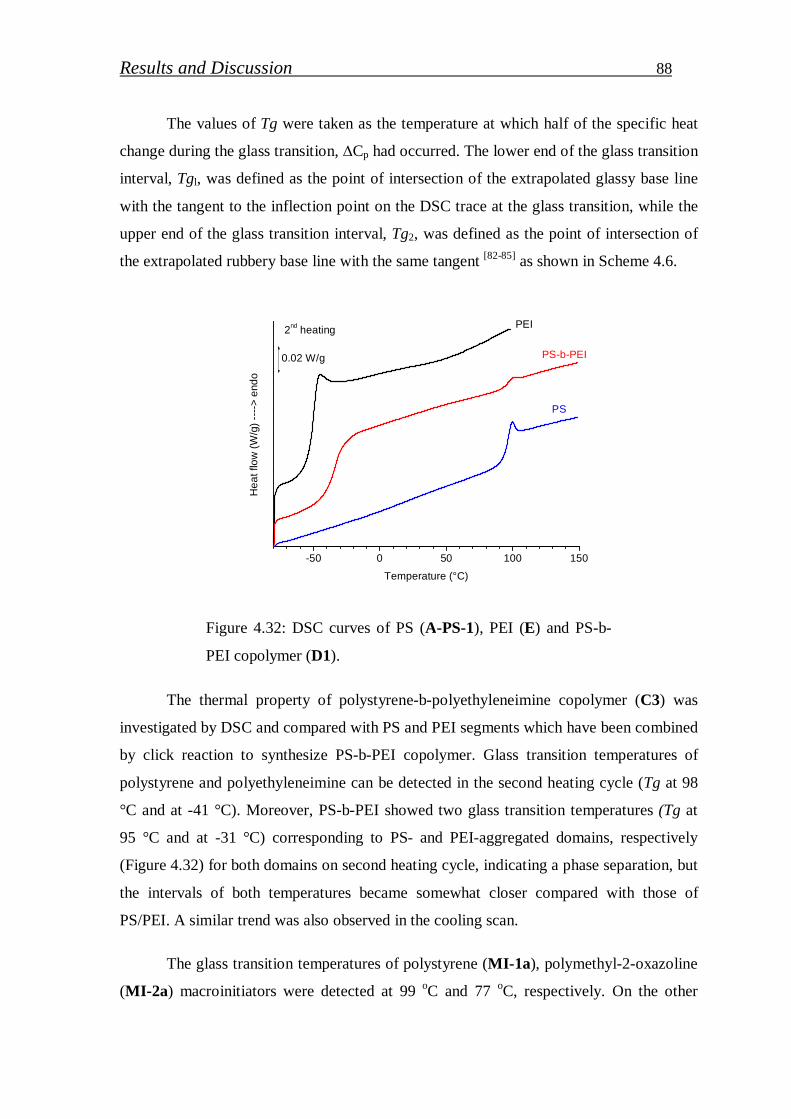
Results and Discussion 88
The values of Tg were taken as the temperature at which half of the specific heat
change during the glass transition, ∆Cp had occurred. The lower end of the glass transition
interval, Tgl, was defined as the point of intersection of the extrapolated glassy base line
with the tangent to the inflection point on the DSC trace at the glass transition, while the
upper end of the glass transition interval, Tg2, was defined as the point of intersection of
the extrapolated rubbery base line with the same tangent [82-85] as shown in Scheme 4.6.
-50 0 50 100 150
He
at f
low
(W
/g)
----
> e
ndo
Temperature (°C)
0.02 W/g
PEI
PS
PS-b-PEI
2nd heating
Figure 4.32: DSC curves of PS (A-PS-1), PEI (E) and PS-b-
PEI copolymer (D1).
The thermal property of polystyrene-b-polyethyleneimine copolymer (C3) was
investigated by DSC and compared with PS and PEI segments which have been combined
by click reaction to synthesize PS-b-PEI copolymer. Glass transition temperatures of
polystyrene and polyethyleneimine can be detected in the second heating cycle (Tg at 98
°C and at -41 °C). Moreover, PS-b-PEI showed two glass transition temperatures (Tg at
95 °C and at -31 °C) corresponding to PS- and PEI-aggregated domains, respectively
(Figure 4.32) for both domains on second heating cycle, indicating a phase separation, but
the intervals of both temperatures became somewhat closer compared with those of
PS/PEI. A similar trend was also observed in the cooling scan.
The glass transition temperatures of polystyrene (MI-1a), polymethyl-2-oxazoline
(MI-2a) macroinitiators were detected at 99 oC and 77 oC, respectively. On the other
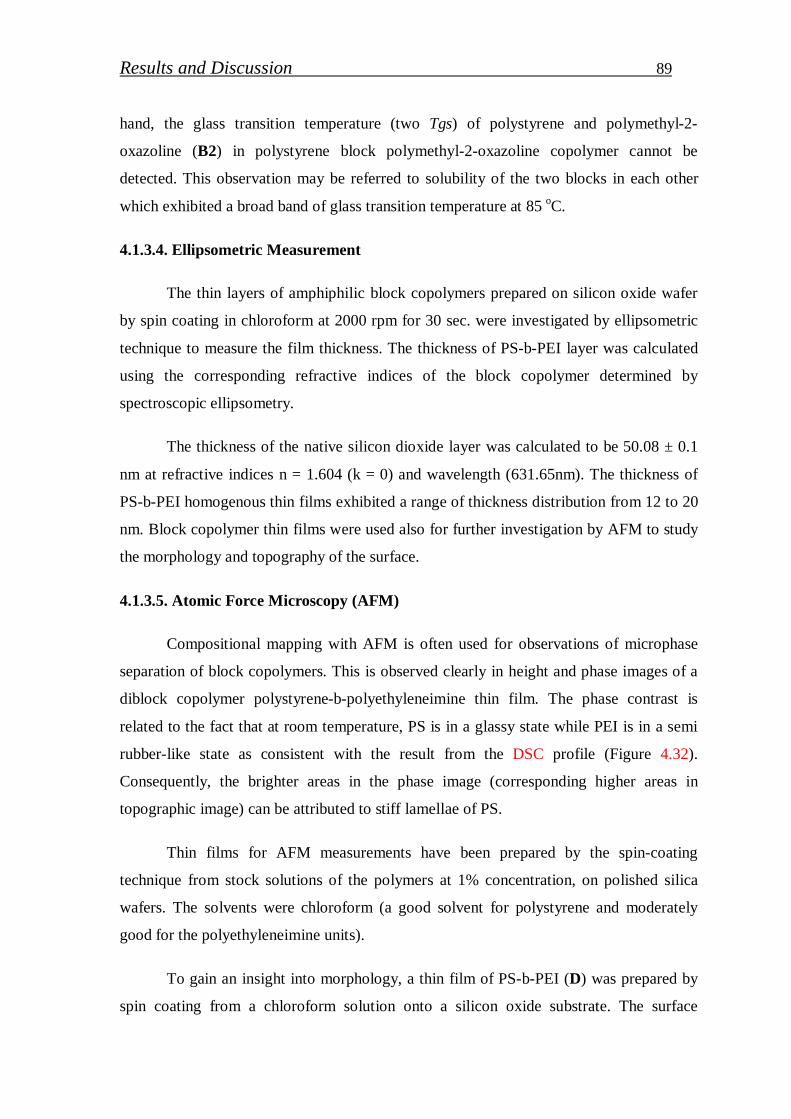
Results and Discussion 89
hand, the glass transition temperature (two Tgs) of polystyrene and polymethyl-2-
oxazoline (B2) in polystyrene block polymethyl-2-oxazoline copolymer cannot be
detected. This observation may be referred to solubility of the two blocks in each other
which exhibited a broad band of glass transition temperature at 85 oC.
4.1.3.4. Ellipsometric Measurement
The thin layers of amphiphilic block copolymers prepared on silicon oxide wafer
by spin coating in chloroform at 2000 rpm for 30 sec. were investigated by ellipsometric
technique to measure the film thickness. The thickness of PS-b-PEI layer was calculated
using the corresponding refractive indices of the block copolymer determined by
spectroscopic ellipsometry.
The thickness of the native silicon dioxide layer was calculated to be 50.08 ± 0.1
nm at refractive indices n = 1.604 (k = 0) and wavelength (631.65nm). The thickness of
PS-b-PEI homogenous thin films exhibited a range of thickness distribution from 12 to 20
nm. Block copolymer thin films were used also for further investigation by AFM to study
the morphology and topography of the surface.
4.1.3.5. Atomic Force Microscopy (AFM)
Compositional mapping with AFM is often used for observations of microphase
separation of block copolymers. This is observed clearly in height and phase images of a
diblock copolymer polystyrene-b-polyethyleneimine thin film. The phase contrast is
related to the fact that at room temperature, PS is in a glassy state while PEI is in a semi
rubber-like state as consistent with the result from the DSC profile (Figure 4.32).
Consequently, the brighter areas in the phase image (corresponding higher areas in
topographic image) can be attributed to stiff lamellae of PS.
Thin films for AFM measurements have been prepared by the spin-coating
technique from stock solutions of the polymers at 1% concentration, on polished silica
wafers. The solvents were chloroform (a good solvent for polystyrene and moderately
good for the polyethyleneimine units).
To gain an insight into morphology, a thin film of PS-b-PEI (D) was prepared by
spin coating from a chloroform solution onto a silicon oxide substrate. The surface
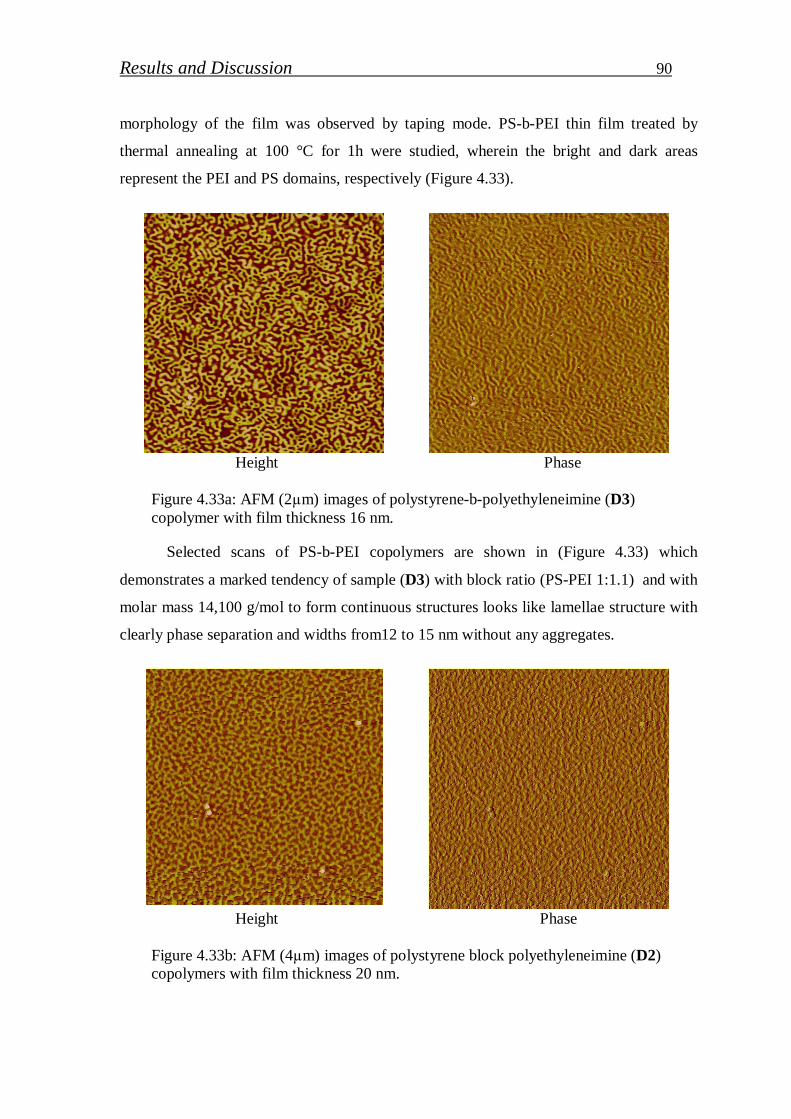
Results and Discussion 90
morphology of the film was observed by taping mode. PS-b-PEI thin film treated by
thermal annealing at 100 °C for 1h were studied, wherein the bright and dark areas
represent the PEI and PS domains, respectively (Figure 4.33).
Height Phase Figure 4.33a: AFM (2µm) images of polystyrene-b-polyethyleneimine (D3) copolymer with film thickness 16 nm.
Selected scans of PS-b-PEI copolymers are shown in (Figure 4.33) which
demonstrates a marked tendency of sample (D3) with block ratio (PS-PEI 1:1.1) and with
molar mass 14,100 g/mol to form continuous structures looks like lamellae structure with
clearly phase separation and widths from12 to 15 nm without any aggregates.
Height Phase Figure 4.33b: AFM (4µm) images of polystyrene block polyethyleneimine (D2) copolymers with film thickness 20 nm.
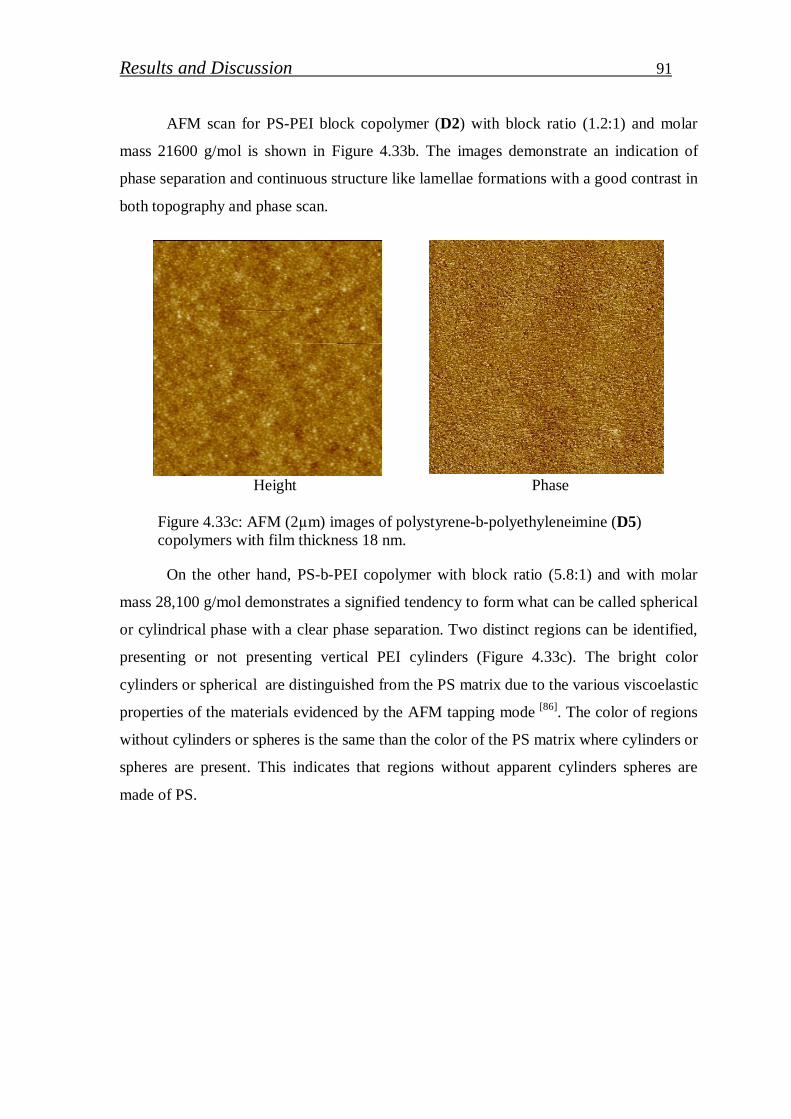
Results and Discussion 91
AFM scan for PS-PEI block copolymer (D2) with block ratio (1.2:1) and molar
mass 21600 g/mol is shown in Figure 4.33b. The images demonstrate an indication of
phase separation and continuous structure like lamellae formations with a good contrast in
both topography and phase scan.
Height Phase Figure 4.33c: AFM (2µm) images of polystyrene-b-polyethyleneimine (D5) copolymers with film thickness 18 nm.
On the other hand, PS-b-PEI copolymer with block ratio (5.8:1) and with molar
mass 28,100 g/mol demonstrates a signified tendency to form what can be called spherical
or cylindrical phase with a clear phase separation. Two distinct regions can be identified,
presenting or not presenting vertical PEI cylinders (Figure 4.33c). The bright color
cylinders or spherical are distinguished from the PS matrix due to the various viscoelastic
properties of the materials evidenced by the AFM tapping mode [86]. The color of regions
without cylinders or spheres is the same than the color of the PS matrix where cylinders or
spheres are present. This indicates that regions without apparent cylinders spheres are
made of PS.
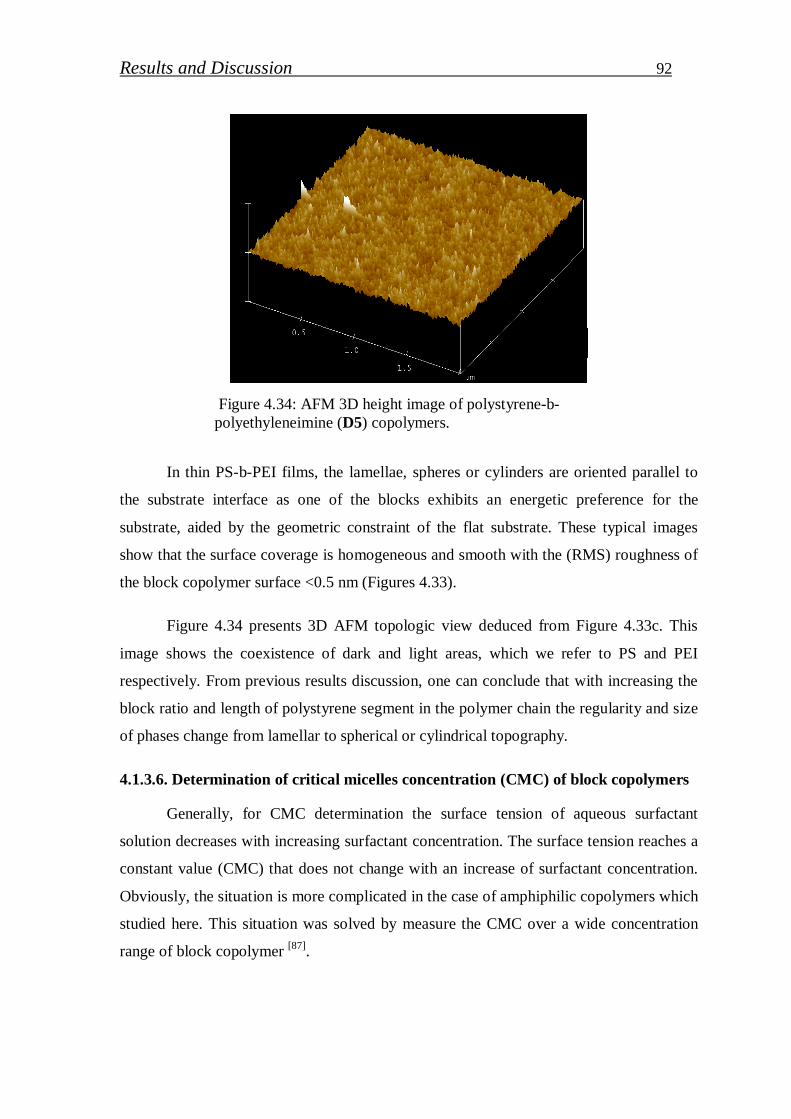
Results and Discussion 92
Figure 4.34: AFM 3D height image of polystyrene-b- polyethyleneimine (D5) copolymers.
In thin PS-b-PEI films, the lamellae, spheres or cylinders are oriented parallel to
the substrate interface as one of the blocks exhibits an energetic preference for the
substrate, aided by the geometric constraint of the flat substrate. These typical images
show that the surface coverage is homogeneous and smooth with the (RMS) roughness of
the block copolymer surface <0.5 nm (Figures 4.33).
Figure 4.34 presents 3D AFM topologic view deduced from Figure 4.33c. This
image shows the coexistence of dark and light areas, which we refer to PS and PEI
respectively. From previous results discussion, one can conclude that with increasing the
block ratio and length of polystyrene segment in the polymer chain the regularity and size
of phases change from lamellar to spherical or cylindrical topography.
4.1.3.6. Determination of critical micelles concentration (CMC) of block copolymers
Generally, for CMC determination the surface tension of aqueous surfactant
solution decreases with increasing surfactant concentration. The surface tension reaches a
constant value (CMC) that does not change with an increase of surfactant concentration.
Obviously, the situation is more complicated in the case of amphiphilic copolymers which
studied here. This situation was solved by measure the CMC over a wide concentration
range of block copolymer [87].
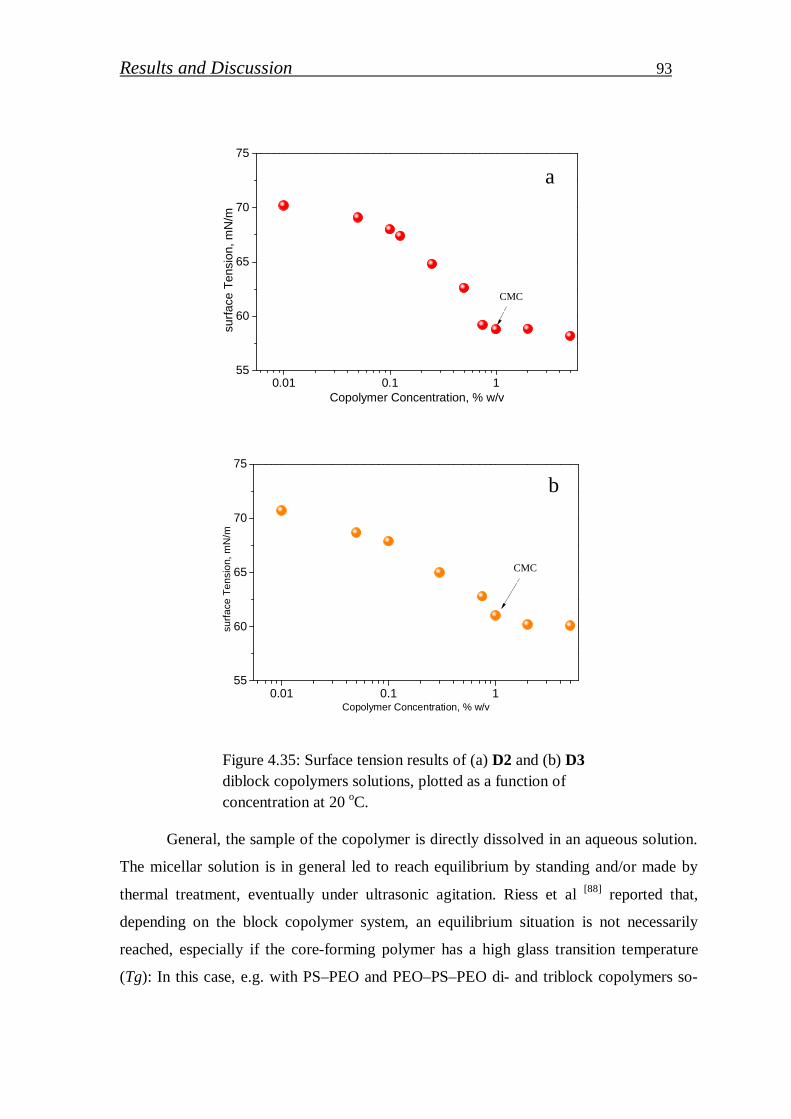
Results and Discussion 93
0.01 0.1 155
60
65
70
75
surf
ace
Ten
sion
, mN
/m
Copolymer Concentration, % w/v
0.01 0.1 155
60
65
70
75
surf
ace
Te
nsi
on,
mN
/m
Copolymer Concentration, % w/v
Figure 4.35: Surface tension results of (a) D2 and (b) D3 diblock copolymers solutions, plotted as a function of concentration at 20 oC.
General, the sample of the copolymer is directly dissolved in an aqueous solution.
The micellar solution is in general led to reach equilibrium by standing and/or made by
thermal treatment, eventually under ultrasonic agitation. Riess et al [88] reported that,
depending on the block copolymer system, an equilibrium situation is not necessarily
reached, especially if the core-forming polymer has a high glass transition temperature
(Tg): In this case, e.g. with PS–PEO and PEO–PS–PEO di- and triblock copolymers so-
a
b
CMC
CMC
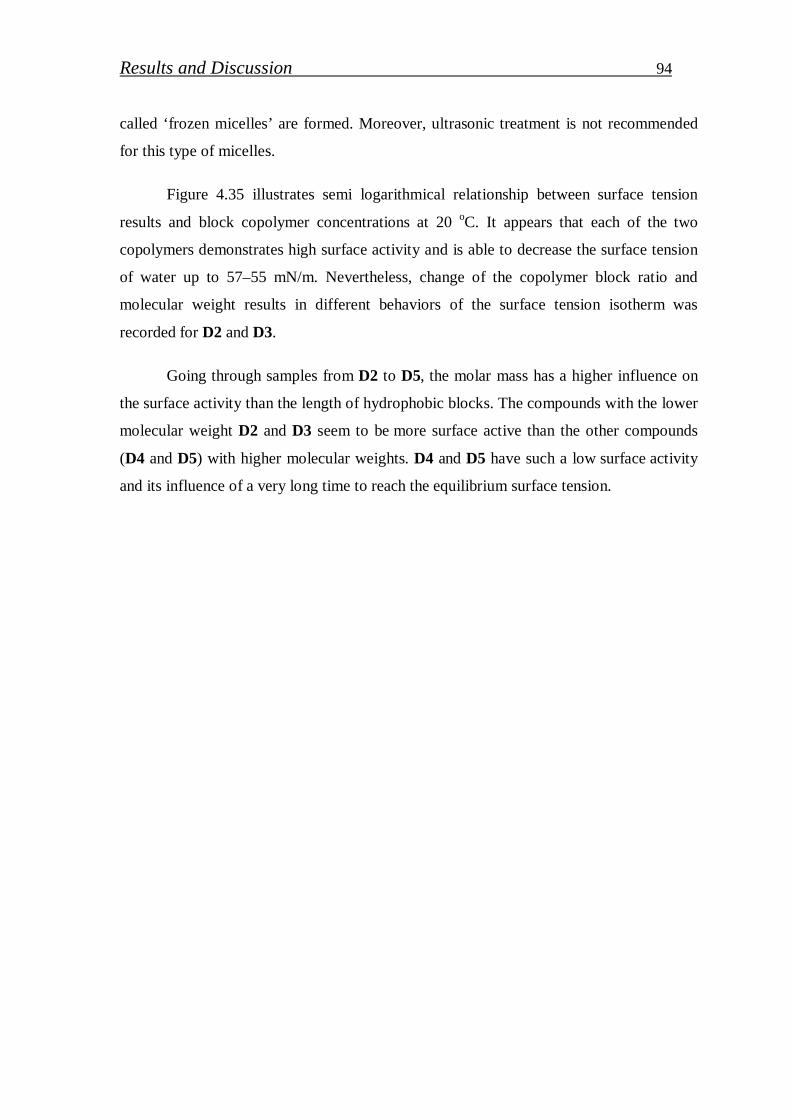
Results and Discussion 94
called ‘frozen micelles’ are formed. Moreover, ultrasonic treatment is not recommended
for this type of micelles.
Figure 4.35 illustrates semi logarithmical relationship between surface tension
results and block copolymer concentrations at 20 oC. It appears that each of the two
copolymers demonstrates high surface activity and is able to decrease the surface tension
of water up to 57–55 mN/m. Nevertheless, change of the copolymer block ratio and
molecular weight results in different behaviors of the surface tension isotherm was
recorded for D2 and D3.
Going through samples from D2 to D5, the molar mass has a higher influence on
the surface activity than the length of hydrophobic blocks. The compounds with the lower
molecular weight D2 and D3 seem to be more surface active than the other compounds
(D4 and D5) with higher molecular weights. D4 and D5 have such a low surface activity
and its influence of a very long time to reach the equilibrium surface tension.
Results and Discussion 95
4.1.4. Summary of block copolymers synthesis part
A set of different diblock copolymers based on styrene and 2-methyl-2-oxazoline
was synthesized by combining nitroxide mediated radical polymerization (NMRP) and
cationic ring opening polymerization (CROP) using the macroinitiator or click coupling
methods. PS-PMeOx block copolymers with excellent control over the molecular
composition and narrow molar mass distribution were achieved. In the last block
copolymer section, using click coupling and macroinitiator route, six main products (PS,
PMeOx, PS-N3, PMeOx-alkyne, PS-b-PMeOx and PS-b-PEI) were achieved.
PS macroinitiators (MI-1) prepared through NMRP by modified alkoxyamine
initiator 1, was used to initiate polymerization of 2-methyl-2-oxazoline. The efficiency of
PS macroinitiator to initiate CROP is quite low; this can be referred to weak initiation
efficiency of methylene chloride group to polymerize 2-oxazolines. For that, the block
ratio cannot be controlled. On the other hand, PMeOx macroinitiators (MI-2) synthesized
through CROP by modified alkoxyamine initiator 1 was applied as effective initiator to
polymerize styrene. PS-PMeOx block copolymers were achieved with good conversion
and exhibit quite nice block ratio control.
A novel coupling between NMRP and CROP by “click” reaction was applied to
synthesize amphiphilic PS-PMeOx copolymer. PS block functionalized with azide moiety
was coupled with PMeOx block terminated with alkyne group. Nice molar masses control
and block ratio exhibited for all block copolymers with different molecular weight
distribution. Low molar mass of PMeOx and poor controlled in block ratio obtained are
the reasons to use click coupling strategy to prepared PS-PEI block copolymer which used
further nanoparticles section.
Target PS-PEI block copolymer was produced from hydrolysis of PS-PMeOx
block copolymer in alkaline medium. The products were characterized with various
analytical means (NMR, SEC, FTIR, AFM and DSC) which allowed to prove the
chemical composition and the high control achieved in click coupling of NMRP and
CROP.
Click coupling method is more precise and effective than macroinitiation method.
By comparison the calculated and experimental molar masses of macroinitiation and click
Results and Discussion 96
coupling strategies, we can conclude that there is high agreement between calculated and
experimental molar masses (Mncal ≈ MnSEC) with low polydispersities. Also the block
ratio was matched with prospected results especially when calculated from 1H NMR. In
contrast, the results of macroinitiator strategy exhibit lower possibility to control the block
ratio especially, using the polystyrene macroinitiator. PMeOx macroinitiator presents a
better control of block ratio with nice polydispersities but “click” coupling strategy still
has higher performance than macroinitiator route. Therefore, the target PS-b-PEI were
only prepared from the PS-b-PMeOx products achieved from the click coupling approach.
In the next sections, selected PS-b-PEI copolymers D were used to stabilize gold
nanoparticles and gallium nitride quantum dots. D2 and D3 were selected with nearly
stoichiometric block ratio. This selection was depending on our expectation of
stoichiometric block behavior to form micelles in organic and aqueous medium. The good
phase separation between PS and PEI segments of stoichiometric PS-b-PEI copolymer
could lead to a homogenous distribution of gold nanoparticles or gallium nitride QDs in
PEI phase.
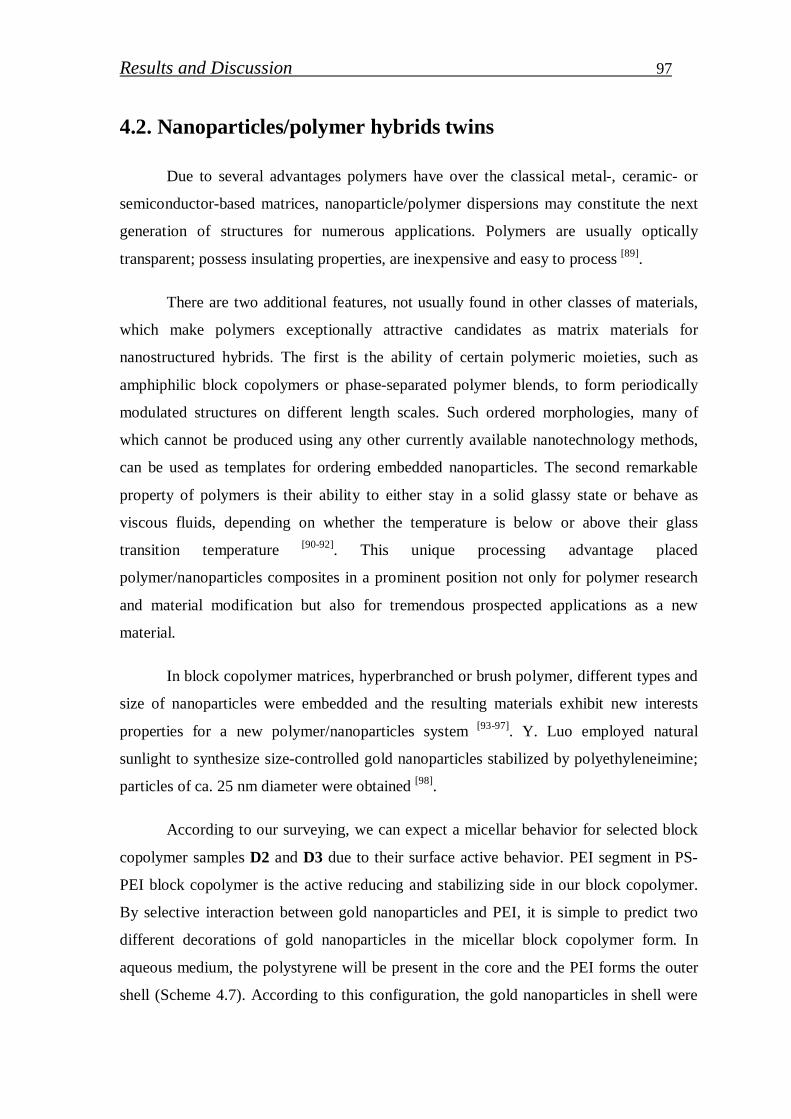
Results and Discussion 97
4.2. Nanoparticles/polymer hybrids twins
Due to several advantages polymers have over the classical metal-, ceramic- or
semiconductor-based matrices, nanoparticle/polymer dispersions may constitute the next
generation of structures for numerous applications. Polymers are usually optically
transparent; possess insulating properties, are inexpensive and easy to process [89].
There are two additional features, not usually found in other classes of materials,
which make polymers exceptionally attractive candidates as matrix materials for
nanostructured hybrids. The first is the ability of certain polymeric moieties, such as
amphiphilic block copolymers or phase-separated polymer blends, to form periodically
modulated structures on different length scales. Such ordered morphologies, many of
which cannot be produced using any other currently available nanotechnology methods,
can be used as templates for ordering embedded nanoparticles. The second remarkable
property of polymers is their ability to either stay in a solid glassy state or behave as
viscous fluids, depending on whether the temperature is below or above their glass
transition temperature [90-92]. This unique processing advantage placed
polymer/nanoparticles composites in a prominent position not only for polymer research
and material modification but also for tremendous prospected applications as a new
material.
In block copolymer matrices, hyperbranched or brush polymer, different types and
size of nanoparticles were embedded and the resulting materials exhibit new interests
properties for a new polymer/nanoparticles system [93-97]. Y. Luo employed natural
sunlight to synthesize size-controlled gold nanoparticles stabilized by polyethyleneimine;
particles of ca. 25 nm diameter were obtained [98].
According to our surveying, we can expect a micellar behavior for selected block
copolymer samples D2 and D3 due to their surface active behavior. PEI segment in PS-
PEI block copolymer is the active reducing and stabilizing side in our block copolymer.
By selective interaction between gold nanoparticles and PEI, it is simple to predict two
different decorations of gold nanoparticles in the micellar block copolymer form. In
aqueous medium, the polystyrene will be present in the core and the PEI forms the outer
shell (Scheme 4.7). According to this configuration, the gold nanoparticles in shell were
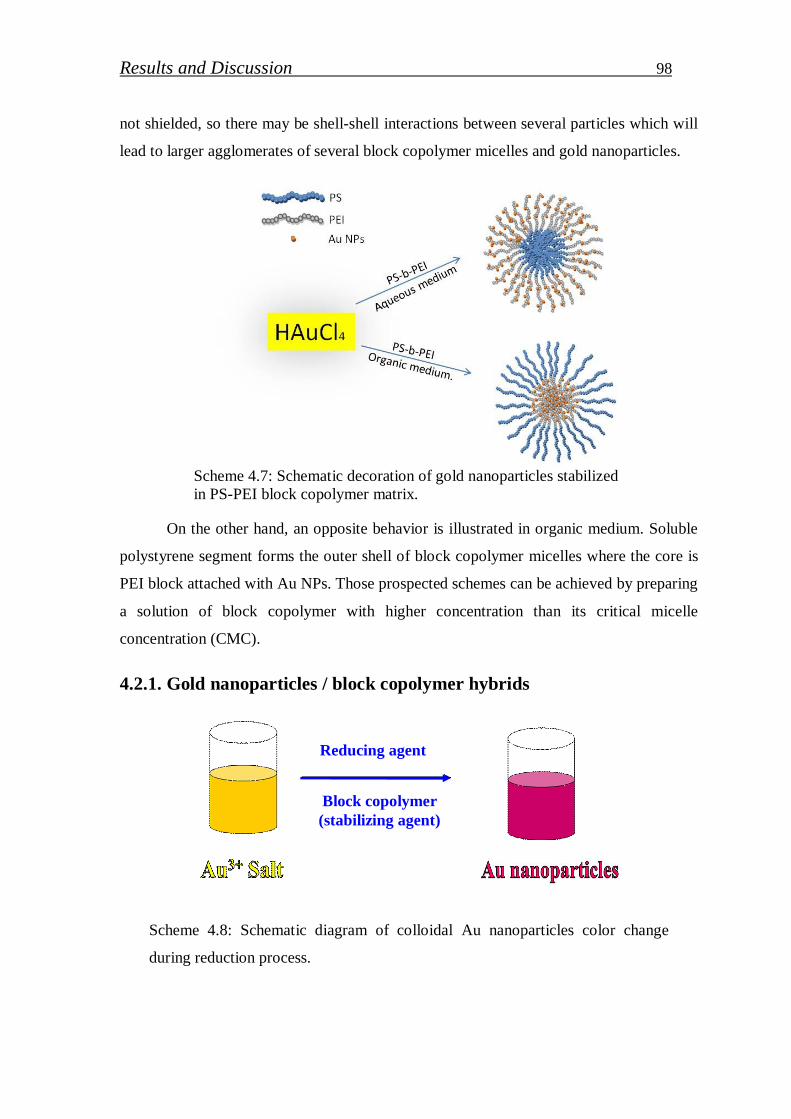
Results and Discussion 98
not shielded, so there may be shell-shell interactions between several particles which will
lead to larger agglomerates of several block copolymer micelles and gold nanoparticles.
Scheme 4.7: Schematic decoration of gold nanoparticles stabilized in PS-PEI block copolymer matrix.
On the other hand, an opposite behavior is illustrated in organic medium. Soluble
polystyrene segment forms the outer shell of block copolymer micelles where the core is
PEI block attached with Au NPs. Those prospected schemes can be achieved by preparing
a solution of block copolymer with higher concentration than its critical micelle
concentration (CMC).
4.2.1. Gold nanoparticles / block copolymer hybrids
Scheme 4.8: Schematic diagram of colloidal Au nanoparticles color change
during reduction process.
Block copolymer (stabilizing agent)
Reducing agent
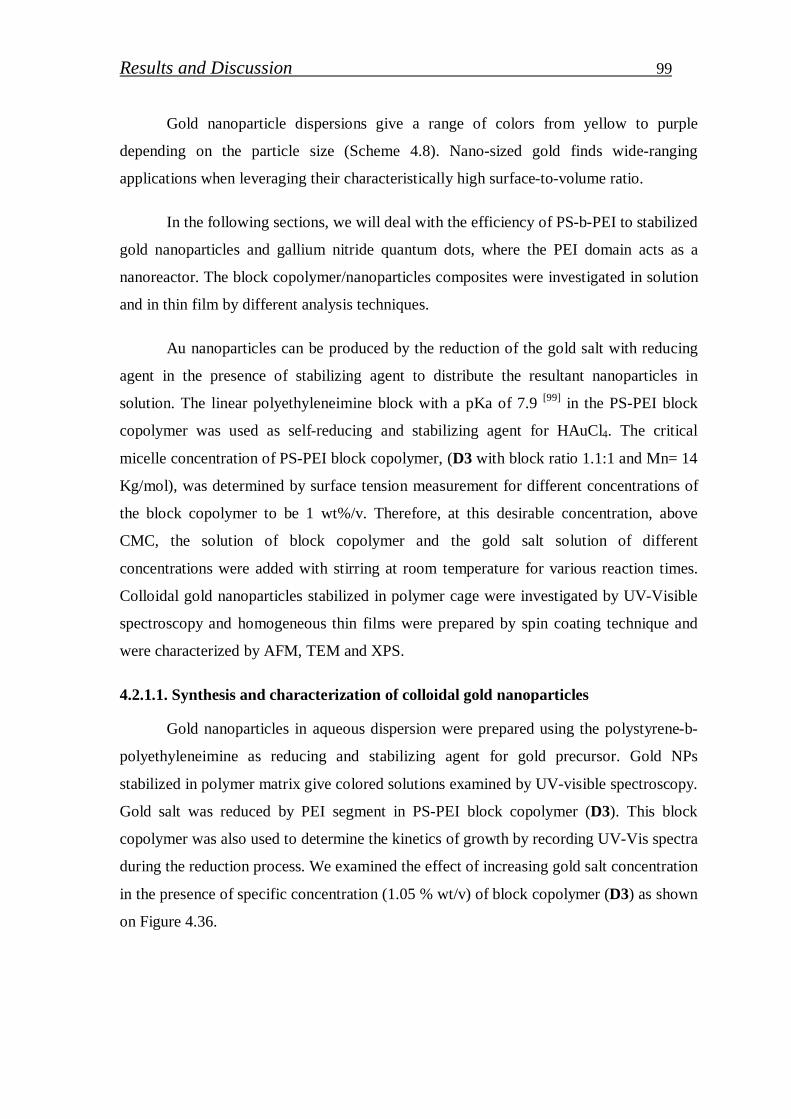
Results and Discussion 99
Gold nanoparticle dispersions give a range of colors from yellow to purple
depending on the particle size (Scheme 4.8). Nano-sized gold finds wide-ranging
applications when leveraging their characteristically high surface-to-volume ratio.
In the following sections, we will deal with the efficiency of PS-b-PEI to stabilized
gold nanoparticles and gallium nitride quantum dots, where the PEI domain acts as a
nanoreactor. The block copolymer/nanoparticles composites were investigated in solution
and in thin film by different analysis techniques.
Au nanoparticles can be produced by the reduction of the gold salt with reducing
agent in the presence of stabilizing agent to distribute the resultant nanoparticles in
solution. The linear polyethyleneimine block with a pKa of 7.9 [99] in the PS-PEI block
copolymer was used as self-reducing and stabilizing agent for HAuCl4. The critical
micelle concentration of PS-PEI block copolymer, (D3 with block ratio 1.1:1 and Mn= 14
Kg/mol), was determined by surface tension measurement for different concentrations of
the block copolymer to be 1 wt%/v. Therefore, at this desirable concentration, above
CMC, the solution of block copolymer and the gold salt solution of different
concentrations were added with stirring at room temperature for various reaction times.
Colloidal gold nanoparticles stabilized in polymer cage were investigated by UV-Visible
spectroscopy and homogeneous thin films were prepared by spin coating technique and
were characterized by AFM, TEM and XPS.
4.2.1.1. Synthesis and characterization of colloidal gold nanoparticles
Gold nanoparticles in aqueous dispersion were prepared using the polystyrene-b-
polyethyleneimine as reducing and stabilizing agent for gold precursor. Gold NPs
stabilized in polymer matrix give colored solutions examined by UV-visible spectroscopy.
Gold salt was reduced by PEI segment in PS-PEI block copolymer (D3). This block
copolymer was also used to determine the kinetics of growth by recording UV-Vis spectra
during the reduction process. We examined the effect of increasing gold salt concentration
in the presence of specific concentration (1.05 % wt/v) of block copolymer (D3) as shown
on Figure 4.36.
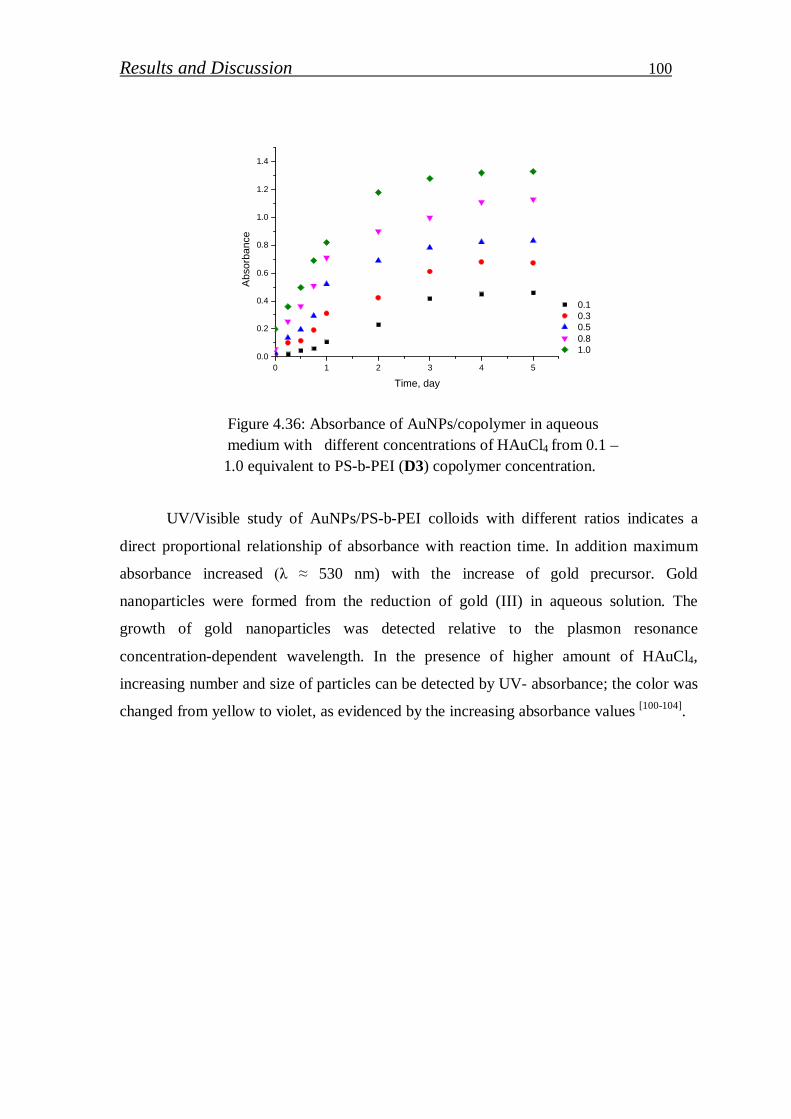
Results and Discussion 100
0 1 2 3 4 50.0
0.2
0.4
0.6
0.8
1.0
1.2
1.4
0.1 0.3 0.5 0.8 1.0
Abs
orba
nce
Time, day
Figure 4.36: Absorbance of AuNPs/copolymer in aqueous medium with different concentrations of HAuCl4 from 0.1 – 1.0 equivalent to PS-b-PEI (D3) copolymer concentration.
UV/Visible study of AuNPs/PS-b-PEI colloids with different ratios indicates a
direct proportional relationship of absorbance with reaction time. In addition maximum
absorbance increased (λ ≈ 530 nm) with the increase of gold precursor. Gold
nanoparticles were formed from the reduction of gold (III) in aqueous solution. The
growth of gold nanoparticles was detected relative to the plasmon resonance
concentration-dependent wavelength. In the presence of higher amount of HAuCl4,
increasing number and size of particles can be detected by UV- absorbance; the color was
changed from yellow to violet, as evidenced by the increasing absorbance values [100-104].
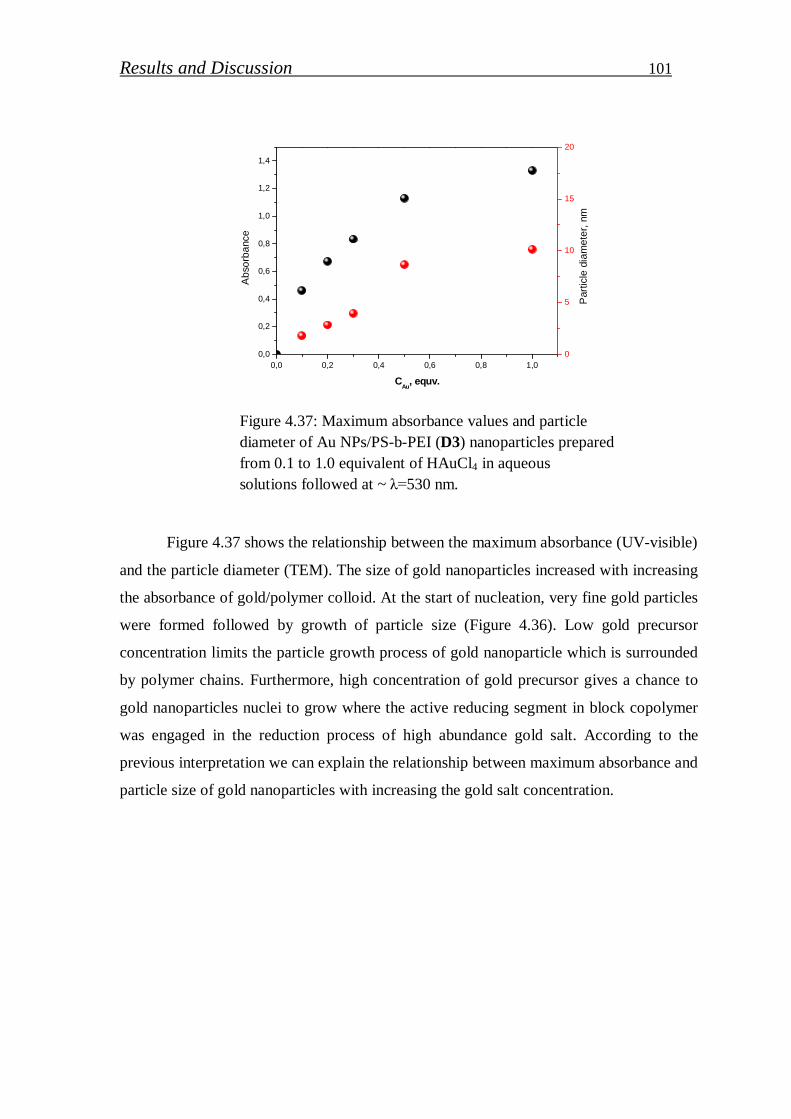
Results and Discussion 101
0,0 0,2 0,4 0,6 0,8 1,00,0
0,2
0,4
0,6
0,8
1,0
1,2
1,4
CAu, equv.
Ab
sorb
anc
e
0
5
10
15
20
Par
ticle
dia
me
ter,
nm
Figure 4.37: Maximum absorbance values and particle diameter of Au NPs/PS-b-PEI (D3) nanoparticles prepared from 0.1 to 1.0 equivalent of HAuCl4 in aqueous solutions followed at ~ λ=530 nm.
Figure 4.37 shows the relationship between the maximum absorbance (UV-visible)
and the particle diameter (TEM). The size of gold nanoparticles increased with increasing
the absorbance of gold/polymer colloid. At the start of nucleation, very fine gold particles
were formed followed by growth of particle size (Figure 4.36). Low gold precursor
concentration limits the particle growth process of gold nanoparticle which is surrounded
by polymer chains. Furthermore, high concentration of gold precursor gives a chance to
gold nanoparticles nuclei to grow where the active reducing segment in block copolymer
was engaged in the reduction process of high abundance gold salt. According to the
previous interpretation we can explain the relationship between maximum absorbance and
particle size of gold nanoparticles with increasing the gold salt concentration.
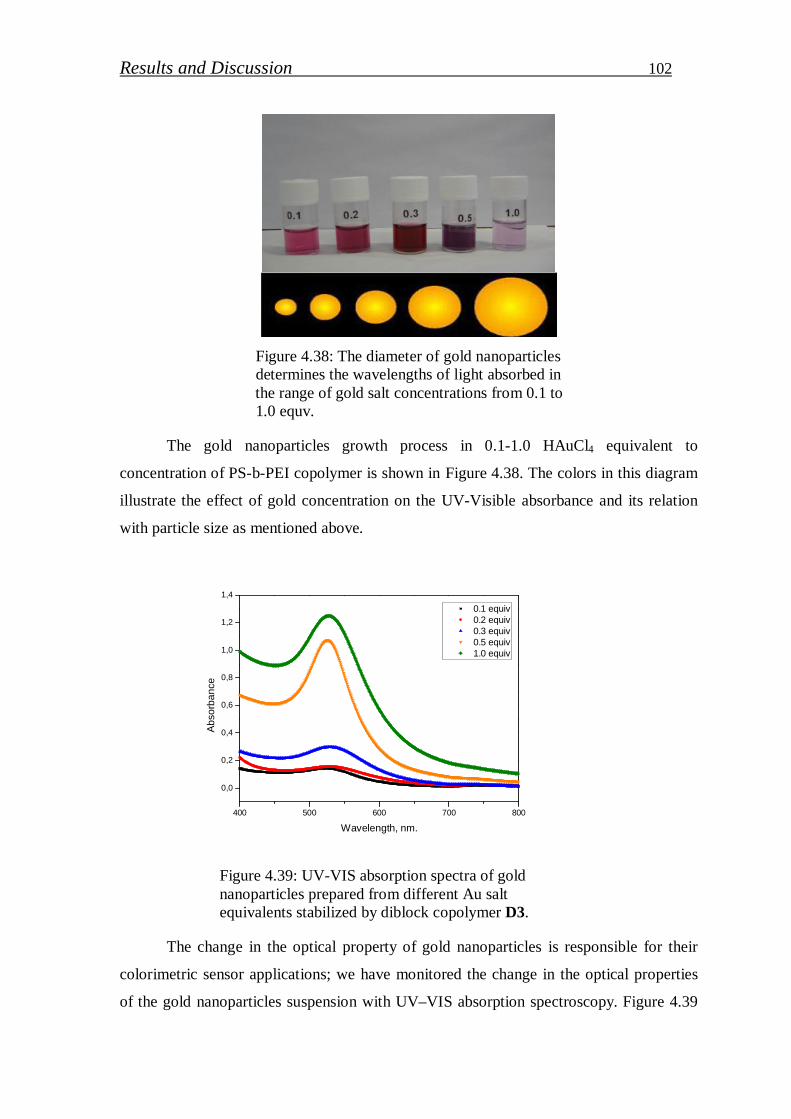
Results and Discussion 102
Figure 4.38: The diameter of gold nanoparticles determines the wavelengths of light absorbed in the range of gold salt concentrations from 0.1 to 1.0 equv.
The gold nanoparticles growth process in 0.1-1.0 HAuCl4 equivalent to
concentration of PS-b-PEI copolymer is shown in Figure 4.38. The colors in this diagram
illustrate the effect of gold concentration on the UV-Visible absorbance and its relation
with particle size as mentioned above.
400 500 600 700 800
0,0
0,2
0,4
0,6
0,8
1,0
1,2
1,4
0.1 equiv 0.2 equiv 0.3 equiv 0.5 equiv 1.0 equiv
Ab
sorb
an
ce
Wavelength, nm.
Figure 4.39: UV-VIS absorption spectra of gold nanoparticles prepared from different Au salt equivalents stabilized by diblock copolymer D3.
The change in the optical property of gold nanoparticles is responsible for their
colorimetric sensor applications; we have monitored the change in the optical properties
of the gold nanoparticles suspension with UV–VIS absorption spectroscopy. Figure 4.39
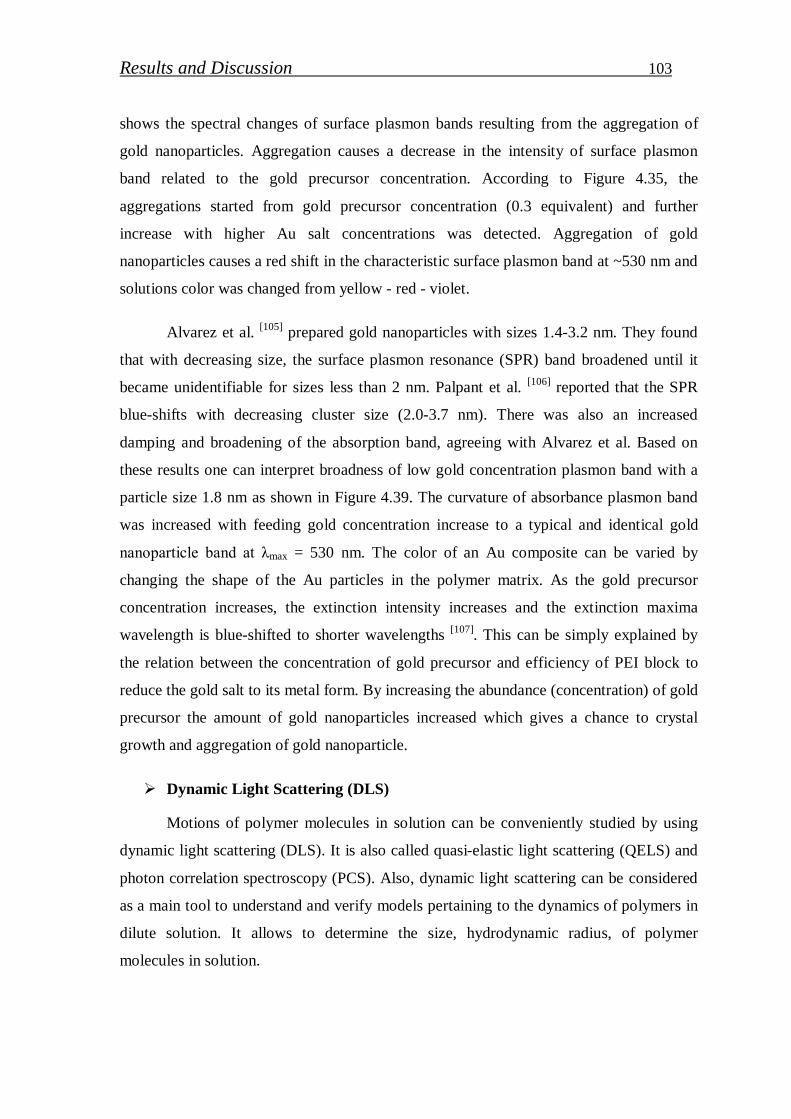
Results and Discussion 103
shows the spectral changes of surface plasmon bands resulting from the aggregation of
gold nanoparticles. Aggregation causes a decrease in the intensity of surface plasmon
band related to the gold precursor concentration. According to Figure 4.35, the
aggregations started from gold precursor concentration (0.3 equivalent) and further
increase with higher Au salt concentrations was detected. Aggregation of gold
nanoparticles causes a red shift in the characteristic surface plasmon band at ~530 nm and
solutions color was changed from yellow - red - violet.
Alvarez et al. [105] prepared gold nanoparticles with sizes 1.4-3.2 nm. They found
that with decreasing size, the surface plasmon resonance (SPR) band broadened until it
became unidentifiable for sizes less than 2 nm. Palpant et al. [106] reported that the SPR
blue-shifts with decreasing cluster size (2.0-3.7 nm). There was also an increased
damping and broadening of the absorption band, agreeing with Alvarez et al. Based on
these results one can interpret broadness of low gold concentration plasmon band with a
particle size 1.8 nm as shown in Figure 4.39. The curvature of absorbance plasmon band
was increased with feeding gold concentration increase to a typical and identical gold
nanoparticle band at λmax = 530 nm. The color of an Au composite can be varied by
changing the shape of the Au particles in the polymer matrix. As the gold precursor
concentration increases, the extinction intensity increases and the extinction maxima
wavelength is blue-shifted to shorter wavelengths [107]. This can be simply explained by
the relation between the concentration of gold precursor and efficiency of PEI block to
reduce the gold salt to its metal form. By increasing the abundance (concentration) of gold
precursor the amount of gold nanoparticles increased which gives a chance to crystal
growth and aggregation of gold nanoparticle.
Dynamic Light Scattering (DLS)
Motions of polymer molecules in solution can be conveniently studied by using
dynamic light scattering (DLS). It is also called quasi-elastic light scattering (QELS) and
photon correlation spectroscopy (PCS). Also, dynamic light scattering can be considered
as a main tool to understand and verify models pertaining to the dynamics of polymers in
dilute solution. It allows to determine the size, hydrodynamic radius, of polymer
molecules in solution.
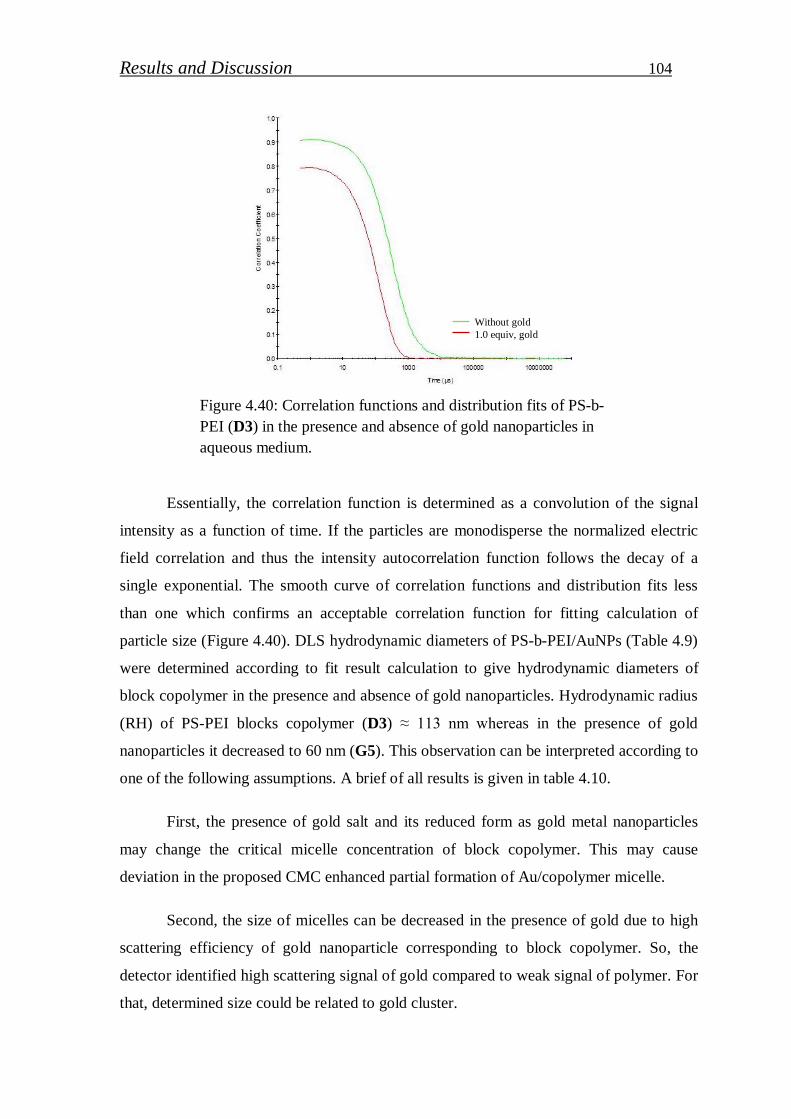
Results and Discussion 104
Figure 4.40: Correlation functions and distribution fits of PS-b-PEI (D3) in the presence and absence of gold nanoparticles in aqueous medium.
Essentially, the correlation function is determined as a convolution of the signal
intensity as a function of time. If the particles are monodisperse the normalized electric
field correlation and thus the intensity autocorrelation function follows the decay of a
single exponential. The smooth curve of correlation functions and distribution fits less
than one which confirms an acceptable correlation function for fitting calculation of
particle size (Figure 4.40). DLS hydrodynamic diameters of PS-b-PEI/AuNPs (Table 4.9)
were determined according to fit result calculation to give hydrodynamic diameters of
block copolymer in the presence and absence of gold nanoparticles. Hydrodynamic radius
(RH) of PS-PEI blocks copolymer (D3) ≈ 113 nm whereas in the presence of gold
nanoparticles it decreased to 60 nm (G5). This observation can be interpreted according to
one of the following assumptions. A brief of all results is given in table 4.10.
First, the presence of gold salt and its reduced form as gold metal nanoparticles
may change the critical micelle concentration of block copolymer. This may cause
deviation in the proposed CMC enhanced partial formation of Au/copolymer micelle.
Second, the size of micelles can be decreased in the presence of gold due to high
scattering efficiency of gold nanoparticle corresponding to block copolymer. So, the
detector identified high scattering signal of gold compared to weak signal of polymer. For
that, determined size could be related to gold cluster.
Without gold 1.0 equiv, gold
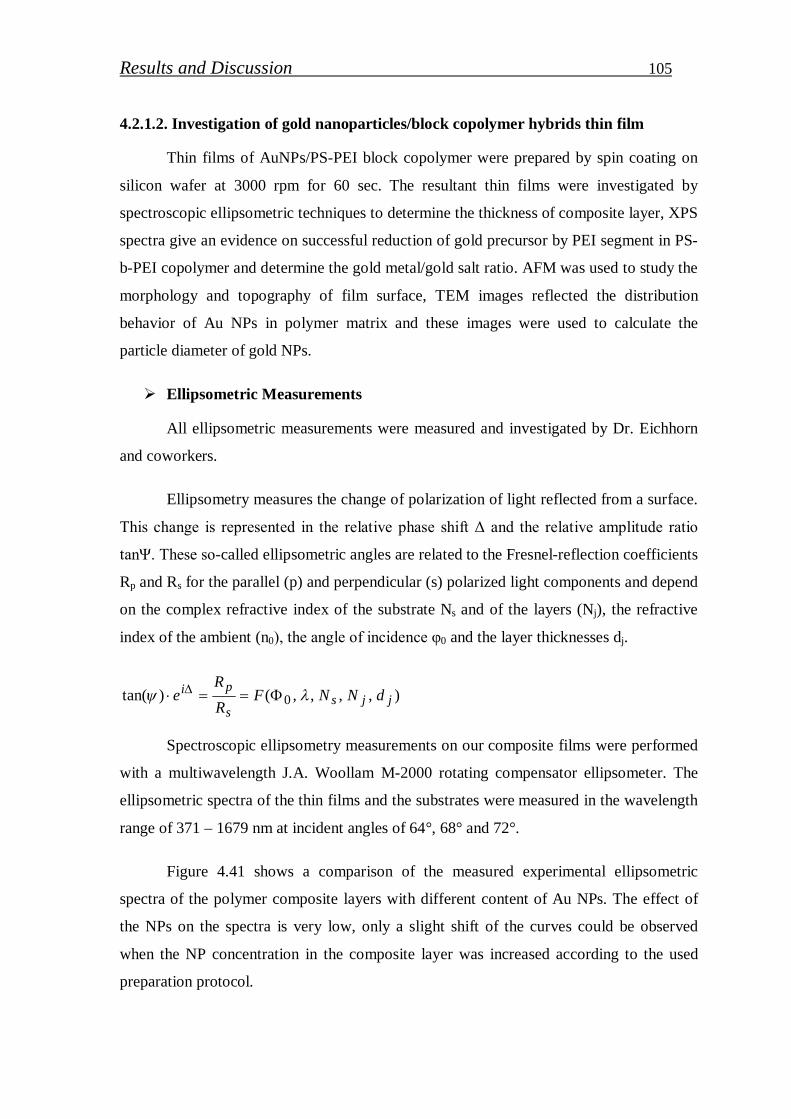
Results and Discussion 105
4.2.1.2. Investigation of gold nanoparticles/block copolymer hybrids thin film
Thin films of AuNPs/PS-PEI block copolymer were prepared by spin coating on
silicon wafer at 3000 rpm for 60 sec. The resultant thin films were investigated by
spectroscopic ellipsometric techniques to determine the thickness of composite layer, XPS
spectra give an evidence on successful reduction of gold precursor by PEI segment in PS-
b-PEI copolymer and determine the gold metal/gold salt ratio. AFM was used to study the
morphology and topography of film surface, TEM images reflected the distribution
behavior of Au NPs in polymer matrix and these images were used to calculate the
particle diameter of gold NPs.
Ellipsometric Measurements
All ellipsometric measurements were measured and investigated by Dr. Eichhorn
and coworkers.
Ellipsometry measures the change of polarization of light reflected from a surface.
This change is represented in the relative phase shift Δ and the relative amplitude ratio
tanΨ. These so-called ellipsometric angles are related to the Fresnel-reflection coefficients
Rp and Rs for the parallel (p) and perpendicular (s) polarized light components and depend
on the complex refractive index of the substrate Ns and of the layers (Nj), the refractive
index of the ambient (n0), the angle of incidence φ0 and the layer thicknesses dj.
),,,,()tan( 0 jjss
pi dNNFRR
e
Spectroscopic ellipsometry measurements on our composite films were performed
with a multiwavelength J.A. Woollam M-2000 rotating compensator ellipsometer. The
ellipsometric spectra of the thin films and the substrates were measured in the wavelength
range of 371 – 1679 nm at incident angles of 64°, 68° and 72°.
Figure 4.41 shows a comparison of the measured experimental ellipsometric
spectra of the polymer composite layers with different content of Au NPs. The effect of
the NPs on the spectra is very low, only a slight shift of the curves could be observed
when the NP concentration in the composite layer was increased according to the used
preparation protocol.
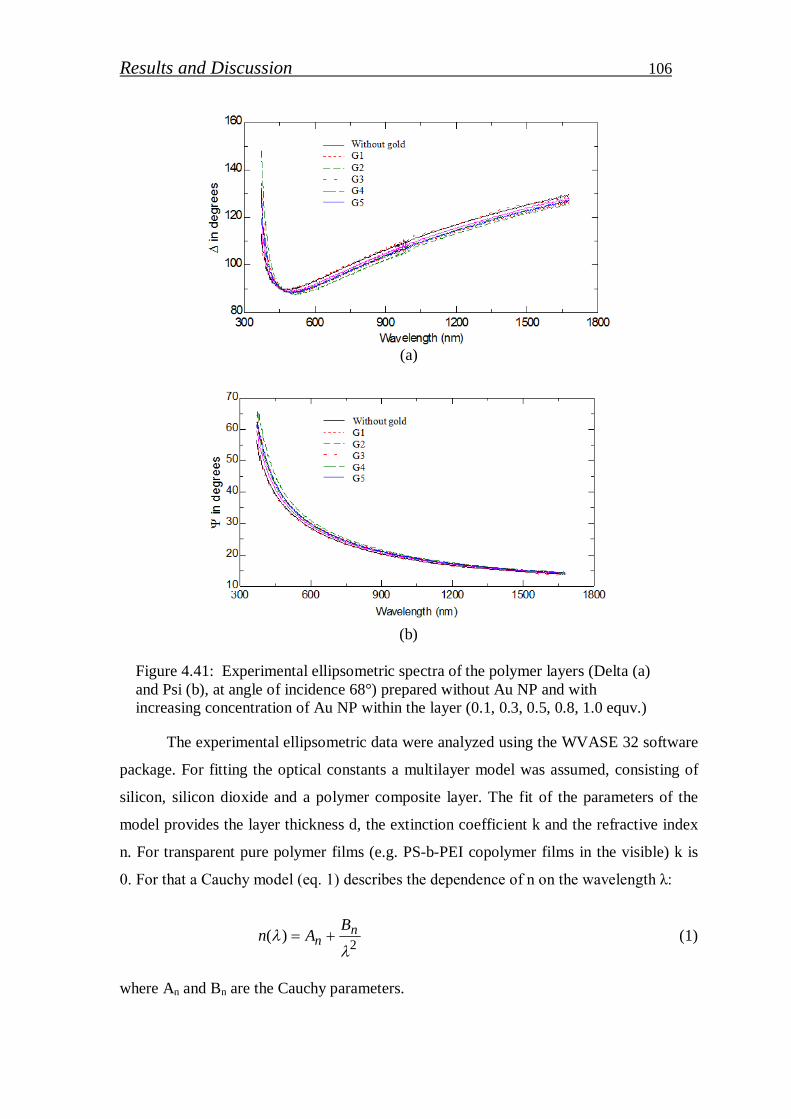
Results and Discussion 106
(a)
(b)
Figure 4.41: Experimental ellipsometric spectra of the polymer layers (Delta (a) and Psi (b), at angle of incidence 68°) prepared without Au NP and with increasing concentration of Au NP within the layer (0.1, 0.3, 0.5, 0.8, 1.0 equv.)
The experimental ellipsometric data were analyzed using the WVASE 32 software
package. For fitting the optical constants a multilayer model was assumed, consisting of
silicon, silicon dioxide and a polymer composite layer. The fit of the parameters of the
model provides the layer thickness d, the extinction coefficient k and the refractive index
n. For transparent pure polymer films (e.g. PS-b-PEI copolymer films in the visible) k is
0. For that a Cauchy model (eq. 1) describes the dependence of n on the wavelength λ:
2)(
nn
BAn (1)
where An and Bn are the Cauchy parameters.

Results and Discussion 107
Thus, in the first step the pure PS-b-PEI copolymer layer without Au NPs was
fitted using the following optical model: Si/30nm SiO2/ polymer (Cauchy layer). A typical
result is a film thickness of 12.2 nm and refractive index n(λ) = 1.601 + 0.005/ λ2
In the second step the PS-b-PEI copolymer layer, prepared by spin coating of
colloidal gold nanoparticles/block copolymer, as a composite layer was fitted. The Au
NPs should cause a typical optical absorption of the composite layer, that means different
n and k-spectra compared to the pure copolymer layers should be obtained. For gold NPs
smaller than the wave length of the exciting light a typical plasmon absorption band
should be found [108].
An Effective Medium Approximation (EMA) was applied here to determine the
polymer composite layer thickness, its effective optical constants as well as the Au
content in the layer.
The Maxwell-Garnett EMA is derived assuming spherical inclusions of a material B exist
in a host matrix of a second material A:
AB
ABB
A
A f
~2~~~
~2~~~
This equation must be solved for the effective complex dielectric function~ given
the volume fraction fB and fA=1- fB, and the dielectric functions of the two materials.
There is a simple relation between the effective complex dielectric function and the
effective optical constants n and k of the EMA layer:
2221
~~ iknni From the k spectra the dispersion of the absorption constant α can be calculated:
k4
Both dispersion relationships should consist of the plasmon resonance effects due to the Au NPs.
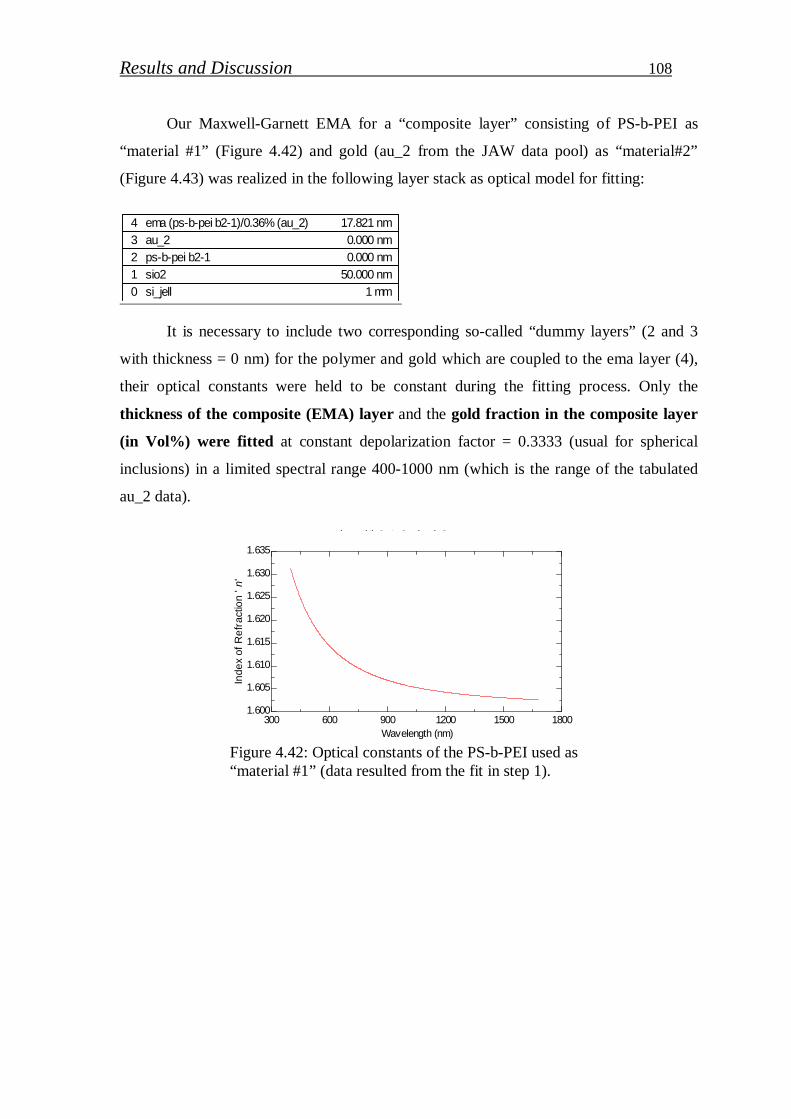
Results and Discussion 108
Our Maxwell-Garnett EMA for a “composite layer” consisting of PS-b-PEI as
“material #1” (Figure 4.42) and gold (au_2 from the JAW data pool) as “material#2”
(Figure 4.43) was realized in the following layer stack as optical model for fitting:
0 si_jell 1 mm1 sio2 50.000 nm2 ps-b-pei b2-1 0.000 nm3 au_2 0.000 nm4 ema (ps-b-pei b2-1)/0.36% (au_2) 17.821 nm
It is necessary to include two corresponding so-called “dummy layers” (2 and 3
with thickness = 0 nm) for the polymer and gold which are coupled to the ema layer (4),
their optical constants were held to be constant during the fitting process. Only the
thickness of the composite (EMA) layer and the gold fraction in the composite layer
(in Vol%) were fitted at constant depolarization factor = 0.3333 (usual for spherical
inclusions) in a limited spectral range 400-1000 nm (which is the range of the tabulated
au_2 data).
ps-b-pei b2-1 Optical Constants
Wavelength (nm)300 600 900 1200 1500 1800
Inde
x of
Re
frac
tion
'n'
1.600
1.605
1.610
1.615
1.620
1.625
1.630
1.635
Figure 4.42: Optical constants of the PS-b-PEI used as “material #1” (data resulted from the fit in step 1).
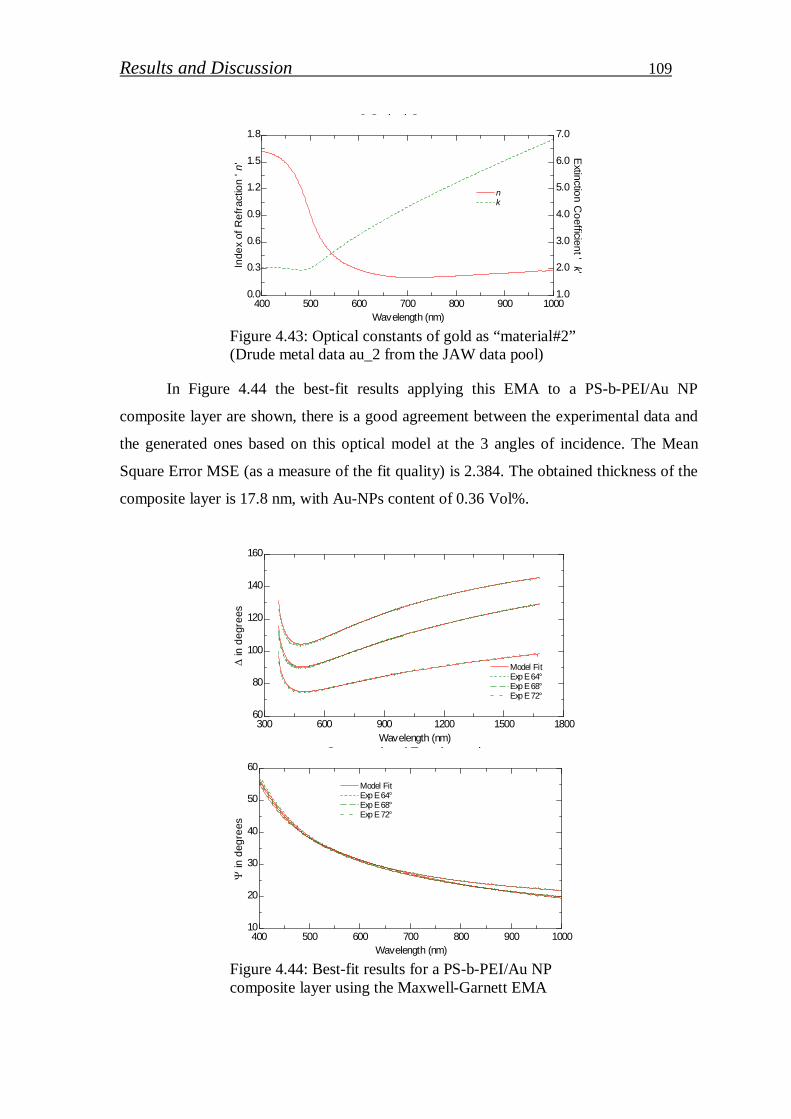
Results and Discussion 109
au_2 Optical Constants
Wavelength (nm)400 500 600 700 800 900 1000
Inde
x of
Re
frac
tion
'n'
Extinctio
n Co
efficient '
k'
0.0
0.3
0.6
0.9
1.2
1.5
1.8
1.0
2.0
3.0
4.0
5.0
6.0
7.0
nk
Figure 4.43: Optical constants of gold as “material#2” (Drude metal data au_2 from the JAW data pool)
In Figure 4.44 the best-fit results applying this EMA to a PS-b-PEI/Au NP
composite layer are shown, there is a good agreement between the experimental data and
the generated ones based on this optical model at the 3 angles of incidence. The Mean
Square Error MSE (as a measure of the fit quality) is 2.384. The obtained thickness of the
composite layer is 17.8 nm, with Au-NPs content of 0.36 Vol%.
Generated and Experimental
Wavelength (nm)300 600 900 1200 1500 1800
in
de
gre
es
60
80
100
120
140
160
Model Fit Exp E 64°Exp E 68°Exp E 72°
Generated and Experimental
Wavelength (nm)400 500 600 700 800 900 1000
in
deg
rees
10
20
30
40
50
60
Model Fit Exp E 64°Exp E 68°Exp E 72°
Figure 4.44: Best-fit results for a PS-b-PEI/Au NP composite layer using the Maxwell-Garnett EMA
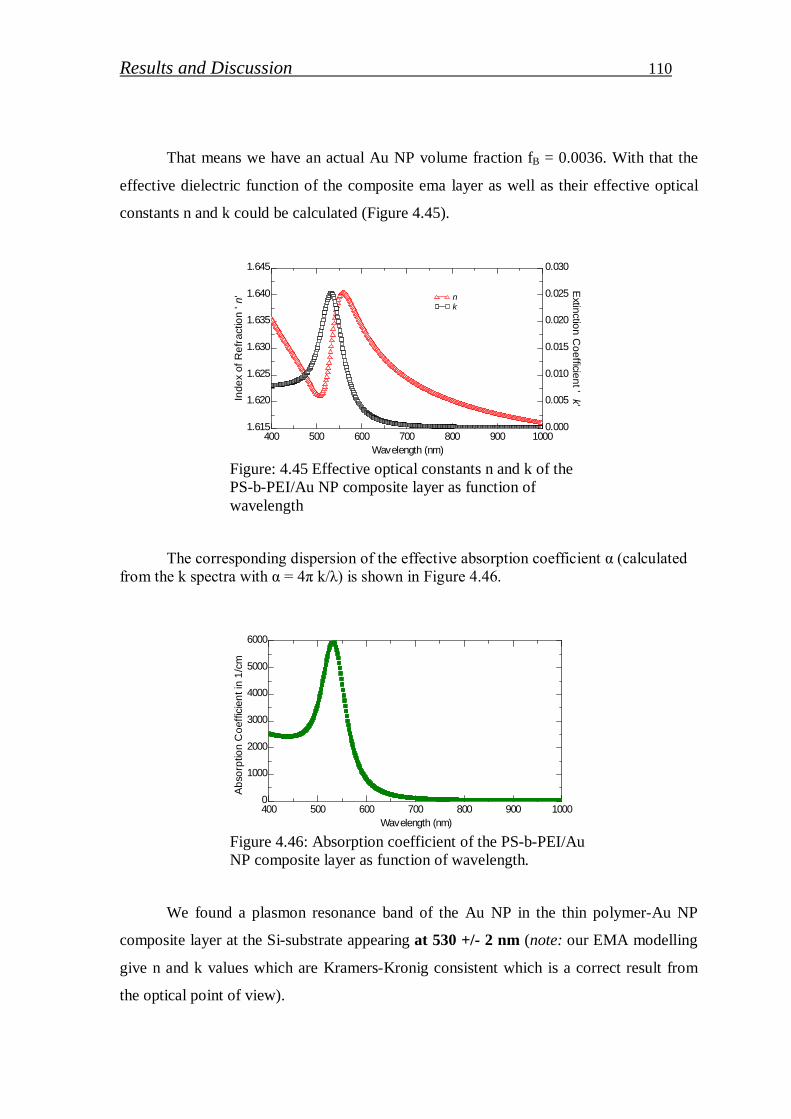
Results and Discussion 110
That means we have an actual Au NP volume fraction fB = 0.0036. With that the
effective dielectric function of the composite ema layer as well as their effective optical
constants n and k could be calculated (Figure 4.45).
ema Optical Constants
Wavelength (nm)400 500 600 700 800 900 1000
Inde
x of
Re
frac
tion
'n'
Extinctio
n Co
efficient '
k'
1.615
1.620
1.625
1.630
1.635
1.640
1.645
0.000
0.005
0.010
0.015
0.020
0.025
0.030
nk
Figure: 4.45 Effective optical constants n and k of the PS-b-PEI/Au NP composite layer as function of wavelength
The corresponding dispersion of the effective absorption coefficient α (calculated from the k spectra with α = 4π k/λ) is shown in Figure 4.46.
ema Optical Constants
Wavelength (nm)400 500 600 700 800 900 1000
Ab
sorp
tion
Co
effic
ien
t in
1/c
m
0
1000
2000
3000
4000
5000
6000
Figure 4.46: Absorption coefficient of the PS-b-PEI/Au NP composite layer as function of wavelength.
We found a plasmon resonance band of the Au NP in the thin polymer-Au NP
composite layer at the Si-substrate appearing at 530 +/- 2 nm (note: our EMA modelling
give n and k values which are Kramers-Kronig consistent which is a correct result from
the optical point of view).
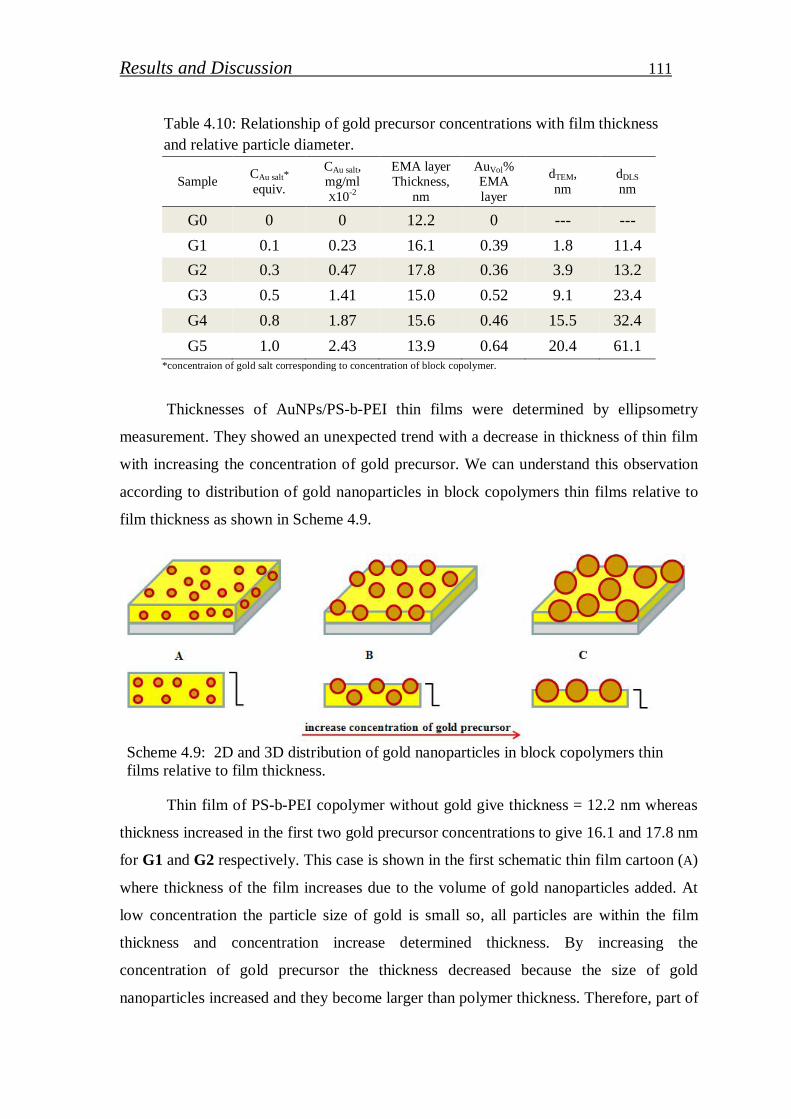
Results and Discussion 111
Table 4.10: Relationship of gold precursor concentrations with film thickness and relative particle diameter.
Sample CAu salt* equiv.
CAu salt, mg/ml X10-2
EMA layer Thickness,
nm
AuVol% EMA layer
dTEM, nm
dDLS nm
G0 0 0 12.2 0 --- --- G1 0.1 0.23 16.1 0.39 1.8 11.4 G2 0.3 0.47 17.8 0.36 3.9 13.2 G3 0.5 1.41 15.0 0.52 9.1 23.4 G4 0.8 1.87 15.6 0.46 15.5 32.4 G5 1.0 2.43 13.9 0.64 20.4 61.1
*concentraion of gold salt corresponding to concentration of block copolymer.
Thicknesses of AuNPs/PS-b-PEI thin films were determined by ellipsometry
measurement. They showed an unexpected trend with a decrease in thickness of thin film
with increasing the concentration of gold precursor. We can understand this observation
according to distribution of gold nanoparticles in block copolymers thin films relative to
film thickness as shown in Scheme 4.9.
Scheme 4.9: 2D and 3D distribution of gold nanoparticles in block copolymers thin films relative to film thickness.
Thin film of PS-b-PEI copolymer without gold give thickness = 12.2 nm whereas
thickness increased in the first two gold precursor concentrations to give 16.1 and 17.8 nm
for G1 and G2 respectively. This case is shown in the first schematic thin film cartoon (A)
where thickness of the film increases due to the volume of gold nanoparticles added. At
low concentration the particle size of gold is small so, all particles are within the film
thickness and concentration increase determined thickness. By increasing the
concentration of gold precursor the thickness decreased because the size of gold
nanoparticles increased and they become larger than polymer thickness. Therefore, part of
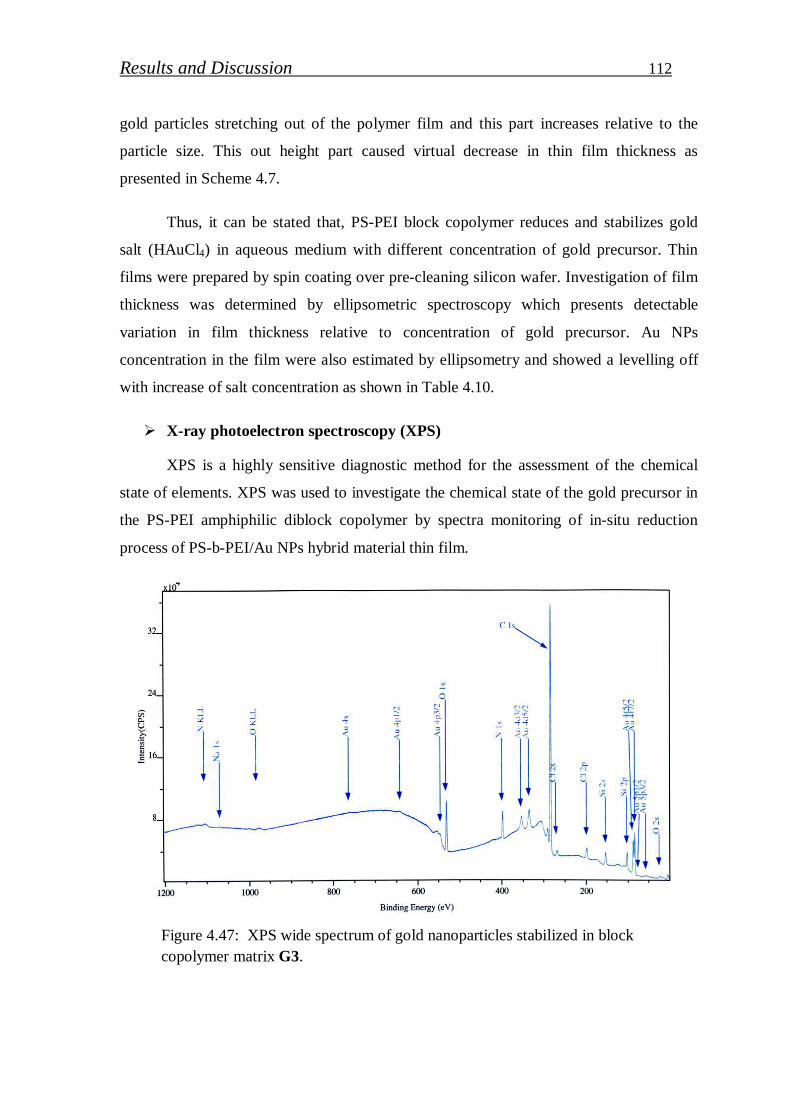
Results and Discussion 112
gold particles stretching out of the polymer film and this part increases relative to the
particle size. This out height part caused virtual decrease in thin film thickness as
presented in Scheme 4.7.
Thus, it can be stated that, PS-PEI block copolymer reduces and stabilizes gold
salt (HAuCl4) in aqueous medium with different concentration of gold precursor. Thin
films were prepared by spin coating over pre-cleaning silicon wafer. Investigation of film
thickness was determined by ellipsometric spectroscopy which presents detectable
variation in film thickness relative to concentration of gold precursor. Au NPs
concentration in the film were also estimated by ellipsometry and showed a levelling off
with increase of salt concentration as shown in Table 4.10.
X-ray photoelectron spectroscopy (XPS)
XPS is a highly sensitive diagnostic method for the assessment of the chemical
state of elements. XPS was used to investigate the chemical state of the gold precursor in
the PS-PEI amphiphilic diblock copolymer by spectra monitoring of in-situ reduction
process of PS-b-PEI/Au NPs hybrid material thin film.
Figure 4.47: XPS wide spectrum of gold nanoparticles stabilized in block copolymer matrix G3.
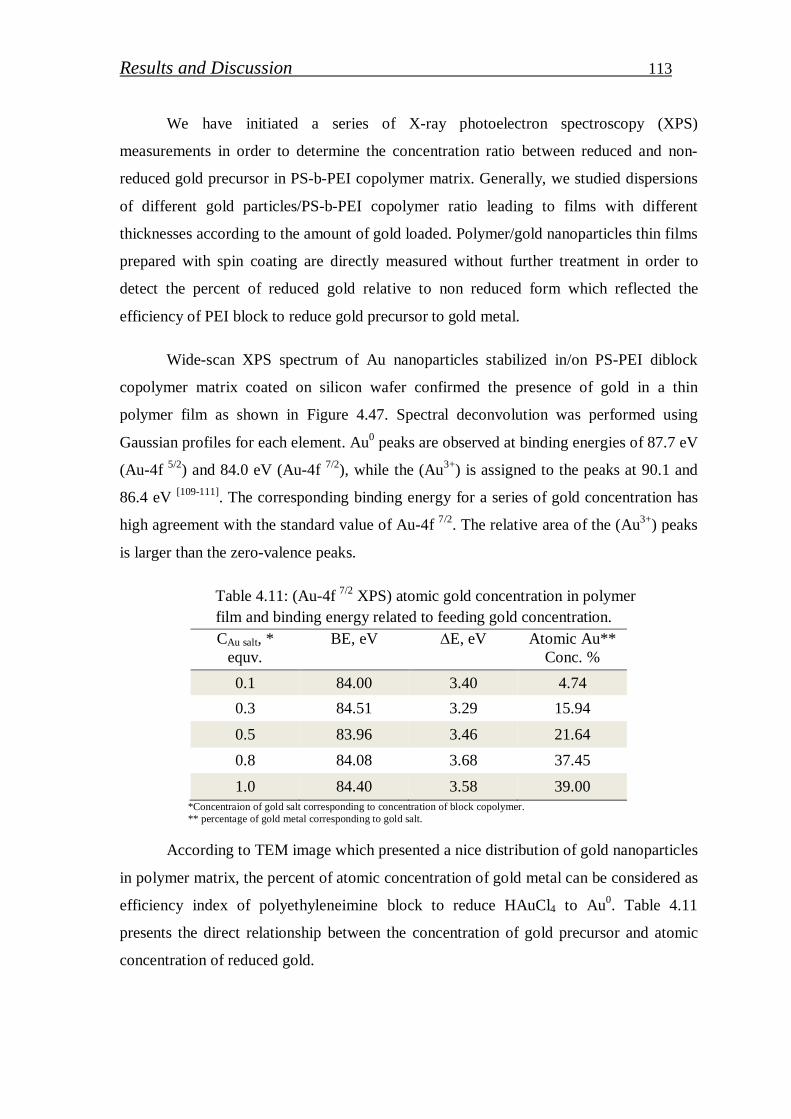
Results and Discussion 113
We have initiated a series of X-ray photoelectron spectroscopy (XPS)
measurements in order to determine the concentration ratio between reduced and non-
reduced gold precursor in PS-b-PEI copolymer matrix. Generally, we studied dispersions
of different gold particles/PS-b-PEI copolymer ratio leading to films with different
thicknesses according to the amount of gold loaded. Polymer/gold nanoparticles thin films
prepared with spin coating are directly measured without further treatment in order to
detect the percent of reduced gold relative to non reduced form which reflected the
efficiency of PEI block to reduce gold precursor to gold metal.
Wide-scan XPS spectrum of Au nanoparticles stabilized in/on PS-PEI diblock
copolymer matrix coated on silicon wafer confirmed the presence of gold in a thin
polymer film as shown in Figure 4.47. Spectral deconvolution was performed using
Gaussian profiles for each element. Au0 peaks are observed at binding energies of 87.7 eV
(Au-4f 5/2) and 84.0 eV (Au-4f 7/2), while the (Au3+) is assigned to the peaks at 90.1 and
86.4 eV [109-111]. The corresponding binding energy for a series of gold concentration has
high agreement with the standard value of Au-4f 7/2. The relative area of the (Au3+) peaks
is larger than the zero-valence peaks.
Table 4.11: (Au-4f 7/2 XPS) atomic gold concentration in polymer film and binding energy related to feeding gold concentration.
CAu salt, * equv.
BE, eV ∆E, eV Atomic Au** Conc. %
0.1 84.00 3.40 4.74 0.3 84.51 3.29 15.94 0.5 83.96 3.46 21.64 0.8 84.08 3.68 37.45 1.0 84.40 3.58 39.00
*Concentraion of gold salt corresponding to concentration of block copolymer. ** percentage of gold metal corresponding to gold salt.
According to TEM image which presented a nice distribution of gold nanoparticles
in polymer matrix, the percent of atomic concentration of gold metal can be considered as
efficiency index of polyethyleneimine block to reduce HAuCl4 to Au0. Table 4.11
presents the direct relationship between the concentration of gold precursor and atomic
concentration of reduced gold.
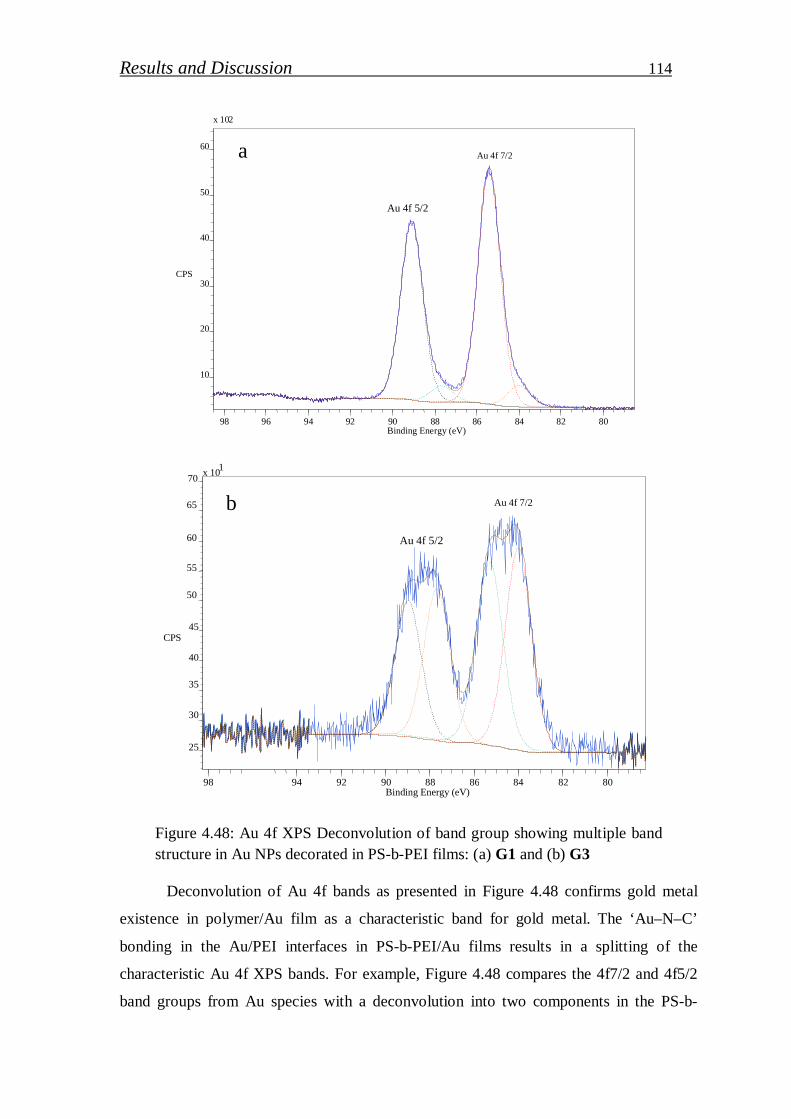
Results and Discussion 114
Au 4f 5/2
Au 4f 7/2
x 10 2
10
20
30
40
50
60
CPS
98 96 94 92 90 88 86 84 82 80 Binding Energy (eV)
Au 4f 5/2
Au 4f 7/2
x 10 1
25
30
35
40
45
50
55
60
65
70
CPS
98 94 92 90 88 86 84 82 80Binding Energy (eV)
Figure 4.48: Au 4f XPS Deconvolution of band group showing multiple band structure in Au NPs decorated in PS-b-PEI films: (a) G1 and (b) G3
Deconvolution of Au 4f bands as presented in Figure 4.48 confirms gold metal
existence in polymer/Au film as a characteristic band for gold metal. The ‘Au–N–C’
bonding in the Au/PEI interfaces in PS-b-PEI/Au films results in a splitting of the
characteristic Au 4f XPS bands. For example, Figure 4.48 compares the 4f7/2 and 4f5/2
band groups from Au species with a deconvolution into two components in the PS-b-
a
b
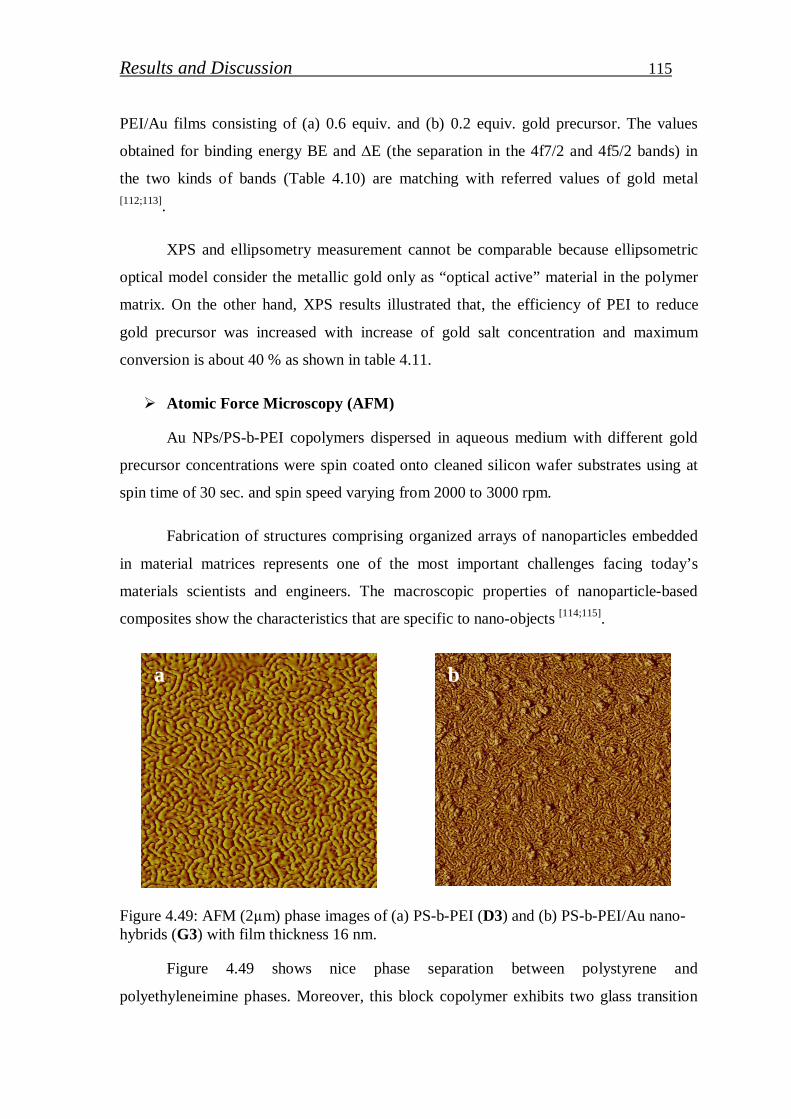
Results and Discussion 115
PEI/Au films consisting of (a) 0.6 equiv. and (b) 0.2 equiv. gold precursor. The values
obtained for binding energy BE and ∆E (the separation in the 4f7/2 and 4f5/2 bands) in
the two kinds of bands (Table 4.10) are matching with referred values of gold metal [112;113].
XPS and ellipsometry measurement cannot be comparable because ellipsometric
optical model consider the metallic gold only as “optical active” material in the polymer
matrix. On the other hand, XPS results illustrated that, the efficiency of PEI to reduce
gold precursor was increased with increase of gold salt concentration and maximum
conversion is about 40 % as shown in table 4.11.
Atomic Force Microscopy (AFM)
Au NPs/PS-b-PEI copolymers dispersed in aqueous medium with different gold
precursor concentrations were spin coated onto cleaned silicon wafer substrates using at
spin time of 30 sec. and spin speed varying from 2000 to 3000 rpm.
Fabrication of structures comprising organized arrays of nanoparticles embedded
in material matrices represents one of the most important challenges facing today’s
materials scientists and engineers. The macroscopic properties of nanoparticle-based
composites show the characteristics that are specific to nano-objects [114;115].
Figure 4.49: AFM (2µm) phase images of (a) PS-b-PEI (D3) and (b) PS-b-PEI/Au nano-hybrids (G3) with film thickness 16 nm.
Figure 4.49 shows nice phase separation between polystyrene and
polyethyleneimine phases. Moreover, this block copolymer exhibits two glass transition
a b
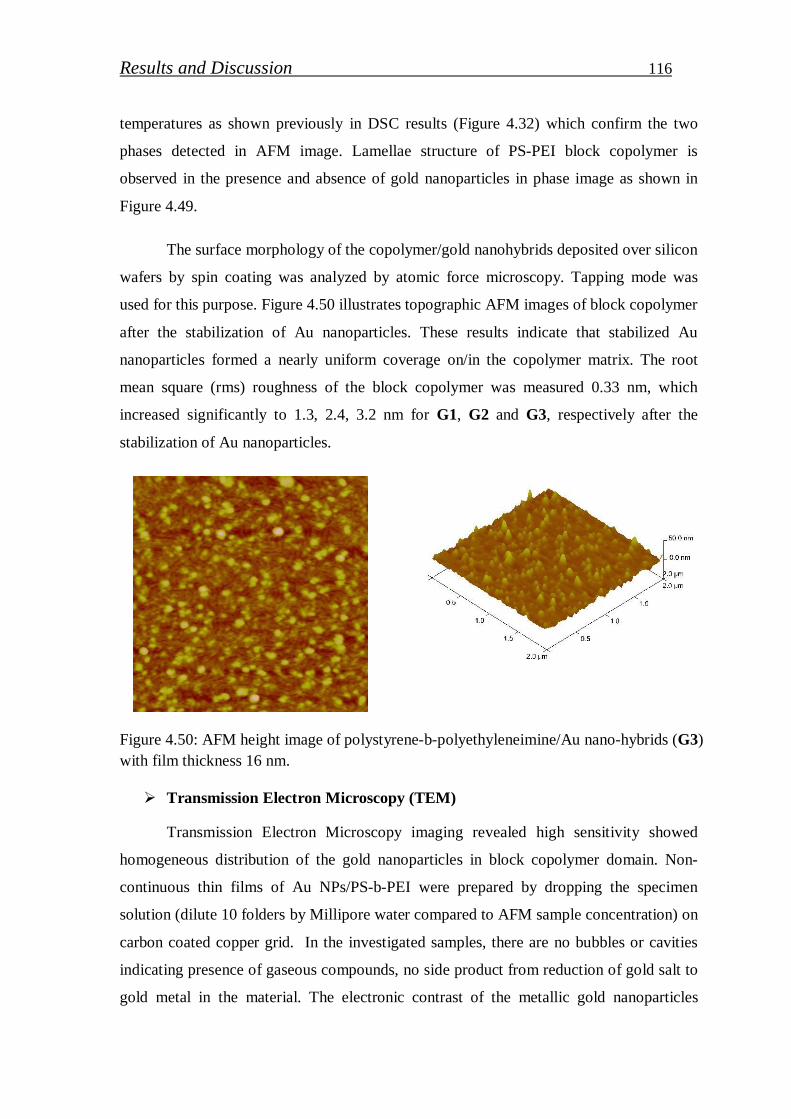
Results and Discussion 116
temperatures as shown previously in DSC results (Figure 4.32) which confirm the two
phases detected in AFM image. Lamellae structure of PS-PEI block copolymer is
observed in the presence and absence of gold nanoparticles in phase image as shown in
Figure 4.49.
The surface morphology of the copolymer/gold nanohybrids deposited over silicon
wafers by spin coating was analyzed by atomic force microscopy. Tapping mode was
used for this purpose. Figure 4.50 illustrates topographic AFM images of block copolymer
after the stabilization of Au nanoparticles. These results indicate that stabilized Au
nanoparticles formed a nearly uniform coverage on/in the copolymer matrix. The root
mean square (rms) roughness of the block copolymer was measured 0.33 nm, which
increased significantly to 1.3, 2.4, 3.2 nm for G1, G2 and G3, respectively after the
stabilization of Au nanoparticles.
Figure 4.50: AFM height image of polystyrene-b-polyethyleneimine/Au nano-hybrids (G3) with film thickness 16 nm.
Transmission Electron Microscopy (TEM)
Transmission Electron Microscopy imaging revealed high sensitivity showed
homogeneous distribution of the gold nanoparticles in block copolymer domain. Non-
continuous thin films of Au NPs/PS-b-PEI were prepared by dropping the specimen
solution (dilute 10 folders by Millipore water compared to AFM sample concentration) on
carbon coated copper grid. In the investigated samples, there are no bubbles or cavities
indicating presence of gaseous compounds, no side product from reduction of gold salt to
gold metal in the material. The electronic contrast of the metallic gold nanoparticles
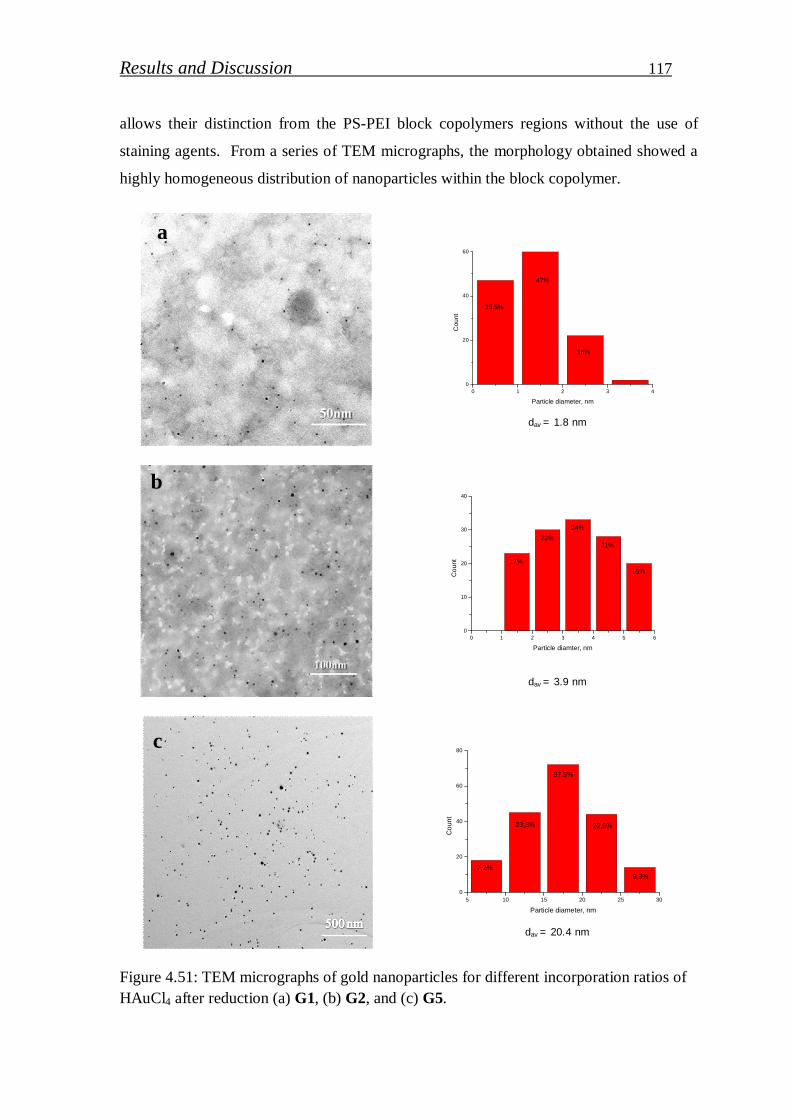
Results and Discussion 117
allows their distinction from the PS-PEI block copolymers regions without the use of
staining agents. From a series of TEM micrographs, the morphology obtained showed a
highly homogeneous distribution of nanoparticles within the block copolymer.
0 1 2 3 40
20
40
60
Cou
nt
Particle diameter, nm
35.5%
47%
16%
dav = 1.8 nm
0 1 2 3 4 5 60
10
20
30
40
17%
21%
Co
unt
Particle diamter, nm
15%
23%
24%
dav = 3.9 nm
5 10 15 20 25 300
20
40
60
80
Co
unt
Particle diameter, nm
7,2%
23,3%
37.3%
22,8%
9,3%
dav = 20.4 nm
Figure 4.51: TEM micrographs of gold nanoparticles for different incorporation ratios of HAuCl4 after reduction (a) G1, (b) G2, and (c) G5.
a
b
c
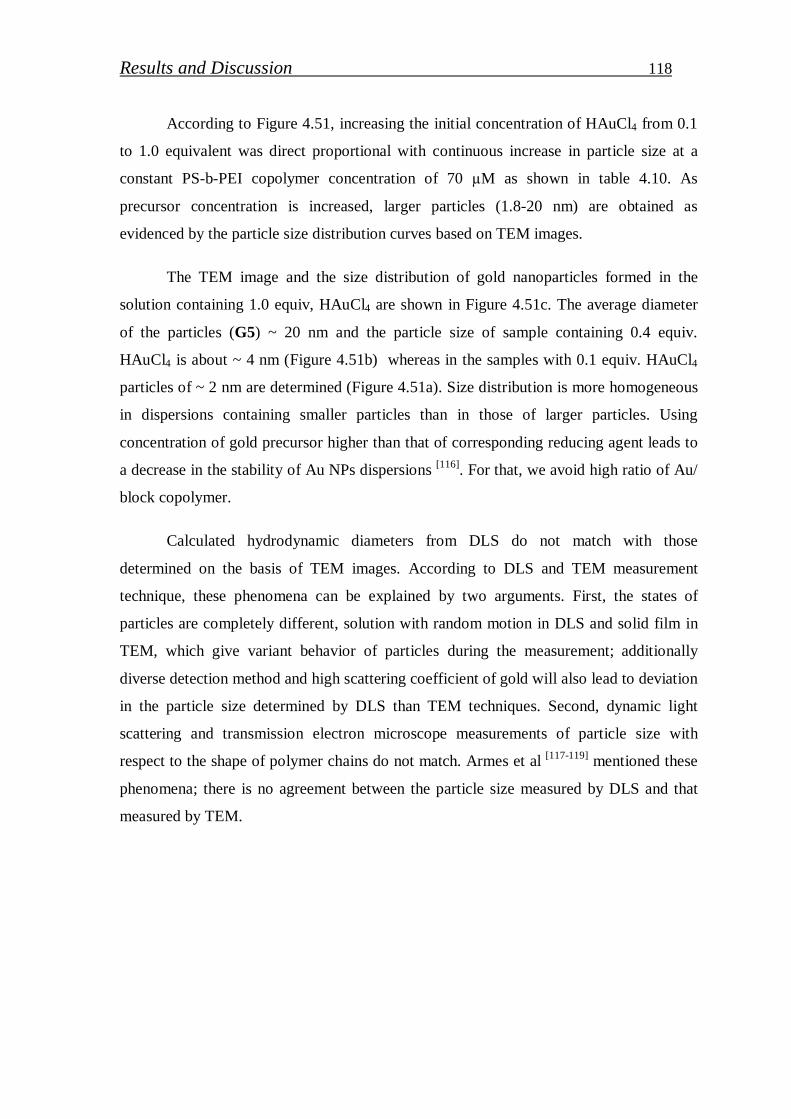
Results and Discussion 118
According to Figure 4.51, increasing the initial concentration of HAuCl4 from 0.1
to 1.0 equivalent was direct proportional with continuous increase in particle size at a
constant PS-b-PEI copolymer concentration of 70 µM as shown in table 4.10. As
precursor concentration is increased, larger particles (1.8-20 nm) are obtained as
evidenced by the particle size distribution curves based on TEM images.
The TEM image and the size distribution of gold nanoparticles formed in the
solution containing 1.0 equiv, HAuCl4 are shown in Figure 4.51c. The average diameter
of the particles (G5) ~ 20 nm and the particle size of sample containing 0.4 equiv.
HAuCl4 is about ~ 4 nm (Figure 4.51b) whereas in the samples with 0.1 equiv. HAuCl4
particles of ~ 2 nm are determined (Figure 4.51a). Size distribution is more homogeneous
in dispersions containing smaller particles than in those of larger particles. Using
concentration of gold precursor higher than that of corresponding reducing agent leads to
a decrease in the stability of Au NPs dispersions [116]. For that, we avoid high ratio of Au/
block copolymer.
Calculated hydrodynamic diameters from DLS do not match with those
determined on the basis of TEM images. According to DLS and TEM measurement
technique, these phenomena can be explained by two arguments. First, the states of
particles are completely different, solution with random motion in DLS and solid film in
TEM, which give variant behavior of particles during the measurement; additionally
diverse detection method and high scattering coefficient of gold will also lead to deviation
in the particle size determined by DLS than TEM techniques. Second, dynamic light
scattering and transmission electron microscope measurements of particle size with
respect to the shape of polymer chains do not match. Armes et al [117-119] mentioned these
phenomena; there is no agreement between the particle size measured by DLS and that
measured by TEM.
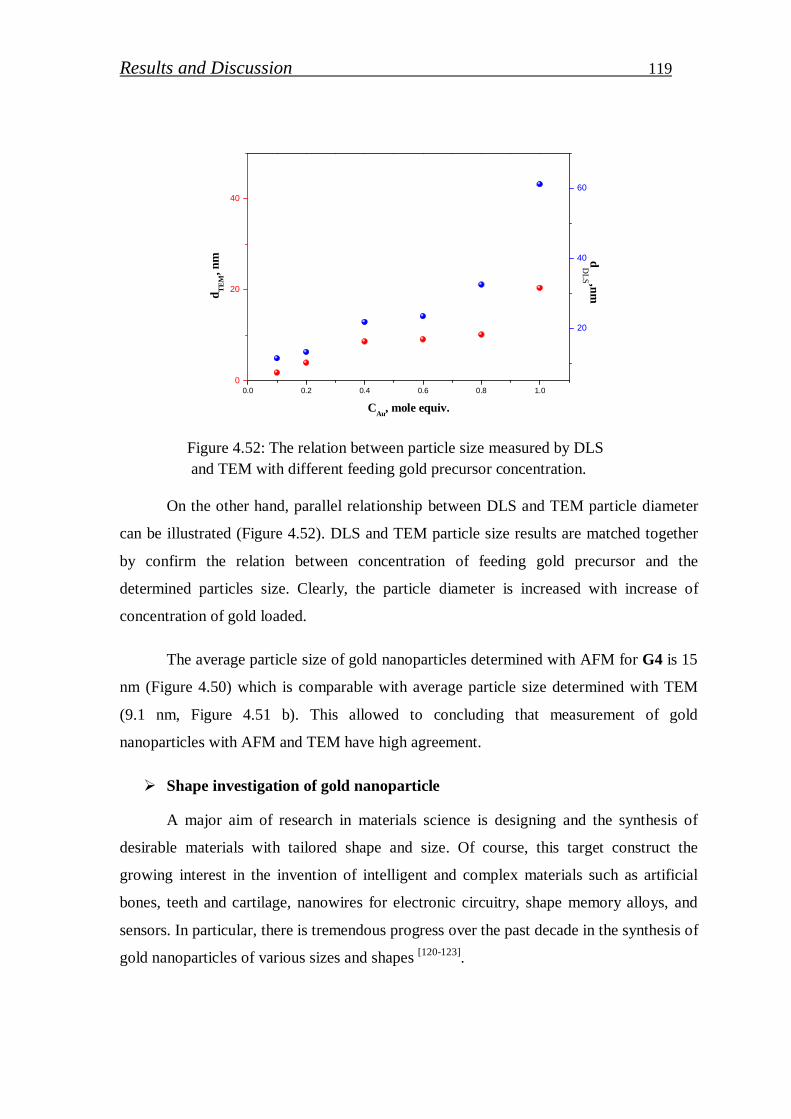
Results and Discussion 119
0.0 0.2 0.4 0.6 0.8 1.00
20
40
CAu, mole equiv.
d TEM
, nm
20
40
60d
DLS ,nm
Figure 4.52: The relation between particle size measured by DLS and TEM with different feeding gold precursor concentration.
On the other hand, parallel relationship between DLS and TEM particle diameter
can be illustrated (Figure 4.52). DLS and TEM particle size results are matched together
by confirm the relation between concentration of feeding gold precursor and the
determined particles size. Clearly, the particle diameter is increased with increase of
concentration of gold loaded.
The average particle size of gold nanoparticles determined with AFM for G4 is 15
nm (Figure 4.50) which is comparable with average particle size determined with TEM
(9.1 nm, Figure 4.51 b). This allowed to concluding that measurement of gold
nanoparticles with AFM and TEM have high agreement.
Shape investigation of gold nanoparticle
A major aim of research in materials science is designing and the synthesis of
desirable materials with tailored shape and size. Of course, this target construct the
growing interest in the invention of intelligent and complex materials such as artificial
bones, teeth and cartilage, nanowires for electronic circuitry, shape memory alloys, and
sensors. In particular, there is tremendous progress over the past decade in the synthesis of
gold nanoparticles of various sizes and shapes [120-123].
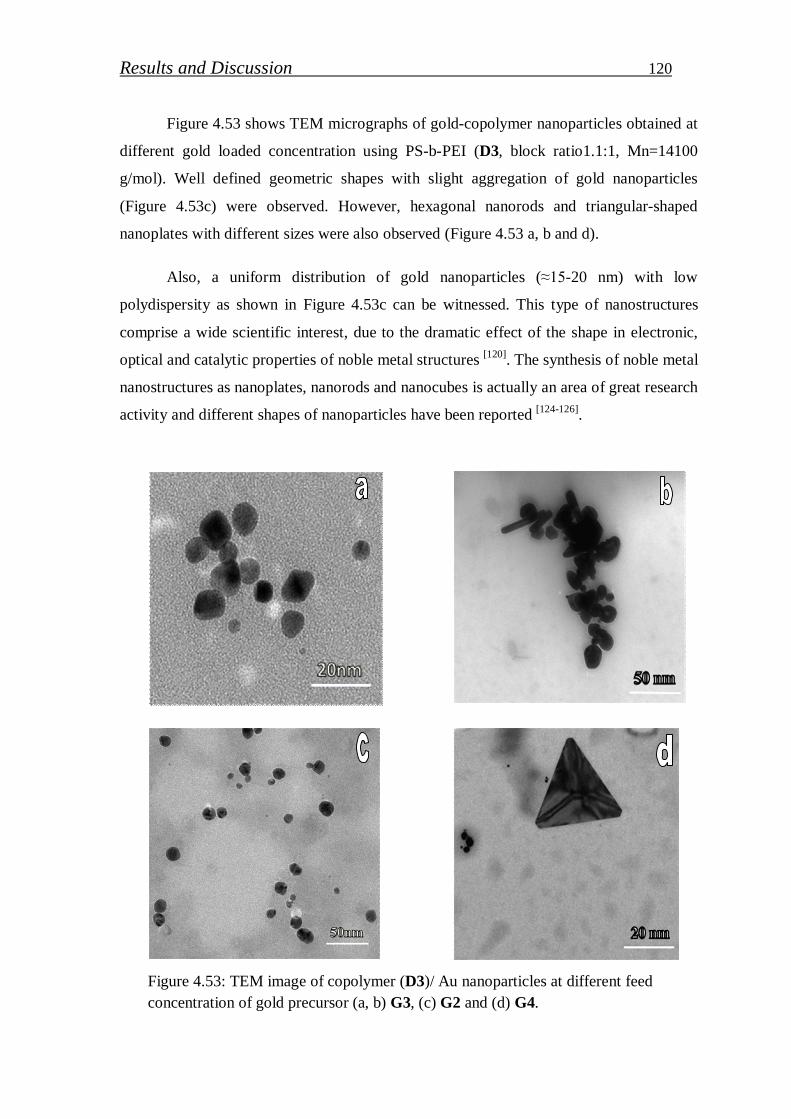
Results and Discussion 120
Figure 4.53 shows TEM micrographs of gold-copolymer nanoparticles obtained at
different gold loaded concentration using PS-b-PEI (D3, block ratio1.1:1, Mn=14100
g/mol). Well defined geometric shapes with slight aggregation of gold nanoparticles
(Figure 4.53c) were observed. However, hexagonal nanorods and triangular-shaped
nanoplates with different sizes were also observed (Figure 4.53 a, b and d).
Also, a uniform distribution of gold nanoparticles (≈15-20 nm) with low
polydispersity as shown in Figure 4.53c can be witnessed. This type of nanostructures
comprise a wide scientific interest, due to the dramatic effect of the shape in electronic,
optical and catalytic properties of noble metal structures [120]. The synthesis of noble metal
nanostructures as nanoplates, nanorods and nanocubes is actually an area of great research
activity and different shapes of nanoparticles have been reported [124-126].
Figure 4.53: TEM image of copolymer (D3)/ Au nanoparticles at different feed concentration of gold precursor (a, b) G3, (c) G2 and (d) G4.
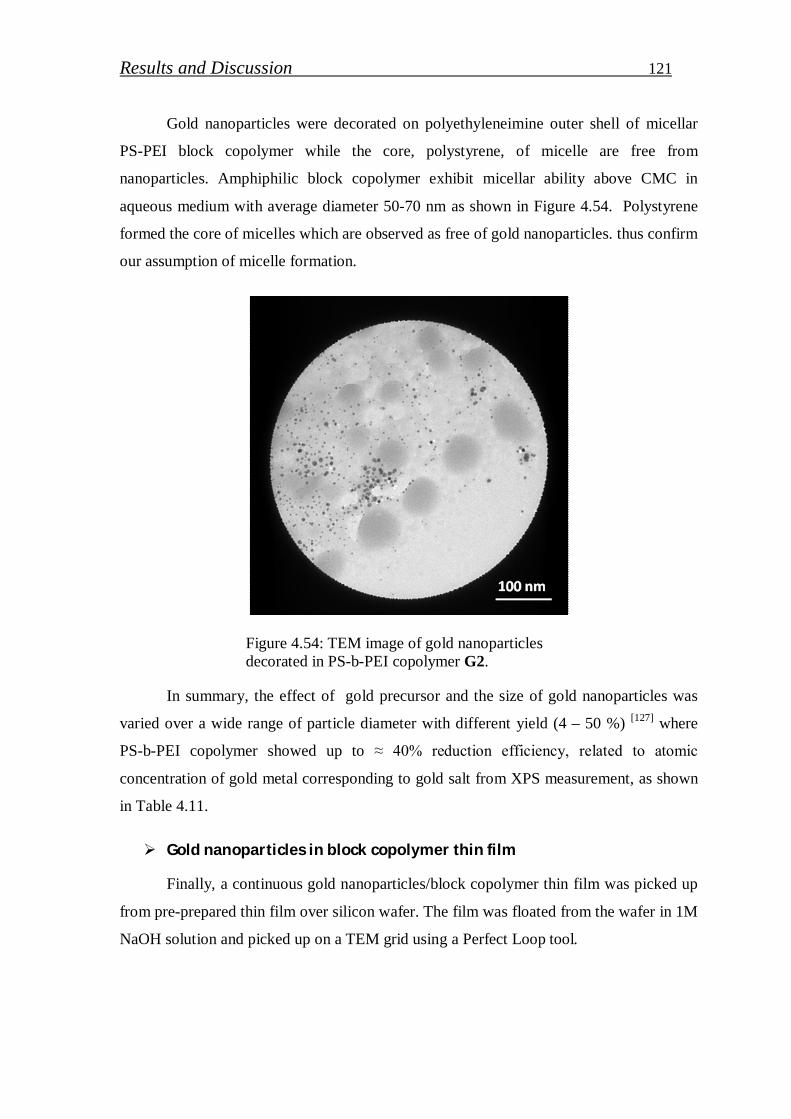
Results and Discussion 121
Gold nanoparticles were decorated on polyethyleneimine outer shell of micellar
PS-PEI block copolymer while the core, polystyrene, of micelle are free from
nanoparticles. Amphiphilic block copolymer exhibit micellar ability above CMC in
aqueous medium with average diameter 50-70 nm as shown in Figure 4.54. Polystyrene
formed the core of micelles which are observed as free of gold nanoparticles. thus confirm
our assumption of micelle formation.
Figure 4.54: TEM image of gold nanoparticles decorated in PS-b-PEI copolymer G2.
In summary, the effect of gold precursor and the size of gold nanoparticles was
varied over a wide range of particle diameter with different yield (4 – 50 %) [127] where
PS-b-PEI copolymer showed up to ≈ 40% reduction efficiency, related to atomic
concentration of gold metal corresponding to gold salt from XPS measurement, as shown
in Table 4.11.
Gold nanoparticles in block copolymer thin film
Finally, a continuous gold nanoparticles/block copolymer thin film was picked up
from pre-prepared thin film over silicon wafer. The film was floated from the wafer in 1M
NaOH solution and picked up on a TEM grid using a Perfect Loop tool.
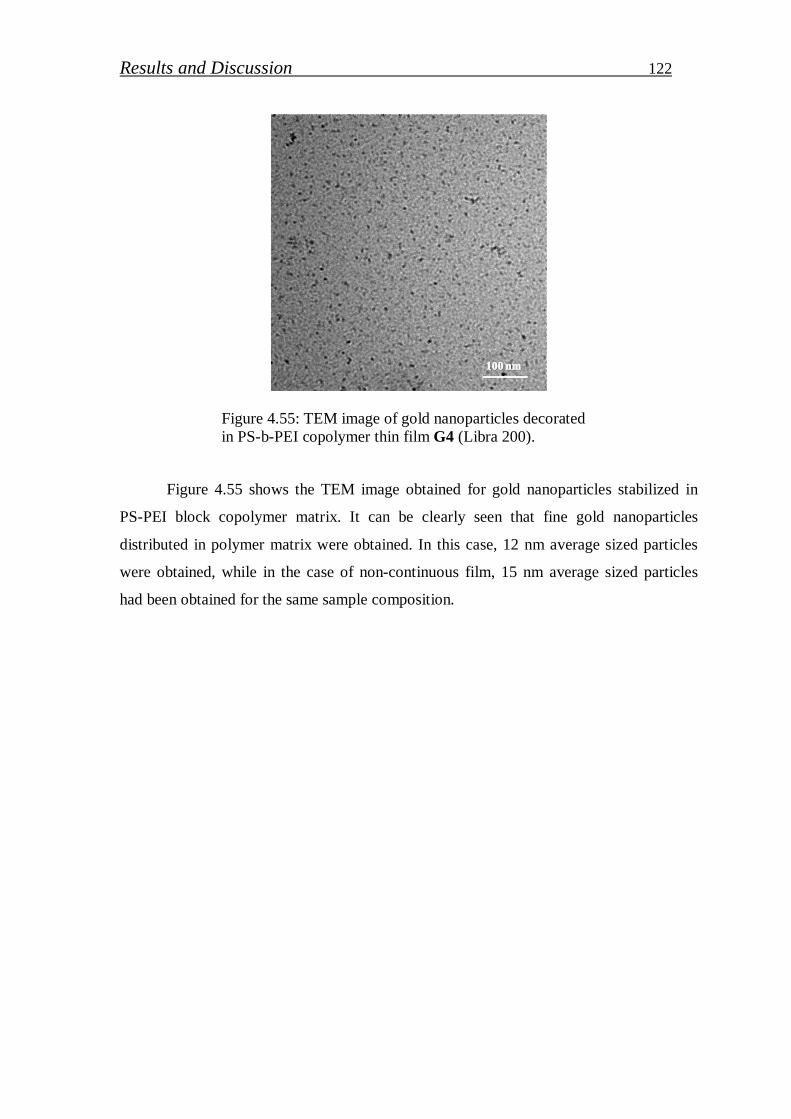
Results and Discussion 122
Figure 4.55: TEM image of gold nanoparticles decorated in PS-b-PEI copolymer thin film G4 (Libra 200).
Figure 4.55 shows the TEM image obtained for gold nanoparticles stabilized in
PS-PEI block copolymer matrix. It can be clearly seen that fine gold nanoparticles
distributed in polymer matrix were obtained. In this case, 12 nm average sized particles
were obtained, while in the case of non-continuous film, 15 nm average sized particles
had been obtained for the same sample composition.
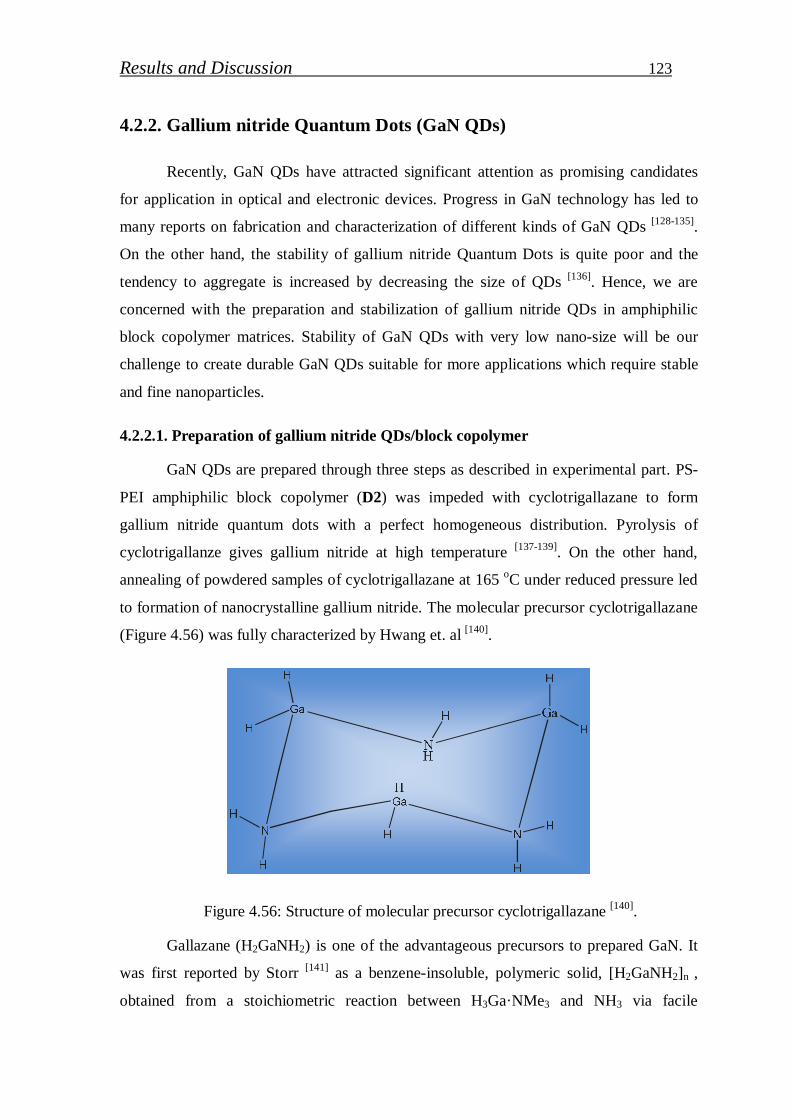
Results and Discussion 123
4.2.2. Gallium nitride Quantum Dots (GaN QDs)
Recently, GaN QDs have attracted significant attention as promising candidates
for application in optical and electronic devices. Progress in GaN technology has led to
many reports on fabrication and characterization of different kinds of GaN QDs [128-135].
On the other hand, the stability of gallium nitride Quantum Dots is quite poor and the
tendency to aggregate is increased by decreasing the size of QDs [136]. Hence, we are
concerned with the preparation and stabilization of gallium nitride QDs in amphiphilic
block copolymer matrices. Stability of GaN QDs with very low nano-size will be our
challenge to create durable GaN QDs suitable for more applications which require stable
and fine nanoparticles.
4.2.2.1. Preparation of gallium nitride QDs/block copolymer
GaN QDs are prepared through three steps as described in experimental part. PS-
PEI amphiphilic block copolymer (D2) was impeded with cyclotrigallazane to form
gallium nitride quantum dots with a perfect homogeneous distribution. Pyrolysis of
cyclotrigallanze gives gallium nitride at high temperature [137-139]. On the other hand,
annealing of powdered samples of cyclotrigallazane at 165 oC under reduced pressure led
to formation of nanocrystalline gallium nitride. The molecular precursor cyclotrigallazane
(Figure 4.56) was fully characterized by Hwang et. al [140].
Figure 4.56: Structure of molecular precursor cyclotrigallazane [140].
Gallazane (H2GaNH2) is one of the advantageous precursors to prepared GaN. It
was first reported by Storr [141] as a benzene-insoluble, polymeric solid, [H2GaNH2]n ,
obtained from a stoichiometric reaction between H3Ga·NMe3 and NH3 via facile
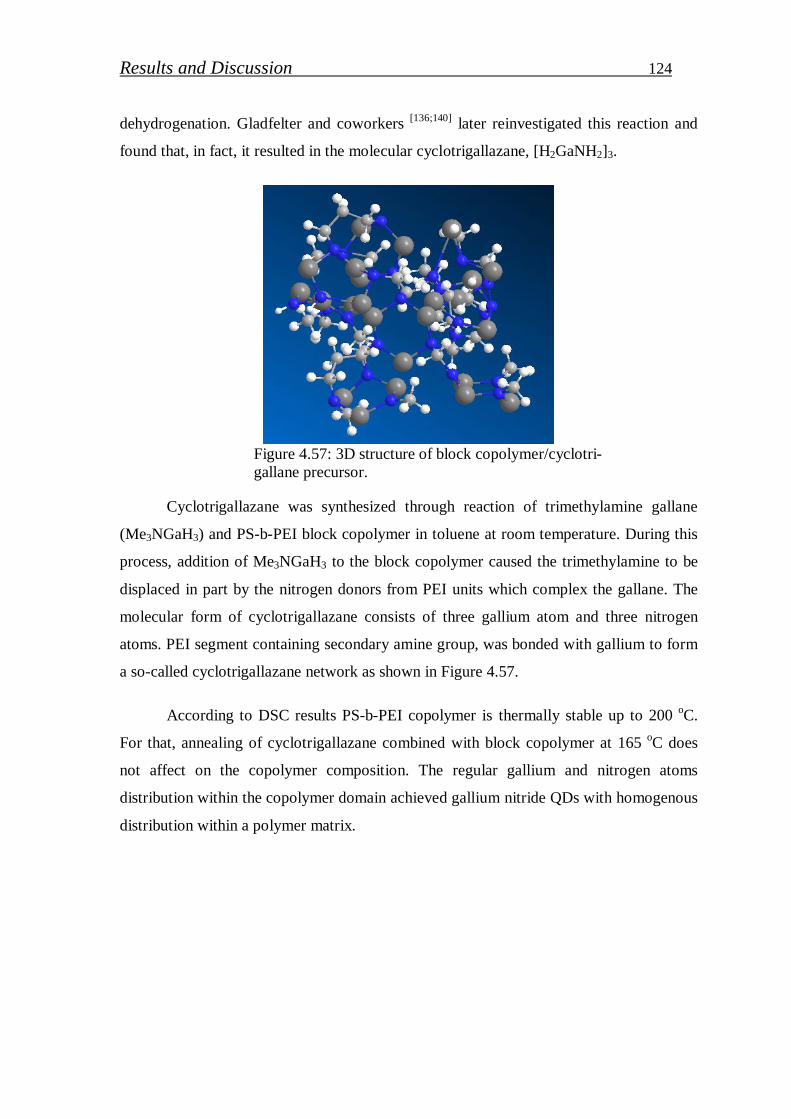
Results and Discussion 124
dehydrogenation. Gladfelter and coworkers [136;140] later reinvestigated this reaction and
found that, in fact, it resulted in the molecular cyclotrigallazane, [H2GaNH2]3.
Figure 4.57: 3D structure of block copolymer/cyclotri- gallane precursor.
Cyclotrigallazane was synthesized through reaction of trimethylamine gallane
(Me3NGaH3) and PS-b-PEI block copolymer in toluene at room temperature. During this
process, addition of Me3NGaH3 to the block copolymer caused the trimethylamine to be
displaced in part by the nitrogen donors from PEI units which complex the gallane. The
molecular form of cyclotrigallazane consists of three gallium atom and three nitrogen
atoms. PEI segment containing secondary amine group, was bonded with gallium to form
a so-called cyclotrigallazane network as shown in Figure 4.57.
According to DSC results PS-b-PEI copolymer is thermally stable up to 200 oC.
For that, annealing of cyclotrigallazane combined with block copolymer at 165 oC does
not affect on the copolymer composition. The regular gallium and nitrogen atoms
distribution within the copolymer domain achieved gallium nitride QDs with homogenous
distribution within a polymer matrix.
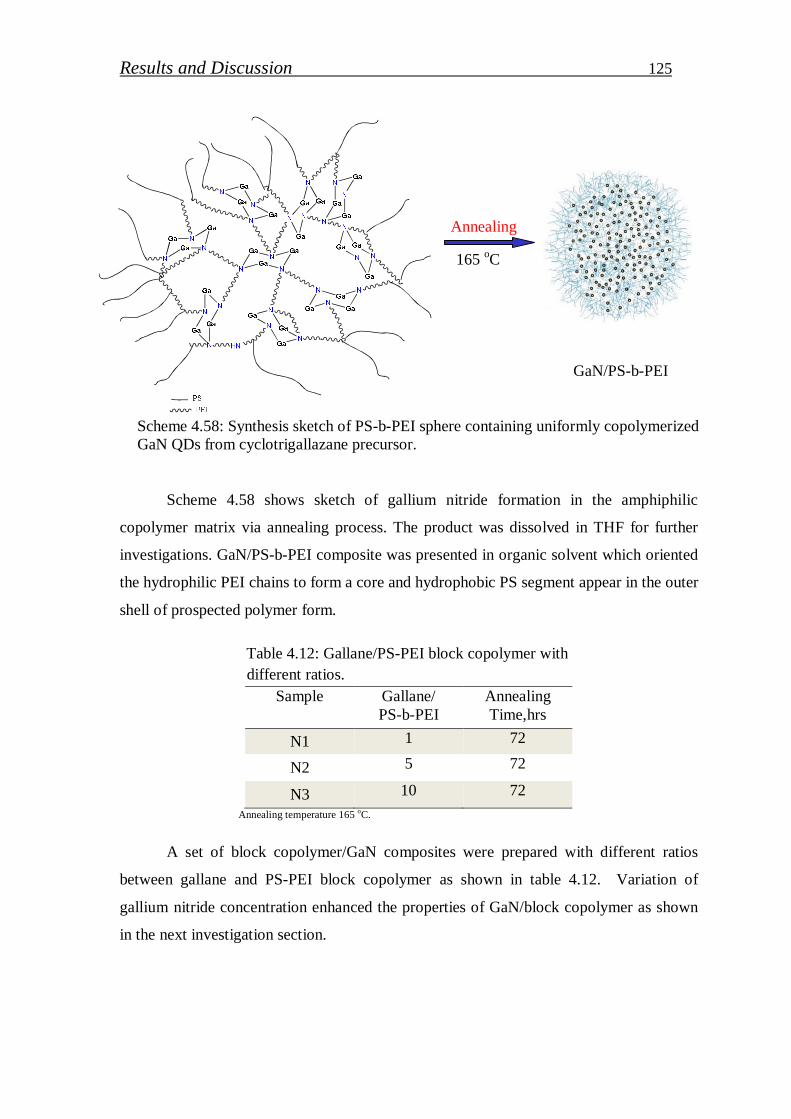
Results and Discussion 125
GaN/PS-b-PEI
Scheme 4.58: Synthesis sketch of PS-b-PEI sphere containing uniformly copolymerized GaN QDs from cyclotrigallazane precursor.
Scheme 4.58 shows sketch of gallium nitride formation in the amphiphilic
copolymer matrix via annealing process. The product was dissolved in THF for further
investigations. GaN/PS-b-PEI composite was presented in organic solvent which oriented
the hydrophilic PEI chains to form a core and hydrophobic PS segment appear in the outer
shell of prospected polymer form.
Table 4.12: Gallane/PS-PEI block copolymer with different ratios.
Sample Gallane/ PS-b-PEI
Annealing Time,hrs
N1 1 72
N2 5 72
N3 10 72 Annealing temperature 165 oC.
A set of block copolymer/GaN composites were prepared with different ratios
between gallane and PS-PEI block copolymer as shown in table 4.12. Variation of
gallium nitride concentration enhanced the properties of GaN/block copolymer as shown
in the next investigation section.
Annealing
165 oC
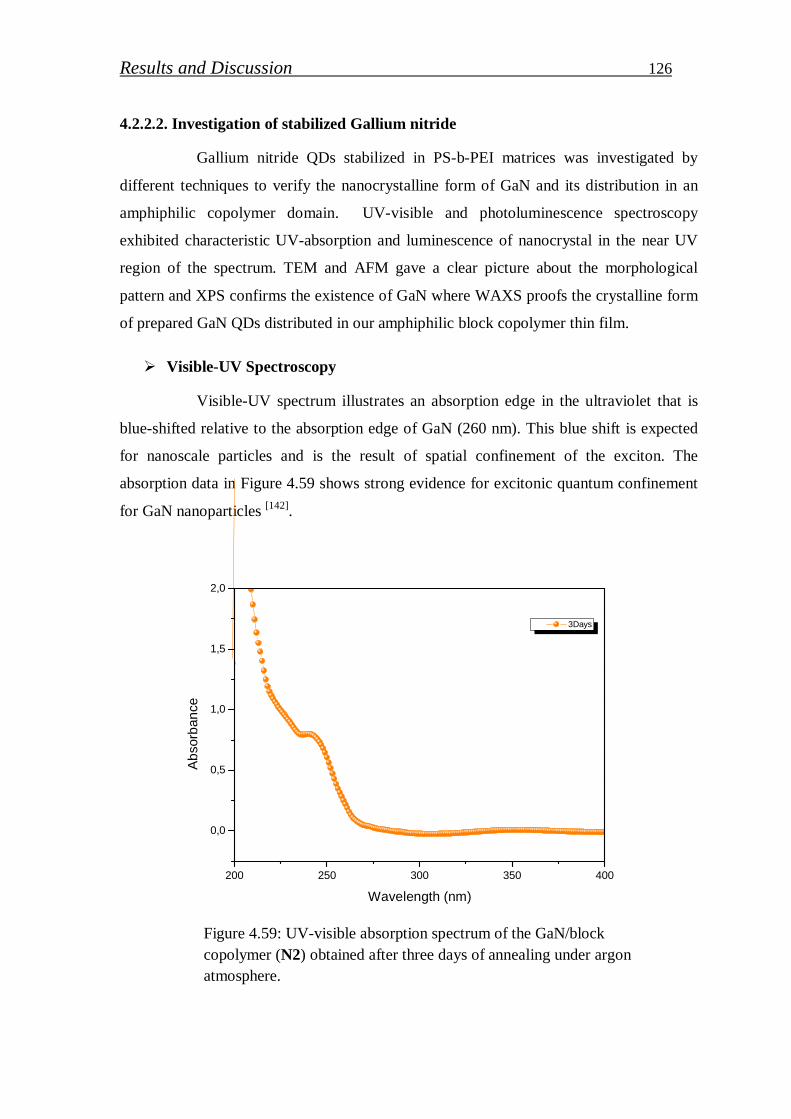
Results and Discussion 126
4.2.2.2. Investigation of stabilized Gallium nitride
Gallium nitride QDs stabilized in PS-b-PEI matrices was investigated by
different techniques to verify the nanocrystalline form of GaN and its distribution in an
amphiphilic copolymer domain. UV-visible and photoluminescence spectroscopy
exhibited characteristic UV-absorption and luminescence of nanocrystal in the near UV
region of the spectrum. TEM and AFM gave a clear picture about the morphological
pattern and XPS confirms the existence of GaN where WAXS proofs the crystalline form
of prepared GaN QDs distributed in our amphiphilic block copolymer thin film.
Visible-UV Spectroscopy
Visible-UV spectrum illustrates an absorption edge in the ultraviolet that is
blue-shifted relative to the absorption edge of GaN (260 nm). This blue shift is expected
for nanoscale particles and is the result of spatial confinement of the exciton. The
absorption data in Figure 4.59 shows strong evidence for excitonic quantum confinement
for GaN nanoparticles [142].
200 250 300 350 400
0,0
0,5
1,0
1,5
2,0
3Days
Wavelength (nm)
Ab
sorb
ance
Figure 4.59: UV-visible absorption spectrum of the GaN/block copolymer (N2) obtained after three days of annealing under argon atmosphere.
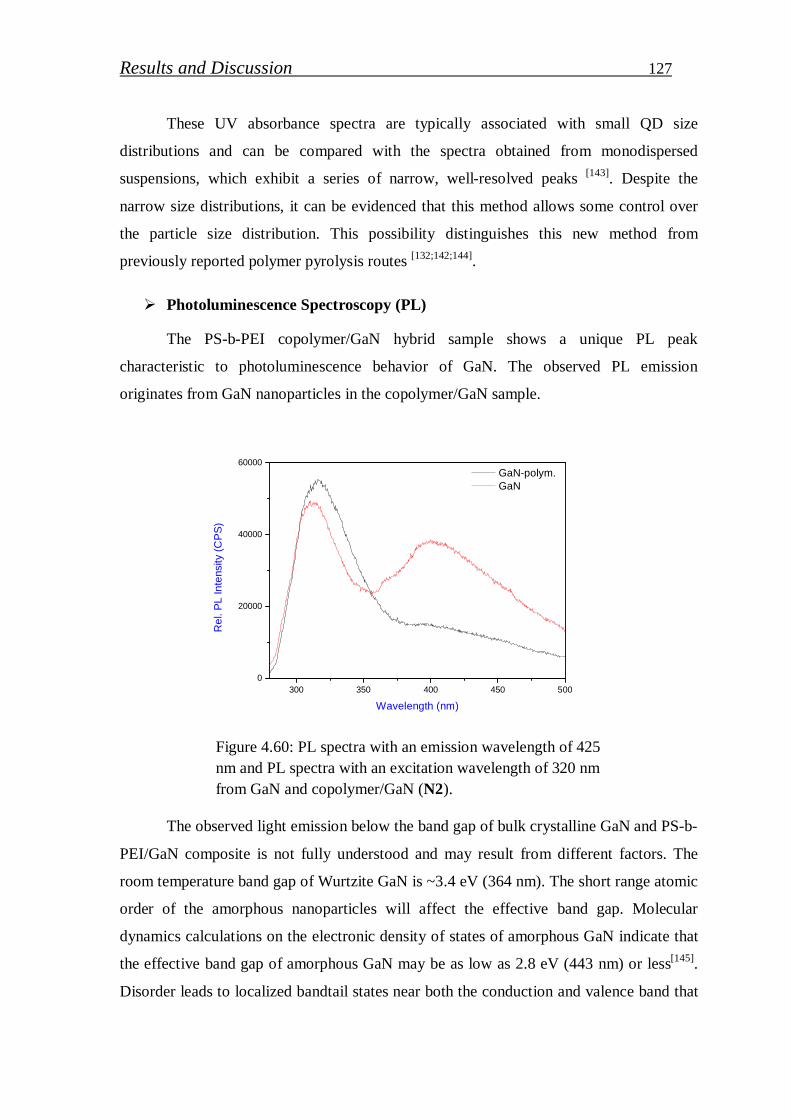
Results and Discussion 127
These UV absorbance spectra are typically associated with small QD size
distributions and can be compared with the spectra obtained from monodispersed
suspensions, which exhibit a series of narrow, well-resolved peaks [143]. Despite the
narrow size distributions, it can be evidenced that this method allows some control over
the particle size distribution. This possibility distinguishes this new method from
previously reported polymer pyrolysis routes [132;142;144].
Photoluminescence Spectroscopy (PL)
The PS-b-PEI copolymer/GaN hybrid sample shows a unique PL peak
characteristic to photoluminescence behavior of GaN. The observed PL emission
originates from GaN nanoparticles in the copolymer/GaN sample.
300 350 400 450 5000
20000
40000
60000
Re
l. P
L In
tens
ity (
CP
S)
Wavelength (nm)
GaN-polym. GaN
Figure 4.60: PL spectra with an emission wavelength of 425 nm and PL spectra with an excitation wavelength of 320 nm from GaN and copolymer/GaN (N2).
The observed light emission below the band gap of bulk crystalline GaN and PS-b-
PEI/GaN composite is not fully understood and may result from different factors. The
room temperature band gap of Wurtzite GaN is ~3.4 eV (364 nm). The short range atomic
order of the amorphous nanoparticles will affect the effective band gap. Molecular
dynamics calculations on the electronic density of states of amorphous GaN indicate that
the effective band gap of amorphous GaN may be as low as 2.8 eV (443 nm) or less[145].
Disorder leads to localized bandtail states near both the conduction and valence band that
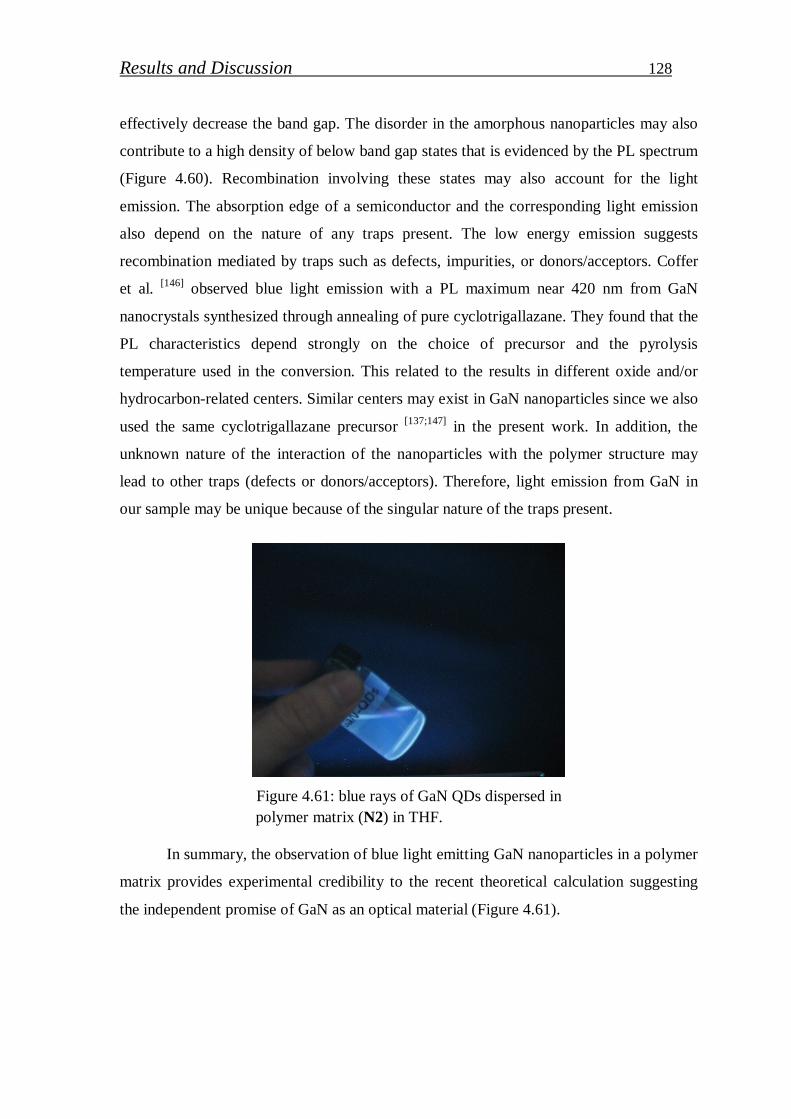
Results and Discussion 128
effectively decrease the band gap. The disorder in the amorphous nanoparticles may also
contribute to a high density of below band gap states that is evidenced by the PL spectrum
(Figure 4.60). Recombination involving these states may also account for the light
emission. The absorption edge of a semiconductor and the corresponding light emission
also depend on the nature of any traps present. The low energy emission suggests
recombination mediated by traps such as defects, impurities, or donors/acceptors. Coffer
et al. [146] observed blue light emission with a PL maximum near 420 nm from GaN
nanocrystals synthesized through annealing of pure cyclotrigallazane. They found that the
PL characteristics depend strongly on the choice of precursor and the pyrolysis
temperature used in the conversion. This related to the results in different oxide and/or
hydrocarbon-related centers. Similar centers may exist in GaN nanoparticles since we also
used the same cyclotrigallazane precursor [137;147] in the present work. In addition, the
unknown nature of the interaction of the nanoparticles with the polymer structure may
lead to other traps (defects or donors/acceptors). Therefore, light emission from GaN in
our sample may be unique because of the singular nature of the traps present.
Figure 4.61: blue rays of GaN QDs dispersed in
polymer matrix (N2) in THF.
In summary, the observation of blue light emitting GaN nanoparticles in a polymer
matrix provides experimental credibility to the recent theoretical calculation suggesting
the independent promise of GaN as an optical material (Figure 4.61).
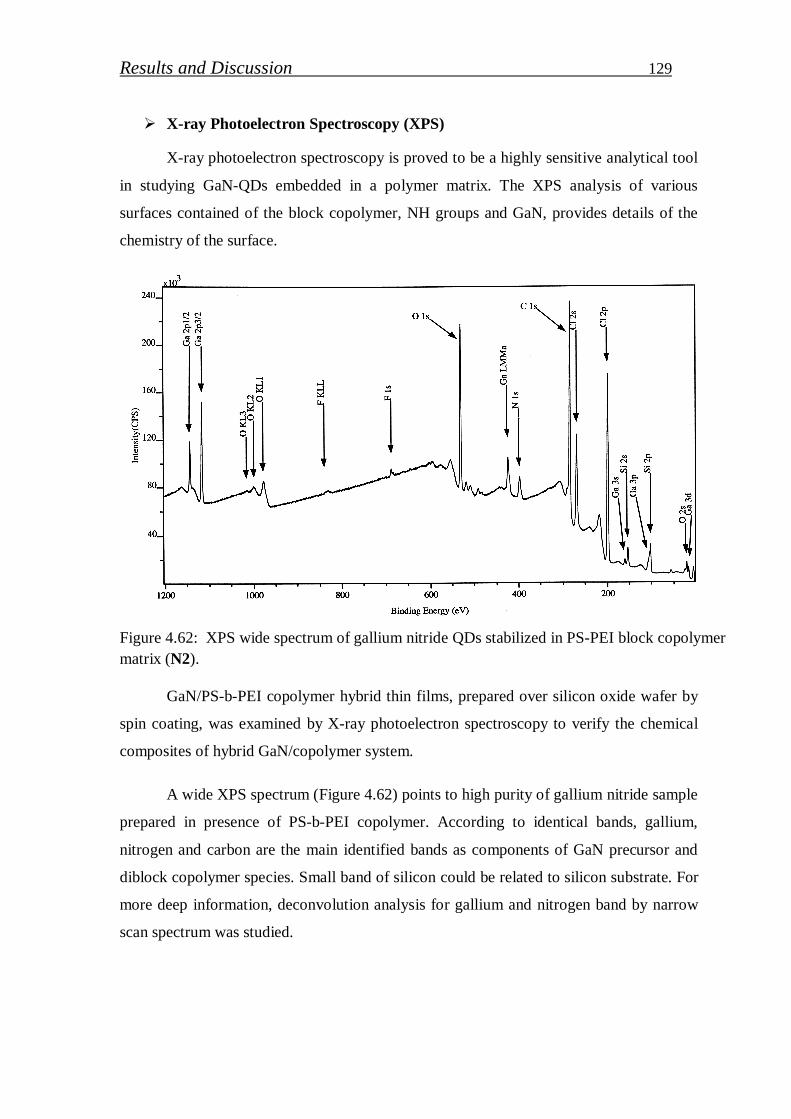
Results and Discussion 129
X-ray Photoelectron Spectroscopy (XPS)
X-ray photoelectron spectroscopy is proved to be a highly sensitive analytical tool
in studying GaN-QDs embedded in a polymer matrix. The XPS analysis of various
surfaces contained of the block copolymer, NH groups and GaN, provides details of the
chemistry of the surface.
Figure 4.62: XPS wide spectrum of gallium nitride QDs stabilized in PS-PEI block copolymer matrix (N2).
GaN/PS-b-PEI copolymer hybrid thin films, prepared over silicon oxide wafer by
spin coating, was examined by X-ray photoelectron spectroscopy to verify the chemical
composites of hybrid GaN/copolymer system.
A wide XPS spectrum (Figure 4.62) points to high purity of gallium nitride sample
prepared in presence of PS-b-PEI copolymer. According to identical bands, gallium,
nitrogen and carbon are the main identified bands as components of GaN precursor and
diblock copolymer species. Small band of silicon could be related to silicon substrate. For
more deep information, deconvolution analysis for gallium and nitrogen band by narrow
scan spectrum was studied.
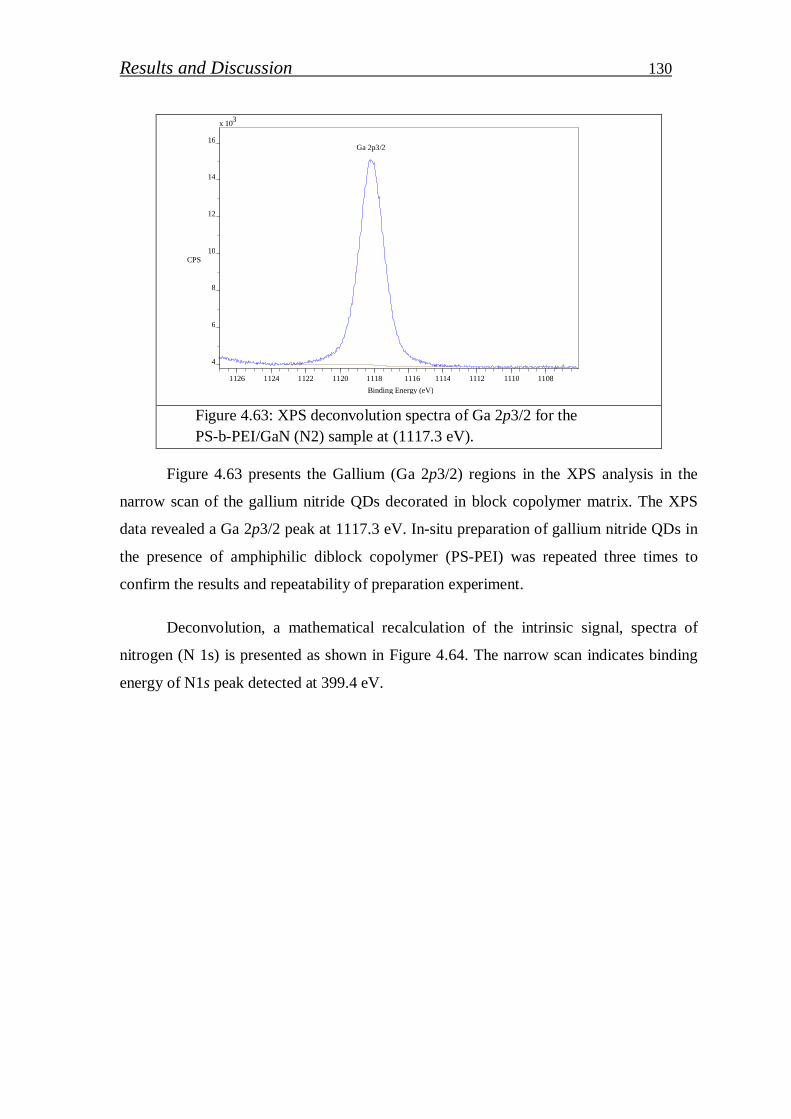
Results and Discussion 130
Ga 2p3/2
x 10 3
4
6
8
10
12
14
16
CPS
1126 1124 1122 1120 1118 1116 1114 1112 1110 1108 Binding Energy (eV)
Figure 4.63: XPS deconvolution spectra of Ga 2p3/2 for the PS-b-PEI/GaN (N2) sample at (1117.3 eV).
Figure 4.63 presents the Gallium (Ga 2p3/2) regions in the XPS analysis in the
narrow scan of the gallium nitride QDs decorated in block copolymer matrix. The XPS
data revealed a Ga 2p3/2 peak at 1117.3 eV. In-situ preparation of gallium nitride QDs in
the presence of amphiphilic diblock copolymer (PS-PEI) was repeated three times to
confirm the results and repeatability of preparation experiment.
Deconvolution, a mathematical recalculation of the intrinsic signal, spectra of
nitrogen (N 1s) is presented as shown in Figure 4.64. The narrow scan indicates binding
energy of N1s peak detected at 399.4 eV.
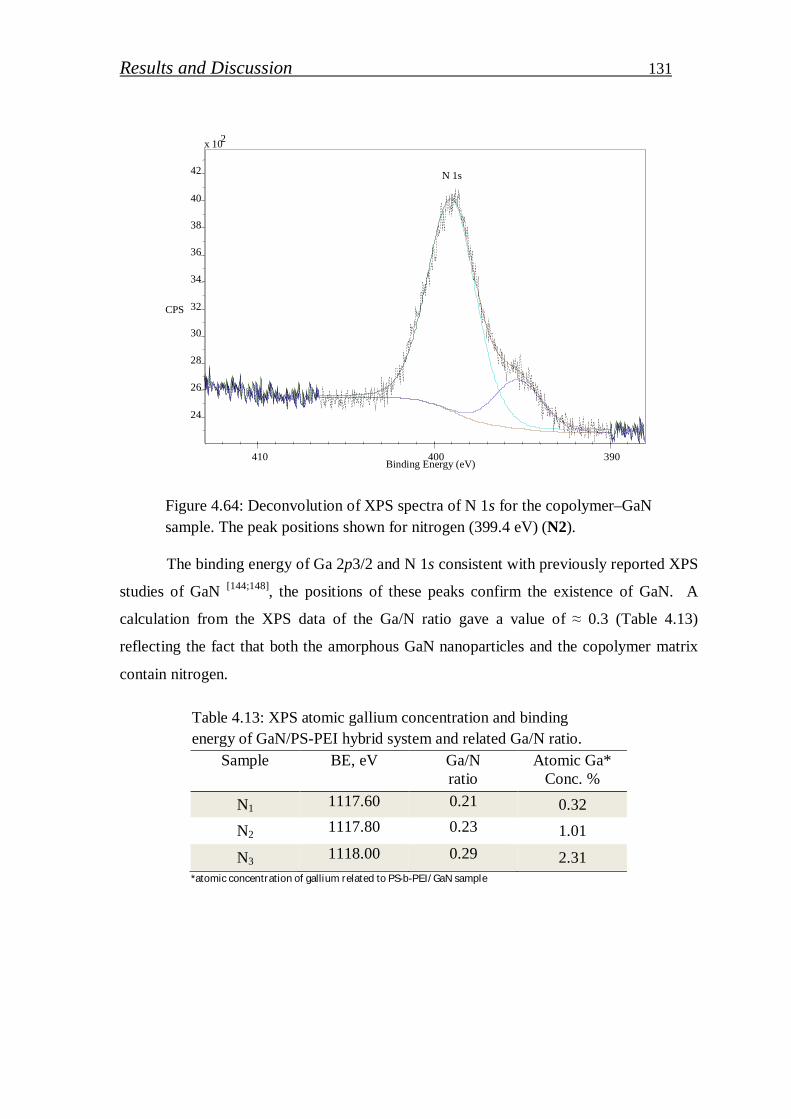
Results and Discussion 131
Figure 4.64: Deconvolution of XPS spectra of N 1s for the copolymer–GaN sample. The peak positions shown for nitrogen (399.4 eV) (N2).
The binding energy of Ga 2p3/2 and N 1s consistent with previously reported XPS
studies of GaN [144;148], the positions of these peaks confirm the existence of GaN. A
calculation from the XPS data of the Ga/N ratio gave a value of ≈ 0.3 (Table 4.13)
reflecting the fact that both the amorphous GaN nanoparticles and the copolymer matrix
contain nitrogen.
Table 4.13: XPS atomic gallium concentration and binding energy of GaN/PS-PEI hybrid system and related Ga/N ratio.
Sample BE, eV Ga/N ratio
Atomic Ga* Conc. %
N1 1117.60 0.21 0.32 N2 1117.80 0.23 1.01
N3 1118.00 0.29 2.31 *atomic concentration of gallium related to PS-b-PEI/GaN sample
N 1s
x 10 2
24
26
28
30
32
34
36
38
40
42
CPS
410 400 390 Binding Energy (eV)
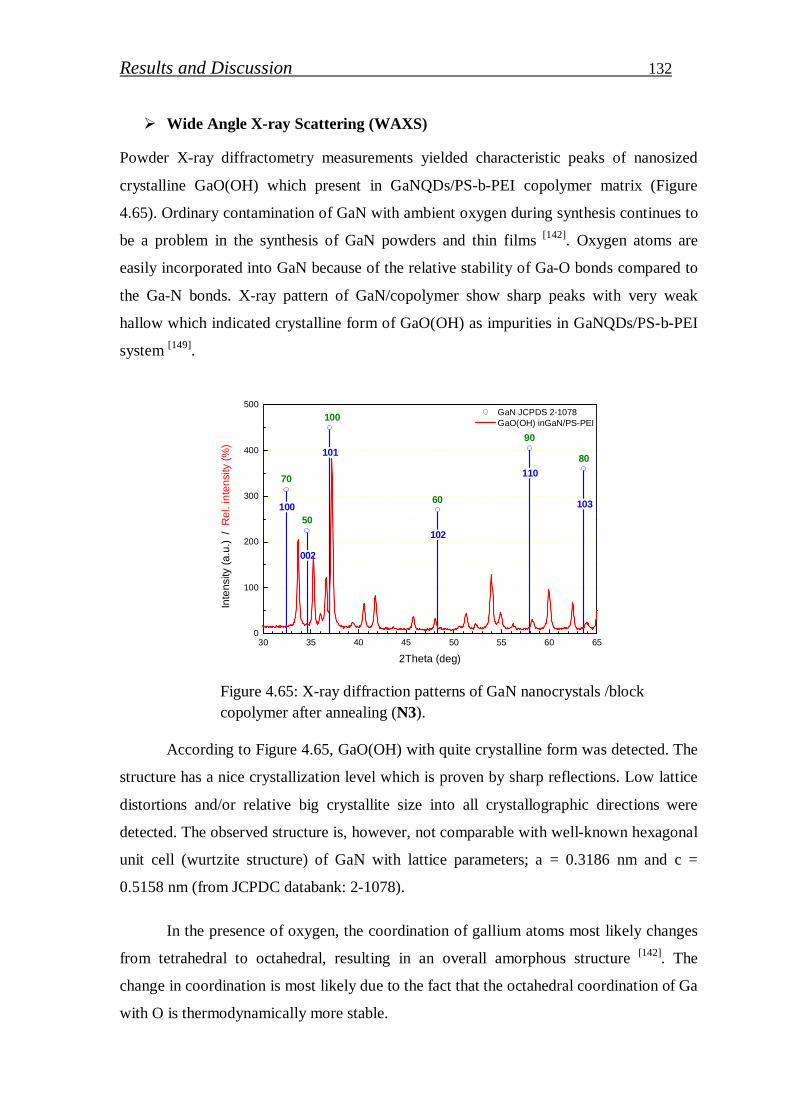
Results and Discussion 132
Wide Angle X-ray Scattering (WAXS)
Powder X-ray diffractometry measurements yielded characteristic peaks of nanosized
crystalline GaO(OH) which present in GaNQDs/PS-b-PEI copolymer matrix (Figure
4.65). Ordinary contamination of GaN with ambient oxygen during synthesis continues to
be a problem in the synthesis of GaN powders and thin films [142]. Oxygen atoms are
easily incorporated into GaN because of the relative stability of Ga-O bonds compared to
the Ga-N bonds. X-ray pattern of GaN/copolymer show sharp peaks with very weak
hallow which indicated crystalline form of GaO(OH) as impurities in GaNQDs/PS-b-PEI
system [149].
30 35 40 45 50 55 60 650
100
200
300
400
500
70
50
100
60
90
80
100
002
101
102
110
103
GaN JCPDS 2-1078 GaO(OH) inGaN/PS-PEI
Inte
nsi
ty (
a.u
.) /
Re
l. in
ten
sity
(%
)
2Theta (deg) Figure 4.65: X-ray diffraction patterns of GaN nanocrystals /block copolymer after annealing (N3).
According to Figure 4.65, GaO(OH) with quite crystalline form was detected. The
structure has a nice crystallization level which is proven by sharp reflections. Low lattice
distortions and/or relative big crystallite size into all crystallographic directions were
detected. The observed structure is, however, not comparable with well-known hexagonal
unit cell (wurtzite structure) of GaN with lattice parameters; a = 0.3186 nm and c =
0.5158 nm (from JCPDC databank: 2-1078).
In the presence of oxygen, the coordination of gallium atoms most likely changes
from tetrahedral to octahedral, resulting in an overall amorphous structure [142]. The
change in coordination is most likely due to the fact that the octahedral coordination of Ga
with O is thermodynamically more stable.
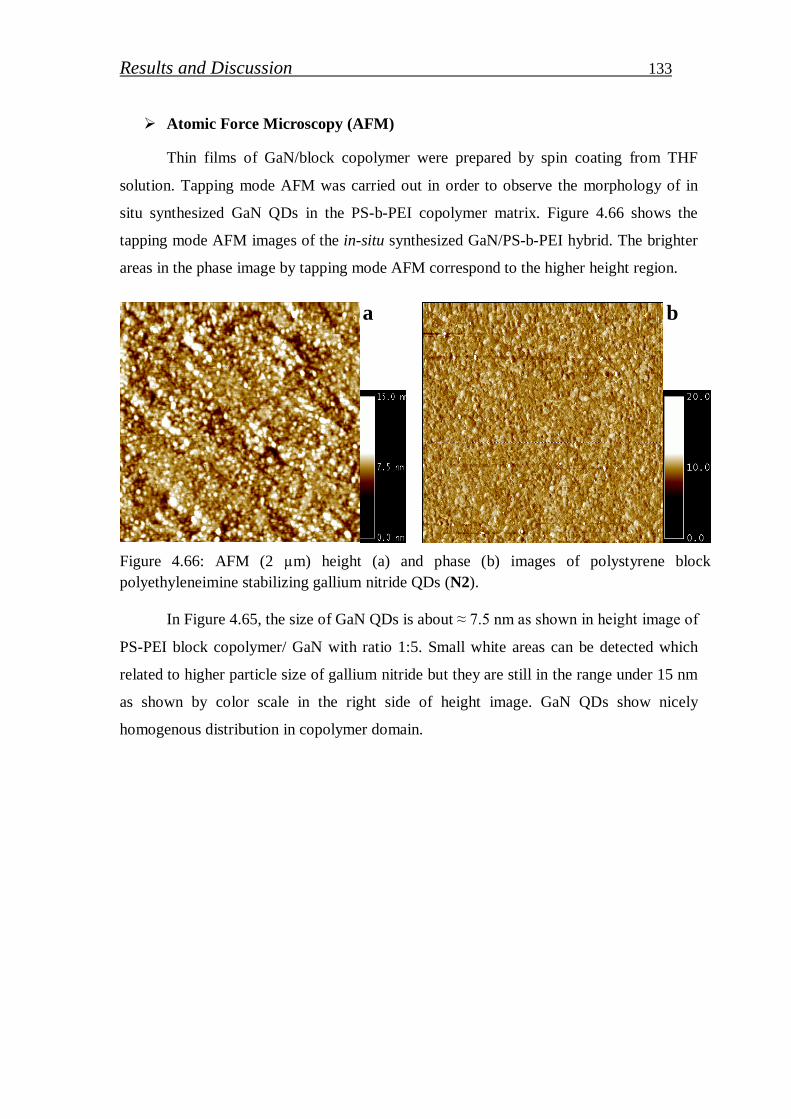
Results and Discussion 133
Atomic Force Microscopy (AFM)
Thin films of GaN/block copolymer were prepared by spin coating from THF
solution. Tapping mode AFM was carried out in order to observe the morphology of in
situ synthesized GaN QDs in the PS-b-PEI copolymer matrix. Figure 4.66 shows the
tapping mode AFM images of the in-situ synthesized GaN/PS-b-PEI hybrid. The brighter
areas in the phase image by tapping mode AFM correspond to the higher height region.
Figure 4.66: AFM (2 µm) height (a) and phase (b) images of polystyrene block polyethyleneimine stabilizing gallium nitride QDs (N2).
In Figure 4.65, the size of GaN QDs is about ≈ 7.5 nm as shown in height image of
PS-PEI block copolymer/ GaN with ratio 1:5. Small white areas can be detected which
related to higher particle size of gallium nitride but they are still in the range under 15 nm
as shown by color scale in the right side of height image. GaN QDs show nicely
homogenous distribution in copolymer domain.
a b
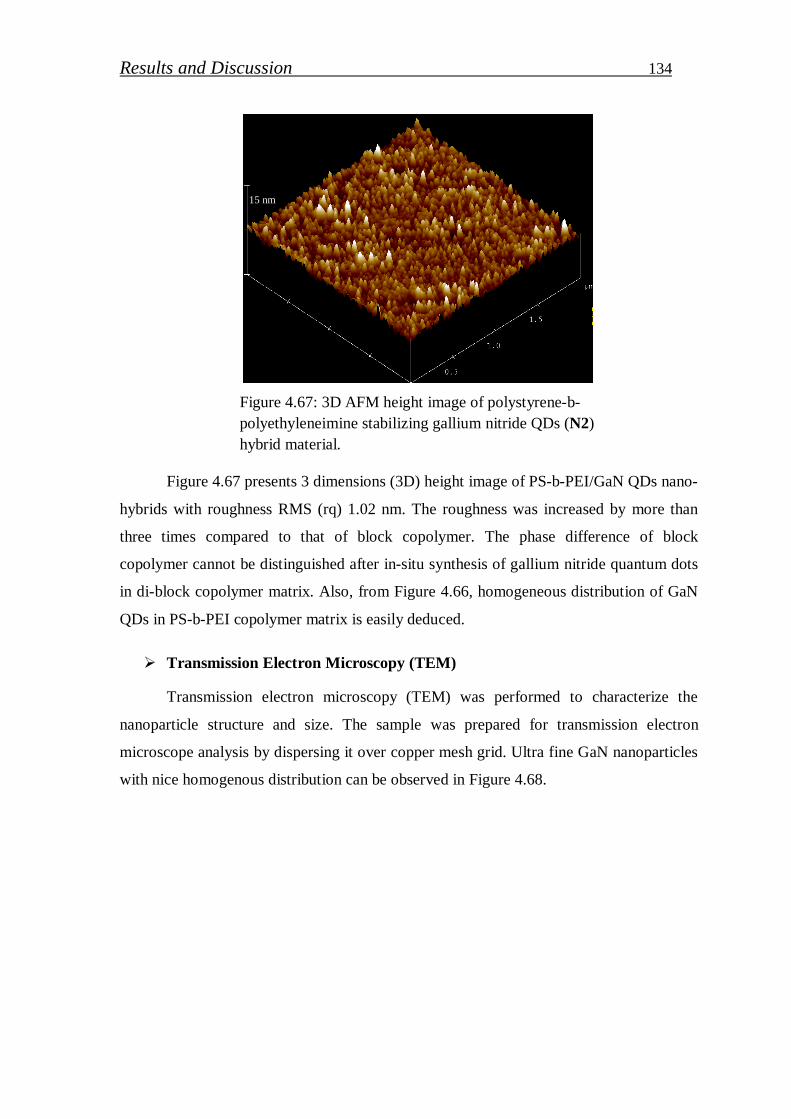
Results and Discussion 134
Figure 4.67: 3D AFM height image of polystyrene-b- polyethyleneimine stabilizing gallium nitride QDs (N2) hybrid material.
Figure 4.67 presents 3 dimensions (3D) height image of PS-b-PEI/GaN QDs nano-
hybrids with roughness RMS (rq) 1.02 nm. The roughness was increased by more than
three times compared to that of block copolymer. The phase difference of block
copolymer cannot be distinguished after in-situ synthesis of gallium nitride quantum dots
in di-block copolymer matrix. Also, from Figure 4.66, homogeneous distribution of GaN
QDs in PS-b-PEI copolymer matrix is easily deduced.
Transmission Electron Microscopy (TEM)
Transmission electron microscopy (TEM) was performed to characterize the
nanoparticle structure and size. The sample was prepared for transmission electron
microscope analysis by dispersing it over copper mesh grid. Ultra fine GaN nanoparticles
with nice homogenous distribution can be observed in Figure 4.68.
15 nm
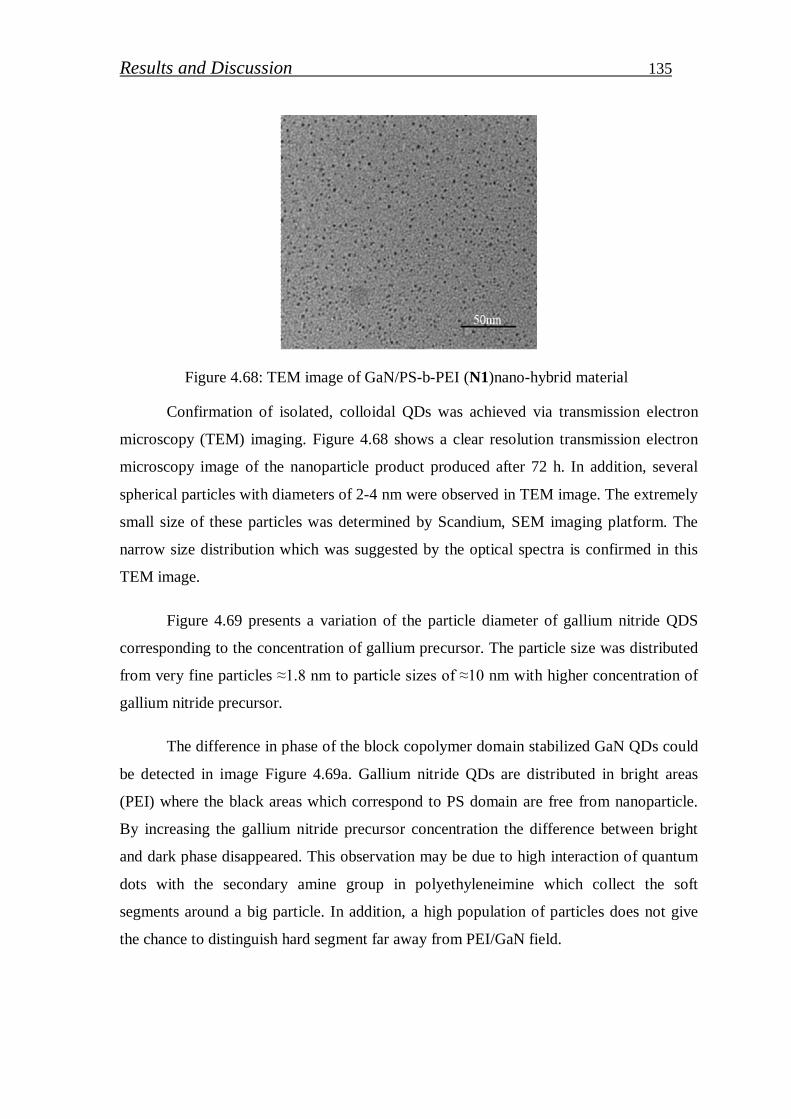
Results and Discussion 135
Figure 4.68: TEM image of GaN/PS-b-PEI (N1)nano-hybrid material
Confirmation of isolated, colloidal QDs was achieved via transmission electron
microscopy (TEM) imaging. Figure 4.68 shows a clear resolution transmission electron
microscopy image of the nanoparticle product produced after 72 h. In addition, several
spherical particles with diameters of 2-4 nm were observed in TEM image. The extremely
small size of these particles was determined by Scandium, SEM imaging platform. The
narrow size distribution which was suggested by the optical spectra is confirmed in this
TEM image.
Figure 4.69 presents a variation of the particle diameter of gallium nitride QDS
corresponding to the concentration of gallium precursor. The particle size was distributed
from very fine particles ≈1.8 nm to particle sizes of ≈10 nm with higher concentration of
gallium nitride precursor.
The difference in phase of the block copolymer domain stabilized GaN QDs could
be detected in image Figure 4.69a. Gallium nitride QDs are distributed in bright areas
(PEI) where the black areas which correspond to PS domain are free from nanoparticle.
By increasing the gallium nitride precursor concentration the difference between bright
and dark phase disappeared. This observation may be due to high interaction of quantum
dots with the secondary amine group in polyethyleneimine which collect the soft
segments around a big particle. In addition, a high population of particles does not give
the chance to distinguish hard segment far away from PEI/GaN field.
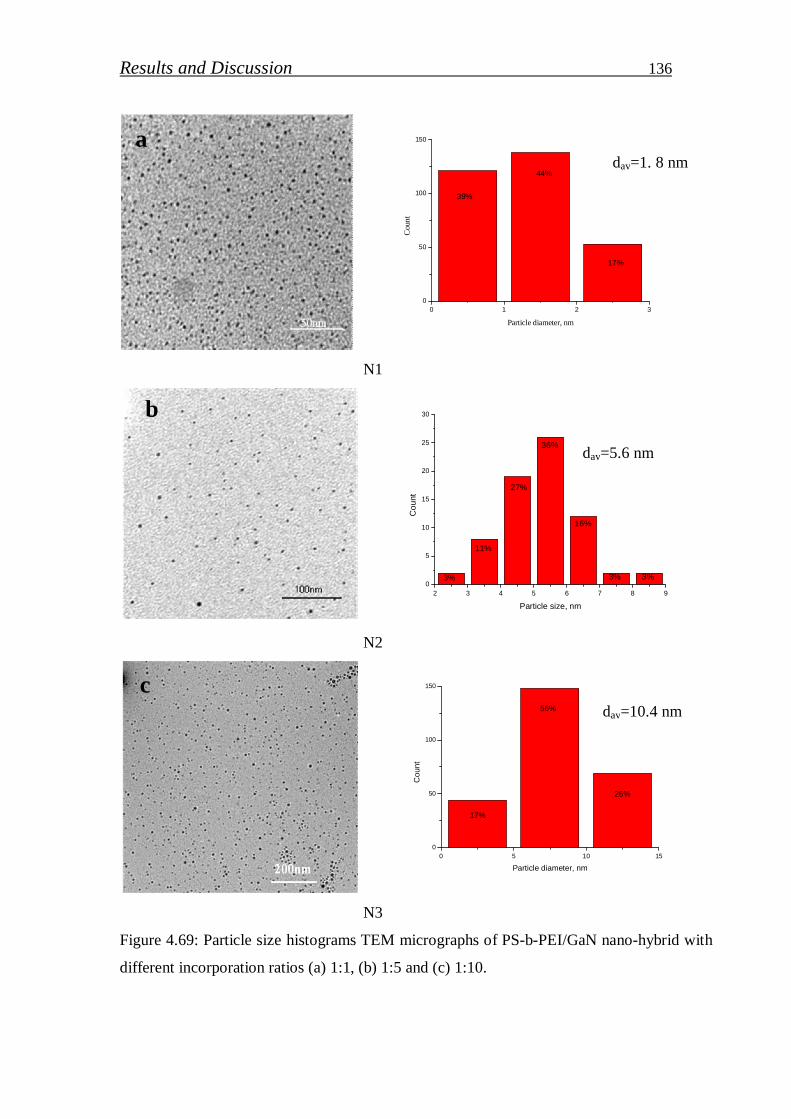
Results and Discussion 136
0 1 2 30
50
100
150
Cou
nt
Particle diameter, nm
39%
44%
17%
N1
2 3 4 5 6 7 8 9
0
5
10
15
20
25
30C
ou
nt
Particle size, nm
36%
27%
16%
11%
3% 3% 3%
N2
0 5 10 150
50
100
150
Co
un
t
Particle diameter, nm
17%
56%
26%
N3
Figure 4.69: Particle size histograms TEM micrographs of PS-b-PEI/GaN nano-hybrid with
different incorporation ratios (a) 1:1, (b) 1:5 and (c) 1:10.
a
b
c
dav=1. 8 nm
dav=5.6 nm
dav=10.4 nm
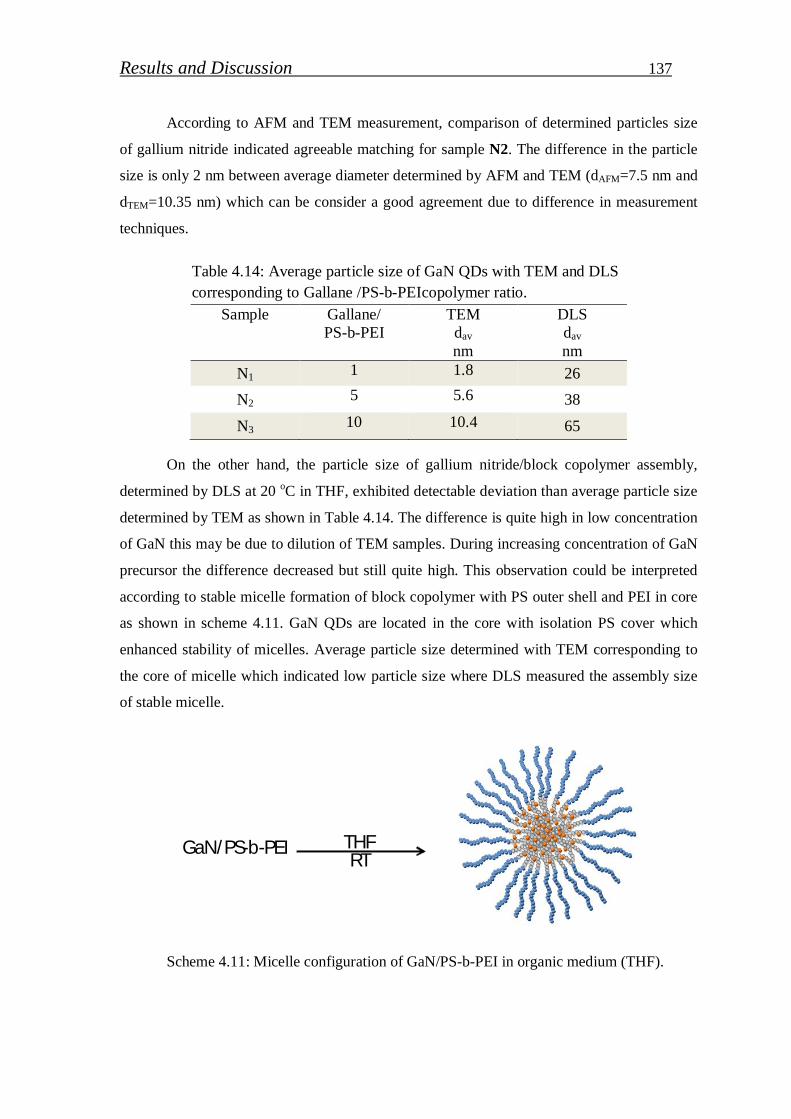
Results and Discussion 137
According to AFM and TEM measurement, comparison of determined particles size
of gallium nitride indicated agreeable matching for sample N2. The difference in the particle
size is only 2 nm between average diameter determined by AFM and TEM (dAFM=7.5 nm and
dTEM=10.35 nm) which can be consider a good agreement due to difference in measurement
techniques.
Table 4.14: Average particle size of GaN QDs with TEM and DLS corresponding to Gallane /PS-b-PEIcopolymer ratio.
Sample Gallane/ PS-b-PEI
TEM dav nm
DLS dav nm
N1 1 1.8 26 N2 5 5.6 38
N3 10 10.4 65
On the other hand, the particle size of gallium nitride/block copolymer assembly,
determined by DLS at 20 oC in THF, exhibited detectable deviation than average particle size
determined by TEM as shown in Table 4.14. The difference is quite high in low concentration
of GaN this may be due to dilution of TEM samples. During increasing concentration of GaN
precursor the difference decreased but still quite high. This observation could be interpreted
according to stable micelle formation of block copolymer with PS outer shell and PEI in core
as shown in scheme 4.11. GaN QDs are located in the core with isolation PS cover which
enhanced stability of micelles. Average particle size determined with TEM corresponding to
the core of micelle which indicated low particle size where DLS measured the assembly size
of stable micelle.
THFRT
GaN/PS-b-PEI
Scheme 4.11: Micelle configuration of GaN/PS-b-PEI in organic medium (THF).
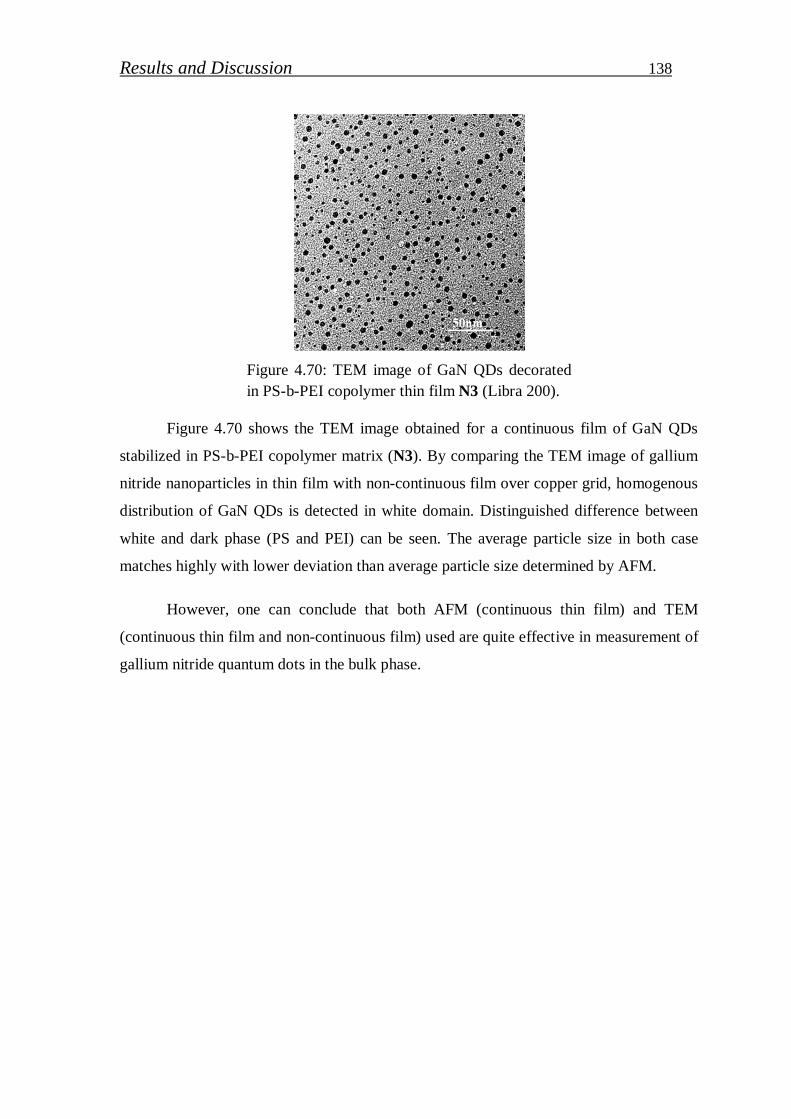
Results and Discussion 138
Figure 4.70: TEM image of GaN QDs decorated in PS-b-PEI copolymer thin film N3 (Libra 200).
Figure 4.70 shows the TEM image obtained for a continuous film of GaN QDs
stabilized in PS-b-PEI copolymer matrix (N3). By comparing the TEM image of gallium
nitride nanoparticles in thin film with non-continuous film over copper grid, homogenous
distribution of GaN QDs is detected in white domain. Distinguished difference between
white and dark phase (PS and PEI) can be seen. The average particle size in both case
matches highly with lower deviation than average particle size determined by AFM.
However, one can conclude that both AFM (continuous thin film) and TEM
(continuous thin film and non-continuous film) used are quite effective in measurement of
gallium nitride quantum dots in the bulk phase.
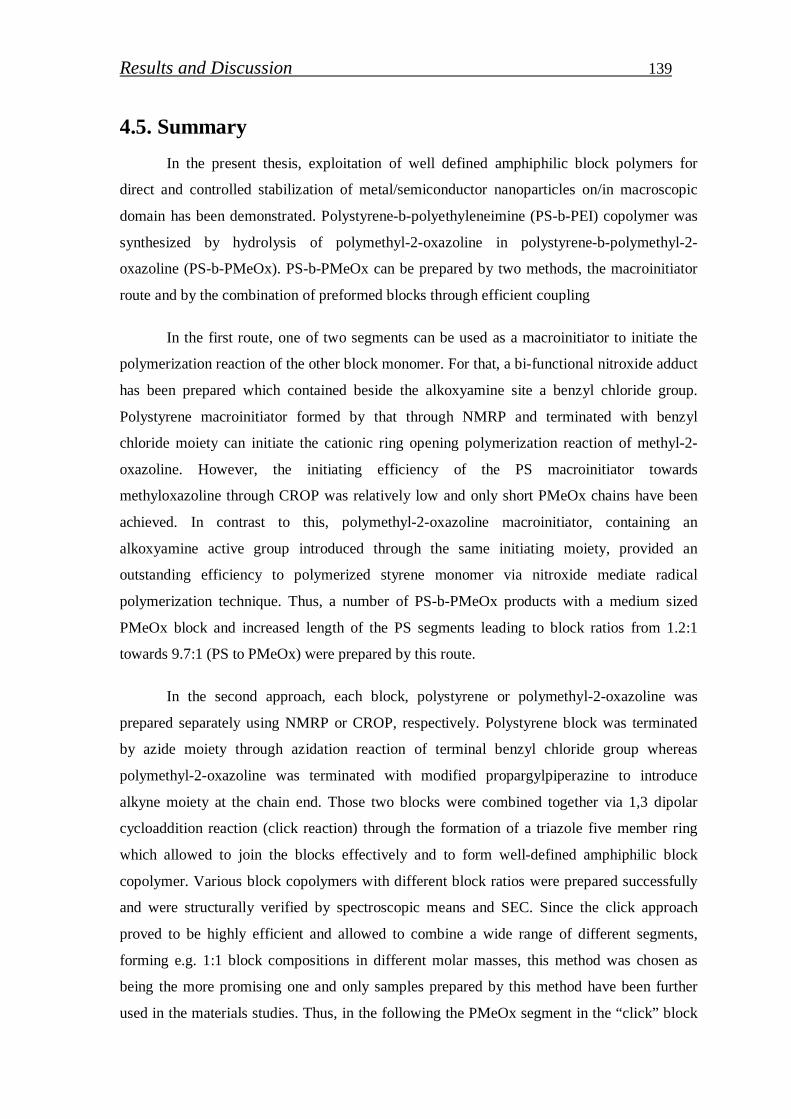
Results and Discussion 139
4.5. Summary In the present thesis, exploitation of well defined amphiphilic block polymers for
direct and controlled stabilization of metal/semiconductor nanoparticles on/in macroscopic
domain has been demonstrated. Polystyrene-b-polyethyleneimine (PS-b-PEI) copolymer was
synthesized by hydrolysis of polymethyl-2-oxazoline in polystyrene-b-polymethyl-2-
oxazoline (PS-b-PMeOx). PS-b-PMeOx can be prepared by two methods, the macroinitiator
route and by the combination of preformed blocks through efficient coupling
In the first route, one of two segments can be used as a macroinitiator to initiate the
polymerization reaction of the other block monomer. For that, a bi-functional nitroxide adduct
has been prepared which contained beside the alkoxyamine site a benzyl chloride group.
Polystyrene macroinitiator formed by that through NMRP and terminated with benzyl
chloride moiety can initiate the cationic ring opening polymerization reaction of methyl-2-
oxazoline. However, the initiating efficiency of the PS macroinitiator towards
methyloxazoline through CROP was relatively low and only short PMeOx chains have been
achieved. In contrast to this, polymethyl-2-oxazoline macroinitiator, containing an
alkoxyamine active group introduced through the same initiating moiety, provided an
outstanding efficiency to polymerized styrene monomer via nitroxide mediate radical
polymerization technique. Thus, a number of PS-b-PMeOx products with a medium sized
PMeOx block and increased length of the PS segments leading to block ratios from 1.2:1
towards 9.7:1 (PS to PMeOx) were prepared by this route.
In the second approach, each block, polystyrene or polymethyl-2-oxazoline was
prepared separately using NMRP or CROP, respectively. Polystyrene block was terminated
by azide moiety through azidation reaction of terminal benzyl chloride group whereas
polymethyl-2-oxazoline was terminated with modified propargylpiperazine to introduce
alkyne moiety at the chain end. Those two blocks were combined together via 1,3 dipolar
cycloaddition reaction (click reaction) through the formation of a triazole five member ring
which allowed to join the blocks effectively and to form well-defined amphiphilic block
copolymer. Various block copolymers with different block ratios were prepared successfully
and were structurally verified by spectroscopic means and SEC. Since the click approach
proved to be highly efficient and allowed to combine a wide range of different segments,
forming e.g. 1:1 block compositions in different molar masses, this method was chosen as
being the more promising one and only samples prepared by this method have been further
used in the materials studies. Thus, in the following the PMeOx segment in the “click” block
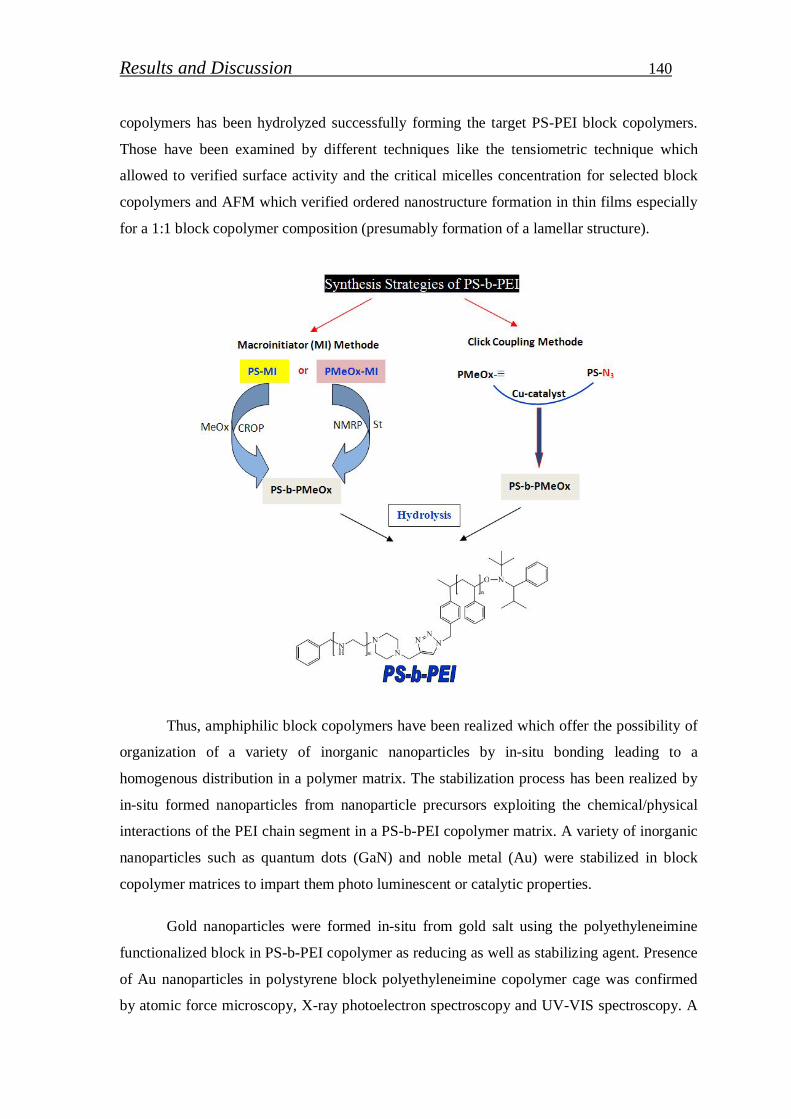
Results and Discussion 140
copolymers has been hydrolyzed successfully forming the target PS-PEI block copolymers.
Those have been examined by different techniques like the tensiometric technique which
allowed to verified surface activity and the critical micelles concentration for selected block
copolymers and AFM which verified ordered nanostructure formation in thin films especially
for a 1:1 block copolymer composition (presumably formation of a lamellar structure).
Thus, amphiphilic block copolymers have been realized which offer the possibility of
organization of a variety of inorganic nanoparticles by in-situ bonding leading to a
homogenous distribution in a polymer matrix. The stabilization process has been realized by
in-situ formed nanoparticles from nanoparticle precursors exploiting the chemical/physical
interactions of the PEI chain segment in a PS-b-PEI copolymer matrix. A variety of inorganic
nanoparticles such as quantum dots (GaN) and noble metal (Au) were stabilized in block
copolymer matrices to impart them photo luminescent or catalytic properties.
Gold nanoparticles were formed in-situ from gold salt using the polyethyleneimine
functionalized block in PS-b-PEI copolymer as reducing as well as stabilizing agent. Presence
of Au nanoparticles in polystyrene block polyethyleneimine copolymer cage was confirmed
by atomic force microscopy, X-ray photoelectron spectroscopy and UV-VIS spectroscopy. A
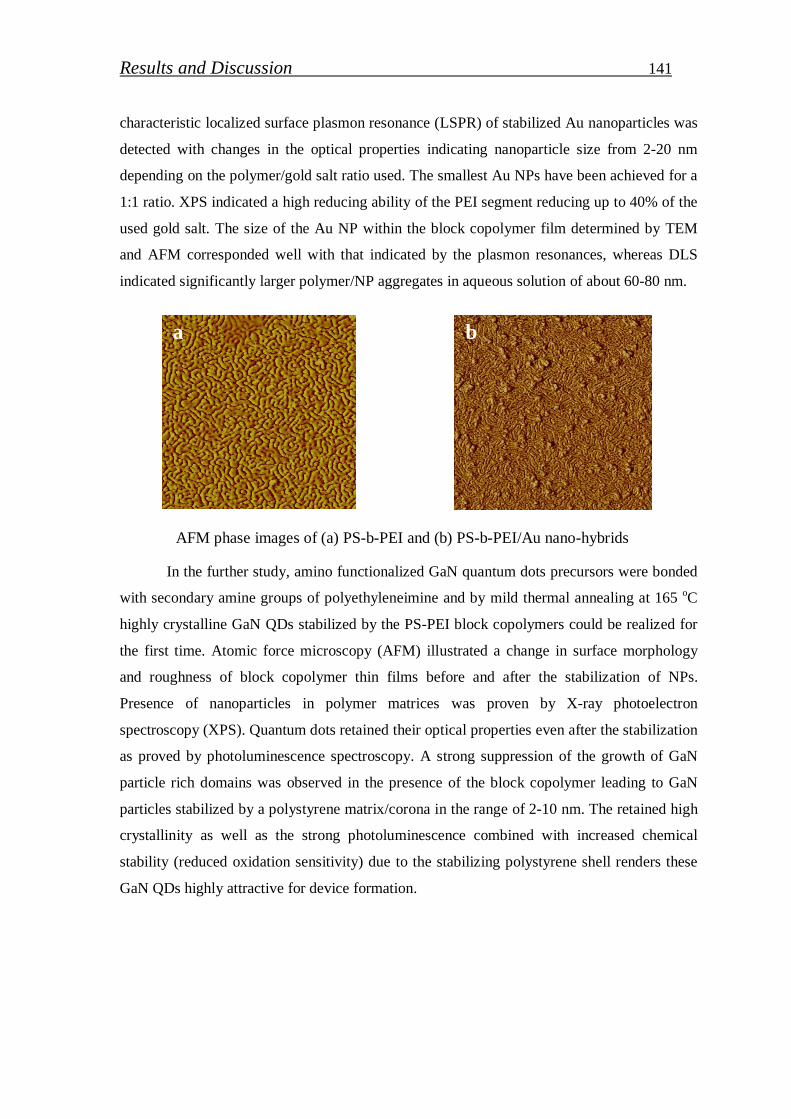
Results and Discussion 141
characteristic localized surface plasmon resonance (LSPR) of stabilized Au nanoparticles was
detected with changes in the optical properties indicating nanoparticle size from 2-20 nm
depending on the polymer/gold salt ratio used. The smallest Au NPs have been achieved for a
1:1 ratio. XPS indicated a high reducing ability of the PEI segment reducing up to 40% of the
used gold salt. The size of the Au NP within the block copolymer film determined by TEM
and AFM corresponded well with that indicated by the plasmon resonances, whereas DLS
indicated significantly larger polymer/NP aggregates in aqueous solution of about 60-80 nm.
AFM phase images of (a) PS-b-PEI and (b) PS-b-PEI/Au nano-hybrids
In the further study, amino functionalized GaN quantum dots precursors were bonded
with secondary amine groups of polyethyleneimine and by mild thermal annealing at 165 oC
highly crystalline GaN QDs stabilized by the PS-PEI block copolymers could be realized for
the first time. Atomic force microscopy (AFM) illustrated a change in surface morphology
and roughness of block copolymer thin films before and after the stabilization of NPs.
Presence of nanoparticles in polymer matrices was proven by X-ray photoelectron
spectroscopy (XPS). Quantum dots retained their optical properties even after the stabilization
as proved by photoluminescence spectroscopy. A strong suppression of the growth of GaN
particle rich domains was observed in the presence of the block copolymer leading to GaN
particles stabilized by a polystyrene matrix/corona in the range of 2-10 nm. The retained high
crystallinity as well as the strong photoluminescence combined with increased chemical
stability (reduced oxidation sensitivity) due to the stabilizing polystyrene shell renders these
GaN QDs highly attractive for device formation.
a b
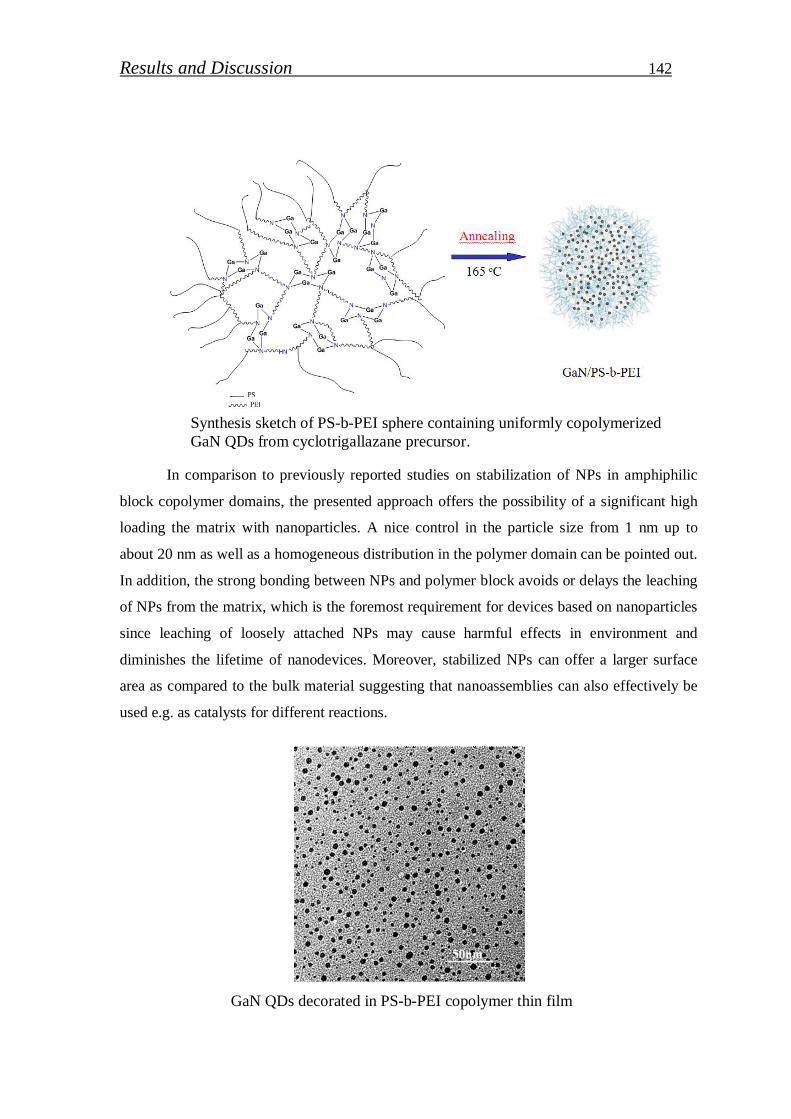
Results and Discussion 142
Synthesis sketch of PS-b-PEI sphere containing uniformly copolymerized GaN QDs from cyclotrigallazane precursor.
In comparison to previously reported studies on stabilization of NPs in amphiphilic
block copolymer domains, the presented approach offers the possibility of a significant high
loading the matrix with nanoparticles. A nice control in the particle size from 1 nm up to
about 20 nm as well as a homogeneous distribution in the polymer domain can be pointed out.
In addition, the strong bonding between NPs and polymer block avoids or delays the leaching
of NPs from the matrix, which is the foremost requirement for devices based on nanoparticles
since leaching of loosely attached NPs may cause harmful effects in environment and
diminishes the lifetime of nanodevices. Moreover, stabilized NPs can offer a larger surface
area as compared to the bulk material suggesting that nanoassemblies can also effectively be
used e.g. as catalysts for different reactions.
GaN QDs decorated in PS-b-PEI copolymer thin film

Results and Discussion 143
In this thesis, it was demonstrated that different kinds of nanoparticles can be
permanently stabilized at/in amphiphilic PS-b-PEI diblock copolymers which is advantageous
for the avoidance of NP aggregation at the surface. Further studies can be carried out on the
basis of the results reported in this thesis. For example, fabrication of a variety of block
copolymer –nanoparticles hybrid-materials, other than those attained in the present work can
be explored by employing the described approach and its applications in fabrication of
nanodevices. As a new application, the use of metallic NPs as a catalyst can be investigated.
In addition, stabilization of two types of NPs on/in triblock copolymers can be prospectively
investigated.
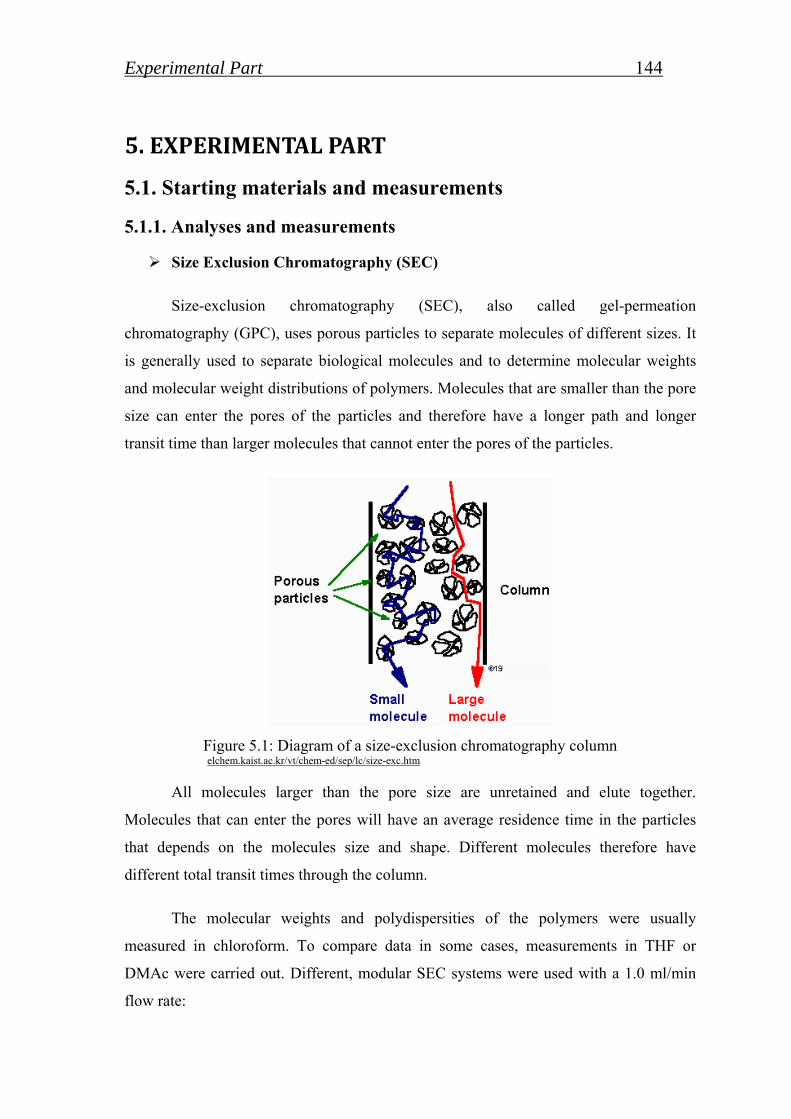
Experimental Part 144
5. EXPERIMENTAL PART
5.1. Starting materials and measurements
5.1.1. Analyses and measurements
Size Exclusion Chromatography (SEC)
Size-exclusion chromatography (SEC), also called gel-permeation
chromatography (GPC), uses porous particles to separate molecules of different sizes. It
is generally used to separate biological molecules and to determine molecular weights
and molecular weight distributions of polymers. Molecules that are smaller than the pore
size can enter the pores of the particles and therefore have a longer path and longer
transit time than larger molecules that cannot enter the pores of the particles.
Figure 5.1: Diagram of a size-exclusion chromatography column elchem.kaist.ac.kr/vt/chem-ed/sep/lc/size-exc.htm
All molecules larger than the pore size are unretained and elute together.
Molecules that can enter the pores will have an average residence time in the particles
that depends on the molecules size and shape. Different molecules therefore have
different total transit times through the column.
The molecular weights and polydispersities of the polymers were usually
measured in chloroform. To compare data in some cases, measurements in THF or
DMAc were carried out. Different, modular SEC systems were used with a 1.0 ml/min
flow rate:
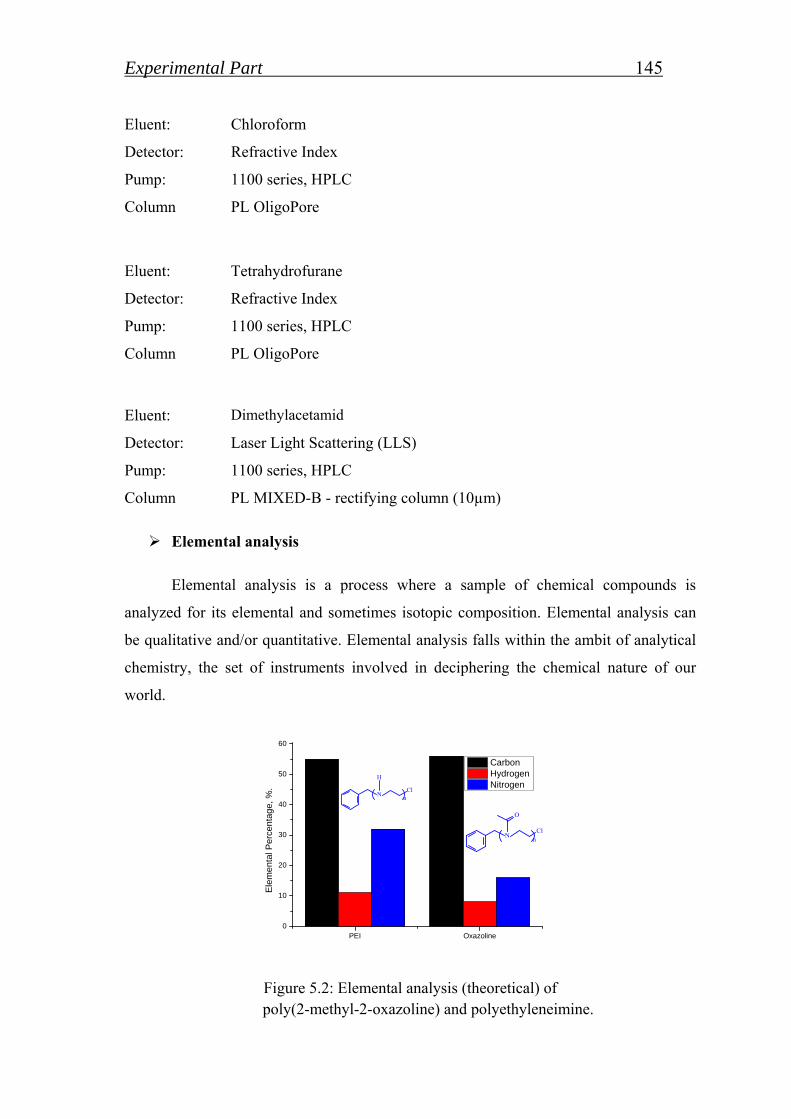
Experimental Part 145 Eluent: Chloroform
Detector: Refractive Index
Pump: 1100 series, HPLC
Column PL OligoPore
Eluent: Tetrahydrofurane
Detector: Refractive Index
Pump: 1100 series, HPLC
Column PL OligoPore
Eluent: Dimethylacetamid
Detector: Laser Light Scattering (LLS)
Pump: 1100 series, HPLC
Column PL MIXED-B - rectifying column (10µm)
Elemental analysis
Elemental analysis is a process where a sample of chemical compounds is
analyzed for its elemental and sometimes isotopic composition. Elemental analysis can
be qualitative and/or quantitative. Elemental analysis falls within the ambit of analytical
chemistry, the set of instruments involved in deciphering the chemical nature of our
world.
PEI Oxazoline0
10
20
30
40
50
60
Ele
men
tal P
erce
nta
ge,
%.
Carbon Hydrogen Nitrogen
O
nN
Cl
ClN
n
H
Figure 5.2: Elemental analysis (theoretical) of poly(2-methyl-2-oxazoline) and polyethyleneimine.
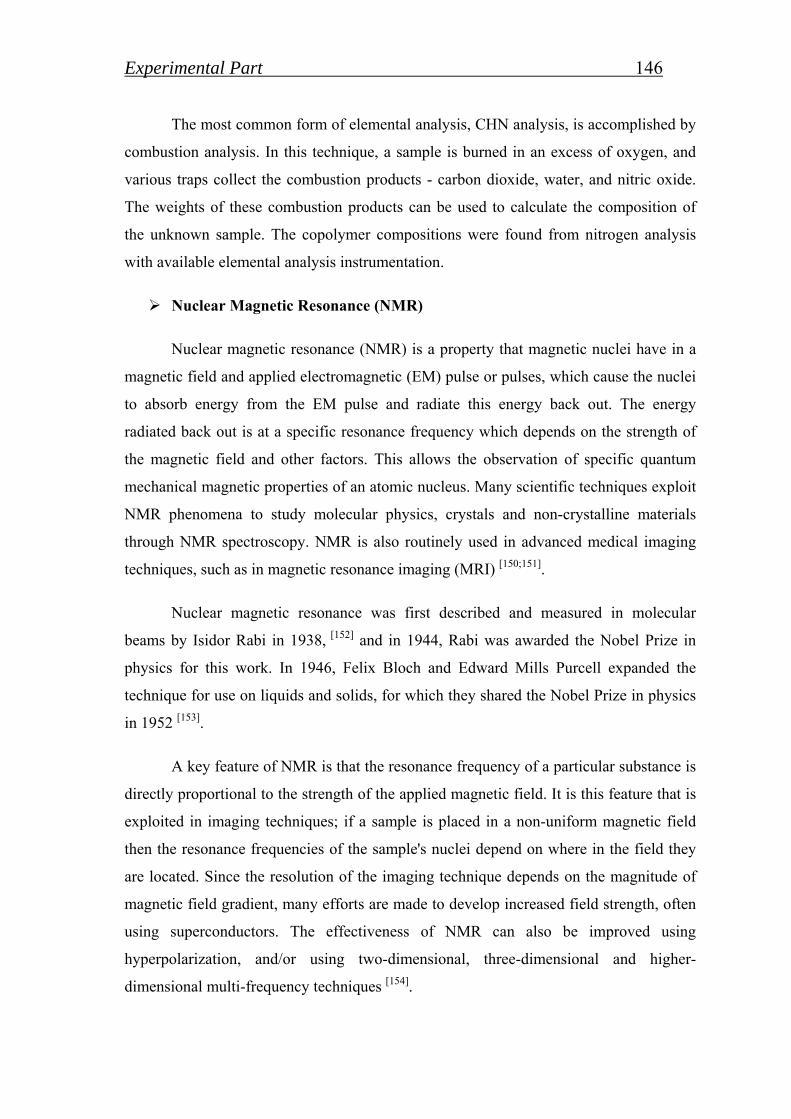
Experimental Part 146
The most common form of elemental analysis, CHN analysis, is accomplished by
combustion analysis. In this technique, a sample is burned in an excess of oxygen, and
various traps collect the combustion products - carbon dioxide, water, and nitric oxide.
The weights of these combustion products can be used to calculate the composition of
the unknown sample. The copolymer compositions were found from nitrogen analysis
with available elemental analysis instrumentation.
Nuclear Magnetic Resonance (NMR)
Nuclear magnetic resonance (NMR) is a property that magnetic nuclei have in a
magnetic field and applied electromagnetic (EM) pulse or pulses, which cause the nuclei
to absorb energy from the EM pulse and radiate this energy back out. The energy
radiated back out is at a specific resonance frequency which depends on the strength of
the magnetic field and other factors. This allows the observation of specific quantum
mechanical magnetic properties of an atomic nucleus. Many scientific techniques exploit
NMR phenomena to study molecular physics, crystals and non-crystalline materials
through NMR spectroscopy. NMR is also routinely used in advanced medical imaging
techniques, such as in magnetic resonance imaging (MRI) [150;151].
Nuclear magnetic resonance was first described and measured in molecular
beams by Isidor Rabi in 1938, [152] and in 1944, Rabi was awarded the Nobel Prize in
physics for this work. In 1946, Felix Bloch and Edward Mills Purcell expanded the
technique for use on liquids and solids, for which they shared the Nobel Prize in physics
in 1952 [153].
A key feature of NMR is that the resonance frequency of a particular substance is
directly proportional to the strength of the applied magnetic field. It is this feature that is
exploited in imaging techniques; if a sample is placed in a non-uniform magnetic field
then the resonance frequencies of the sample's nuclei depend on where in the field they
are located. Since the resolution of the imaging technique depends on the magnitude of
magnetic field gradient, many efforts are made to develop increased field strength, often
using superconductors. The effectiveness of NMR can also be improved using
hyperpolarization, and/or using two-dimensional, three-dimensional and higher-
dimensional multi-frequency techniques [154].
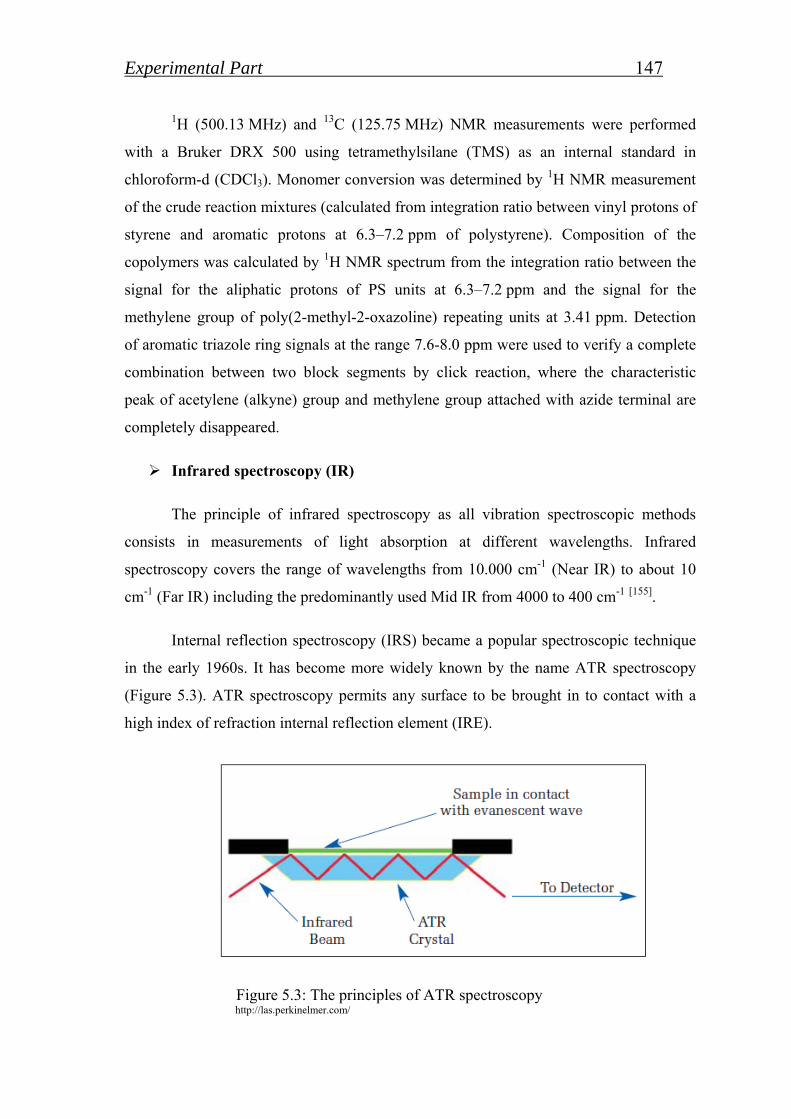
Experimental Part 147
1H (500.13 MHz) and 13C (125.75 MHz) NMR measurements were performed
with a Bruker DRX 500 using tetramethylsilane (TMS) as an internal standard in
chloroform-d (CDCl3). Monomer conversion was determined by 1H NMR measurement
of the crude reaction mixtures (calculated from integration ratio between vinyl protons of
styrene and aromatic protons at 6.3–7.2 ppm of polystyrene). Composition of the
copolymers was calculated by 1H NMR spectrum from the integration ratio between the
signal for the aliphatic protons of PS units at 6.3–7.2 ppm and the signal for the
methylene group of poly(2-methyl-2-oxazoline) repeating units at 3.41 ppm. Detection
of aromatic triazole ring signals at the range 7.6-8.0 ppm were used to verify a complete
combination between two block segments by click reaction, where the characteristic
peak of acetylene (alkyne) group and methylene group attached with azide terminal are
completely disappeared.
Infrared spectroscopy (IR)
The principle of infrared spectroscopy as all vibration spectroscopic methods
consists in measurements of light absorption at different wavelengths. Infrared
spectroscopy covers the range of wavelengths from 10.000 cm-1 (Near IR) to about 10
cm-1 (Far IR) including the predominantly used Mid IR from 4000 to 400 cm-1 [155].
Internal reflection spectroscopy (IRS) became a popular spectroscopic technique
in the early 1960s. It has become more widely known by the name ATR spectroscopy
(Figure 5.3). ATR spectroscopy permits any surface to be brought in to contact with a
high index of refraction internal reflection element (IRE).
Figure 5.3: The principles of ATR spectroscopy http://las.perkinelmer.com/
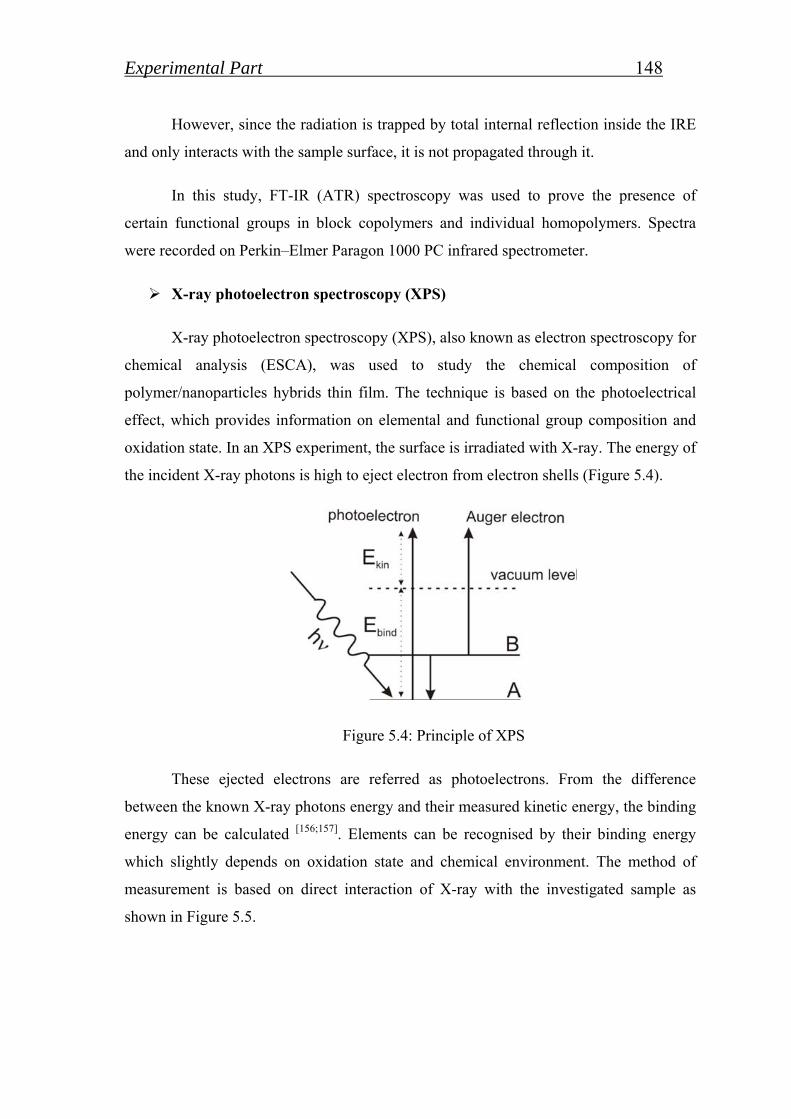
Experimental Part 148
However, since the radiation is trapped by total internal reflection inside the IRE
and only interacts with the sample surface, it is not propagated through it.
In this study, FT-IR (ATR) spectroscopy was used to prove the presence of
certain functional groups in block copolymers and individual homopolymers. Spectra
were recorded on Perkin–Elmer Paragon 1000 PC infrared spectrometer.
X-ray photoelectron spectroscopy (XPS)
X-ray photoelectron spectroscopy (XPS), also known as electron spectroscopy for
chemical analysis (ESCA), was used to study the chemical composition of
polymer/nanoparticles hybrids thin film. The technique is based on the photoelectrical
effect, which provides information on elemental and functional group composition and
oxidation state. In an XPS experiment, the surface is irradiated with X-ray. The energy of
the incident X-ray photons is high to eject electron from electron shells (Figure 5.4).
Figure 5.4: Principle of XPS
These ejected electrons are referred as photoelectrons. From the difference
between the known X-ray photons energy and their measured kinetic energy, the binding
energy can be calculated [156;157]. Elements can be recognised by their binding energy
which slightly depends on oxidation state and chemical environment. The method of
measurement is based on direct interaction of X-ray with the investigated sample as
shown in Figure 5.5.
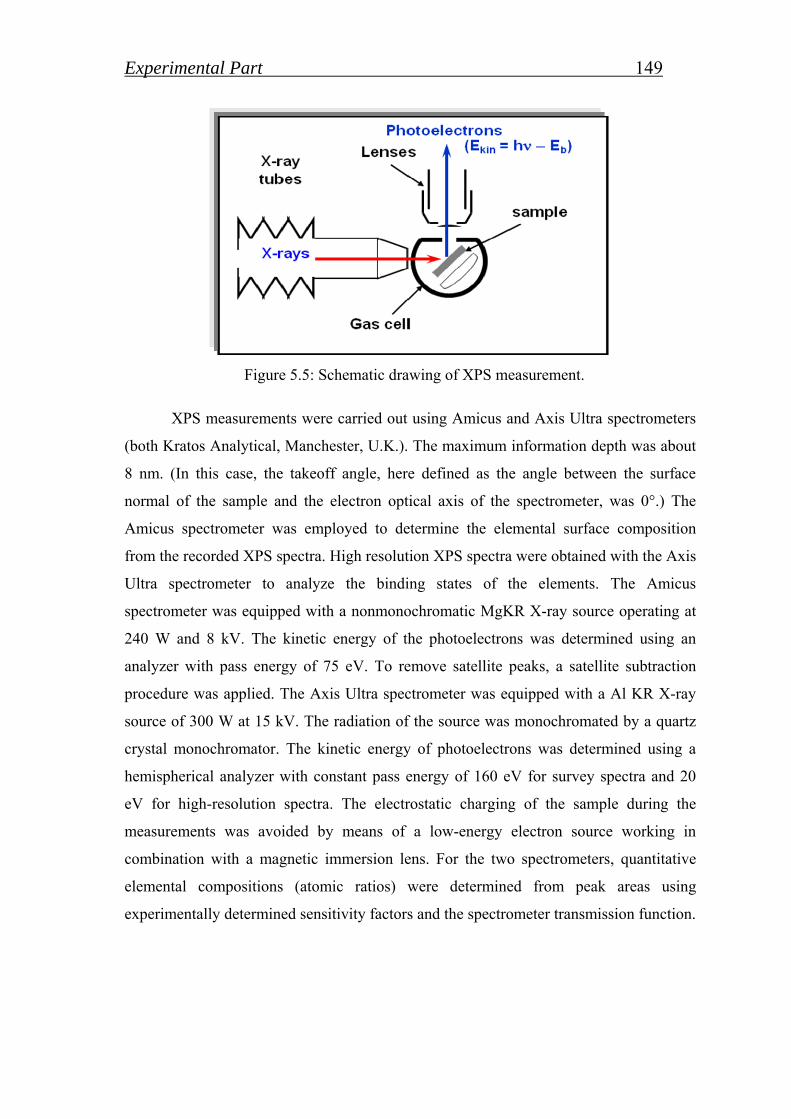
Experimental Part 149
Figure 5.5: Schematic drawing of XPS measurement.
XPS measurements were carried out using Amicus and Axis Ultra spectrometers
(both Kratos Analytical, Manchester, U.K.). The maximum information depth was about
8 nm. (In this case, the takeoff angle, here defined as the angle between the surface
normal of the sample and the electron optical axis of the spectrometer, was 0°.) The
Amicus spectrometer was employed to determine the elemental surface composition
from the recorded XPS spectra. High resolution XPS spectra were obtained with the Axis
Ultra spectrometer to analyze the binding states of the elements. The Amicus
spectrometer was equipped with a nonmonochromatic MgKR X-ray source operating at
240 W and 8 kV. The kinetic energy of the photoelectrons was determined using an
analyzer with pass energy of 75 eV. To remove satellite peaks, a satellite subtraction
procedure was applied. The Axis Ultra spectrometer was equipped with a Al KR X-ray
source of 300 W at 15 kV. The radiation of the source was monochromated by a quartz
crystal monochromator. The kinetic energy of photoelectrons was determined using a
hemispherical analyzer with constant pass energy of 160 eV for survey spectra and 20
eV for high-resolution spectra. The electrostatic charging of the sample during the
measurements was avoided by means of a low-energy electron source working in
combination with a magnetic immersion lens. For the two spectrometers, quantitative
elemental compositions (atomic ratios) were determined from peak areas using
experimentally determined sensitivity factors and the spectrometer transmission function.
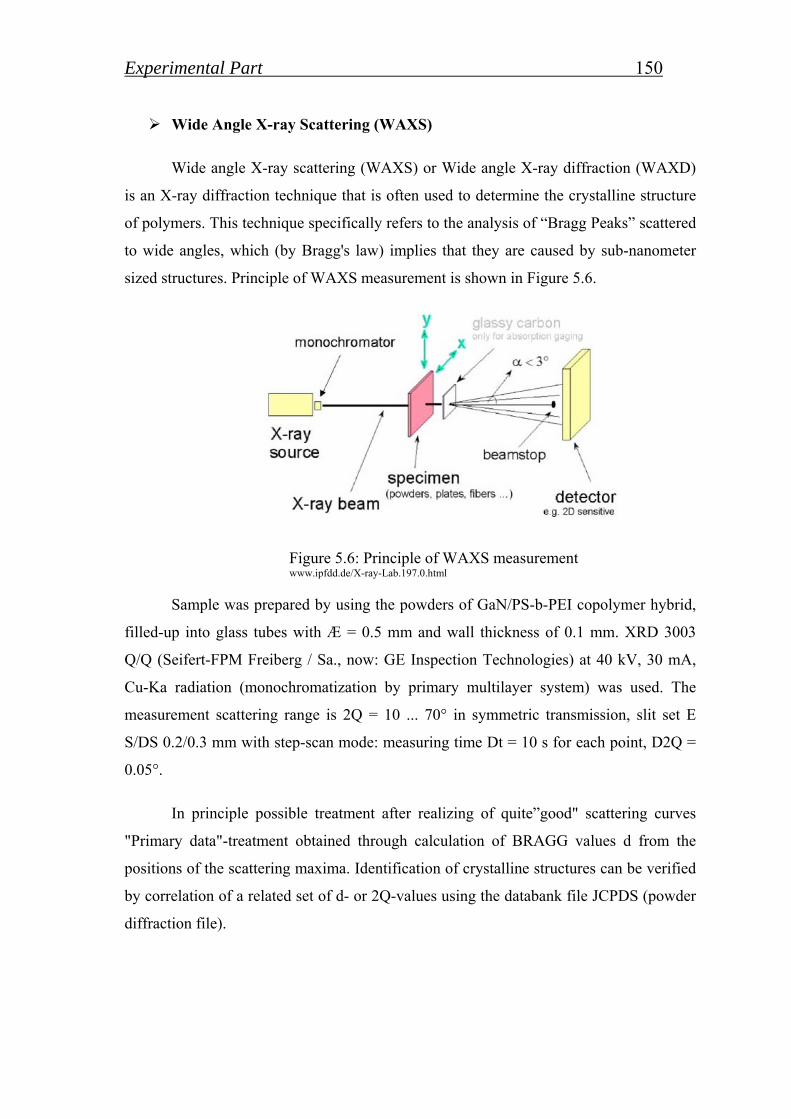
Experimental Part 150 Wide Angle X-ray Scattering (WAXS)
Wide angle X-ray scattering (WAXS) or Wide angle X-ray diffraction (WAXD)
is an X-ray diffraction technique that is often used to determine the crystalline structure
of polymers. This technique specifically refers to the analysis of “Bragg Peaks” scattered
to wide angles, which (by Bragg's law) implies that they are caused by sub-nanometer
sized structures. Principle of WAXS measurement is shown in Figure 5.6.
Figure 5.6: Principle of WAXS measurement www.ipfdd.de/X-ray-Lab.197.0.html
Sample was prepared by using the powders of GaN/PS-b-PEI copolymer hybrid,
filled-up into glass tubes with Æ = 0.5 mm and wall thickness of 0.1 mm. XRD 3003
Q/Q (Seifert-FPM Freiberg / Sa., now: GE Inspection Technologies) at 40 kV, 30 mA,
Cu-Ka radiation (monochromatization by primary multilayer system) was used. The
measurement scattering range is 2Q = 10 ... 70° in symmetric transmission, slit set E
S/DS 0.2/0.3 mm with step-scan mode: measuring time Dt = 10 s for each point, D2Q =
0.05°.
In principle possible treatment after realizing of quite”good" scattering curves
"Primary data"-treatment obtained through calculation of BRAGG values d from the
positions of the scattering maxima. Identification of crystalline structures can be verified
by correlation of a related set of d- or 2Q-values using the databank file JCPDS (powder
diffraction file).
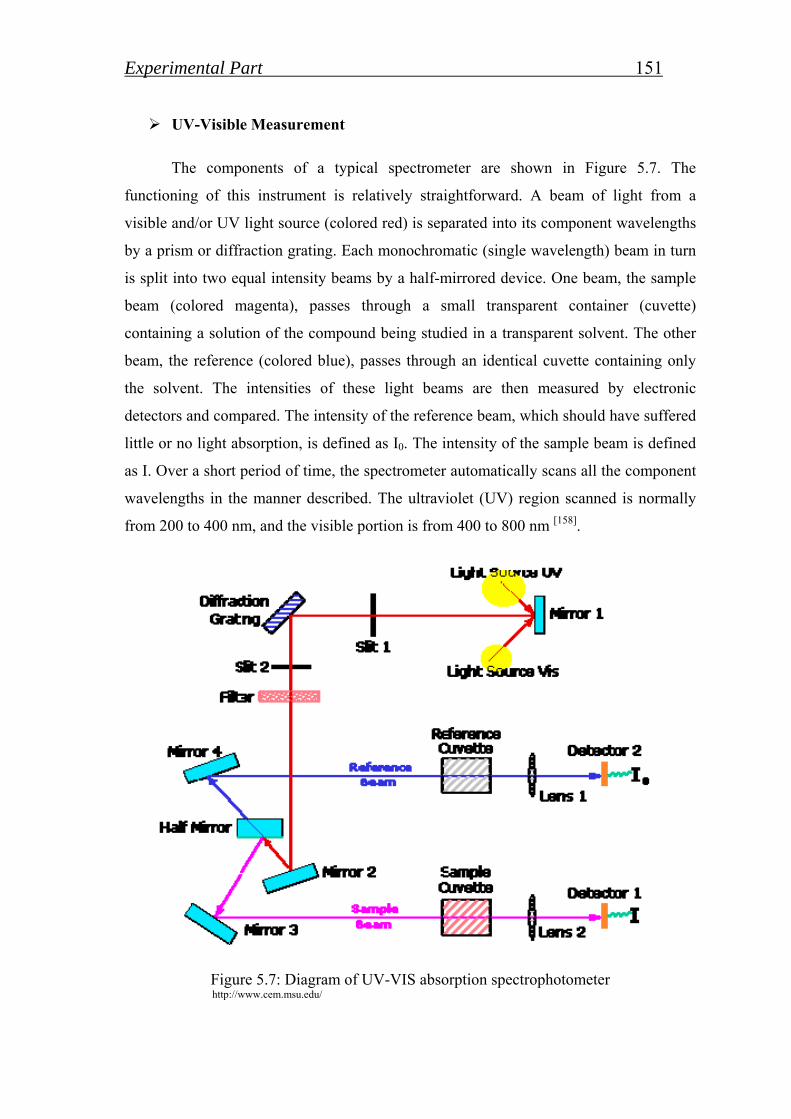
Experimental Part 151 UV-Visible Measurement
The components of a typical spectrometer are shown in Figure 5.7. The
functioning of this instrument is relatively straightforward. A beam of light from a
visible and/or UV light source (colored red) is separated into its component wavelengths
by a prism or diffraction grating. Each monochromatic (single wavelength) beam in turn
is split into two equal intensity beams by a half-mirrored device. One beam, the sample
beam (colored magenta), passes through a small transparent container (cuvette)
containing a solution of the compound being studied in a transparent solvent. The other
beam, the reference (colored blue), passes through an identical cuvette containing only
the solvent. The intensities of these light beams are then measured by electronic
detectors and compared. The intensity of the reference beam, which should have suffered
little or no light absorption, is defined as I0. The intensity of the sample beam is defined
as I. Over a short period of time, the spectrometer automatically scans all the component
wavelengths in the manner described. The ultraviolet (UV) region scanned is normally
from 200 to 400 nm, and the visible portion is from 400 to 800 nm [158].
Figure 5.7: Diagram of UV-VIS absorption spectrophotometer
http://www.cem.msu.edu/
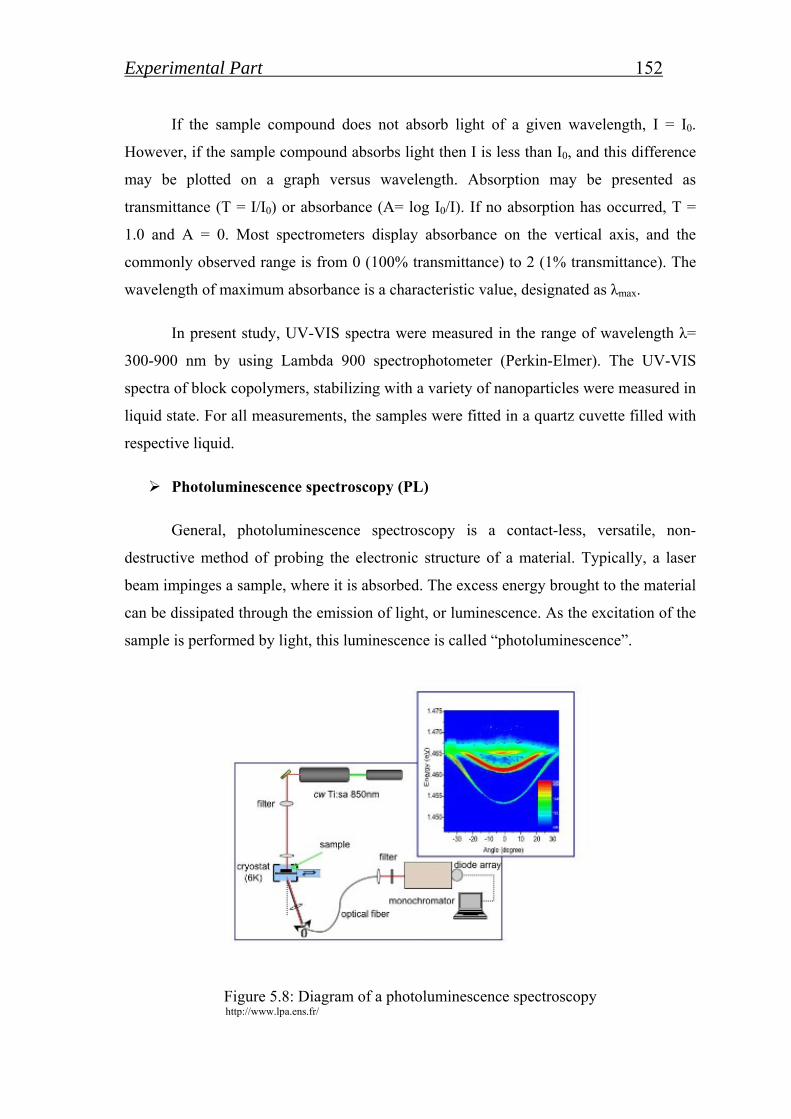
Experimental Part 152
If the sample compound does not absorb light of a given wavelength, I = I0.
However, if the sample compound absorbs light then I is less than I0, and this difference
may be plotted on a graph versus wavelength. Absorption may be presented as
transmittance (T = I/I0) or absorbance (A= log I0/I). If no absorption has occurred, T =
1.0 and A = 0. Most spectrometers display absorbance on the vertical axis, and the
commonly observed range is from 0 (100% transmittance) to 2 (1% transmittance). The
wavelength of maximum absorbance is a characteristic value, designated as λmax.
In present study, UV-VIS spectra were measured in the range of wavelength λ=
300-900 nm by using Lambda 900 spectrophotometer (Perkin-Elmer). The UV-VIS
spectra of block copolymers, stabilizing with a variety of nanoparticles were measured in
liquid state. For all measurements, the samples were fitted in a quartz cuvette filled with
respective liquid.
Photoluminescence spectroscopy (PL)
General, photoluminescence spectroscopy is a contact-less, versatile, non-
destructive method of probing the electronic structure of a material. Typically, a laser
beam impinges a sample, where it is absorbed. The excess energy brought to the material
can be dissipated through the emission of light, or luminescence. As the excitation of the
sample is performed by light, this luminescence is called “photoluminescence”.
Figure 5.8: Diagram of a photoluminescence spectroscopy http://www.lpa.ens.fr/
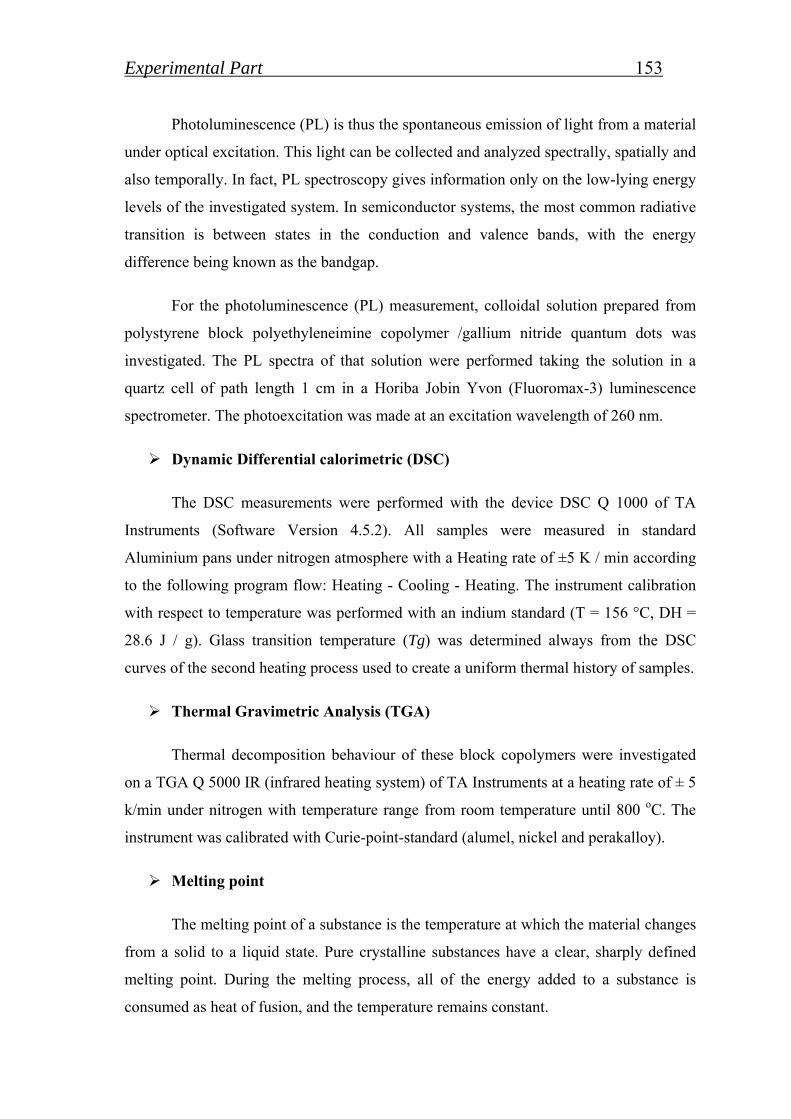
Experimental Part 153
Photoluminescence (PL) is thus the spontaneous emission of light from a material
under optical excitation. This light can be collected and analyzed spectrally, spatially and
also temporally. In fact, PL spectroscopy gives information only on the low-lying energy
levels of the investigated system. In semiconductor systems, the most common radiative
transition is between states in the conduction and valence bands, with the energy
difference being known as the bandgap.
For the photoluminescence (PL) measurement, colloidal solution prepared from
polystyrene block polyethyleneimine copolymer /gallium nitride quantum dots was
investigated. The PL spectra of that solution were performed taking the solution in a
quartz cell of path length 1 cm in a Horiba Jobin Yvon (Fluoromax-3) luminescence
spectrometer. The photoexcitation was made at an excitation wavelength of 260 nm.
Dynamic Differential calorimetric (DSC)
The DSC measurements were performed with the device DSC Q 1000 of TA
Instruments (Software Version 4.5.2). All samples were measured in standard
Aluminium pans under nitrogen atmosphere with a Heating rate of ±5 K / min according
to the following program flow: Heating - Cooling - Heating. The instrument calibration
with respect to temperature was performed with an indium standard (T = 156 °C, DH =
28.6 J / g). Glass transition temperature (Tg) was determined always from the DSC
curves of the second heating process used to create a uniform thermal history of samples.
Thermal Gravimetric Analysis (TGA)
Thermal decomposition behaviour of these block copolymers were investigated
on a TGA Q 5000 IR (infrared heating system) of TA Instruments at a heating rate of ± 5
k/min under nitrogen with temperature range from room temperature until 800 oC. The
instrument was calibrated with Curie-point-standard (alumel, nickel and perakalloy).
Melting point
The melting point of a substance is the temperature at which the material changes
from a solid to a liquid state. Pure crystalline substances have a clear, sharply defined
melting point. During the melting process, all of the energy added to a substance is
consumed as heat of fusion, and the temperature remains constant.
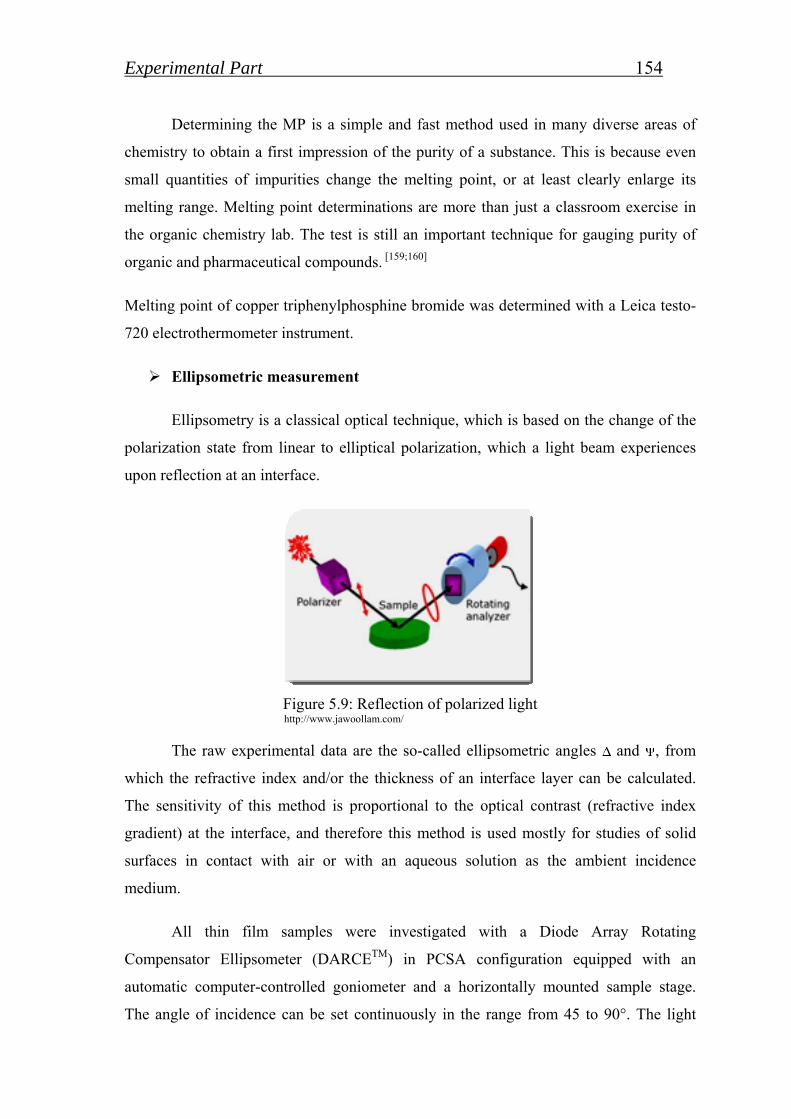
Experimental Part 154
Determining the MP is a simple and fast method used in many diverse areas of
chemistry to obtain a first impression of the purity of a substance. This is because even
small quantities of impurities change the melting point, or at least clearly enlarge its
melting range. Melting point determinations are more than just a classroom exercise in
the organic chemistry lab. The test is still an important technique for gauging purity of
organic and pharmaceutical compounds. [159;160]
Melting point of copper triphenylphosphine bromide was determined with a Leica testo-
720 electrothermometer instrument.
Ellipsometric measurement
Ellipsometry is a classical optical technique, which is based on the change of the
polarization state from linear to elliptical polarization, which a light beam experiences
upon reflection at an interface.
Figure 5.9: Reflection of polarized light http://www.jawoollam.com/
The raw experimental data are the so-called ellipsometric angles and , from
which the refractive index and/or the thickness of an interface layer can be calculated.
The sensitivity of this method is proportional to the optical contrast (refractive index
gradient) at the interface, and therefore this method is used mostly for studies of solid
surfaces in contact with air or with an aqueous solution as the ambient incidence
medium.
All thin film samples were investigated with a Diode Array Rotating
Compensator Ellipsometer (DARCETM) in PCSA configuration equipped with an
automatic computer-controlled goniometer and a horizontally mounted sample stage.
The angle of incidence can be set continuously in the range from 45 to 90°. The light
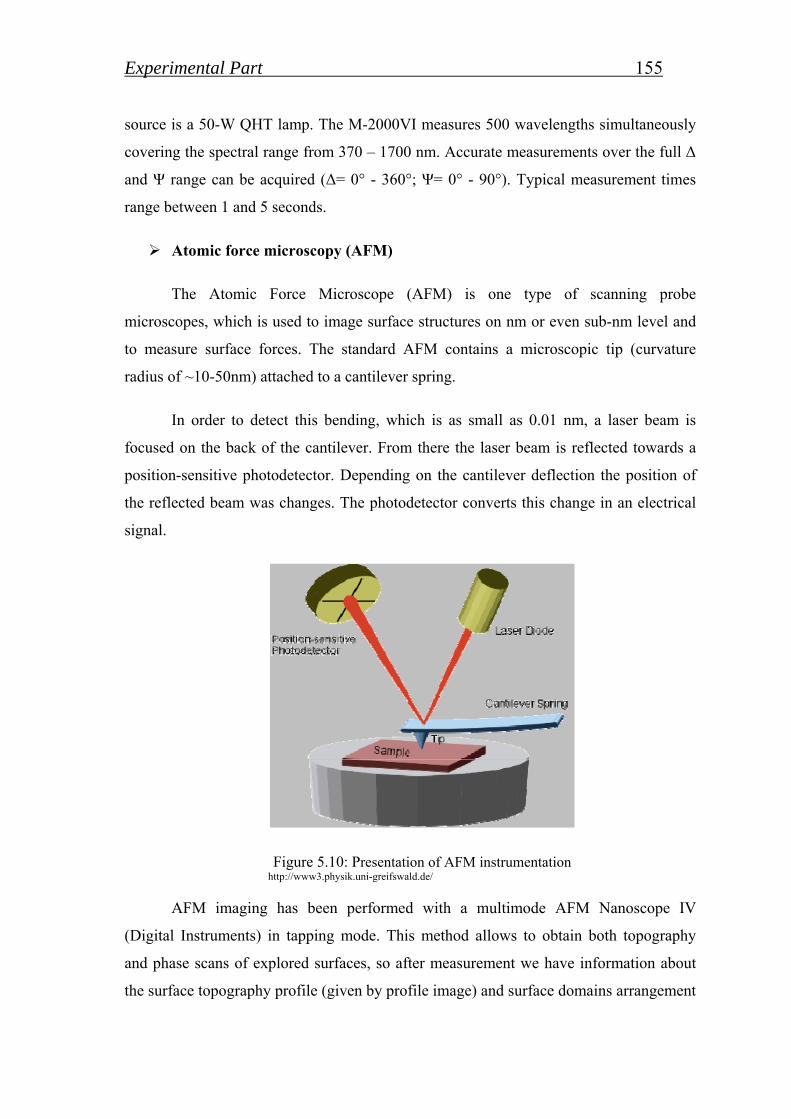
Experimental Part 155 source is a 50-W QHT lamp. The M-2000VI measures 500 wavelengths simultaneously
covering the spectral range from 370 – 1700 nm. Accurate measurements over the full Δ
and Ψ range can be acquired (Δ= 0° - 360°; Ψ= 0° - 90°). Typical measurement times
range between 1 and 5 seconds.
Atomic force microscopy (AFM)
The Atomic Force Microscope (AFM) is one type of scanning probe
microscopes, which is used to image surface structures on nm or even sub-nm level and
to measure surface forces. The standard AFM contains a microscopic tip (curvature
radius of ~10-50nm) attached to a cantilever spring.
In order to detect this bending, which is as small as 0.01 nm, a laser beam is
focused on the back of the cantilever. From there the laser beam is reflected towards a
position-sensitive photodetector. Depending on the cantilever deflection the position of
the reflected beam was changes. The photodetector converts this change in an electrical
signal.
Figure 5.10: Presentation of AFM instrumentation http://www3.physik.uni-greifswald.de/
AFM imaging has been performed with a multimode AFM Nanoscope IV
(Digital Instruments) in tapping mode. This method allows to obtain both topography
and phase scans of explored surfaces, so after measurement we have information about
the surface topography profile (given by profile image) and surface domains arrangement
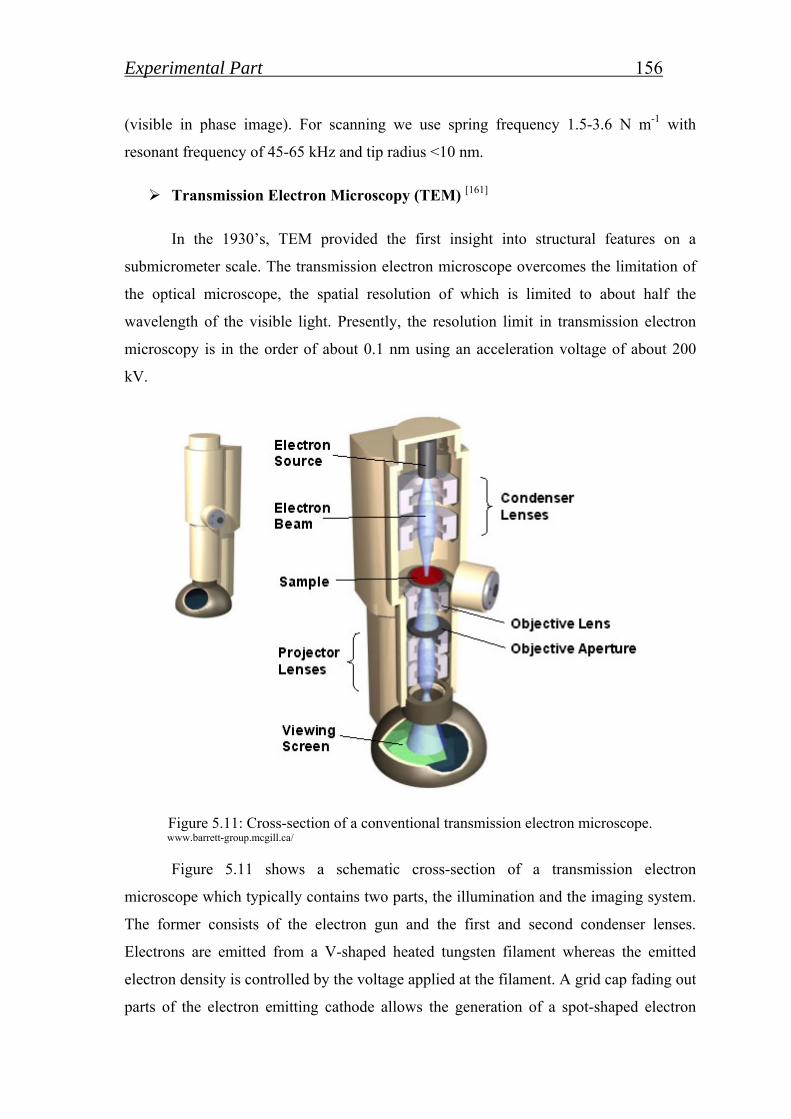
Experimental Part 156 (visible in phase image). For scanning we use spring frequency 1.5-3.6 N m-1 with
resonant frequency of 45-65 kHz and tip radius <10 nm.
Transmission Electron Microscopy (TEM) [161]
In the 1930’s, TEM provided the first insight into structural features on a
submicrometer scale. The transmission electron microscope overcomes the limitation of
the optical microscope, the spatial resolution of which is limited to about half the
wavelength of the visible light. Presently, the resolution limit in transmission electron
microscopy is in the order of about 0.1 nm using an acceleration voltage of about 200
kV.
Figure 5.11: Cross-section of a conventional transmission electron microscope. www.barrett-group.mcgill.ca/
Figure 5.11 shows a schematic cross-section of a transmission electron
microscope which typically contains two parts, the illumination and the imaging system.
The former consists of the electron gun and the first and second condenser lenses.
Electrons are emitted from a V-shaped heated tungsten filament whereas the emitted
electron density is controlled by the voltage applied at the filament. A grid cap fading out
parts of the electron emitting cathode allows the generation of a spot-shaped electron
Experimental Part 157 beam. A high voltage field accelerates the emitted electrons which reach the system of
condenser lenses in the illumination system after crossing the ring anode.
These lenses regulate the intensity and refocus the electron beam. The specimen is then
hit by an intense, parallel beam of monoenergetic electrons.
The imaging system is build up by the objective lens, the intermediate lens and
their corresponding apertures, the projector lens, a phosphor viewing screen, and the
photographic film or CCD camera. The most important parts of the imaging system are
the objective lens and objective aperture which can either generate a bright-field or a
dark-field image of the specimen. The apertures act as filters mainly for elastically or in
elastically scattered or transmitted electrons and are necessary to create a phase contrast
in the sample.
Specimens of low-density hydrocarbon materials like polymers must be less than
100 nm thick while high-density metals should be less than 20 nm thick. Bright field is
the most widely used mode of transmission electron microscopy imaging, selecting the
weakly scattered and transmitted electrons by an objective aperture. The dark areas in the
image correspond to strongly scattering areas in the specimen, indicating to the areas of
higher mass thickness.
The block copolymer and hybrid materials specimens were prepared by dropping
the specimen solution (dilute ten folders by Millipore water than AFM sample
concentration) on carbon coated copper grid (S160-3 Plano GmbH) or a thin film of the
polymer was prepared by spin-coating on cleaned silicon wafer. The film was cured at
100 oC for 1hours in Argon atmosphere. The film was floated from the wafer in 1M
NaOH solution and picked up on a TEM grid using a Perfect Loop tool and investigated
in Libra 120/Libra 200 TEM (Carl Zeiss NTS) operated at 120 kV /200 kV. Zero-loss
energy filtering was used to increase the image contrast. Most samples were investigated
with Libra 120 otherwise it is mentioned under figure. The size distribution of the
particles was determined by automatic particle-identification routine in Olympus
Scandium software.
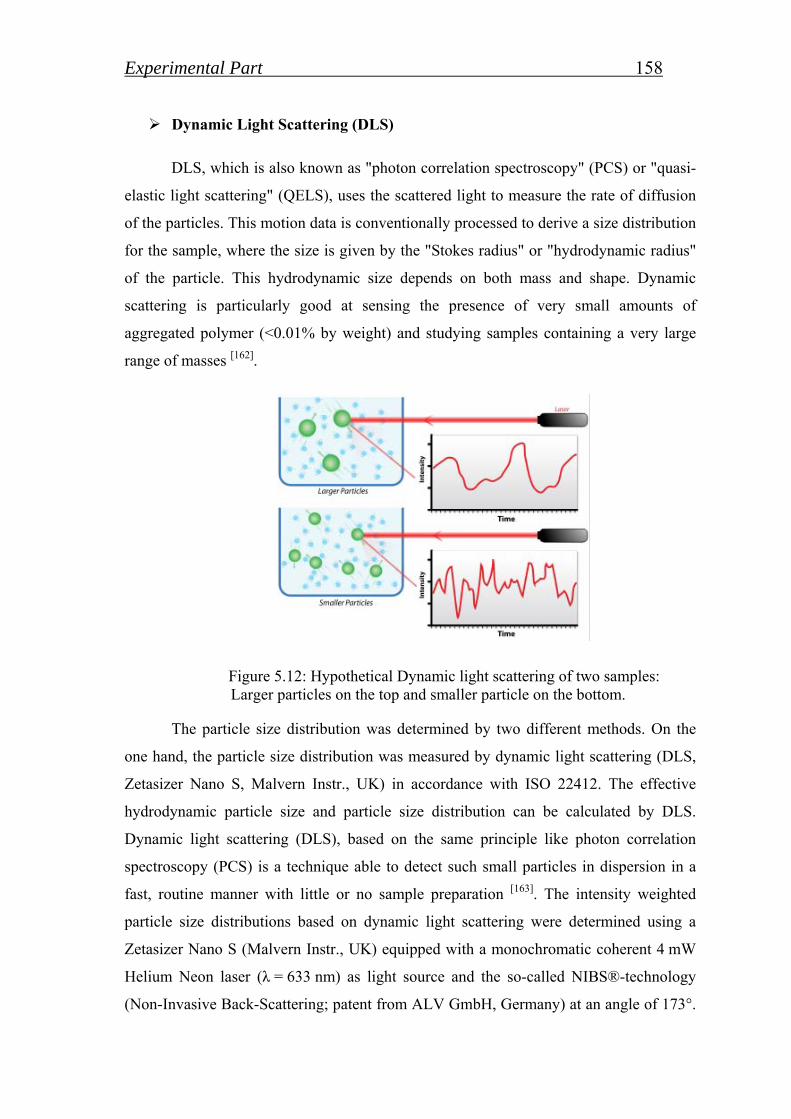
Experimental Part 158 Dynamic Light Scattering (DLS)
DLS, which is also known as "photon correlation spectroscopy" (PCS) or "quasi-
elastic light scattering" (QELS), uses the scattered light to measure the rate of diffusion
of the particles. This motion data is conventionally processed to derive a size distribution
for the sample, where the size is given by the "Stokes radius" or "hydrodynamic radius"
of the particle. This hydrodynamic size depends on both mass and shape. Dynamic
scattering is particularly good at sensing the presence of very small amounts of
aggregated polymer (<0.01% by weight) and studying samples containing a very large
range of masses [162].
Figure 5.12: Hypothetical Dynamic light scattering of two samples: Larger particles on the top and smaller particle on the bottom.
The particle size distribution was determined by two different methods. On the
one hand, the particle size distribution was measured by dynamic light scattering (DLS,
Zetasizer Nano S, Malvern Instr., UK) in accordance with ISO 22412. The effective
hydrodynamic particle size and particle size distribution can be calculated by DLS.
Dynamic light scattering (DLS), based on the same principle like photon correlation
spectroscopy (PCS) is a technique able to detect such small particles in dispersion in a
fast, routine manner with little or no sample preparation [163]. The intensity weighted
particle size distributions based on dynamic light scattering were determined using a
Zetasizer Nano S (Malvern Instr., UK) equipped with a monochromatic coherent 4 mW
Helium Neon laser (λ = 633 nm) as light source and the so-called NIBS®-technology
(Non-Invasive Back-Scattering; patent from ALV GmbH, Germany) at an angle of 173°.
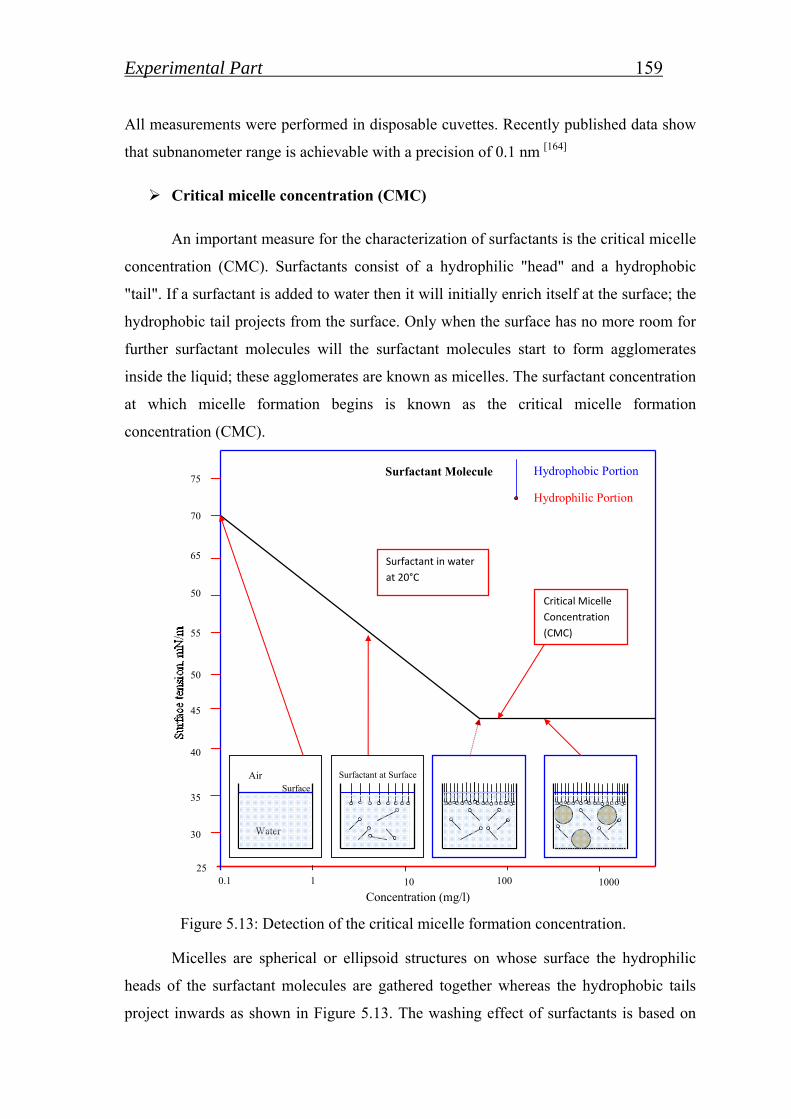
Experimental Part 159 All measurements were performed in disposable cuvettes. Recently published data show
that subnanometer range is achievable with a precision of 0.1 nm [164]
Critical micelle concentration (CMC)
An important measure for the characterization of surfactants is the critical micelle
concentration (CMC). Surfactants consist of a hydrophilic "head" and a hydrophobic
"tail". If a surfactant is added to water then it will initially enrich itself at the surface; the
hydrophobic tail projects from the surface. Only when the surface has no more room for
further surfactant molecules will the surfactant molecules start to form agglomerates
inside the liquid; these agglomerates are known as micelles. The surfactant concentration
at which micelle formation begins is known as the critical micelle formation
concentration (CMC).
Critical Micelle
Concentration
(CMC)
Surfactant in water
at 20°C
Air
Water
Surface
Surfactant at Surface
Surfactant Molecule
Concentration (mg/l) 1 10 100 1000
35
45
0.1 25
40
55
50
65
70
50
30
75 Hydrophobic Portion
Hydrophilic Portion
Figure 5.13: Detection of the critical micelle formation concentration.
Micelles are spherical or ellipsoid structures on whose surface the hydrophilic
heads of the surfactant molecules are gathered together whereas the hydrophobic tails
project inwards as shown in Figure 5.13. The washing effect of surfactants is based on
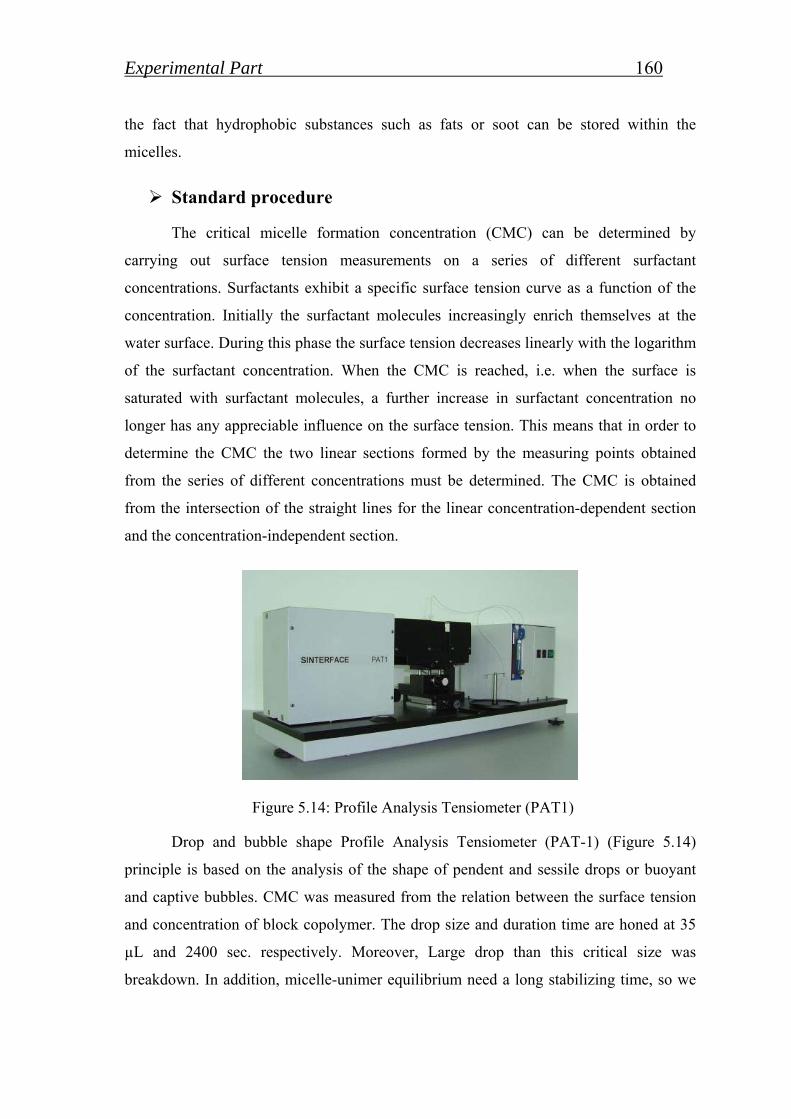
Experimental Part 160 the fact that hydrophobic substances such as fats or soot can be stored within the
micelles.
Standard procedure
The critical micelle formation concentration (CMC) can be determined by
carrying out surface tension measurements on a series of different surfactant
concentrations. Surfactants exhibit a specific surface tension curve as a function of the
concentration. Initially the surfactant molecules increasingly enrich themselves at the
water surface. During this phase the surface tension decreases linearly with the logarithm
of the surfactant concentration. When the CMC is reached, i.e. when the surface is
saturated with surfactant molecules, a further increase in surfactant concentration no
longer has any appreciable influence on the surface tension. This means that in order to
determine the CMC the two linear sections formed by the measuring points obtained
from the series of different concentrations must be determined. The CMC is obtained
from the intersection of the straight lines for the linear concentration-dependent section
and the concentration-independent section.
Figure 5.14: Profile Analysis Tensiometer (PAT1)
Drop and bubble shape Profile Analysis Tensiometer (PAT-1) (Figure 5.14)
principle is based on the analysis of the shape of pendent and sessile drops or buoyant
and captive bubbles. CMC was measured from the relation between the surface tension
and concentration of block copolymer. The drop size and duration time are honed at 35
µL and 2400 sec. respectively. Moreover, Large drop than this critical size was
breakdown. In addition, micelle-unimer equilibrium need a long stabilizing time, so we
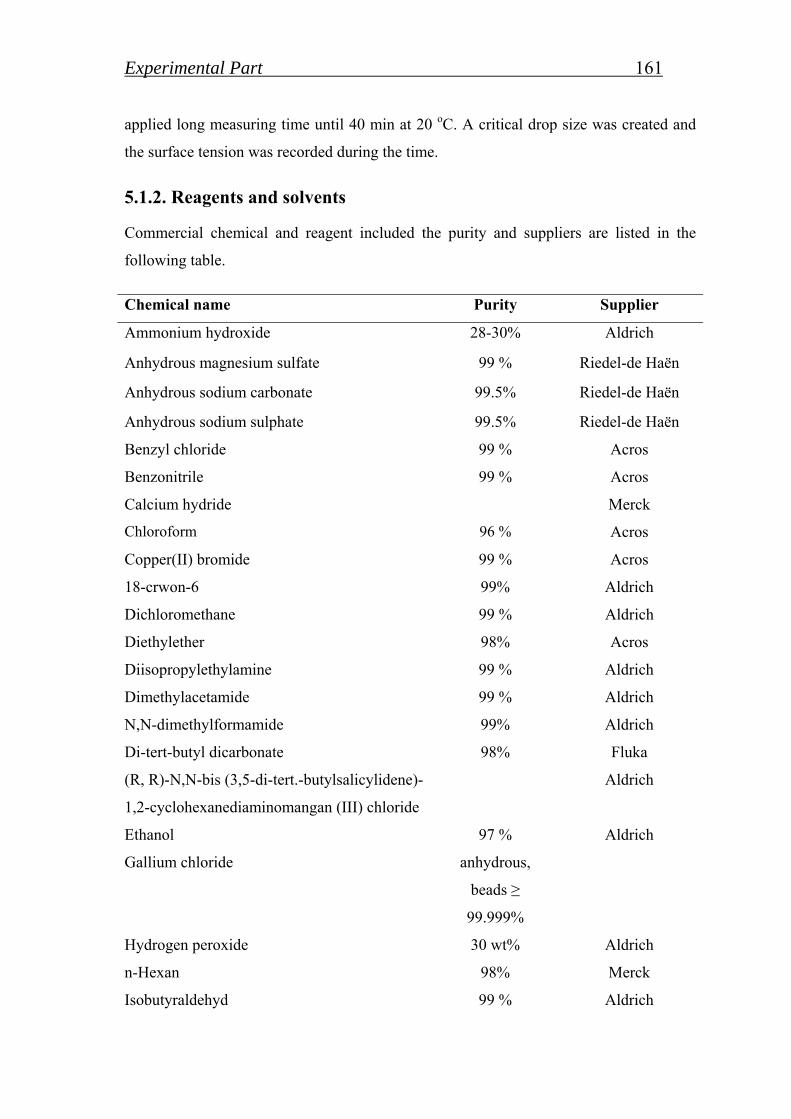
Experimental Part 161 applied long measuring time until 40 min at 20 oC. A critical drop size was created and
the surface tension was recorded during the time.
5.1.2. Reagents and solvents
Commercial chemical and reagent included the purity and suppliers are listed in the
following table.
Chemical name Purity Supplier
Ammonium hydroxide 28-30% Aldrich
Anhydrous magnesium sulfate 99 % Riedel-de Haën
Anhydrous sodium carbonate 99.5% Riedel-de Haën
Anhydrous sodium sulphate 99.5% Riedel-de Haën
Benzyl chloride 99 % Acros
Benzonitrile 99 % Acros
Calcium hydride Merck
Chloroform 96 % Acros
Copper(II) bromide 99 % Acros
18-crwon-6 99% Aldrich
Dichloromethane 99 % Aldrich
Diethylether 98% Acros
Diisopropylethylamine 99 % Aldrich
Dimethylacetamide 99 % Aldrich
N,N-dimethylformamide 99% Aldrich
Di-tert-butyl dicarbonate 98% Fluka
(R, R)-N,N-bis (3,5-di-tert.-butylsalicylidene)-
1,2-cyclohexanediaminomangan (III) chloride
Aldrich
Ethanol 97 % Aldrich
Gallium chloride anhydrous,
beads ≥
99.999%
Hydrogen peroxide 30 wt% Aldrich
n-Hexan 98% Merck
Isobutyraldehyd 99 % Aldrich
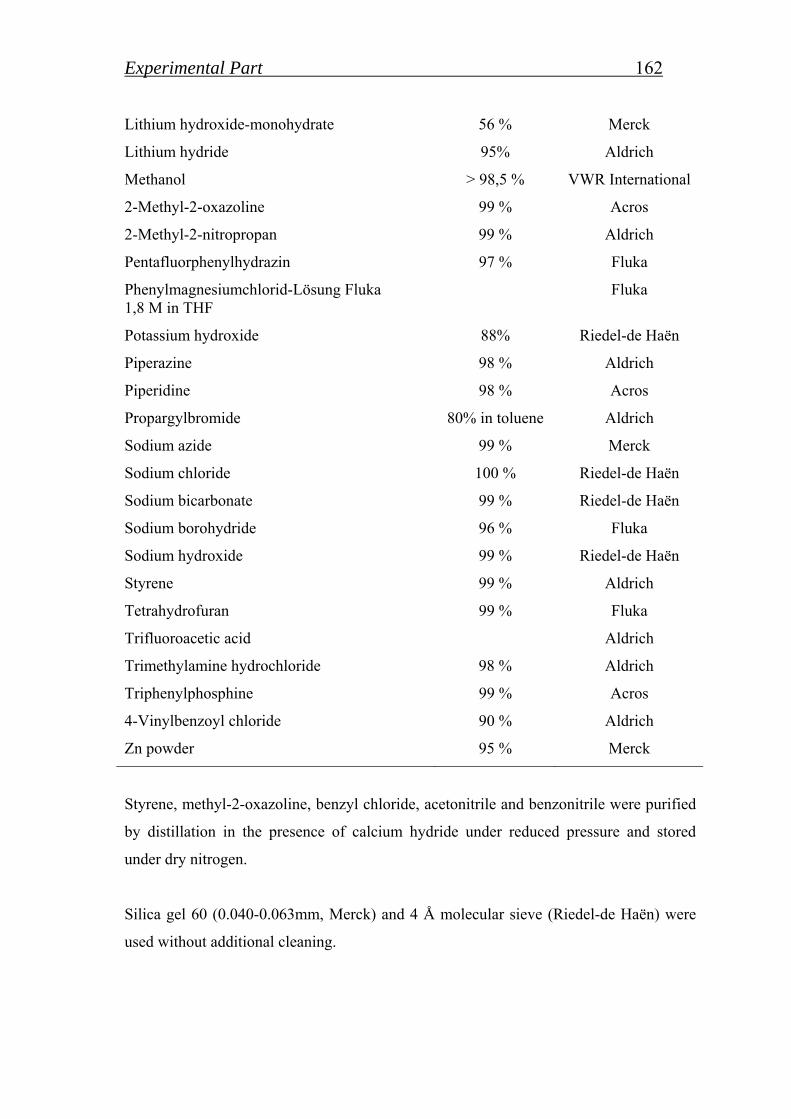
Experimental Part 162 Lithium hydroxide-monohydrate 56 % Merck
Lithium hydride 95% Aldrich
Methanol > 98,5 % VWR International
2-Methyl-2-oxazoline 99 % Acros
2-Methyl-2-nitropropan 99 % Aldrich
Pentafluorphenylhydrazin 97 % Fluka
Phenylmagnesiumchlorid-Lösung Fluka 1,8 M in THF
Fluka
Potassium hydroxide 88% Riedel-de Haën
Piperazine 98 % Aldrich
Piperidine 98 % Acros
Propargylbromide 80% in toluene Aldrich
Sodium azide 99 % Merck
Sodium chloride 100 % Riedel-de Haën
Sodium bicarbonate 99 % Riedel-de Haën
Sodium borohydride 96 % Fluka
Sodium hydroxide 99 % Riedel-de Haën
Styrene 99 % Aldrich
Tetrahydrofuran 99 % Fluka
Trifluoroacetic acid Aldrich
Trimethylamine hydrochloride 98 % Aldrich
Triphenylphosphine 99 % Acros
4-Vinylbenzoyl chloride 90 % Aldrich
Zn powder 95 % Merck
Styrene, methyl-2-oxazoline, benzyl chloride, acetonitrile and benzonitrile were purified
by distillation in the presence of calcium hydride under reduced pressure and stored
under dry nitrogen.
Silica gel 60 (0.040-0.063mm, Merck) and 4 Å molecular sieve (Riedel-de Haën) were
used without additional cleaning.
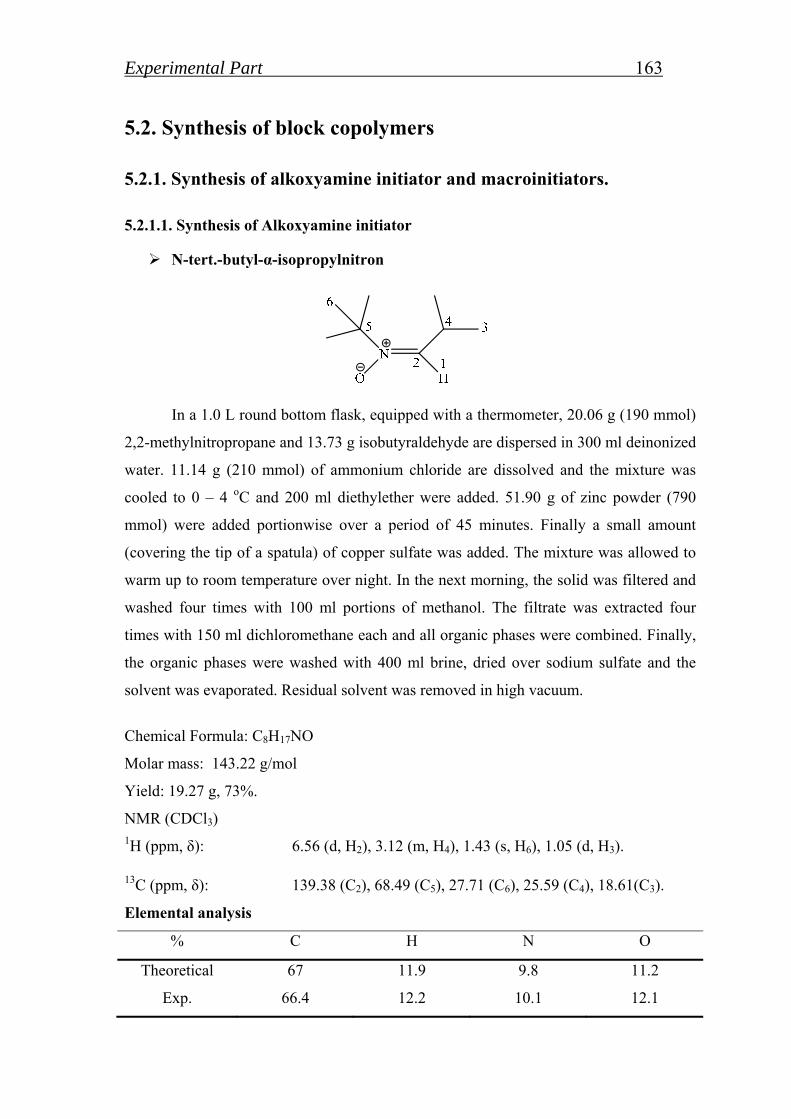
Experimental Part 163
5.2. Synthesis of block copolymers
5.2.1. Synthesis of alkoxyamine initiator and macroinitiators.
5.2.1.1. Synthesis of Alkoxyamine initiator
N-tert.-butyl-α-isopropylnitron
In a 1.0 L round bottom flask, equipped with a thermometer, 20.06 g (190 mmol)
2,2-methylnitropropane and 13.73 g isobutyraldehyde are dispersed in 300 ml deinonized
water. 11.14 g (210 mmol) of ammonium chloride are dissolved and the mixture was
cooled to 0 – 4 oC and 200 ml diethylether were added. 51.90 g of zinc powder (790
mmol) were added portionwise over a period of 45 minutes. Finally a small amount
(covering the tip of a spatula) of copper sulfate was added. The mixture was allowed to
warm up to room temperature over night. In the next morning, the solid was filtered and
washed four times with 100 ml portions of methanol. The filtrate was extracted four
times with 150 ml dichloromethane each and all organic phases were combined. Finally,
the organic phases were washed with 400 ml brine, dried over sodium sulfate and the
solvent was evaporated. Residual solvent was removed in high vacuum.
Chemical Formula: C8H17NO
Molar mass: 143.22 g/mol
Yield: 19.27 g, 73%.
NMR (CDCl3) 1H (ppm, δ): 6.56 (d, H2), 3.12 (m, H4), 1.43 (s, H6), 1.05 (d, H3).
13C (ppm, δ): 139.38 (C2), 68.49 (C5), 27.71 (C6), 25.59 (C4), 18.61(C3).
Elemental analysis
% C H N O
Theoretical 67 11.9 9.8 11.2
Exp. 66.4 12.2 10.1 12.1
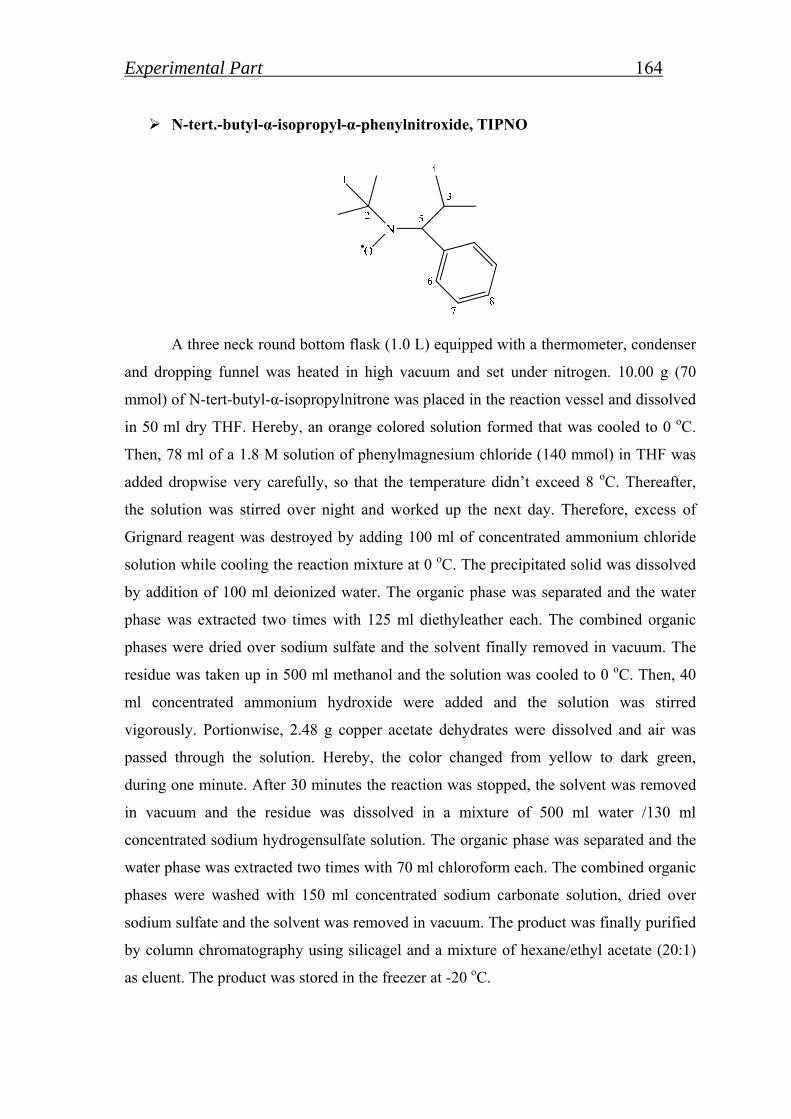
Experimental Part 164 N-tert.-butyl-α-isopropyl-α-phenylnitroxide, TIPNO
A three neck round bottom flask (1.0 L) equipped with a thermometer, condenser
and dropping funnel was heated in high vacuum and set under nitrogen. 10.00 g (70
mmol) of N-tert-butyl-α-isopropylnitrone was placed in the reaction vessel and dissolved
in 50 ml dry THF. Hereby, an orange colored solution formed that was cooled to 0 oC.
Then, 78 ml of a 1.8 M solution of phenylmagnesium chloride (140 mmol) in THF was
added dropwise very carefully, so that the temperature didn’t exceed 8 oC. Thereafter,
the solution was stirred over night and worked up the next day. Therefore, excess of
Grignard reagent was destroyed by adding 100 ml of concentrated ammonium chloride
solution while cooling the reaction mixture at 0 oC. The precipitated solid was dissolved
by addition of 100 ml deionized water. The organic phase was separated and the water
phase was extracted two times with 125 ml diethyleather each. The combined organic
phases were dried over sodium sulfate and the solvent finally removed in vacuum. The
residue was taken up in 500 ml methanol and the solution was cooled to 0 oC. Then, 40
ml concentrated ammonium hydroxide were added and the solution was stirred
vigorously. Portionwise, 2.48 g copper acetate dehydrates were dissolved and air was
passed through the solution. Hereby, the color changed from yellow to dark green,
during one minute. After 30 minutes the reaction was stopped, the solvent was removed
in vacuum and the residue was dissolved in a mixture of 500 ml water /130 ml
concentrated sodium hydrogensulfate solution. The organic phase was separated and the
water phase was extracted two times with 70 ml chloroform each. The combined organic
phases were washed with 150 ml concentrated sodium carbonate solution, dried over
sodium sulfate and the solvent was removed in vacuum. The product was finally purified
by column chromatography using silicagel and a mixture of hexane/ethyl acetate (20:1)
as eluent. The product was stored in the freezer at -20 oC.
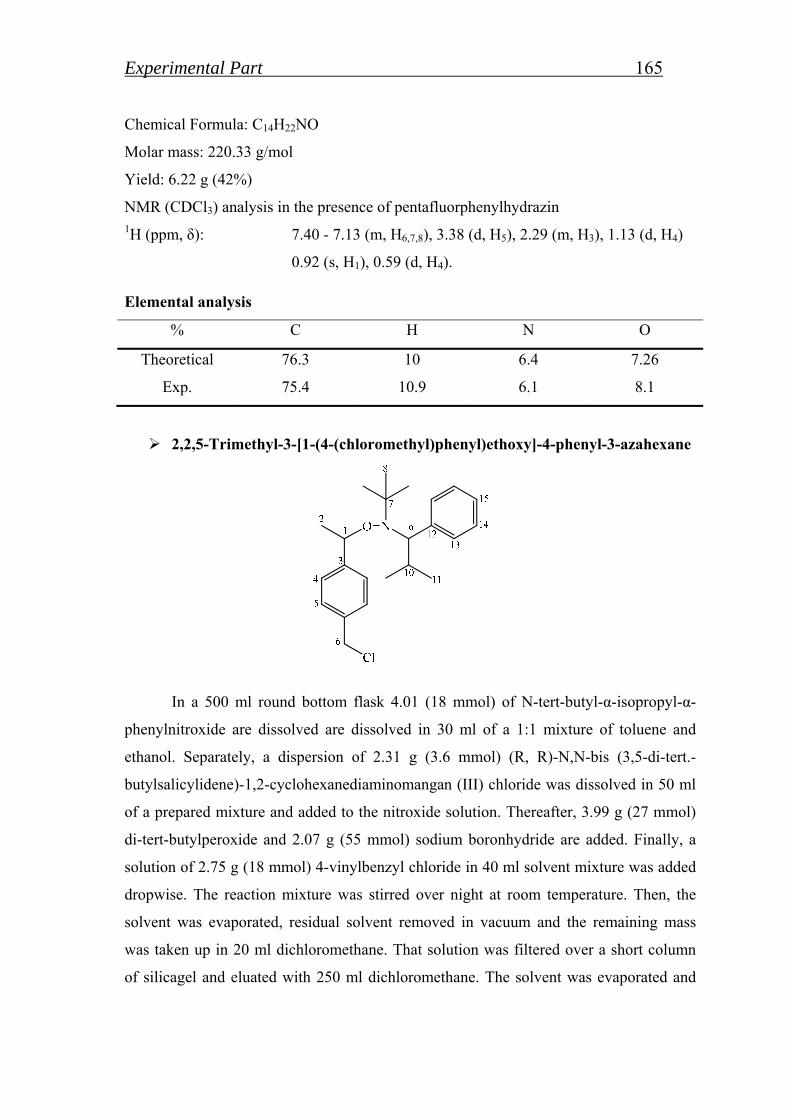
Experimental Part 165 Chemical Formula: C14H22NO
Molar mass: 220.33 g/mol
Yield: 6.22 g (42%)
NMR (CDCl3) analysis in the presence of pentafluorphenylhydrazin 1H (ppm, δ): 7.40 - 7.13 (m, H6,7,8), 3.38 (d, H5), 2.29 (m, H3), 1.13 (d, H4)
0.92 (s, H1), 0.59 (d, H4).
Elemental analysis
% C H N O
Theoretical 76.3 10 6.4 7.26
Exp. 75.4 10.9 6.1 8.1
2,2,5-Trimethyl-3-[1-(4-(chloromethyl)phenyl)ethoxy]-4-phenyl-3-azahexane
In a 500 ml round bottom flask 4.01 (18 mmol) of N-tert-butyl-α-isopropyl-α-
phenylnitroxide are dissolved are dissolved in 30 ml of a 1:1 mixture of toluene and
ethanol. Separately, a dispersion of 2.31 g (3.6 mmol) (R, R)-N,N-bis (3,5-di-tert.-
butylsalicylidene)-1,2-cyclohexanediaminomangan (III) chloride was dissolved in 50 ml
of a prepared mixture and added to the nitroxide solution. Thereafter, 3.99 g (27 mmol)
di-tert-butylperoxide and 2.07 g (55 mmol) sodium boronhydride are added. Finally, a
solution of 2.75 g (18 mmol) 4-vinylbenzyl chloride in 40 ml solvent mixture was added
dropwise. The reaction mixture was stirred over night at room temperature. Then, the
solvent was evaporated, residual solvent removed in vacuum and the remaining mass
was taken up in 20 ml dichloromethane. That solution was filtered over a short column
of silicagel and eluated with 250 ml dichloromethane. The solvent was evaporated and
Experimental Part 166 the crude product was purified by column chromatography using a hexane/ethylacetate
(100:1) as an eluent. Yield 5 g of viscous, colorless oil.
Chemical Formula: C23H32ClNO
Molar mass: 373.22 g/mol
Yield: 2.11 g, 35%
NMR (CDCl3) 1H (ppm, δ): 7.47-7.18 (m, H4,5,13,14,15); 4.92 (m, H1,x and H1,o); 4.55 (m, H6,x
and H6,o); 3.43 (d, H9,x); 3.31 (d, H9,o); 2.35 (m; H10,x); 1.64 (d,
H2,x); 1.60 (d, H2,o); 1.40 (m, H10,o); 1.32 (d, H11,x); 1.06 (s,
H8,o); 0.93 (d, H11,o); 0.79 ppm (s; H8,x) 0.55 (d; H11,x); 0.23 (d;
H11,o).
13C (ppm, δ): 145.73 (C8,x) 144.97 (C8,o); 142.41 (C12,x); 142.22 (C12,o);
130.94 (C13,x); 128.02, 127.99, 127.34, 127.23, 127.14, 126.59,
126.30, 126.12 (C5,14,15); 126.14 (C4,x); 126.95 (C4,o); 83.47
(C1,x); 82.77 (C1,o); 72.22 (C9,x); 72.15 (C9,o); 60.48 (C7,o);
60.35 (C7,x); 46.20 (C6,x); 46.09 (C6,o); 31.99 (C10,x); 31.59
(C10,o); 28.38 (C8,o); 28.19 (C8,x); 24.63 (C2,x); 23.13 (C2,o);
22.09 (C11,o); 21.02 (C11,o); 21.93 (C11,x); 21.13 ppm (C11,x).
Elemental analysis
% C H N O Cl
Theoretical 73.8 8.6 3.7 4.2 9.5
Exp. 72.3 8.9 3.4 --- ---
5.2.1.2. Synthesis of polystyrene macroinitiator
All polymerizations of styrene were carried out by preparing a mixture of the
alkoxyamine-Cl initiator (32.5 mg, 0.1 mmol), acetic anhydride (20.4 mg, 0.2 mmol),
and styrene (2.6 g, 25 mmol) were degassed by three freeze/ thaw cycles, sealed under
argon, and heated at 125 °C under nitrogen for 18 h. The solidified reaction mixture was
then dissolved in dichloromethane (5.0 mL) and precipitated twice into methanol. The
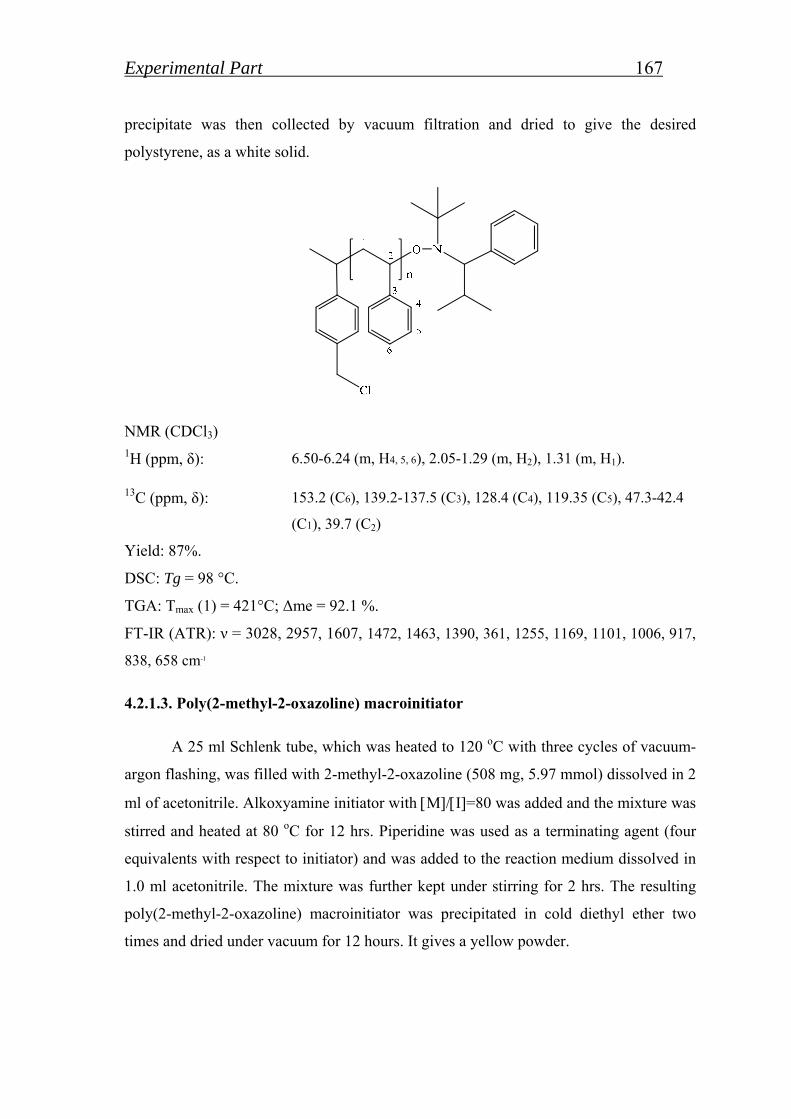
Experimental Part 167 precipitate was then collected by vacuum filtration and dried to give the desired
polystyrene, as a white solid.
NMR (CDCl3) 1H (ppm, δ): 6.50-6.24 (m, H4, 5, 6), 2.05-1.29 (m, H2), 1.31 (m, H1).
13C (ppm, δ): 153.2 (C6), 139.2-137.5 (C3), 128.4 (C4), 119.35 (C5), 47.3-42.4
(C1), 39.7 (C2)
Yield: 87%.
DSC: Tg = 98 °C.
TGA: Tmax (1) = 421°C; Δme = 92.1 %.
FT-IR (ATR): ν = 3028, 2957, 1607, 1472, 1463, 1390, 361, 1255, 1169, 1101, 1006, 917,
838, 658 cm-1
4.2.1.3. Poly(2-methyl-2-oxazoline) macroinitiator
A 25 ml Schlenk tube, which was heated to 120 oC with three cycles of vacuum-
argon flashing, was filled with 2-methyl-2-oxazoline (508 mg, 5.97 mmol) dissolved in 2
ml of acetonitrile. Alkoxyamine initiator with M/I=80 was added and the mixture was
stirred and heated at 80 oC for 12 hrs. Piperidine was used as a terminating agent (four
equivalents with respect to initiator) and was added to the reaction medium dissolved in
1.0 ml acetonitrile. The mixture was further kept under stirring for 2 hrs. The resulting
poly(2-methyl-2-oxazoline) macroinitiator was precipitated in cold diethyl ether two
times and dried under vacuum for 12 hours. It gives a yellow powder.
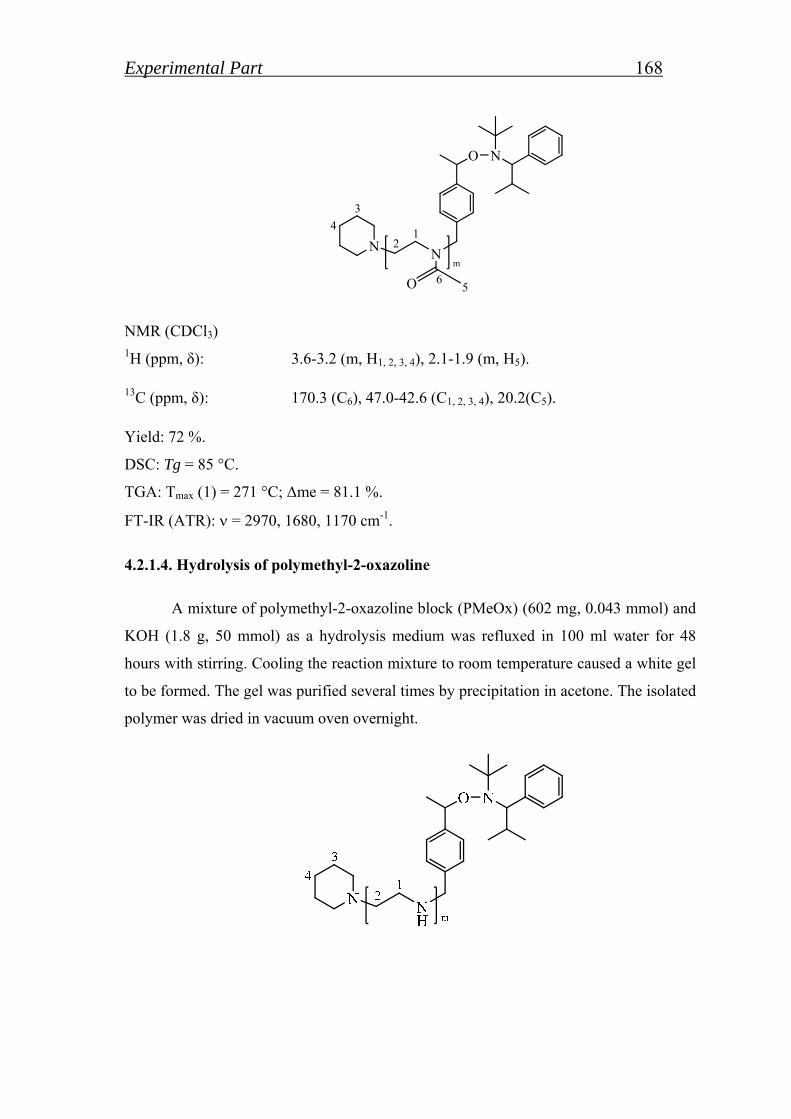
Experimental Part 168
O N
NNm
O
12
3
4
56
NMR (CDCl3) 1H (ppm, δ): 3.6-3.2 (m, H1, 2, 3, 4), 2.1-1.9 (m, H5).
13C (ppm, δ): 170.3 (C6), 47.0-42.6 (C1, 2, 3, 4), 20.2(C5).
Yield: 72 %.
DSC: Tg = 85 °C.
TGA: Tmax (1) = 271 °C; Δme = 81.1 %.
FT-IR (ATR): = 2970, 1680, 1170 cm-1.
4.2.1.4. Hydrolysis of polymethyl-2-oxazoline
A mixture of polymethyl-2-oxazoline block (PMeOx) (602 mg, 0.043 mmol) and
KOH (1.8 g, 50 mmol) as a hydrolysis medium was refluxed in 100 ml water for 48
hours with stirring. Cooling the reaction mixture to room temperature caused a white gel
to be formed. The gel was purified several times by precipitation in acetone. The isolated
polymer was dried in vacuum oven overnight.
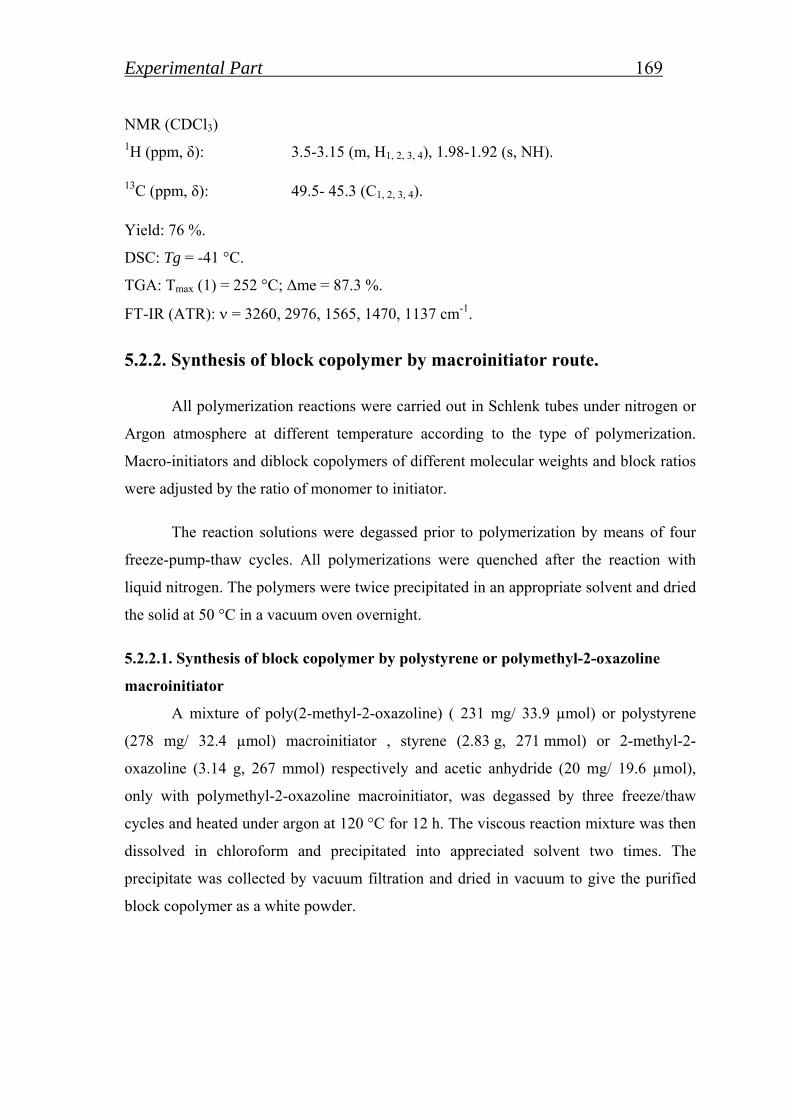
Experimental Part 169 NMR (CDCl3) 1H (ppm, δ): 3.5-3.15 (m, H1, 2, 3, 4), 1.98-1.92 (s, NH).
13C (ppm, δ): 49.5- 45.3 (C1, 2, 3, 4).
Yield: 76 %.
DSC: Tg = -41 °C.
TGA: Tmax (1) = 252 °C; Δme = 87.3 %.
FT-IR (ATR): = 3260, 2976, 1565, 1470, 1137 cm-1.
5.2.2. Synthesis of block copolymer by macroinitiator route.
All polymerization reactions were carried out in Schlenk tubes under nitrogen or
Argon atmosphere at different temperature according to the type of polymerization.
Macro-initiators and diblock copolymers of different molecular weights and block ratios
were adjusted by the ratio of monomer to initiator.
The reaction solutions were degassed prior to polymerization by means of four
freeze-pump-thaw cycles. All polymerizations were quenched after the reaction with
liquid nitrogen. The polymers were twice precipitated in an appropriate solvent and dried
the solid at 50 °C in a vacuum oven overnight.
5.2.2.1. Synthesis of block copolymer by polystyrene or polymethyl-2-oxazoline
macroinitiator
A mixture of poly(2-methyl-2-oxazoline) ( 231 mg/ 33.9 µmol) or polystyrene
(278 mg/ 32.4 µmol) macroinitiator , styrene (2.83 g, 271 mmol) or 2-methyl-2-
oxazoline (3.14 g, 267 mmol) respectively and acetic anhydride (20 mg/ 19.6 µmol),
only with polymethyl-2-oxazoline macroinitiator, was degassed by three freeze/thaw
cycles and heated under argon at 120 °C for 12 h. The viscous reaction mixture was then
dissolved in chloroform and precipitated into appreciated solvent two times. The
precipitate was collected by vacuum filtration and dried in vacuum to give the purified
block copolymer as a white powder.
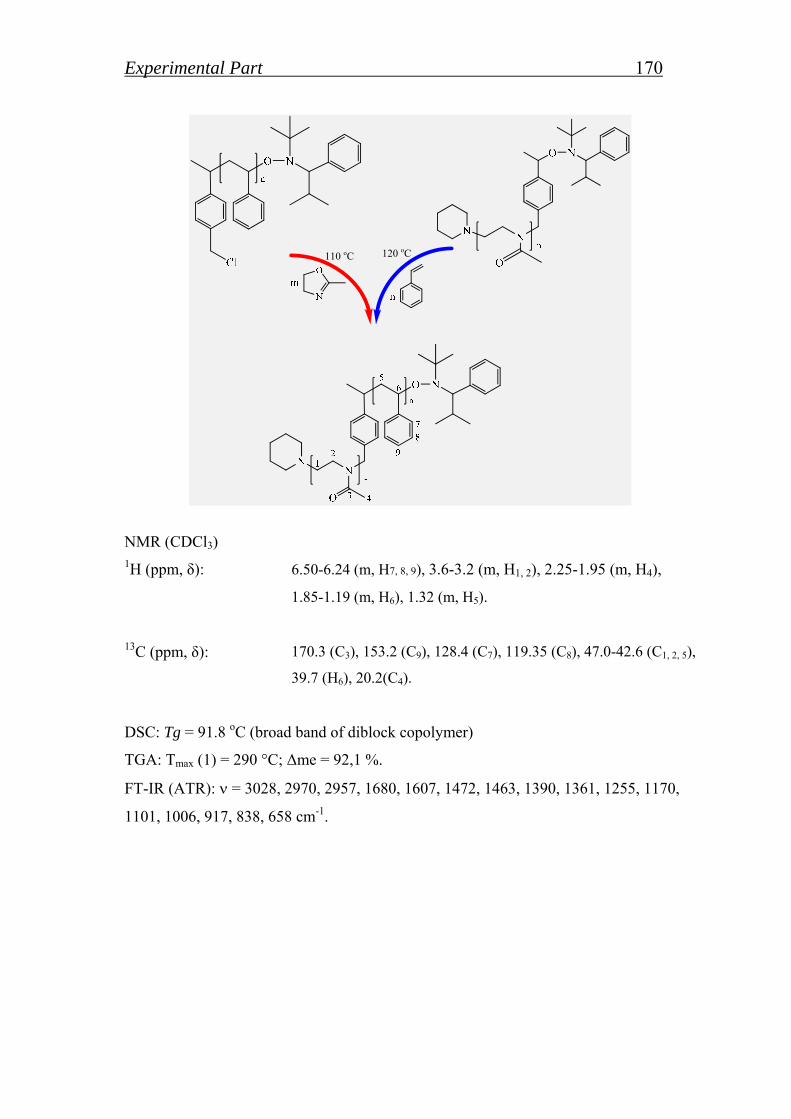
Experimental Part 170
NMR (CDCl3) 1H (ppm, δ): 6.50-6.24 (m, H7, 8, 9), 3.6-3.2 (m, H1, 2), 2.25-1.95 (m, H4),
1.85-1.19 (m, H6), 1.32 (m, H5).
13C (ppm, δ): 170.3 (C3), 153.2 (C9), 128.4 (C7), 119.35 (C8), 47.0-42.6 (C1, 2, 5),
39.7 (H6), 20.2(C4).
DSC: Tg = 91.8 oC (broad band of diblock copolymer)
TGA: Tmax (1) = 290 °C; Δme = 92,1 %.
FT-IR (ATR): = 3028, 2970, 2957, 1680, 1607, 1472, 1463, 1390, 1361, 1255, 1170,
1101, 1006, 917, 838, 658 cm-1.
120 oC 110 oC
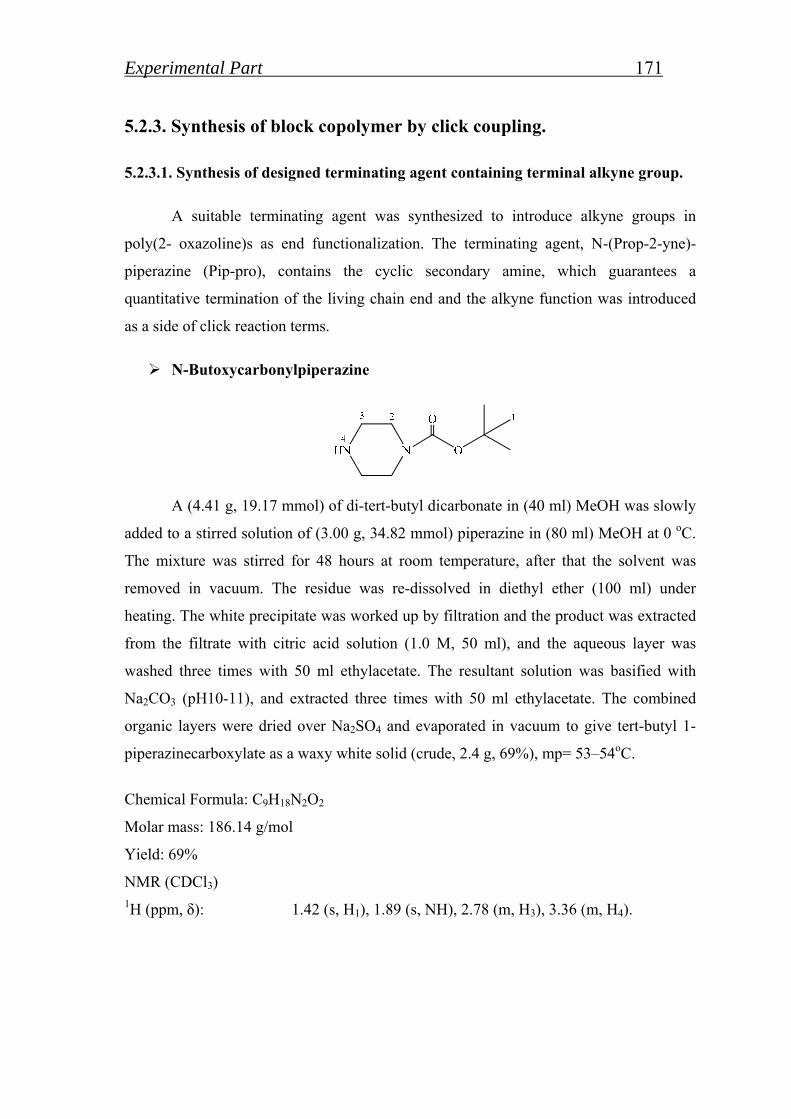
Experimental Part 171 5.2.3. Synthesis of block copolymer by click coupling.
5.2.3.1. Synthesis of designed terminating agent containing terminal alkyne group.
A suitable terminating agent was synthesized to introduce alkyne groups in
poly(2- oxazoline)s as end functionalization. The terminating agent, N-(Prop-2-yne)-
piperazine (Pip-pro), contains the cyclic secondary amine, which guarantees a
quantitative termination of the living chain end and the alkyne function was introduced
as a side of click reaction terms.
N-Butoxycarbonylpiperazine
A (4.41 g, 19.17 mmol) of di-tert-butyl dicarbonate in (40 ml) MeOH was slowly
added to a stirred solution of (3.00 g, 34.82 mmol) piperazine in (80 ml) MeOH at 0 oC.
The mixture was stirred for 48 hours at room temperature, after that the solvent was
removed in vacuum. The residue was re-dissolved in diethyl ether (100 ml) under
heating. The white precipitate was worked up by filtration and the product was extracted
from the filtrate with citric acid solution (1.0 M, 50 ml), and the aqueous layer was
washed three times with 50 ml ethylacetate. The resultant solution was basified with
Na2CO3 (pH10-11), and extracted three times with 50 ml ethylacetate. The combined
organic layers were dried over Na2SO4 and evaporated in vacuum to give tert-butyl 1-
piperazinecarboxylate as a waxy white solid (crude, 2.4 g, 69%), mp= 53–54oC.
Chemical Formula: C9H18N2O2
Molar mass: 186.14 g/mol
Yield: 69%
NMR (CDCl3) 1H (ppm, δ): 1.42 (s, H1), 1.89 (s, NH), 2.78 (m, H3), 3.36 (m, H4).
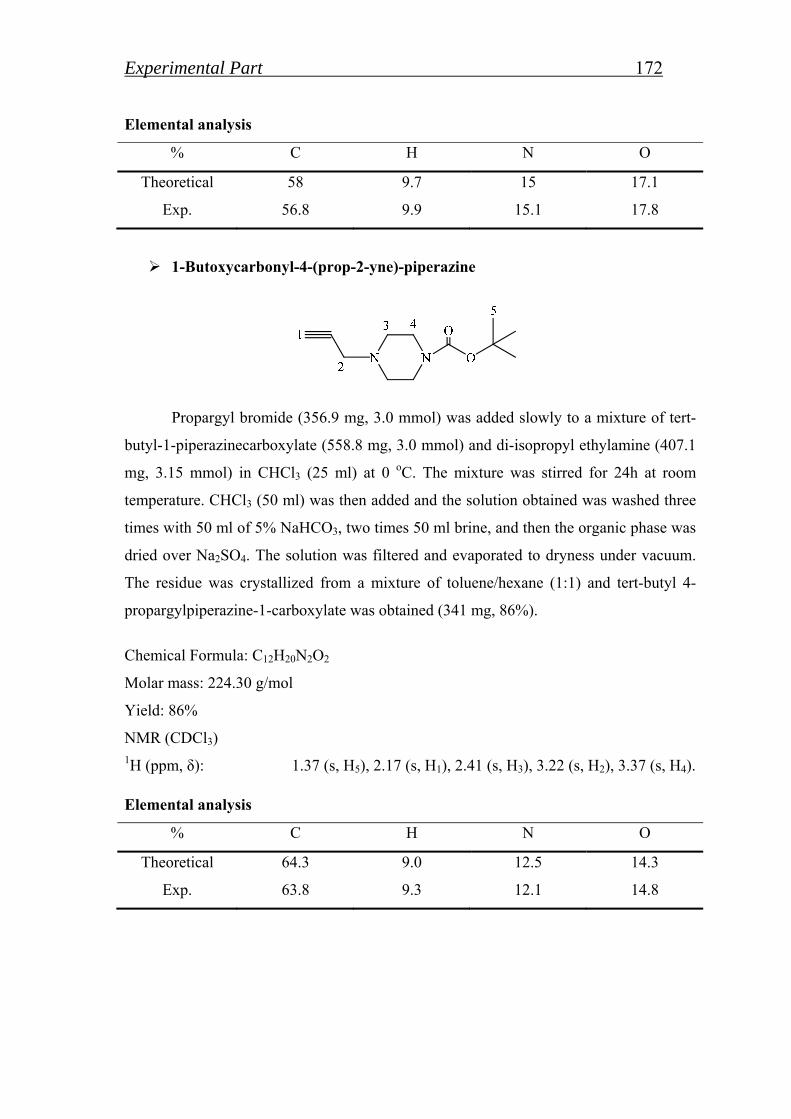
Experimental Part 172 Elemental analysis
% C H N O
Theoretical 58 9.7 15 17.1
Exp. 56.8 9.9 15.1 17.8
1-Butoxycarbonyl-4-(prop-2-yne)-piperazine
Propargyl bromide (356.9 mg, 3.0 mmol) was added slowly to a mixture of tert-
butyl-1-piperazinecarboxylate (558.8 mg, 3.0 mmol) and di-isopropyl ethylamine (407.1
mg, 3.15 mmol) in CHCl3 (25 ml) at 0 oC. The mixture was stirred for 24h at room
temperature. CHCl3 (50 ml) was then added and the solution obtained was washed three
times with 50 ml of 5% NaHCO3, two times 50 ml brine, and then the organic phase was
dried over Na2SO4. The solution was filtered and evaporated to dryness under vacuum.
The residue was crystallized from a mixture of toluene/hexane (1:1) and tert-butyl 4-
propargylpiperazine-1-carboxylate was obtained (341 mg, 86%).
Chemical Formula: C12H20N2O2
Molar mass: 224.30 g/mol
Yield: 86%
NMR (CDCl3) 1H (ppm, δ): 1.37 (s, H5), 2.17 (s, H1), 2.41 (s, H3), 3.22 (s, H2), 3.37 (s, H4).
Elemental analysis
% C H N O
Theoretical 64.3 9.0 12.5 14.3
Exp. 63.8 9.3 12.1 14.8
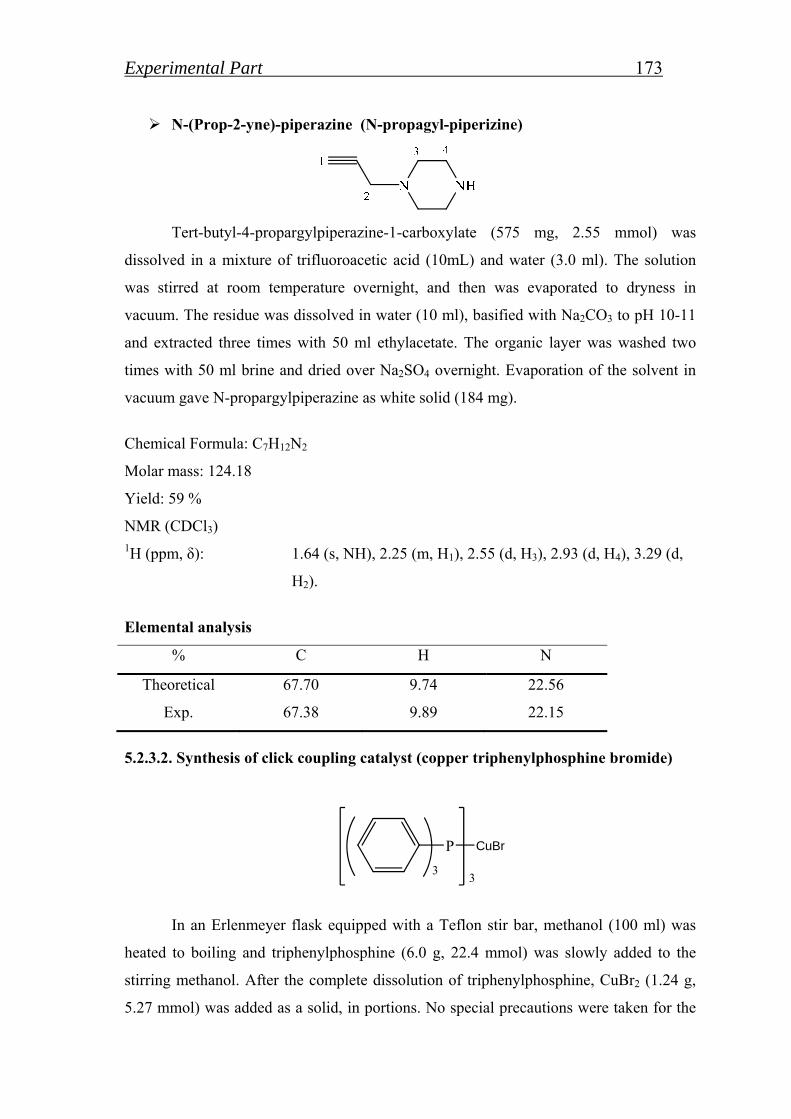
Experimental Part 173 N-(Prop-2-yne)-piperazine (N-propagyl-piperizine)
Tert-butyl-4-propargylpiperazine-1-carboxylate (575 mg, 2.55 mmol) was
dissolved in a mixture of trifluoroacetic acid (10mL) and water (3.0 ml). The solution
was stirred at room temperature overnight, and then was evaporated to dryness in
vacuum. The residue was dissolved in water (10 ml), basified with Na2CO3 to pH 10-11
and extracted three times with 50 ml ethylacetate. The organic layer was washed two
times with 50 ml brine and dried over Na2SO4 overnight. Evaporation of the solvent in
vacuum gave N-propargylpiperazine as white solid (184 mg).
Chemical Formula: C7H12N2
Molar mass: 124.18
Yield: 59 %
NMR (CDCl3) 1H (ppm, δ): 1.64 (s, NH), 2.25 (m, H1), 2.55 (d, H3), 2.93 (d, H4), 3.29 (d,
H2).
Elemental analysis
% C H N
Theoretical 67.70 9.74 22.56
Exp. 67.38 9.89 22.15
5.2.3.2. Synthesis of click coupling catalyst (copper triphenylphosphine bromide)
P CuBr
33
In an Erlenmeyer flask equipped with a Teflon stir bar, methanol (100 ml) was
heated to boiling and triphenylphosphine (6.0 g, 22.4 mmol) was slowly added to the
stirring methanol. After the complete dissolution of triphenylphosphine, CuBr2 (1.24 g,
5.27 mmol) was added as a solid, in portions. No special precautions were taken for the
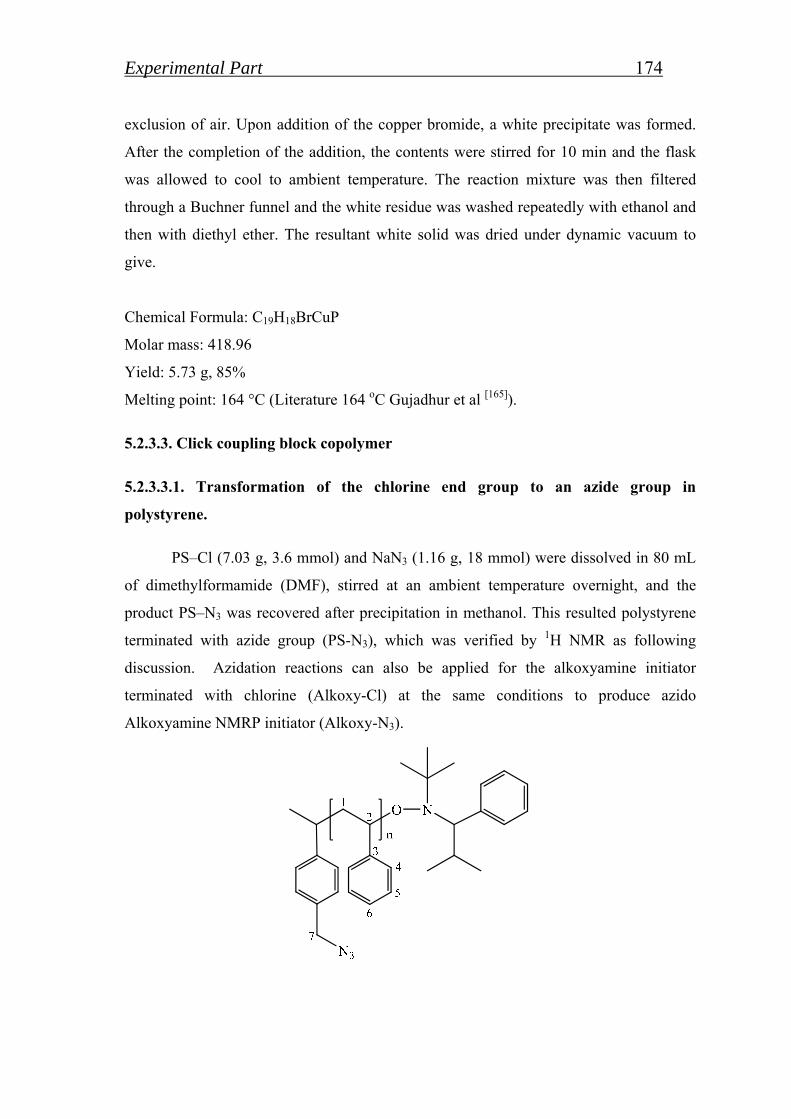
Experimental Part 174 exclusion of air. Upon addition of the copper bromide, a white precipitate was formed.
After the completion of the addition, the contents were stirred for 10 min and the flask
was allowed to cool to ambient temperature. The reaction mixture was then filtered
through a Buchner funnel and the white residue was washed repeatedly with ethanol and
then with diethyl ether. The resultant white solid was dried under dynamic vacuum to
give.
Chemical Formula: C19H18BrCuP
Molar mass: 418.96
Yield: 5.73 g, 85%
Melting point: 164 °C (Literature 164 oC Gujadhur et al [165]).
5.2.3.3. Click coupling block copolymer
5.2.3.3.1. Transformation of the chlorine end group to an azide group in
polystyrene.
PS–Cl (7.03 g, 3.6 mmol) and NaN3 (1.16 g, 18 mmol) were dissolved in 80 mL
of dimethylformamide (DMF), stirred at an ambient temperature overnight, and the
product PS–N3 was recovered after precipitation in methanol. This resulted polystyrene
terminated with azide group (PS-N3), which was verified by 1H NMR as following
discussion. Azidation reactions can also be applied for the alkoxyamine initiator
terminated with chlorine (Alkoxy-Cl) at the same conditions to produce azido
Alkoxyamine NMRP initiator (Alkoxy-N3).
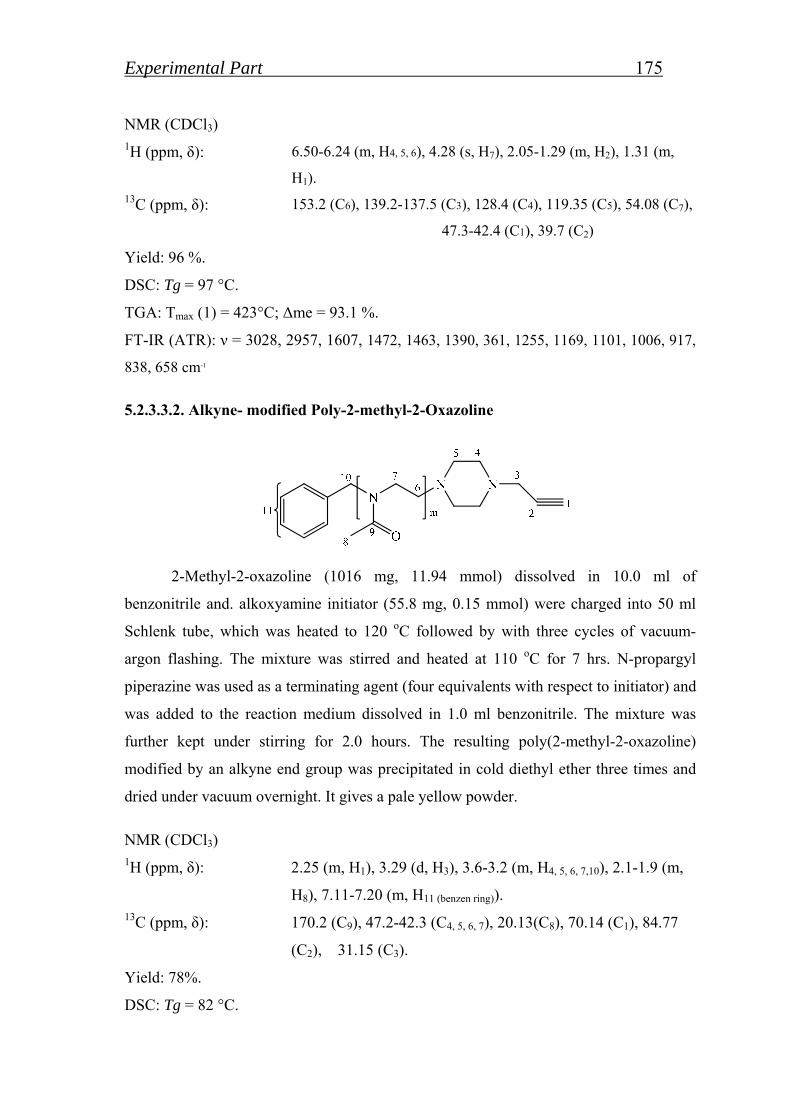
Experimental Part 175 NMR (CDCl3) 1H (ppm, δ): 6.50-6.24 (m, H4, 5, 6), 4.28 (s, H7), 2.05-1.29 (m, H2), 1.31 (m,
H1). 13C (ppm, δ): 153.2 (C6), 139.2-137.5 (C3), 128.4 (C4), 119.35 (C5), 54.08 (C7),
47.3-42.4 (C1), 39.7 (C2)
Yield: 96 %.
DSC: Tg = 97 °C.
TGA: Tmax (1) = 423°C; Δme = 93.1 %.
FT-IR (ATR): ν = 3028, 2957, 1607, 1472, 1463, 1390, 361, 1255, 1169, 1101, 1006, 917,
838, 658 cm-1
5.2.3.3.2. Alkyne- modified Poly-2-methyl-2-Oxazoline
2-Methyl-2-oxazoline (1016 mg, 11.94 mmol) dissolved in 10.0 ml of
benzonitrile and. alkoxyamine initiator (55.8 mg, 0.15 mmol) were charged into 50 ml
Schlenk tube, which was heated to 120 oC followed by with three cycles of vacuum-
argon flashing. The mixture was stirred and heated at 110 oC for 7 hrs. N-propargyl
piperazine was used as a terminating agent (four equivalents with respect to initiator) and
was added to the reaction medium dissolved in 1.0 ml benzonitrile. The mixture was
further kept under stirring for 2.0 hours. The resulting poly(2-methyl-2-oxazoline)
modified by an alkyne end group was precipitated in cold diethyl ether three times and
dried under vacuum overnight. It gives a pale yellow powder.
NMR (CDCl3) 1H (ppm, δ): 2.25 (m, H1), 3.29 (d, H3), 3.6-3.2 (m, H4, 5, 6, 7,10), 2.1-1.9 (m,
H8), 7.11-7.20 (m, H11 (benzen ring)). 13C (ppm, δ): 170.2 (C9), 47.2-42.3 (C4, 5, 6, 7), 20.13(C8), 70.14 (C1), 84.77
(C2), 31.15 (C3).
Yield: 78%.
DSC: Tg = 82 °C.
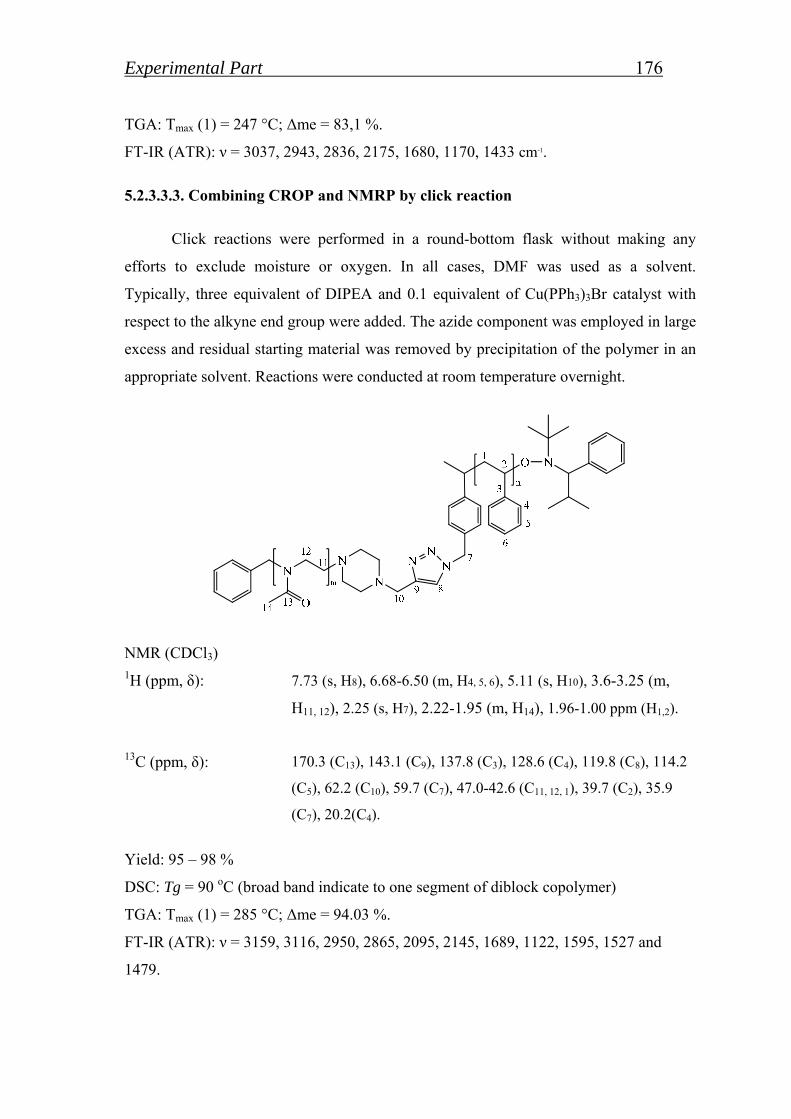
Experimental Part 176 TGA: Tmax (1) = 247 °C; Δme = 83,1 %.
FT-IR (ATR): ν = 3037, 2943, 2836, 2175, 1680, 1170, 1433 cm-1.
5.2.3.3.3. Combining CROP and NMRP by click reaction
Click reactions were performed in a round-bottom flask without making any
efforts to exclude moisture or oxygen. In all cases, DMF was used as a solvent.
Typically, three equivalent of DIPEA and 0.1 equivalent of Cu(PPh3)3Br catalyst with
respect to the alkyne end group were added. The azide component was employed in large
excess and residual starting material was removed by precipitation of the polymer in an
appropriate solvent. Reactions were conducted at room temperature overnight.
NMR (CDCl3) 1H (ppm, δ): 7.73 (s, H8), 6.68-6.50 (m, H4, 5, 6), 5.11 (s, H10), 3.6-3.25 (m,
H11, 12), 2.25 (s, H7), 2.22-1.95 (m, H14), 1.96-1.00 ppm (H1,2).
13C (ppm, δ): 170.3 (C13), 143.1 (C9), 137.8 (C3), 128.6 (C4), 119.8 (C8), 114.2
(C5), 62.2 (C10), 59.7 (C7), 47.0-42.6 (C11, 12, 1), 39.7 (C2), 35.9
(C7), 20.2(C4).
Yield: 95 – 98 %
DSC: Tg = 90 oC (broad band indicate to one segment of diblock copolymer)
TGA: Tmax (1) = 285 °C; Δme = 94.03 %.
FT-IR (ATR): ν = 3159, 3116, 2950, 2865, 2095, 2145, 1689, 1122, 1595, 1527 and
1479.
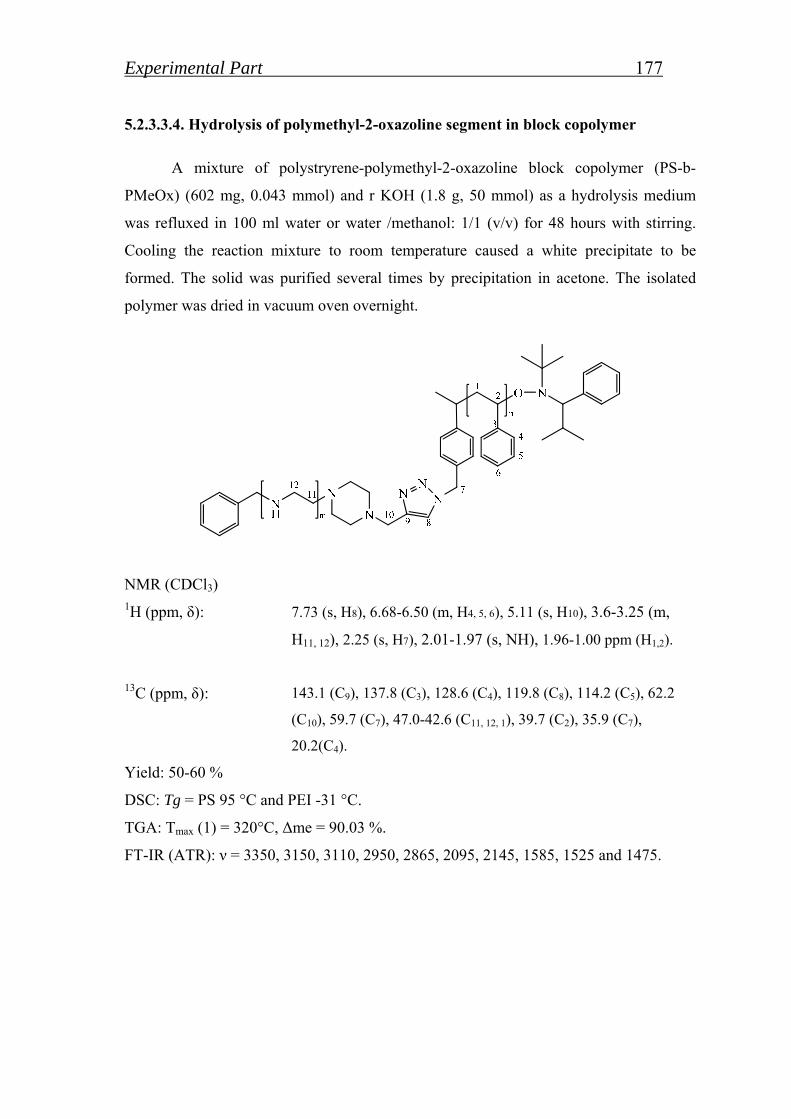
Experimental Part 177 5.2.3.3.4. Hydrolysis of polymethyl-2-oxazoline segment in block copolymer
A mixture of polystryrene-polymethyl-2-oxazoline block copolymer (PS-b-
PMeOx) (602 mg, 0.043 mmol) and r KOH (1.8 g, 50 mmol) as a hydrolysis medium
was refluxed in 100 ml water or water /methanol: 1/1 (v/v) for 48 hours with stirring.
Cooling the reaction mixture to room temperature caused a white precipitate to be
formed. The solid was purified several times by precipitation in acetone. The isolated
polymer was dried in vacuum oven overnight.
NMR (CDCl3) 1H (ppm, δ): 7.73 (s, H8), 6.68-6.50 (m, H4, 5, 6), 5.11 (s, H10), 3.6-3.25 (m,
H11, 12), 2.25 (s, H7), 2.01-1.97 (s, NH), 1.96-1.00 ppm (H1,2).
13C (ppm, δ): 143.1 (C9), 137.8 (C3), 128.6 (C4), 119.8 (C8), 114.2 (C5), 62.2
(C10), 59.7 (C7), 47.0-42.6 (C11, 12, 1), 39.7 (C2), 35.9 (C7),
20.2(C4).
Yield: 50-60 %
DSC: Tg = PS 95 °C and PEI -31 °C.
TGA: Tmax (1) = 320°C, Δme = 90.03 %.
FT-IR (ATR): ν = 3350, 3150, 3110, 2950, 2865, 2095, 2145, 1585, 1525 and 1475.
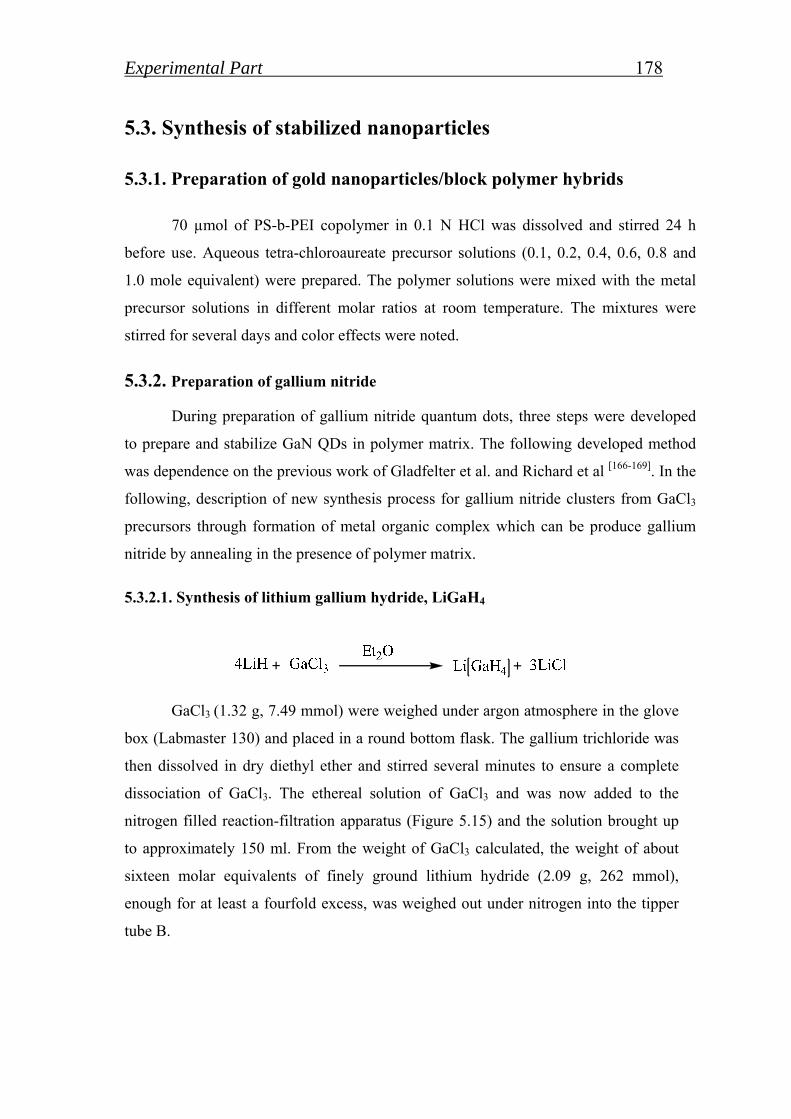
Experimental Part 178
5.3. Synthesis of stabilized nanoparticles
5.3.1. Preparation of gold nanoparticles/block polymer hybrids
70 µmol of PS-b-PEI copolymer in 0.1 N HCl was dissolved and stirred 24 h
before use. Aqueous tetra-chloroaureate precursor solutions (0.1, 0.2, 0.4, 0.6, 0.8 and
1.0 mole equivalent) were prepared. The polymer solutions were mixed with the metal
precursor solutions in different molar ratios at room temperature. The mixtures were
stirred for several days and color effects were noted.
5.3.2. Preparation of gallium nitride
During preparation of gallium nitride quantum dots, three steps were developed
to prepare and stabilize GaN QDs in polymer matrix. The following developed method
was dependence on the previous work of Gladfelter et al. and Richard et al [166-169]. In the
following, description of new synthesis process for gallium nitride clusters from GaCl3
precursors through formation of metal organic complex which can be produce gallium
nitride by annealing in the presence of polymer matrix.
5.3.2.1. Synthesis of lithium gallium hydride, LiGaH4
GaCl3 (1.32 g, 7.49 mmol) were weighed under argon atmosphere in the glove
box (Labmaster 130) and placed in a round bottom flask. The gallium trichloride was
then dissolved in dry diethyl ether and stirred several minutes to ensure a complete
dissociation of GaCl3. The ethereal solution of GaCl3 and was now added to the
nitrogen filled reaction-filtration apparatus (Figure 5.15) and the solution brought up
to approximately 150 ml. From the weight of GaCl3 calculated, the weight of about
sixteen molar equivalents of finely ground lithium hydride (2.09 g, 262 mmol),
enough for at least a fourfold excess, was weighed out under nitrogen into the tipper
tube B.
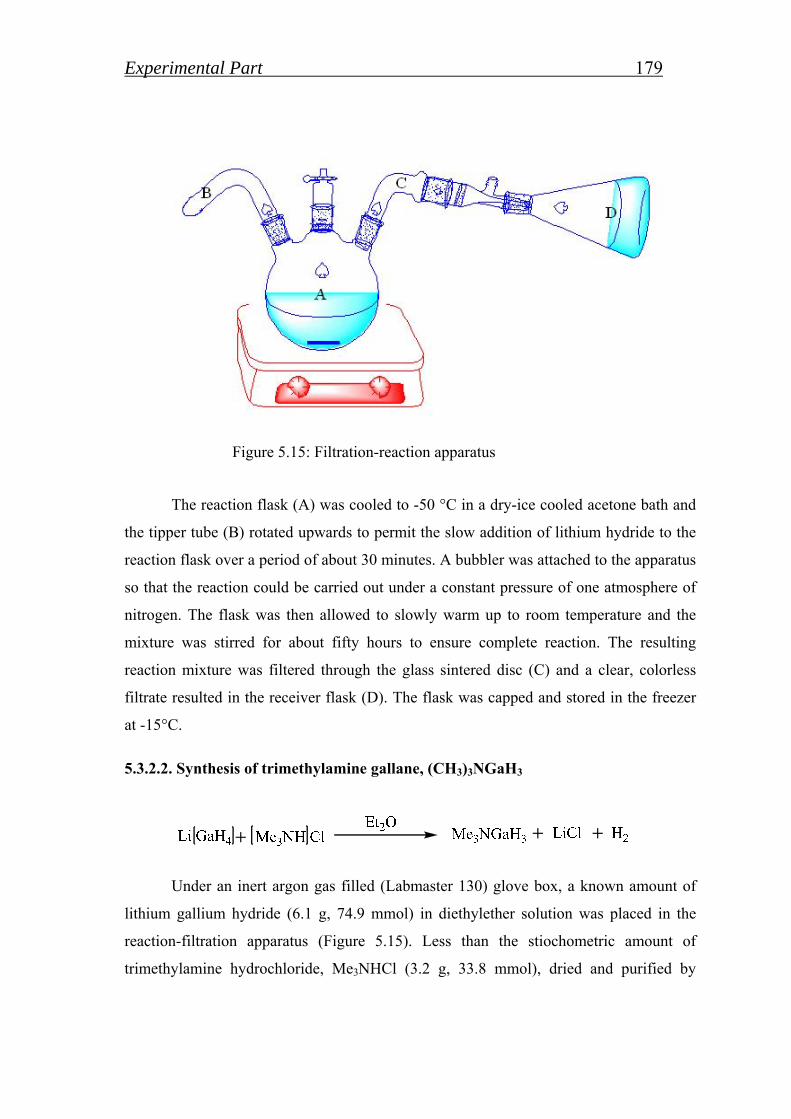
Experimental Part 179
Figure 5.15: Filtration-reaction apparatus
The reaction flask (A) was cooled to -50 °C in a dry-ice cooled acetone bath and
the tipper tube (B) rotated upwards to permit the slow addition of lithium hydride to the
reaction flask over a period of about 30 minutes. A bubbler was attached to the apparatus
so that the reaction could be carried out under a constant pressure of one atmosphere of
nitrogen. The flask was then allowed to slowly warm up to room temperature and the
mixture was stirred for about fifty hours to ensure complete reaction. The resulting
reaction mixture was filtered through the glass sintered disc (C) and a clear, colorless
filtrate resulted in the receiver flask (D). The flask was capped and stored in the freezer
at -15°C.
5.3.2.2. Synthesis of trimethylamine gallane, (CH3)3NGaH3
Under an inert argon gas filled (Labmaster 130) glove box, a known amount of
lithium gallium hydride (6.1 g, 74.9 mmol) in diethylether solution was placed in the
reaction-filtration apparatus (Figure 5.15). Less than the stiochometric amount of
trimethylamine hydrochloride, Me3NHCl (3.2 g, 33.8 mmol), dried and purified by
Experimental Part 180 sublimation, was placed in the tipper tube (B) of the apparatus which contained a
nitrogen atmosphere.
The ether solution of LiGaH4, was first cooled to -50 °C in a dry-ice cooled
acetone bath, as the trimethylamine hydrochloride was added over a period of about ten
minutes. The solution was slowly warmed to room temperature and stirred for about four
hours to ensure complete reaction. The solution was then filtered through the glass sinter
(C) and the receiver flask (D) containing the clear ether solution was attached to the
sublimation apparatus. This apparatus was attached to the vacuum line and the ether was
pumped off at -50 °C. When most of the ether was removed, the receiver flask containing
the remaining residue was warmed to 0 °C while the sublimation apparatus was
immersed in a dry-ice cooled acetone bath. The pure trimethylamine gallane was vacuum
sublimed as long, needle-like crystals into the sublimation apparatus. The yield was (2.1
g, 15.7 mmol) of trimethylamine gallane.
5.3.2.3. Synthesis of gallium nitride QDs
GaN was synthesised in the polymer matrix by in situ formation, and subsequent
decomposition of cyclotrigallazane. In a glove box (Labmaster 130) filled with argon
gas, trimethylamine gallane (Me3NGaH3) was dissolved in toluene and added to a
solution of PS-b-PEI block copolymer in a modified Schlenk tube at room temperature.
During this process, addition of Me3NGaH3 to the polymer caused the trimethylamine to
be displaced by the nitrogen donors such that PEI units complexed the gallane. The
mixture was next stirred for 12 hrs and then cooled to about -78 oC and treated with
excess ammonia, resulting in the conversion of gallane to cyclotrigallazane. This was
followed by removed of the volatiles under reduced pressure to give an opaque polymer,
which was subsequently heated at 165 oC under reduced pressure for 72 hrs, resulting in
the conversion of cyclotrigallazane to GaN [170;171], within the PEI domains of the block
copolymer.
5.4. Polymer thin films
Every day we are exposed to a myriad of applications of polymer thin films. The
growth in the interest of polymer thin films has been catalyzed by the increase in the
number of techniques available to characterize thin polymer films. While these
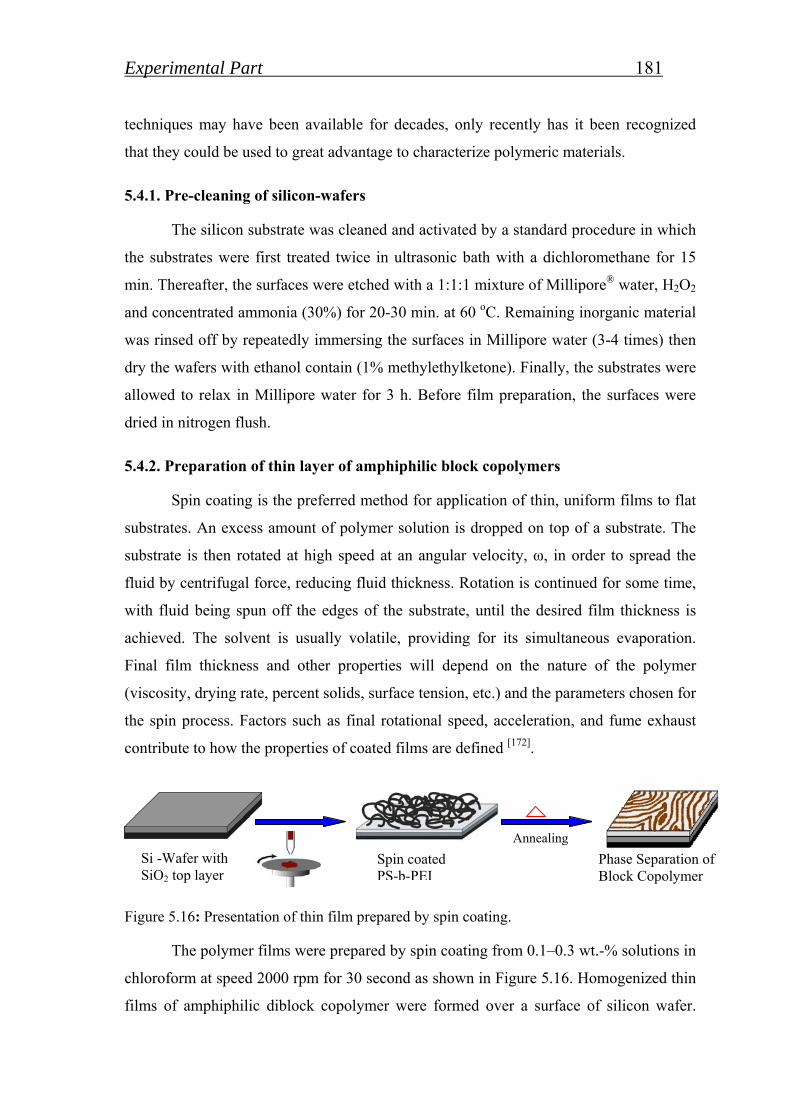
Experimental Part 181 techniques may have been available for decades, only recently has it been recognized
that they could be used to great advantage to characterize polymeric materials.
5.4.1. Pre-cleaning of silicon-wafers
The silicon substrate was cleaned and activated by a standard procedure in which
the substrates were first treated twice in ultrasonic bath with a dichloromethane for 15
min. Thereafter, the surfaces were etched with a 1:1:1 mixture of Millipore® water, H2O2
and concentrated ammonia (30%) for 20-30 min. at 60 oC. Remaining inorganic material
was rinsed off by repeatedly immersing the surfaces in Millipore water (3-4 times) then
dry the wafers with ethanol contain (1% methylethylketone). Finally, the substrates were
allowed to relax in Millipore water for 3 h. Before film preparation, the surfaces were
dried in nitrogen flush.
5.4.2. Preparation of thin layer of amphiphilic block copolymers
Spin coating is the preferred method for application of thin, uniform films to flat
substrates. An excess amount of polymer solution is dropped on top of a substrate. The
substrate is then rotated at high speed at an angular velocity, ω, in order to spread the
fluid by centrifugal force, reducing fluid thickness. Rotation is continued for some time,
with fluid being spun off the edges of the substrate, until the desired film thickness is
achieved. The solvent is usually volatile, providing for its simultaneous evaporation.
Final film thickness and other properties will depend on the nature of the polymer
(viscosity, drying rate, percent solids, surface tension, etc.) and the parameters chosen for
the spin process. Factors such as final rotational speed, acceleration, and fume exhaust
contribute to how the properties of coated films are defined [172].
Figure 5.16: Presentation of thin film prepared by spin coating.
The polymer films were prepared by spin coating from 0.1–0.3 wt.-% solutions in
chloroform at speed 2000 rpm for 30 second as shown in Figure 5.16. Homogenized thin
films of amphiphilic diblock copolymer were formed over a surface of silicon wafer.
Si -Wafer with SiO2 top layer
Spin coated PS-b-PEI
Annealing
Phase Separation of Block Copolymer

Experimental Part 182 After that all samples were annealed at 100 oC for one hour. This procedure was applied
for diblock copolymer in presence and absence of stabilized gold nanoparticles or
gallium nitride quantum dots in polymer cage.
References 183
6. References
[1] B. Susana, Synlett 2001, 4 563.
[2] C. J. Hawker, Accounts of Chemical Research 1997, 30 373-382.
[3] O. L. Lebedev, S. N. Kazarnovskii, Zhur.Obshch.Khim 1960, 30 1631-1635.
[4] F. Montanari, S. Quici, H. Henry-Riyad, T. T. Tidwell, 2,2,6,6-Tetramethylpiperidin-1-oxyl"Encyclopedia of Reagents for Organic Synthesis", John Wiley & Sons, 2005.
[5] A. L. Zanocco, A. Y. Canetem., M. X. Melendez, Bol.Soc.Chil.Quím. 2010, 45 123-129.
[6] M. K. Georges, R. P. N. Veregin, P. M. Kazmaier, G. K. Hamer, Macromolecules 1993, 26 2987-2988.
[7] G. Moad, D. H. Solomon, S. R. Johns, R. I. Willing, Macromolecules 1982, 15 1188-1191.
[8] C. H. J. Johnson, G. Moad, D. H. Solomon, T. H. Spurling, Aust.J.Chem. 1986, 39 1943-1950.
[9] C. J. Hawker, G. G. Barclay, A. Orellana, J. Dao, W. Devonport, Macromolecules 1996, 29 5245-5254.
[10] V. Sciannamea, R. Jerome, C. Detrembleur, Chemical Reviews 2008, 108 1104-1126.
[11] D. Benoit, V. Chaplinski, R. Braslau, C. J. Hawker, Journal of the American Chemical Society 1999, 121 3904-3920.
[12] C. J. Hawker, A. W. Bosman, E. Harth, Chemical Reviews 2001, 101 3661-3688.
[13] S. L. Vander Velde, E. N. Jacobsen, The Journal of Organic Chemistry 1995, 60 5380-5381.
[14] M. Yu, H. C. Malinakova, K. W. Stagliano, The Journal of Organic Chemistry 2006, 71 6648-6651.
[15] P. B. Zetterlund, Y. Kagawa, M. Okubo, Chemical Reviews 2008, 108 3747-3794.
[16] M. K. Georges, R. P. N. Veregin, P. M. Kazmaier, G. K. Hamer, M. Saban, Macromolecules 1994, 27 7228-7229.
[17] E. Malmstrom, R. D. Miller, C. J. Hawker, Tetrahedron 1997, 53 15225-15236.
[18] A. W. Hui, A. E. Hamielec, Journal of Applied Polymer Science 1972, 16 749-753..
[19] R. K. Iha, K. L. Wooley, A. M. Nystroêm, D. J. Burke, M. J. Kade, C. J. Hawker, Chemical Reviews 2009, 109 5620-5686.
References 184
[20] Nicholas.P.Cheremisinoff, Polymer Characterization : Laboratory Techniques and
Analysis, Noyes Publications, Westwood, New Jersey 2010.
[21] L. Mueller, W. Jakubowski, W. Tang, K. Matyjaszewski, Macromolecules 2007, 40 6464-6472.
[22] T. Fukuda, T. Terauchi, A. Goto, Y. Tsujii, T. Miyamoto, Y. Shimizu, Macromolecules 1996, 29 3050-3052.
[23] P. M. Kazmaier, K. Daimon, M. K. Georges, G. K. Hamer, R. P. N. Veregin, Macromolecules 1997, 30 2228-2231.
[24] P. B. Zetterlund, Y. Kagawa, M. Okubo, Chemical Reviews 2008, 108 3747-3794.
[25] E. Yoshida, T. Ishizone, A. Hirao, S. Nakahama, T. Takata, T. Endo, Macromolecules 1994, 27 3119-3124.
[26] N. A. Listigovers, M. K. Georges, P. G. Odell, B. Keoshkerian, Macromolecules 1996, 29 8992-8993.
[27] M. Steenbock, M. Klapper, K. Mullen, N. Pinhal, M. Hubrich, Acta Polymerica 1996, 47 276-279.
[28] O. Nuyken, J. Rueda-Sanchez, B. Voit, Polymer Bulletin 1997, 38 657-664.
[29] K. Tsutsumiuchi, K. Aoi, M. Okada, Macromolecules 1997, 30 4013-4017.
[30] M. Meyer, H. Schlaad, Macromolecules 2006, 39 3967-3970.
[31] J. Y. Chang, P. J. Park, M. J. Han, Macromolecules 1999, 33 321-325.
[32] C. R. Becer, R. M. Paulus, S. Hoêppener, R. Hoogenboom, C. A. ü. Fustin, J. F. Gohy, U. S. Schubert, Macromolecules 2008, 41 5210-5215.
[33] S. Fleischmann, H. Komber, B. Voit, Macromolecules 2008, 41 5255-5264.
[34] J. Ruehl, N. L. Hill, E. D. Walter, G. Millhauser, R. Braslau, Macromolecules 2008, 41 1972-1982.
[35] O. W. Webster, Science 1991, 251 887-893.
[36] W. Van Camp, V. Germonpre, L. Mespouille, P. Dubois, E. J. Goethals, F. E. Du Prez, Reactive & Functional Polymers 2007, 67 1168-1180.
[37] J. A. Opsteen, J. C. M. Van Hest, Journal of Polymer Science Part A-Polymer Chemistry 2007, 45 2913-2924.
[38] D. Quemener, T. P. Davis, C. Barner-Kowollik, M. H. Stenzel, Chem.Commun. 2006, 5051-5053.
[39] D. Quemener, M. Le Hellaye, C. Bissett, T. P. Davis, C. Barner-Kowollik, M. H. Stenzel, Journal of Polymer Science Part A-Polymer Chemistry 2008, 46 155-173.
References 185
[40] Z. An, W. Tang, M. Wu, Z. Jiao, G. D. Stucky, Chem.Commun. 2008, 6501-6503.
[41] Y. Li, B. C. Benicewicz, Macromolecules 2008, 41 7986-7992.
[42] R. Ranjan, W. J. Brittain, Macromolecular Rapid Communications 2008, 29 1104-1110.
[43] H. Durmaz, A. Dag, E. Erdogan, A. L. Demirel, G. Hizal, U. Tunca, Journal of Polymer Science Part A-Polymer Chemistry 2010, 48 99-108.
[44] L. P. Yang, H. X. Zhou, G. Y. Shi, Y. Wang, C. Y. Pan, Journal of Polymer Science Part A-Polymer Chemistry 2008, 46 6641-6653.
[45] T. Zhang, Z. H. Zheng, X. B. Ding, Y. X. Peng, Macromolecular Rapid Communications 2008, 29 1716-1720.
[46] C. W. Tornöe, C. Christensen, M. Meldal, The Journal of Organic Chemistry 2002, 67 3057-3064.
[47] V. V. Rostovtsev, L. G. Green, V. V. Fokin, K. B. Sharpless, Angewandte Chemie International Edition 2002, 41 2596-2599.
[48] R. Manetsch, A. Krasiäski, Z. Radiç, J. Raushel, P. Taylor, K. B. Sharpless, H. C. Kolb, Journal of the American Chemical Society 2004, 126 12809-12818.
[49] T. R. Chan, R. Hilgraf, K. B. Sharpless, V. V. Fokin, Organic Letters 2004, 6 2853-2855.
[50] R. Gujadhur, D. Venkataraman, J. T. Kintigh, Tetrahedron Letters 2001, 42 4791-4793.
[51] G. O'Bryan, A. Nilsen, R. Braslau, Macromolecules 2007, 40 7848-7854.
[52] S. Kobayashi, H. Uyama, N. Higuchi, T. Saegusa, Macromolecules 1990, 23 54-59.
[53] R. Jordan, K. Martin, H. J. Riñder, K. K. Unger, Macromolecules 2001, 34 8858-8865.
[54] T. B. Bonn, K. L, R. Jordan, P. Spannek, C. M. Papadakis, Colloid & Polymer Science 2004, 282 1425.
[55] Y. Chujo, E. Ihara, H. Ihara, T. Saegusa, Macromolecules 1989, 22 2040-2043.
[56] S. Kobayashi, H. Uyama, H. Shirasaka, Makromolekulare Chemie-Rapid Communications 1990, 11 11-14.
[57] M. Miyamoto, Y. Sano, Y. Kimura, T. Saegusa, Macromolecules 1985, 18 1641-1648.
[58] R. Konradi, B. Pidhatika, A. Muhlebach, M. Textor, Langmuir 2008, 24 613-616.
[59] S. Kobayashi, E. Masuda, S. Shoda, Y. Shimano, Macromolecules 1989, 22 2878-2884.
References 186
[60] S. Kobayashi, H. Uyama, Macromolecules 1991, 24 5473-5475.
[61] M. Dreme, P. Le perchec, J. Garapon, B. Sillion, Tetrahedron Letters 1982, 23 73-74.
[62] S. Brunel, B. Fixari, P. L. Perchec, B. Sillion, Tetrahedron Letters 1985, 26 1013-1014.
[63] H. Ohno, A. Toda, Y. Miwa, T. Taga, N. Fujii, T. Ibuka, Tetrahedron Letters 1999, 40 349-352.
[64] S. Cesana, J. Auernheimer, R. Jordan, H. Kessler, O. Nuyken, Macromolecular Chemistry and Physics 2006, 207 183-192.
[65] A. Gross, G. Maier, O. Nuyken, Macromolecular Chemistry and Physics 1996, 197 2811-2826.
[66] S. Hartwig, S. Hecht, Macromolecules 2009, 43 242-248.
[67] S. Fleischmann, H. Komber, B. Voit, Macromolecules 2008, 41 5255-5264.
[68] R. K. Iha, K. L. Wooley, A. M. Nystroêm, D. J. Burke, M. J. Kade, C. J. Hawker, Chemical Reviews 2009, 109 5620-5686.
[69] L. M. Campos, K. L. Killops, R. Sakai, J. M. J. Paulusse, D. Damiron, E. Drockenmuller, B. W. Messmore, C. J. Hawker, Macromolecules 2008, 41 7063-7070.
[70] D. A. Tomalia, D. P. Sheetz, Journal of Polymer Science Part A-1-Polymer Chemistry 1966, 4 2253-2258.
[71] K. Ishizu, S. Ishikawa, T. Fukutomi, Journal of Polymer Science Part A-Polymer Chemistry 1985, 23 445-452.
[72] H. M. L. Lambermont-Thijs, L. Bonami, F. E. Du Prez, R. Hoogenboom, Polymer Chemistry 2010, 1 747-754.
[73] O. Nuyken, J. R. Sanchez, B. Voit, Journal of Macromolecular Science-Pure and Applied Chemistry 1997, A34 1261-1267.
[74] D. Gromadzki, J. Lokaj, P. Cernoch, O. Diat, F. Nallet, P. Stepnek, European Polymer Journal 2008, 44 189-199.
[75] H. M. L. Lambermont-Thijs, F. S. van der Woerdt, A. Baumgaertel, L. Bonami, F. E. Du Prez, U. S. Schubert, R. Hoogenboom, Macromolecules 2009, 43 927-933.
[76] G. B. Guise, G. C. Smith, Journal of Chromatography A 1982, 235 365-376.
[77] J. Ryczkowski, Catalysis Today 2001, 68 263-381.
[78] S. Prati, E. Joseph, G. Sciutto, R. Mazzeo, Accounts of Chemical Research 2010, 43 792-801.
[79] Stuart.B., Infrared Spectroscopy: fundamentals and applications, John Wiley and Sons, Ltd; Chichester, England, 2004.
References 187
[80] S. Choosakoonkriang, B. A. Lobo, G. S. Koe, J. G. Koe, C. R. Middaugh,
J.Pharm.Sci. 2003, 92 1710-1722.
[81] J. Zhu, F. Uhl, C. A. Wilkie, in Fire and Polymers, American Chemical Society, 2001, p. pp. 24-33.
[82] Z. H. Lu, S. Krause, M. Iskandar, Macromolecules 1982, 15 367-370.
[83] Z. H. Lu, S. Krause, Macromolecules 1982, 15 112-114.
[84] S. Krause, M. Iskandar, M. Iqbal, Macromolecules 1982, 15 105-111.
[85] S. Krause, Z. Lu, M. Iskandar, Macromolecules 1982, 15 1076-1082.
[86] H. C. Kim, T. P. Russell, J.Polym.Sci.B Polym.Phys. 2001, 39 663-668.
[87] A. Voronov, S. Vasylyev, A. Kohut, W. Peukert, Journal of Colloid and Interface Science 2008, 323 379-385.
[88] G. Riess, Progress in Polymer Science 2003, 28 1107-1170.
[89] P. Wisian-Neilson, Journal of the American Chemical Society 2003, 125 6338-6339.
[90] M. Han, C. H. Xu, D. Zhu, L. Yang, J. L. Zhang, Y. P. Chen, K. Ding, F. Q. Song, G. H. Wang, Advanced Materials 2007, 19 2979-2984.
[91] O. Azzaroni, A. A. Brown, N. Cheng, A. Wei, A. M. Jonas, W. T. S. Huck, J.Mater.Chem. 2007, 17 3433-3439.
[92] B. Sergeev, Russ.Chem.Rev. 2001, 70 809-825.
[93] B. H. Sohn, B. H. Seo, Chemistry of Materials 2001, 13 1752-1757.
[94] S. Sun, S. Anders, H. F. Hamann, J. U. Thiele, J. E. E. Baglin, T. Thomson, E. E. Fullerton, C. B. Murray, B. D. Terris, Journal of the American Chemical Society 2002, 124 2884-2885.
[95] Z. Cheng, L. Cheng, Q. Gao, S. Dong, X. Yang, J.Mater.Chem. 2002, 12 1724-1729.
[96] W. A. Lopes, H. M. Jaeger, Nature 2001, 414 735-738.
[97] A. Köth, J. Koetz, D. Appelhans, B. Voit, Colloid Polym. Sci. 2008, 286 1317-1327.
[98] Y. Luo, Materials Letters 2007, 61 2164-2166.
[99] B. Brissault, A. Kichler, C. Guis, C. Leborgne, O. Danos, H. Cheradame, Bioconjugate Chemistry 2003, 14 581-587.
[100] T. Kim, C. H. Lee, S. W. Joo, K. Lee, Journal of Colloid and Interface Science 2008, 318 238-243.
[101] Z. Wang, L. Ma, Coordination Chemistry Reviews 2009, 253 1607-1618.
References 188
[102] J. Zhou, J. Ralston, R. Sedev, D. A. Beattie, Journal of Colloid and Interface Science
2009, 331 251-262.
[103] P. A. Atanasov, N. N. Nedyalkov, T. Sakai, M. Obara, Applied Surface Science 2007, 254 794-798.
[104] J. Norman, C. D. Grant, A. M. Schwartzberg, J. Z. Zhang, Optical Materials 2005, 27 1197-1203.
[105] M. M. Alvarez, J. T. Khoury, T. G. Schaaff, M. N. Shafigullin, I. Vezmar, R. L. Whetten, The Journal of Physical Chemistry B 1997, 101 3706-3712.
[106] B. Palpant, B. vel, Lermeacute, J. , E. Cottancin, M. Pellarin, M. Treilleux, A. Perez, J. L. Vialle, M. Broyer, Phys.Rev.B 1998, 57 1963.
[107] C. A. Foss, G. L. Hornyak, J. A. Stockert, C. R. Martin, The Journal of Physical Chemistry 1994, 98 2963-2971.
[108] S. Link, M. A. El-Sayed, Journal of Physical Chemistry B 1999, 103 4212-4217.
[109] M. Brust, M. Walker, D. Bethell, D. J. Schiffrin, R. Whyman, J.Chem.Soc., Chem.Commun. 1994, 801-802.
[110] H. G. Boyen, G. Kastle, F. Weigl, B. Koslowski, C. Dietrich, P. Ziemann, J. P. Spatz, S. Riethmuller, C. Hartmann, M. Moller, G. Schmid, M. G. Garnier, P. Oelhafen, Science 2002, 297 1533-1536.
[111] K. Juodkazis, J. Juodkazyte, V. Jasulaitiene, A. Lukinskas, B. Sebeka, Electrochemistry Communications 2000, 2 503-507.
[112] P. Tripathy, A. Mishra, S. Ram, H. J. Fecht, J. Bansmann, R. J. Behm, Nanotechnology 2009, 20 .
[113] S. Shanmugam, B. Viswanathan, T. Varadarajan, Nanoscale Research Letters 2007, 2 175-183.
[114] O. P. Varnavski, M. B. Mohamed, M. A. El-Sayed, T. Goodson, The Journal of Physical Chemistry B 2003, 107 3101-3104.
[115] A. P. Alivisatos, Science 1996, 271 933-937.
[116] M. Andrea, P. Rita, H. Viktória, D. Imre, Gold Bulletin 2009, 42 113-123.
[117] J. Du, Y. Tang, A. L. Lewis, S. P. Armes, Journal of the American Chemical Society 2005, 127 17982-17983.
[118] J. Du, S. P. Armes, Journal of the American Chemical Society 2005, 127 12800-12801.
[119] S. Fujii, Y. Cai, J. V. M. Weaver, S. P. Armes, Journal of the American Chemical Society 2005, 127 7304-7305.
[120] S. Eustis, M. A. El-Sayed, Chem.Soc.Rev. 2006, 35 209-217.
References 189
[121] A. Meristoudi, S. Pispas, N. Vainos, J.Polym.Sci.B Polym.Phys. 2008, 46 1515-1524.
[122] S. Eustis, M. A. El-Sayed, ChemInform 2006, 37 no.
[123] C. L. Schofield, A. H. Haines, R. A. Field, D. A. Russell, Langmuir 2006, 22 6707-6711.
[124] C. J. Murphy, T. K. Sau, A. M. Gole, C. J. Orendorff, J. Gao, L. Gou, S. E. Hunyadi, T. Li, The Journal of Physical Chemistry B 2005, 109 13857-13870.
[125] I. Pardinas-Blanco, C. E. Hoppe, Y. Pineiro-Redondo, M. A. Lopez-Quintela, J. Rivas, Langmuir 2007, 24 983-990.
[126] C. J. Murphy, L. B. Thompson, A. M. Alkilany, P. N. Sisco, S. P. Boulos, S. T. Sivapalan, J. A. Yang, D. J. Chernak, J. Huang, The Journal of Physical Chemistry Letters 2010, 1 2867-2875.
[127] M. Grzelczak, J. Perez-Juste, P. Mulvaney, L. M. Liz-Marzan, Chem.Soc.Rev. 2008, 37 1783-1791.
[128] F. Widmann, B. Daudin, G. Feuillet, Y. Samson, J. L. Rouviere, N. Pelekanos, Journal of Applied Physics 1998, 83 7618-7624.
[129] P. Ramvall, P. Riblet, S. Nomura, Y. Aoyagi, S. Tanaka, Journal of Applied Physics 2000, 87 3883-3890.
[130] E. Borsella, M. A. Garcia, G. Mattei, C. Maurizio, P. Mazzoldi, E. Cattaruzza, F. Gonella, G. Battaglin, A. Quaranta, F. D'Acapito, Journal of Applied Physics 2001, 90 4467-4473.
[131] B. Daudin, G. Feuillet, H. Mariette, G. Mula, N. Pelekanos, E. Molva, J. L. Rouviere, C. Adelmann, E. Martinez-Guerrero, J. Barjon, F. Chabuel, B. Bataillou, J. Simon, Japanese Journal of Applied Physics Part 1-Regular Papers Short Notes & Review Papers 2001, 40 1892-1895.
[132] F. Widmann, J. Simon, B. Daudin, G. Feuillet, J. L. re, N. T. Pelekanos, G. Fishman, Phys.Rev.B 1998, 58 R15989.
[133] P. Ramvall, S. Tanaka, S. Nomura, P. Riblet, Y. Aoyagi, Applied Physics Letters 1998, 73 1104-1106.
[134] V. J. Leppert, C. J. Zhang, H. W. H. Lee, I. M. Kennedy, S. H. Risbud, Applied Physics Letters 1998, 72 3035-3037.
[135] E. Martinez-Guerrero, C. Adelmann, F. Chabuel, J. Simon, N. T. Pelekanos, G. Mula, B. Daudin, G. Feuillet, H. Mariette, Applied Physics Letters 2000, 77 809-811.
[136] J. W. Hwang, J. P. Campbell, J. Kozubowski, S. A. Hanson, J. F. Evans, W. L. Gladfelter, Chemistry of Materials 1995, 7 517-525.
[137] Y. L. Yang, J. R. Valerie, H. T. Subhash, P. Brendan, P. L. Phillip, W. H. Howard, Appl.Phys.Lett. 2009, 74 2262-2264.
References 190
[138] J. F. Janik, R. L. Wells, Inorganic Chemistry 1997, 36 4135-4137.
[139] A. Devi, R. Schmid, J. Müller, R. A. Fischer, in Precursor Chemistry of Advanced MaterialsEd.: R. Fischer), Springer Berlin / Heidelberg, 2005, 49-80.
[140] J. W. Hwang, S. A. Hanson, D. Britton, J. F. Evans, K. F. Jensen, W. L. Gladfelter, Chemistry of Materials 1990, 2 342-343.
[141] A. Storr, J.Chem.Soc.A 1968, 2605-2608.
[142] H.Wu, C. B. Poitras, M. Lipson, M. G. Spencer, J. Hunting, F. J. Di Salvo, Appl. Phys. Lett. 2006, 88 11921-11928. [143] C. B. Murray, C. R. Kagan, M. G. Bawendi, Annual Review of Materials Science
2000, 30 545-610.
[144] S. D. Wolter, B. P. Luther, D. L. Waltemyer, C. Onneby, S. E. Mohney, R. J. Molnar, Applied Physics Letters 1997, 70 2156-2158.
[145] P. Stumm, D. A. Drabold, Phys.Rev.Lett. 1997, 79 677.
[146] J. L. Coffer, M. A. Johnson, L. Zhang, R. L. Wells, J. F. Janik, Chemistry of Materials 1997, 9 2671-2673.
[147] B. Schwenzer, J. Hu, R. Seshadri, S. Keller, S. P. DenBaars, U. K. Mishra, Chemistry of Materials 2004, 16 5088-5095.
[148] K. Prabhakaran, T. G. Andersson, K. Nozawa, Appl.Phys.Lett. 1996, 69 3212-3214.
[149] L. Grocholl, J. J. Wang, E. G. Gillan, Chemistry of Materials 2001, 13 4290-4296.
[150] C.P.Slichter, Principles of Magnetic Resonance , Harper & Row, New York, 1963.
[151] R.J.Abraham, J.Fisher, P.Loftus, Introduction to NMR Spectroscopy , John Wiley& Sons, New York, 1988.
[152] I. I. Rabi, J. R. Zacharias, S. Millman, P. Kusch, Phys.Rev. 1938, 53 318.
[153] A. Filler, Nature Precedings 2009, 3267 5-74.
[154] L.R.Treiber, W.H.Arison, G.A.Doss, Huang, G.MacConnell, Miller, R.A.Stearns, Experientia 1995, 51 252-255.
[155] J. X. Chen, A. N. Pilon, J. J. Hechler, A. Chouliotis, K. C. Overbury, Appl.Spectroscopy 1998, 42 79.
[156] K. Hricovini, R. nther, P. Thiry, A. Taleb-Ibrahimi, G. Indlekofer, J. E. Bonnet, P. Dumas, Y. Petroff, X. Blase, X. Zhu, S. G. Louie, Y. J. Chabal, P. A. Thiry, Phys.Rev.Lett. 1993, 70 1992.
[157] X. Zhu, M. S. Hybertsen, P. B. Littlewood, Phys.Rev.B 1996, 54 13575.
References 191
[158] in Methods in Experimental Physics Solid State PhysicsEd.: R. V. Coleman),
Academic Press, 1974, 67-122. [159] M. H. Keshavarz, Journal of Hazardous Materials 2009, 171 786-796.
[160] A. Semnani, M. H. Keshavarz, Journal of Hazardous Materials 2010, 178 264-272.
[161] B. W. David, B. C. Carter, Transmission electron microscopy: A Textbook for Materials Science , Plenum, New York , 1997.
[162] L. Zhang, K. Khougaz, M. Moffitt, A. Eisenberg, in Amphiphilic Block CopolymersEds.: A. Paschalis, L. Bjorn), Elsevier Science B.V., Amsterdam 2000, 87-113.
[163] P. Plantz, in Handbook of Plastics Analysis, CRC Press, 2003.
[164] M. Kaszuba, D. McKnight, M. Connah, F. McNeil-Watson, U. Nobbmann, Journal of Nanoparticle Research 2008, 10 823-829.
[165] R. Gujadhur, D. Venkataraman, J. T. Kintigh, Tetrahedron Letters 2001, 42 4791-4793.
[166] J. F. Janik, R. L. Wells, Inorganic Chemistry 1997, 36 4135-4137.
[167] J. W. Hwang, J. P. Campbell, J. Kozubowski, S. A. Hanson, J. F. Evans, W. L. Gladfelter, Chemistry of Materials 1995, 7 517-525.
[168] J. W. Hwang, S. A. Hanson, D. Britton, J. F. Evans, K. F. Jensen, W. L. Gladfelter, Chemistry of Materials 1990, 2 342-343.
[169] J. A. Jegier, S. McKernan, A. P. Purdy, W. L. Gladfelter, Chemistry of Materials 2000, 12 1003-1010.
[170] Y. L. Yang, J. R. Valerie, H. T. Subhash, P. Brendan, P. L. Phillip, W. H. Howard, Appl.Phys.Lett. 2009, 74 2262-2264.
[171] W. W. Flack, D. S. Soong, A. T. Bell, D. W. Hess, Journal of Applied Physics 1984, 56 1199-1206.
Symbols and Abbreviations 192
7. Symbols and Abbreviations AFM Atomic force microscopy
ATR Attenuated total reflectance
ATRP Atom transfer radical polymerization
AP Anionic polymerization
Au-NPs Gold nanoparticles
-b- Block
BC Block copolymer
BOC Tert.-butyloxycarbonyloxy
CMC Critical micelles concentration
Cop Copolymer
CP Cationic polymerization
CRP Controlled radical polymerization
CROP Cationic ring opening polymerization
DIPEA Diisopropylethylamin
DLS Dynamic light scattering
DMF Dimethylformamid
DMSO Dimethylsulfoxid
DPn Number-average degree of polymerization
DSC Differential scanning calorimetry
FTIR Fourier transform infrared spectroscopy
GaN Gallium nitride
g Gram
GPC Gel permeation chromatography
h Hour
HDC Huisgen 1,3-dipolar cycloaddition
IRS Internal reflection spectroscopy
Symbols and Abbreviations 193
K Kelvin
LFRP Living free radical polymerization
mmol Milli mole
mbar Milli bar
Min Minute
Mn Number-average molecular weight
Mn, cal. Calculated -number-average molecular weight
Mn, Exp. Experimental-number-average molecular weight
Mw Weight-average molecular weight
MWD Molecular weight distribution
NMR Nuclear magnetic resonance
NMRP Nitroxide mediated radical polymerization
PAT Potential analysis tensiometer
PDI Polydispersity index
PS Polystyrene
PMeOx Poly(2-methy-2-loxazoline)
PEtOx Poly(ethyl-2-oxazoline)
PEI Polyethyleneimine
RT Room temperature
Rt Retention time
RAFT Reversible addition fragmentation transfer
SEC Size exclusion chromatography
SFRP Stable free radical polymerization
Tg Glass transition temperature
TGA Thermal gravimetric analysis
THF Tetrahydrofurane
TIPNO N-tert.-butyl-α-isopropyl-α-phenylnitroxid
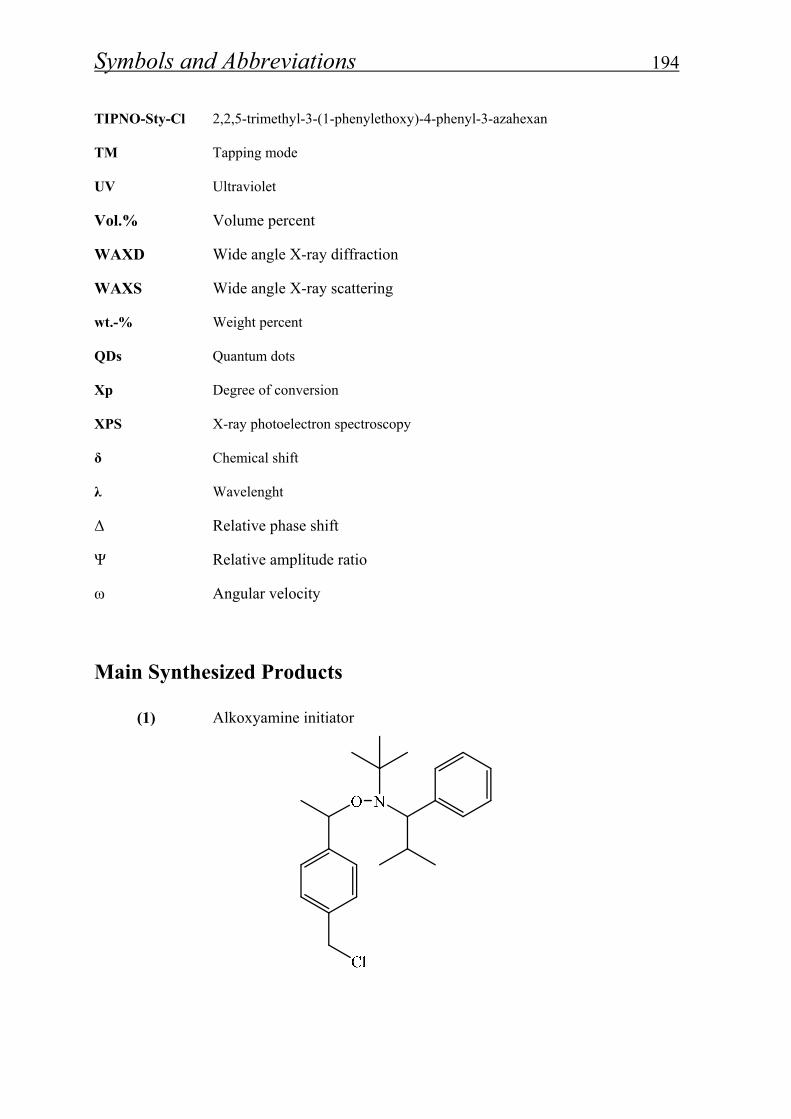
Symbols and Abbreviations 194
TIPNO-Sty-Cl 2,2,5-trimethyl-3-(1-phenylethoxy)-4-phenyl-3-azahexan
TM Tapping mode
UV Ultraviolet
Vol.% Volume percent
WAXD Wide angle X-ray diffraction
WAXS Wide angle X-ray scattering
wt.-% Weight percent
QDs Quantum dots
Xp Degree of conversion
XPS X-ray photoelectron spectroscopy
δ Chemical shift
λ Wavelenght
Δ Relative phase shift
Ψ Relative amplitude ratio
ω Angular velocity
Main Synthesized Products
(1) Alkoxyamine initiator
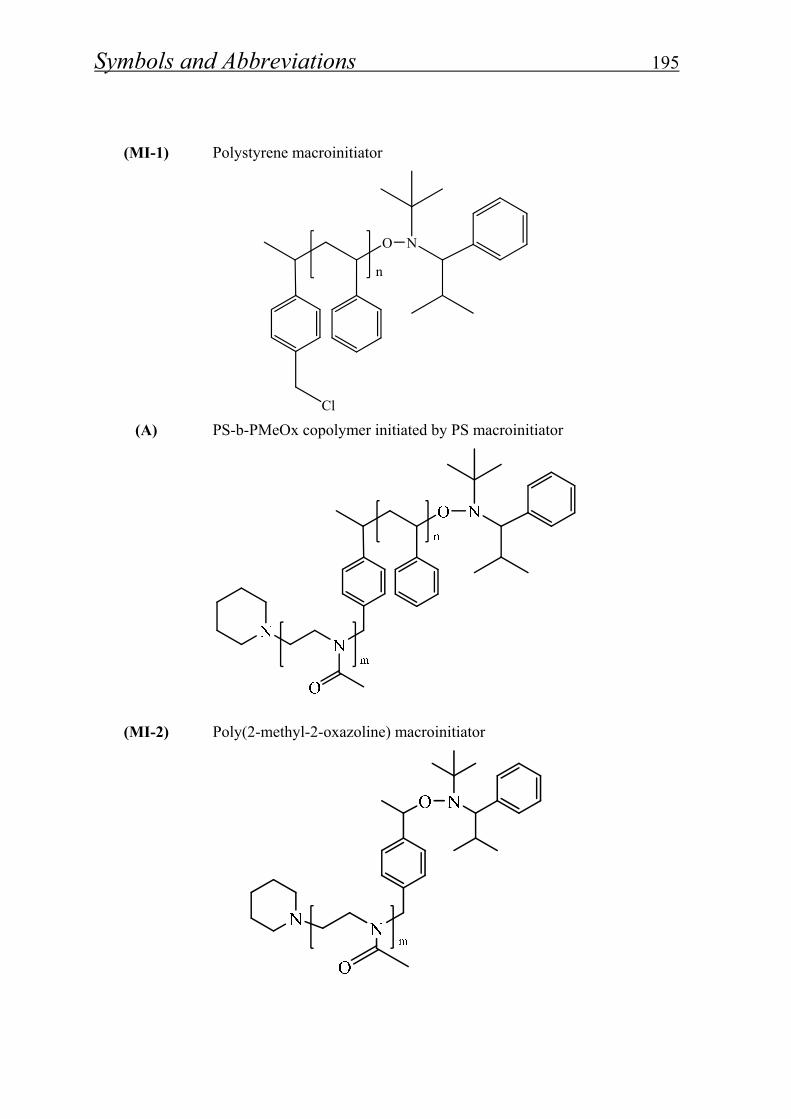
Symbols and Abbreviations 195
(MI-1) Polystyrene macroinitiator
NO
n
Cl
(A) PS-b-PMeOx copolymer initiated by PS macroinitiator
(MI-2) Poly(2-methyl-2-oxazoline) macroinitiator
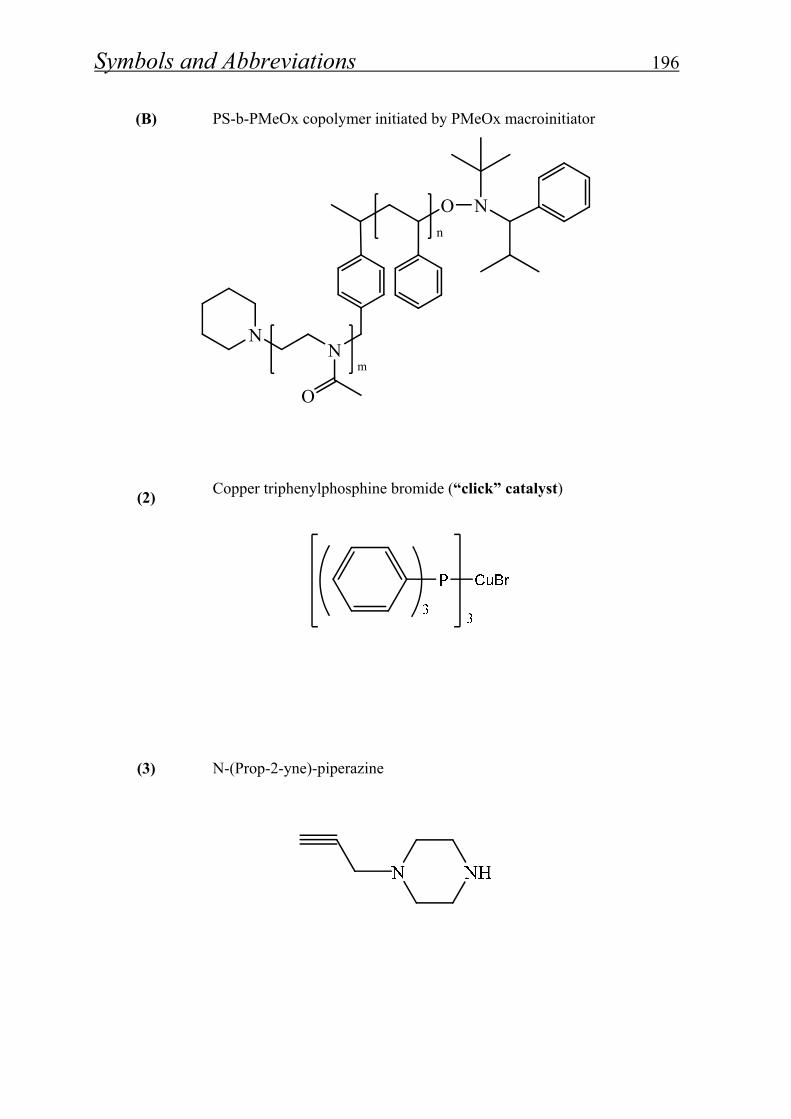
Symbols and Abbreviations 196
(B) PS-b-PMeOx copolymer initiated by PMeOx macroinitiator
NOn
NN
O
m
(2)
Copper triphenylphosphine bromide (“click” catalyst)
(3)
N-(Prop-2-yne)-piperazine
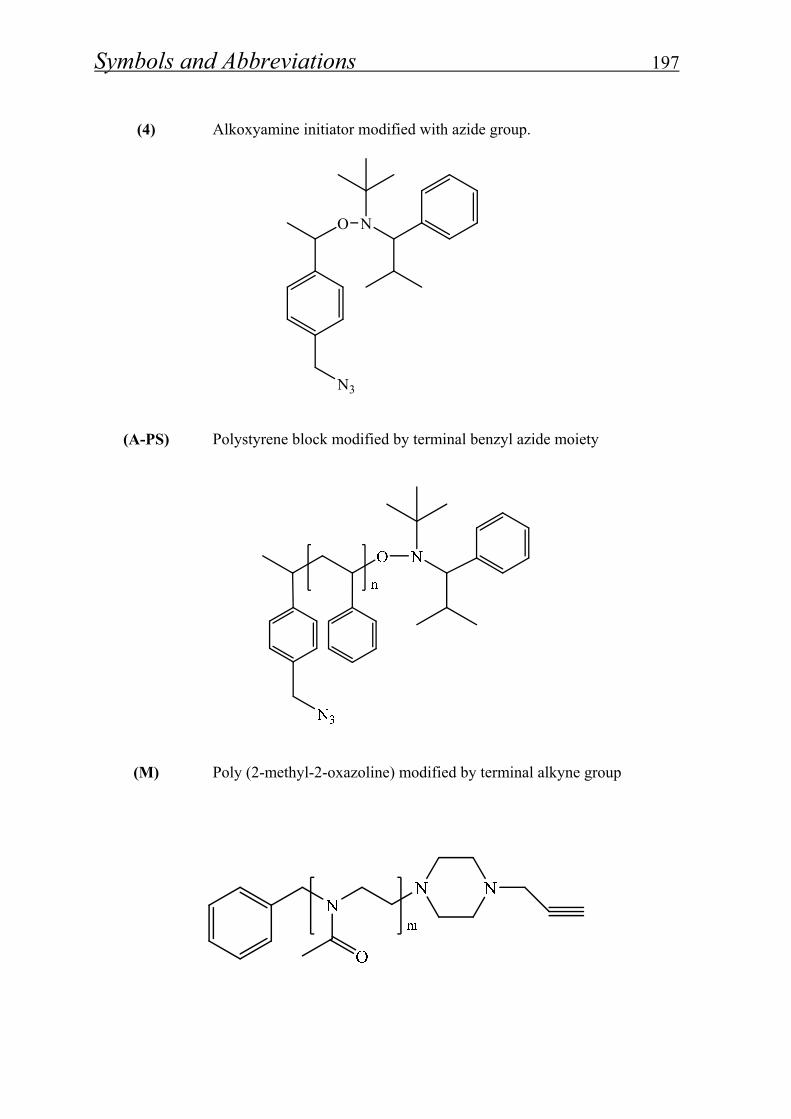
Symbols and Abbreviations 197
(4)
Alkoxyamine initiator modified with azide group.
O N
N3
(A-PS) Polystyrene block modified by terminal benzyl azide moiety
(M) Poly (2-methyl-2-oxazoline) modified by terminal alkyne group
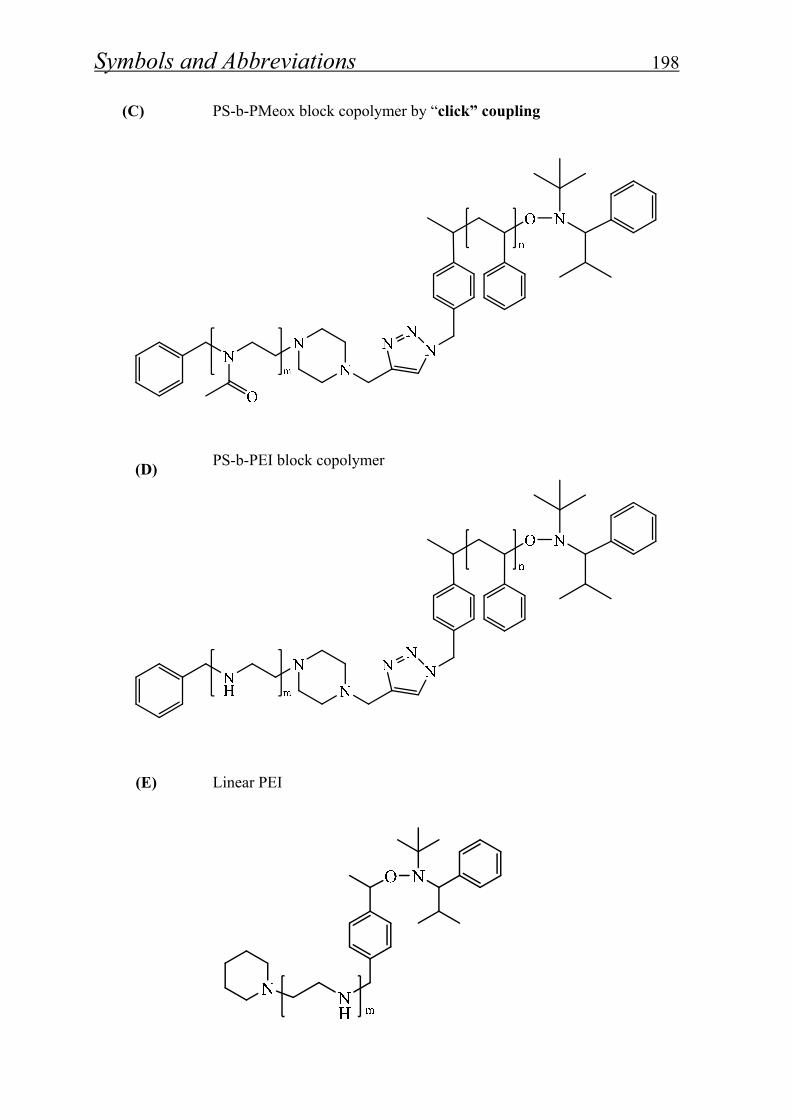
Symbols and Abbreviations 198
(C)
PS-b-PMeox block copolymer by “click” coupling
(D)
PS-b-PEI block copolymer
(E)
Linear PEI
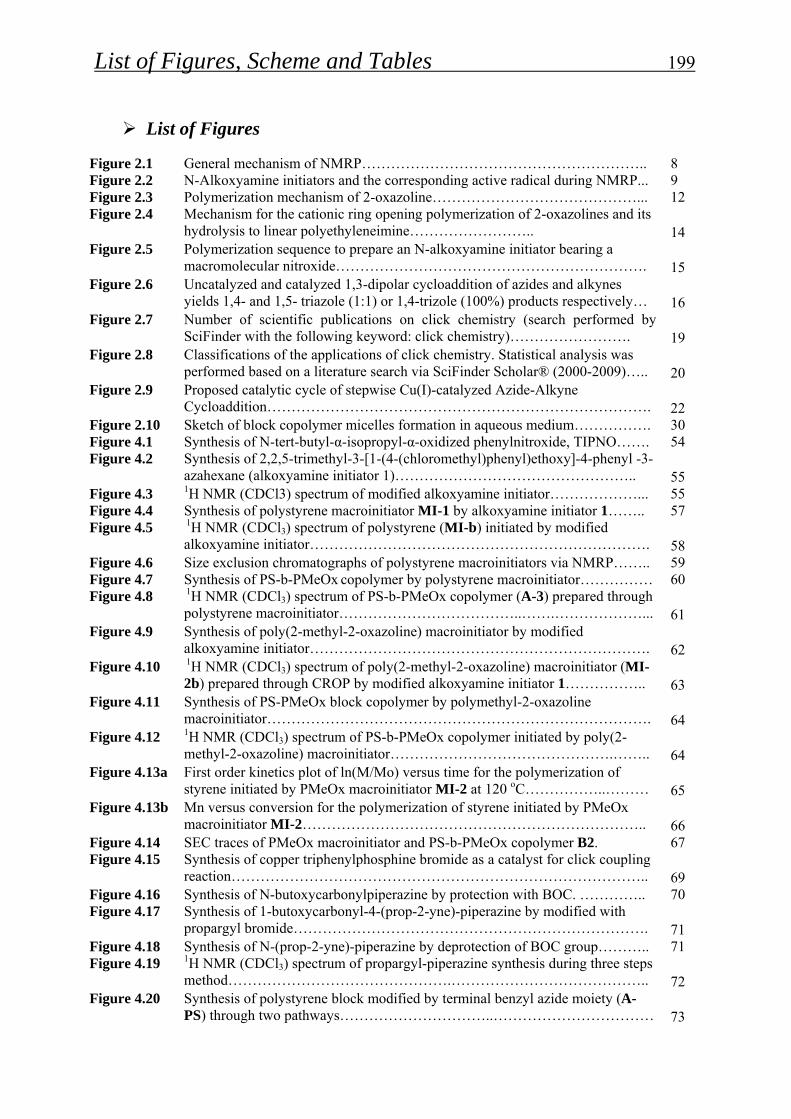
List of Figures, Scheme and Tables 199
List of Figures
Figure 2.1 General mechanism of NMRP………………………………………………….. 8Figure 2.2 N-Alkoxyamine initiators and the corresponding active radical during NMRP... 9Figure 2.3 Polymerization mechanism of 2-oxazoline……………………………………... 12Figure 2.4 Mechanism for the cationic ring opening polymerization of 2-oxazolines and its
hydrolysis to linear polyethyleneimine…………………….. 14
Figure 2.5 Polymerization sequence to prepare an N-alkoxyamine initiator bearing a macromolecular nitroxide……………………………………………………….
15
Figure 2.6 Uncatalyzed and catalyzed 1,3-dipolar cycloaddition of azides and alkynes yields 1,4- and 1,5- triazole (1:1) or 1,4-trizole (100%) products respectively…
16
Figure 2.7 Number of scientific publications on click chemistry (search performed by SciFinder with the following keyword: click chemistry)…………………….
19
Figure 2.8 Classifications of the applications of click chemistry. Statistical analysis was performed based on a literature search via SciFinder Scholar® (2000-2009)…..
20
Figure 2.9 Proposed catalytic cycle of stepwise Cu(I)-catalyzed Azide-Alkyne Cycloaddition…………………………………………………………………….
22
Figure 2.10 Sketch of block copolymer micelles formation in aqueous medium……………. 30Figure 4.1 Synthesis of N-tert-butyl-α-isopropyl-α-oxidized phenylnitroxide, TIPNO……. 54Figure 4.2 Synthesis of 2,2,5-trimethyl-3-[1-(4-(chloromethyl)phenyl)ethoxy]-4-phenyl -3-
azahexane (alkoxyamine initiator 1)………………………………………….. 55
Figure 4.3 1H NMR (CDCl3) spectrum of modified alkoxyamine initiator………………... 55Figure 4.4 Synthesis of polystyrene macroinitiator MI-1 by alkoxyamine initiator 1…….. 57Figure 4.5 1H NMR (CDCl3) spectrum of polystyrene (MI-b) initiated by modified
alkoxyamine initiator……………………………………………………………. 58
Figure 4.6 Size exclusion chromatographs of polystyrene macroinitiators via NMRP…….. 59Figure 4.7 Synthesis of PS-b-PMeOx copolymer by polystyrene macroinitiator…………… 60Figure 4.8 1H NMR (CDCl3) spectrum of PS-b-PMeOx copolymer (A-3) prepared through
polystyrene macroinitiator………………………………..…….………………... 61
Figure 4.9 Synthesis of poly(2-methyl-2-oxazoline) macroinitiator by modified alkoxyamine initiator…………………………………………………………….
62
Figure 4.10 1H NMR (CDCl3) spectrum of poly(2-methyl-2-oxazoline) macroinitiator (MI-2b) prepared through CROP by modified alkoxyamine initiator 1……………..
63
Figure 4.11 Synthesis of PS-PMeOx block copolymer by polymethyl-2-oxazoline macroinitiator…………………………………………………………………….
64
Figure 4.12 1H NMR (CDCl3) spectrum of PS-b-PMeOx copolymer initiated by poly(2-methyl-2-oxazoline) macroinitiator……………………………………….……..
64
Figure 4.13a First order kinetics plot of ln(M/Mo) versus time for the polymerization of styrene initiated by PMeOx macroinitiator MI-2 at 120 oC……………..………
65
Figure 4.13b Mn versus conversion for the polymerization of styrene initiated by PMeOx macroinitiator MI-2……………………………………………………………..
66
Figure 4.14 SEC traces of PMeOx macroinitiator and PS-b-PMeOx copolymer B2. 67Figure 4.15 Synthesis of copper triphenylphosphine bromide as a catalyst for click coupling
reaction………………………………………………………………………….. 69
Figure 4.16 Synthesis of N-butoxycarbonylpiperazine by protection with BOC. ………….. 70Figure 4.17 Synthesis of 1-butoxycarbonyl-4-(prop-2-yne)-piperazine by modified with
propargyl bromide………………………………………………………………. 71
Figure 4.18 Synthesis of N-(prop-2-yne)-piperazine by deprotection of BOC group……….. 71Figure 4.19 1H NMR (CDCl3) spectrum of propargyl-piperazine synthesis during three steps
method……………………………………….………………………………….. 72
Figure 4.20 Synthesis of polystyrene block modified by terminal benzyl azide moiety (A-PS) through two pathways…………………………..……………………………
73
List of Figures, Scheme and Tables 200
Figure 4.21 A relationship between a Mncal, MnSEC and polydispersity index of polystyrenes (A-PS) prepared through NMRP…………………………………………………
74
Figure 4.22 SEC chromatographs for the polymerization of styrene (A-PS-4) at 120 °C in the presence of alkoxyamine initiator 1: a) the product after 3 hrs, b) 8 hrs, c) 12 hrs and d) 18 hrs…………………………………………………………..………
75
Figure 4.23 1H NMR (CDCl3) spectrum of polystyrene (A-PS) initiated by modified alkoxyamine terminated with azide………………………………………………
75
Figure 4.24 Synthesis of poly(2-methyl-2-oxazoline) modified by terminal alkyne group…... 76Figure 4.25 Synthesis of PS-b-PMeOx block copolymer (C) by click coupling……………... 77Figure 4.26 1H NMR (CDCl3) spectrum of PS-PMeOx block copolymer (C2) prepared
through click coupling reaction…………………………………………………. 79
Figure 4.27 Synthesis of PS-b-PEI block copolymer by alkaline hydrolysis……………... 81Figure 4.28 1H NMR (CDCl3) spectrum of polystyrene-polyethyleneimine block copolymer
D3……………………………………………………………………………….. 82
Figure 4.29 SEC traces of PS-PEI block copolymers……………………………………….. 83Figure 4.30 FTIR (ATR) spectroscopy of PS (PS-1), PMeOx (M-4), PS-b-PMeOx (C1) and
PS-b-PEI (D1) copolymers. …………………………………………………….. 84
Figure 4.31 TG of polystyrene, polyethyleneimine and polystyrene block polyethyleneimine copolymer…………………………………………………...
87
Figure 4.32 DSC curves of PS (PS-1), PEI (E) and PS-b-PEI copolymer (D1)………….…. 88Figure 4.33a AFM (2µm) images of polystyrene-b-polyethyleneimine (D3) copolymer with
thickness 16 nm…………………………………………………………………. 90
Figure 4.33b AFM (4µm) images of polystyrene block polyethyleneimine (D2) copolymers with thickness 20 nm……………………………………………………………..
90
Figure 4.33c AFM (2µm) images of polystyrene-b-polyethyleneimine (D5) copolymers with thickness 18 nm………………………………………………………………….
91
Figure 4.34 AFM 3D height image of polystyrene-b-polyethyleneimine (D5) copolymers… 92Figure 4.35 Surface tension results of diblock copolymers D2 in aqueous solution, plotted as
a function of concentration at 25 oC……………….……………………………. 93
Figure 4.36 Absorbance of AuNPs/copolymer in aqueous medium with different concentrations of HAuCl4 from 0.1 – 1.0 equivalent to PS-b-PEI (D2) copolymer concentration. ………………………………………………………
100
Figure 4.37 Illustrate maximum absorbance values and particle diameter of Au NPs/PS-b-PEI (D2) nanoparticles prepared from to 1.0 equivalent of HAuCl4 in aqueous solutions followed at ~ λ=530 nm……………………………………………….
101
Figure 4.38 The diameter of gold nanoparticles determines the wavelengths of light absorbed………………………………………………………………………….
102
Figure 4.39 UV-VIS absorption spectra of gold nanoparticles stabilized diblock copolymer D2………………………………………………………………………………..
102
Figure 4.40 Correlation functions and distribution fits of PS-b-PEI in the presence and absence of gold nanoparticles in aqueous medium……………………………...
104
Figure 4.41 Experimental ellipsometric spectra of the polymer layers (Delta (a) and Psi (b), at angle of incidence 68°) prepared without Au NP and with increasing concentration of Au NP within the layer (0.1, 0.2, 0.4, 0.6, 0.8, 1.0 equv.)……..
106
Figure 4.42 Optical constants of the PS-b-PEI used as “material #1” (data resulted from the fit in step 1)………………………………………………………………………
108
Figure 4.43 Optical constants of gold as “material#2” (Drude metal data au_2 from the JAW data pool)………………………………………………………………….
109
Figure 4.44 Best-fit results for a PS-b-PEI/Au NP composite layer using the Maxwell-Garnett EMA…………………………………………………………………….
109
Figure 4.45 Effective optical constants n and k of the PS-b-PEI/Au NP composite layer as
List of Figures, Scheme and Tables 201
function of wavelength………………………………………………………… 110Figure 4.46 Absorption coefficient of the PS-b-PEI/Au NP composite layer as function of
wavelength………………………………………………………………………. 110
Figure 4.47 XPS wide spectrum of gold nanoparticles stabilized in block copolymer matrix G4…………………………………………………………………………………
112
Figure 4.48 Au 4f XPS Deconvolution of band group showing multiple band structure in Au NPs decorated in PS-b-PEI films: (a) G4 and (b) G1…..………………………..
114
Figure 4.49 AFM (2µm) phase images of (a) PS-b-PEI (G4) and (b) PS-b-PEI/Au nano-hybrids……………………………………………………………………………
115
Figure 4.50 AFM height image of polystyrene block polyethyleneimine/Au nano-hybrids (G4) with thickness 16 nm………………………………………………………
116
Figure 4.51 TEM micrographs of gold nanoparticles for different incorporation ratios of HAuCl4 after reduction (a) 0.1 equiv, (b) 0.2 equiv, and (c) 1.0 equiv…………..
117
Figure 4.52 The relation between particle size measured by DLS and TEM with different feeding gold precursor concentration…………………………………………….
119
Figure 4.53 TEM image of copolymer (D2)/ gold nanoparticles at different feed concentration of gold precursor (a, b) 0.5, (c) 0.2 and (d) 0.8 equiv……………..
120
Figure 4.54 TEM image of gold nanoparticles decorated in PS-b-PEI copolymer (G2)……... 121Figure 4.55 TEM image of gold nanoparticles decorated in PS-b-PEI copolymer thin film
(G3)………………………………………………………………………………. 122
Figure 4.56 Structure of molecular precursor cyclotrigallazane……………………………… 123Figure 4.57 3D strcture of block copolymer/cyclotri-gallane precursor…………………….. 124Figure 4.58 UV-visible absorption spectrum of the GaN/block copolymer obtained after
three days of annealing under argon atmosphere……………………………….. 126
Figure 4.59 PL spectra with an emission wavelength of 425 nm and PL spectra with an excitation wavelength of 320 nm from GaN and copolymer/GaN……………….
127
Figure 4.60 blue rays of GaN QDs dispersed in polymer matrix……………………………... 128
Figure 4.61 XPS wide spectrum of gallium nitride QDs stabilized in PS-PEI block copolymer matrix…………………………………………………………………
129
Figure 4.62 XPS deconvolution spectra of Ga 2p3/2 for the PS-b-PEI–GaN sample at (1117.3 eV)……………………………………………………………………….
130
Figure 4.63 Deconvolution of XPS spectra of N 1s for the copolymer–GaN sample. The peak positions shown for nitrogen (399.4 eV)……………………………………
131
Figure 4.64 X-ray diffraction patterns of GaN nanocrystals /block copolymer after annealing………………………………………………………………………….
132
Figure 4.65 AFM (2 µm) height (a) and phase (b) images of polystyrene block polyethyleneimine stabilizing gallium nitride QDs (N2)………………………...
133
Figure 4.66 3D AFM height image of polystyrene block polyethyleneimine stabilizing gallium nitride QDs (N2) hybrid material………………………………………..
134
Figure 4.67 TEM image of GaN/PS-b-PEI (N1)nano-hybrid material……………………….. 135Figure 4.68 Particle size histograms TEM micrographs of PS-b-PEI/GaN nano-hybrid with
different incorporation ratios (a) 1:1, (b) 1:5 and (c) 1:10……………………… 136
Figure 4.69 TEM image of GaN QDs decorated in PS-b-PEI copolymer thin film (N3)………………………………………………………………………..
138
Figure 5.1 Diagram of a size-exclusion chromatography column…………………………... 144Figure 5.2 Elemental analysis (theoretical) of poly(2-methyl-2-oxazoline) and
polyethyleneimine……………………………………………………………….. 145
Figure 5.3 The principles of ATR spectroscopy……………………………………………. 147Figure 5.4 Principle of XPS…………………………………………………………………. 148Figure 5.5 Schematic drawing of XPS measurement……………………………………….. 149Figure 5.6 Principle of WAXS measurement……………………………………………….. 150
List of Figures, Scheme and Tables 202
Figure 5.7 Diagram of UV-VIS absorption spectrophotometer…………………………….. 151Figure 5.8 Diagram of a photoluminescence spectroscopy…………………………………. 152Figure 5.9 Reflection of polarized light…………………………………………………….. 154Figure 5.10 Presentation of AFM instrumentation…………………………………………… 155Figure 5.11 Cross-section of a conventional transmission electron microscope……………... 156Figure 5.12 Hypothetical dynamic light scattering of two samples: larger particles on the top
and smaller particle on the bottom…………………………………………… 158
Figure 5.13 Detection of the critical micelle formation concentration……………………….. 159Figure 5.14 Profile Analysis Tensiometer (PAT1)…………………………………………… 160Figure 5.15 Filtration-reaction apparatus……………………………………………………... 179Figure 5.16 Presentation of thin film prepared by spin coating……………………………… 181
List of Schemes
Scheme 2.1 Chart of controlled/living polymerization types………………………………... 4Scheme 2.2 The Winstein spectrum…………………………………………………………. 10Scheme 2.3 Schematic design of different polymers architectures according to ordering of
polymer blocks…………………………………………………………………..
29Scheme 2.4 Examples of nanomaterials and nanocarrier systems…………………………... 31Scheme 2.5 Schematic synthesis of gallium nitride clusters from precursor………………... 37Scheme 3.1 Schematic combination of PS and PMeOx blocks by click reaction…………… 49Scheme 3.2 Schematic diagram of research path way………………………………... 50 Scheme 4.1 Synthesis of alkoxyamine initiator from nitrone as precursor of nitroxide
adduct…………………………………………………………………………… 53Scheme 4.2 Click recombination of polymer segments via 1,3-dipolar cycloaddition
reaction………………………………………………………………………… 68Scheme 4.3 Schematic click coupling of alkyne and azide moieties via Huisgen 1,3-dipolar
cycloaddition…………………………………………………………………….
68Scheme 4.4 Scheme of 2-oxazolines polymerization reaction (Ini = initiator, Term =
Terminating agent and F1 & F2 is desirable function groups)……………….….
70Scheme 4.5 3D Scheme structure of N-(prop-2-yne)-piperazine……………………………. 71Scheme 4.6 Schematic diagram presenting determination of glass transition temperature…. 87Scheme 4.7 Schematic decoration of gold nanoparticles stabilized in PS-PEI block
copolymer matrix……………………………………………………………….. 98Scheme 4.8 Schematic diagram of colloidal Au nanoparticles color change during
reduction process………………………………………………………………..
98Scheme 4.9 2D and 3D distribution of gold nanoparticles in block copolymers thin films
relative to film thickness………………………………………………………..
111Scheme 4.10 Synthesis sketch of PS-b-PEI sphere containing uniformly copolymerized GaN
QDs from cyclotrigallazane precursor…………………………………………..
125Scheme 4.11 Micelle configuration of GaN/PS-b-PEI in organic medium (THF)………... 137
List of Figures, Scheme and Tables 203
List of Tables
Table 4.1 Molar masses, conversions and polydispersities of polystyrene macroinitiators (MI-1)…………………………………………………………... 58
Table 4.2 Molar masses, conversions and polydispersities of PS-PMeOx block copolymer synthesized by polystyrene macroinitiators (MI-1b)…………………….………. 61
Table 4.3 Molar masses, PDIs, and conversions of poly(2-methyl-2-oxazoline) macroinitiators…………………………………………………………………….. 62
Table 4.4 Molar masses, PDIs, and conversions of PS-b-PMeOx copolymer prepared by PMeOx macroinitiator (MI-2)…..………………………………………………... 65
Table 4.5 Molar masses, conversions and polydispersities of polystyrene prepared by alkoxyamine initiators 1………………………………………………………….. 73
Table 4.6 Molar masses, conversions and polydispersities of functionalized poly(2-methyl-2-oxazoline) (M) with terminal acetylene moiety ….……………………………. 77
Table 4.7 Molar mass, PDI and block ratios of PS-b-PMeox copolymer via click reaction... 79Table 4.8 Molar masses, polydispersities and block ratios of PS-b-PEI (D) copolymers….. 83Table 4.9 TGA data for PS, PEI and PS-PEI block copolymers…………………………….. 86Table 4.10 Relationship of gold precursor concentrations with film thickness and relative
particle diameter………………………………………………………………….. 111Table 4.11 (Au-4f 7/2 XPS) atomic gold concentration in polymer film and binding energy
related to feeding gold concentration. ……………………………………………. 113Table 4.12 Gallane/PS-PEI block copolymer with different ratios…………………………… 125Table 4.13 XPS atomic gallium concentration and binding energy of GaN/PS-PEI hybrid
system and related Ga/N ratio……………………………………………………. 131
Versicherung Hiermit versichere ich, dass ich die vorliegende Arbeit ohne unzulässige Hilfe Dritter und
ohne Benutzung anderer als der angegebenen Hilfsmittel angefertigt habe; die aus fremden
Quellen direkt oder indirekt übernommenen Gedanken sind als solche kenntlich gemacht. Die
Arbeit wurde bisher weder im Inland noch im Ausland in gleicher oder ähnlicher Form einer
anderen Prüfungsbehörde vorgelegt.
Die vorliegende Dissertation wurde in der Zeit von Januar 2007 bis Januar 2011 am Leibniz-
Institut für Polymerforschung Dresden e.V. unter der wissenschaftlichen Betreuung von Frau
Prof. Dr. Brigitte Voit angefertigt.
Frühere Promotionsverfahren haben nicht stattgefunden.
Ich erkenne die Promotionsordnung der Fakultät Mathematik und Naturwissenschaften der
Technischen Universität Dresden vom 17. Juli 2008 in vollem Umfang an.
Dresden, 10. Januar 2011