Self-Assembly of Block Copolymers in External Fields · Self-Assembly of Block Copolymers in...
193
Self-Assembly of Block Copolymers in External Fields DISSERTATION zur Erlangung des akademischen Grades eines Doktors der Naturwissenschaften (Dr. rer. nat.) im Fach Chemie der Fakultät für Biologie, Chemie und Geowissenschaften der Universität Bayreuth vorgelegt von Alexander Böker geboren in Frankfurt/Main Bayreuth, 2002
Transcript of Self-Assembly of Block Copolymers in External Fields · Self-Assembly of Block Copolymers in...
Self-Assembly of Block Copolymers
in External Fields
DISSERTATION
zur Erlangung des akademischen Grades eines
Doktors der Naturwissenschaften (Dr. rer. nat.)
im Fach Chemie der Fakultät für Biologie, Chemie und Geowissenschaften
der Universität Bayreuth
vorgelegt von
Alexander Böker
geboren in Frankfurt/Main
Bayreuth, 2002

Die vorliegende Arbeit wurde in der Zeit von März 1999 bis Juli 2002 in Bayreuth an den
Lehrstühlen für Physikalische Chemie II und Makromolekulare Chemie II unter der
Betreuung von Herrn Prof. Dr. Georg Krausch und Herrn Prof. Dr. Axel H.E. Müller
angefertigt.
Promotionsgesuch eingereicht am: 18.7.2002
Prüfungsausschuß:
Prof. Dr. G. Krausch (Erstgutachter)

Meiner Familie

There are more things in heaven and earth,
Than are dreamt of in your philosophy.
W. Shakespeare

Table of Contents
I
Table of Contents
1. Introduction 1
1.1. Microphase Separation of Block Copolymers 21.1.1. Theoretical Models for Phase Separation in AB Diblock Copolymers 3
1.2. Surface-Induced Microdomain Structures in Thin block Copolymer Films 9
1.3. Alignment of Block Copolymer Microstructures 91.3.1. Shear Alignment 101.3.2. Electric Field Alignment 111.3.2.1. Electrothermodynamics of Microphase-Separated Block Copolymers 11
1.4. Structure of this Thesis 16
2. Methods 20
2.1. Synthesis 202.1.1. Anionic Polymerization 202.1.2. Fundamentals of Anionic Polymerization 212.1.2.1. Molecular Weight Distribution and Mechanism 212.1.2.2. Kinetics 24
2.2. Characterization 252.2.1. Scanning Force Microscopy (SFM) 252.2.2. Transmission Electron Microscopy (TEM) 262.2.2.1. Fundamentals of Transmission Electron Microscopy 262.2.2.2. Staining of Polymer Samples 282.2.2.3. Radiation Damage 292.2.3. Small-Angle X-Ray Scattering (SAXS) 292.2.3.1. Fundamentals of Scattering 292.2.3.2. Small-angle X-Ray Scattering on Microphase-Separated Block Copolymers 322.2.3.3. Setup of Synchrotron-SAXS Beamline (ID02A, ESRF, Grenoble) 32
3. Nanoscopic Surface Patterns from FunctionalABC Triblock Copolymers 38
3.1. Introduction 39
3.2. Experimental Section 403.2.1. Solvents and Materials 403.2.2. Synthesis of 2-[(Trimethylsilyl)oxy]ethyl methacrylate (TMS-HEMA) 413.2.3. Block Copolymerizations 41
3.3. Methods 42

Table of Contents
II
3.4. Results and Discussion 463.4.1. Bulk Morphology of ABC Block Copolymers 463.4.2. Thin Films of ABC Block Copolymers 463.4.3. Ultrathin Films 503.4.3.1. Annealed Ultrathin Films 553.4.3.2. Concentration Dependence of Pattern Formation 573.4.4. Scaling Analysis 603.4.4.1. Striped Patterns 613.4.4.2. Island-like Patterns 62
3.5. Conclusion 67
4. Wetting of Chemically Nanopatterned Model Surfaces 71
4.1. Introduction 72
4.2. Experimental Section 734.2.1. Materials and Methods 734.2.2. Sample Preparation 73
4.3. Results 744.3.1. Stability of Polystyrene Films on a Triblock Copolymer Model Surface 754.3.1.1. Annealing 754.3.1.2. Solvent Vapor Treatment 76
4.4. Discussion 79
4.5. Conclusion 79
5. Large Scale Domain Alignment of a Block Copolymerfrom Solution using Electric Fields 83
5.1. Introduction 84
5.2. Experimental Section 85
5.3. Results 885.3.1. Films Cast at Zero Electric Field 885.3.2. Films Cast in the Presence of an Electric Field 88
5.4. Discussion 90
5.5. Conclusion 97

Table of Contents
III
6. Microscopic Mechanisms of Electric Field InducedAlignment of Block Copolymer Microdomains 101
6.1. Introduction 102
6.2. Experimental Section 1036.2.1. Synthesis 1036.2.2. Sample Preparation 1036.2.3. Viscosity Measurements 1046.2.4. Synchrotron Small-Angle X-Ray Scattering (Synchrotron-SAXS) 1046.2.5. Transmission Electron Microscopy (TEM) 1046.2.6. Calculation of Order Parameters 105
6.3. Results 1066.3.1. Concentration Dependence of Structure Formation 1066.3.2. Reorientation Behavior of PS-b-PI in Toluene 1086.3.3. Kinetics and Mechanism of Microphase Orientation 1096.3.3.1. Concentration Dependence 1096.3.3.2. Electric Field Strength Dependence 1116.3.3.3. Temperature Dependence 113
6.4. Discussion 115
6.5. Conclusion 127
7. The Influence of Phase Separation and Dielectric Contraston the Electric Field Induced Orientation of LamellarAC and ABC Block Copolymer Solutions 132
7.1. Introduction 133
7.2. Experimental Section 133
7.3. Results 1347.3.1. Concentration Dependence of the Microdomain Structure in Solution 1347.3.2. Reorientation Behavior of PS-b-PHEMA-b-PMMA in THF 1367.3.3. Kinetics of Microphase Orientation 1377.3.3.1. Concentration Dependence 1377.3.3.2. Electric Field Strength Dependence 1397.3.3.3. Kinetic Behavior of PS-b-PMMA Diblock Copolymer 142
7.4. Discussion 143
7.5. Conclusion 152

Table of Contents
IV
8. Electric Field Induced Alignment of High Molecular WeightAB and ABC Block Copolymers with High Dielectric Contrast 155
8.1. Introduction 156
8.2. Experimental Section 1568.2.1. Synthesis 156
8.3. Results and Discussion 1578.3.1. Polystyrene-b-poly(2-vinyl pyridine) S50V50
78 1578.3.1.1. Concentration Dependence of the Microdomain Structure in Solution 1578.3.1.2. Reorientation Behavior 1588.3.1.3. Kinetics of Microphase Orientation 1618.3.2. Polystyrene-b-poly(tert-butyl methacrylate) S50T50
100 1668.3.3. Polystyrene-b-poly(2-vinyl pyridine)-b-poly(tert-butyl methacrylate)
S27V35T3884 and S16V21T63
138 168
8.4. Conclusion 172
9. Summary/Zusammenfassung 175
10. List of Publications 181

Chapter 1 Introduction
1
1. Introduction
In this thesis the potential of external fields for guided self-assembly of block copolymer
microdomains is investigated. Microphase-separated block copolymers usually exhibit well-
ordered structures on the mesoscale. However, in the absence of external fields typically an
isotropic grain structure is obtained characterized by a random distribution of microdomain
orientations. In the present work both surface fields and electric fields are used to overcome
this drawback and macroscopically align the block copolymer mesostructures.
Some studies on thin films have shown that external interfaces can align the block
copolymer morphology, given that the interface selectively attracts one of the constituent
blocks1,2. In these cases, the geometry of thin film morphologies does not lead to lateral
surface patterns as the lower surface tension component typically assembles at the film
surface and covers the whole film. In the first part of this work, we demonstrate how surface
fields can be used to generate stable two-dimensional surface patters via adsorption of
ultrathin block copolymer layers onto a polar substrate.
In order to achieve large scale alignment throughout a macroscopically large thin film or
bulk sample, several techniques have been used in the last decades. In the bulk, an external
mechanical field, i.e. shear, has been proven to be a successful technique3 - 7.
Alignment of microdomains by application of electric fields has also been investigated in
the recent past8,9. So far, all these experiments have been conducted in the melt. Here,
however, large electric fields (10 – 30 kV/mm) are required. We therefore focused on the
investigation of electric field alignment of block copolymer solutions, aiming to establish a
new method for large scale microdomain alignment in thin films and in bulk. The electric
field strengths needed are about one order of magnitude smaller than required for melt
processing. The kinetics of microdomain alignment in concentrated block copolymer
solutions, the temperature and electric field strength dependence, and the threshold field
strengths for different systems were investigated. Finally, the competing interaction between
surface and electric fields was studied.

Chapter 1 Introduction
2
1.1. Microphase separation of block copolymers
Block copolymers composed of immiscible components microphase-separate to generate
structures on a mesoscopic scale, e.g. on a length scale of several tens of nanometers.
Typically grains of such microdomains are formed which exhibit a regular order10.
Macroscopic phase separation cannot occur since the blocks of the copolymer are chemically
connected at a junction point. The emerging microdomains of A-rich and B-rich regions of a
diblock copolymer maintain their own characteristics, e.g. they stay in the amorphous state,
behave as a glass or an elastomer or exhibit a liquid crystalline phase.
The tendency to form microphase-separated domains is governed by two counteracting
driving forces: One is the tendency to minimize the unfavorable interaction energy between
the different segments via the formation of A- and B-rich regions. Thereby, the smallest
possible interface to volume ratio is achieved, thus minimizing the unfavorable interfacial free
energy per unit volume. On the other hand, as microphase separation is associated with a
significant stretching of the respective block copolymer chains, i.e. loss of translational and
configurational entropy, an entropic energy penalty has to be balanced by the gain in energy
from the reduction of the interfacial area.
In the past, theoretical models for the microphase separation of block copolymers have
been developed for AB diblock copolymers11-13.
In the following, we will consider the relevant parameters, which influence the phase
behavior of AB diblock copolymers: The overall degree of polymerization, N, the volume
fractions of the individual blocks (�A, �B = 1-�A), the individual segment lengths of the
monomers, and the A-B segment-segment interaction, described by the Flory-Huggins
parameter,��. The product �N is used to express the enthalpic-entropic balance and it
parameterizes the block copolymer phase along with the volume fraction, ���of the copolymer
segments. In principle, the latter parameter determines which morphology is obtained as long
as the block copolymer remains in the range of an ordered phase.
Besides the volume fraction of the block copolymer components, the Flory-Huggins
interaction parameter, �, plays an important role for the description of the phase separation of
block copolymers. Especially in the theory of the formation of complex morphologies in ABC
triblock copolymers, the surface tension, �, which is proportional to � , is used as a
parameter for the miscibility of the different segments (Equation 1-1). Both parameters are
readily derived in good approximation from the cohesive energy density.

Chapter 1 Introduction
3
ijij �� � Equation 1-1
�ij: surface tension between the segments i and j of a block copolymer�ij: Flory-Huggins-interaction parameter between the segments i and j of a block copolymer
The Flory-Huggins interaction parameter is derived from experiments or can be calculated
from the solubility parameters of both components, i and j, using the van-Laar-Hildebrand-
Equation (Equation 1-2):
� �2
j i ji
V
RT� � �� � � Equation 1-2
�I,j: solubility parameter for the segments i and j of a block copolymer [(cal/cm3)]1/2
V: molar segment volume, calculated by the mean value of the molar volume of both segments (i and j), which are derived from the molar mass of the repeating unit and the density [cm3/mol]R: universal gas constant 2 [cal/(K·mol)]T: temperature [K]
1.1.1. Theoretical models for phase separation in AB diblock
copolymers
As described above, ��and N play an important role for the formation of phase-separated
structures in block copolymers. Depending on the degree of incompatibility, the product �N
defines regimes of weak segregation (weak segregation limit, WSL, �N � 10), intermediate
segregation, and strong segregation (SSL, �N » 10). Based on the classical division of AB
diblock copolymers into the WSL and SSL, different models for the phase behavior have been
developed:
In the case that �N is significantly smaller than unity, entropic effects dominate over the
tendency of the block copolymer to minimize the unfavorable interfacial energy of two
different segments. Consequently, the formation of a mixed, isotropic phase is observed and
the chain segments of both components penetrate into each other.
With an increase of the product �N by either a higher incompatibility or a larger degree of
polymerization, a correlation hole occurs in the polymer melt with a fluctuation length scale,
D, proportional to the radius of gyration (Equation 1-3).

Chapter 1 Introduction
4
21
NRD G �� Equation 1-3
D: fluctuation length scale [nm]RG: radius of gyration of the block copolymer [nm]N: degree of polymerization
These fluctuations can be regarded as the origin of the formation of a microphase-
separated structure,14 and result from the tendency of the connected polymer chains to
minimize the amount of unfavorable interactions.
Figure 1-1: Sinusoidal composition profile for phase-separated AB diblock copolymers in the weak segregationlimit (WSL)11
d: length of repeating unit in the composition profilea: thickness of the shared interface of the two components�(A), �(B): density profile of the components A and B in the different phases
With further increase of the product �N, the weak segregation limit (WSL) is reached
where the ‘disorder to order’ phase transition (ODT) is observed. The individual domains in
the ordered microstructures are enriched with one component, indicated by an approximately
sinusoidal composition profile for both components (Figure 1-1).
Similar to the length scale fluctuation of the mixed block copolymer, the dimensions of the
microphase-separated structure are expected to scale with the square root of the overall degree
of polymerization (Equation 1-4). This fact results from the Gaussian conformation assumed
for the chains.11
21
NRD G �� Equation 1-4
D: domain size [nm]

Chapter 1 Introduction
5
A phase diagram for weakly segregated diblock copolymers was first calculated by Leibler
using Landau's mean-field approximation14. He compared the free energy of different ordered
phases with respect to the disordered phase. His theory predicts that for all diblock
copolymers with asymmetric composition (�A � 0.5), a microphase separation from the
disordered into the metastable body-centered cubic structure (BCC) occurs. According to the
phase diagram in Figure 1-2, a transition to the thermodynamically stable hexagonal and
lamellar phases is expected upon further increase of the product �N. Only for symmetrical
diblock copolymers (�A = 0.5), a direct first-order transition from the disordered to the
lamellar phase is expected.
��
Figure 1-2: Phase diagram for diblock copolymers in the weak segregation (WSL) limit calculated by Leibler14
LAM: lamellar microphaseHEX: hexagonal microphase (cylinders)BCC: body-centered cubic microphase (spheres)DIS: disordered phase�A: volume fraction of component A in the diblock copolymer
Diblock copolymers belonging to the regime of the strong segregation limit (SSL, �N »10)
show a strong incompatibility of the two segments, which is indicated by a large value for �.
Even for small N, phase separation occurs, the interphases between the domains are narrow
and well separated, and nearly pure A and B microdomains are obtained as illustrated in
Figure 1-3. The function, which describes the composition profile over the regime of phase
separation, resembles a step function with values of one and zero, corresponding to the two
regions of the particular pure component.
Chapter 1 Introduction
6
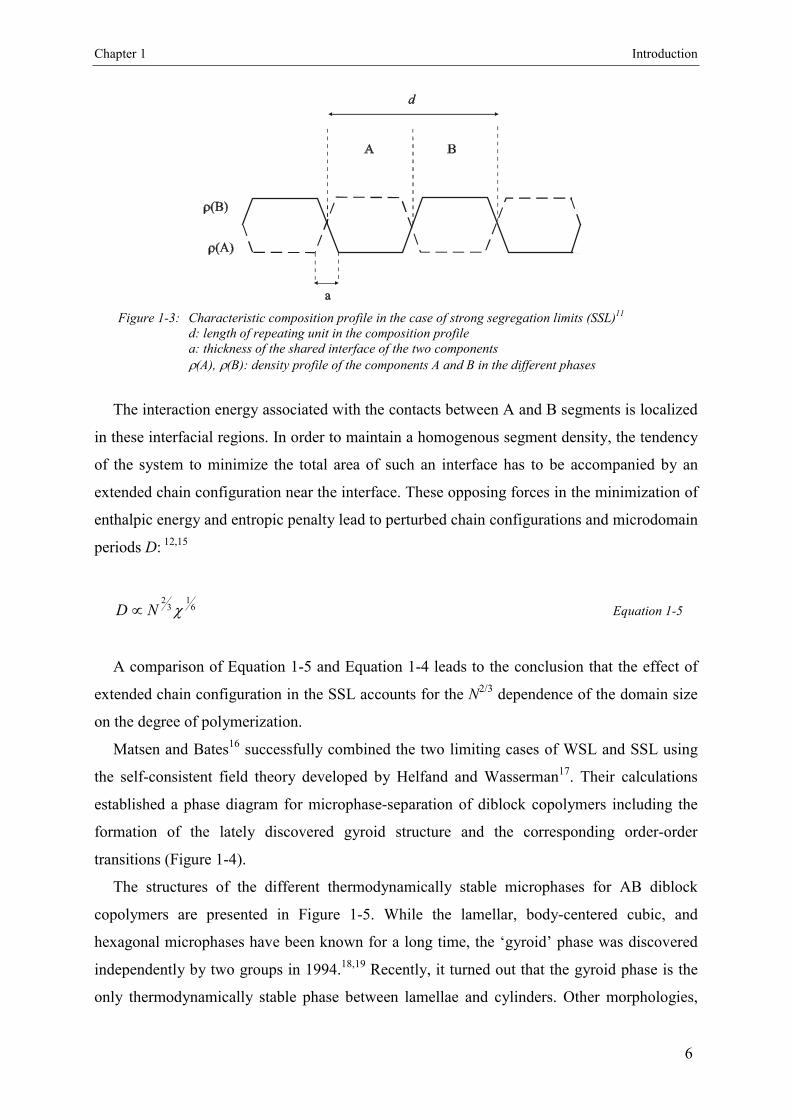
Figure 1-3: Characteristic composition profile in the case of strong segregation limits (SSL)11
d: length of repeating unit in the composition profilea: thickness of the shared interface of the two components�(A), �(B): density profile of the components A and B in the different phases
The interaction energy associated with the contacts between A and B segments is localized
in these interfacial regions. In order to maintain a homogenous segment density, the tendency
of the system to minimize the total area of such an interface has to be accompanied by an
extended chain configuration near the interface. These opposing forces in the minimization of
enthalpic energy and entropic penalty lead to perturbed chain configurations and microdomain
periods D: 12,15
61
32
�ND � Equation 1-5
A comparison of Equation 1-5 and Equation 1-4 leads to the conclusion that the effect of
extended chain configuration in the SSL accounts for the N2/3 dependence of the domain size
on the degree of polymerization.
Matsen and Bates16 successfully combined the two limiting cases of WSL and SSL using
the self-consistent field theory developed by Helfand and Wasserman17. Their calculations
established a phase diagram for microphase-separation of diblock copolymers including the
formation of the lately discovered gyroid structure and the corresponding order-order
transitions (Figure 1-4).
The structures of the different thermodynamically stable microphases for AB diblock
copolymers are presented in Figure 1-5. While the lamellar, body-centered cubic, and
hexagonal microphases have been known for a long time, the ‘gyroid’ phase was discovered
independently by two groups in 1994.18,19 Recently, it turned out that the gyroid phase is the
only thermodynamically stable phase between lamellae and cylinders. Other morphologies,

Chapter 1 Introduction
7
such as OBDD (ordered bicontinuous double diamond) or hexagonal perforated layer (HPL),
are meanwhile considered as transient or 'long-lived' metastable phases.20,21
Figure 1-4: Phase diagram for diblock copolymers in the strong segregation limit (SSL) as calculated by Matsenet al.16
ll: lamellar microphasehex: hexagonal microphaseBCC: body-centered cubic microphaseCPS: centered packed spheresDIS: disordered phase�A: volume fraction of component A in the diblock copolymer
BCC CYL GYR LAM GYR CYL BCC
�a
Figure 1-5: Thermodynamic equilibrium morphologies in AB diblock copolymers depending on the volumefraction of component A.BCC: spheres, arranged on a body centered cubic latticeHEX: cylinders, arranged on a hexagonal latticeGYR: gyroid, biscontinuous phaseLAM: lamellar structure

Chapter 1 Introduction
8
Symmetric diblock copolymers (�A = 0.5) arrange into a lamellar phase (LAM), with
alternating layers of the constituent blocks. The increase of the volume fraction of one
component leads to more asymmetrical copolymers, for which a bicontinuous cubic ‘gyroid’
phase (GYR) is observed. A phase of hexagonal-packed cylinders (HEX) and a body-centered
(BCC) cubic phase occur with a further increase of the volume fraction of the matrix
component. Simultaneously, the interfacial curvature increases on changing the morphology
from the LAM to the BCC phase.
B
MS
ll
u-cic
sos
cic
cac
hel
soc
dl
ml
lcls
cic
sos
Figure 1-6: Ternary phase diagramm of SBM triblock copolymers, color according to staining witht OsO4.PS: grey, PB: black, PMMA: white.
With ABC triblock copolymers the situation is even more complex, as not only AB
contacts play a role but also AC and BC interactions. As a result there is a rich variety of
triblock copolymer structures. Pioneering work on ABC triblock copolymers was done by
Arai et al.22, Mogi et al.23 - 25 and Stadler et al. 26 - 28 (Figure 1-6). Other types of block
copolymers (e.g. star-, brush-like or dendritic) also can increase the variety of morphologies29.
A detailed discussion of this field is, however, far beyond the scope of this introduction.

Chapter 1 Introduction
9
1.2. Surface Induced Microdomain Structures in Thin
Block Copolymer Films
Ultrathin films of polystyrene-b-poly(2-vinyl pyridine) block copolymers can self-
assemble into surface induced nanopatterns due to strongly different affinities of the polymer
blocks towards a substrate30,31. A very characteristic aspect of these patterns is the fact that the
anchoring block adsorbs so strongly on the substrate that its conformation is transformed to a
two dimensional coil. This, from the entropic point of view very unfavorable state can be
realized because of an enthalpic gain due to the interactions between polymer and substrate.
The adsorbing block is stretched in its lateral dimensions to such a degree that the non
adsorbing cannot follow. The gain in enthalpy that would result from wetting the surface
formed by the polar block is not sufficient to allow for chain stretching. Therefore, the non
adsorbing block dewets the adsorbed layer and forms small isolated clusters. From this
description it becomes clear that these surface patterns are only formed, if the adsorbing
blocks form a large number of contacts with the substrate32. This is only the case for ultrathin
films, in thicker block copolymer films, the surface is in contact with more polymer chains
and the number of contacts per chain and the stretching of the adsorbing blocks is reduced, so
the block copolymers can adopt a layered structure parallel to the substrate33.
The approach presented in this work relies on ABC triblock copolymers with a selectively
adsorbing short middle block (e.g. poly(2-vinyl pyridine) or poly(2-hydroxyethyl
methacrylate)) and polystyrene and poly(methyl methacrylate) end blocks. Based on recent
mean field calculations by Pickett and Balasz, we expect this middle block to facilitate the
generation of well-defined lateral morphologies34. In chapter 3 a detailed investigation of the
surface structures and their size scaling will be presented, describing the parameters that can
be used to control the domain spacing of different morphologies. These parameters are the
polymer composition, the film thickness and the concentration of the polymer solution from
which the film is prepared. The influence of these parameters is demonstrated in chapter 3.
1.3. Alignment of Block Copolymer Microstructures
Control of the orientation of a block copolymer microstructure allows the development of
polymeric materials with novel and interesting properties. Anisotropic mechanical, optical,

Chapter 1 Introduction
10
electrical or mass transport properties can be tailored by proper orientation of the block
copolymer microstructure. Alignment of glassy microphase-separated cylinders in a rubbery
matrix gives a material with a glassy modulus along the cylindrical axis and a rubbery
modulus along the transverse directions35. If the cylinders are made conductive, the material
becomes a directional conductor36 - 39. Quantum dots or wires could be made from block
copolymers with a spherical or cylindrical microstructure. The birefringence inherent in
lamellar or cylindrical block copolymers could be useful for optical applications. Alignment
of microstructures also is desirable for scientific investigations because interpretation of
experiments, e.g. transmission electron microscopy, is simplified when the microstructure is
uniformly oriented.
1.3.1. Shear Alignment
Commonly, the long-range order of the microdomains of a block copolymer is perturbed
by defects. If the microphase-separated state is formed from a disordered state in the absence
of a strong aligning field, the resulting grains nucleating at different centers will exhibit
various randomly distributed orientations. This finally leads to defects at the grain boundaries
like wall and line defects and curvature. In the past, many research groups have shown that
macroscopic alignment of lamellar and cylindrical microstructures can be achieved by
flow40 - 42. Most studies have focused on shear which is easily applied. The variety of
observed alignments has been explained by several mechanisms, including rotation of ordered
regions (grains), disordering of regions that are destabilized by flow-induced deformation,
followed by reordering in a preferred alignment direction43 - 47.
In oscillatory shear experiments, the direction of alignment depends on the amplitude and
frequency of shear and on temperature48,49. Under certain conditions, the normal vector of
lamellar microdomains aligns in the flow gradient direction („parallel“ alignment), other
conditions lead to alignment along the vorticity direction („perpendicular“ alignment). Patel et
al.45 proposed that the mechanical contrast between the two microdomains is a primary
consideration in choice of alignment direction. Koppi et al.47 suggested that the vorticity in
shear induces instabilities in the parallel lamellae and thus favors perpendicular alignment. All
these considerations indicate, that the behavior of block copolymer microstructures under
flow is quite complex.

Chapter 1 Introduction
11
From a practical point of view, the most prominent procedures devised in the past are, for
example, Large Amplitude Oscillatory Shear (LAOS)50 - 52 and roll-casting53.
1.3.2. Electric Field Alignment
Flow provides a strong aligning force. However, because of boundary constraints and
conditions of continuity, the potential for flow-induced orientation is limited. Electric fields
provide a weaker aligning force but offer the advantage of local alignment control by
application of spatially specific electric fields. For these reasons, electric fields may provide a
unique pathway to new applications for block copolymers. In addition, electric field
alignment is scientifically interesting because the driving force for alignment is much simpler
than that induced by flow. Studies of field alignment can be used to learn about materials
properties like defect mobilities and give straightforward insight into alignment mechanisms.
Investigations on solvent-based systems of different block copolymers will be described in
chapters 5 to 8.
1.3.2.1. Electrothermodynamics of Microphase-Separated Block Copolymers
As an example we consider a block copolymer filling the gap between parallel, planar
electrodes. The electrodes are held at a constant potential by a voltage source. Therefore, the
free energy of the system contains an electrostatic contribution54:
rdrErFF 32
0 )()(8
1���
V
�
�
Equation 1-6
F0: free energy in the absence of an electric field�(r): local dielectric constantE(r): electric fieldThe integration is over the volume of the material, V.
According to this expression, materials with a high dielectric constant are attracted to
regions of high field strength, in order to maximize the magnitude of the negative electrostatic
contribution to the free energy. Different composition patterns within a block copolymer
material and the associated spatially varying local dielectric constant produce different
patterns of electric field. The consequence is a composition-pattern dependent electrostatic
Chapter 1 Introduction
12
contribution to the free energy. Certain orientations of the composition pattern are
thermodynamically favored over others. The forces that give rise to preferred orientations
arise from field-induced polarization charges resulting from gradients in the dielectric
constants. Using Maxwell´s equation for dielectric materials, we find that polarization charges
exist wherever the gradient in the dielectric constant has a component in the direction of the
applied field.
We will now consider the two different microdomain orientations of a lamellar AB diblock
copolymer parallel and perpendicular to the electrodes. For the parallel orientation, symmetry
in the transverse direction dictates a vertical electric field everywhere with the continuity
condition at the AB interface:
�AEA = �BEB , Equation 1-7
where �A and �B are the dielectric constants of the materials A and B, and EA and EB are the
electric field strengths in regions of the materials A and B. The discontinuity in the field
strength at the phase boundaries arises from excess polarization charges. The total voltage
drop across the lamellae must equal the applied voltage, V:
EA�Ad + EB�Bd = V , Equation 1-8
Where �A and �B are the volume fractions of components A and B and d is the electrode
spacing. Equations 1-7 and 1-8 yield the field strengths:
EA =
B
ABA
d
V
�
��
� �
1, EB =
A
BAB
d
V
�
��
� �
1Equation 1-9
Knowing the field strength, the electrostatic contribution to the free energy can be derived
from Equation 1-6:
VV
2
32
08
1)()(
8
1�
�
�
�
�
������ � d
VrdrErFF h�
�
�
�
Equation 1-10
where �h is the harmonic average of the dielectric constants:
Chapter 1 Introduction
13
B
B
A
A
h �
�
�
�
�
��
1Equation 1-11
This gives the effective dielectric constant of the material in the parallel orientation.
If the lamellae are perpendicular to the electrode surfaces, all the interfaces are parallel to
the electric field and thus there will be no excess polarization charges. The field will be a
constant V/d throughout the material. The electrostatic contribution to the free energy can be
calculated as
VV
2
3
2
08
1)(
8
1�
�
�
�
�
����
�
�
�
�
���� � d
Vrdr
d
VFF a�
�
�
�
Equation 1-12
where �a is the arithmetic average of the dielectric constants:
�a = �A�A + �B�B Equation 1-13
This is the effective dielectric constant of the material in the perpendicular orientation.
As the arithmetic mean of the dielectric constant always matches or exceeds the harmonic
mean, the perpendicular orientation always represents the lower energy state:
�a - �h = (�A - �B)2
BAAB
BA
����
��
�
0 Equation 1-14
The effective dielectric constant for an arbitrary orientation where the lamellar normal
vector forms a tilt angle, �, with respect to the vertical can be expressed as follows:
�eff(�) = �a + (�h - �a)cos2��� Equation 1-15
The material experiences a torque whenever the lamellae are not perpendicular to the
electrodes. The torque arises from the forces of attraction between the excess polarization
charges at the interfaces and the charges on the electrodes.
In the above considerations, the anisotropic behavior of the block copolymer
microstructure arises from shape and not from molecular anisotropy. In contrast to work by
Gurovich55 - 57, contributions to the electrostatic free energy from the alignment and stretching
Chapter 1 Introduction
14
of chains and their difference in polarizability in the direction along and perpendicular to the
bonds has been neglected.
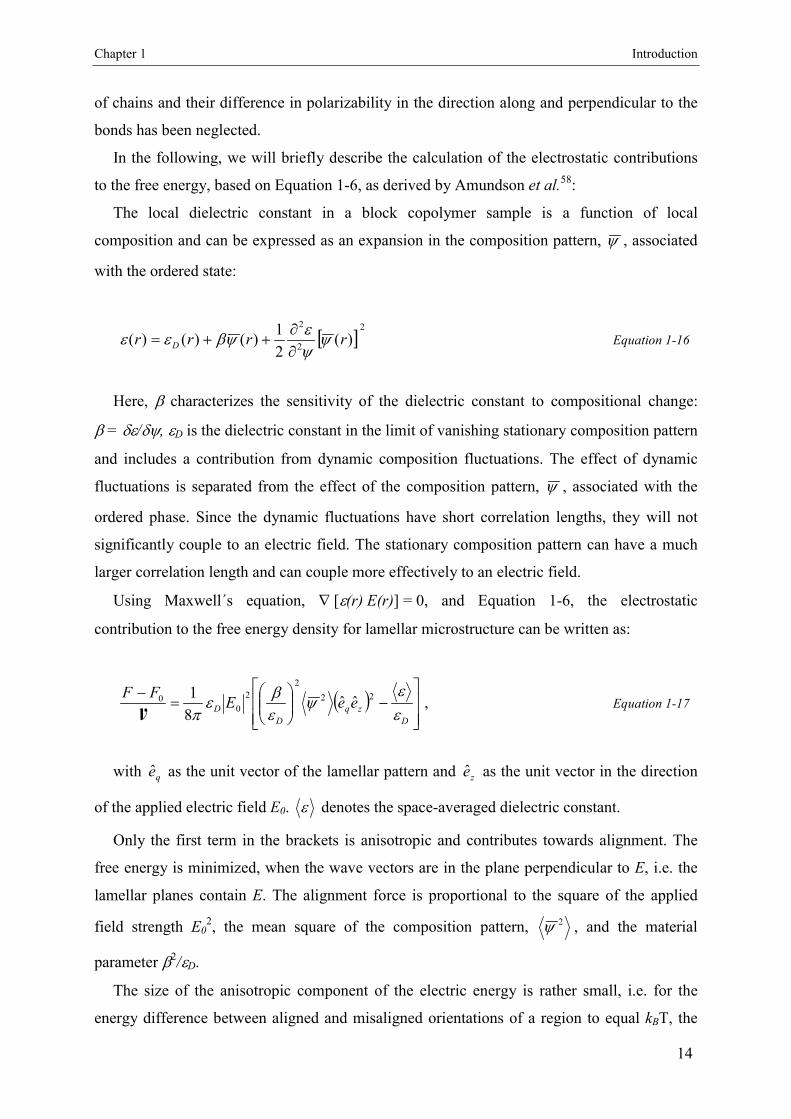
In the following, we will briefly describe the calculation of the electrostatic contributions
to the free energy, based on Equation 1-6, as derived by Amundson et al.58:
The local dielectric constant in a block copolymer sample is a function of local
composition and can be expressed as an expansion in the composition pattern, � , associated
with the ordered state:
� �
2
2
2
)(2
1)()()( rrrr D �
�
�
����
�
�
��� Equation 1-16
Here, � characterizes the sensitivity of the dielectric constant to compositional change:
� = ��/�, �D is the dielectric constant in the limit of vanishing stationary composition pattern
and includes a contribution from dynamic composition fluctuations. The effect of dynamic
fluctuations is separated from the effect of the composition pattern, � , associated with the
ordered phase. Since the dynamic fluctuations have short correlation lengths, they will not
significantly couple to an electric field. The stationary composition pattern can have a much
larger correlation length and can couple more effectively to an electric field.
Using Maxwell´s equation, � [�(r) E(r)] = 0, and Equation 1-6, the electrostatic
contribution to the free energy density for lamellar microstructure can be written as:
� �
�
�
�
�
�
�
�
�
���
��
�
�
�
D
zq
D
D eeEFF
�
�
�
�
�
�
�
22
2
2
00 ˆˆ
8
1
V, Equation 1-17
with qe as the unit vector of the lamellar pattern and ze as the unit vector in the direction
of the applied electric field E0. � denotes the space-averaged dielectric constant.
Only the first term in the brackets is anisotropic and contributes towards alignment. The
free energy is minimized, when the wave vectors are in the plane perpendicular to E, i.e. the
lamellar planes contain E. The alignment force is proportional to the square of the applied
field strength E02, the mean square of the composition pattern, 2
� , and the material
parameter �2/�D.
The size of the anisotropic component of the electric energy is rather small, i.e. for the
energy difference between aligned and misaligned orientations of a region to equal kBT, the

Chapter 1 Introduction
15
region must be of order of some hundred nanometers for a PS-b-PMMA block copolymer.
The electric field can only affect the microdomains if it is acting on an organized state with
long-range order.
Chapter 1 Introduction
16
1.4. Structure of this Thesis
The following chapters in this thesis describe in detail:
� Fundamentals of the most commonly used characterization and synthetic methods
(Chapter 2)
� Synthesis and characterization of functional ABC triblock copolymers for controlled
surface patterns on nanometer scale (Chapter 3)
� Investigation of homopolymer wetting behavior on chemically nanopatterned
Surfaces (Chapter 4)
� Introduction of a solvent-based method to generate highly anisotropic block
copolymer bulk samples using electric fields (Chapter 5)
� Elucidation of governing mechanisms responsible for electric field-induced alignment
of block copolymer microdomains in a PS-b-PI block copolymer in concentrated
toluene solutions (Chapter 6)
� Investigation of kinetics and mechanism of the electric field-induced alignment of a
PS-b-PHEMA-b-PMMA block copolymer in concentrated tetrahydrofuran solutions,
determining the influence of phase separation and dielectric contrast (Chapter 7)
� Application of electric field-induced alignment of block copolymer microdomains to
high molecular weight AB and ABC block copolymers with high dielectric contrast
(PS-b-P2VP, PS-b-PtBMA, PS-b-P2VP-b-PtBMA) (Chapter 8)

Chapter 1 Introduction
17
References
1 Anastasiadis, S.H.; Russell, T.P.; Satija, S.K.; Majkrzak, C.F. Phys. Rev. Lett. 1989, 62,
1852.
2 Annighöfer, F.; Gronski, W. Makromol. Chem., Rapid Commun. 1983, 4, 123.
3 Wiesner, U. Macromol. Chem. Phys. 1997, 198, 3319.
4 Chen, Z.-R.; Kornfield, J.A.; Smith, S.D.; Grothaus, J.T.; Satkowski, M.M. Science 1997,
277, 1248.
5 Chen, Z.-R.; Kornfield, J.A. Polymer 1998, 39, 4679.
6 Keller, A.; Pedemonte, E.; Willmouth, F.M. Nature 1970, 225, 538.
7 Albalak, R.J.; Thomas, E.L. J. Polym. Sci., Polym. Phys. Ed. 1993, 31, 37.
8 Thurn-Albrecht, T.; Schotter, J.; Kastle, G.A.; Emley, N.; Shibauchi, T.; Krusin-Elbaum, L.;
Guarini, K.; Black, C.T.; Tuominen, M.T.; Russell, T.P. Science 2000, 290, 2126.
9 Amundson, K.; Helfand, E.; Davis, D.D.; Quan, X.; Patel, S.S.; Smith, S.D.;
Macromolecules 1991, 24, 6546.
10 Bates, F.S.; Frederickson, G.H. Physics Today 1999, 52, 32.
11 Bates, F. S.; Fredrickson, G. H. Annu. Rev. Phys. Chem. 1990, 41, 525.
12 Semenov, A.N. Sov. Phys. JETP 1985, 61, 733.
13 Ohta, T.; Kawasaki, K. Macromolecules 1986, 19, 2621.
14 Leibler, L. Macromolecules 1980, 13, 1602.
15 Helfand, E.; Wassermann, Z.R. Macromolecules 1976, 9, 879.
16 Matsen, M.W.; Bates, F.S. Macromolecules 1996, 13, 1091.
17 Helfand, E.; Wasserman, Z.R. Macromolecules 1980, 13, 994.
18 Schulz, M.F.; Bates, F.S.; Almdal, K.; Mortensen, K.; Hajduk, D.A. Phys. Rev. Lett. 1994,
77, 3153.
19 Hadjuk, D.A.; Harper, P.E.; Gruner, S.M.; Honeker, C.C.; Kim, G.; Thomas, E.L.; Fetters,
L.J. Macromolecules 1993, 27, 4063.
20 Hadjuk, D.A.; Harper, P.E.; Gruner, S.M.; Honeker, C.C.; Thomas, E.L.; Fetters, L.J.
Macromolecules 1995, 28, 2570.
21 Vigild, M.E.; Almdal, K.; Mortensen, K.; Hamley, I.W.; Fairclough, J.P.A.; Ryan, A.J.
Macromolecules 1998, 31, 5702.
22 Arai, K.; Kotaka, T.; Kitano, Y.; Yoshimura, K. Macromolecules 1980, 13, 455.
23 Mogi, Y.; Kotsuji, H.; Kaneko, Y.; Mori, K.; Matsushita, Y.; Noda, I. Macromolecules
1992, 25, 5408.

Chapter 1 Introduction
18
24 Mogi, Y.; Mori, K.; Kotsuji, H.; Matsushita, Y.; Noda, I.; Han, C.C. Macromolecules 1993,
26, 5169.
25 Mogi, Y.; Nomura, M.; Kotsuji, H.; Ohnishi, K.; Matsushita, Y.; Noda, I. Macromolecules
1994, 27, 6755.
26 Stadler, R.; Auschra, C.; Beckmann, J.; Krappe, U.; Voigt-Martin, I.; Leibler, L.
Macromolecules 1995, 28, 3080.
27 Breiner, U.; Krappe, U.; Abetz, V.; Stadler, R. Macromol. Chem. Phys., 1997, 198, 1051.
28 Breiner, U.; Krappe, U.; Thomas, E. L.; Stadler, R. Macromolecules, 1998, 31, 135.
29 Hückstädt, H.; Göpfert, A.; Abetz, V. Polymer, 2000, 41, 9089.
30 Spatz, J.P.; Sheiko, S.S.; Möller, M. Adv. Mater. 1996, 8, 513.
31 Spatz, J.P.; Möller, M.; Noeske, M.; Behm, R.J.; Pietralla, M. Macromolecules, 1997, 30,
3874.
32 In ref. 31 Spatz et al. found that every third to second 2VP unit is in contact with the
substrate. This is sufficient to prevent a significant expansion of the adsorbing block into the
third dimension (perpendicular to the substrate surface).
33 Russell, T.P.; Coulou, G.; Deline, V.R.; Miller, D.C. Macromolecules 1989, 22, 4600.
34 Pickett, G. T.; Balazs, A. C. Macromol. Theory Simul. 1998, 7, 249.
35 Albalk, R.J.; Thomas, E.L. Polymer 1995, 35, 4115.
36 Tassoni, R.; Schrock, R.R. Chem. Mater. 1994, 6, 744.
37 Saunders, R.S.; Cohen, R.E.; Schrock, R.R. Macromolecules 1991, 24, 5599.
38 Ishizu, K.; Yamada, Y.; Saito, R.; Kanbara, T.; Yamamoto, T. Polymer 1993, 34, 2256.
39 Morkved, T.L.; Wiltzius, P.; Jaeger, H.M.; Grier, D.G.; Witten, T.A. Appl. Phys. Lett. 1994,
64, 422.
40 Barclay, G.G.; Ober, C.K. Prog. Polym. Sci. 1993, 18, 899.
41 Heilmeir, G.H.; Goldmacher, J.E. Appl. Phys. Lett. 1969, 13, 132.
42 Lavrentovich, O.D.; Kléman, M. Phys. Rev. E 1993, 48, R39.
43 Hadziioannou, G.; Mathis, A.; Skoulios, A. Colloid Polym. Sci. 1979, 257, 136.
44 Larson, R.G.; Winey, K.I.; Patel, S.S.; Watanabe, H.; Bruinsma, R. Rheol. Acta 1993, 32,
245.
45 Patel, S.S.; Larson, R.G.; Winey, K.I.; Watanabe, H. Macromolecules 1995, 28, 4313.
46 Winey, K.I.; Patel, S.S.; Larson, R.G.; Watanabe, H. Macromolecules 1993, 26, 4373.
47 Koppi, K.A.; Tirrell, M.; Bates, F.S.; Almdal, K.; Colby, R.H. J. Phys. (Paris) 1993, 2,
1941.

Chapter 1 Introduction
19
48 Gupta, V.; Krishnamoorti, R.; Kornfiled, J.A.; Smith, S.D. Macromolecules 1996, 29, 1359.
49 Gupta, V.; Krishnamoorti, R.; Chen, Z.R.; Kornfiled, J.A.; Smith, S.D.; Satkowski, M.M.;
Grothaus, J.T. Macromolecules 1996, 29, 875.
50 Wiesner, U.; Macromol. Chem. Phys. 1997, 198, 3319.
51 Chen, Z.-R.; Kornfield, J.A.; Smith, S.D.; Grothaus, J.T.; Satkowski, M.M.; Science 1997,
277, 1248.
52 Chen, Z.-R.; Kornfield, J.A.; Polymer 1998, 39, 4679.
53 Albalak, R.J.; Thomas, E.L.; J. Polym. Sci., Polym. Phys. Ed. 1993, 31, 37.
54 Landau, L.D.; Lifshitz, E.M.; Pitaevskii, L.P. Landau and Lifshitz Course of Theoretical
Physics, Vol. 8: Electrodynamics of Continuous Media, 2nd ed., Pergamon Press, New York,
1984, pp. 44-51.
55 Gurovich, E. Macromolecules 1994, 27, 7063.
56 Gurovich, E. Macromolecules 1994, 27, 7339.
57 Gurovich, E. Phys. Rev. Lett. 1995, 74, 482.
58 Amundson, K.; Helfand, E.; Quan, X.; Smith, S.D. Macromolecules 1993, 26, 2698.

Chapter 2 Methods
20
2. Methods
2.1. Synthesis
2.1.1. Anionic Polymerization
Anionic polymerization of styrene1 and dienes2,3 initiated by alkali metals has been well-
known since the early 1900´s. The interest in these reactions has increased continuously over
the last decades since Szwarc first reported the “living” nature of the anionic polymerization
of styrene and diene monomers in 1956.4,5 One important aspect of the term living
polymerization refers to the fact that the reaction occurs in the absence of irreversible
termination and chain transfer.4-6 Therefore, the molecular weight in a living polymerization
is controlled by the stoichiometry of the reaction and the degree of conversion. The living
nature of the propagating chain allows the synthesis of block copolymers by sequential addi-
tion of different monomers. Due to the complex, reaction condition dependent, mechanism the
properties of the polymer can be adjusted to specific requirements. By variation of
composition and architecture the following properties can be controlled:
� Molecular weight and molecular weight distribution
� Topology of the polymers
multiblock copolymer star block copolymer 7-9
comb shaped polymer 10-12
� Sequence of the monomer units 4,5,13
block copolymer statistical copolymer alternating copolymer
� End-functionalized polymers by a functionalized initiator or end capping of the living
chain end 14-16

Chapter 2 Methods
21
� Tacticity for monomers of the type CH2=CHR or CH2=CR1R2
H H H H
R R R R
H H H H
H HHH
H H H H
R H R H
H H H H
H RRH
H H H H
R R H R
H H H H
R HHH
isotactic syndiotactic atactic
� Microstructure of diene-based polymers (Regiochemistry)
1,2-polybutadiene 1,4-cis polybutadiene 1,4-trans polybutadiene
In the last 50 years, new polymerization techniques such as cationic polymerization,17
Ziegler-Natta,18 ring-opening metathesis19 or group transfer polymerization20,21 have been
developed in order to control the architecture of polymers. Recently, “living”/ controlled
radical polymerization (e.g., atom transfer radical polymerization, ATRP) has become a major
topic of research 22,23.
2.1.2. Fundamentals of Anionic Polymerization
2.1.2.1. Molecular Weight Distribution and Mechanism
As described above, the molecular weight in a living polymerization is controlled by the
stoichiometry of the reaction and the degree of conversion. Therefore, a living anionic
polymerization only consists of initiation and propagation steps in the absence of termination
and chain transfer. As a consequence, the concentration of propagating chains, c*, is constant
during the course of the reaction and the number-average molecular weight depends linearly
on the conversion, p. This yields for the number-average degree of polymerization, nX , at
full conversion24:
0
0
][
][
I
MX n � , Equation 2-1
[M]0: initial concentration of monomer[I]0: initial concentration of monofunctional initiator

Chapter 2 Methods
22
A consequence of the absence of termination and chain transfer in a polymerization is that
the resulting polymer should be nearly monodisperse ( nw MM � ), when the following
conditions are fulfilled: Initiation must be fast compared to propagation so that all
propagations centers begin to grow simultaneously. Efficient mixing (tmix « t1/2) throughout
the polymerization is required and depropagation must be slow relative to propagation.
Moreover, there must be a fast equilibrium between propagating species of different
reactivity. Under these circumstances, the size distribution will be given by a Poisson
distribution 25,26. The polydispersity index (PDI) can be expressed as
nn
n
n
w
XX
X
X
X 11
11
2��
�
�� Equation 2-2
nX : number-average degree of polymerization
wX : weight-average degree of polymerization
Equation 2-2 shows that for sufficiently high degrees of polymerization, the size
distribution will be narrow with PDI being close to unity. Practically, living anionic systems
under ideal conditions yield nw XX < 1.1 27,28.
In general, anionic polymerizations can be described by the following three reaction
schemes, where the reaction is terminated deliberately by addition of a hydrogen transfer
agent (e.g. methanol or water).
�
���� ik PMI i* Initiation
I*: initiatorM: monomerPi
*: active polymer chain with i monomer unitski: rate constant of initiation
R LiY
CR Li+
Y ki+
Y: electron withdrawing group
Figure 2-1: Reaction scheme for the initiation step of an anionic polymerization
The initiator required to polymerize a monomer depends on the reactivity of the monomer
towards nucleophilic attack. The monomer reactivity increases with increasing ability to

Chapter 2 Methods
23
stabilize the carbanion charge. Very strong nucleophiles such as amide anions29 or alkyl
carbanions are needed to polymerize monomers, such as styrene and butadiene, with
relatively weak electron-withdrawing substituents. Weaker nucleophiles, such as alkoxide30 or
hydroxide ions, can initiate the polymerization of monomers with strongly electron-
withdrawing substituents, such as acrylonitrile, methyl methacrylate and methyl vinyl ketone,
although the efficiency is lower than that of stronger nucleophiles31-35.
*
1
*
�
���� i
k
i PMP p Propagation
kP: rate constant of propagation
Y
CR Li+
Y
R C
Y
n
Li+
Y kp
+
Figure 2-2: Reaction scheme of the propagation step of an anionic polymerization
The rate constant of propagation and rate of propagation for an anionic polymerization are
strongly affected by the nature of both the solvent and the counterion. If we consider for
example the polymerization of styrene with sodium counterion, the apparent rate constant of
propagation is increased by two orders of magnitude when the reaction is conducted in
tetrahydrofuran (� = 7.6) rather than in benzene (� = 2.2), i.e. the polymerization is much
faster in a more polar solvent36. The stronger solvating power of the reaction medium
increases the fraction of solvent separated ion pairs relative to contact ion pairs and thus
increases their reactivity. On the other hand also the counterion itself influences the fraction
solvent separated ion pairs: the smaller Li+ is solvated to a much greater extend than the larger
Cs+.
�
������� XYPYXP ik
it*
Termination
kt: rate constant of terminationX-Y: quenching agent for termination of the polymerizationX -: anion of the terminating agent
Y
R C
Y
n
Li+
OH2
Y
R
Y
HnLi
+OH+ +
Figure 2-3: Termination of an anionic chain end by water

Chapter 2 Methods
24
2.1.2.2. Kinetics
Under the condition that initiation is faster than propagation (i.e. the concentration of
active polymer chains in the system, c*, is constant), the rate of propagation can be described
by a pseudo-first-order rate equation.
][][][ * MkMck
dt
MdR apppp ����
Equation 2-3
Rp: rate of propagation[M]: monomer concentrationc*: concentration of active polymer chains in the systemkapp: pseudo-first-order rate constant
Integration of Equation 2-3 yields:
tktckM
Mappp
t
��
*0
][
][ln Equation 2-4
[M]o: initial monomer concentration[M]t: monomer concentration at time t
A time-conversion plot results in a straight line through the origin in the case of
instantaneous initiation and absence of termination. The slope of the curve is equal to the
apparent rate constant of propagation, kapp.

Chapter 2 Methods
25
2.2. Characterization
2.2.1. Scanning Force Microscopy (SFM)
Scanning force microscopy (SFM) is becoming increasingly important in polymer
characterization with regard to both surface topography and surface mechanical properties.
The instrument used in this work is a Digital Instruments Dimension 3100 SFM with a
Nanoscope III Controller. Of particular interest in determining topography and phase
morphology in polymer films is Tapping Mode SFM.
Tapping Mode imaging is implemented in ambient air by oscillating the cantilever at or
near its resonance frequency using a piezoelectric crystal. The piezo motion causes the
cantilever to oscillate with a high amplitude (typically equal or greater than 20nm) when the
tip is not in contact with the surface. The oscillating tip is then moved toward the surface until
it begins to slightly touch, or “tap” the surface. During scanning, the vertically oscillating tip
alternately contacts the surface and lifts off, generally at a frequency of 250 - 350 kHz. As the
oscillating cantilever begins to intermittently contact the surface, the cantilever oscillation
amplitude is reduced due to energy loss caused by the tip contacting the surface. The
oscillation amplitude of the tip is measured. A digital feedback loop then adjusts the tip-
sample separation to maintain a constant amplitude. The reduction in oscillation amplitude is
used to identify and measure surface features.
Below we give a summary of the various types of images that can be collected in Tapping
Mode:
Height Data: The vertical position of the probe tip is monitored by noting changes in the
length of the z-axis on the xyz scanning piezo tube. The input voltage to the scanning piezo
tube is proportional to the length of the tube. The change in the z-axis is plotted as a
topographical map of the sample surface. Height data is a good measure of the height of
surface features but does not show distinct edges of these features.
Phase Data: This type of imaging monitors the change in phase offset, or phase angle, of
the oscillating cantilever with respect to the phase offset of the input drive signal (to the drive
piezo). The phase of the drive signal is compared to the phase of the cantilever response
signal on the photo diode detector. The phase offset between the two signals is defined as zero
for the cantilever oscillating freely in air. As the probe tip engages the sample surface, the
phase offset of the oscillating cantilever changes by a certain angle with respect to the phase
offset of the input drive signal. As regions of differing elasticity are encountered on the
sample surface, the phase angle between the two signals changes. These changes in phase
Chapter 2 Methods
26
offset are due to differing amounts of damping experienced by the probe tip as it rasters
across the sample surface. This phase shift is very sensitive to variations in material properties
such as adhesion and viscoelasticity.
Amplitude Data: The amplitude of the cantilever is monitored by the photo diode detector.
The RMS value of the laser signal on the y-axis of the detector is recorded for each of the 512
segments on a given raster of the probe tip. These values are plotted as an amplitude map of
the sample surface. Amplitude images tend to highlight edges of surface features.
2.2.2. Transmission Electron Microscopy (TEM) 37,38
2.2.2.1. Fundamentals of Transmission Electron Microscopy
Transmission electron microscopy (TEM) is one of the most versatile analytical tools for
the investigation of polymer microstructures, especially when studying multiphase polymer
morphologies and polymer blends. In the 1930´s, it provided the first insight into structural
features on a sub-micrometer scale. The transmission electron microscope overcomes the
limitation of the optical microscope the spatial resolution of which is limited to about half the
wavelength of the visible light.
Presently, the resolution limit in transmission electron microscopy is in the order of about
0.1 nm using an acceleration voltage of about 104-105 V. Figure 2-4 shows a schematic cross-
section of a transmission electron microscope that can be divided into two parts, the
illumination and the imaging system.
The former consists of the electron gun and the first and second condenser lenses.
Electrons are emitted from a V-shaped heated tungsten filament whereas the emitted electron
density is controlled by the voltage applied at the filament. A grid cap fading out parts of the
electron emitting cathode allows the generation of a spot-shaped electron beam. A high
voltage field accelerates the emitted electrons which reach the system of condenser lenses in
the illumination system after crossing the ring anode. These lenses regulate the intensity and
refocus the electron beam. The specimen is then hit by an intense, parallel beam of mono-
energetic electrons.
The imaging system is build up by the objective lens, the intermediate lens and their
corresponding apertures, the projector lens, a phosphor viewing screen, and the photographic
film. The most important parts of the imaging system are the objective lens and objective
aperture which can either generate a bright-field or a dark-field image of the specimen. The

Chapter 2 Methods
27
apertures act as filters mainly for elastically or inelastically scattered or transmitted electrons
and are necessary to create a phase contrast in the sample. Specimens of low-density
hydrocarbon materials like polymers must be less than 100 nm thick while high-density
metals should be less than 20 nm thick. Bright field is the most widely used mode of
transmission electron microscopy imaging, selecting the weakly scattered and transmitted
electrons by location of the objective aperture on the optic axis. Dark areas on the image
correspond to strongly scattering areas in the specimen.
Filament
Grid Cap
Acceleration Voltage
Anode
First condenser lens
First condenser lens aperture
Second condenser lens
Second condenser lens aperture
Specimen
Objective lens
Intermediate lens
Objective aperture
Sad aperture
Projector lens
Phosphor viewing screen
Photographic films
Imaging system
Illuminationsystem
Figure 2-4: Schematic cross section of a transmission electron microscope37
For dark-field imaging the objective aperture is set to collect a portion of the scattered
electrons, while the non-scattered or weakly scattered electrons are filtered out by the
aperture.
Usually, due to relatively similar electron densities, the contrast between most organic
polymers is rather limited and too low for a direct microphase investigation by bright-field or
dark-field imaging.39 A variety of methods is available to impose contrast in the TEM images.
Any substance that selectively reacts with or diffuses into one phase of the microstructure can

Chapter 2 Methods
28
be used as staining agent. Hereby, the contrast increases with the mass of the staining atom
and number of staining sites occupied per volume.
2.2.2.2. Staining of Polymer Samples
Ruthenium tetroxide (RuO4) is a strong oxidizing agent and reacts with both aromatic and
olefinic double bonds.40-42 The reaction of the staining agent with aromatic double bonds is
shown in Figure 2-5.
RuO4CH2 CH CH2 CH
O
H
O
RuO2+
Figure 2-5: Reaction of RuO4 with aromatic double bonds
The selectivity of RuO4 strongly depends on the staining time and on the concentration of
the vapor. RuO4 does not react with ester groups present in polymers, like
poly(methyl methacrylate). The interfaces in strongly segregated microphase-separated
polymers are often stained more strongly by RuO4 than expected from the corresponding
homogenous phase. This observation is explained by an enhanced reactivity of the functional
groups due to mechanical tension of the polymer chain at phase interfaces.43,44
Typically, RuO4 vapor is generated by the reaction of hydrated ruthenium trichloride
(RuCl3�3H2O) and a 15-20 wt.-% aqueous solution of sodium hypochlorite (NaOCl, Figure 2-
6).
8 NaOCl 2 RuO4 8 NaCl 3 Cl2 3 H2O+ + + +2 RuCl3 3 H2O�
Figure 2-6: Generation of ruthenium tetroxide from ruthenium chloride
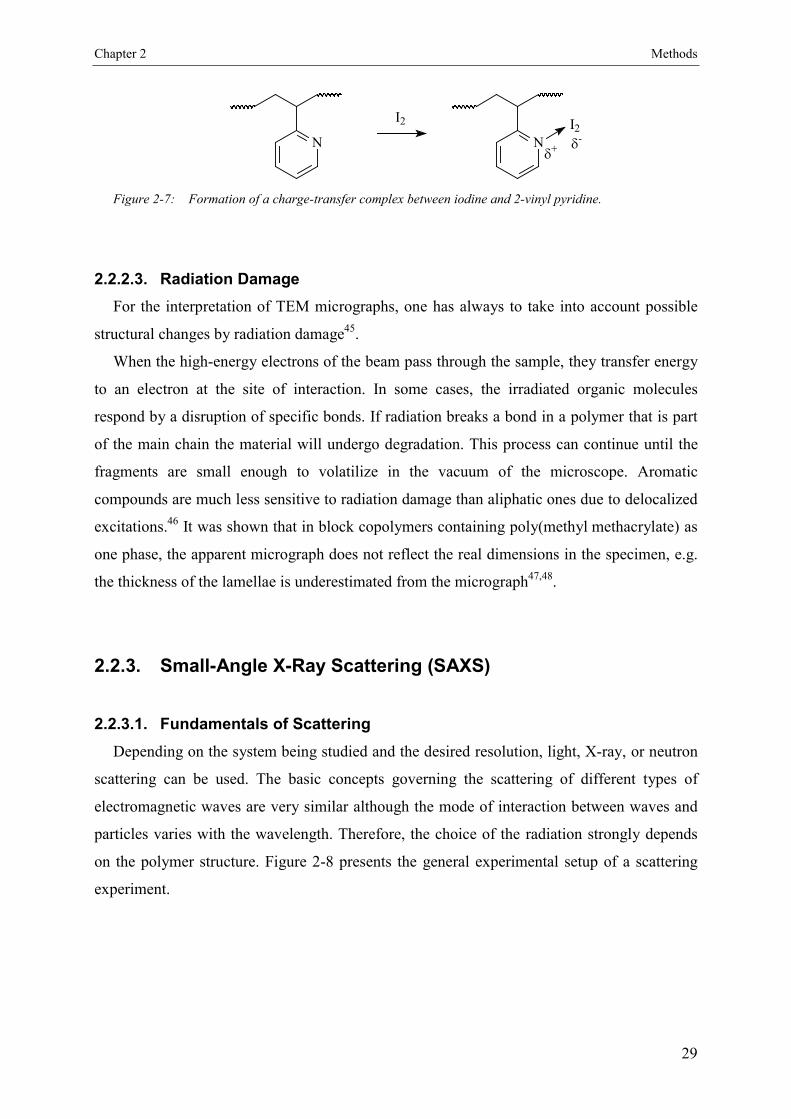
In order to selectively stain poly(2-vinyl pyridine), iodine is used frequently. Samples are
exposed to iodine vapor at room temperature which diffuses into the microstructure and forms
a charge-transfer complex with the amino function of the 2-vinyl pyridine moieties. The
reaction is shown in Figure 2-7.
Chapter 2 Methods
29
N
I2
N
I2
�
��
-
Figure 2-7: Formation of a charge-transfer complex between iodine and 2-vinyl pyridine.
2.2.2.3. Radiation Damage
For the interpretation of TEM micrographs, one has always to take into account possible
structural changes by radiation damage45.
When the high-energy electrons of the beam pass through the sample, they transfer energy
to an electron at the site of interaction. In some cases, the irradiated organic molecules
respond by a disruption of specific bonds. If radiation breaks a bond in a polymer that is part
of the main chain the material will undergo degradation. This process can continue until the
fragments are small enough to volatilize in the vacuum of the microscope. Aromatic
compounds are much less sensitive to radiation damage than aliphatic ones due to delocalized
excitations.46 It was shown that in block copolymers containing poly(methyl methacrylate) as
one phase, the apparent micrograph does not reflect the real dimensions in the specimen, e.g.
the thickness of the lamellae is underestimated from the micrograph47,48.
2.2.3. Small-Angle X-Ray Scattering (SAXS)
2.2.3.1. Fundamentals of Scattering
Depending on the system being studied and the desired resolution, light, X-ray, or neutron
scattering can be used. The basic concepts governing the scattering of different types of
electromagnetic waves are very similar although the mode of interaction between waves and
particles varies with the wavelength. Therefore, the choice of the radiation strongly depends
on the polymer structure. Figure 2-8 presents the general experimental setup of a scattering
experiment.

Chapter 2 Methods
30
D
d
2�
I(q)
NI0
q�
ik�
ik�
fk�
Figure 2-8: General setup of a scattering experiment
I0: intensity of the incident beamI(q): intensity of the scattered beam as a function of q
k�
: wave vector [nm-1]d: distance between scattering object and detector [nm]
q�
: scattering vector [nm-1]
D: detectorN: total number of particles�: Bragg scattering angle [ °]
An incident beam of monochromatic radiation with a wavelength � and an intensity I0 is
partly absorbed or scattered by a sample while the rest is transmitted unchanged. The intensity
of the scattered, I(q), waves is registered by a detector D at a distance d while the direction of
observation is varied. The scattering vector, q�
, is equal to the difference between the wave
vectors of the incident, i
k�
, and the scattered, f
k�
, plane waves. Coherent scattering occurs
primarily in the experiments on polymers. The radiation is scattered elastically and, hence, the
wave vectors are equal in their magnitude (Equation 2-5).
f i
2k k
�
�
� �
� �
Equation 2-5
kf: wave vector of the scattered beam [nm-1]ki: wave vector of the incident beam [nm-1]�: wavelength [nm]
The vector q�
can be defined as the difference f
k�
- i
k�
. Isotropic materials are described
with the norm of the scattering vector, q�
, being a function of the Bragg angle, �, as shown in
Equation 2-6.

Chapter 2 Methods
31
��2
22sin
q
k
q
i
�
�
�
��� with�
� �
��
sin4qq�
Equation 2-6
�: Bragg angle [ °]
q�
: scattering vector
In contrast to the coherently scattered X-rays, the incoherently scattered ones result in
scattered waves of longer wavelengths. No coherence between the incident and the scattered
beam is preserved. This behavior is predominantly observed in wide-angle X-ray scattering
(WAXS) experiments.
For coherent elastic scattering of radiation at an angle 2� with respect to the incident
beam, the intensity, I(q), of the scattered beam is proportional to the square norm of the
amplitude, A(q), (Equation 2-7).
2)()( qAqI � Equation 2-7
I(q) intensity of the scattered beamA(q): amplitude of the scattered beam
As shown in Equation 2-8, the amplitude itself derives from the electron density
distribution within the sample.
��
V
driqrrqA )exp()()( � Equation 2-8
A(q):amplitude of the scattered beamV: scattering volume of the sample [cm3]�(r): electron density [C/cm3]
For materials exhibiting a long-range and periodic order, the amplitude can be defined as
the product of the so called lattice factor, L(q), and the structure factor, F(q), (Equation 2-9).
)()()( qFqLqA �� Equation 2-9
A(q):amplitude of the scattered beamL(q): lattice factorF(q):structure factor

Chapter 2 Methods
32
2.2.3.2. Small-Angle X-Ray Scattering on Microphase Separated Block
Copolymers
Small-angle X-ray scattering (SAXS) is one of the most widely used techniques available
to study polymer structures on a scale of 2-200 nm. While transmission electron microscopy
allows the investigation of the microphase in local areas of a few micrometers, SAXS
provides average information about bulk properties of the segregated microdomains within
the sample. The X-rays scattered from different electrons interfere with each other and
generate a diffraction pattern. Due to the interaction of the beam with the electrons, segments
of the block copolymers need to be different in their electron density in order to allow a
monitoring of the morphology by SAXS. Otherwise, the regularity of the morphology cannot
be detected in form of well-defined intensity maxima in the scattering profile. In a first
approximation, the electron density can be calculated using Equation 2-10.
A e
e
i i
i
i
N Z
m
�
� � Equation 2-10
�ei: electron density of component I [C/cm3]NA: Avogadro’s number [mol-1]�I: density of component I [g/cm3]Zei: number of electrons of component I [C]mi: molar mass of component I [g/mol]
The scattered intensity pattern arising from a microphase-separated block copolymer is
similar to the diffraction pattern obtained from a crystalline solid. However, the Bragg dif-
fraction peaks occur at smaller scattering angles and show a broadening of the peaks due to
the diminished regularity as compared to a regular crystalline lattice.49 Both factors in
Equation 2-9 must be defined in relation to the specific characteristics of block copolymers
compared to crystals.
When the lattice has long-range periodicity, the lattice factor, L(q), provides information
about the spatial distribution of the scattering objects (spheres, cylinders, lamellae) and can be
described as a linear array of delta functions for a particular set of lattice planes. The spacing
of the delta functions is related to the distance of the lattice by an inverse proportionality.50
Depending on the type of lattice, only certain peaks can be found corresponding to allowed
reflexes of the particular structure. Bragg’s Equation (Equation 2-11) describes the condition
for the interference of the beam scattered at two different planes in the crystal.

Chapter 2 Methods
33
hkln 2 sind� � � Equation 2-11
�: Bragg angle [ °]n: order of the reflexdhkl: distance between two planes (hkl) [nm]
Equation 2-11 together with the definition of the size of the scattering vector (Equation
2-6) determines the spacing dhkl (Equation 2-12) from the diffraction pattern of the crystal.
hkl
2 nd
q
�
� Equation 2-12
The observed values for the spacing can be compared to the characteristic sequences of
model lattices and the ratio of the characteristic peaks, dhkl, with the first peak, d100. Table 2-1
presents the ratios of Bragg spacings for different spatial arrangements, such as lamellae,
hexagonally packed cylinders and body centered cubic (bcc) spheres.
Figure 2-9: Cylindrical long period L and distance d in a hexagonal lattice.
L: cylindrical long period determined by TEM, shortest distance between two related cylinders [nm]d: distance between parallel planes obtained by the reflex q100 for a hexagonal lattice [nm]
Morphology Scattering Maxima1 2 3 4 5 6
Spheres
bcc
dhkl/d100
qhkl/q100
1
1
0.707
2
0.577
3
0.5
4
0.447
5
0.408
6
hkl 110 200 211 220 310 222Cylinders
hexagonaldhkl/d100
qhkl/q100
1
1
0.577
3
0.5
4
0.378
7
0.333
9
0.289
12
hkl 100 110 200 210 300 320Lamellae dhkl/d100
qhkl/q100
1
1
0.5
2
0.333
3
0.25
4
0.20
5
0.167
6hkl 100 200 300 400 500 600
Table 2-1: Ratios of consecutive Bragg spacings for different model morphologies:Body centered cubic spheres (bcc), hexagonally packed cylinderand lamellae

Chapter 2 Methods
34
In a hexagonally packed lattice, the distance d100 resulting from the scattering peak q100
corresponds directly to the shortest distance between two parallel neighboring lattice planes
(Figure 2-9).
While TEM also provides the shortest distance between two cylinders, L, SAXS only
yields information about the distance between two neighboring planes. For a hexagonal
symmetry of the structure, both values are correlated by Equation 2-13.
Ld2
3100 � Equation 2-13
d100: distance between two parallel planes [nm] (Figure 2-9)
The structure factor (Equation 2-9) depends on the geometric shape of an object and
derives from a Fourier transformation of an individual domain structure. For solid spheres,
cylinders, and lamellae, the structure factors are rapidly oscillating functions.51 Spheres can be
described by trigonometric functions (Equation 2-14).52
� �S 3
sin sin cos( )
qr qr qrF q
qr
�
� Equation 2-14
FS(q): structure factor of a homogenous spherer: radius of the sphere [nm]q: scattering vector
A Bessel function of first order is used to describe the structure factor for cylinders, which
have negligible diameters compared to their lengths (Equation 2-15).
1
C
( )( )
J qrF q
qr� Equation 2-15
with
� �
� �
v
v
vqr
vvqrJ
21
01
22!
1)(
�
�
�
�
�
�
�
�
�
��
�
FC: structure factor of a homogenous cylinderr: radius of the cylinder [nm]J1: Bessel function of first order
Both functions strongly depend on the product of the scattering vector, q, and the radius, r,
of the spheres or cylinders. If the minimum in the function is equal to zero, no diffraction
peak will be observed even if it corresponds to a scattering vector which represents a solution
Chapter 2 Methods
35
for the delta function of the lattice vector. Thus, the absence of a diffraction peak in an
expected sequence may be the result of a weak structure factor.
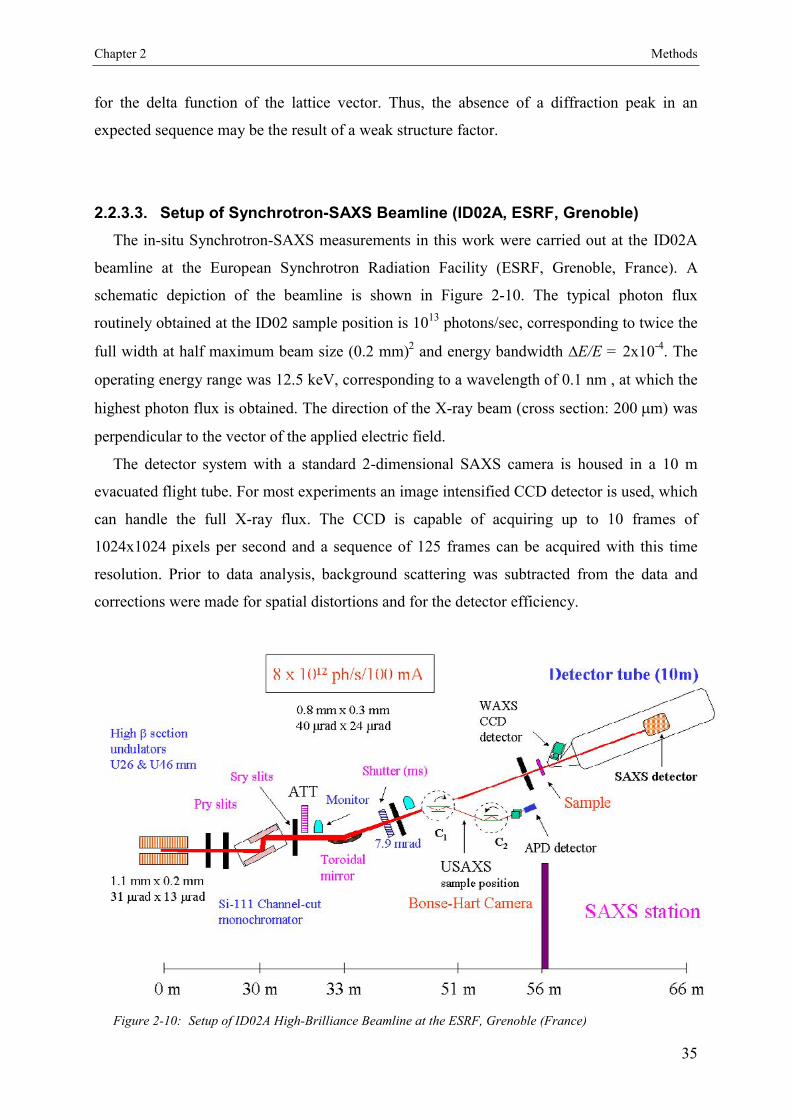
2.2.3.3. Setup of Synchrotron-SAXS Beamline (ID02A, ESRF, Grenoble)
The in-situ Synchrotron-SAXS measurements in this work were carried out at the ID02A
beamline at the European Synchrotron Radiation Facility (ESRF, Grenoble, France). A
schematic depiction of the beamline is shown in Figure 2-10. The typical photon flux
routinely obtained at the ID02 sample position is 1013 photons/sec, corresponding to twice the
full width at half maximum beam size (0.2 mm)2 and energy bandwidth �E/E = 2x10⁻⁴. The
operating energy range was 12.5 keV, corresponding to a wavelength of 0.1 nm , at which the
highest photon flux is obtained. The direction of the X-ray beam (cross section: 200 �m) was
perpendicular to the vector of the applied electric field.
The detector system with a standard 2-dimensional SAXS camera is housed in a 10 m
evacuated flight tube. For most experiments an image intensified CCD detector is used, which
can handle the full X-ray flux. The CCD is capable of acquiring up to 10 frames of
1024x1024 pixels per second and a sequence of 125 frames can be acquired with this time
resolution. Prior to data analysis, background scattering was subtracted from the data and
corrections were made for spatial distortions and for the detector efficiency.
Figure 2-10: Setup of ID02A High-Brilliance Beamline at the ESRF, Grenoble (France)

Chapter 2 Methods
36
References
1 Schlenk, W.; Appenrodt, J.; Michael, A.; Thal, A. Chem. Ber. 1914, 47, 473.2 Matthews, F.E.; Strange, E.H. British Patent 1910, 24, 790.3 Harries, C. Justus Liebigs Ann. Chem. 1911, 383, 213.4 Szwarc, M. Nature, 1956, 178, 1168.5 Szwarc, M.; Levy, M.; Milkovich, R. J. Am. Chem. Soc., 1958, 78, 2656.6 Szwarc, M.; Carbanions, Living, Polymers and Electron Transfer Processes, Interscience,
New York, 1968.7 Bywater,S.; Adv. Polym. Sci. 1979, 30, 89.8 Rempp, P.; Volkov; V. I.; Parrod, J.; Sadron, C. Bull. Soc. Chim. Fr. 1960, 919.9 Quirk, R.P.; Yoo, T.; Lee, B. J. Macromol. Sci. Pure Appl. Chem. 1994, A31, 911.10 Ceresa, R. J.(ed.); Block and Graft Copolymerization, Vol. 1+2, Wiley-Intersience, New
York 1973.11 Dreyfuss, P.; Quirk, R.P.; Encyclopedia of Polymer Science and Engineering, Vol. 7, p.551,
Wiley-Intersience, New York, 1985.12 Rempp, P. F.; Lutz, P. J.; Comprehensive Polymer Sience, Vol. 6, p.403, Pergamon Press,
Elmsford, 1989.13 Quirk, R.P.; Kinning, D.J.; Fetters, L.J.; Comprehensive Polymer Science, Vol. 7, Pergamon
Press, Elmsford, 1989.14 Quirk, R.P.; Yin, J.; Guo, S.-H.; Hu, X.-W.; Summers, G.; Kim, J.; Zhu, L.-F.; Schock,
L.E. Makromol. Chem. Macromol. Symp. 1990, 32, 47.15 Morton M.; Fetters, L. J. Macromol. Rev. 1967, 2, 71.16 Fontanille, M.; Comprehensive Polymer Science, Vol. 3, p.425, Pergamon Press, Elmsford,
1989.17 Miyamato, M.; Sawamoto, M.; Higashimura, T. Macromolecules 1984, 17, 265.18 Doi, Y.; Keii, T. Adv. Polym. Sci. 1986, 73/74, 201.19 Amass, A.J.; Beevers, M.S.; Farren, T.R.; Stowell, J.A. Makromol. Chem. 1987, 188, 2535.20 Webster, O.W.; Hertler, W.; Sogah, D.Y.; Farnham, W.B.; Rajen-Babu, T.V. J. Am. Chem.
Soc. 1983, 105, 5706.21 Müller, A.H.E. Makromol. Chem., Macromol. Symp. 1990, 32, 87.22 Georges, M.K.; Veregin, R.P.N.; Kazmaier, P.M.; Hamer, G.K. Macromolecules 1993, 26,
2987.23 Matyjaszewski, K.; Wang, J.-L.; Grimaud, T.; Shipp, D.A. Macromolecules 1998, 31, 1528.24 Waack, R.; Rembaum, A.; Coombes, J. D.; Szwarc, M. J. Am. Chem. Soc. 1957, 79, 2026.25 Flory, P. J. J. Am. Chem. Soc. 1940, 62, 1561.26 Schulz, G.V. Z. Elektrochem. 1956, 60, 199.27 Fetters, L.J.; Encyclopedia of Polymer Science and Engineering, Vol. 10, p.19 Wiley-

Chapter 2 Methods
37
Intersience, New York, 1985.28 Billingham, N.C.; Comprehensive Polymer Science, Vol. 3, p.43, Pergamon Press,
Elmsford, 1989.29 Antoun, S.; Teyssie, Ph.; Jerome, R. J. Polym. Sci., Part A: Polym. Chem. 1997, 35, 3637.30 Nagasaki, Y. Recent Res. Dev. Macromol. Res. 1997, 2, 11.31 Bywater, S.; „Anionic Polymerization“, Chap.2 in: Progress in Polymer Science, Vol. 4,
Jenkins, A D. (ed.), Pergammon Press, New York, 1975.32 Fontanille, M.; Comprehensive Polymer Science, Vol. 3, p.365, Pergamon Press, Elmsford,
1989.33 Bywater, S.; Encyclopedia of Polymer Science and Engineering, 2nd ed., Vol. 2, p.1, John
Wiley and Sons, New York, 1986.34 Morton, M.; „Anionic Polymerizations: Prinziples and Practice“, Academic Press, New
York, 1983.35 Young, R.N.; Quirk, R.P.; Fetters, L.J. Adv. Polym. Sci. 1984, 56, 1.36 Swarc, M.; Smid, J.; “The Kinetics of Propagation of Anionic Polymerization and
Copolymerization”, Chap. 5 in “Progress in Reaction Kinetics”, Vol. 2, G. Porter (ed.),
Pergamon Press, Oxford, 1964.37 Thomas, E.L.; Electron micrsocopy, Chap. 5 in Encyclopedia of Polymer Science &
Engineering, p. 644, 1985.38 Tsuji, M.; Comprehensive Polymer Science 1989, V1, 785.39 Sawyer, L.C.; Grubb, D.T.; Fundamentals of microscopy, Chap. 2 in Polymer Microscopy,
Chapman & Hall, London, 1996.40 Trent, J.S.; Scheinbein, J.I.; Couchman, P.R. J. Polym. Sci., Polym. Lett. Ed. 1981, 19, 315.41 Trent, J.S.; Scheinbein, J.I.; Couchman, P.R. Macromolecules 1983, 16, 589.42 Vitali, R.; Montani, E. Polymer 1980, 21, 1220.43 Auschra, C.; Stadler, R. Macromolecules 1993, 26, 2171.44 Auschra, C.; Stadler, R. Macromolecules 1993, 26, 6364.45 Grubb, D. T. J. Mat. Sci. 1974, 9, 1715.46 Pullman, B.; Pullman, A.; Quantum Biochemistry, Interscience, New York, 1963.47 Breiner, U.; Krappe, U.; Thomas, E.L.; Stadler, R. Macromolecules 1998, 31, 135.48 Abetz, V.; Goldacker, T. Macromol. Rapid Commun. 2000, 21, 16.49 Christ, B. J. Polym. Sci. Polym. Phys. Ed. 1973, 11, 635.50 Tadakoro, H.; Structures of Crystalline Polymers, Wiley-Interscience, New York, 1979.51 Oster, G.; Riley, D. P.; Acta Crystallogr. 1952, 5, 272.52 Glatter, O.; Kratky, O.; Small Angle X-ray Scattering, Academic Press, 1981.

Chapter 3 Nanoscopic Surface Patterns
38
Chapter 3
Nanoscopic Surface Patterns
from Functional ABC Triblock Copolymers1
Abstract
We synthesized analogous series of monodisperse ABC triblock copolymers with
symmetrical end blocks A/C and different short middle blocks B (5-10 wt.-%) with varying
polarities by sequential anionic polymerization; i.e. polystyrene-b-poly(2-vinylpyridine)-b-
poly(methyl methacrylate) (PS-b-P2VP-b-PMMA) and polystyrene-b-poly(2-hydroxyethyl
methacrylate)-b-poly(methyl methacrylate) (PS-b-PHEMA-b-PMMA). Thin (thickness
~ 20 nm) and ultrathin films (thickness 7 nm) were prepared by either dip-coating or
adsorption from solution onto silicon wafers. The copolymer films were investigated by
scanning force microscopy. In thin films, the polar middle block adsorbs preferentially to the
polar substrate, resulting in a polymer film surface that exclusively consists of PS and PMMA
microdomains. In ultrathin films the two polar B and C blocks behave like a single B block
resulting in structures which can be described by recent scaling laws. The lateral spacing and
the morphology of the structures can be controlled by film thickness and A/C block length.

Chapter 3 Nanoscopic Surface Patterns
39
3.1. Introduction
In recent years, the use of block copolymers for surface patterning has attracted increasing
attention2,3,4,5,6. Well-defined laterally patterned surfaces are important for a variety of
technological applications, e.g. as compatibilizers for polymer blends or as templates for
growing biological cells with controlled shapes and sizes7. In addition, patterned polymer
substrates can also be used as templates in fabrication of optoelectronic devices through the
selective adsorption of a conducting material8, which results in a system of alternating
polymeric and metallic stripes with domain spacings in the tens of nanometers scale, an order
of magnitude smaller than typically achieved through photolithography. The high potential of
polymer-patterned substrates for lithographic purposes has recently been demonstrated by
Spatz et al., who deposited polystyrene-b-poly(2-vinylpyridine) (PS-b-P2VP) block
copolymers on mica and created highly ordered hexagonal arrays of PS dots on the surface.
These were used as templates for lithographic masks9,10. Aside from these practical
applications, laterally patterned polymer surfaces can be of use as model systems for the study
of wetting and dewetting phenomena on heterogeneous substrates11.
To this point, most of the experiments described in the literature involved diblock
copolymers only, disregarding the potential advantage of ABC triblock copolymers for the
generation of lateral structures in thin films. The latter was recently pointed out by Pickett and
Balazs in the context of self-consistent-field calculations for the case of symmetric ABC
triblock copolymers12. The authors showed that a perpendicular alignment of the lamellae
with respect to the plane of the films is expected, when the boundary surfaces preferentially
attract the middle block B. In case of a sufficiently strong interaction between the walls and
the adsorbing block B, the A and C end blocks may even be expelled from the walls, resulting
in homogeneous layers of B next to the walls and a laterally microphase-separated layer of A
and C in the film center. Given that the end blocks have a lower surface energy than the
middle block B, these results suggest that one may remove one of the walls and expect that
the film structure consists of a homogeneous B layer adsorbed at the substrate covered with a
laterally microphase-separated A/C striped surface layer. First experiments along these lines
were recently reported13.
The aim of the present work is to generate striped surfaces of controlled size and domain
spacing in the nanometer range by use of suitably chosen ABC triblock copolymers. Control
over the lateral dimensions is gained by variation of film thickness and A/C block length.
Thin and ultrathin films of two series of block copolymers are investigated by Tapping

Chapter 3 Nanoscopic Surface Patterns
40
Mode™ SFM. The experimental results are discussed in view of recent scaling considerations
developed in the context of pattern formation in diblock copolymer thin films14,15.
3.2. Experimental Section
The block copolymers were synthesized by sequential anionic polymerization (see Scheme
3-1). The deprotection of the hydroxyl group of the PHEMA block was accomplished by
precipitating the polymer into technical grade methanol. Gel permeation chromatography
(GPC) proved that the polymerization yielded monodisperse triblock copolymers (Figure 3-1).
The functional block copolymers were synthesized to give two series of polymers with
constant relative amounts of polystyrene, poly(methyl methacrylate) (~ 45 wt-%) and the
functional middle block (consisting of 5-10 wt-% poly(2-hydroxyethyl methacrylate) or
poly(2-vinylpyridine), respectively). In each series only the overall molecular weight of the
whole block copolymer was varied as shown in Table 3-1. The composition was calculated
from 1H-NMR of the block copolymer using GPC results for the corresponding PS precursor,
calibrated with narrowly distributed PS standards.
26 27 28 29 30 31
Ve [ml]
Figure 3-1: GPC trace (RI signal) of triblock copolymer S47 H10 M4382 ( ) and its precursors PS (.....) and
PS-b-PHEMA (.-.-.). Mn = 82300 g/mol, Mw/Mn = 1.04
3.2.1. Solvents and Materials
Unless noted, all chemicals were purchased from Aldrich and used without further
purification.
Styrene was stirred twice over calcium hydride for 24 h and finally, after overnight
treatment with MgBu2 (bright yellowish color), it has been condensed into an ampoule and set
under nitrogen for storage.

Chapter 3 Nanoscopic Surface Patterns
41
Trimethylsilyl protected 2-hydroxyethyl methacrylate (TMS-HEMA) was stirred twice
over calcium hydride for 24 h and purified by reduced pressure distillation. Prior to use it was
filtered over a 1 cm column filled with neutral alumina.
2-Vinylpyridine was treated with triethyl aluminium for 3 h and condensed into a Schlenk
flask, from which it was taken directly for the polymerization procedure.
Methyl methacrylate was stirred with triethyl aluminium for 2 h, condensed into a glass
ampoule and finally stored under nitrogen.
The solvent tetrahydrofuran (THF) was distilled over calcium hydride for 48 h and finally
refluxed over potassium under nitrogen for another 2 days.
3.2.2. Synthesis of 2-[(Trimethylsilyl)oxy]ethyl methacrylate
(TMS-HEMA)
The trimethylsilyl protecting group was introduced as previously reported by Hirao et al.16
using hexamethyldisilazane and trimethylsilyl chloride.
3.2.3. Block Copolymerizations
1 l freshly distilled THF was cooled down to – 78 °C. 0.36 ml sec-BuLi (1.55 molar
solution in n-hexane/cyclohexane) were injected, before 23.4 g styrene were added. After
60 minutes of polymerization the styryl anions were capped with 0.17 ml 1,1-
diphenylethylene (DPE), which results in a deep red colour of the reaction mixture. One hour
later, the polymerization was resumed by injection of 7.9 ml (7.3 g) TMS-HEMA, which
leads to immediate disappearance of the red colour. After additional 2 hours, 24 g MMA were
added quickly and polymerized for another 45 minutes. Finally, the reaction was terminated
with 1 ml degassed methanol.
The polymer was precipitated in 5 l methanol, which also leads to deprotection of the
PHEMA block. Then the product was redissolved in THF and reprecipitated two more times
into iso-propanol and dried under vacuum at room temperature.
A similar procedure was chosen for the preparation of the polystyrene-b-
poly(2-vinylpyridine)-b-poly(methyl methacrylate) block copolymers. After capping the
styryl anions with DPE, the 2-vinylpyridine was allowed to polymerize for 1 h. Before
addition of MMA, DPE was added again and reacted overnight in order to achieve a complete
capping reaction.
The block ratio was determined by 1H-NMR spectra using the integrated aromatic signals
of the polystyrene block in combination with the GPC results of the styrene precursor.

Chapter 3 Nanoscopic Surface Patterns
42
m 1. 1h, THF, -78°C2. DPE, 1h, -78°C
OCH3
O
O
O
OTMS
2h,THF,-78°C
1. 1h, THF, -78°C2. MeOH
n
p
bb
OO
OTMS
H
O OCH3
m n p
b
OO
OTMS
COO(CH2)2OTMSm n-1
msec-BuLi
Scheme 3-1: Synthesis of PS-b-PHEMA-b-PMMA (SHM) triblock copolymers.
3.3. Methods
Polymer Analysis: GPC measurements were performed using a set of 30 cm SDV-gel
columns of 5 �m particle size having 105, 104, 103 and 102 Å pore size and dual detectors (RI
and UV [� = 254 nm]). The solvent was THF at room temperature with an elution rate of 1
ml/min. Narrowly distributed polystyrene samples were used as calibration standards.
1H-NMR spectra were acquired on a 250 MHz Bruker AC 250 instrument using CDCl3 or
THF-d8 as solvents and tetramethylsilane (TMS) as internal standard. The molecular weights
of the B and C blocks were calculated using the block copolymer composition determined by

Chapter 3 Nanoscopic Surface Patterns
43
NMR and the polystyrene molecular weights obtained from GPC.
PolymerMn (S)
[kg/mol]
Mn (H/2VP)
[kg/mol]
Mn (M)
[kg/mol]
Mw/Mn
(GPC)
��Mn (total)
[kg/mol]
S47H10M4382 38.7 8.4 35.2 1.04 82.3
S46H4M50134 61.5 5.2 67.7 1.06 134.4
S67H6M27129 86.4 8.0 34.1 1.02 128.5
S512VP5M44110 56.2 5.9 48.2 1.06 110.3
S482VP5M47180 85.8 8.6 85.5 1.05 179.9
S562VP6M38299 168.4 16.6 113.6 1.05 298.6
Table 3-1: GPC data of the synthesized block copolymers.The subscript indicates the weight fraction of the corresponding blocks. The superscript denotes thetotal Mn in kg/mol.
Sample Preparation: Thin polymer films were prepared on polished silicon wafers by
dip-coating from 1 mg/ml solutions of the block copolymers in THF. To study ultrathin films,
the silicon wafers were exposed to 1 mg/ml solutions of the polymers for 3-4 days, which led
to adsorption of the block copolymer onto the polar substrate. Subsequently, the wafers were
rinsed 4 times with 5 ml THF.
Prior to use, the Si wafers were rinsed in organic solvents (THF, chloroform and acetone)
and subsequently treated with a beam of CO2 crystals (“snow jet�“) to remove any organic
residues from the surface.
Scanning Force Microscopy: SFM images were taken on a Digital Instruments
Dimension 3100 microscope operated in Tapping ModeTM (free amplitude of the cantilever �
20 nm, amplitude set point � 0.98). The standard silicon nitride probes were driven at 3 %
offset below their resonance frequencies in the range of 250-350 kHz. Height and phase
images were taken at scanning speeds of around 6 �m/sec.
Transmission Electron Microscopy: The bulk morphology of the block copolymers was
examined using TEM. Films (around 1 mm thick) were cast from 5 wt.% solutions in THF
and allowed to evaporate slowly for 5 days. The as-cast films were dried for one day in a
vacuum oven at room temperature followed by annealing at 140 °C for at least one week
under vacuum. Thin sections were cut at room temperature using a Reichert-Jung Ultracut E
microtome equipped with a diamond knife. In order to enhance the electron density contrast
Chapter 3 Nanoscopic Surface Patterns
44
between polystyrene and the methacrylic blocks, the sections were exposed to RuO4 vapor for
45 minutes, which leads to a preferential staining of the polystyrene block. Bright field TEM
was performed using a Zeiss electron microscope (CEM 902) operated at 80 kV.
Small Angle X-Ray Scattering: SAXS measurements were performed using a Bruker-
AXS Nanostar instrument with a Siemens Kristalloflex 760 X-ray source (Cu K�� radiation:
1.541 Å) operated at 40 mA and 40 kV and a 2D Histar detector.
Scanning Electron Microscopy: SEM was performed using a LEO 1530 Gemini
instrument equipped with a field emission cathode with a lateral resolution of approximately
2 nm. The acceleration voltage was 1 kV. Prior to the measurements the films were stained
with RuO4 vapor for 45 minutes.
Evaluation of characteristic length scales and estimation of experimental errors:
The lateral spacing of the thin film structures was determined from the reciprocal of the
maximum intensity position of the Fourier transform of a 3 x 3 �m2 SFM image. The Fourier
transform was calculated using the software supplied with the microscope (version 4.42r4).
The uncertainty of the lateral dimensions was estimated from the half-width of the peak in the
Fourier transform. The film thickness was determined by SFM scans in a region where the
polymer film had been partially removed by a scratch. At least 20 single cross sections were
taken at different locations at the step.
The lateral patterns in the ultrathin films were evaluated with respect to the mean stripe-to-
stripe or island-to-island half-distance D, the mean height H, the mean island radius or stripe
half-width R and the number of aggregated PS chains nPS in an island or defined section of a
stripe (see Scheme 3-2). The mean half-distance D was determined using Fourier transform as
described above for the thin film structures. In the case of the uniform stripe morphology, the
average of at least 15 single stripe height values obtained from the SFM height images was
taken as the mean stripe height H. For the island morphology, the tool Particle Analysis of the
above mentioned commercial software was used to determine the mean height H from a
3 x 3 �m2 SFM height image. In both cases, the experimental uncertainty was estimated from
the statistical scattering of the single island/stripe height values.

Chapter 3 Nanoscopic Surface Patterns
45
Scheme 3-2: Schematic representation of a cross-section through an ultrathin film of PS-b-PMMA diblockcopolymers adsorbed onto a silicon substrate.
The mean radius R of the islands was determined applying Particle Analysis of the
Nanoscope III software 4.42r4 to a 3 x 3 �m2 SFM height image with a constant threshold
height of 1 nm. The average of at least 15 single stripe half-widths values was taken as the
mean stripe half-width R. In both cases, the error �R was estimated from the statistical
scattering of the single island/stripe R values. For a correct evaluation of the mean radii or
half-widths R, one has to take into account the convolution with the curvature of the tip apex,
which causes a systematic error by enlarging the lateral dimensions of elevated objects by
roughly the tip apex, which itself varies by at least 10 % between different tips. In this study
tips were changed regularly to avoid artifacts due to tip contamination. We assume that all
tips had a tip radius of t = 10 nm by which the imaged objects are enlarged. This value was
subtracted from the measured radii and half-width values R.
Scheme 3-3: Schematic representation of a stripe section with a base of 2R x 2R.
The number of aggregated PS chains nPS in an island or defined section of a stripe was
calculated using the following expressions, assuming a spherical cap-like shape of the islands.
The volume of a stripe section was modelled as a cylindrical cap with a rectangular base of
2R x 2R and a height H (see Scheme 3-3). For the density of PS�we assume � = 1.1 g/cm3.
(a) Islands:
� �
� �PSM
NHRHn
n
A
IslandPS
�
� 22
,
36
�
� (1)
R
D
SUBSTRATE
PS
PMMAH
2R
R
H

Chapter 3 Nanoscopic Surface Patterns
46
(b) Stripes:
� �
� �PSM
NRRHRHRH
HR
nn
A
StripesPS
�
�
�
�
�
�
�
�
�
���
��
�
��
�
�
23
4 2222
, (2)
with NA and Mn(PS) being the Avogadro number and the molecular weight of the PS
block, respectively. We note that the estimate for the aggregation number of the stripe pattern
nPS,Stripes is based on an approximation for the volume of the cylindrical cap, which leads to an
error of less than 3 %.
3.4. Results and Discussion
3.4.1. Bulk Morphology of ABC Block Copolymers
The bulk morphology of the block copolymers was investigated using TEM and SAXS as
described above. All polymers except S67 H6 M27129 (which shows a cylindrical microdomain
structure) exhibit a lamellar morphology with a characteristic lamellar spacing L0 ranging
between 40 and 100 nm. The L0 values determined by the two independent methods are
shown in Table 3-2.
3.4.2. Thin Films of ABC Block Copolymers
Thin films were produced on polished silicon wafers by dip-coating from dilute (1 mg/ml)
solutions of the block copolymers in tetrahydrofuran (THF). Subsequently, the films were
dried at room temperature.
Figure 3-2a-d shows typical SFM topography and phase images of
PS-b-PHEMA-b-PMMA and PS-b-P2VP-b-PMMA triblock copolymers. All dip-coated
samples exhibit a well defined worm-like surface structure both in the height and in the phase
images. Vacuum annealing (5d at 140 °C) does not lead to significant changes in surface
morphology. The characteristic lateral spacings of all samples were obtained from Fourier
transforms of the SFM images as described above. Film thicknesses as determined by SFM

Chapter 3 Nanoscopic Surface Patterns
47
scans range between 14 and 30 nm which is well below L0 for each individual sample (Table
3-2).
1 �m
A
1 �m1 �m
A
1 �m
C
1 �m1 �m
C
1 �m
D
1 �m1 �m
D
1 �m
B
1 �m1 �m
B
Figure 3-2: SFM topography (a,c) and phase images (b,d) of thin films dip-coated from 1 mg/ml THFsolutions onto a polished silicon wafer: (a, b) 15 nm thick film of S46 H4 M50
134;(c, d) 25 nm thick film of S56 2VP6 M38
299. Topography: 8 nm, Phase: 8 °.
In the following, we shall try to establish a microscopic model of the thin film morphology
responsible for the observed surface structures. We expect the polar middle block B (either
PHEMA or P2VP) to strongly interact with the native oxide layer on top of the silicon
substrate. Therefore we may assume that only polystyrene (PS) and poly(methyl
methacrylate) (PMMA) microdomains are present at the film surface. This notion is supported
by the following considerations.
Differences in the solubility of the different components of a block copolymer lead to well-
defined topographical features at the film surface13,17. It was found that after spin- or dip-
coating domains rich in the polymer with the lower solubility tend to protrude over the ones
rich in the polymer with the higher solubility. As THF is a slightly better solvent for PS than

Chapter 3 Nanoscopic Surface Patterns
48
for PMMA, we expect the PMMA microdomains to protrude over the PS phase. We may
therefore identify the protruding features in Figure 3-2 as PMMA microdomains. The mean
height difference between the protrusions (PMMA) and the depressions (PS) ranges between
2 ... 4 nm depending on the size of the PS and PMMA blocks of the respective polymer.
C
A
D
B
Substrate
HY
L0/2
Substrate
A
B
C
L0/2
Substrate
PL
L0/2
Substrate
L0
= PS= PS = PHEMA/P2VP= PHEMA/P2VP = PMMA= PMMA
Scheme 3-4: Schematic depiction of proposed surface perpendicular morphologies for AB and ABC blockcopolymers.
This assignment is corroborated by the fact that the protruding domains show a slightly
larger phase shift compared to the depressed domains. The average difference in the phase
shift between neighboring domains amounts to about 4° (with small variations depending on

Chapter 3 Nanoscopic Surface Patterns
49
the tip characteristics and therefore on the measurement conditions). As the harder material
commonly exhibits a larger phase shift than a softer material in Tapping Mode SFM images
taken in the repulsive regime, this observation confirms our statement that the protruding
phase consists of PMMA.
This finding is in agreement with experiments on thin films of PS-b-PMMA on silicon
nitride18. In these experiments, SFM and TEM measurements were performed at the same
spot of the sample. The authors showed that, in fact, the PMMA phase protrudes over the PS
domains when the samples were prepared from common solvents exhibiting a higher
solubility for PS.
Domain spacings [nm]
Polymer NS/NH/2VP/NM
Film
thickness[nm]
SFM TEM a SAXS
S47H10M4382 370/65/350 14 � 2 44 � 4 40 � 4 49 � 6
S46H4M50134 590/40/680 15 � 2 53 � 4 50 � 5 61 � 7
S67H6M27129 830/60/340 12 � 2 58 � 5 49 � 5 b 59 � 7 b
S512VP5M44110 540/55/480 18 � 2 47 � 5 45 � 5 49 � 6
S482VP5M47180 825/80/855 30 � 4 73 � 8 60 � 6 63 � 8
S562VP6M38299 1620/160/1140 25 � 4 92 � 9 80 � 8 80 � 9
Table 3-2: Characteristic spacings of phase separated block copolymers in bulk and thin films as determinedby SFM, TEM and SAXS.a bulk values, all films cast from THF solution, b cylinders
Moreover, we observe that the lateral spacings of the thin PS-b-PHEMA-b-PMMA and
PS-b-P2VP-b-PMMA triblock copolymer films are nearly identical to the ones determined for
bulk samples using TEM and SAXS (Table 3-2). Deviations tend to occur in films of block
copolymers with a large amount of PMMA and may be due to degradation of the
poly(methacrylates) in the electron beam during the TEM measurements.
Our experiments indicate that the formation of a laterally phase-separated and therefore
patterned surface can be accomplished by simple dip-coating from 1 mg/ml THF solutions
onto a polished silicon wafer. The patterned regions extend over large areas the size of which
mainly depends on the uniformity of film thickness. Aiming towards a model for the
microdomain morphology of our samples in the thin film regime, we briefly review related
work on diblock copolymers. Morkved et al.6 observed a kinetically stable perpendicular
lamellar structure for symmetric PS-b-PMMA diblock copolymers at film thicknesses around
one lamellar spacing L0. The authors take into account a possible “capping” of the PS sheets

Chapter 3 Nanoscopic Surface Patterns
50
by PMMA at the (polar) substrate (see Scheme 3-4a). Recent self-consistent-field calculations
by Fasolka et al.19 suggest two types of perpendicular morphologies in the thin film regime
for thicknesses below about 1/3 L0, which are depicted in Scheme 3-4b/c. The authors
describe a “hybrid structure” (HY), which consists of a PMMA layer at the substrate/polymer
interface with protrusions extending to the polymer/air interface, perforating a PS top layer
(Scheme 3-4b). Alternatively, a so-called “perpendicular lamellae“ (PL) morphology is
discussed, which consists of full lamellae aligned perpendicular to the plane of the film
(Scheme 3-4c). The calculations predict both (HY and PL) morphologies to exhibit an
equilibrium lateral spacing equal to L0.
The latter prediction is also fulfilled by the observations made in the case of the thin
PS-b-PHEMA-b-PMMA and PS-b-P2VP-b-PMMA triblock copolymer films discussed in the
present work. Compared to the situation faced in the above studies, the P2VP / PHEMA
middle blocks are expected to exhibit an even stronger interaction with the SiOx substrate. We
therefore assume that the substrate is covered with the polar middle blocks, resulting in a thin
film structure that consists of a homogeneous B layer adsorbed at the substrate, covered with
a laterally microphase-separated PS/PMMA surface layer. This notion is in agreement with
the SFM results and follows the prediction based on SCF calculations of Pickett and Balazs12
(see Scheme 3-4d). Given the rather short length of the middle blocks, however, we cannot
exclude that part of the substrate is covered with PMMA as well. This would then lead to a
compromise between the morphologies depicted in Scheme 3-4b and d. In comparing
experiment and theoretical prediction one has to realize that the structures observed
experimentally were formed during the dip-coating and subsequent drying process and did not
change significantly on further annealing. It remains unclear though, whether they represent
the thermodynamic equilibrium structure of the film. In contrast, the SCF calculations predict
the equilibrium morphology based on the minimum of the free energy of the system.
3.4.3. Ultrathin Films
Ultrathin films were prepared by adsorption of the block copolymers from dilute (1 mg/ml)
solutions in tetrahydrofuran (THF) onto polished silicon wafers. In order to ensure that only
strongly physisorbed polymer molecules are present at the surface, the silicon wafer was
rinsed thoroughly in pure THF after being removed from solution. Subsequently, the samples
were dried at room temperature. THF was chosen because it dissolves the outer blocks of the
different block copolymers well and therefore we do not expect micelle formation in solution.
Detailed investigations on the solution properties are presently under way in order to

Chapter 3 Nanoscopic Surface Patterns
51
illuminate the structure forming process and will be described elsewhere. Thus, so far we can
assume that the surface structures are formed by adsorption of individual block copolymer
molecules. The dried films were investigated with SFM operated in Tapping Mode™.
1 �m
A
1 �m1 �m
A
1 �m
C
1 �m1 �m1 �m
C
1 �m
E
1 �m1 �m
E
1 �m
B
1 �m1 �m
B
1 �m
F
1 �m1 �m
F
1 �m
D
1 �m1 �m
D
Figure 3-3: SFM micrographs and phase images of ultrathin films of PS-b-PHEMA-b-PMMA adsorbedfrom 1 mg/ml THF solutions onto a polished silicon wafer.(a, b) S47 H10 M43
82; (c, d) S46 H4 M50134; (e, f) S67 H6 M27
129. Topography: 8 nm, Phase: 15 °.
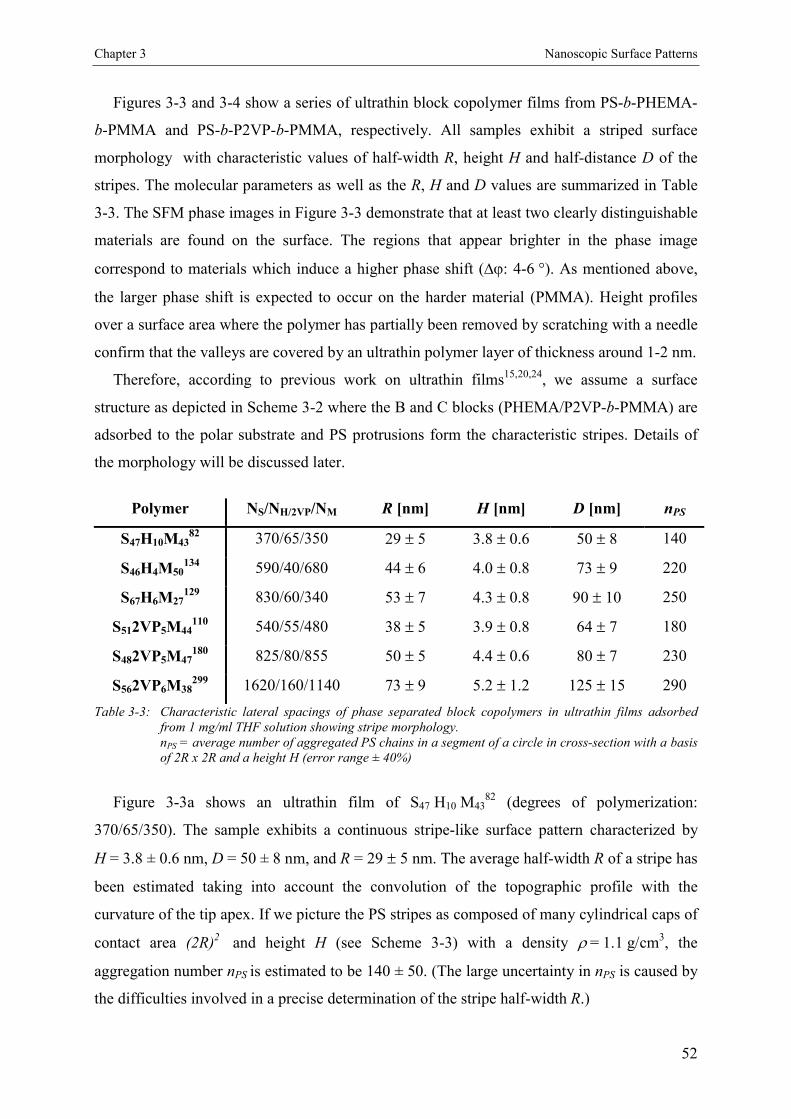
Chapter 3 Nanoscopic Surface Patterns
52
Figures 3-3 and 3-4 show a series of ultrathin block copolymer films from PS-b-PHEMA-
b-PMMA and PS-b-P2VP-b-PMMA, respectively. All samples exhibit a striped surface
morphology with characteristic values of half-width R, height H and half-distance D of the
stripes. The molecular parameters as well as the R, H and D values are summarized in Table
3-3. The SFM phase images in Figure 3-3 demonstrate that at least two clearly distinguishable
materials are found on the surface. The regions that appear brighter in the phase image
correspond to materials which induce a higher phase shift (��: 4-6 °). As mentioned above,
the larger phase shift is expected to occur on the harder material (PMMA). Height profiles
over a surface area where the polymer has partially been removed by scratching with a needle
confirm that the valleys are covered by an ultrathin polymer layer of thickness around 1-2 nm.
Therefore, according to previous work on ultrathin films15,20,24, we assume a surface
structure as depicted in Scheme 3-2 where the B and C blocks (PHEMA/P2VP-b-PMMA) are
adsorbed to the polar substrate and PS protrusions form the characteristic stripes. Details of
the morphology will be discussed later.
Polymer NS/NH/2VP/NM R [nm] H [nm] D [nm] nPS
S47H10M4382 370/65/350 29 � 5 3.8 � 0.6 50 � 8 140
S46H4M50134 590/40/680 44 � 6 4.0 � 0.8 73 � 9 220
S67H6M27129 830/60/340 53 � 7 4.3 � 0.8 90 � 10 250
S512VP5M44110 540/55/480 38 � 5 3.9 � 0.8 64 � 7 180
S482VP5M47180 825/80/855 50 � 5 4.4 � 0.6 80 � 7 230
S562VP6M38299 1620/160/1140 73 � 9 5.2 � 1.2 125 � 15 290
Table 3-3: Characteristic lateral spacings of phase separated block copolymers in ultrathin films adsorbedfrom 1 mg/ml THF solution showing stripe morphology.nPS = average number of aggregated PS chains in a segment of a circle in cross-section with a basisof 2R x 2R and a height H (error range ± 40%)
Figure 3-3a shows an ultrathin film of S47 H10 M4382 (degrees of polymerization:
370/65/350). The sample exhibits a continuous stripe-like surface pattern characterized by
H = 3.8 ± 0.6 nm, D = 50 ± 8 nm, and R = 29 � 5 nm. The average half-width R of a stripe has
been estimated taking into account the convolution of the topographic profile with the
curvature of the tip apex. If we picture the PS stripes as composed of many cylindrical caps of
contact area (2R)2 and height H (see Scheme 3-3) with a density � = 1.1 g/cm3, the
aggregation number nPS is estimated to be 140 ± 50. (The large uncertainty in nPS is caused by
the difficulties involved in a precise determination of the stripe half-width R.)
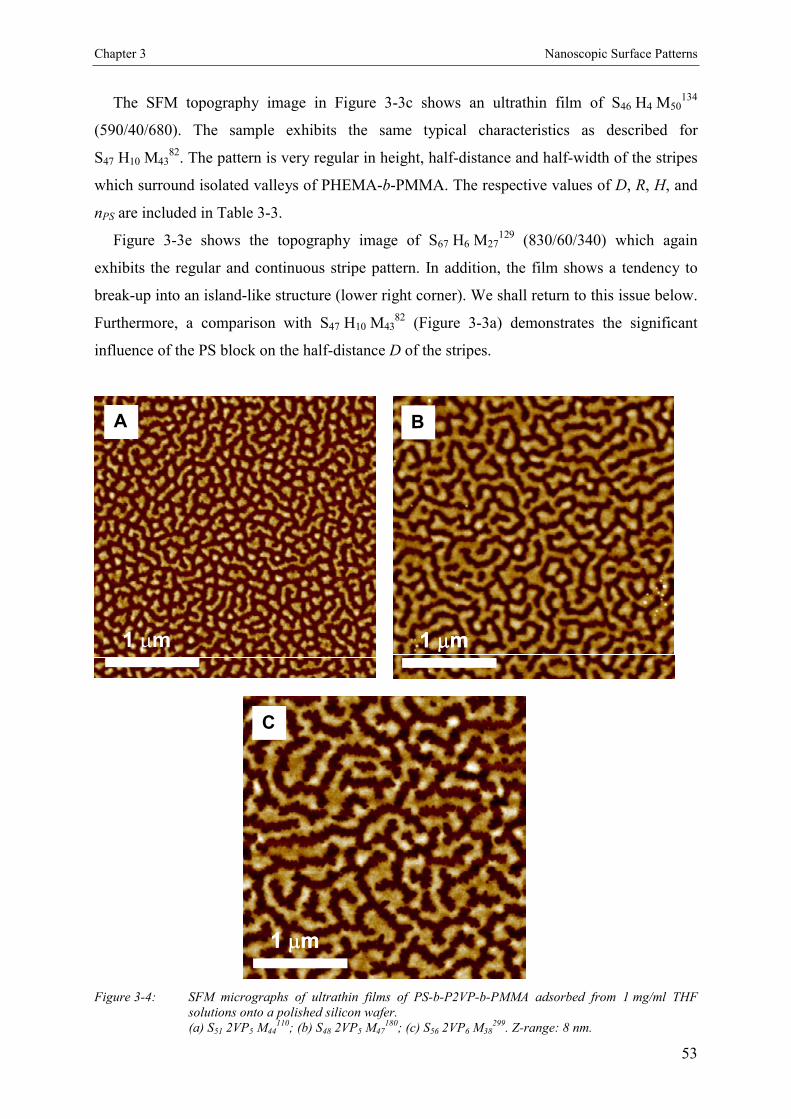
Chapter 3 Nanoscopic Surface Patterns
53
The SFM topography image in Figure 3-3c shows an ultrathin film of S46 H4 M50134
(590/40/680). The sample exhibits the same typical characteristics as described for
S47 H10 M4382. The pattern is very regular in height, half-distance and half-width of the stripes
which surround isolated valleys of PHEMA-b-PMMA. The respective values of D, R, H, and
nPS are included in Table 3-3.
Figure 3-3e shows the topography image of S67 H6 M27129 (830/60/340) which again
exhibits the regular and continuous stripe pattern. In addition, the film shows a tendency to
break-up into an island-like structure (lower right corner). We shall return to this issue below.
Furthermore, a comparison with S47 H10 M4382 (Figure 3-3a) demonstrates the significant
influence of the PS block on the half-distance D of the stripes.
1 �m
A
1 �m
B
1 �m1 �m
B
1 �m
C
1 �m1 �m
C
Figure 3-4: SFM micrographs of ultrathin films of PS-b-P2VP-b-PMMA adsorbed from 1 mg/ml THFsolutions onto a polished silicon wafer.(a) S51 2VP5 M44
110; (b) S48 2VP5 M47180; (c) S56 2VP6 M38
299. Z-range: 8 nm.

Chapter 3 Nanoscopic Surface Patterns
54
Figure 3-4a shows an ultrathin film of S51 2VP5 M44110 (540/55/480). Compared to all other
samples the stripes in this case are not continuous but broken up into long and short islands
that still exhibit the characteristics of a stripe pattern. Half-width, half-distance and height are
still uniform and correlate well with spacings found in the other samples as will be discussed
further below. (R = 38 ± 5 nm, D = 64 ± 7 nm, H = 3.9 ± 0.8 nm). The aggregation number
nPS can be estimated to some 180 agglomerated PS chains.
The ultrathin film morphology of S48 2VP5 M47180 (825/80/855) is shown in Figure 3-4b.
According to the expected behavior, the characteristic scales increase so that R = 50 ± 5 nm
and D = 80 ± 7 nm. Besides the stripes some island-like features are also detected that fit well
to the overall scaling. The number of aggregated PS chains as defined above rises to
nPS = 230.
1 �m1 �m
Figure 3-5: Large area SEM micrograph of an ultrathin film of S48 2VP5 M47180 adsorbed from 1 mg/ml
THF solution onto a polished silicon wafer
In order to show that the surface patterns indeed extend over large areas over the whole
substrate, SEM pictures were taken. In Figure 3-5 an image of an ultrathin film of
S48 2VP5 M47180 is shown. SEM has been chosen instead of a large area SFM image because
high resolution images can be obtained easily capturing large areas. As the PS block has been
stained with RuO4 vapour prior to the measurement, the PS stripes appear brighter than the
P2VP and PMMA sublayer. The haziness in the PS parts may be due to electron emission
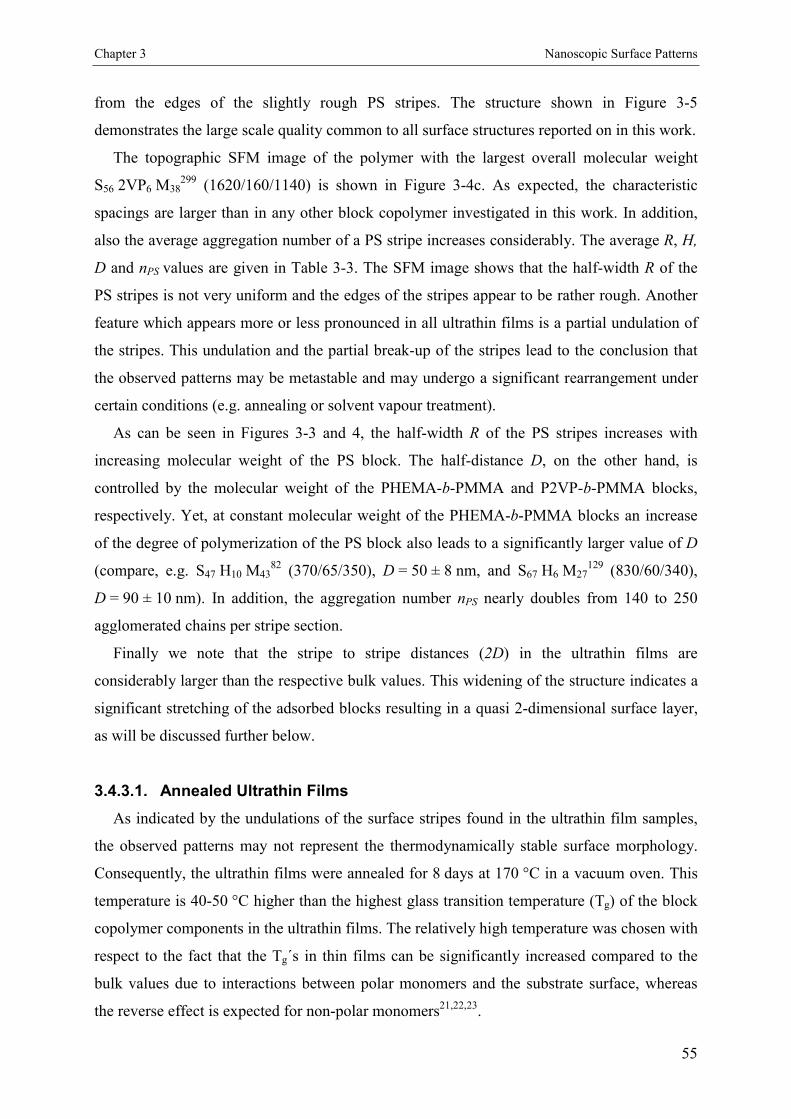
Chapter 3 Nanoscopic Surface Patterns
55
from the edges of the slightly rough PS stripes. The structure shown in Figure 3-5
demonstrates the large scale quality common to all surface structures reported on in this work.
The topographic SFM image of the polymer with the largest overall molecular weight
S56 2VP6 M38299 (1620/160/1140) is shown in Figure 3-4c. As expected, the characteristic
spacings are larger than in any other block copolymer investigated in this work. In addition,
also the average aggregation number of a PS stripe increases considerably. The average R, H,
D and nPS values are given in Table 3-3. The SFM image shows that the half-width R of the
PS stripes is not very uniform and the edges of the stripes appear to be rather rough. Another
feature which appears more or less pronounced in all ultrathin films is a partial undulation of
the stripes. This undulation and the partial break-up of the stripes lead to the conclusion that
the observed patterns may be metastable and may undergo a significant rearrangement under
certain conditions (e.g. annealing or solvent vapour treatment).
As can be seen in Figures 3-3 and 4, the half-width R of the PS stripes increases with
increasing molecular weight of the PS block. The half-distance D, on the other hand, is
controlled by the molecular weight of the PHEMA-b-PMMA and P2VP-b-PMMA blocks,
respectively. Yet, at constant molecular weight of the PHEMA-b-PMMA blocks an increase
of the degree of polymerization of the PS block also leads to a significantly larger value of D
(compare, e.g. S47 H10 M4382 (370/65/350), D = 50 ± 8 nm, and S67 H6 M27
129 (830/60/340),
D = 90 ± 10 nm). In addition, the aggregation number nPS nearly doubles from 140 to 250
agglomerated chains per stripe section.
Finally we note that the stripe to stripe distances (2D) in the ultrathin films are
considerably larger than the respective bulk values. This widening of the structure indicates a
significant stretching of the adsorbed blocks resulting in a quasi 2-dimensional surface layer,
as will be discussed further below.
3.4.3.1. Annealed Ultrathin Films
As indicated by the undulations of the surface stripes found in the ultrathin film samples,
the observed patterns may not represent the thermodynamically stable surface morphology.
Consequently, the ultrathin films were annealed for 8 days at 170 °C in a vacuum oven. This
temperature is 40-50 °C higher than the highest glass transition temperature (Tg) of the block
copolymer components in the ultrathin films. The relatively high temperature was chosen with
respect to the fact that the Tg´s in thin films can be significantly increased compared to the
bulk values due to interactions between polar monomers and the substrate surface, whereas
the reverse effect is expected for non-polar monomers21,22,23.
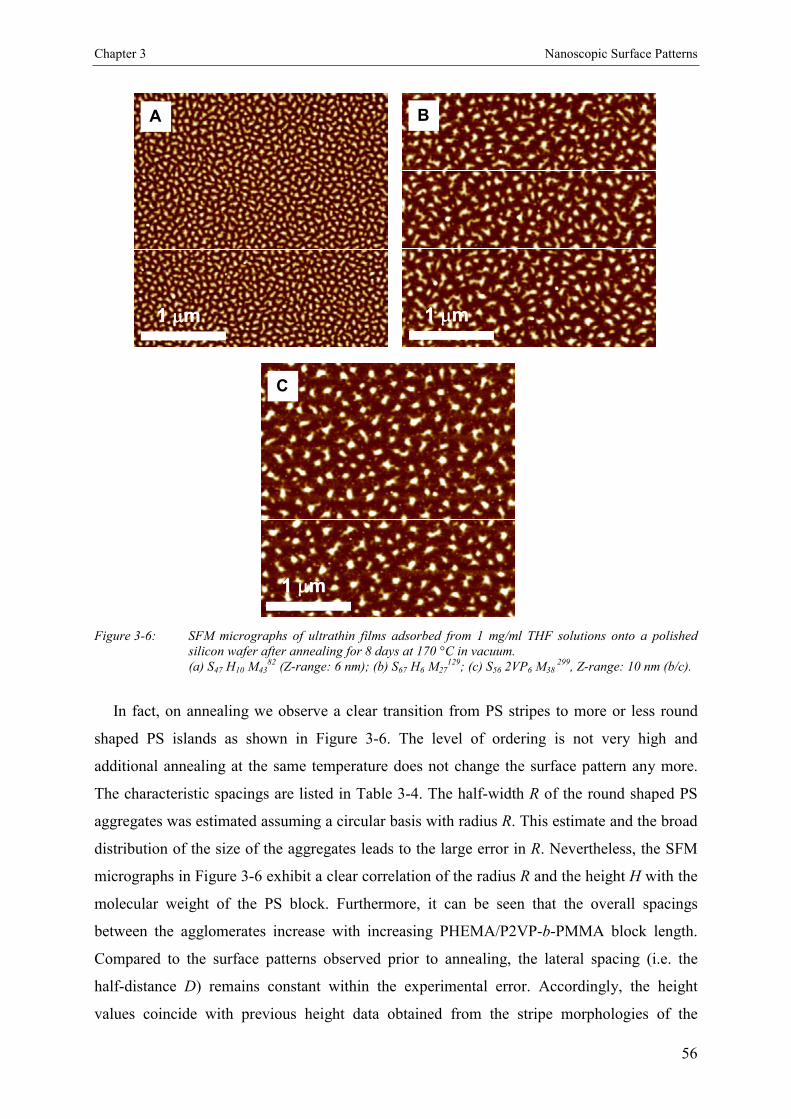
Chapter 3 Nanoscopic Surface Patterns
56
1 �m
A
1 �m1 �m
A
1 �m
B
1 �m1 �m
B
1 �m
C
1 �m1 �m
C
Figure 3-6: SFM micrographs of ultrathin films adsorbed from 1 mg/ml THF solutions onto a polishedsilicon wafer after annealing for 8 days at 170 °C in vacuum.(a) S47 H10 M43
82 (Z-range: 6 nm); (b) S67 H6 M27129; (c) S56 2VP6 M38
299, Z-range: 10 nm (b/c).
In fact, on annealing we observe a clear transition from PS stripes to more or less round
shaped PS islands as shown in Figure 3-6. The level of ordering is not very high and
additional annealing at the same temperature does not change the surface pattern any more.
The characteristic spacings are listed in Table 3-4. The half-width R of the round shaped PS
aggregates was estimated assuming a circular basis with radius R. This estimate and the broad
distribution of the size of the aggregates leads to the large error in R. Nevertheless, the SFM
micrographs in Figure 3-6 exhibit a clear correlation of the radius R and the height H with the
molecular weight of the PS block. Furthermore, it can be seen that the overall spacings
between the agglomerates increase with increasing PHEMA/P2VP-b-PMMA block length.
Compared to the surface patterns observed prior to annealing, the lateral spacing (i.e. the
half-distance D) remains constant within the experimental error. Accordingly, the height
values coincide with previous height data obtained from the stripe morphologies of the

Chapter 3 Nanoscopic Surface Patterns
57
unannealed samples. In contrast, the average mean radii R decreased significantly after
annealing, especially for the formerly broad stripes. The overall impression is dominated by
the observation that the radii of the clusters generated from stripes with large half-width are
less uniform than for clusters resulting from smaller stripes (see Figure 3-6a/c). In addition,
the average number of aggregated chains per cluster ranges between 50 and 90 with an
estimated error of ± 60 %.
We note in passing that a 7 day treatment in saturated THF vapor results in a
morphological transition nearly identical to the one observed after annealing.
Polymer NS/NH/2VP/NM R [nm] a H [nm] D [nm]
S47H10M4382 370/65/350 23 � 5 3.5 � 0.5 42 � 6
S46H4M50134 590/40/680 32 � 10 4.3 � 0.8 63 � 10
S67H6M27129 830/60/340 34 � 14 5.9 � 1.1 81 � 15
S512VP5M44110 540/55/480 27 � 9 4.9 � 1.0 55 � 10
S482VP5M47180 825/80/855 30 � 12 5.8 � 1.0 78 � 19
S562VP6M38299 1620/160/1140 36 � 14 6.6 � 1.0 104 � 20
Table 3-4: Characteristic lateral spacings of phase separated block copolymers in ultrathin films adsorbedfrom 1 mg/ml THF solution after annealing at 170 °C for 8 days showing island morphology.
a estimated from Nanoscope Particle Analysis assuming a circular basis of the aggregates
3.4.3.2. Concentration Dependence of Pattern Formation
When ultrathin films are prepared by dip-coating from 0.1 mg/ml solutions in THF onto
polished silicon wafers, the surface patterns are very similar to the stripe-like morphologies as
prepared by adsorption from 1 mg/ml solutions in THF. In fact, the scaling of the lateral
spacings is identical to the one found for the adsorbed films whereas the height values appear
to be slightly larger. This may be due to a higher overall coverage. In addition, the
as-prepared films exhibited a smooth and structureless surface. This finding may be attributed
to a nearly complete PS coverage, which only partially dewetts the adsorbed sublayer. A few
irregular holes are formed as shown in Figure 3-7. After exposue to saturated THF vapor for a
few hours, the PS surface layer completely brakes up to form the well-known stripe-like
patterns. Similarly, annealing also leads to a morphological transition resulting in an
island-like morphology.

Chapter 3 Nanoscopic Surface Patterns
58
1 �m
Figure 3-7: SFM micrograph of ultrathin film of S48 2VP5 M47180 dip-coated from 0.1 mg/ml THF solution
onto a polished silicon wafer. Z-range: 8 nm.
When samples were prepared by dip-coating from 0.01 mg/ml solutions in THF onto
polished silicon wafers, an irregular pattern of small elongated or oval islands was observed.
Two samples (S46 H4 M50134 (590/40/680) and S48 2VP5 M47
180 (825/80/855)) were used for
these studies. The islands had a diffuse shape at their base, which may be attributed to bundles
of polymer chains (Figure 3-8a/b). Apparently, the substrate is not covered completely by the
polymer but very small aggregates of polymer chains are spread all over the wafer. The mean
height of the main clusters for S46 H4 M50134 was determined to be 2 ± 1 nm, excluding all
objects with H < 0.5 nm. A similar result was obtained for the as-prepared adsorbates of
S48 2VP5 M47180 (see Table 3-5).
Polymer NS/NH/2VP/NM R [nm] H [nm] D [nm]
Number of
Clusters
[3�3 �m2]
S46H4M50134 590/40/680 19 � 14 2 � 1 56 � 14 � 1200
after annealing 20 � 6 4 � 1 50 � 12 � 1100
S482VP5M47180 825/80/855 20 � 12 2 � 1 74 � 15 � 850
after annealing 25 � 8 5 � 2 75 � 18 � 700
Table 3-5: Characteristic lateral spacings of phase separated block copolymers in ultrathin films adsorbedfrom 0.01 mg/ml THF solution showing island morphology before and after annealing at 190 °C for5 days.

Chapter 3 Nanoscopic Surface Patterns
59
1 �m
C
500 nm
A
1 �m
D
B
500 nm
1 �m
C
1 �m1 �m
C
500 nm
A
500 nm500 nm
A
1 �m
D
1 �m1 �m
D
B
500 nm
B
500 nm500 nm
Figure 3-8: SFM micrographs of ultrathin films dip-coated from 0.01 mg/ml THF solutions onto a polishedsilicon wafer: S46 H4 M50
134 (a) topography (5 nm) and (b) phase (15 degrees) as-prepared and(c) after annealing for 5 days at 190 °C; (d) S48 2VP5 M47
180 after annealing for 5 days at190 °C. Z-range: 10 nm (c/d).

Chapter 3 Nanoscopic Surface Patterns
60
After annealing for 5 days at 190 °C an array of more regularly round shaped polymer
clusters is formed (Figure 3-8c/d). The mean radii R were determined to 20 ± 6 nm and
25 ± 8 nm for S46 H4 M50134 and S48 2VP5 M47
180, respectively. No significant change in the
lateral spacing was found on further annealing. However, the height of the clusters changed
significantly which may be attributed to an incorporation of the small molecule bundles
spread on the surface, thus increasing the cluster height and volume. This is also supported by
the small decrease in the overall number of clusters higher than 0.5 nm which changes from
~1200 to ~1100 and from ~850 to ~700 for S46 H4 M50134 and S48 2VP5 M47
180, respectively
(see Table 3-5). The calculation of the aggregation number nPS gives a value of 25 and 40
chains per cluster with an error range of ± 65 %.
These findings underline the fact that the amount of polymer deposited during dip-coating
is not sufficient to cover the surface completely. Due to the lack of polymeric material, the
most favourable form for the aggregates on the surface is given by a drop- or island-like
agglomeration.
3.4.4. Scaling Analysis
Recently, Potemkin et al. developed a theory predicting the scaling parameters of surface
patterns observed in ultrathin films of PS-b-P2VP and PS-b-P4VP diblock copolymers14,15. In
this system the PVP blocks adsorb to the substrate and the PS blocks dewet from the PVP
sublayer. The degree of polymerization and the surface energies (with PVP > PS) of both
blocks were found to affect the size and shape of the observed structures, i.e. island or stripe
morphologies of different spacings. Their calculations resulted in the following dependences:
� � 13
113, �
��
�dd
BdA NNHR (3a)
� � 13
111
�
��
�dd
BdA NND (3b)
with d = 3 for island and d = 2 for stripe morphologies, where NA is the degree of
polymerization (DP) of the adsorbing block (in their case PVP) and NB the DP of the
protruding block (PS), which leads to:
6.02.0, BA NNHR �
� (4a)

Chapter 3 Nanoscopic Surface Patterns
61
2.06.0BA NND � (4b)
for a stripe morphology and
5.0, BNHR � (5a)
25.05.0BA NND � (5b)
for an island morphology.
Given the rather short length of the middle blocks in our study and the fact that the PMMA
end blocks are expected to adsorb onto a polar substrate as well, we shall try to model our
system by treating blocks B and C as a single adsorbing unit and use the above theoretical
approach. This choice is further corroborated by the surface energy differences between the
blocks, which fullfil the assumption of the above model, i.e. PHEMA,PMMA > PS and
P2VP,PMMA > PS.
3.4.4.1. Striped Patterns
In Figure 3-9 the scaling behavior of half-width R, half-distance D and height H are
compared to the above theory. The axes of the graphs are scaled in a way that the
experimental points should fall onto straight lines. As can be seen in Figure 3-9a the scaling
of the half-width R of the stripes is well described by the theory. The line drawn in the plot is
calculated by linear regression. Stripe heights H (Figure 3-9c), which are expected to scale
identically to the half-width R, also agree quite well with theory even though the accuracy is
not as good as for the R values or the half-distance D. Obviously, the nature of the middle
block B (PHEMA or P2VP) does not seem to have a strong influence on the scaling behaviour
of R and H as especially S46 H4 M50134 (590/40/680) and S51 2VP5 M44
110 (540/55/480) as well
as S67 H6 M27129 (830/60/340) and S48 2VP5 M47
180 (825/80/855) exhibit an interesting
similarity in half-width and height. They only differ significantly in the length of the PMMA
block which contributes to a different scaling behaviour with regard to D. In Figure 3-9b the
strong influence of the PS molecular weight on the stripe to stripe distance D can be seen. The
asymmetrical polymer S67 H6 M27129 (830/60/340) shows a very large stripe-to-stripe
half-distance D which is about 1.6 times larger than expected according to the line calculated
using linear regression disregarding S67 H6 M27129 (hollow square). Compared to the sample
S47 H10 M4382 (370/65/350) the molecular weight of the adsorbing blocks B/C is nearly

Chapter 3 Nanoscopic Surface Patterns
62
constant so that the only difference is given by the PS block which is 2.25 times larger. This
phenomenon has been observed earlier in the case of asymmetric PS-b-P2VP diblock
copolymers with a ratio N(PS) : N(P2VP) of approximately 3 : 1 which is similar to the ratio
N(PS) : N(PHEMA/PMMA) in S67 H6 M27129 (830/60/340)15. A possible explanation for the
above observation could be that in this case, there is not a homogeneous PHEMA-b-PMMA
sublayer below the PS stripes but a certain area where PS is in direct contact with the silicon
substrate15. If the linear regression is carried out without the D value of polymer
S67 H6 M27129, one finds very good qualitative agreement with the scaling prediction.
3.4.4.2. Island-like Patterns
In the following we compare the measured R, H and D values of the island-like surface
patterns with the theory by Potemkin et al.14 using equations 5a/b. Figure 3-10 shows a series
of graphs where the radii R, half-distances D and heights H are plotted such that the data
points should fall onto straight lines. The black line drawn in the plots is calculated according
to linear regression. Both the radius R and the height H (Figure 3-10a/c) are expected to
depend on the PS molecular weight only and should scale as NPS0.5. This is indeed observed.
The large error bars reflect the broad distribution of the cluster radii and the difficulties in the
correct determination of R as described earlier. The height values are more reliable and have a
much smaller error range. Besides, like in the case of the stripe morphology, we find
similarities in the characteristic spacings especially for S46 H4 M50134 (590/40/680) and
S51 2VP5 M44110 (540/55/480) as well as S67 H6 M27
129 (830/60/340) and S48 2VP5 M47180
(825/80/855) which both have PS blocks of similar length. As expected, the radius R and the
height H are nearly identical without any influence induced by the different B/C block
composition. As our results show a qualitatively good agreement between the scaling
predictions for the observed structures ( 5.0, PSNHR � ) and the actual radius and height of the
clusters, we may conclude that the conformation of the PS chains in an aggregate is nearly
Gaussian.
The half-distance D of the PS aggregates scales nearly perfectly according to the
theoretical predictions (Figure 3-10b). If one compares the ultrathin annealed film of
S47 H10 M4382 (370/65/350) to S67 H6 M27
129 (830/60/340) as shown in Figure 3-6a/b it turns
out that an increase of the degree of polymerization of the PS block at a constant molecular
weight of the PHEMA-b-PMMA blocks leads to a significantly larger value of D which
increases from D = 42 ± 6 nm to 81 ± 15 nm. The lateral spacing in the latter case is 1.6 times
larger than expected according to the black line given by the linear fit. This is a very similar
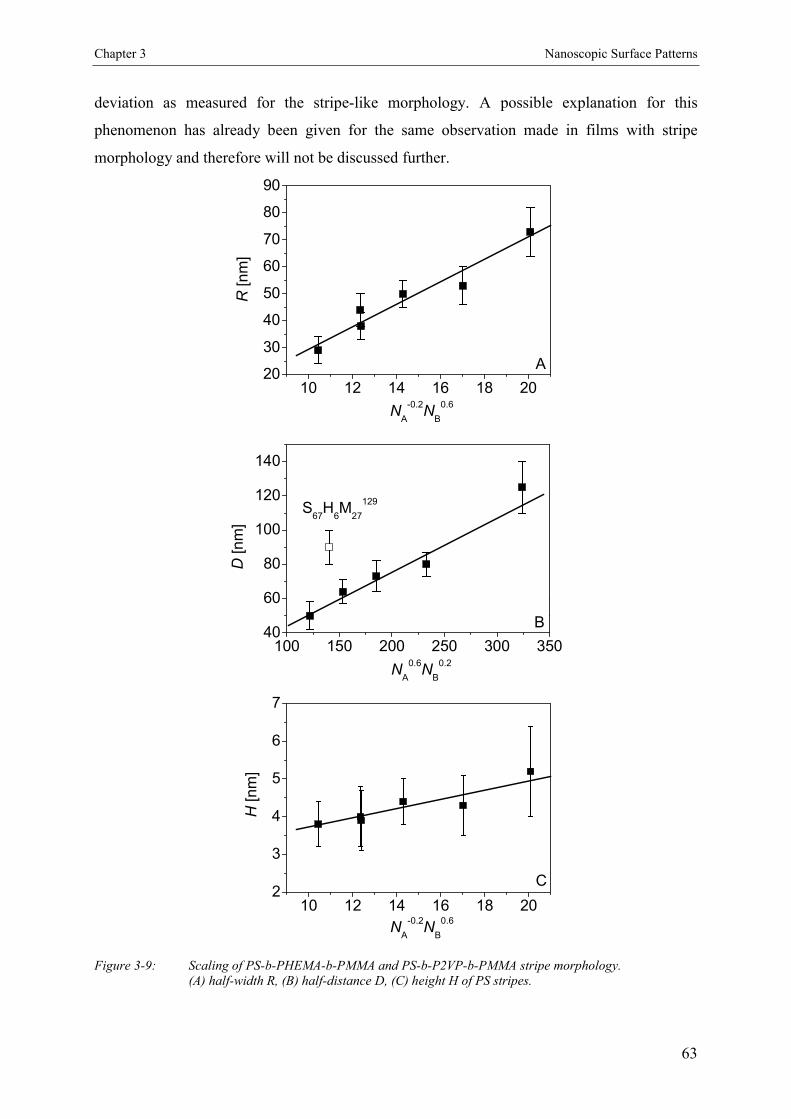
Chapter 3 Nanoscopic Surface Patterns
63
deviation as measured for the stripe-like morphology. A possible explanation for this
phenomenon has already been given for the same observation made in films with stripe
morphology and therefore will not be discussed further.
10 12 14 16 18 2020
30
40
50
60
70
80
90
A
R [n
m]
NA
-0.2NB
0.6
10 12 14 16 18 202
3
4
5
6
7
C
H [n
m]
NA
-0.2NB
0.6
100 150 200 250 300 35040
60
80
100
120
140
B
S67
H6M
27
129
D [n
m]
NA
0.6NB
0.2
Figure 3-9: Scaling of PS-b-PHEMA-b-PMMA and PS-b-P2VP-b-PMMA stripe morphology.(A) half-width R, (B) half-distance D, (C) height H of PS stripes.
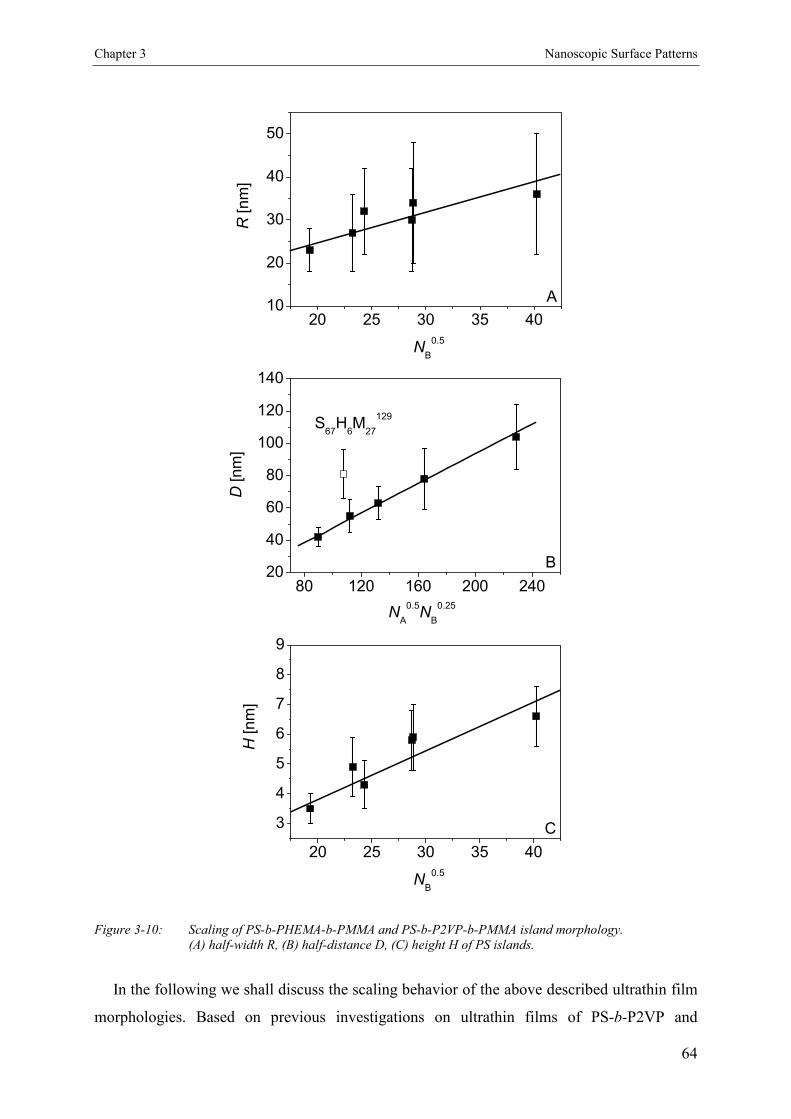
Chapter 3 Nanoscopic Surface Patterns
64
20 25 30 35 40
3
4
5
6
7
8
9
C
H[n
m]
NB
0.5
20 25 30 35 4010
20
30
40
50
A
R [nm
]
NB
0.5
80 120 160 200 24020
40
60
80
100
120
140
B
S67
H6M
27
129
D [nm
]
NA
0.5NB
0.25
Figure 3-10: Scaling of PS-b-PHEMA-b-PMMA and PS-b-P2VP-b-PMMA island morphology.(A) half-width R, (B) half-distance D, (C) height H of PS islands.
In the following we shall discuss the scaling behavior of the above described ultrathin film
morphologies. Based on previous investigations on ultrathin films of PS-b-P2VP and

Chapter 3 Nanoscopic Surface Patterns
65
PS-b-P4VP 15,20,24 we expect the observed structures to consist of PS stripes with a mixed
sublayer of PMMA and PHEMA or P2VP, respectively. The good agreement of our results to
the scaling analysis developed for diblock copolymers corroborates this notion. Obviously,
once in contact with the silicon wafer, the polarity of both the middle blocks and the PMMA
end block leads to co-adsorption to the substrate surface, resulting in a quasi 2-dimensional
layer of the PHEMA-b-PMMA and P2VP-b-PMMA portion of the block copolymers. Due to
the unfavourable interaction and elastic contributions to the free energy (see below), the PS
blocks do not cover this layer completely but rather dewet the sublayer. During this process,
the PS chains form aggregates of different size and spacing resulting in the three-dimensional
structures observed in the SFM images. The size, height and half-distance of the resulting
structures clearly depend on the PS/PMMA block length as shown in Table 3-3. The
definition of the parameters used for scaling analysis and a cross-section of the morphology
are depicted in Scheme 3-2 which summarizes schematically the above descriptions.
So far only the dimensions associated with the PS stripes were considered. One can easily
calculate the half-width of the valleys between adjacent stripes, which should consist mainly
of PMMA, from the difference of the D and R values summarised in Table 3-3. It is
interesting to compare these values to the radii of gyration of the PMMA block. As an
example, for S48 2VP5 M47180 (825/80/855) the radius of gyration of the PMMA block is about
8 nm, whereas the half-width of the valleys found in the corresponding ultrathin film amounts
to some 30 nm. This result indicates significant streching of the PMMA chains in the
adsorbed layer. The free energy cost due to stretching must therefore be balanced by
maximizing the number of contacts to the substrate and the corresponding adhesion energy. In
order to cover the PMMA layer in the valleys completely, the PS chains (Rg ~ 8 nm) would
have to stretch approximately 4 times as well. Since no enthalpic gain of comparable
magnitude is expected at the PS/PMMA interface, complete coverage of PMMA by PS is not
observed. From the D and R data for the other block copolymers we consistently find a
streching of the adsorbing blocks by about 4-5 times compared to an unperturbed Gaussian
chain. The half-width of the observed valleys is 6 times smaller compared to the respective
PMMA contour length. Together with the average thickness of the adsorbed polymer layer of
approximately 1-2 nm, we may conclude that the adsorbed coils form trains and loops on the
substrate surface as shown in Scheme 3-2.
In the case of S67 H6 M27129 (830/60/340) the picture is quite different. As indicated earlier
the unusually large spacing of the PS stripes could be due to an incomplete coverage of the
substrate by a PHEMA-b-PMMA sublayer. This assumption is further supported by the fact
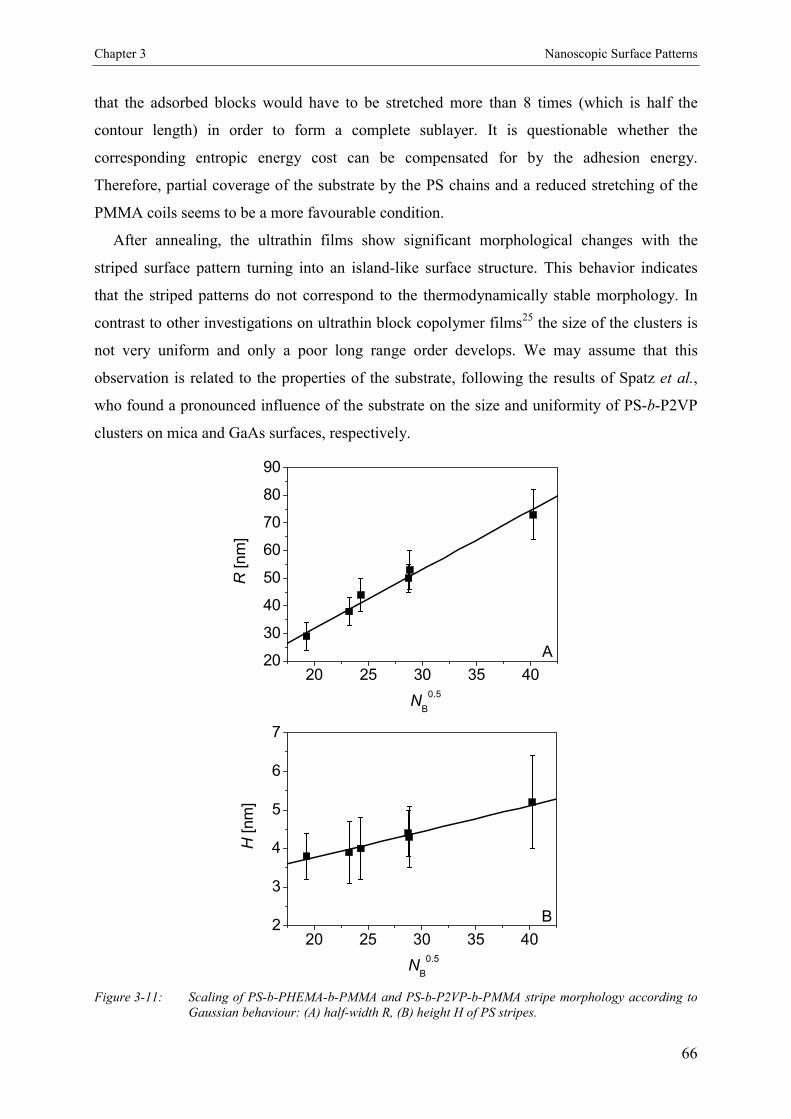
Chapter 3 Nanoscopic Surface Patterns
66
that the adsorbed blocks would have to be stretched more than 8 times (which is half the
contour length) in order to form a complete sublayer. It is questionable whether the
corresponding entropic energy cost can be compensated for by the adhesion energy.
Therefore, partial coverage of the substrate by the PS chains and a reduced stretching of the
PMMA coils seems to be a more favourable condition.
After annealing, the ultrathin films show significant morphological changes with the
striped surface pattern turning into an island-like surface structure. This behavior indicates
that the striped patterns do not correspond to the thermodynamically stable morphology. In
contrast to other investigations on ultrathin block copolymer films25 the size of the clusters is
not very uniform and only a poor long range order develops. We may assume that this
observation is related to the properties of the substrate, following the results of Spatz et al.,
who found a pronounced influence of the substrate on the size and uniformity of PS-b-P2VP
clusters on mica and GaAs surfaces, respectively.
20 25 30 35 4020
30
40
50
60
70
80
90
A
R [nm
]
NB
0.5
20 25 30 35 402
3
4
5
6
7
B
H [nm
]
NB
0.5
Figure 3-11: Scaling of PS-b-PHEMA-b-PMMA and PS-b-P2VP-b-PMMA stripe morphology according toGaussian behaviour: (A) half-width R, (B) height H of PS stripes.

Chapter 3 Nanoscopic Surface Patterns
67
Furthermore, according to recent calculations by Potemkin et al.14 on the stability of
islands and stripes and the transition between both phases, we expect that our system is
located close to the phase transition between stripes and islands. One important factor that
accounts for the stability of one phase is given by the difference in surface tension of the
dominant blocks. Compared to the system PS-b-P2VP (�� 50 mN/m26) the difference in
surface tension between PS and PMMA only amounts to �� 0.4 – 20.2 mN/m depending on
the amount of moisture absorbed by PMMA (0 – 3 %)26. According to the predictions of
Potemkin et al.14, stripes are more stable for �(adsorbing block/air) > �(dewetting block/air)
which would result in a smaller surface area to be covered by the adsorbing block. The larger
the difference in surface tension, the more energetically favourable is the striped structure. On
the other hand, the island-like pattern would be more stable if the surface tension ratio was
reverse. A difference in surface tension as small as described above does not provide a
thermodynamic argument to decide in favour of one or the other morphology.
Another hint pointing towards an instability of the observed stripe morphology is given by
the scaling behavior of the stripe dimensions H and R, respectively. For a state close to the
transition regime a Gaussian behaviour of H and R is expected ( 5.0, PSNHR � )14. As is shown
in Figure 3-11, this is indeed observed. The fit for the island-like morphology obtained after
annealing the striped samples (see Figure 3-10) does not show such a good agreement with
theory, which can be explained by the large errors due to the non-uniformity of the clusters.
A transition from stripes to islands has already been observed earlier by changing the
overall molecular weight ratios14, but in the present study the transition is induced by
instabilities resulting from the fact that the corresponding block copolymers are located in a
region near the phase boundary between the two phases.
3.5. Conclusions
We have shown that thin and ultrathin films of polystyrene-b-poly(2-vinyl-pyridine)-b-
poly(methyl methacrylate) and polystyrene-b-poly(2-hydroxyethyl methacrylate)-b-
poly(methyl methacrylate) block copolymers reveal regular surface patterns with worm-,
stripe- and island-like morphologies. The characteristic spacings can be controlled via the
molecular weight of the different blocks of the respective copolymers.
Thin films prepared by dip-coating from a polymer solution were found to exhibit a phase-
separated worm-like surface morphology that presumably only consists of PS and PMMA
microdomains with a characteristic lateral length scale similar to the bulk period L0. We

Chapter 3 Nanoscopic Surface Patterns
68
assume that the generation of such a striped surface pattern can be explained by complete
coverage of the silicon oxide surface by PHEMA or P2VP, resulting in a thin film structure
that consists of a homogeneous layer of the middle block adsorbed at the substrate covered
with a laterally microphase-separated surface layer of PS and PMMA microcomains. The
proposed model for this morphology is in agreement with previous SCF calculations by
Pickett and Balazs12.
In the case of the ultrathin films, our results demonstrate that adsorption of a block
copolymer as an ultrathin film leads to a periodic surface domain structure (stripes), where
both polar blocks (B and C) adsorb to the surface. Due to significant stretching of the
adsorbed blocks the spacings between the domains are large for the rather low molecular
weight block copolymers. The lateral dimensions correlate well with the molecular
dimensions of the A and B/C blocks according to previously derived scaling laws14.
It could be shown that the striped structure observed in the as-prepared samples exhibits
the tendency to rearrange into a thermodynamically more stable island-like structure on
annealing. These patterns show a lower uniformity in size and long-range order, presumably
due to the influence of the silicon substrate.
Especially for ultrathin films our results show that the size of the PS domains is dominated
by the molecular weight of PS whereas the spacing of the PS stripes or clusters can be
controlled by the length of the PHEMA-b-PMMA and P2VP-b-PMMA blocks. The
understanding of domain formation by self-assembly of block copolymers into certain surface
morphologies by tailoring the polymer architecture is an important aspect for future
investigations on generation of polymeric templates for a large variety of applications.
AcknowledgementThe authors thank C. Drummer (BIMF) and A. Göpfert for their skillful help with SEM
and TEM measurements, respectively. This work was financially supported by the Deutsche
Forschungsgemeinschaft within the Schwerpunktsprogramm “Benetzung und Strukturbildung
an Grenzflächen” (KR 1369/9). A.B. acknowledges a Kekulé fellowship by the Stiftung
Stipendien-Fonds des Verbandes der Chemischen Industrie and the German
Bundesministerium für Bildung und Forschung (BMBF).
Chapter 3 Nanoscopic Surface Patterns
69
References
1 The results of this chapter have already been pubilshed: A. Böker, A.H.E. Müller, G.
Krausch Macromolecules 2001, 34, 7477-7488.
2 Kellogg, G. J.; Walton, D. G.; Mayes, A. M.; Lambooy, P.; Russel, T. P.; Gallagher, P. D.;
Satija, S. K. Phys. Rev. Lett. 1996, 76, 2503.
3 Morkved, T. L.; Lu, M.; Urbas, A. M.; Ehrichs, E. E.; Jaeger, H. M.; Mansky, P.; Russell, T.
P. Science 1996, 273, 931.
4 Walton, D. G.; Kellogg, G. J.; Mayes, A. M.; Lambooy, P.; Russell, T. P. Macromolecules
1994, 27, 6225.
5 Henkee, C. S.; Thomas, E. L.; Fetters, L. J. J. Mat. Sci. 1988, 23, 1685.
6 Morkved, T. L.; Jaeger, H. M. Europhys. Lett. 1997, 40, 643.
7 Singhvi, R.; Kumar, A.; Lopez, G. P.; Stephanopoulos, G. N.; Wang, D. I. C.; Whitesides,
G. M.; Ingber, D. E. Science 1994, 264, 696.
8 Morkved, T. L.; Wiltzius, P.; Jaeger, H. M.; Grier, D.; Witten, T. Appl. Phys. Lett. 1994, 64,
422.
9 Spatz, J. P.; Roescher, A.; Möller, M. Adv. Mater. 1996, 8, 337.
10 Spatz, J. P.; Eibeck, P.; Mößmer, S.; Möller, M.; Herzog, T.; Ziemann, P. Adv. Mater.
1998, 10, 849.
11 Fukunaga, K.; Elbs, H.; Krausch, G. Langmuir 2000, 16, 3774.
12 Pickett, G. T.; Balazs, A. C. Macromol. Theory Simul. 1998, 7, 249.
13 Elbs, H.; Fukunaga, K.; Stadler, R.; Sauer, G.; Magerle, R.; Krausch, G. Macromolecules
1999, 32, 1204.
14 Potemkin, I. I.; Kramarenko, E. Y.; Khokhlov, A. R.; Winkler, R. G.; Reineker, P.; Eibeck,
P.; Spatz, J. P.; Möller, M. Langmuir 1999, 15, 7290.
15 Eibeck, P.; Spatz, J. P.; Potemkin, I. I.; Kramarenko, E. Y.; Khokhlov, A. R.; Möller, M.
Polymer Prepr. 1999, 40, 990.
16 Hirao, A.; Kato, H.; Yamaguchi, K.; Nakahama, S. Macromolecules 1986, 19, 1294.
17 Walheim, S.; Böltau, M.; Mlynek, J.; Krausch, G.; Steiner, U. Macromolecules 1997, 30,
4995.
18 Morkved, T. L.; Lopes, W. A.; Hahm, J.; Sibener, S. J.; Jaeger, H. M. Polymer 1998, 39,
3871.
19 Fasolka, M. J.; Banerjee, P.; Mayes, A. C.; Pickett, G.; Balazs, A. C. Macromolecules
2000, 33, 5702.

Chapter 3 Nanoscopic Surface Patterns
70
20 Spatz, J. P.; Möller, M.; Noeske, M.; Behm, R. J.; Pietralla, M. Macromolecules 1997, 30,
3874.
21 Keddie, J. L.; Jones, R. A. L. Isr. J. Chem. 1995, 35, 21.
22 Keddie, J. L.; Jones, R. A. L.; Cory, R. A. Faraday Disc. 1994, 98, 219.
23 Fryer, D. S.; Nealey, P. F.; de Pablo, J. J. Macromolecules 2000, 33, 6439.
24 Spatz, J. P.; Sheiko, S.; Möller, M. Adv. Mater. 1996, 8, 513.
25 Spatz, J. P.; Eibeck, P.; Mössmer, S.; Möller, M.; Kramarenko, E. Y.; Khalatur, P. G.;
Potemkin, I. I.; Winkler, R. G.; Reineker, P. Macromolecules 2000, 33, 150.
26 Brandrup, J.; Immergut, E. H. Polymer Handbook; 3rd ed.; Wiley Publisher: New York,
1991.
Chapter 4 Wetting of Nanopatterned Surfaces
71
Chapter 4
Wetting of Chemically Nanopatterned
Model Surfaces
Abstract
We investigate the wetting behavior of thin ~ 20 nm polystyrene films floated onto
chemically nanopatterned (heterogeneous) substrates, formed by adsorption of a polystyrene-
b-poly(2-vinyl pyridine)-b-poly(methyl methacrylate) block copolymer onto a polished
silicon wafer. These substrates exhibit a surface morphology mainly consisting of PS brushes
on a PMMA sublayer. Upon annealing, we observe partial dewetting of the PS film from the
substrate, resulting in an undulated meander-like PS pattern. In contrast, treatment in saturated
chloroform vapor leads to complete dewetting of the PS film induced by growth of large
holes.

Chapter 4 Wetting of Nanopatterned Surfaces
72
4.1. Introduction
In recent years, the use of block copolymers for surface patterning has attracted increasing
attention1 - 5. Well-defined laterally patterned surfaces are important for a variety of
applications, e.g. as compatibilizers for polymer blends6 or as templates for growing
biological cells with controlled shapes and sizes7. Furthermore, laterally patterned polymer
surfaces can be used as model systems for the study of wetting and dewetting phenomena on
heterogeneous substrates8 - 10. This field recently received a great amount of attention, because
the wetting behavior of thin polymer films on different types of substrates is of considerable
importance in practical applications such as paints, adhesives, lubricants, dielectrics,
biomedical devices, and nonlinear optics. The study of basic wetting phenomena in polymeric
systems is even more important as it has been demonstrated that the wetting dynamics and
dewetting instability of polymer molecules can be very different from those of simple
liquids11 - 14.
The wetting behavior of thin PS films on homogeneous silicon substrates has been studied
extensively over the last years. The initiation of the dewetting process, the underlying
mechanisms as well as its kinetics have been investigated in detail14 - 22. More recent
experiments focus on the wetting behavior of chemically and topographically nanostructured
surfaces23,24.
Following recent results by Eibeck et al.25,26 and our own studies27, we use the adsorption
of a polystyrene-b-poly(2-vinyl pyridine)-b-poly(methyl methacrylate) triblock copolymer
onto a polished silicon wafer to generate well-defined dot- or stripe-like PS/PMMA patterns
of characteristic lateral spacing on the surface.
The aim of the present work is to study the wetting behavior of thin PS films on these
chemically patterned (heterogeneous) model substrates.
The use of polymers for this purpose has several advantages compared to common low
molecular weight liquids. The vapor pressure of polymers is negligible and thus the mass of
the film is conserved and the low mobility of polymer melts favors time-resolved
experiments.

Chapter 4 Wetting of Nanopatterned Surfaces
73
4.2. Experimental Section
4.2.1. Materials and Methods
The block copolymer used in this study was synthesized by sequential anionic
polymerization as described in detail elsewhere27. The composition as calculated from
1H-NMR of the block copolymer using GPC results for the corresponding PS precursor,
calibrated with narrowly distributed PS standards, yields 48 wt.-% PS, 5 wt.-% P2VP, and
47 wt.-% PMMA with an overall number-average molecular weight Mn of 180,000 g/mol (in
the following, we will denote the polymer as S482VP5M47180, for chemical structure see Figure
4-1). The polystyrene (PS) homopolymer samples were purchased from PSS, Mainz,
Germany. PS 14, PS 54 and PS 104 denote homopolymer samples with Mn of 14 kg/mol,
54 kg/mol and 104 kg/mol, respectively.
bb
H
O OCH3
N
m n p
Figure 4-1: Chemical structure of PS-b-P2VP-b-PMMA triblock copolymer (NPS = 825, NP2VP = 80,NPMMA = 855).
4.2.2. Sample Preparation
In order to laterally pattern the silicon wafers, they were exposed to 1 mg/ml solutions of
the block copolymer in THF for 3-4 days, which led to adsorption of the polymer onto the
polar substrate. Subsequently, the wafers were rinsed 4 times with 5 ml THF.
Prior to use, the Si wafers were rinsed in organic solvents (THF, chloroform and acetone)
and subsequently treated with a beam of CO2 crystals (“snow jet�“) to remove any organic
residues from the surface.
The thin PS films were prepared by spin coating a toluene solution of the respective
polymer onto silicon wafers. After drying, they were floated from the silicon support and
transferred via the surface of deionized water onto the patterned model substrates.

Chapter 4 Wetting of Nanopatterned Surfaces
74
4.2.3. Scanning Force Microscopy
SFM images were taken on a Digital Instruments Dimension 3100 microscope operated in
Tapping ModeTM (free amplitude of the cantilever � 20 nm, amplitude set point � 0.98). The
standard silicon nitride probes were driven at 3 % offset below their resonance frequencies in
the range of 250-350 kHz. Height and phase images were taken at scanning speeds of around
6 �m/sec.
4.3. Results
Before we start the description of the wetting behavior of PS films on chemically structured
surfaces, we briefly recall the surface morphology of ultrathin block copolymers adsorbed
onto silicon wafers. As has been reported earlier27, the adsorption of an ABC triblock
copolymer with a short anchoring middle block (in this case P2VP, which enhances the
adsorption from solution) leads to a surface structure as described in Scheme 3-2 in chapter 3,
where the B and C blocks (P2VP-b-PMMA) are adsorbed to the polar substrate and PS
protrusions form a island- or stripe-like pattern. For the S482VP5M47180 block copolymer used
in this study, we find a characteristic half-spacing of D = 80 � 7 nm, which does not change
significantly upon annealing (height H of the protrusions: 4.4 � 0.6 nm, for details see
chapter 3).
1 �m
A
1 �m
B
Figure 4-2: SFM topography image of PS 54 on S482VP5M47180: (A) as prepared (z-range: 30 nm) and (B)
after 5 min at 130 °C (z-range: 60 nm). The right side of each image shows the pure triblockcopolymer substrate.

Chapter 4 Wetting of Nanopatterned Surfaces
75
When a thin PS film (thickness ~ 20 nm) is floated onto the above described model
surface, we partially observe rupture of the film, leading to sharp edges between regions
covered with the homopolymer film (on the left in Figure 4-2A) and the free block copolymer
surface (on the right in Figure 4-2B). This allows us to investigate the changes in morphology
for the PS film as well as for the free block copolymer surface. In addition, we can see in
Figure 4-2A that the PS protrusions of the adsorbed block copolymer layer even slightly
deform the PS sheet covering the sublayer. Thus, the topography of the sublayer can also be
seen on the left side of Figure 4-2A.
4 �m
Figure 4-3: SFM topography image of PS 54 on S482VP5M47180 after 5 min at 130 °C (z-range: 60 nm).
Fourier-transform of the PS pattern (inset) yields d ~ 420 nm.
4.3.1. Stability of polystyrene films on a triblock copolymer
model surface
4.3.1.1. Annealing
In order to check the stability of the homopolymer film on our patterned substrates, the
samples were annealed on a hotstage at 130°C, which is well above the glass transition
temperature of polystyrene (Tg ~ 100°C). Here, we report the observations made with a 20 nm
thick PS 54 film on S482VP5M47180. After 5 minutes, we observe a characteristic dewetting
pattern as shown in Figure 4-2B. The previously homogeneous film has broken up into an

Chapter 4 Wetting of Nanopatterned Surfaces
76
undulated meander-like pattern. Between the dewetted PS stripes, parts of the triblock
copolymer sublayer become visible. In the region of the homopolymer film the distance
between the PS protrusions of the sublayer seems to be larger than in the areas of the pure
triblock copolymer sublayer. It appears as if the triblock has been incorporated partially with
its PS block into the homopolymer film, acting as a compatibilizer and thus preventing a
complete, large scale dewetting process as found for pure silicon wafers15. A Fourier-
transform analysis of the dewetting pattern as shown in the inset in Figure 4-3 reveals a mean
distance, d, between the PS meanders of approximately 420 nm. This is about 2.5 times larger
than the mean spacing between the PS protrusions of the underlying ultrathin block
copolymer film. We note that these surface features are still too small to be visualized
optically, so that the wafer does not turn opaque due to large dewetting structures. We
anticipate that longer annealing times may eventually lead to an amplification of the
undulations and finally result in a break-up of the meander-like stripes into small droplets.
1 �m
Figure 4-4: SFM topography image of PS 14 on S482VP5M47180 after 1 min of exposure to saturated CHCl3
vapor (z-range: 15 nm).
4.3.1.2. Solvent Vapor Treatment
For the experiments using saturated chloroform vapor, we start with a sample morphology
identical to the one depicted in Figure 4-2A. At the very early stages of the vapor treatment,
we observe rupture of the thin homopolymer films at the spots where the PS sheet covers the
PS protrusions formed by the triblock copolymer sublayer as can be seen in Figure 4-4 for a
PS 14 on S482VP5M47180 after one minute of treatment with saturated chloroform vapor. This
is also observed for PS 104. We note that except for the dewetting kinetics, we did not detect
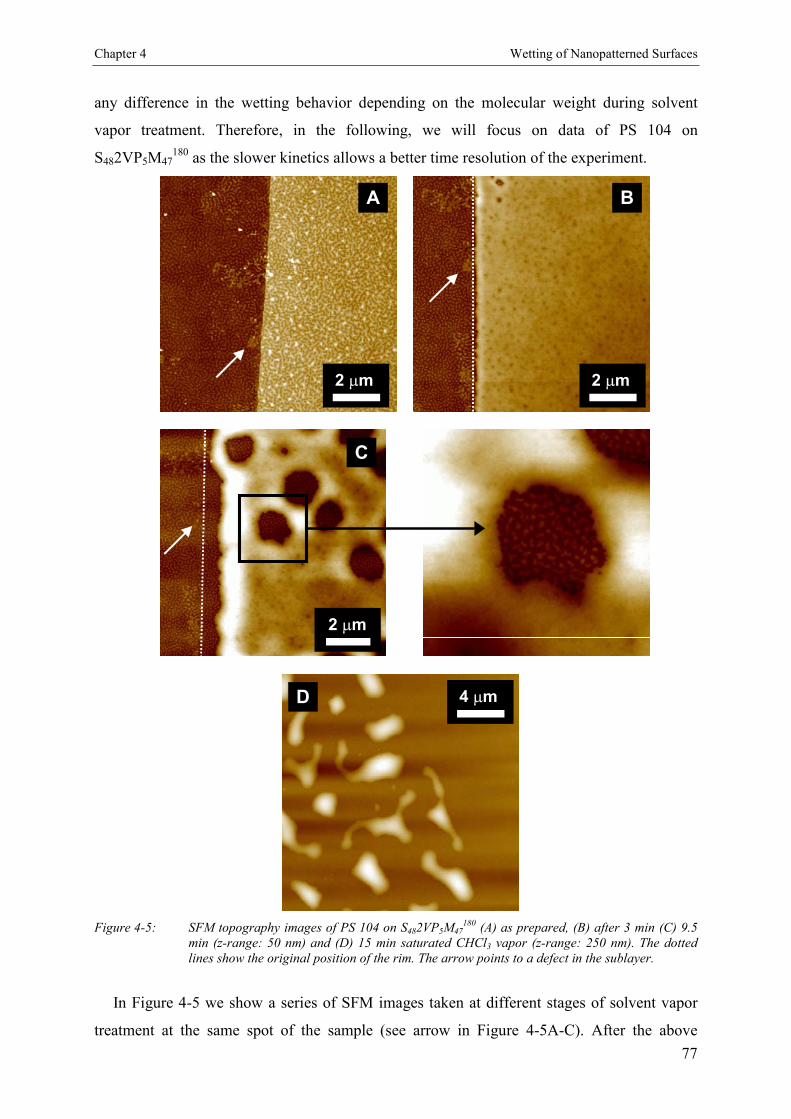
Chapter 4 Wetting of Nanopatterned Surfaces
77
any difference in the wetting behavior depending on the molecular weight during solvent
vapor treatment. Therefore, in the following, we will focus on data of PS 104 on
S482VP5M47180 as the slower kinetics allows a better time resolution of the experiment.
4 �mD
2 �m
A
2 �m
B
2 �m
C
Figure 4-5: SFM topography images of PS 104 on S482VP5M47180 (A) as prepared, (B) after 3 min (C) 9.5
min (z-range: 50 nm) and (D) 15 min saturated CHCl3 vapor (z-range: 250 nm). The dottedlines show the original position of the rim. The arrow points to a defect in the sublayer.
In Figure 4-5 we show a series of SFM images taken at different stages of solvent vapor
treatment at the same spot of the sample (see arrow in Figure 4-5A-C). After the above

Chapter 4 Wetting of Nanopatterned Surfaces
78
described rupture, the film seems to relax to form a more homogeneous surface, where the PS
protrusions of the sublayer do not influence the surface topography of the homopolymer film
any more. Nevertheless, in Figure 4-5B we observe a large number of widely distributed
indents and even first holes in the PS film. As can be seen in Figure 4-5C, the film forms a
large rim (original position indicated by dotted line) which slowly retracts while more holes
are created which grow with time. The magnification of a large hole in Figure 4-5C reveals
that the block copolymer sublayer seems to be unperturbed by the whole dewetting process.
Finally, as depicted in Figure 4-5D, the holes connect to each other and PS droplets are
formed. Compared to the dewetting pattern observed after annealing, the distance between the
droplets is much larger. Additionally, there are at least two orders of magnitude between the
average spacing and size of the PS protrusions of the underlying block copolymer layer and
the droplets formed during solvent vapor annealing.
These dewetting patterns are now large enough to be visualized optically, i.e. the sample
turns opaque. An optical micrograph of a completely dewetted film is shown in Figure 4-6.
These structures are very similar to “classical” dewetting patterns formed by PS on pure
silicon wafers as described in detail by G. Reiter15.
100 �m
Figure 4-6: Optical micrograph of PS 14 on S482VP5M47180 after CHCl3 vapor treatment for 5.5 min.

Chapter 4 Wetting of Nanopatterned Surfaces
79
4.4. Discussion
From the above described experiments, we cannot draw any definite conclusions about the
wetting behavior of PS homopolymer films on a PS/PMMA nanopatterned surface. From
surface tension considerations we may have expected a significant stabilization of the
homopolymer films compared to the behavior on pure silicon wafers. This has only been
observed for the annealed film, where undulated PS meanders are formed. Their spacings are
larger than the dimensions of the sublayer but do not exhibit a difference in size of several
orders of magnitude as found for the vapor treated films.
In the case of the PS homopolymer films annealed in solvent vapor, the sublayer does not
seem to be influenced by the dewetting PS film. Even though we expect the mobility of chains
in a vapor swollen film to be much higher than during thermal annealing, interpenetration of
the homopolymer and the PS blocks of the sublayer does not seem to occur. Here, it could
well be that “autodewetting” is observed. It is well-known that an entropic barrier can be
established when polymer molecules are confined in specific configurations (e.g. end-grafted
to a solid substrate forming a dense brush28, ordered in lamellae in a block copolymer at an
interface29 or interconnected in a network/gel type matrix30). In these cases the entropic gain
in free energy associated with interpenetration of the homopolymer chains and the chains at
the substrate surface is more than compensated for by the loss in conformational entropy due
to distortion of the substrate chains and a well defined interface is formed. The excess energy
associated with this interface can then destabilize the film and induce dewetting.
4.5. Conclusions
We have presented first studies on the wetting behavior of thin PS homopolymer films on
chemically nanopatterned substrates which already show that a partial stabilization of a PS
film can be achieved by an ultrathin sublayer of a polystyrene-b-poly(2-vinyl pyridine)-b-
poly(methyl methacrylate) block copolymer. So far, the experiments only allow a very
qualitative description of the results. Further work will have to concentrate on a systematic
variation of the PS domain spacing D of the sublayer in order to elucidate any correlation with
the mean spacing of the dewetting pattern. Furthermore, the influence of the molecular weight
of the homopolymer and the film thickness on the wetting behavior and kinetics should be
investigated systematically.

Chapter 4 Wetting of Nanopatterned Surfaces
80
AcknowledgementThis work was financially supported by the Deutsche Forschungsgemeinschaft within the
Schwerpunktsprogramm “Benetzung und Strukturbildung an Grenzflächen” (KR 1369/9).
A.B. acknowledges a Kekulé fellowship by the Stiftung Stipendien-Fonds des Verbandes der
Chemischen Industrie and the BMBF.
Chapter 4 Wetting of Nanopatterned Surfaces
81
References
1 Kellogg, G.J.; Walton, D G.; Mayes, A.M.; Lambooy, P.; Russel, T. P.; Gallagher, P.D.;
Satija, S. K. Phys. Rev. Lett. 1996, 76, 2503.
2 Morkved, T.L.; Lu, M.; Urbas, A.M.; Ehrichs, E.E.; Jaeger, H.M.; Mansky, P.; Russell, T.P.
Science 1996, 273, 931.
3 Walton, D.G.; Kellogg, G.J.; Mayes, A.M.; Lambooy, P.; Russell, T.P. Macromolecules
1994, 27, 6225.
4 Henkee, C.S.; Thomas, E.L.; Fetters, L.J. J. Mat. Sci. 1988, 23, 1685.
5 Morkved, T.L.; Jaeger, H.M. Europhys. Lett. 1997, 40, 643.
6 Fukunaga, K.; Elbs, H.; Krausch, G. Langmuir 2000, 16, 3474.
7 Singhvi, R.; Kumar, A.; Lopez, G.P.; Stephanopoulos, G.N.; Wang, D.I.C.; Whitesides,
G.M.; Ingber, D.E. Science 1994, 264, 696.
8 Konnur, R.; Kargupta, K.; Sharma, A. Phys. Rev. Lett. 2000, 84, 931.
9 Kargupta, K.; Konnur, R.; Sharma, A. Langmuir 2000, 16, 10243.
10 Kargupta, K.; Sharma, A. J. Chem. Phys. 2002, 116, 3042.
11 Silberzan, P.; Léger, L. Macromolecules 1992, 25, 1267.
12 Bruinsma, R. Macromolecules 1990, 23, 276.
13 Zhao, W.; Rafailovich, M.H.; Sokolov, J.; Fetters, L.J.; Plano, R.; Sanyal, M.K.; Sinha,
S.K.; Sauer, B.B. Phys. Rev. Lett. 1993, 70, 2659.
14 Reiter, G. Langmuir 1993, 9, 1344.
15 Reiter, G. Phys. Rev. Lett. 1992, 68, 75.
16 Brochard, F.; di Meglio, J.M.; Quéré, D. C. R. Acad. Sci., Ser. II 1987, 304, 553.
17 Brochard, F.; de Gennes, P.G. Langmuir 1992, 8, 3033.
18 Brochard-Wyart, F.; Redon, C.; Sykes, C. C. R. Acad. Sci., Ser. II 1992, 314, 10.
19 Brochard-Wyart, F.; de Gennes, P. G.; Hervet, H.; Redon, C. Langmuir 1994, 10, 1566.
20 Reiter, G. Macromolecules 1994, 27, 3046.
21 Seemann, R.; Herminghaus, S.; Jacobs, K. J. Phys.: Condens. Matter 2001, 13, 4925.
22 Seemann, R.; Herminghaus, S.; Jacobs, K. Phys. Rev. Lett. 2001, 86, 5534.
23 Rockford, L.; Liu, Y.; Mansky, P.;Russell, T.P.; Yoon, M.; Mochrie, S.G.J. Phys. Rev. Lett.
1999, 82, 2602.
24 Rehse, N.; Krausch, G. Eur. Phys. J. E 2001, 4, 69.
25 Spatz, J.P.; Eibeck, P.; Mössmer, S.; Möller, M.; Kramarenko, E.Y.; Khalatur, P.G.;
Potemkin, I.I.; Winkler, R.G.; Reineker, P. Macromolecules 2000, 33, 150.

Chapter 4 Wetting of Nanopatterned Surfaces
82
26 Eibeck, P.; Spatz, J.P.; Potemkin, I.I.; Kramarenko, E.Y.; Khokhlov, A.R.; Möller, M.
Polym. Prepr. 1999, 40, 990.
27 Böker, A.; Müller, A.H.E.; Krausch, G. Macromolecules 2001, 34, 7477.
28 Henn, G.; Bucknall, D.G.; Stamm, M.; Vanhoorne, P.; Jerome, R. Macromolecules 1996,
29, 4305.
29 Liu, Y.; Rafailovich, M.H.; Sokolov, J.; Schwarz, S.A.; Zhong, X.; Eisenberg, A.; Kramer,
E.J.; Sauer, B.B.; Satija, S. Phys. Rev. Lett. 1994, 73, 440.
30 Kerle, T.; Yerushalmi-Rozen, R.; Klein, J. Europhys. Lett. 1997, 38, 207.

Chapter 5 Large Scale Domain Alignment
83
Chapter 5
Large Scale Domain Alignment of a Block
Copolymer from Solution using Electric Fields1
Abstract
We have aligned the microdomains of a polystyrene-b-poly(2-hydroxyethyl meth-
acrylate)-b-poly(methyl methacrylate) (PS-b-PHEMA-b-PMMA) triblock copolymer during
preparation from solution by virtue of an external electric DC field (1.8 kV/mm). Bulk
samples cast in the presence of an electric field exhibit lamellar microdomains highly oriented
parallel to the electric field vector, as shown by small-angle X-ray scattering (SAXS) and
transmission electron microscopy (TEM).

Chapter 5 Large Scale Domain Alignment
84
5.1. Introduction
The microphase separation of block copolymers has been studied extensively over the past
two decades both experimentally and theoretically2,3. In the ordered state, these materials
exhibit highly regular mesoscopic microdomain structures with characteristic length scales of
the order of several tens of nanometers. Similar to polycrystalline materials, typically small
grains of microdomains are formed, the size of which may be of the order of microns. As a
consequence, although a single grain may have a highly anisotropic structure (e.g. in the case
of cylindrical or lamellar structures), a bulk sample of a block copolymer typically exhibits
isotropic materials properties. If macroscopic anisotropies are desirable, additional efforts
have to be made to create macroscopic alignment of the microdomain structures. In the past,
different techniques aiming towards macroscopic microdomain alignment have been devised.
Most prominently, external mechanical fields have been successfully applied to orient block
copolymer melts (e.g. Large Amplitude Oscillatory Shear (LAOS)4 - 6 or extrusion7) and block
copolymer solutions (e.g. roll-casting8).
In addition to mechanical fields, the potential of electric fields for microdomain alignment
has attracted increasing interest in the recent past as it may also be of considerable technical
interest9. It has been shown that both lamellar and cylindrical microdomain structures in
polystyrene-b-poly(methyl methacrylate) (PS-b-PMMA) melts could be oriented
macroscopically by virtue of a DC electric field 10 - 15. Due to the differences in the dielectric
constants (��) of the blocks (�PS 2.4, �PMMA 3.6)16, the microdomains tend to orient
parallel to the electric field vector, thereby lowering the free energy of the system. The
electric field - induced driving force is proportional to (��E)2 11,15. Cylindrical microdomains
can in principle be aligned along the field vector resulting in a single monodomain (i.e. a
block copolymer “single crystal”). In a lamellar microdomain structure, on the other hand, all
lamellar orientations containing the electric field vector within the lamellar planes are
energetically equivalent. Therefore, the electric field is expected to at best favor the sub-set of
lamellar orientations with the lamellar normal pointing perpendicular to the field.
So far most experiments using electric fields have been conducted in the melt. Due to the
high melt viscosities, they are limited with respect to the molecular weight of the copolymers
and the size of the macroscopic regions to be oriented (Mw 74000 g/mol for thin films of
thickness 1 �m 17; Mw 37000 g/mol for samples of thickness 2 mm 10,11). In addition,
temperatures close to the decomposition temperature and electric field strengths of up to
25 kV/mm are required to achieve high degrees of orientation. These limitations render the
orientation of higher molecular weight copolymers or copolymers of more complex

Chapter 5 Large Scale Domain Alignment
85
architectures (multiblock copolymers, star copolymers, etc.) rather difficult if not impossible,
since their melt viscosities easily exceed the values faced in the investigations quoted above.
Given the increasing interest in complex block copolymer structures, it is therefore desirable
to explore alternative approaches, which circumvent the above limitations.
In the present contribution, we demonstrate the potential of an electric DC field for the
microdomain alignment of a block copolymer solution18,19. The field is applied during solvent
evaporation until final film formation and thereby leads to macroscopically oriented bulk
specimens as well. The use of a solvent based procedure extends the potential of electric
fields for block copolymer alignment to a much larger class of block copolymers. As an
example, we apply the approach to an ABC triblock copolymer, where macroscopic melt
alignment in electric fields is expected to be hardly possible. We note that the aligning force
of an electric field is significantly smaller for block copolymer solutions than for melts due to
an effective reduction of the difference in the dielectric constants of the blocks �� by the
solvent.
5.2. Experimental Section
A polystyrene-b-poly(2-hydroxyethyl methacrylate)-b-poly(methyl methacrylate) triblock
copolymer was synthesized by sequential living anionic polymerization as described in detail
elsewhere20. The polymer used in this study consists of 47 wt.-% polystyrene, 43 wt.-%
poly(methyl methacrylate) (PMMA) and 10 wt.-% poly(2-hydroxyethyl methacrylate)
(PHEMA) with a total number average molecular weight Mn = 82000 g/mol. GPC of the final
block copolymer yields a polydispersity of Mw/Mn = 1.04.
5.2.1. Polymer Analysis
GPC measurements were performed using a set of 30 cm SDV-gel columns of 5 �m
particle size having 105, 104, 103 and 102 Å pore size and dual detectors (RI and UV
[� = 254 nm]). The solvent was THF at room temperature with an elution rate of 1 mL/min.
Narrowly distributed polystyrene samples were used as calibration standards.
1H-NMR spectra were acquired on a 250 MHz Bruker AC 250 instrument using CDCl3 as
solvent and tetramethylsilane (TMS) as internal standard. The molecular weights of the
PHEMA and PMMA blocks were calculated using the block copolymer composition
determined by NMR and the polystyrene molecular weight obtained from GPC.

Chapter 5 Large Scale Domain Alignment
86
5.2.2. Sample Preparation
The alignment experiments were performed in a cylindrical capacitor with aluminum
electrodes (r = 5 mm, d = 1.1 mm; Figure 5-1) at room temperature. A DC voltage of 2 kV
was applied resulting in an electric field strength of ~ 1.8 kV/mm. The voltage at the
electrodes and the current were monitored during the course of the experiment indicating only
a small leakage current (0.01 – 0.02 mA) during the first few seconds after the field was
applied. Between 0.2 and 1.1 mm thick films were obtained by slowly evaporating the solvent
from 30 vol.-% solutions of the block copolymer in chloroform.
Teflon insulationelectrodes
polymer solution
+
-
lower electroder
d ~~~~~~~~~~~~~~~~~~~~~
Teflon insulationelectrodes
polymer solution
+
-
lower electroder
d ~~~~~~~~~~~~~~~~~~~~~
Figure 5-1: Capacitor setup used for sample preparation in the absence and in the presence of an electricfield, respectively.
5.2.3. Small Angle X-ray Scattering (SAXS)
Cubic specimen of approximately 1 mm edge length were cut from the respective regions
of interest of the as-cast film. SAXS measurements were performed using a Bruker-AXS
Nanostar instrument with a sealed tube Cu K��X-ray source (� = 1.5418 Å) operated at 40 mA
and 40 kV and a 2D Histar detector. The direction of the X-ray beam (approximate cross
section: 100 �m/crossed Goebel mirrors) was perpendicular to the vector of the applied
electric field. The scattering patterns were corrected for the beam stop and background prior
to further evaluations.
In order to estimate the scattering contrast between PHEMA and PMMA we calculate the
electron density of both possible methacrylic phases taking into account the different densities
of �PHEMA = 1.15 g/cm3 16 and �PMMA = 1.19 g/cm3 16 and the molecular weights of 130 and
100 g/mol, respectively. The calculations yield an electron density of 0.64 mol/cm3 for

Chapter 5 Large Scale Domain Alignment
87
PMMA and 0.62 mol/cm3 for PHEMA. These values are similar and in both cases
significantly higher than the 0.56 mol/cm3 that we calculate for the polystyrene phase.
Therefore we may conclude that there is no significant scattering contrast between the
methacrylic phases compared to polystyrene.
5.2.4. Scanning Electron Microscopy (SEM)
SEM was performed using a LEO 1530 Gemini instrument equipped with a field emission
cathode with a lateral resolution of approximately 2 nm. The acceleration voltage was 5 kV.
The sample was prepared by freeze fracture. Prior to the measurements it was sputtered with
gold.
5.2.5. Transmission Electron Microscopy (TEM)
Thin sections were cut from the as-cast films parallel to the electric field vector (far from
any surface) using a Reichert-Jung Ultracut E microtome equipped with a diamond knife. In
order to enhance the electron density contrast between polystyrene and the methacrylic
blocks, the sections were exposed to RuO4 vapor for 45 minutes, which leads to a preferential
staining of the polystyrene block21. Bright field TEM was performed using a Zeiss electron
microscope (CEM 902) operated at 80 kV in the bright field mode.
5.2.6. Calculation of order parameters
As will become clear from the experimental observations described below, domain
alignment is induced by two competing external fields of different symmetry, i.e. the
interfacial field between polymer solution and electrode surface and the electric field,
respectively. To quantify the alignment, we calculate the order parameter P2 by integrating the
scattering intensity from � = 0° to 360°:
2
1cos3 2
2
�
�
�
P
with
� �
� ��
�
�
��
�
�
�
���
����
�2
0
2
0
2
2
)sin()(
)sin()(cos)(
cos
q
q
Id
Id
Chapter 5 Large Scale Domain Alignment
88
Depending on the position of the maxima of the scattering intensity the calculation yields two
different ranges of the order parameter. For lamellar alignment parallel to the electrodes
(maximum at � = 0°), P2 ranges from 0 to 1 with P2 = 1 corresponding to perfect lamellar
alignment where all lamellar normals are oriented perpendicular to the surfaces, i.e.
electrodes. For alignment of the lamellae along the field direction (maximum at � = 90°), P2
ranges from 0 to - 0.5 with P2 = - 0.5 corresponding to the case where all lamellae are aligned
parallel to the field, however, with the lamella normals being isotropically oriented in the
plane of the electrodes. Depending on the type of alignment the maximum values describing
perfect alignment are 1 and - 0.5, respectively.
5.3. Results
5.3.1. Films cast at zero electric field
In order to exclude any effect of solvent evaporation on the alignment process, films were
cast in the setup shown in Figure 5-5-1, however in the absence of an external electric field.
We observe a highly anisotropic SAXS pattern as shown in Figure 5-5-2a. The azimuthal
angular dependence (�) of the scattering intensity (Figure 5-5-2b) reveals a preferential
alignment of the lamellae parallel to the electrodes. We attribute this finding to a strong
affinity of the solution/electrode interface to one of the blocks, which leads to preferential
orientation of the lamellae parallel to the electrodes during solvent evaporation. This
phenomenon has already been observed by Annighöfer and Gronski for controlled solvent
casting of lamellar polystyrene-b-polyisoprene diblock copolymers22.
For the data presented in Figure 5-2 we calculate the order parameter of P2 = 0.43. The
lamellar spacing dSAXS = 45 � 2 nm calculated from the first-order reflection in Figure 5-2c at
q* = 0.14 nm-1 (dSAXS = 2/q*) fits well to the value dTEM = 40 � 2 nm obtained from the TEM
pictures (Figure 5-3a). Furthermore, Figure 5-3a shows a well-ordered lamellar microdomain
alignment parallel to the electrode surfaces thereby corroborating the SAXS results.
5.3.2. Films cast in the presence of an electric field
Film formation under the influence of an external electric field results in significant
thickness undulations, which eventually lead to the formation of column-like protrusions that
connect both electrodes. Recently, Schäffer et al. showed that electric fields can induce
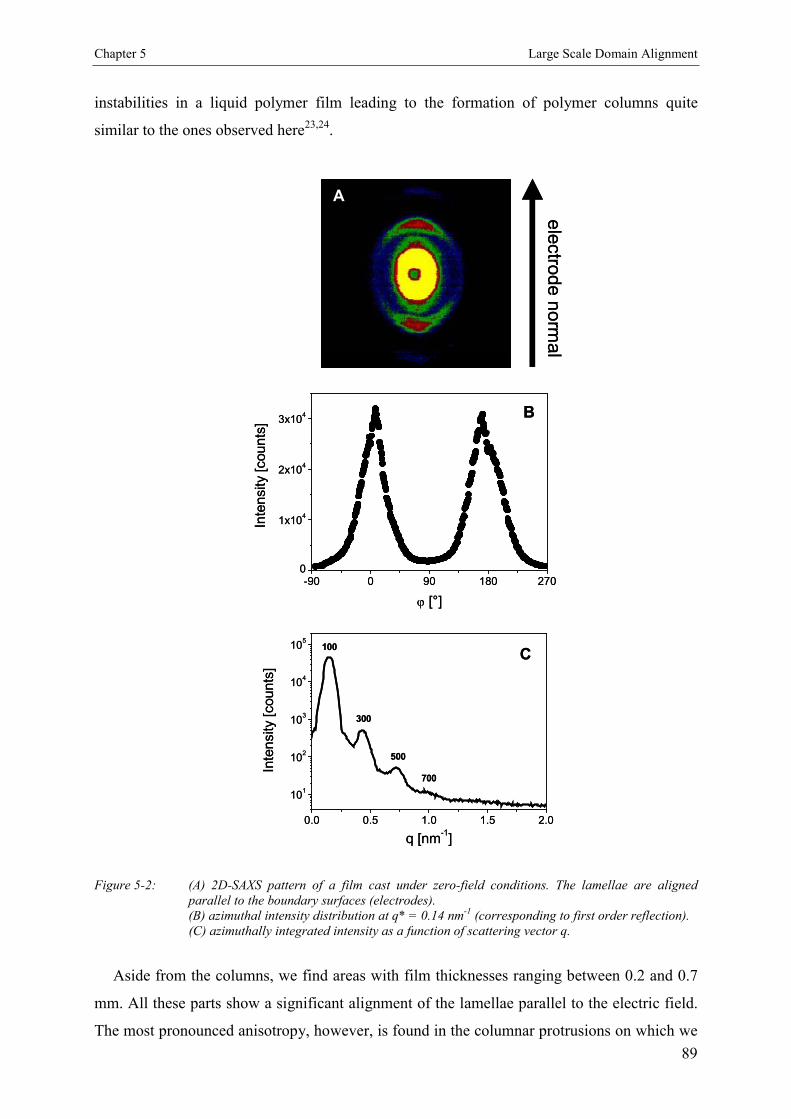
Chapter 5 Large Scale Domain Alignment
89
instabilities in a liquid polymer film leading to the formation of polymer columns quite
similar to the ones observed here23,24.
ele
ctro
de n
orm
al
A
ele
ctro
de n
orm
al
A
-90 0 90 180 2700
1x10⁴
2x10⁴
3x10⁴
Inte
nsi
ty [counts
]
� [°]
B
-90 0 90 180 2700
1x10⁴
2x10⁴
3x10⁴
Inte
nsi
ty [counts
]
� [°]
B
0.0 0.5 1.0 1.5 2.0
101
102
103
104
105
700
500
300
100
Inte
nsi
ty [
counts
]
q [nm-1]
C
0.0 0.5 1.0 1.5 2.0
101
102
103
104
105
700
500
300
100
Inte
nsi
ty [
counts
]
q [nm-1]
C
Figure 5-2: (A) 2D-SAXS pattern of a film cast under zero-field conditions. The lamellae are alignedparallel to the boundary surfaces (electrodes).(B) azimuthal intensity distribution at q* = 0.14 nm-1 (corresponding to first order reflection).(C) azimuthally integrated intensity as a function of scattering vector q.
Aside from the columns, we find areas with film thicknesses ranging between 0.2 and 0.7
mm. All these parts show a significant alignment of the lamellae parallel to the electric field.
The most pronounced anisotropy, however, is found in the columnar protrusions on which we

Chapter 5 Large Scale Domain Alignment
90
will focus in the present study. Figure 5-4 shows a cross sectional SEM image of a typical
column. The curvature of the boundaries is induced by the wetting of the electrode surfaces
during evolution of the protrusion.
A representative SAXS pattern taken within one of the columns is shown in Figure 5-5a. It
reveals an anisotropic azimuthal angular dependence of the scattering intensities (Figure 5-5b)
shifted by 90° compared to the zero-field experiment. The Bragg reflections are identical to
the ones observed in the zero-field experiment. The order parameter P2 yields - 0.4. Thus,
these results clearly indicate a predominant alignment of the lamellae parallel to the electric
field vector. A representative TEM picture is shown in Figure 5-3b. There are regions of very
uniform lamellae aligned parallel to the electric field vector throughout the whole picture.
Interestingly, the orientation of these lamellae is not disturbed by the defect structures (e.g.
disclinations). Furthermore, it appears that the trajectories of the disclination lines and other
defects (coarse patterns similar to wood grain patterns) are aligned predominantly in the
direction of the electric field as well. Especially the latter defects have been reported earlier
for PS-b-PMMA block copolymers oriented in an electric field from the melt. These
structures may arise from disclination lines cut shallowly parallel to their trajectories25.
Investigations of the lamellar alignment at the film boundaries reveal the large influence of
the electrode surface on the microdomain alignment as has already been observed for the
zero-field experiment. Even with an applied electric field we find orientation of the lamellae
parallel to the electrode surface for the first 10 to 40 lamellar layers as shown in Figure 5-6.
5.4. Discussion
We start our discussion with a quantitative estimate of the energies involved in the process
of domain ordering in our experiments. For this end we note that we have evidence that the
PHEMA block is actually miscible with the PMMA block. This is indicated by differential
scanning calorimetry (DSC), rheological and TEM experiments, where only a single
methacrylic phase could be identified. TEM experiments involved the staining with
phosphotungstic acid and long time exposure to ruthenium tetroxide vapor which is well
known to lead not only to staining of the PS block but also should react with hydroxyl
groups21. As both methods did not lead to definite results and DSC and rheological
measurements only revealed two glass transition temperatures at 110 °C and 137 °C which are
attributed to the PS and a methacrylic phase, respectively, we anticipate that PHEMA and
PMMA may form a mixed phase.

Chapter 5 Large Scale Domain Alignment
91
cutting edge
A
1 �m
cutting edge
A
1 �m1 �m1 �m 1 �m
B
1 �m1 �m1 �m
B
Figure 5-3: TEM pictures of zero-field and alignment experiment.(A) zero-field (The arrow indicates the direction perpendicular to the electrodes).(B) E = 1.8 kV/mm (The arrow indicates the direction of the electric field vector). The imagewas taken from one of the columns bridging between the electrodes.
This assumption leads us to treat the triblock copolymer as an AB diblock copolymer with
the following composition: A: 47 wt.-% PS (�A = 2.4) and B: 53 wt.-% methacrylic blocks
(�B = 0.81 �PMMA + 0.19 �PHEMA = 4.6; with �PMMA = 3.6 and �PHEMA = 8.9 26). As chloroform
(�CHCl3 4.8) is a fairly non-selective solvent for the two main components, PS and PMMA,
we expect a similar swelling behavior leading merely to a dilution effect with respect to the
dielectric constants of each block. Therefore, with increasing solvent content in the films, the
difference of the dielectric constants is reduced and the thermodynamic driving force for an
alignment of the lamellae parallel to the field is expected to decrease15. As has been pointed
out by Amundson et al.11 with respect to melts of PS-b-PMMA block copolymers this force is
already small, so that it is remarkable that its decrease still leaves a sufficient driving force to
allow for preferential alignment of the microdomains.
To estimate the driving forces for domain alignment as a function of solvent concentration
�, we calculate the electric energy per unit area W, which is stored in the capacitor for the
different situations sketched in Figure 5-7a. The model relies on two major assumptions: The
dielectric constant of a mixture �mix of polymer �pol and solvent �sol is assumed to depend
linearly on the solvent concentration �
� � polsolmix ����� ��� 1

Chapter 5 Large Scale Domain Alignment
92
We further disregard any influence of the solvent on the partial molar volume of the polymer,
i.e. the volumes of polymer Vpol and solvent Vsol simply add:
solpolmix VVV ��
Four basic geometries have been identified to describe the system, corresponding to a
perpendicular (W�,col, W
�,flat) and parallel (W||,col, W||,flat) alignment of the microdomains with
respect to the electric field and to a formation of columns (W�,col, W||,col) and a flat film
(W�,flat, W||,flat), respectively.
We calculate the energy W stored within the electric field of the capacitor according to
� �� dVDEW��
21
with E�
being the electric field and D�
the displacement field.
300 �m300 �m300 �m
Figure 5-4: Cross sectional SEM image of a protrusion formed during exposure to a DC electric field(1.8 kV/mm).
In contrast to the dielectric displacement D�
, the electric field E�
along the z-direction of
the capacitor is not uniform for the models, which incorporate a layered structure (W�,flat and
W�,col). This is due to the fact that the component of the electric field perpendicular to the
interface between two materials is not continuous, but the one of the displacement field is:
D�
�1 = D�
�2 but E�
�1 E�
�2. Additionally E�
i = D�
i/�i and the applied voltage V = � E�
dz,
which means that as soon as air is present as a layer in the capacitor with the applied voltage
V, the electric field in both polymer layers is reduced. This leads effectively to a reduced
energy stored inside the capacitor and to a reduced alignment of the block copolymer in the
thinner parts of the sample. We are well aware of the fact that our calculations neglect the

Chapter 5 Large Scale Domain Alignment
93
existence of interfacial boundary regions in concentrated polymer solutions. Therefore the
results may represent an approximation to the upper limit of the real energetic situation.
Figure 5-7b shows the energy per unit area stored inside a capacitor filled with 15 vol.-%
polymer A (�A = 2.4) and 15 vol.-% polymer B (�B = 4.6) as a function of solvent volume
fraction (�sol = 4.8), corresponding to the four basic geometries, with a gap width of 1.1 mm
and an applied voltage of 2 kV.
0E
A
0E
A
0 90 180 270 360
0
1x10³
2x10³
3x10³
4x10³
5x10³
Inte
nsity
[counts
]
� [°]
B
0 90 180 270 360
0
1x10³
2x10³
3x10³
4x10³
5x10³
Inte
nsity
[counts
]
� [°]
B
Figure 5-5: (A) 2D-SAXS pattern of a film cast in the presence of a DC electric field (1.8 kV/mm).The experiment has been performed within one of the columns bridging between the electrodes.The lamellae are oriented preferentially along the field direction.(B) azimuthal intensity distribution at first order reflection (P2 = -0.4).
Curves W�,col and W
�,flat as well as curves W||,col and W||,flat converge at a solvent concentration
of 70 vol.-% (which is the starting concentration of our experiment), because at this point the
capacitor is completely filled and the respective geometries are equivalent. For the major part
of the plot, columns (W�,col, W||,col) store more energy than flat films (W
�,flat, W||,flat) because
the polymer/solvent mixture exhibits a higher dielectric constant as compared to air.
Therefore column formation should be favored in agreement with the experimental finding. It
has to be kept in mind though that column formation requires the formation of additional

Chapter 5 Large Scale Domain Alignment
94
surfaces, which leads to an energy penalty. Obviously, according to our results, the gain in
energy during alignment of the lamellae parallel to the electric field vector is large enough to
compensate for an additional surface energy cost. An approximation taking into account the
dimensions of the observed protrusions, a mean surface energy of ~ 30 mJ/m2
(�PS = 40.7 mJ/m2, �PMMA = 41.1 mJ/m2, �CHCl3 = 26.7 mJ/m2)16 and the gain in electric energy
per unit area in the capacitor (~ 20 mJ/m2 at 50 - 60 vol.-% solvent) leads to the following
result: At a certain ratio of the radius R of a column to its height H (R/H ~ 0.8 ) the surface
and electric energy contributions are equal. Given the fact that the columns observed in our
experiment start to evolve at relatively high solvent concentrations, we have to consider a
significant shrinkage in the lateral dimensions during film formation. However, the gain in
electric energy for the aligned system is of the same order of magnitude as the surface energy
cost. The observation that we still find material in between the protrusions can be explained
by the fact that the overall process of film formation, i.e. drying of the polymer solution,
occurs at a faster rate than the formation of the columns.
500 nm500 nm500 nm500 nm
Figure 5-6: TEM picture of interfacial region between electric field aligned polymer film and electrodesurface (Film embedded in epoxy resin. The arrow indicates the direction of the electric fieldvector).
The electric energies for structures aligned parallel to the electric field are always larger
than the ones for structures oriented perpendicular to the field, explaining the preferential
alignment observed in the experiment. It is interesting to look at the energy difference
between the microdomain orientations in the columns (W�,col, W||,col) and the one in the flat
film (W�,flat, W||,flat), which is shown in the inset in Figure 5-7b. With decreasing solvent
concentration this value is much higher for the columns. Therefore the microdomain ordering

Chapter 5 Large Scale Domain Alignment
95
inside the columns is expected to be better than inside the flat film regions in between the
columns. In addition, for the case of the thinner films in between the columns we expect a
larger influence of the electrode/polymer and the polymer/air interfaces, which would favor
lamellar alignment parallel to the electrodes. These two effects are in competition and only if
the electric field is large enough the microdomains will align parallel to the field15. Indeed,
SAXS experiments performed in the flat areas in between the columns (Figure 5-8) show a
lamellar alignment along the field direction, however, with a significantly smaller degree of
order (P2 = - 0.25).
A
A B air
W||,col W�,col
W�,flatW||,flat
A B air
W||,col W�,col
W�,flatW||,flat
A
A B air
W||,col W�,col
W�,flatW||,flat
A B air
W||,col W�,col
W�,flatW||,flat
0 10 20 30 40 50 60 70
20
30
40
50
60
70
W [m
J/m
2]
Vol.-% Solvent
0 10 20 30 40 50 60 70
0.0
0.4
0.8
1.2
1.6
W [
mJ/
m2]
Vol.-% Solvent
W||,flatW||,col
W�,col
W�,flat
W||,col - W�,col
W||,flat - W�,flat
B
B
0 10 20 30 40 50 60 70
20
30
40
50
60
70
W [m
J/m
2]
Vol.-% Solvent
0 10 20 30 40 50 60 70
0.0
0.4
0.8
1.2
1.6
W [
mJ/
m2]
Vol.-% Solvent
W||,flatW||,col
W�,col
W�,flat
W||,col - W�,col
W||,flat - W�,flat
B
0 10 20 30 40 50 60 70
20
30
40
50
60
70
W [m
J/m
2]
Vol.-% Solvent
0 10 20 30 40 50 60 70
0.0
0.4
0.8
1.2
1.6
W [
mJ/
m2]
Vol.-% Solvent
W||,flatW||,col
W�,col
W�,flat
W||,col - W�,col
W||,flat - W�,flat
0 10 20 30 40 50 60 70
20
30
40
50
60
70
W [m
J/m
2]
Vol.-% Solvent
0 10 20 30 40 50 60 70
0.0
0.4
0.8
1.2
1.6
W [
mJ/
m2]
Vol.-% Solvent
W||,flatW||,col
W�,col
W�,flat
W||,col - W�,col
W||,flat - W�,flat
B
B
Figure 5-7: (A) Different geometries used for the calculation of the electric energy W stored in a capacitorpartially filled with polymers A and B. (B) Energy per area stored in the capacitor for the fourgeometries as a function of solvent concentration. The inset shows the energy differencebetween the two orientations for columns (W||,col - W
�,col) and for a flat film (W||,flat - W�,flat),
respectively.
There have been various assumptions concerning the mechanism of microdomain alignment,
which are mostly based on defect movement, resulting in either mutual annihilation of
equivalent defects (which are traverse to the electric field) or pinning of defect structures11,25.
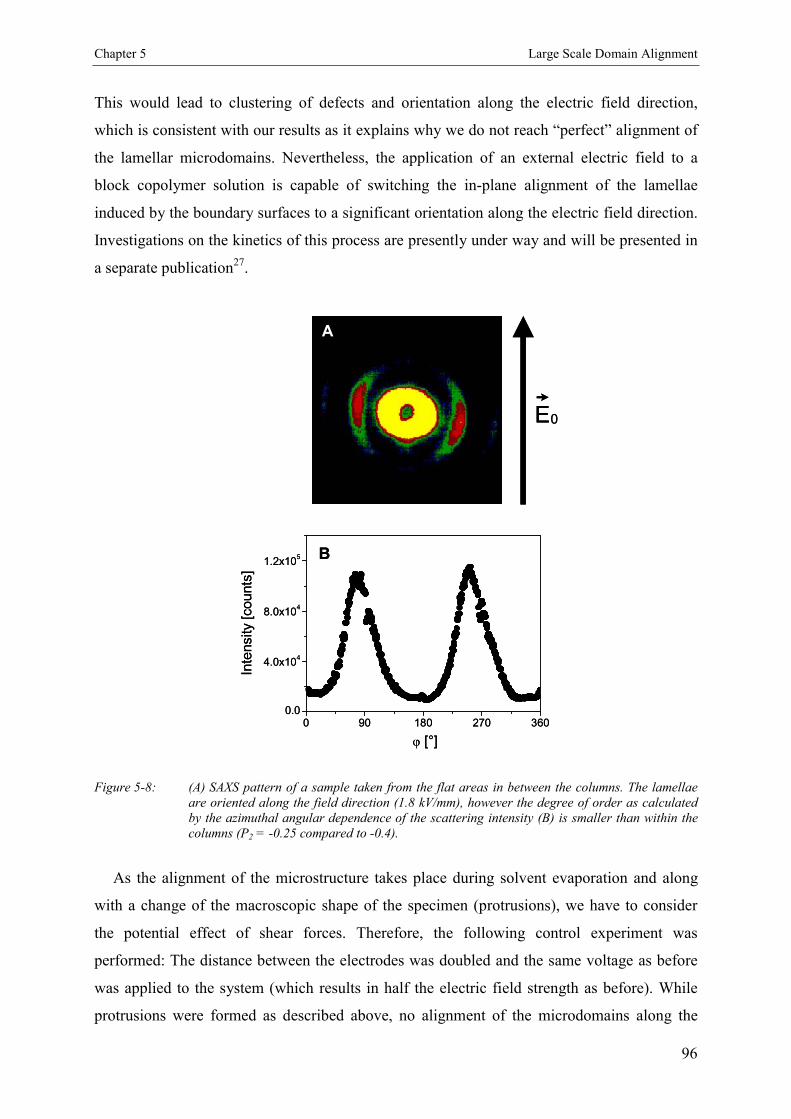
Chapter 5 Large Scale Domain Alignment
96
This would lead to clustering of defects and orientation along the electric field direction,
which is consistent with our results as it explains why we do not reach “perfect” alignment of
the lamellar microdomains. Nevertheless, the application of an external electric field to a
block copolymer solution is capable of switching the in-plane alignment of the lamellae
induced by the boundary surfaces to a significant orientation along the electric field direction.
Investigations on the kinetics of this process are presently under way and will be presented in
a separate publication27.
0E
A
0E
A
0 90 180 270 3600.0
4.0x10⁴
8.0x10⁴
1.2x10⁵
Inte
nsity
[co
unts
]
� [°]
B
0 90 180 270 3600.0
4.0x10⁴
8.0x10⁴
1.2x10⁵
Inte
nsity
[co
unts
]
� [°]
B
Figure 5-8: (A) SAXS pattern of a sample taken from the flat areas in between the columns. The lamellaeare oriented along the field direction (1.8 kV/mm), however the degree of order as calculatedby the azimuthal angular dependence of the scattering intensity (B) is smaller than within thecolumns (P2 = -0.25 compared to -0.4).
As the alignment of the microstructure takes place during solvent evaporation and along
with a change of the macroscopic shape of the specimen (protrusions), we have to consider
the potential effect of shear forces. Therefore, the following control experiment was
performed: The distance between the electrodes was doubled and the same voltage as before
was applied to the system (which results in half the electric field strength as before). While
protrusions were formed as described above, no alignment of the microdomains along the

Chapter 5 Large Scale Domain Alignment
97
electric field was found under these conditions. We therefore exclude shear as the dominant
driving force for domain alignment in our experiments.
Finally we note that although we can model our system as a diblock copolymer in our
calculations, the incorporation of the PHEMA middle block seems to be essential for the
ordering process to function. Similar experiments on PS-b-PMMA diblock copolymer
solutions (not shown here) did not exhibit field induced domain alignment. Two reasons may
be responsible for this observation: At first, the high dielectric constant of PHEMA
(�PMMA = 8.9) significantly increases the driving force for ordering even at the rather small
volume fraction realized in the present experiments. Moreover, microphase separation in
PS-b-PMMA diblock copolymer solutions occurs only at polymer concentrations above
60 wt.-%, while the PHEMA containing triblock copolymers already microphase separate at
polymer concentrations around 40 wt.-%. In the latter case, the viscosity of the phase
separated solution is considerably smaller which helps the ordering process induced by the
small electric force. Recent kinectic experiments indicate that there is a rather small
concentration window in which microdomain ordering by electric fields can effectively be
realized. This issue will be subject of a forthcoming publication27. The use of a PS-b-PHEMA
diblock copolymer as a model system, however, is not suitable, as PHEMA exhibits a very
strong surface interaction with the electrode material and its amphiphilic character leads to a
selective solubility in all low dielectric constant solvents, which would further complicate the
situation.
5.5. Conclusions
We have shown that block copolymer solutions can be aligned in DC electric fields during
solvent evaporation leading to highly anisotropic microdomain structures in the resulting
films. In comparison to melt alignment, the method presented here is applicable to polymers
with higher melt viscosities such as high molecular weight copolymers and copolymers of
more complex architecture, which cannot be aligned in the melt by virtue of electric fields.
Furthermore, we were able to describe the observed behavior by a quantitative estimate of
the electric energies involved in the alignment process. Our calculations predict the formation
of column-like protrusions during solvent evaporation and explain the higher degree of
orientation found in the columns as compared to the thinner parts of the films.
Future work will have to concentrate on a quantitative control of the solvent vapor pressure
during orientation of the domains. There should exist an optimum degree of swelling around

Chapter 5 Large Scale Domain Alignment
98
the order-disorder-concentration, which combines a maximum chain mobility with a
significant energetic difference between the different microdomain orientations. Keeping the
system at the respective vapor pressure (i.e. concentration of the polymer solution) for a
sufficient time should result in a significant improvement of the long-range order of the
microdomains.
AcknowledgementThe authors thank C. Drummer, A. Göpfert and S. Stangler for their skillful help with the
SEM, TEM and SAXS measurements, respectively. We thank M. Hund for his assistance
devising the capacitor setup. A.B. acknowledges helpful discussions with H. Schmalz and a
Kekulé fellowship by the Stiftung Stipendien-Fonds des Verbandes der Chemischen Industrie
and the German Bundesministerium für Bildung und Forschung (BMBF). This work was
carried out in the framework of the Sonderforschungsbereich 481 funded by the German
Science Foundation (DFG).

Chapter 5 Large Scale Domain Alignment
99
References
1 The results of this chapter have already been published: A. Böker, A. Knoll, H. Elbs, V.
Abetz, A.H.E. Müller, G. Krausch Macromolecules, 2002, 35, 1319-1325.
The contribution of A. Knoll consists of invaluable help with the calculations presented in
Figure 5-7. In addition, I have benefitted from many helpful discussions with H. Elbs during
start-up of this work.
2 Bates, F.S.; Fredrickson, G.H.; Ann. Rev. Phys. Chem. 1990, 41, 525.
3 Bates, F.S.; Frederickson, G.H.; Physics Today 1999, 52, 32.
4 Wiesner, U.; Macromol. Chem. Phys. 1997, 198, 3319.
5 Chen, Z.-R.; Kornfield, J.A.; Smith, S.D.; Grothaus, J.T.; Satkowski, M.M.; Science 1997,
277, 1248.
6 Chen, Z.-R.; Kornfield, J.A.; Polymer 1998, 39, 4679.
7 Keller, A.; Pedemonte, E.; Willmouth, F.M.; Nature 1970, 225, 538.
8 Albalak, R.J.; Thomas, E.L.; J. Polym. Sci., Polym. Phys. Ed. 1993, 31, 37.
9 Thurn-Albrecht, T.; Schotter, J.; Kastle, G.A.; Emley, N.; Shibauchi, T.; Krusin-Elbaum, L.;
Guarini, K.; Black, C.T.; Tuominen, M.T.; Russell, T.P.; Science 2000, 290, 2126.
10 Amundson, K.; Helfand, E.; Davis, D.D.; Quan, X.; Patel, S.S.; Smith, S.D.;
Macromolecules 1991, 24, 6546.
11 Amundson, K.; Helfand, E.; Quan, X.; Smith, S.D.; Macromolecules 1993, 26, 2698.
12 Morkved, T.L.; Lu, M.; Urbas, A.M.; Ehrichs, E.E.; Jaeger, H.M.; Mansky, P.; Russell,
T.P.; Science 1996, 273, 931.
13 Morkved, T.L.; Lopez, V.A.; Hahm, J.; Sibener, S.J.; Jaeger, H.M.; Polymer 1998, 39,
3871.
14 Mansky, P.; DeRouchey, J.; Russell, T.P.; Mays, J.; Pitsikalis, M.; Morkved, T.L.; Jaeger,
H.M.; Macromolecules 1998, 31, 4399.
15 Thurn-Albrecht, T.; DeRouchey, J.; Russell, T.P.; Jaeger, H.M.; Macromolecules 2000, 33,
3250.
16 Brandrup, J.; Immergut, E.H. Polymer Handbook; 3rd Ed.; Wiley Publisher: New York,
1991.
17 Thurn-Albrecht, T.; Steiner, R.; DeRouchey, J.; Stafford, C.M.; Huang, E.; Bal, M.;
Tuominen, M.; Hawker, C.J.; Russell, T.P.; Adv. Mat. 2000, 12, 787.
18 Le Meur, J.; Terrisse, J.; Schwab, C.; Goldzene, P.; J. Phys., Colloq. 1971, 32, C5a-301.

Chapter 5 Large Scale Domain Alignment
100
19 Serpico, J.M.; Wnek, G.E.; Krause, S.; Smith, T.W.; Luca, D.J.; van Laeken, A.;
Macromolecules 1992, 25, 6373.
20 Böker, A.; Müller, A.H.E.; Krausch, G.; Macromolecules 2001, 34, 7477.
21 C.C. Sawyer; D.T. Grubb; Polymer Microscopy, 2nd Ed.; Chapman & Hall: London, 1996.
22 Annighöfer, F.; Gronski, W.; Makromol. Chem., Rapid Commun. 1983, 4, 123.
23 Schäffer, E.; Thurn-Albrecht, T.; Russell, T.P.; Steiner, U.; Nature 2000, 403, 874.
24 Lin, Z.; Kerle, T.; Baker, S.M.; Hoagland, D.A.; Schäffer, E.; Steiner, U.; Russell, T.P.; J.
Chem. Phys. 2001, 14, 2377.
25 Amundson, K.; Helfand, E.; Quan, X.; Hudson, S.D.; Smith, S.D.; Macromolecules 1994,
27, 6559.
26 Yamaguchi, R.; Sato, S.; Jpn. J. Appl. Phys. 1994, 33, 4007.
27 Böker, A.; Elbs, H.; Hänsel, H.; Knoll, A; Zettl, H.; Urban, V.; Abetz, V.; Müller, A.H.E.;
Krausch, G. in preparation.

Chapter 6 Mechanisms of Electric Field Induced Alignment
101
Chapter 6
Microscopic Mechanisms of Electric Field
Induced Alignment of Block Copolymer
Microdomains1
Abstract
We investigate the microdomain orientation kinetics of concentrated block copolymer
solutions exposed to a DC electric field by time-resolved synchrotron small-angle X-ray
scattering (SAXS). As a model system, we use a lamellar polystyrene-b-polyisoprene block
copolymer dissolved in toluene. Our results indicate two different microscopic mechanisms,
i.e. domain boundary migration and grain rotation. The former dominates close to the order-
disorder transition, while the latter prevails under more strongly segregated conditions. The
orientation kinetics follows a single exponential behavior with characteristic time constants
varying from a few seconds to some minutes depending on polymer concentration,
temperature, electric field strength, and system size. From the experimental results we deduce
optimum conditions for the preparation of highly anisotropic bulk polymer samples via
solvent casting in the presence of an electric field.

Chapter 6 Mechanisms of Electric Field Induced Alignment
102
6.1. Introduction
Block copolymers composed of incompatible components self-assemble into microphase
separated domains usually leading to well-ordered structures on the mesoscale2,3. However, in
the absence of external fields typically an isotropic grain structure is obtained characterized
by a random distribution of microdomain orientations. It is well known from thin-film studies
that external interfaces can align the block copolymer morphology, given that the interface
selectively attracts one of the constituent blocks4,5. Usually, however, the influence of the
substrate on the alignment decays quite rapidly, i.e. after a few long periods a more or less
random orientation is observed as it is typical for the bulk state. In order to achieve large scale
alignment throughout a macroscopically large bulk sample, different techniques have been
devised in the past. Most prominently, external mechanical fields have been successfully
applied to orient block copolymer melts and solutions, e.g. large amplitude oscillatory shear
(LAOS)6 ,7,8, extrusion9 or roll-casting10.
In addition to mechanical fields, the potential of electric fields for microdomain alignment
has attracted increasing interest in the recent past as it may also have a considerable
technological potential 11. It has been shown that both lamellar and cylindrical microdomain
structures in polystyrene-b-poly(methyl methacrylate) (PS-b-PMMA) thin films could be
oriented by virtue of a DC electric field 12 - 18. These melt-based electric field procedures
suffer from severe limitations due to the high melt viscosities typical of high molecular
weight copolymers or copolymers of more complex architectures. In order to overcome these
limitations, one can try to align concentrated block copolymer solutions, where a non-
selective solvent is used to induce sufficient mobility. Following earlier investigations by Le
Meur et al.19 we recently investigated the microdomain alignment of an ABC triblock
copolymer during solvent casting in the presence of an external electric DC field20. After
drying, bulk samples of the material exhibited lamellar microdomains highly oriented parallel
to the electric field vector, as shown by small-angle X-ray scattering (SAXS) and
transmission electron microscopy (TEM).
In the present paper, we describe real-time synchrotron radiation small-angle X-ray
scattering (Synchrotron-SAXS) investigations aiming to follow the kinetics of electric field
induced microdomain reorientation in concentrated block copolymer solutions and thus to
elucidate the underlying microscopic mechanisms. As a model system, we investigate the
orientation behavior of a lamellae-forming polystyrene-b-polyisoprene diblock copolymer
dissolved in toluene. We discuss the influence of the polymer concentration, the electric field
strength, the temperature, and the system size on the reorientation behavior. We identify two

Chapter 6 Mechanisms of Electric Field Induced Alignment
103
different microscopic processes, grain boundary migration and grain rotation, which are
found to dominate the reorientation process in different regimes of block copolymer
concentration and temperature.
6.2. Experimental Section
6.2.1. Synthesis
A polystyrene-b-polyisoprene block copolymer (SI-80) with a total number-average
molecular weight Mn = 80 kg/mol was synthesized by sequential living anionic
polymerization as described in detail elsewhere21. The polymer used in this study consists of
52 wt.-% polystyrene and 48 wt.-% polyisoprene (92% 1,4-cis and 4% 1,2 and 3,4
microstructure). Gel permeation chromatography (GPC) of the final block copolymer yields a
polydispersity Mw/Mn = 1.02. The block ratio and overall molecular weight were determined
by 1H-NMR using the integrated aromatic signals of the polystyrene block in combination
with the GPC results of the corresponding polystyrene precursor.
V
X-ray
�
�
E 0°
90°
Figure 6-1: Experimental setup for in-situ SAXS.
6.2.2. Sample Preparation
Toluene solutions of the block copolymer with concentrations ranging from 30 - 80 wt.-%
were prepared. The alignment experiments were performed in a home built capacitor with
gold electrodes (sample depth = 5 mm, electrode distance d = 0.5, 1, 2, 4 mm) at temperatures
ranging from room temperature up to 80°C. A DC voltage between 0.5 kV and 6 kV was
applied across the capacitor resulting in a homogeneous electric field pointing perpendicular

Chapter 6 Mechanisms of Electric Field Induced Alignment
104
to the X-ray beam direction (Figure 6-1). Both the voltage at the electrodes and the current
through the sample were monitored during the course of the experiment. No leakage currents
were detected after the electric field was applied. The sample temperature was adjusted to
within �1 °C using Peltier elements.
6.2.3. Viscosity Measurements
The solution viscosity, �, at 1 rad/sec was measured for different polymer concentrations
using a Rheometrics Stress Rheometer SR-5000 with a plate-plate geometry (diameter: 25
mm). Time sweeps were performed and the final values are averages over at least three
independent measurements.
6.2.4. Synchrotron Small-Angle X-Ray Scattering
(Synchrotron-SAXS)
Synchrotron-SAXS measurements were performed at the ID02A beamline at the European
Synchrotron Radiation Facility (ESRF, Grenoble, France). The typical photon flux routinely
obtained at the ID02A sample position is 1013 photons/sec, corresponding to twice the full
width at half maximum beam size (0.2 mm)2 and energy bandwidth �E/E = 2x10⁻⁴. The
operating energy range was 12.5 keV, corresponding to a wavelength of 0.1 nm, at which the
highest photon flux is obtained. The direction of the X-ray beam (cross section: 200 �m) was
perpendicular to the direction of the applied electric field.
The detector system is housed in a 10 m evacuated flight tube. For most experiments an
image intensified CCD detector was used, which can handle the full X-ray flux. The CCD is
capable of acquiring up to 10 frames of 1024x1024 pixels per second and a sequence of 125
frames can be acquired with this time resolution. Prior to data analysis, background scattering
was subtracted from the data and corrections were made for spatial distortions and for the
detector efficiency.
6.2.5. Transmission Electron Microscopy (TEM)
Some of the samples were dried in the presence of the electric field. Subsequently, thin
sections were cut parallel to the electric field vector (far from any surface) using a Reichert-
Jung Ultracut E microtome equipped with a diamond knife. In order to enhance the electron
density contrast between polystyrene and polyisoprene, the sections were exposed to RuO4

Chapter 6 Mechanisms of Electric Field Induced Alignment
105
vapor for 45 minutes, which leads to a preferential staining of the polystyrene block22. Bright
field TEM was performed using a Zeiss electron microscope (CEM 902) operated at 80 kV.
6.2.6. Calculation of order parameters
As will become clear from the experimental observations described below, domain
alignment is induced by two competing external fields of different symmetry, i.e. the
interfacial field between polymer solution and the electrode surfaces and the electric field,
respectively. To quantify the microdomain alignment, we calculate the order parameter P2 by
integrating the scattering intensity Iq(�) over the azimuthal angle ��from � = 0° to 360°:
2
1cos3 2
2
�
�
�
P Equation 6-1
with
� �
� ��
�
�
��
�
�
�
���
����
�2
0
2
0
2
2
)sin()(
)sin()(cos)(
cos
q
q
Id
IdEquation 6-2
Depending on the type of alignment, two different ranges of the order parameter exist. For
lamellar alignment parallel to the electrodes (maximum scattering intensity at � = 0°), P2
ranges from 0 to 1 with P2 = 1 corresponding to perfect lamellar alignment parallel to the
electrodes. For an alignment of the lamellae along the field direction (maximum scattering
intensity at � = 90°), P2 ranges from 0 to – 0.5 with P2 = - 0.5 corresponding to the case
where all lamellae are aligned parallel to the field, however, with the lamella normals being
isotropically oriented in the plane of the electrodes.
In order to quantify the orientation kinetics, the orientational order parameter P2 was
calculated for each single scattering pattern acquired during the course of the experiment. The
behavior of P2 as a function of time t could be fitted by a single exponential as described by:
P2(t) = P2, + (P2,0 - P2, ) e-t/�Equation 6-3
with P2,0 and P2, being the limiting values of the order parameter before application of the
electric field and at late times, respectively, and � being the time constant.
The reminder of the paper is organized as follows. We shall first describe the structure
formation in solution and its properties before we continue discussing the influence of an

Chapter 6 Mechanisms of Electric Field Induced Alignment
106
external electric field on the domain orientation of solutions of different concentrations, at
different electric field strengths, and at different temperatures. We will end the discussion by
showing how our results can be used to generate well aligned block copolymer bulk samples.
0.0 0.1 0.2 0.3 0.4 0.5 0.6
Inte
nsi
ty [a
.u.]
q [nm-1]
Figure 6-2: Scattering intensity profiles at various concentrations.34 wt.-% (�), 35 wt.-% (�), 50 wt.-% (�), 70 wt.-% (�).
6.3. Results
6.3.1. Concentration Dependence of Structure Formation
Before we discuss the effects of external electric fields on the PS-b-PI block copolymer
domains, we first concentrate on the microdomain structure formed in solution in the absence
of an electric field. Toluene was chosen as it is a fairly non-selective solvent for PS and PI23.
The Flory-Huggins interaction parameters between the two polymers and toluene are
�PS/Tol = 0.44 and �PI/Tol = 0.40, respectively24. As anticipated from previous investigations on
concentrated solutions of symmetric PS-b-PI block copolymers in toluene25, we observe the
evolution of a lamellar microstructure with increasing concentration as shown in Figure 6-2.
Above a polymer concentration of wp = 34 wt.-%, the system exhibits higher order Bragg
peaks appearing at integer multiples of the first order maximum. The lamellar spacing
d100 = 2�/q100* increases with increasing polymer concentration, despite increasing
deswelling, indicating that the segregation power continuously increases as the solvent
content decreases (Figure 6-3). The dependence of the lamellar spacing d on the polymer
volume fraction �p scales as d ~ �p 0.30 ± 0.01 for intermediate concentrations (see the double
logarithmic plot in Figure 6-4). We also note, that the lamellar spacing of the bulk sample

Chapter 6 Mechanisms of Electric Field Induced Alignment
107
(wp�� 100 wt.-%) is much lower than expected by extrapolation. The above described
observations are in agreement with previous investigations by Shibayama et al.25.
30 40 50 60 70 80 90 100
36
38
40
42
44
46
48
50
wp [wt.-%]
35 wt.-%
d [n
m]
Figure 6-3: Concentration dependence of the lamellar spacing of PS-b-PI solutions in toluene(dbulk = 42.5 nm).
Above wp�� 34 wt.-% we observe a significant increase in scattering intensity. Moreover,
we observe a distinct drop in d as the polymer concentration falls below 35 wt.-% (see arrow
in Figure 6-3). In addition, optical birefringence, measured using crossed polarizers,
disappears below wp�� 35 wt.-%, and no anisotropic scattering patterns were observed below
wp�� 35 wt.-%, neither in the presence nor in the absence of the electric field (see below). We
therefore locate the order-disorder transition at room temperature between 34 and 35 wt.-%.
0.31 0.35 0.38 0.42 0.46 0.50
37.5
39.3
41.1
42.9
44.6
d [n
m]
�P
Figure 6-4: Double logarithmic plot of dependence of lamellar spacing on the volume fraction of polymer�P (d ~ �p
0.30 ± 0.01).
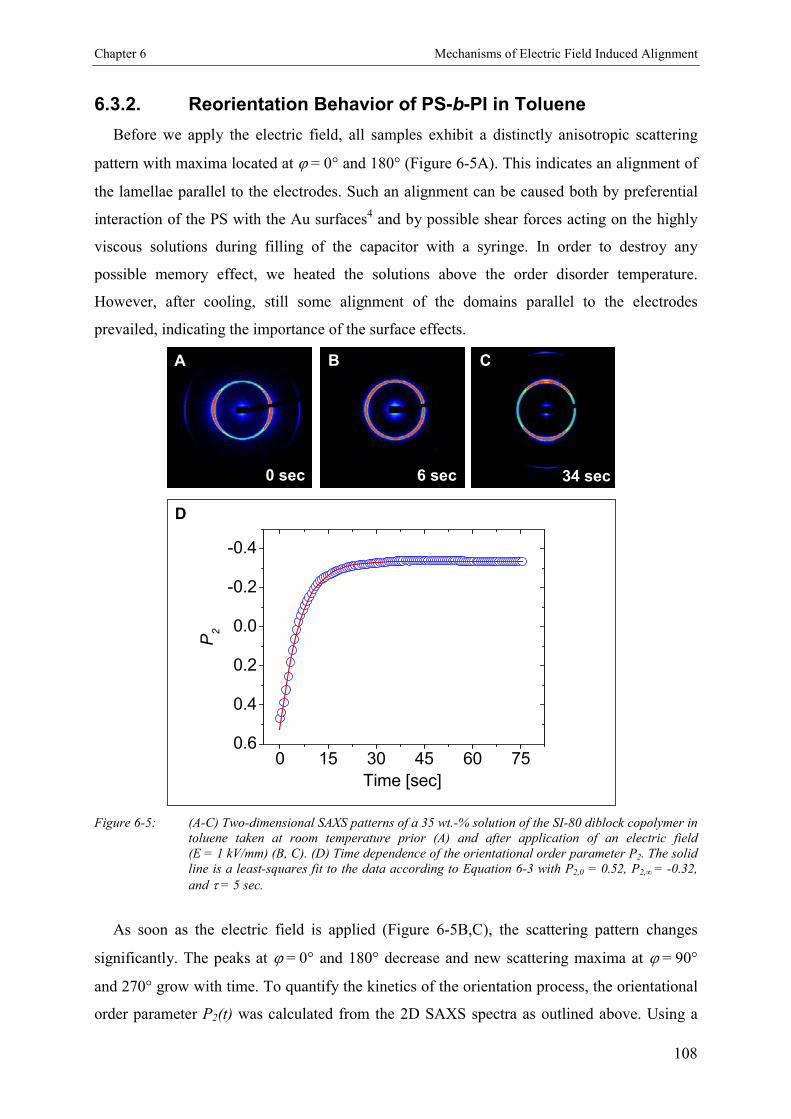
Chapter 6 Mechanisms of Electric Field Induced Alignment
108
6.3.2. Reorientation Behavior of PS-b-PI in Toluene
Before we apply the electric field, all samples exhibit a distinctly anisotropic scattering
pattern with maxima located at � = 0° and 180° (Figure 6-5A). This indicates an alignment of
the lamellae parallel to the electrodes. Such an alignment can be caused both by preferential
interaction of the PS with the Au surfaces4 and by possible shear forces acting on the highly
viscous solutions during filling of the capacitor with a syringe. In order to destroy any
possible memory effect, we heated the solutions above the order disorder temperature.
However, after cooling, still some alignment of the domains parallel to the electrodes
prevailed, indicating the importance of the surface effects.
0 15 30 45 60 750.6
0.4
0.2
0.0
-0.2
-0.4
Time [sec]
P 2
D
A
0 sec 34 sec6 sec
B C
Figure 6-5: (A-C) Two-dimensional SAXS patterns of a 35 wt.-% solution of the SI-80 diblock copolymer intoluene taken at room temperature prior (A) and after application of an electric field(E = 1 kV/mm) (B, C). (D) Time dependence of the orientational order parameter P2. The solidline is a least-squares fit to the data according to Equation 6-3 with P2,0 = 0.52, P2, = -0.32,and � = 5 sec.
As soon as the electric field is applied (Figure 6-5B,C), the scattering pattern changes
significantly. The peaks at � = 0° and 180° decrease and new scattering maxima at � = 90°
and 270° grow with time. To quantify the kinetics of the orientation process, the orientational
order parameter P2(t) was calculated from the 2D SAXS spectra as outlined above. Using a

Chapter 6 Mechanisms of Electric Field Induced Alignment
109
single exponential fit, we can determine the time constant of the reorientation process (Figure
6-5D).
6.3.3. Kinetics and Mechanism of Microphase Orientation
6.3.3.1. Concentration dependence
We studied the reorientation kinetics as a function of polymer concentration, starting from
wp�= 30 wt.-% and increasing wp �stepwise by 1 wt.-% up to 35 wt.-% and then by steps of
2.5 wt.-% to higher polymer concentrations. The electric field strength E was kept constant at
E = 1 kV/mm at a capacitor spacing of 2 mm. The isotropic scattering pattern observed at
polymer concentrations at and below wp�= 34 wt.-% did not change by the electric field.
Above wp�= 34 wt.-%, the scattering patterns changed similar to the behavior shown in Figure
6-5 and time constants �(wp) were determined from the evolution of P2 with time as shown in
Figure 6-6. Above wp�= 50 wt.-%, however, the reorientation process became rather slow
(time constant in the order of some 5 minutes) due to the high solution viscosities. We
therefore limited our study to polymer concentrations between 34.5 and 50 wt.-%.
0 200 400 600 800 1000 1200
0.6
0.4
0.2
0.0
-0.2
-0.4
0 5 10 15 20
0.6
0.4
0.2
0.0
-0.2
-0.4
Time [sec]
P 2
Figure 6-6: Evolution of orientational order parameter P2 with time for different concentrations at2 kV/2 mm (� = 34.5 wt.-%, � = 37.5 wt.-%, � = 42.5 wt.-%, � = 50 wt.-%).
The result of this procedure is shown in Figure 6-7. As anticipated from the solution
viscosities, the time constant � strongly increases with increasing polymer concentration. The
results of the exponential fits are summarized in Table 6-1. The single exponential fit works
quite well for all concentrations studied, as can be seen from the low �2 values. The time
constants, �, vary from the very fast process at 34.5 wt.-% (� = 0.8 sec) to more than 3
minutes (� = 192 sec) for the 50 wt.-% solution. In addition, within some 10% scatter P2

Chapter 6 Mechanisms of Electric Field Induced Alignment
110
reaches about the same limiting values P2, = -0.3 � 0.03 independent of polymer
concentration. Therefore, we can conclude that the polymer concentration only influences the
rate of orientation but not the final degree of orientation.
30 35 40 45 50 550
50
100
150
200� [sec]
wp [wt.-%]
Figure 6-7: Concentration dependence of time constant ��
Interestingly, the microscopic mechanism of microdomain reorientation seems to change
as the polymer concentration is increased.
0 30 60 90 120 1500
90
180
270
360
Time [sec]
� [°]
A
0 150 300 450 600 750 9000
90
180
270
360
Time [sec]
� [
°]
B
Figure 6-8: Azimuthal angular dependence of the scattering intensity for different concentrations at2 kV/2 mm. (A) 35 wt.-%, (B) 50 wt.-%.
In Figure 6-8, we compare the time dependence of the scattering patterns for the limiting
polymer concentrations, wp�= 35 wt.-% and wp�= 50 wt.-%. For the low concentration (Figure
6-8A) the initial peaks at � = 0° and 180° almost vanish as the electric field is applied and
new peaks are formed at � = 90° and 270°, the intensity of which grows with time. For high
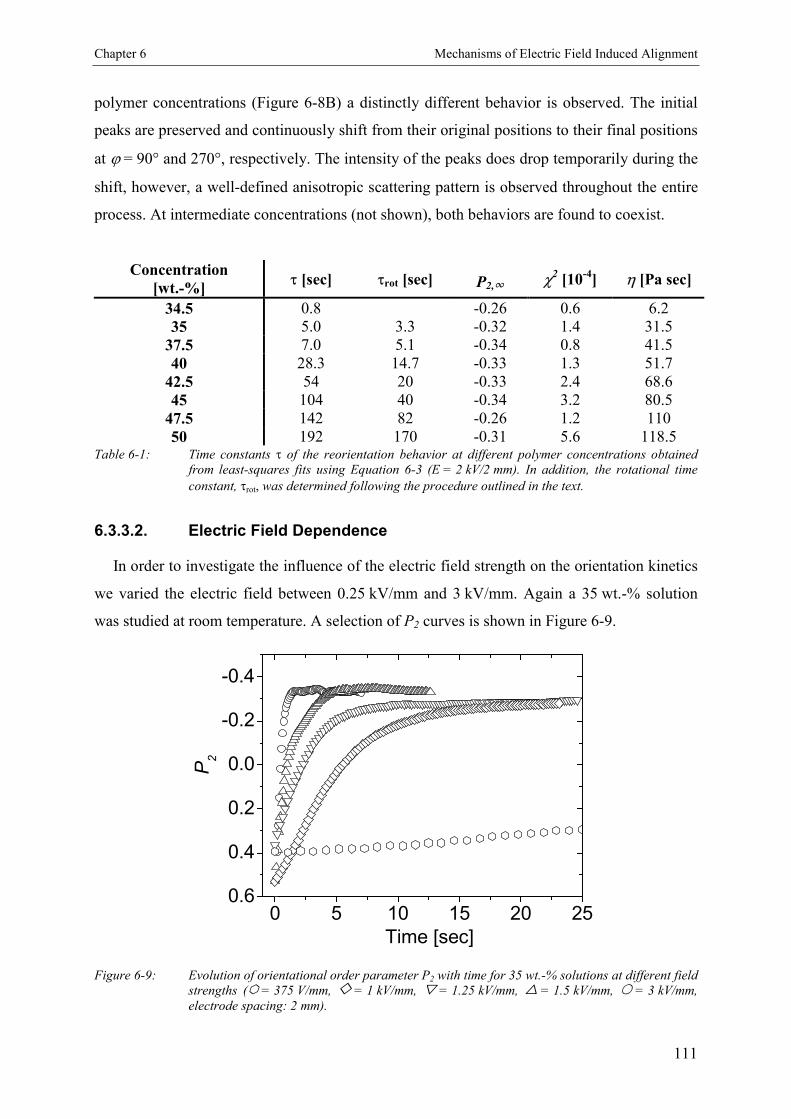
Chapter 6 Mechanisms of Electric Field Induced Alignment
111
polymer concentrations (Figure 6-8B) a distinctly different behavior is observed. The initial
peaks are preserved and continuously shift from their original positions to their final positions
at � = 90° and 270°, respectively. The intensity of the peaks does drop temporarily during the
shift, however, a well-defined anisotropic scattering pattern is observed throughout the entire
process. At intermediate concentrations (not shown), both behaviors are found to coexist.
Concentration[wt.-%]
� [sec] �rot [sec] P2, �
2 [10-4] � [Pa sec]
34.5 0.8 -0.26 0.6 6.235 5.0 3.3 -0.32 1.4 31.5
37.5 7.0 5.1 -0.34 0.8 41.540 28.3 14.7 -0.33 1.3 51.7
42.5 54 20 -0.33 2.4 68.645 104 40 -0.34 3.2 80.5
47.5 142 82 -0.26 1.2 11050 192 170 -0.31 5.6 118.5
Table 6-1: Time constants � of the reorientation behavior at different polymer concentrations obtainedfrom least-squares fits using Equation 6-3 (E = 2 kV/2 mm). In addition, the rotational timeconstant, �rot, was determined following the procedure outlined in the text.
6.3.3.2. Electric Field Dependence
In order to investigate the influence of the electric field strength on the orientation kinetics
we varied the electric field between 0.25 kV/mm and 3 kV/mm. Again a 35 wt.-% solution
was studied at room temperature. A selection of P2 curves is shown in Figure 6-9.
0 5 10 15 20 250.6
0.4
0.2
0.0
-0.2
-0.4
Time [sec]
P 2
Figure 6-9: Evolution of orientational order parameter P2 with time for 35 wt.-% solutions at different fieldstrengths ( = 375 V/mm, = 1 kV/mm, � = 1.25 kV/mm, � = 1.5 kV/mm, � = 3 kV/mm,electrode spacing: 2 mm).

Chapter 6 Mechanisms of Electric Field Induced Alignment
112
Voltage [kV/mm] � [sec] P2, �
2 [10-4]
0.25 (a) (a) (a)0.375 100.1 -0.26 4.3
0.5 15.5 -0.32 2.30.75 8.3 -0.31 0.4
1 5.0 -0.32 1.41.25 2.5 -0.29 0.31.5 1.2 -0.34 1.8
1.75 0.90 -0.32 1.52 0.56 -0.29 4.2
2.25 0.48 -0.33 42.5 0.40 -0.35 3.83 0.34 -0.34 3.7
Table 6-2: Time constants of the reorientation behavior at different electric field strength obtained fromleast-squares fits using Equation 6-3 (wp = 35 wt.-%, electrode spacing: 2 mm).(a) no electric field induced reorientation observed.
The results of the fitting procedure are summarized in Table 6-2 and shown in Figure 6-10.
The quality of the single exponential fits can be inferred from the low �2 values. Independent
of the electric field strength, the limiting values P2, always reach a value around P2, = -0.3
within a scatter of some 10%.
0.0 0.5 1.0 1.5 2.0 2.5 3.0
0
20
40
60
80
100
E [kV/mm]
� [sec]
Figure 6-10: Electric field dependence of time constant for 35 wt.-% solutions (electrode spacing: 2 mm).
The solid line represents a least-squares fit to the power law � = �(E - Et)a + � to the data
points.
The time constants ��range from 100 sec for low electric fields (0.375 kV/mm) to as low as
0.34 sec for the highest field strength (3 kV/mm). On the time scale of our experiment, we
were not able to detect any reorientation for electric fields below 0.375 kV/mm. We may
therefore conclude that there exists a threshold field strength Et between 0.25 kV/mm and

Chapter 6 Mechanisms of Electric Field Induced Alignment
113
0.375 kV/mm, below which no field induced reorientation is possible. Above Et, the
dependence of the time constant on the electric field reveals a power law dependence
� = �(E - Et)a + � . The data points are best fitted for � = 0.2 sec a = -1, Et = 350 V/mm and
� = 0 sec (solid line in Figure 6-10).
6.3.3.3. Temperature Dependence
In order to investigate the temperature dependence of the reorientation process, a
47.5 wt.-% solution was studied between 27.3°C and 80°C. The rather high polymer
concentration was chosen to access a large temperature range before reaching the order-
disorder transition temperature (TODT) of the solution.
0 75 150 225 300 3750
90
180
270
360
Time [sec]
� [°]
A
0 75 150 225 300 3750
90
180
270
360
Time [sec]
� [°]
A
0 100 200 300 4000
90
180
270
360�
[°]
Time [sec]
B
0 100 200 300 4000
90
180
270
360�
[°]
Time [sec]
B
0 15 30 45 60 75 900
90
180
270
360
� [°]
Time [sec]
C
0 15 30 45 60 75 900
90
180
270
360
� [°]
Time [sec]
C
Figure 6-11: Azimuthal angular dependence of the scattering intensity for different temperatures at2 kV/2 mm. (A) 27.3°C, (B) 51.5°C, (C) 80°C.
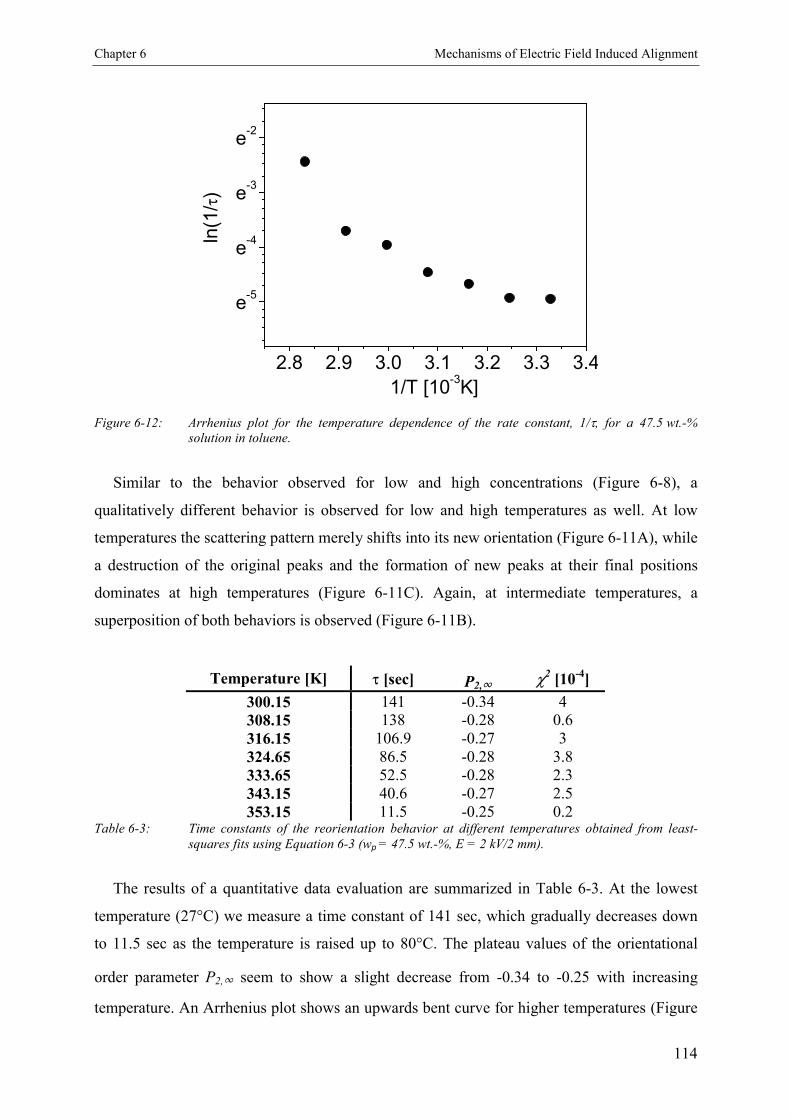
Chapter 6 Mechanisms of Electric Field Induced Alignment
114
2.8 2.9 3.0 3.1 3.2 3.3 3.4
e-5
e-4
e-3
e-2
ln(1
/�)
1/T [10-3K]
Figure 6-12: Arrhenius plot for the temperature dependence of the rate constant, 1/�, for a 47.5 wt.-%solution in toluene.
Similar to the behavior observed for low and high concentrations (Figure 6-8), a
qualitatively different behavior is observed for low and high temperatures as well. At low
temperatures the scattering pattern merely shifts into its new orientation (Figure 6-11A), while
a destruction of the original peaks and the formation of new peaks at their final positions
dominates at high temperatures (Figure 6-11C). Again, at intermediate temperatures, a
superposition of both behaviors is observed (Figure 6-11B).
Temperature [K] � [sec] P2, �
2 [10-4]
300.15 141 -0.34 4308.15 138 -0.28 0.6316.15 106.9 -0.27 3324.65 86.5 -0.28 3.8333.65 52.5 -0.28 2.3343.15 40.6 -0.27 2.5353.15 11.5 -0.25 0.2
Table 6-3: Time constants of the reorientation behavior at different temperatures obtained from least-squares fits using Equation 6-3 (wp = 47.5 wt.-%, E = 2 kV/2 mm).
The results of a quantitative data evaluation are summarized in Table 6-3. At the lowest
temperature (27°C) we measure a time constant of 141 sec, which gradually decreases down
to 11.5 sec as the temperature is raised up to 80°C. The plateau values of the orientational
order parameter P2, seem to show a slight decrease from -0.34 to -0.25 with increasing
temperature. An Arrhenius plot shows an upwards bent curve for higher temperatures (Figure

Chapter 6 Mechanisms of Electric Field Induced Alignment
115
6-12). This behavior is typical for a process, which changes mechanism depending on the
temperature. From the data, we can calculate two apparent activation energies, Ea,app, for the
lower and higher temperature region, yielding 27 kJ/mol and 130 kJ/mol, respectively.
6.4. Discussion
6.4.1. Structure Formation in Solution
We start our discussion with the observed behavior in the absence of the electric field. As
briefly indicated above, we locate the order disorder transition (wODT) at room temperature at
a polymer concentration between 34 and 35 wt.-%. This assignment is based on various
experimental observations. Most convincingly, we note the absence of birefringence at and
below wp�= 34 wt.-%. It has been shown both experimentally and theoretically that phase
separated (ordered) block copolymer materials consisting of randomly oriented lamellae are
birefringent26,27,28. The lack of birefringence thus indicates the absence of randomly oriented
lamellae. From the SAXS experiments, we find an increase in scattering intensity above
wp�= 34.5 wt.-%, accompanied by a sharpening of the signal and the evolution of higher order
Bragg peaks. Additional evidence is given by the fact that only starting from 34.5 wt.-% we
observe an anisotropic scattering pattern in the absence of the electric field, which indicates
some microdomain alignment induced either by shear (during filling of the sample chamber)
or by preferential attraction of one block to the electrode surface. We note that the peak in the
scattering profile at and below 34 wt.-% is due to composition fluctuations found commonly
in the disordered state (correlation hole).
We may compare our result on the wODT to earlier measurements on similar systems (SI in
toluene solution). Yao et al. determined the wODT of a symmetrical PS-b-PI block copolymer
(Mw = 84000g/mol) in toluene solution by dielectric measurements and found a critical
concentration between 25 and 28 wt.-% at 273 K29. As our measurements have been
conducted at room temperature (~ 298 K), it is reasonable that we find a somewhat higher
concentration. Sakamoto et al. determined the wODT for a symmetrical SI block copolymer of
higher molecular weight to be around 22 wt.-% and estimated the wODT for the Yao-system to
be around 31 wt.-% at room temperature30. Both results compare well with our finding.
The lamellar spacing d was determined from the first order scattering maxima. It increases
with increasing polymer concentration, indicating an increasing segregation power (or
repulsive interactions) between the PS and PI chains as the polymer concentration increases.

Chapter 6 Mechanisms of Electric Field Induced Alignment
116
The fact that the bulk lamellar spacing is significantly smaller than the extrapolated value
from the solutions can be explained by the formation of a non-equilibrium structure during the
solvent casting process. As the concentration of the solution increases, the Tg reaches room
temperature and the viscosity of the whole system increases significantly. Therefore, the
modulus of the whole system becomes high, so that deformation of grains requires a
prolonged equilibration time, i.e. the displacement of the chemical junction points of the
blocks, which is required for an increase in domain spacing, is hindered. This “frozen”
domain structure is incapable of reaching an equilibrium at time scales smaller than the rate of
solvent evaporation. Therefore, further evaporation of solvent results in a decrease of the
spacing merely by a deswelling effect. Thus, in the high concentration regime the domain
spacing is kinetically, but not thermodynamically controlled.
The dependence of d on polymer concentration in the intermediate concentration regime
can be described by a scaling relation d ~ �P0.3. This behavior compares well with previous
investigations by Shibayama et al.25 who observed a d ~ �P1/3 dependence. In contrast, based
on a theory by Noolandi and Hong31, a d ~ �P1/6 relationship was predicted for the strong
segregation limit32. Leibler and Frederickson predicted a d ~ �P-0.12 behavior for the weak
segregation limit in block copolymer solutions33. In the light of these predictions, we may
conclude that the positive exponent found in our experiments indicates that our system falls
into the strong segregation limit. This assignment is corroborated by the observation that the
polymer chains are significantly stretched in our system. This is found from a comparison of
the lamellar half-width d/2 (some 19 nm and higher) to the unperturbed dimension of the
block copolymer chains (approximately 2Rg� 9 nm).
6.4.2. Mechanism of Domain Alignment
One of the most important aspects for the understanding of the reorientation behavior of
block copolymer microdomains in solution is the knowledge of the underlying mechanisms
contributing to the rearrangement of domains. In contrast to in-situ birefringence8,34, in-situ
SANS28,35 and ex-situ SAXS36,37,38 measurements on block copolymer melts and solutions
under shear, which lead to detailed insight into the respective mechanisms, so far only little is
known about the microscopic processes during electric field alignment. Synchrotron-SAXS
combines the advantages of birefringence (high time resolution) with the detailed and
straightforward information about the microscopic order characteristic of scattering methods.
Indeed, the SAXS data indicate two distinctly different mechanisms of microdomain
reorientation. At low concentrations and high temperatures (Figure 6-8A, Figure 6-11C), a
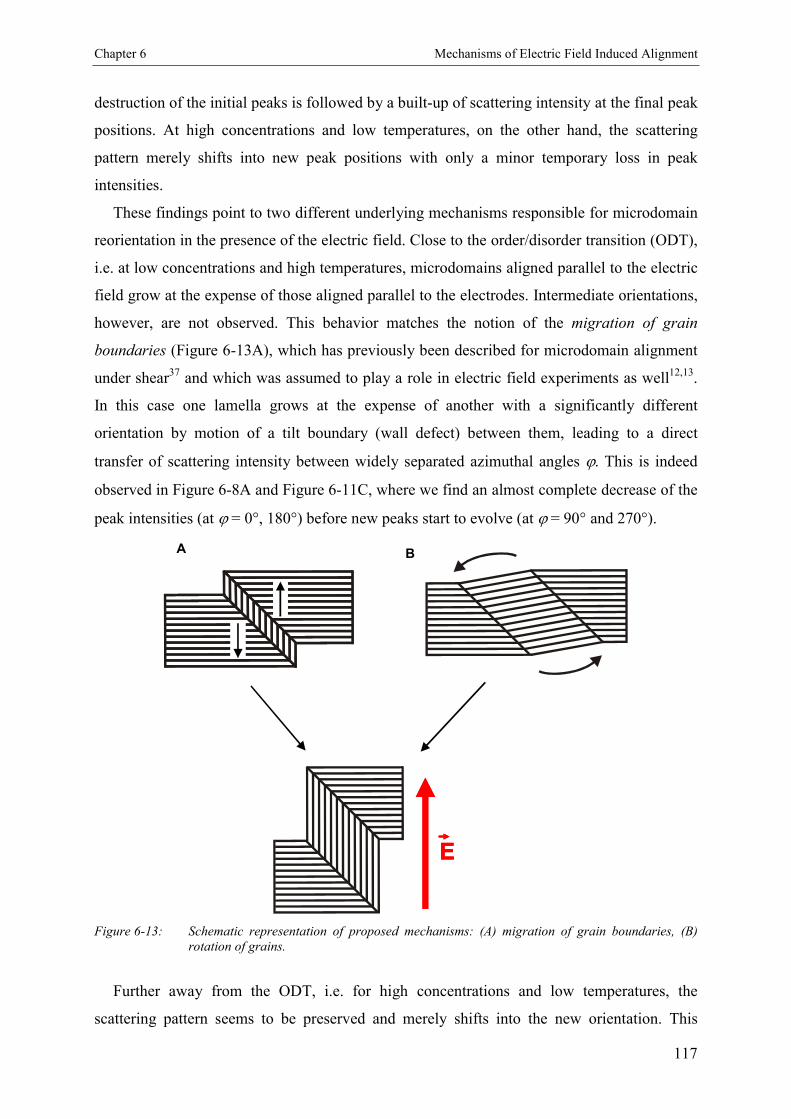
Chapter 6 Mechanisms of Electric Field Induced Alignment
117
destruction of the initial peaks is followed by a built-up of scattering intensity at the final peak
positions. At high concentrations and low temperatures, on the other hand, the scattering
pattern merely shifts into new peak positions with only a minor temporary loss in peak
intensities.
These findings point to two different underlying mechanisms responsible for microdomain
reorientation in the presence of the electric field. Close to the order/disorder transition (ODT),
i.e. at low concentrations and high temperatures, microdomains aligned parallel to the electric
field grow at the expense of those aligned parallel to the electrodes. Intermediate orientations,
however, are not observed. This behavior matches the notion of the migration of grain
boundaries (Figure 6-13A), which has previously been described for microdomain alignment
under shear37 and which was assumed to play a role in electric field experiments as well12,13.
In this case one lamella grows at the expense of another with a significantly different
orientation by motion of a tilt boundary (wall defect) between them, leading to a direct
transfer of scattering intensity between widely separated azimuthal angles �. This is indeed
observed in Figure 6-8A and Figure 6-11C, where we find an almost complete decrease of the
peak intensities (at � = 0°, 180°) before new peaks start to evolve (at � = 90° and 270°).
A B
EEE
Figure 6-13: Schematic representation of proposed mechanisms: (A) migration of grain boundaries, (B)rotation of grains.
Further away from the ODT, i.e. for high concentrations and low temperatures, the
scattering pattern seems to be preserved and merely shifts into the new orientation. This
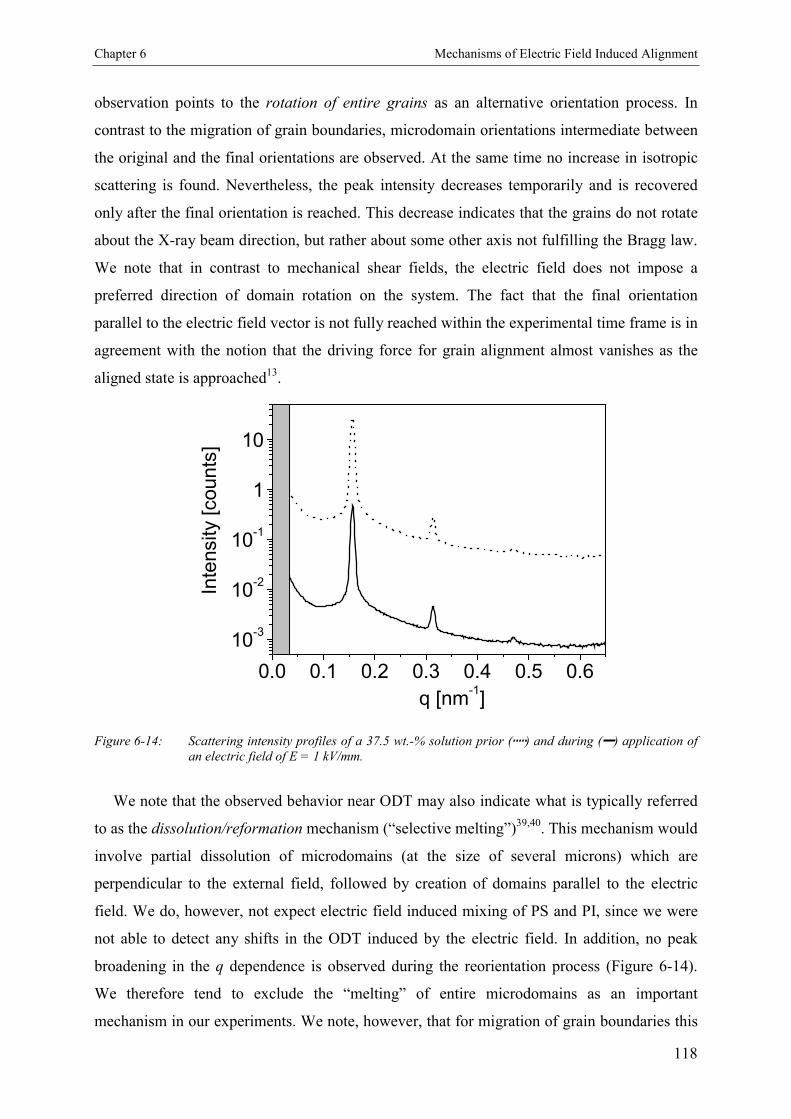
Chapter 6 Mechanisms of Electric Field Induced Alignment
118
observation points to the rotation of entire grains as an alternative orientation process. In
contrast to the migration of grain boundaries, microdomain orientations intermediate between
the original and the final orientations are observed. At the same time no increase in isotropic
scattering is found. Nevertheless, the peak intensity decreases temporarily and is recovered
only after the final orientation is reached. This decrease indicates that the grains do not rotate
about the X-ray beam direction, but rather about some other axis not fulfilling the Bragg law.
We note that in contrast to mechanical shear fields, the electric field does not impose a
preferred direction of domain rotation on the system. The fact that the final orientation
parallel to the electric field vector is not fully reached within the experimental time frame is in
agreement with the notion that the driving force for grain alignment almost vanishes as the
aligned state is approached13.
0.0 0.1 0.2 0.3 0.4 0.5 0.6
10-3
10-2
10-1
1
10
Inte
nsity
[counts
]
q [nm-1]
Figure 6-14: Scattering intensity profiles of a 37.5 wt.-% solution prior (�) and during (�) application ofan electric field of E = 1 kV/mm.
We note that the observed behavior near ODT may also indicate what is typically referred
to as the dissolution/reformation mechanism (“selective melting”)39,40. This mechanism would
involve partial dissolution of microdomains (at the size of several microns) which are
perpendicular to the external field, followed by creation of domains parallel to the electric
field. We do, however, not expect electric field induced mixing of PS and PI, since we were
not able to detect any shifts in the ODT induced by the electric field. In addition, no peak
broadening in the q dependence is observed during the reorientation process (Figure 6-14).
We therefore tend to exclude the “melting” of entire microdomains as an important
mechanism in our experiments. We note, however, that for migration of grain boundaries this

Chapter 6 Mechanisms of Electric Field Induced Alignment
119
process may play a role on a molecular level, as in principle single chain motion is sufficient
to stepwise change the orientation of large areas along a wall defect (“molecular scale
reorientation” or “molecular scale dissolution/reformation”).
EEE
A
DC
E
0 90 180 270 360
P2 = -0.30
Inte
nsi
ty [a.u
.]� [°]
B
Figure 6-15: SAXS and TEM data of a bulk sample prepared from a 40 wt.-% solution of SI-80 in toluenedried under an applied electric field of 1 kV/mm. The arrows indicate the direction of theelectric field vector. (A) 2D-SAXS pattern and (B) azimuthal intensity distribution at first orderreflection (P2 = -0.34). The TEM pictures show a defect free domain (C) and characteristickink band defects (D/E). The scale bars represent 400 nm.
Our mechanistic model is further corroborated by typical defects, so called “kink bands”
(Figure 6-15D) , which are characteristic of the above described mechanisms and have been
identified in similar processes during shear-induced lamellar reorientation37. Figure 6-15E
shows the annihilation of a kink band by rotation of the defect structure.

Chapter 6 Mechanisms of Electric Field Induced Alignment
120
We note that in most of our experiments both migration of grain boundaries and grain
rotation seem to contribute to microdomain reorientation. One process dominates the other
depending on the degree of segregation (i.e. in a certain concentration or temperature regime).
An example for an intermediate regime is shown in Figure 6-11B, where we clearly observe
the coexistence of both mechanisms. The decrease in intensity of the initial orientation is
accompanied by the development of a shoulder which results in a new peak. This new signal
shifts to the position of the final orientation (� = 90° and 270°) and increases at the expense of
the remaining intensities at the starting orientation (� = 0° and 180°).
0 250 500 750 1000 1250
0
15
30
45
60
75
90 A
�� [°]
Time [sec]
25 50 75 100
1
10
102
B
�
rot [
sec]
� [Pa sec]
Figure 6-16: (A) Angular shift of rotational component at different concentrations (� = 35 wt.-%,� = 47.5 wt.-%, � = 50 wt.-%) at a field strength of E = 1 kV/mm at T = 25 °C . The solidlines represent the least-squares fits to the data yielding the rotational time constant, �rot; (B)Double logarithmic plot of �rot versus solution viscosity, � (�rot � �
2.85 � 0.22).

Chapter 6 Mechanisms of Electric Field Induced Alignment
121
In order to separately access the kinetics of the two different microscopic reordering
mechanisms, we model the azimuthal scattering intensity around � = 180° by two Gaussians,
one fixed at the initial peak position and the other being allowed to shift towards the final
position as a function of time. We reveal the respective peak intensities and the position �� of
the maximum of the shifting peak from least-squares fits to the experimental data. The data
for the position of the shifting peak, ��, versus time for different copolymer concentrations
(not shown) can again be fitted by a single exponential yielding an effective rotational time
constant, rot. With these data we can establish a relation between the (microscopic) rotational
time constant, rot, and the (macroscopic) viscosity, �,�of our block copolymer solutions
(Table 6-1). A double logarithmic plot of rot versus � (at 1 rad/s) (Figure 6-16B) yields a
straight line with a slope of 2.85 � 0.22 indicating a power law behavior rot �2.85 � 0.22.
If one considers the macroscopic viscosity dependence on the polymer concentration we
find a typical behavior41 as � c3.8. Obviously, the microscopic viscous properties of our
system differ significantly from the macroscopic viscous response. Therefore, once the
challenge of modeling the relationship between rot and � has been resolved, the
determination of the rotational time constant, rot, might yield valuable insight into the
microscopic properties of our system, i.e. information about viscous responses on the length
scale of grain sizes ranging from a few to some hundred microns.
At this point we conclude that we are able to get detailed insight into the prevailing
orientation mechanisms for lamellar domain alignment in block copolymer solutions by virtue
of an external electric field. With increasing segregation power (i.e. increasing
concentration/decreasing temperature, � �P, � 1/T) we observe a transition from
orientation by migration of grain boundaries to orientation by grain rotation. Intermediate
conditions indicate the simultaneous action of both processes. In addition, we are able to
separate both processes by a simple fitting procedure.
The transition from grain rotation to migration of grain boundaries when approaching
ODT can be explained by the fact that at high concentrations and low temperatures, i.e. in a
strongly segregated system, grain boundaries are thermodynamically unfavorable. Therefore,
larger grains are formed which exceed a certain critical size, so that they can be rotated
effectively by the electric field, which has already been anticipated for diblock copolymer
melt systems12. At low concentrations and high temperatures, i.e. in a weakly segregated
system, the energetic penalty for the creation of boundary interfaces is much lower.
Furthermore, close to ODT, we also expect a high defect density and a high mobility of

Chapter 6 Mechanisms of Electric Field Induced Alignment
122
defects. The vast majority of grains formed are obviously not large enough to be rotated by
the electric field. Polarizing optical microscopy of block copolymer solutions of different
concentration yields a broad distribution of grain sizes ranging from a few to some hundred
microns (for example see Figure 6-17 which shows the evolution of birefringent domains
during electric field-induced orientation of the lamellae). On the other hand, the mobility of
defects such as grain boundaries (wall defects) is large, which allows the system to orient its
domains parallel to the electric field by single chain based migration of grain boundaries.
A B
C D
E
Figure 6-17: Polarizing optical micrographs of a 40 wt.-% solution of SI-80 in toluene between two ITOcovered glass slides (d = 2mm) at 4 kV. (A) prior to electric field, (B) after 1 min, (C) 2 min,(D) 3 min and (E) 5 min. The viewing direction is parallel to the electric field vector. The scalebar represents 200 �m.
Chapter 6 Mechanisms of Electric Field Induced Alignment
123
6.4.3. Kinetics of Microphase Orientation
For the effective preparation of highly anisotropic melt block copolymer samples via
solvent casting in the presence of an external electric field, it is important to find an optimum
set of parameters (e.g. degree of swelling of the block copolymer domains, electric field
strength and temperature), which combines a maximum chain mobility (i.e. fast kinetics) with
the highest possible polymer concentration. In short, the reorientation process should be faster
than the rate of solvent evaporation during preparation of bulk samples from solution, i.e. it
should be completed before the bulk structure “freezes”.
6.4.3.1. Concentration Dependence
With increasing polymer concentration the time constant � increases as can be seen in
Figure 6-7 and Table 6-1. Simultaneously we also observe an increase in viscosity of the
respective systems. The viscosity only influences the kinetics but not the final degree of order
(P2, ), which is consistent with previous dielectric relaxation spectroscopy measurements on
the realignment of a side-chain liquid crystalline polymer in its liquid-crystalline state induced
by a DC electric field42.
Furthermore, it is interesting to investigate the kinetics in the region of the order-disorder
concentration. Below the wODT we do not observe any interaction of the polymer solution and
the electric field. This can be explained by the fact that at this concentration the system is not
yet microphase separated. Long range order is absent and only correlation hole scattering
contributes to the SAXS pattern (Figure 6-2). As has been pointed out by Amundson in a
recent review article43, an organized state with long-range order is required for an anisotropic
microstructure to be induced by the electric field. As soon as the order-disorder concentration
(wODT) is reached, small grains are created from various nucleation centers and finally form a
polydomain structure, which at low concentrations orients by migration of grain boundaries.
From the mechanistic considerations in the previous section we already expect the
reorientation process to be fast. Nevertheless, it is surprising to observe, that at 34.5 wt.-%,
which is - within the error of measurement - in the region of wODT, the time constant is
determined to be as low as = 800 msec with the overall process completed after around 2.5
sec. These values are already comparable with the orientation times measured by Finkelmann
and coworkers for various nematic liquid-crystalline side chain block copolymers exposed to
a DC electric field, ranging from 200 msec to 5 sec at field strengths of 0.12-0.16 kV/mm44.
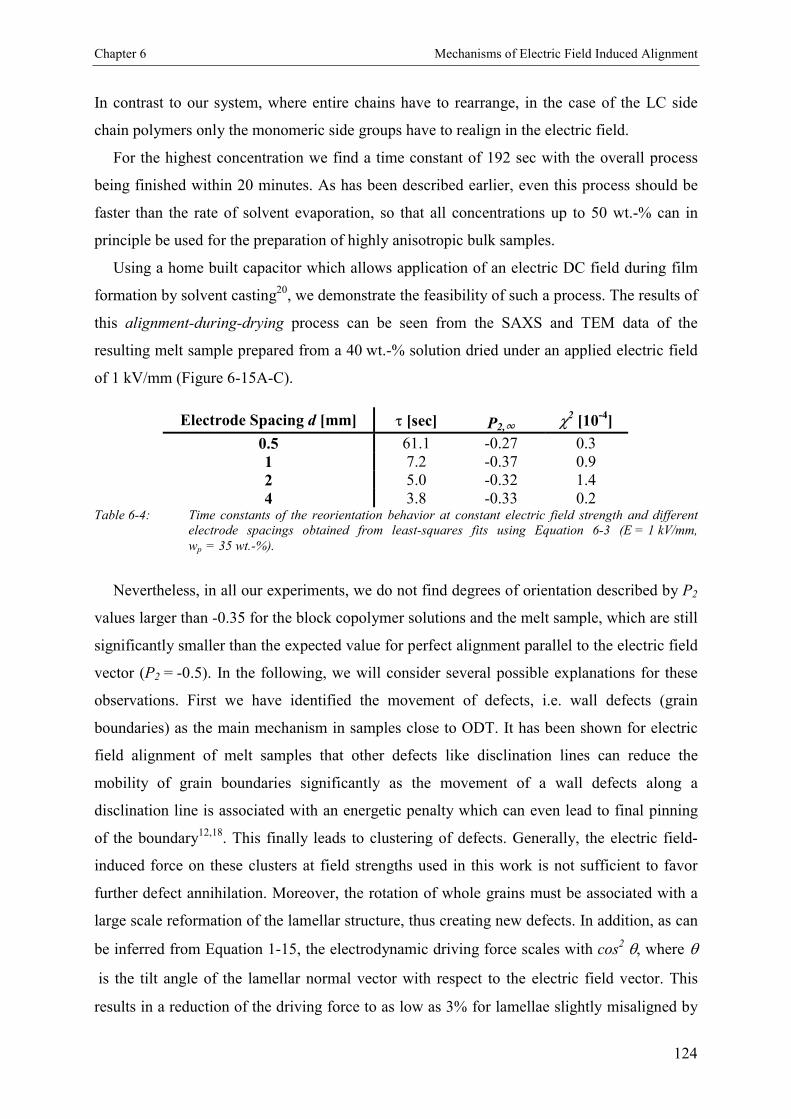
Chapter 6 Mechanisms of Electric Field Induced Alignment
124
In contrast to our system, where entire chains have to rearrange, in the case of the LC side
chain polymers only the monomeric side groups have to realign in the electric field.
For the highest concentration we find a time constant of 192 sec with the overall process
being finished within 20 minutes. As has been described earlier, even this process should be
faster than the rate of solvent evaporation, so that all concentrations up to 50 wt.-% can in
principle be used for the preparation of highly anisotropic bulk samples.
Using a home built capacitor which allows application of an electric DC field during film
formation by solvent casting20, we demonstrate the feasibility of such a process. The results of
this alignment-during-drying process can be seen from the SAXS and TEM data of the
resulting melt sample prepared from a 40 wt.-% solution dried under an applied electric field
of 1 kV/mm (Figure 6-15A-C).
Electrode Spacing d [mm] � [sec] P2, �
2 [10-4]
0.5 61.1 -0.27 0.31 7.2 -0.37 0.92 5.0 -0.32 1.44 3.8 -0.33 0.2
Table 6-4: Time constants of the reorientation behavior at constant electric field strength and differentelectrode spacings obtained from least-squares fits using Equation 6-3 (E = 1 kV/mm,wp = 35 wt.-%).
Nevertheless, in all our experiments, we do not find degrees of orientation described by P2
values larger than -0.35 for the block copolymer solutions and the melt sample, which are still
significantly smaller than the expected value for perfect alignment parallel to the electric field
vector (P2 = -0.5). In the following, we will consider several possible explanations for these
observations. First we have identified the movement of defects, i.e. wall defects (grain
boundaries) as the main mechanism in samples close to ODT. It has been shown for electric
field alignment of melt samples that other defects like disclination lines can reduce the
mobility of grain boundaries significantly as the movement of a wall defects along a
disclination line is associated with an energetic penalty which can even lead to final pinning
of the boundary12,18. This finally leads to clustering of defects. Generally, the electric field-
induced force on these clusters at field strengths used in this work is not sufficient to favor
further defect annihilation. Moreover, the rotation of whole grains must be associated with a
large scale reformation of the lamellar structure, thus creating new defects. In addition, as can
be inferred from Equation 1-15, the electrodynamic driving force scales with cos2�, where
�is the tilt angle of the lamellar normal vector with respect to the electric field vector. This
results in a reduction of the driving force to as low as 3% for lamellae slightly misaligned by

Chapter 6 Mechanisms of Electric Field Induced Alignment
125
10° from a perfect orientation parallel to the electric field. In all cases, the application of
electric fields of higher field strengths than have been accessible in this work, could improve
the degree of alignment.
6.4.3.2. Electric Field Dependence
The dependence of the time constant � on the electric field strength exhibits a hyperbolic
power law as described earlier. The asymptotic behavior at high electric fields (i.e. for a large
force acting on the lamellae) indicates = 0 sec for infinite field strength. This is expected in
the absence of any electrorheological effects and limits in single chain diffusion, as the
dominating process at 35 wt.-% is the migration of grain boundaries. The asymptotic behavior
at low field strength indicates a threshold value Et of some 0.35 kV/mm. This is in agreement
with the experimental observation that at lower field strengths no effect of the electric field on
the scattering pattern was observed. This threshold value can be explained by a competition of
the electric field and the surface field generated by the gold electrodes. The latter exhibits an
unexpected range, as has already been found by Annighöfer and Gronski for thick PS-b-PI
block copolymer bulk samples cast from several aromatic solvents (including toluene) in the
absence of an external electric field5. The threshold we determine differs from the one
detected by Thurn-Albrecht et al.17. They defined the threshold field strength as the one
needed for an alignment of the cylinders parallel to the electric field vector throughout the
entire film. In our case, we always find 10 to 40 lamellar layers parallel to the boundary
electrodes with a transition to lamellae perpendicular to the electrodes, as reported earlier (for
example see Figure 5-6)20. Nevertheless, there is an indirect influence of the electrode surface
on the threshold voltage in our case. As the formation of T-junctions for the transition from
lamellae parallel to perpendicular to the boundary surfaces leads to an energetic penalty which
has to be balanced by the electric field, we can define the threshold field strength as the
voltage needed to overcome this energetic barrier. Therefore, a sufficient gain in energy is
required, which can be derived from the overall size of the domains to be aligned parallel to
the electric field vector. If the size of the domains which can be oriented is reduced by
decreasing the electrode spacing, the threshold field strength will increase as the gain in
energy (i.e. energy stored in the capacitor per area) decreases. This explains the dependence
of the time constant on the electrode spacing as shown in Table 6-4 and Figure 6-18. Here,
we measured the reorientation kinetics at constant field strength for different electrode
spacings for a 35 wt.-% solution of SI-80 in toluene. We find a distinct jump in the time
constant from 1 mm to 0.5 mm, indicating that below 1 mm the energetic cost decreasingly

Chapter 6 Mechanisms of Electric Field Induced Alignment
126
can be balanced by the gain in energy from the aligned domains. Further reduction of the
electrode spacing to the range of the electrode surface field might finally lead to a complete
pinning of the starting orientation. This distinct dependence of the threshold field strength has
recently been predicted by Tsori and Andelman45 for a lamellar block copolymer system in
the strong segregation limit. Nevertheless, we note that further experiments have to be
conducted in order to exclude completely the possibility that due to the rather large domains
size of up to 200 �m we have to consider a kinetic rather than a thermodynamic effect to
explain our data.
0 1 2 3 41
10
102
� [se
c]
d [mm]
Figure 6-18: Logarithmic dependence of the orientation kinetics on the electrode spacing for a 35 wt.-%solution of SI-80 in toluene at 1 kV/mm.
Amundson et al.13 found an E2 dependence of the rate constant for a limited range of field
strengths (1, 1.5 and 1.75 kV/mm). In contrast, our data rather indicate a somewhat stronger
dependence of the rate constant on the electric field strength. A double logarithmic plot of
1/ versus E yields a slope of 2.4 � 0.1, i.e. 1/ ~ E2.4� 0.1. As anticipated by Amundson et al.
their range of electric field strength is not sufficient to draw a definite conclusion about the
electric field strength dependence of the alignment kinetics. Moreover, we also agree with
their assumption that the stronger dependence could indicate an activated process, such as
nucleation of new defect structures, e.g. wall defects, which in turn would accelerate the
orientation process by increasing the active centers for alignment in the sample, rearranging
by migration of grain boundaries as this is the dominant mechanism for the 35 wt.-% used in
this series.

Chapter 6 Mechanisms of Electric Field Induced Alignment
127
6.4.3.3. Temperature Dependence
The rate constant exhibits a non-linear behavior for an Arrhenius type plot as shown in
Figure 6-12. This non-classical Arrhenius type behavior reveals that the observed shift in
mechanism from grain rotation at low temperatures to migration of grain boundaries at higher
temperatures goes along with a significant change in apparent activation energy. Due to an
increase in temperature, many parameters like viscosity, interaction parameter and finally
- with decreasing degree of phase separation - also the thermodynamic driving force for the
electric field-induced alignment change. Therefore, we cannot give a definite explanation for
the higher activation energy observed for the migration of grain boundaries. A possible
explanation would have to take into account the interplay between decreasing viscosity,
decreasing thermodynamic driving force and increasing composition fluctuations close to
TODT. In addition, we note that the superposition of the above described two distinctly
different mechanisms further complicates the kinetic behavior.
6.5. Conclusion
We have identified two mechanisms governing the electric field alignment of a lamellar
block copolymer from concentrated solutions. It was shown that depending on the segregation
power (� �P, � 1/T) a single mechanism dominates the orientation process, i.e. in a
weakly segregated system (low concentration or high temperature) the migration of
boundaries prevails, whereas a stronger phase separated system (high concentration or low
temperature) predominantly exhibits rotation of grains.
Furthermore, the orientation kinetics slows down with increasing polymer concentration,
which can be correlated to the respective solution viscosity and the mechanism of orientation.
Additionally, we determined the influence of the electric field strength on the orientation
kinetics, including a threshold value below which no electric field induced orientation could
be achieved on the time scale of the experiment. The time constants of the fastest processes
were in the range of 0.5 sec, reaching a final orientation described by order parameters of up
to P2 = -0.35. Finally, the variation of temperature lead us to control the governing
mechanisms at a fixed polymer concentration.
In summary, we have demonstrated that electric field alignment of block copolymer
domains from solution is a powerful tool to generate highly anisotropic bulk block copolymer
samples. The large variety of parameters which we can control allows us to further improve

Chapter 6 Mechanisms of Electric Field Induced Alignment
128
the preparation of macroscopically aligned melt samples via solvent casting in the presence of
an electric field.
AcknowledgementThe authors thank H. Krejtschi and his team for the skillful assistance in constructing the
experimental set-up. We are grateful for many helpful discussions with H. Brand. We
acknowledge K. Matussek for the viscosity measurements, A. Göpfert for the TEM
measurements, and H. Schmalz for the cooperation during the block copolymer synthesis.
A.B. is grateful for a Kekulé fellowship by the Stiftung Stipendien-Fonds des Verbandes der
Chemischen Industrie and the BMBF. We are grateful to the ESRF for financial support and
provision of synchrotron beam time. This work was carried out in the framework of the
Sonderforschungsbereich 481 funded by the German Science Foundation (DFG).
Chapter 6 Mechanisms of Electric Field Induced Alignment
129
References
1 A part of this work has been submitted to Phys. Rev. Lett. by A. Böker, H. Elbs, H. Hänsel,
A. Knoll, S. Ludwigs, H. Zettl, V. Urban, V. Abetz, A.H.E. Müller, and G. Krausch.
Some of the coauthors (Elbs, Hänsel, Knoll, Ludwigs, Zettl, Abetz and Urban) have helped
during the 72h beamtime at the ESRF with setup of the equipment and sample preparation. In
addition the measurements were performed by different shifts round the clock in order to
effectively use the allocated beamtime. Moreover, helpful discussions with H. Elbs, H.
Hänsel, A. Knoll, H. Zettl, and V. Abetz about data evaluation and technical details are
gratefully acknowledged. Additionally, H. Hänsel developed a LabView programm, which
automated the calculation of the hundreds of P2 values of each experiment.
2 Bates, F.S.; Fredrickson, G.H. Ann. Rev. Phys. Chem. 1990, 41, 525.
3 Bates, F.S.; Fredrickson, G.H. Physics Today 1999, 52, 32.
4 Anastasiadis, S.H.; Russell, T.P.; Satija, S.K.; Majkrzak, C.F. Phys. Rev. Lett. 1989, 62,
1852.
5 Annighöfer, F.; Gronski, W. Makromol. Chem., Rapid Commun. 1983, 4, 123.
6 Wiesner, U. Macromol. Chem. Phys. 1997, 198, 3319.
7 Chen, Z.-R.; Kornfield, J.A.; Smith, S.D.; Grothaus, J.T.; Satkowski, M.M. Science 1997,
277, 1248.
8 Chen, Z.-R.; Kornfield, J.A. Polymer 1998, 39, 4679.
9 Keller, A.; Pedemonte, E.; Willmouth, F.M. Nature 1970, 225, 538.
10 Albalak, R.J.; Thomas, E.L. J. Polym. Sci., Polym. Phys. Ed. 1993, 31, 37.
11 Thurn-Albrecht, T.; Schotter, J.; Kastle, G.A.; Emley, N.; Shibauchi, T.; Krusin-Elbaum,
L.; Guarini, K.; Black, C.T.; Tuominen, M.T.; Russell, T.P. Science 2000, 290, 2126.
12 Amundson, K.; Helfand, E.; Davis, D.D.; Quan, X.; Patel, S.S.; Smith, S.D.
Macromolecules 1991, 24, 6546.
13 Amundson, K.; Helfand, E.; Quan, X.; Smith, S.D. Macromolecules 1993, 26, 2698.
14 Morkved, T.L.; Lu, M.; Urbas, A.M.; Ehrichs, E.E.; Jaeger, H.M.; Mansky, P.; Russell,
T.P. Science 1996, 273, 931.
15 Morkved, T.L.; Lopez, V.A.; Hahm, J.; Sibener, S.J.; Jaeger, H.M. Polymer 1998, 39, 3871.
16 Mansky, P.; DeRouchey, J.; Russell, T.P.; Mays, J.; Pitsikalis, M.; Morkved, T.L.; Jaeger,
H.M. Macromolecules 1998, 31, 4399.
17 Thurn-Albrecht, T.; DeRouchey, J.; Russell, T.P.; Jaeger, H.M. Macromolecules 2000, 33,
3250.

Chapter 6 Mechanisms of Electric Field Induced Alignment
130
18 Amundson, K.; Helfand, E.; Quan, X.; Hudson, S.D.; Smith, S.D. Macromolecules 1994,
27, 6559.
19 Le Meur, J.; Terrisse, J.; Schwab, C.; Goldzene, P. J. Phys., Colloq. 1971, 32, C5a-301.
20 Böker, A.; Knoll, A.; Elbs, H.; Abetz, V.; Müller, A.H.E.; Krausch, G. Macromolecules
2002, 35, 1319.
21 Schmalz, H.; Böker, A.; Lange, R.; Krausch, G.; Abetz, V. Macromolecules 2001, 34,
8720.
22 C.C. Sawyer; D.T. Grubb Polymer Microscopy, 2nd Ed.; Chapman & Hall: London, 1996.
23 Wang, W.; Hashimoto, T. Polymer 2000, 41, 4729.
24 Noolandi, J.; Hong, K.M. Ferroelectrics 1980, 30, 117.
25 Shibayama, M.; Hashimoto, T.; Hasegawa, H.; Kawai, H. Macromolecules 1983, 16, 1427.
26 Amundson, K.; Helfand, E.; Patel, S.S.; Quan, X.; Smith, S.D. Macromolecules 1992, 25,
1953.
27 Balsara, N.P.; Perahia, D.; Safinya, C.R.; Tirrell, M.; Lodge, T.P. Macromolecules 1992,
25, 3896.
28 Balsara, N.P.; Hammouda, B.; Kesani, P.K.; Jonnalagadda, S.V.; Straty, G.C.
Macromolecules 1994, 27, 2566.
29 Yao, M.L.; Watanabe, H.; Adachi, K.; Kotaka, T. Macromolecules 1992, 25, 1699.
30 Sakamoto, N.; Hashimoto, T.; Kido, R.; Adachi, K. Macromolecules 1996, 29, 8126.
31 Hong, K.M.; Noolandi, J. Macromolecules 1981, 14, 736.
32 Balsara, N.P.; Eastman, C.E.; Foster, M.D.; Lodge, T.P.; Tirrell, M. Makromol. Chem.,
Makromol. Symp. 1991, 45, 213.
33 Fredrickson, G.H.; Leibler, L. Macromolecules 1989, 22, 1238.
34 Chen, Z.R.; Issaian, A.M.; Kornfield, J.A.; Smith, S.D.; Grothaus, J.T.; Satkowski, M.M.
Macromolecules 1997, 30, 7096.
35 Balsara, N.P.; Hammouda, B. Phys. Rev. Lett. 1994, 72, 360.
36 Winey, K.I.; Patel, S.S.; Larson, R.G.; Watanabe, H. Macromolecules 1993, 26, 2542.
37 Polis, D.L.; Smith, S.D.; Terrill, N.J.; Ryan, A.J.; Morse, DC; Winey, K.I. Macromolecules
1999, 32, 4668.
38 Zhang, Y.; Wiesner, U. J. Chem. Phys. 1995, 103, 4784.
39 Morrison, F.A.; Winter, H.H. Macromolecules 1989, 22, 3533.
40 Scott, D.B.; Waddon, A.J.; Lin, Y.G.; Karasz, F.E.; Winter, H.H. Macromolecules 1992,
25, 4175.

Chapter 6 Mechanisms of Electric Field Induced Alignment
131
41 D.S. Pearson, A. Mera, W.E. Rochefort Polym. Prepr. 1981, 22, 102.
42 Kozak, A.; Simon, G.P.; Moscicki, J.K.; Williams, G. Mol. Cryst. Liq. Cryst. 1990, 193,
155.
43 Amundson, K.R.: “Electric and magnetic field effects on polymeric systems exhibiting
long-range orientational order” Plast. Eng. (N.Y.) 1998, 45, 1079.
44 Finkelmann, H.; Naegele, D.; Ringsdorf, H. Makromol. Chem. 1979, 180, 803.
45 Tsori, Y.; Andelman, D. Macromolecules 2002, 35, 5161.

Chapter 7 Orientation of AC and ABC Block Copolymers
132
Chapter 7
The Influence of Phase Separation and
Dielectric Contrast on the Electric Field
Induced Orientation of Lamellar AC and ABC
Block Copolymer Solutions
Abstract
We investigate the reorientation kinetics of concentrated solutions of lamellar AC diblock
and ABC triblock copolymers in the presence of an external DC electric field. The
experiments were performed on polystyrene-b-poly(methyl methacrylate) and polystyrene-b-
poly(2-hydroxyethyl methacrylate)-b-poly(methyl methacrylate) block copolymer solutions in
tetrahydrofuran. In-situ synchrotron radiation small-angle X-ray scattering was used to
monitor the reorientation process. For the ABC triblock copolymer, the orientation kinetics is
well described by a single exponential with characteristic time constants varying between a
few seconds and several minutes depending on the polymer concentration and the electric
field strength. In addition, detailed insight into the dominant microscopic mechanisms is
revealed. We identify a narrow concentration window, in which the interplay between chain
mobility and gain in free energy in the electric field allows the preparation of highly
anisotropic bulk polymer samples by exposure to an electric field. We compare the
observations for the triblock copolymer with a lamellar polystyrene-b-poly(methyl
methacrylate) diblock copolymer, were no electric field induced reorientation could be
achieved.

Chapter 7 Orientation of AC and ABC Block Copolymers
133
7.1. Introduction
In a recent work1, we have demonstrated that electric field induced alignment can be
applied successfully to block copolymer solutions, thereby effectively circumventing
limitations associated with the high melt viscosities of high molecular weight copolymers or
copolymers of more complex architectures (multiblock copolymers, star copolymers, etc.).
Given the increasing interest in complex block copolymer structures, it is desirable to further
explore such alternative approaches in detail. Therefore, we present in this work real-time
Synchrotron-SAXS investigations on the kinetics and mechanisms of the reorientation of
lamellar polystyrene-b-poly(2-hydroxyethyl methacrylate)-b-poly(methyl methacrylate) and
polystyrene-b-poly(methyl methacrylate) block copolymers. Macroscopically aligned bulk
samples of these polymers are of considerable technological interest as the methacrylic
component can be decomposed by UV irradiation, yielding a crosslinked PS scaffold for
application as a nanoporous membrane or a template for simple pattern transfer on nanometer
scale2.
7.2. Experimental Section
7.2.1. Synthesis
The polystyrene-b-poly(2-hydroxyethyl methacrylate)-b-poly(methyl methacrylate)
(SHM) block copolymer was synthesized by sequential living anionic polymerization as
described in detail elsewhere3. The polymer used in this study consists of 47 wt.-%
polystyrene, 10 wt.-% poly(2-hydroxyethyl methacrylate) (PHEMA) and 43 wt.-%
poly(methyl methacrylate) (PMMA) with a total number-average molecular weight Mn =
82,000 g/mol (we denote this material as S47H10M4382). GPC of the final block copolymer
yields a polydispersity of Mw/Mn = 1.04. The block ratio and overall molecular weight were
determined by 1H-NMR using the integrated aromatic signals of the polystyrene block in
combination with the GPC results of the corresponding polystyrene precursor. The diblock
copolymer polystyrene-b-poly(methyl methacrylate) was synthesized and characterized
analogously, yielding Mn = 100,000 g/mol and Mw/Mn = 1.03 with nearly symmetrical
composition (49 wt.-% PS, 51 wt.-% PMMA, S49M51100).
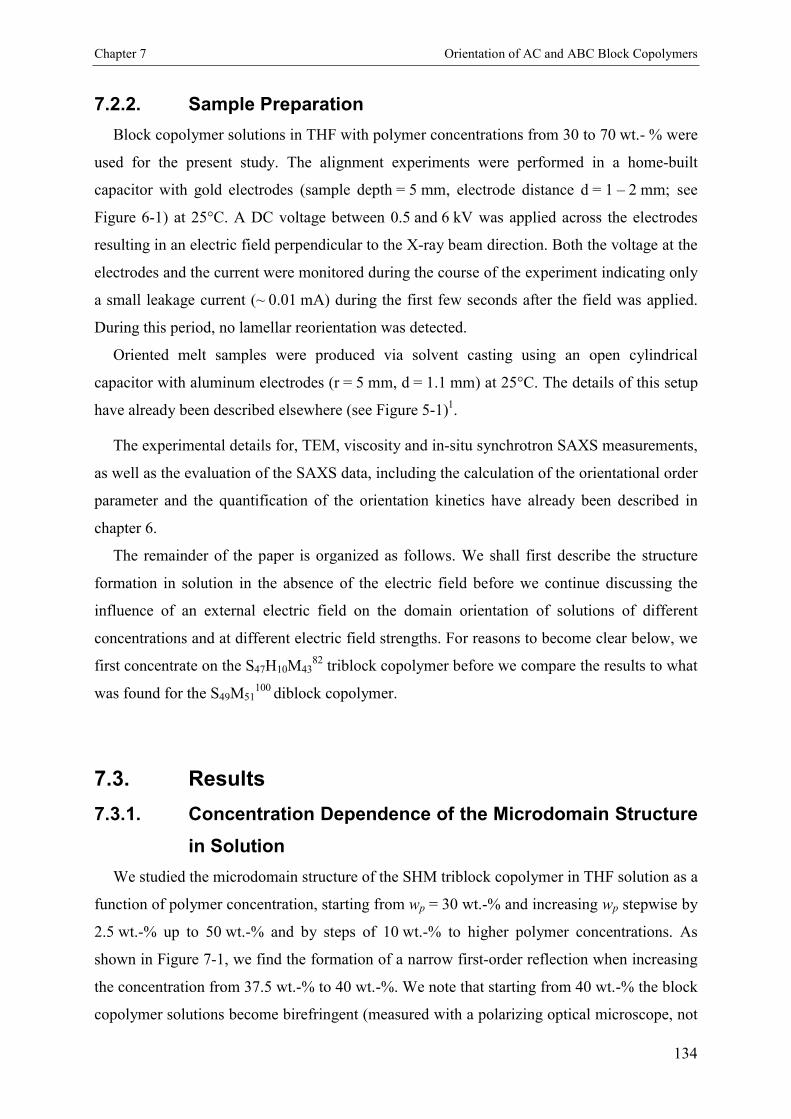
Chapter 7 Orientation of AC and ABC Block Copolymers
134
7.2.2. Sample Preparation
Block copolymer solutions in THF with polymer concentrations from 30 to 70 wt.- % were
used for the present study. The alignment experiments were performed in a home-built
capacitor with gold electrodes (sample depth = 5 mm, electrode distance d = 1 – 2 mm; see
Figure 6-1) at 25°C. A DC voltage between 0.5 and 6 kV was applied across the electrodes
resulting in an electric field perpendicular to the X-ray beam direction. Both the voltage at the
electrodes and the current were monitored during the course of the experiment indicating only
a small leakage current (~ 0.01 mA) during the first few seconds after the field was applied.
During this period, no lamellar reorientation was detected.
Oriented melt samples were produced via solvent casting using an open cylindrical
capacitor with aluminum electrodes (r = 5 mm, d = 1.1 mm) at 25°C. The details of this setup
have already been described elsewhere (see Figure 5-1)1.
The experimental details for, TEM, viscosity and in-situ synchrotron SAXS measurements,
as well as the evaluation of the SAXS data, including the calculation of the orientational order
parameter and the quantification of the orientation kinetics have already been described in
chapter 6.
The remainder of the paper is organized as follows. We shall first describe the structure
formation in solution in the absence of the electric field before we continue discussing the
influence of an external electric field on the domain orientation of solutions of different
concentrations and at different electric field strengths. For reasons to become clear below, we
first concentrate on the S47H10M4382 triblock copolymer before we compare the results to what
was found for the S49M51100 diblock copolymer.
7.3. Results
7.3.1. Concentration Dependence of the Microdomain Structure
in Solution
We studied the microdomain structure of the SHM triblock copolymer in THF solution as a
function of polymer concentration, starting from wp = 30 wt.-% and increasing wp stepwise by
2.5 wt.-% up to 50 wt.-% and by steps of 10 wt.-% to higher polymer concentrations. As
shown in Figure 7-1, we find the formation of a narrow first-order reflection when increasing
the concentration from 37.5 wt.-% to 40 wt.-%. We note that starting from 40 wt.-% the block
copolymer solutions become birefringent (measured with a polarizing optical microscope, not
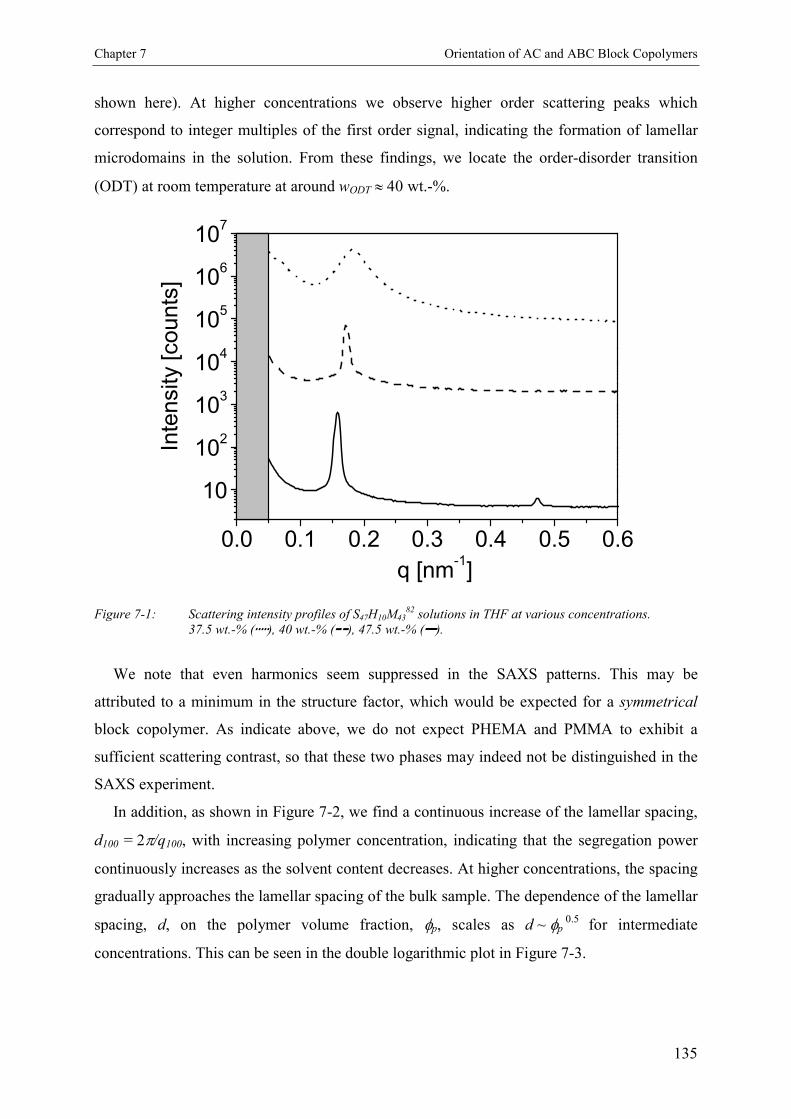
Chapter 7 Orientation of AC and ABC Block Copolymers
135
shown here). At higher concentrations we observe higher order scattering peaks which
correspond to integer multiples of the first order signal, indicating the formation of lamellar
microdomains in the solution. From these findings, we locate the order-disorder transition
(ODT) at room temperature at around wODT � 40 wt.-%.
0.0 0.1 0.2 0.3 0.4 0.5 0.6
10
102
103
104
105
106
107
Inte
nsity
[counts
]
q [nm-1]
Figure 7-1: Scattering intensity profiles of S47H10M4382 solutions in THF at various concentrations.
37.5 wt.-% (�), 40 wt.-% (�), 47.5 wt.-% (�).
We note that even harmonics seem suppressed in the SAXS patterns. This may be
attributed to a minimum in the structure factor, which would be expected for a symmetrical
block copolymer. As indicate above, we do not expect PHEMA and PMMA to exhibit a
sufficient scattering contrast, so that these two phases may indeed not be distinguished in the
SAXS experiment.
In addition, as shown in Figure 7-2, we find a continuous increase of the lamellar spacing,
d100 = 2�/q100, with increasing polymer concentration, indicating that the segregation power
continuously increases as the solvent content decreases. At higher concentrations, the spacing
gradually approaches the lamellar spacing of the bulk sample. The dependence of the lamellar
spacing, d, on the polymer volume fraction, �p, scales as d ~ �p 0.5 for intermediate
concentrations. This can be seen in the double logarithmic plot in Figure 7-3.

Chapter 7 Orientation of AC and ABC Block Copolymers
136
30 40 50 60 70 80 90 100 110
30
35
40
45
50
ODT
d [n
m]
wp [wt.-%]
Figure 7-2: Concentration dependence of the lamellar spacing (d100).
7.3.2. Reorientation Behavior of PS-b-PHEMA-b-PMMA
After sample preparation and prior to electric field exposure, all phase-separated solutions
exhibit a distinctly anisotropic scattering pattern with maxima located at � = 0° and 180°,
respectively (Figure 7-4A). This pattern indicates alignment of the lamellae parallel to the
electrodes. Such an alignment can be caused both by preferential interaction of PS with the
gold surfaces and by possible shear forces acting on the highly viscous solutions during filling
of the capacitor with a syringe. In order to destroy any possible memory effect, we heated the
solutions above the order-disorder temperature. However, after cooling, still some alignment
of the domains parallel to the electrodes prevailed, indicating the importance of the surface
effects4.
As soon as the electric field is applied, the scattering pattern changes significantly. The
peaks at � = 0° and 180° decrease and new scattering maxima at � = 90° and 270° grow with
time (Figure 7-4A-C). In order to quantify the kinetics of the orientation process, P2(t) was
calculated from the 2D SAXS patterns as described above. Using a single exponential fit, we
can determine the time constant � of the reorientation process (see Equation 6-3).
The evolution of the orientational order parameter, P2(t), is shown in Figure 7-5 for
40 wt.-% and 45 wt.-% solutions of SHM in THF. The solid lines represent least squares fits
to the data. For the 45 wt.-% solution only little alignment was achieved on application of

Chapter 7 Orientation of AC and ABC Block Copolymers
137
1 kV/mm. Therefore, after some 400 sec, the electric field strength was increased to
2 kV/mm.
0.32 0.35 0.39 0.42 0.45 0.48
33.9
35.7
37.5
39.3
41.1
42.9d
[nm
]
�P
Figure 7-3: Double logarithmic plot of dependence of lamellar spacing on the volume fraction of polymer�P for intermediate concentrations (d ~ �P
0.5).
7.3.3. Kinetics of Microphase Orientation
7.3.3.1. Concentration dependence
The kinetics of the alignment of the microdomains formed in our triblock copolymer
system was followed within a narrow concentration window between 40 wt.-% (where phase
separation sets in) and 50 wt.-%. As anticipated from the increasing solution viscosities, the
time constant, �� strongly increases with increasing polymer concentration. As can be seen
from Figure 7-5 and Table 7-1, the time constants for the reorientation process at 1kV/mm in
a 1 mm capacitor are in the range of some minutes (1.5 minutes and nearly 6 minutes for 40
and 45 wt.-%, respectively). At concentrations above 45 wt.-% no electric field induced
orientation could be detected. Moreover, at 45 wt.-% (Figure 7-5B) the process is slowed
down significantly at an incomplete degree of alignment (P2 = 0.28), which can only be
overcome by increasing the field strength.
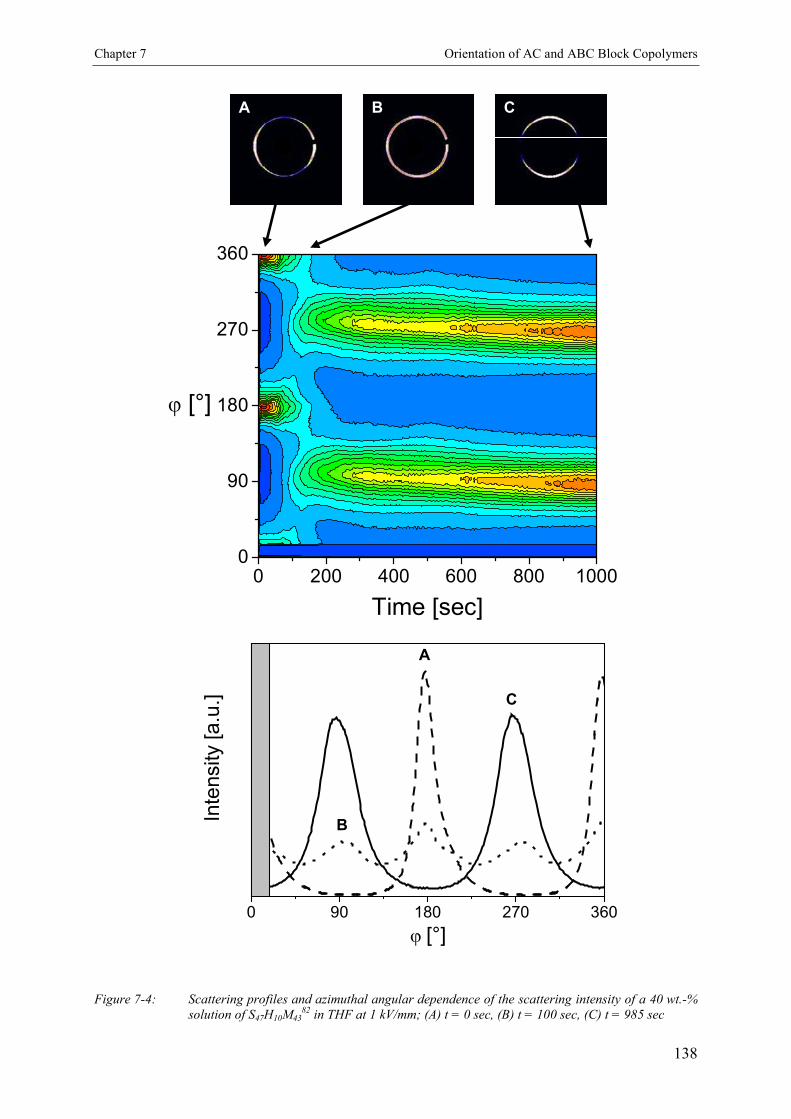
Chapter 7 Orientation of AC and ABC Block Copolymers
138
0 200 400 600 800 10000
90
180
270
360
Time [sec]
� [°]
A CB
0 90 180 270 360
Inte
nsity
[a.u
.]
���[°]
A
B
C
Figure 7-4: Scattering profiles and azimuthal angular dependence of the scattering intensity of a 40 wt.-%solution of S47H10M43
82 in THF at 1 kV/mm; (A) t = 0 sec, (B) t = 100 sec, (C) t = 985 sec

Chapter 7 Orientation of AC and ABC Block Copolymers
139
The results of the exponential fits are summarized in Table 7-1. The single exponential fit
works quite well for all concentrations studied, as can be seen from the low �2 values. At a
sufficiently high electric field strength, P2 reaches about the same limiting values
P2, = -0.25 � 0.02 independent of concentration. Therefore, we may assume that the polymer
concentration only influences the rate of orientation rather than the final degree of alignment.
Within the narrow concentration window accessible for electric field induced alignment we
observe the superposition of two different microscopic reorientation mechanisms5. As can be
seen in Figure 7-4, the initial peaks at � = 0° and 180° almost vanish as the electric field is
applied and new peaks are formed at � = 90° and 270°, the intensity of which grows with
time. Simultaneously, we observe small peaks, which shift into their new positions (from
180° to 90° and from 360° to 270°). This is seen best in the azimuthal contour plot in Figure
7-4.
Concentration [wt.-%] Voltage [kV/mm] � [sec] P2, �
2 [10-4]
40 1 89 -0.26 3.8
45 1 348 0.28 0.5
45 2 151 -0.23 1.4
45 3 157 -0.27 0.6
Table 7-1: Time constants � of the reorientation behavior at different polymer concentrations anddifferent electric field strength obtained from least squares fits using Equation 6-3. (1 mmelectrode distance)
7.3.3.2. Electric Field Strength Dependence
In order to investigate the influence of the electric field strength on the orientation kinetics
we varied the electric field between 0.25 kV/mm and 3 kV/mm. In this case a 40 wt.-%
solution of the triblock copolymer was studied at room temperature in a 2 mm capacitor in
order to exclude dominant surface effects. A selection of P2 vs. t curves is shown in Figure 7-
6. The results of the fitting procedure are summarized in Table 7-2 and shown in Figure 7-7.
The quality of the single exponential fits can be inferred from the low �2 values. Except for
E = 0.375 kV/mm (P2, = -0.08), the limiting values, P2, , always reach a value around
P2, = -0.2 � 0.03. With increasing field strength, there is a slight tendency towards higher
plateau values (-0.17…..-0.22). The time constants, ���range from 545 sec for low electric
fields (0.375 kV/mm) to as low as 0.64 sec for the highest field strength (3 kV/mm). On the
time scale of our experiment, we were not able to detect any reorientation for electric fields
below 0.25 kV/mm. We may therefore conclude that there exists a threshold field strength

Chapter 7 Orientation of AC and ABC Block Copolymers
140
Et = 0.25 …0.375 kV/mm, below which no field induced reorientation is possible. Above Et,
the time constant scales with the electric field strength in a hyperbolic power law dependence
� = �(E - Et)a + � . The data points are best fitted for � = 0.10 sec, a = -1.47, Et = 310 V/mm
and � = 0 sec (solid line in Figure 7-7).
A
0 200 400 600 800 1000
0.4
0.2
0.0
-0.2
-0.4
Time [sec]
P 2
0 500 1000 1500 2000
0.4
0.2
0.0
-0.2
2kV/mm
Time [sec]
P 2
B
Figure 7-5: Evolution of orientational order parameter P2 with time (for orientation parallel to the electric
field vector): (A) 40 wt.-% solution of S47H10M4382 in THF at 1 kV/mm, (B) 45 wt.-% solution of S47H10M43
82 in
THF at 1 kV/mm and 2 kV/mm. The solid lines represent least squares fits to the data according to Equation 6-3.

Chapter 7 Orientation of AC and ABC Block Copolymers
141
0 100 200 300 400 500 6000.8
0.6
0.4
0.2
0.0
-0.2
0 1 2 3 4 5 6
0.4
0.2
0.0
-0.2
Time [sec]
P2
Time [sec]
P 2
Figure 7-6: Evolution of orientational order parameter P2 with time for 40 wt.-% solutions at different fieldstrengths (� = 375 V/mm, � = 545 sec; � = 500 V/mm,�� = 116 sec; � = 1 kV/mm,� = 18.7 sec;� = 1.5 kV/mm, � = 10.3 sec;� = 3 kV/mm, � = 0.64 sec). Electrode spacing:2 mm.
Voltage[kV/mm] � [sec] P2, �
2 [10-4]
0.25 (a) (a) (a)
0.375 545 -0.08 5.0
0.5 116.2 -0.17 4.1
0.75 32 -0.16 5.5
1 18.7 -0.17 4.8
1.25 12.7 -0.20 2.5
1.5 10.3 -0.21 2.6
1.75 5.6 -0.21 3.2
2 2.9 -0.20 4.8
2.25 2 -0.21 3.9
2.5 1.3 -0.21 3.1
3 0.64 -0.22 2.9
Table 7-2: Time constants � of the reorientation behavior at different field strength obtained from leastsquares fits using Equation 6-3. (wp = 40 wt.-%, 2 mm electrode distance). (a) no electric fieldinduced reorientation observed.
In addition to the 40 wt.-% solution, a 45 wt.-% solution was measured at 1, 2, and
3 kV/mm. Due to the higher solution viscosity, the system exhibits a much slower kinetic
behavior. In addition, an increase in field strength from 2 to 3kV/mm does not lead to a

Chapter 7 Orientation of AC and ABC Block Copolymers
142
significant change in the time constant � as shown in Table 7-1. Here, we may assume that the
rate of reorientation in such a high viscosity solution is already significantly limited by chain
diffusion.
0.0 0.5 1.0 1.5 2.0 2.5 3.0
0
25
50
75
100
125
150��[s
ec]
[kV/mm]
Figure 7-7: Electric Field dependence of time constant �� for 40 wt.-% solutions. The solid line represents
a least squares fit of the power law � = �(E - Et)a + � to the data points yielding � = 0.10 sec
a = -1.47, Et = 310 V/mm and � = 0 sec.
7.3.3.3. Kinetic Behavior of PS-b-PMMA Diblock Copolymer
Similar experiments were conducted on solutions of the S49M51100 diblock copolymer.
Although the total molecular weight of this polymer is slightly larger than for the S47H10M4382
triblock copolymer, the absence of the PHEMA middle block leads to an increased
compatibility and thereby to a higher order-disorder concentration. The wODT was localized
between 50 and 60 wt.-%. Therefore the viscosity of the microphase-separated solutions is
significantly higher in the diblock copolymer case as compared to the triblock system. Indeed,
above wODT no reorientation of the microdomains could be realized even at electric field
strength as high as 5 kV/mm. As shown in Figure 7-8, a 50 wt.-% solution which, in the
absence of the electric field, only exhibited scattering due to composition fluctuations found
commonly in the disordered state (correlation hole), could be deformed parallel to the electric
field vector at 5 kV/mm. It appears that above wODT the force implied on the lamellae by the
electric field in not sufficient to lead to reorientation1. We note that the introduction of even a
short block of the high dielectric constant material PHEMA (�PHEMA = 8.9)6, both enhances

Chapter 7 Orientation of AC and ABC Block Copolymers
143
phase separation and increases the effective dielectric contrast sufficiently to enable electric
field induced microdomain alignment in solution.
0 90 180 270 360
Inte
nsity
[a.u
.]
���[°]0 90 180 270 360
Inte
nsi
ty [
a.u
.]
���[°]
A B
Figure 7-8: 2D SAXS patterns and respective azimuthal angular dependence of scattering intensity of a50 wt.-% solution of S49M51
100 in THF. (A) Before and (B) after application of an electric fieldof strength E = 5 kV/mm.
7.4. Discussion
7.4.1. Structure Formation in Solution
We start our discussion with the observed behavior of the triblock copolymer solutions in
the absence of the electric field. As briefly indicated above, we locate the order-disorder
transition (ODT) at room temperature at a polymer concentration between 37.5 and 40 wt.-%.
This assignment is based on various experimental observations. Most convincingly, we note
the absence of birefringence below wp = 40 wt.-%. It has been shown both experimentally and
theoretically that microphase-separated (ordered) block copolymer materials consisting of
randomly oriented lamellae are birefringent7,8,9. We therefore take the absence of
birefringence as an indication that no microphase separation has occurred yet. From the
SAXS experiments, we find an increase in scattering intensity above wp = 37.5 wt.-%,
accompanied by a sharpening of the first order Bragg peak and the evolution of higher orders

Chapter 7 Orientation of AC and ABC Block Copolymers
144
Bragg peaks with increasing concentration. Additional evidence is given by the fact that only
starting from 40 wt.-% we observe an anisotropic scattering pattern in the absence of the
electric field, which indicates some microdomain alignment induced either by shear (during
filling of the sample chamber) or by preferential attraction of one block to the electrode
surface. We note that the broad peak in the scattering profile at and below 37.5 wt.-% is due
to correlation hole scattering.
The lamellar spacing, d, increases with increasing polymer concentration, indicating an
increasing segregation power (or repulsive interactions) between the PS and PHEMA/PMMA
chains as the polymer concentration increases. The dependence of d on polymer concentration
can be described by a scaling relation d ~ �P0.5. Based on calculations by Noolandi and Hong10
a d ~ �P1/6 relationship was predicted for the strong segregation limit in block copolymer
solutions11. Shibayama et al.12 found a d ~ �P1/3 dependence for PS-b-PI in toluene in the
strong segregation limit. Leibler and Frederickson predicted a d ~ �P-0.12 behavior for the weak
segregation limit in block copolymer solutions13. From these predictions, we may conclude
that the positive exponent found in our experiments indicates that our system falls into the
strong rather than into the weak segregation limit.
7.4.2. Mechanism of Domain Alignment
Synchrotron-SAXS is an excellent tool to microscopically investigate the reorientation
process as it combines the advantages of birefringence (high time resolution) with the detailed
and straightforward information about the microscopic order characteristic of scattering
methods.
The change in the azimuthal angular dependence of the scattering pattern as shown in
Figure 7-4A-C, i.e. increase of scattering signals parallel to the electric field vector
(� = 90°/270) and simultaneous decrease of the peaks parallel to the electrodes (� = 0°/360°)
reveals the prevailing mechanism characteristic for all processes described here. This
behavior matches the description of the migration of grain boundaries, as described earlier for
electric field- and shear-induced orientation of lamellae5,14. In this case one lamella grows at
the expense of another one with a significantly different orientation by motion of a tilt
boundary (wall defect) between them, leading to a direct transfer of scattering intensity
between widely separated azimuthal angles �.
Additionally, the small component exhibiting a shift towards the final position at � = 90°
and 270° indicates the rotation of entire grains. Details of this mechanism have already been
identified and described for similar experiments on highly concentrated lamellar PS-b-PI

Chapter 7 Orientation of AC and ABC Block Copolymers
145
solutions in toluene5. Both mechanisms coexist in all our experiments, but within the rather
narrow concentration window accessible in our experiment (wp = 40…….45 wt.-%), grain
boundary migration appears to be the dominating microscopic process.
7.4.3. Kinetics of Microphase Orientation
For the effective preparation of highly anisotropic melt block copolymer samples by virtue of
an external electric field, it is important to find an optimum set of parameters (e.g. degree of
swelling of the block copolymer domains, electric field strength and temperature), which
combines a maximum chain mobility (i.e. fast kinetics) with the highest possible polymer
concentration. In short, the reorientation process should be faster than the rate of solvent
evaporation during preparation of bulk samples from solution, i.e. it should be completed
before the bulk structure “freezes”.
7.4.3.1. Concentration Dependence
When increasing the polymer concentration from 40 to 45 wt.-% the time constant, ��
increases significantly as can be seen in Figure 7-5 and Table 7-1. This can be attributed to an
increase in viscosity of the respective system. For a sufficiently high electric field strength the
viscosity only influences the kinetics but not the final degree of order (P2, ), which is
consistent with previous dielectric relaxation spectroscopy measurements on the realignment
of a side-chain liquid crystalline polymer in its liquid-crystalline state induced by a DC
electric field15.
For wp = 45 wt.-% we find a time constant of around 150 sec with the overall process being
finished within 10 minutes at field strengths of 2-3 kV/mm. As has been described earlier,
even this process should be faster than the rate of solvent evaporation, so that all
concentrations up to 45 wt.-% could be used for bulk sample preparation.
Using a home-built capacitor which allows application of an electric DC field during film
formation by solvent casting1, we demonstrate the feasibility of such a process. Figure 7-9
shows SAXS data of a melt sample prepared from a 40 wt.-% solution dried in the presence of
an electric field of 2 kV/mm. From the azimuthal angular dependence of the scattering
intensity at the first order reflexion, we calculate P2 = -0.4.

Chapter 7 Orientation of AC and ABC Block Copolymers
146
EE
A
0 90 180 270 360
Inte
nsi
ty [a.u
.]
� [°]
B
Figure 7-9: SAXS data of a SHM bulk sample prepared from a 40 wt.-% solution dried under an appliedelectric field of 1 kV/mm. (A) 2D-SAXS pattern and (B) azimuthal intensity distribution at first-order reflection (P2 = -0.4).1
As has already been described in chapter 6 for the PS-b-PI block copolymer in toluene
solution, we only reach for the PS-b-PHEMA-b-PMMA dissolved in THF degrees of
orientation described by P2 values of around -0.25 for the block copolymer solutions and -0.4
for the respective melt sample. In principle, we assume the same reasons which have already
been considered in chapter 6 to apply to the SHM system. Mainly, pinning of wall defects by
disclination lines and the reduction of the electric driving force as the lamellae approach the
final orientation parallel to the electric field vector, prevent the system from reaching a better
degree of orientation on the time scale of the experiment at the given intermediate field
strengths. In addition, we can not exclude electrohydrodynamic destabilization of the lamellar
Chapter 7 Orientation of AC and ABC Block Copolymers
147
pattern induced by nanomolar amounts of lithium salts from the synthesis of the block
copolymer (even though we do not detect any leakage current in the late stages of the
experiments). Such charges might cause convective vortices between the electrodes leading to
an isotropisation of the lamellar orientations. Similar processes are well known for nematic
liquid crystals16.
7.4.3.2. Electric Field Dependence
We assume that the 45 wt.-% sample shows a lower limit in the time constant due to a
viscosity-induced chain diffusion limit at increasing field strength, we investigated the
40 wt.-% solutions of the S47H10M4382 block copolymer. The dependence of the time constant
on the field strengths exhibits a hyperbolic power law � = �(E - Et)a + � . The asymptotic
behavior at high electric field strength (i.e. for a large force acting on the lamellae) indicates
� = 0 sec for infinite field strength. This is expected in the absence of any electrorheological
effects and limits in single chain diffusion, as the dominating process at wp = 40 wt.-% is the
migration of grain boundaries. The asymptotic behavior at low field indicates a threshold field
strength, Et = 310 V/mm. This is in agreement with the experimental observation that at lower
field strengths no effect of the electric field on the scattering pattern was observed.
This threshold value can be explained by a competition between the electric field and the
surface field generated by the gold electrodes. The latter exhibits a rather wide range, as has
already been found by Anastasiadis et al. for PS-b-PMMA block copolymer films without an
external field4. In a recent theoretical work, Tsori and Andelman17 have described the
different threshold fields expected for a strongly phase separated system. As we always find
some 10 lamellar layers parallel to the polymer-electrode interface with a transition to
lamellae perpendicular to the electrodes as reported earlier1, we conclude that our system
exhibits a mixed orientation as considered by Tsori and Andelman. In this state, the system
has to compensate a positive energy penalty associated with the formation of T-junctions for
the transition from lamellae parallel to perpendicular to the boundary surfaces, which mainly
depends on the dielectric contrast of the block copolymer system and the sample thickness.
This penalty has to be balanced by the electric field. Therefore, in accordance with Tsori and
Andelman, we can define the threshold field strength as the voltage needed to overcome this
energetic barrier. Thus, a sufficient gain in energy is required, which can be derived from the
overall size of the domains (given by the sample thickness) to be aligned parallel to the
electric field vector and the dielectric contrast in the system.

Chapter 7 Orientation of AC and ABC Block Copolymers
148
Further experiments will be dealing with the influence of the sample thickness, the
magnitude of the surface fields and dielectric contrast of the block copolymer system on the
threshold field strength5. We note that, in contrast to investigations by Thurn-Albrecht et al.18,
the threshold field identified in our study yields the electric field strength required for a
transition from lamellae parallel to the electrodes to a mixed morphology with a parallel and
predominantly perpendicular lamellar orientation. The threshold field determined by Thurn-
Albrecht et al. is the one required for a second transition from a mixed to a fully
perpendicular alignment.
In contrast, to investigations by Amundson et al.19 a double logarithmic plot of 1/� versus
E yields a slope of 2.8 � 0.2 for our data, i.e. 1/� ~ E2.8� 0.2, which significantly differs from
the expected E2 dependence (see Equation 1-17). We do agree with their assumption that the
stronger dependence could indicate an activated process, such as nucleation of new defect
structures, e.g. wall defects, which in turn would accelerate the orientation process by
increasing the active centers for alignment in the sample, rearranging by migration of grain
boundaries as this is the governing mechanism for all samples used in this series.
7.4.4. Comparison of the Diblock (S49M51100) and the Triblock
(S47H10M4382) System
In the following we will consider electrostatic and thermodynamic arguments explaining
the advantages associated with the introduction of a PHEMA middle block with a high
dielectric constant in a PS-b-PMMA diblock polymer.
We aim to estimate the electrostatic energy difference between the different microdomain
orientations. As the SAXS measurements in Figure 7-1 indicate that the PHEMA and PMMA
blocks form a mixed phase, we will treat the S47H10M4382 copolymer as an AB diblock
copolymer with the following composition: A: 47 wt.-% PS (�A = 2.4) and B: 53 wt.-%
methacrylic blocks (�B = 0.81 �PMMA + 0.19 �PHEMA = 4.6; with �PMMA = 3.6 and �PHEMA = 8.9).
The resulting dielectric contrast amounts to � = 2.2. The S49M51100 diblock copolymer on the
other hand is calculated with 49 wt.-% PS (�A = 2.4) and 51 wt.-% PMMA (�PMMA = 3.6)
leading to a dielectric contrast of only � = 1.2. As THF (�THF 7.8) and chloroform
(�CHCl3 4.8) are fairly non-selective solvents for the two main components, PS and PMMA,
we expect a similar swelling behavior leading merely to a dilution effect with respect to the
dielectric constants of each block. Therefore, with increasing solvent content in the films, the

Chapter 7 Orientation of AC and ABC Block Copolymers
149
difference of the dielectric constants is reduced to ��eff = wp �� and the thermodynamic
driving force for an alignment of the lamellae parallel to the field is expected to decrease
accordingly.
0 20 40 60 80 100
60
80
100
120
140
W [m
J/m
2]
�s
B
W||
W�
W|| - W�
0 20 40 60 80 1000
1
2
3
4
5
6
W [
mJ/m
2]
�s
0 10 20 30 40 50 60 70
0.0
0.4
0.8
1.2
1.6
W [m
J/m
2]
�s
C
W||,col - W�,col
W||,flat - W�,flat
A
A B air
W||,col W�,col
W�,flatW||,flat
A B air
W||,col W�,col
W�,flatW||,flat
Figure 7-10: (A) Four basic geometries of lamellar orientation. Calculated differences in energy stored inthe capacitor between lamellar alignment parallel and perpendicular to the electric fieldvector in dependence of solvent volume fraction; (B) SHM solution in THF in closed capacitor,(C) open capacitor which allows for solvent evaporation with SHM (�) and with SM blockcopolymer (....) in CHCl3.

Chapter 7 Orientation of AC and ABC Block Copolymers
150
In order to estimate the driving forces for domain alignment as a function of the volume
fraction of solvent, �s, we calculate the electric energy per unit area, W, which is stored in a
capacitor for the different situations sketched in Figure 7-10A. The details of the model
calculation are given elsewhere1. Furthermore, we distinguish between an open capacitor
(solvent: CHCl3) which allows for solvent evaporation (layer of air in the system) and a
closed system (solvent: THF) as used for the in-situ SAXS studies.
Film formation in the open capacitor under the influence of an external electric field may
result in significant thickness undulations which eventually lead to the formation of column-
like protrusions that connect both electrodes. Recently, Schäffer et al. showed that electric
fields can induce electrohydrodynamic instabilities in a liquid polymer film leading to the
formation of polymer columns quite similar to the ones observed here20,21. Aside from the
columns, we find areas with film thicknesses ranging between 0.2 and 0.7 mm. All these parts
show a significant alignment of the lamellae parallel to the electric field. The most
pronounced anisotropy, however, is found within the columnar protrusions1.
Therefore, for our calculations, we have chosen four basic geometries to describe the
system, corresponding to a perpendicular (W�,col, W
�,flat) and parallel (W||,col, W||,flat) alignment
of the microdomains with respect to the electric field and to a formation of columns (W�,col,
W||,col) and a flat film (W�,flat, W||,flat) in the open capacitor, respectively. In the case of the
closed capacitor, the two perpendicular (W�,col, W
�,flat = W�) and two parallel (W||,col,
W||,flat = W||) cases are equivalent.
We calculate the energy, W, stored within the electric field of the capacitor as
� �� dVDEW��
21
with E�
being the electric field and D�
the displacement field.
In contrast to the dielectric displacement, D�
, the electric field, E�
, along the z-direction of
the capacitor is not uniform for the models, which incorporate a layered structure (W�,flat and
W�,col). This is due to the fact that the component of the electric field perpendicular to the
interface between two materials is not continuous, but the one of the displacement field is:
D�
�1 = D�
�2 but E�
�1 � E�
�2. Additionally, E�
i = D�
i/�i and the applied voltage V = � E�
dz,
which means that as soon as air is present as a layer in the capacitor with the applied voltage
V, the electric field in both polymer layers is reduced.
Figure 7-10B shows the energy per unit area stored inside a closed capacitor filled with
different solutions of our model AB block copolymer in THF with �A = 2.4 and �B = 4.6
(resembling S47H10M4382 ) as a function of THF volume fraction (�THF = 7.8) at a field

Chapter 7 Orientation of AC and ABC Block Copolymers
151
strength of 2 kV/mm. The inset depicts the difference in energy between the orientations
parallel and perpendicular to the electric field vector. Compared to an open capacitor the
system stores at least 2 times more energy at given solvent concentration1.
Figure 7-10C shows the energy per unit area stored inside a capacitor filled with 15 vol.-%
polymer A (�A = 2.4) and 15 vol.-% polymer B (�B = 4.6 with PHEMA and �B = 3.6 without
PHEMA) as a function of CHCl3 volume fraction (�CHCl3 = 4.8), corresponding to the four
basic geometries, at a field strength of 2 kV/mm. Curves W�,col and W
�,flat as well as curves
W||,col and W||,flat converge at a solvent volume fraction of 70 vol.-% (which is the starting
concentration of our experiment), because at this point the capacitor is completely filled and
the respective geometries are equivalent. Besides the fact that for the SHM as well as the SM
system the difference in energy between the two orientations in column (W�,col, W||,col) is
larger than for flat films (W�,flat, W||,flat), the energetic difference is more than 3 times higher
for the SHM than for the SM system.
When we compare the two situations described above, we find that: (i) the closed system
stores more energy per unit area, and (ii) the difference in energy between the two
orientations is always higher in the closed capacitor, especially for higher concentrations.
Therefore, from our experimental findings, we may conclude that, if the electric field induced
orientation of a block copolymer does not work in the closed capacitor, it will neither function
in the open system, as the energetic difference is always larger for the closed capacitor set-up.
This is even more appropriate as the higher dielectric constant solvent THF was used for the
calculation of the closed capacitor, which reduces the dielectric contrast of the blocks even
more than the lower dielectric constant solvent CHCl3. Therefore, the incorporation of the
high dielectric constant PHEMA middle block into the SM diblock copolymer is the key to
creating a well-performing methacrylate-based block copolymer system for electric field
induced alignment from solution.
Moreover, the PHEMA block enhances the microphase separation in the block copolymer
solutions compared to the PS-b-PMMA system which only phase-separates at polymer
concentrations above 60 wt.-%, while the PHEMA containing block copolymer already
microphase separates at polymer concentrations between 37.5 and 40 wt.-%. Therefore, in the
latter case, the viscosity of the phase-separated solution is considerably smaller, which
promotes the ordering process induced by the small electric force. On the other hand, a lower
polymer concentration also reduces the effective field strength and driving force in the
capacitor as shown in Figure 7-10.
To this point, we can not decide definitely, if in this case enhanced phase separation or the

Chapter 7 Orientation of AC and ABC Block Copolymers
152
increased dielectric contrast between the block is more important for the electric field-induced
ordering process to function. Further experiments to elucidate the influence of a high
dielectric contrast in a block copolymer will be described in chapter 8.
7.5. Conclusion
Using Synchrotron-SAXS we have identified migration of grain boundaries as the
governing mechanism of the electric field induced microdomain alignment of a PS-b-
PHEMA-b-PMMA block copolymer in solution. In addition, the time-resolved SAXS
measurements allowed us to study the kinetic behavior of the PS-b-PHEMA-b-PMMA system
compared to the PS-b-PMMA diblock copolymer. The interplay of enhanced phase separation
and contribution to a high dielectric contrast between the phases by the incorporation of the
PHEMA block results in a functioning electric field driven ordering process. Furthermore, we
have identified a rather small concentration window between 40 and 45 wt.-% in which
microdomain ordering by electric fields can be effectively realized. The variation of the
electric field strength revealed a threshold value, below which no electric field induced
orientation can be achieved. In summary, the maximum final orientation reached in solution
could be described by order parameters of up to P2 = -0.27. The time constants of the fastest
processes were in the range of � = 0.6 sec. Finally, after complete solvent evaporation, bulk
samples exhibited order parameters of up to P2 = -0.4.
We have demonstrated that electric field alignment of block copolymer domains from
solution provides a useful tool to generate anisotropic bulk block copolymer samples by
controlling a large variety of parameters like block copolymer composition, polymer
concentration, and electric field strength.
AcknowledgementThe authors thank H. Krejtschi and his team for the skillful assistance building the
capacitors, K. Matussek for the viscosity measurements and T. Goldacker for synthesis and
characterization of the diblock copolymer. A.B. acknowledges a Kekulé fellowship by the
Stiftung Stipendien-Fonds des Verbandes der Chemischen Industrie and the BMBF. We are
grateful to the ESRF for financial support and provision of synchrotron beam time. This work
was carried out in the framework of the Sonderforschungsbereich 481 funded by the German
Science Foundation (DFG).

Chapter 7 Orientation of AC and ABC Block Copolymers
153
References
1 Böker, A.; Knoll, A.; Elbs, H.; Abetz, V.; Müller, A.H.E.; Krausch, G. Macromolecules
2002, 35, 1319.
2 Thurn-Albrecht, T.; Schotter, J.; Kastle, G.A.; Emley, N.; Shibauchi, T.; Krusin-Elbaum, L.;
Guarini, K.; Black, C.T.; Tuominen, M.T.; Russell, T.P. Science 2000, 290, 2126.
3 Böker, A.; Müller, A.H.E.; Krausch, G. Macromolecules 2001, 34, 7477.
4 Anastasiadis, S.H.; Russell, T.P.; Satija, S.K.; Majkrzak, C.F. Phys. Rev. Lett. 1989, 62,
1852.
5 Böker, A.; Elbs, H.; Hänsel, H.; Knoll, A.; Ludwigs, S.; Zettl, H.; Urban, V.; Abetz, V.;
Müller, A.H.E.; Krausch, G. in preparation.
6 Yamaguchi, R.; Sato, S.; Jpn. J. Appl. Phys. 1994, 33, 4007.
7 Amundson, K.; Helfand, E.; Patel, S.S.; Quan, X.; Smith, S.D. Macromolecules 1992, 25,
1953.
8 Balsara, N.P.; Perahia, D.; Safinya, C.R.; Tirrell, M.; Lodge, T.P. Macromolecules 1992, 25,
3896.
9 Balsara, N.P.; Hammouda, B.; Kesani, P.K.; Jonnalagadda, S.V.; Straty, G.C.
Macromolecules 1994, 27, 2566.
10 Hong, K.M.; Noolandi, J. Macromolecules 1981, 14, 736.
11 Balsara, N.P.; Eastman, C.E.; Foster, M.D.; Lodge, T.P.; Tirrell, M. Makromol. Chem.,
Makromol. Symp. 1991, 45, 213.
12 Shibayama, M.; Hashimoto, T.; Hasegawa, H.; Kawai, H. Macromolecules 1983, 16, 1427.
13 Frederickson, G.H.; Leibler, L. Macromolecules 1989, 22, 1238.
14 Polis, D.L.; Smith, S.D.; Terrill, N.J.; Ryan, A.J.; Morse, D.C.; Winey, K.I.
Macromolecules 1999, 32, 4668.
15 Kozak, A.; Simon, G.P.; Moscicki, J.K.; Williams, G. Mol. Cryst. Liq. Cryst. 1990, 193,
155.
16 Kramer, L.; Pesch, W., in “Pattern Formation in Liquid Crystals”, A. Buka, L. Kramer, ed.,
Springer-Verlag, New York, 1995.
17 Tsori, Y.; Andelman, D. Macromolecules 2002, 35, 5161.
18 Thurn-Albrecht, T.; DeRouchey, J.; Russell, T.P.; Jaeger, H.M.; Macromolecules 2000, 33,
3250.
19 Amundson, K.; Helfand, E.; Davis, D.D.; Quan, X.; Patel, S.S.; Smith, S.D.;
Macromolecules 1991, 24, 6546.
Chapter 7 Orientation of AC and ABC Block Copolymers
154
20 Schäffer, E.; Thurn-Albrecht, T.; Russell, T.P.; Steiner, U.; Nature 2000, 403, 874.
21 Lin, Z.; Kerle, T.; Baker, S.M.; Hoagland, D.A.; Schäffer, E.; Steiner, U.; Russell, T.P.;
J. Chem. Phys. 2001, 14, 2377.
Chapter 8 Alignment of AB and ABC Block Copolymers
155
Chapter 8
Electric Field Induced Alignment of High
Molecular Weight AB and ABC Block
Copolymers with High Dielectric Contrast
Abstract
We investigate the microdomain orientation kinetics of concentrated block copolymer
solutions exposed to a DC electric field by time-resolved synchrotron small-angle X-ray
scattering (SAXS). The feasibility of the electric field-induced ordering process is
demonstrated for polystyrene-b-poly(2-vinyl pyridine), polystyrene-b-poly(tert-butyl meth-
acrylate) and polystyrene-b-poly(2-vinyl pyridine)-b-poly(tert-butyl methacrylate) block
copolymers dissolved in tetrahydrofuran. The orientation kinetics follow a single exponential
time behavior with characteristic time constants varying from a few seconds to some minutes
depending on polymer concentration, electric field strength and block copolymer architecture.
Moreover, we systematically compare the above described block copolymers to polystyrene-
b-polyisoprene and polystyrene-b-poly(methyl methacrylate)-based systems with respect to
their microstructure, dielectric contrast and the surface tension, i.e. interaction with the
electrode surfaces.

Chapter 8 Alignment of AB and ABC Block Copolymers
156
8.1. Introduction
In the previous chapters we have discussed the influence of block copolymer composition
and solution properties on the electric field-induced alignment of lamellar microdomains from
solution. In the following chapter we will extend these investigations to block copolymers
with a higher dielectric contrast, e.g. polystyrene-b-poly(2-vinyl pyridine) (�PS = 2.4,
�P2VP = 7.5), higher molecular weight and more complex microstructures. Thus aiming
towards demonstrating the wide range of applicability of the process of electric field
alignment of microstructures from concentrated solutions.
8.2. Experimental Section
8.2.1. Synthesis
Polystyrene-b-poly(2-vinyl pyridine), polystyrene-b-poly(tert-butyl methacrylate), and
polystyrene-b-poly(2-vinyl pyridine)-b-poly(tert-butyl methacrylate) block copolymers were
synthesized by sequential living anionic polymerization as described in detail elsewhere1,2.
The polymers used in this study have the following compositions: S50V5078, S50T50
100,
S27V35T3884 and S16V21T63
138. (The subscripts denote the weight fractions of the respective
blocks and the superscript gives the number-average molecular weight in kg/mol). Gel
permeation chromatography (GPC) of the final block copolymers yielded polydispersities,
Mw/Mn, of 1.05, 1.03, 1.04, and 1.03, respectively. The block ratios and overall molecular
weights were determined by 1H-NMR using the integrated aromatic signals of the polystyrene
block in combination with the GPC results of the corresponding polystyrene precursor.
Structural analysis of the bulk structures reveals that all systems except S16V21T63138 exhibit a
lamellar morphology. S16V21T63138 forms a hexagonal array of core-shell cylinders with a PS
core surrounded by a P2VP shell embedded within a PtBMA matrix2.
8.2.2. Sample Preparation
Block copolymer solutions in THF with concentrations ranging from 30 to 50 wt.- % were
used for the present study. The alignment experiments were performed in a home-built
capacitor with gold electrodes (sample depth = 5 mm, electrode distance: 1 – 2 mm) at room
temperature. A DC voltage between 0.25 and 5 kV was applied resulting in a homogeneous
electric field pointing perpendicular to the X-ray beam direction. Both the voltage at the

Chapter 8 Alignment of AB and ABC Block Copolymers
157
electrodes and the current were monitored during the course of the experiment indicating only
a small leakage current (~ 0.01 mA) during the first few seconds after the field was applied.
8.3. Results and Discussion
8.3.1. Polystyrene-b-poly(2-vinyl pyridine) S50V5078
8.3.1.1. Concentration Dependence of the Microdomain Structure in
Solution
We studied the evolution of structure of the S50V5078 diblock copolymer in THF solution in
the absence of the electric field as a function of polymer concentration, starting from
wp = 30 wt.-% and increasing wp stepwise by 2.5 wt.-% up to 50 wt.-%.
0.0 0.1 0.2 0.3 0.4 0.5 0.61
10
102
103
104
105
106
107
Inte
nsity
[co
unts
]
q [nm-1]
Figure 8-1: Scattering intensity profiles of S50V5078 solutions in THF at various concentrations.
35 wt.-% (�), 37.5 wt.-% (�), 50 wt.-% (�).
As shown in Figure 8-1 we find the formation of a narrow first order reflection when
increasing the concentration from 35 wt.-% to 37.5 wt.-%. Starting from 37.5 wt.-%, the block
copolymer solutions become birefringent (not shown here) and we observe higher order
scattering peaks which correspond to integer multiples of the first order signal. The latter
indicates the formation of lamellar microdomains in the solution. In addition, as shown in
Figure 8-2, we find a continuous increase of the lamellar spacing d100 = 2�/q100 with

Chapter 8 Alignment of AB and ABC Block Copolymers
158
increasing polymer concentration, indicating an increasing segregation power (or repulsive
interactions) between the PS and P2VP chains as the polymer concentration increases. We
anticipate that at higher concentrations, the spacing gradually approaches the melt lamellar
spacing of 43 nm. The dependence of the lamellar spacing d on the polymer volume fraction
�p scales as d ~ �p 0.21 ± 0.02 for intermediate concentrations as can be seen from the double
logarithmic plot in Figure 8-3. Similar to the systems described in chapter 6 and 7, we may
conclude from the predictions made by Shibayama et al.3 and Leibler and Frederickson4 for
block copolymer solutions in the strong and weak segregation limit, respectively, that the
positive exponent found in our experiments indicates that the PS-b-P2VP chains in our
solutions are strongly segregated.
From the experimental observations described above, we locate the order-disorder
transition (ODT) at room temperature at a polymer concentration between 35 and 37.5 wt.-%.
This assignment is further corroborated by the absence of birefringence at and below
wp = 35 wt.-%. It has been shown both experimentally and theoretically that phase-separated
(ordered) block copolymer materials consisting of randomly oriented lamellae are
birefringent5,6,7. Therefore, the lack of birefringence indicates the absence of randomly
oriented lamellae. From the SAXS experiments, we find an increase in scattering intensity at
and above wp = 37.5 wt.-%, accompanied by a sharpening of the signal and the evolution of
higher order Bragg peaks with increasing concentration (Figure 8-1). Additional evidence is
given by the fact that only starting from 37.5 wt.-% we observe an anisotropic scattering
pattern in the absence of the electric field, which indicates some microdomain alignment
induced either by shear (during filling of the sample chamber) or by preferential attraction of
one block to the electrode surface. We note that the broad peak in the scattering profile at and
below 35 wt.-% is due to composition fluctuations found commonly in the disordered state
(correlation hole).
8.3.1.2. Reorientation Behavior
After filling the samples into the capacitor, all phase-separated solutions exhibit a
distinctly anisotropic scattering pattern with maxima located at � = 0° and 180°, respectively
(Figure 8-4). This finding indicates an alignment of the lamellae parallel to the electrodes,
which may be caused both by preferential interaction of the PS with the Au surfaces and by
possible shear forces acting on the highly viscous solutions during filling of the capacitor with
a syringe. In order to destroy any possible alignment induced by the preparation process, we
heated the solutions above the order-disorder transition temperature. However, after cooling,

Chapter 8 Alignment of AB and ABC Block Copolymers
159
still some alignment of the domains parallel to the electrodes prevailed, indicating the
importance of the surface effects8.
30 35 40 45 5030
32
34
36
38
ODT
d [n
m]
wp [wt.-%]
Figure 8-2: Concentration dependence of the lamellar spacing for S50V5078 solutions in THF
(dbulk = 43 nm).
As soon as the electric field is applied, the scattering pattern changes significantly. The
peaks at � = 0° and 180° decrease and new scattering maxima at � = 90° and 270° grow with
time (Figure 8-4). To quantify the kinetics of the orientation process, P2(t) was calculated
from the 2D SAXS patterns as described above. Using a single exponential fit, we can
determine the time constant � of the reorientation process.
Concentration [wt.-%] � [sec] P2, �
2 [10-4] ��[Pa sec]
35 (a) (a) (a) 8
37.5 0.28 -0.15 2.0 66
40 0.84 -0.19 1.1 107
47.5 5.6 -0.27 1.3 258
50 6.4 -0.28 1.5 269
Table 8-1: Time constants � of the reorientation behavior of S50V5078 at different polymer concentrations
obtained from least squares fits according to Equation 6-3 (E = 2 kV/mm, 1 mm electrode
distance). (a) system not phase separated
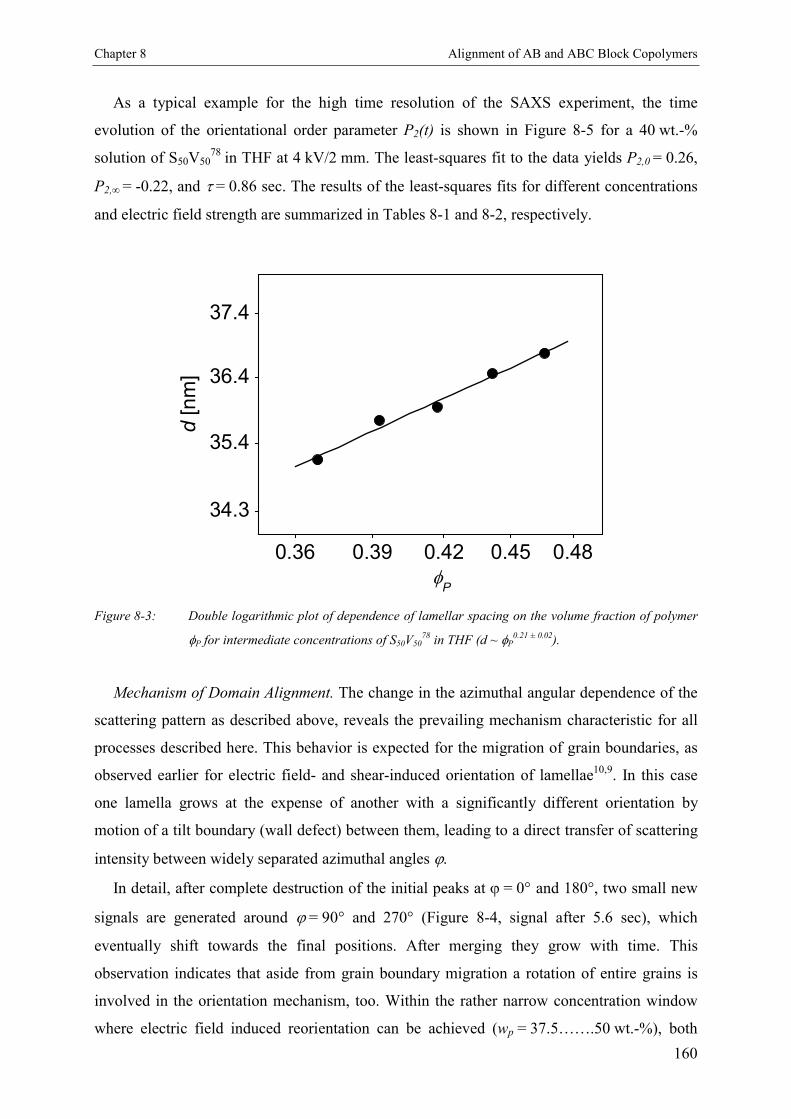
Chapter 8 Alignment of AB and ABC Block Copolymers
160
As a typical example for the high time resolution of the SAXS experiment, the time
evolution of the orientational order parameter P2(t) is shown in Figure 8-5 for a 40 wt.-%
solution of S50V5078 in THF at 4 kV/2 mm. The least-squares fit to the data yields P2,0 = 0.26,
P2, = -0.22, and � = 0.86 sec. The results of the least-squares fits for different concentrations
and electric field strength are summarized in Tables 8-1 and 8-2, respectively.
0.36 0.39 0.42 0.45 0.48
34.3
35.4
36.4
37.4
d [n
m]
�P
Figure 8-3: Double logarithmic plot of dependence of lamellar spacing on the volume fraction of polymer
�P for intermediate concentrations of S50V5078 in THF (d ~ �P
0.21 ± 0.02).
Mechanism of Domain Alignment. The change in the azimuthal angular dependence of the
scattering pattern as described above, reveals the prevailing mechanism characteristic for all
processes described here. This behavior is expected for the migration of grain boundaries, as
observed earlier for electric field- and shear-induced orientation of lamellae10,9. In this case
one lamella grows at the expense of another with a significantly different orientation by
motion of a tilt boundary (wall defect) between them, leading to a direct transfer of scattering
intensity between widely separated azimuthal angles �.
In detail, after complete destruction of the initial peaks at � = 0° and 180°, two small new
signals are generated around � = 90° and 270° (Figure 8-4, signal after 5.6 sec), which
eventually shift towards the final positions. After merging they grow with time. This
observation indicates that aside from grain boundary migration a rotation of entire grains is
involved in the orientation mechanism, too. Within the rather narrow concentration window
where electric field induced reorientation can be achieved (wp = 37.5…….50 wt.-%), both

Chapter 8 Alignment of AB and ABC Block Copolymers
161
mechanisms coexist, but the overall process is dominated by the migration of grain
boundaries.
0 90 180 270 360
Inte
nsi
ty [a.u
.]
� [°]
Figure 8-4: Azimuthal angular dependence of the scattering intensity for a 40 wt.-% S50V5078 solution in
THF exposed to an electric field of E = 1 kV/mm: 0 sec (�), 5.6 sec (�), 16.4 sec (�),
50.6 sec (�).
8.3.1.3. Kinetics of Microphase Orientation
Concentration Dependence. The kinetics of the alignment of the microdomains formed in
the S50V5078 block copolymer system was measured in a 1 mm capacitor at E = 2 kV/mm for a
narrow concentration window from 37.5 wt.-% (where phase separation sets in) to 50 wt.-%.
As anticipated from the increasing solution viscosities, the time constants, �, increase with
increasing polymer concentration. Nevertheless, they are still rather small and range from
0.28 sec for 37.5 wt.-% to 6.4 sec for 50 wt.-%. The results of the exponential fits according
to Equation 6-3 are summarized in Table 8-1. The single exponential fit works quite well for
all concentrations studied, as can be seen from the low �2 values.
We find that depending on the concentration, i.e. the degree of phase separation, the
limiting value of the orientational order parameter P2, shows a clear tendency to higher
values, starting from P2, = -0.15 low polymer concentrations and eventually reaching -0.28
at the highest polymer concentration studied. Obviously, in contrast to earlier investigations
on polystyrene-b-poly(2-hydroxyethyl methacrylate)-b-poly(methyl methacrylate) (SHM) and
polystyrene-b-polyisoprene (SI) block copolymers as described in chapters 6 and 7 10, the
polymer concentration not only influences the rate of orientation but also the final degree of
alignment (P2, ). In the following we will compare the SHM system already described in
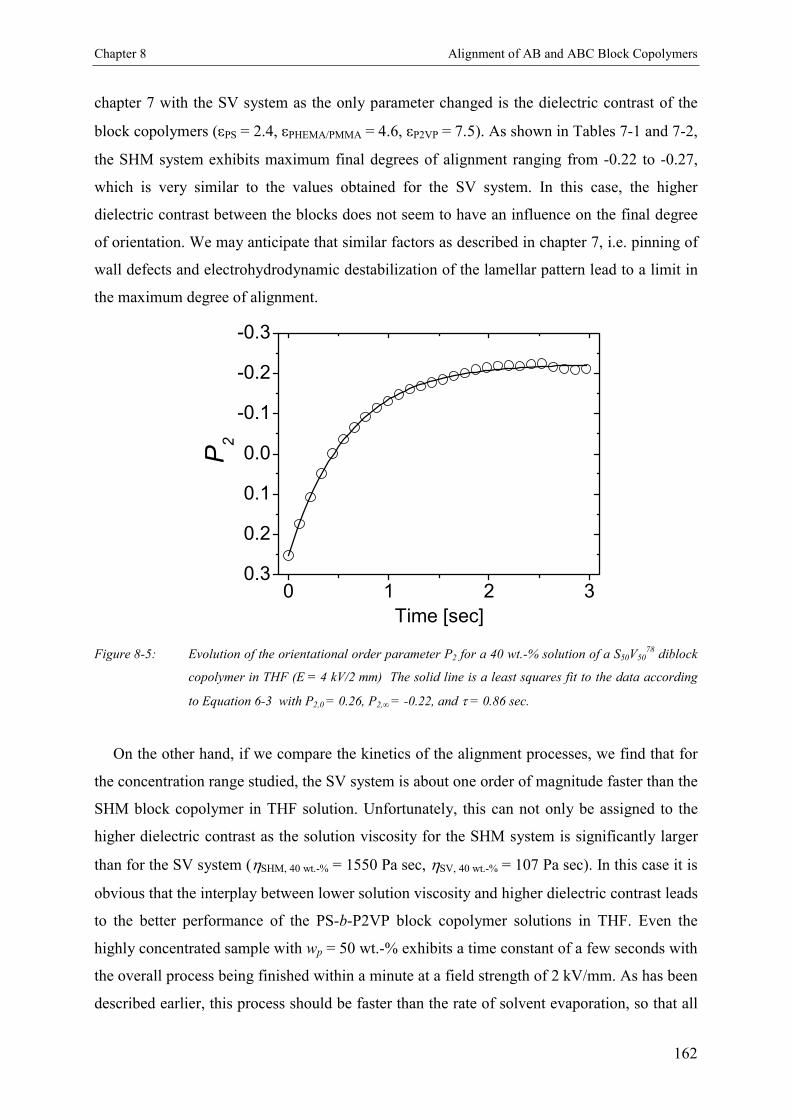
Chapter 8 Alignment of AB and ABC Block Copolymers
162
chapter 7 with the SV system as the only parameter changed is the dielectric contrast of the
block copolymers (�PS = 2.4, �PHEMA/PMMA = 4.6, �P2VP = 7.5). As shown in Tables 7-1 and 7-2,
the SHM system exhibits maximum final degrees of alignment ranging from -0.22 to -0.27,
which is very similar to the values obtained for the SV system. In this case, the higher
dielectric contrast between the blocks does not seem to have an influence on the final degree
of orientation. We may anticipate that similar factors as described in chapter 7, i.e. pinning of
wall defects and electrohydrodynamic destabilization of the lamellar pattern lead to a limit in
the maximum degree of alignment.
0 1 2 30.3
0.2
0.1
0.0
-0.1
-0.2
-0.3
Time [sec]
P 2
Figure 8-5: Evolution of the orientational order parameter P2 for a 40 wt.-% solution of a S50V5078 diblock
copolymer in THF (E = 4 kV/2 mm) The solid line is a least squares fit to the data according
to Equation 6-3 with P2,0 = 0.26, P2, = -0.22, and � = 0.86 sec.
On the other hand, if we compare the kinetics of the alignment processes, we find that for
the concentration range studied, the SV system is about one order of magnitude faster than the
SHM block copolymer in THF solution. Unfortunately, this can not only be assigned to the
higher dielectric contrast as the solution viscosity for the SHM system is significantly larger
than for the SV system (�SHM, 40 wt.-% = 1550 Pa sec, �SV, 40 wt.-% = 107 Pa sec). In this case it is
obvious that the interplay between lower solution viscosity and higher dielectric contrast leads
to the better performance of the PS-b-P2VP block copolymer solutions in THF. Even the
highly concentrated sample with wp = 50 wt.-% exhibits a time constant of a few seconds with
the overall process being finished within a minute at a field strength of 2 kV/mm. As has been
described earlier, this process should be faster than the rate of solvent evaporation, so that all

Chapter 8 Alignment of AB and ABC Block Copolymers
163
concentrations up to 50 wt.-% could be used for macroscopic alignment of melt samples via
solvent casting.
Using a home-built capacitor which allows application of an electric DC field during film
formation by solvent casting, we demonstrate the feasibility of such a process. An example is
shown in Figure 8-6, where we display SAXS data of a melt sample prepared from a
37.5 wt.-% solution cast in the presence of an electric field of 2 kV/mm.
EE
A
0 90 180 270 360
P2 = -0.28
Inte
nsi
ty [a.u
.]
� [°]
B
C
Figure 8-6: SAXS and TEM data of a S50V5078 melt sample prepared from a 37.5 wt.-% solution cast in the
presence of an electric field of 2 kV/mm. (A) 2D-SAXS pattern and (B) azimuthal intensity
distribution at first order reflection. (C) TEM micrograph (stained with iodine). The arrow
indicates the direction of the electric field vector. The scale bar represents 500 nm.

Chapter 8 Alignment of AB and ABC Block Copolymers
164
Electric Field Strength Dependence. In order to investigate the influence of the electric
field strength on the orientation kinetics we varied the electric field strength from
0.125 kV/mm to 2.5 kV/mm. In this case a 40 wt.-% solution of the S50V5078 block copolymer
was studied at room temperature in a 2 mm capacitor in order to minimize potential surface
effects.
0.0 0.5 1.0 1.5 2.0 2.5
0
50
100
150
200
250
300
E [kV/mm]
� [se
c]
Figure 8-7: Electric Field dependence of time constant � for 40 wt.-% solutions of a S50V5078 diblock
copolymer in THF. Electrode distance: 2mm. The solid line represents a least squares fit of the
power law � = �(E - Et)a + � to the data yielding � = 0.19 sec, a = -1.4, Et = 200 V/mm, and
� = 0 sec.
Voltage [kV/mm] � [sec] P2, �
2 [10-4]
0.125 (a) (a) (a)
0.25 280 -0.19 1.8
0.5 20.9 -0.22 3.2
1 7.1 -0.24 1.3
1.5 2 -0.24 2.7
2 0.86 -0.22 3.0
2.5 0.24 -0.20 3.4
Table 8-2: Time constants � of the reorientation behavior of S50V5078 at different field strength obtained
from least squares fits according to Equation 6-3 (wp = 40 wt.-%, electrode distance: 2mm).
(a) no electric field induced orientation detected

Chapter 8 Alignment of AB and ABC Block Copolymers
165
The results of the least squares fits according to Equation 6-3 are summarized in Table 8-2
and shown in Figure 8-7. The quality of the single exponential fits can be inferred from the
low �2 values. The limiting values P2, always reach a value around P2, = -0.22 � 0.03.
Increasing the field strength, does not seem to have an effect on the plateau values. The time
constants ���range from 280 sec for low electric fields (0.250 kV/mm) to as low as 0.24 sec for
the highest field strength (2.5 kV/mm). On the time scale of our experiment, we were not able
to detect any reorientation for electric fields below 0.125 kV/mm. Therefore, we conclude that
there exists a threshold field strength Et below which no field induced reorientation is
possible. Above Et, the time constant scales with the electric field strength in a hyperbolic
power law dependence � = �(E - Et)a + � . The data points are best fitted for � = 0.19 sec,
a = -1.4 and Et = 200 V/mm (solid line in Figure 8-7).
The asymptotic behavior at high electric fields (i.e. for a large force acting on the lamellae)
indicates � = 0 sec for infinite field strength. This is expected in the absence of any
electrorheological effects and limits in single chain diffusion, as the dominating process at
wp = 40 wt.-% is the migration of grain boundaries.
If we consider the dependence of the rate constant, 1/�, we find for our system a cubic
exponent. This is a significantly stronger dependence than expected theoretically as derived
from Equation 1-17 (1/� ~ E2)11. As can be seen in chapters 6 and 7, this has been found for
all diblock copolymer systems under investigation in this work.
Polymer Et [kV/mm] ��
PS-b-PI 350 0.2
PS-b-PHEMA-b-PMMA 310 2.2
PS-b-P2VP 200 5.1
Table 8-3: Threshold field strengths and dielectric contrast of different diblock copolymers.
Another property common to all diblock copolymer samples is the low threshold field
strength which ranges between 200 and 350 V/mm and decreases with increasing polarity of
the second block. In the sequence PS-b-PI/PS-b-PHEMA-b-PMMA/PS-b-P2VP, the
asymmetry in the surface tension between the blocks increases and therefore the interaction
with the electrode surface field becomes stronger, i.e. one of the blocks interacts with the
surface increasingly stronger than the other block and the surface field strength increases. In a
recent theoretical work, Tsori and Andelman12 have predicted that the threshold field strength

Chapter 8 Alignment of AB and ABC Block Copolymers
166
for a transition from an alignment of the lamellae parallel to the electrodes to a mixed
morphology only depends on the dielectric contrast between the blocks, i.e. a larger dielectric
contrast is expected to decreases the threshold field. This prediction is corroborated by our
experimental results as the threshold field strength for our systems decreases with increasing
dielectric contrast as shown in Table 8-3. This agreement is even more surprising as
intuitively one would have expected the polarity of the second block of our systems to lead to
an increase in the threshold field strength due to a stronger surface field.
8.3.2. Polystyrene-b-poly(tert-butyl methacrylate)
S50T50100
In the following we will consider the different kinetic behaviors of the various block
copolymer systems consisting of PS, P2VP and PtBMA.
Similar experiments as described above for the S50V5078 block copolymer system were also
conducted for the S50T50100 diblock copolymer and for the triblock copolymers S27V35T38
84 and
S16V21T63138. For S50T50
100 solutions in THF we find a weakly established lamellar phase
starting at a polymer concentration of about 40 wt.-%. Even the 50 wt.-% solution exhibits
large concentration fluctuation scattering around the beam stop as can be seen in Figure 8-8A.
Nevertheless, we identify weak first and second order maxima. Due to the larger interaction-
parameter �ST as compared to �SM, the solutions phase separate at lower concentrations than
the respective PS-b-PMMA system, which has been described in chapter 7. As this also
results in a lower solution viscosity at the order-disorder transition, the electric field induced
force on the lamellae is sufficient to induce a reorientation very similar to the processes
already discussed10.
If we compare the diblock copolymers S50V5078 and S50T50
100, we find that at a polymer
concentration of 40 wt.-% the S50T50100 system is by far not as strongly phase separated as the
S50V5078 block copolymer. Obviously, the effective interaction-parameter �ST in THF solution
is smaller than �SV. For a 40 wt.-% solution the concentration fluctuations associated with the
disordered regions are even more pronounced. From Figure 8-8B we can see the time
evolution of the orientational order parameter for the first order reflexion. Due to the weak
phase separation, we observe a sigmoidal curve, which is characteristic for a non-cooperative
process. As the system is not yet fully phase-separated, there are only small grains of ordered
regions in a disordered matrix. Therefore, direct interaction between the grains during the
reorientation process is inhibited, leading to the observed non-cooperative induction period at

Chapter 8 Alignment of AB and ABC Block Copolymers
167
early stages of reorientation. A fit to the empirical function P2(t) = �
�
�
�
�
�
,2/)(
,20,2
01P
e
PPtt �
yields a
time constant � = 9.7 sec and a plateau value P2, = -0.14.
0.0 0.1 0.2 0.3 0.4 0.5 0.610
102
Inte
nsi
ty [co
unts
]
q [nm-1]
A
0 10 20 30 40 50 600.2
0.1
0.0
-0.1
-0.2
Time [sec]
P 2
B
Figure 8-8: (A) Scattering intensity profile of a 50 wt.-% solution of S50T50100 in THF. (B) Evolution of
orientational order parameter with time for a 40 wt.-% solution of S50T50100 in THF at
2 kV/mm: � = 9.7 sec, P2, = -0.14.
As we are dealing with a very weakly phase-separated system, the final degree of
orientation is low as anticipated from the concentration dependence of P2, for the S50V5078
block copolymers as shown in Table 8-1. Furthermore, the S50V5078 system exhibits a much
faster reorientation behavior than S50T50100, which can be explained by a combination of the
different degrees of phase separation and the difference in the dielectric constants. With

Chapter 8 Alignment of AB and ABC Block Copolymers
168
�P2VP = 7.5 the dielectric constant of P2VP nearly twice as large as the respective value of
PtBMA which is expected to be around 3.4 13, similar to PMMA. In addition, as has been
described by Amundson et al., since the formation of grains of a certain size is required for an
effective coupling between the microdomains and the electric field, the weak phase separation
of S50T50100 might lead to a reduction of the effective driving force for the overall orientation
process.
Nevertheless, it has been demonstrated that THF solutions of PS-b-P2VP as well as a PS-
b-PtBMA can be aligned by virtue of an external electric field. This result finally lead us to
investigate the orientation behavior of more complex triblock copolymers composed of the
above described diblock copolymer components.
0.0 0.1 0.2 0.3 0.4 0.5 0.6
10-1
1
Inte
nsi
ty [counts
]
q [nm-1]
Figure 8-9: Scattering intensity profile of a 40 wt.-% solution of S27V35T3884 in THF.
8.3.3. Polystyrene-b-poly(2-vinyl pyridine)-b-poly(tert-butyl methacrylate) S27V35T38
84 and S16V21T63138
In order to demonstrate the feasibility of our solvent-based orientation method for higher
molecular weight polymers and more complex block copolymer systems, which can not be
aligned by conventional melt-based processes, we additionally investigated a lamellar
(S27V35T3884) and a core-shell cylindrical (S16V21T63
138) PS-b-P2VP-b-PtBMA triblock
copolymer of 84,000 g/mol and 138,000 g/mol molecular weight, respectively.

Chapter 8 Alignment of AB and ABC Block Copolymers
169
0 90 180 270 360
Inte
nsity
[a.u
.]
���[°]
A
0 50 100 150 200 2500.1
0.0
-0.1
-0.2
-0.3
Time [sec]
P 2
B
Figure 8-10: (A) Azimuthal angular dependence of the scattering intensity for a 40 wt.-% solution of
S27V35T3884 in THF at 2 kV/2 mm: 0 sec (�), 5 sec (�), 10 sec (�), 85 sec (�). (B) Time
evolution of P2 for the same system, � = 17.7 sec, P2, = -0.21.
S27V35T3884 phase-separates at concentrations above 37.5 wt.-% in THF. In Figure 8-9 we
show the scattering intensity profile of a 40 wt.-% solution of S27V35T3884 in THF. Clearly
several higher order scattering maxima at integer multiples of the first order Bragg peak can
be identified. After filling the capacitor we also find lamellae predominantly aligned parallel
to the electrode surfaces. Once the electric field is switched on, the scattering pattern changes
significantly. As can be seen from the azimuthal angular dependence of the scattering
intensity in Figure 8-10A, the initial peaks at � = 0° and 180° disappear within the first 5
seconds of the experiment and new peaks at � = 90° and 270° grow with time. This indicates
the migration of grain boundaries as the dominating mechanism, which has previously been

Chapter 8 Alignment of AB and ABC Block Copolymers
170
observed for lamellar diblock copolymer solutions10. The evolution of the orientational order
parameter with time for the above described process is shown in Figure 8-10B. The solid line
represents a least-squares fit to the data according to Equation 6-3 yielding a time constant
� = 17.7 sec and a plateau value P2, = -0.21. As anticipated from the measurements dealing
with the respective diblock systems, the electric field induced orientation of S27V35T3884 is a
fast and well-controlled process, which can be described by a single exponential.
0.0 0.1 0.2 0.3 0.4 0.5 0.6
10-2
10-1
1
16
12
97
4
3
1
Inte
nsity
[co
unts
]
q [nm-1]
Figure 8-11: Scattering intensity profile of a 40 wt.-% solution of S16V21T63138 in THF.
Figure 8-11 shows the SAXS pattern of a 40 wt.-% solution of S16V21T63138 in THF. From
the relative peak positions at 1, 3 , 2, 7 , 3, and 12 we infer a hexagonally ordered
cylindrical morphology. For the alignment experiments we start with orientation of the
cylinders parallel to the electrodes, so that a hexagonal scattering pattern is observed (Figure
8-12A). The initial peaks of the hexagonal pattern merge to form new signals at � = 90° and
270° (Figure 8-12B/C). Therefore, we can identify the migration of grain boundaries as the
governing process. The reorientation of the cylindrical microdomains is significantly slower
than the reorientation of the lamellae in S27V35T3884. The least-squares fit to the calculated P2
values according to Equation 6-3 gives a time constant of � = 480 sec and a plateau value
P2, = -0.23 (solid line in Figure 8-12D).

Chapter 8 Alignment of AB and ABC Block Copolymers
171
0 90 180 270 360
Inte
nsity
[a
.u.]
���[°]
C
0 300 600 900 1200 1500
0.0
-0.1
-0.2
Time [sec]
P 2
D
A B
0 sec 1500 sec
Figure 8-12: 2D SAXS pattern of a 40 wt.-% solution of S16V21T63138 in THF (A) prior to and (B) after
application of the electric field. (C) Azimuthal angular dependence of the scattering intensity
for a 40 wt.-% solution of S16V21T63138 in THF at 2 kV/2 mm: 0 sec (�), 45 sec (�), 330 sec
(�), 1500 sec (�). (D) Time evolution of orientational order parameter P2 for the same
system: � = 480 sec, P2, = -0.23.
On one hand, we may assume that the slow kinetic behavior is due to the higher solution
viscosity of the higher molecular weight block copolymer solution at constant concentration.
In addition, there is an electrostatic argument, as the electric field induced driving force also

Chapter 8 Alignment of AB and ABC Block Copolymers
172
depends on the volume fraction of the dielectric bodies in the solution. As the cylindrical
microdomains exhibit an asymmetry where PS and P2VP represent the minority component
embedded within a PtBMA matrix, the driving force for reorientation should be significantly
smaller than for the lamellar case. Nevertheless, time permitting the cylinders will also align
predominantly parallel to the electric field vector.
8.4. Conclusion
Using Synchrotron-SAXS we have identified migration of grain boundaries as the
governing mechanism of the electric field induced microdomain alignment of a PS-b-P2VP
block copolymer in solution. In addition, we found a concentration range from 37.5 wt.-% up
to 50 wt.-%, in which reorientation of the lamellar microdomains can be realized on the time
scale of a few seconds. The variation of the electric field strength revealed a threshold value
(Et = 200 V/mm), below which no electric field induced orientation can be achieved. In
summary, the maximum final orientation reached in solution could be described by order
parameters of up to P2 = -0.28. The time constants of the fastest processes were in the range
of 0.3 sec.
In addition, the time resolved SAXS measurements allowed us to study the kinetic
behavior of a PS-b-PtBMA, which - in contrast to PS-b-PMMA - showed electric field-
induced orientation of the microdomains due to a larger interaction parameter �ST compared to
�SM leading to a phase-separated solution at lower viscosities. Furthermore, we could show
that the even more complex lamellar and core-shell cylindrical PS-b-P2VP-b-PtBMA high
molecular weight triblock copolymer systems could be oriented by virtue of an electric field
from solution.
We have demonstrated that our solvent-based method for electric field-induced alignment
of block copolymer microdomains can be applied successfully to a large variety of block
copolymer compositions and microstructures, even at molecular weights too high for melt-
based procedures.

Chapter 8 Alignment of AB and ABC Block Copolymers
173
AcknowledgementThe authors thank H. Krejtschi and his team for the skillful assistance in building the
capacitors, K. Matussek for the viscosity measurements and T. Goldacker for the synthesis of
S50T50100. A.B. acknowledges a Kekulé fellowship by the Stiftung Stipendien-Fonds des
Verbandes der Chemischen Industrie and the BMBF. We are grateful to the ESRF for
financial support and provision of synchrotron beam time. This work was carried out in the
framework of the Sonderforschungsbereich 481 funded by the German Science Foundation
(DFG).
Chapter 8 Alignment of AB and ABC Block Copolymers
174
References
1 Giebeler, E.; Stadler, R. Macromol. Chem. Phys. 1997, 198, 3815.
2 Ludwigs, S.; Böker, A.; Abetz, V.; Müller, A.H.E.; Krausch, G. Polym. Prepr. 2002 in print.
3 Shibayama, M.; Hashimoto, T.; Hasegawa, H.; Kawai, H. Macromolecules 1983, 16, 1427.
4 Frederickson, G.H.; Leibler, L. Macromolecules 1989, 22, 1238.
5 Amundson, K.; Helfand, E.; Patel, S.S.; Quan, X.; Smith, S.D. Macromolecules 1992, 25,
1953.
6 Balsara, N.P.; Perahia, D.; Safinya, C.R.; Tirrell, M.; Lodge, T.P. Macromolecules 1992, 25,
3896.
7 Balsara, N.P.; Hammouda, B.; Kesani, P.K.; Jonnalagadda, S.V.; Straty, G.C.
Macromolecules 1994, 27, 2566.
8 Anastasiadis, S.H.; Russell, T.P.; Satija, S.K.; Majkrzak, C.F. Phys. Rev. Lett. 1989, 62,
1852.
9 Polis, D.L.; Smith, S.D.; Terrill, N.J.; Ryan, A.J.; Morse, DC; Winey, K.I. Macromolecules
1999, 32, 4668.
10 Böker, A.; Elbs, H.; Hänsel, H.; Knoll, A.; Ludwigs, S.; Zettl, H.; Urban, V.; Abetz, V.;
Müller, A.H.E.; Krausch, G. in preparation.
11 Amundson, K.; Helfand, E.; Quan, X.; Smith, S.D. Macromolecules 1993, 26, 2698.
12 Tsori, Y.; Andelman, D. Macromolecules 2002, 35, 5161.
13 Polak, A.J.; Sundahl, R.C. . Polymer 1989, 30, 1314.

Chapter 9 Summary
175
Chapter 9
Summary
The influence of external fields on the microdomain structure of block copolymers has
been studied. Both surface fields and electric fields have been considered.
The first part describes the synthesis and characterization of ABC triblock copolymers
aiming towards the generation of tailor-made substances for the controlled patterning of
surfaces on nanometer scale. It is demonstrated that thin and ultrathin films of polystyrene-b-
poly(2-vinyl-pyridine)-b-poly(methyl methacrylate) and polystyrene-b-poly(2-hydroxyethyl
methacrylate)-b-poly(methyl methacrylate) block copolymers on silicon wafers reveal regular
surface patterns with worm-, stripe- or island-like morphologies. The characteristic spacings
can be controlled via the molecular weight of the different blocks of the respective
copolymers and the film thickness.
Thin films (~ 20 nm thickness) prepared by dip-coating from a polymer solution were
found to exhibit a phase-separated worm-like surface morphology that presumably only
consists of PS and PMMA microdomains with a characteristic lateral length scale similar to
the bulk period L0. The generation of such a striped surface pattern can be explained by
complete coverage of the silicon oxide surface by PHEMA or P2VP, resulting in a thin film
structure that consists of a homogeneous layer of the middle block adsorbed at the substrate
covered with a laterally microphase-separated surface layer of PS and PMMA microdomains.
The proposed model for this morphology is in agreement with recent self-consistent field
calculations.
In the case of the ultrathin films (thickness � 7 nm), our results demonstrate that adsorption
of a block copolymer as an ultrathin film leads to a periodic surface domain structure
(stripes), where both polar blocks (B and C) adsorb to the surface. Due to significant
stretching of the adsorbed blocks the spacings between the domains are large for the rather

Chapter 9 Summary
176
low molecular weight block copolymers. The lateral dimensions correlate well with the
molecular dimensions of the A and B/C blocks according to recently derived scaling laws.
In the second part of this thesis external electric fields are used to create macroscopically
oriented bulk samples. In order to circumvent limitations associated with the application of
external fields to melts of high molecular weight block copolymers and multiblock
copolymers of complex architecture, a new solvent-based procedure is introduced, i.e. the
block copolymer microdomains are aligned by application of an electric field
(E ~ 1 - 2 kV/mm) during solvent casting of bulk samples.
In order to elucidate the dominating parameters and governing mechanisms, the
microdomain orientation kinetics of concentrated block copolymer solutions exposed to a DC
electric field is investigated by time-resolved synchrotron small-angle X-ray scattering
(SAXS) at the ID02A beamline at the European Synchrotron Radiation Facility (ESRF) in
Grenoble, France. As a first model system, a lamellar polystyrene-b-polyisoprene block
copolymer dissolved in toluene is used. The orientation kinetics follows a single exponential
behavior with characteristic time constants varying from a few seconds to some minutes
depending on polymer concentration, temperature, electric field strength, and system size.
Furthermore, two mechanisms governing the electric field alignment of a lamellar block
copolymer from concentrated solutions are identified. It is shown that depending on the
segregation power (� � �P, � � 1/T) a single mechanism dominates the orientation process,
i.e. in a weakly segregated system (low concentration or high temperature) the migration of
boundaries prevails, whereas a stronger phase separated system (high concentration or low
temperature) predominantly exhibits rotation of grains.
In addition, the orientation kinetics slows down with increasing polymer concentration,
which can be correlated to the respective solution viscosity and the mechanism of orientation.
Moreover, the influence of the electric field strength on the orientation kinetics is determined,
including a threshold value below which no electric field induced orientation could be
achieved on the time scale of the experiment. The time constants of the fastest processes were
in the range of 0.5 sec, reaching a final orientation described by order parameters of up to
P2 = -0.35. Finally, the variation of temperature yields control of the governing mechanisms
at a fixed polymer concentration.
In additional studies, the dielectric contrast of the block copolymer components was varied
systematically (PS-b-PI, PS-b-PMMA, PS-b-PtBMA, PS-b-PHEMA-b-PMMA, PS-b-P2VP).
It is found that a high dielectric contrast leads to faster alignment kinetics (e.g. the time
Chapter 9 Summary
177
constants of the fastest processes for a PS-b-P2VP diblock system in THF are in the range of
0.3 sec) and reduces the threshold field strength (around 200 V/mm for PS-b-P2VP).
Furthermore, it could be shown that the interplay between degree of phase-separation,
solution viscosity and dielectric contrast is crucial to decide if a given polymer/solvent system
can be used for electric field-induced microdomain alignment. For example, it was found that
PS-b-PtBMA shows electric field-induced orientation of the microdomains while PS-b-
PMMA does not. This can be explained by the larger interaction parameter �ST compared to
�SM leading to a phase-separated solution at lower viscosities. In a similar way, the
introduction of a high dielectric constant middle block (PHEMA) into a PS-b-PMMA, which
additionally enhances phase separation, is shown to be the key to creating a well-performing
methacrylate-based block copolymer system for electric field induced alignment from
solution.
Finally, we could show that the even more complex lamellar and core-shell cylindrical PS-
b-P2VP-b-PtBMA high molecular weight triblock copolymer systems could be oriented by
virtue of an electric field from solution.
In summary, it was demonstrated that electric field alignment of block copolymer domains
from solution is a powerful tool to generate highly anisotropic bulk block copolymer samples.
The large variety of parameters which we can control allows us to further improve the
preparation of macroscopically aligned melt samples via solvent casting in the presence of an
electric field.

Chapter 9 Zusammenfassung
178
Zusammenfassung
In der vorliegenden Arbeit wurde der Einfluß von äußeren Feldern auf die Mikrodomänen-
struktur von Blockcopolymeren untersucht. Dabei wurden sowohl Oberflächenfelder als auch
elektrische Felder betrachtet.
Im ersten Teil wird die Synthese und Charakterisierung von ABC Dreiblockcopolymeren
zur kontrollierten lateralen Strukturierung von Oberflächen auf Nanometerskala beschrieben.
Es wird gezeigt, daß dünne und ultradünne Filme aus Polystyrol-b-Poly(2-Vinylpyridin)-b-
Polymethylmethacrylat und Polystyrol-b-Poly(2-Hydroxyethylmethacrylat)-b-Polymethyl-
methacrylat auf Siliziumoberflächen regelmäßige Oberflächenstrukturen in Form von Streifen
oder Inseln ergeben. Die charakteristischen Abstände der Strukturen können mittels der
Filmdicke und dem Molekulargewicht der jeweiligen Blöcke gesteuert werden.
Durch Tauchbeschichten aus einer verdünnten Polymerlösung hergestellte dünne Filme
(ca. 20 nm dick) zeigen eine wurmartige Oberflächenmorphologie, die ausschließlich aus
Polystyrol- und Polymethylmethacrylatmikrodomänen besteht. Die charakteristische Wieder-
holungseinheit der Oberflächenstrukturen ist mit den Längenskalen der Volumenstruktur
identisch. Die Entstehung einer solchen Oberflächenmorphologie kann durch die vollständige
Adsorption des PHEMA- bzw. P2VP-Mittelblockes an die Siliziumoxidoberfläche bei
gleichzeitiger lateraler Entmischung der Außenblöcke erklärt werden. Das hier vorgestellte
Modell deckt sich mit jüngsten SCF-Rechnungen.
Im Fall der ultradünnen Filme (Filmdicke kleiner als 7 nm) zeigen die Ergebnisse, daß die
Adsorption der beiden polaren Blöcke B und C an die Substratoberfläche zu einer gestreiften
Oberflächenstruktur führt. Aufgrund der deutlichen Streckung der adsorbierten Blöcke erhält
man verhältnismäßig große Domänenabstande, die sehr gut mittels kürzlich etablierter
Skalengesetze anhand der molekularen Dimensionen beschrieben werden können.
Chapter 9 Zusammenfassung
179
Im zweiten Teil dieser Arbeit wurden externe elektrische Felder zur Herstellung von
makroskopisch ausgerichteten Volumenproben verwendet. Um Beschränkungen zu umgehen,
die üblicherweise mit der Ausrichtung von Mikrodomänen hochmolekularer Blockco-
polymere oder von Blockcopolymeren mit komplexem Aufbau aus der Schmelze verbunden
sind, wird eine neue Methode zur Ausrichtung aus Lösung vorgestellt. Dabei werden die
Mikrodomänen einer Blockcopolymerlösung während des Eintrocknens mit einem
elektrischen Feld (E ~ 1 - 2 kV/mm) parallel zu den elektrischen Feldlinien orientiert.
Um die Parameter und Mechanismen zu ergründen, die den Orientierungsprozess im
elektrischen Feld dominieren, sind die Kinetiken der Mikrodomänenorientierung in
konzentrierten Blockcopolymerlösungen unter Einfluß eines elektrischen Feldes mit Hilfe von
in-situ Röntgenkleinwinkelstreuung an der europäischen Synchrotronstrahlquelle (ESRF) in
Grenoble vermessen worden. Als erstes Modellsystem wurde ein Polystyrol-b-Polyisopren
Blockcopolymer in Toluollösung verwendet. Die Ausrichtungskinetik kann mit einer
Exponentialfunktion erster Ordnung beschrieben werden. Man erhält in Abhängigkeit von der
Polymerkonzentration, der Temperatur, der elektrischen Feldstärke, sowie dem Elektroden-
abstand unterschiedliche Zeitkonstanten von ein paar Sekunden bis zu wenigen Minuten.
Darüber hinaus wurden zwei Mechanismen identifiziert, die den Orientierungsvorgang
bestimmen. Es kann gezeigt werden, daß die Stärke der Phasenseparation (� � �P, � � 1/T) in
einer Blockcopolymerlösung über den dominierenden Mechanismus entscheidet. In einem
schwach phasenseparierten System (niedrige Konzentration oder hohe Temperatur) herrscht
die Wanderung von Korngrenzen vor. In einer stark phasenseparierten Probe (hohe
Konzentration oder niedrige Temperatur) findet man bevorzugt die Rotation von einzelnen
Körnern.
Außerdem nimmt die Orientierungsgeschwindigkeit mit zunehmender Polymerkonzen-
tration ab, welches mit der steigenden Lösungsviskosität (trotz zunehmender Phasen-
separation und ansteigender elektrostatischer Triebkraft für den Orientierungsprozeß) und
dem Mechanismus des Prozesses korreliert werden kann.
Darüber hinaus wurde der Einfluß der elektrischen Feldstärke auf die Ausrichtungskinetik
untersucht. Dabei konnten, je nach Polymersystem, unterschiedliche Grenzfeldstärken
bestimmt werden. Unterhalb einer solchen Grenzfeldstärke konnte keine Orientierung der
Mikrodomänen durch das elektrische Feld erzielt werden.
Die schnellsten Prozesse lassen sich mit Zeitkonstanten im Bereich von 0.5 Sekunden
beschreiben. Die höchste erreichte Ausrichtung ergibt einen Wert von –0.35 für den
Ordnungsparameter P2. Schließlich konnte gezeigt werden, daß durch Kontrolle der

Chapter 9 Zusammenfassung
180
Temperatur bei konstanter Konzentration, der dominierende Mechanismus der Mikro-
domänenausrichtung eingestellt werden kann.
In zusätzlichen Studien wurden die Dielektrizitätskonstanten der einzelnen Polymerblöcke
systematisch variiert (PS-b-PI, PS-b-PMMA, PS-b-PtBMA, PS-b-PHEMA-b-PMMA, PS-b-
P2VP). Dabei wurde festgestellt, daß die Orientierungsgeschwindigkeit mit erhöhtem
dielektrischen Kontrast zwischen den Blöcken ansteigt und die Grenzfeldstärke abnimmt (der
schnellste Prozeß für eine THF-Lösung von PS-b-P2VP verläuft mit einer Zeitkonstante von
0.3 Sekunden und eine Grenzfeldstärke von nur 200 V/mm).
Darüber hinaus konnte gezeigt werden, daß das Zusammenspiel von Phasenseparation,
Lösungsviskosität und dielektrischem Kontrast entscheidet, ob ein gegebenes
Polymer/Lösungsmittel-System für die Ausrichtung der Mikrodomänen im elektrischen Feld
verwendet werden kann. So wurde z.B. festgestellt, daß PS-b-PtBMA in THF ein geeignetes
System darstellt, wohingegen PS-b-PMMA ungeeignet ist. In diesem Fall führt der größere
Wechselwirkungsparameter �ST zur Phasenseparation in Lösung bei niedrigeren Viskositäten
als bei PS-b-PMMA. In ähnlicher Weise führt die Einführung eines Mittelblockes mit hoher
Dielektrizitätskonstante, der außerdem die Phasenseparation fördert, zu einem Blockco-
polymersystem auf Methacrylatbasis, dessen Mikrodomänen sich leicht im elektrischen Feld
ausrichten lassen.
Schließlich war es auch möglich, zylindrische Kern-Schale und lamellare Morphologien
hochmolekularer PS-b-P2VP-b-PtBMA Dreiblockcopolymere unter dem Einfluß eines
elektrischen Feldes aus Lösung zu orientieren.
Zusammenfassend kann man sagen, daß die Ausrichtung von Blockcopolymerdomänen
aus Lösung im elektrischen Feld ein vielversprechendes Verfahren zur Herstellung
makroskopisch orientierter Volumenproben darstellt. Die Kontrolle der oben genannten
Parameter, aufgrund der in dieser Arbeit beschriebenen Untersuchungen, erlaubt eine
deutliche Verbesserung dieses Prozesses.

Chapter 10 List of Publications
181
10. List of Publications
During the course of this thesis the following papers have been published:
A. Böker, A.H.E. Müller, G. Krausch*
”Nanoscopic Surface Patterns from Functional ABC Triblock Copolymers”Macromolecules 2001, 34, 7477.
A. Böker, A. Knoll, H. Elbs, V. Abetz, A.H.E. Müller, G. Krausch*
"Large Scale Domain Alignment of a Block Copolymers from Solution using Electric Fields"Macromolecules 2002, 35, 1319.
A. Böker, H. Elbs, H. Hänsel, A. Knoll, S. Ludwigs, H. Zettl, V. Urban, V. Abetz, A.H.E.Müller, and G. Krausch*
“Microscopic Mechanisms of Electric Field Induced Alignment of Block CopolymerMicrodomains”Phys. Rev. Lett. 2002, submitted.
A. Böker, T. Herweg, K. Reihs*
" Selective Alteration of Polymer Surfaces by Thermal Cleavage of Fluorinated Side Chains"Macromolecules 2002, 35, 4929.
R. Erhardt, A. Böker, H. Zettl, H. Kaya, W. Pyckhout-Hintzen, G. Krausch, V. Abetz*, A.H.E.Müller*
"Janus Micelles"Macromolecules 2001, 34, 1069.
H. Mori, A. Böker, G. Krausch, A.H.E. Müller*
"Surface-grafted Hyperbranched Polymer Films via Self-condensing Atom Transfer RadicalPolymerization from Silicon Surfaces"Macromolecules 2001, 34, 6871.
G. Cheng, A. Böker, M. Zhang, G. Krausch, A.H.E. Müller*
"Cylindrical Core-Shell Brushes via a "Grafting From' Process Using ATRP"Macromolecules 2001, 34, 6883.
H. Schmalz, A. Böker, R. Lange, G. Krausch, V. Abetz*
"Synthesis and Properties of ABA and ABC Triblock Copolymers with Glassy (A),Elastomeric (B), and Crystalline (C) Blocks"Macromolecules 2001, 34, 8720.
A. Böker, A.H.E. Müller, G. Krausch*
"Functional ABC triblock copolymers for controlled surface patterns on nanometer scale";Polym. Mater. Sci. Eng. 2001, 84, 312.
A. Böker, H. Elbs, H. Hänsel, A. Knoll, S. Ludwigs, H. Zettl, V. Urban, V. Abetz,A.H.E. Müller, and G. Krausch*
“Macroscopic Alignment of Concentrated Block Copolymer Solutions in Electric Fields”Polym. Prepr. 2002 in print.
Chapter 10 List of Publications
182
S. Ludwigs, A. Böker, V. Abetz, A.H.E. Müller and G. Krausch*
“Self-Assembly of Polystyrene-b-poly(2-vinylpyridine)-b-poly(tert-butyl methacrylate)(SVT) Triblock Copolymers in Bulk and in Thin Films”Polym. Prepr. 2002 in print.
A.H.E. Müller*, G. Cheng, A. Böker, G. Krausch"Unimolecular amphipolar nanocylinders via a 'grafting from' process using ATRP"Polym. Mater. Sci. Eng. 2001, 84, 91.
R. Erhardt, A. Böker, H. Zettl, H. Kaya, W. Pyckhout-Hintzen, G. Krausch, V. Abetz*, A.H.E.Müller*
"Superstructures of Janus Micelles"Polym. Mater. Sci. Eng. 2001, 84, 102.
H. Mori, A. Böker, G. Krausch, A.H.E. Müller*
"Hyperbranched (meth)acrylates grafted onto silicon"Polym. Mater. Sci. Eng. 2001, 84, 933.
H. Schmalz, A. Böker, R. Lange, V. Abetz*
"ABC Triblock Copolymers with Crystalline End Blocks and their Use as ThermoplasticElastomers"Polym. Mater. Sci. Eng. 2001, 85, 478.
Presentations at international meetings:
DPG, Potsdam, März 2000, Poster presentation:”Synthese und Charakterisierung von funktionellen mikrophasenseparierten ABCDreiblockcopolymeren zur Erzeugung lateral strukturierter Oberflächen”
IUPAC World Polymer Congress, Warschau, Juli 2000, Poster presentation:“Synthesis and Characterization of Functional ABC Triblock Copolymers for ControlledSurface Patterns on Nanometer Scale”
ACS, San Diego, April 2001, Oral presentation:”Nanoscopic Surface Patterns from Functional ABC Triblock Copolymers”
DPG, Regensburg, März 2002, Oral presentation:”Orientation Kinetics of Block Copolymer Solutions under the Influence of an Electric Field”
APS, Indianapolis, April 2002, Poster presentation:”Electric Field Induced Macroscopic Alignment of Concentrated Block Copolymer Solutions”

Danksagung
Diese Arbeit wäre ohne die Unterstützung, die ich von vielen Seiten erhalten habe, nicht
möglich gewesen. Besonders bedanken möchte ich mich bei:
Prof. Georg Krausch für die interessante und vielseitige Aufgabenstellung, die intensive
Förderung dieser Arbeit und die Diskussionsbereitschaft, sowie Gespräche, die nicht immer
nur physikalische Themen zum Inhalt hatten.
Prof. Axel Müller für alle Ratschläge, die die hohe Kunst der anionischen Polymerisation
betrafen und manchmal auch darüber hinaus gingen.
Meinen beiden Chefs für die Möglichkeit, eine Doktorarbeit, zwischen den doch recht
unterschiedlichen Welten von Physikern und Chemikern anzufertigen, sowie die Aufrecht-
erhaltung einer sehr fruchtbaren Kooperation zwischen Physikalischer und Makromolekularer
Chemie.
Dr. Volker Abetz für sein großes Interesse am E-Feld-Thema, die wertvolle Hilfe während
des ersten Grenoble Aufenthalts und die zahlreichen Diskussionen zur Auswertung der
Streudaten.
Prof. H. Brand für die sehr hilfreichen Diskussionen über das Verhalten von Polymeren im
elektrischen Feld.
Darüber hinaus möchte ich mich bei allen ehemaligen und jetzigen Mitgliedern der MC II und
PC II bedanken, die auf verschiedenste Weise zum Gelingen dieser Arbeit beigetragen haben.
Mein besonderer Dank gilt:
Holger Schmalz für seine immerwährende Hilfsbereitschaft, die gute Arbeitsatmosphäre im
Labor, sowie nicht zuletzt die unerschütterliche Unterstützung in allen Computerfragen.
Heiko Zettl für die große Hilfe bei Planung und Bau der Kondensatoren und des Meßaufbaus
für die Synchrotronmessungen, seinen unermüdlichen Meßdrang während diverser Nacht-
schichten in Grenoble und die Erkenntnis, daß kein Problem, möge es auch noch so
aussichtslos scheinen, unlösbar ist.
Helmut Hänsel für die Entwicklung des Auswerteprogramms zur automatisierten Berechnung
der vielen hundert Orientierungsparameter aus jeder Synchrotronmessung, sowie die gekonnte

Handhabung der vielen Gigabytes an Daten. Dadurch wurde die Dauer dieser Arbeit um Jahre
verkürzt.
Armin Knoll für die zahlreichen Diskussionen, Tips und Tricks, die das Leben als Chemiker
an einem „Physik-Lehrstuhl“ ernorm erleichtert haben und die Hilfe bei verschiedenen
„physikalischen“ Rechnungen.
Hubert Elbs für die geteilte Fußball-Leidenschaft und viele Hinweise, die den Einstieg in das
E-Feld-Thema deutlich erleichtert haben.
Sabine Ludwigs für die gute Zusammenarbeit während der SVT-Synthesen.
Ein großer Dank gebührt außerdem den verschiedenen Meßteams von Grenoble, die mir
teilweise auch Daten „im Schlaf“ beschert haben.
Außerdem möchte ich mich ganz herzlich bedanken bei:
Gaby Oliver und Sybille Zimmermann, dem guten Geist der PC II, für die großen und kleinen
Hilfen in allen bürokratischen und organisatorischen Belangen.
Astrid Göpfert für die TEM-Messungen und die Geduld auf der Suche nach ausgerichteten
Mikrodomänen, Clarissa Drummer für die schönen SEM-Bilder, Kerstin Matussek für die
Viskositätsmessungen, Markus Hund für viele technische Hilfen und den Glasbläsern und
Mitarbeitern der NW I-Werkstatt um Herrn Krejtschi, ohne deren handwerkliches Geschick
so mancher Kondensator und Meßaufbau nur eine Skizze geblieben wäre.
Ein herzlicher Dank gilt Holger Schmalz, Gerd Mannebach, Katja Loos und Heiko Zettl für
die gute Freundschaft und vielen Gespräche, die weit über das Fachliche hinausgegangen sind
und mir in Bayreuth ein angenehmes Umfeld geschaffen haben.
Schließlich möchte ich mich noch bei meiner Familie für die große und unersetzliche
Unterstützung während des Studiums und der Promotion bedanken.
Für die finanzielle Unterstützung danke ich besonders:
Dem Fonds der Chemischen Industrie und dem BMBF für ein Kekulé-Stipendium, dem
Sonderforschungsbereich 481, Teilprojekt A2, sowie der European Synchrotron Radiation
Facility (ESRF) in Grenoble.

Erklärung
Die vorliegende Arbeit wurde von mir selbstständig verfasst und ich habe dabei keine anderen
als die angegebenen Hilfsmittel und Quellen benutzt.
Ferner habe ich nicht versucht, anderweitig mit oder ohne Erfolg eine Dissertation einzu-
reichen oder mich der Doktorprüfung zu unterziehen.
Bayreuth, den 18.7.2002
(Alexander Böker)