THE EFFECT OF DIFFERENT FRYING CONDITIONS ON THE …
8
CARPATHIAN JOURNAL OF FOOD SCIENCE AND TECHNOLOGY journal homepage:http://chimie-biologie.ubm.ro/carpathian_journal/index.html 35 THE EFFECT OF DIFFERENT FRYING CONDITIONS ON THE COLOR PARAMETERS OF PURPLE SWEET POTATO (Ipomoea batatas Poiret) SLICES Rahmat Fadhil 1 *, Diswandi Nurba 2 , Kiki Ikhwanto 2 1 Department of Agricultural Engineering, Syiah Kuala University, Jalan Teungku Hasan Krueng Kalee No.3 Darussalam 23111, Banda Aceh, Indonesia 2 Laboratory of Postharvest Technology, Syiah Kuala University, Darussalam 23111, Banda Aceh, Indonesia * [email protected] Article history: Received : 26 April 2016 Accepted : 6 June 2017 ABSTRACT The aim of the research was to analyze of the surface color measurement to the pre-frying and post-frying purple sweet potato (Ipomea batatas Poiret) slices by using a combining device i.e. the digital camera and the graphic software. It is believe that such analysis method able to observe colors and an average in a value of L*a*b* units of food ingredient surfaces. The digital images of purple sweet potato slices could be displayed on the computer screen or printed on a certain piece of paper their colors and structures can be analyzed. To do so, the method of digital image application is used, namely a digital camera Canon Ixus 145 without using the camera light and with the distance focus of 10 cm from the object. Following that, the resulted images, were plotted against colors on the Adobe Photoshop CS5. The results show that the use of the Adobe Photoshop CS5 software is extremely helpful in measuring colors of purple sweet potato chips due to the fact that it could bring a consistency when defining colors of pre-frying and post-frying slices with the system model of L*a*b* units. Overall, this study found that there is no difference in colors between pre-frying purple sweet potatoes and the post-frying ones in various treatments by the variance analysis and continued to the Duncan Multiple Range Test (DMRT) at a confidence level of 95 percent (p<0.05), except those in a fractional number of treatments. Keywords: Color; Purple sweet potato; L*a*b* model; Frying; Adobe Photoshop CS5. 1. Introduction A food visual appearance is still a primary consideration for consumers to assess and decide to buy a food product. The food color is relatively one important parameter for consumers to select foods that would be consumed. This, at once, becomes a decision in accepting those food ingredients, whether it is proper to be accepted by consumers. The visual on colors sometimes is more preferred by consumers rather than observation on other quality parameters and it provides a clue regarding chemical changes in food ingredients (Winarno, 2002). The digital image is a process aiming to manipulate and analyze color images in which involves many visual perceptions and supported by a computer. The image processing aims to see the detail of image qualities in order to be interpreted easily by humans or machines (Wijaya et al., 2007). Overall, there are three measurement models of a color space, those are the RGB (red, green, blue) model (for televisions, computer screens, scanners, and digital cameras), the CYMK (cyan, magenta, yellow, black) model (for printing industries) and the CIE Lab model or also called as the L*a*b* color m o d e l (used in laboratories of
Transcript of THE EFFECT OF DIFFERENT FRYING CONDITIONS ON THE …
CARPATHIAN JOURNAL OF FOOD SCIENCE AND TECHNOLOGY
journal homepage:http://chimie-biologie.ubm.ro/carpathian_journal/index.html
35
THE EFFECT OF DIFFERENT FRYING CONDITIONS ON THE COLOR
PARAMETERS OF PURPLE SWEET POTATO (Ipomoea batatas Poiret)
SLICES
Rahmat Fadhil1*, Diswandi Nurba2, Kiki Ikhwanto2
1 Department of Agricultural Engineering, Syiah Kuala University, Jalan Teungku Hasan Krueng Kalee
No.3 Darussalam 23111, Banda Aceh, Indonesia
2 Laboratory of Postharvest Technology, Syiah Kuala University, Darussalam 23111, Banda Aceh, Indonesia
Article history:
Received :
26 April 2016
Accepted :
6 June 2017
ABSTRACT
The aim of the research was to analyze of the surface color measurement to
the pre-frying and post-frying purple sweet potato (Ipomea batatas Poiret)
slices by using a combining device i.e. the digital camera and the graphic
software. It is believe that such analysis method able to observe colors and
an average in a value of L*a*b* units of food ingredient surfaces. The
digital images of purple sweet potato slices could be displayed on the
computer screen or printed on a certain piece of paper their colors and
structures can be analyzed. To do so, the method of digital image
application is used, namely a digital camera Canon Ixus 145 without using
the camera light and with the distance focus of 10 cm from the object.
Following that, the resulted images, were plotted against colors on the
Adobe Photoshop CS5. The results show that the use of the Adobe
Photoshop CS5 software is extremely helpful in measuring colors of purple
sweet potato chips due to the fact that it could bring a consistency when
defining colors of pre-frying and post-frying slices with the system model
of L*a*b* units. Overall, this study found that there is no difference in
colors between pre-frying purple sweet potatoes and the post-frying ones in
various treatments by the variance analysis and continued to the Duncan
Multiple Range Test (DMRT) at a confidence level of 95 percent (p<0.05),
except those in a fractional number of treatments.
Keywords:
Color;
Purple sweet potato;
L*a*b* model;
Frying;
Adobe Photoshop CS5.
1. Introduction A food visual appearance is still a primary
consideration for consumers to assess and
decide to buy a food product. The food color is
relatively one important parameter for
consumers to select foods that would be
consumed. This, at once, becomes a decision in
accepting those food ingredients, whether it is
proper to be accepted by consumers. The visual
on colors sometimes is more preferred by
consumers rather than observation on other
quality parameters and it provides a clue
regarding chemical changes in food ingredients
(Winarno, 2002). The digital image is a
process aiming to manipulate and analyze color
images in which involves many visual
perceptions and supported by a computer. The
image processing aims to see the detail of image
qualities in order to be interpreted easily by
humans or machines (Wijaya et al., 2007).
Overall, there are three measurement
models of a color space, those are the RGB
(red, green, blue) model (for televisions,
computer screens, scanners, and digital
cameras), the CYMK (cyan, magenta, yellow,
black) model (for printing industries) and the
CIE Lab model or also called as the L*a*b*
color m o d e l (used in laboratories of
Fadhil et al. Carpathian Journal of Food Science and Technology 2017, 9(2), 35-42
36
color
measurement) (Fernandez et al., 2005). The
color model most commonly used is the L*a*b*
color model since it has a homogenous color
distribution (Leon et al., 2005, Zhang et al.,
2010). The homogeneity of color perceptions
carries an appropriate guarantee of color
differences and is essential for the process of
segmentation (Dong & Xie, 2005). This color
space is able to depict all colors that could be
seen by human eyes and is often used as a
reference of color spaces (Yam & Papadakis,
2004).
The color measurement of food ingredients
in L*a*b units is an international standard of a
color measurement developed by the
Commission Internationale d’Eclairage (CIE)
in 1976. The L*a*b color model comprises 3
components, those are the L* dimension as
luminance (color brightness) whose the value
ranges from 0 to 100, in which 0 is for black
and 100 is for white; the a* dimension
describing the color types of green-red, in
which a negative indicates a green color and
the reverse indicates a red color; and the b*
dimension for the color types of blue-yellow, in
which a negative indicates a green color and
the reverse indicates a yellow color. The a* and
b* dimensions are color dimensions opposite to
each other ranging from -120 to +120. The
L*a*b is an independent device that provides
consistent colors regardless of the inputs or
outputs. It is specifically devices of digital
cameras, scanners, monitors, and printers
(Widiasri, 2013; Lukinac et al., 2009; Yam and
Papadakis, 2004).
Soaking in the sodium bicarbonate
(NaHCO3) solution aims for crisping and would
produce the CO2 gas. As the concentration of
NaHCO3 improves, more gas will be generated
in food ingredients when the frying process is conducted. This gas builds some pores in the food ingredients. Due to a large number of pores in the ingredients, their mass becomes lower and will be friable to loads or outer forces exposed to them. As more pores are
built, the texture of chips produced will be much crispier (Shinta et al., 1995; Putranto et
al., 2013). The NaHCO3 is one of cake
improvers and a firming agent of fried foods in the form of white powder. As the concentration of NaHCO3 and the frying
temperature increase, the hardness value of chips will decline (Winarno, 2002).
2.Materials and methods
2.1. Tools and material
The tools used in this study were knifes,
peel removers, stoves, pans, plastic washbasins,
food jars, plastic bags, manual chip slicers,
digital scales, thermometers, a digital camera
Canon Ixus 145 (DIGIC 4, 16.0 MP, 28-224
mm, 8x optical, 16x zoom plus, 1600 max. ISO
value, ½.3 type CCD, 2.7- i nch LCD), and the
Adobe Photoshop CS5 program (Adobe System,
2010).
The main material used in this research was
the purple sweet potato obtained from famers in
the Sare area, Aceh Besar Regency, Aceh
Province, Indonesia. Purple sweet potatoes used
in this study were cropped in approximately 4-5
months of age after planting. In addition,
supporting materials included in this research
were sodium bicarbonate (NaHCO3), salt
(NaCl), water, and Bimoli brand cooking oil
produced by PT. Salim Ivomas Pratama Tbk.
2.2. Research procedures
The fresh purple sweet potatoes were washed
to get rid of any dirt, then they were weighed
in 500 grams and sliced in various thicknesses of
1 mm, 2 mm, and 3 mm. After slicing, each of
them were weighed before soaking in a
solution of 2% salt and 1 L of water within
10 minutes. Following that, the next soaking
used a solution of NaHCO3 at concentrations of 1
gram/liter water, 3 grams/liter water, and 5
grams/liter water within 30 minutes respectively
in order to enable chips to be crispy. Then, the
analysis of pre-frying purple sweet potatoes was
conducted.
The purple sweet potato slices were fried
on the stove at the temperatures ranging from
145oC to 150
oC for 2-3 minutes. The volume of
cooking oil was 2 L for 500 grams of sweet

Fadhil et al. Carpathian Journal of Food Science and Technology 2017, 9(2), 35-42
37
potato s l i c e s from various thicknesses and
NaHCO3 concentrations. The cooking oil
was replaced in each completed frying so as
each treatment was conducted with the new
cooking oil. A thermometer was inserted
directly into the oil in order to keep the
temperature range desired. Since the
temperature stability of frying purple sweet
potato chips would determine colors and
crispness of chips produced, the chips from
each treatment, after frying, were weighed
and putted into jars. Finally, the color
measurement of post-frying sweet potato
slices was carried out.
2.3. The color measurement
The method of digital image taking was
conducted with a Canon Ixus 145 digital
camera having a resolution of 16 megapixels
without the camera light and with the focus
distance of 10 cm from objects in light rooms.
The digital image taking was performed in two
times of repetitions in each treatment of
ingredients. The digital images obtained were
saved in the SanDisk Ultra 30 MB/s memory
card at a capacity of 8 GB in the PNG (Portable
Network Graphics) format. Those images, then,
were transferred to a PC to be plotted against
colors on Adobe Photoshop CS5, thereby
obtaining the RGB (Red, Green, Blue) values at
a color intensity ranging from 0 to 225 (Magdić
and Dobričević, 2007; Lukinac et al., 2009).
Hue angles were obtained using the method
described by Precil (1953), that is:
Where R0, G0 and B0 indicate the color
parameters of sweet potato slices. The
calculation of R, G, and B values were shown
by the 0o
(red), 60o
(yellow), 120o
(green), 180o
(cyan), 240o
(blue), 300o
(magenta) degrees.
The average values of each color of purple
sweet potato slices were presented as the final
result of the color determination plotted along
R, G, B axises (Figure 1).
Figure 1. The graphic representation of color spaces along R, G and B axis (White, 2003).
Accordingly, the values of X, Y, Z could
be calculated using an
equation from the Commission on Illumination
(CIE) (White, 2003) as follows:
X = 0,607R+0,174G+0,201B
Y = 0,299R+0,587G+0,114B
Z = 0.066G+1.117B
Fadhil et al. Carpathian Journal of Food Science and Technology 2017, 9(2), 35-42
38
Subsequently, by using the system of
Hunter-Lab, the values of a* and b* that would
be plotted into the L*a*b* (Hunter-Lab, 2008)
units were gained; therefore digital images of
purple sweet potato chips were obtained.
L* = 25(100Y/100)1/3-16
a* = 500[(X/98.071)1/3-(Y/100)]1/3
b* = 200[(Y/100)1/3-
(Z/118.225)]1/3
2.4. The experiment design
This research used the Randomized
Completely Design with 3 treatments and 2
repetitions. Factors that were tested included
the purple sweet potato thicknesses of 1 mm, 2
mm, and 3 mm as well as the sodium
bicarbonate (NaHCO3) concentrations of 1
gram/liter, 3 grams/liter and 5 grams/liter.
Hence, there were 9 combinations of the
treatment and 2 repetitions so as the total was
18 experimental units. Data obtained, then, was
subjected to Analysis of Variance (ANOVA)
using a SAS software, version 9.1.3 (SAS
Institute Inc., 2006) and was tested further by
the Duncan Multiple Range Test (DMRT) at
the uncertainty of 5% (Gomez and Gomez,
1984; Sastrosupadi, 2000; Steel and Torie,
1980).
3.Results and discussions
There are several reasons to select the
Adobe Photoshop as a color measurement
method. Firstly, this software has numerous
features of picture editing and an analysis
capability comparable to other more expensive
softwares. Secondly, this software also
provides a more advance capability to manage
colors and create consistent colors rather than
other graphic softwares. Furthermore, it is
available in many computer laboratories and
also supported by the manufacturer and users
(Yam et al., 2004).
The average values of pre-frying and post-
frying color measurements from various
treatments and thicknesses of purples sweet
potato slices were obtained using the Adobe
Photoshop CS5. The L*, a*, and b* values
from purple sweet potato slices could be seen
in Table 1. The L* average values of purple
sweet potato slices gained range from 48.01
(the lowest) to 74.10 (the highest). The former
was obtained from a treatment of 3 grams/1 L
water NaHCO3 concentration and a slice
thickness of 2 mm (K2S2) and the latter was
obtained from a treatment of 5 grams/1 L water
NaHCO3 concentration and a slice thickness of
3 mm (K3S3). Whereas, the a* average values
of purple sweet potato slices gained range from
-8.28 (the lowest) to 27.04 (the highest). The
former was obtained from a treatment of 3
grams/1 L water NaHCO3 concentration and a
slice thickness of 3 mm (K2S3) and the latter
was obtained from a treatment of 1 gram/1 L
water NaHCO3 concentration (K1S1) and a
slice thickness of 1 mm (K1S1). Whilst, the b*
average values of purple sweet potato slices
gained range from 3.59 (the lowest) to 64.49
(the highest). The former was obtained from a
treatment of 3 gram/1 L water NaHCO3
concentration and a slice thickness of 1 mm
(K2S1) and the latter was obtained from a
treatment of 5 grams/1 L water NaHCO3
concentration and a slice thickness of 1 mm
(K3S1).
This color measurement is extremely
important in food industries since a large
amount of information, nowadays, could be
received from measurements at the level of
pixels that would enable better
characterizations of food color images. The
measurement in identifying food colors
commonly used is the one with the model of
L*a*b* units, due to the homogenous
distributions so as the results resemble colors
perceived by humans (Leon et al., 2006;
Papadakis et al., 2000; Segnini et al., 1999).
In brief, the results show that there is no
significant difference among colors created
from the treatment of various NaHCO3
concentrations and the different thicknesses of
purple sweet potato slices (L*: K1S1, K2S1,
K3S1; a*: K1S1, K2S1, K1S2, K2S2, K3S2,
K1S3, K2S3, K3S3; b*: K1S1, K2S1, K2S2,
K3S2, K1S3, K2S3, K3S3).
Fadhil et al. Carpathian Journal of Food Science and Technology 2017, 9(2), 35-42
39
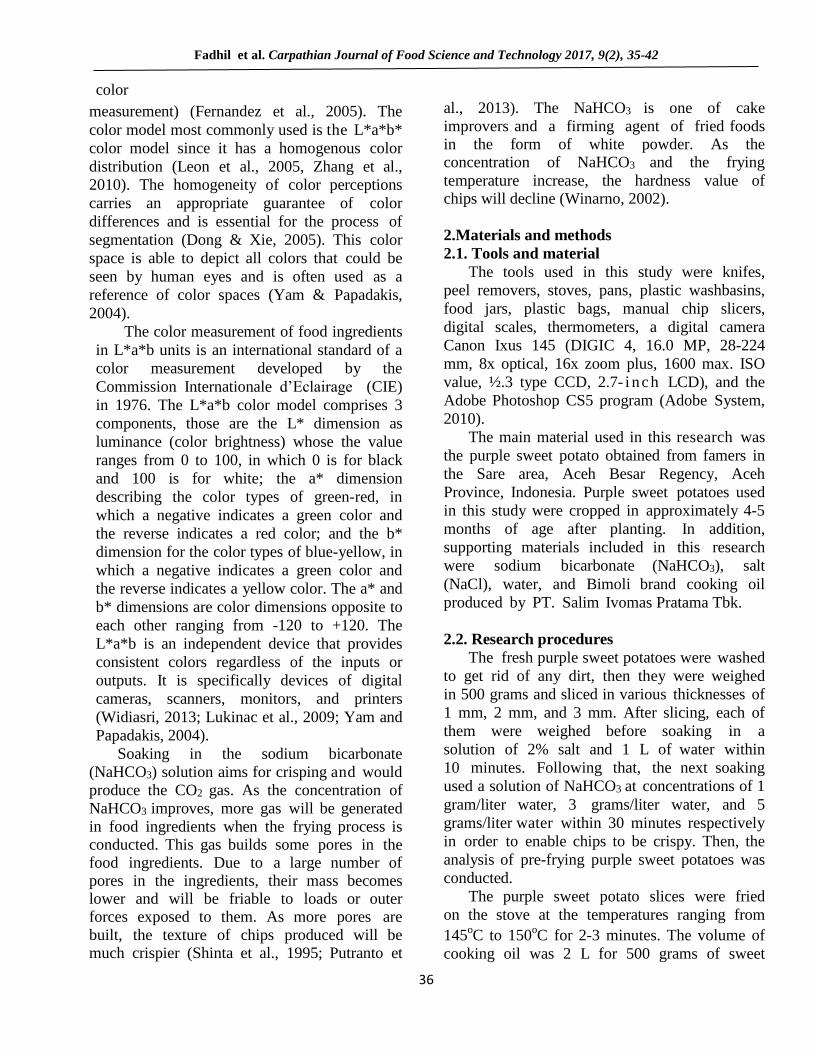
Table 1. The L*a*b* unit values of pre-frying and post-frying purple sweet potato slices
3S3
The notification of same words in each column shows that there is no statistically significant difference (P>0.05)
Descriptions:
K1S1 = the NaHCO3 concentration of 1 gram and the thickness of 1 mm K2S1 = the NaHCO3 concentration of 3 grams and the thickness of 1 mm K3S1 = the NaHCO3 concentration of 5 grams and the thickness of 1 mm K1S2 = the NaHCO3 concentration of 1 gram and the thickness of 2 mm K2S2 = the NaHCO3 concentration of 3 grams and the thickness of 2 mm K3S2 = the NaHCO3 concentration of 5 grams and the thickness of 2 mm K1S3 = the NaHCO3 concentration of 1 gram and the thickness of 3 mm K2S3 = the NaHCO3 concentration of 3 grams and the thickness of 3 mm K3S3 = the NaHCO3 concentration of 5 grams and the thickness of 3 mm
Initial K1S1 K2S1 K3S1 K1S2 K2S2 K3S2 K1S3 K2S3
K
L* Pre 62.73 + 3.48 a 66.66 + 5.15 a 63,39 + 2.48 a 65,5 0 + 7.19 a 67,8 7 + 2.50 a 70,5 4 + 1.30 a 70,33 + 11.73 a 68,69 + 7.39 74,1 0 + 3.59 a
Post 62,43 + 5.03 a 57.25 + 14.08 a 55,27 + 1.81 a 51,4 3 + 0.00 b 48,0 1 + 0.00 b 57,0 8 + 8.02 b 60,25 + 0.79 a 65,55 + 4.99 60,4 7 + 9.72 a
a* Pre 27,04 + 16.14 a 10,59 + 13.37 a 13,45 + 1.97 a 8,7 3 + 6.18 a 3,0 0 + 4.16 a 6,76 + 12.77 a 3,51 + 6.21 a 4,04 + 14.58 a -2,4 2 + 0.13 a
Post 7,41 + 4.76 a 6,31 + 10.87 a 6,26 + 1.44 b 2,84 + 11.15 a 6,2 5 + 2.25 a 3,0 9 + 2.97 a 5,97 + 4.37 a -8,28 + 8.45 a -3,5 4 + 7.96 a
b* Pre 12,44 + 1.86 a 3,59 + 1.05 a 8,56 + 5.55 a 11,6 4 + 0.13 a 5,8 4 + 8.46 a 13,1 6 + 4.68 a 12,50 + 4.37 a 11,22 + 1.35 a 10,8 7 + 1.08 a
Post 6,55 + 1.35 a 6,85 + 4.51 a 64,49 + 17.90 b 4,8 2 + 0.91 b 14,2 2 + 9.59 a 11,4 5 + 6.48 a 4,07 + 9.48 a 12,94 + 12.55 a 13,4 1 + 1.89 a
Fadhil et al. Carpathian Journal of Food Science and Technology 2017, 9(2), 35-42
40
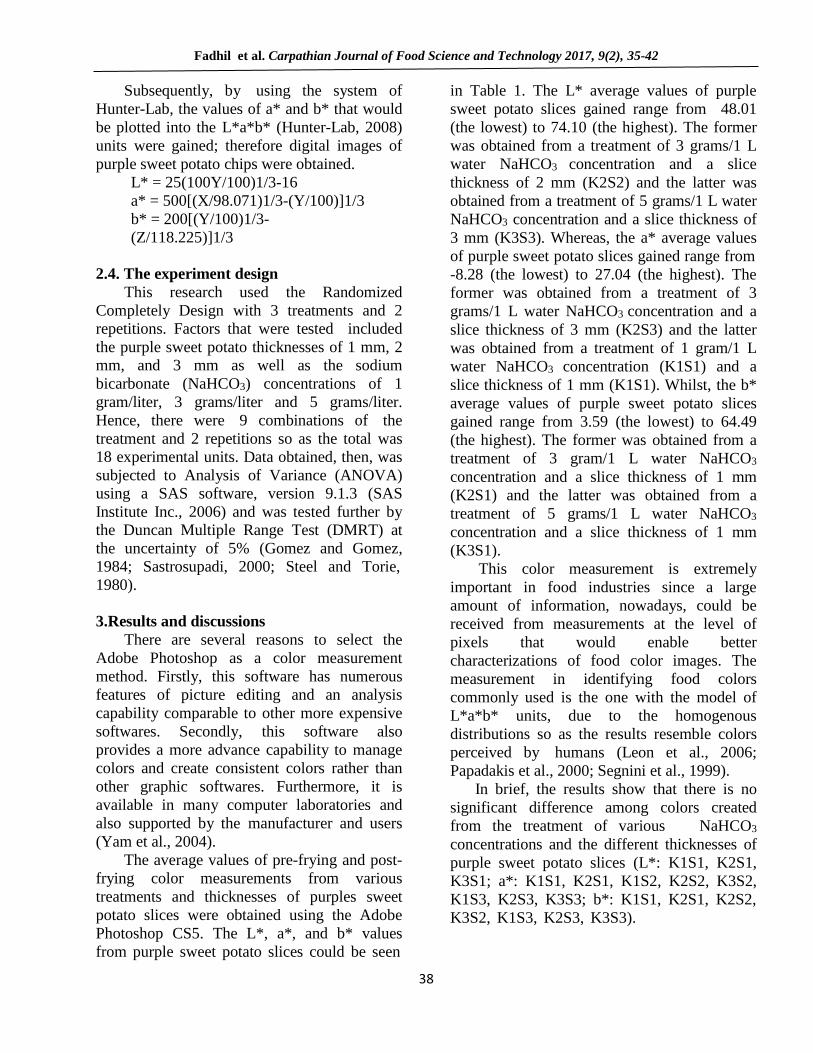
Figure 2. The graph of Pre-frying L*a*b values (Adopted from Konicaminolta, 2003)
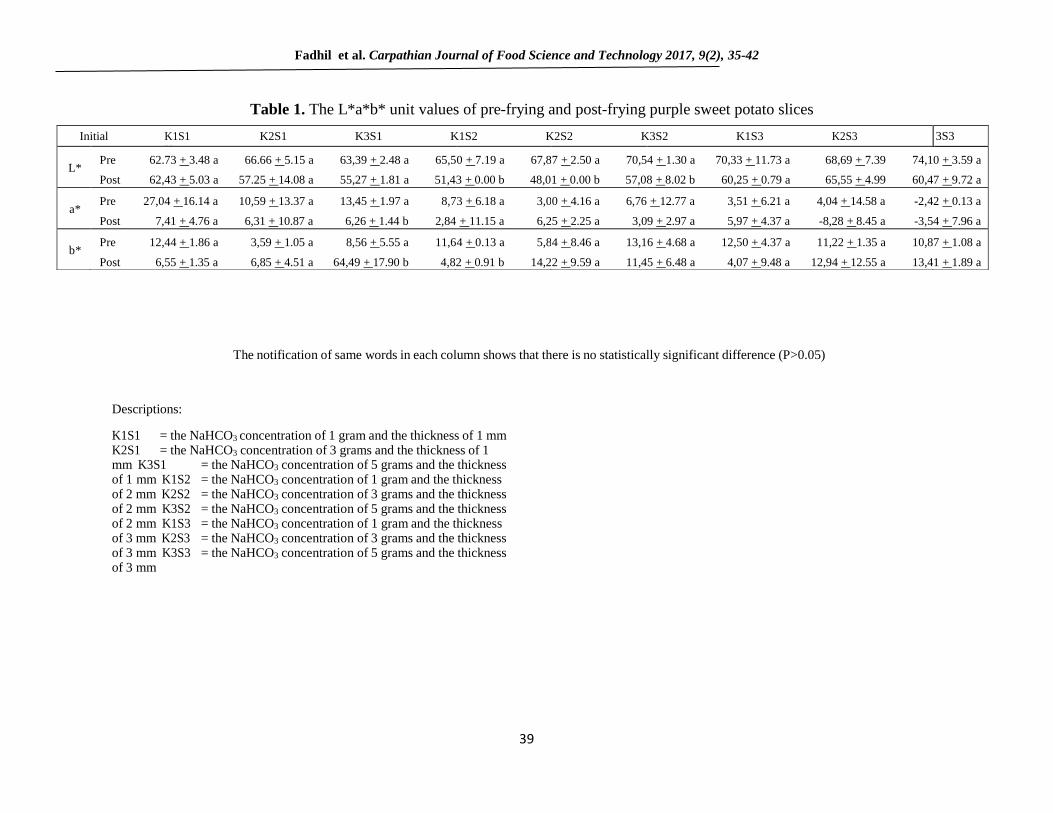
Figure 3. The graph of Post-frying L*a*b values (Adopted from Konicaminolta, 2003)
Fadhil et al. Carpathian Journal of Food Science and Technology 2017, 9(2), 35-42
41
Hoever, several other treatments show a
significant difference between those of pre-
frying and post-frying (L*: K1S2, K2S2,
K3S2; a*: K3S1; b*: K3S1,
K1S2) (Table 1). Figure 2 and Figure 3
also show the different L*a*b* values gained.
Apparently, it is due to the inhomogeneous
color of those purple sweet potato slices
resulting in the different L*a*b* values of each
thickness and NaHCO3 concentration.
4.Conclusions
The use of the Adobe Photoshop CS5
software is very helpful in analyzing colors of
purple sweet potatoes as it could provide a
consistency in defining colors of pre-frying and
post-frying slices with the system model of
L*a*b* units. Overall, there is no significant
difference among several treatments of pre-
frying and post-frying purple sweet potatoes by
the Duncan Multiple Range Test (DMRT) at
the confidence level of 95 percent (P<0.05),
except in a fractional number of treatments.
Consumer decision on food products,
particularly is based on the visual perception
and this becomes commonly the only one
immediate decision of the food product
acceptance. This coverage eventually suggests
that an analysis model of this system could be
used in analyzing colors of a food product,
particularly in observing the color distribution
of food ingredient surfaces having the average
values within L*a*b* units. Later on, it is
necessary to conduct a further research, in
particular for the application on different food
ingredients and products.
5.References
Adobe Systems. (2010). Adobe Creative Suite
5 Photoshop Scripting Guide. San Jose,
CA: Adobe Systems Inc.
Dong, G., Xie, M. (2005). Color Clustering and
Learning for Image Segmentation Based on
Neural Networks. IEEE Transactions on
Neural Networks, 16 (4), 925-936.
Fernandez, L., Castillero, C., Aguilera, J. M.
(2005). An Application of Image Analysis
to Dehydration of Apple Discs. Journal of
Food Engineering, 67 (1-2), 185-193.
Gomez, A. A., Gomez, K. A. (1984). Statistical
Procedures for Agricultural Research. 2nd
editions. John Wiley & Son, Canada.
Hunter-Lab. (2008). Insight on Color, CIE
L*a*b* Color Scale. Reston, VA, USA.
Konicaminolta. (2003). L*a*b* Color
Space.
Retrieved 15 January 2015 from http://www2.
konicaminolta.eu/eu/Measuring/pcc/en/part
1/ 07.html.
Leon K., Mery, D., Pedreschi, F., Leon, J.
(2006). Color measurement in L*a*b* units
from RGB digital images. Food Research
International, 39 (10), 1084-1091.
Lukinac, J., Jokic, S., Planinic, M., Magdic, D,
Velic, D., Bucic-Kojic, A., Bulic, M.,
Tomas, S. (2009). An Aplication of Image
Analysis and Colorimetric Methods on
Color Change of Dehydrated Asparagus
(Asparagus maritimus L.). Agriculturae
Conspectus Scientificus, 74 (3), 233-237.
Magdić, D., Dobričević, N. (2007). Statistical
Evaluation of Dynamic Changes of ‘Idared’
Apples Color During Storage. Agriculturae
Conspectus Scientificus, 72 (4), 311-316
Papadakis, S. E., Abdul-Malek, S., Kamden, R.
E., Yam, K. L. (2000). A Versatile and
Inexpensive Technique for Measuring
Color of Foods. Food Technology, 54 (12),
48–51.
Preucil, F. (1953). Color Hue and Ink Transfer,
Their Relation to Perfect Reproduction,
TAGA Proceedings, 102-110.
Putranto, A. W., Argo, B. D., Komar, N.
(2013). The Effect of Sodium Bicarbonate
Immersion and Frying Temperature toward
the Hardness Value of Cocoyam Chips
(Xanthosoma sagittifolium). Jurnal
Teknologi Pertanian, 14 (2), 105-114. [in
Indonesian].
SAS Institute Inc. (2006). SAS® 9.1.3
Language Reference: Dictionary, Fifth
Edition, Volumes 1-4. Cary, NC: SAS
Institute Inc.

Fadhil et al. Carpathian Journal of Food Science and Technology 2017, 9(2), 35-42
42
Sastrosupadi A. (2000). Design of Practical
Experiments for Agriculture. Edisi 6.
Kanisius, Yogyakarta. [in Indonesian].
Segnini, S., Dejmek, P., Oste, R. (1999). A
Low Cost Video Technique for Colour
Measurement of Potato Chips. LWT - Food
Science and Technology, 32 (4), 216–222.
Shinta, D. S., Susilowati, Buhasor, T. K.
(1995). The Effect of Reusing Cooking Oil
on the Quality of Cassava Chips. Warta
Industri Hasil Pertanian, Balai Penelitian
dan Pengembangan Industri Kecil Hasil
Pertanian. Bogor. [in Indonesian].
Steel, R. G. D., Torie, J. H. (1980). Principle
and Procedure of Statistics. Mc Graw Hill
Inc, New York.
White, B. M. (2003). System and Method for
Color Palette Conversion from TV Unsafe
to TV Safe Colors. US Patent
No.US2013/0086022 A1.
Widiasri, M. (2013). The Comparison of Color
Information Processing for Image
Segmentation Based on Neutrosophic Set.
Scan: Jurnal Teknologi Informasi dan
Komunikasi, VIII (1), 33-39. [in
Indonesian].
Wijaya, C. H., Marvin, Prijono, A. (2007).
Digital Image Processing using MATLAB
Image Processing Toolbox. Penerbit
Informatika. Bandung. [in Indonesian].
Winarno, F. G. (2002). Food Chemistry and
Nutrition. Penerbit Gramedia Pustaka
Utama, Jakarta. [in Indonesian].
Yam, K. L., Papadakis, S. E. (2004). A Simple
Digital Imaging Method for Measuring and
Analyzing Color of Food Surfaces. Journal
of Food Engineering, 61 (1), 137-142.
Zhang, M., Zhang, L., Cheng, H. D. (2010). A
Neutrosophic Approach to Image
Segmentation Based on Watershed Method.
Signal Processing, 90 (5), 1510-1517.