
The Electron Momentum Distribution in Leadzfn.mpdl.mpg.de/data/Reihe_A/48/ZNA-1993-48a-0343.pdf ·...
5
This work has been digitalized and published in 2013 by Verlag Zeitschrift für Naturforschung in cooperation with the Max Planck Society for the Advancement of Science under a Creative Commons Attribution 4.0 International License. Dieses Werk wurde im Jahr 2013 vom Verlag Zeitschrift für Naturforschung in Zusammenarbeit mit der Max-Planck-Gesellschaft zur Förderung der Wissenschaften e.V. digitalisiert und unter folgender Lizenz veröffentlicht: Creative Commons Namensnennung 4.0 Lizenz. The Electron Momentum Distribution in Lead * D. N. Timms Department of Applied Physics and Physical Electronics, Portsmouth Polytechnic, Portsmouth POl 2DZ, UK M. J. Cooper Department of Physics, University of Warwick, Coventry CV4 7AL, UK Z. Naturforsch. 48 a, 343-347 (1993); received January 11, 1992 Directional Compton profiles have been measured along the [100], [110] and [111] crystallo- graphic axes in lead using 412 and 59.5 keV y-radiation from 98 Au and Am radioisotope sources, respectively. Both measurements are in mutual agreement and show a small anisotropy, which is just distinguishable within the statistical error. The spherically averaged data have been compared with the predictions of relativistic Hartree-Fock (RHF) and non-relativistic Hartree-Fock (HF) free atom calculations. As expected, the experiment clearly favours the RHF rather than the HF calculation. Key words: Compton profile; Electron momentum distribution; Relative effects; Lead. 1. Introduction The Compton profile is deduced from the measured x-ray or y-ray double-differential scattering cross-sec- tion and is the projection of the electron momentum density, n(p) along the scattering vector, usually cho- sen as the z-axis of a Cartesian coordinate system (see [1]) J(p z ) = \\n(p)dp x dp y . (1) The Compton profile is subject to the normalisation rule + 00 J J(p z ) dp z — Z, (2) — 00 where Z is the atomic number of the scatterer. The Compton profile line shape is very sensitive to the behaviour of the valence electrons and thus pro- vides a basis to test band theory electron wave func- tions. After suitable normalisation, Compton data are compared directly with theoretical predictions for J(p z ) and are also interpreted in terms of differences between pairs of directional profiles, i.e. AJ(p z ) = J hkl (p z )-J hk 'Ap z ), (3) * Presented at the Sagamore X Conference on Charge, Spin and Momentum Densities, Konstanz, Fed. Rep. of Germany, September 1-7, 1991. Reprint requests to Dr. David N. Timms, Applied Physics and Physical Electronics Department, Portsmouth Poly- technic, Park Building, King Henry I St., Portsmouth, POl 2DZ, United Kingdom. where hkl and h'k'l' denote planes perpendicular to the scattering vector. The latter approach eliminates or at least minimises residual systematic errors after data processing and also removes the isotropic core contribution from J(p z ). Relativistic Hartree-Fock (RHF) Compton profile calculations of heavy elements [2-4] have demon- strated that the "relativistic effects" are not limited to electrons situated near to the nucleus. The relativistic spatial wave functions of the rapidly moving electrons in the inner orbitals are pulled in towards the nucleus when compared with non-relativistic Hartree-Fock (HF) wave functions as its mass increases, [5]. This relativistic contraction of the core electron distribu- tion leads to a more effective screening of the nuclear charge. The more sharply peaked position-space wave func- tion of the core electron leads to a more delocalised momentum-space wave function and thus a flatter core electron momentum-space wave function. The consequence is that the Compton profile derived from a relativistic model is broader than the corresponding profile derived from a non-relativistic model. We expect a relativistic model to better predict the behaviour of the tightly bound innermost 1 s, 2 s and 2 p-orbitals of heavy elements. However, since the single-particle electron wave functions must be orthogonal, the outer s and p orbitals must also be affected by the relativistic nature of the core electrons. The importance of rela- tivistic modelling in heavy metals is emphasised in a first-principles calculation of the crystal structure of 0932-0784 / 93 / 0100-0343 $ 01.30/0. - Please order a reprint rather than making your own copy.
Transcript of The Electron Momentum Distribution in Leadzfn.mpdl.mpg.de/data/Reihe_A/48/ZNA-1993-48a-0343.pdf ·...
This work has been digitalized and published in 2013 by Verlag Zeitschrift für Naturforschung in cooperation with the Max Planck Society for the Advancement of Science under a Creative Commons Attribution4.0 International License.
Dieses Werk wurde im Jahr 2013 vom Verlag Zeitschrift für Naturforschungin Zusammenarbeit mit der Max-Planck-Gesellschaft zur Förderung derWissenschaften e.V. digitalisiert und unter folgender Lizenz veröffentlicht:Creative Commons Namensnennung 4.0 Lizenz.
The Electron Momentum Distribution in Lead * D. N. Timms Department of Applied Physics and Physical Electronics, Portsmouth Polytechnic, Portsmouth P O l 2DZ, U K
M. J. Cooper Department of Physics, University of Warwick, Coventry CV4 7AL, UK
Z. Naturforsch. 48 a, 3 4 3 - 3 4 7 (1993); received January 11, 1992
Directional Compton profiles have been measured along the [100], [110] and [111] crystallo-graphic axes in lead using 412 and 59.5 keV y-radiation from 9 8Au and Am radioisotope sources, respectively. Both measurements are in mutual agreement and show a small anisotropy, which is just distinguishable within the statistical error. The spherically averaged data have been compared with the predictions of relativistic Hartree-Fock (RHF) and non-relativistic Hartree-Fock (HF) free atom calculations. As expected, the experiment clearly favours the R H F rather than the H F calculation.
Key words: Compton profile; Electron momentum distribution; Relative effects; Lead.
1. Introduction
The Compton profile is deduced from the measured x-ray or y-ray double-differential scattering cross-sec-tion and is the projection of the electron momentum density, n(p) along the scattering vector, usually cho-sen as the z-axis of a Cartesian coordinate system (see [1])
J(pz) = \\n(p)dpxdpy. (1)
The Compton profile is subject to the normalisation rule
+ 00
J J(pz) dpz — Z, (2) — 00
where Z is the atomic number of the scatterer. The Compton profile line shape is very sensitive to
the behaviour of the valence electrons and thus pro-vides a basis to test band theory electron wave func-tions. After suitable normalisation, Compton data are compared directly with theoretical predictions for J(pz) and are also interpreted in terms of differences between pairs of directional profiles, i.e.
AJ(pz) = Jhkl(pz)-Jhk'Apz), (3)
* Presented at the Sagamore X Conference on Charge, Spin and Momentum Densities, Konstanz, Fed. Rep. of Germany, September 1 - 7 , 1991.
Reprint requests to Dr. David N. Timms, Applied Physics and Physical Electronics Department, Portsmouth Poly-technic, Park Building, King Henry I St., Portsmouth, P O l 2DZ, United Kingdom.
where hkl and h'k'l' denote planes perpendicular to the scattering vector. The latter approach eliminates or at least minimises residual systematic errors after data processing and also removes the isotropic core contribution from J(pz).
Relativistic Hartree-Fock (RHF) Compton profile calculations of heavy elements [2-4] have demon-strated that the "relativistic effects" are not limited to electrons situated near to the nucleus. The relativistic spatial wave functions of the rapidly moving electrons in the inner orbitals are pulled in towards the nucleus when compared with non-relativistic Hartree-Fock (HF) wave functions as its mass increases, [5]. This relativistic contraction of the core electron distribu-tion leads to a more effective screening of the nuclear charge.
The more sharply peaked position-space wave func-tion of the core electron leads to a more delocalised momentum-space wave function and thus a flatter core electron momentum-space wave function. The consequence is that the Compton profile derived from a relativistic model is broader than the corresponding profile derived from a non-relativistic model. We expect a relativistic model to better predict the behaviour of the tightly bound innermost 1 s, 2 s and 2 p-orbitals of heavy elements. However, since the single-particle electron wave functions must be orthogonal, the outer s and p orbitals must also be affected by the relativistic nature of the core electrons. The importance of rela-tivistic modelling in heavy metals is emphasised in a first-principles calculation of the crystal structure of
0932-0784 / 93 / 0100-0343 $ 01.30/0. - Please order a reprint rather than making your own copy.
344 D. N. Timms and M. J. Cooper • The Electron Momentum Distribution in Lead
lead [6] where a non-relativistic model resulted in the d iamond s t ructure of lead being more stable than the observed face-centred cubic structure.
A measure of the relativistic flattening of J(pz) is provided by the quant i ty (JRHF(Pz) ~JHF(PZ))/ jHF(PZ) at J(0). Mendelsohn et al. [3] cite the following results: a rgon ( Z = 18) 0.187%, krypton (Z = 36) 0.712% and lead (Z = 82) 5.24%. As expected the effect is more significant for heavy elements.
In an earlier C o m p t o n study [7], 1 2 3 m Te y-radiation was used to measure the C o m p t o n profiles of the rare gases Ar and Kr, and the results were compared with relativistic and non-relativistic calculations of J(p,). The relativistic flattening of J(pz) in these gases is small, and within the statistical accuracy of the results it was not possible to distinguish between the two cal-culations. The effects of relativistic flattening in lead have been previously investigated [8] a l though the ex-perimental results were of poo r statistical accuracy ( ± 4 % J(0)), low signal-to-noise rat io and contained a large multiple-scattering contr ibut ion ( > 20% of the total intensity). However, the results did favour the R H F calculation of J(pz) for lead.
Heller and Morei ra [9] have deduced the Compton profiles of lead (and aluminium) f rom measurements with 1 3 7 C s y-radiation (662 keV). They determined cont inuous single-scattering C o m p t o n profiles for each electron orbital f rom the discrete values of J { P z ) given in [3]. The differential scattering cross-section was calculated using a M o n t e Car lo method to simu-late the theoretical y-ray spectra characterised by the part icular scattering angle and scattered energy used. G o o d agreement between experiment and simulation was observed only when the Ribberfors expressions [10, 11] for scattering th rough angles differing from 180 degrees were employed. This work strongly sup-por ted the relativistic cross-section derived by Ribber-fors [10, 11].
Pat t i son and Schneider [12] used 412 keV y-radia-tion to measure the C o m p t o n profiles of lead and gold up to m o m e n t u m values of 110 a.u. (1 a.u. of momen-tum = 1.99 • 10 ~ 2 4 m kg s ~L). They limited their inter-pretat ion to the m o m e n t u m range 6 0 - 1 1 0 a.u. where the profile line shape is domina ted by the behaviour of the relativistic core electrons. The K- and L-shell bind-ing edges contained within this momentum region were clearly resolved in this experiment and well modelled by an R H F calculation of J ( P z ) . As with [9] the good agreement observed suppor ted strongly the relativistic cross-section derived by Ribberfors [10, 11].
The objectives of the present study were twofold. The first was to deduce accura te directional C o m p t o n profiles of lead to encourage a theoretical band struc-ture calculation for lead. The second was to illustrate the fact that non-relativistic theories are inadequate for modelling the electron m o m e n t u m density and C o m p t o n profiles of lead.
2. Measurements and Data Analysis
The [100], [110] and [111] directional C o m p t o n pro-files of lead were deduced f rom Compton scattering measurements on single-crystal slices at y-ray energies of 412 and 59.5 keV. The high-energy measurements were made using the 1 9 8 A u C o m p t o n spectrometer [13] that is sited at the Ruther ford Appleton Labora -tory. The 1 9 8 A u source has a useful lifetime of abou t 10 days (the initial activity is 150 -200 Ci and the 1 9 8 Au isotope has a half life of 2.7 days). A new source was used to measure each directional profile. The lower-energy, lower-resolution measurements were under taken at the University of Warwick using the 2 4 1 Am spectrometer [14]. M o r e than thirty days were required for each directional measurement with the 5 Ci 2 4 1 A m source, which has a half life of 452 years.
The individual oriented single-crystal discs, diame-ter 15.0 ± 0 . 1 mm, were cut f rom a large cylindrical single-crystal bar and reduced to a common thickness (1.60 ± 0.05 mm) using spark erosion techniques. The samples were then etched to remove surface damage. Individual energy spectra were accumulated over a period of 260 hours (412 keV) and 400 hours (59.5 keV), enabled integrated counts of approximately 6 x l 0 6
and 3 x 10⁶ to be recorded in the respective C o m p t o n profiles. Low count rates 5 cps under the C o m p t o n profile) were observed: this is a direct consequence of the high photoelectr ic absorp t ion cross-section of lead.
The da ta were processed by application of a series of energy-dependent corrections, which were applied according to a well-tested scheme detailed in [15]. The detector response function, the energy dependence of the detector efficiency, the source-dependent and inde-pendent background correct ions and the contr ibut ion f rom multiple scattering were all closely scrutinised. F o r the high-energy da t a the source-independent background or static background contr ibut ion was established to be 65% of the integrated total back-ground and was removed using the procedure out-lined in [16].
345 D. N. Timms and M. J. Cooper • The Electron Momentum Distribution in Lead
As usua l , a M o n t e C a r l o s i m u l a t i o n [17] was e m -p loyed to d e t e r m i n e t he ene rgy d i s t r i b u t i o n of the mul t ip l e sca t te r ing . F o r the h igh a n d low-ene rgy spec-t r o m e t e r s the c o n t r i b u t i o n s f r o m m u l t i p l e sca t t e r ing were 13 .5% a n d 3 . 7 % of J(pz), respect ively . T h e s e pe r cen t ages a r e smal l c o m p a r e d wi th C o m p t o n m e a -s u r e m e n t s o n l ighter m a t e r i a l s [18, 19] a n d a re a fu r -t he r c o n s e q u e n c e of the l a rge p h o t o e l e c t r i c a b s o r p t i o n cross-sect ion of lead. It w a s a s s u m e d t h a t the mult iple-sca t t e r ing prof i le h a d n o d i r e c t i o n a l d e p e n d e n c e , a n d the c o n s t a n t s a m p l e t h i cknes s e n s u r e d t h a t the s a m e c o r r e c t i o n c o u l d be a p p l i e d t o e a c h d i r ec t i ona l profi le .
Af te r a p p l i c a t i o n of t he d a t a p r o c e s s i n g r o u t i n e s the h igh -ene rgy d a t a were n o r m a l i s e d t o t he f r e e - a t o m va lue of 29.226 e l ec t rons o v e r t he m o m e n t u m r a n g e 0 t o 7 a.u. T h e K , L, a n d M e lec t ron-she l l b i n d i n g ener -gies of lead a r e 88.01 keV, 3 0 - 1 5 . 9 keV, a n d 2 . 5 - 3 . 8 keV, respect ively. H e n c e in t he l ow-ene rgy e x p e r i m e n t it was n o t poss ib le t o exci te the 1 s e l ec t rons in lead wi th 59.5 k e V r a d i a t i o n a n d t he 2 s a n d 2 p - e l e c t r o n s d id n o t c o n t r i b u t e for m o m e n t u m va lues g rea t e r t h a n — 7 a.u. a n d + 1 1 a.u., respect ively . T h e b i n d i n g edges were a c o u n t e d fo r in t he n o r m a l i s a t i o n of the low-energy d a t a .
3. Discussion
T h e e x p e r i m e n t a l d i r e c t i o n a l C o m p t o n prof i les m e a s u r e d wi th 412 k e V y - r a d i a t i o n a n d the i so t rop ic R H F [3, 4] a n d H F [5] t heo re t i ca l p rof i les a re listed in Tab le 1. B o t h theo re t i ca l p rof i les h a v e been c o n -vo lu t ed w i th G a u s s i a n s of F W H M = 0.4 a.u. in o r d e r to m a t c h t he e x p e r i m e n t a l r e s o l u t i o n half w id th . T h e diff icult ies e n c o u n t e r e d in r e m o v i n g t he sys t ema t i c er-ro r s f r o m J(pz) in t he 2 4 1 A m e x p e r i m e n t (see [18, 19, 15]), t o g e t h e r wi th t he b r e a k d o w n of t h e impu l se a p -p r o x i m a t i o n fo r the K , L, a n d M - e l e c t r o n s , lead to the c o n c l u s i o n t h a t s y m m e t r i c prof i les will n o t be f o r t h -c o m i n g f r o m these d a t a . F o r th is r e a s o n t he low-energy d a t a we re used on ly t o c o n f i r m the a n i s o t r o p y m e a s u r e d wi th the 1 9 8 A u s p e c t r o m e t e r .
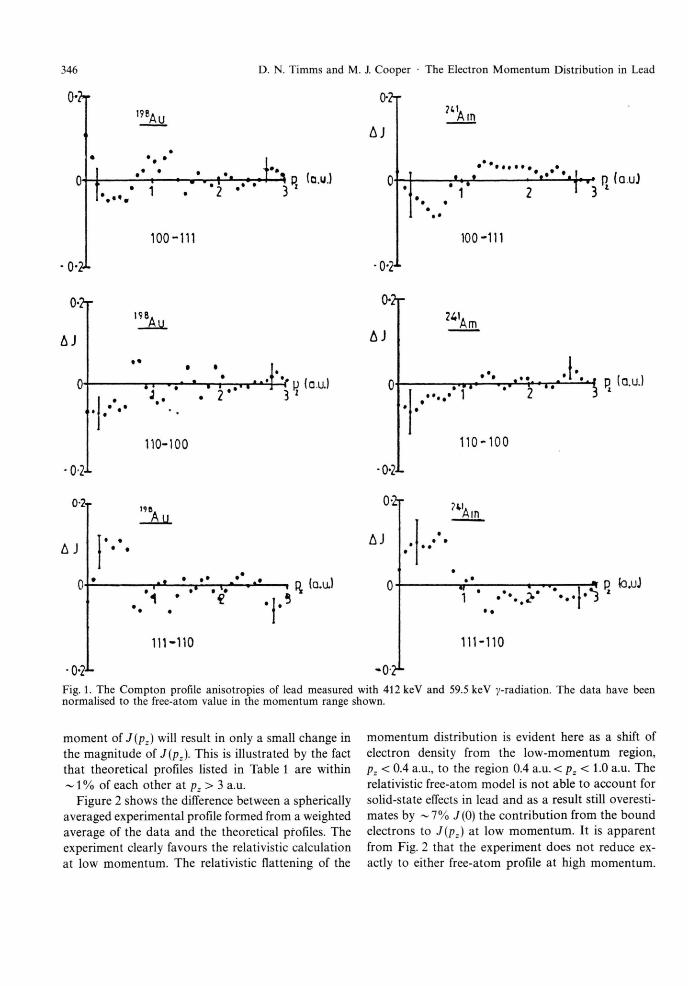
F i g u r e 1 s h o w s the d i f ferences b e t w e e n d i rec t iona l prof i les of lead o b t a i n e d f r o m m e a s u r e m e n t s wi th 412 k e V a n d 59.5 k e V y - r ad i a t i on . As the c o r e elec-t r o n c o n t r i b u t i o n t o the p rof i l e is i so t rop ic , the ob -served a n i s o t r o p y in J(pz) gives a m e a s u r e of the an -i s o t r o p y in the va lence e l ec t ron m o m e n t u m densi ty . T a k i n g in to a c c o u n t t he p o o r e r qua l i t y of the low-energy d a t a (i.e. + 0 . 6 2 % J (0 ) ) c o m p a r e d wi th t h a t of
Table 1. The experimental and theoretical Compton profiles of lead along the [100], [110], and [111] crystallographic directions. The experimental data were obtained from mea-surements with 412 keV y-radiation. The R H F and H F free-atom profiles are taken from [3, 4] and [5], respectively. Both theoretical profiles have been convoluted with a Gaussian of 0.4 a.u. F W H M to mimic the experimental resolution half width of the 1 9 8Au spectrometer.
PZ Experi- Experi- Experi- Relativ- Nonrelativ-ment ment ment istic free istic free [100] [110] [111] atom atom
0.0 10.252 10.095 10.141 10.980 11.470 + 0.040
0.1 10.177 10.018 10.169 10.881 11.346 0.2 10.064 9.869 10.100 10.598 10.991 0.3 9.837 9.684 9.897 10.175 10.461 0.4 9.519 9.443 9.620 9.669 9.839 0.5 9.218 9.062 9.259 9.140 9.213 0.6 8.773 8.653 8.825 8.637 8.650 0.7 8.281 8.293 8.310 8.193 8.181 0.8 7.862 7.886 7.839 7.820 7.809 0.9 7.471 7.479 7.449 7.510 7.512 1.0 7.148 7.109 7.123 7.248 7.265 1.2 6.683 6.687 6.639 6.799 6.833 1.4 6.221 6.209 6.239 6.370 6.409 1.6 5.846 5.887 5.845 5.926 5.966 1.8 5.400 5.370 5.403 5.476 5.513 2.0 5.025 5.055 4.973 5.043 5.077 2.5 4.053 4.082 4.129 4.130 4.185 3.0 3.489 3.474 3.506 3.513 3.569
+ 0.031 4.0 2.843 2.844 2.847 2.842 2.852 5.0 2.484 2.484 2.487 2.399 2.377 6.0 2.085 2.099 2.085 1.980 1.990 7.0 1.737 1.770 1.715 1.718 1.744
the h igh-energy d a t a ( + 0 . 3 9 % J(0)) , it c a n be seen t h a t b o t h d a t a sets a re in m u t u a l a g r e e m e n t .
T h e resul ts s h o w t h a t l ead exh ib i t s on ly a smal l a n i s o t r o p y ( ~ 1 % J(0)) , w h i c h is j u s t s ta t is t ica l ly s ignif icant . A l t h o u g h the a n i s o t r o p i c s a re smal l , they a p p e a r to be a s soc i a t ed wi th t he [111]-d i rec t ion a n d co r r e spond to a shift of e lectron densi ty f r o m the reg ion 0.75 a.u. < pz< 1.5 a.u. t o t he r eg ion pz < 0.75 a.u. T h e Br i l louin z o n e b o u n d a r y in t he [111]-d i rec t ion is a t 0.6 a.u. A l t h o u g h the dens i ty of s t a tes a n d the F e r m i su r face of lead h a v e been ca l cu l a t ed by a n u m b e r of w o r k e r s (see, fo r example , [ 2 0 - 2 3 ] ) , it is diff icul t t o d r a w any direct c o m p a r i s o n s b e t w e e n the i r w o r k a n d these da t a .
A relat ivist ic C o m p t o n prof i le will h a v e a l a rge r s econd m o m e n t (i.e. g rea t e r k ine t i c energy) t h a n t he co r re spond ing non-relat ivis t ic profile, a n d by the virial t h e o r e m this c o r r e s p o n d s t o a l ower to t a l energy . T h e k ine t ic -energy di f ference will n o t be visible in J(pz) a t h igh m o m e n t u m , w h e r e a la rge c h a n g e in t he s econd
346 D. N. Timms and M. J. Cooper • The Electron Momentum Distribution in Lead
0'?T
-0-2J-
198 AU
1 4 » v . , . r i p
„ • i . ' 2 •• • 3 • * * • (D.U.)
100-111
0
A J
2t
0-
-0-2-L
198, A g
' \ J\ H * » I . . ' » " ' J V p j . . . 2 * 3 1
(a.u.)
110-100
0-2r
A J
?41 Arn
• • • •
r v uj
• • »
• •
100-111
- 0 - 2 1
0-2r
A J
0
0-2-L
241 Am
• • • . . . • { ' . — r ^ v
i 4 q l a u . )
110-100
0-2r
A J
196 A i L
• • • •
1 •
111-110
• i . 5
0-2r
A J
- 0 * 1 -
?V Arn
T 7 P fo.uJ
111-110
Fig. 1. The Compton profile anisotropics of lead measured with 412 keV and 59.5 keV y-radiation. The data have been normalised to the free-atom value in the momentum range shown.
m o m e n t of J(p,) will resul t in on ly a smal l c h a n g e in the m a g n i t u d e of J{pz). T h i s is i l lus t ra ted by the fact t h a t theore t i ca l prof i les l isted in Table 1 a re wi th in ~ 1 % of each o t h e r a t p: > 3 a.u.
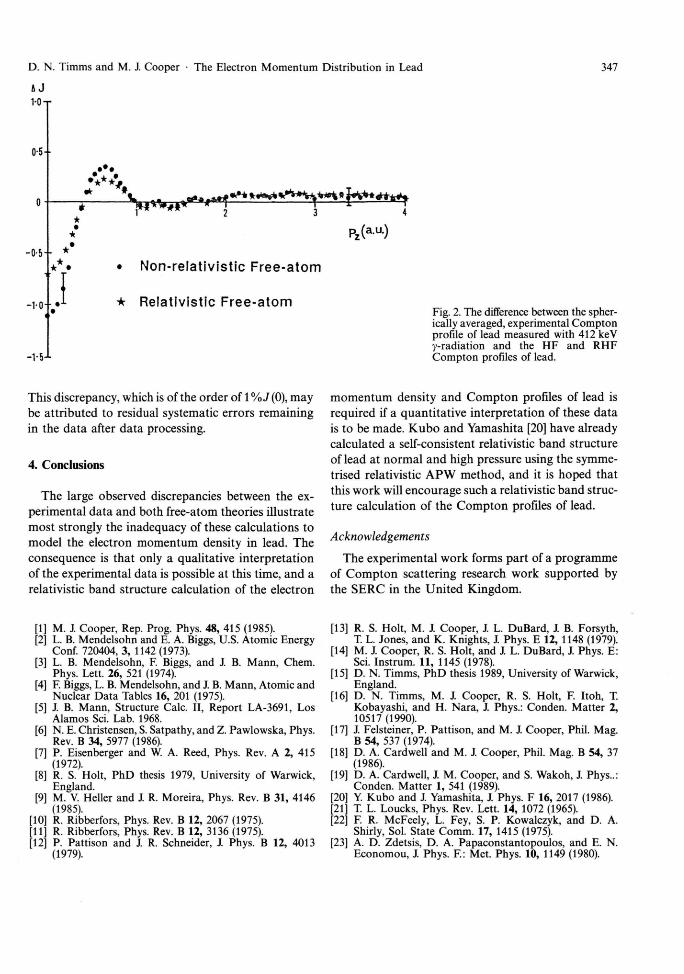
F i g u r e 2 s h o w s the d i f ference be tween a spher ica l ly a v e r a g e d e x p e r i m e n t a l prof i le f o r m e d f r o m a weighted ave rage of the d a t a a n d the theore t i ca l prof i les . T h e e x p e r i m e n t c lear ly f a v o u r s the relat ivis t ic ca lcu la t ion a t low m o m e n t u m . T h e relat ivis t ic f l a t t en ing of the
m o m e n t u m d i s t r i bu t i on is ev iden t he re as a shift of e lec t ron dens i ty f r o m the l o w - m o m e n t u m reg ion , pz < 0.4 a.u., to the r eg ion 0.4 a.u. < pz < 1.0 a.u. T h e relat ivis t ic f r e e - a t o m m o d e l is n o t ab le t o a c c o u n t for so l id-s ta te effects in lead a n d as a resul t still overes t i -m a t e s by ~ 7 % J ( 0 ) t he c o n t r i b u t i o n f r o m the b o u n d e lec t rons to J(pz) a t low m o m e n t u m . It is a p p a r e n t f r o m Fig. 2 t ha t the e x p e r i m e n t d o e s n o t r educe ex-actly to e i ther f r e e - a t o m prof i le a t h igh m o m e n t u m .
D. N. Timms and M. J. Cooper • The Electron M o m e n t u m Distribution in Lead
& J 1-0 T
347
0-5--
-i-o--
-V5-1-
P z ( a u ) -0-5+ *
J • Non- re lat i v is t ic F r e e - a t o m
• Relativ ist ic F r e e - a t o m Fig. 2. The difference between the spher-ically averaged, experimental Compton profile of lead measured with 412 keV y-radiation and the H F and R H F C o m p t o n profiles of lead.
This discrepancy, which is of the order of 1%J(0), may be attributed to residual systematic errors remaining in the data after data processing.
4. Conclusions
The large observed discrepancies between the ex-perimental data and both free-atom theories illustrate most strongly the inadequacy of these calculations to model the electron momentum density in lead. The consequence is that only a qualitative interpretation of the experimental data is possible at this time, and a relativistic band structure calculation of the electron
momentum density and Compton profiles of lead is required if a quantitative interpretation of these data is to be made. Kubo and Yamashita [20] have already calculated a self-consistent relativistic band structure of lead at normal and high pressure using the symme-trised relativistic APW method, and it is hoped that this work will encourage such a relativistic band struc-ture calculation of the Compton profiles of lead.
Acknowledgements
The experimental work forms part of a programme of Compton scattering research work supported by the SERC in the United Kingdom.
[1] M. J. Cooper, Rep. Prog. Phys. 48, 415 (1985). [2] L. B. Mendelsohn and E. A. Biggs, U.S. Atomic Energy
Conf. 720404, 3, 1142 (1973). [3] L. B. Mendelsohn, F. Biggs, and J. B. Mann , Chem.
Phys. Lett. 26, 521 (1974). [4] F. Biggs, L. B. Mendelsohn, and J. B. Mann , Atomic and
Nuclear Da ta Tables 16, 201 (1975). [5] J. B. Mann, Structure Calc. II, Report LA-3691, Los
Alamos Sei. Lab. 1968. [6] N. E. Christensen, S. Satpathy, and Z. Pawlowska, Phys.
Rev. B 34, 5977 (1986). [7] P. Eisenberger and W. A. Reed, Phys. Rev. A 2, 415
(1972). [8] R. S. Holt, P h D thesis 1979, University of Warwick,
England. [9] M. V. Heller and J. R. Moreira, Phys. Rev. B 31, 4146
(1985). [10] R. Ribberfors, Phys. Rev. B 12, 2067 (1975). [11] R. Ribberfors, Phys. Rev. B 12, 3136 (1975). [12] P. Patt ison and J. R. Schneider, J. Phys. B 12, 4013
(1979).
[13] R. S. Holt, M. J. Cooper , J. L. DuBard, J. B. Forsyth, T. L. Jones, and K. Knights, J. Phys. E 12, 1148 (1979).
[14] M. J. Cooper , R. S. Holt , and J. L. DuBard, J. Phys. E: Sei. Instrum. 11, 1145 (1978).
[15] D. N. Timms, P h D thesis 1989, University of Warwick, England.
[16] D. N. Timms, M. J. Cooper, R. S. Holt, F. Itoh, T. Kobayashi, and H. Nara , J. Phys.: Conden. Mat ter 2, 10517 (1990).
[17] J. Felsteiner, P. Pat t ison, and M. J. Cooper, Phil. Mag. B 54, 537 (1974).
[18] D. A. Cardwell and M. J. Cooper , Phil. Mag. B 54, 37 (1986).
[19] D. A. Cardwell, J. M. Cooper, and S. Wakoh, J. Phys..: Conden. Mat te r 1, 541 (1989).
[20] Y. K u b o and J. Yamashita, J. Phys. F 16, 2017 (1986). [21] T. L. Loucks, Phys. Rev. Lett. 14, 1072 (1965). [22] F. R. McFeely, L. Fey, S. P. Kowalczyk, and D. A.
Shirly, Sol. State Comm. 17, 1415 (1975). [23] A. D. Zdetsis, D. A. Papaconstantopoulos , and E. N.
Economou, J. Phys. F.: Met. Phys. 10, 1149 (1980).
![United Elliptic Homology - Universiteit Utrechtmeier007/Thesis-FinalVersionb.pdf · Let R denote the ungraded version of this ring. By [BH93, p.33], Exti R(F2, M) 6= 0 can only be](https://static.fdokument.com/doc/165x107/5f29d6215b89c1406f085ba7/united-elliptic-homology-universiteit-meier007thesis-finalversionbpdf-let.jpg)