The evolution of contrail microphysics in the vortex phase - Elib - DLR
12
Meteorologische Zeitschrift, Vol. 17, No. 2, 145-156 (April 2008) c by Gebrüder Borntraeger 2008 Article The evolution of contrail microphysics in the vortex phase S IMON UNTERSTRASSER ∗1 ,KLAUS GIERENS 1 and P ETER S PICHTINGER 2 1 Deutsches Zentrum für Luft- und Raumfahrt, Institut für Physik der Atmosphäre, Oberpfaffenhofen, Germany 2 Institute for Atmospheric and Climate Science, ETH Zurich, Switzerland (Manuscript received November 7, 2006; in revised form October 18, 2007; accepted December 17, 2007) Abstract We investigate the evolution of contrails during the vortex phase using numerical simulations. Emphasis is placed on microphysical properties and on the vertical distribution of ice mass and number concentration at the end of the vortex phase. Instead of using a 3D model which would be preferable but computationally too costly, we use a 2D model equipped with a special tool for controlling vortex decay. We conduct a great number of sensitivity studies for one aircraft type. It turns out that atmospheric parameters, namely supersaturation, temperature, stability and turbulence level have the biggest impact on the number of ice crystals and on the ice mass that survives until vortex breakup and that therefore makes up the persistent contrail in supersaturated air. The initial ice crystal number density and its distribution in the vortex, are of minor importance. Zusammenfassung Die Entwicklung von Kondensstreifen während der Wirbelphase wird mit Hilfe numerischer Simulationen studiert. Besonderes Augenmerk wird auf mikrophysikalische Eigenschaften und die vertikale Verteilung des Eises (Masse and Anzahlkonzentration) am Ende der Wirbelphase gelegt. Anstelle eines 3D-Modells, was wünschenswert, aber zu rechenzeitintensiv wäre, verwenden wir ein 2D-Modell, das mit einem Spezial- werkzeug zum Steuern des Wirbelzerfalls ausgerüstet wird. Damit kann eine große Anzahl von Sensi- tivitätsstudien für einen festgelegten Flugzeugtyp durchgeführt werden. Es stellt sich heraus, dass atmo- sphärische Parameter, nämlich Übersättigung, Temperatur, Stabilität und Turbulenzniveauden größten Ein- fluss auf Anzahldichte und Massenkonzentration der Eiskristalle haben, die bis zum Wirbelzerfall überleben und die folglich den persistenten Kondensstreifen in übersättigter Luft bilden. Die anfängliche Anzahl der Eiskristalle und deren Verteilung in den Wirbeln sind hingegen von untergeordneter Bedeutung. 1 Introduction Of all aviation effects on the radiative forcing of the at- mosphere that due to persistent contrails that evolve into contrail cirrus is potentially the largest (IPCC, 1999; SAUSEN et al., 2005; MANNSTEIN and SCHUMANN, 2005; STUBER et al., 2006). However, the degree of sci- entific understanding of contrail cirrus’ share of avia- tions radiative forcing is still judged so low that authors of the IPPC special report and of the TRADEOFF 1 study (SAUSEN et al., 2005) didn’t dare to ascibe a best es- timate to this effect. Indeed, it is very difficult to set up a climatology of contrail cirrus, a prerequisite for any attempt to quantify its radiative forcing. While it is relatively easy to detect line-shaped contrails in satel- lite images automatically (MANNSTEIN et al., 1999), no method is currently known to distinguish contrail cirrus from natural cirrus in satellite data after a contrail has lost its characteristic line shape. Numerical studies on the contrail-to-cirrus transition are rare (GIERENS and ∗ Corresponding author: Simon Unterstrasser, Deutsches Zentrum für Luft- und Raumfahrt, Institut für Physik der Atmosphäre, Oberpfaffenhofen, Germany 82234 Wessling, Germany, e-mail: si- [email protected] 1 an EU FP5 research project (2000–2003) J ENSEN, 1998; J ENSEN et al., 1998), so that the vast va- riety of possible evolution pathways of aging contrails has not yet been fathomed in the least. In order to prepare for more numerical studies of the contrail-to-cirrus transition it is necessary to provide ini- tial conditions. It is generally not a good idea to start a simulation of a contrail cirrus at the jet exit because this would require to resolve small scales of the order 1 m (time step of a fraction of a second) in a domain of per- haps several kilometers and for a simulation period of several hours. A better strategy seems to be to use condi- tions at the end of the vortex phase as initial conditions for simulations of the contrail-to-cirrus transition. Vor- tex phase lidar observations and numerical studies by SUSSMANN and GIERENS (1999, 2001) show that the early evolution of a contrail depends sensitively on the ambient relative humidity and on the type of aircraft. Other strong sensitivities are conceivable, yet have not been studied systematically so far. Thus we think, be- fore starting simulations of the later contrail evolution with more or less ad hoc estimates of initial conditions, we should first strive for a more complete overview for possible contrail evolution during the vortex phase, pro- viding a better justified set of initial conditions. DOI: 10.1127/0941-2948/2008/0273 0941-2948/2008/0273 $ 5.40 c Gebrüder Borntraeger, Berlin, Stuttgart 2008
Transcript of The evolution of contrail microphysics in the vortex phase - Elib - DLR
Meteorologische Zeitschrift Vol17 No 2 145-156 (April 2008)ccopy by Gebruumlder Borntraeger 2008 Article
The evolution of contrail microphysics in the vortex phase
SIMON UNTERSTRASSERlowast1 KLAUS GIERENS1 and PETER SPICHTINGER2
1Deutsches Zentrum fuumlr Luft- und Raumfahrt Institut fuumlr Physik der Atmosphaumlre Oberpfaffenhofen Germany2Institute for Atmospheric and Climate Science ETH Zurich Switzerland
(Manuscript received November 7 2006 in revised form October 18 2007 accepted December 17 2007)
AbstractWe investigate the evolution of contrails during the vortexphase using numerical simulations Emphasis isplaced on microphysical properties and on the vertical distribution of ice mass and number concentration atthe end of the vortex phase Instead of using a 3D model which would be preferable but computationallytoo costly we use a 2D model equipped with a special tool for controlling vortex decay We conduct agreat number of sensitivity studies for one aircraft type It turns out that atmospheric parameters namelysupersaturation temperature stability and turbulence level have the biggest impact on the number of icecrystals and on the ice mass that survives until vortex breakup and that therefore makes up the persistentcontrail in supersaturated air The initial ice crystal number density and its distribution in the vortex are ofminor importance
ZusammenfassungDie Entwicklung von Kondensstreifen waumlhrend der Wirbelphase wird mit Hilfe numerischer Simulationenstudiert Besonderes Augenmerk wird auf mikrophysikalische Eigenschaften und die vertikale Verteilung desEises (Masse and Anzahlkonzentration) am Ende der Wirbelphase gelegt Anstelle eines 3D-Modells waswuumlnschenswert aber zu rechenzeitintensiv waumlre verwenden wir ein 2D-Modell das mit einem Spezial-werkzeug zum Steuern des Wirbelzerfalls ausgeruumlstet wirdDamit kann eine groszlige Anzahl von Sensi-tivitaumltsstudien fuumlr einen festgelegten Flugzeugtyp durchgefuumlhrt werden Es stellt sich heraus dass atmo-sphaumlrische Parameter naumlmlich Uumlbersaumlttigung Temperatur Stabilitaumlt und Turbulenzniveau den groumlszligten Ein-fluss auf Anzahldichte und Massenkonzentration der Eiskristalle haben die bis zum Wirbelzerfall uumlberlebenund die folglich den persistenten Kondensstreifen in uumlbersaumlttigter Luft bilden Die anfaumlngliche Anzahl derEiskristalle und deren Verteilung in den Wirbeln sind hingegen von untergeordneter Bedeutung
1 Introduction
Of all aviation effects on the radiative forcing of the at-mosphere that due to persistent contrails that evolve intocontrail cirrus is potentially the largest (IPCC 1999SAUSEN et al 2005 MANNSTEIN and SCHUMANN2005 STUBER et al 2006) However the degree of sci-entific understanding of contrail cirrusrsquo share of avia-tions radiative forcing is still judged so low that authorsof the IPPC special report and of the TRADEOFF1 study(SAUSEN et al 2005) didnrsquot dare to ascibe a best es-timate to this effect Indeed it is very difficult to setup a climatology of contrail cirrus a prerequisite forany attempt to quantify its radiative forcing While it isrelatively easy to detect line-shaped contrails in satel-lite images automatically (MANNSTEIN et al 1999) nomethod is currently known to distinguish contrail cirrusfrom natural cirrus in satellite data after a contrail haslost its characteristic line shape Numerical studies onthe contrail-to-cirrus transition are rare (GIERENS and
lowastCorresponding author Simon Unterstrasser Deutsches Zentrumfuumlr Luft- und Raumfahrt Institut fuumlr Physik der AtmosphaumlreOberpfaffenhofen Germany 82234 Wessling Germany e-mail si-monunterstrasserdlrde
1an EU FP5 research project (2000ndash2003)
JENSEN 1998 JENSENet al 1998) so that the vast va-riety of possible evolution pathways of aging contrailshas not yet been fathomed in the least
In order to prepare for more numerical studies of thecontrail-to-cirrus transition it is necessary to provide ini-tial conditions It is generally not a good idea to start asimulation of a contrail cirrus at the jet exit because thiswould require to resolve small scales of the order 1 m(time step of a fraction of a second) in a domain of per-haps several kilometers and for a simulation period ofseveral hours A better strategy seems to be to use condi-tions at the end of the vortex phase as initial conditionsfor simulations of the contrail-to-cirrus transition Vor-tex phase lidar observations and numerical studies bySUSSMANN and GIERENS (1999 2001) show that theearly evolution of a contrail depends sensitively on theambient relative humidity and on the type of aircraftOther strong sensitivities are conceivable yet have notbeen studied systematically so far Thus we think be-fore starting simulations of the later contrail evolutionwith more or less ad hoc estimates of initial conditionswe should first strive for a more complete overview forpossible contrail evolution during the vortex phase pro-viding a better justified set of initial conditions
DOI 1011270941-294820080273
0941-294820080273 $ 540
ccopy Gebruumlder Borntraeger Berlin Stuttgart 2008
146 S Unterstrasser et al Contrail microphysics in the vortex phase Meteorol Z 17 2008
Therefore in this paper we will carry out numeri-cal simulations of contrail evolution during the vortexphase Our main purpose is an investigation of the fac-tors that mainly determine how much ice mass and howmany ice crystals survive the vortex phase and how theyare spatially distributed after vortex decay To facilitate asystematic investigation we need a fast numerical modelthat enables to run a large number of simulations in rea-sonable time Hence we perform 2D simulations witha special method for a proper representation of vortexdecay described in detail below in sections 2 and 3 Re-sults are presented in section 4 and discussed in section5 Finally conclusions are drawn in section 6
2 Model setup
The present study covers only the vortex phase of con-trail evolution that is the simulations start at a plumeage of about 20 s when the vortex roll-up is com-pleted and the temperature of the exhaust jets has re-laxed to ambient values (GERZ and EHRET 1997)The formation of contrail ice particles takes only afew seconds and is completed at the beginning of thevortex phase (see Fig 2 in STROumlM and GIERENS2002) Ice nucleation therefore is not needed to besimulated The large-eddy simulations have been car-ried out with the non-hydrostatic anelastic model Eu-Lag (SMOLARKIEWICZ and MARGOLIN 1997) Thetool allows to switch between a semi-lagragian advec-tion scheme and an Eulerian approach We opted for theEulerian mode which employs the built-in positive defi-nite advection algorithm MPDATA (SMOLARKIEWICZ
and MARGOLIN 1998) MPDATA is an iterative ad-vancement of the fundamental upstream differencingmethod minimizing its dispersiveness The horizontaldirectionx is along wingspan andz is the vertical coordi-nate The computation of eddy viscosity uses Smagorin-skyrsquos closure
For the calculations of the ice microphysics we useda recently developed parameterisation (SPICHTINGER
and GIERENS 2008) of bulk microphysics based on aconsistent two moment scheme (ie prognostic equa-tions for ice crystal mass concentration and numberdensity) The following microphysical processes fromthe parameterisation are used for this study depositiongrowth and sublimation of ice crystals (KOENIG 1971GIERENS 1996) and sedimentation In contrast to othermodels for instance the classical approach by KESSLER
(1969) all ice crystals start to fall relative to the ambi-ent air once they are formed ie there are no differentclasses for cloud ice and sedimenting ice Crystal aggre-gation is neglected because it is unimportant for youngcontrails (GIERENS 1996) For the ice crystal mass dis-tribution we prescribe a lognormal distribution with a
fixed geometrical widthσm = 3246 but variable modalmassm0
f (m) =Nradic
2π lnσmmmiddotexp
[
minus12
(
lnmm0
lnσm
)2]
The total ice crystal number concentration isN theice mass concentrationIWC is the first moment ofthe mass distribution For the ice crystals columnarshape is assumed Via the mass-size-relationm = a middotLb
(HEYMSFIELD and IAQUINTA 2000) the size distribu-tion is also of lognormal type with a geometrical stan-dard deviation ofσL = 1708
We do not use explicit ice nucleation (as eg homo-geneous nucleation) in the vortex but we prescribe theice crystal number density and the ice water content atthe start of the simulations
The configuration of the baseline case is The do-main has a horizontalvertical extent ofxD = 256 m andzD = 500 m with a 1 m-resolution in each direction Thetimestep is∆t = 002 s and the simulations stop aftert0 = 160 s A large aircraft (Airbus A340 Boeing B747)with wing spanbspan = 60 m is located atzCA = 400 m(cruise altitude) The real height of the flight level is de-termined by the choice of temperature at cruise altitude(explained below) The body of the plane is in the mid-dle of the domainxH = xD2 The engine exits are 20 mto the leftright of the body The mass of the plane isM = 310000 kg and the flight speed isU = 250 ms Asthe simulations start at the beginning of the vortex phaseit is assumed that the vortices have fully rolled up andeach vortex can be initialized with a Hallock-Burnhamprofile of tangential velocity (vθ )
vθ (r) =Γ0
2πrr2
r2 + rc2
The critical radius is chosen to berc = 4m and the initialcirculationΓ0 = 650 m2s (usinggM = ρairΓ0b0U withdensity of airρair = 04 kgm3) Horizontal separationdistance of the two vortex centres isb0 = π
4 bspan Weakersecondary vortices with opposite circulation shaping upfor certain flapwing configurations are not taken intoaccount The resulting maximum horizontalvertical ve-locity is 13 ms and 15 ms We assume that all the watervapour emitted due to fuel burning is contained in the icecrystals Assuming a fuel flow of ˙m f = 3 kgs and giventhe emission index of waterEIH2O = 125 kgkg theemitted water per flight path isIWC0 = 146middot10minus2 kgmThe ice crystals are assumed to be uniformly distrib-uted in circles (rp = 20 m) centred at the vortex coresThe number of ice crystals per meter of flight path isN0 = 34 middot1012 Sensitivity tests investigating the effectof changing the initial concentration and distribution ofthe contrail ice will be presented in section 53
Meteorol Z 17 2008 S Unterstrasser et al Contrail microphysics in the vortex phase 147
Since we are particularly interested in the fractionsof ice number and mass that survive the vortex phasewe only consider low to moderate supersaturations up to20 As shown later these fractions are most sensitiveto relative humidity at low supersaturation Althoughhigher supersaturations exist in the upper tropospherewe do not consider such cases At low supersaturationscirrus clouds usually do not form hence we assume theatmosphere to be cloud free The humidity field in thedomain is uniform with constantRHi
The (ambient) turbulence is characterised in terms ofeddy dissipation rateε = 35middot10minus5m2s3 Following theturbulence classification of SHARMAN (2005) this rep-resents an atmosphere with light turbulence The eddydissipation rate can be transformed into the root meansquareq = (uprime2)12 of the turbulent velocity fluctuations
usingε = 18
q3
Λ The typical length scaleΛ is chosen tobe 100 m
The potential temperature increases at cruise altitudeapproximately with 32 Kkm and the temperature it-self TCA ranges from 209 K to 222 K Temperaturesbelow the thresholdTSA = 225 K for RHw = 60 asympRHi = 100 satisfy the Schmidt-Appleman criterion(SCHUMANN 1996) that is contrails can form A shiftof flight altitude is solely effected by a change ofTCA inthe simulations The pressure at the lower boundary iskept constant atp0 = 250 hPa for all simulations Thisis reasonable since simulations showed no significantdifferences whenp0 was varied byplusmn30 hPa while thetemperatureTCA was kept constant
3 Treatment of vortex decay
As stated earlier we prefer 2D simulations for the sakeof saving computing time Unfortunately the most ef-ficient vortex decay mechanism the Crow instability(CROW 1970) is a 3D phenomenon hence cannot besimulated in 2D In order to cure this deficiency of 2Dsimulations we have implemented a circulation controltool (CC-tool) to artificially enforce and monitor an ac-curate vortex decay This method is based on results byHOLZAumlPFEL (2003 2006) on vortex decay The CC-tooltracks the vortex cores and computes the circulation de-pending on the current circulation the diffusion is artifi-cially increased in the neighborhood of the vortex secur-ing a proper vortex decay The microphysical propertiesof a contrail depend on how fast the vortex pair sinks(w(t)) and how long it lives (tbreakup) as the ice crystalstrapped in the vortex may face subsaturation due to adi-abatic compression and eventually sublimate
During the jet phase (roughly the first 20 s) thecirculation around the wings (Kutta-Joukowski law) istransformed into a pair of counterrotating vortices withdowndraughts inside and updraughts outside of the cor-responding vortex centres which areb02 off the fuse-
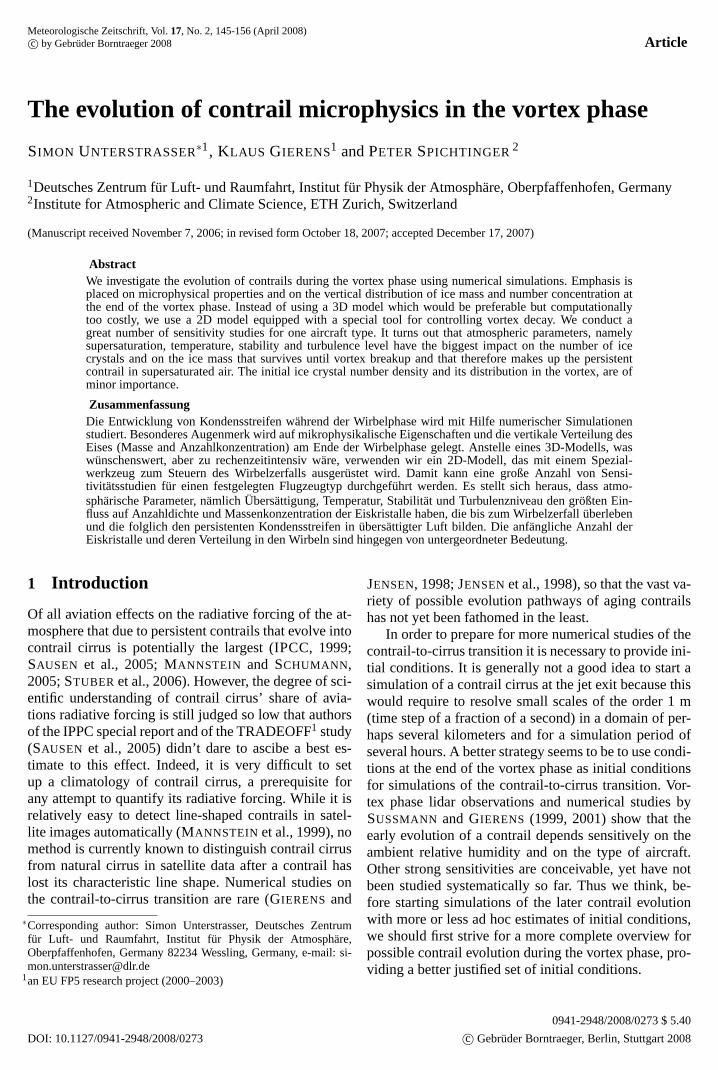
Figure 1 a) Evolution of the circulationΓ5minus15 for the baseline
case (ΓCC solid line Γnum dotted lineΓnum with CC-tool turned
off dashed line) The dash-dotted line displays the evolution of the
height of the vortex center b) Ratioγ = ΓnumΓCC vs time is dis-
played c) Descent speeds vs time are displayed The soliddashed
line shows the theoretical evolution (excludingincluding buoyancy)
The dotted line shows the simulated values
lage The two vortices mutually induce an initial down-ward transport at a speedw0 approximated by
vθ (b0) asympΓ0
2πb0= w0 (31)
The relationship of circulation and descent speed is notlinear as (31) might suggest The shape of the radial ve-locity profile changes as the critical radiusrc increasesTypically the circulation initially decreases withoutconsiderably slowing down the downward movementBuoyancy effects may become important in a stronglystratified environment The restoring force can becomelarge at late stages (great vertical displacement of thevortex) such that the vortex motion halts or even re-verses Baroclinic instability around the upper stagna-tion point of the vortex system leads to detrainment ofair that being warmer than its environment starts to riseA buoyant plume arises in the vertical along the pathwayof the sinking vortex pair
For a single vortex its circulation is evaluated inte-grating the vorticityη = partw
partx minus partupart z over the whole do-
main For a two-vortex system the integration domainmust be restricted to the vicinity of the according vortexcentre in order not to include opposite-sign contributionsof the counterrotating vortex
Γr =int r
0
int 2π
0η(rprimeφ)rprimedφdrprime
In our analysis circulation is given in terms of aradius-averaged measure (using the discrete levelsr = 5m 15m) Γ5minus15 = 1
11 sum15mr=5mΓr (following
HOLZAumlPFEL 2003) Starting a simulation withΓ0 =650 m2s corresponds to aΓ5minus15-value of aboutΓ0 =575 m2s since not all circulation is contained withinthe inner circles The decay of the vortex pair depends onmeteorological parameters (stratificationNBV and eddy
148 S Unterstrasser et al Contrail microphysics in the vortex phase Meteorol Z 17 2008
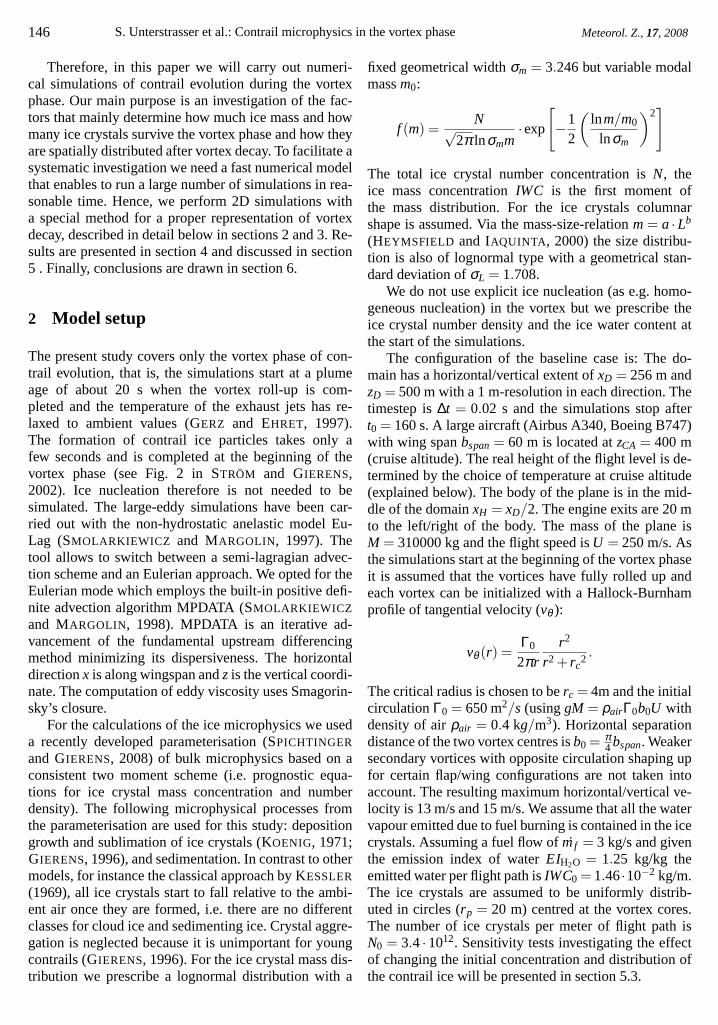
Figure 2 Normalised totals of surviving ice crystal number (left)
and ice mass (right) as a function of relative humidity The curves are
shown for two temperatures (TCA = 222 K trianglesTCA = 209 K
asterisks) The linestyle denotes the integration over the total crossndash
section (solid) primary (dotted) and secondary (dashed) wake
dissipation rateε) as well as on aircraft parameters (ini-tial circulationΓ0 and initial vortex separationb0) Thevortex decay occurs in two phases During the diffu-sion phase the vortex pair weakens slowly independentof the meteorological parameters After a certain onsettime T lowast
2 (using the definition of HOLZAumlPFEL 2006) aphase of rapid decay sets in GenerallyT lowast
2 is smallerand the rapid decay is faster for stronger turbulenceand for more stable stratification A stronger circula-tion for the same aircraft geometryb0 (eg higher pay-load) leads to a faster break-up since the interaction ofthe two vortices is more intense The temporal evolu-tion of Γ5minus15 is parametrised in HOLZAumlPFEL (2003)henceforth labelled asΓCC The end of the vortex phasetbreakup is reached when the vorticity fluctuations due tothe swirling vortices reaches ambient turbulence levelsIn the simulations this is characterized byΓCC droppingbelow 1 of the initial value
The CC-tool tracks the vortex cores (their height forthe baseline case is depicted in Figure 1a and evalu-ates the radius-averaged circulationΓ5minus15 which is de-noted byΓnum Depending on the ratioγ = Γnum
ΓCCthe dif-
fusion coefficient in the simulations is artificially in-creased around the vortex cores and adapted each sec-ond in order to ensureγ to be close to 1 and to maintaina realistic decay Figure 1a shows the evolution of thecirculation Γ5minus15 for the baseline case The solid lineshowsΓCC the dotted oneΓnum and the dashed one thesimulation with the circulation control turned off (ieno increased diffusion) Simulations without a circula-
tion control are obviously not adequate for our purposeas the decay is much too slow Figure 1b shows the ra-tio γ vs time During the diffusion phase the simulatedcirculation deviates less than 2 fromΓCC and at thebeginning of the rapid phase one still has good agree-ment with Holzaumlpfelrsquos results Close to break-up timetbreakup Γnum is not reduced fast enough since the dif-fusion cannot be further increased due to the diffusion-stability criterion In Figure 1c) the vortex descent speedfor the baseline case is shown The soliddashed curvesshow Holzaumlpfelrsquos benchmark values (ex- and includingbuoyancy effects see HOLZAumlPFEL 2003) The dottedcurve shows the simulated values Initially the down-ward transport is slightly underestimated and towardsthe end it is overestimated However the descent speedsare in good agreement with HOLZAumlPFEL (2003) andthe final vertical displacement is within the uncertaintyrange of Holzaumlpfelrsquos results Due to the too strong down-ward transport in the final stages the sublimation of icemass is overestimated As a simple compensation mea-sureN andIWC at vortex breakup are evaluated roughly5s beforetbreakup
4 Results
This section presents the results of the numerical sim-ulations First we stipulate some definitions The totalnormalised ice mass (per meter of flight path) is
tIWC(t) =int int
IWC(xz t)dxdzIWC0
The total normalised number of ice crystalstN is de-fined analogously In order to determine the quantities(N IWC) inside the primary wake the integral is takenoverr = 50 m circles around the vortex centres
pIWC(t) =
int int
rle f t or rrightlt50m
IWC(xz t)dxdz
IWC0
pN (number of ice crystals in the primary wake)is computed in an analogous way As stated earlier abouyant plume of ice arises between the original flightaltitude and the upper stagnation point of the vortex pair(also called secondary wake) The ice mass in the sec-ondary wakesIWC can be deduced by subtracting theprimary ice masspIWC from the total ice masstIWC acorresponding procedure gives the number of crystals inthe secondary wakesN
The term surviving ice crystalsmass refers to thetime of vortex breakup (taking into account the 5s cor-rection see section 3) All the results discussed in thissection refer to baseline case simulations with specified
Meteorol Z 17 2008 S Unterstrasser et al Contrail microphysics in the vortex phase 149
temperatureTCA and relative humidityRHi = 1+ si (su-persaturationsi) unless it is mentioned explicitly In thefollowing subsections the sensitivity of the spatial andtemporal ice distribution on various parameters like rel-ative humidity temperature ambient turbulence strati-fication and aircraft weight is discussed
41 Variation of relative humidity
The left panel of Fig 2 shows the normalised num-ber of surviving ice crystals as a function of relativehumidity for two flight levels (TCA = 222 K trianglesTCA = 209 K asterisks) Since there is no nucleation ofnew ice crystals the normalised value must be less thanunity Not surprisingly the moister the environment themore crystals survive The sensitivity of the survivingfraction to relative humidity increases with temperatureAt the lower temperature crystal sublimation is slowerthan at the higher one so that atTCA = 209 K onlyslightly more crystals are lost at ice saturation (40 sur-viving) than at 20 supersaturation (60 surviving)At TCA = 222 K this sensitivity is much larger (03 vs30 ) In the cold case the primary vortex contains thedominant fraction of the crystals at all supersaturationsconsidered However in the warm case (triangles) theprimary wake only dominates forsi approaching 20 At lower supersaturation the fraction in the secondarywake clearly dominates and is even the only fractionsurviving below 5 supersaturation In that case de-trainment of ice from the sinking primary vortex ceasesbeforetbreakup is reached which has the effect that thecontrail does not achieve its full vertical extent
The right panel of Fig 2 shows accordingly the nor-malised surviving ice mass which can exceed unity be-cause of crystal growth As all curves are steeper thantheir counterparts in the left panel one sees that the icemass evolution during the vortex phase is more sensitiveto ambient supersaturation than the evolution of crys-tal number because with increasing supersaturation notonly the number but also the individual mass of the sur-viving crystals increases During the vortex phase theice mass initially increases by deposition growth of thecrystals until all the excess moisture from the ambientsupersaturation in the vortex system is consumed Atsmall ambient supersaturation the majority of ice crys-tals in the primary vortices experience subsaturationhence it turns out that the surviving crystals have smallermean mass than the ice crystal population had initiallyIn a moister environment attbreakup the crystals still ben-efit from the substantial initial growth hence the meansize of the surviving crystals can be larger the meansize of the initial population Especially the ice mass inthe secondary wake grows since it has significant ex-posure to the ambient supersaturated air The earlier anice crystal is detrained the larger it will be in the endThe growth rate of the crystals in the secondary wake
Figure 3 Normalised totals of surviving ice crystal number (left)
and ice mass (right) as a function of temperatureTCA The curves are
shown for three relative humidities (RHi = 120 squaresRHi =
105 asterisksRHi = 100 diamonds) The colour and linestyle
denote the integration over the total crossndashsection (blacksolid) pri-
mary (reddotted) and secondary (greendashed) wake
is larger in the warmer than in the colder case sincethe absolute humidity is higher In the warm case at allsimulated ambient supersaturations the major part of icemass is in the secondary wake although atsi = 20 the major fraction by number is in the primary wake Inthe cold case the major fraction of ice is in the primarywake both by number and by mass
42 Variation of temperature or flightaltitude
Fig 3 reveals more clearly the influence of temperatureor flight level respectively on ice mass and number con-centration Results are shown for three different super-saturations (RHi = 120 squaresRHi = 105 aster-isksRHi = 100 diamonds) The total number of sur-viving ice crystals (blacksolid lines left) decreases withincreasing temperature While the temperature influenceis weak in the moistest case (si = 20 ) it is very strongin the slightly supersaturated cases in particular in theprimary wake which totally vanishes whenTCA is toohigh In these cases the persistent contrail is made upexclusively of the ice in the secondary wake Howeveralso the number of crystals in the secondary wakes de-creases with increasing temperature because the source(ie the ice in the primary vortex) runs dry before thevortex reaches its final vertical position
On the right panel the surviving ice mass is dis-played Comparing both graphs one sees that in the massbudget the increasing loss of ice crystals with increasing
150 S Unterstrasser et al Contrail microphysics in the vortex phase Meteorol Z 17 2008
Table 1 Breakup time and fraction of surving ice crystals as a func-
tion of ambient turbulence
ε in m2s3 35middot10minus3 35middot10minus4 35middot10minus5 35middot10minus6
tbreakup in s 100 118 135 150tN 028 015 0062 0030
Table 2 Various effects of varying stratification on vortex break-up
and number of ice crystals
NBV in sminus1 0 10minus2 2middot10minus2
tbreakup in s 165 135 117∆zbreakup in m 300 250 200
tN 0013 0062 033tN(si = 10) 004 041 047tN(T = 209K) 028 041 059
temperatures is partly balanced by an increased growthrate of the surviving ice crystals which is apparent inthe curves that increase with increasing temperature Inparticular the ice in the secondary wake contributes tothis effect This can lead to a higer total ice mass at theupper end of the considered temperature range althoughthe number of crystals strictly decreases with increasingTCA
43 Variation of ambient turbulence
In the following three subsections parameters affectingthe breakup timetbreakup are varied namely the am-bient turbulence the stratification and the initial cir-culation First the impact of ambient turbulence givenin terms of eddy dissipation rateε is investigated forTCA = 217 K andsi = 5 Stronger ambient turbulenceleads to faster decay of the vortex system (reduction oftbreakup see Table 1) and smaller vertical displacementThe studied turbulence strengths cover the full rangeof null (ε = 35 middot 10minus6 m2s3) medium-strength (ε =35 middot 10minus4 m2s3) and extreme (ε = 35 middot 10minus3 m2s3)turbulence events We employ the upperlevel turbulenceclassification (valid for heights above flight level 200)from SHARMAN (2005) Figures 4a b show vertical pro-files of horizontally integratedN andIWC for a varietyof eddy dissipation rates The black curves included forbetter orientation show the vertical profile of the initialdistribution of N and IWC that is crystals uniformlydistributed over two circles (one per wing) with radiusr = 20 m at heightzCA = 400 m With decreasing tur-bulence strength the fractiontN of surviving ice crystalsgets smaller (see Table 1) in particular in the primarywake because the vortices exist longer and sink downfarther The variation of the vortex sinking with differ-ent turbulence levels also affects the number and massof ice in the secondary wake as can be seen in the fig-ure
44 Variation of stratification
The subsequent set of simulations shows the impact ofstratification again computed withTCA = 217 K andsi = 5 ε is kept constant at 35 middot 10minus5 m2s3 Runswith three different stratifications (neutral baseline caseand strongly stable atmosphere) are compared (for val-ues ofNBV see Table 2) ForNBV = 0 the standard do-main was enlarged in the vertical direction in order toavoid boundary effects of the far-travelling vortex pair
According to HOLZAumlPFEL (2003) the vortex pair de-cays faster in a more stable atmosphere hence more iceshould survive With increasing stability the vertical ex-tent of the contrail is decreased since the vortex breaksup earlier and the buoyancy drag additionally retards thedescent Figures 4c d show the vertical profiles of hori-zontally integratedN andIWC with the initial distribu-tions (black lines) included for orientation as before
Let us consider first some features of the strongly sta-ble case (blue curves) The reduced downward displace-ment of the primary vortex is apparent (see Table 2) Thedetrained air parcels are highly buoyant (updraughts upto w = 4 ms) such that the secondary wake even reachesaltitudes above the initial flight level The strength ofthe baroclinic instability at the upper stagnation pointincreases with increasing stability such that the numberof ice crystals in the secondary wake becomes as high asin the primary wake
In case of a neutral atmosphere the ice in the primarywake is completely lost The vortex cores have moveddown toz = 100 m and the small bump in ice concentra-tion aroundz = 150 m is formed of detrained particlesthat is it does not belong to the the primary wake Theice concentration in the secondary wake decreases withdownward distance from flight level in a roughly expo-nential fashion
The total number of surviving crystals varies be-tween 13 (neutral) and 33 (strong stability) whichshows that the stratification of the ambient atmosphere isan important parameter for contrail evolution It must behowever remarked that this sensitivity is weaker whenit is colder or moister than in the cases considered above(seetN(TCA = 209 K) andtN(si = 10 ) in Table 2)
blueΓ0 = 650 m2s redΓ0 = 700 m2s green)
45 Variation of initial circulation
The initial circulation of each vortexΓ0 is proportionalto the weight of the aircraft which changes during flightdue to fuel consumption (note that the fuel weight con-tributes a significant part to the overall weight of an air-craft) Here we test how a variation ofΓ0 that is typicalfor the range of fuel filling levels during a flight affectsthe contrailrsquos vertical profiles of ice mass and numberconcentration Ambient conditions are as in the previoussubsection Aircraft geometry and speed are unchanged
Meteorol Z 17 2008 S Unterstrasser et al Contrail microphysics in the vortex phase 151
Figure 4 Vertical ice crystal number (left) and mass (right) profile
for various simulations at vortex breakup time The black lines show
the initial distribution of ice crystal number and mass atzCA = 400 m
a) and b) effect of turbulence level (ε = 35 middot 10minus6 m2s3 green
ε = 35 middot 10minus5 m2s3 red ε = 35 middot 10minus4 m2s3 blue ε = 35 middot10minus3 m2s3 purple) c) and d) effect of stratification (NBV = 0 sminus1
greenNBV = 10minus2 sminus1 red NBV = 2 middot 10minus2 sminus1 blue) e) and f)
effect of circulation (Γ0 = 500 m2s purpleΓ0 = 600 m2s
The results are given in Table 3 and the profiles are pre-sented in Figures 4e f)
During flight whenΓ0 decreases the life time of thevortex pair increases since the interaction of the twovortices gets weaker with decreasingΓ0 This has twomain effects (1) later onset of the rapid decay phaseand (2) slower descent The dominant impact of descentspeed on the final vertical displacement∆zbreakup (seeTable 3) is partially balanced by the changed vortex lifetime
The vertical profiles ofN andIWC (horizontally in-tegrated see Fig 4e f) differ only weakly for the in-flight variation of the circulation In the present case thetotal number of surviving crystalstN varies from 56for the largest circulation (fuel filling level high) to 13
for the smallest circulation (fuel filling level low) Thusthe effect of the initial circulation on contrail evolutionis much smaller than the effect of the other factors dis-cussed before
Table 3 Various effects of varying initial circulationΓ0 on vortex
break-up and number of ice crystals
Γ in m2s 500 600 650 700tbreakup in s 160 140 135 128
∆zbreakup in m 215 230 250 260tN 013 0089 0062 0056
5 Discussion
51 Impact of the temperature and relativehumidity variation ndash theoreticalbackground
The results of the preceeding section revealed that thenumber of surving ice crystals depends critically on am-bient humidity as well as on ambient temperature Herewe want to give some theoretical explanation for thesimulation results
During the downward transport the air trapped insidethe vortex undergoes adiabatic heating We can estimatethe vertical displacementδ zcrit where the relative hu-midity falls below saturation when for now we simplyassume that the ice crystals do not grow or evaporateduring the vortex falling Then the air within the vortexheats up according to a dry adiabatic process such thatδT = Γdδ z with Γd = gcp asymp 98 Kkm independentlyof the ambient lapse rate It does not make sense to usean ice adiabatic lapse rate because the ice is not in equi-librium with the vapour and the ice mass sublimating isso small that the release of latent heat only weakly af-fects the lapse rate Also the effect of the stratificationon the pressure profile and thus on the lapse rate is neg-ligible The total amount of vapour of an initially super-saturated air parcel at cruise altitude matches the one ofa saturated parcel at some higher temperature namely
(1+ si) qs(TCA) = qs(TCA +Γd δ zcrit)
Hereqs is the saturation mixing ratio of water vapour(with respect to ice) Taylor expansion of the rhs and us-ing part
partT lnqs = 09 partpartT lnes (the constant 09 accounts for
the adiabatic atmospheric pressure change during the de-scent of the plume andes is saturation vapour pressure)gives
δ zcrit =si
Γd middot09 partpartT (lnes(TCA))
The threshold isδ zcrit = si middot750 m for cold conditions(TCA = 205 K) andsi middot910 m for warm conditions (TCA =
152 S Unterstrasser et al Contrail microphysics in the vortex phase Meteorol Z 17 2008
Figure 5 Temporal evolution of primary ice mass for various tem-
peratures and relative humidities (TCA = 222 K andsi = 10 dash-
dotted TCA = 209 K and si = 10 dashedTCA = 209 K and
si = 0 solidTCA = 222 K andsi = 0 dotted)
Figure 6 Power law fits (see equation 51) for the surviving number
and mass of ice crystals vs relative humidity for different temper-
atures The curve labels correspond to the line number in Table 4
Diamonds represent the results from the simulations
225 K) Threshold values numerically computed withthe full nonlinear equations are aboutsi middot50 m smallerFor our moistest case this means that subsaturation isreached in the vortex at a vertical distance of less thanabout 180 m a distance that is reached in all our simu-lations Hence all our simulations reach subsaturationThe total ice mass does not fall below its initial valueas long as the plume is displaced less thanδ zcrit Actu-ally the ice crystals grow during the first 10 to 40 s untilall excess vapour from the ambient supersaturation in
the plume is condensed The rate of deposition increasesconsiderably with temperature Initially the total icemass per flight path is 146middot10minus2 kgm (water emittedby the engines) The excess ambient moisture inside theplume with radiusrp = 20 m isδq = siqs(T )2r2
pπρairFor si = 10 andTCA = 220 K δq = 066 kgm Vary-ing TCA within the simulated range can indecreaseδqby a factor of 2-3 Thus the total ice mass can increaseby 20 (cold 5 supersaturation) up to 300 (warm20 supersaturation) Since there is no nucleation dur-ing the vortex phase the initially existing crystals cangrow substantially
The sinking vortex pair reachesδ zcrit some time af-ter all the excess vapour is condensed The plume airis subsaturated and the crystals lose mass in order tomaintain saturation Typically the relative humidity isabout 95ndash98 inside the plume as the sublimation lagsbehind the adiabatic heating The sublimation is fasterfor higher temperatures but more ice is necessary tosaturate the air How far below the threshold altitudezCA minusδ zcrit the ice crystals survive depends most sensi-tively on temperature and cannot be easily answered bytheoretical reasoning Hence we resort to the presentednumerical simulations
In Fig 5 the temperature sensitivity of the sublima-tion process is demonstrated The temporal evolution ofthe primary ice mass is shown forTCA = 209222 Kand si = 0 10 Forsi = 0 the displacementthresholdδ zcrit is 0 m and subsaturation sets in imme-diately ForTCA = 222 K the ice has been completelysublimated within 100 s whereas forTCA = 209 K stillmore than 20 of the ice mass surives the vortex phase(tbreakup = 135 s) Atsi = 10 it takes abouttcrit = 40 suntil the vortex falls below the critical height (δ zcrit =75 m) hence it takes at least 40 s more than in the othercases (si = 0 ) to sublimate the ice completely AtTCA = 222 K the estimated minimum survival time of thecrystals (100s+40s) is close totbreakup It turns out thatabout 1 of ice mass and crystals (not shown here) sur-vive At TCA = 209 K the initial condensation of excessmoisture is slower than atTCA = 222 K nevertheless thecolder plume contains more ice mass att gt 70 s andnearly 50 of the ice mass still exist at vortex break-upWe can conclude that the survival of the ice in the pri-mary vortex depends on the interrelationship of differ-ent timescales namelytcrit (most sensitive tosi) tbreakup(depending on aircraft parameters stratification and am-bient turbulence) and the growthsublimation timescaleof the ice crystal population (most sensitive toT )
δ zcrit was eventually reached in all our simulationsbefore vortex breakup The question then arises whetherthere are cases where this does not occur and wheretherefore all ice crystals should survive This could hap-pen for instance in highly supersaturated air but thennatural cirrus may have formed anyway Another pos-
Meteorol Z 17 2008 S Unterstrasser et al Contrail microphysics in the vortex phase 153
Table 4 Fit parameters for equation 51 at various temperatures
No quantity y0 β α1 tN at T = 209 K 382middot10minus1 965 0252 tIWC at T = 209 K 267middot10minus1 893 1433 tN at T = 212 K 176middot10minus1 983 0474 tIWC at T = 212 K 069middot10minus1 965 1565 tN at T = 217 K 659middot10minus3 980 1776 tIWC at T = 217 K 279middot10minus3 990 2147 tN at T = 222 K 269middot10minus3 938 348 tIWC at T = 222 K 918middot10minus3 969 295
Table 5 Ice crystal number density in a plume of 3s age as a func-
tion of ambient temperature (taken from Fig 4 in KAumlRCHER et al
1998)
TCA in K 209 212 217 222N in 104 cmminus3 15 12 8 1
sibility is given for smaller aircraft than the simulatedone when the vortices sink slower than here such thattheir maximum downward travelling distance is lessthanδ zcrit
52 Power-law fitting
The number and mass concentrations of ice crystals sur-viving the vortex phase increases monotonically withambient relative humidity It turns out that the depen-dence can be fitted with a power law The functionf (RHi) approximates the normalised quantitiestIWCandtN for the baseline scenario
f (RHi) = y0
(
RHi minusβ100minusβ
)α (51)
The three parametersy0β α are fitted (chi-square) fortIWC andtN using the simulation results at the five hu-midity levels RHi = 100 103 105 110 120 The parameter values for all temperaturesTCA
are listed in Table 5 At most data points the absoluteerror | f (RHi)minus tN(RHi)| and | f (RHi)minus tIWC(RHi)| isbelow 0005 The simulation results and the correspond-ing approximations are shown in Fig 6
In equation 51y0 is the surviving fraction (massor number) when the environment is just saturated Asseen from the tabley0 decreases strongly with increas-ing temperature The parameterβ is that relative humid-ity where f becomes zero ie the ice sublimates com-pletely during the vortex phase As the table shows allvalues ofβ range from about 90 to 99 consistent withthe fact that a contrail does not survive significantly af-ter the end of the vortex phase even when the air is onlyslightly subsaturated The exponentsα increase stronglywith increasing temperature which expresses the fact
that the sensitivity oftIWC andtN on ambient humidityincreases strongly with increasing temperature
53 Testing minor sensitivity parameters
In our simulations we have used a fixed number of icecrystals per meter of flight in order to allow the samenormalisation for all simulations Actually this num-ber can vary within about one order of magnitude de-pending for instance on ambient temperature fuel sul-phur content soot particle emission index for variousengines etc For testing the sensitivity of the results withregard to the ice crystal number density we have takenfrom KAumlRCHER et al (1998) temperature-dependentestimates ofN assuming a medium sulphur contentThese are listed in Table 5 The temperature-dependentice number density equals our standard choice (8middot104 cmminus3) at TCA = 217 K N is higher at colder andconsiderably smaller at higher temperature Simulationswith the variedN andsi = 5 were performed for thetwo cold cases yet it was found that the normalisednumber of surviving ice crystals and mass do not changesignificantly compared to our standard choice ofNHowever atTCA = 222 K there is a non-negligible sen-sitivity to N a larger fraction of crystals survive whenless crystals are present initially
Fig 7 shows the fraction of surviving crystals andice mass for the warm case (TCA = 222 K) at supersat-urations ranging from 0 to 20 comparing the runswith our standardN and the one corresponding toTCA =222 K from Table 5 Note the large factor of eight be-tween these two ice number concentrations We see thatwith N = 1 middot 104 cmminus3 considerably more crystals sur-vive both in the primary and secondary wake than in thestandard cases The threshold supersaturation at whichsay 1 of ice crystals survives in the vortices is higherwhen the initial ice number density is lower Neverthe-less the absolute number of surviving ice crystals ishigher for the standardN than for the smaller value ofN(due to the large difference between these two values)More excess vapour from the ambient supersaturation isdeposited on the detrained crystals in the case with stan-dardN than in the other case Thus the secondary wakeis stronger and the total surviving ice mass fraction islarger in the standard cases than in the cases with thesmall value ofN
We investigated several more modifications of theinitial ice distribution We introduced random densityfluctuations of up toplusmn30 on the uniform distributionThis had no impact and the concentration is smoothedout quickly since the diffusion is very high (controlledby the CC-tool) Generally we found out that the choiceof distribution is not critical as long as the fraction ofdeentrained particles is similar
A vortex features a low pressure at the centreto compensate for centrifugal forces LEWELLEN and
154 S Unterstrasser et al Contrail microphysics in the vortex phase Meteorol Z 17 2008
LEWELLEN (2001) report of a typical underpressure ofaboutpv = 2 hPa Accordingly the temperature in a vor-tex core must be lower than at its limb if we assumean adiabat a cooling byTv asymp 05 K would result Cool-ing in turn reduces the saturation vapour pressure andthe sublimation rate during the descent of the vortex Atest simulation showed that the effect is negligible sincethe depression is confined to a small area of the primarywake
54 Comparison with recent 3D results
Although 2D simulations have the advantage that onecan test quickly a number of major and minor sensitivi-ties they have also some disadvantages compared witha full 3D model The most obvious one is that the vortexdecay process due to Crow instability can be achievedusing numerical tricks but the variations due to thisinstability along the flight path cannot be representedHowever the question is is this variation so importantthat it is worth the effort of a full 3D model to com-pute it To our view it is not As stated before the ulti-mate goal of this investigation is to provide initial condi-tions for later studies of the contrail-to-cirrus transitionand the resulting contrail cirrus For such a purpose theinitial variations along the flight path for example themammatus like structures that often appear in supersat-urated cases (an example can be found in GERZ et al(1998) Fig 2) are irrelevant since they will be forgottenhours later
If we had a 3D simulation we would eventually aver-age the results anyway In this sense our 2D simulationis hoped to give results that are close to these desiredaverages It is then possible that due to non-linearitiesthis 2D average would be wrong (ie strongly differingfrom the true 3D average) A comparison with recent 3Dresults shows that this is not the case We use the simula-tions of LEWELLEN and LEWELLEN (2001) and HUEB-SCH and LEWELLEN (2008) for comparison First wenote by looking at their drift-plots that there is not muchalong-flight-path variation in the cross-stream integratedfields during the vortex phase Stronger variations evolvelater in the beginning dispersion phase into which oursimulations do not reach As already said these varia-tions will be smoothed away or otherway randomizedby the atmospheric turbulence and shear motions and bycrystal sedimentation in the course ot the transition tocontrail cirrus
LEWELLEN and LEWELLEN (2001) investigatecases of 2 up to 30 ice supersaturation withT = 220 K (similar to ours) a slightly smaller lapserate and turbulence than ours but a larger crystal num-ber density A look at their Fig 7 shows their vortexbreakup times which are similar to ours and the sur-viving fraction of ice number Let us consider the case
Figure 7 Normalised totals of surviving ice crystal number (left)
and ice mass (right) as a function of relative humidity The curves
are shown for temperatureTCA = 222 K with initial ice crystal con-
centrationN = 1 middot 104 cmminus3 (squares) andN = 8 middot 104 cmminus3 (as-
terisks) The line style denotes the integration over the total cross-
section (solid) primary (dotted) and secondary (dashed) wake
with 10 supersaturation Our simulations give frac-tions (tN) of 007 and 035 for 222 and 217 K respec-tively whereas the 3D simulation at 220 K gives a frac-tion of 028 At 20 supersaturation we gottN of 021and 046 for the two considered temperatures whereasthe 3D simulation gavetN of 081 Hence the differ-ences are larger than for the less supersaturated caseHowever this difference is most likely due to the differ-ing assumptions in the microphysics parameterisationsHUEBSCH and LEWELLEN (2008) have shown that useof a monomodal size distribution as in LEWELLEN andLEWELLEN (2001) leads to overestimation oftN sothe value 081 is too large Since we use a broad log-normal size distribution our values oftN are accord-ingly smaller than that of LEWELLEN and LEWELLEN
(2001)Summarising in view of the later evolution into a
contrail cirrus and the then dominant atmospheric mo-tions the 3D variations in the early structure of a contrailare of minor importance The surviving fraction of icenumber compares well with those of recent 3D simula-tions when the conditions are similar The ice mass isanyway determined by the ambient humidity We con-clude that a our 2D approach is accurate enough to com-pute the surviving fractions of ice number and mass andhence does justice to our next goal to study contrail-to-cirrus transformation
Meteorol Z 17 2008 S Unterstrasser et al Contrail microphysics in the vortex phase 155
6 Conclusions
In the present paper we have used numerical 2D simu-lations of the contrailrsquos vortex phase to determine majorand minor factors of influence on the mass and num-ber concentration of ice crystals that survive the vortexphase As we had to perform a large number of sim-ulations we decided not to use a 3D model but to in-stead equip a 2D model with a circulation control toolto ensure a realistic vortex decay Surviving fractionsand the final vertical profile of ice concentration are im-portant initial conditions for studies of contrail-to-cirrustransformation The simulations have been performedfor only one aircraft type the influence of wing spanand flight speed has not yet been tested
We can state the following conclusions
bull The fraction of ice number and mass that sur-vives the vortex phase depends strongly on theambient supersaturation with respect to ice Thedependence can be fitted by a power law Thedependence is strongest for the highest temper-ature that allows contrail formation (Schmidt-Appleman criterion) and becomes weaker withdecreasing temperature
bull Only the ice in the secondary vortex survives atlow supersaturation consistent with the results ofSUSSMANN and GIERENS(1999) giving rise to apersistent yet very faint contrail
bull The stratification of the atmosphere and its turbu-lence level have strong impact of the fraction ofthe surviving ice via their dynamical effect on thesinking vortex pair Strong turbulence leads to fastvortex decay whereas weak turbulence allows thevortex pair to travel a long distance downwardHence in situations of strong turbulence more iceis rendered to the atmosphere than in weakly tur-bulent conditions The downward travelling dis-tance of the vortex increases with decreasing strat-ification strength hence more crystals survive inmore stable situations and vice versa Addition-ally more ice is detrained into the secondary wakein more stable situations
bull The initial number of ice crystals increases withdecreasing ambient temperature within a range ofabout an order of magnitude At the warmest tem-peratures that the Schmidt-Appleman criterion al-lows for contrail formation the surviving fractionis larger when less ice crystals are formed initiallyHowever the total number of surviving crystalsand the surviving ice mass can be larger whenmore crystals are formed initially
bull The variation of the initial circulation with vary-ing aircraft weight during a flight details of the
spatial distribution and the temperature profilewithin the vortices have only a minor influence onthe surviving ice fraction
We see that the structure and microphysical proper-ties (hence also the optical appearance) of a contrail de-pend sensitively on ambient conditions during its earlyhistory up to the end of the vortex phase which is about2 to 3 minutes after exhaust The most important condi-tions are atmospheric parameters supersaturation tem-perature stability and turbulence level We expect thatalso wind shear is an important parameter but this hasnot yet been tested because it will affect the vortex evo-lution much stronger than the parameters studied so farhence it deserves a separate study With the informa-tion gained during the presented studies we are now ableto reasonably initialise larger scale simulations of thecontrail-to-cirrus transformation
Acknowledgments
The authors would like to thank Bernd KAumlRCHERThomas GERZ and Frank HOLZAumlPFEL for their helpThe first author especially wishes to thank AndreasDOumlRNBRACK for his steady support and many fruitfuldiscussions This work contributes to the DLRHGF-project ldquoParticles and Cirrus Cloudsrdquo (PAZI-2) and tothe European Network of Excellence ECATS (Environ-mentally Compatible Air Transport System) The sim-ulations have been carried out as a part of the spe-cial project ldquoIce-supersaturation and cirrus cloudsrdquo atECMWF
References
CROW S C 1970 Stability theory for a pair of trailing vor-tices ndash AIAA J8 2172ndash2179
GERZ T T DUumlRBECK P KONOPKA 1998 Transport andeffective diffusion of aircraft emissions ndash J Geophys Res103 25905ndash25913
GERZ T T EHRET 1997 Wingtip Vortices and ExhaustJets During the Jet Regime of Aircraft Wakes ndash AerospSci Technol7 463ndash474
GIERENS K M 1996 Numerical simulations of persistentcontrails ndash J Atmos Sci53 3333ndash3348
GIERENS K E JENSEN 1998 A numerical study ofthe contrail-to-cirrus transition ndash Geophys Res Lett554341ndash4344
HEYMSFIELD A J J IAQUINTA 2000 Cirrus crystal ter-minal velocities ndash J Atmos Sci57 916ndash938
HOLZAumlPFEL F 2003 Probabilistic two-phase wake vortexdecay and transport model ndash J Aircraft40 323ndash331
mdash 2006 Probabilistic Two-Phase Aircraft Wake-VortexModel Further Development and Assessment ndash J Aircraft43 700ndash708
HUEBSCH WW DC LEWELLEN 2008 Application ofLES and binned microphysics for sensitivity study on con-trail evolution ndash Proc of the TACndashConference June 26 to29 2006 Oxford UK 167ndash172
156 S Unterstrasser et al Contrail microphysics in the vortex phase Meteorol Z 17 2008
INTERGOVERNMENTAL PANEL FOR CLIMATE CHANGE(IPCC) 1999 Aviation and the global atmosphere JEPENNER et al (Eds) ndash Cambrige University Press 373pp
JENSEN E AS ACKERMAN DE STEVENS OBTOON P MINNIS 1998 Spreading and growth of con-trails in a sheared environment ndash J Geophys Res10331557ndash31567
KESSLER E 1969 On the distribution and continuity ofwater substance in atmospheric circulation ndash Met MonAmer Meteor Soc32 80 ppcher98
KAumlRCHER B R BUSEN A PETZOLD F P SCHROumlDERU SCHUMANN 1998 Physicochemistry of aircraft-generated liquid aerosols soot and iceparticles 2 Com-parison with observations and sensitivity studies ndash J Geo-phys Res103 17129ndash17147
KOENIG L R 1971 Numerical modeling of ice depositionndash J Atmos Sci28 226ndash237
LEWELLEN D C W S LEWELLEN 2001 The effects ofaircraft wake dynamics on contrail development ndash J At-mos Sci58 390ndash406
MANNSTEIN H U SCHUMANN 2005 Aircraft inducedcontrail cirrus over Europe ndash Meteorol Z14 549ndash554
MANNSTEIN H R MEYER P WENDLING 1999 Opera-tional detection of contrails from NOAA-AVHRR data ndashInt J Remote Sens20 1641ndash1660
SAUSEN R I ISAKSEN V GREWE D HAUGLUSTAINED S LEE G MYHRE M KOumlHLER G PITARI USCHUMANN F STODAL C ZEREFOS 2005 Aviationradiative forcing in 2000 An update of IPCC (1999) ndash
Meteorol Z14 555ndash561SCHUMANN U 1996 On conditions for contrail formation
ndash Meteorol Z5 4ndash23SHARMAN R C TEBALDI G WIENER J WOLFF 2005
An integrated approach to mid- and upper-level turbulenceforecasting ndash Wea Forecast21 268ndash287
SMOLARKIEWICZ P L MARGOLIN 1997 On forward-in-time differencing for fluids an EulerianSemi-Lagrangiannon-hydrostatic model for stratified flows ndash Atmos-Oceans35 127ndash152
mdash mdash 1998 MPDATA A finite-difference solver for geo-physical flows ndash J Comp Phy140 459ndash480
SPICHTINGER P K GIERENS2008 Mesoscale modellingof homogeneous and heterogeneous cirrus cloud formationand evolution using EuLag Part 1 Model description andvalidation ndash Atmos Chem Phys Diss8 601ndash686
STUBER N P FORSTER G RADEL K SHINE 2006 Theimportance of the diurnal and annual cycle of air traffic forcontrail radiative forcing ndash Nature441 864ndash867
STROumlM L K GIERENS 2002 First simulations ofcryoplane contrails ndash J Geophys Res107 4346doi1010292001JD000838
SUSSMANN R K GIERENS 1999 Lidar and numericalstudies on the different evolution of a contrailrsquos vortex sys-tem and its secondary wake ndash J Geophys Res104 2131ndash2142
mdash mdash 2001 Differences in early contrail evolution of 2-engined versus 4-engined aircraft Lidar measurements andnumerical simulations ndash J Geophys Res106 4899ndash4911
146 S Unterstrasser et al Contrail microphysics in the vortex phase Meteorol Z 17 2008
Therefore in this paper we will carry out numeri-cal simulations of contrail evolution during the vortexphase Our main purpose is an investigation of the fac-tors that mainly determine how much ice mass and howmany ice crystals survive the vortex phase and how theyare spatially distributed after vortex decay To facilitate asystematic investigation we need a fast numerical modelthat enables to run a large number of simulations in rea-sonable time Hence we perform 2D simulations witha special method for a proper representation of vortexdecay described in detail below in sections 2 and 3 Re-sults are presented in section 4 and discussed in section5 Finally conclusions are drawn in section 6
2 Model setup
The present study covers only the vortex phase of con-trail evolution that is the simulations start at a plumeage of about 20 s when the vortex roll-up is com-pleted and the temperature of the exhaust jets has re-laxed to ambient values (GERZ and EHRET 1997)The formation of contrail ice particles takes only afew seconds and is completed at the beginning of thevortex phase (see Fig 2 in STROumlM and GIERENS2002) Ice nucleation therefore is not needed to besimulated The large-eddy simulations have been car-ried out with the non-hydrostatic anelastic model Eu-Lag (SMOLARKIEWICZ and MARGOLIN 1997) Thetool allows to switch between a semi-lagragian advec-tion scheme and an Eulerian approach We opted for theEulerian mode which employs the built-in positive defi-nite advection algorithm MPDATA (SMOLARKIEWICZ
and MARGOLIN 1998) MPDATA is an iterative ad-vancement of the fundamental upstream differencingmethod minimizing its dispersiveness The horizontaldirectionx is along wingspan andz is the vertical coordi-nate The computation of eddy viscosity uses Smagorin-skyrsquos closure
For the calculations of the ice microphysics we useda recently developed parameterisation (SPICHTINGER
and GIERENS 2008) of bulk microphysics based on aconsistent two moment scheme (ie prognostic equa-tions for ice crystal mass concentration and numberdensity) The following microphysical processes fromthe parameterisation are used for this study depositiongrowth and sublimation of ice crystals (KOENIG 1971GIERENS 1996) and sedimentation In contrast to othermodels for instance the classical approach by KESSLER
(1969) all ice crystals start to fall relative to the ambi-ent air once they are formed ie there are no differentclasses for cloud ice and sedimenting ice Crystal aggre-gation is neglected because it is unimportant for youngcontrails (GIERENS 1996) For the ice crystal mass dis-tribution we prescribe a lognormal distribution with a
fixed geometrical widthσm = 3246 but variable modalmassm0
f (m) =Nradic
2π lnσmmmiddotexp
[
minus12
(
lnmm0
lnσm
)2]
The total ice crystal number concentration isN theice mass concentrationIWC is the first moment ofthe mass distribution For the ice crystals columnarshape is assumed Via the mass-size-relationm = a middotLb
(HEYMSFIELD and IAQUINTA 2000) the size distribu-tion is also of lognormal type with a geometrical stan-dard deviation ofσL = 1708
We do not use explicit ice nucleation (as eg homo-geneous nucleation) in the vortex but we prescribe theice crystal number density and the ice water content atthe start of the simulations
The configuration of the baseline case is The do-main has a horizontalvertical extent ofxD = 256 m andzD = 500 m with a 1 m-resolution in each direction Thetimestep is∆t = 002 s and the simulations stop aftert0 = 160 s A large aircraft (Airbus A340 Boeing B747)with wing spanbspan = 60 m is located atzCA = 400 m(cruise altitude) The real height of the flight level is de-termined by the choice of temperature at cruise altitude(explained below) The body of the plane is in the mid-dle of the domainxH = xD2 The engine exits are 20 mto the leftright of the body The mass of the plane isM = 310000 kg and the flight speed isU = 250 ms Asthe simulations start at the beginning of the vortex phaseit is assumed that the vortices have fully rolled up andeach vortex can be initialized with a Hallock-Burnhamprofile of tangential velocity (vθ )
vθ (r) =Γ0
2πrr2
r2 + rc2
The critical radius is chosen to berc = 4m and the initialcirculationΓ0 = 650 m2s (usinggM = ρairΓ0b0U withdensity of airρair = 04 kgm3) Horizontal separationdistance of the two vortex centres isb0 = π
4 bspan Weakersecondary vortices with opposite circulation shaping upfor certain flapwing configurations are not taken intoaccount The resulting maximum horizontalvertical ve-locity is 13 ms and 15 ms We assume that all the watervapour emitted due to fuel burning is contained in the icecrystals Assuming a fuel flow of ˙m f = 3 kgs and giventhe emission index of waterEIH2O = 125 kgkg theemitted water per flight path isIWC0 = 146middot10minus2 kgmThe ice crystals are assumed to be uniformly distrib-uted in circles (rp = 20 m) centred at the vortex coresThe number of ice crystals per meter of flight path isN0 = 34 middot1012 Sensitivity tests investigating the effectof changing the initial concentration and distribution ofthe contrail ice will be presented in section 53
Meteorol Z 17 2008 S Unterstrasser et al Contrail microphysics in the vortex phase 147
Since we are particularly interested in the fractionsof ice number and mass that survive the vortex phasewe only consider low to moderate supersaturations up to20 As shown later these fractions are most sensitiveto relative humidity at low supersaturation Althoughhigher supersaturations exist in the upper tropospherewe do not consider such cases At low supersaturationscirrus clouds usually do not form hence we assume theatmosphere to be cloud free The humidity field in thedomain is uniform with constantRHi
The (ambient) turbulence is characterised in terms ofeddy dissipation rateε = 35middot10minus5m2s3 Following theturbulence classification of SHARMAN (2005) this rep-resents an atmosphere with light turbulence The eddydissipation rate can be transformed into the root meansquareq = (uprime2)12 of the turbulent velocity fluctuations
usingε = 18
q3
Λ The typical length scaleΛ is chosen tobe 100 m
The potential temperature increases at cruise altitudeapproximately with 32 Kkm and the temperature it-self TCA ranges from 209 K to 222 K Temperaturesbelow the thresholdTSA = 225 K for RHw = 60 asympRHi = 100 satisfy the Schmidt-Appleman criterion(SCHUMANN 1996) that is contrails can form A shiftof flight altitude is solely effected by a change ofTCA inthe simulations The pressure at the lower boundary iskept constant atp0 = 250 hPa for all simulations Thisis reasonable since simulations showed no significantdifferences whenp0 was varied byplusmn30 hPa while thetemperatureTCA was kept constant
3 Treatment of vortex decay
As stated earlier we prefer 2D simulations for the sakeof saving computing time Unfortunately the most ef-ficient vortex decay mechanism the Crow instability(CROW 1970) is a 3D phenomenon hence cannot besimulated in 2D In order to cure this deficiency of 2Dsimulations we have implemented a circulation controltool (CC-tool) to artificially enforce and monitor an ac-curate vortex decay This method is based on results byHOLZAumlPFEL (2003 2006) on vortex decay The CC-tooltracks the vortex cores and computes the circulation de-pending on the current circulation the diffusion is artifi-cially increased in the neighborhood of the vortex secur-ing a proper vortex decay The microphysical propertiesof a contrail depend on how fast the vortex pair sinks(w(t)) and how long it lives (tbreakup) as the ice crystalstrapped in the vortex may face subsaturation due to adi-abatic compression and eventually sublimate
During the jet phase (roughly the first 20 s) thecirculation around the wings (Kutta-Joukowski law) istransformed into a pair of counterrotating vortices withdowndraughts inside and updraughts outside of the cor-responding vortex centres which areb02 off the fuse-
Figure 1 a) Evolution of the circulationΓ5minus15 for the baseline
case (ΓCC solid line Γnum dotted lineΓnum with CC-tool turned
off dashed line) The dash-dotted line displays the evolution of the
height of the vortex center b) Ratioγ = ΓnumΓCC vs time is dis-
played c) Descent speeds vs time are displayed The soliddashed
line shows the theoretical evolution (excludingincluding buoyancy)
The dotted line shows the simulated values
lage The two vortices mutually induce an initial down-ward transport at a speedw0 approximated by
vθ (b0) asympΓ0
2πb0= w0 (31)
The relationship of circulation and descent speed is notlinear as (31) might suggest The shape of the radial ve-locity profile changes as the critical radiusrc increasesTypically the circulation initially decreases withoutconsiderably slowing down the downward movementBuoyancy effects may become important in a stronglystratified environment The restoring force can becomelarge at late stages (great vertical displacement of thevortex) such that the vortex motion halts or even re-verses Baroclinic instability around the upper stagna-tion point of the vortex system leads to detrainment ofair that being warmer than its environment starts to riseA buoyant plume arises in the vertical along the pathwayof the sinking vortex pair
For a single vortex its circulation is evaluated inte-grating the vorticityη = partw
partx minus partupart z over the whole do-
main For a two-vortex system the integration domainmust be restricted to the vicinity of the according vortexcentre in order not to include opposite-sign contributionsof the counterrotating vortex
Γr =int r
0
int 2π
0η(rprimeφ)rprimedφdrprime
In our analysis circulation is given in terms of aradius-averaged measure (using the discrete levelsr = 5m 15m) Γ5minus15 = 1
11 sum15mr=5mΓr (following
HOLZAumlPFEL 2003) Starting a simulation withΓ0 =650 m2s corresponds to aΓ5minus15-value of aboutΓ0 =575 m2s since not all circulation is contained withinthe inner circles The decay of the vortex pair depends onmeteorological parameters (stratificationNBV and eddy
148 S Unterstrasser et al Contrail microphysics in the vortex phase Meteorol Z 17 2008
Figure 2 Normalised totals of surviving ice crystal number (left)
and ice mass (right) as a function of relative humidity The curves are
shown for two temperatures (TCA = 222 K trianglesTCA = 209 K
asterisks) The linestyle denotes the integration over the total crossndash
section (solid) primary (dotted) and secondary (dashed) wake
dissipation rateε) as well as on aircraft parameters (ini-tial circulationΓ0 and initial vortex separationb0) Thevortex decay occurs in two phases During the diffu-sion phase the vortex pair weakens slowly independentof the meteorological parameters After a certain onsettime T lowast
2 (using the definition of HOLZAumlPFEL 2006) aphase of rapid decay sets in GenerallyT lowast
2 is smallerand the rapid decay is faster for stronger turbulenceand for more stable stratification A stronger circula-tion for the same aircraft geometryb0 (eg higher pay-load) leads to a faster break-up since the interaction ofthe two vortices is more intense The temporal evolu-tion of Γ5minus15 is parametrised in HOLZAumlPFEL (2003)henceforth labelled asΓCC The end of the vortex phasetbreakup is reached when the vorticity fluctuations due tothe swirling vortices reaches ambient turbulence levelsIn the simulations this is characterized byΓCC droppingbelow 1 of the initial value
The CC-tool tracks the vortex cores (their height forthe baseline case is depicted in Figure 1a and evalu-ates the radius-averaged circulationΓ5minus15 which is de-noted byΓnum Depending on the ratioγ = Γnum
ΓCCthe dif-
fusion coefficient in the simulations is artificially in-creased around the vortex cores and adapted each sec-ond in order to ensureγ to be close to 1 and to maintaina realistic decay Figure 1a shows the evolution of thecirculation Γ5minus15 for the baseline case The solid lineshowsΓCC the dotted oneΓnum and the dashed one thesimulation with the circulation control turned off (ieno increased diffusion) Simulations without a circula-
tion control are obviously not adequate for our purposeas the decay is much too slow Figure 1b shows the ra-tio γ vs time During the diffusion phase the simulatedcirculation deviates less than 2 fromΓCC and at thebeginning of the rapid phase one still has good agree-ment with Holzaumlpfelrsquos results Close to break-up timetbreakup Γnum is not reduced fast enough since the dif-fusion cannot be further increased due to the diffusion-stability criterion In Figure 1c) the vortex descent speedfor the baseline case is shown The soliddashed curvesshow Holzaumlpfelrsquos benchmark values (ex- and includingbuoyancy effects see HOLZAumlPFEL 2003) The dottedcurve shows the simulated values Initially the down-ward transport is slightly underestimated and towardsthe end it is overestimated However the descent speedsare in good agreement with HOLZAumlPFEL (2003) andthe final vertical displacement is within the uncertaintyrange of Holzaumlpfelrsquos results Due to the too strong down-ward transport in the final stages the sublimation of icemass is overestimated As a simple compensation mea-sureN andIWC at vortex breakup are evaluated roughly5s beforetbreakup
4 Results
This section presents the results of the numerical sim-ulations First we stipulate some definitions The totalnormalised ice mass (per meter of flight path) is
tIWC(t) =int int
IWC(xz t)dxdzIWC0
The total normalised number of ice crystalstN is de-fined analogously In order to determine the quantities(N IWC) inside the primary wake the integral is takenoverr = 50 m circles around the vortex centres
pIWC(t) =
int int
rle f t or rrightlt50m
IWC(xz t)dxdz
IWC0
pN (number of ice crystals in the primary wake)is computed in an analogous way As stated earlier abouyant plume of ice arises between the original flightaltitude and the upper stagnation point of the vortex pair(also called secondary wake) The ice mass in the sec-ondary wakesIWC can be deduced by subtracting theprimary ice masspIWC from the total ice masstIWC acorresponding procedure gives the number of crystals inthe secondary wakesN
The term surviving ice crystalsmass refers to thetime of vortex breakup (taking into account the 5s cor-rection see section 3) All the results discussed in thissection refer to baseline case simulations with specified
Meteorol Z 17 2008 S Unterstrasser et al Contrail microphysics in the vortex phase 149
temperatureTCA and relative humidityRHi = 1+ si (su-persaturationsi) unless it is mentioned explicitly In thefollowing subsections the sensitivity of the spatial andtemporal ice distribution on various parameters like rel-ative humidity temperature ambient turbulence strati-fication and aircraft weight is discussed
41 Variation of relative humidity
The left panel of Fig 2 shows the normalised num-ber of surviving ice crystals as a function of relativehumidity for two flight levels (TCA = 222 K trianglesTCA = 209 K asterisks) Since there is no nucleation ofnew ice crystals the normalised value must be less thanunity Not surprisingly the moister the environment themore crystals survive The sensitivity of the survivingfraction to relative humidity increases with temperatureAt the lower temperature crystal sublimation is slowerthan at the higher one so that atTCA = 209 K onlyslightly more crystals are lost at ice saturation (40 sur-viving) than at 20 supersaturation (60 surviving)At TCA = 222 K this sensitivity is much larger (03 vs30 ) In the cold case the primary vortex contains thedominant fraction of the crystals at all supersaturationsconsidered However in the warm case (triangles) theprimary wake only dominates forsi approaching 20 At lower supersaturation the fraction in the secondarywake clearly dominates and is even the only fractionsurviving below 5 supersaturation In that case de-trainment of ice from the sinking primary vortex ceasesbeforetbreakup is reached which has the effect that thecontrail does not achieve its full vertical extent
The right panel of Fig 2 shows accordingly the nor-malised surviving ice mass which can exceed unity be-cause of crystal growth As all curves are steeper thantheir counterparts in the left panel one sees that the icemass evolution during the vortex phase is more sensitiveto ambient supersaturation than the evolution of crys-tal number because with increasing supersaturation notonly the number but also the individual mass of the sur-viving crystals increases During the vortex phase theice mass initially increases by deposition growth of thecrystals until all the excess moisture from the ambientsupersaturation in the vortex system is consumed Atsmall ambient supersaturation the majority of ice crys-tals in the primary vortices experience subsaturationhence it turns out that the surviving crystals have smallermean mass than the ice crystal population had initiallyIn a moister environment attbreakup the crystals still ben-efit from the substantial initial growth hence the meansize of the surviving crystals can be larger the meansize of the initial population Especially the ice mass inthe secondary wake grows since it has significant ex-posure to the ambient supersaturated air The earlier anice crystal is detrained the larger it will be in the endThe growth rate of the crystals in the secondary wake
Figure 3 Normalised totals of surviving ice crystal number (left)
and ice mass (right) as a function of temperatureTCA The curves are
shown for three relative humidities (RHi = 120 squaresRHi =
105 asterisksRHi = 100 diamonds) The colour and linestyle
denote the integration over the total crossndashsection (blacksolid) pri-
mary (reddotted) and secondary (greendashed) wake
is larger in the warmer than in the colder case sincethe absolute humidity is higher In the warm case at allsimulated ambient supersaturations the major part of icemass is in the secondary wake although atsi = 20 the major fraction by number is in the primary wake Inthe cold case the major fraction of ice is in the primarywake both by number and by mass
42 Variation of temperature or flightaltitude
Fig 3 reveals more clearly the influence of temperatureor flight level respectively on ice mass and number con-centration Results are shown for three different super-saturations (RHi = 120 squaresRHi = 105 aster-isksRHi = 100 diamonds) The total number of sur-viving ice crystals (blacksolid lines left) decreases withincreasing temperature While the temperature influenceis weak in the moistest case (si = 20 ) it is very strongin the slightly supersaturated cases in particular in theprimary wake which totally vanishes whenTCA is toohigh In these cases the persistent contrail is made upexclusively of the ice in the secondary wake Howeveralso the number of crystals in the secondary wakes de-creases with increasing temperature because the source(ie the ice in the primary vortex) runs dry before thevortex reaches its final vertical position
On the right panel the surviving ice mass is dis-played Comparing both graphs one sees that in the massbudget the increasing loss of ice crystals with increasing
150 S Unterstrasser et al Contrail microphysics in the vortex phase Meteorol Z 17 2008
Table 1 Breakup time and fraction of surving ice crystals as a func-
tion of ambient turbulence
ε in m2s3 35middot10minus3 35middot10minus4 35middot10minus5 35middot10minus6
tbreakup in s 100 118 135 150tN 028 015 0062 0030
Table 2 Various effects of varying stratification on vortex break-up
and number of ice crystals
NBV in sminus1 0 10minus2 2middot10minus2
tbreakup in s 165 135 117∆zbreakup in m 300 250 200
tN 0013 0062 033tN(si = 10) 004 041 047tN(T = 209K) 028 041 059
temperatures is partly balanced by an increased growthrate of the surviving ice crystals which is apparent inthe curves that increase with increasing temperature Inparticular the ice in the secondary wake contributes tothis effect This can lead to a higer total ice mass at theupper end of the considered temperature range althoughthe number of crystals strictly decreases with increasingTCA
43 Variation of ambient turbulence
In the following three subsections parameters affectingthe breakup timetbreakup are varied namely the am-bient turbulence the stratification and the initial cir-culation First the impact of ambient turbulence givenin terms of eddy dissipation rateε is investigated forTCA = 217 K andsi = 5 Stronger ambient turbulenceleads to faster decay of the vortex system (reduction oftbreakup see Table 1) and smaller vertical displacementThe studied turbulence strengths cover the full rangeof null (ε = 35 middot 10minus6 m2s3) medium-strength (ε =35 middot 10minus4 m2s3) and extreme (ε = 35 middot 10minus3 m2s3)turbulence events We employ the upperlevel turbulenceclassification (valid for heights above flight level 200)from SHARMAN (2005) Figures 4a b show vertical pro-files of horizontally integratedN andIWC for a varietyof eddy dissipation rates The black curves included forbetter orientation show the vertical profile of the initialdistribution of N and IWC that is crystals uniformlydistributed over two circles (one per wing) with radiusr = 20 m at heightzCA = 400 m With decreasing tur-bulence strength the fractiontN of surviving ice crystalsgets smaller (see Table 1) in particular in the primarywake because the vortices exist longer and sink downfarther The variation of the vortex sinking with differ-ent turbulence levels also affects the number and massof ice in the secondary wake as can be seen in the fig-ure
44 Variation of stratification
The subsequent set of simulations shows the impact ofstratification again computed withTCA = 217 K andsi = 5 ε is kept constant at 35 middot 10minus5 m2s3 Runswith three different stratifications (neutral baseline caseand strongly stable atmosphere) are compared (for val-ues ofNBV see Table 2) ForNBV = 0 the standard do-main was enlarged in the vertical direction in order toavoid boundary effects of the far-travelling vortex pair
According to HOLZAumlPFEL (2003) the vortex pair de-cays faster in a more stable atmosphere hence more iceshould survive With increasing stability the vertical ex-tent of the contrail is decreased since the vortex breaksup earlier and the buoyancy drag additionally retards thedescent Figures 4c d show the vertical profiles of hori-zontally integratedN andIWC with the initial distribu-tions (black lines) included for orientation as before
Let us consider first some features of the strongly sta-ble case (blue curves) The reduced downward displace-ment of the primary vortex is apparent (see Table 2) Thedetrained air parcels are highly buoyant (updraughts upto w = 4 ms) such that the secondary wake even reachesaltitudes above the initial flight level The strength ofthe baroclinic instability at the upper stagnation pointincreases with increasing stability such that the numberof ice crystals in the secondary wake becomes as high asin the primary wake
In case of a neutral atmosphere the ice in the primarywake is completely lost The vortex cores have moveddown toz = 100 m and the small bump in ice concentra-tion aroundz = 150 m is formed of detrained particlesthat is it does not belong to the the primary wake Theice concentration in the secondary wake decreases withdownward distance from flight level in a roughly expo-nential fashion
The total number of surviving crystals varies be-tween 13 (neutral) and 33 (strong stability) whichshows that the stratification of the ambient atmosphere isan important parameter for contrail evolution It must behowever remarked that this sensitivity is weaker whenit is colder or moister than in the cases considered above(seetN(TCA = 209 K) andtN(si = 10 ) in Table 2)
blueΓ0 = 650 m2s redΓ0 = 700 m2s green)
45 Variation of initial circulation
The initial circulation of each vortexΓ0 is proportionalto the weight of the aircraft which changes during flightdue to fuel consumption (note that the fuel weight con-tributes a significant part to the overall weight of an air-craft) Here we test how a variation ofΓ0 that is typicalfor the range of fuel filling levels during a flight affectsthe contrailrsquos vertical profiles of ice mass and numberconcentration Ambient conditions are as in the previoussubsection Aircraft geometry and speed are unchanged
Meteorol Z 17 2008 S Unterstrasser et al Contrail microphysics in the vortex phase 151
Figure 4 Vertical ice crystal number (left) and mass (right) profile
for various simulations at vortex breakup time The black lines show
the initial distribution of ice crystal number and mass atzCA = 400 m
a) and b) effect of turbulence level (ε = 35 middot 10minus6 m2s3 green
ε = 35 middot 10minus5 m2s3 red ε = 35 middot 10minus4 m2s3 blue ε = 35 middot10minus3 m2s3 purple) c) and d) effect of stratification (NBV = 0 sminus1
greenNBV = 10minus2 sminus1 red NBV = 2 middot 10minus2 sminus1 blue) e) and f)
effect of circulation (Γ0 = 500 m2s purpleΓ0 = 600 m2s
The results are given in Table 3 and the profiles are pre-sented in Figures 4e f)
During flight whenΓ0 decreases the life time of thevortex pair increases since the interaction of the twovortices gets weaker with decreasingΓ0 This has twomain effects (1) later onset of the rapid decay phaseand (2) slower descent The dominant impact of descentspeed on the final vertical displacement∆zbreakup (seeTable 3) is partially balanced by the changed vortex lifetime
The vertical profiles ofN andIWC (horizontally in-tegrated see Fig 4e f) differ only weakly for the in-flight variation of the circulation In the present case thetotal number of surviving crystalstN varies from 56for the largest circulation (fuel filling level high) to 13
for the smallest circulation (fuel filling level low) Thusthe effect of the initial circulation on contrail evolutionis much smaller than the effect of the other factors dis-cussed before
Table 3 Various effects of varying initial circulationΓ0 on vortex
break-up and number of ice crystals
Γ in m2s 500 600 650 700tbreakup in s 160 140 135 128
∆zbreakup in m 215 230 250 260tN 013 0089 0062 0056
5 Discussion
51 Impact of the temperature and relativehumidity variation ndash theoreticalbackground
The results of the preceeding section revealed that thenumber of surving ice crystals depends critically on am-bient humidity as well as on ambient temperature Herewe want to give some theoretical explanation for thesimulation results
During the downward transport the air trapped insidethe vortex undergoes adiabatic heating We can estimatethe vertical displacementδ zcrit where the relative hu-midity falls below saturation when for now we simplyassume that the ice crystals do not grow or evaporateduring the vortex falling Then the air within the vortexheats up according to a dry adiabatic process such thatδT = Γdδ z with Γd = gcp asymp 98 Kkm independentlyof the ambient lapse rate It does not make sense to usean ice adiabatic lapse rate because the ice is not in equi-librium with the vapour and the ice mass sublimating isso small that the release of latent heat only weakly af-fects the lapse rate Also the effect of the stratificationon the pressure profile and thus on the lapse rate is neg-ligible The total amount of vapour of an initially super-saturated air parcel at cruise altitude matches the one ofa saturated parcel at some higher temperature namely
(1+ si) qs(TCA) = qs(TCA +Γd δ zcrit)
Hereqs is the saturation mixing ratio of water vapour(with respect to ice) Taylor expansion of the rhs and us-ing part
partT lnqs = 09 partpartT lnes (the constant 09 accounts for
the adiabatic atmospheric pressure change during the de-scent of the plume andes is saturation vapour pressure)gives
δ zcrit =si
Γd middot09 partpartT (lnes(TCA))
The threshold isδ zcrit = si middot750 m for cold conditions(TCA = 205 K) andsi middot910 m for warm conditions (TCA =
152 S Unterstrasser et al Contrail microphysics in the vortex phase Meteorol Z 17 2008
Figure 5 Temporal evolution of primary ice mass for various tem-
peratures and relative humidities (TCA = 222 K andsi = 10 dash-
dotted TCA = 209 K and si = 10 dashedTCA = 209 K and
si = 0 solidTCA = 222 K andsi = 0 dotted)
Figure 6 Power law fits (see equation 51) for the surviving number
and mass of ice crystals vs relative humidity for different temper-
atures The curve labels correspond to the line number in Table 4
Diamonds represent the results from the simulations
225 K) Threshold values numerically computed withthe full nonlinear equations are aboutsi middot50 m smallerFor our moistest case this means that subsaturation isreached in the vortex at a vertical distance of less thanabout 180 m a distance that is reached in all our simu-lations Hence all our simulations reach subsaturationThe total ice mass does not fall below its initial valueas long as the plume is displaced less thanδ zcrit Actu-ally the ice crystals grow during the first 10 to 40 s untilall excess vapour from the ambient supersaturation in
the plume is condensed The rate of deposition increasesconsiderably with temperature Initially the total icemass per flight path is 146middot10minus2 kgm (water emittedby the engines) The excess ambient moisture inside theplume with radiusrp = 20 m isδq = siqs(T )2r2
pπρairFor si = 10 andTCA = 220 K δq = 066 kgm Vary-ing TCA within the simulated range can indecreaseδqby a factor of 2-3 Thus the total ice mass can increaseby 20 (cold 5 supersaturation) up to 300 (warm20 supersaturation) Since there is no nucleation dur-ing the vortex phase the initially existing crystals cangrow substantially
The sinking vortex pair reachesδ zcrit some time af-ter all the excess vapour is condensed The plume airis subsaturated and the crystals lose mass in order tomaintain saturation Typically the relative humidity isabout 95ndash98 inside the plume as the sublimation lagsbehind the adiabatic heating The sublimation is fasterfor higher temperatures but more ice is necessary tosaturate the air How far below the threshold altitudezCA minusδ zcrit the ice crystals survive depends most sensi-tively on temperature and cannot be easily answered bytheoretical reasoning Hence we resort to the presentednumerical simulations
In Fig 5 the temperature sensitivity of the sublima-tion process is demonstrated The temporal evolution ofthe primary ice mass is shown forTCA = 209222 Kand si = 0 10 Forsi = 0 the displacementthresholdδ zcrit is 0 m and subsaturation sets in imme-diately ForTCA = 222 K the ice has been completelysublimated within 100 s whereas forTCA = 209 K stillmore than 20 of the ice mass surives the vortex phase(tbreakup = 135 s) Atsi = 10 it takes abouttcrit = 40 suntil the vortex falls below the critical height (δ zcrit =75 m) hence it takes at least 40 s more than in the othercases (si = 0 ) to sublimate the ice completely AtTCA = 222 K the estimated minimum survival time of thecrystals (100s+40s) is close totbreakup It turns out thatabout 1 of ice mass and crystals (not shown here) sur-vive At TCA = 209 K the initial condensation of excessmoisture is slower than atTCA = 222 K nevertheless thecolder plume contains more ice mass att gt 70 s andnearly 50 of the ice mass still exist at vortex break-upWe can conclude that the survival of the ice in the pri-mary vortex depends on the interrelationship of differ-ent timescales namelytcrit (most sensitive tosi) tbreakup(depending on aircraft parameters stratification and am-bient turbulence) and the growthsublimation timescaleof the ice crystal population (most sensitive toT )
δ zcrit was eventually reached in all our simulationsbefore vortex breakup The question then arises whetherthere are cases where this does not occur and wheretherefore all ice crystals should survive This could hap-pen for instance in highly supersaturated air but thennatural cirrus may have formed anyway Another pos-
Meteorol Z 17 2008 S Unterstrasser et al Contrail microphysics in the vortex phase 153
Table 4 Fit parameters for equation 51 at various temperatures
No quantity y0 β α1 tN at T = 209 K 382middot10minus1 965 0252 tIWC at T = 209 K 267middot10minus1 893 1433 tN at T = 212 K 176middot10minus1 983 0474 tIWC at T = 212 K 069middot10minus1 965 1565 tN at T = 217 K 659middot10minus3 980 1776 tIWC at T = 217 K 279middot10minus3 990 2147 tN at T = 222 K 269middot10minus3 938 348 tIWC at T = 222 K 918middot10minus3 969 295
Table 5 Ice crystal number density in a plume of 3s age as a func-
tion of ambient temperature (taken from Fig 4 in KAumlRCHER et al
1998)
TCA in K 209 212 217 222N in 104 cmminus3 15 12 8 1
sibility is given for smaller aircraft than the simulatedone when the vortices sink slower than here such thattheir maximum downward travelling distance is lessthanδ zcrit
52 Power-law fitting
The number and mass concentrations of ice crystals sur-viving the vortex phase increases monotonically withambient relative humidity It turns out that the depen-dence can be fitted with a power law The functionf (RHi) approximates the normalised quantitiestIWCandtN for the baseline scenario
f (RHi) = y0
(
RHi minusβ100minusβ
)α (51)
The three parametersy0β α are fitted (chi-square) fortIWC andtN using the simulation results at the five hu-midity levels RHi = 100 103 105 110 120 The parameter values for all temperaturesTCA
are listed in Table 5 At most data points the absoluteerror | f (RHi)minus tN(RHi)| and | f (RHi)minus tIWC(RHi)| isbelow 0005 The simulation results and the correspond-ing approximations are shown in Fig 6
In equation 51y0 is the surviving fraction (massor number) when the environment is just saturated Asseen from the tabley0 decreases strongly with increas-ing temperature The parameterβ is that relative humid-ity where f becomes zero ie the ice sublimates com-pletely during the vortex phase As the table shows allvalues ofβ range from about 90 to 99 consistent withthe fact that a contrail does not survive significantly af-ter the end of the vortex phase even when the air is onlyslightly subsaturated The exponentsα increase stronglywith increasing temperature which expresses the fact
that the sensitivity oftIWC andtN on ambient humidityincreases strongly with increasing temperature
53 Testing minor sensitivity parameters
In our simulations we have used a fixed number of icecrystals per meter of flight in order to allow the samenormalisation for all simulations Actually this num-ber can vary within about one order of magnitude de-pending for instance on ambient temperature fuel sul-phur content soot particle emission index for variousengines etc For testing the sensitivity of the results withregard to the ice crystal number density we have takenfrom KAumlRCHER et al (1998) temperature-dependentestimates ofN assuming a medium sulphur contentThese are listed in Table 5 The temperature-dependentice number density equals our standard choice (8middot104 cmminus3) at TCA = 217 K N is higher at colder andconsiderably smaller at higher temperature Simulationswith the variedN andsi = 5 were performed for thetwo cold cases yet it was found that the normalisednumber of surviving ice crystals and mass do not changesignificantly compared to our standard choice ofNHowever atTCA = 222 K there is a non-negligible sen-sitivity to N a larger fraction of crystals survive whenless crystals are present initially
Fig 7 shows the fraction of surviving crystals andice mass for the warm case (TCA = 222 K) at supersat-urations ranging from 0 to 20 comparing the runswith our standardN and the one corresponding toTCA =222 K from Table 5 Note the large factor of eight be-tween these two ice number concentrations We see thatwith N = 1 middot 104 cmminus3 considerably more crystals sur-vive both in the primary and secondary wake than in thestandard cases The threshold supersaturation at whichsay 1 of ice crystals survives in the vortices is higherwhen the initial ice number density is lower Neverthe-less the absolute number of surviving ice crystals ishigher for the standardN than for the smaller value ofN(due to the large difference between these two values)More excess vapour from the ambient supersaturation isdeposited on the detrained crystals in the case with stan-dardN than in the other case Thus the secondary wakeis stronger and the total surviving ice mass fraction islarger in the standard cases than in the cases with thesmall value ofN
We investigated several more modifications of theinitial ice distribution We introduced random densityfluctuations of up toplusmn30 on the uniform distributionThis had no impact and the concentration is smoothedout quickly since the diffusion is very high (controlledby the CC-tool) Generally we found out that the choiceof distribution is not critical as long as the fraction ofdeentrained particles is similar
A vortex features a low pressure at the centreto compensate for centrifugal forces LEWELLEN and
154 S Unterstrasser et al Contrail microphysics in the vortex phase Meteorol Z 17 2008
LEWELLEN (2001) report of a typical underpressure ofaboutpv = 2 hPa Accordingly the temperature in a vor-tex core must be lower than at its limb if we assumean adiabat a cooling byTv asymp 05 K would result Cool-ing in turn reduces the saturation vapour pressure andthe sublimation rate during the descent of the vortex Atest simulation showed that the effect is negligible sincethe depression is confined to a small area of the primarywake
54 Comparison with recent 3D results
Although 2D simulations have the advantage that onecan test quickly a number of major and minor sensitivi-ties they have also some disadvantages compared witha full 3D model The most obvious one is that the vortexdecay process due to Crow instability can be achievedusing numerical tricks but the variations due to thisinstability along the flight path cannot be representedHowever the question is is this variation so importantthat it is worth the effort of a full 3D model to com-pute it To our view it is not As stated before the ulti-mate goal of this investigation is to provide initial condi-tions for later studies of the contrail-to-cirrus transitionand the resulting contrail cirrus For such a purpose theinitial variations along the flight path for example themammatus like structures that often appear in supersat-urated cases (an example can be found in GERZ et al(1998) Fig 2) are irrelevant since they will be forgottenhours later
If we had a 3D simulation we would eventually aver-age the results anyway In this sense our 2D simulationis hoped to give results that are close to these desiredaverages It is then possible that due to non-linearitiesthis 2D average would be wrong (ie strongly differingfrom the true 3D average) A comparison with recent 3Dresults shows that this is not the case We use the simula-tions of LEWELLEN and LEWELLEN (2001) and HUEB-SCH and LEWELLEN (2008) for comparison First wenote by looking at their drift-plots that there is not muchalong-flight-path variation in the cross-stream integratedfields during the vortex phase Stronger variations evolvelater in the beginning dispersion phase into which oursimulations do not reach As already said these varia-tions will be smoothed away or otherway randomizedby the atmospheric turbulence and shear motions and bycrystal sedimentation in the course ot the transition tocontrail cirrus
LEWELLEN and LEWELLEN (2001) investigatecases of 2 up to 30 ice supersaturation withT = 220 K (similar to ours) a slightly smaller lapserate and turbulence than ours but a larger crystal num-ber density A look at their Fig 7 shows their vortexbreakup times which are similar to ours and the sur-viving fraction of ice number Let us consider the case
Figure 7 Normalised totals of surviving ice crystal number (left)
and ice mass (right) as a function of relative humidity The curves
are shown for temperatureTCA = 222 K with initial ice crystal con-
centrationN = 1 middot 104 cmminus3 (squares) andN = 8 middot 104 cmminus3 (as-
terisks) The line style denotes the integration over the total cross-
section (solid) primary (dotted) and secondary (dashed) wake
with 10 supersaturation Our simulations give frac-tions (tN) of 007 and 035 for 222 and 217 K respec-tively whereas the 3D simulation at 220 K gives a frac-tion of 028 At 20 supersaturation we gottN of 021and 046 for the two considered temperatures whereasthe 3D simulation gavetN of 081 Hence the differ-ences are larger than for the less supersaturated caseHowever this difference is most likely due to the differ-ing assumptions in the microphysics parameterisationsHUEBSCH and LEWELLEN (2008) have shown that useof a monomodal size distribution as in LEWELLEN andLEWELLEN (2001) leads to overestimation oftN sothe value 081 is too large Since we use a broad log-normal size distribution our values oftN are accord-ingly smaller than that of LEWELLEN and LEWELLEN
(2001)Summarising in view of the later evolution into a
contrail cirrus and the then dominant atmospheric mo-tions the 3D variations in the early structure of a contrailare of minor importance The surviving fraction of icenumber compares well with those of recent 3D simula-tions when the conditions are similar The ice mass isanyway determined by the ambient humidity We con-clude that a our 2D approach is accurate enough to com-pute the surviving fractions of ice number and mass andhence does justice to our next goal to study contrail-to-cirrus transformation
Meteorol Z 17 2008 S Unterstrasser et al Contrail microphysics in the vortex phase 155
6 Conclusions
In the present paper we have used numerical 2D simu-lations of the contrailrsquos vortex phase to determine majorand minor factors of influence on the mass and num-ber concentration of ice crystals that survive the vortexphase As we had to perform a large number of sim-ulations we decided not to use a 3D model but to in-stead equip a 2D model with a circulation control toolto ensure a realistic vortex decay Surviving fractionsand the final vertical profile of ice concentration are im-portant initial conditions for studies of contrail-to-cirrustransformation The simulations have been performedfor only one aircraft type the influence of wing spanand flight speed has not yet been tested
We can state the following conclusions
bull The fraction of ice number and mass that sur-vives the vortex phase depends strongly on theambient supersaturation with respect to ice Thedependence can be fitted by a power law Thedependence is strongest for the highest temper-ature that allows contrail formation (Schmidt-Appleman criterion) and becomes weaker withdecreasing temperature
bull Only the ice in the secondary vortex survives atlow supersaturation consistent with the results ofSUSSMANN and GIERENS(1999) giving rise to apersistent yet very faint contrail
bull The stratification of the atmosphere and its turbu-lence level have strong impact of the fraction ofthe surviving ice via their dynamical effect on thesinking vortex pair Strong turbulence leads to fastvortex decay whereas weak turbulence allows thevortex pair to travel a long distance downwardHence in situations of strong turbulence more iceis rendered to the atmosphere than in weakly tur-bulent conditions The downward travelling dis-tance of the vortex increases with decreasing strat-ification strength hence more crystals survive inmore stable situations and vice versa Addition-ally more ice is detrained into the secondary wakein more stable situations
bull The initial number of ice crystals increases withdecreasing ambient temperature within a range ofabout an order of magnitude At the warmest tem-peratures that the Schmidt-Appleman criterion al-lows for contrail formation the surviving fractionis larger when less ice crystals are formed initiallyHowever the total number of surviving crystalsand the surviving ice mass can be larger whenmore crystals are formed initially
bull The variation of the initial circulation with vary-ing aircraft weight during a flight details of the
spatial distribution and the temperature profilewithin the vortices have only a minor influence onthe surviving ice fraction
We see that the structure and microphysical proper-ties (hence also the optical appearance) of a contrail de-pend sensitively on ambient conditions during its earlyhistory up to the end of the vortex phase which is about2 to 3 minutes after exhaust The most important condi-tions are atmospheric parameters supersaturation tem-perature stability and turbulence level We expect thatalso wind shear is an important parameter but this hasnot yet been tested because it will affect the vortex evo-lution much stronger than the parameters studied so farhence it deserves a separate study With the informa-tion gained during the presented studies we are now ableto reasonably initialise larger scale simulations of thecontrail-to-cirrus transformation
Acknowledgments
The authors would like to thank Bernd KAumlRCHERThomas GERZ and Frank HOLZAumlPFEL for their helpThe first author especially wishes to thank AndreasDOumlRNBRACK for his steady support and many fruitfuldiscussions This work contributes to the DLRHGF-project ldquoParticles and Cirrus Cloudsrdquo (PAZI-2) and tothe European Network of Excellence ECATS (Environ-mentally Compatible Air Transport System) The sim-ulations have been carried out as a part of the spe-cial project ldquoIce-supersaturation and cirrus cloudsrdquo atECMWF
References
CROW S C 1970 Stability theory for a pair of trailing vor-tices ndash AIAA J8 2172ndash2179
GERZ T T DUumlRBECK P KONOPKA 1998 Transport andeffective diffusion of aircraft emissions ndash J Geophys Res103 25905ndash25913
GERZ T T EHRET 1997 Wingtip Vortices and ExhaustJets During the Jet Regime of Aircraft Wakes ndash AerospSci Technol7 463ndash474
GIERENS K M 1996 Numerical simulations of persistentcontrails ndash J Atmos Sci53 3333ndash3348
GIERENS K E JENSEN 1998 A numerical study ofthe contrail-to-cirrus transition ndash Geophys Res Lett554341ndash4344
HEYMSFIELD A J J IAQUINTA 2000 Cirrus crystal ter-minal velocities ndash J Atmos Sci57 916ndash938
HOLZAumlPFEL F 2003 Probabilistic two-phase wake vortexdecay and transport model ndash J Aircraft40 323ndash331
mdash 2006 Probabilistic Two-Phase Aircraft Wake-VortexModel Further Development and Assessment ndash J Aircraft43 700ndash708
HUEBSCH WW DC LEWELLEN 2008 Application ofLES and binned microphysics for sensitivity study on con-trail evolution ndash Proc of the TACndashConference June 26 to29 2006 Oxford UK 167ndash172
156 S Unterstrasser et al Contrail microphysics in the vortex phase Meteorol Z 17 2008
INTERGOVERNMENTAL PANEL FOR CLIMATE CHANGE(IPCC) 1999 Aviation and the global atmosphere JEPENNER et al (Eds) ndash Cambrige University Press 373pp
JENSEN E AS ACKERMAN DE STEVENS OBTOON P MINNIS 1998 Spreading and growth of con-trails in a sheared environment ndash J Geophys Res10331557ndash31567
KESSLER E 1969 On the distribution and continuity ofwater substance in atmospheric circulation ndash Met MonAmer Meteor Soc32 80 ppcher98
KAumlRCHER B R BUSEN A PETZOLD F P SCHROumlDERU SCHUMANN 1998 Physicochemistry of aircraft-generated liquid aerosols soot and iceparticles 2 Com-parison with observations and sensitivity studies ndash J Geo-phys Res103 17129ndash17147
KOENIG L R 1971 Numerical modeling of ice depositionndash J Atmos Sci28 226ndash237
LEWELLEN D C W S LEWELLEN 2001 The effects ofaircraft wake dynamics on contrail development ndash J At-mos Sci58 390ndash406
MANNSTEIN H U SCHUMANN 2005 Aircraft inducedcontrail cirrus over Europe ndash Meteorol Z14 549ndash554
MANNSTEIN H R MEYER P WENDLING 1999 Opera-tional detection of contrails from NOAA-AVHRR data ndashInt J Remote Sens20 1641ndash1660
SAUSEN R I ISAKSEN V GREWE D HAUGLUSTAINED S LEE G MYHRE M KOumlHLER G PITARI USCHUMANN F STODAL C ZEREFOS 2005 Aviationradiative forcing in 2000 An update of IPCC (1999) ndash
Meteorol Z14 555ndash561SCHUMANN U 1996 On conditions for contrail formation
ndash Meteorol Z5 4ndash23SHARMAN R C TEBALDI G WIENER J WOLFF 2005
An integrated approach to mid- and upper-level turbulenceforecasting ndash Wea Forecast21 268ndash287
SMOLARKIEWICZ P L MARGOLIN 1997 On forward-in-time differencing for fluids an EulerianSemi-Lagrangiannon-hydrostatic model for stratified flows ndash Atmos-Oceans35 127ndash152
mdash mdash 1998 MPDATA A finite-difference solver for geo-physical flows ndash J Comp Phy140 459ndash480
SPICHTINGER P K GIERENS2008 Mesoscale modellingof homogeneous and heterogeneous cirrus cloud formationand evolution using EuLag Part 1 Model description andvalidation ndash Atmos Chem Phys Diss8 601ndash686
STUBER N P FORSTER G RADEL K SHINE 2006 Theimportance of the diurnal and annual cycle of air traffic forcontrail radiative forcing ndash Nature441 864ndash867
STROumlM L K GIERENS 2002 First simulations ofcryoplane contrails ndash J Geophys Res107 4346doi1010292001JD000838
SUSSMANN R K GIERENS 1999 Lidar and numericalstudies on the different evolution of a contrailrsquos vortex sys-tem and its secondary wake ndash J Geophys Res104 2131ndash2142
mdash mdash 2001 Differences in early contrail evolution of 2-engined versus 4-engined aircraft Lidar measurements andnumerical simulations ndash J Geophys Res106 4899ndash4911
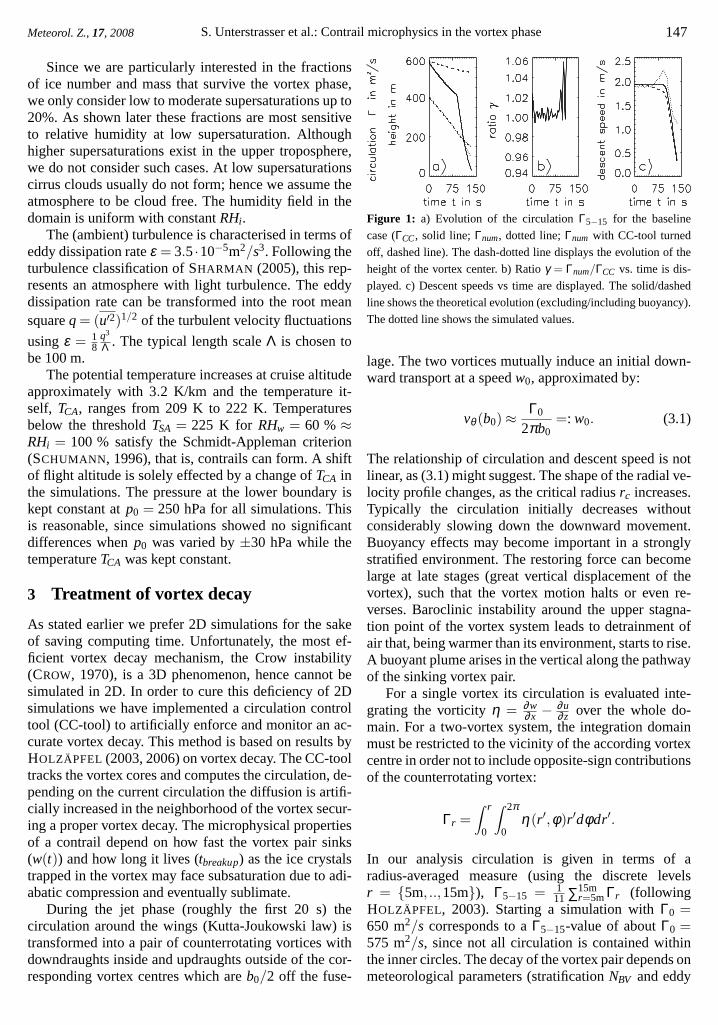
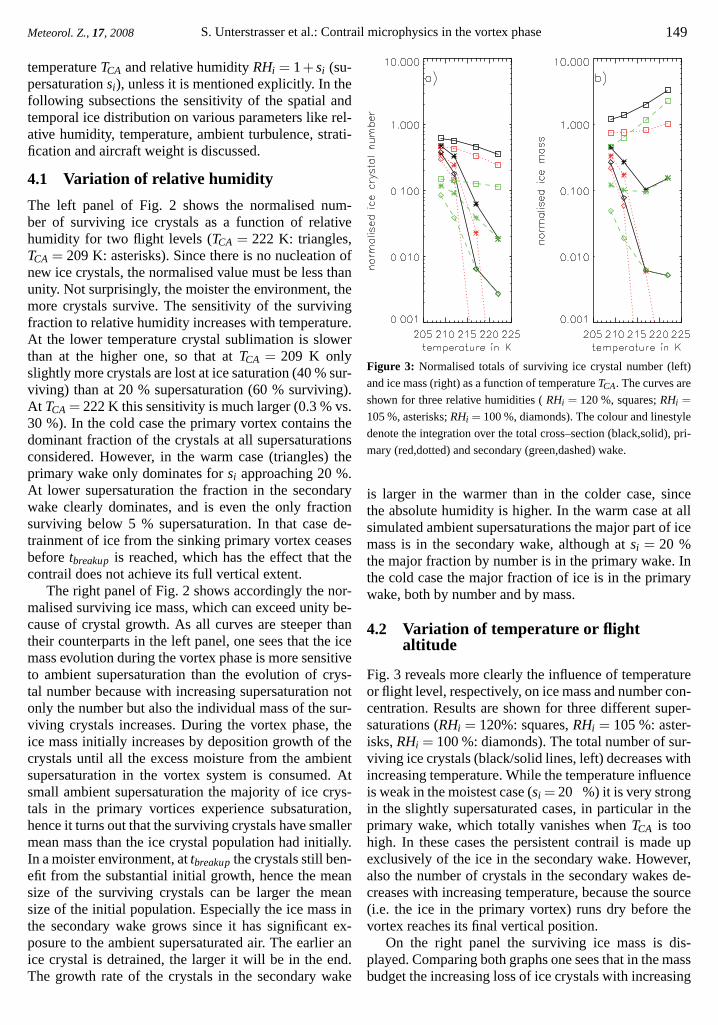
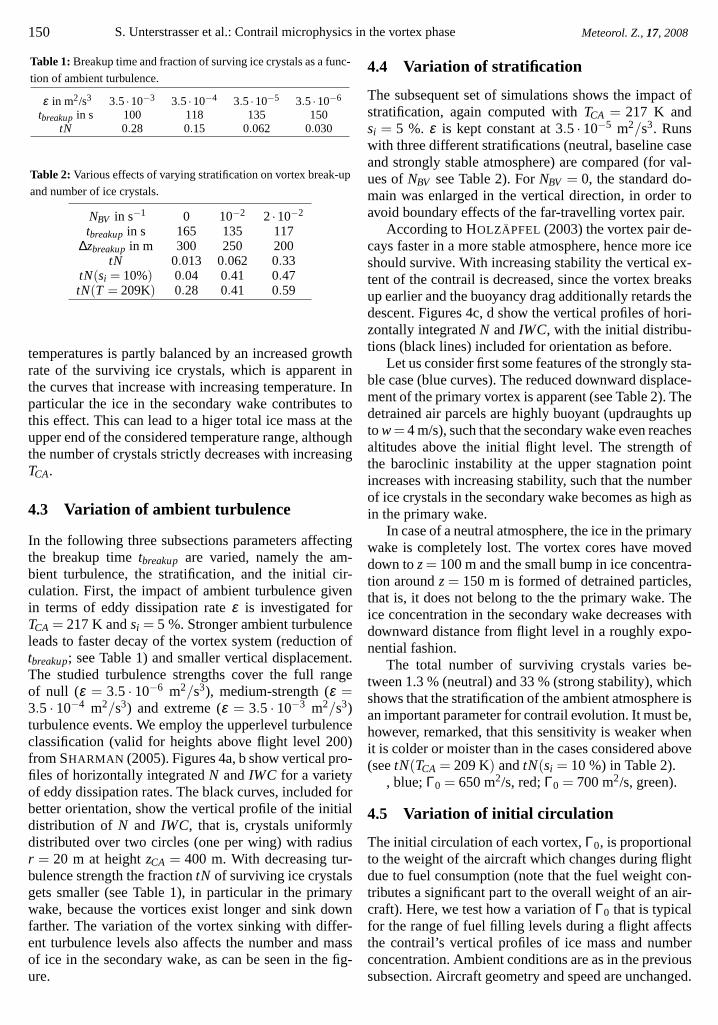
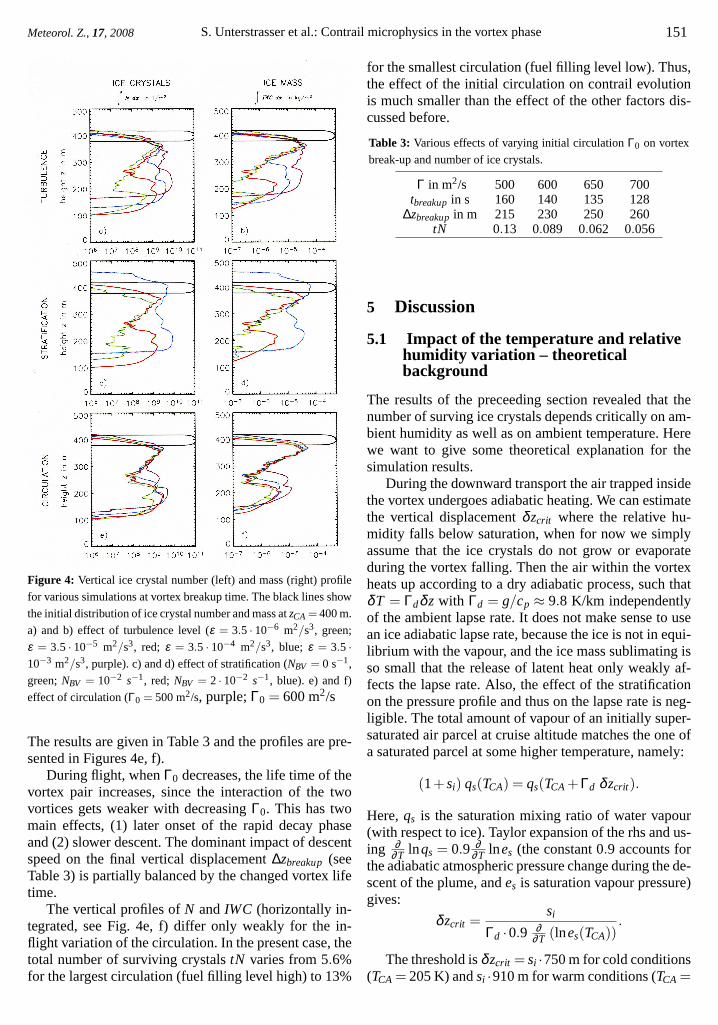
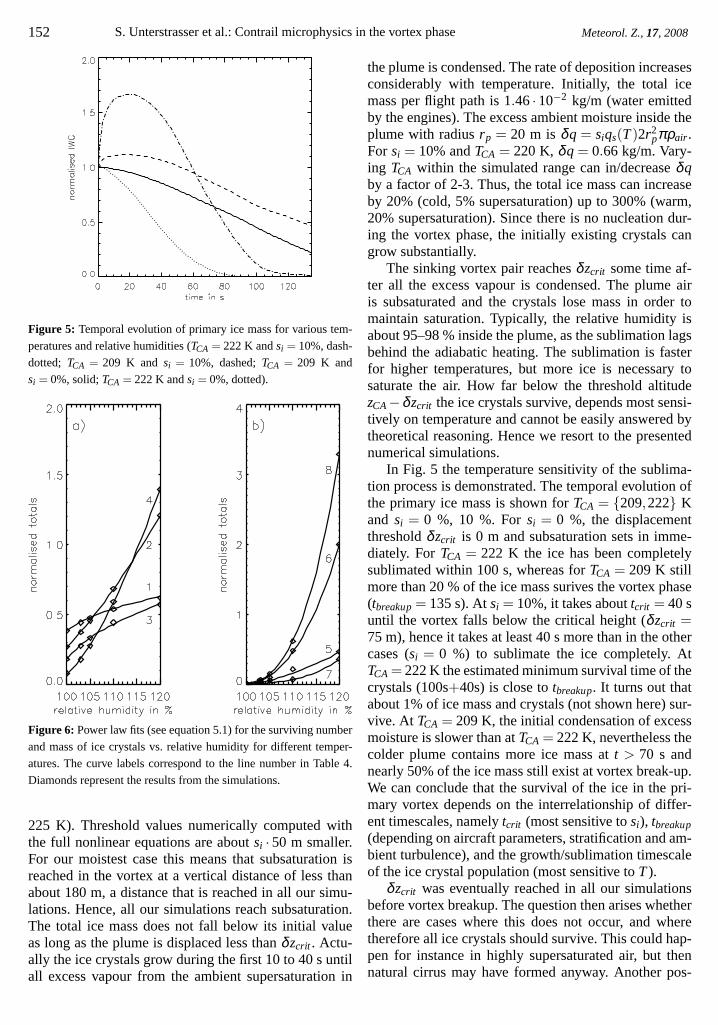
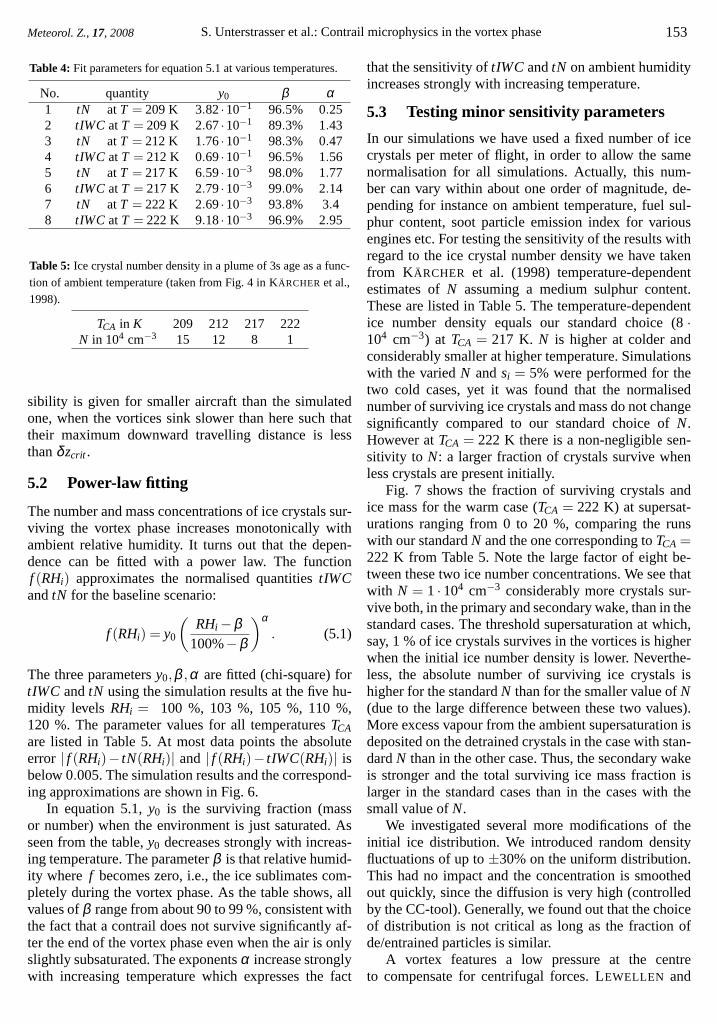
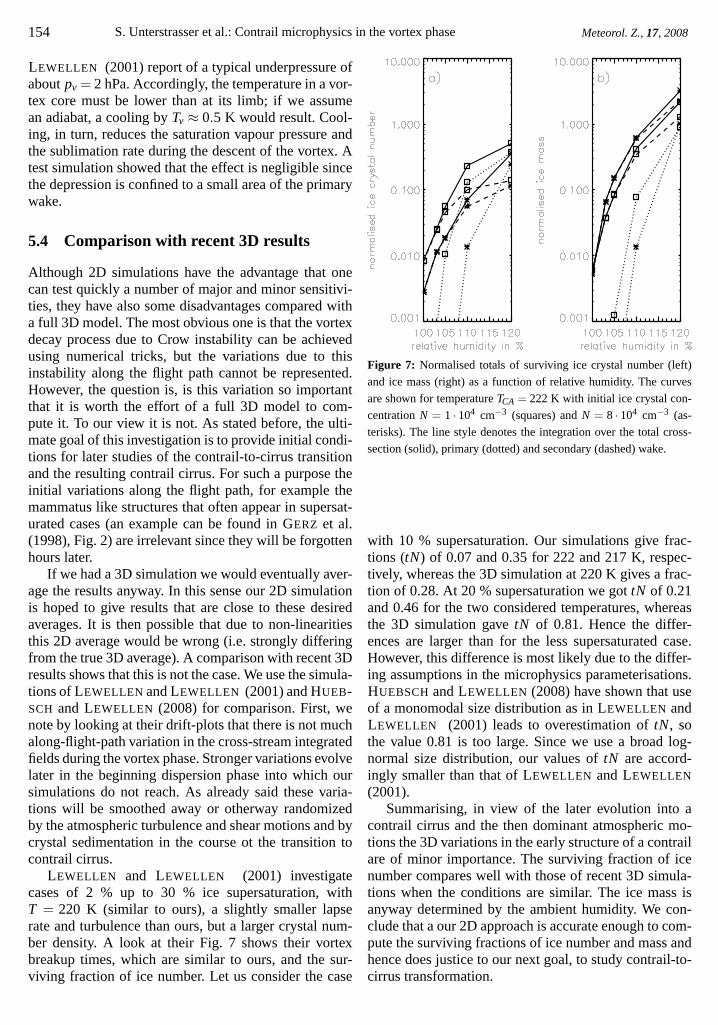
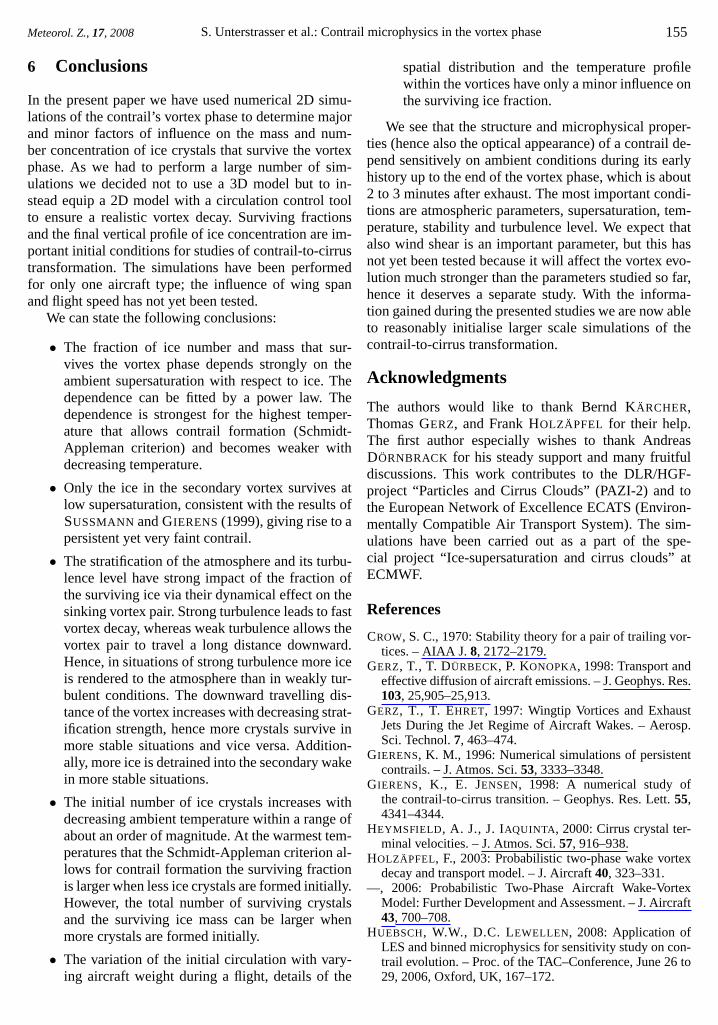