
The Total Costs of Corporate Borrowing in the Loan Market: Don't ...
50
Sonderforschungsbereich/Transregio 15 · www.sfbtr15.de Universität Mannheim · Freie Universität Berlin · Humboldt-Universität zu Berlin · Ludwig-Maximilians-Universität München Rheinische Friedrich-Wilhelms-Universität Bonn · Zentrum für Europäische Wirtschaftsforschung Mannheim Speaker: Prof. Dr. Klaus M. Schmidt · Department of Economics · University of Munich · D-80539 Munich, Phone: +49(89)2180 2250 · Fax: +49(89)2180 3510 * University of Bonn ** Stern School of Business, New York University *** ESMT European School of Management and Technology February 10, 2015 Financial support from the Deutsche Forschungsgemeinschaft through SFB/TR 15 is gratefully acknowledged. Discussion Paper No. 489 The Total Costs of Corporate Borrowing in the Loan Market: Don’t Ignore the Fees Tobias Berg*, Anthony Saunders** and Sascha Steffen***
Transcript of The Total Costs of Corporate Borrowing in the Loan Market: Don't ...
Sonderforschungsbereich/Transregio 15 · www.sfbtr15.de Universität Mannheim · Freie Universität Berlin · Humboldt-Universität zu Berlin · Ludwig-Maximilians-Universität München
Rheinische Friedrich-Wilhelms-Universität Bonn · Zentrum für Europäische Wirtschaftsforschung Mannheim
Speaker: Prof. Dr. Klaus M. Schmidt · Department of Economics · University of Munich · D-80539 Munich, Phone: +49(89)2180 2250 · Fax: +49(89)2180 3510
* University of Bonn ** Stern School of Business, New
York University *** ESMT European School of Management and Technology
February 10, 2015
Financial support from the Deutsche Forschungsgemeinschaft through SFB/TR 15 is gratefully acknowledged.
Discussion Paper No. 489
The Total Costs of Corporate Borrowing in the Loan Market:
Don’t Ignore the Fees
Tobias Berg*, Anthony Saunders** and Sascha Steffen***
1
The Total Costs of Corporate Borrowing in the Loan Market:
Don’t Ignore the Fees
TOBIAS BERG, ANTHONY SAUNDERS, and SASCHA STEFFEN*
February 10, 2015
Abstract
More than 80% of US syndicated loans contain at least one fee type and contracts typically
specify a menu of spread and different types of fees. We test the predictions of existing theories
about the main purposes of fees and provide supporting evidence that: (1) fees are used to price
options embedded in loan contracts such as the draw-down option for credit lines and the
cancellation option in term loans; and (2) fees are used to screen borrowers about the likelihood
of exercising these options. We also propose a new total-cost-of-borrowing measure that includes
various fees charged by lenders.
* Tobias Berg is at the University of Bonn, Anthony Saunders is at the Stern School of Business, New York University, and Sascha Steffen is at the ESMT European School of Management and Technology. We thank Viral Acharya, Javed Ahmed, Bastian von Beschwitz, Lamont Black, Martin Brown, Michael Faulkender, Mark Flannery, Iftekhar Hasan, Elena Loutskina, Loretta Mester, Michael Roberts, Tao Shen, conference participants at the 2013 SFS Cavalcade in Miami, the 2013 FIRS meetings in Dubrovnik, the 2013 Bank Structure Conference in Chicago, the WFA 2013 meetings in Lake Tahoe, the EFA 2013 meetings in Cambridge, the DGF 2013 meetings, the CAREFIN 2013 conference at Bocconi, the 2014 Corporate Finance Workshop at Tsinghua University and seminar participants at Fordham University, the University of Bonn, and the University of St. Gallen for valuable comments and suggestions. In addition, we thank the editor, Michael Roberts, and three anonymous referees for their comments and suggestions. Tobias Berg gratefully acknowledges financial support from the Deutsche Forschungsgemeinschaft through SFB 649 "Economic Risk" and SFB-TR15 "Governance and the Efficiency of Economic Systems".
2
Fees are an important part of corporate loan contracting. More than 80% of US syndicated loans
contain at least one fee type and contracts typically specify a menu of spread and different types
of fees. Despite this importance, the substantial empirical literature that studies private loan
contracts largely ignores their complex pricing mechanisms and focuses on a single statistic such
as an interest rate spread.1 Contracts, however, are not that simple as the following example
suggests.
On June 16th, 2010, Meredith Corp., an American media conglomerate, entered into a
USD 150mn credit line, a commitment by some banks under which Meredith can borrow up to
the committed amount over a period of 36 months. The contract specifies that Meredith has to
pay 50bps of the committed amount upfront. Moreover, during the 36 months, Meredith pays
37.5bps annually for each dollar that is committed but not borrowed. For each dollar borrowed
under the commitment, it has to pay LIBOR plus 250bps (the interest rate spread). Obviously, it
is insufficient to describe the contract by simply referring to the interest rate spread. On the
contrary, fees are clearly important because of their magnitude and as they are intimately linked
to states of the world in which Meredith decides to borrow or not to borrow under the
commitment.2
In this paper, we take a first step in analyzing the pricing structure and, in particular, the
role of fees in corporate loan contracts. Why are fees in loan contracts and how are they
differentially used in the most common loan types, credit lines and term loans? Why do fees
come in various forms and combinations? And, how are fees set, that is, how do fees vary with
borrower and other financial market characteristics?
1 A notable exception is the paper by Shockley and Thakor (1997). We extend their paper by empirically establishing the option-view of lines of credit and linking fees to the takedown behavior of borrowers. 2 The Dealscan FacilityID of this agreement is 256725. The full credit agreement is available via http://www.sec.gov/Archives/edgar/data/65011/000006501110000058/exh.htm. Information on spreads and fees can be found in Section 2.08 (spread) and Section 2.09 (fees).

3
The theoretical literature on loan pricing provides clear predictions regarding the
existence and magnitude of fees in corporate loan contracts. We start by revisiting these theories
and identify two main purposes of fees: First, fees are used to price options embedded in
corporate loan contracts (Thakor et al., 1981). Most credit lines and term loan contracts contain
option-like features. The empirical loan pricing literature usually lumps credit lines and term
loans together even though these contracts are inherently different. For example, the most
widespread option is the option to draw down on a line of credit. Sufi (2009) reports that 82% of
firm-years in the U.S. have a line of credit and even 32% of otherwise all equity financed firms
have credit lines. At the time borrowers exercise this option, there is a value transfer from
lenders to borrowers: borrowers choose to use the credit line if the committed interest rates is
lower that the current spot market rate. Fees compensate lenders for granting this option. Similar
arguments apply for the option to cancel a term loan – which is valuable for borrowers and thus
requires compensation in the form of upfront or cancellation fees.
The second purpose of fees is to screen borrowers if they have private information about
exercising any of the options embedded in a loan contract (Thakor and Udell, 1987), and to alter
ex-post incentives. For example, a borrower can signal a low likelihood of future credit line
usage by selecting into a contract with a high spread and a low commitment fee.
We provide empirical evidence consistent with these theories. First, we empirically
verify the option-like characteristics of credit lines. In particular, we show that firms are more
likely to draw on their lines of credit when their economic situation deteriorates. We group
borrowers into quintiles based on realized equity returns in the first three years after loan
origination and find significantly higher draw-downs from borrowers with the lowest returns.
4
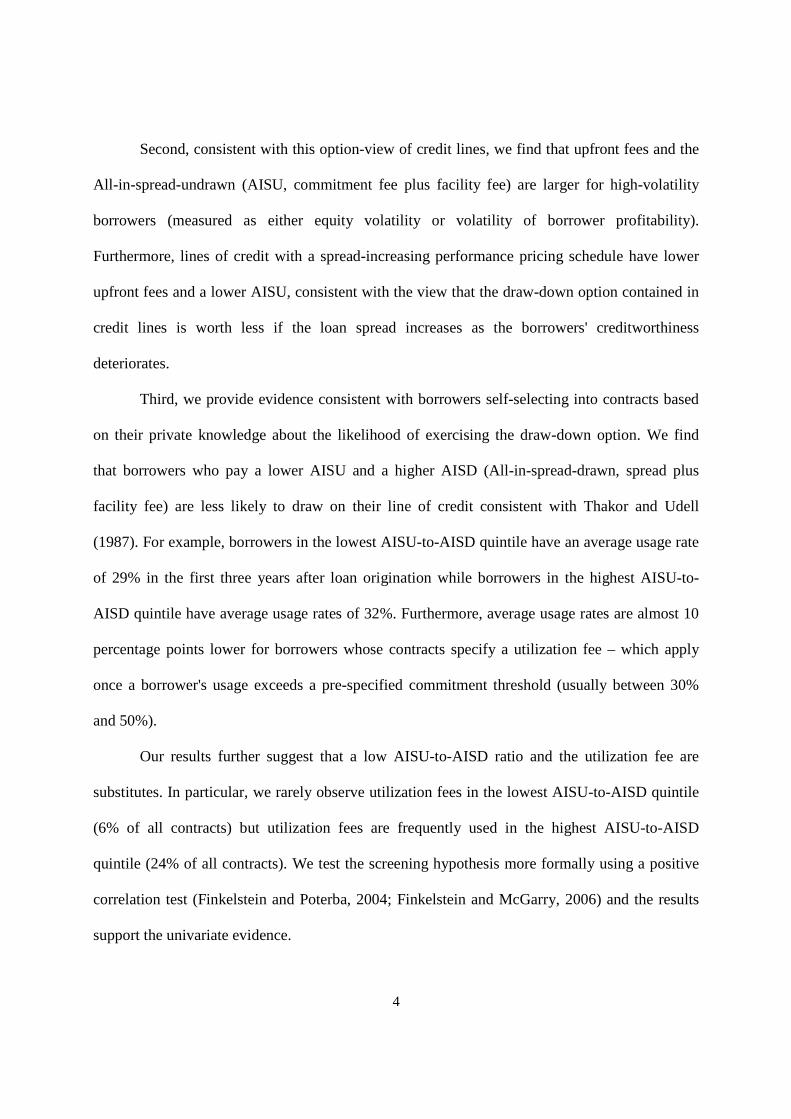
Second, consistent with this option-view of credit lines, we find that upfront fees and the
All-in-spread-undrawn (AISU, commitment fee plus facility fee) are larger for high-volatility
borrowers (measured as either equity volatility or volatility of borrower profitability).
Furthermore, lines of credit with a spread-increasing performance pricing schedule have lower
upfront fees and a lower AISU, consistent with the view that the draw-down option contained in
credit lines is worth less if the loan spread increases as the borrowers' creditworthiness
deteriorates.
Third, we provide evidence consistent with borrowers self-selecting into contracts based
on their private knowledge about the likelihood of exercising the draw-down option. We find
that borrowers who pay a lower AISU and a higher AISD (All-in-spread-drawn, spread plus
facility fee) are less likely to draw on their line of credit consistent with Thakor and Udell
(1987). For example, borrowers in the lowest AISU-to-AISD quintile have an average usage rate
of 29% in the first three years after loan origination while borrowers in the highest AISU-to-
AISD quintile have average usage rates of 32%. Furthermore, average usage rates are almost 10
percentage points lower for borrowers whose contracts specify a utilization fee – which apply
once a borrower's usage exceeds a pre-specified commitment threshold (usually between 30%
and 50%).
Our results further suggest that a low AISU-to-AISD ratio and the utilization fee are
substitutes. In particular, we rarely observe utilization fees in the lowest AISU-to-AISD quintile
(6% of all contracts) but utilization fees are frequently used in the highest AISU-to-AISD
quintile (24% of all contracts). We test the screening hypothesis more formally using a positive
correlation test (Finkelstein and Poterba, 2004; Finkelstein and McGarry, 2006) and the results
support the univariate evidence.

5
Our analysis of fees is a useful starting point in understanding the contracting
environment surrounding corporate loan contracts. We document that lenders use a complex
pricing structure to ensure an appropriate expected return rather than a single price measure,
thereby accounting for the various options embedded in corporate loan contracts. However, once
spreads and fees are set, we can use this pricing structure to estimate a cost measure that
incorporates various fees charged by lenders. In the final part of the paper, we develop a
comprehensive total-cost-of-borrowing measure (TCB) that accounts for fees, spread and the
likelihood that they will have to be paid. We suggest that the TCB measure might be used as an
alternative to the AISD in future research exploring the cost of debt.
There are a number of issues that have not been explored in this paper that require
different types of analyses. We describe some of these issues throughout the paper. Overall, we
need to better understand (both from a theoretical and empirical perspective) why certain options
and fees exist and how they determine the timing and state in which value transfers between
borrowers and lenders occur. Our paper is a first step in this direction.
The remainder of the paper is structured as follows. Section 1 provides basic stylized
facts on the importance of fees in syndicated loan contracts. Section 2 derives hypotheses on the
occurrence and magnitude of fees from prior theoretical work and provides empirical evidence
alongside these hypotheses. Section 3 proposes a new and comprehensive total-cost-of-
borrowing measure that includes the various fees being charged by the lenders. Section 4
concludes.

6
I. Data sources, loan types and options, fee types and definitions
A. Data sources
We collect all syndicated loans issued by U.S. non-financial firms during the 1986 to
2011 period from the LPC Dealscan database. We obtain all spreads and fees as well as other
relevant information including maturity, loan size, facility type, collateral and covenants and
require that all key loan contract terms are available.3 Using the Dealscan-Compustat Linking
Database (Chava and Roberts, 2008) we collect financial statement information from the merged
CRSP/Compustat database for each borrower. We also collect data on credit line usage over the
three years after origination from CapitalIQ, which has been available since 2000. Our final
sample spans the 1986 to 2011 period and includes 32,343 loans from Dealscan to 5,481 publicly
listed borrowers. 21,981 (68%) of these loans are credit lines and 10,362 (32%) are term loans
(Table I).
[Table I]
We construct a second sample, hand-collecting fee information from a random sample of
1,000 syndicated loan facilities directly from electronic SEC filings and compare the fee
information from these filings to Dealscan. If fee information is available in the SEC filings,
Dealscan correctly reports these fees in more than 95% of the cases.
With respect to upfront fee, however, contracts filed with the SEC frequently refer to a
non-public fee letter without disclosing the upfront fee directly. Dealscan provides more
information related to upfront fees than is actually available in the SEC filings. The SEC filings
specify an upfront fee in 10% of the cases, in a further 77% of the cases the contracts clearly
indicate that an upfront fee exists but the magnitude is not available via public sources, in 20% of
3 In particular, these contract terms include maturity, loan amount, AISD, and, for lines of credit, AISU.

7
the cases there is no clear trace of an upfront fee in the SEC filings.4 Dealscan provides upfront
fees in even 25% of the cases. That is, upfront fees are to some extent gathered from non-public
sources (other than SEC filings) and Dealscan systematically produces more upfront fee
information than the SEC filings. This suggests that, while borrower and loan characteristics of
our samples with and without upfront fee information are broadly comparable, the omission of
upfront fee information in Dealscan might not be idiosnycratic.5 A detailed analysis and
comparison of the SEC and Dealscan samples are available in our Online Appendix C.
B. Loan types and options embedded in loan contracts
The most important loan types are credit lines and term loans.6 The empirical loan pricing
literature usually lumps both loan types together even though these contracts are inherently
different. While credit lines are commitments of lenders to provide a loan at a contractually
agreed spread in the future, term loans, in contrast, are fully funded at loan origination.
Consequently, credit lines and term loans are also different with respect to options embedded in
these loan contracts and – as will be discussed in the next subsection – in their pricing structure.
We identify three main options included in loan contracts:
4 As an example, the loan contract of Level 3 Communications dated as of Sep, 30th, 1999 specifies: "Level 3 and the Borrowers agree to pay to the Administrative Agent, for its own account, fees payable in the amounts and at the times separately agreed upon with the Administrative Agent." Indeed, for this specific loan contract, Dealscan reports an upfront fee of 87.5 bps, suggesting that Dealscan has obtained private information from the participating banks or the borrower. 5 As an example, while our sample firms are publicly listed, private firms are usually not required to file with the SEC and Dealscan collects contract term information from private loan desks. 6 Dealscan reports a variety of other loan types, such as letters of credit, leases or guarantees. These other loan types make up only 4% of the Dealscan observations and we thus exclude them our analysis
8
Option to draw on a line of credit: Each line of credit provides the borrower with an
option to draw at a pre-specified spread. Borrowers should be more likely to draw down their
lines of credit when spot market spreads are high, that is, when the option is "in-the-money".
Option to terminate a loan contract: Most corporate loan contracts allow the borrower to
terminate the loan contract before maturity. The option to terminate is particularly relevant for
term loans.7 Firms should be more likely to terminate a term loan contract when spot market
spreads are low. Terminations or renegotiations of loan contracts before the loan matures are
widespread. For example, Roberts and Sufi (2009) report an unconditional likelihood of
renegotiation of 9.1% per quarter, of which 4.2% are early terminations.
Option to request a competitive bid ("Competitive bid option (CBO)"): Some corporate
loan contracts provide the borrower with the option to request a "competitive bid". A CBO
allows the borrower to solicit the best bid from its syndicated group for a given borrowing
(Taylor and Sansone (2007)). Therefore, the loan shares by the syndicate participants are backup
shares in case no sufficient bids are obtained in any of these auctions.8
C. Fee types and definitions
Fess are an important component of syndicated loan contracts. As noted earlier, about
80% of the syndicated loans issued over the 1986-2012 period contain at least one fee type in the
7 For credit lines, borrowers do not have to terminate the loan contract to avoid having to pay the full spread. Instead, borrowers can simply choose not to draw down the credit line. 8 If, for example, two lenders each have a USD 50mn share of a USD 100mn revolver, each lender is still allowed to bid for a higher amount when the borrower requests liquidity from a credit line. In an extreme case, lender A might provide the whole USD 100mn loan if lender A bids for the total amount and lender B bids nothing.
9
Dealscan database.9 We identify 5 different fee types that occur in more than 5% of all loan
contracts.10
[Figure 1]
In particular, approximately 50% of the loans contain a commitment fee, almost 25% a
facility fee and some syndicated loans even specify a “collateral monitoring fee”. The average
fee ranges from 12 bps (utilization fee) to 160 bps (cancellation fee) and is large compared to the
average interest spread of 190 bps.
The fee structure of credit lines is more complex compared to term loans. For example,
four main fee types are present in more than 10% of credit line contracts (upfront fee, facility
fee, commitment fee, utilization fee) while only two fee types are used in more than 10% of term
loan contracts (upfront fee, cancellation fee). As term loans are fully funded at origination, only a
very small number of term loans specify a commitment fee.
In the following we briefly describe the major fee and spread components. We focus on
those fees that are present in at least 10% of credit lines or term loans in our sample.11
(a) Spread over LIBOR: The spread over LIBOR is the interest margin above the interbank
loan rate charged to borrowers on the drawn portion of the loan.
(b) Upfront Fee: The one-time fee paid by the borrower to lender(s) at the loan closing
date.12
9 Online Appendix C contains detailed instructions how to extract the fee information from Dealscan. 10 Dealscan also reports letter of credit fees. Letter of credits are separate products that are jointly offered with lines of credit, with the letter of credit fee being conceptually similar to a loan spread. 11 The following definitions mainly follow Taylor and Sansone (2007). 12 For term loans, the upfront fee is conceptually the same as the original-issue-discount (OID), that is, the borrower receives the notional reduced by the upfront fee/OID. Credit lines do not have an OID as they are not fully funded at origination.

10
(c) Commitment Fee: The fee is paid by borrowers on unused loan commitments.
Commitment fees are most frequently used in credit lines. For term loans, such fees are
only used where the exact date of drawing down is not predetermined.
(d) Facility Fee:13 A facility fee is the annual fee paid on the entire committed amount,
regardless of usage. Commitment fees and facility fees are usually mutually exclusive. In
particular, credit lines contain one of these types of fees, but not both.
(e) Utilization fee: A utilization fee is payable if utilization exceeds a certain percentage, for
example 30% or 50%, of a credit line. On each day that this percentage is exceeded, the
fee is payable on all utilizations of the credit line and not merely the portion that exceeds
the utilization threshold.
(f) Cancellation fee: A cancellation fee is payable if the borrower cancels the credit
agreement before maturity. It is usually found in institutional term loan tranches and
decreases from the origination date to the maturity date (e.g. 3% in the first year, 2% in
the second year, 1% thereafter).
Table II reports the occurrence of the major fee types segregated by credit ratings for credit lines
and term loans.
[Table II]
Commitment fees and facility fees are generally substitutes and usually mutually
exclusive of each other. 68.0% of the facilities on average include a facility fee (but not a
commitment fee) while 28.9% include a commitment fee (but not a facility fee), with 3.0% of the
facilities containing both fee types. The facility fee is used more frequently by investment grade
13 The facility fee is labeled “annual fee” in Dealscan. We use the wording “facility fee” as this is usually used in the credit agreements.

11
borrowers (76.3%) while the commitment fee is used more frequently for non-investment grade
borrowers (88.7%). Interestingly, the usage of facility fees drops from 54.2% to 28.0% for BB+
versus BBB- rated borrowers, that is, at the investment grade / non-investment grade boundary.
Utilization fees are more likely to be included in loans to borrowers of medium credit
quality. Credit lines of BBB+ rated borrowers contain a utilization fee in almost one out of two
contracts. On the other hand, less than 3% of the loans to borrowers rated worse than BB contain
a utilization fee.
Cancellation fees are more common in term loans of low quality borrowers. Only 5% of
loans extended to investment-grade rated borrowers include a cancellation fee. At the same time,
however, the cancellation fee is included in 10% (23%) of the loans extended to BB (B) rated
borrowers, mainly in institutional tranches.
Overall, lenders do not use a single measure such as an interest rate spread to ensure an
appropriate expected return. On the contrary, lenders use combinations of fees and spread and
our stylized facts suggest that fees are not just idiosyncratic, but follow clear patterns as to the
occurrence of certain fee types, for example as a function of borrower risk. Consequently, any
calculation of an expected return on a loan has to take the fee structure into account, which varies
with loan type and comprises some fees that are paid upfront and others that are a function of
borrower behavior (such as drawdowns or cancellations). Importantly, this is very different than
an expected return calculated based on an interest rate spread.
The following section discusses theories and provides empirical evidence of why fees are
in loan contracts, why they come in various forms, and how fees might vary with different
determinants.
12
II. Economic framework, hypotheses, and empirical evidence
In this section, we provide an economic framework for the role of fees in the pricing
structure of corporate loans, derive hypotheses from the economic framework, and provide
empirical evidence. We mainly focus on credit lines (i.e., the majority of the sample) but also
discuss some applications for term loans at the end of the section. Our main claim can be
summarized as follows: Corporate loans contain various options for borrowers and lenders and
the pricing (fee) structure reflects the uncertainty associated with these options. Importantly, fees
are a compensation for options in loan contracts; fees are used to screen borrowers as to their
likelihood of exercising certain options, and fees are used to alter ex-post incentives to exercise
these options.
We use a common format to investigate the use of fees in loan contracts: First, we
describe the economic rationale and theory underlying the use of fees in loan contracts. Second,
we summarize this in a testable hypothesis. Third, we discuss the related empirical evidence.
Section II.A. examines the role of fees as a compensation for options embedded in credit lines,
Section II.B. provides evidence that fees are used for ex-ante screening. Section II.C. provides a
brief discussion of ideas for further research.
A. Fees as compensation for options embedded in corporate loan contracts
A.1. Option-view of lines of credit – Draw-down behavior
Description: The theoretical literature views loan commitments as insurance against the
deterioration of a firm’s creditworthiness as it provides the option for the borrower to draw down
the credit line (Thakor et al., 1981; Thakor, 1982; Ho and Saunders, 1983; Boot et al., 1987;
Thakor and Udell, 1987; and Chateau, 1990, Shockley and Thakor, 1997). A borrower will only
13
exercise this option when it is more costly to borrow in the spot market at current market rates.14
We thus directly get the following hypothesis as to the borrowers' draw-down behavior:
Hypothesis 1: Borrowers are more likely to draw down a line of credit if thei
creditworthiness has deteriorated since origination than if their creditworthiness has improved.
Empirical evidence: While we cannot directly observe spot market spreads in the loan
market, we can observe how the borrower's stock price and profitability have evolved after loan
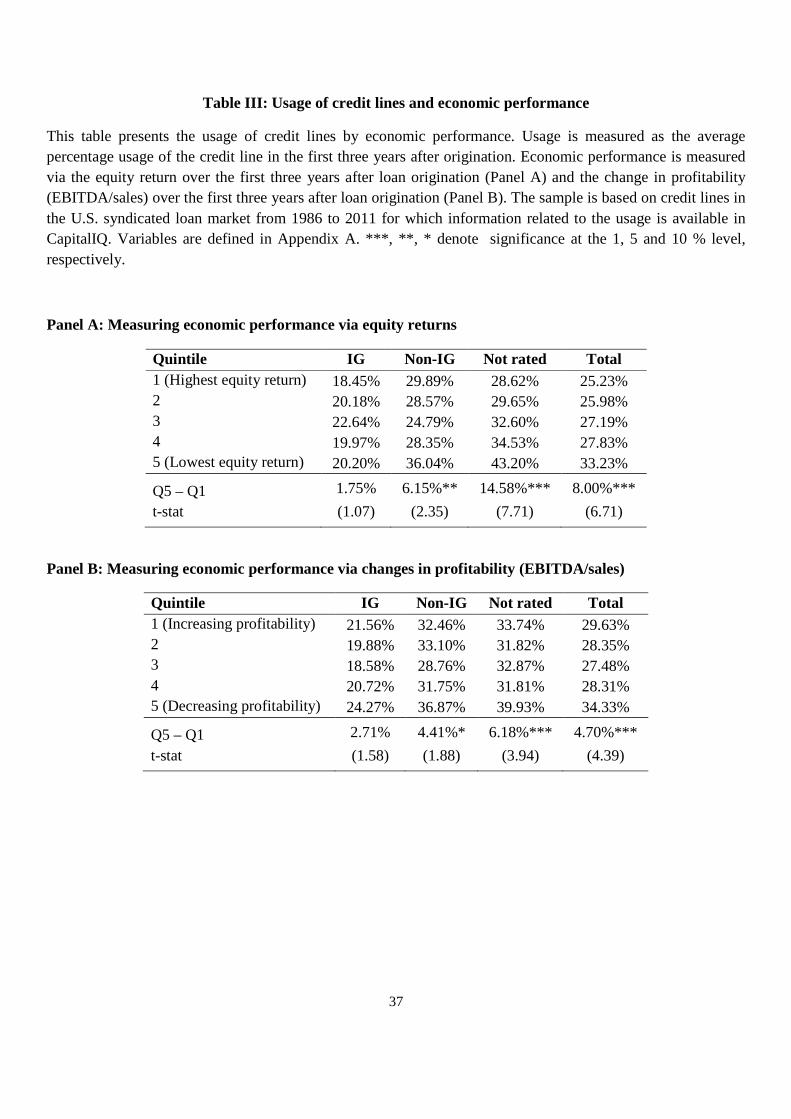
origination. Table III provides statistics on the usage of lines of credit based the development of
the stock return (Panel A) and the change in profitability (EBITDA/sales) over the first three
years after loan origination (Panel B). We thereby split the sample into sub-samples of
investment-grade firms (IG), non-investment-grade firms (non-IG) and unrated firms. For each
of these sub-samples, we sort the observations into quintiles based on stock returns (Panel A) and
profitability (Panel B). Mean usage rates are lowest for investment grade borrowers, followed by
non-investment grade and unrated borrowers. Within each sub-sample, we document that credit
lines are more likely to be used if the borrower's economic performance deteriorates – in
particular for non-investment grade and non-rated firms.15
We do not report mean difference tests for brevity, but the average drawdowns between
the rating categories (IG vs. non-IG, IG vs. unrated and non-IG vs. unrated) are statistically
14 This option-view of lines of credit is, of course, a simplified description of loan contracting. First, borrowers might exercise the option for other reasons – for example if they are credit rationed in the spot market (Thakor, 2005). Second, syndicated loans include provisions that either restrict credit line usage if the credit line is deep-in-the-money (via covenants or using the MAC clause, see Section II.C for a discussion) or make the draw-down more expensive for the borrower (via performance pricing, see Hypothesis 3 for a discussion). 15 For profitability, we observe a slightly U-shaped pattern, with borrowers with a large decline (5th quintile) and a large increase in profitability (1st quintile) having higer usage rates than borrowers with a medium change in profitability. However, the difference between mean usage rates of borrowers in the 1st and 3rd quintile is only significant at the 10% level, while the difference between the 3rd and the 5th quintile is highly statistically significant at the 1% level.

14
significant. This is consistent with what we would expect. Unrated firms are more bank-
dependent and have access to fewer outside funding options. We expect unrated firms to use
credit lines more extensively, ceteris paribus, compared to rated firms. A similar argument
applies to the difference in drawdowns of lower versus higher rated firms. Lower (i.e., non-IG)
rated firms might have more problems raising external capital relative to better rated firms
suggesting higher usage rates. In multivariate regressions, we also find that investment grade
borrowers are more likely to use a facility fee while non-investment grade borrowers are more
likely to use a commitment fee.16
Appendix Table 1 extends the analysis to a multivariate setting. In particular, we control
for rating fixed effects on the rating notch level, loan characteristics (logarithm of the facility
amount, logarithm of the maturity, secured-dummy, sole-lender-dummy, syndicate size, and lead
size), borrower characteristics (logarithm of total assets, logarithm of coverage ratio, leverage,
profitability, asset tangibility, current ratio, and the market-to-book ratio), and year, loan
purpose, loan type and one-digit SIC code fixed effects.. These control variables are described in
more detail in Appendix A and are used throughout this paper in all multivariate settings. The
multivariate analysis confirms the univariate results. Thus, consistent with the option-view, lines
of credit are more likely to be used if a borrower's fundamental credit quality deteriorates.
[Table III]
16There is also anecdotal evidence that IG rated firms, that is, those firms with access to short-term commercial paper markets, usually use credit lines not as alternative funding source but rather as “backup” for commercial paper programs. Commercial paper is short-term (1-270 days) and usually uncollateralized, thus short-term investors are more willing to provide funding as they can be repaid by firms drawing down their credit lines if necessary. In other words, the option to draw facilitates funding in commercial paper markets.
15
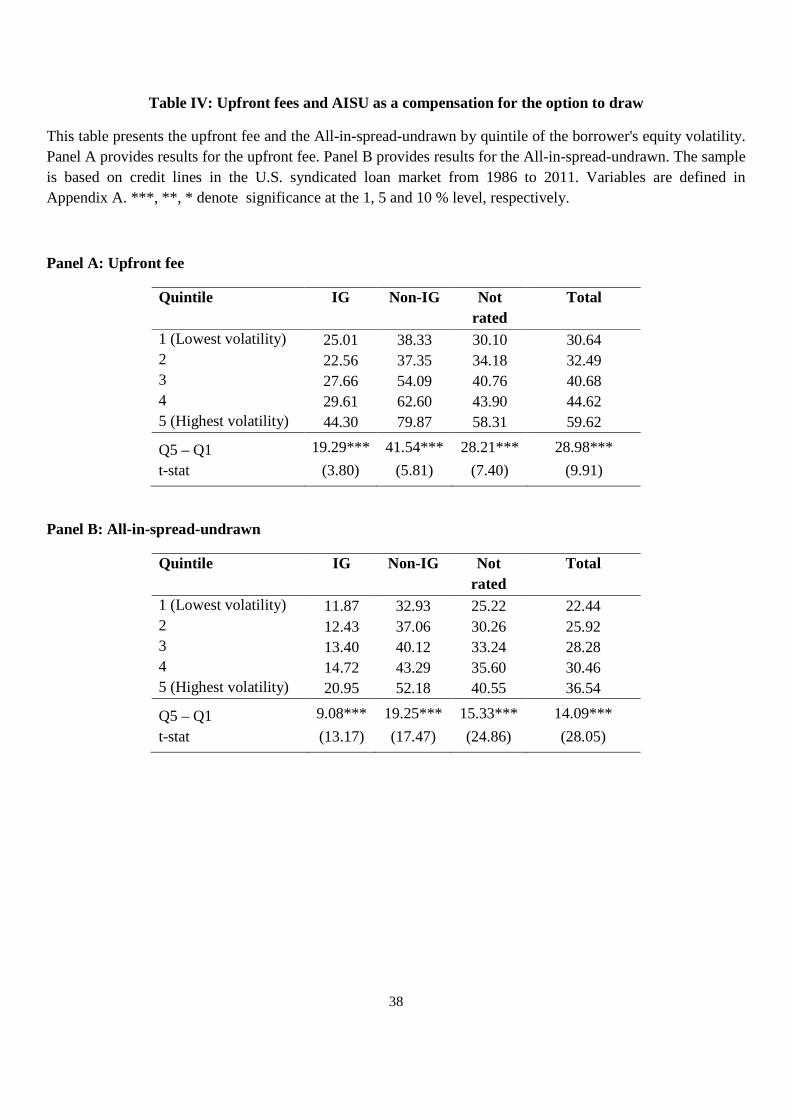
A.2. Option-view of lines of credit – Pricing of the draw-down option
Description: The option-view of lines of credit implies that, when a borrower draws from
the credit line, there is a wealth transfer from lenders to borrowers. In other words, borrowing
under loan commitments is a negative NPV loan for banks and they will demand compensation
ex-ante for the expected loss under the commitment. Upfront fees and unused fees (AISU) are
part of the pricing structure to compensate banks for writing this option.17 Ceteris paribus, an
option is more likely to be in the money if the volatility of the underlying (i.e., the volatility of
the borrower's creditworthiness) is high (Black and Scholes (1973)). Thus, upfront fees and
unused fees should be an increasing function of the borrower's creditworthiness volatility:
Hypothesis 2: Upfront fees and the All-in-spread-undrawn (commitment and facility fees) are
increasing functions of the borrowers’ creditworthiness volatility.
Empirical evidence: We use the realized volatility of the borrower’s equity return over
the year prior to the loan origination date as a proxy for the volatility of the borrower's loan spot
market spread. For each of the subsamples of investment-grade, non-investment grade and
unrated borrowers, we group the facilities into quintiles based on the firm's equity volatility and
report the results in Table IV. We analyze both upfront fees (Panel A) and the AISU (Panel B)
across these quintiles and split the sample into sub-samples of investment-grade (IG), non-
investment-grade (non-IG) and unrated firms.
[Table IV]
17 We do not discuss the rationale for paying for the draw-down option via upfront or unused fees here. Please note that outside the loan market, option prices are sometimes paid via upfront payments (e.g. call options on stocks) while others are paid with a mix of upfront payments and annual payments (e.g. credit default swaps). We discuss possible reasons for the choice of upfront versus unused fees in section II.C.
16
For example, upfront fees increase from 25bps (lowest volatility) to 44bps (highest
volatility) for investment-grade borrowers and the differences across volatility quintiles are large
and statistically significant. This pattern extends to non-IG and unrated firms. Interestingly, we
observe the steepest increase in upfront fees for non-IG borrowers. We observe a similar pattern
for the AISU, that is, firms with higher equity volatility have a significantly larger AISU.
We perform various robustness tests that we report in Appendix Table 2. First, we report
multivariate results controlling for loan and borrower characteristics as well as as well as rating
notch, year, loan purpose, loan type and one-digit SIC code fixed effects. (Panel I). Second, we
use the volatility of the borrower's profitability (EBITDA/Sales) in the five years prior to
origination as an alternative proxy for the volatility of the unobservable loan spot market spread
of the borrower (see Panel II). Third, we look at pairs of term loans and lines of credit that fulfill
the following criteria: i) the term loan and the line of credit are originated by the same firm on
the same day ii) the AISD specified in the line of credit is similar (+/- 15%) to the spread
specified in the term loan contract (see column (3) and (6) in all Panels of Appendix Table 2).
Basically, this procedure only looks at at-the-money options and thus ensures that strike prices
are aligned with the firm's current creditworthiness. In all three robustness tests, the upfront fee
and AISU are an increasing function of the firm's creditworthiness volatility.18
Taken together, our results suggest that a higher volatility of stock returns and
profitability measures are associated with higher upfront fees and a higher AISU, consistent with
18 Our model specifications also control for the syndicate structure such as the number of lenders as well as number of lead arrangers, as supply effects could influence the pricing and fee structure. While the number of lenders does not enter significantly into the regression, we find that a larger number of lead arrangers increases upfront fees significantly. In other tests, we include lender fixed effects to control for the possibility that there are (time-invariant) differences between lenders in charging fees. Overall, these tests do not change the results presented in this paper. Results using lender fixed effects are reported in Online Appendix A.
17
the hypothesis that lenders demand higher compensation if borrowers are more likely to draw
down their credit lines.
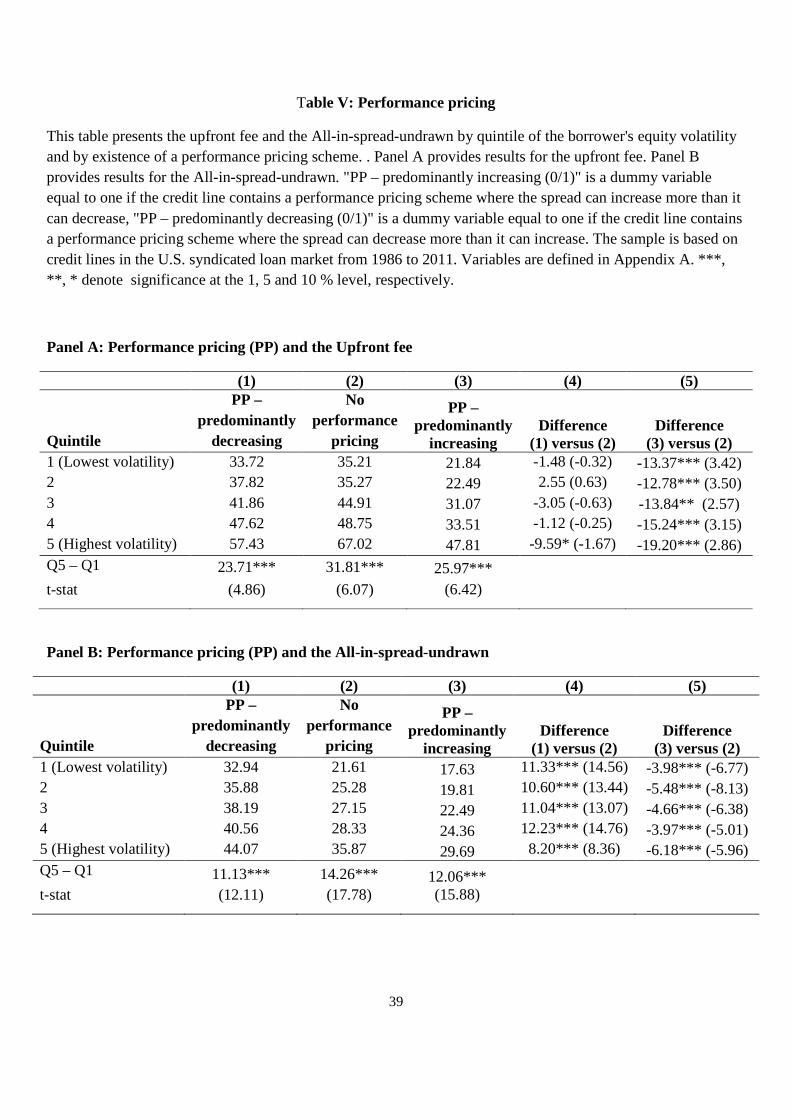
A.3. Option-view of lines of credit – The role of performance pricing
Description: A large percentage of loans includes performance-pricing provisions
(Asquith et al. (2005), Manso et al. (2010), Begley (2013), Adam et al. (2014)). These loans
include performance pricing (PP) grids that are state contingent mappings from a borrower's
economic condition (measured via ratings or financial ratios) to loan spreads. This feature has
important implications for the options embedded in credit lines and therefore for fees: The option
to draw down a credit line becomes less valuable if the spread increases as the borrower’s
economic condition deteriorates ("spread-increasing performance pricing"). On the contrary, the
option is more valuable if the spread decreases if the borrower's economic condition improves
("spread-decreasing performance pricing").19 If the AISD of a credit line fully adjusts to the level
of the current market interest rate (and thus reflects the riskiness of the borrower), then the
option value is zero and we would not expect to see any compensation in terms of fees.20 We
summarize this in the following hypothesis:
Hypothesis 3: Upfront fees and the All-in-spread-undrawn (commitment and facility fees) are
lower for lines of credit that include a spread-increasing performance pricing provision and
higher for lines of credit with a spread-decreasing performance pricing schedule.
19 This only holds if the spread can decrease to levels below the spot market spread. If, for example, the credit line spread decreases from 100 bps to 50 bps after a downgrade and the spot market spread only decreases from 100 bps to 70 bps, then this decreasing performance pricing scheme increases the option value for the borrower. 20 Consistent with this hypothesis, Ivanov et al. (2014) find that market-based pricing – that is, tying loan interest rate spreads to credit default swap spreads – significantly reduces fees for lines of credit. While Ivanov et al. (2014) attribute the lower fees to a reduction in monitoring costs, their findings can also be explained with a simple option-view of lines of credit.
18
Empirical evidence: We document that 52% of all credit lines contain a PP schedule. PP
can adjust the spread in both ways: It can increase the spread if the economic condition
deteriorates (increasing PP) or increase the spread if the economic condition improves
(decreasing PP). For each credit line, we determine the current spread at origination
(Spreadcurrent), as well as the maximum spread (Spreadmax) and the minimum spread (Spreadmin)
based on the PP grid and group credit lines into three categories: If Spreadmin = Spreadmax, we
assign the line of credit to the category "No performance pricing" (10,555 of 21,981 observations
= 48%). If Spreadmax - Spreadcurrent ≥ Spreadcurrent – Spreadmin, that is, the spread can increase
more than it can decrease, the credit line is "PP–predominantly increasing" (6,038 of 21,981
observations = 27%). Finally, if Spreadmax - Spreadcurrent < Spreadcurrent – Spreadmin, that is, the
spread can decrease more than it can increase, we assign the line of credit to the category "PP–
predominantly decreasing" (5,388 of 21,981 observations = 25%).21
We analyze upfront fees and AISU across the volatility quintiles for all three cases (no
performance pricing, PP – predominantly increasing, PP – predominantly decreasing). The
results are reported in Table V. We find that, on average, mean upfront fees and AISU are
significantly lower when credit lines contain an increasing PP schedule, consistent with the
interpretation that PP lowers the option value to draw from the credit line. The differences are
economically and statistically significant: Increasing PP schemes have 13-19 bps lower upfront
fees and 4-6 bps lower unused fees (column (5) in Table V). Credit lines with decreasing PP
schemes have higher unused fees – consistent with an increase in the option value – but upfront
21 For 906 out of 21,981 observations, the performance pricing is "symmetric", that is, spreads can increase exactly as much as they can decrease (Spreadmax - Spreadcurrent ≥ Spreadcurrent – Spreadmin). Our results remain very similar if we would either drop these observations or assign these lines of credit to the class "PP – predominantly decreasing".
19
fees are not significantly different compared to the "no performance pricing" case (column (4) in
Table V).
[Table V]
Again, we perform various robustness tests that we report in Appendix Table 3. In
particular, we report multivariate results controlling for loan and borrower characteristics as well
as rating notch, year, loan purpose, loan type and one-digit SIC code fixed effects. We also
develop a continuous performance pricing measure, defined as (Spreadmax – Spreadcurrent) –
(Spreadcurrent – Spreadmin), where Spreadmax (Spreadmin) is the maximum (minimum) spread under
the PP schedule and Spreadcurrent is the spread the borrower has to pay for draw-downs based on
his rating / financial characteristics at origination. This continuous measure is high and positive
if the spread can increase (but not decrease) significantly under the PP schedule. It is low and
negative if the PP schedule allows for a significant decrease (but not increase) of loan spreads.
Thus, the results from the univariate analysis are confirmed in both cases.22
A.4. Option-view of lines of credit – The competitive bid option (CBO)
Description: As our descriptive evidence in Table II shows, facility fees and commitment
fees are usually mutually exclusive. Moreover, high quality borrowers (those with an IG rating)
are more likely to have a facility fee while low quality borrowers are more likely to have a
commitment fee. There is no theoretical guidance as to why contracts should contain either of
these two recurring fee types. Note that commitment fees are only paid on the undrawn portion
of the credit line while facility fees are always paid on the entire committed amount. In principle,
22 Utilization fees – that apply if usage exceeds a certain threshold – are conceptually similar to performance pricing schemes. Since utilization is negatively correlated with a borrower's economic performance (see Hypothesis 1), utilization fees are more likely to apply when a borrower has been downgraded and/or fundamentals have deteriorated. In unreported results, we show that contracts with utilization fees have lower upfront fees and lower unused fees (AISU), which is consistent with the results we obtain for performance pricing schemes.
20
however, a contract with a spread and a commitment fee can generate the same state-contingent
payments as a contract with a spread and a facility fee.23 This sub-section provides a first step in
explaining this observed empirical regularity.
An important part of the explanation is the “Competitive Bid Option” (CBO). The CBO
provides borrowers the option to solicit bids from syndicate lenders that specify the spreads
based on which they are willing to lend a partial or even the full committed amount under the
credit line. This can lead to a situation in which a line of credit is fully utilized, but some lenders
do not provide any funds (because other lenders provide lower bids). Facilities with a CBO thus
usually contain a facility fee to ensure that the lenders that do not lend under the CBO are still
paid for their commitment. We thus expect to see a higher percentage of loans with CBO to have
a facility fee and a higher percentage of loans without CBO to have a commitment fee.
Hypothesis 4: Lines of credit with a competitive bid option (CBO) are more likely to have
a facility fee and less likely to have a commitment fee.
Empirical evidence: We test this hypothesis and report the results in Table VI.
[Table VI]
Panel A (Panel B) of Table VI shows the percentage of loans with a facility fee (commitment
fee) for loans with and without CBOs and for sub-samples of IG, non-IG and unrated firms. As
expected, loans with a CBO are significantly more likely to contain a facility fee and less likely
23 A contract with a spread X and a facility fee Y generates the same state-contingent payments as a contract with a spread X+Y and a commitment fee of Y, namely X+Y if the loan is drawn and Y if it is not drawn. With a competitive bid option, this is no longer true: A lender that does not provide funds for a fully drawn credit line still receives a facility fee, but does not receive anything if the contract specifies a commitment fee.
21
to contain a commitment fee. The differences are economically and statistically highly
significant. Our multivariate regressions tests (Appendix Table 4) confirm these results.
While the description and analysis of the CBO is a useful start in explaining the choice
between facility fee and commitment fee, we do have to recognize some caveats: First, the CBO
does not provide a full explanation of the choice of facility versus commitment fee: There are
still contracts with CBO that do contain a commitment fee and there are non-CBO contracts that
contain a facility fee. However, the existence of a CBO is by far the strongest predictor of the
existence of a facility fee, with t-statistics of around 20 in a multivariate set-up (higher than all
other explanatory variables).
Second, we do not try to explain why contracts include a CBO in the first place. The
existence of a CBO is endogenous and it is beyond the scope of our paper to establish a causal
link between the existence of a CBO and facility fees. A CBO with a facility fee seems like a
redundant instrument: Why do borrowers want to include a CBO in a loan contract? It seems to
us, that borrowers are always free to request additional bids in the spot market, regardless of
whether they have a CBO or not. We think that the two points raised above might provide an
interesting avenue for further research, but they are beyond the scope of our paper.
B. Fees as a tool to facilitate ex-ante screening and control ex-post moral hazard
B.1. AISU versus AISD
Description: If borrowers have private information about the likelihood of exercising
options embedded in corporate loan contracts, fees can be used to encourage borrowers to self-
select into different contracts. Ergungor (2001) provides an excellent review of theories that
rationalize the pricing structure of credit lines via asymmetric information or moral hazard
22
arguments. In particular, Thakor and Udell (1987) and Shockley and Thakor (1997) provide a
straightforward prediction that borrowers who expect a lower usage rate will self-select into
contracts paying a low AISU and a high AISD. Thus, we have the following hypothesis:
Hypothesis 5: Borrowers who pay a lower AISU and a higher AISD are less likely to draw down
their credit line.
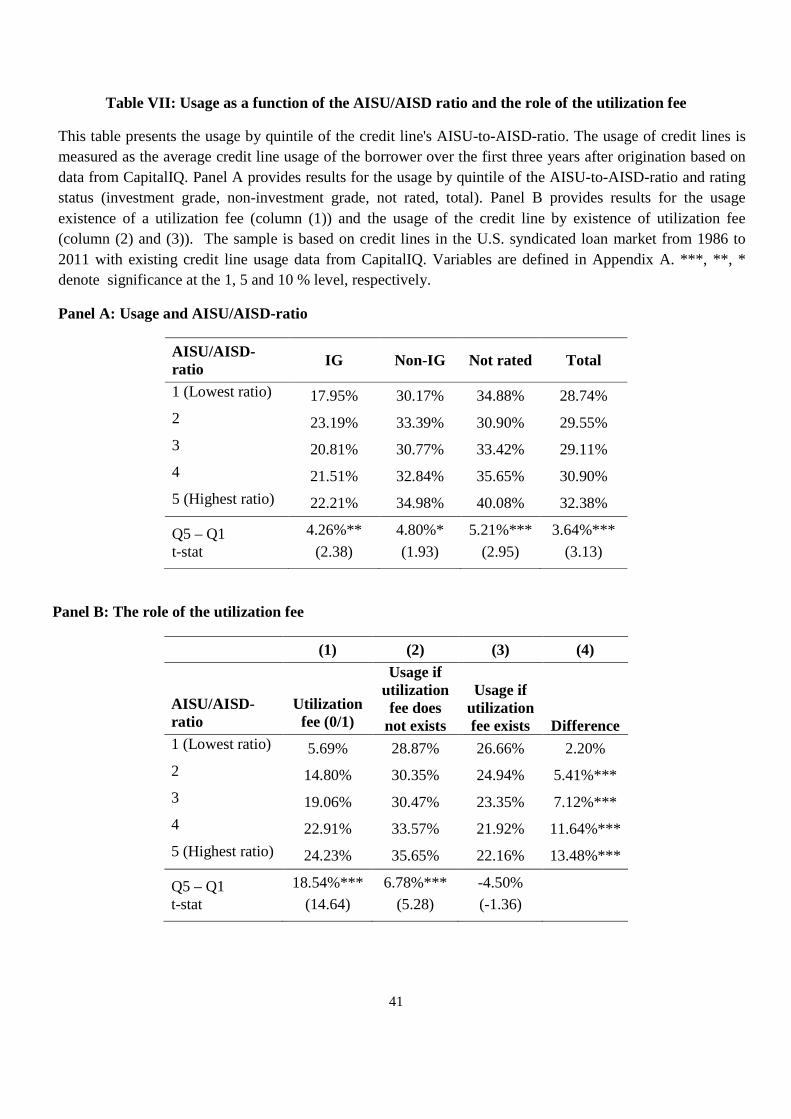
Empirical evidence: Panel A of Table VII provides average usage ratios in the first 3
years after loan aggregation by AISU-to-AISD-ratio quintiles and rating status (investment
grade, non-investment grade, not rated).
[Table VII]
Consistent with the screening hypothesis, we find that borrowers with low AISU/AISD-
ratios have significantly lower ex-post utilization rates. The difference between the lowest and
highest quintile by AISU/AISD-ratio ranges from 4.26% (investment grade) to 5.21% (not
rated). These values are not only statistically significant, but also economically important given
that the unconditional mean usage rates are approximately 20% (investment grade) and 30-35%
(non investment grade and not rated).
A more formal test of this adverse selection story is the positive correlation test
(Finkelstein and Poterba, 2004; Finkelstein and McGarry, 2006). The basic idea behind this test
can be illustrated with two simple equations:
�1� ����
����= + �
�2��� �� = � + �
23
Usage is the average usage of the line of credit, and X is a set of borrower characteristics
observable to the bank at origination. If borrowers have private information about future credit
line usage, borrowers with a high likelihood of usage will select into contracts with a lower
AISU/AISD-ratio. We thus expect the residuals � and � to be positively correlated (bad types
have a high � and high �, good types have a low � and low �). The model can also be tested in a
single-equation reduced form (see Finkelstein and Poterba (2004)):
�3��� �� = � + �����
����+ �
Equations (1) and (2) can be jointly estimated using seemingly unrelated regression
(SUR) techniques. If control variables X are omitted, SUR reduces to a simple correlation
between Usage and AISU/AISD. The reduced-form equation (3) can be estimated using standard
OLS regression. We report multivariate results for equation (3) in Panel A of Appendix Table 5.
In addition to the standard loan and borrower characteristics and fixed effects (see Appendix
Table A) we also control for volatility and performance pricing to control for factors we have
already identified as being relevant for the draw-down option in the hypothesis above. Consistent
with our prior results, we find a positive and significant effect of the AISU/AISD-ratio on credit
line usage rates.
B.2. Utilization fee
Description: Utilization fees are another tool to signal expected usage rates. Utilization
fees increase the costs of draw-downs once draw-downs exceed a prespecified threshold (usually
33% or 50%). Thus, borrowers that expect a low probability of large draw-downs can signal this
by choosing a contract that specifies a utilization fee:
24
Hypothesis 6: Borrowers who pay a utilization fee are less likely to draw on their line of credit.
Empirical evidence: Panel B of Table VII provides univariate tests for this hypothesis.
Column (1) provides the fraction of loan contracts that contain a utilization fee. While only 6%
of all loans in the lowest AISU/AISD-quintile include utilization fees, about 24% of all loans in
the highest AISU/AISD quintile include utilization fees. These results suggest that the utilization
fee is a partial substitute for a low AISU/AISD-ratio. Column (2) and (3) provide average usage
ratios split by contracts that either contain or do not contain a utilization fee. We observe two
main results: First, we find that average usage ratios are significantly lower for loans with
utilization fees (see column (4)). In other words, borrowers that anticipate lower usage chose
contracts that include a utilization fee consistent with Thakor and Udell (1987). Utilization fees
are most common for medium quality borrowers (see Table II and the related discussion in
Section I.C.). Given that usage rates increase significantly at the investment-grade/non-
investment-grade boundary, the need to signal future usage might be largest for medium quality
borrowers.24 Second, the AISU/AISD-ratio is correlated with future usage only for contracts
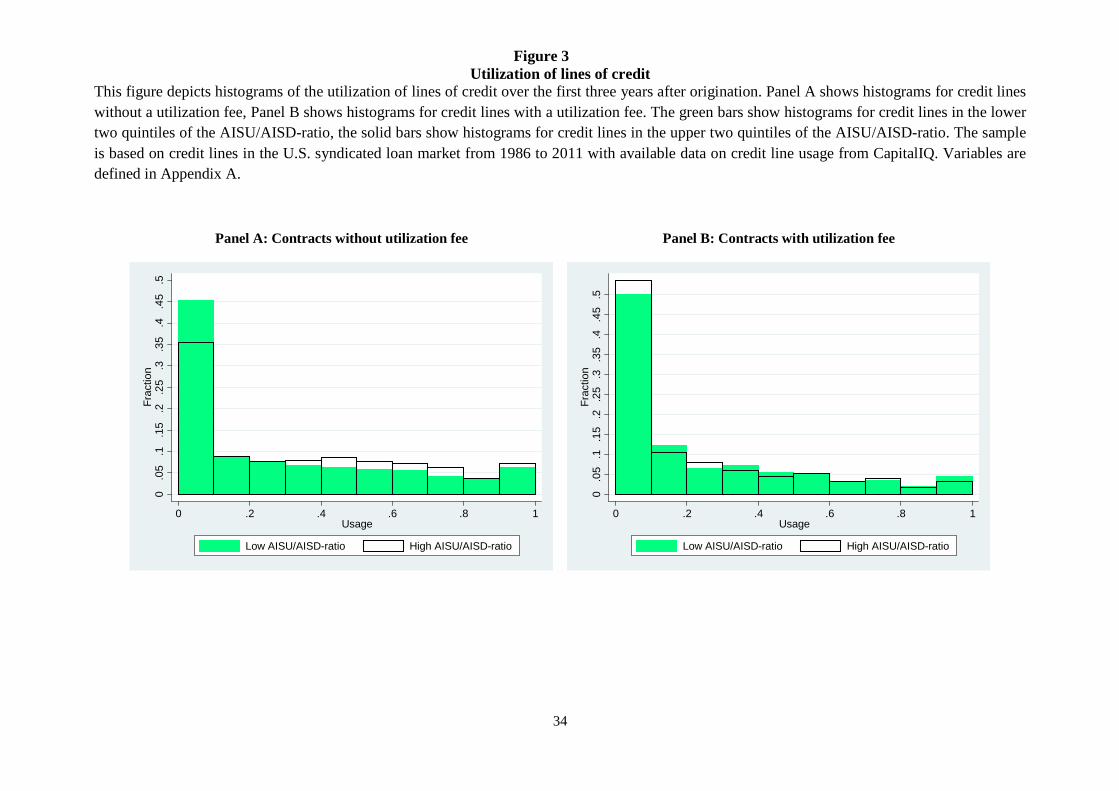
without utilization fees. Figure 3 shows this graphically by providing a histogram by
AISU/AISD-ratio and existence of a utilization fee. We observe that credit lines with a high
AISU/AISD-ratio are less likely to be left unused, while usage rates of 40% or higher are more
likely for these credit lines. For contracts with a utilization fee, we observe no difference
between high versus low AISU/AISD-ratios. Credit lines with a utilization fee are less likely to
be heavily used.
[Figure 3]
24 The fact that borrowers in the middle of the credit rating spectrum require more intense screening and monitoring is also consistent with Diamond (1991).
25
Again, we test the relationship between future usage and the existence of a utilization fee
more rigorously using the positive-correlation test. Results are reported in Panel B of Appendix
Table 5. Consistent with the univariate results, we find that a higher utilization fee reduces usage
rates and that the AISU/AISD-ratio is positively correlated with future usage only for contracts
without utilization fee.25
B.3. Screening or altering of ex-post incentives?
The positive correlation test does not allow to distinguish between the hypotheses of fees
being used as a screening device versus that of fees being used to alter borrowers' incentives ex-
post (Finkelstein and Poterba (2004), Finkelstein and McGarry (2006)). To do so would either
require either randomly assigning contracts ex-ante (to eliminate the screening explanation) or
exogenously altering the pricing structure ex-post (to eliminate the ex-post incentives
explanation). It is not our goal to find the natural experiment or perfect instrument. Rather, we
seek to demonstrate that loan pricing structures are clearly correlated to ex-post usage of lines of
credit. Future research might explore a setting as described above to distinguish between these
explanations.
C. Other options embedded in corporate loan contracts
Until now, we have focused on the main options found in corporate loans – namely the
option to draw down a line of credit and the "special cases" of the option to draw in the presence
of a PP schedule or a competitive bid option. Loan contracts contain a variety of other options.
25 Performance-pricing schemes are conceptually similar to a utilization fee because both vary the payment from the borrower to the lender based on some observable outcome that is correlated with the borrower's creditworthiness. Consistent with this argumentation, we find in unreported results that borrowers who have contracts with a performance pricing scheme are less likely to draw on their lines of credit.
26
Due to lack of space, we cannot provide an exhaustive analysis for all options. However, we will
briefly discuss other examples of options embedded in loan contracts.
First, term loans usually include the options to terminate a loan contract for a given
charge (the cancellation fee). We discuss details about cancellation fees and the option to cancel
a term loan contract in Online Appendix B. An analogy is the choice between mortgage points
and interest rates in mortgage pricing that can be used to encourage self-selection based on the
likelihood of early termination.26 Second, lines for letters of credits include the option to request
a letter of credit. This option is similar to the option to draw under a line of credit, with the main
exception that lenders provide a guarantee – but no liquidity – when a letter of credit is drawn.
Third, some credit lines contain multicurrency options which give the borrower the right to
choose the borrowing currency. Some features of syndicated loan contracts also provide options
to lenders: Most contracts include material adverse change clauses (MAC) that give lenders the
right to terminate a loan contract when a material adverse event is realized.27 Furthermore,
covenants can be seen as an option for the lender to terminate or renegotiate a loan contract once
a covenant is breached (Roberts and Sufi, 2009).
A fully comprehensive list of options embedded in corporate loan contracts is beyond the
scope of this paper. Furthermore, we do not try to offer a complete explanation of the raison
d'être or even a full assessment of the value of all these options. Rather, our aim is to point out to
the types of options in corporate loan contracts and the role that fees play as a compensation and
screening device for these options.
26 Mortgage points are a form of upfront fee or original-issue discount (OID). By paying upfront fees at the beginning of a mortgage contract, borrowers can reduce the interest rate on the loan. Brueckner (1994) and LeRoy (1996) show that mortgage points can be used to screen borrowers on their likelihood of early termination. 27 Material adverse events are usually only vaguely defined and thus allows the bank not to keep its illusory promise, see Boot, Greenbaum, and Thakor (1993) and Thakor (2005) for reputation-based models of MAC clauses.
27
III. Total Cost of Borrowing
In the previous sections, we have shown that the pricing structure of loan commitments is
complex and includes a variety of fees. We have tested theories as to why these fees exist and
found that they are used to (1) price options embedded in loan contracts as well as (2) screen
borrowers about the likelihood of exercising these option. We now propose a new total-cost-of-
borrowing measure (TCB) that reflects all of these fees.
Once the menu of spread and fees has been negotiated, we can use this pricing structure
to estimate the likelihood of exercising the embedded options and thus can calculate the TCB
measure: 28
TCB = Upfront Fee / Expected Loan Maturity in Years (1)
+ (1-PDD) x (Facility Fee + Commitment Fee) (2)
+ PDD x (Facility Fee + Spread) (3)
+ PDD x Prob(Utilization>UtilizationThreshhold | Usage > 0) x Utilization Fee (4)
+ Prob(Cancellation) x Cancellation Fee (5)
where the expected loan maturity in years is measured as the difference between facility
start and end date. PDD is the likelihood that the credit line is drawn down;
Prob(Utilization>UtilizationThreshhold | Usage > 0) is the probability that the utilization of the
credit line is higher than the thresholds specified in the loan contract conditional on observing
utilization. Prob(Cancellation) is the probability that the loan is going to be canceled.
The TCB measure thus reflects the option characteristics of bank loans, differentiates
between credit lines and term loans (PDD is 1 in case of term loans) and incorporates the various
28 We provide an in-depth discussion as to how to calculate TCB in Online Appendix D using Dealscan data; we also provide the TCB measure and the program/code to compute the measure on our website.
28
fees paid to lenders. The AISD, on the other hand, is defined as “Facility Fee + Spread” thereby
ignoring important loan pricing components that we described above. We thus propose the TCB
as an alternative to the AISD in future research exploring the cost of loans.
IV. Conclusion
This study shows that fees are an important part of corporate loan contracts. We test the
predictions of existing theories about the main purposes of fees and show that fees serve two
main purposes: First, fees are compensation for options embedded in corporate loan contracts.
Thus, high-creditworthiness-volatility borrowers need to pay higher upfront and unused fees to
compensate lenders for providing a draw-down option. However, the draw-down option is worth
less if the spread (partially) adjusts to the borrower's spot market spread, and thus performance
sensitive loans have lower fees. Second, fees can be used to screen borrowers as to the likelihood
of exercising any of these options. For example, we show that borrowers selecting into contracts
with low unused fees (AISU) and high spreads are less likely to draw down their credit line than
borrowers selecting into contracts with high unused fees and low spreads. Overall, our results
suggest that analyzing the fees in the syndicated loan market can provide important insights into
lender-borrower pricing behavior.
Looking forward, the results presented in this paper have important implications for the
literature on loan contracting and loan pricing. First, researchers should be careful in pooling
credit lines and term loans into a single syndicated loan sample. Option-like features differ
widely between credit lines and term loans and thus, pricing and fee structures are different as
well. Second, the analysis of a single measure, such as the AISD, is not sufficient to fully capture

29
the richness of the pricing structure of corporate loans. However, once spreads and fees are set,
we can use this pricing structure to estimate a total-cost-of-borrowing measure (TCB) that
incorporates spreads and fees based on the likelihood that each of these components will have to
be paid by the borrower.
Our hope is that this study inspires more research exploring the complexity of loan
contracts. We have provided several suggestions throughout the paper that might be helpful in
this regard. We also hope that the TCB, as a more comprehensive measure of the debt cost of
capital (compared with the AISD), is useful to academics in future research.
30
References
Adam, Tim, Valentin Burg, Tobias Scheinert, and Daniel Streitz, 2014, Managerial Optimism
and Debt Contract Design, Working Paper.
Asquith, Paul, Anne Beatty, and Joseph Weber, 2005, Performance pricing in bank debt
contracts, Journal of Accounting and Economics 40, 101-128.
Begley, Taylor A., 2013, Signaling, Financial Constraints, and Performance-Sensitive Debt,
Working Paper.
Black, Fischer, and Myron Scholes, 1973, The pricing of options and corporate liabilities,
Journal of Political Economy 81, 637-654.
Boot, Arnoud W.A., Stuart I. Greenbaum, and Anjan V. Thakor, 1993, Reputation and
Discretion in Financial Contracting, American Economic Review 83, 1165-1183.
Boot, Arnoud W.A., Anjan V. Thakor, and Gregory F. Udell, 1987, Competition, Risk Neutrality
and Loan Commitments, Journal of Banking and Finance 11,449-72.
Brueckner, Jan K., 1994, Borrower Mobility, Self-Selection, and Mortgage Points, Journal of
Financial Intermediation 3, 416-441.
Chateau, John-Peter D., 1990, Valuation of Capped Variable Rate Loan Commitments, Journal
of Banking and Finance 14, 717-728.
Chava, Sudheer, and Michael R. Roberts, 2008, How does financing impact investment? The
role of debt covenants, The Journal of Finance 63, 2085-2121.
Diamond, Douglas W., 1991, Monitoring and Reputation: The Choice between Bank Loans and
Directly Placed Debt, Journal of Political Economy 99, 689-721.
Ergungor, O. Emre, 2001, Theories of Bank Loan Commitments, Economic Review - Federal
Reserve Bank of Cleveland 37, 2-19.
Finkelstein, Amy, and Kathleen McGarry, 2006, Multiple dimensions of private information:
Evidence from the long-term care insurance market, American Economic Review 96, 938-958.
31
Finkelstein, Amy, and James Poterba, 2004, Adverse selection in insurance markets:
Policyholder evidence from the UK annuity market, Journal of Political Economy 112, 183-208.
Ho, Thomas S.Y., and Anthony Saunders, 1983, Fixed-Rate Loan Commitments, Take-Down
Risk, and the Dynamics of Hedging with Futures, Journal of Financial and Quantitative
Analysis 18, 499-516.
Ivanov, Ivan, Joao A.C. Santos, and Thu Vo, 2014, The Transformation of Banking: Tying Loan
Interest Rates to Borrower's CDS Spreads, Working Paper.
LeRoy, Stephen F., 1996, Mortgage Valuation Under Optimal Prepayment, Review of Financial
Studies 9, 817-844.
Manso, Gustavo, Bruno Strulovici, and Alexei Tchistyi, 2010, Performance-sensitive debt,
Review of Financial Studies 23, 1819-1854.
Roberts, Michael R., and Amir Sufi, 2009, Renegotiation of Financial Contracts: Evidence from
Private Credit Agreements, Journal of Financial Economics 93, 159-184.
Shockley, Richard L. and Anjan V. Thakor, 1997, Bank Loan Commitment Contracts: Data,
Theory, and Tests, Journal of Money, Credit and Banking 29, 517-534.
Sufi, Amir, 2009, Bank lines of credit in corporate finance: An empirical analysis, Review of
Financial Studies 22, 1057–1088.
Taylor, Allison and Alicia Sansone, 2007, The Handbook of Loan Syndications and Trading,
McGraw-Hill, New York, NY.
Thakor, Anjan V., Hai Hong, and Stuart I. Greenbaum, 1981, Bank loan commitments and
interest rate volatility, Journal of Banking and Finance 5, 497-510.
Thakor, Anjan V., 1982, Toward a Theory of Bank Loan Commitments, Journal of Banking and
Finance 6, 55-83.
Thakor, Anjan V., and Gregory F. Udell, 1987, An Economic Rationale for the Pricing Structure
of Bank Loan Commitments, Journal of Banking and Finance 11, 271-289.
Thakor, Anjan V., 2005, Do Loan Commitments Cause Overlending?, Journal of Money, Credit,
and Banking 37, 1067-1099.
32
Figure 1 Spread and fee components of U.S. syndicated loans
This figure depicts fee types and the proportion of syndicated loans where the respective fee type is available in Dealscan. The column Percentage of contracts denotes the percentage of contracts where the respective fee is available in Dealscan. The column Mean (in bps) denotes the mean of the respective fee type in basis points as reported by Dealscan. Any fee is the percentage of syndicated loans where any fee is available on Dealscan. The sample is based on credit lines and term loans in the U.S. syndicated loan market from 1986 to 2011. Variables are defined in Appendix A.
33
Figure 2 Spread and fee components of U.S. syndicated loans / Credit lines versus Term loans
This figure depicts fee types and the proportion of syndicated loans where the respective fee type is available in Dealscan. Panel A provides the results for term loans, Panel B provides the results for credit lines. The column Percentage of contracts denotes the percentage of contracts where the respective fee is available in Dealscan. The column Mean (in bps) denotes the unconditional mean of the respective fee type in basis points as reported by Dealscan. Any fee is the percentage of syndicated loans where any fee is available on Dealscan. The sample is based on credit lines and term loans in the U.S. syndicated loan market from 1986 to 2011. Variables are defined in Appendix A.
34
Figure 3 Utilization of lines of credit
This figure depicts histograms of the utilization of lines of credit over the first three years after origination. Panel A shows histograms for credit lines without a utilization fee, Panel B shows histograms for credit lines with a utilization fee. The green bars show histograms for credit lines in the lower two quintiles of the AISU/AISD-ratio, the solid bars show histograms for credit lines in the upper two quintiles of the AISU/AISD-ratio. The sample is based on credit lines in the U.S. syndicated loan market from 1986 to 2011 with available data on credit line usage from CapitalIQ. Variables are defined in Appendix A.
Panel A: Contracts without utilization fee
Panel B: Contracts with utilization fee
0.0
5.1
.15
.2.2
5.3
.35
.4.4
5.5
Fra
ctio
n
0 .2 .4 .6 .8 1Usage
Low AISU/AISD-ratio High AISU/AISD-ratio
0.0
5.1
.15
.2.2
5.3
.35
.4.4
5.5
Fra
ctio
n
0 .2 .4 .6 .8 1Usage
Low AISU/AISD-ratio High AISU/AISD-ratio
35
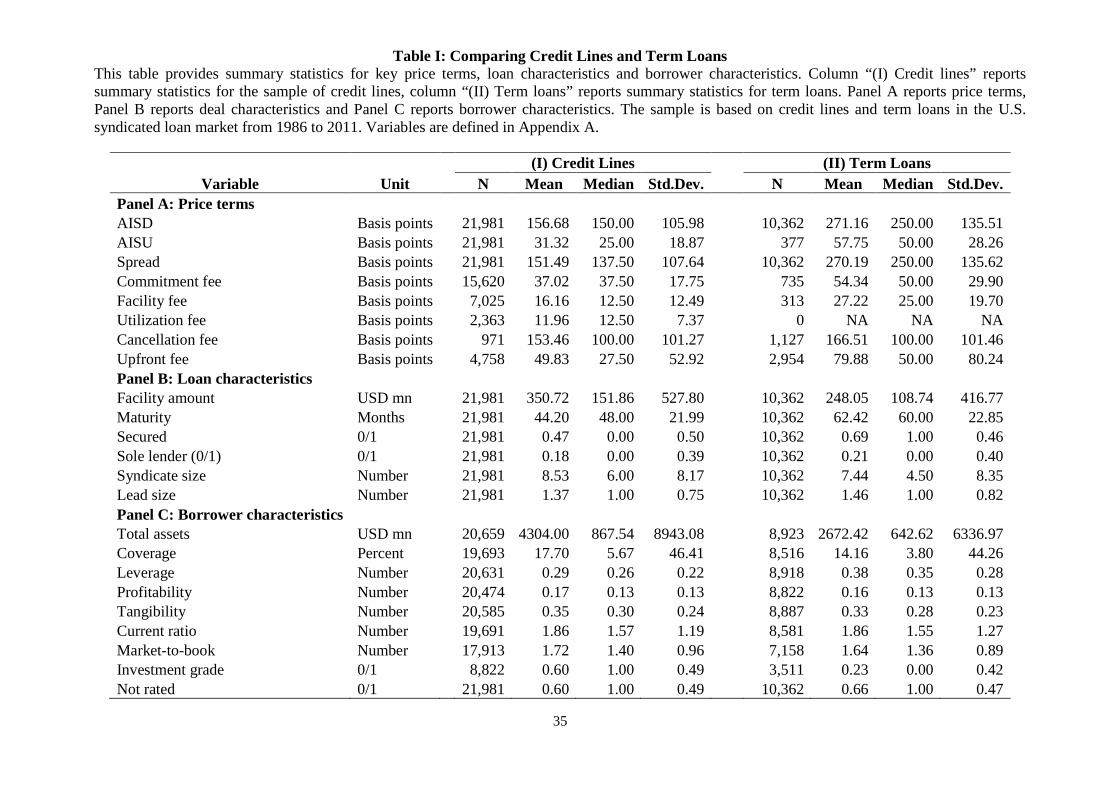
Table I: Comparing Credit Lines and Term Loans This table provides summary statistics for key price terms, loan characteristics and borrower characteristics. Column “(I) Credit lines” reports summary statistics for the sample of credit lines, column “(II) Term loans” reports summary statistics for term loans. Panel A reports price terms, Panel B reports deal characteristics and Panel C reports borrower characteristics. The sample is based on credit lines and term loans in the U.S. syndicated loan market from 1986 to 2011. Variables are defined in Appendix A.
(I) Credit Lines (II) Term Loans Variable Unit N Mean Median Std.Dev. N Mean Median Std.Dev.
Panel A: Price terms AISD Basis points 21,981 156.68 150.00 105.98 10,362 271.16 250.00 135.51 AISU Basis points 21,981 31.32 25.00 18.87 377 57.75 50.00 28.26 Spread Basis points 21,981 151.49 137.50 107.64 10,362 270.19 250.00 135.62 Commitment fee Basis points 15,620 37.02 37.50 17.75 735 54.34 50.00 29.90 Facility fee Basis points 7,025 16.16 12.50 12.49 313 27.22 25.00 19.70 Utilization fee Basis points 2,363 11.96 12.50 7.37 0 NA NA NA Cancellation fee Basis points 971 153.46 100.00 101.27 1,127 166.51 100.00 101.46 Upfront fee Basis points 4,758 49.83 27.50 52.92 2,954 79.88 50.00 80.24 Panel B: Loan characteristics Facility amount USD mn 21,981 350.72 151.86 527.80 10,362 248.05 108.74 416.77 Maturity Months 21,981 44.20 48.00 21.99 10,362 62.42 60.00 22.85 Secured 0/1 21,981 0.47 0.00 0.50 10,362 0.69 1.00 0.46 Sole lender (0/1) 0/1 21,981 0.18 0.00 0.39 10,362 0.21 0.00 0.40 Syndicate size Number 21,981 8.53 6.00 8.17 10,362 7.44 4.50 8.35 Lead size Number 21,981 1.37 1.00 0.75 10,362 1.46 1.00 0.82 Panel C: Borrower characteristics Total assets USD mn 20,659 4304.00 867.54 8943.08 8,923 2672.42 642.62 6336.97 Coverage Percent 19,693 17.70 5.67 46.41 8,516 14.16 3.80 44.26 Leverage Number 20,631 0.29 0.26 0.22 8,918 0.38 0.35 0.28 Profitability Number 20,474 0.17 0.13 0.13 8,822 0.16 0.13 0.13 Tangibility Number 20,585 0.35 0.30 0.24 8,887 0.33 0.28 0.23 Current ratio Number 19,691 1.86 1.57 1.19 8,581 1.86 1.55 1.27 Market-to-book Number 17,913 1.72 1.40 0.96 7,158 1.64 1.36 0.89 Investment grade 0/1 8,822 0.60 1.00 0.49 3,511 0.23 0.00 0.42 Not rated 0/1 21,981 0.60 1.00 0.49 10,362 0.66 1.00 0.47

36
Table II: Existence of fee types in syndicated loan contracts
This table shows the existence of several fee types by S&P rating class. The sample is based on credit lines and term loans in the U.S. syndicated loan market from 1986 to 2011. Variables are defined in Appendix A.
(1) (2) (3) Credit lines Credit lines Term Loans Facility fee versus Commitment fee
Rating Facility Fee
only Commitment
Fee only Both
Fee Types Utilization
Fee Cancellation
Fee AAA/AA 91.63% 8.17% 0.20% 23.71% 0.00% A+ 89.34% 10.43% 0.23% 34.69% 6.90% A 87.25% 11.74% 1.01% 42.06% 3.16% A- 80.63% 17.72% 1.65% 40.99% 11.11% BBB+ 72.63% 25.85% 1.52% 45.50% 2.96% BBB 72.35% 26.33% 1.33% 37.46% 3.02% BBB- 54.19% 44.14% 1.67% 19.74% 5.86% BB+ 28.00% 70.86% 1.14% 9.14% 7.84% BB 12.23% 86.04% 1.73% 3.17% 10.33% BB- 7.09% 91.37% 1.54% 1.06% 11.22% B+ 3.01% 95.24% 1.75% 0.52% 12.79% B 4.95% 93.49% 1.56% 0.53% 23.16% B- and worse 1.21% 96.37% 2.42% 0.00% 20.22% Unrated 14.89% 80.99% 4.13% 2.87% 10.54% Total 28.94% 68.04% 3.02% 10.75% 10.88% Total IG 76.30% 22.49% 1.20% 35.66% 4.53% Total Non-IG 9.67% 88.70% 1.63% 2.46% 13.58%
37
Table III: Usage of credit lines and economic performance
This table presents the usage of credit lines by economic performance. Usage is measured as the average percentage usage of the credit line in the first three years after origination. Economic performance is measured via the equity return over the first three years after loan origination (Panel A) and the change in profitability (EBITDA/sales) over the first three years after loan origination (Panel B). The sample is based on credit lines in the U.S. syndicated loan market from 1986 to 2011 for which information related to the usage is available in CapitalIQ. Variables are defined in Appendix A. ***, **, * denote significance at the 1, 5 and 10 % level, respectively.
Panel A: Measuring economic performance via equity returns
Quintile IG Non-IG Not rated Total 1 (Highest equity return) 18.45% 29.89% 28.62% 25.23% 2 20.18% 28.57% 29.65% 25.98% 3 22.64% 24.79% 32.60% 27.19% 4 19.97% 28.35% 34.53% 27.83% 5 (Lowest equity return) 20.20% 36.04% 43.20% 33.23%
Q5 – Q1 1.75% 6.15%** 14.58%*** 8.00%***
t-stat (1.07) (2.35) (7.71) (6.71)
Panel B: Measuring economic performance via changes in profitability (EBITDA/sales)
Quintile IG Non-IG Not rated Total 1 (Increasing profitability) 21.56% 32.46% 33.74% 29.63% 2 19.88% 33.10% 31.82% 28.35% 3 18.58% 28.76% 32.87% 27.48% 4 20.72% 31.75% 31.81% 28.31% 5 (Decreasing profitability) 24.27% 36.87% 39.93% 34.33%
Q5 – Q1 2.71% 4.41%* 6.18%*** 4.70%***
t-stat (1.58) (1.88) (3.94) (4.39)
38
Table IV: Upfront fees and AISU as a compensation for the option to draw
This table presents the upfront fee and the All-in-spread-undrawn by quintile of the borrower's equity volatility. Panel A provides results for the upfront fee. Panel B provides results for the All-in-spread-undrawn. The sample is based on credit lines in the U.S. syndicated loan market from 1986 to 2011. Variables are defined in Appendix A. ***, **, * denote significance at the 1, 5 and 10 % level, respectively.
Panel A: Upfront fee
Quintile IG Non-IG Not rated
Total
1 (Lowest volatility) 25.01 38.33 30.10 30.64 2 22.56 37.35 34.18 32.49 3 27.66 54.09 40.76 40.68 4 29.61 62.60 43.90 44.62 5 (Highest volatility) 44.30 79.87 58.31 59.62
Q5 – Q1 19.29*** 41.54*** 28.21*** 28.98***
t-stat (3.80) (5.81) (7.40) (9.91)
Panel B: All-in-spread-undrawn
Quintile IG Non-IG Not rated
Total
1 (Lowest volatility) 11.87 32.93 25.22 22.44 2 12.43 37.06 30.26 25.92 3 13.40 40.12 33.24 28.28 4 14.72 43.29 35.60 30.46 5 (Highest volatility) 20.95 52.18 40.55 36.54
Q5 – Q1 9.08*** 19.25*** 15.33*** 14.09***
t-stat (13.17) (17.47) (24.86) (28.05)
39
Table V: Performance pricing
This table presents the upfront fee and the All-in-spread-undrawn by quintile of the borrower's equity volatility and by existence of a performance pricing scheme. . Panel A provides results for the upfront fee. Panel B provides results for the All-in-spread-undrawn. "PP – predominantly increasing (0/1)" is a dummy variable equal to one if the credit line contains a performance pricing scheme where the spread can increase more than it can decrease, "PP – predominantly decreasing (0/1)" is a dummy variable equal to one if the credit line contains a performance pricing scheme where the spread can decrease more than it can increase. The sample is based on credit lines in the U.S. syndicated loan market from 1986 to 2011. Variables are defined in Appendix A. ***, **, * denote significance at the 1, 5 and 10 % level, respectively.
Panel A: Performance pricing (PP) and the Upfront fee
(1) (2) (3) (4) (5)
Quintile
PP – predominantly
decreasing
No performance
pricing
PP – predominantly
increasing Difference
(1) versus (2) Difference
(3) versus (2) 1 (Lowest volatility) 33.72 35.21 21.84 -1.48 (-0.32) -13.37*** (3.42) 2 37.82 35.27 22.49 2.55 (0.63) -12.78*** (3.50) 3 41.86 44.91 31.07 -3.05 (-0.63) -13.84** (2.57) 4 47.62 48.75 33.51 -1.12 (-0.25) -15.24*** (3.15) 5 (Highest volatility) 57.43 67.02 47.81 -9.59* (-1.67) -19.20*** (2.86) Q5 – Q1 23.71*** 31.81*** 25.97***
t-stat (4.86) (6.07) (6.42)
Panel B: Performance pricing (PP) and the All-in-spread-undrawn
(1) (2) (3) (4) (5)
Quintile
PP – predominantly
decreasing
No performance
pricing
PP – predominantly
increasing Difference
(1) versus (2) Difference
(3) versus (2) 1 (Lowest volatility) 32.94 21.61 17.63 11.33*** (14.56) -3.98*** (-6.77) 2 35.88 25.28 19.81 10.60*** (13.44) -5.48*** (-8.13) 3 38.19 27.15 22.49 11.04*** (13.07) -4.66*** (-6.38) 4 40.56 28.33 24.36 12.23*** (14.76) -3.97*** (-5.01) 5 (Highest volatility) 44.07 35.87 29.69 8.20*** (8.36) -6.18*** (-5.96) Q5 – Q1 11.13*** 14.26*** 12.06*** t-stat (12.11) (17.78) (15.88)

40
Table VI: Facility fee versus commitment fee: The role of creditworthiness and the competitive bid option
This table provides statistics on the existence of the facility and commitment fee for credit lines with and without competitive bid option. Panel A provides results for the facility fee. Panel B provides results for the commitment fee. The sample is based on credit lines in the U.S. syndicated loan market from 1986 to 2011. Variables are defined in Appendix A. ***, **, * denote significance at the 1, 5 and 10 % level, respectively.
Panel A: Facility fee (0/1)
Competitive Bid
Option
IG Non-IG Not rated Total
CBO in contract 94.00% 54.04% 46.69% 67.24%
CBO not in contract 71.44% 8.73% 14.80% 25.57%
Difference 22.56%*** 45.31%*** 31.89%*** 41.67%***
t-stat (18.01) (20.72) (32.84) (50.41)
Panel B: Commitment fee (0/1)
Competitive Bid
Option
IG Non-IG Not rated Total
CBO in contract 8.93% 48.99% 64.63% 40.03%
CBO not in contract 29.13% 92.81% 88.23% 76.68%
Difference -20.20%*** -43.82%*** -23.60%*** -36.65%***
t-stat (-15.72) (-21.57) (-26.42) (-45.13)
41
Table VII: Usage as a function of the AISU/AISD ratio and the role of the utilization fee
This table presents the usage by quintile of the credit line's AISU-to-AISD-ratio. The usage of credit lines is measured as the average credit line usage of the borrower over the first three years after origination based on data from CapitalIQ. Panel A provides results for the usage by quintile of the AISU-to-AISD-ratio and rating status (investment grade, non-investment grade, not rated, total). Panel B provides results for the usage existence of a utilization fee (column (1)) and the usage of the credit line by existence of utilization fee (column (2) and (3)). The sample is based on credit lines in the U.S. syndicated loan market from 1986 to 2011 with existing credit line usage data from CapitalIQ. Variables are defined in Appendix A. ***, **, * denote significance at the 1, 5 and 10 % level, respectively.
Panel A: Usage and AISU/AISD-ratio
AISU/AISD-ratio
IG Non-IG Not rated Total
1 (Lowest ratio) 17.95% 30.17% 34.88% 28.74%
2 23.19% 33.39% 30.90% 29.55%
3 20.81% 30.77% 33.42% 29.11%
4 21.51% 32.84% 35.65% 30.90%
5 (Highest ratio) 22.21% 34.98% 40.08% 32.38%
Q5 – Q1 4.26%** 4.80%* 5.21%*** 3.64%***
t-stat (2.38) (1.93) (2.95) (3.13)
Panel B: The role of the utilization fee
(1) (2) (3) (4)
AISU/AISD-ratio
Utilization fee (0/1)
Usage if utilization fee does
not exists
Usage if utilization fee exists Difference
1 (Lowest ratio) 5.69% 28.87% 26.66% 2.20%
2 14.80% 30.35% 24.94% 5.41%***
3 19.06% 30.47% 23.35% 7.12%***
4 22.91% 33.57% 21.92% 11.64%***
5 (Highest ratio) 24.23% 35.65% 22.16% 13.48%***
Q5 – Q1 18.54%*** 6.78%*** -4.50%
t-stat (14.64) (5.28) (-1.36)
42
Appendix A Explanation of variables
Variable Source Description
General Credit line Dealscan Loans with type “Revolver/Line < 1 Yr.”, “Revolver/Line >= 1 Yr.”,
“364-Day Facility”, “Limited Line” or “Revolver/Term Loan” as indicated in the facility table in Dealscan
Term Loan Dealscan Loans with type “Term Loan”, “Term Loan A”-“Term Loan H”,or “Delay Draw Term Loan” as indicated in the facility table in Dealscan
Lead arranger Dealscan We follow Bharath et al. (2011) and define a lender as a lead arranger if at least one of the following conditions is met: 1) LeadArrangerCredit = Yes in the LenderShares table of Dealscan, 2) LenderRole is equal to “Agent”, “Admin agent”, “Arranger” or “Lead bank” in the LenderShares table of Dealscan, 3) the lender is the sole lender.
Price terms AISD Dealscan All-In-Spread-Drawn, defined as the sum of the spread over LIBOR plus
the facility fee AISU Dealscan All-In-Spread-Undrawn, defined as the sum of the facility fee and the
commitment fee Spread Dealscan Spread over LIBOR (non-LIBOR-based loans are excluded from the
sample) paid on drawn amounts on credit lines Commitment fee Dealscan Fee paid on the unused amount of loan commitments Facility fee Dealscan Fee paid on the entire committed amount, regardless of usage Utilization fee Dealscan Fee paid on the entire drawn amount once a certain usage threshold has
been exceeded Cancellation fee Dealscan Fee paid if the syndicated loan is cancelled before maturity Upfront fee Dealscan Fee paid upon completion of a syndicated loan
Loan characteristics Facility amount Dealscan Facility amount in USD mn as indicated in the field FacilityAmt in the
facility table in Dealscan, adjusted for inflation in year 2005 dollars Maturity Dealscan Facility maturity in months as indicated in the field Maturity in the
facility table in Dealscan Secured (0/1) Dealscan Dummy equal to 1 if a facility is secured as indicated by the field
Secured in the facility table in Dealscan Sole Lender (0/1) Dealscan Dummy equal to 1 if a facility is provided solely by a single lender as
indicated by the LenderShares table in Dealscan Syndicate Size Dealscan Number of lenders (lead arranger and participants) of a syndicated loan
facility as indicated by the LenderShares table in Dealscan Lead Size Dealscan Number of lead arrangers of a syndicated loan facility as indicated by the
LenderShares table in Dealscan
43
Borrower characteristics Total assets Compustat Total assets in USD mn, adjusted for inflation in year 2005 dollars Coverage Compustat Ratio of EBITDA to interest expenses Leverage Compustat Ratio of book value of total debt to the book value of assets Profitability Compustat Ratio of EBITDA to sales Tangibility Compustat Ratio of property, plant and equipment to total assets Current ratio Compustat Ratio of current assets to current liabilities Market-to-book Compustat Ratio of (book value of assets – book value of equity + market value of
equity) to book value of assets Investment grade (0/1) Compustat Dummy equal to 1 if the S&P rating is BBB- or higher. For non-rated
borrowers this dummy is missing Not rated (0/1) Compustat Dummy equal to 1 if no S&P rating for the borrower exists
Other characteristics Equity volatility CRSP Equity volatility of the borrower's stock price, measured via daily stock
returns in the 12 months prior to loan origination Profitability volatility Compustat Volatility of EBITDA/sales using annual report data over the three years
prior to loan origination Spreadmin (Spreadmax) Dealscan Minimum (Maximum) spread specified in the performance pricing
schedule. Equal to the spread if no performance pricing schedule exists PP – predominantly increasing (0/1)
Dealscan Dummy equal to one if the credit line contains a performance pricing scheme where the spread can increase more than it can decrease
PP – predominantly increasing (0/1)
Dealscan Dummy equal to one if the credit line contains a performance pricing scheme where the spread can decrease more than it can decrease
PP (continuous measure)
Dealscan (Spreadmax – Spreadcurrent) - (Spreadcurrent - Spreadmin), where Spreadcurrent denotes the spread specified in the loan contract as of loan origination
44
Appendix B: Multivariate Results
Appendix Table 1: Usage of credit lines and economic performance (Multivariate results for Table III)
This table provides results of a linear regression of the usage of credit lines on the economic performance and control variables. Usage is measured as the average usage of the credit line in the first three years after loan origination. Economic performance is measured via the equity return over the first three years after loan origination (Columns (1) and (2)) and the change in profitability (EBITDA/sales) over the first three years after loan origination (Column (3) and (4)). Column (1) and (3) provide results from a multivariate regressions with rating fixed effects (rating notch level). Column (2) and (4) provide results from a multivariate regressions controlling for loan and borrower characteristics as well as rating notch, year, loan purpose, loan type and one-digit SIC code fixed effects.. Variables are defined in Appendix A. We report t-values based on standard errors clustered at the borrowing firm in parentheses. ***, **, * denote significance at the 1, 5 and 10 % level, respectively.
Panel A: Measuring
economic performance via equity returns
Panel B: Measuring
economic performance via changes in profitability
(1) (2) (3) (4) Credit
lines Credit lines Credit lines Credit lines
Usage Usage Usage Usage Equity Return -0.062*** -0.066*** (-6.78) (-6.67) Change in profitability (EBITDA/sales) -0.205*** -0.168*** (-3.39) (-2.69) Rating fixed effects Yes Yes Yes Yes Loan characteristics No Yes No Yes Borrower characteristics No Yes No Yes Year fixed effects No Yes No Yes Loan purpose fixed effects No Yes No Yes Loan type fixed effects No Yes No Yes One digit SIC code fixed effects No Yes No Yes Adj. R2 6.95% 19.38% 5.09% 18.34% Observations 5,552 4,988 7,573 6,178
45
Appendix Table 2: Upfront fees and AISU as a compensation for the option to draw (Multivariate results for Table IV)
This table provides results of a linear regression of the upfront fee and the All-in-spread-undrawn on the measures of borrower riskiness and control variables. Panel I provides results using equity volatility (measured in percentage points) as a proxy for borrower riskiness and Panel II provides results using the standard deviation of profitability (measured as EBITDA/sales) over the three years preceding loan origination. Panel I.A/II.A provide results for the upfront fee, Panel I.B/II.B provide results for the All-in-spread-undrawn. Variables are defined in Appendix A. We report t-values based on standard errors clustered at the borrowing firm in parentheses. ***, **, * denote significance at the 1, 5 and 10 % level, respectively.
Panel I: Using equity volatility as a proxy for risk
Panel I.A: Upfront fee Panel I.B: AISU (1) (2) (3) (4) (5) (6) Credit lines Credit lines At-the-money
credit lines Credit lines Credit lines At-the-money
credit lines Upfront fee Upfront fee Upfront fee AISU AISU AISU Equity Volatility 0.492*** 0.359*** 0.245* 0.226*** 0.132*** 0.106*** (9.07) (6.15) (1.70) (23.75) (11.92) (4.32)
Rating fixed effects Yes Yes Yes Yes Yes Yes Loan characteristics No Yes Yes No Yes Yes Borrower characteristics No Yes Yes No Yes Yes Year fixed effects No Yes Yes No Yes Yes Loan purpose fixed effects No Yes Yes No Yes Yes Loan type fixed effects No Yes Yes No Yes Yes One digit SIC code fixed effects
No Yes Yes
No Yes Yes
Adj. R2 10.42% 35.87% 23.36% 41.26% 58.55% 32.41% Observations 2,638 2,274 503 13,730 12,063 1,810

46
Panel II: Using volatility of profitability (EBITDA /sales) as a proxy for risk
Panel II.A: Upfront fee Panel II.B: AISU (1) (2) (3) (4) (5) (6) Credit lines Credit lines At-the-money
credit lines Credit
lines Credit lines At-the-money
credit lines Upfront fee Upfront fee Upfront fee AISU AISU AISU Profitability volatility 58.293*** 41.509*** 69.454* 32.473*** 14.497*** 27.420*** (4.51) (2.67) (1.78) (10.76) (4.84) (3.63) Rating fixed effects Yes Yes Yes Yes Yes Yes Loan characteristics No Yes Yes No Yes Yes Borrower characteristics No Yes Yes No Yes Yes Year fixed effects No Yes Yes No Yes Yes Loan purpose fixed effects No Yes Yes No Yes Yes Loan type fixed effects No Yes Yes No Yes Yes One digit SIC code fixed effects
No Yes Yes
No Yes Yes
Adj. R2 4.02% 34.72% 36.49% 33.26% 54.27% 28.10% Observations 3,739 3,141 734 18,277 15,659 2,488
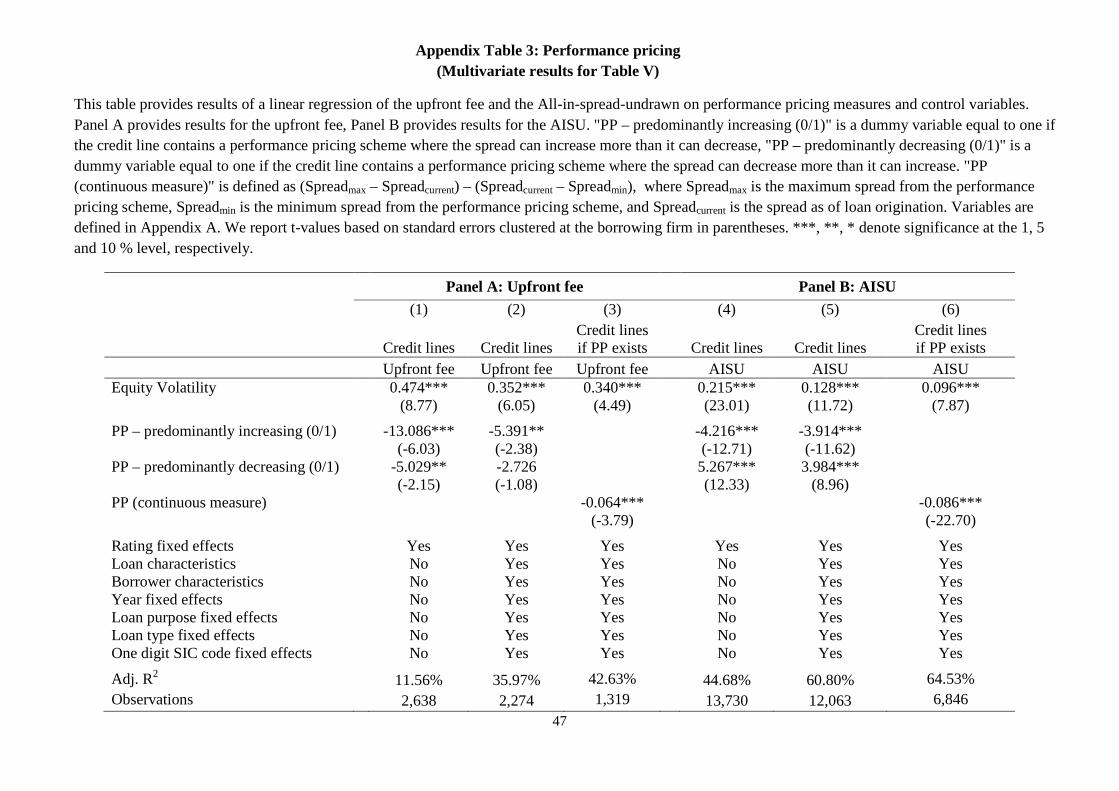
47
Appendix Table 3: Performance pricing (Multivariate results for Table V)
This table provides results of a linear regression of the upfront fee and the All-in-spread-undrawn on performance pricing measures and control variables. Panel A provides results for the upfront fee, Panel B provides results for the AISU. "PP – predominantly increasing (0/1)" is a dummy variable equal to one if the credit line contains a performance pricing scheme where the spread can increase more than it can decrease, "PP – predominantly decreasing (0/1)" is a dummy variable equal to one if the credit line contains a performance pricing scheme where the spread can decrease more than it can increase. "PP (continuous measure)" is defined as (Spreadmax – Spreadcurrent) – (Spreadcurrent – Spreadmin), where Spreadmax is the maximum spread from the performance pricing scheme, Spreadmin is the minimum spread from the performance pricing scheme, and Spreadcurrent is the spread as of loan origination. Variables are defined in Appendix A. We report t-values based on standard errors clustered at the borrowing firm in parentheses. ***, **, * denote significance at the 1, 5 and 10 % level, respectively.
Panel A: Upfront fee Panel B: AISU
(1) (2) (3) (4) (5) (6)
Credit lines Credit lines Credit lines if PP exists Credit lines Credit lines
Credit lines if PP exists
Upfront fee Upfront fee Upfront fee AISU AISU AISU Equity Volatility 0.474*** 0.352*** 0.340*** 0.215*** 0.128*** 0.096*** (8.77) (6.05) (4.49) (23.01) (11.72) (7.87)
PP – predominantly increasing (0/1) -13.086*** -5.391** -4.216*** -3.914*** (-6.03) (-2.38) (-12.71) (-11.62) PP – predominantly decreasing (0/1) -5.029** -2.726 5.267*** 3.984*** (-2.15) (-1.08) (12.33) (8.96) PP (continuous measure) -0.064*** -0.086*** (-3.79) (-22.70)
Rating fixed effects Yes Yes Yes Yes Yes Yes Loan characteristics No Yes Yes No Yes Yes Borrower characteristics No Yes Yes No Yes Yes Year fixed effects No Yes Yes No Yes Yes Loan purpose fixed effects No Yes Yes No Yes Yes Loan type fixed effects No Yes Yes No Yes Yes One digit SIC code fixed effects No Yes Yes No Yes Yes
Adj. R2 11.56% 35.97% 42.63% 44.68% 60.80% 64.53% Observations 2,638 2,274 1,319 13,730 12,063 6,846
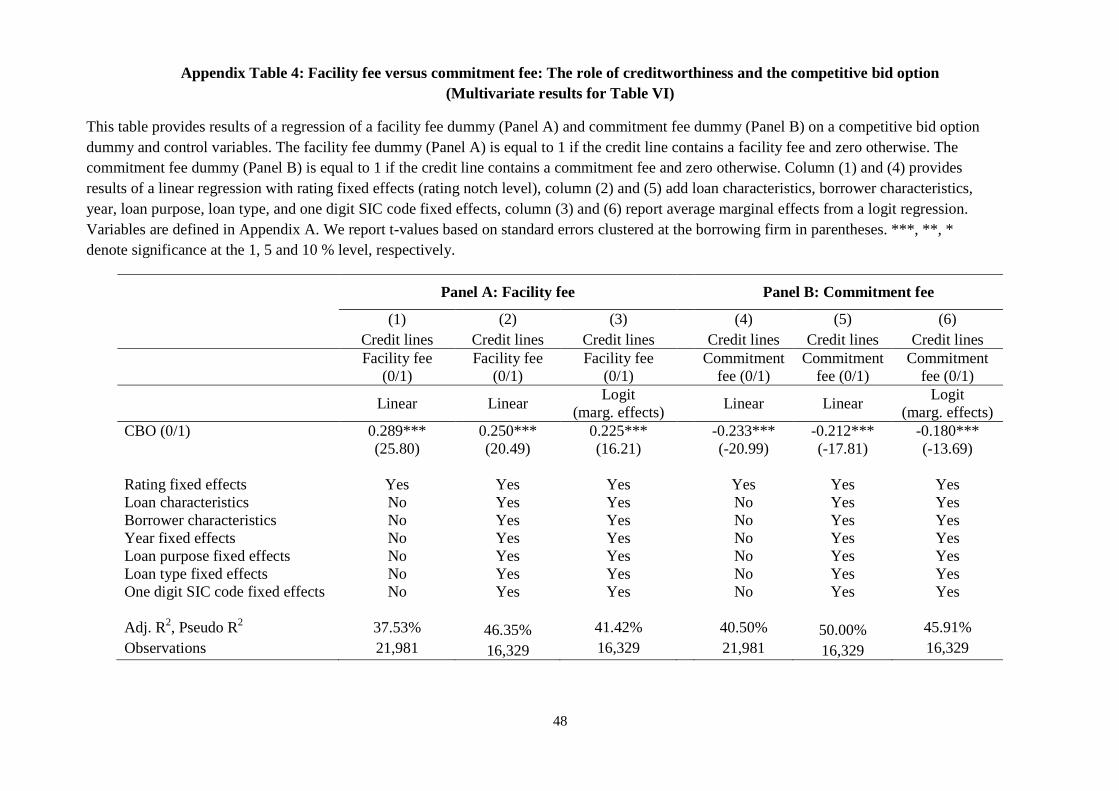
48
Appendix Table 4: Facility fee versus commitment fee: The role of creditworthiness and the competitive bid option (Multivariate results for Table VI)
This table provides results of a regression of a facility fee dummy (Panel A) and commitment fee dummy (Panel B) on a competitive bid option dummy and control variables. The facility fee dummy (Panel A) is equal to 1 if the credit line contains a facility fee and zero otherwise. The commitment fee dummy (Panel B) is equal to 1 if the credit line contains a commitment fee and zero otherwise. Column (1) and (4) provides results of a linear regression with rating fixed effects (rating notch level), column (2) and (5) add loan characteristics, borrower characteristics, year, loan purpose, loan type, and one digit SIC code fixed effects, column (3) and (6) report average marginal effects from a logit regression. Variables are defined in Appendix A. We report t-values based on standard errors clustered at the borrowing firm in parentheses. ***, **, * denote significance at the 1, 5 and 10 % level, respectively.
Panel A: Facility fee Panel B: Commitment fee
(1) (2) (3) (4) (5) (6) Credit lines Credit lines Credit lines Credit lines Credit lines Credit lines
Facility fee (0/1)
Facility fee (0/1)
Facility fee (0/1)
Commitment fee (0/1)
Commitment fee (0/1)
Commitment fee (0/1)
Linear Linear Logit
(marg. effects)
Linear Linear Logit
(marg. effects) CBO (0/1) 0.289*** 0.250*** 0.225*** -0.233*** -0.212*** -0.180*** (25.80) (20.49) (16.21) (-20.99) (-17.81) (-13.69) Rating fixed effects Yes Yes Yes Yes Yes Yes Loan characteristics No Yes Yes No Yes Yes Borrower characteristics No Yes Yes No Yes Yes Year fixed effects No Yes Yes No Yes Yes Loan purpose fixed effects No Yes Yes No Yes Yes Loan type fixed effects No Yes Yes No Yes Yes One digit SIC code fixed effects No Yes Yes No Yes Yes Adj. R2, Pseudo R2 37.53% 46.35% 41.42% 40.50% 50.00% 45.91% Observations 21,981 16,329 16,329 21,981 16,329 16,329
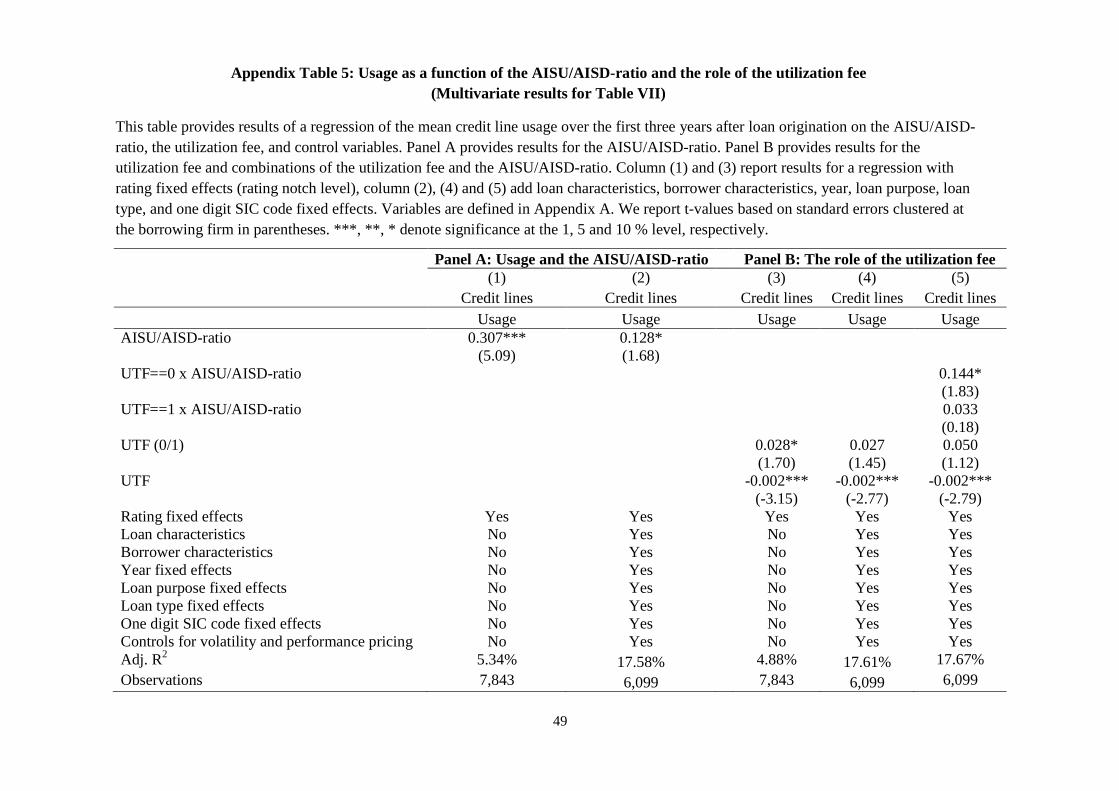
49
Appendix Table 5: Usage as a function of the AISU/AISD-ratio and the role of the utilization fee (Multivariate results for Table VII)
This table provides results of a regression of the mean credit line usage over the first three years after loan origination on the AISU/AISD-ratio, the utilization fee, and control variables. Panel A provides results for the AISU/AISD-ratio. Panel B provides results for the utilization fee and combinations of the utilization fee and the AISU/AISD-ratio. Column (1) and (3) report results for a regression with rating fixed effects (rating notch level), column (2), (4) and (5) add loan characteristics, borrower characteristics, year, loan purpose, loan type, and one digit SIC code fixed effects. Variables are defined in Appendix A. We report t-values based on standard errors clustered at the borrowing firm in parentheses. ***, **, * denote significance at the 1, 5 and 10 % level, respectively.
Panel A: Usage and the AISU/AISD-ratio Panel B: The role of the utilization fee (1) (2) (3) (4) (5) Credit lines Credit lines Credit lines Credit lines Credit lines Usage Usage Usage Usage Usage AISU/AISD-ratio 0.307*** 0.128* (5.09) (1.68) UTF==0 x AISU/AISD-ratio 0.144* (1.83) UTF==1 x AISU/AISD-ratio 0.033 (0.18) UTF (0/1) 0.028* 0.027 0.050 (1.70) (1.45) (1.12) UTF -0.002*** -0.002*** -0.002*** (-3.15) (-2.77) (-2.79) Rating fixed effects Yes Yes Yes Yes Yes Loan characteristics No Yes No Yes Yes Borrower characteristics No Yes No Yes Yes Year fixed effects No Yes No Yes Yes Loan purpose fixed effects No Yes No Yes Yes Loan type fixed effects No Yes No Yes Yes One digit SIC code fixed effects No Yes No Yes Yes Controls for volatility and performance pricing No Yes No Yes Yes Adj. R2 5.34% 17.58% 4.88% 17.61% 17.67% Observations 7,843 6,099 7,843 6,099 6,099