University of Padova Land, Environment, Agriculture and ...
157
University of Padova Land, Environment, Agriculture and Forestry (LEAF) Department ________________________________________________________ PhD Program: Land, Environment, Resources and Health (LERH) Batch: XXXII Deforestation risk in bovine leather supply chain. Risk assessment through conceptualization, discourse and trade data analysis within the context of Italian-Brazilian leather trade PhD Program Coordinator: Prof. Davide Matteo Pettenella Supervisor: Prof. Davide Matteo Pettenella Co-Supervisors: Asst. Prof. Dr. Mauro Masiero, Asst. Prof. Dr. Jelle Hendrik Behagel PhD candidate: Aynur Mammadova
Transcript of University of Padova Land, Environment, Agriculture and ...

University of Padova
Land, Environment, Agriculture and Forestry (LEAF) Department
________________________________________________________
PhD Program: Land, Environment, Resources and Health (LERH)
Batch: XXXII
Deforestation risk in bovine leather supply chain.
Risk assessment through conceptualization, discourse and trade data analysis within the context of Italian-Brazilian leather trade
PhD Program Coordinator: Prof. Davide Matteo Pettenella
Supervisor: Prof. Davide Matteo Pettenella
Co-Supervisors: Asst. Prof. Dr. Mauro Masiero, Asst. Prof. Dr. Jelle Hendrik Behagel
PhD candidate: Aynur Mammadova


Università degli Studi di Padova
Dipartimento Territorio e Sistemi Agro-Forestali (TESAF)
________________________________________________________________
CORSO DI DOTTORATO DI RICERCA
Land, Environment, Resources, Health (LERH)
Ciclo XXXII
Il rischio di deforestazione nella filiera delle pelli bovine.
Valutazione del rischio basata su concettualizzazione, analisi del discorso e dati di commercio con riferimento all’esportazione di
pelli dal Brasile all’Italia
Coordinatore: Prof. Davide Matteo Pettenella
Supervisore: Prof. Davide Matteo Pettenella
Co-Supervisori: Dott. Mauro Masiero, Dott. Jelle Hendrik Behagel
Dottoranda: Aynur Mammadova


Table of contents List of Figures ................................................................................................................................ 5
List of Tables ................................................................................................................................. 7
Abbreviations and acronyms ........................................................................................................ 9
Acknowledgements .................................................................................................................... 11
Editorial responsibilities ............................................................................................................. 12
Summary ..................................................................................................................................... 13
Sommario .................................................................................................................................... 15
1 Introduction ........................................................................................................................ 17
1.1 Problem statement and motivation ............................................................................ 17
1.2 Structure of the thesis ................................................................................................. 18
1.3 Background ................................................................................................................. 19
1.3.1 Commodity supply chains and deforestation risk .............................................. 19
1.3.2 Transparency of supply chains, visibility of the deforestation risk and social justice 21
1.3.3 Tracing deforestation risk in trade of commodities ........................................... 23
1.3.4 Leather and deforestation risk ........................................................................... 24
1.4 Objectives and research questions ............................................................................. 37
1.5 Methodological choices and justification ................................................................... 37
1.5.1 Guiding definitions of forests and deforestation ............................................... 37
1.5.2 The choice of Brazilian Legal Amazon (BLA) as a scope ...................................... 39
1.5.3 The choice of Brazil and Italy as case countries.................................................. 41
1.5.4 Social science approach and deforestation risk assessment .............................. 41
2 Conceptualizing deforestation risk in commodity supply chains. The case of bovine leather ......................................................................................................................................... 43
2.1 Conceptualization of deforestation risk along supply chains ..................................... 45
2.2 Results ......................................................................................................................... 49
2.2.1 Commodity driven deforestation: cattle as forest-risk commodity in Brazil ..... 50
2.2.2 Geospatial analysis of deforestation risk ............................................................ 52
2.2.3 Deforestation risk revealed through supply chain complexities ........................ 57
2.2.4 Embedded deforestation in production and trade............................................. 62
2.3 Discussion ................................................................................................................... 64
2.4 Conclusion ................................................................................................................... 66
3 Making deforestation risk visible. Discourses on bovine leather supply chain in Brazil .... 69
3.1 Transparency and sustainable supply chains .............................................................. 70
3.1.1 Transparency and sustainability ......................................................................... 70

3.1.2 Transparency and legitimacy .............................................................................. 71
3.1.3 Transparency and fairness .................................................................................. 72
3.2 Research approach ...................................................................................................... 72
3.2.1 Discourse analysis ............................................................................................... 72
3.2.2 Data collection and analysis methods ................................................................ 73
3.3 Results ......................................................................................................................... 74
3.3.1 Order and Progress ............................................................................................. 76
3.3.2 Livehoods ............................................................................................................ 78
3.3.3 Zero deforestation .............................................................................................. 80
3.4 Discussion .................................................................................................................... 83
3.4.1 Sustainable, legitimate, and fair supply chains ................................................... 83
3.4.2 The politics of transparency ................................................................................ 84
Source: author’s own elaboration ........................................................................................... 85
3.5 Conclusion ................................................................................................................... 85
4 Embedded deforestation in the Brazilian-Italian bovine leather trade .............................. 87
4.1 Results ......................................................................................................................... 90
4.1.1 Italian imports of forest-risk commodities from Brazil ....................................... 90
4.1.2 Italian leather industry ........................................................................................ 93
4.1.3 Italian imports of leather from Brazil .................................................................. 94
4.1.4 Final destination - main clients of the Italian tanneries ................................... 104
4.2 Discussion and conclusion ......................................................................................... 105
5 Overall discussion and policy recommendations ............................................................. 107
5.1 Interaction of the different analyses ......................................................................... 107
5.2 Policy implications and conclusion ............................................................................ 109
5.2.1 Policy recommendations ................................................................................... 110
References ................................................................................................................................ 113
List of websites and databases ................................................................................................. 130
List of personal communication ................................................................................................ 131
Annex 1. Data sources and collection methods for geospatial analysis ................................... 133
Annex 2: List of slaughterhouses in Brazilian Legal Amazon .................................................... 135
Annex 3: List of tanneries in Brazilian Legal Amazon ................................................................ 141
Annex 4. The list of Harmonized Commodity Description and Coding Systems (HS) applicable to the case of bovine leather .................................................................................................... 143
Annex 5. List of informants and field visits ............................................................................... 151
Annex 6. Definitions .................................................................................................................. 155

5
List of Figures Figure 1. The structure of the thesis _____________________________________________________ 19 Figure 2. A typical bovine leather supply chain based on the Brazilian production model ___________ 26 Figure 3. A suggested full cycle and extended system boundaries and considered input and output elements __________________________________________________________________________ 29 Figure 4. Environmental impact and pollutants linked to core leather processing. BOD - Biochemical Oxygen Demand COD - Chemical Oxygen Demand TDS - Total Dissolved Solids SS - Suspended Solids _ 30 Figure 5. Model for describing typical production processes and type of outputs/products _________ 34 Figure 6. Semi-processed leather at wet-blue stage ________________________________________ 34 Figure 7. Brazilian Legal Amazon (in blue) and administrative borders of the states of Brazil ________ 39 Figure 8. Annual deforestation estimates in Brazil _________________________________________ 40 Figure 9. The accumulated deforestation per state 2008-2018 ________________________________ 40 Figure 10. Visual conceptualization of deforestation risk of an area; forest-risk commodities; commodity-driven deforestation; embodied deforestation ____________________________________________ 48 Figure 11. Annual deforestation and the increase in total pastureland cover in BLA for the period 2004-2017 _____________________________________________________________________________ 51 Figure 12. SIF slaughterhouses location within the BLA and the risk associated to their proximity to deforestation between 2005 and 2016 __________________________________________________ 54 Figure 13. Tanneries location within the BLA and the risk associated with their proximity to deforestation between 2005 and 2016 ______________________________________________________________ 56 Figure 14. Leather supply chain and its different segments __________________________________ 59 Figure 15. The difference between total slaughter and acquisition of bovine hides by tanneries as an inference about clandestine market _____________________________________________________ 62 Figure 16. Total slaughter and acquisition of tanned (wet-blue) leather by tanneries and their difference per state in 2018 ____________________________________________________________________ 64 Figure 17. Cattle herd (nelore breed), pasture with and without the legal forest reserve ___________ 67 Figure 18. Play of emphasis and visibility of different elements of sustainable supply chains by different discourses _________________________________________________________________________ 85 Figure 19. Around 18% of all Brazilian exports in 2018 were destined to EU (indicated in blue) ______ 89 Figure 20. Top 5 importing EU countries (on the left), and top 5 imported commodities (on the right), from Brazil in 2017, billion dollars ______________________________________________________ 91 Figure 21. Top 5 EU countries importing Brazilian beef; bovine hide and leather; soybeans in 2017, million dollars ______________________________________________________________________ 92 Figure 22. Countries channelling direct investment equity to Brazil through the Netherlands ________ 92 Figure 23. Italian leather industry in a nutshell. ___________________________________________ 94 Figure 24. Top 15 countries importing Brazilian bovine hides and leather (HS 4101; 4104; 4107 combined), net weight in kg ___________________________________________________________ 95 Figure 25. Top 10 Bovine hides and leather exporters to Italy in 2018 (sum of netweight, kt) and the share of raw hides, wet-blue and finished leather exported by Brazil to Italy in 2018 ______________ 96 Figure 26. The share of raw (salted) hides, wet-blue and finished leather exported by Brazil in 2018 and the top 5 importers of each HS product category in 2018, in USD _____________________________ 97 Figure 27. Top 10 Brazilian states exporting to Italy in the period 2014-2018, netweight, kg. _______ 99 Figure 28. Main importers (consignees) of Brazilian hides and leather (HS 4104; HS 4107) in 2018 __ 101 Figure 29. Main exporters (shippers) to Italy from Brazil (HS 4104; HS 4107) in 2018 _____________ 101 Figure 30. Top 12 country importers of Italian exports of leather (raw, semi-processed, finished combined HS41); articles of leather (HS 42); and leather footwear (HS 6403;6404) in 2018, in trade value USD _____________________________________________________________________________ 105 Figure 31. Leather ready to be transported from tannery to a port or to other tanneries __________ 106

6

7
List of Tables Table 1. Share of chrome (wet-blue), vegetable and chrome-free (wet-white) tanning per end use of leather ____________________________________________________________________________ 31 Table 2. List of relevant Italian (in white), Brazilian (in blue) and international (in yellow) sustainability standards, certifications and initiatives in the leather sector, per key-sustainability-dimension addressed _________________________________________________________________________________ 35 Table 3. The concepts and their definitions in the literature __________________________________ 47 Table 4. BLA deforestation (km2) within 100 km radius from current slaughterhouse location and % incidence on total BLA deforestation (2005-2016)__________________________________________ 53 Table 5. BLA deforestation (km2) within 100 km radius from current tannery location and % incidence on total BLA deforestation (2005-2016) ____________________________________________________ 55 Table 6. Direct investment liability positions – 2010 and 2015. Equity - Immediate investing country and ultimate investor country, billion USD and relative incidence on total values ____________________ 91 Table 7.Wet-blue exports from Pará state in 2018, in net value (USD), net weight (kg) and percentages relative to grand total _______________________________________________________________ 98 Table 8. Exports of finished leather (HS 4107) from the state of Mato Grosso in 2018, in net value (USD), net weight (kg) and percentages relative to grand total ____________________________________ 100 Table 9: List of slaughterhouses in Brazilian Legal Amazon, the assigned deforestation risk and associated information ______________________________________________________________ 135 Table 10: List of tanneries in Brazilian Legal Amazon, the assigned deforestation risk and associated information _______________________________________________________________________ 141 Table 11. The list of Harmonized Commodity Description and Coding Systems (HS) applicable to the case of bovine leather ___________________________________________________________________ 143 Table 12. The list of informants and field visits in Brazil and Italy during the period of 2016-2019 ___ 151

8

9
Abbreviations and acronyms AC Acre
AM Amazonas
AP Amapá
APP Áreas de Preservação Permanente
BLA Brazilian Legal Amazon
CAR Cadatro Ambiental Rural
CBD Convention on Biological Diversity
CGF Consumers Good Forum
CICB Centre for the Brazilian Tanning Industry
CSR Corporate Social Responsibility
EC European Commission
EU European Union
FAO Food and Agriculture Organization
FC Forest Code
FRA Forest Resource Assessment
FREL Forest Reference Emission Level
GBC Guia Brasileiro do Couro
GCP Global Canopy Programme
GFW Global Forest Watch
GFWC Global Forest Watch Commodities
GHG
GTA
Greenhouse Gasses
Guia de Transporte Público
HS Harmonized Commodity Description and Coding Systems
IBAMA Brazilian Institute of Environment and Renewable Natural Resources
IBGE Brazilian Institute of Geography and Statistics
INDC Intended Nationally Determined Contribution
INPE National Institute for Space Research
IPAM Instituto de Pesquisa Ambiental da Amazônia

10
IPCC Intergovernmental Panel on Climate Change
IUCN International Union for Conservation of Nature
LAPIG Laboratório de Processamento de Imagens e Geoprocessamento
LWG Leather Working Group
MAPA Ministério da Agricultura, Pecuária e Abastecimento
MMA Ministério do Meio Ambiente
NGO Non-Governmental Organizations
NYDF The New York Declaration on Forests
OEC Observatory of Economic Complexity
PA Pará
PPCDAm Plan for Protection and Control of Deforestation in the Amazon
PRODES Legal Amazon Deforestation Monitoring Project
RL Reserva Legal
SDA Secretaria de Defesa Agropecuária
SDG Sustainable Development Goals
SIDRA Sistema IBGE de Recuperação Automática
SIE Estate Inspection System
SIF Federal Inspection System
SIM Municipality Inspection System
SISBOV System of Identification and Certification of Bovines and Bubalines
TAC
TO
Term for Commitment to Adjustment of Conduct
Tocantins
UNDP United Nations Development Programme
UNIC
UNFCCC
Unione Nazionale Industria Conciaria (Italian Tanners Association)
United Nations Framework Convention on Climate Change
USA United States of America
USD USA dollar
11
Acknowledgements
This research is the result of collective efforts and valuable support by many important people in my life and those who I happened to meet during the research process.
Foremost, I would like to express my sincere gratitude to my supervisors, Prof. Davide M. Pettenella, Dr. Mauro Masiero and Dr. Jelle Behagel for their close engagement and trust in the project. In particular, I would like to thank Prof. Pettenella for his acceptance of the thesis supervision, for his wise guidance throughout the research process and for professional networking opportunities. Especial thanks to Dr. Mauro Masiero for his timely and rigorous checks on the written outputs, for his optimism about the success of the project and for the close support in reaching out to the diverse stakeholders. I am very grateful to Dr. Jelle Behagel for his extended interest in the research since our first meeting, for patient listening to my unstructured thoughts and close guidance on linking them to theory and literature. It has been an honor to learn from and work with the professionals with so many years of experience and knowledge in the field.
Especial thanks to Mauro Armelin from Amigos da Terra - Amazônia Brasileira, Ian Thompson from the Nature Conservancy Brazil and Carla Leal from Mato Grosso State University, Brazil for hosting me in their respective organizations and for helping to reach out to the relevant stakeholders for the interviews. I also thank all the people I met during my visit to Brazil who hosted me, helped travel safely and acted as interpreters during the interviews. Many thanks to Caroline Sartorato Silva França for her support in the research and for extended interest in the topic.
I am grateful for the chance to be a participant of European Forest Institute Short Scientific Visits (SSV) call for Early Stage Researchers and visit Wageningen University and Research for the exchange semester in 2017. The scholarship provided by “Matteo Cagnoni” call, by Agronomi e Forestali Senza Frontiere ONLUS enabled the possibility of extensive travel in Brazil to hold the stakeholder interviews.
During the most challenging times of the research process, I was blessed to have the close support of old and new friends. Especial thanks to Jonas, to the MESPOM group and to Patrick for helping me to stay on track and grounded. My sincere thanks to Niccolò, Gaia, Emilia, Nisha, Simone and Eros for making me feel welcomed in Italy. I feel deep gratitude for having the chance to meet and make friends with so many inspiring young souls during the Amazon Summer School, 2018 edition in Tumbira community, Brazil. Their follow-up conversations and amazing achievements have become the source of endless inspiration.
Especial thanks to Adriene for mindfulness and meditation lessons that proved to be essential to deal with the stress of the research process and to Julia Butterfly Hill for inspiration and spiritual guidance. I feel honored to have the mentorship of Mauricio Curi whose timely interference was essential for navigating through despair as the result of the extended travel to Brazil and witnessing the nature destruction, violence and insecurity of the frontiers.

12
I thank my family and especially my parents for always supporting me in my new endeavours. Seeing their proud faces is always priceless!
Last but not least, my deep appreciation and gratefulness go to the sacred and life-sustaining forests of the Amazon and to the communities and individuals who risk their lives in the defence of these forests, for the sake of all humanity and life on Earth!
Editorial responsibilities
As the author of the thesis Aynur Mammadova is responsible for conducting the literature review, collection of primary and secondary data and writing down major parts of the data analysis. As part of the master thesis preparation, Caroline Sartorato Silva França contributed with the geospatial data analysis on slaughterhouse and tannery locations and the associated deforestation risk estimations (Chapter 2). Dr. Jelle Behagel had a written contribution with discourse theory and analysis presented in Chapter 3. Prof. Davide M. Pettenella and Dr. Mauro Masiero have improved the scope and analysis of the research through continuous feedback on written outputs during the research process. The individual contributions of the authors to different chapters of the thesis forming separate blocks of the analysis (as manuscripts either submitted or to be submitted to the peer-reviewed journals) are presented below:
• Conceptualizing deforestation risk in commodity supply chains. The case of bovine leather Details: Mammadova A., Sartorato C. S. F., Behagel J., Masiero M., Pettenella D. M. (to be submitted to Forest Policy and Economics).
• Making deforestation risk visible. Discourses on bovine leather supply chain in Brazil Details: Mammadova A., Behagel J., Masiero M. (submitted to Geoforum June 27, 2019).
• Embedded deforestation in the Brazilian-Italian bovine leather trade Details: Mammadova A., Masiero M., Pettenella, D. (to be submitted to Forest Policy and Economics).
13
Summary
Large-scale industrial agricultural production and commodity trade are increasingly linked to deforestation and forest degradation in the tropics. This link is described via the concept of ‘deforestation risk’. Agricultural products whose production or extraction involves deforestation and native vegetation clearing are classified as forest-risk commodities. Beef, soybean, palm oil, and timber - the commodities with deforestation risk - are considered the “big four” of forest-risk commodities. Due to the complexity of global production and trade systems there are commodities that possess the risk of originating from deforested areas without being direct deforestation/forest degradation drivers. This dimension of the risk is either overlooked or held as secondary in the debates about commodity-driven deforestation. Differentiation between commodities with direct causal links and those with the exposure to deforestation in their supply chain has impact on how responsibility and accountability is constructed both through legal measures and self-regulatory voluntary standards. Better conceptualization is needed to approximate the usage of the terms both in grey and academic literature and to achieve science backed policy decisions. By referring to the case of bovine leather (hereinafter just leather) and the case of Brazilian leather production we aim to expand the conceptualization of deforestation risk. We focus on leather for multiple reasons. First, while the role of cattle in driving deforestation in Brazil is subject to increasing public scrutiny, the leather commodity chain largely remains in the shadow. Except for a few leading firms in leather goods, public discussion about transparency across the leather supply chain and associated deforestation risk is mostly absent. Second, leather supply chains are more complex compared to beef and involve many national and international players, including intermediary sellers, tanneries, fashion houses, etc. This creates traceability gaps and complicates identifying deforestation risk along the chain. Third, leather is a commodity with inherently uneven power relations among the actors in the supply chain and with costs and benefits unevenly distributed across the chain. Often considered a waste or by-product to beef meat, actors in the leather supply chain argue to lack important negotiation power to impose their standards and no deforestation conditions upon producers. At the same time, downstream actors of leather supply chain, such as fashion brands, are more susceptible to reputational risks compared to that of beef. While upstream farmers lack resources to adhere to sustainability standards and hardly get any financial compensation for the skin of their cattle, finished leather products are often regarded as luxury products presenting very high price margins for producing/trading brands.
This research employs both primary and secondary data. Primary data is mostly qualitative and entails thirty-nine semi-structured, recorded, and transcribed interviews, in the form of both face-to-face and video call interviews conducted during extended field visit to Brazil in May-August 2018. This data is mainly used for the discourse analysis in the second chapter and for interpretative and contextual purposes to analyse the secondary quantitative data in the other chapters. Secondary information consists of extensive literature review, statistical data on annual slaughter, bovine hide/leather registry and annual deforestation, geospatial data on

14
deforestation, slaughterhouse and tannery locations, as well as, trade statistics on Brazilian-Italian leather trade. No specific time frame was chosen to analyse the data and time series for each data set were selected according to availability and the specific requirements of each type of analysis.
The results show that bovine leather supply chains possess significant risk of embedded deforestation despite leather not being a primary product of cattle ranching and driver of deforestation. The risk reveals itself in the link with cattle ranching, incomplete supply chain traceability, as well as in interstate and international leather trade. The Brazilian-Italian bovine leather has significant level of embedded deforestation due to intensive trade relations. Different discourses articulate deforestation risk of bovine leather differently and highlight how the storylines of each discourse bring attention both to what is made visible and invisible in relation to sustainability, legitimacy, and fairness. The results emphasise the importance of the role and voice of frontier settlers, by presenting how their storylines inform a political discourse on livelihoods. There is a need for increased public scrutiny of supply chains, including the leather one, and for special attention to unequal power relations and the importance of meaningful inclusion of vulnerable groups and populations. The leather industry and big brands need to be more proactive by sending clear market signals that deforestation and other illegalities are not tolerated. Full coverage and traceability of the supply chain and engagement with the producers is necessary if the industry wants to produce and trade deforestation-free products.

15
Sommario
La produzione agricola industriale su larga scala e il commercio di prodotti sono sempre più connessi a fenomeni di deforestazione e degradazione delle foreste tropicali. Tale fenomeno è descritto tramite il concetto di ‘rischio di deforestazione’ o forest-risk. I prodotti agricoli i cui processi produttivi implicano deforestazione e rimozione della vegetazione autoctona, sono classificati beni a rischio deforestazione (forest risk commodities). Carne bovina, soia, olio di palma e legname – i beni a rischio deforestazione – sono considerati ‘i grandi 4’ tra le forest-risk commodities. A causa della complessità dei sistemi globali di produzione e commercio alcuni beni sono indirettamente legati a tale rischio, poiché derivano da aree deforestate senza essere essi stessi causa diretta di deforestazione. Questa dimensione del rischio viene spesso tralasciata e permane un tema secondario nel dibattito sulla deforestazione derivata dalla produzione e il commercio di beni di consumo. La distinzione tra beni con un legame causale diretto con la deforestazione e beni che includono nella propria filiera il rischio di deforestazione incide su come la responsabilità della deforestazione viene attribuita e considerata sia tramite misure legali che tramite standard volontari di auto-regolamentazione. Pertanto risulta necessario sviluppare una concettualizzazione migliore per concordare una terminologia da utilizzare sia nella letteratura accademica che in quella informale e raggiungere delle decisioni politiche basate su un approccio scientifico. Nella ricerca effettuata si è voluto espandere la concettualizzazione di deforestation risk facendo riferimento al caso delle pelli bovine (di qui in avanti semplicemente, pelli) e in particolare al caso della produzione di pelli/prodotti di conceria in Brasile. Il focus sulle pelli ha molteplici ragioni. In primo luogo, mentre il ruolo degli allevamenti zootecnici come causa di deforestazione in Brasile è soggetto ad una crescente attenzione da parte dell’opinione pubblica, la filiera di produzione delle pelli rimane ancora inesplorata. Fatta eccezione per poche imprese leader del settore dei prodotti in pelle, il dibattito sulla trasparenza di questa filiera e il rischio di deforestazione ad essa associato è praticamente assente. In secondo luogo, la filiera della pelle è di norma molto più complessa rispetto a quella della carne bovina e coinvolge numerosi attori sia a livello nazionale che internazionale, ivi compresi gli intermediari, le concerie, le case di moda, ecc. Ciò crea delle discontinuità nella tracciabilità della pelle e complica l’identificazione del rischio di deforestazione lungo la filiera. Infine, la pelle è un bene che per propria stessa natura è legato a rapporti di forza squilibrati tra gli attori della filiera. Una terza ragione per la scelta del settore della pelle è data dal fatto che, poiché la pelle è spesso considerata un prodotto di scarto secondario della carne bovina, ne consegue che gli attori coinvolti nella filiera sostengono di avere uno scarso potere di negoziazione per imporre i loro standard e delle condizioni di non-deforestazione ai produttori. Al contempo, gli attori a valle della filiera, come le case di moda, sono maggiormente esposti a rischi di natura reputazionale rispetto alle imprese del settore della carne. In conseguenza di tale situazione vi è il fatto che la pelle è un bene con costi e benefici distribuiti in maniera asimmetrica all’interno della filiera. Mentre a monte gli allevatori mancano delle risorse per rispettare standard di sostenibilità e spesso non beneficiano di nessuna compensazione economica per il pellame dei propri bovini, i prodotti finiti in pelle sono visti come beni di lusso, con elevati margini di guadagno per le aziende che li producono e commerciano.

16
Questa ricerca impiega sia dati primari che secondari. I dati primari sono principalmente di tipo qualitativo e derivano da trentanove interviste semi-strutturate e audio-registrate condotte sotto forma sia di colloqui vis-à-vis che a distanza (video-chiamate) durante una missione in Brasile tra maggio e agosto 2018. Tali dati sono stati utilizzati prevalentemente ai fini dell’analisi del discorso (discourse analysis) presentata nel secondo capitolo e come riferimenti interpretativi e di lettura del contesto per l’analisi dei dati quantitativi secondari presentata nei rimanenti capitoli. I dati e le informazioni secondari sono stati derivati da un’estesa analisi della letteratura e analisi di dati statistici relativi a mattatoi, registri su pelli bovine grezze e semilavorate e processi di deforestazione; sono stati inoltre considerati dati geospaziali relativi alle aree deforestate e alla localizzazione dei mattatoi e delle concerie; da ultimo sono stati considerati dati relativi al commercio di pelli e prodotti derivati tra Brasile e Italia. Nessun intervallo di tempo specifico è stato selezionato a priori per l’analisi dei dati: le serie temporali sono state selezionate a seconda della disponibilità di dati e delle necessità relative alle singole tipologie di analisi impiegate.
Dai risultati emerge che la filiera delle pelli ha un rischio deforestazione significativo nonostante il pellame non sia un prodotto primario dell’allevamento bovino e un fattore diretto di deforestazione. Il rischio si colloca principalmente nel legame con le attività zootecniche e di allevamento, nell’incompleta tracciabilità della filiera così come nel commercio interno e internazionale di pelle. Le pelli prodotte in Brasile e importate per essere successivamente lavorate in Italia incorporano un livello significativo di rischio di deforestazione a causa degli intensi scambi commerciali tra i due Paesi. Il rischio di deforestazione legato alle pelli è affrontato in maniera diversa dai diversi discorsi esistenti sul tema e pone in evidenza come l’articolarsi della trama di ciascun discorso comporti l’attenzione sia su aspetti visibili che invisibili rispetto alla sostenibilità, all’equità e alla legalità delle filiere in questione. I risultati mettono in risalto l’importanza del ruolo e della voce degli agricoltori di frontiera, mostrando come la loro visione e interpretazione informi un discorso politico incentrato sul tema della sopravvivenza e del sostentamento. È quindi necessaria una maggiore attenzione da parte dell’opinione pubblica sulle filiere produttive, ivi comprese quelle delle pelli e dei prodotti derivati, e in particolare sulle relazioni non eque di potere, così come sull’importanza di un’inclusione significativa di gruppi vulnerabili della popolazione. L’industria del pellame e i grandi marchi dovrebbero essere più proattivi, inviando al mercato un chiaro segnale per cui la deforestazione e altre forme di illegalità non possono essere tollerate. Una piena tracciabilità della filiera e il coinvolgimento dei produttori è imprescindibile se l’industria mira a produrre e commerciare prodotti che non siano responsabili di o coinvolti in processi di deforestazione.

17
Only when the last tree has been cut down, the last fish been caught, and the last stream poisoned, will we realize we cannot eat money…
Cree Indian saying
1 Introduction This chapter introduces the research by setting the background, providing the objective and research questions and by explaining the overall research methodology. It also presents the outline and logical structure of the thesis.
1.1 Problem statement and motivation Our world is more connected than ever thanks to the global trade in goods, services, technology, as well as flows of investment, people, and information. One of the promises of globalization was efficiency in the use of human and natural resources: countries and regions with favourable conditions would specialize in certain production types and later would trade those products with the rest of the world. Despite the benefits, globalization has also led to careless consumerist culture in both developed and developing countries. Human rights violations in the form of low wages, child labour, slavery, violence against local communities, environmental activists, and natural resource exploitation in the form of deforestation, wildlife trafficking, biodiversity loss, air and water contamination became “externalities” not accounted for in cheap prices of consumer products (Temper et al., 2018, Crane et al., 2019; Githiru & Njambuya, 2019).
By focusing on market-driven deforestation in Brazilian Amazonian rainforests, this research addresses the ever-increasing global demand for consumer products and questions the role of corporate power in shaping that demand while mostly engaging in denial of responsibility. In 2009 Greenpeace published the report “Slaughtering Amazon” revealing the sector-wide illegalities in Brazil and complicity in deforestation of global cattle-based product supply chains and businesses (Greenpeace, 2009). Ten years have passed since that report was published and yet there is very little improvement on the ground. Instead, cattle grazing has continued pressuring forests and 2019 marked a year with the catastrophic forest fires due to illegal deforestation to make the way for more agricultural development. Having this historical perspective invites deep reflection whether the approaches to fight deforestation have been right but also sufficient and if we are missing out any important element.
In contrast to largely held beliefs, the modern-day Amazonian deforestation can hardly be explained due to human presence in the forests. Studies show that these forests have been socio-economic systems for centuries as we discover more evidences of pre-Columbus human settlements across the biome (de Souza, 2018). Nowadays, indigenous people and traditional riverside dwellers (ribeirinhos) are excellent examples of how nature and humans can co-exist together. The ideology that views these forests as Wild West to be tamed and burned and its people as failed attempts to modernize and civilize is also the one that reinforces the reduction of the value of modern human to mere consumer.
In the last few decades, Brazil has become a major producer and exporter of agriculture commodities such as beef, soy, corn, leather, etc. while aiming to increase its production even further (OECD, 2018). While this economic boom helped the country for a short term, the

18
expansion of soy fields and cattle pasture has become the single biggest driver of deforestation and forest degradation in the country. The natural forests in Amazon and savanna biomes have experienced the biggest impact. If we compare only 1% of deforestation in the Amazon forests in 1970s, nowadays it is 20%. Scientists claim that the continuous deforestation coupled with feedback loop of climate change will exacerbate situation to the point of no return and have catastrophic consequences for the whole planet. This involves a tipping point where the hydrological cycle of the rainforest would be broken, effectively turning the whole Amazon into a dry forest or a savanna type of biome (Lovejoy & Nobre, 2018).
Bovine leather is a product finding itself closely entangled in the debates about Amazonian deforestation thanks to being a by-product of cattle. The exposure to deforestation seems to be embedded in the supply chain of the leather originating from Brazil and is carried to international markets. However, addressing the deforestation risk along the bovine leather supply chain is very challenging due to supply chain and trade complexities, as well as diverse political discourses that frame the risk differently. This requires an analysis that goes beyond trade data estimations and also includes qualitative assessment of the risk and political analysis of responsibility.
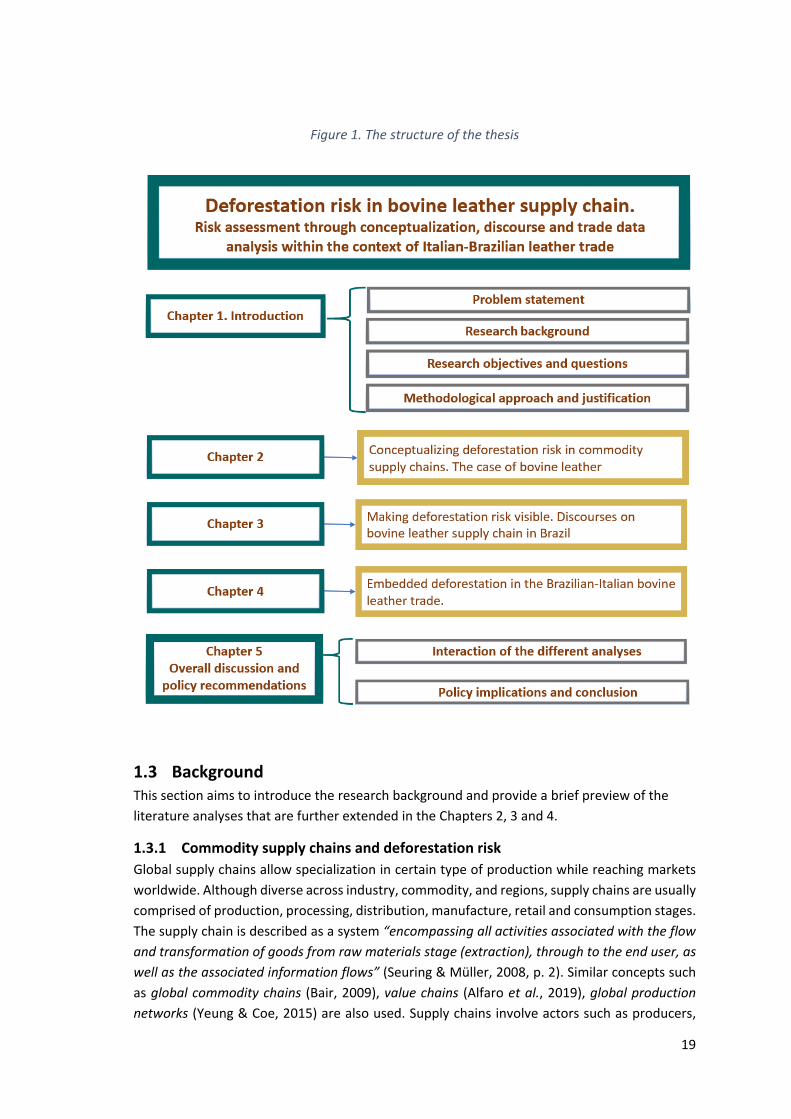
1.2 Structure of the thesis The complexity and multi-faceted character of the research topic necessitated dividing the research itself into three (non-exhaustive) subtopics looking at deforestation risk in bovine leather supply chain through the lenses of (1) conceptualization of the risk, (2) discourse and (3) trade data analysis (Figure 1). Each of these subtopics followed separate methodology and data collection methods that are explained in the respective sub-chapters and are organized in the form of independent publishable manuscripts.
The thesis is organised into six main chapters:
• Chapter 1 introduces the thesis by providing motivations behind the research, setting the background, presenting overall research objectives and questions and explaining the general methodological approach and justification.
• Chapter 2 focuses on the topic of conceptualization of deforestation risk.
• Chapter 3 addresses political discourse analysis on deforestation risk along commodity supply chains.
• Chapter 4 presents a case study of Brazilian-Italian bovine leather trade.
• Chapter 5, discusses the different blocks of analysis in general terms, derives policy recommendations and ends with overall conclusion.
The thesis is complemented by a list of references and additional materials (Annexes).
19
Figure 1. The structure of the thesis
1.3 Background This section aims to introduce the research background and provide a brief preview of the literature analyses that are further extended in the Chapters 2, 3 and 4.
1.3.1 Commodity supply chains and deforestation risk Global supply chains allow specialization in certain type of production while reaching markets worldwide. Although diverse across industry, commodity, and regions, supply chains are usually comprised of production, processing, distribution, manufacture, retail and consumption stages. The supply chain is described as a system “encompassing all activities associated with the flow and transformation of goods from raw materials stage (extraction), through to the end user, as well as the associated information flows” (Seuring & Müller, 2008, p. 2). Similar concepts such as global commodity chains (Bair, 2009), value chains (Alfaro et al., 2019), global production networks (Yeung & Coe, 2015) are also used. Supply chains involve actors such as producers,
20
intermediaries, processors, manufacturers, retailers, importers/exporters, consumers (Lundy et al., 2014; Meijer, 2014). These actors directly involved in the production and commercialization are also referred as direct or market actors (Lundy et al., 2014). Those who are not directly involved and do not run financial risks, and yet can influence the process, both positively and negatively, are referred as indirect actors (i.e. government, civil society, etc.) (Newton et al., 2013; Lundy et al., 2014). According to Seuring & Müller (2008), supply chain management (SCM) is “the integration of the activities through improved supply chain relationships to achieve a sustainable competitive advantage’’ (p. 2). Christopher (2011) defines supply chain management as “the management of upstream and downstream relationships with suppliers and customers to deliver superior customer value at less cost to the supply chain as a whole” (p.3). Sustainable supply chain management is the SCM for achieving sustainability outcomes considering stakeholder requirements on all three dimensions of sustainability, i.e., economic, environmental and social (Koberg & Longoni, 2018). Global supply chain management can run a lot of risks. Generally, in business literature risks are categorized as financial (market), operational, regulatory and reputational (Sherman et al., 2014). In a globalized world, outsourcing company operations overseas significantly increases the probability as well as perception of these risks (Russel, 2009). Risks manifest through disruption of supply chain flows. As a result, supply chain risk and its management has evolved into separate discipline within the business management. Supply chain risk assessment in business literature is described as “risk assessment to analyse the degree of risk associated with each supply chain hazard. The goal of risk assessment is to indicate which areas and activities in the value chain are most susceptible to hazards” (Palaniappan, 2014, p.20). Supply chain risk management (SCRM) strategies aim to “ensure profitability and continuity through cost saving and reduction of vulnerabilities” (Fan & Stevenson, 2017). Although outsourcing can provide certain benefits such as cost reduction, strategic agility, innovation and comparative edge, it also entails dealing with risks linked to internal as well as external environment of the production overseas. Risks internal to the production include, for example, labour and resource availability. The external or macro-risks can be classified as natural and man-made (Ho et al., 2015). Natural environmental risks that businesses are exposed to entail catastrophic nature events such as earthquakes, storms, droughts, floods etc. that can disrupt the continuity of the production. Man-induced natural risks can derive from business/production activities themselves such as increased soil erosion and water shortage as a result of clear-cut deforestation. Both natural and man-induced environmental risks score the highest among perceived risks to business in Global Risk Landscape Report 2019 (World Economic Forum, 2019).
In debates on sustainable supply chain management and corporate social responsibility (CSR), deforestation risk is added to concerns such as human rights violations, health and sanitation issues (Walker et al., 2013). Large-scale industrial agricultural production and commodity trade are increasingly linked to deforestation and forest degradation in the tropics (Gibbs et al., 2010; Henders et al., 2015; Curtis et al., 2018). According to Hosonuma et al. (2012) commercial
21
agriculture was the most important driver of deforestation in Latin America (68%), while in Africa and Asia it contributed to around 35% of deforestation in 2000-2010. Curtis et al. (2018) argue that agricultural commodity production was the single most important driver of deforestation, with an associated 27% of permanent land use change within the period 2001-2015. Beef, soybeans, palm oil, and timber -the commodities whose production or extraction involves deforestation and native vegetation clearing - are considered the “big four” of forest-risk commodities (Walker et al., 2013; Pendrill et al., 2019).
Distance between the deforested lands and markets where the forest-risk commodities are consumed complicates establishment of a firm link between commodity consumption and deforestation. The complex trade systems and supply chains as a result of global transactions make full traceability a challenge. These uncertainties are therefore expressed through the term deforestation risk in commodity supply chains. As deforestation is increasingly linked to commodity production and trade, it also shifts responsibility away from legal protection of forest areas to market parties and consumers (Nepstad et al., 2014; Weatherley-Singh & Gupta, 2018). Businesses and big brands in control of major share of market volume and value are scrutinized and demanded to ensure that their operations are sustainable and are not involved in deforestation and forest degradation. Private sector self-regulatory initiatives and third-party certification systems serve as an attempt to address those risks (van der Ven et al., 2018). This shift of responsibility for global deforestation and forest degradation is not only changing who the actor is but also where it is. Deforestation and land use change are increasingly recognized as the responsibility of the market demand from global North instead of being discarded as solely governance problem of the developing countries (Weatherley-Singh & Gupta, 2018).
Due to the complexity of global production systems there are also commodities that possess the risk of originating from deforested areas without being direct deforestation/forest degradation drivers. Differentiation between commodities with direct causal links and those with the exposure to deforestation in their supply chain has impact on how responsibility and accountability is constructed. The exposure to deforestation risk can happen through three main channels. First, certain commodity production can pose a significant indirect pressure for deforestation and forest degradation through land use change dynamics. The second channel of exposure to deforestation risk happens when forest-risk commodities are used to produce a product or commodity of another category (i.e. soy used as feed for poultry). Another identified channel of deforestation risk exposure is through the supply chains of by-products of the main forest-risk commodities. In this case, the causal link between demand (production) and land conversion does not apply. Chapter 2 explores the conceptualization of deforestation risk along supply chains in much more detail.
1.3.2 Transparency of supply chains, visibility of the deforestation risk and social justice
Sustainable supply chain management is predominantly focused on transparency and traceability of company operations, responsible suppliers, and associated socio-environmental impacts. Over the last decades, transparency has evolved as a key element of environmental governance (Fung et al., 2007; Mol, 2010). Recent studies argue that transparency of supply chains requires mechanisms that incorporate both traceability of commodities across the chain

22
and sustainability conditions of traders and suppliers (Egels-Zandén et al., 2015; Gardner et al., 2018). This is assumed to lead to positive governance outcomes, by enhancing public accountability of businesses to civil society and consumers (Mol, 2015; Koberg & Longoni, 2018), by balancing power asymmetries amongst stakeholders in the supply chain and promoting fairness (Mol, 2010; Gardner et al., 2018), and by reducing negative social and environmental impacts (Mol, 2010; Fung, 2013).
Deforestation risk has become a dimension affecting the design of transparency mechanism of businesses. The 2014 New York Declaration on Forests (NYDF) together with the 2016 Paris Climate Agreement has spurred adoption of public and private forest related commitments. NYDF is an important policy document stressing the shared role and responsibilities of private finance and businesses for achieving deforestation-free economy. So far, 62 public, 60 private and 87 civil society organizations have become signatories of NYDF pledging to at least halve the rate of natural forest loss by 2020 and strive to end it by 2030 (NYDF Assessment Partners, 2019). There are other initiatives that attempt to bring transparency and public accountability over forest related private commitments. Forests 500, Supply Change by Forests Trends, Consumer Goods Forum, Tropical Forest Alliance 2020, CDP Forests Programme, Accountability Framework and Collaboration for Forests and Agriculture (CFA) are the third party or multi-stakeholder initiatives emerging as the result of extended attention on the issue.
The affiliation of businesses involved in these initiatives range from personal care products, foodstuff, furniture to fashion. They also represent different levels of supply chain ranging from producer, trader to retailers. The most recent report by Forest Trends shows that only 72 out 865 companies with exposure to deforestation risk have put forward explicit commitments to clean their supply chain from deforestation either for a single or multiple commodity. In this list consumer facing companies dominate the list, as 42 out of 72 companies (i.e. about 60%) are manufacturers and 24 (33%) are retailers. 30 (42%) of these companies are headquartered in Europe and 17 (24%) in the United States where reputational risk due to civil society and consumer pressure is much higher compared to other markets (Rothrock & Weatherer, 2019). The share of global palm oil production under any kind of deforestation related commitment is much higher compared to other commodities. Individual company commitments cover 65% of palm oil, 11% of soybean, 11% of cattle and 12% of pulp and paper production volume worldwide (Haupt et al., 2018).
However, the 5-year progress report of NYDF states that despite the progress, reducing deforestation and restoring natural forests has not kept pace with the scale of commitments and the need for climate mitigation (NYDF Assessment Partners, 2019). Another recent report by CERES indicates that despite the large-scale commitments by companies to end commodity-driven deforestation by 2020, there are very few of them that are on track and disclose quantitative progress toward achieving this goal (CERES, 2019). The Investor statement on deforestation in the Amazon (endorsed by 230 investors representing approximately US $16.2 trillion in assets) request companies to increase their efforts and demonstrate clear commitment to eliminating deforestation through transparent monitoring systems and public disclosure of information (UNPRI, 2019). These developments create the necessity to re-consider the design of the commitments and associated transparency tools.
23
The assumptions that transparency in sustainable supply chains leads to positive governance invite critique (Mol 2010; Garrett et al., 2016; Gardner et al., 2018; van der Ven et al., 2018). Transparency may result in reverse impacts as information is often produced and controlled by already powerful actors that may use this information to strengthen their position in the supply chain, for example with regard to price bargaining. This adds vulnerability to already vulnerable actors in the chain (Mol, 2010). Local suppliers are usually small or family farmers lacking economic and political power or resources to address structural and systematic causes of unsustainability. “Name & shame” campaigns that subsequently follow revealed information about impacts of the production often negatively affect the livelihoods of the already vulnerable communities (Gardner et al., 2018). Thus, when transparency is used to increase surveillance (Gardner et al., 2018), it can also push the responsibility and associated cost of compliance to those upstream actors that lack substantial resources to either adhere to the standards or to demonstrate sustainable behaviour already in place (Gupta, 2010). In Chapter 3 we explore how certain practices of transparency in the leather supply chain are linked to specific interpretations of fairness, legitimacy and sustainability in governance outcomes. In our results, we show how political discourses on deforestation risk and transparency affect decisions over what is made visible in the supply chain and who is assigned responsibility.
1.3.3 Tracing deforestation risk in trade of commodities In the verge of the ratification of EU-Mercosur Free Trade Agreement the topic of underlying drivers of tropical deforestation in the form of global demand, trade liberalization and grey finance is being revisited. In a letter published on the journal Science more than 600 scientists and 300 Brazilian indigenous groups urge the European Union (EU) to reconsider the trade agreement and put human rights and deforestation above economic gains (Kehoe et al., 2019). The indigenous communities in Brazil and organizations such as Amazon Watch trace the destruction of forests to European and North American companies’ financial flows. They call for EU-led sanctions and boycotts on the Brazilian commodity trade to stop the destruction of the natural ecosystems (Amazon Watch, 2019).
Pendrill et al. (2019) estimate that around 29–39% of deforestation-related emissions, as part of carbon footprint of forest-risk commodities such as beef and oilseeds, are driven by international trade. Sandström et al. (2018) show that land use change embedded in the commodity production in tropical countries is an important contributor to greenhouse gas (GHG) footprints of EU diets. Kanemoto et al. (2013) points out how international trade in commodities undermine national emissions reduction targets due to leakage of the impacts to other countries. In yet another study Pendrill et al. (2019a) discuss the “displaced” deforestation as the countries that were either slowing deforestation rates or even increasing forest cover on their own territories in 2005–2013 (e.g., European countries, China, India, Russia), are also the ones that import most of the products with embedded deforestation from somewhere else. According to the estimates, embedded deforestation equalled about one-third of the net forest gains in these countries.
From being a net food importer in 1970s Brazil has managed to transform itself into producer and net exporter of major agriculture commodities including the forest-risk ones such as beef and soy. The country aims to strengthen its position as a provider of agricultural products by planning on increasing the production and export further by 2030 (OECD/FAO, 2017; IBGE,
24
2018). Currently the deforestation frontier states1 are also among top producers of soy and cattle. Although early research about Amazonian deforestation focuses on the typology of actors at the local level, more recent studies shift the focus towards the role of global markets as main drivers of deforestation (Kaimowitz et al., 2004; Nepstad et al., 2014; Gibbs et al., 2015). By focusing on Brazilian Legal Amazon (BLA) and using standard and spatial econometrics, Faria & Almeida (2015) argue that the increase in openness to trade and increase in deforestation are positively correlated.
Italy ranks the 4th among EU countries that trade with Brazil (Comtrade database). For some forest-risk commodities the country is leading the list. Given its position as a historical trading partner it is worth exploring the risk of deforestation and land use change embedded in this trade and accumulated over time. For that purpose, we focus on leather supply chain as a case study (see 1.3.4. for more details about the link between deforestation risk and leather). As the traditional bovine leather manufacturing country, Italy is importing a large share of bovine skin from Brazil. Given the role of cattle raising in driving deforestation and forest degradation in Brazil, we assume most of that impact is also embedded in the supply chains reaching Italy. The initial assessment and mapping of the deforestation risk in the trade relations between the two countries could create necessary basis for the future studies on quantifying that risk or GHG footprint linked to deforestation. Chapter 4 explores deforestation risk in Brazilian-Italian leather supply chain in more details.
1.3.4 Leather and deforestation risk By referring to the case of leather and focusing on Brazilian leather production we aim to expand the conceptualization of deforestation risk. We focus on leather for multiple reasons. First, while the role of cattle in driving deforestation in Brazil is subject to increasing public scrutiny, the leather commodity chain largely remains in the shadow. Except for a few leading firms in leather goods, public discussion about transparency across the leather supply chain and associated deforestation risk is mostly absent. Second, leather supply chains are more complex compared to beef and involve many national and international players, including intermediary sellers, tanneries, fashion houses, etc. This creates traceability gaps and complicates identifying deforestation risk along the chain. Third, leather is a commodity with inherently uneven power relations among the actors in the supply chain with costs and benefits unevenly distributed across the chain. Often considered a waste or by-product to beef, actors in the leather supply chain argue to lack important negotiation power to impose their standards and no deforestation conditions upon producers. At the same time, downstream actors of leather supply chain such as fashion brands are more susceptible to reputational risks compared to that of beef. While upstream farmers lack resources to adhere to sustainability standards and hardly get any financial compensation for the skin of their cattle, finished leather products are often regarded as luxury products presenting very high price margins for producing/trading brands.
1 The Brazilian states, mainly Pará, Mato Grosso, Rondônia and Amazonas that are in the frontier between natural vegetation cover and agriculture expansion in Cerrado and Amazon biomes. These states experience the highest rates of annual deforestation based on Prodes/INPE data.

25
1.3.4.1 Leather supply chain description The exposure to deforestation risk also manifests itself in incomplete structure, complexities and gaps at different actor levels along the supply chain of leather. Each of these levels needs careful review for understanding the general degree of the risk. For the sake of simplicity, we have divided the supply chain of leather into farm, slaughterhouse, leather tanning and leather manufacturing segments to discuss the deforestation risk. A complete leather supply chain theoretically starts at a farm level that includes direct sourcing and two-level indirect farms. As a rule, cattle grazing process goes through three main stages: breeding/calving, raising and fattening until they are sold to slaughterhouse (Figure 2). Slaughterhouses represent the next level of the supply chain flow of leather. The outputs of the slaughtering process are beef as the main product, and animal hides2, bones, tallow and other parts of the animal as by-products that are sold to other industries for further processing. Tanneries represent the next segment of supply chain flow of leather. Tannery level operations are complex and resource intensive and can be generally categorized as preservation, pre-tanning (salted), tanning (wet-blue), post-tanning (crust) and finishing (finished leather) processes (see 1.4.3.4. for more details of the tanning processes). Leather manufacturing and market distribution is the last segment of supply chain flow before a finished leather product reaches a final consumer (i.e. Italian market). Figure 2 presents a typical bovine leather supply chain based on the Brazilian production model.
2 Raw, unprocessed leather.

26
Figure 2. A typical bovine leather supply chain based on the Brazilian production model
Source: author’s own elaboration

27
1.3.4.2 Leather and applicable legislation The definition of leather and leather derived products can be found in national and international legislations around the world (ITC, 2019). At the European level the most comprehensive definition can be found in the Directive 94/11/EC (2013) On the approximation of the laws, regulations and administrative provisions of the Member States relating to labelling of the materials used in the main components of footwear for sale to the consumer. The law defines leather as:
A general term for hide or skin with its original fibrous structure more or less intact, tanned to be rot-proof. The hair or wool may or may not have been removed. Leather is also made from a hide or skin which has been split into layers or segmented either before or after tanning. However, if the tanned hide or skin is disintegrated mechanically and/or chemically into fibrous particles, small pieces or powders and then, with or without the combination of a binding agent, is made into sheets or other forms, such sheets or forms are not leather. If the leather has a surface coating, however applied, or a glued-on finish, such surface layers must not be thicker than 0,15 mm (…)
Despite the lack of comprehensive legislation covering the whole leather industry at the European level, there are certain laws that are applicable to the industry. These laws are in the field of: a) restricted chemicals - Regulation (EC) No 1907/2006 on the Registration, Evaluation, Authorisation and restriction of Chemical substances (REACH); b) industrial emissions- Directive 2010/75/EU of the European Parliament and of the Council of 24 November 2010 on industrial emissions (integrated pollution prevention and control); c) on animal by-products - Regulation (EC) 1069/2009 and Commission Regulation (EU) 142/2011 on animal by-products and derived products not intended for human consumption (EC, 2019). The applicability of the EU Circular Economy Package is a subject area that is currently explored both by the industry and by the practitioners.
On the other hand, correct labelling of the terms hide, leather and leather products and their differentiation from the materials with other origin has been the main focus of national legislations worldwide. The most prominent ones are Italian, Spanish and French national laws (ITC, 2019). The Italian regulatory regime concerning leather is comprised of Italian Law 1112 of 1966 (Legge 1112: Disciplina dell’uso dei nomi “cuoio” e “pelliccia” e dei termini che ne derivano. 16/12/1966. Gazz.Uff. 27.12.1966, no. 325); Law 8 of 2013 (Legge 8 : Nuovi disposizioni in materia di utilizzo dei termini cuoio, pelle e pellicia e di quelli da essi derivanti o loro sinonimi. 14/02/2013. Gazz.Uff. 14.01.2013) and the most recent article 7 of Law 37 of 2019 (Legge 3/5/2019 No. 37, Disposizioni per l'adempimento degli obblighi derivanti dall'appartenenza dell'Italia all'Unione Europea - Legge Europea 2018). Article 7 of the Law No. 37 repeals the previous laws on leather and requires a new one to be adopted within 12 months. Thus, more changes are yet to come in the legislative framework concerning leather industry in Italy.
The Brazilian Law No. 4888 of December 9, 1965, widely known as the Law on leather (Lei do Couro), reserves the usage of the term “leather” exclusively to the material obtained from animal skin and puts a special focus on curbing the misuse of the term “leather” to describe the materials with other origin (ITC, 2019; CICB, 2019). Mislabelling applies to the cases
28
especially when the term leather is used with diverse suffixes such as synthetic leather, eco-leather, natural leather, green leather, fake leather, and eco leather. Infringement constitutes a crime of unfair competition based on the Article 195 of the Penal Code of the country which establishes the penalty as the detention of the offender from 3 months to 1 year or fine (CICB, 2019). With the increasing availability of alternative materials such as those derived from plastics (polyurethane, polypropylene, polyvinyl), fruits and vegetables (apple, mushroom, pineapple, etc.) or those grown in the laboratory, the European and the US leather industry are constantly pushing for similar elaborations and explicit restrictions in relation to alternative materials in the national and regional legislations as well (Anonymous, 2019).
1.3.4.3 Stages of leather processing Transforming raw animal hides into quality leather is not a simple process. It is an industrial process requiring high level of resource inputs in terms of water, energy and chemicals, as well as expertise and know-how. The quality of the final product highly depends on the treatment of the animals at the farm level (fencing techniques, pest control, i.e. tick management, branding/fire marking, etc.), although multiple tanning processes can cover the defects up to a certain level. Full grain leather is considered of the highest quality, as this kind of finished leather possesses very thin layer of tanning material and other chemicals on the surface. This shows the importance of the farm level impacts for achieving high-quality leather
Once the animal skin (hide) is removed from the flesh at a slaughterhouse it is preserved and sent to a tannery for further processing. Figures 3 and 4 show the flow of upstream (farming and slaughter) and core and downstream processes of the leather preparation. In general, the processes at the tannery level can be oversimplified into preservation, semi-processed leather preparation (mostly, wet-blue) and finished leather processing. Each of these steps have diverse resource input requirements and outputs in terms of product, waste and associated environmental impact.

29
Figure 3. A suggested full cycle and extended system boundaries and considered input and output elements
.
Source: adapted from UNIC, 2017; De Rosa-Giglio, 2018; Buljan & Král, 2019

30
Figure 4. Environmental impact and pollutants linked to core leather processing. BOD - Biochemical Oxygen Demand COD - Chemical Oxygen Demand TDS - Total Dissolved Solids SS -
Suspended Solids
Source: adapted from Buljan & Kráľ, 2019

31
The topic of sustainability in the leather industry is mostly managed through industry standards and voluntary certifications. The major focus of these third-party and industry led initiatives are facility level sustainability issues. The environmental impacts incurred by the leather processing industry at a facility level can be grouped as solid, air and water pollutants. The unpleasant smell around tannery facilities are due to the air emissions such as H2S, NH3 and CH2O at different stages of the processing. The water pollution is the most pressing environmental issue during raw hide preparation and wet-blue stages. If the preservation is handled by salting (application of sodium chloride) the resulting wastewater is heavily saline and cannot be removed by normal treatment or Reverse Osmosis (RO) due to extremely high energy costs (Buljan & Kráľ, 2019). The pollution by chromium tans (Cr3) is most relevant during wet-blue preparation stage that applies trivalent chromium salts to hides to obtain light blue coloured material (Figure 3). The Cr3 emitted in wastewater or solid waste can oxidize in natural environment to create hexavalent chromium (Cr6+) which is a highly toxic chemical, also restricted by REACH. However, the use of chrome tanned leather is different for each sector (Table 1). Taking into consideration that usually preservation and wet-blue stages of leather processing are conducted in developing countries such as India, Bangladesh or Brazil, the applicability of strict environmental management systems – a general constraint in the European Union - is problematic in these countries. The use of diverse chemicals not only pollute water streams and air, they also create diverse health and occupational problems for tannery workers and communities living nearby (Garaj, 2014; Sarwar et al., 2018; Kanagaraj & Elango, 2019). An overview of environmental pollutants of leather processing are provided in the Figure 4 and the UNIDO led study by Buljan & Kráľ (2019) could provide more details of the processes and the associated environmental impacts.
Table 1. Share of chrome (wet-blue), vegetable and chrome-free (wet-white) tanning per end use of leather
End use Chrome-Tanned
Vegetable-Tanned
Free of Chrome (FoC) (wet-white)
Animal Origin
Automotive and upholstery
63% 0% 37% Bovine (100%)
Footwear and leather goods
75% 22% 3% Bovine (66%), Calf (12%),
Caprine (11%), Ovine (11%)
Garments and Gloves
100% 0% 0% Calf (20%), Caprine (16%),
Ovine (64%)
Sole leather 0% 100% 0% Bovine (100%)
Source: De Rosa-Giglio et al., 2018
32
1.3.4.4 Leather and sustainability standards Methodologies for estimating environmental footprint of the leather sector can be grouped in two: product and organization (corporate) environmental footprint methodologies3. Table 2 provides a list of relevant standards, certifications and third-party sustainability initiatives for the leather sector in Italy, Brazil and internationally. In 2018 the EC finalized Product Environmental Footprint Category Rules (PEFCRs) for leather with the aim to provide a reference framework for industries to assess and declare the environmental footprint of finished leather. “PEFCRs are product category-specific, life-cycle-based rules that complement general methodological guidance for Product Environmental Footprint studies by providing further specification at the level of a specific product category” (De Rosa-Giglio et al., p. XV) and are used for preparing Environmental Product Declarations (EPD) or Type III environmental labels. Life cycle approach (LCA) is the base for product footprint estimations and environmental product declarations, taking into consideration environmental impact of a product through “cradle to gate” – in this case from raw material extraction till the tannery gate.
The important point of departure for determination of system boundaries for any kind of LCA or environmental footprint analysis is the classification of hides/leather according to product types. There is a significant disagreement concerning this classification in the available literature. The industry led studies tend to argue that animal hides4 are produced as waste of dairy and meat producing processes. Thus, the treated hides and leather should be referred as recovered waste. In this case all environmental impact (CO2 equivalent content) should be attributed to upstream processes of milk and meat production and allocated between them accordingly based on biophysical allocation (De Rosa-Giglio et al., 2018, p. 64). This argument necessitates looking at definitions of product categories of production processes, namely main, co-, by- and waste products in much more detail. Figure 5 presents the model for understanding significant differences among these categories.
Co-products are production outputs “produced along with the main product and carries equal importance as the main product” and can affect the production volume and demand for production process (De Rosa-Giglio et al., 2018; Business Dictionary, 2019).
By-products are “output other than the principal product(s) of an industrial process, such as sawdust or woodchips generated in processing lumber. Unlike joint-products (co-products), by-
3 Product environmental footprint methodologies are based on two main standards: ISO 14044: Environmental Management: Life Cycle Assessment and ISO 14067: Carbon Footprint of Product, while the main basis for corporate environmental footprint is ISO 14064: Principles and requirements at the organization level for quantification and reporting of greenhouse gas (GHG) emissions and removals. The environment related information of products can be communicated through Type I, II and III environmental labels. Type I ecolabels (voluntary, third-party verified) must conform to ISO 14024, Type II (informative environmental self-declarations) to ISO 14021, and Type III (voluntary programmes providing quantified environmental data of a product based on life cycle assessment) to ISO 14025 standards. Type III labels provide only the information linked to environmental performance of a product without benchmarking. Thus, the availability of Type III label for a product does not necessarily certify its environmental friendliness. Type III labels are mostly presented in the form of Environmental Product Declarations (EPD) (Allison & Carter, 2000). 4 In the case of adult bovine hides, calf, ovine and caprine skins that represent more than 99% of global finished leather production (ICT, 2019).
33
products are undesirable, unplanned and have low value in comparison with the principal product(s) and may be discarded or sold either in their original state, or after further processing” (De Rosa-Giglio et al., 2018).
The Glossary of Environment Statistics by UNStats defines waste products as “materials that are not prime products (that is, products produced for the market) for which the generator has no further use in terms of his/her own purposes of production, transformation or consumption, and of which he/she wants to dispose. Wastes may be generated during the extraction of raw materials, the processing of raw materials into intermediate and final products, the consumption of final products, and other human activities. Residuals recycled or reused at the place of generation are excluded” (UNStats, 2001, p.67).
Going back to the case of animal hides and leather, we can carefully consider each case. Except for exotic animals (i.e. crocodiles) that are farmed primarily for their skin, the hides from livestock are produced as the result of dairy and meat production. Thus, considering animal hides primary/determining product of production would be misguiding. To continue with, co-products are advance-planned production outputs that require no or very little further treatment process. Co-products determine and impact the production volume and demand for raw materials equally or with very little difference in percentage. Taking this as guidance we can argue that the term co-product does not apply in the case of leather either.
A disposal of industrial waste generates an economic cost for a producer. Quite in opposite, hides just like any other additional parts of an animal comprise a potential marginal profit for a slaughterhouse. In any well-established industrial process hides are sold to tanneries or intermediary actors, even at very low prices. As the definitions suggest, once there is a possibility to recover, treat, add value and use as raw material for other production processes, any undesirable outputs of production processes are classified as by-products. Animal hides and leather has been historically re-purposed by humans for different applications and annually only very small portion of produced hides is discarded as waste. Thus, the term by-product applies to the case of animal hides and leather. In fact, with increasing attention on circular economy and EU-led support for industrial symbiosis5 the term “waste” loses its importance as all the outputs of circular production processes are expected to be reused and recycled either internally or by other industries (EC, 2019). The argument is also reinforced by EC experts and the PEFCR Guidance 6.3 that refused to agree on “zero allocation rules” or to consider any product with economic value as waste (De Rosa-Giglio et al., 2018, p.8; UNIC, 2017, p. 34).
5 Industrial symbiosis is the process by which wastes, or by-products of an industry or industrial process become the raw materials for another. Application of this concept allows materials to be used in a more sustainable way and contributes to the creation of a circular economy (EC, 2019).

34
Figure 5. Model for describing typical production processes and type of outputs/products
Source: Author’s own elaboration
Figure 6. Semi-processed leather at wet-blue stage
Source: Author’s visit to a tannery in Mato Grosso do Sul state of Brazil, July 2018.

35
Table 2. List of relevant Italian (in white), Brazilian (in blue) and international (in yellow) sustainability standards, certifications and initiatives in the leather sector, per key-
sustainability-dimension addressed
Source: ICEC, 2019; LWG, 2019; RLRT, 2019.
36
Attributing hides and leather to different categories should be approached as a process with multiple implications that goes beyond a mere technical task. First (as discourse framing devices) categories are “…neither innocent nor passive, they are both ‘models of’ prior thought and ‘models for’ subsequent action” (Yanow, 2008; van Bommel et al., 2014). Studies by Schön (1993 and 1979), van Hulst (2008) and Yanow (2013) show how categories and classifications construct reality and influence how the world is understood and studied: how they help to highlight certain features, “blind” us to others, with important power implications as the result. Without going into details of politics of category making process itself, we can focus on assignment of products, in our case hide and leather, to a certain category. The long-lasting struggle of the leather industry to define leather as waste and codify it as such in important policy documents is not in vain but essential for reputation management, denial of important upstream sustainability risks and having regulatory justification for doing so. For the well-established industry with good network and lobbying power it is much more cost-effective and safer to invest in influencing and direct participation in policy and standard making than in risk management upstream. Classification as waste also helps to fit leather into the narrative of circular economy and harvest the benefits of the marketing strategy: “Even before its production processes begin, the tanning industry is, by definition, sustainable. Because it vastly reduces the amount of waste that needs disposing, thereby reducing the impact on the environment” (UNIC, 2017).
The politics of categorization is understood better when its implications for defining system boundaries for LCA or any other environmental footprint methodologies is explained. Leather as waste product would mean assigning all environmental impact to dairy and meat production (thus, zero allocation for leather production) as an extreme case or starting system boundaries for LCA analysis from slaughterhouse as a point where animal hide is “produced” for the first time. In the second case the leather industry would be responsible for environmental impact only of the core - leather treatment and tanning - processes till finished leather is produced and passed on to manufacturing industries where different leather products are produced (Figure 2). In this scenario, leather is considered as an intermediate product and the end boundary of the system is a tannery gate.
Despite the strong opposition by the industry, the final version of PEFCR for leather set the start of system boundary for LCA analysis at the farm/breeding instead of at the slaughterhouse level taking “cradle to tannery gate” approach and considering the following life cycle stages: a) Animal farming (upstream process); b) Slaughtering process (upstream process); c) Tanning (core process) (De Rosa-Giglio et al., 2018, p.8; UNIC, 2017, p. 34). However, despite the progressive move on system boundaries, the allocation of environmental impacts to animal hides by the study is quite small. The study allocates 88% of livestock’s CO2 to dairy and 12% to meat production. 3.5% out of 12% was allocated to hide, meaning that only 0.44% of farm level upstream impacts is allocated to leather production (De Rosa-Giglio et al., 2018; Anonymous, 2019a). The environmental impact categories and their indicators applicable to the farm level are diverse ranging from freshwater eutrophication to ozone depletion. Land use – an impact category that is most relevant for the purpose of this study – is one out of 16 impact categories, meaning its share within 0.44% is quite insignificant.
37
1.4 Objectives and research questions Based on the above-mentioned problem statement and background information this research aims to explore conceptualization and assessment of deforestation risk along commodity supply chains, with special reference to the leather supply chain. Moreover, it explores political analysis of transparency and responsibility, as well as assesses the utility of trade data for the analysis of embedded deforestation along commodity supply chains. The research aims to close certain conceptual gaps in the literature and to provide policy relevant analysis of responsibility, accountability and elements of sustainable supply chains.
The research questions that guide the analysis in the following chapters are:
• Chapter 2: How is deforestation linked to commodity supply chains?
o How deforestation risk can be conceptualized and assessed along leather supply chain?
• Chapter 3: How is deforestation risk made transparent and monitored?
o How different discourses articulate transparency over deforestation risk of bovine leather in relation to sustainability, legitimacy, and fairness?
• Chapter 4: How can trade data be used to study the role of a commodity in deforestation?
o What is the extend of deforestation risk revealed through Brazilian-Italian leather trade data analysis?
1.5 Methodological choices and justification This section aims to present the scope of the analysis and logic for certain conceptual and methodological choices.
1.5.1 Guiding definitions of forests and deforestation The United Nations Food and Agriculture Organization (FAO) defines forest as an area of > 0.5 ha, with >10% tree canopy cover, and with “trees” capable of growing >5 m tall (FAO, 2001). It also differentiates between closed (> 40 % canopy cover) and open (10-40 % canopy cover). The definition adopted by the Framework Convention on Climate Change (UNFCCC) is similar: a minimum area of 0.05 -1.0 ha, tree crown cover 10-30%, and the minimum height of a tree 2-5 m (UNFCC, 2002). Individual countries can choose along this range for the definition of forest most suitable for their own landscape and forest policies. The FAO definition is widely used by national governments to estimate the forest cover on their territories. These estimations create basis for FAO’s Forest Resources Assessment (FRA), a study produced on 5-year intervals on the state of world forests. Developing countries participating in REDD+6 also use this definition to
6 Reducing Emissions from Deforestation and forest Degradation (REDD+) is a mechanism developed by Parties to the United Nations Framework Convention on Climate Change. It creates a financial value for the carbon stored in forests by offering incentives for developing countries to reduce emissions from forested lands and invest in low-carbon paths to sustainable development (UN REDD Programme, 2019).
38
guide estimations on a national forest Reference Emission Level (REL) for their national monitoring system.
The importance of proper conceptualization around forests and forest-derived terms (i.e. deforestation, forest degradation, reforestation, etc.) for conservation, sustainable forest management, livelihoods, as well as climate mitigation policies has been long discussed (Sasaki & Putz, 2009; Noordwijk & Minang, 2009; Putz & Redford, 2010; Romijn et al., 2013; Chazdon et al., 2016). The definition of forest that is currently in use has received significant criticism: a) for not differentiating natural or old-growth forests from plantations (Sasaki & Putz, 2009); b) for disregarding certain level forest degradation - the changes in the quality of the forests and consequently the provided ecosystem services (Noordwijk & Minang, 2009; Chazdon et al., 2016); c) for allowing non-forest areas with high ecological value to be afforested for carbon mitigation strategies (Putz & Redford, 2010; Romijn et al., 2013); and d) for accepting “zero net forest loss” by allowing old growth forests to be clear-cut and replaced by commercial tree species (Putz & Redford, 2010; Brown & Zarin, 2013). Despite being aware of these challenges and criticism, we decided to adopt the FAO definition of forest as given, due to its still wide-spread usage and different focus of this research.
Without getting in details of defining deforestation, we take clear-cut of natural and old-growth forests as the basis. In our study we also adopt the land-use perspective and look at deforestation as clearance of forest cover for non-forest land uses. Clear cut deforestation is also the one that Brazil’s National Institute for Space Research Brazilian (INPE) is monitoring under PRODES (Program to Calculate Deforestation in the Amazon, Programa de Cálculo do Desflorestamento da Amazônia) since 1988. PRODES uses satellite imagery from Landsat 5, 7 and 8, CBERS-2, CBERS-2B, Resourcesat-1, and UK2-DMC integrated with direct field observations. Its estimates are upgraded on an annual basis and with a monitoring year from August 1 to July 31 to better coordinate with the dry season when most of the deforestation happens in the region and also to avoid low image quality due to cloud coverage. PRODES focuses only on the Brazilian Legal Amazon and should not be confused with national level deforestation estimates that are including also biomes such as Cerrado (tropical savanna) and the Atlantic forests. The system can identify patches of loss only over 6.25 hectares (INPE, 2019).
PRODES estimates of deforestation form the basis for Brazilian government’s policies on deforestation and serve as a useful and reliable tool for scientists and civil society to discuss Amazonian deforestation. Our discussion on deforestation risk on leather supply chains also relies on PRODES estimates.
Besides PRODES, Brazilian government has also established the system DETER (Real time deforestation detection, Detecção de Desmatamento em Tempo Real) that issues monthly near real-time deforestation/forest degradation alerts, and TerraClass for the monitoring of the increase and loss of secondary forests and other land uses. There are also number of independent third-party and international deforestation monitoring systems such as SAD (Deforestation Alert System, Sistema de Alerta de Deforestation) issuing monthly deforestation alerts and monitored by Amazon Institute of People and the Environment (Imazon, Instituto do Homem e Meio Ambiente da Amazônia).

39
1.5.2 The choice of Brazilian Legal Amazon (BLA) as a scope The administrative unit of Brazilian Legal Amazon was established by Federal Law No. 5173 (Art. 2). It is an administrative region that covers 61% (5,217,423 km²) of the Brazilian territory and includes the whole of the Brazilian Amazon biome as well as 20% of the Cerrado (tropical savannah) and parts of Pantanal (tropical wetland). It contains the states of Acre (AC), Amapá (AP), Amazonas (AM), Mato Grosso (MT), Pará (PA), Rondônia (RO), Roraima (RR) and Tocantins (TO) and part of the Estate of Maranhão (MA) (Figure 7). Established in 1953, BLA aims at promoting the sustainable development and integration of the region. The choice of BLA as the geographical scope of this study followed several rationales:
1) Most of the Brazil’s remaining natural forest systems are within the borders of BLA and the region is of highest priority in terms of carbon stocks (INPE/PRODES, 2019);
2) The region is heavily affected by agriculture, especially by cattle driven deforestation (Bowman et al., 2012; Barreto et al., 2017);
3) Besides the environmental impacts, deforestation and forest degradation are very detrimental for the indigenous and traditional communities clustered mainly in this region (Cabral et al., 2018; FUNAI, 2019);
4) Data on deforestation by the National Institute for Space Research (INPE), that monitors the deforestation since 1988 through its PRODES (Legal Amazon Deforestation Monitoring Project) is confined to the BLA borders. These are the deforestation estimates that are used in this research as well (INPE/PRODES, 2019).
Figure 7. Brazilian Legal Amazon (in blue) and administrative borders of the states of Brazil
Source: Author’s own elaboration based on LAPIG (2017).
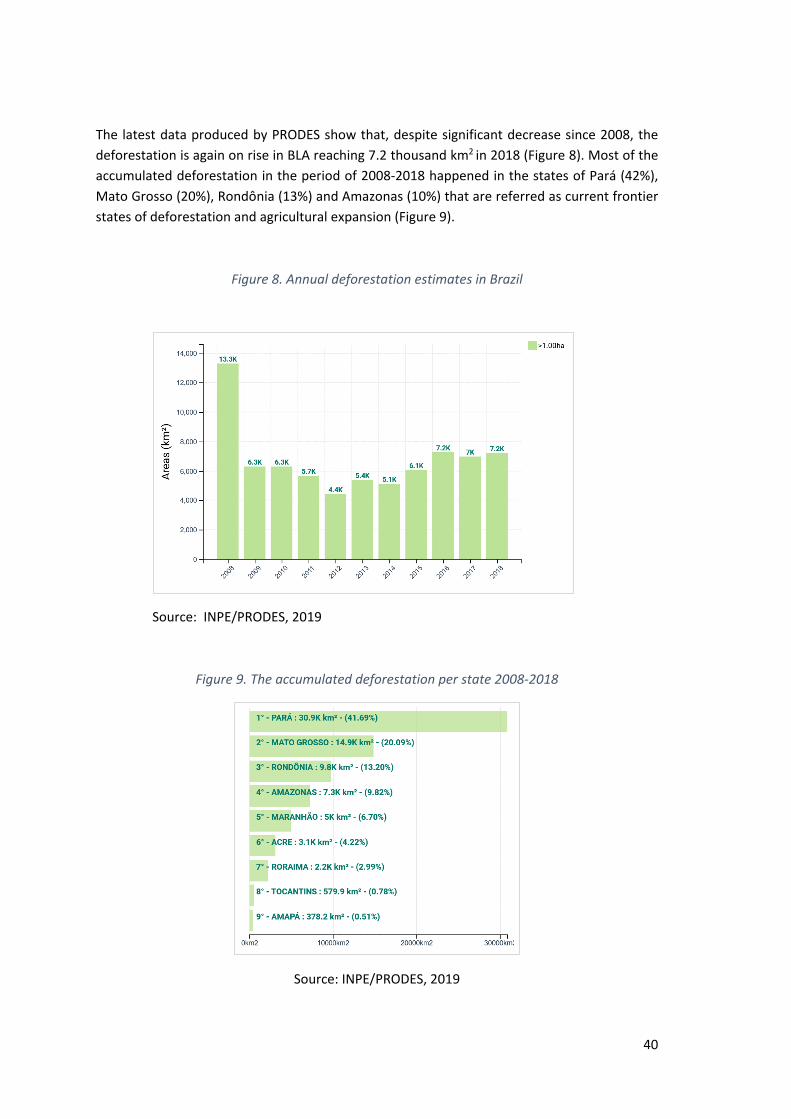
40
The latest data produced by PRODES show that, despite significant decrease since 2008, the deforestation is again on rise in BLA reaching 7.2 thousand km2 in 2018 (Figure 8). Most of the accumulated deforestation in the period of 2008-2018 happened in the states of Pará (42%), Mato Grosso (20%), Rondônia (13%) and Amazonas (10%) that are referred as current frontier states of deforestation and agricultural expansion (Figure 9).
Figure 8. Annual deforestation estimates in Brazil
Source: INPE/PRODES, 2019
Figure 9. The accumulated deforestation per state 2008-2018
Source: INPE/PRODES, 2019

41
1.5.3 The choice of Brazil and Italy as case countries The role of Brazil as an important cattle producer and the link of leather to cattle is already briefly explained in the previous sections and it will further be explored in the following chapters. Italy holds major share of Brazilian bovine leather exports for consecutive years and ranks as the number second importer after China (both in terms of value and net weight of the commodity) (Comtrade database). Most of the Italian imports of Brazilian leather are in the form of semi-processed (i.e. wet-blue) which can be declared as leather Made in Italy after certain final processing conducted in Italy, according to the Italian Standard UNI 11239 (ICEC, 2019). 71% of the raw material used by the Italian tanneries are adult bovine hides. Chapter 4 explores the Italian leather industry in more details.
1.5.4 Social science approach and deforestation risk assessment By taking the technical understanding of supply chain risk assessment as a starting point and applying it to the case of deforestation risk, we focused mostly on qualitative analysis with the purpose of proper conceptualization of the risk, identifying political discourses around it and mapping it through supply chain in the example of Brazilian-Italian leather trade. For that purpose, we used conceptual framework building, political discourse analysis and trade data analysis as study approach. Detailed description of the methodologies, as well as corresponding data collection and analysis methods are described in each of the following three chapters that deal with different blocks of the overall analysis. In general, the research employs both qualitative (i.e. stakeholder interviews) and quantitative data (i.e. trade data, geospatial data, etc.).
Throughout the research process we also explored some other methodologies with the aim of discussing upstream environmental impacts of leather supply chain and understanding responsibility over those impacts. These methodologies are: product environmental footprinting and LCA analysis and deforestation and associated carbon footprinting methodologies. The following sections provide more details about the methodological choices.
1.5.4.1 Product environmental footprinting and LCA analysis The close examination of existent environmental footprint methodologies and LCA studies for leather helped to conclude that the inherent limitations of the approaches and involved politics do not allow room for discussion about deforestation footprint of leather as a product/commodity. First, land use impact category, that is more relevant to discuss the topic of deforestation, only estimates land demand for crop, in our case for feed production. This can be easily traced in the description of land use category in the database inventories (secondary data) that are used for calculating upstream environmental impacts (Agri Footprint, 2019). The direct demand for land for cattle rearing, thus the related deforestation is not being considered. Second, the standard making and modelling processes as any other decision-making processes are not free from politics and power implications. The close examination of the authorship of very few publicly available and repeatedly cited LCA studies in the leather sector show the industry affiliation of the authors either in the form of direct employment or long-term collaboration as independent consultants (Buljan & Kráľ, 2019, p.139). Even the most

42
progressive study among them, the EC led PEFCR 2018 was drafted mostly by industry organizations. The public consultation process involved only one non-governmental organizations (NGO) representative in the initial stage that was later replaced by some other experts. Thus, taking the provided LCA standards and proposed boundaries as an objective tool to discuss upstream impact of leather is not considered fit for the purpose of this research. More reflection on the adoption processes of these standards is needed for the sake of awareness about corporate power in environmental governance (Clapp & Fuchs, 2009; Toohey, 2013).
1.5.4.2 Deforestation and associated carbon footprinting methodologies The research group affiliated with the Stockholm Environment Institute (SEI) that address embedded deforestation in EU commodity trade in their studies suggests several approaches for that purpose: Persson et. al. (2014) offer a method for calculating a land-use change carbon footprint (LUC-CFP) for agricultural commodities. Kastner et al. (2011) suggest a physical trade (PT) model based on bilateral trade data. In their latest research Pendrill et al. (2019) combine all the previous research under “pan-tropical quantification of carbon emissions from deforestation associated with the expansion of agriculture and forest plantations, and trace embodied emissions through global supply chains to consumers”. The decision against using a similar footprinting methodologies for the case of leather was based on several factors: a) these models are too complex and mostly suitable for major forest-risk commodities, rather than by-products; b) leather trade and supply chain is much more complex in comparison to beef with associated data inconsistencies; c) allocation of carbon footprinting in these methodologies is based on the assumption that the land use change happens to produce the products with the primary purposes, which is not the case with bovine leather.

43
2 Conceptualizing deforestation risk in commodity supply chains. The case of bovine leather7
The Intergovernmental Panel on Climate Change (IPCC) calls for urgent actions to avoid catastrophic consequences of climate change and its latest report points out to sustainable land use as a critical area where these actions should be directed (IPCC, 2018 and 2019). The IPCC special report published in 2019 indicates that around 70% of the planet’s ice-free land surface is in use by humans and that Agriculture, Forestry and Other Land Use (AFOLU) is responsible for 23% of total net anthropogenic emissions of GHG8 for the period 2007-2016. Majority of these emissions result from transformation of vast territories to croplands and pastures following deforestation and forest degradation especially in tropical countries. According to the United Nations Framework Convention on Climate Change (2018) on average deforestation alone accounts for around 15-20% of anthropogenic GHG emissions and the risk of further deforestation is leading to the risk of further global warming. Besides, deforestation risk also leads to the risk of habitat and biodiversity loss, soil erosion, reduced water availability, disaster vulnerability, loss of livelihoods, etc. (Lin et al., 2014; Di Lallo et al., 2017; Ordway et al., 2017; IPBES, 2019).
The surge in forest fires in August-September 2019 across tropical forest countries brought the topic of agriculture driven deforestation to headlines one more time (NASA Earth Observatory, 2019; Mackintosh, 2019; Mammadova & Vasconcelos, 2019). Gibbs et al. (2010) estimate that between 1980 and 2000 more than 55% of new agricultural land came at the expense of intact forests. As already mentioned before, according to Hosonuma et al. (2012) commercial agriculture was the most important driver of deforestation in Latin America (68%), while in Africa and Asia it contributed to around 35% of deforestation in 2000-2010. Curtis et al. (2018) argue that agricultural commodity production was the single most important driver of deforestation, with an associated 27% of permanent land use change within the period 2001-2015. The global demand and production of certain commodities such as beef, palm oil, soybean, timber, coffee, cacao, etc. have the most devastating impacts as they are increasingly referred as forest-risk commodities (Henders et al., 2015; Pendrill et al., 2019). Although the production of these key commodities is recognized as an important driver of deforestation in the tropics in general, their role varies according to region and period of time (Rudel et al., 2009; Boucher et al., 2011). Besides, distance between the deforested lands and markets where the forest-risk commodities are consumed complicate establishment of a firm link between commodity consumption and deforestation. The complex trade systems and supply chains9 as a result of global transactions make full traceability a challenge. These uncertainties are therefore expressed through the term deforestation risk in commodity supply chains.
As deforestation is increasingly linked to commodity production and trade, it also shifts responsibility away from legal protection of forest areas to market parties and consumers
7 Mammadova A., Sartorato C. S. F., Behagel J., Masiero M., Pettenella D. M. (to be submitted to Forest Policy and Economics). Conceptualizing deforestation risk in commodity supply chains. The case of bovine leather. 8 13% of CO2, 44% of methane (CH4), and 82% of nitrous oxide (N2O) (IPCC, 2019), 9 Although diverse across industry, commodity, and regions, supply chains are usually comprised of production, processing, distribution, manufacture, retail and consumption stages.

44
(Nepstad et al., 2014; Weatherley-Singh & Gupta, 2018). Businesses and big brands in control of major share of market volume and value are scrutinized and demanded to ensure that their operations are sustainable and are not involved in deforestation and forest degradation. Private sector self-regulatory initiatives and third-party certification systems serve as an attempt to address those risks (van der Ven et al., 2018). As the risk of deforestation leads to financial, operational, legal and reputational implications it is increasingly internalized by the businesses: supply chain risk management (SCRM) strategies are used to identify, map, assess and manage it along supply chains. Deforestation risk in business is defined “…as the volatility of returns that could generate unexpected losses or profits associated with direct and indirect impacts from deforestation” (Ceres, 2018). Carbon Disclosure project estimates that “at least US$906 billion in revenue is at risk because of deforestation” and that “addressing deforestation is key to business success” (CDP, 2016).
This shift of responsibility for global deforestation and forest degradation is not only changing who the actor is but also where it is. Deforestation and land use change are increasingly recognized as the responsibility of the market demand from global North instead of being discarded as solely governance problem of the developing countries (Weatherley-Singh & Gupta, 2018). The EU’s Forest Law Enforcement, Governance and Trade (FLEGT) Action plan (2003) or Roadmap to step up EU action to combat deforestation and forest degradation (2019) can serve as example for gradual acknowledgement of the role of developed country markets over the fate of tropical forests at the political level.10 The most recent calls by European civil society organizations and scientists to halt negotiations over EU-Mercosur Free Trade Agreement is yet another example of the shift of consciousness over responsibility (FERN, 2019; Kehoe et al., 2019). In this regard, new policies are evolving towards territorial, jurisdictional and landscape approaches to include global socio-economic drivers and diverse dynamics of land use change. Due to the complexity of global production systems there are also commodities that possess the risk of originating from deforested areas without being direct deforestation/forest degradation drivers. This dimension of the risk is either overlooked or held as secondary in the debates about market driven deforestation. Differentiation between commodities with direct causal links and those with the exposure to deforestation in their supply chain has impact on how responsibility and accountability is constructed both through legal measures and self-regulatory voluntary standards. Better conceptualization is needed to approximate the usage of the terms both in grey and academic literature and to achieve science backed policy decisions. By referring to the case of leather and focusing on Brazilian leather production we aim to expand the conceptualization of deforestation risk. The conceptual framework based on extensive literature review and analysis of different concepts is presented in the Section 2 of this chapter. Aimed to identify and differentiate commodities with and without causal links to deforestation, the framework also helps to locate leather in relation to other commodities and discuss its exposure to deforestation risk in much more detail. By presenting different dimensions on the concept of deforestation risk the framework helps to discuss each one of these dimensions within the example of leather.
As already mentioned, to discuss the concept of deforestation risk this research employs primary and secondary data. Primary data is mostly qualitative, in the form of face-to-face
10 See the Section 2 for more discussion on the EC led studies on embodied deforestation

45
interviews and observation notes, collected by the first author during extended field visit to Brazil in May-August 2018. This data is used for interpretative and contextual purposes and for filling gaps found in publicly available information, mainly on the structure and transactions of a typical leather supply chain. Secondary data consists of extensive literature review, statistical data on annual slaughter, bovine hide/leather registry and annual deforestation, as well as geospatial data on deforestation, slaughterhouse and tannery locations.
Statistical data on annual slaughter is obtained from SIDRA, the publicly available database of the Brazilian Institute of Geography and Statistics (IBGE). This data is collected directly from slaughterhouses that operate under different inspection systems, on a quarterly basis through Trimestral Research on Animal Slaughter (Pesquisa Trimestral do Abate de Animais). The main source for leather production data is the Trimestral Research on Leather (Pesquisa Trimestral do Couro) by SIDRA. The survey is based on the units of bovine hide received and reported directly by tanneries. Data on leather production is further enriched by information provided by the Centre for the Brazilian Tanning Industry (CICB).
Data on deforestation were collected from the National Institute for Space Research (INPE), which monitors the rate of deforestation within the BLA since 1988 through its PRODES (Legal Amazon Deforestation Monitoring Project). PRODES detects deforestation by clear-cut area totalling at least 6.25 ha (INPE, 2013, p. 5) and the same threshold has been adopted to define deforestation within this study. Both annual deforestation estimates and geospatial information are used to compare deforestation trends with other variables and to infer on the deforestation surrounding slaughterhouses and tanneries location (see Annex 1 and 2 for more information). Data within the period of 2005-2016 is used for geospatial analysis for identifying deforestation risk surrounding slaughterhouses and tanneries. Besides these main data sources, the research also employs data by MapBiomas on Area (hectares) coverage and land use data by biome, state and municipality from 1985 to 2017, tannery location and specialization data by the Brazilian Leather Guide (Guia Brasiliero do Couro), daily market prices of cattle provided by the Centre for Advanced Studies in Applied Economics (Centro de Estudos Avançados em Economia Aplicada, CEPEA), and initiative by the College of Agriculture of the University of São Paulo (Escola Superior de Agricultura "Luiz de Queiroz", ESALQ). The next sections are organised as follows: the second section discusses the concept of deforestation risk and other related terms as a basis for the conceptual framework; the third section presents results for conceptualizing deforestation risk of leather; and finally, the fifth section draws on discussion and the sixth on conclusions.
2.1 Conceptualization of deforestation risk along supply chains With increased attention on environmental and social impacts of commodity production, deforestation risk is explored in relation to commodity supply chains. This risk is most prevalent in the raw material production stage of supply chains and travels all the way till the end consumers. In this context, the source of the risk is the production and business operations linked to certain commodities and the subject of the risk is the area with original forest cover. While exploring this dimension of deforestation risk, existing literature employs other related concepts such as forest-risk commodity, commodity-driven deforestation and embodied

46
deforestation, etc. largely used in the literature (Ordway et al., 2017; Umunay et al., 2018; Weatherley-Singh & Gupta, 2018).
As a rule, the existing literature tends to estimate the risk of deforestation in the area through GIS modelling by using spatial data on forest cover and land use changes. The concept is mainly described as the exposure potential of an area to further deforestation and forest degradation based on previous patterns and diverse natural and man-made drivers. These studies include various variables to estimate the deforestation risk such as accessibility, vulnerability, pressure, etc., some examples of which are provided in Table 3 (Lin et al., 2014; Di Lallo et al., 2017; Ordway et al., 2017).
The concept forest-risk commodity helps to link deforestation to a handful of products whose global demand is driving large share of deforestation. The concept brings global consumption patterns to forefront and contributes to the debates of shifting the responsibility for tropical deforestation towards global North. The term was first mentioned in Rautner et al. (2013) and defined as:” …globally traded goods and raw materials that originate from tropical forest ecosystems, either directly from within forest areas, or from areas previously under forest cover, whose extraction or production contributes significantly to global tropical deforestation and degradation” (Rautner et al., 2013, p. 15).
Within this context, commodity-driven deforestation can be defined as an impact that forest-risk commodities have on the area with deforestation risk. The assessment of the deforestation driven by big forest-risk commodities has been attempted in several studies and through different tools. Global Forest Watch Commodities matches geospatial data over forest change, land cover and land use to estimate the deforestation driven by major commodity productions (GFW, 2019). The TRASE initiative follows the methodology suggested by Godar et al. (2015) - Spatially Explicit Information on Production to Consumption Systems (SEI-PCS) - that connects the sub-national location of production (municipality level) to consumption (domestic and international) patterns. By connecting the data on municipality of production, exporter, importer, trade volume and value, Godar et al. (2015 and 2016) argue that the exposure of European imports to deforestation risk increases compared to national level estimations. Pendrill et al. (2019) suggest a land-balance model - quantifying deforestation embodied in the production of major forest-risk commodities at a country level and tracing it till the countries of consumption using a physical, country-to-country trade estimates. In 2013 the European Commission (EC) published a report titled The impact of EU consumption on deforestation that first formulated the concept embodied deforestation and forest degradation11 (Cuypers et al., 2013). The new policy debate on embodied deforestation12 at a
11 In line with the studies undertaken by the EC, FAO and UN REDD Programme this research refers to forest degradation as ‘the reduction of the quality and capacity of a forest to provide goods and services’. We assume forest degradation to usually but not necessarily precede deforestation. As the focus of this research is leather supply chain and cattle grazing, the economic activity which demands clear-cut deforestation, we do not explore the conceptualization of forest degradation in details. The complexity of identifying and assessing forest degradation also adds to this challenge. 12 As a point of reflection, it is worth to mention that the concepts of embodied or embedded deforestation are used interchangeably within the EC documents. For example, the simple text count of The EU Feasibility Study on options to step up EU action against deforestation (2018) results in 19 uses of the term embedded deforestation and 52 of

47
European level further strengthens the perceived linkage between deforestation and consumption and calls for policy measures to consider the impact of EU market demand has on the health of ecosystems in producing countries (Weatherley-Singh & Gupta, 2018). The EC estimates that between 1990 and 2016 around 1.3 million square kilometres of worldwide gross deforestation and forest degradation can be attributed to crop production, ruminant livestock production and industrial roundwood production (logging) (Cuypers et al., 2013; EC, 2019). The EC study found that over the period of 1990-2008 the major share of crops and livestock products associated with deforestation were not actually traded internationally but were rather consumed at local or regional level (Cuypers et al., 2013). The study points out that the largest consumers of deforestation were Africa and South and Central America, with an associated 30% of the global share each. According to the study the European Union (EU) was “only” responsible for 10% of the global embodied deforestation (7,290 thousand hectares per year). However, it was responsible for the import of about 36% of all deforestation embodied in crops and livestock products traded between regions (Cuypers et al., 2013). These results are among the first attempts of estimating the embodied deforestation. Thus, the methodological choice and granularity of the assessment of the risk affect what percentage of embodied deforestation is assigned to global and European supply chains.
Table 3 provides an overview of the usage of above-mentioned concepts in academic literature and Figure 10 presents an attempt to visually represent the concepts and their interrelation.
Table 3. The concepts and their definitions in the literature
Concept Ex. Definition Authors Key attribute Forest-risk commodity
Forest-risk commodities are products whose cultivation involves deforestation and vegetation clearing in the producing countries
Henders et al., 2015 Commodity
Commodity-driven deforestation
Commodity driven deforestation (is) defined by the long-term, permanent conversion of forest and shrubland to a non-forest land use such as agriculture, mining, or energy infrastructure.
Curtis et al., 2018 Impact
Deforestation risk
The risk of deforestation is generally assessed using data about the respective drivers of deforestation.
Di Lallo et al., 2017 Production area Supply chain
a) historical data on forest clearing Lin et al., 2014 b) exposure, vulnerability, and pressure Ordway et al., 2017 c) accessibility, rural population density and crop suitability
Sandker et al., 2017
Embodied deforestation
Embodied deforestation is deforestation as an externality in the production, trade or consumption of a good, commodity or service.
Weatherley-Singh & Gupta, 2018
Externality
embodied deforestation. The Scopus search of the concept embodied deforestation resulted just in one and embedded deforestation in zero peer-reviewed articles. In this research we use them interchangeably as well.

48
The EC led studies define embodied deforestation as “…the deforestation embodied (as an externality) in a produced, traded, or consumed product, good, commodity or service during their production phase” (Cuypers et al., 2013, p.14). The concept takes a normative turn by calling for deforestation to be accounted for as a negative externality of production and trade. Moreover, it also helps to expand the exposure risk to deforestation beyond a handful of forest-risk commodities. Given the complexity of land use and production systems, indirect exposure of certain commodities to deforestation risk, addressed by the concept of embedded deforestation, needs further exploration.
The exposure to deforestation risk can happen through three main channels. First, certain commodity production can pose a significant indirect pressure for deforestation and forest degradation through land use change dynamics. For example, besides being a major forest-risk commodity due to direct conversion of forest area to cropland, Brazilian soybeans can also be identified as a commodity with indirect exposure to the risk: studies suggest that consolidation of croplands in the hands of large-scale industrial producers, high opportunity cost of soy production and rent-seeking behaviour of actors in the Cerrado biome in Brazil have gradually replaced the pasturelands in the area with soy fields and has continued to push the deforestation frontier for cattle production towards the Amazon biome (Fearnside et al., 2001; Morton et al., 2006; Greenpeace 2006; Fearnside, 2007; Walker et al., 2009; Gibbs et al., 2015b; Godar et al., 2015). In this case, although cattle raising is the first economic activity right after clear-cut deforestation, the underlying cause of the land use change is soy cultivation. This indirect exposure or embedded deforestation has created the challenges for the success of Soy Moratorium in Brazil since 2006 (Gibbs et al., 2015; Junior & Lima, 2018).
Figure 10. Visual conceptualization of deforestation risk of an area; forest-risk commodities;
commodity-driven deforestation; embodied deforestation
Source: author’s own elaboration

49
The second channel of exposure to deforestation risk happens when forest-risk commodities are used to produce a product or commodity of another category. An example for this is provided by the supply chains of European poultry and livestock that largely rely on plant-based feed, mostly derived from soybeans. Wide-spread food and mouth disease in the beginning of 2001 in Europe led to high demand for soybeans from Latin America as a cheaper and safer source of animal feed. Among Latin American countries Brazil supplies around 15% of the production volume of soybean to the world markets and provided around 36% of EU soybean imports in 2017 (Comtrade database). Increased soybean production has led to significant deforestation and land conversion in Maranhão, Tocantins, Piauí and Bahia (MATOPIBA) region in Brazil, as well as in Gran Chaco region of Paraguay and Argentina (TRASE, 2018). Thus, although European livestock and poultry production does not directly require conversion of large forest areas, a significant share of embedded deforestation can be attributed to their supply chains through feed systems. Another identified channel of deforestation risk exposure is through the supply chains of by-products of the main forest-risk commodities. In this case, although the causal link between demand (production) and land conversion does not apply, the supply chains of by-products are still exposed to deforestation risk due to the connection to main commodities that drive deforestation. Wood pellets as by-product of lumber production or animal skin/ leather as by product of beef production can serve as examples for this type of exposure. The following sections explore embedded deforestation in leather supply chains in more details.
2.2 Results Being a by-product of beef, the bovine leather is a suitable case for exploring the applicability of the conceptual framework, and to expand on the understanding of deforestation risk and embedded deforestation. We discuss deforestation risk in the example of leather supply chain by pointing out different aspects where these risks can be identified. The risk is more evident at the beginning of the supply chain where cattle farming practices have been identified as direct deforestation drivers for a long time. However, the complexity of trade and supply chain actor relations adds new qualitative layers to this risk. The deforestation risk in leather supply chain reveals itself in the linkage with cattle farming as direct driver, supply chain complexities and trade relations.
According to EC (2013), EU import of embodied deforestation in ruminant livestock products during the period 1990-2008 amounted to 1.3 million ha (Mha) out of a global total of about 4 Mha. Similar to this study there are also reports by Forest Trends (Lawson, 2014), FERN (Lawson, 2015), Chatham House (Brack et al., 2016), World Wildlife Fund (WWF)-UK, Roundtable for Sustainable Palm Oil (RSPO) (Jennings et al., 2017) and Forest 500 (Rogerson, 2019) addressing cattle driven deforestation. As a result of complexity of understanding a share of deforestation impact caused by leather production, these studies mostly calculate it adjacent to beef supply chains or as cattle in general. However, simple transfer of the deforestation footprint of beef to leather supply chain can be misguiding and might result in double counting. Moreover, while majority of the beef is consumed in internal markets of producing countries, this equation is the opposite for the case of leather, which further complicates the deforestation footprint

50
associated with global trade and imports. For example, according to rough estimations, the domestic consumption and export ratio is 80/20% for beef and 17-20/80% for leather in the case of Brazil (Walker et al., 2009; CICB, 2017). These complications necessitate understanding the deforestation risk in leather supply chain from a different perspective rather than just as an allocation of the percentage of deforestation embodied in the production.
2.2.1 Commodity driven deforestation: cattle as forest-risk commodity in Brazil Deforestation associated with cattle ranching in the Brazilian Amazon is not an accidental phenomenon but has emerged gradually due to historical processes. First, large-scale economic exploitation of Amazonian forests started with the second rubber extraction cycle during the presidency of Getúlio Vargas (1930-1945) who saw the strategic importance of the forests and encouraged the "March to the West". Occupation of Amazon forests by settlers then started during the military regime in 1960s under the nationalist slogan “integrate not to forfeit” (Integrar para não Entregar) as a strategy to fight increasing presence of socialist guerrillas in the region. It was a period when construction of highways traversing the Amazon from north to south - Cuiabá-Santarém (BR-163) and from east to west - Transamazônica (BR-230) started. Road construction encouraged migration to the region and establishment of settlements that followed a fishbone trajectory along the roads (Fearnside, 2005; Müller et al., 2016). The occupation supervised by Superintendency of Amazonian Development (Sudam) promised land titles and economic opportunities to people under another slogan of “Land without man to men without land” (Terra sem homem, para homem sem terra). In the 1970s, the total deforested area in the Amazon forests reached around 14 Mha (Fearnside, 2005). This mass migration gave rise to many unresolved social issues, including social injustice, land tenure conflicts, and violence against indigenous people and traditional communities (Tollefson, 2015; Moutinho et al., 2016).
The second wave of deforestation and land use change in Cerrado (Brazilian savannah) and Amazon biomes of the country has been induced by agroindustry expansion in Brazil in the form of mainly soybean and cattle production. The historical agriculture expansion in the country exhibits a trajectory of moving from south, south-east and north-east of the country towards central-east and north covering Cerrado, moving towards Amazon biome and consuming more and more forest and natural vegetation cover (Godar et al., 2015). From being a net food importer in 1970s Brazil has managed to transform itself into a producer and net exporter of major agriculture commodities including the forest-risk ones such as beef and soybean. The country aims to strengthen its position as a provider of agricultural products by planning on increasing the production further by 2030 (OECD/FAO, 2017; IBGE, 2018). Just the beef sector alone aims to produce 13.7 billion tons by 2030 compared to current ~10 billion tons (GTPS, 2018). Currently the deforestation frontier states13 are also among top producers of soybean and cattle. State of Mato Grosso has maintained its lead in the list of cattle herds per state for the year of 2018, while Pará was among top 5 producer states with 21 million heads in 2017 (MAPA, 2019).
13 The Brazilian states, mainly Pará, Mato Grosso and Rondônia, that are in the frontier between natural vegetation cover and agriculture expansion in Cerrado and Amazon biomes. These states experience the highest rates of annual deforestation based on Prodes/ INPE data.

51
The cropland and cattle pasture driven deforestation has been addressed in multiple researches since the 1990s’ with diverse focus on the drivers, actors and case studies (Faminow 1998; Achard et al. 2002; Kaimowitz et al., 2004; Rudel et al., 2009; Defries et al., 2010; Gibbs et al., 2010; Hansen et al., 2013; Pereira et al., 2016; Barreto et al., 2017). Although early research focuses on the typology of actors at the local level, more recent studies shift the focus towards the role of global markets as main drivers of deforestation (Kaimowitz et al., 2004; Nepstad et al., 2014; Gibbs et al., 2015). In addition to peer-reviewed research articles, the reports, geospatial mapping and other type of data analysis conducted by Brazil-based institutions provide plethora of evidence for debating the direct correlation between commodity production and land use conversion. For example, the recent data by Mapbiomas (2018) suggests that 40.8 Mha of net native vegetation loss equals around same area of net gain in pastureland within the period of 1985-2017 in the Amazon biome (Figure 11). Although due to government and private interventions the deforestation in Legal Amazon reduced in the period of 2004-2015, eliminating the stagnated 5-6K km2 average annual deforestation in the following years became much more challenging (Nepstad et al., 2014; Gibbs et al., 2015a and 2015b; Moutinho et al., 2016). Since 2016 the deforestation rates are again on rise, reaching 7,900 km2 in 2018 (INPE/PRODES, 2019). The most recent data revealed by the agency shows that June 2019 has experienced the 88%, July 278% and August 118% increase in deforestation compared to the same months in 2018. Accordingly, majority of the accumulated annual deforestation has happened in the current deforestation frontier in the states of Pará (PA) (41.69%), Mato Grosso (MT) (20.09%) and Rondônia (RO) (13.20%), accounting for around 80% of the deforestation within Legal Amazon in general (INPE/PRODES, 2019).
Figure 11. Annual deforestation and the increase in total pastureland cover in BLA for the period 2004-2017
Source: INPE/PRODES 2019; MapBiomas 2019

52
2.2.2 Geospatial analysis of deforestation risk A detailed analysis of the past and future deforestation risk linked to cattle farming and location of slaughterhouses in the state of Pará can be found in Barreto et al. (2017). Considering the potential buying zones of slaughterhouses, the authors have been working on producing maps to match those zones with the areas already deforested and with the risk of further deforestation. They argue that the potential buying zones for the 99 major meat-packing plants affect regions that contain the majority of problems associated with deforestation in the Brazilian Amazon: 88% of the total of embargoed areas by IBAMA14, 88% of the area deforested from 2010-2015 that was not embargoed (although a large share may be illegal) and about 90% of the areas at greater risk for deforestation from 2016-2018 (of a total of 1.68 Mha of forests). Authors also estimate that 30% of the slaughter capacity in the region is in meat packing plants (slaughterhouses) that have not signed the Agreement for the Adjustment of Conduct (TAC)15 with the government and their production systems do not employ any traceability system. These slaughterhouses create a significant risk of leakage of illegality to legal meat supply chains (Gibbs et al., 2016; Barreto et al., 2018). These estimations can serve as important reference points for analysing the risk of deforestation in the supply chain systems connected to the location of tanneries, also considering the interstate trade. As the task of mapping deforestation risk in relation to slaughterhouse locations in the frontier states is already undertaken by different Brazil based institutions in much more detail and precision, here we provide an adapted simulation of the risk based on slaughterhouse and tannery locations. The details of the data sources and methodology used for the risk analysis can be found in the Annexes 1, 2 and 3.
2.2.2.1 Slaughterhouses and deforestation in Brazilian Legal Amazon (BLA) Brazilian Law no 7889 of November 23rd, 1989 establishes the 3 different inspection systems for slaughterhouses as Federal (SIF), State (SIE) and Municipal (SIM). Slaughterhouses under SIF can commercialize beef in all Brazilian states and export to other countries, whereas SIE and SIM slaughterhouses must respect administrative boundaries when commercializing products. About a third of the Brazilian SIF slaughterhouses were found within the BLA (83 out of 258)16. The geospatial analysis conducted for this research (See Annex 2 for detailed explanation) showed that almost half of all BLA deforestation (44.8%) from 2005 to 2016 occurred within a 100 km radius of current slaughterhouses. This represents 46,628 km2 out of 104,056 km2 (i.e. 48%) of total deforestation. When only taking into consideration 2016 figures, the relative value drops to 38.6% and corresponds to 2,585 km2 out of 6,691 km2 (Table 4). Clearly, the location
14 Brazilian Institute of the Environment and Renewable Natural Resources (Instituto Brasileiro do Meio Ambiente e dos Recursos Naturais Renováveis) is the Brazilian Ministry of the Environment's administrative arm responsible for the execution, regulation, and control of environmental policies. 15 In October, 2003, a Term for Commitment to Adjustment of Conduct (TAC) was signed between the Public Prosecution Service (MPF), Ministry for Agrarian Development (MDA), Ministry of the Environment (MMA), National Institute for Colonization and Land Reform (Incra) and the Brazilian Environmental Institute (Ibama). Available at: http://www.mma.gov.br/port/conama/processos/EFFC0E7F/TACLicAmbProjAssentRefAgr.pdf. Individual meatpacking companies began signing the legally binding Terms of Adjustment of Conduct (“MPF-TAC”) agreements in July 2009 to stop purchasing from properties with illegal deforestation. 16 There is about 258 federally inspected slaughterhouses in Brazil (Lapig, 2017; SIF, 2017), however this number is dynamic due to embargoes and establishment of new structures. See Barreto et al. 2017 for a robust analysis of active and non-active slaughterhouses.

53
of the slaughterhouses alone does not imply they are responsible for deforestation in surrounding areas. However, slaughterhouses are a well-known factor influencing pasture expansion (Barreto et al., 2017; Bowman et al., 2012; Pacheco, 2009). Aside from that, slaughterhouse structures are large investments, which are located as close as possible to pastures, in order to reduce transaction costs due to, for example, transportation and logistics (Mertens et al., 2002; Zucchi et al., 2011). Thus, a correlation between expansion of pastures and location of slaughterhouses is at place.
Most importantly, slaughterhouses located in certain geographies have a higher risk of receiving cattle bred and raised in deforested land as well as of receiving cattle laundered through legal farms. Figure 12 also shows the location of SIF slaughterhouses, illustrating the risk associated with the proximity of slaughter operations to deforestation areas for the whole period 2005-2016. Annex 2 shows a list of slaughterhouses and calculated deforestation risk, exemplifying the type of information buyers of beef and leather might derive from publicly available information and, most importantly use when seeking to source sustainably. 22 out of 83 BLA registered SIF slaughterhouses was assigned very high risk (4), 21 of them high risk (3), 20 of them medium risk (2) and 20 of them low deforestation risk (1). Taking into consideration that 100 km radius is a conservative distance, the level of the risk can increase with the increase of the radius. Annex 1 explains this methodological choice in more detail.
Table 4. BLA deforestation (km2) within 100 km radius from current slaughterhouse location and % incidence on total BLA deforestation (2005-2016)
Year Deforestation (km2) % of total BLA Deforestation 2005 12,626.96 53.3 2006 5,298.14 48.9 2007 5,546.72 48.4 2008 5,815.05 43.7 2009 2,742.73 41.7 2010 2,062.06 32.6 2011 2,022.38 35.5 2012 1,729.57 39.0 2013 2,281.46 42.4
2014 1,927.44 43.6 2015 1,989.65 37.8 2016 2,585.52 38.6
(2005-2016) 46,627.68 44.8 Source: co-author’s elaboration based on GFW (2017), INPE (2017), LAPIG (2017), SIF (2017).
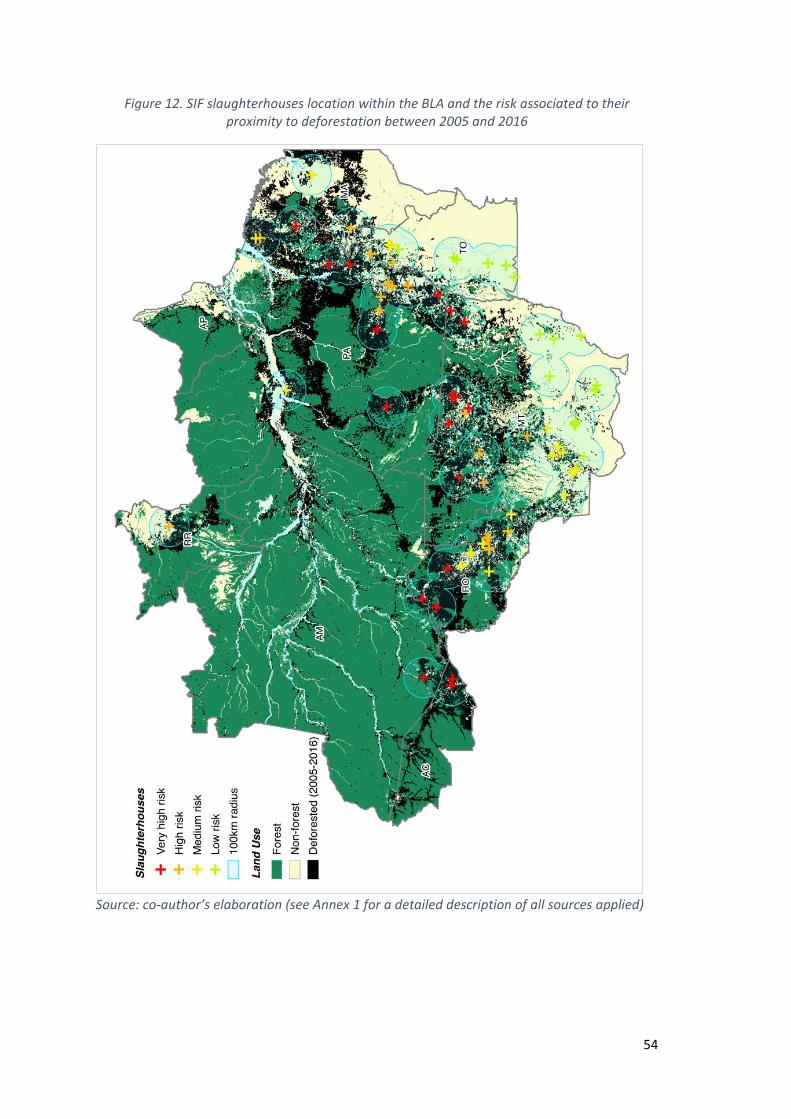
54
Figure 12. SIF slaughterhouses location within the BLA and the risk associated to their proximity to deforestation between 2005 and 2016
Source: co-author’s elaboration (see Annex 1 for a detailed description of all sources applied)

55
2.2.2.2 Tanneries and deforestation in Brazilian Legal Amazon (BLA) A number of 22 tanneries out of 214 were found within the BLA (BLG, 2017; CICB, 2017; LWG, 2017; SIF, 2017). The total number of Brazilian tanneries retrieved from various sources is somewhat close to the value reported by the IBGE database, approximately 250 units (IBGE, 2002). The geospatial analysis (see Figure 13) showed that, differently from slaughterhouses, only 10.8% of deforestation from 2005 to 2016 occurred within a 100 km radius from tanneries (Table 5). Despite only 10.8% of tanneries are located in the BLA, questions remain regarding the volume of hides being processed in such few tanneries (e.g. one tannery could be processing hides from several slaughterhouses). Such figures show a quite high horizontal (i.e. pastures-slaughterhouse-tannery) concentration within the BLA, likely higher than the remainder of the country. Figure 4 shows the location of tanneries within the BLA and the level of associated risk considering the amount of deforested land surrounding these plants. Annex 3 shows a full list of tanneries and deforestation risk associated to them as of 2017. 6 out of 22 BLA registered tanneries were assigned very high risk (4), 5 of them high risk (3), 5 of them medium risk (2) and 6 of them low deforestation risk (1).
While proximity to slaughterhouses is known to influence pasture formation, such relation to tanneries is not established. However, as mentioned before, tanneries have close connection to slaughterhouses. Besides, due to the assumption that tanneries operating on the BLA region also receive leather from slaughterhouses under SIE and SIM registration and without public traceability agreements (see Section 3.3.2 below for details), they arguably are at higher risk of receiving raw materials from bovines raised on deforested land. Thus, it is still relevant assessing tanneries locations as they can provide clues to the embodied deforestation of leather produced in these geographies. Figure 13 shows the location of tanneries within the BLA and the level of associated risk considering the amount of deforested land surrounding these plants.
Table 5. BLA deforestation (km2) within 100 km radius from current tannery location and % incidence on total BLA deforestation (2005-2016)
Year Deforestation (km2) % of total BLA deforestation 2005 3,339.86 14.11 2006 1,297.55 11.97 2007 1,181.31 10.32 2008 1,797.40 13.52 2009 580.18 8.83 2010 586.54 9.28 2011 394.28 6.91 2012 300.97 6.78 2013 433.56 8.05 2014 349.52 7.90 2015 449.81 8.54 2016 482.02 7.20
(2005-2016) 11,193.01 10.76 Source: co-author’s elaboration based on BLG (2017), CICB (2017), GFW (2017), INPE (2017), LAPIG (2017), LWG (2017), SIF (2017)
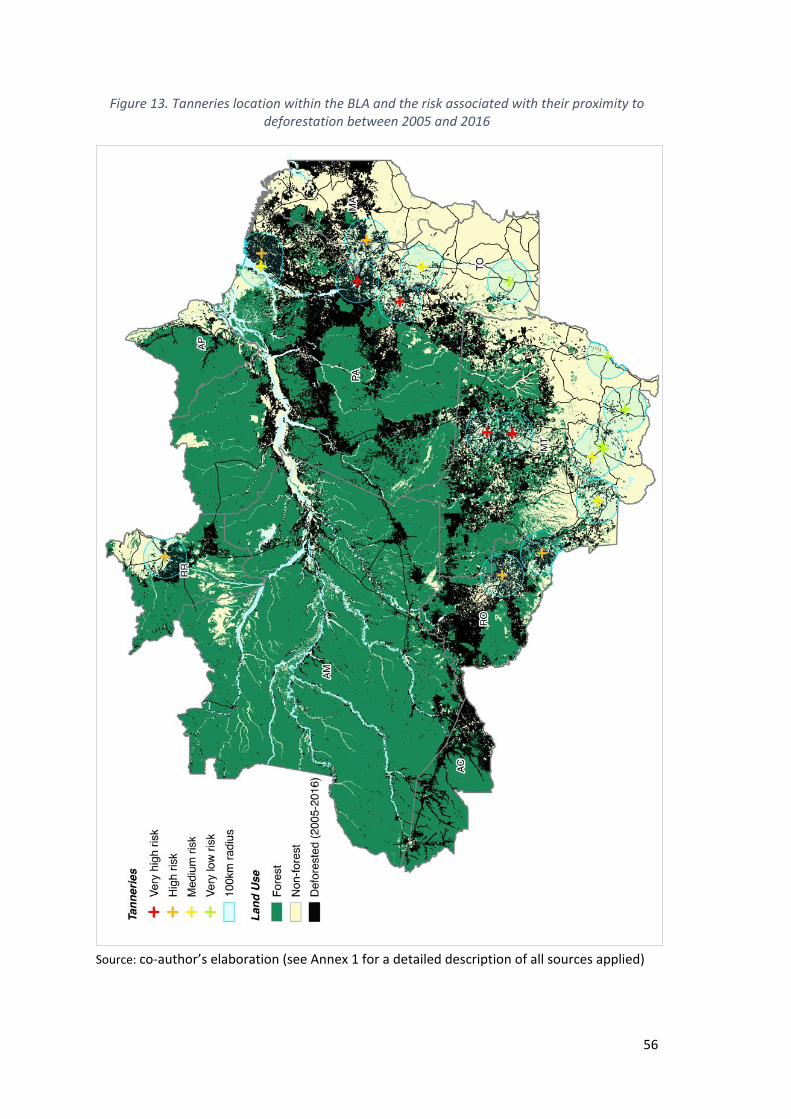
56
Figure 13. Tanneries location within the BLA and the risk associated with their proximity to deforestation between 2005 and 2016
Source: co-author’s elaboration (see Annex 1 for a detailed description of all sources applied)

57
2.2.3 Deforestation risk revealed through supply chain complexities The exposure to deforestation risk also manifests itself in incomplete structure, complexities and gaps at different actor levels along the supply chain of leather. Each of these levels needs careful review for understanding the general degree of the risk. For the sake of simplicity, we have divided the supply chain of leather into farm, slaughterhouse, leather tanning and leather manufacturing segments to discuss the deforestation risk (Figure 14). A complete leather supply chain theoretically starts at a farm level that includes direct sourcing and two-level indirect farms. As a rule, cattle grazing process goes through three main stages: breeding/calving, raising and fattening (cria, recria, engorda) until they are sold to slaughterhouse (Figure 5). Around 40% of all the cattle herd destined for beef production in Brazil are raised in agricultural properties that carry out the full cycle –– from cattle breeding to fattening (IBGE, 2012). Nowadays an average slaughter age ranges between 24-36 months depending on the state of production and the sex of an animal. On average calves stay at the breeding farm for 7-8 months until they are not fed by milk and then sold at an average price of 347.26 US$ and a weight of 210.4 kg per calf (Nelore breed, reference year of 2019, São Paulo state) (CEPEA, 2019). Cattle remain in raising farms for 8-12 months and then sold to fattening farms. Depending on feeding system cattle can stay in fattening farms from 100 days (feed lots) up to 6 months (semi-feed lots and pasture) until reaching a weight of around 17 arrobas (roughly 250 kg) (Personal Communication, 27 July 2018). In majority of the cases, raising and fattening operations in Amazon region are undertaken in vertically integrated farms. Once fattened, the cattle are sold for an average price of 40.51 US$/arroba to a slaughterhouse (CEPEA, 2019).
Slaughterhouses represent the next level of the supply chain flow of leather. As discussed in the Section 3.2.1, slaughterhouses in Brazil are controlled under different inspection systems. In 2016 the slaughter survey covered an average of 1,191 slaughterhouses per trimester (SIDRA, 2017). Of these, 198 were under the SIF17, 391 under the SIE and 601 under the SIM, corresponding respectively to 78.0%, 16.7% e 5.3% of the accumulated weight of carcasses produced. Thus, despite the relatively low number of slaughterhouses under the SIF, most production happens within these facilities. When considering the BLA, proportion rate for SIF raises to 88.0%, while rates for SIE and SIM decrease accordingly to 9.3% and 2.7% respectively (SIDRA, 2017): this further shows the concentration of production in these facilities. The bovine hides that result as a by-product of daily animal slaughter are piled together in a pool through waste system of a slaughterhouse. Depending on the proximity of the processing tanneries, the piles of hides can be pre-processed or salted already at the slaughterhouse level for sanitary reasons and for allowing long-distance travels. This stage of treatment is generally referred as a preservation process.
Tanneries represent the next segment of supply chain flow of leather. Tannery level operations are complex and resource intensive and can be generally categorized as preservation, pre-tanning (salted), tanning (wet-blue), post-tanning (crust) and finishing (finished leather)
17 There are about 258 federally inspected slaughterhouses in Brazil (Lapig, 2017; SIF, 2017), however this number is dynamic due to embargoes and establishment of new structures.
58
processes. There are in total 260 registered tanneries operating in Brazil (CICB, 2019). Our analysis show that 22 of them are located in BLA (BLG, 2019; LWG, 2019), 15 out of which were registered as exporting tanneries in 2018 (SECEX, 2019). Although the data on export share of individual tanneries is not being made public anymore, the registry information shows that majority of the tanneries located in BLA are specialized in wet-blue tanning process (SECEX, 2018) allowing the assumption that the further processing is being implemented in other states of Brazil.
Leather manufacturing and market distribution is the last segment of supply chain flow before a finished leather product reaches a final consumer. According to CICB around 80% of production value (US$) of Brazilian bovine hides and leather are exported while 20% is manufactured within the country. The major final destination sectors of the exported Brazilian leather are upholstery (52%), followed by footwear (20.1%), furniture (20.7%) and leather goods (8%). Internal leather manufacturing is, however, dominated by footwear (60%) (CICB, 2017).
Although animals are traced throughout the farming process (either through fire branding or eartag systems) that level of traceability is lost once the animals enter slaughterhouse. The traceability at the slaughterhouse level, in the best-case scenario, is based on daily purchase information indicating the name of a supplying farm, number of purchased cattle, etc. This information is transmitted through Animal Transport Guide - Guia de Transporte Público (GTA)18
by a farmer to slaughterhouse. A physical traceability of animal hide (if in place) starts at a first instance receiving tannery. This traceability is usually based on a branded code on the corner of a hide indicating date of purchase, slaughterhouse ID and the number of a batch. Depending on leather manufacturing and splitting processes the code and traceability bears the risk to be lost or faded away along the way.
Due to this complexity of transaction units and levels, the benefit sharing across the supply chain of leather is also lost or becomes less transparent. The financial flow starting from the last consumer ends at a slaughterhouse level, as cattle farmers are not remunerated for animal hides (rather based on arroba weight and rarely on meat quality). The revenues from the sale of animal hides as well as other by-products of cattle shape the marginal profits of slaughterhouses (Personal Communication, June 20, 2018). Although in general it is estimated that animal hides make up to 7-10% of the total value of a cattle, “value for whom?” is a relevant question to ask. According to Rocha (2002), Pereira et al. (2005) and information gathered in Pará state in 2018, leather is remunerated through the bica corrida system at a slaughterhouse. That is, on average, 7-8% of the value that a farmer receives per arroba covers the value of animal skin regardless of its quality. However, there is no explicit policy of remuneration for leather making it difficult for a farmer to care for the quality of leather, as well as sustainability conditions demanded by the leather market. This loss of benefit sharing and lack of incentive mechanisms for farmers may finally result in an increase of the risk of exposure to deforestation in leather supply chains (Figure 14).
18 According to the Decree no. 5741/2006, in order to sell the cattle farms, need to issue GTAs which include the number of animals being transported, age range, destination and identification of origin (municipality, name of ranch or meat processor, and Tax Payer’s ID Number). The GTAs do not track individual heads of animals.

59
The next sections discuss the deforestation risk based on complexities and gaps at the farm and slaughterhouse level, while tannery and manufacturing level gaps and discrepancies are presented through production data analysis in the section 2.3.4. of this chapter.
Figure 14. Leather supply chain and its different segments
Source: author’s own elaboration based on IBGE (2019) and CICB (2018).

60
2.2.3.1 Farm level risks The risk of leakage due to mobility of cattle and indirect suppliers, as well as the shortcomings of the Rural Environmental Registry (in Portuguese Cadastro Ambiental Rural, CAR) system are the gaps identified at the farm level. As opposed to soy, cattle are mobile product making farm-to-farm transactions easy. As described in the section above, this attribute of mobility allows the risk of laundering animals from illegal farms to legal ones, moving cattle away from a farm during audits by authorities and benefiting from informal transactions among farms, especially in the frontier states where the government control is very weak (Personal communication, July 2018). The leakage and laundering of illegal cattle to legal supply chains is well documented also in Gibbs et al. (2016) and Barreto et al. (2017).
Indirect supplier is a term mainly used to describe the second or third tier farms along the supply chain. Indirect suppliers present risk of deforestation and other illegalities for a couple of reasons. First, TAC signed among big meatpackers and Public Prosecution Service (Ministério Público Federal, MPF) in 2009 as well as individual traceability systems of slaughterhouses covers only the transactions with direct supplying (fattening) farm. Thus, even the most advanced initiatives for fighting deforestation in the area have incomplete coverage. This is because in majority of the cases, slaughterhouses have access to GTA of the farms that they directly engage in the transaction. The GTAs also do not track individual heads of animals and many states still use paper-based systems. Thus, in the beginning of the supply chain where informal transactions still prevail, GTA falsification is a well-known phenomenon (Barreto et al., 2017; Locatelli & Aranha, 2017). Moreover, even though farming practices differ across state and business models in Brazil, indirect supplying farms are typically smallholdings. The available data indicates that significant deforestation and land clearings in the region are happening in small patches. Although the link between small patch deforestation and smallholder activities19 are not consistently studied, the evidence from the ground suggests that smallholder cattle farming and associated incremental land clearings are related. Using official PRODES data20, Walker et al. (2013) focused on deforestation patterns during the period of 2001-2005 and demonstrated that around 50% of all clearings in the states of Pará, Mato Grosso and Rondônia happened in patches smaller than 100 ha. Godar et al. (2015) attributes 16.3% of the deforestation (2004-2011) to smallholders and demonstrate that areas closer to the forest frontier are also dominated by smaller rural properties. Using Global Forest Change (GFC) Hansen et al. (2018) and Kalamandeen et al. (2018) studied deforestation patterns within the period of 2001-2007 and 2008-2014. By focusing on deforestation patches up to 1 ha and 6.25 ha respectively (which are below the annual deforestation threshold detected by the PRODES data), they argue that this fraction increased from ~23% in 2004 to ~53% in 2013. However, it is very likely that small patch deforestation also happens in large farms to avoid monitoring and fines. Besides, due to land
19 The definition of smallholder activity differs according to municipality and can fall under 4 fiscal modules (FM) (400ha). Fiscal module is the criterion established by INCRA (National Institute for Colonization and Agrarian Reform) to classify properties in small (≤4FM), medium (≥4 - ≤15 FM) and large (≥15 FM). One fiscal module varies between 30 and 100 hectares, across municipalities and economic activity. 20 The current version of PRODES (Monitoramento do Desmatamento na Amazônia Legal por Satélite) programme consider deforestation events >6.25 ha and do not present patches <6.25ha unless accumulated over several years.
61
speculations and occupations by large players smallholders and settlers are being pushed towards forest frontier where deforestation is regarded as a rational act for survival (Wunder, 2000; Branford & Torres, 2017). The third gap at the farm level is identified around the CAR as the central element of SICAR (National Rural Environmental Registry System) system established by the Forest Code 2012. CAR is considered by the government the most robust rural property monitoring system for the control of deforestation. It requires rural private properties to register in the national system providing the georeferenced coordinates of the boundaries and remaining forests in the property. As of May 2019, 5.9 million rural properties have been registered across the country covering 489 M ha (SICAR, 2019). While registration of private properties under the CAR is required by law, deadlines to do so have been extended multiple times, suggesting lenient approach to law enforcement. The provisional Measure 867 of 26 December 2018 extends the deadline till December 31, 2019. Moreover, registry in CAR doesn’t immediately translate into legality as illegal deforestation or breach of limits can still happen in CAR registered properties if: a) the ratio of Legal Reserve (LR) is not according to the baseline year 2008; b) Permanent Protection Areas (PPA)21 are not being properly conserved. CAR registries are also considered self-declarations until they are checked and confirmed by the Secretariat of Environment and Sustainability (SEMAS). According to the estimates, verification of the CAR registries can take several decades with the current speed and technological capacity of SEMAS (Anonymous, Personal communication, June 7, 2018).
2.2.3.2 Slaughterhouse level risks In 2009 the TAC was signed between Public Prosecutor of Pará state and major slaughterhouses that were accused of buying cattle from illegally deforesting farms. Based on this agreement the slaughterhouses (mostly falling under the SIF system), agreed not to buy cattle from farms deforesting post 2009. TAC was extended for the whole Amazon region afterwards. According to Barreto et al. (2018) up until 2017, 79 slaughterhouses possessing 70% of slaughter capacity of the region have signed TACs. Although TACs contributed to the reduction of the deforestation in the region for a while, weak low enforcement soon compromised their effects (Alix-Garcia & Gibbs, 2017). The 2018 audits by the Federal Public Prosecution Service (Ministério Público Federal, MPF) of Pará show that the slaughterhouses with TAC continue sourcing from illegal farms embargoed by IBAMA (MPF, 2018; Mengardo, 2018). Besides, according to Barreto et al. (2018), 30% of slaughter capacity in the region is still with the meatpackers without TAC. In March and April 2018 MPF asked IBAMA to inspect 56 slaughterhouses without TAC22 that were suspected in illegalities and buying from embargoed zones (MPF, 2018a e MPF 2018b). Around 80% of embargoed farms by IBAMA fall into potential buying zones of 56 slaughterhouses without TAC (Barreto et al., 2018).
21 According to the Forest Code the private properties are required to keep certain percentage of their properties in the form of Legal Reserve (LG) and Permanent Protection Areas (PPA) depending on the biome they are located in. APPs apply to environmentally sensitive areas such as riverside forest buffers, hilltops, high elevations, and steep slopes. Conserved APPs can be calculated within LG. 22 Excepting one slaughterhouse with TAC in the state of Pará .

62
Although beef supply chains are checked for legality based on SIF, SIE and SIM inspection systems and TAC agreements, the same does not apply for animal hides. Thus, as a general rule, animal hides either from SIF, SIE and SIM slaughterhouses and those with and without TAC can be transported to tanneries where this type of classification is not required for leather to be destined for internal market or exports. The vertical integration between tanneries and SIF slaughterhouses under a same private entity (e.g. in the cases of business groups like JBS or Marfrig) reduces this risk to a certain extend. According to IBGE (2019) around 72% of all raw hides processed in Brazilian tanneries and around 81% of all the raw hides processed in BLA are sourced directly from federal slaughterhouses in 2018. This data suggests either high degree of vertical integration or close proximity of salting and wet-blue processing tanneries to slaughterhouses in BLA.
2.2.4 Embedded deforestation in production and trade The risk of embedded deforestation and other illegalities is revealed also by looking at discrepancies at the country level production data. According to annual and quarterly agriculture production data by IBGE it is possible to see the annual slaughter and hide production per state. As indicated in Walker et al. (2013), the comparison between whole hide production and number of slaughters in the country in a given year reveals the share of clandestine market in the cattle sector. It is argued that, as the leather sector is less monitored, the registered number of received raw hides by tanneries can be used as a proxy to estimate the real number of slaughters in the country (Kalif, 2018) (Figure 15). Figure 15. The difference between total slaughter and acquisition of bovine hides by tanneries
as an inference about clandestine market
Source: IBGE, 2018, adapted from Kalif, 2018. Data on interstate trade of animal hide and leather within Brazil is also a very important focus point to consider when discussing deforestation risk along supply chain. The observations during the field visit and information shared during personal communications with the stakeholders in 2018, indicate towards the important level of trade between deforestation frontier states and the rest of the country. The tanneries located in the frontier states (that are

63
usually in close proximity to slaughterhouses) are specialized in initial stages of leather treatment from raw hides till wet-blue (SECEX, 2018; BLG, 2019). Long distance transportation of leather in salted and wet-blue stage is also more convenient due to diverse technical and logistical reasons. If not directly exported to foreign countries, wet-blue leather originating from BLA states is transported to southern and south-eastern states of the country where leather tanning and manufacturing has historically been an important economic activity and where know-how and tannery associations also concentrate. Leather with BLA origin gains value-added through processing in the finishing tanneries that are either part of vertically integrated system or operate independently. It could be possible to understand the extent of interstate trade by following tax declarations collected electronically by the State secretaries and the Ministry of Economy (Ministério da Fazenda). However, tax information is considered strictly confidential and not available to public access. Analysis of publicly available data on the Quantity of whole tanned bovine leather in month and quarter by tanning method (Quantidade de couro inteiro curtido de bovino, no mês e no trimestre, por método de curtimento) by IBGE helps to make inferences about the extent of the interstate transactions. The comparison of total slaughter per state and the quantity of tanned (wet-blue stage) leather received by tanneries in each state23 for the year 2018 shows major difference between the two, especially in southern states such as Parana (133%), Rio Grande do Sul (59%), Mato Grosso do Sul (36%) and São Paulo (34%) (Figure 16). This comparison between registries can be interpreted as the extent of the clandestine market per state discussed above. However, it also helps to infer about the potential volume of interstate trade, though it does not provide direct evidence for transactions between southern states and the BLA ones. States with high difference in percentage between registered slaughter and wet-blue hides are assumed to import them from other states. This type of analysis can serve as a starting point to discuss the exposure to deforestation and confront businesses claiming to have transactions exclusively with the southern states and thus, not to possess the risk in their supply chains. Assessment of embedded deforestation in trade and global supply chains beyond the national borders of Brazil need close look at the individual transactions based on trading partners and type of commodities.
23 As the variation between registries of raw hides and tanned leather in each state is very insignificant, we do not present it here.
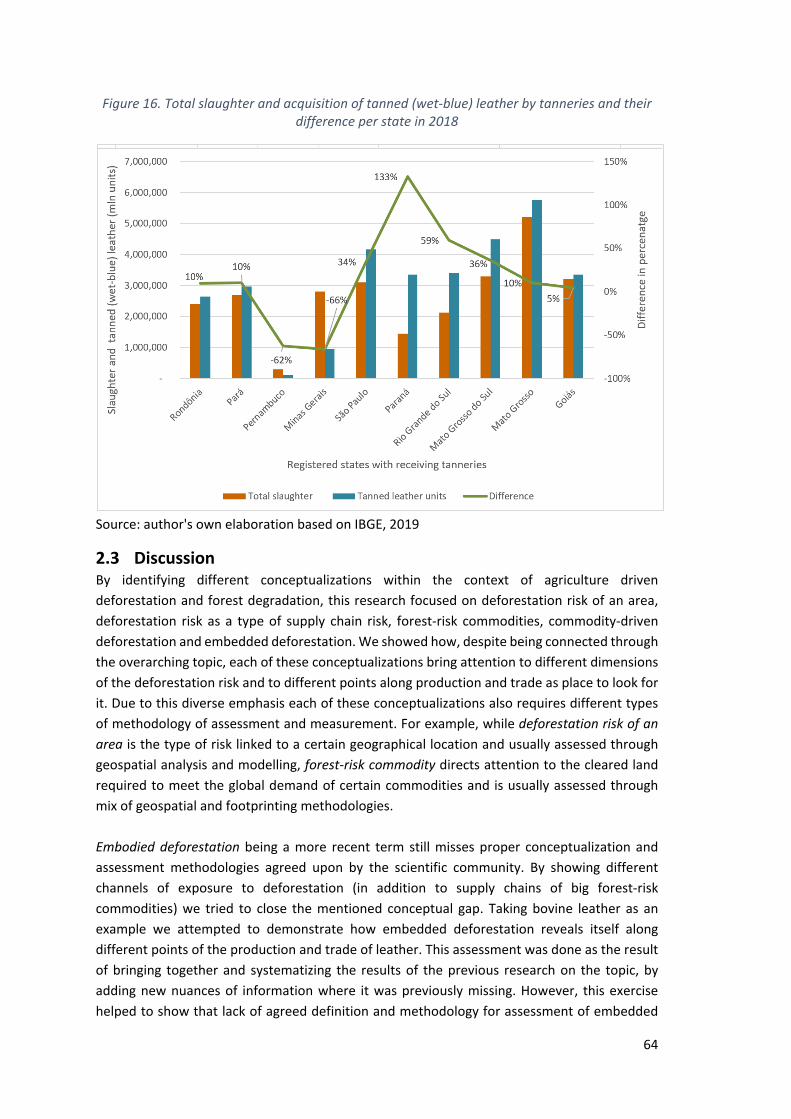
64
Figure 16. Total slaughter and acquisition of tanned (wet-blue) leather by tanneries and their difference per state in 2018
Source: author's own elaboration based on IBGE, 2019
2.3 Discussion By identifying different conceptualizations within the context of agriculture driven deforestation and forest degradation, this research focused on deforestation risk of an area, deforestation risk as a type of supply chain risk, forest-risk commodities, commodity-driven deforestation and embedded deforestation. We showed how, despite being connected through the overarching topic, each of these conceptualizations bring attention to different dimensions of the deforestation risk and to different points along production and trade as place to look for it. Due to this diverse emphasis each of these conceptualizations also requires different types of methodology of assessment and measurement. For example, while deforestation risk of an area is the type of risk linked to a certain geographical location and usually assessed through geospatial analysis and modelling, forest-risk commodity directs attention to the cleared land required to meet the global demand of certain commodities and is usually assessed through mix of geospatial and footprinting methodologies. Embodied deforestation being a more recent term still misses proper conceptualization and assessment methodologies agreed upon by the scientific community. By showing different channels of exposure to deforestation (in addition to supply chains of big forest-risk commodities) we tried to close the mentioned conceptual gap. Taking bovine leather as an example we attempted to demonstrate how embedded deforestation reveals itself along different points of the production and trade of leather. This assessment was done as the result of bringing together and systematizing the results of the previous research on the topic, by adding new nuances of information where it was previously missing. However, this exercise helped to show that lack of agreed definition and methodology for assessment of embedded

65
deforestation results in qualitative mapping and assessment of the risk. Robust quantitative methodologies need to be developed, alongside with qualitative assessments. We see this challenge of assessment reflected also in a fact that when talking about embedded deforestation policy documents usually refer to a handful of commodities with direct causal links to clearance of large forest areas. Although, in theory embedded deforestation refers to the externality of a broad list of “produced, traded, or consumed product, good, commodity or service”, in practice most of the discussion in policy documents are narrowed to big forest-risk commodities (Cuypers et al., 2013, p.14). Given the complexity of land use and production systems, indirect exposure of certain commodities to deforestation risk needs to be further explored. The choice of concepts when discussing the risk of deforestation is policy relevant and has impact on how responsibility and accountability is constructed both through legal actions and voluntary sustainability standards by a sector itself. Depending on the choice of the concept and associated measurement of the risk, the assignment of the risk to businesses and supply chains will also differ. For example, if with the objective to assess Amazonian deforestation driven by soy supply chain, we employ the definition commodity-driven deforestation, then the assignment of the risk will be much less compared to when we use the concept embedded deforestation. In the second case, we would also consider the Amazonian deforestation indirectly driven by consolidation of soy fields through land use dynamics. This type of assessment would result in different policy responses to the studied phenomena. Setting the baseline year of allowed deforestation to 2008 (originally 2006) through Soy Moratorium in Brazil was an attempt to acknowledge and have control over embedded deforestation caused by soy cultivation. The choice of concept also affects how the criteria for sustainability are designed within private sector standards. For example, if we discuss leather as a waste product of cattle without deforestation risk in the supply chain, it is only possible through the choice of concept different from embedded deforestation risk. These means major sustainability standards and guidance documents of the commodity would take deforestation as only relevant for beef/cattle as the driver of deforestation and put distance between farm level impacts and the leather supply chain. If deforestation risk is taken as embedded, then the waste product narrative is also undermined. Limiting the discussion about deforestation risk to casual linkage and focusing on big forest-risk commodities provides extra legitimacy for the waste product, other similar narratives and the neo-liberal discourse they are part of. By using the rational of forest-risk commodities to explain deforestation risk prevalent in leather supply chains, it is inevitable to lose an argumentative step and get lost in conceptualization of reality engineered by the very industries themselves. Thus, the discussion should be around embedded deforestation in the supply chains and the systems that inherently support the continuous prevalence of that risk rather than chasing after individual culprit commodities as drivers.

66
At this point, it is also important to reflect critically upon undesirable consequences of excessive focus on the topic of commodity driven deforestation. Although focusing on market demand and major commodities provides policy makers and practitioners the necessary guidance, it can also have multiple implications: a) the way simplification and reduction of the forest issue to carbon units received significant criticism (Humphreys, 2006; McDermott, 2012), commodification of the deforestation issue is experiencing the same. This focus could be limiting by creating false assumption that addressing private supply chain sustainability instead of much larger governance issues is the answer to tropical deforestation (Meijer 2015; Newton & Benzeev 2018; Weatherley-Singh & Gupta, 2018). These discussions also help to get locked in the discourse of the neoliberal market by blurring the vision for seeing much deeper societal, economic and environmental underlying causes of nature destruction. The lockage in the narrative of sustainable commodity supply chains could be used to make consumerism and modern human’s attitude towards nature of secondary priority. This focus allows to find incremental and almost convenient solutions for businesses to keep things as usual (Weber & Partzsch, 2018; Dauvergne, 2018). This simplification also creates a very large base for businesses to self-regulate themselves through voluntary measures, commitments, certification schemes while achieving little sustainability outcomes and playing power games with state and other regulatory bodies (Klooster, 2006, 2009; Gulbrandsen, 2008; Dauvergne, 2018).
2.4 Conclusion The discussion about deforestation risk requires careful review for each type of production system and supply chain. Purchasing cattle in Pará state of Brazil and a leather bag in the streets of Milan has different levels of perception and exposure to the risk, despite possessing the same origin. Although quantifying the deforestation risk could be very challenging for the case of leather due to the complexity of the supply chain, qualitative assessment and mapping of the risk could help understanding where and when the risks can be mitigated. By demonstrating how the risk travels along the leather supply chain, we argue that this differentiation could help identifying policy gaps and better understanding of responsibilities by industries. Mitigation of the deforestation risk by the leather industry will also highly depend on the choice of political discourses in Brazil that create and blur visibilities around deforestation risk and its types (legal vs illegal) (Mammadova et al., 2019).
Mitigation of the deforestation risk in leather supply chains should also go hand in hand with supplier development and engagement instead of abandonment of a source and engagement in denial. Instead of waiting for low hanging fruits of the efforts put forward by the beef industry, the leather industry itself can be more proactive and contribute to achieving zero deforestation in the region through acknowledgement of the risk of embedded deforestation in the supply chains. The benefits received through leather supply chains could help farmers to cover important transaction costs linked to legality and sustainability and receive clear signals about market requirements on deforestation-free production. In times when market prices for raw hides have reached historical low, calling for less cattle production and meat consumption should also be both rational business strategy as well as an example for true corporate environmentalism.

67
Figure 17. Cattle herd (nelore breed), pasture with and without the legal forest reserve
Source: author’s visit to a cattle farm in Mato Grosso state, July 2018

68

69
3 Making deforestation risk visible. Discourses on bovine leather supply chain in Brazil24
Large-scale industrial agricultural production and commodity trade are more and more linked to deforestation and forest degradation in the tropics (Gibbs et al., 2010; Henders et al., 2015; Curtis et al., 2018). Increasingly, this is described via the concept of ‘deforestation risk’. Agricultural products whose production or extraction involves deforestation and native vegetation clearing are classified as forest-risk commodities. As already discussed, beef, soybeans, palm oil, and timber - the commodities with deforestation risk - are considered the “big four” forest-risk commodities (Walker et al., 2013; Pendrill et al., 2019). In debates on corporate social responsibility (CSR) and sustainable resource governance, deforestation risk is added to concerns such as human rights violations, health and sanitation issues to be addressed by supply chain interventions (Walker et al., 2013). Specifically, the idea of sustainable supply chain management represents an industry response to societal pressure by non-governmental organizations (NGOs) and civil society to reduce socio-environmental impacts of business operations (Gereffi et al., 2005).
Sustainable supply chain management is predominantly focused on transparency and traceability of company operations, responsible suppliers, and associated socio-environmental impacts. Over the last decades, transparency has evolved as a key element of environmental governance (Fung et al., 2007; Mol, 2010). Recent studies also argue that transparency of supply chains requires mechanisms that incorporate both traceability of commodities across the chain and sustainability conditions of traders and suppliers (Egels-Zandén et al., 2015; Gardner et al., 2018). This is assumed to lead to positive governance outcomes, by enhancing public accountability of businesses to civil society and consumers (Mol, 2015; Koberg & Longoni, 2018); by balancing power asymmetries amongst stakeholders in the supply chain and promoting fairness (Mol, 2010; Gardner et al., 2018), and by reducing negative social and environmental impacts (Mol, 2010; Fung 2013).
The assumptions about how transparency in sustainable supply chains leads to positive governance invite critique, as transparency does not always lead to the desired fair outcomes and may lead to reverse impacts (Mol, 2010; Garrett et al., 2016; Gardner et al., 2018; van der Ven et al., 2018). First, supply chain information is often limited to business-to-business (B2B) relations, while actors in the beginning and end of the supply chain are neglected. Thus, there is a lack of evidence that consumers can leverage complex supply chain transparency information and assert their power through informed decision making and preferences (Egels-Zandén & Hansson, 2016; Grunert et al., 2014; Janßen & Langen, 2017). Second, supply chain transparency information is usually made public in a complex, abstract and vague manner. This can obscure the ability and willingness of individual users to interpret given information accurately and act accordingly (Dingwerth & Eichinger, 2010). Third, transparency may result in reverse impacts as information is often produced and controlled by already powerful actors that may use this information to strengthen their position in the supply chain, for example with
24 Mammadova A., Behagel J., Masiero M. (submitted to Geoforum). Making deforestation risk visible. Discourses on bovine leather supply chain in Brazil.

70
regard to price bargaining. This adds vulnerability to already vulnerable actors in the chain (Mol, 2010).
Leather supply chain is a good example for the complexity of supply chain transparency and for failing to reach small suppliers and consumers at both ends of the chain. While the role of cattle in deforestation is subject to increased public scrutiny (Nepstad et al., 2006; Godar et al., 2012; Gibbs et al., 2016), the leather commodity chain remains largely in the shadow. In the rest of this chapter, we explore how specific practices of transparency in the leather supply chain are linked to specific interpretations of fairness, legitimacy and sustainability in governance outcomes. In our results, we show how political discourses on deforestation risk and transparency affect decisions over what is made visible in the supply chain and who is assigned responsibility. We therefore conclude the with a call for increased public scrutiny of supply chains, including the leather one, and for special attention to unequal power relations and the importance of meaningful inclusion of vulnerable groups and populations.
3.1 Transparency and sustainable supply chains In the current age of globalisation, hierarchical mechanisms of accountability within governments are increasingly supplemented and replaced by horizontal modes of peer and public accountability, where civil society and the public holds powerful actors accountable for their actions (Bevir, 2010; Bäckstrand, 2008). At the same time, the complexity of globalisation and the lack of institutionalised relations makes it difficult to define the scope and boundaries of supply chains, in particular the actors that should be involved and held accountable (Gupta & Mason, 2016; Widerberg & Pattberg, 2017). The result is that accountability mechanisms often fail hold powerful actors responsible or amount to little more than ‘greenwashing’ of consumer goods. Subsequently, supply chains of globally traded commodities invite political contestations about how transparency comes about and who should have access to information.
Political contestations about sustainable supply chains are often centred on ambiguities of meaning. First, ambiguity is found in the concept of sustainability (Salas-Zapata & Ortiz-Munoz, 2018). While the concept is intended to build bridges between the dimensions of economic development, nature conservation, and social inclusion, political discourse and social-ecological context often emphasize one dimension at the cost of the other two (Higgins & Richards, 2019). Second, ambiguity exists with regards to the legitimacy of different forms of activity in the supply chain. As the supply chain spreads across geographies, the legitimacy of activities within these fields and spaces may draw on competing rationalities, e.g. environmental, economic, or governmental (Behagel & Arts, 2014). Third, the complexity of the supply chain and the different types of actors that operate within it make the question over fairness and responsibility a major point of debate. Consensus over what is a fair distribution of responsibility across the chain is hard to find (Mair, Druckman & Jackson, 2017). Each of these three issues – sustainability, legitimacy, and fairness – is explored in detail below.
3.1.1 Transparency and sustainability Increased levels of transparency and information sharing do not necessarily lead to actual betterment of a situation. The causal relation between transparency and economic,
71
environmental or social performance is still very difficult to estimate (Auld & Gulbrandsen, 2010; Ponte & Gibbon, 2011; Gardner et al., 2018) and contingent on where and what kind of undesirable behaviour is being scrutinized. Due to increased media and civil society attention, as well as limitations of data and resources, certain aspects of production systems can receive more attention than others. Thus, transparency of one aspect can divert attention from, simplify or diminish the importance of others (Flyverbom, 2016; Gardner et al., 2018). In other words, transparency tools target only the behaviour for which they are designed. For supply chains, the extent to which transparency leads to sustainability outcomes is particularly contested for the topics of leakage, scope, and traceability (Mason 2008; Mol 2010). In the case of leakage, civil society’s pressure to abandon unsustainable practices may for example lead to buyers to change suppliers but not to address the core problem. This creates the so-called effect of leakage of unsustainable operations to be carried on somewhere else (Henders & Ostvald 2014; Garrett et al., 2016; Gibbs et al., 2016; Alix-Garcia & Gibbs 2017). Second, by being concerned about sustainability of individual commodities, supply chain transparency may remain limited in scope: unless it is coupled with other governmental and civil society strategies, reduced impact of the supply chain of one commodity (e.g. sugarcane) may be cancelled out by increased impact of another (e.g. palm oil) (Larsen et al., 2008; Newton et al., 2013; Boström et al., 2015). Third, individual supply chain sustainability initiatives are always under the risk of contamination through laundry and introduction of unsustainable products into the system (Gibbs et al., 2016). For example, unsustainably produced products may be mixed with sustainably produced ones, i.e. animals may be moved across farms.
3.1.2 Transparency and legitimacy Transparency in supply chain governance is linked to legitimacy beyond the boundaries of the modern state (Behagel & Turnhout, 2011; Schouten & Glasbergen 2011). Three important dimensions of legitimacy are legality, justification, and consent (Beetham, 1991). The dimension of legality addresses the adherence of practices by actors with relevant legal norms and rules, in regional, national, and international jurisdictional contexts. While legality says little about fairness or justice, it does presuppose an ordered or balanced system of operating as a valid basis for legitimacy. The dimension of justification is related to societal norms about what is considered good and just. Such norms can be external or internal (Beetham, 1991; Parkinson, 2003). For example, norms external to the supply chain may come from spiritual beliefs about the value of nature (“thou shall not cut trees”) or from wider discourses about global sustainability, while internal norms may relate to how farmers view their relationship with a buyer of cattle. The dimension of consent relates to the social processes by which agreement to a practice or decision is given. For example, acquiring free, prior, and informed consent (FPIC) of local communities to carry out mining or forestry operations is an increasingly recognised way to address social equity in global governance contexts (Mahanty & McDermott, 2013).
Transparency is relevant to each of the three dimensions of legitimacy. Adherence to legal norms and rules is often accompanied by governmental and private certification practices that aim to create public information about the performance of private actors in the supply chain. Questions over who is required to adhere to both legal norms and rules or who should adopt private certification schemes therefore affect what type of legitimacy is produced. There also
72
exists a big difference whether practices across the supply chain are evaluated according to norms external to the supply chain or internal to it. For example, whether economic development or nature conservation are more important grounds for legitimacy depends greatly on values and these will be weighed differently by an environmental NGO than a meatpacker. Finally, which actors have access to information and how they can use that information to give or withhold consent for certain activities also affects legitimacy. A consumer who does not know where his/her soy-burger is produced is not able to withhold consent for deforestation.
3.1.3 Transparency and fairness Within the context of global commodity production, fairness is understood in multiple ways (Howard et al., 2016). First, fairness may relate to local farmers being paid a “living wage” regardless of market fluctuations. Transparency can have an adverse effect on this objective, when the sustainability of production is being linked to the commodity itself instead of the location of its production. Local suppliers are usually small or family farmers lacking economic and political power or resources to address structural and systematic causes of unsustainability. “Name & shame” campaigns that subsequently follow revealed information about impacts of the production often negatively affect the livelihoods of these already vulnerable communities (Gardner et al., 2018).
Other elements of fairness relate to procedures and institutions and to benefit sharing. Issues linked to access to land titles, bureaucracy, and transaction costs have big impacts on the livelihoods of local actors, often much more so than on the sales of individual companies sourcing from the region. Making previously invisible actors and impacts more visible may therefore add to the vulnerability of these actors and to their ability to enter markets. Fair benefit sharing may also be compromised. Economically vulnerable actors often carry the burden of transparency by being subject to strategic behaviour of powerful actors and because of an absence of shared responsibility by all actors of the supply chain. In the example of Brazil, clearing and distancing operations from illegal and deforesting activities is much easier for a company located in São Paulo than for a smallholder farm in Pará . Thus, when transparency is used to increase surveillance (Gardner et al., 2018), it can also push the responsibility and associated cost of compliance to those upstream actors that lack substantial resources to either adhere to the standards or to demonstrate sustainable behaviour already in place (Gupta, 2010).
3.2 Research approach 3.2.1 Discourse analysis In this chapter we focus on different choices that can be made to include transparency concerns and instruments in the supply chain of leather as a forest-risk commodity. These choices are strongly structured by the societal discourses that actors in the supply chain adhere to, i.e. how they publicly discuss broad topics such as economic development, environmental conservation, and the rule of law. Such discourses may be centred around the ideal of nature conservation, economic development, or another important social issue, as we illustrate in the results below. Specifically, we consider how these public debates steer specific choices for specific policy

73
instruments, acceptance of responsibility, and valuation of deforestation risk. Moreover, we analyse how these discourses relate transparency to sustainability, legitimacy, and fairness.
The results are based on a discourse analysis (Scharp & Richardson, 2001; Hajer & Versteeg, 2005; Torfing, 2005) for the leather supply chain in Brazil. We understand discourse as “an ensemble of ideas, concepts and categories through which meaning is given to social and physical phenomena, and which is produced and reproduced through an identifiable set of practices” (Hajer & Versteeg, 2005, p.175). Such ideas, concepts and theories, in the context of this chapter, refer specifically to ideas about sustainability objectives, concepts of transparency, theories of fairness, and so on. These different elements of a discourse become connected and fixed in relation to each other in storylines. Accordingly, these storylines represent simplifications of reality that make the world manageable and possible (Behagel & Turnhout, 2011). For example, considering a commodity to travel across a supply chain makes the sharing of responsibility for negative impacts across different actors possible. We identify discourses as they are reproduced by a discourse coalition, which is “…a group of actors that in the context of identifiable set of practices shares the usage of a particular set of storylines over a particular period of time” (Hajer et al., 2006, p70; Elgert, 2012). Thus, we use a discourse coalition approach to understand how certain storylines are (re)produced and transformed by certain actors within the context of the leather supply chain in Brazil.
3.2.2 Data collection and analysis methods Data collected includes the review of publications, grey literature and qualitative data collected during an extended field work visit of the first author in the Brazilian states of São Paulo, Pará , Mato Grosso, Mato Grosso do Sul, and Rio Grande do Sul in May-July 2018. The collected qualitative data entail thirty-nine semi-structured, recorded, and transcribed interviews, in the form of face-to-face (thirty-one) and videocall (eight) interviews. Additionally, field notes, observation and notes based on unstructured interviews during visits to meat-packing plants, tanneries, farms, fairs and workshops were included in the analysis. Grey literature and online publications were used to enrich the analysis and to better understand the storylines supported by each discourse coalition. The criteria for choosing these publications were based on both a) snowball sampling – i.e. publications actively suggested by interviewees - and b) an active online search based on keywords distilled from the interviews and observations.
Interviewee selection was based on a broad set of criteria - including prominence of interviewees in key events, formalized networks, decision-making authority, impact of statements on the public discourse, and authorship of key documents. Additionally, snowball sampling was used. Given the vast territory of Brazil, as well as the diversity and extensive number of stakeholders involved, we aimed to use a non-probability sampling approach that allow covering those with important information power (Malterud et al., 2016).
Data analysis consisted of qualitative coding of the material in several rounds using the research software Atlas.ti 8. First, the transcribed material was reviewed and coded based on empirically emerging themes and concepts to identify major storylines and discourse coalitions. A second round of coding was applied based on the theoretical concepts and categories discussed in the first section of this paper. Here, articulations of transparency, sustainability, legitimacy and fairness in different storylines of diverse discourse coalitions were identified. All interviewees gave informed, prior and written consent to be recorded for the purpose of this research. The

74
quotes from the interviews are kept anonymous to protect economically, socially, and/or politically vulnerable respondents. The results are presented below. A short background is first offered on the history of deforestation in the Brazilian Amazon. After that, the main part of the results discusses three discourse coalitions and their major storylines as represented in the data.
3.3 Results
“The history of Brazil is the history of land grabbing and occupation” (Anonymous, Personal communication, June 7, 2018). As it is expressed in the quote, deforestation associated with cattle ranching in the Brazilian Amazon has developed as a result of a historical trajectory of socio-economic and political processes within the country. Large-scale economic exploitation of Amazonian forests started with the second rubber extraction cycle during the presidency of Getúlio Vargas (1930-1945), continued in 1960s under the nationalist slogan “integrate not to forfeit” (Integrar para não Entregar), in 1970s “Land without man to men without land” (Terra sem homem, para homem sem terra) and the construction of highways traversing the Amazon from north to south - Cuiabá-Santarém (BR-163) and from east to west - Transamazônica (BR-230). This mass migration gave rise to many unresolved social issues, including social injustice, land tenure conflicts, and violence against indigenous people and traditional communities.
The Amazon forests and the adjacent tropical savannah biome of Cerrado experienced another wave of exploitation and deforestation once Brazil started establishing its role as a major provider of agricultural commodities in the 1990s. Within the period of 1990-2003, cattle production within the Legal Amazon25 increased 240% and reached 64 million heads (IBGE, 2018). This contributed a to an annual 28 million ha of deforested land in 2004, the worst deforestation value in the history of the region (Kaimowitz et al., 2004; INPE, 2019). Due to low initial capital investment and consolidation of soy plantations in productive lands, cattle ranching has gradually become a major economic activity of the frontier settlements (Gardner, 2009; Pacheco, 2012). It has also become the most profitable way for demonstrating productivity on the land to seek land titles under usucapio or usucapt rules and avoid confiscation for Agrarian reform (Law 8,629 of 1993) once the title is obtained. Thus, in addition to a livelihood, cattle ranching has become an activity involved in land grabbing (grilagem) and land speculation (Bowman et al., 2012; Pereira et al., 2016).
Since the 1970s, international and national environmental NGOs have paid increasing attention to deforestation in the Amazon and played a crucial role in the establishment of protected areas, indigenous territories and extractive reserves for rubber tapping in the region. For privately owned lands, the Brazilian Forest Code of 2012 (Law 12,651/2012) constitutes an attempt of the federal government to limit deforestation. The Forest Code requires private land
25 The administrative unit of Brazilian Legal Amazon was established by Federal Law No. 5.173 (Art. 2) and surrounds the states of Acre, Amapá, Amazonas, Pará, Rondônia, Roraima, Tocantins, Mato Grosso, and part of Maranhão. Covering more than 5 million km2 (two thirds of Brazil), the Legal Amazon encompasses all the Amazon Biome, 37% of the Cerrado, and 40% of the Pantanal Biome (FAO, 2019).

75
owners to keep a certain percentage of their properties in the form of Legal Reserve (LR) and Permanent Protection Areas (PPA) depending on the biome they are located in. If a property is located within the limits of Amazon forest biome, legal requirements include the conservation of 80% of the land area in native vegetation as LR. This percentage is lowered to 35% in the Cerrado (Brazilian savannah), and to 20% in all other biomes. The Forest Code also established the system of Rural Environmental Registry (Cadastro Ambiental Rural, CAR) requiring all rural private properties to register in the national system and provide the georeferenced coordinates of the boundaries and remaining forests within the property (Azevedo et al., 2015). While registration of private properties under the CAR is required by law, deadlines to do so have been extended multiple times, recently to December 31, 2019 (SICAR, 2019).
Over the last decade, forest conservation strategies in the Amazon have become focused on politicizing commodity supply chains and bringing visibility to the impact of international commodity markets (Barbosa, 2015). In 2007, the Brazilian Institute of Environment and Renewable Natural Resources (Instituto Brasileiro do Meio Ambiente e dos Recursos Naturais Renováveis, IBAMA) published the “priority list” - largely known as “blacklist” - of municipalities where most deforestation takes place. This led to intense government control, “naming & shaming”, and restriction of access to federal credit. In 2009, the Federal Public Prosecution Service (Ministério Público Federal, MPF) of the state of Pará and IBAMA sued ranchers and slaughterhouses that deforested illegally and threatened to sue big retailers and supermarket chains that bought from them. The big slaughterhouses signed Terms of Adjustment of Conduct (TAC) agreements with the MPF in July 2009 committing to avoid purchases from properties with illegal deforestation (Gibbs et al., 2016; Barreto et al., 2017). At the same time, Greenpeace published a report called “Slaughtering Amazon”, where major meat and leather producers were accused of driving deforestation. This has led the biggest four Brazilian slaughterhouses - JBS, Minerva, Marfrig and Bertin - to sign a private agreement with Greenpeace, largely known as G4 Agreement or Zero Deforestation Cattle Agreement. Under this agreement, the slaughterhouses agreed to put monitoring and auditing systems in place to avoid being involved with deforestation. Two subsequent operations called Carne Fraca (Weak Meat) and Carne Fria (Cold Meat) in 2017 revealed more illegality and corruption in the sector. In 2017, Greenpeace left the private agreement citing a lack of sincere efforts and robust measures by the slaughterhouses to act on deforestation risk (Greenpeace, 2017). In 2017, IMAZON published a wide-spread report demonstrating the extend of illegality still existing around the meat industry of the region (Barreto et al., 2017).
Historical developments have produced strong public debate around issues such as who is responsible for increasing environmental degradation and deforestation in the Amazon region; who should bear the costs; what kind of measures are considered indiscriminate and fair. Within this context, different actor coalitions frame historical events in a distinct way and engage in a discursive production of reality through certain storylines and practices. Based on the collected data, we identified and named these discourse coalitions as 1) Order and Progress (Ordem e Progresso) 2) Livelihoods and 3) Zero deforestation. We present the coalitions and their discourses below.

76
3.3.1 Order and Progress The discourse of Order and Progress is found in the national motto of Brazil and in slogans such as Integrate not to forfeit. This discourse is institutionalized in many policies and policy instruments, and its supporters can be mainly found in major government agencies, producer associations, roundtables, and the private sector in general. By representing a dominant discourse in public debates around development of the Amazon, it has historically developed to include the storylines of a) Brazil as a green producer, b) sustainability as legality, c) equal but differentiated responsibilities.
a) The major storyline of this discourse is of Brazil as a green producer and exporter that feeds more than 1.5 billion people across the globe. The world has hunger and Brazil feeds it. From being a net food importer in the 1970s, Brazil transformed itself into a net food exporter today and has established itself as an important producer of agriculture products/commodities. The country aims to strengthen its position as a provider of agricultural products by planning on increasing the production to reach 13.7 million tons of beef by 2030 (GTPS, 2018).
The storyline of green production argues that Brazil should be applauded for managing to secure its position as an important producer and exporter of agriculture products while allocating 30% of its territory for conservation and indigenous territories. It also argues that Brazil invests a lot in solidifying agriculture lands and intensification of production. Intensive and technology-based agriculture is the future for Brazil and for the world.
With technology, engaged people and sustainability, Brazil sets the example in production and conservation, being a reference in the fight against hunger and showing the path to other nations (Ciasulli, 2019).
This storyline also emphasises that Brazil is a proud producer of bovine leather products and exports leather to around 80 countries in the world (CICB, 2018). High quality and socio-environmental standards is said to allow Brazilian leather to be used in fashion, upholstery and the automotive sector. The leather industry moreover embraces the philosophy of circular economy and argues that it turns the biological waste of the meat industry at the slaughterhouse into valuable items.
The unprecedented growth of Brazilian exports is thought to have scared its competitors. Thus, the story goes that environmental organizations get sponsored by international funds who work against progress of the country: the environmentalist agenda is strategically used to slow down the economic growth of Brazil and to attach negative associations to its production, instead of recognizing the sustainability achievements of the country.
…Sustainable development has three pillars, economic, social and environmental. Just the way the US has been recognized for its economic power and Norway for its successful social reforms, the example of Brazil in environmental sector should be recognized internationally. (Anonymous, Personal Communication, 8 June 2018).
b) The second storyline of the Order and Progress discourse is that sustainability is equal to legality. It argues that the percentages established by the Forest Code of 2012, the CAR system and the forest monitoring systems developed by the government create reliability and transparency that allow effective governance. Accordingly, the storyline argues that NGOs’
77
request to make public Animal Transport Guides (GTA) for tracking animal transport across farms as both unacceptable and unnecessary, as transparency over this kind of information can disrupt the market and compromise already achieved regulatory success.
The idea behind the storyline that sustainability equals legality is that Brazil has one of the most robust environmental legislations in the world. Sustainable production is the one that follows legal rules and regulations. Zero illegal deforestation by 2030 is the main target. Zero gross deforestation requirements26 put forward by the environmental NGOs are therefore considered an “unconstitutional and illegitimate NGO hoax” (Anonymous, Personal Communication, 27 June 2018) for demanding higher standards than those set by federal laws. It directly interferes with sovereignty of Brazilian government over its own territories. Brazil has already “lost” its territories to international forces when conservation areas and indigenous territories were created. Zero deforestation requirements are another way to make Brazil lose its control over Amazonian resources.
So, the reason why we didn’t use just one criterion, let’s say zero deforestation as a proxy to sustainability? Because we have a lot modern legislation on conservation of natural vegetation inside the property. When we have been discussing indicators and forest conservation inside GTPS, the forest code was also under discussion. It was approved in 2012. This legislation allows certain % of your property to be cleared legally. And not all areas in Brazil have been already cleared. If I have an area that I inherited from my family and if my grandfather used only 5% of the area, then I have the right to use the other 15% m (Anonymous, Personal Communication, 11 May, 2018)
c) The third storyline of Order and Progress discourse focuses on equal but differentiated responsibilities. It argues that developed countries have exploited their rights to deforest and develop, while the same rights are being denied to Brazil. If Brazilian forests provide ecosystem services for the whole world, then the Brazilian government should be supported with conservation efforts and landowners need to be financially compensated for keeping forests intact within their private territories. It is also considered unjust to demand of farmers to give up their legal right to deforest. Payment for Ecosystem Services and other mechanisms are therefore needed to help farms to compensate for the foregone profit per head of animal. Consumer markets abroad must pay a premium for environmentally friendly products that Brazil is producing, including beef and leather.
26 Zero deforestation has become an umbrella concept to direct the requirements, commitments and policies for achieving deforestation-free economy. However, the nuances of using the concept have diverse implications for national and global forest governance. At the international level, the main point of divergence is between the concepts of zero net and zero gross deforestation. Zero gross deforestation excludes native vegetation clearing and conversion of forests at any cost while zero net deforestation allows certain conversion to be compensated later by planted forests (Linhares-Juvenal & Neeff, 2017). In Brazil, the discussions around zero deforestation focuses on zero legal and illegal deforestation. The Forest Code of 2012 allows certain percentage of native vegetation clearing in private properties according to biome types. Nationally Determined Contributions (NDCs) of Brazilian government support zero illegal deforestation by 2030. When it comes to cattle, while public Terms of Adjustment of Conduct (TAC) between Public Prosecutor and major slaughterhouses in 2009 addresses zero illegal deforestation, private G4 agreements between Greenpeace and four main slaughterhouses in 2009 puts a commitment to stop zero legal deforestation as well in sourcing farms.

78
In addition to its focus on financial compensation, the storyline argues that Brazil pays high cost for being rich in biodiversity as a country. While Brazilian cattle production is mainly based on open pasture lands, Brazil is considered to face unjust discrimination in international trade. It is argued that nowhere in the world a rural farm is required to keep forest reserve within their private properties and yet Brazilian farmers face a bad reputation linked to deforestation (Miranda, 2019). Thus, Brazil carries double costs – the one linked to preserving the forests even within the rural properties, plus the cost of a negative international reputation that affects sales and premiums.
3.3.2 Livehoods Smallholder farms of settlements, best-practice farms (PECSA, São Marcelo, etc.) and solution-oriented NGOs (Amazon Environmental Research Institute (IPAM); The Nature Conservancy Brazil (TNC); Instituto Centro de Vida (ICV); Amigos da Terra – Amazônia Brasileira; National Wildlife Federation; IDH – Sustainable Trade Initiative; Earth Innovation Institute, WWF Brazil, etc.) connect around the discourse of socio-economic livelihoods. While they do not necessarily share deep social and environmental values, their interpretations of certain events and realities come together in storylines of a) how socio-economic-factors cause deforestation, b) that land tenure is at the core of the deforestation issues, and c) finding local solutions.
a) The central storyline of the discourse is that historical and structural socio-economic factors lead to deforestation. The storyline highlights the issue of fairness and historical injustice. It argues that settlers were promised to find economic opportunities in the middle of the forest and that they are cheated when faced with reality and hardships of everyday life. This is a central element of the collective memory in many settlements. Lack of proper settlement planning, shortage of public services such as schools and medical centres strengthen this storyline. While it was a government initiative and policy to occupy Amazon in the 1960s, settlers are now paying the cost of deforestation and are being scrutinized as criminals. The government repeatedly failed to deliver its promises, while putting pressure on farmers through command and control mechanisms.
The Minister of Environment arrived by helicopter with armed forces and put that into 6 pm news calling everyone in the area bandits. This is not something you want to see with your children. So, there has been a lot of resentment building up against the federal government. They confiscated millions of cows from the public land that should not be used. That was a big a shock for the area, where cattle mean money and livelihood (Anonymous, Personal Communication, 28 May, 2018).
b) The second storyline of the Livelihoods discourse frames land tenure as at the core of the deforestation. Obtaining land titles is a slow and bureaucratic process that incentivizes illegality. Insecure land rights incentivise actors to maximize their profit in a short time through exploitation of forests. Thus, supporters of this discourse argue that government should work efficiently in clearing up land disputes and allocating the titles if the aim is to reduce deforestation.
Associated with the land tenure issue is the argument that conservation of 80% is an extra burden upon a farmer due to costs of forest management plan, fighting forest fires, managing the attack of wild animals, and so on. The storyline holds that responsibility and cost of forest

79
conservation is pushed upon private properties, a function that a government is responsible for in any other country. It moreover argues that if forest conservation is important for the government, then it needs to implement proper zoning and distribute lands only in the areas that are good for production. Besides, allocating “undesignated” public lands to a certain category of protection or usage is considered key to stopping land grabbing and associated deforestation in public forests.
Insecurity of the tenure situation is compounded by the postponing of deadlines for the CAR registry, regular changes and differences in percentages of allowed deforestation and cut-off dates. Supporters of the Livelihoods discourse argue that transparency and CAR registry requirements will not address leakage of deforestation to elsewhere as long as it is profitable to be illegal.
One of the things in the Forest code is that it defines what smallholders had in terms of native vegetation up to 2008 as their legal reserve. So, what signal do you give once again? You are a smallholder and I am a smallholder. I am a bad person and I had a plot of land of 100 ha and I opened 100 in 2000. We both moved in 2000 and you were too concerned about environment and you opened only 10 ha. And comes the law of 2008 or 2012 and it says, I am ok. I can still have cattle, soy or whatever in my 100 ha and you can only open another 10% if you are in Amazon biome and if you have a license. So, what does it say today? Being illegal is ok. (Anonymous, Personal Communication, 4 July 4, 2018).
c) The third storyline of the discourse puts preference on finding local solutions through better farming practices, and fair benefit and cost sharing, as opposed to “naming & shaming” techniques. In the past, when NGOs pressured slaughterhouses and retailers to act, the latter did not invest in farm sustainability and just sufficed with “black-listing” and boycotting. These actions had local repercussions at a deeper level. It eroded trust in and weakened support for environmentalist agenda of the NGOs and that of the Brazilian government at the time. New zero legal deforestation requirements without compensation are therefore considered unfair. Compensation mechanisms are necessary to support farmers to intensify and adopt best practices and make them conserve forest reserves on their land. In other words, if 20% of the land is the limit for forest conversion, then consumers need to take responsibility and be ready to pay local farmers for it.
…and then comes Greenpeace and says: “You did deforestation, you are a criminal”. So, they don’t understand the historical process of the Amazon, and they criminalise our production. The day Greenpeace arrives here to see and understand the agrarian system and the distribution of land, and the difficulties we are going through, 60% to 80% of the problems can be solved (Anonymous, Personal Communication, 22 May, 2018).
Another local issue that is debated is that slaughterhouses have a power to dictate the price of cattle and do not offer a premium for sustainability. The only premium that is offered is for the quality of meat. While farmers get paid per arroba (1 arroba= 15 kg) of meat, they do not get compensated for animal skin for the leather industry. The profits gained by slaughterhouses and tanneries are not reaching the farmer, the real producer of the product. Meanwhile the farmers are required to maximize their profit within the limit of 20% allowed land, to invest in

80
traceability and intensification. If leather brands want sustainable and deforestation-free leather they must sit at the roundtable with producers, engage and make sure the payment for sustainable production reaches the farmers.
What they are doing today is push the responsibility of preservation only upwards on the producer…Nowadays, the Prada brand is valued more than the standing forest (Anonymous, Personal Communication, 23 May, 2018)
3.3.3 Zero deforestation Following the historical discourse of conservationists that biodiversity is the global “heritage of humankind” (UNESCO 1972) this discourse coalition, with prominent supporters such as Greenpeace, the federal Brazilian agency IMAZON, international scientific journals and ecologists, public prosecutors, Brazilian Institute of the Environment and Renewable Natural Resources (IBAMA) considers Amazon forests as the heritage of all humankind and its protection the duty of everyone. It includes the storylines of a) the possibility of a ‘tipping point’ of the Amazon biome, b) robust measures for forest protection, and c) the danger of reverse incentives.
a) The first storyline is about the concern around tipping point of Amazonian deforestation. Only 1% of Amazon forests were deforested in 1970s and today the percentage of deforested forest areas in the region is 20%. Scientists argue in journals such as Science and Nature that the continuous deforestation coupled with feedback loop of climate change can exacerbate situation to the point of no return and have catastrophic consequences for the whole planet (Lovejoy & Nobre, 2018). This involves a tipping point where the hydrological cycle of the rainforest would be broken, effectively turning the whole Amazon into a dry forest or a savannah type of biome. Thus, no further deforestation should be allowed, whether legal or illegal. Moreover, reforestation in already deforested areas and properties with environmental liabilities should start immediately. This also requires that consumers adjust their diets to exclude forest-risk commodities and hold the businesses that deforest accountable. The storyline also argues that supermarkets, leather brands and slaughterhouses carry direct responsibility and publicly pressuring these downstream actors is therefore an effective strategy.
b) The second storyline of the Zero Deforestation discourse argues for robust and beyond-current-legality measures to protect the forests. The Forest Code and its provisions are not considered enough to protect the Amazon. Rather, legal measures for forest conservation in Brazil are considered the result of long-lasting political debates and agriculture lobbying, and therefore not the most effective and legitimate. Supporters of the discourse moreover argue that 58 of the 84 articles of the 2012-revised Forest Code (i.e. the current Forest Code) infringe on the Brazilian Constitution and should be withdrawn. These articles are considered to favour deforestation and remove environmental protections. For example, Article 12 (a) allows Amazonian states to reduce the legal reserve requirement for rural properties from 80% to 50% if conservation units and indigenous reservations make up more than 65% of their territory (Freitas et al., 2018).
The idea of “lets first deal with illegal deforestation and then find solutions for the legal one” is not supported as a robust measure. The extent to which legal deforestation is inherently

81
sustainable is strongly questioned. Ever changing baseline cut-off dates, amnesties to forgive first pre-1998 and then pre-2008 deforestation and de-regularization of protected areas are argued to demonstrate significant flaws in the capacity of current laws and regulations to preserve the forests. The current Forest Code is moreover thought to be too lenient on landowners and influenced by the rhetoric of agrobusiness. That is the reason why in 2016 Greenpeace started the campaign for a “Zero deforestation law”.
The Forest Code and CAR are thought inadequate to provide enough transparency over cattle and meat and leather supply chains. With current rates of registration, it will take decades for the Secretariat of Environment and Sustainability (Secretarias de Meio Ambiente e Sustentabilitade, SEMAS) to check and verify the forest reserve of the CAR registries. At the same time, there is still a great deal of illegality and informality happening in the sector. GTAs should therefore be made public to trace individual animals and be linked to CAR registry to have a better and more reliable monitoring system and avoid leakage of deforestation risk. Slaughterhouses should start identifying and monitoring their indirect suppliers, while producer associations in different states should help making GTAs transparent.
Robust measures mean that every actor in the cattle supply chain is thought to carry responsibility, including retailers/supermarkets, the leather tanneries and their customer brands. Pressuring these consumer-facing actors with reputational risk is the proven way to achieve some change in the sector since MPF prosecutions and the report of “Slaughtering Amazon” and “Hora di Conta” in 2009. With or without power to change the practices on the ground, the leather sector cannot source illegal and deforestation risk leather. It needs to invest in traceability and send clear signal to upstream producers: everybody needs to participate in this ethical call.
About 70% of the slaughter capacity is now owned by slaughterhouses that signed an agreement with the Public Prosecutor to stop buying from the areas that illegally deforest. So, we still have about 30% of slaughter capacity that is owned by companies with no commitments. And this 70%, although they have the commitments, they still deal with direct suppliers. So, we still have problems with control. Today we cannot say for sure that any cattle are deforestation-free. So, we cannot talk about deforestation-free leather either. [..] It is very important that market takes a position. It is more likely for ranchers to listen to the market than to public policy or NGO (Anonymous, Personal Communication, 24 May, 2018).
c) The third storyline of this discourse is framed around the danger of reverse incentives through compensation, premium prices and intensification of the production. It is the ethical duty of the farmers to produce sustainably and responsibility of the supermarkets to make sure that all products are sustainable by default. The citizens and consumers are still exposed to deforestation and social crimes via the beef they find in the supermarket shelves. If slaughterhouses and supermarkets do not fully control their cattle supply chain, consumers have little power to avoid complicity in a problem that they are not responsible to solve. A premium for sustainability is then a wrong incentive in the case of Brazilian beef.
I don’t want to enter a supermarket and have a choice of paying extra for a meat without deforestation and illegality. What does it mean? That the rest of the meat
82
products are illegal and with deforestation risk? (Anonymous, Personal Communication, 26 June, 2018).
The argument against paying a premium for avoided deforestation is moreover that society and environment have paid enough historically for deforestation and illegality. Examples are historical and current violence against indigenous people and traditional communities as part of deforestation and land use change. The storyline thus expresses the idea that it is not fair to ask for compensation to stop doing illegal and unsustainable activities, it is a wrong incentive. It is also not fair that the taxpayers are paying for government projects to monitor the deforestation, rather than agribusiness for example. Brazilian society also pays indirectly by experiencing the economic crisis and negative reputation of the Brazilian production abroad.
In this storyline around incentives, the commodity of beef or, more in general, meat is also identified as the worst environmental problem today and the number one contributor to climate change: it leads to deforestation, methane release, extensive virtual water footprint and pollution of water systems through animal waste. Intensification can support the growing demand for meat up to certain extent, however at some point more land will be required. Instead of investing valuable resources into intensification we need to rethink our diets and change to plant-based products. By proxy, this also extends to the use of leather and plant-based alternatives such a “fruitleather”.
83
3.4 Discussion The three discourses discussed above all include references to sustainability, legitimacy, and fairness. Moreover, they articulate how these issues should be understood and how transparency in specific parts of the supply chain can address these issues. These political discourses therefore suggest multiple points of emphasis in which a leather supply chain should be organised (Figure 17). This diversity of the emphasis creates a basis for what kind of transparency is considered important and where, upon which actors and towards which subjects the efforts of data collection and monitoring are thought essential (Flyverbom, 2016; Gardner et al., 2018). Discussing these therefore also leads us to explore the political dimension of making the leather supply chain visible. We thus find that transparency and deforestation risk are inherently political terms and should be acknowledged as such in order to create sensitivity to local needs and previously excluded voices.
As a point of reflection, it is important to mention that discourse coalitions do not possess rigid boundaries and coalition members might travel from one discourse to another across storylines, even though antagonistic relations between different discourses often prevent this from occurring. For example, although IPAM was included in the Livelihoods discourse coalition, their leading efforts and campaign for zero deforestation in Brazil is well recognized by many stakeholders (although their approach to achieve zero gross deforestation might differ from that of Greenpeace). Indeed, discourse analysis demonstrates that actors can be part of a discourse coalition without necessarily sharing deep values or core beliefs (Hajer et al., 2006).
3.4.1 Sustainable, legitimate, and fair supply chains Our analysis of the various storylines of each of the three discourses brings attention both to what is made visible and invisible within each political discourse. For sustainability this play of visibility leads to different interpretations of the term (Newberry 2013; Pirard et al., 2015; Higgins & Richards, 2019) (Figure 18). While the Order and Progress discourse focuses on the need to recognize Brazil as an important producer of agriculture products, it also seeks recognition for the efforts made to achieve good environmental governance. By focusing on the “greater good” of feeding the hungry world, the discourse sheds light on the increasing demand for agriculture products worldwide, while issues such as inefficient food distribution and correlation between rise of middle class and demand for beef are overlooked. The definition of sustainability by the Livelihoods discourse puts much more emphasis on social aspects such as land tenure, historical injustices, and economic vulnerability of settlers. In some cases, this emphasis might direct the attention away from global demand for cattle and agriculture products as important driver of deforestation and from the attempts to find global solutions. Finally, the framing of sustainability by the Zero Deforestation discourse puts a lot of emphasis on environmental aspects and sustainable supply chains are framed as deforestation and land-conversion free. This discourse tends to overlook the lack of agency and vulnerable positions of local farmers.
Legitimacy, for the Zero Deforestation discourse, means to effectively conserve the Amazon. More transparency and traceability are therefore considered as an appropriate tool for deforestation-free commodity supply chains. Within cattle supply chains this could be achieved

84
through tracing indirect suppliers (second or third tier calf suppliers) or by making GTAs publicly available. This type of legitimacy is however challenged by the Order and Progress discourse based on an understanding legitimacy as legality - zero legal deforestation is not a requirement by law and third-party actors have no legitimate power to require that from farmers. The political legitimacy of zero gross deforestation is further undermined by claims that it serves the agenda of foreign countries and private funds averse to Brazil developing as an economic power. Building on this idea, the Livelihoods discourse emphasises consent as an important dimension of legitimacy. It is farmers’ right to deforest 20% of the forest within their private properties (in the Amazon biome) and consenting to give away that right can only be reached upon agreement and compensation. In contrast, the Zero Deforestation discourse challenges the legitimacy of government regulations, the Forest Code and farmers’ legal rights to deforest by pointing to the power of agricultural lobby in legislative branches of the government, to corruption, and to historical land occupation and speculation.
A fairer distribution of benefits and responsibilities is considered the purpose of transparency in all discourses. However, the questions of “which fairness, for whom and why?” is relevant here (Howard et al., 2016). Different dimensions of fairness are emphasised in the different discourses. The Order and Progress discourse considers it unfair that the economic and societal costs of conserving forests are left upon Brazil alone while other countries had the chance to exploit their resources for their economic growth. Thus, the emphasis is upon common but differentiated responsibilities (CBDR). The Livelihoods discourse views fairness from the lens of historical injustices towards settlers and farmers. Pushing the cost and responsibility of sustainable and deforestation-free cattle upstream to small farmers within this context is unfair. The Zero Deforestation discourse, on the other hand, uses global ethics as a basis for fairness. Deforesting forests that are rich in biodiversity to satisfy increasing consumerist culture and gain short-term profits is ethically wrong. Inter- and intragenerational injustices are also complementary elements of fairness framed by this discourse.
3.4.2 The politics of transparency The sustainable supply chain is not just an economic or managerial term, but also a political one. As deforestation risk of bovine leather is articulated by different discourses, questions about sustainability, legitimacy, and fairness are answered differently. As a result, we see that any choice about how to mitigate deforestation risk of bovine leather depends on the political reality of the actor making that choice. Deforestation risk is invisible in the Order & Progress discourse so long as cattle is raised and produced within the boundaries set by law and legality. In this discourse, the leather supply chain is inherently sustainable thanks to progressive laws that govern the country. The Livelihoods discourse does acknowledge the strong presence of risk on deforestation but calls upon leather brands and tanneries to take responsibility for mitigating this risk. They need to engage with suppliers by sharing the costs and benefits in exchange of transparency of information. The Zero Deforestation discourse points to gaps in legal protection of the Amazon and understands deforestation risk as a more systematic issue, tied to illegal deforestation, political dynamics, and consumerism.

85
Figure 18. Play of emphasis and visibility of different elements of sustainable supply chains by different discourses
Source: author’s own elaboration
In addition to debating sustainable supply chains, transparency, and deforestation risk as political terms, it is important to highlight the relevance of livelihoods as part of the forest-risk commodity debate. Our results showed the importance of the role and voice of frontier settlers and legal cattle farmers in public debates, by presenting their storylines along with as part of a discourse on livelihoods. Internationally, public debates on zero deforestation and sustainable supply chains have thus far mostly represented local and international nature conservation organizations, governments and businesses (Taravella & de Sartre, 2012; Pirard et al., 2015; Newton & Benzeev, 2018). While the importance of including local livelihoods in the articulation of international forest policy has been taken up in public debates about policy instruments such as REDD+ (Agrawal & Angelsen 2009; den Besten et al., 2019), such debates are less visible for supply chain governance. Moreover, most programmes that focus on local livelihoods of settlers in Brazil often do so as part of ‘low-carbon agriculture’ initiatives, instead of directly addressing deforestation risk (Newton et al., 2016)
3.5 Conclusion For the leather supply chain, we found multiple calls for greater traceability in the beginning (or ‘upstream’) of the supply chain, i.e. the farmers that rear cattle. Our analysis however showed that this might have negative implications for the fairness of policy interventions and result in ineffective policies that shift the problem to vulnerable actors rather than solve it. The

86
discursive framing of sustainable and transparent supply chains across different discourses moreover has direct impact on how visibility is created (Scott, 1998; Flyverbom, 2016). What may be legitimate calls for ‘zero legal deforestation’ thus still need to include the voices of local farmers and workers if the aim is a leather supply chain that is not only environmentally sound but also socially just. In the past in Brazil, zero deforestation requirements and boycotts in the state of Pará (Gibbs et al., 2016) have been experienced as negatively affecting local livelihoods to a great extent. This has resulted in a lack of trust and ownership around zero deforestation commitments by local farmers as they consider themselves “sandwiched” among discourses of government, agricultural lobby, global food markets, and environmental NGOs. Public debates about deforestation-free sustainable supply chains should moreover be held by different levels of governance as well, as discounting legal, domestic efforts to curb deforestation as ‘not enough’ can bring about negative political dynamics rather than higher environmental ambition, as is clearly seen today in the current political situation of Brazil. Acknowledging and giving voice to all relevant stakeholders is therefore key to having a debate that can overcome political divisions and discursive antagonisms.
Our analysis confirms the idea that a simplistic understanding of transparency or a blind trust in its inherent goodness may lead to negative implications for livelihoods and sustainability outcomes (Klintman & Boström, 2008; Gupta, 2010). Visibility without further engagement and investment causes actors to become economically or politically vulnerable and erodes trust in the system, thus jeopardizing the success of zero deforestation commitments. Even so, our analysis also leads us to believe that transparency is a pre-requisite for sustainability. We argue that the possible success of zero deforestation strategies for the Brazilian leather supply chain will largely depend on the ability to consider the arguments of all three discourses. This means that zero deforestation requirements and commitments by businesses should consider forests as part of socio-ecological systems that include important economic and social dimensions. Social criteria need to go beyond labour standards, land rights and community consultation, and include environmental justice and support for local livelihoods (Newton et al., 2018). Currently, the zero deforestation criteria proposed by environmental ambitious actors are neither considered legitimate by law nor by farmers, nor as an internal norm of market or leather supply chain. As the current Brazilian government is unlikely to change this situation (Wallace, 2018; O’Sullivan, 2019), it is now up to international leather markets to find mechanisms for transparent and inclusive supply chains that may bring the ambition of zero deforestation in the Amazon a little closer.

87
4 Embedded deforestation in the Brazilian-Italian bovine leather trade27
The latest progress report of 2014 New York Forest Declaration (NYDF) shows that the political ambition of “halving tropical deforestation by 2020 and ending it by 2030” is far from being on track. On the contrary instead, since the NYDF was endorsed, average annual humid tropical primary forest loss has accelerated by 44% (NYDF Assessment Partners, 2019). Among the important drivers for these trends, the report is pointing out to the market demand for commodities the production of which leads to deforestation and land use change in the tropics. Another important driver is the massive difference (almost 15 times) between global “green finance” aimed at forest conservation and reforestation and “business as usual” grey finance that supports destructive agricultural and industrial processes through different financial flows (NYDF Assessment Partners, 2019).
In the verge of the ratification of EU-Mercosur Free Trade Agreement the topic of underlying drivers of tropical deforestation in the form of global demand, trade liberalization and grey finance is being revisited. The letter addressed to the European Commission by 24 national and international non-governmental organizations (NGOs) in 2018 (FERN, 2018) points out that “removing trade barriers with this region would increase European demand for cheap, unsustainable agricultural products and biofuels from South America, drive additional deforestation and conflicts over land, contribute to wildlife trafficking, biodiversity loss and higher overall greenhouse gas (GHG) emissions”. As already stressed in the Introduction, in another letter published on Science journal more than 600 scientists and 300 Brazilian Indigenous groups urged the European Union (EU) to reconsider the trade agreement and put human rights and deforestation above economic gains (Kehoe et al., 2019). The indigenous communities in Brazil and organizations such as Amazon Watch trace the destruction of forests to European and North American companies’ financial flows. They call for EU-led sanctions and boycotts on the Brazilian commodity trade to stop the destruction of the natural ecosystems (Amazon Watch, 2019).
As already mentioned in the Introduction chapter of the thesis, the negative externalities of large-scale industrial production and commodity trade for years have preoccupied the scientific community as well. By studying land-use change in a globalized world Friis & Nielsen (2019) capture combined socio-economic and environmental interactions, feedback mechanisms and spillover effects over distance and across scales through the concept of telecoupling. Pendrill et al. (2019) estimate that around 29–39% of deforestation-related emissions, as part of carbon footprint of forest-risk commodities such as beef and oilseeds, are driven by international trade. Sandström et al. (2018) show that land use change embedded in the commodity production in tropical countries is an important contributor to GHG footprints of EU diets. Kanemoto et al. (2013) point out how international trade in commodities undermine national emissions reductions targets due to leakage of the impacts to other countries. In yet another study Pendrill et al. (2019a) discuss the “displaced” deforestation as the countries that were either slowing 27 Mammadova A., Masiero M., Pettenella, D. (to be submitted to Forest Policy and Economics). Embedded deforestation in the Brazilian-Italian bovine leather trade.

88
deforestation rates or even increasing forest cover on their own territories in 2005–2013 (e.g., European countries, China, India, Russia), are also the ones that import most of the products with embedded deforestation from somewhere else. According to the estimates, embedded deforestation equalled about one-third of the net forest gains in these countries.
Agriculture-driven deforestation is affected by agricultural output prices: if trade liberalization brings changes local agricultural prices, that liberalization reinforces and increases deforestation (Robalino & Herrera, 2010). By focusing on Brazilian Legal Amazon (BLA) and using standard and spatial econometrics, Faria & Almeida (2015) argue that the increase in openness to trade and increase in deforestation are positively correlated. Harstad & Mideksa (2019) argue that trade liberalization makes it beneficial to capture market share by discouraging competitors and, as a result, illegal deforesters gain positive signals that might finally encourage them to continue with deforestation.
Since Brazil has transformed itself into a global powerhouse of agricultural production and exports, its natural ecosystems have experienced serious damages as well (Gibbs et al., 2010; Hosonuma et al., 2012; Nepstad et al., 2014). According to the estimates of the Organization for Economic Cooperation and Development (OECD), by 2030 Brazil will strengthen its leading position in producing soybeans, and its exports will outperform global trade growth for maize and beef (OECD, 2017). Since the country has historically relied on extensive agriculture at the expense of natural vegetation in mainly Cerrado and Amazonian biomes, more production and more trade are also being feared to have catastrophic consequences pushing the forests to the tipping point (Lovejoy & Nobre, 2018; Niranjan, 2019; Harstad, 2019). The EU is Brazil's second-biggest trading partner, accounting for 18.3% of its total trade (Figure 19). In 2017 the total value of Brazilian exports to Europe was equal to $30.7 billions, 50% of which were agricultural products, followed by metals and minerals (33%) and forest products (10%). The embedded deforestation in the EU imports goes beyond the supply chains of major forest-risk commodities as the EU is also the second biggest importer of by-products such as bovine leather (Comtrade database).
Italy ranks fourth among EU countries that trade with Brazil (Comtrade database). For some forest-risk commodities the country holds a leading position among trade partners for Brazil. Considering this, as well as historical and cultural relations between the two countries, it is worth exploring the risk of deforestation and land use change embedded in Brazil-Italy trade and accumulated over time. As a traditional bovine leather manufacturing country, Italy is importing a large share of bovine skins from Brazil. Given the role of cattle in deforestation and forest degradation in Brazil, we assume most of that impact is also embedded in the supply chains reaching Italy. By focusing on BLA as an administrative unit with most of the agriculture driven deforestation, we attempt to understand the extend of animal hides and leather originating from this area and being exported to Italy. An assessment and mapping of the deforestation risk in the trade relations between the two countries could create necessary basis for the future studies on quantifying that risk or other relevant dimensions (e.g. GHG footprint) linked to deforestation.

89
Figure 19. Around 18% of all Brazilian exports in 2018 were destined to EU (indicated in blue)
Source: Comtrade database.
With the aim to set a general scene and to explore the extend of the trade in major forest-risk commodities between Brazil and Italy we used the UN Comtrade database and annual trade statistics based on commodity codes and importer-exporter classification. The Resource Trade platform by Chatham House (2019) was another source for exploring this type of data. The reports by the Central Bank of Brazil provided details of financial transactions between Brazil and the EU as well as Brazil and Italy.
With specific reference to the trade in leather, data employed for the analysis was searched at three different geographical levels and each of these levels has different sources:
a) Overall annual leather trade statistics between Brazil and Italy, at the national level, for the years 2014-2018 and 2018: UN Comtrade database, based on eight-digit Harmonized System (HS8) of tariff nomenclature (see Annex 4 for a detailed description of codes).
b) Overall annual leather trade statistics between Brazil and Italy, at the municipality/state level exports, for the years 2014-2018 and 2018: COMEXSTAT database (previously, ALICEWEB) used for accessing Brazilian foreign trade statistics. Within the database, exports and imports of Cities (Municipalities) offer monthly data from 1997 to the current year, as well as detailing of countries, blocks, harmonized system (only HS4, Chapter and Section), state and city of tax domicile of the exporter/importer.
c) Annual leather trade statistics between Brazil and Italy, at the exporter-importer level, for the year 2018, in metric tons: custom declarations, based on both HS4 and HS6 codes.

90
With the aim to harmonize the data obtained from different sources as well as for the simplicity of analysis and communication, the results are presented based on three major steps in leather processing: a) preservation of raw hides; b) wet-blue (or chrome-free) tanning and crust; and c) leather finishing. These three oversimplified steps are also reflected in HS4 codes:
• HS 4101- Raw hides and skins of bovine (including buffalo) or equine animals (fresh, salted, dried, limed, pickled, otherwise preserved but not tanned, parchment dressed or further prepared), whether or not dehaired or split - hereinafter raw or salted hides;
• HS 4104 - Tanned or crust hides and skins of bovine (including buffalo) or equine animals, without hair on, whether or not split, but not further prepared - hereinafter wet-blue or semi-processed leather;
• HS 4107- Leather further prepared after tanning or crusting, including parchment-dressed leather, of bovine (including buffalo) or equine animals, without hair on, whether or not split, other than leather of heading 41.14 – hereinafter finished leather.
4.1 Results Results are presented by distinguishing into Italian imports of forest-risk commodities from Brazil, some general information about Italian leather industry, Italian imports of leather from Brazil based on HS codes, states and importer and exporter data and finally the exports of leather products from Italy.
4.1.1 Italian imports of forest-risk commodities from Brazil From a business and investment perspective, the EU-Brazilian relations can be categorized on three fronts: trade, investments and financial assistance from banks and other financial institutions. Brazil is the single largest exporter of agricultural products to the EU after China. Besides direct trade, the EU is also the biggest foreign investor in Brazil. In 2015, the EU invested 48.5% of its Latin American investments in Brazil (Table 6).
As shown in Figure 20, agricultural products make up the major share of the Brazilian commodities imported by the EU. Although among European importers Germany leads the list for total imports, Italy is among the top 5 importing countries. In 2017 Italian imports of Brazilian commodities were worth USD 3.2 billion in value (Resource trade database by Chatham House).
When it comes to individual commodities such as beef and bovine leather, the commodities with the higher footprint on deforestation due to cattle ranching, Italy ranks first for the imports in 2017. In the same year Italy ranks fifth with regard to soybean imports. More in detail, Italian beef imports accounted for USD 158 million, bovine hide and leather imports USD 349 million and soybean imports USD 144 million in value (Figure 21) (Resource trade database by Chatham House).

91
Table 6. Direct investment liability positions – 2010 and 2015. Equity - Immediate investing country and ultimate investor country, billion USD and relative incidence on total values
Source: Central Bank of Brazil, 2018
Figure 20. Top 5 importing EU countries (on the left), and top 5 imported commodities (on the right), from Brazil in 2017, billion dollars
Source: Resource Trade database by Chatham House.
As for Foreign direct investments (FDI) Italy ranks among top 10 European investors in Brazil (Table 6). Italy also channels 50% of the total FDI to Brazil through the Netherlands, the biggest investor country in Brazil (Central Bank of Brazil, 2018) (Figure 22).

92
Figure 21. Top 5 EU countries importing Brazilian beef; bovine hide and leather; soybeans in 2017, million dollars
Source: Resource Trade database by Chatham House
Figure 22. Countries channelling direct investment equity to Brazil through the Netherlands
Source: Central Bank of Brazil, 2018

93
4.1.2 Italian leather industry The leather industry in Italy is comprised of: (i) tanneries (full cycle, wet-blue processors and crust processors), (ii) sub-contractors, such as dryers, millers, buffers, printers, supporting industries such as tanning machinery, chemicals, logistics, depuration, (iii) manufacturers transforming finished leather to different leather products. Traditionally the leather sector is made-up of small and medium enterprises that, like for other industrial or manufacturing sectors in Italy (e.g. tissue paper, furniture, etc.), are concentrated in districts for the purpose of benefiting from synergies, horizontal and vertical integration, sharing of technological know-how, artisanal knowledge and cost-efficient operations. These districts have developed into distinct territories shaping the landscape and identity of many areas. The main four industrial districts of the leather sector are: • Arzignano and Chiampo valley from Crespadoro to Montebello, from Montorso to
Zermeghedo and Montecchio Maggiore (Vicenza, Veneto – North-East Italy); • Santa Croce Sull’Arno and Ponte a Egola (Pisa, Tuscany – Centre-West Italy); • Solofra (Avellino, Campania – South Italy); • Turbigo (Milan, Lombardy – North-West Italy).
These industrial districts make up 55%, 28,5%, 7,6% and 5% of the total Italian leather production value respectively. The Italian tanning industry employs in total 17,612 people in around 1,210 companies with an annual turnover of 5 billion euros (Figure 23) (greenLife, 2017; UNIC, 2019).
The main raw materials used by the Italian tanning industry are adult bovine, which accounts for 71% of the total production, followed by sheep (11%), goats (10%) and calves (8%). The most important end use markets of finished leather are footwear (42%), leather goods (24%), furniture (16%), upholstery (11%) and clothing (5%). While tanneries based in Veneto mainly serve the furniture and automotive sectors, those based in Tuscany process medium and small-sized cowhides for high fashion brands (mainly footwear and leather accessories) and those based in Campania are specialized in preparing hides for clothing and leather goods.

94
Figure 23. Italian leather industry in a nutshell.
Source: author's own elaboration based on data provided by UNIC (2019)
The 90% of processed raw materials are imported from other countries under the form of raw hides (mainly from the EU region, 52%), wet-blue (47%) and semi-finished products (crust, 1%). With reference to exports, the Italian leather industry makes up around 65% of the total EU production and 20% of the total tanning industry turnover worldwide (UNIC, 2019). Around 75% of the Italian production value is exported constituting 68% of EU and 26% of world exports in total. The EU region is the main destination (51%), followed by China, including Hong Kong (16%), and the US (14%).
Since 1946 the Italian leather Industry has self-organized in the form of association with the purpose of promoting the strategic interests of the industry in a much more organized form. Currently, 161 out of the 1,210 companies are members of the Italian Tanners Association (Unione Nazionale Industria Conciaria, UNIC). UNIC is also a member of The Confederation of National Associations of Tanners and Dressers of the European Community (Cotance) and of The International Council of Tanners (ICT) (UNIC, 2019).
4.1.3 Italian imports of leather from Brazil This section presents Italian imports of leather from Brazil, based on HS codes, exporting Brazilian states, as well as importer and exporter data and associated risks.
4.1.3.1 Total and HS category-based trade in bovine hides and leather According to the Comtrade database, Italy has been the second importer of Brazilian bovine hides and leather (HS 4101; 4104; 4107 combined) for many consecutive years. This position of Italian import market remains the same both in terms of estimations in net weight (kg) and value ($ US). Besides, the Italian imports from Brazil are also exponentially increasing over the

95
years, while Chinese (inc. Hong Kong) imports show the opposite trend (Comtrade database). In 2018, Italy imported 123 million kg (in net weight) bovine hides and leather from Brazil (Figure 24).
Figure 24. Top 15 countries importing Brazilian bovine hides and leather (HS 4101; 4104; 4107 combined), net weight in kg
Note: only the 2018 value labels are shown on the Figure. Source: Comtrade database, 2019
The cross-check of data in terms of top exporters of bovine hide and leather to Italy reveal similar results28 and reinforces the position of Brazil as an important source country. In 2018 Brazil’s share among top 10 exporter countries to Italy was 22%. Brazil tops the list in terms of sum of net weight of 4101, 4104, 4107 product categories. While European countries remain as major sources of raw hides, Brazil is still on the top of the list for wet-blue and finished leather categories (Figure 25).
Due to technical difficulties and long travel distance, but mostly due to the protectionist policies29 by the Brazilian government, Italy does not import raw (salted) hides from Brazil. The main reason for protectionism is an attempt to promote Brazilian leather sector and to increase the share of value-added processes implemented in the country (CICB, 2019). The Brazilian raw hides that get exported are mainly destined to Uruguay or China (Figure 26). However, this trend
28 Import and export data provided on Comtrade database and reported by different countries can have discrepancies due to the complexity of data collection and taxation. 29 “Protectionism refers to government actions and policies that restrict or restrain international trade for the benefit of a single domestic economy. Protectionist policies are usually implemented with the goal to improve economic activity within a domestic economy but can also be implemented for safety or quality concerns” (Investopedia, 2019).

96
is likely to change in the future. Recently, Mercosur and the EU finalized an agreement, as part of the Free Trade Agreement, to liberalize the export of raw animal hides from these countries, including Brazil (Anonymous, 2019b).
The wet-blue (HS 4104) exports made up 41% of Brazilian leather exports in 2018. Italy is the second importer of Brazilian wet-blue hides, worth around 165 million USD in value. With reference to finished leather (HS 4107) exported from Brazil in 2018 (59% of total leather exports), Italy is the number three in the list (82 million USD), following USA (239 million USD) and China (88 million USD) (Figure 25). Thus, the share of the Italian market is especially important for wet-blue (semi-processed) leather exports.
Figure 25. Top 10 Bovine hides and leather exporters to Italy in 2018 (sum of netweight, kt) and the share of raw hides, wet-blue and finished leather exported by Brazil to Italy in 2018
Source: Comtrade database

97
Figure 26. The share of raw (salted) hides, wet-blue and finished leather exported by Brazil in 2018 and the top 5 importers of each HS product category in 2018, in USD
Source: Comtrade database, 2019
4.1.3.2 State based trade with Italy It is important to understand where within the national borders of Brazil the different categories of leather originate: the data on subnational, state or municipal origin are an indicator of the exposure risk of certain destination markets to deforestation. As also demonstrated by Godar et al. (2015 and 2016) the exposure of European imports to deforestation risk increases when looked at the municipal and state level compared to the national level estimations. Comexstate database (2019) allows filtering out exporting states and exported product categories. With regard to the origin states we are interested in understanding the share of BLA leather exports within total exports from the country.
Figure 27 shows that in terms ot total exports (all 3 HS categories combined) BLA states Mato Grosso, Pará , Tocantins and Amazonas are among top 10 exporting states to Italy. The state of Amazonas appears as an exporter to Italy since 2018. It is worth noting that within the BLA these states also have the largest share of accumulated deforestation over the period of 2008-2018, i.e. Pará (41%), Mato Grosso (20%), Amazonas (10%) (INPE/Prodes, 2019). Amazonas also declared an emergency over the forest fires, surged as the result of increased illegal deforestation, in August 2019 (Euronews, 2019).
When considering single HS categories separately, among the BLA states only Pará and Amapa exported raw hides (HS 4101) in 2018 and in both cases the shipments were destined to Thainland (in total, 0.48 million USD in value and 0.88 million kg in weight). Raw hide exports from Brazil are mainly concentrated on the states and municipalities with international ports. This could be explained with the fact that the preservation period of raw or salted hides is
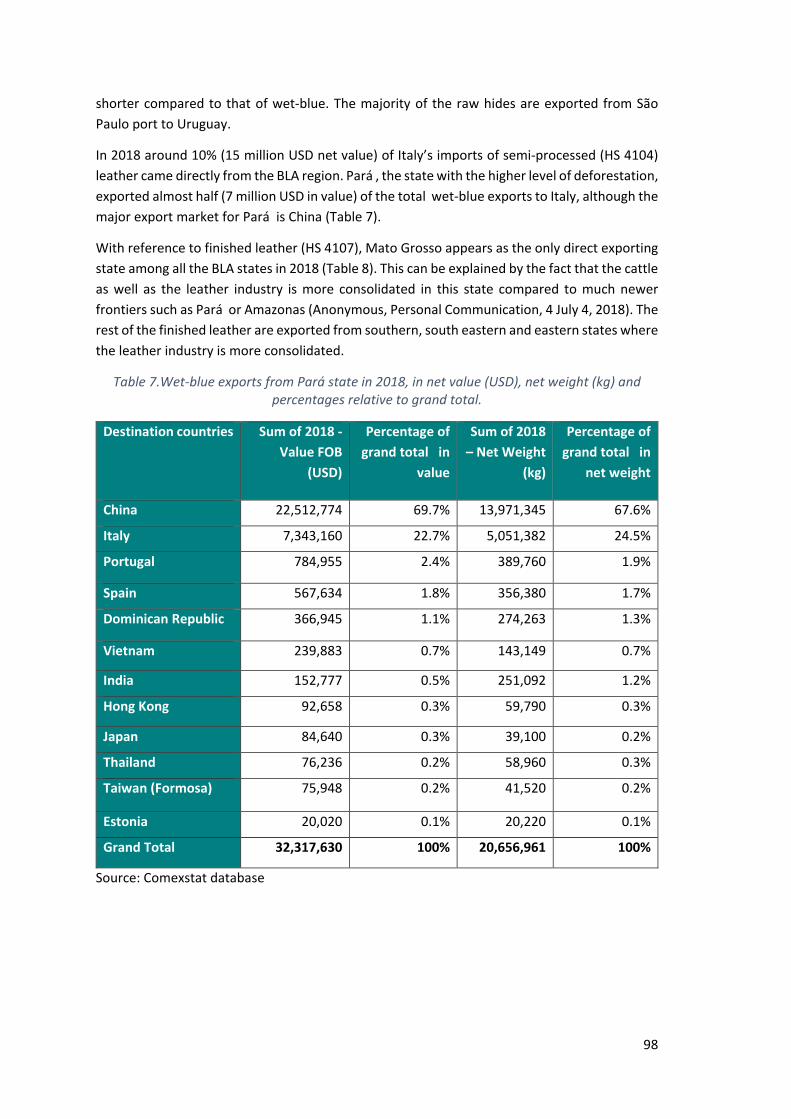
98
shorter compared to that of wet-blue. The majority of the raw hides are exported from São Paulo port to Uruguay.
In 2018 around 10% (15 million USD net value) of Italy’s imports of semi-processed (HS 4104) leather came directly from the BLA region. Pará , the state with the higher level of deforestation, exported almost half (7 million USD in value) of the total wet-blue exports to Italy, although the major export market for Pará is China (Table 7).
With reference to finished leather (HS 4107), Mato Grosso appears as the only direct exporting state among all the BLA states in 2018 (Table 8). This can be explained by the fact that the cattle as well as the leather industry is more consolidated in this state compared to much newer frontiers such as Pará or Amazonas (Anonymous, Personal Communication, 4 July 4, 2018). The rest of the finished leather are exported from southern, south eastern and eastern states where the leather industry is more consolidated.
Table 7.Wet-blue exports from Pará state in 2018, in net value (USD), net weight (kg) and percentages relative to grand total.
Destination countries Sum of 2018 - Value FOB
(USD)
Percentage of grand total in
value
Sum of 2018 – Net Weight
(kg)
Percentage of grand total in
net weight
China 22,512,774 69.7% 13,971,345 67.6%
Italy 7,343,160 22.7% 5,051,382 24.5%
Portugal 784,955 2.4% 389,760 1.9%
Spain 567,634 1.8% 356,380 1.7%
Dominican Republic 366,945 1.1% 274,263 1.3%
Vietnam 239,883 0.7% 143,149 0.7%
India 152,777 0.5% 251,092 1.2%
Hong Kong 92,658 0.3% 59,790 0.3%
Japan 84,640 0.3% 39,100 0.2%
Thailand 76,236 0.2% 58,960 0.3%
Taiwan (Formosa) 75,948 0.2% 41,520 0.2%
Estonia 20,020 0.1% 20,220 0.1%
Grand Total 32,317,630 100% 20,656,961 100%
Source: Comexstat database

99
Figure 27. Top 10 Brazilian states exporting to Italy in the period 2014-2018, netweight, kg.
Source: Comexstat database

100
Table 8. Exports of finished leather (HS 4107) from the state of Mato Grosso in 2018, in net value (USD), net weight (kg) and percentages relative to grand total
Destination Countries
2018 - Value FOB (USD)
Percentage of grand total in
value
2018 – Net weight (kg)
Percentage of grand total in
net weight Mexico 7,781,489 48.2% 485,406 27.7% United States 7,467,209 46.3% 399,080 22.8% Netherlands 7,102.79 0.0% 672,991 38.4% Hong Kong 1,313.82 0.0% 100,340 5.7% Italy 879,505 5.4% 92,325 5.3% Canada 7,906 0.0% 332 0.0% Grand total 16,144,526 100% 1,750,474 100%
Source: Comexstat database
4.1.3.3 Main exporters and importers and the associated risk Customs data for the year 2018 allow tracking major transactions in terms of leather trade between Brazil and Italy. Both in terms of exporters (shippers) from Brazil and and importers (consignees) of the hides and leather the major share is handled not by tanneries themselves but by logistics companies or intermediares. Cross match of the data on both sides show that MAR VI Speed SRL Spedizioni Internazionali as the biggest consignee on the Italian side is also a major client of Euro America International Freight Forwarders (major exporter from the Brazilian side) in 2018 – out of 57,990 metric tons (mt) MAR VI handled 39,507 mt in 2018. Although the company has offices all over Italy, one of the major shipping centers is located in Arzignano district (The Chambers of Commerce, 2019). Based on the convient location of this company in the heart of the Arzignano district as well as triangulation through the information gathered from the UNIC website and through personal communication, we can infer that majority of the Brazilian leather is imported by the Veneto tanning district. As the district mainly serves upholstry and furniture markets, major clients of these tanneries face a risk that they could be purchasing leather from deforested lands in the Amazon (Figures 28 and 29).

101
Figure 28. Main importers (consignees) of Brazilian hides and leather (HS 4104; HS 4107) in 2018
Source: Customs data
Figure 29. Main exporters (shippers) to Italy from Brazil (HS 4104; HS 4107) in 2018
Source: Customs data
It is also possible to check for the BLA based tanneries (municipality-level precision) involved in the trade with Italy by matching the list of exporting tanneries, from the database of the company registries in Brazil (Foreign Trade Secretary, 2018) and matching via Google Maps.
The analysis of the customs data as well as COMEXstat database registries, show that Italy receives finished leather from Pedra Preta Municipality of the Mato Grosso state. Google Maps search reveals JBS as the only registered tannery within that municipality. JBS is recognized as the biggest meatpacking company in the world slaughtering 13 million animals every single day and having annual revenues of 50 USD billion. It is also the company the executives of which are repeatedly accused of corruption and cattle purchase of illegally deforested lands, investigated through the operations Carne Fraca (Weak Meat) and Carne Fria (Cold Meat) since 2017. JBS owns a big tannery in Maraba municipality (one of the important deforestation frontiers) in Pará state as well. Italy imports leather also from Maraba municipality.

102
The recent investigation by Amazon Watch claims that the slaughterhouse Frigorífico Redentor, a subsidiarity of Grupo Bihl, involved in “Operation Abate” in 2009 and sanctioned with fines over illegal deforestation in Mato Grosso state in 2017-2018, has supplied Vicenza based tanneries such as Rino Mastrotto Group (two shipments totaling 162 tons); Faeda (ten shipments totalling 483 tons), Conceria Cadore (four shipments totalling 219 tons), Conceria Cristina (five shipments totaling 99 tons) and Italpelli (thirteen shipments totalling 530 tons) in 2018 (Amazon Watch, 2019).
Since 2018 Italy also started importing wet-blue leather from the state of Amazonas, a relatively new but rapidly inscreasing deforestation frontier state. A simple Google Maps search shows that there is only one tannery registered in the Amazonas state, i.e. SMX Agroindustrial Ltda. Operation Archimedes started in June 2019 by the Public Prosecutor Office in the Amazonas state over environmental crimes, as well as active and passive corruption, also cover an open investigation (the Case #4) against SMX Agroindustrial Ltda for the mentioned crimes (MPF, 2019).
4.1.3.4 Making the business case for deforestation risk of leather The deforestation risk in Brazilian leather supply chain can be categorized as reputational, legal and operational. Currently downstream actors can be described as more susceptible to reputational and upstream actors to regulatory risks.
Reputational risk. After the publication of the reports “Slaughtering the Amazon” (Greenpeace, 2009) and “Time to pay the bill”(Hora di Conta) (Smeraldi and May, 2009), the discussion about deforestation risk in leather supply chain became the discussion point of public debates, although mostly overshadowed by that of beef and soy as main drivers of deforestation. Following these reports and claims by the two non-governmental organisations (NGOs) major brands such as Timberland, Clarks, Nike and Adidas (among others) put forward pledges to cut the trade relations with suppliers associated with deforestation (Swartz, 2011). Since then a number of other brands and manufacturers in footwear, upholstery and furniture sectors that use leather extensively in their products have put forward deforestation related commitments or started looking for alternative materials as substitutes. The recent coverage by the Supply Change initiative run by Forest Trends featured 29 such entities with commitments linked to leather (2019). Due to exposed brand image, in 2013 major fashion brand Gucci started a pilot project of a line of “deforestation-free” bag. Despite the claim that the company very rarely source from Brazil, the reputational risk was too high not to act. By getting access to hides originating from Sustainable Agriculture Network (SAN)-Rainforest Alliance certified São Marcelo farm in Tangará da Serra, Mato Grosso state, the brand could act on its reputational risk. However, the project discontinued afterwards (Personal Communication, July 26, 2019).
In the face of recent forest fires in Brazil, some major global brands have taken the lead, announcing their concerns about what is happening in Brazil and its highly biodiverse ecosystems (Cernansky, 2019). VF Corporation officially announced a provisional ban on Brazilian leather until it could “…have the confidence and assurance that the materials used in [its] products do not contribute to environmental harm in the country” (Spring & Slattery, 2019).

103
Major fast fashion retailer H&M has also declared a similar ban on Brazilian leather (Andreoni & Maheshwari, 2019).
And it is not just companies in the fashion industry that are sending a signal that the leather industry should move towards more sustainable sourcing. Car manufacturers BMW and Volkswagen have both also stated privately that sourcing sustainable leather is on their agenda (Butler, 2019). Furniture retailer IKEA is working on extending its in-house traceability system to ensure that it sources from farms without deforestation risk. The increased civil society pressure, public debates and corporate commitments gave rise to third-party initiatives that would help to add assurance to the deforestation-free leather claims. In 2010 the Leather Working Group (LWG) developed a Traceability Audit Protocol especially for the case of Brazil and Amazonian deforestation setting 2009 as a baseline year of deforestation (LWG, 2019). The audits held by LWG against this protocol result in gold, silver, bronze or ‘audited’ rates depending on how successful the tannery is to trace the origin of the hide till the slaughterhouse. The topic of deforestation and land use change is also one of the important focuses of Responsible Leather Round Table (RLRT), a much recent multi-stakeholder initiative started since 2018. Among many, it aims to create a specific committee on deforestation and also help downstream market actors to make sustainability claims by participating in credit trading system and purchasing sustainable faming credits put forward by farmers directly (RLRT, 2019).
Legal or Regulatory risk. Internationally, the discussions about leather as a forest-risk commodity mostly prevail in public policy documents originated within the European Union and discussed in the beginning of the paper. Leather is mentioned repeatedly in the study on embodied deforestation conducted by the EC although mostly in connection to beef (EC, 2013; EC, 2017; EC, 2019). The Amsterdam Declaration “Towards Eliminating Deforestation from Agricultural Commodity Chains with European Countries” of 2015 signed by six European countries30 mention leather as a commodity sector with deforestation risk.
At the Brazilian level leather industry has already faced and continues to face regulatory risks. First, the results of the latest audit published by Public Prosecutor Office of Pará include a number of leather tanneries located in the state, sending out the signal that deforestation is a legality risk for the leather sector and that they are required to have traceability system in place (MPF, 2018). Second, recent scandals such as Carna Fria (Cold Meat), Carna Fraca (Weak Meat) and Lava Jato (Car Wash) that involved illegalities respectively in terms of purchasing cattle from illegally deforested areas, wide-spread bribery of officials to overlook the sale of spoiled meat and the biggest corruption scheme involving top level politicians and businesses, have also hugely impacted the leather industry. This impact was felt both at reputational as well as regulatory level in the example of JBS, the biggest meatpacking company in Brazil and in the world, which consequently also controls major share of leather industry in Brazil (Gaworecki, 2017; Parra-Bernal & Mello, 2017). JBS is still facing charges even after the arrest of the chief executive. The risk of illegality and deforestation involved in JBS and other big meatpacker transactions are passed down further to leather industry.
30 i.e. Denmark, France, Germany, the Netherlands, Norway and the United Kingdom.

104
The most recent political events in Brazil and the lenient approach of the current president of Brazil towards legal and illegal deforestation in the country presents very important risk at the moment. Although environmental considerations were a priority of the previous government, Jair Bolsonaro, the current president, considers forests and indigenous people the biggest threat to the country’s development. His plans include opening up more forest areas in the northern states for the agriculture production, road construction, hydroelectric dams and connecting those areas with big commercial centres of the country and around the world. Since the first days of presidency his actions are directed towards weakening environmental protections and dismantling environmental agencies (Watts 2019; Branford & Borger, 2019). Due to increased feeling of impunity the deforestation within BLA have increased dramatically since his presidency and just in the June, 2019 alone deforestation has increased 88% compared to the same month of the last year (Spring, 2019; Anonymous, 2019c). These new developments change the whole landscape and should be differentiated from usual regulatory or legality risks.
Operational risk. Although currently identifying direct operational risks linked to deforestation is challenging for the leather industry, it is expected to be impacted from the negative consequences of continuous deforestation (see section 2.1). Increased deforestation, feedback loop of climate change, water shortage and altered rainfall patterns is affecting the availability of resources for all industries including cattle farming (Agroin, 2019). However, currently the leather industry is argued to suffer from the opposite – the abundance of raw hides as the result of sharp increase in cattle production. The prices for raw hides are falling constantly and at the moment are considered the historical lowest affecting the profitability of the industry (Anonymous, 2019d). As the sustainability of abundant cattle production is under question, the resulting operational risk needs a careful consideration by the industry.
4.1.4 Final destination - main clients of the Italian tanneries While imports of raw materials to Italy are relatively easy to track, the exports of highly processed leather products from Italy are more challenging to follow. This challenge is mainly due to the re-exports, but also to the granularity of the use of leather as parts of different products. In this case, products made entirely or partly from leather fall under different commodity category codes, which complicates the data mining. For example, while two-digit HS 42 (Articles of leather; saddlery and harness; travel goods, handbags and similar containers; articles of animal gut (other than silk-worm gut)) could be allocated totally as a leather-made product category of leather articles, HS 64 (Footwear; gaiters and the like; parts of such articles) requires further zoom into 4-digit codes such as HS 6403 (Footwear; with outer soles of rubber, plastics, leather or composition leather and uppers of leather) and HS 6404 (Footwear; with outer soles of rubber, plastics, leather or composition leather and uppers of textile materials) to filter out and identify the products using leather as material. Tracking finished leather to be used or already used in furniture and upholstery products, unfortunately, is much more complex.
Figure 30 presents the top 12 importing countries of Italian exports of leather (raw, semi-processed, finished combined HS 41), articles of leather (HS 42) and leather footwear (HS 6403 and 6404) in 2018, in trade value (million USD). In all three categories internal European markets have major shares. The leading position of Romania for the imports of HS 41 category from Italy

105
is explained with the higher share of raw (salted) (HS 4101) and semi-processed leather (HS 4104). This could be explained by relatively lower labor cost, but also less strict environmental regulations around leather processing in Romania (the largest share of environmental impact of leather processing tends to concentrate on the initial stages) (Tattara & Crestanello, 2010; Constantin et al., 2010).
Figure 30. Top 12 country importers of Italian exports of leather (raw, semi-processed, finished combined HS41); articles of leather (HS 42); and leather footwear (HS 6403;6404) in 2018, in
trade value USD
Source: Comtrade database
4.2 Discussion and conclusion The European market is one the major destinations for Brazilian forest-risk commodities ranging from agricultural to mining-based commodities. The role of trade as an underlying driver of deforestation and forest degradation has been studied for many years and now is feared even more due to the EU-Mercosur Free Trade Agreement. In the leather sector, the openness to trade brought by the this deal is already reflected through the fact that it will allow the export of raw (salted) bovine hides from Brazil to Europe, including Italy.
Leather (once it is salted) is the commidity that has much higher mobility and shelf time compared to beef. Due to this mobility and flexibility allowed trough exemption of sanitary checks (necessary for the beef market) leather travels easily among Brazilian states as well as internationally. The BLA states with most of the continous deforestation are also the ones with less consolidated infrustructure for leather processing. Leather processed till wet-blue stage (HS 4104) is either exported directly from those states to other countries or sent southwards to the other Brazilian states where most of the infrastructure for further processing is located. Due to this interstate trade and difficulty to acces data on this type of transactions the extend of deforestation risk present in Brazilian-Italian leather trade is difficult to quantify. The direct exports from BLA states to Italy helps to start the discussion about the risk of deforestation. Looking at the data at the state or municipality level, rather than at the total national level, helps to connect European and Italian markets with the deforestation frontiers even closer.
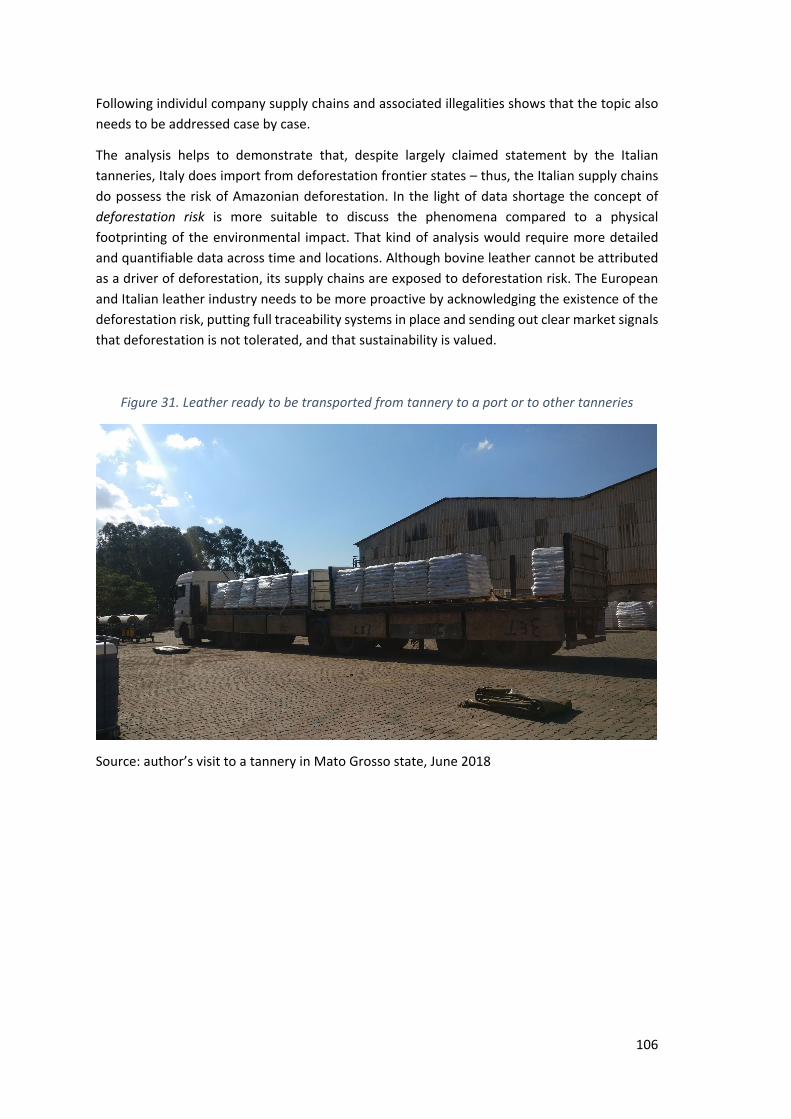
106
Following individul company supply chains and associated illegalities shows that the topic also needs to be addressed case by case.
The analysis helps to demonstrate that, despite largely claimed statement by the Italian tanneries, Italy does import from deforestation frontier states – thus, the Italian supply chains do possess the risk of Amazonian deforestation. In the light of data shortage the concept of deforestation risk is more suitable to discuss the phenomena compared to a physical footprinting of the environmental impact. That kind of analysis would require more detailed and quantifiable data across time and locations. Although bovine leather cannot be attributed as a driver of deforestation, its supply chains are exposed to deforestation risk. The European and Italian leather industry needs to be more proactive by acknowledging the existence of the deforestation risk, putting full traceability systems in place and sending out clear market signals that deforestation is not tolerated, and that sustainability is valued.
Figure 31. Leather ready to be transported from tannery to a port or to other tanneries
Source: author’s visit to a tannery in Mato Grosso state, June 2018

107
5 Overall discussion and policy recommendations
This chapter aims to present an overall discussion by connecting the discussion points from the previous chapters. It also presents some overall policy recommendations for some relevant stakeholders.
5.1 Interaction of the different analyses This section aims to re-visit the overall research questions presented in the introduction of the thesis and summarize how each subsections of the analysis addressed these questions. We then present an overall discussion with the aim to show how different parts of the analysis connect to each other.
Chapter 2: How is deforestation linked to commodity supply chains? How deforestation risk can be conceptualized and assessed along leather supply chain?
Agricultural commodity production in the tropics is driving deforestation and forest degradation in valuable ecosystems such as Amazon rainforests and Cerrado in Brazil. There are big forest risk commodities, such as beef, soy, etc. the market demand of which has direct causal links to deforestation. Complexity of production and trade systems requires also to consider the commodities the supply chains of which possess the exposure to deforestation without being direct drivers. This exposure reveals itself through different channels, such as feed systems, land use dynamics and by-product supply chains. This dimension of the deforestation risk assessment is captured by the concept of embedded deforestation. Being a more recent term, embodied deforestation still misses proper conceptualization and assessment methodologies agreed upon by the scientific community.
Differentiating the types of deforestation risk exposure in supply chains has implications for how the responsibility and accountability is constructed both through legal measures and voluntary sustainability standards. The embedded deforestation in leather supply chains can be mapped and discussed in terms of its linkage with the cattle ranching as the driver of deforestation, geospatial analysis of the tannery locations and surrounding risk zones, supply chain complexities and gaps, as well as production and trade data discrepancies. The choice of concept affects how the criteria for sustainability are designed within the leather sector standards. For example, if we discuss leather as a waste product of cattle without deforestation risk in the supply chain, it is only possible through the choice of any other discussed concept except the embedded deforestation risk. If deforestation risk is taken as embedded, then the waste product narrative is also undermined.
Chapter 3: How is deforestation risk made transparent and monitored? How different discourses articulate transparency over deforestation risk of bovine leather in relation to sustainability, legitimacy, and fairness?
Our analysis of the various discourses shows that sustainable supply chains are political concepts in addition to being economic and managerial terms. How sustainable supply chains and associated transparency and traceability tools are designed needs to be negotiated.
108
Political discourses make certain aspects of sustainability visible while blurring the vision for others. While the Order and Progress discourse focuses on the need to recognize Brazil as an important producer of agriculture products, it also seeks recognition for the efforts made to achieve good environmental governance. The definition of sustainability by the Livelihoods discourse puts much more emphasis on social aspects such as land tenure, historical injustices, and economic vulnerability of settlers. Finally, the framing of sustainability by the Zero Deforestation discourse puts a lot of emphasis on environmental aspects and sustainable supply chains are framed as deforestation- and land-conversion-free.
As deforestation risk of bovine leather is articulated by different discourses, questions about sustainability, legitimacy, and fairness are answered differently. As a result, we see that any choice about how to mitigate deforestation risk of bovine leather depends on the political reality of the actor making that choice. Deforestation risk is invisible in the Order & Progress discourse so long as cattle is raised and produced within the boundaries set by law and legality. In this discourse, the leather supply chain is inherently sustainable thanks to progressive laws that govern the country. The Livelihoods discourse does acknowledge the strong presence of risk on deforestation but calls upon leather brands and tanneries to take responsibility for mitigating this risk. They need to engage with suppliers by sharing the costs and benefits in exchange of transparency of information. The Zero Deforestation discourse points to gaps in legal protection of the Amazon and understands deforestation risk as a more systematic issue, tied to illegal deforestation, political dynamics, and consumerism.
Chapter 4: How can trade data be used to study the role of a commodity in deforestation? What is the extend of deforestation risk revealed through Brazilian-Italian leather trade data analysis?
Trade data analysis helps to link commodity production sites to the markets where those commodities are consumed with the aim to support the gradual shift of responsibility over deforestation to developed country markets instead being disgarded as solely governance problem of developing countries. Depending on the granularity of the analsysis, i.e. whether the national, state or importer-exporter level data is analysed, the linkage between risky production sites and the consumer markets and, consequently, the visibility of the risk can differ. Looking at the data at the state or municipality level, rather than at the total national level, helps to connect European and Italian markets with the deforestation frontiers even closer. Following individual company supply chains and associated illegalities shows that the topic also needs to be addressed case by case.
The analysis helps to demonstrate that despite largely claimed statement by the Italian tanneries, Italy does import from deforestation frontier states – thus, the Italian supply chains do possess the risk of Amazonian deforestation. Leather (once it is salted) is the commodity that has much higher mobility and shelf time compared to beef. Due to this mobility and flexibility leather travels easily among Brazilian states as well as internationally. Due to this interstate trade and difficulty to access data on this type of transactions the extend of deforestation risk present in Brazilian-Italian leather trade is difficult to quantify. The direct exports from BLA states to Italy helps to start the discussion about the risk of deforestation. In the light of data shortage and inconsistencies the concept of deforestation risk is more suitable to discuss the

109
phenomena compared to a physical footprinting of the environmental impact. That kind of analysis would require more detailed and quantifiable data across time and locations. The existing methodologies on environmental footprinting and measurement of the deforestation risk per commodity supply chains rely on trade data of forest-risk commodities. This type of data analysis assumes that the original forest cover is cleared to make the way to produce certain commodities by looking at direct causal links. Although very useful to analyse the concept of deforestation risk, these methodologies still need to evolve to include embedded deforestation as a comprehensive concept that was addressed through this research. Embedded deforestation is difficult to measure, a problem that is reflected in the fact that major policy documents and scientific research focus on analysing deforestation risk of major forest risk commodities. Although, this type of analysis is more pragmatic and can deliver quantifiable results to guide decision-making, for conceptualizing deforestation along the supply chains and understanding the politics of responsibility, a broad understanding of embedded deforestation has certain benefits.
While deforestation risk analysis and trade data focus on individual supply chains, embedded deforestation connects different product supply chains and looks at the impact in the light of their interactions. Going beyond trade data analysis and conducting qualitative analysis of the risk by looking at individual importer and exporter related data helps to re-affirm the risk. The political analysis of responsibility and visibility helps to move beyond technical analysis of market interactions and add human aspect to it with the aim to achieve both deforestation-free as well as socially-just and fair supply chains.
5.2 Policy implications and conclusion Since the discussions about cattle and deforestation became the focus of public debates, the leather industry has been mainly engaged in denial, distancing itself from farm level sustainability discussions and pushing heavily on the “waste product” narrative (except for a few progressive businesses). This narrative helps to frame bovine leather as inherently green by arguing that cattle are never raised for their skin but for their meat and that the industry recovers the waste of meat production. The defensive approach towards internalization of the deforestation risk is also observed at a political level. There has been great mobilization of the resources by the leather industry aimed at development of sectoral standards and influencing legislative process, especially in European Union, to avoid any discussions about deforestation in relation to bovine leather. Corporations, brands and lobby groups have mobilized to significantly influence how environmental regulations are made, which can serve as a good example for saliency of markets described by Toohey (2013). For example, the consultation process and development of the Product Environmental Footprint Category Rules (PEFCR) for the case of leather finalized in 2018 have had a heavy participation by European leather tanning associations and their customer companies.
As described by Welford (1997) and Sklair (2011) corporations frequently hijack and “mobilize environmental discourses in a way that mitigates harm to their reputations rather than providing solutions to environmental degradation” (p.250). The most recent Leather Naturally

110
initiative established by the industry groups, the “Kind leather” concept by JBS or the sustainability report under the title of “Tales of sustainability of Italian leather” by Italian Tanners Association (UNIC) serve for this kind of symbolic corporate environmentalism (Bowen, 2014) and try to prevent the public discussions about pre-slaughterhouse environmental impacts and responsibility of the industry.
The leather industry is also constantly engaging in reformulation and reinvention of the meaning of leather. Alongside with the waste product narrative the current focus is also on the circular economy. By referring to leather as an authentic and sustainable example of circular economy much efforts have been mobilized on demonstrating how the leather industry has been circular historically. Directing the focus towards circularity and sustainability at a facility level loosens the attention on the topic of deforestation risk and helps to “prove” the sustainability with little efforts.
The media publications, academic research and other efforts to discuss the deforestation risk in leather supply chains are also dismissed as ideological (Anonymous. 2019a), incorrect and outdated (Buljan & Kráľ, 2019) and as fake news (Anonymous, 2018). As a result of this identity management and boundary work (Hajer, 1993) those investigating the deforestation risk of leather are also considered not scientific enough or as dreamers (i.e. repeated attempts to discredit this exact research by UNIC), while industry experts are the ones with pragmatic rationality.
5.2.1 Policy recommendations In the light of the research background and mentioned politics here we offer some policy recommendations for identified stakeholder groups.
The national and regional governments need to be more proactive in their efforts to understand and act upon the deforestation and other negative externalities embedded in their producton and trade systems. The current Brazilian government needs to listen to the voice of international community and stop framing Amazonian deforestation as the topic of soverignty and environmental NGOs as “agents” of foreign countries.
The EU needs to conduct more research on embedded deforestation of its imports but also act upon the results of the research with follow-up tangible policies. The European Union’s Communication on Stepping up EU Action (2019) to Protect and Restore the World’s Forests is a good opportunity for common action that could lead to EU-wide corporate due diligence legislation to ensure legality and sustainability (EC, 2019). This Action plan, previous EC led studies on Deforestation footprint of EU imports (2013) and the EU FLEGT Regulation are the only documents directly talking about the topic. However, most of them remain in the form action plan or studies and are not legally binding policy instruments. The EU needs to be put more tangible efforts to achieve the pledge of halting global deforestation by 2020 (EC, 2015)31.
31 This pledge is linked to the SDG (UN Sustainable Development Goals) #15. https://ec.europa.eu/sustainable-development/goal15_en
111
In many aspects, the EU is still a trailblazer and a global leader in promoting sustainability. This creates very effective precedent for other countries and regions to follow. On the hand, scattered policy making, and implementation also produces scattered results and weakens the impacts of one policy through the other one. While EU sets up policy guidance documents and reports on environmental impacts or deforestation footprint of its imports, on the other front it already (almost) ratifies a trade deal (EU-Mercosur Free Trade Agreement) that is a legally binding document and potentially detrimental to environment. With a specific focus on EU demand for agriculture commodities that drive deforestation in Brazil, the EU needs to demand to the Brazilian government to: • remain as signatory of the Paris Agreement on Climate Change and fulfil its commitments; • immediately stop dismantling of environmental agencies or indigenous organizations such
as IBAMA or FUNAI; • restore Amazon Fund, one of the largest international cooperation projects to fund forest
preservation in the world. Take back unreasonable conditions put forward that resulted Norway and Germany to pull back their contribution (Fundo Amazonia, 2019).
The European and Italian leather industry needs to be more proactive by acknowledging the existence of the embedded deforestation risk, putting full traceability systems in place and sending out clear market signals that deforestation is not tolerated, and that sustainability is valued. Visibility or requirement of transparency without further engagement and investment in supply chain development causes actors to become economically or politically vulnerable and erodes trust in the system, thus jeopardizing the success of zero deforestation commitments. This means that zero deforestation requirements and commitments by businesses should consider forests as part of socio-ecological systems that include important economic and social dimensions. Social criteria need to go beyond labour standards, land rights and community consultation, and include environmental justice and support for local livelihoods (Newton et al., 2018). As the current Brazilian government is unlikely to change this situation (Wallace, 2018; O’Sullivan, 2019), it is now up to international leather markets to find mechanisms for transparent and inclusive supply chains that may bring the ambition of zero deforestation in the Amazon a little closer.
The international and local environmental NGOs that consider Amazonian forests as legacy of all humankind, still need to be more attentive to the voices of the local communities. Whether accepted or not, frontier settlements are now the reality of the Amazon. What may be legitimate calls for ‘zero legal deforestation’ thus still need to include the voices of local farmers and workers if the aim is a leather supply chain that is not only environmentally sound but also socially just. The previous calls for boycotts have resulted in a lack of trust and ownership around zero deforestation commitments by local farmers as they consider themselves “sandwiched” among discourses of government, agricultural lobby, global food markets, and environmental NGOs. Public debates about deforestation-free sustainable supply chains should moreover be held by different levels of governance as well, as discounting legal, domestic efforts to curb deforestation as ‘not enough’ can bring about negative political dynamics rather than higher environmental ambition, as is clearly seen today in the current political situation of Brazil. Acknowledging and giving voice to all relevant stakeholders is therefore key to having a debate that can overcome political divisions and discursive antagonisms.

112

113
References
Agrawal, A., & Angelsen, A. 2009. Using community forest management to achieve REDD+ goals. Realising REDD+: national strategy and policy options, 1, 201-212.
Agri Footprint. 2019. Land Use Change. Calculating greenhouse gas emissions from land use change. Available at: http://www.agri-footprint.com/direct-land-use-change/ (Last accessed 30 September 2019).
Agroin. 2019. Aumento das temperaturas pode impactar pastagens brasileiras. Agroin- O Jornal do Agronegócio Brasileiro. Agricultura, Pecuária, Meio Ambiente, Turismo, Indústria e Energia. Accessed June 4, 2019 at: http://www.agroin.com.br/assets/uploads/newspapers/7623281575d341efd40f0547bd236920beb1b809.pdf
Alfaro, L., Chor, D., Antras, P., & Conconi, P. 2019. Internalizing global value chains: A firm-level analysis. Journal of Political Economy, 127(2), 508-559.
Alix-Garcia, J., & Gibbs, H. K. 2017. Forest conservation effects of Brazil's zero deforestation cattle agreements undermined by leakage. Global environmental change, 47, 201-217.
Allison, C., & Carter, A. 2000. Study on different types of Environmental Labelling (ISO Type II and III Labels): Proposal for an Environmental Labelling Strategy. Final report. DG Environment, European Commission. Available at: https://ec.europa.eu/environment/ecolabel/about_ecolabel/reports/erm.pdf. (Last accessed 30 September 2019).
Amazon Watch. 2019. Complicity in destruction II. How Northern consumers and financiers enable Bolsonaro’s assault on the Brazilian Amazon. Available at: https://amazonwatch.org/assets/files/2019-complicity-in-destruction-2.pdf (Last accessed 30 September 2019).
Amazon Watch. 2019. New Report: European and North American Companies Support Soy, Cattle, and Timber Companies Responsible for Recent Surge in Amazon Deforestation. Available at: https://amazonwatch.org/news/2019/0425-european-and-north-american-companies-support-those-responsible-for-amazon-deforestation-surge (Last accessed 30 September 2019).
Amigos da Terra – Amazonia Brasiliero. 2018. Desmatamento cresce 36% no período eleitoral. Obtained 04.11.2018 at: http://amazonia.org.br/2018/10/desmatamento-cresce-36-no-periodo-eleitoral/ (Last accessed 30 September 2019).
Andreoni M. & Maheshwari S. Is Brazilian Leather Out of Fashion? H&M Stops Buying Over Amazon Fires. September 2019. Available at: https://www.nytimes.com/2019/09/05/world/americas/h-m-leather-brazil-amazon-fires.html (Last accessed 30 September 2019).
Anonymous. 2018. A vaccine against lies. La Conceria, The Leather Monthly Magazine, 2-2018. Available at: https://www.laconceria.it/fp/php/services/view.php?doc=2E.pdf&format=pdf&page=%7Bpage%7D&subfolder=2018/en/full/#page=8 (Last accessed 30 September 2019).
114
Anonymous. 2019. At Expopele, Cotance ask Portugal to make a law on leather authenticity and urge EU to change their mind. La Conceria Weekly Magazine. 15 April. Available at: https://www.laconceria.it/en/tannery/at-expopele-cotance-ask-portugal-to-make-a-law-on-leather-authenticity-and-urge-eu-to-change-their-mind/ (Last accessed 30 September 2019).
Anonymous. 2019a. A White Paper View of the Sustainability of Responsibly Made Leather. Leather Naturally. 2019. Available at: https://www.leathernaturally.org/getattachment/Resources/Useful-Articles/White-Paper-Explores-Sustainability-of-Leather/LN-Sustainable.pdf.aspx?lang=en-US (Last accessed 30 September 2019).
Anonymous. 2019b. EU – Mercosur, there is an agreement: raw hides from South America (finally) opens its doors. July 4. Available at: https://www.laconceria.it/en/news/eu-mercosur-there-is-an-agreement-raw-hides-from-south-america-finally-opens-its-doors/ (Last accessed 30 September 2019).
Anonymous. 2019c. Desmonte sob Bolsonaro pode levar desmatamento da Amazônia a ponto irreversível, diz físico que estuda floresta há 35 anos. Globo Negocios. July, 2019. Available at: https://epocanegocios.globo.com/Brasil/noticia/2019/07/desmonte-sob-bolsonaro-pode-levar-desmatamento-da-amazonia-ponto-irreversivel-diz-fisico-que-estuda-floresta-ha-35-anos.html (Last accessed 30 September 2019).
Anonymous. 2019d. Brazil – Where is the bottom of the market for hide prices?. The Sauer Report. Available at: https://thesauerreportsubscribe.com/bulletin/brazil-where-is-the-bottom-to-be-found. (Last accessed 30 September 2019).
Auld, G., & Gulbrandsen, L. H. 2010. Transparency in nonstate certification: consequences for accountability and legitimacy. Global Environmental Politics, 10(3), 97-119.
Azevedo, A. A., Stabile, M. C., & Reis, T. N. 2015. Commodity production in Brazil: Combining zero deforestation and zero illegality. Elem Sci Anth, 3.
Bäckstrand, K. 2008. Accountability of networked climate governance: The rise of transnational climate partnerships. Global environmental politics, 8(3), 74-102.
Bair, J. 2009. Global commodity chains. Frontiers of commodity chain research, 1-34.
Barbosa, L. C. 2015. Guardians of the Brazilian Amazon rainforest: environmental organizations and development. Routledge.
Barreto, P., Marianno, B., Valdiones, A.P., Barreto, G. 2017. Os Frigoríficos vão ajudar a zerar o desmatamento na Amazônia?. Imazon and Instituto Centro da Vida. Available at: http://www.imazon.org.br/PDFimazon/Portugues/livros/Frigorificos%20e%20o%20desmatamento%20da%20Amaz%C3%B4nia.pdf (Last accessed 30 September 2019).
Barreto, P., Pereira, R. & Baima, S. 2018. (p. 92). Os potenciais impactos de fiscalizar frigoríficos sem compromissos contra o desmatamento. (p. 27). Belém: Imazon.
Barreto, P., Pereira, R., Brandão, A., Baima, S. 2017. Will meat-packing plants help halt deforestation in the Amazon? (p. 158). Belém: Imazon.

115
Beder, S., 1996. Charging the earth: the promotion of price-based measures for pollution control. Ecological Economics 16 (1), 51–63.
Beetham, D. 1991. The legitimation of power. Atlantic Highlands. NJ: Humanuties Fress International.
Behagel, J. H., & Arts, B. A. S. 2014. Democratic governance and political rationalities in the implementation of the water framework directive in the Netherlands. Public Administration, 92(2), 291-306.
Behagel, J., & Turnhout, E. 2011. Democratic legitimacy in the implementation of the Water Framework Directive in the Netherlands: towards participatory and deliberative norms?. Journal of Environmental Policy & Planning, 13(3), 297-316.
Bevir, M. 2010. Democratic governance. Princeton University Press.
Boström, M., Jönsson, A. M., Lockie, S., Mol, A. P., & Oosterveer, P. 2015. Sustainable and responsible supply chain governance: challenges and opportunities. Journal of Cleaner Production, 107, 1-7.
Boucher, D., Elias, P., Lininger, K., May-Tobin, C., Roquemore, S., & Saxon, E. 2011. The root of the problem: what's driving tropical deforestation today?. The root of the problem: what's driving tropical deforestation today?.
Bowman, M. S., Soares-Filho, B. S., Merry, F. D., Nepstad, D. C., Rodrigues, H., & Almeida, O. T. 2012. Persistence of cattle ranching in the Brazilian Amazon: A spatial analysis of the rationale for beef production. Land use policy, 29(3), 558-568.
Brack, D. 2015. Reducing Deforestation in Agricultural Commodity Supply Chains: Using Public Procurement Policy (London: Chatham House).
Brack, D. Glover, A. and Wellesley L. 2016. Energy, Environment and Resources Agricultural Commodity Supply Chains Trade, Consumption and Deforestation. Chatham House Research Paper
Branford and Torres. 2017. Deforestation has become big business in the Brazilian Amazon. Mongabay. Available at: https://news.mongabay.com/2017/04/deforestation-has-become-big-business-in-the-brazilian-amazon/ (Last accessed 30 September 2019).
Brown, S., & Zarin, D. 2013. What does zero deforestation mean. Science, 342(6160), 805-807.
Buljan J., & Kráľ I. 2019. The framework for sustainable leather manufacture. Second edition. United Nations Industrial Development Organization (UNIDO). Available at: https://leatherpanel.org/sites/default/files/publications-attachments/the_framework_for_sustainable_leather_manufacturing_2nd_edition_2019_f.pdf#page=156 (Last accessed 30 September 2019).
Business dictionary. 2019. Definition of co-product. Available at: http://www.businessdictionary.com/ (Last accessed 30 September 2019).
Butler R. 2019. Companies sourcing beef, leather from China exposed to Brazil deforestation risk, researchers say. August, 2019. Available at: https://news.mongabay.com/2019/08/companies-sourcing-beef-leather-from-china-exposed-to-brazil-deforestation-risk-researchers-say/ (Last accessed 30 September 2019).

116
Cabral, A. I., Saito, C., Pereira, H., & Laques, A. E. 2018. Deforestation pattern dynamics in protected areas of the Brazilian Legal Amazon using remote sensing data. Applied geography, 100, 101-115.
CDP. 2016. Revenue at risk. Why addressing deforestation is critical to business success. European summary. Available at: https://bit.ly/362kdMK
Centre for the Brazilian Tanning Industry (CICB). 2019. A Lei do Couro. Available at: http://www.cicb.org.br/lei-do-couro/sobre. (Last accessed 30 September 2019).
Centro das Indústrias de Curtumes do Brasil (CICB) ( The Centre for the Brazilian Tanning Industry). 2018. Sobre o couro. Available at: http://www.cicb.org.br/cicb/sobre-couro (Last accessed 30 September 2019).
Cereceda R. & Abellan-Matamoros C. 2019. Brazil: State of Amazonas declares state of emergency over rising number of forest fires. Available at: https://www.euronews.com/2019/08/11/brazil-state-of-amazonas-declares-state-of-emergency-over-rising-number-of-forest-fires (Last accessed 30 September, 2019)
Ceres. 2017. Case Study Series: Business Risks from Deforestation. Available at: https://www.ceres.org/sites/default/files/Engage%20the%20Chain/ETC%20Climate%20Advisors%20Case%20Studies%20(1).pdf (Last accessed 30 September 2019).
Cernansky. R. 2019. Is footwear funding the burning of the Amazon?. August, 2019. Available at: https://www.voguebusiness.com/companies/amazon-fires-footwear-leather-sustainability? (Last accessed 30 September 2019).
Chazdon, R. L., Brancalion, P. H., Laestadius, L., Bennett-Curry, A., Buckingham, K., Kumar, C., ... & Wilson, S. J. 2016. When is a forest a forest? Forest concepts and definitions in the era of forest and landscape restoration. Ambio, 45(5), 538-550.
Christopher, M. 2011. Logistics and Supply Chain Management (London: FT Prentice Hall).
Ciasulli D. (ed). 2019. Fertile ground for investment. Feed & Food. The Voice of Animal Protein Industry. Available at: http://www.revistafeedfood.com.br/pub/curuca/?numero=141&edicao=10989 (Last accessed 30 September 2019).
Clapp, J. & Fuchs, D.A. (eds.). 2009. Corporate power in global agrifood governance. MIT Press.
Constantin, F., De Giusti, G., & Tattara, G. 2010. Strategies of italian firms in romania: Evidence from selected case studies. Transition Studies Review, 16(4), 829-847.
Crane, A., Matten, D., Glozer, S., & Spence, L. 2019. Business ethics: Managing corporate citizenship and sustainability in the age of globalization. Oxford University Press.
Curtis, P. G., Slay, C. M., Harris, N. L., Tyukavina, A., & Hansen, M. C. 2018. Classifying drivers of global forest loss. Science, 361(6407), 1108-1111.
Cuypers, D., Geerken, T., Gorissen, L., Lust, A., Peters, G., Karstensen, J., Prieler, S., Fisher, G., Hizsnyik, E., Van Velthuizen, H. 2013: The impact of EU consumption on deforestation: Comprehensive analysis of the impact of EU consumption on deforestation, Brussels: European Union (Technical Report – 2013 – 063). Available at: http://ec.europa.eu/environment/forests/pdf/1.%20Report%20analysis%2of%20impact.pdf. (Last accessed 30 September 2019).

117
Dauvergne, P., 2018. The global politics of the business of “sustainable” palm oil. Global Environmental Politics, 18(2), pp.34-52.
De Rosa-Giglio P., Fontanella A., Gonzalez-Quijano G., Ioannidis I., Nucci B. and Brugnoli F. 2018. Product Environmental Footprint Category Rules (PEFCR). Leather. Final version. Available at: https://ec.europa.eu/environment/eussd/smgp/pdf/PEFCR_leather.pdf (Last accessed 30 September 2019).
de Souza, J. G., Schaan, D. P., Robinson, M., Barbosa, A. D., Aragão, L. E., Marimon Jr, B. H., ... & Iriarte, J. 2018. Pre-Columbian earth-builders settled along the entire southern rim of the Amazon. Nature communications, 9(1), 1125.
den Besten, J. W., Arts, B., & Behagel, J. 2019. Spiders in the Web: Understanding the Evolution of REDD+ in Southwest Ghana. Forests, 10(2), 117.
Dingwerth, K., & Eichinger, M. 2010. Tamed transparency: How information disclosure under the global reporting initiative fails to empower. Global Environmental Politics, 10(3), 74-96.
Directive 94/11/EC of European Parliament and Council of 23 March 1994 on the approximation of the laws, regulations and administrative provisions of the Member States relating to labelling of the materials used in the main components of footwear for sale to the consumer. 2013. CELEX : 01994L0011-20130701Available at: https://publications.europa.eu/en/publication-detail/-/publication/0ae3165b-7438-471d-8f7a-cbfe31e50519 (Last accessed 30 September 2019).
Doorey, D. J. 2011. The transparent supply chain: From resistance to implementation at Nike and Levi-Strauss. Journal of Business Ethics, 103(4), 587-603.
Egels-Zandén, N., & Hansson, N. 2016. Supply chain transparency as a consumer or corporate tool: The case of Nudie Jeans Co. Journal of Consumer Policy, 39(4), 377-395.
Elgert, L. 2012. Certified discourse? The politics of developing soy certification standards. Geoforum, 43(2), 295-304.
EMBRAPA. 2018. Soja em números (safra 2017/2018). Available at: https://www.embrapa.br/en/soja/cultivos/soja1/dados-economicos (Last accessed 30 September 2019).
European Commission (EC). 2019. Stepping up EU Action to Protect and Restore the World’s Forests. Communication from The Commission to the European Parliament, the Council, the European Economic and Social Committee and the Committee of the Regions. Available at: https://ec.europa.eu/info/sites/info/files/communication-eu-action-protect-restore-forests_en.pdf. (Last accessed 30 September 2019).
European Commission (EC). 2019b. Textiles, Fashion and Creative Industries. Leather industry. Available at: https://ec.europa.eu/growth/sectors/fashion/leather/legislation_en. (Last accessed 30 September 2019).
FAO. 2001. Global forest resources assessment 2000. FAO Forestry Paper 140. Rome: Food and Agriculture Organization of the United Nations
Faria, W. R., & Almeida, A. N. 2016. Relationship between openness to trade and deforestation: Empirical evidence from the Brazilian Amazon. Ecological Economics, 121, 85-97.

118
Fearnside, P. M. 2005. Deforestation in Brazilian Amazonia: history, rates, and consequences. Conservation biology, 19(3), 680-688.
FERN. 2019. Eu-Mercosur deal sacrifices forests and rights on the altar of trade. Available at: https://www.fern.org/news-resources/eu-mercosur-deal-sacrifices-forests-and-rights-on-the-altar-of-trade-1986/
Flyverbom, M. 2016. Digital Age| Transparency: Mediation and the Management of Visibilities. International Journal of Communication, 10, 13.
Food and Agriculture Organization (FAO). 2019. The Brazilian Amazon: Some features of the study area. Accessed March 21, 2019 at: http://www.fao.org/3/j5416e/J5416E05.htm
Freitas, F. L., Sparovek, G., Berndes, G., Persson, U. M., Englund, O., Barretto, A., & Mörtberg, U. 2018. Potential increase of legal deforestation in Brazilian Amazon after Forest Act revision. Nature Sustainability, 1(11), 665.
Friis, C., & Nielsen, J. Ø. (Eds.). 2019. Telecoupling: Exploring Land-use Change in a Globalised World. Springer.
Fung, A. 2013. Infotopia: Unleashing the democratic power of transparency. Politics & Society, 41(2), 183-212.
Fung, A., Graham, M., & Weil, D. 2007. Full disclosure: The perils and promise of transparency. Cambridge University Press.
Garai, J., 2014. Environmental aspects and health risks of leather tanning industry: a study in the Hazaribag area. Chinese Journal of Population Resources and Environment, 12(3), pp.278-282.
Gardner, B. (2009). Are livestock a troublesome commodity?. Geoforum, 40(5), 781-783.
Gardner, T. A., Benzie, M., Börner, J., Dawkins, E., Fick, S., Garrett, R., ... & Mardas, N. 2018. Transparency and sustainability in global commodity supply chains. World Development.
Garrett, R. D., Carlson, K. M., Rueda, X., & Noojipady, P. 2016. Assessing the potential additionality of certification by the round table on responsible soybeans and the roundtable on sustainable palm oil. Environmental Research Letters, 11(4), 045003.
Gaworecki, M. 2017. Rotten beef and illegal deforestation: Brazil’s largest meatpacker rocked by scandals. Mongabay. Available at: https://news.mongabay.com/2017/04/rotten-beef-and-illegal-deforestation-brazils-largest-meatpacker-rocked-by-scandals/ (Last accessed 30 September 2019).
Gereffi, G., Humphrey, J., & Sturgeon, T. 2005. The governance of global value chains. Review of international political economy, 12(1), 78-104.
Gibbs HK, Rausch L, Munger J, Schelly I, Morton DC, et al. 2015b. Brazil’s Soy Moratorium. Science 347(6220): 377–378.
Gibbs, H. K., Munger, J., L'Roe, J., Barreto, P., Pereira, R., Christie, M., ... & Walker, N. F. 2016. Did ranchers and slaughterhouses respond to zero-deforestation agreements in the Brazilian Amazon?. Conservation Letters, 9(1), 32-42.

119
Gibbs, H. K., Ruesch, A. S., Achard, F., Clayton, M. K., Holmgren, P., Ramankutty, N., & Foley, J. A. 2010. Tropical forests were the primary sources of new agricultural land in the 1980s and 1990s. Proceedings of the National Academy of Sciences, 107(38), 16732-16737.
Giessen, L. 2013. Reviewing the main characteristics of the international forest regime complex and partial explanations for its fragmentation. International Forestry Review, 15(1), 60-70.
Githiru, M., & Njambuya, J. W. 2019. Globalization and Biodiversity Conservation Problems: Polycentric REDD+ Solutions. Land, 8(2), 35.
Godar, J., Tizado, E. J., & Pokorny, B. 2012. Who is responsible for deforestation in the Amazon? A spatially explicit analysis along the Transamazon Highway in Brazil. Forest Ecology and Management, 267, 58-73.
Godar, J., Persson, U.M., Tizado, E.J. and Meyfroidt, P., 2015. Towards more accurate and policy relevant footprint analyses: tracing fine-scale socio-environmental impacts of production to consumption. Ecological Economics, 112, pp.25-35.
Godar, J., Suavet, C., Gardner, T. A., Dawkins, E., Meyfroidt, P. 2016. Balancing detail and scale in assessing transparency to improve the governance of agricultural commodity supply chains. Environmental Research Letters, 11(3), 35015.
greenLife. 2017. Three years of the greenLIFE project. 2014-2017. Layman’s Report. Available at: https://www.slideshare.net/greenLIFEproject/green-life-laymans-report-en. (Last accessed 08/09/2019).
Greenpeace. 2006. Eating up the Amazon. Available at: https://www.greenpeace.org/usa/wp-content/uploads/legacy/Global/usa/report/2010/2/eating-up-the-amazon.pdf (Last accessed 30 September 2019).
Greenpeace. 2009. Slaughtering the Amazon. Available at: https://www.greenpeace.org/usa/research/slaughtering-the-amazon/ . (Last accessed 30 September 2019).
Greenpeace. 2017. Greenpeace Brazil Suspends Negotiations with Cattle Giant JBS. Available at: https://www.greenpeace.org/usa/news/greenpeace-brazil-suspends-negotiations-cattle-giant-jbs/. (Last accessed 30 September 2019).
Grunert, K. G., Hieke, S., & Wills, J. 2014. Sustainability labels on food products: Consumer motivation, understanding and use. Food Policy, 44, 177-189.
Grupo de Trabalho da Pecuária Sustentável (GTPS) – Brazilian Roundtable on Sustainable Livestock. 2018. Brazilian Livestock Overview and its Contribution to the Sustainable Development. Available at: https://www.inputbrasil.org/wp-content/uploads/2016/10/GTPS_BRAZILIAN-LIVESTOCK-OVERVIEW_v3.pdf. (Last accessed 30 September 2019).
Gulbrandsen, L.H., 2008. Accountability arrangements in non-state standards organizations: instrumental design and imitation. Organization 15 (4), 563– 583
Gupta, A. 2010. Transparency as contested political terrain: who knows what about the global GMO trade and why does it matter?. Global Environmental Politics, 10(3), 32-52.

120
Gupta, A., & Mason, M. 2016. Disclosing or obscuring? The politics of transparency in global climate governance. Current Opinion in Environmental Sustainability, 18, 82-90.
Hajer, M., & Versteeg, W. 2005. A decade of discourse analysis of environmental politics: Achievements, challenges, perspectives. Journal of environmental policy & planning, 7(3), 175-184.
Hajer, M. A., Van Den Brink, M., & Metze, T. 2006. Doing discourse analysis: coalitions, practices, meaning. Netherlands geographical studies (ISSN 0169-4839), (344).
Handfield RB, Nichols EL. 1999. Introduction to supply chain management. New Jersey: Prentice-Hall;.
Hansen, C. P., Rutt, R., & Acheampong, E. 2018. ‘Experimental’or business as usual? Implementing the European Union Forest Law Enforcement, Governance and Trade (FLEGT) Voluntary Partnership Agreement in Ghana. Forest Policy and Economics, 96, 75-82.
Harstad, B., & Mideksa, T. K. 2017. Conservation contracts and political regimes. The Review of Economic Studies, 84(4), 1708-1734.
Haupt F., Bakhtary H., Schulte I., Galt H. & Streck C. 2018. Progress on Corporate Commitments and their Implementation. Climate Focus. Available at: https://www.tfa2020.org/wp-content/uploads/2018/06/Progress-on-Corporate-Commitments-and-their-Implementation.pdf. (Last accessed 30 September 2019).
Henders, S., & Ostwald, M. 2014. Accounting methods for international land-related leakage and distant deforestation drivers. Ecological Economics, 99, 21-28.
Henders, S., Persson, U. M., & Kastner, T. (2015). Trading forests: land-use change and carbon emissions embodied in production and exports of forest-risk commodities. Environmental Research Letters, 10(12), 125012.
Higgins, V., & Richards, C. 2019. Framing sustainability: Alternative standards schemes for sustainable palm oil and South-South trade. Journal of Rural Studies, 65, 126-134
Hosonuma, N., Herold, M., De Sy, V., De Fries, R. S., Brockhaus, M., Verchot, L., ... & Romijn, E. 2012. An assessment of deforestation and forest degradation drivers in developing countries. Environmental Research Letters, 7(4), 044009.
Howard, R. J., Tallontire, A. M., Stringer, L. C., & Marchant, R. A. 2016. Which “fairness”, for whom, and why? An empirical analysis of plural notions of fairness in Fairtrade Carbon Projects, using Q methodology. Environmental science & policy, 56, 100-109. https://www.researchgate.net/publication/332665154_Make_EU_trade_with_Brazil_sustainable. (Last accessed 30 September 2019).
Humphreys, D. 2006. Logjam – Deforestation and the crisis of global governance. Earthscan, London
INPE. 2013. Metodologia para o Cálculo da Taxa Anual de Desmatamento na Amazônia Legal. Instituto National de Pesquisas Espaciais (INPE). São José dos Campos. Available at: http://www.obt.inpe.br/prodes/metodologia_TaxaProdes.pdf (Last accessed 30 September 2019).
Instituto Brasileiro de Geografia e Estatística (IBGE) (Brazilian Institute of Geography and Statistics). 2018. Sistema IBGE de Recuperação Automática – SIDRA. Pesquisa do Couro e Abate de Animais. Retrieved from: https://sidra.ibge.gov.br/home/abate/brasil on July 10, 2018
121
Instituto Nacional de Pesquisas Espaciais (INPE/Prodes). 2019. Taxas Anuais de Desmatamento. Available at:http://www.obt.inpe.br/OBT/assuntos/programas/amazonia/prodes (Last accessed 30 September 2019).
Intergovernmental Panel for Climate Change (IPCC) 2018. Summary for Policymakers. In: Global warming of 1.5°C. An IPCC Special Report on the impacts of global warming of 1.5°C above pre-industrial levels and related global greenhouse gas emission pathways, in the context of strengthening the global. Masson-Delmotte T. W. V., Zhai P., Portner H. O., Roberts D., Skea J., Shukla P. R., Pirani A., Moufouma-Okia W., P´ean C., Pidcock R., Connors S., Matthews J. B. R., Chen Y., Zhou X., Gomis M. I., Lonnoy E., Maycock T., Tignor M. Available at: https://report.ipcc.ch/sr15/pdf/sr15_spm_final.pdf (Last accessed 30 September 2019).
Intergovernmental Panel for Climate Change (IPCC). 2019. Summary for Policymakers. Climate Change and Land. An IPCC Special Report on climate change, desertification, land degradation, sustainable land management, food security, and greenhouse gas fluxes in terrestrial ecosystems. Arneth A., Barbosa H., Benton T. et al. Available at: https://www.ipcc.ch/site/assets/uploads/2019/08/Edited-SPM_Approved_Microsite_FINAL.pdf (Last accessed 30 September 2019).
International Council of Tanners (ITC). 2019. Labelling legislation database. Available at: https://leathercouncil.org/what-we-do/labelling-descriptions-of-leather/labeling-legislation-database/. (Last accessed 30 September 2019).
Investopedia. 2019. What is Protectionism? Available at: https://www.investopedia.com/terms/p/protectionism.asp
IPBES. 2019. Summary for policymakers of the global assessment report on biodiversity and ecosystem services of the Intergovernmental Science-Policy Platform on Biodiversity and Ecosystem Services. S. Díaz, J. Settele, E. S. Brondizio E.S., H. T. Ngo, M. Guèze, J. Agard, A. Arneth, P. Balvanera, K. A. Brauman, S. H. M. Butchart, K. M. A. Chan, L. A. Garibaldi, K. Ichii, J. Liu, S. M. Subramanian, G. F. Midgley, P. Miloslavich, Z. Molnár, D. Obura, A. Pfaff, S. Polasky, A. Purvis, J. Razzaque, B. Reyers, R. Roy Chowdhury, Y. J. Shin, I. J. Visseren-Hamakers, K. J. Willis, and C. N. Zayas (eds.). IPBES secretariat, Bonn, Germany. XX pages.
Italian Tanners Association (UNIC). 2017. Tales of Italian Leather. Sustainability Report 2017. Available at: http://s.unic.it/5/report-en.html#20-21 (Last accessed 30 September 2019).
Italian Tanners Association (UNIC). 2019. L'industria Conciaria Italiana. Available at: http://www.unic.it/conceria-italiana/industria-conciaria-italiana (Last accessed 30 September, 2019)
Jakov Buljan, Ivan Kráľ. 2019. The framework for sustainable leather manufacture. United Nations Industrial Development Organization (UNIDO) report. Available at: https://leatherpanel.org/sites/default/files/publications-attachments/the_framework_for_sustainable_leather_manufacturing_2nd_edition_2019_f.pdf (Last accessed 30 September 2019).
Janßen, D., & Langen, N. 2017. The bunch of sustainability labels–Do consumers differentiate?. Journal of cleaner production, 143, 1233-1245.
Jennings S., Sheane R. and McCosker C. 2017. Risky business. Understanding the UK’s overseas footprint for deforestation-risk commodities. WWF and RSPB. Available at: https://www.wwf.org.uk/riskybusiness

122
Junior, C. S., & Lima, M. 2018. Soy Moratorium in Mato Grosso: deforestation undermines the agreement. Land use policy, 71, 540-542.
Kaimowitz, D., Mertens, B., Wunder, S., & Pacheco, P. 2004. Hamburger connection fuels Amazon destruction. Bangor, Indonesia: Center for International Forest Research, 1-10.
Kalamandeen, M., Gloor, E., Mitchard, E., Quincey, D., Ziv, G., Spracklen, D., Spracklen, B., Adami, M., Aragão, L.E. and Galbraith, D., 2018. Pervasive rise of small-scale deforestation in Amazonia. Scientific reports, 8(1), p.1600.
Kanagaraj, G. and Elango, L., 2019. Chromium and fluoride contamination in groundwater around leather tanning industries in southern India: Implications from stable isotopic ratio δ53Cr/δ52Cr, geochemical and geostatistical modelling. Chemosphere, 220, pp.943-953.
Kanemoto, K., Moran, D., Lenzen, M., & Geschke, A. (2014). International trade undermines national emission reduction targets: New evidence from air pollution. Global Environmental Change, 24, 52-59.
Kehoe, L., Reis, T., Virah-Sawmy, M., Balmford, A., Kuemmerle, T., 2019. Make EU trade with Brazil sustainable. Science 364, 341–342, Available at: https://www.researchgate.net/publication/332665154_Make_EU_trade_with_Brazil_sustainable (Last accessed 30 September 2019).
Klintman, M., & Boström, M. 2008. Transparency through labelling? Layers of visibility in environmental risk management. Transparency in a New Global Order. Unveiling Organizational Visions, 178-197.
Klooster, D., 2005. Environmental certification of forests: the evolution of environmental governance in a commodity network. Journal of Rural Studies 21 (4), 403–417.
Klooster, D., 2009. Standardizing sustainable development? The Forest Stewardship Council’s plantation policy review process as neoliberal environmental governance. Geoforum 41 (1), 117–129
Koberg, E., & Longoni, A. 2018. A systematic review of sustainable supply chain management in global supply chains. Journal of Cleaner Production.
Larsen, R. K., Dimaano, F. R., & Pido, M. D. (2008). Can the Wrongs be Righted? Prospects for Remedy in the Philippine Oil Palm Agro-industry. Development and Change.
Laudal, T. 2010. An attempt to determine the CSR potential of the international clothing business. Journal of business ethics, 96(1), 63-77.
Lawson, S. 2014. Consumer Goods and Deforestation: An Analysis of the Extent and Nature of Illegality in Forest Conversion for Agriculture and Timber Plantations. Forest Trends Report Series - Forest Trade and Finance
Lawson, S. 2015. Stolen Goods. The EU’s complicity in illegal tropical deforestation. FERN. ISBN: 978-1-906607-40-1. Available at: https://www.fern.org/fileadmin/uploads/fern/Documents/Stolen%20Goods_EN_0.pdf. (Last accessed 30 September 2019).
123
Le Tourneau, F.M., 2016. Is Brazil now in control of deforestation in the Amazon?. CyberGeo: European Journal of Geography. Revisited Nov 2018 URL: http://journals.openedition.org/cybergeo/27484; DOI: 10.4000/cybergeo.27484. (Last accessed 30 September 2019).
Leather Working Group (LWG). 2019. Traceability. Available at: https://www.leatherworkinggroup.com/how-we-work/traceability (Last accessed 30 September 2019).
Lin, L., Sills, E., & Cheshire, H. (2014). Targeting areas for reducing emissions from deforestation and forest degradation (REDD+) projects in Tanzania. Global Environmental Change, 24, 277-286.
Linhares-Juvenal, T., & Neeff, T. I. L. L. 2017. Definitions matter: Zero deforestation concepts and performance indicators. Zero Deforestation: A Commitment to Change; Pasiecznik, N., Savenije, H., Eds, 3-10.
Locatelli, P., Aranha, A. 2017. JBS compra gado de áreas desmatadas ilegalmente e leva multa de R$24 milhões. Reporter Brasil. Available at: https://reporterbrasil.org.br/2017/03/jbs-compra-gado-de-areas-desmatadas-ilegalmente-e-leva-multa-de-r24-milhoes/. (Last accessed 30 September 2019).
Lovejoy, T. E., & Nobre, C. 2018. Amazon Tipping Point. Science Advances, 4(2).
Mackintosh, E. 2019. The Amazon is burning because the world eats so much meat. CNN World. Available at: https://edition.cnn.com/2019/08/23/americas/brazil-beef-amazon-rainforest-fire-intl/index.html (Last accessed 30 September 2019).
Mahanty, S., & McDermott, C. L. 2013. How does ‘Free, Prior and Informed Consent’(FPIC) impact social equity? Lessons from mining and forestry and their implications for REDD+. Land use policy, 35, 406-416.
Mair, S., Druckman, A., & Jackson, T. 2017. Investigating fairness in global supply chains: applying an extension of the living wage to the Western European clothing supply chain. The International Journal of Life Cycle Assessment, 1-12.
Malterud, K., Siersma, V. D., & Guassora, A. D. 2016. Sample size in qualitative interview studies: guided by information power. Qualitative health research, 26(13), 1753-1760.
Mammadova A. and Vasconcelos, A. 2019. Retailers wake up to deforestation risk — will Italy’s leather trade raise its game? Global Canopy. Available at: https://medium.com/global-canopy/retailers-wake-up-to-deforestation-risk-will-italys-leather-trade-raise-its-game-4c8a8293175f (Last accessed 30 September 2019).
Mammadova. A., Behagel. J. & Masiero M. 2019. Making deforestation risk visible. Discourses on bovine leather supply chain in Brazil. Manuscript submitted for publication.
MapBiomas. 2018. Map and Data, Land use change 1985-2017. Available at: http://mapbiomas.org/map#coverage (Last accessed 30 September 2019).
Mason, M. 2008. Transparency for whom? Information disclosure and power in global environmental governance. Global Environmental Politics, 8(2), 8-13.
124
McDermott, C.L. 2012. REDDuced: From sustainability to legality to units of carbon—The search for common interests in international forest governance, Environ. Sci. Policy (2012), http://dx.doi.org/10.1016/j.envsci.2012.08. 012
McDermott, M., Mahanty, S., & Schreckenberg, K. 2013. Examining equity: a multidimensional framework for assessing equity in payments for ecosystem services. Environmental Science & Policy, 33, 416-427.
Meijer, K.S. A comparative analysis of the effectiveness of four supply chain initiatives to reduce deforestation. Trop. Conserv. Sci. 2015, 8, 583–597
Mengardo, Bárbara. 2018. TACs da Carne no Pará expõem limitações do MP na área ambiental, Notícia de 10/05/2018. Jota / ((o)) eco. Available at: https://www.jota.info/especiais/tacs-da-carne-no-Pará -expoem-limitacoes-do-mp-na-area-ambiental-10052018. (Last accessed 30 September 2019).
Ministério da Economia, Indústria, Comércio Exterior e Serviços (MDIC). 2019. Empresas brasileiras exportadoras e importadoras. Available at: http://www.mdic.gov.br/index.php/comercio-exterior/estatisticas-de-comercio-exterior/empresas-brasileiras-exportadoras-e-importadoras. (Last accessed 30 September, 2019)
Ministério Público Federal (MPF) do Brazil. 2018. Procuradoria da República no Pará. Auditorias confirmam e aprimoram avanços no controle da origem da carne no Pará. Available at: http://www.mpf.mp.br/pa/sala-de-imprensa/noticias-pa/auditorias-confirmam-e-aprimoram-avancos-no-controle-da-origem-da-carne-no-para (Last accessed 30 September, 2019)
Ministério Público Federal (MPF) do Brasil. 2019. Ações penais - Operação Arquimedes. Available at: http://www.mpf.mp.br/grandes-casos/operacao-arquimedes/atuacao-do-mpf/acoes-penais (Last accessed 30 September 2019).
Miranda. E. 2018. Tons de verde: a sustentabilidade da agricultura no Brasil (Shades of Green - Sustainable Agriculture in Brazil). Metalivros. ISBN: 8582200196
Mol, A. P. 2010. The future of transparency: Power, pitfalls and promises. Global Environmental Politics, 10(3), 132-143.
Mol, A. P. 2015. Transparency and value chain sustainability. Journal of Cleaner Production, 107, 154-161.
Mol, A., & Oosterveer, P. 2015. Certification of markets, markets of certificates: Tracing sustainability in global agro-food value chains. Sustainability, 7(9), 12258-12278.
Montaigne, F. 2019. Will Deforestation and Warming Push the Amazon to a Tipping Point? Interview with Carlos Nobre. Yale Environment 360. Available at: https://e360.yale.edu/features/will-deforestation-and-warming-push-the-amazon-to-a-tipping-point (Last Accessed, 30 September 2019)
Morton, D.C., DeFries, R.S., Shimabukuro, Y.E., Anderson, L.O., Arai, E., del Bon Espirito-Santo, F., Freitas, R. and Morisette, J., 2006. Cropland expansion changes deforestation dynamics in the southern Brazilian Amazon. Proceedings of the National Academy of Sciences, 103(39), pp.14637-14641.
125
Moutinho, P., Guerra, R. and Azevedo-Ramos, C., 2016. Achieving zero deforestation in the Brazilian Amazon: What is missing?. Elem Sci Anth, 4.
Müller, H., Griffiths, P. and Hostert, P., 2016. Long-term deforestation dynamics in the Brazilian Amazon—Uncovering historic frontier development along the Cuiabá–Santarém highway. International Journal of Applied Earth Observation and Geoinformation, 44, pp.61-69.
NASA Earth Observatory. 2019. Fire. Available at: https://earthobservatory.nasa.gov/global-maps/MOD14A1_M_FIRE. (Last accessed 30 September 2019).
Nepstad D, McGrath D, Stickler C, Alencar A, Azevedo A, et al. 2014. Slowing Amazon deforestation through public policy and interventions in beef and soy supply chains. Science 344(6188): 1118–1123.
Nepstad, D. C., Stickler, C. M., & Almeida, O. T. 2006. Globalization of the Amazon soy and beef industries: opportunities for conservation. Conservation biology, 20(6), 1595-1603.
Newberry, D. 2014. Why are there cattle in the conservation area? Social barriers to biofuel governance in Brazil. Geoforum, 54, 306-314.
Newton, P., & Benzeev, R. 2018. The role of zero-deforestation commitments in protecting and enhancing rural livelihoods. Current Opinion in Environmental Sustainability, 32, 126-133.
Newton, P., Agrawal, A., & Wollenberg, L. 2013. Enhancing the sustainability of commodity supply chains in tropical forest and agricultural landscapes. Global Environmental Change, 23(6), 1761-1772.
Newton, P., Gomez, A. E. A., Jung, S., Kelly, T., de Araújo Mendes, T., Rasmussen, L. V., ... & Watkins, C. 2016. Overcoming barriers to low carbon agriculture and forest restoration in Brazil: The Rural Sustentável project. World Development Perspectives, 4, 5-7.
NYDF Assessment Partners. 2019. Protecting and Restoring Forests: A Story of Large Commitments yet Limited Progress. New York Declaration on Forests Five-Year Assessment Report. Climate Focus (coordinator and editor). Accessible at forestdeclaration.org.
O’Sullivan K. 2019. Europe is contributing to widespread deforestation in Brazil, say scientists. The Irish times. Available at: https://www.irishtimes.com/news/environment/europe-is-contributing-to-widespread-deforestation-in-brazil-say-scientists-1.3871714 (Last accessed 30 September 2019).
OECD/FAO. (2017). OECD-FAO Agricultural Outlook 2017-2026, OECD Publishing, Paris, https://doi.org/10.1787/agr_outlook-2017-en. (Last accessed 30 September 2019).
Pacheco, P. 2012. Actor and frontier types in the Brazilian Amazon: Assessing interactions and outcomes associated with frontier expansion. Geoforum, 43(4), 864-874.
Palaniappan, P. K. 2014. Risk assessment and management in supply chain. Global Journal of Research In Engineering, 14(2), 18-33.
Parkinson, J. 2003. Legitimacy problems in deliberative democracy. Political studies, 51(1), 180-196.
Parra-Bernal, G., Mello, G. 2017. Brazil police arrest JBS CEO Batista, plea deal in limbo. Reuters. Available at: https://www.reuters.com/article/us-brazil-corruption-jbs-insidertrading/brazil-

126
police-arrest-jbs-ceo-batista-plea-deal-in-limbo-idUSKCN1BO17X (Last accessed 30 September 2019).
Pendrill, F., Persson, U. M., Godar, J., Kastner, T., Moran, D., Schmidt, S., & Wood, R. 2019. Agricultural and forestry trade drives large share of tropical deforestation emissions. Global Environmental Change, 56, 1-10.
Pendrill, F., Persson, U. M., Godar, J., & Kastner, T. 2019a. Deforestation displaced: trade in forest-risk commodities and the prospects for a global forest transition. Environmental Research Letters, 14(5), 055003.
Pereira et al. 2016. Smallholders, Agrarian Reform, and Globalization in the Brazilian Amazon: Cattle versus the Environment. Land 2016, 5, 24; doi:10.3390/land5030024
Pereira, M. D. A., Jacinto, M. A. C., Gomes, A., & Evaristo, L. G. S. 2005. Cadeia produtiva do couro bovino: oportunidades e desafios. Campo Grande, MS: Embrapa Gado de Corte; 2005..
Pirard, R., Gnych, S., Pacheco, P., & Lawry, S. 2015. Zero-deforestation commitments in Indonesia: Governance challenges. 10.17528/cifor/005871.
Ponte, S., & Gibbon, P. 2011. Governing through standards: Origins, drivers and limitations. Palgrave Macmillan.
Putz, F. E., & Redford, K. H. 2010. The importance of defining ‘forest’: Tropical forest degradation, deforestation, long-term phase shifts, and further transitions. Biotropica, 42(1), 10-20.
Rautner, M., Leggett, M., Davis, F. 2013. The Little Book of Big Deforestation Drivers, Global Canopy Programme: Oxford. Available at: http://new.forestcarbonportal.com/documents/files/thelittlebookofbigdeforestation.pdf (Last accessed 30 September 2019).
Responsible Leather Round Table (RLRT). 2019. About the Responsible Leather Round Table (RLRT). Available at: https://responsibleleather.org/about/
Robalino J. & Herrera L.D. 2010. Trade and Deforestation: What have we found?. WTO Research and Analysis. Available at: https://www.wto.org/english/res_e/publications_e/wtr10_robalino_herrera_e.htm. (Last accessed 30 September 2019).
Rogerson, S., 2019. Forest 500 annual report 2018 - the countdown to 2020, Global Canopy: Oxford, UK. Lead author: Sarah Rogerson, contributing authors and reviewers: Helen Bellfield and Helen Burle.
Romania Insider. 2019. Italian furniture producer to relocate part of production to Romania to lower costs. Available at: https://www.romania-insider.com/natuzzi-relocate-production-romania
Romijn, E., Ainembabazi, J. H., Wijaya, A., Herold, M., Angelsen, A., Verchot, L., & Murdiyarso, D. 2013. Exploring different forest definitions and their impact on developing REDD+ reference emission levels: A case study for Indonesia. Environmental Science & Policy, 33, 246-259.

127
Rothrock P. and Weatherer L. 2019. Targeting Zero Deforestation. Company Progress on Commitments That Count. Forest Trends and CERES. Available at: https://www.forest-trends.org/publications/targeting-zero-deforestation/
Rudel, T. K., Defries, R., Asner, G. P., & Laurance, W. F. 2009. Changing drivers of deforestation and new opportunities for conservation. Conservation Biology, 23(6), 1396-1405.
Russel, R.S. 2009. Reeling In Outsourcing: Evaluating Supply Chain Risk and Reward Under Economic Uncertainty. Journal of Service Science, 2(1): 57-64.
Salas-Zapata, W., Ortiz-Munoz, S.M. 2018. Analysis of meanings of the concept of sustainability. Sustainable Development, 27 (1): 153-161.
Sandker, M., Finegold, Y., D'annunzio, R., & Lindquist, E. (2017). Global deforestation patterns: comparing recent and past forest loss processes through a spatially explicit analysis. International Forestry Review, 19(3), 350-368.
Sandström, V., Valin, H., Krisztin, T., Havlík, P., Herrero, M., & Kastner, T. 2018. The role of trade in the greenhouse gas footprints of EU diets. Global food security, 19, 48-55.
Sarwar, F., Malik, R.N., Chow, C.W. and Alam, K., 2018. Occupational exposure and consequent health impairments due to potential incidental nanoparticles in leather tanneries: An evidential appraisal of south Asian developing countries. Environment international, 117, pp.164-174.
Sasaki, N., & Putz, F. E. 2009. Critical need for new definitions of “forest” and “forest degradation” in global climate change agreements. Conservation Letters, 2(5), 226-232.
Scharp, L. & Richardson, T. 2001. Reflections on Foucauldian discourse analysis in planning and environmental policy research. Journal of Environmental Policy & Planning, 3, 193-209.
Schön, D. 1993/1979. ‘Generative metaphor: A perspective on problem-setting in social policy’, in A. Ortonoy (ed.) Metaphor and thought, Cambridge, UK: Cambridge University Press, pp 137-163.
Schouten, G., & Glasbergen, P. 2011. Creating legitimacy in global private governance: The case of the Roundtable on Sustainable Palm Oil. Ecological economics, 70(11), 1891-1899.
Schroeder, H., & McDermott, C. 2014. Beyond carbon: Enabling justice and equity in REDD+ across levels of governance. Ecology and Society, 19(1).
Scott, J. C. 1998. Seeing like a state: How certain schemes to improve the human condition have failed. London: Yale University Press, New Haven, CT.
Seuring, S., & Müller, M. 2008. From a literature review to a conceptual framework for sustainable supply chain management. Journal of cleaner production, 16(15), 1699-1710.
Sherman, M., Weston, H., Willey, S. & Mansfield, N. 2014. Risk y Business : Managing Risk in a Complex and Connected World. Management & Avenir, 74(8), 159-173. doi:10.3917/mav.074.0159.
SICAR. 2018. Números do Cadastro Ambiental Rural. Obtained 18 October 2018 from: http://www.car.gov.br (Last accessed 30 September 2019).
Sistema Nacional de Cadastro Ambiental Rural (SICAR). 2019. Prorrogacao. Retrieved May 3. 2019 at: http://www.car.gov.br/#/saibaMaisProrrogacao

128
Smeraldi, R. and May, P. (2009). A hora da conta: Pecuária, Amazônia e conjuntura. Amigos da Terra Amazônia Brasileira, São Paulo. http://commodityplatform.org/wp/wp-content/uploads/2009/05/a-hora-da-conta.pdf (Last accessed 30 September 2019).
Sping J. 2019. Brazil deforestation exceeds 88% in June under Bolsonaro. Reuters. Available at: https://www.reuters.com/article/us-brazil-environment/brazil-deforestation-exceeds-88-in-june-under-bolsonaro-idUSKCN1TY1VU?utm_medium=Social&utm_source=Facebook&fbclid=IwAR38OWHMfU0tWyV9jd1zS5iQnJ-pZU_J0LvKYZguogBhScRs1y9NCF707MU (Last accessed 30 September 2019).
Spring J. &, Slattery G. 2019. Corporate fallout for Brazil heats up despite signs Amazon fires may be slowing. August, 2019. Available at: https://www.reuters.com/article/us-brazil-environment/corporate-fallout-for-brazil-heats-up-despite-signs-amazon-fires-may-be-slowing-idUSKCN1VJ1I2 (Last accessed 30 September 2019).
Swartz, J. 2011. How I Did It: Timberland’s CEO on Standing Up to 65,000 Angry Activists. In Harvard Business Review on Greening Your Business Profitably. Harvard Business Press, 197–2010.
Taravella, R., & de Sartre, X. A. 2012. The symbolic and political appropriation of scales: A critical analysis of the Amazonian ranchers’ narrative. Geoforum, 43(3), 645-656.
Tattara,G. & Crestanello P. 2010. IIndustrial Clusters and the Governance of the Global Value Chain. The Romania- Veneto Network in Footwear and Clothing. Regional Studies, Taylor & Francis (Routledge), 45 (01), pp.1. ff10.1080/00343401003596299ff. ffhal-00594408
Temper, L., Demaria, F., Scheidel, A., Del Bene, D., & Martinez-Alier, J. 2018. The Global Environmental Justice Atlas (EJAtlas): ecological distribution conflicts as forces for sustainability. Sustainability Science, 13(3), 573-584.
The Chambers of Commerce (Le Camere di Commercio). 2019. Registro impresse. Available at: https://www.registroimprese.it/en_US/company-registration-report-eng-
The Ministry of Agriculture, Cattle and Supply (MAPA). 2018. Dados de rebanho bovino e bubalino no Brasil – 2017. Obtained 08 August 2018, at: http://www.agricultura.gov.br/assuntos/sanidade-animal-e-vegetal/saude-animal/programas-de-saude-animal/febre-aftosa/documentos-febre-aftosa/Dadosderebanhobovinoebub alinodoBrasil_2017.pdf (Last accessed 30 September 2019).
The Ministry of Agriculture, Cattle and Supply (MAPA). 2018a. Dados de rebanho bovino e bubalino no Brasil – 2017. Available at: http://www.agricultura.gov.br/assuntos/sanidade-animal-e-vegetal/saude-animal/programas-de-saude-animal/febre-aftosa/documentos-febre-aftosa/DadosderebanhobovinoebubalinodoBrasil_2017.pdf (Last accessed 30 September 2019).
Tollefson, J. 2015. Stopping deforestation: battle for the Amazon. Nature News, 520(7545), 20.
Toohey, D.E., 2013. Diffusion of Environmental Governance vs. Corporate Power in the Context of Global Environmental Crises. International Journal of Peace Studies, pp.1-26.
Torfing, J. 2005. Discourse theory: Achievements, arguments, and challenges. In Discourse theory In European politics (pp. 1-32). Palgrave Macmillan, London.
Trase, 2018. Trase Yearbook 2018. Assessing deforestation risk in Brazilian soy exports. Available at: https://yearbook2018.trase.earth/chapter5/ (Last accessed 30 September 2019).
129
Umunay, P., Lujan, B., Meyer, C., & Cobián, J. (2018). Trifecta of Success for Reducing Commodity-Driven Deforestation: Assessing the Intersection of REDD+ Programs, Jurisdictional Approaches, and Private Sector Commitments. Forests, 9(10), 609.
UNFCCC. 2002. Report of the Conference of the Parties on itsseventh session, held at Marrakesh from 29 October to 10November 2001 (FCCC/CP/2001/13/Add.1, UNFCCC,Marrakesh, Morocco, 2001). Available at: http://unfccc.int/resource/docs/cop7/13a01.pdf. (Last accessed 30 September 2019).)
Unione Nazionale Industria Conciaria, UNIC. 2019. L'Industria Conciaria Italiana. Available at: http://www.unic.it/conceria-italiana/industria-conciaria-italiana (Last accessed 30 September 2019).
United Nations Principles for Responsible Investment (UNPRI). 2019. Investor statement on deforestation and forest fires in the Amazon. Available at: https://www.unpri.org/Uploads/c/t/z/investorstatementondeforestationandforestfiresintheamazon_v2_766762.pdf. (Last accessed 30 September 2019).
United Nations Statistics Division (UNSD) 2001. The Glossary of Environment Statistics. Available at: https://unstats.un.org/unsd/iiss/Glossary-of-Environment-Statistics.ashx (Last accessed 30 September 2019).
van Bommel, S., van Hulst, M.J. and Yanow, D., 2014. Interpretive policy analysis in the Netherlands. In Policy analysis and evaluation in the Netherlands: Institutionalization and Performance (pp. 69-86). Policy Press.
van der Ven et al. 2018. Do eco-labels prevent deforestation? Lessons from non-state market driven governance in the soy, palm oil, and cocoa sectors. Global Environmental Change 52 (2018) 141–151. https://doi.org/10.1016/j.gloenvcha.2018.07.002
van der Ven, H., Rothacker, C., & Cashore, B. 2018. Do eco-labels prevent deforestation? Lessons from non-state market driven governance in the soy, palm oil, and cocoa sectors. Global environmental change, 52, 141-151.
van Hulst, M.J. 2008. ‘Love and life in heartless town or the use of metaphor in local planning’, in T. Carver and J. Pikalo (eds.) Politics, Language and Metaphor, London: Routledge, pp 212-224.
Van Noordwijk, M., & Minang, P. 2009. If we cannot define it, we cannot save it: forest definitions and REDD. ASB PolicyBrief, 15.
Walker, N., Patel, S., Davies, F., Milledge, S., Hulse, J. & Davey, E. 2013. Reducing 'forest footprints': tackling demand for forest-risk commodities. IED Briefing Paper - International Institute for Environment and Development. No.17167.
Walker, N., Patel, S., Kalif, K. 2013. From Amazon pasture to the high street: deforestation and the Brazilian cattle product supply chain. Tropical Conservation Science, 6(3), 446–467.
Walker, R., Defries, R., Vera-Diaz, M.D.C., Shimabukuro, Y. and Venturieri, A., 2009. The expansion of intensive agriculture and ranching in Brazilian Amazonia. Amazonia and global change, pp.61-81.
Wallace, S. 2018. Brazil's new leader promised to exploit the Amazon—but can he? National Geographic. Available at: https://www.nationalgeographic.com/environment/2018/10/brazil-president-jair-bolsonaro-promises-exploit-amazon-rain-forest/ (Last accessed 30 September 2019).

130
Weatherley-Singh, J. and Gupta, A., 2018. “Embodied Deforestation” as a New EU Policy Debate to Tackle Tropical Forest Loss: Assessing Implications for REDD+ Performance. Forests, 9(12), p.751.
Weber, A. K., & Partzsch, L. 2018. Barking up the right tree? NGOs and corporate power for deforestation-free supply chains. Sustainability, 10(11), 3869.
Welford, R., 2013. Hijacking environmentalism: Corporate responses to sustainable development. Routledge.
Widerberg, O., & Pattberg, P. 2017. Accountability challenges in the transnational regime complex for climate change. Review of Policy Research, 34(1), 68-87.
World Economic Forum. 2019. The Global Risks Report 2019. 14th Edition. Available at: http://www3.weforum.org/docs/WEF_Global_Risks_Report_2019.pdf (Last accessed 30 September 2019).Wunder, S. 2000. The economics of deforestation: the example of Ecuador. Macmillan Press Ltd., London. pp. 9-55.
Yanow, D. 2008. ‘Cognition meets action: Metaphors as models of and models for’, in T. Carver and J. Pikalo (eds.) Political language and metaphor, London: Routledge, pp 225-2138.
Yeung, H. W. C., & Coe, N. M. 2015. Toward a dynamic theory of global production networks. Economic Geography, 91(1), 29-58.
List of websites and databases
ABIEC (2017)
http://www.brazilianbeef.org.br/
BLG (2017) http://www.guiabrasileirodocouro.com.br/ CEPEA (2017)
http://www.cepea.esalq.usp.br/br
CBD 2017 https://www.cbd.int/countries/?country=br CICB (2017) http://www.cicb.org.br/cicb Chatham House (2017)
http://resourcetrade.earth/
EC (2017) http://ec.europa.eu/environment/forests/impact_deforestation.htm FAOSTAT http://www.fao.org/faostat/en/#home Forest 500 http://forest500.org/rankings/other-powerbrokers/leather-working-group GFW (2017) http://data.globalforestwatch.org/ GFWC (2017)
http://commodities.globalforestwatch.org/#v=home
IBGE (2017a)
http://agenciadenoticias.ibge.gov.br/agencia-sala-de-imprensa/2013-agencia-de-noticias/releases/16254-pib-2-tri.html
IBGE (2017b)
http://www.ibge.gov.br/apps/populacao/projecao/index.html
IBGE (2017c)
http://www.ibge.gov.br/home/estatistica/economia/agropecuaria/censoagro/2006_segunda_apuracao/default.shtm
JBS (2017) http://jbs.com.br/en/sobre/
131
LAPIG (2017)
http://maps.lapig.iesa.ufg.br/lapig.html
LWG (2017) https://www.leatherworkinggroup.com/leather-manufacturers-and-traders/leather-manufacturers/our-rated-members?country=Brazil
MAPA (2017)
http://www.agricultura.gov.br/
MapBiomas http://mapbiomas.org/ Marfrig (2017)
http://www.marfrig.com.br/en
Minerva http://portal.minervafoods.com/minerva/home-minerva MMA (2017)
http://combateaodesmatamento.mma.gov.br/
PROBIO/MMA
http://mapas.mma.gov.br/mapas/aplic/probio/ datadownload.htm?/
OEC http://atlas.media.mit.edu/en/profile/country/bra/ Portal Brasil (2017)
http://www.brasil.gov.br/economia-e-emprego/2017/04/operacoes-Pará -o-censo-agropecuario-2017-comecam-em-outubro
SIF (2017) http://sigsif.agricultura.gov.br/sigsif_cons/%21ap_estabelec_nacional_rep SIDRA (2017)
https://sidra.ibge.gov.br
SECEX/MDIC (2017)
http://aliceweb.desenvolvimento.gov.br
UNDP http://hdr.undp.org/en/data WB (2017) http://data.worldbank.org/
List of personal communication Anonymous. (2018, May 11). Personal communication. Sao Paulo
Anonymous. (2018, May 17). Personal communication.Piracicaba, Sao Paulo
Anonymous. (2018, May 22). Personal Communication. Maraba, Para
Anonymous. (2018, May 23). Personal Communication. Maraba, Para
Anonymous. (2018, May 23). Personal Communication. Maraba, Para
Anonymous. (May 24, 2018). Personal Communication, Belem, Para
Anonymous. (2018, May 28). Personal Communication. Belem, Para
Anonymous. (2018, June 07). Personal Communication. Cuiaba, Mato Grosso
Anonymous. (2018, June 08). Personal Communication. Cuiaba, Mato Grosso
Anonymous. (2018, June 26). Personal Communication over skype. Porto Alegre, Rio Grande do Sul
Anonymous. (2018, June 27). Personal Communication. Porto Alegre, Rio Grande do Sul
Anonymous. (2018, July 04). Personal Interview. Sao Paulo


133
Annex 1. Data sources and collection methods for geospatial analysis Slaughterhouses
Only slaughterhouses under the SIF within the BLA were considered for the geospatial analysis. Data on the location of slaughterhouses were based on LAPIG (Laboratório de Processamento de Imagens e Geoprocessamento) database (LAPIG, 2017). The information available through LAPIG was cross-checked with the MAPA (Ministry of Livestock and Supply) database (SIF, 2017) where all information on operating slaughterhouses under SIF are available, including address, company name and processing capacity. An up-to-date data layer on the location of slaughterhouses was produced by locating new slaughterhouses (not yet available through LAPIG data) with Google Earth. All edits made were accurate to the municipal level.
Tanneries
Unlike slaughterhouses, tanneries do not have high sanitary requirements and are not closely monitored by the inspection system (Walker et al., 2013). No readily available data (e.g. shapefile or keyhole mark-up language file) on the location of tanneries could be found. Thus, tanneries were located with Google Earth, using their addresses as retrieved from multiple sources, including the Leather Working Group (LWG, 2017), the Centre for the Brazilian Tanning Industry (CICB, 2017), the SIF database (SIF, 2017) and the Brazilian Leather Guide (BLG, 2017). Addresses were checked across databases to ensure consistency in terms of municipality or the postal code zone. The same geospatial analysis applied to slaughterhouses was used for tanneries in order to allow comparisons despite the fact transportation of hides are not under the same distance constraints when compared to live cattle.
Deforestation
Data on deforestation were gathered from PRODES project for the period from 2005 to 2016. This period was chosen due to data availability and cross-validation concerns. Data on deforestation were primarily collected directly from the PRODES database (INPE, 2017), but they were also cross-checked with PRODES data made available in LAPIG (2017) and Global Forest Watch (GFW, 2017) databases. The methodology used by PRODES has changed over the years and so did the consistency of data made available. Thus, careful consideration was needed when compiling deforestation statistics for the period. Most importantly, the deforestation polygons do not equal the deforestation rates published every year because the latter also have estimates of the deforestation occurring under cloud covered scenes (INPE, 2013). Aside from data availability and cross-validation concerns, 2005 is also used as a milestone in the literature (Nepstad et al., 2014). 2005 marked the start of the “Plan for the Protection and Control of Deforestation in the Amazon” (PPCDAm), established in 2004, the year Brazil experienced the second highest rate of deforestation in its history (27,772 km2) (INPE, 2017). It also marks the start of the 72% decline between 2004 and 2016 (84% decline from 2004 to 2012) in BLA deforestation rates (INPE, 2017). The geospatial analysis was carried out in August 2017, thus 2016 was the latest year of consolidated data available.
Potential buying zones
Based on studies discussing animal transport to slaughterhouses and pre-slaughter management, a few parameters were extracted for the geospatial analysis (Bertoloni et al.,

134
2012; Frasão et al., 2014; Neto et al., 2015). Cattle transportation time can vary from 30 minutes to 15 hours (Neto et al., 2015). A transport above 15 hours is considered unacceptable for animal welfare (Bertoloni et al., 2012; Warris et al., 1995). Long transport on inadequate roads is, in fact, increasingly avoided, as reflected in lower animal mortality (Bertoloni et al., 2012). A combination of losses due to mortality, lesions (which occur often in the prime cuts and need to be discarded) and the decreased quality due to stress and tiredness makes short distances preferable (Bertoloni et al., 2012; Frasão et al., 2014; Neto et al., 2015; Warris et al., 1995). Bertoloni et al. (2012) and Frasão et al. (2014), use distances between 50 km and 250 km to evaluate different transport effects on cattle, suggesting these distances are the most common. Barreto et al. (2017), however, discuss their analysis based on average 360 km for SIF and 153 km for SIE registered slaughterhouses in the state of Pará . Personal interview with the representatives of a slaughterhouse in Marabá municipality in Pará in June 2018 revealed potential buying zones to range between 300-700 km depending on the municipality and market demand for beef. Based on this observation, a conservative radius of 100 km around slaughterhouses was used for the whole BLA when assessing deforestation in the proximity of these facilities.
The deforestation within 100 km of each slaughterhouse was computed for each year and further aggregated to provide a view of the whole decade. A geospatial risk was assigned for each slaughterhouse depending on the total deforestation within the 100 km radius. Quartiles were computed based on each slaughterhouse’s associated deforestation and slaughterhouses were classified as follows:
- “Very high risk”: if Q3 ≤ DefArea ≤ Max - “High risk”: if Q2 ≤ DefArea < Q3 - “Medium risk”: if Q1 ≤ DefArea < Q2 - “Low risk”: if Min ≤ DefArea < Q1
where, “DefArea” is the deforested area within the 100 km2 radius, “Min” is the Minimum value for deforestation within 100 km2 radius found, “Max” is the Maximum for deforestation within 100 km2 radius value found “Q1”, “Q2” and “Q3” represent the first, second and third quartile respectively. The majority of the geospatial analysis as well as all the elaboration of figures presented in this thesis was carried out in QGIS (Las Palmas, 2.18).

135
Annex 2: List of slaughterhouses in Brazilian Legal Amazon
Table 9: List of slaughterhouses in Brazilian Legal Amazon, the assigned deforestation risk and associated information
Company SIF Code Deforestation 2005-
2016 (km2) Rank State City
FRIGORFICO NOSSO LTDA
386 4,324.98 4 RO Porto Velho
T. M. DA SILVA DE CARVALHO FRIGORIFICO - EPP
4686 3,283.18 4 PA Novo Progresso
FRIGOL S. A. L 4150 3,124.02 4 PA São Félix do Xingu
JBS S/A 2011 2,889.43 4 MT Juruena
JBS S/A 4393 2,504.95 4 MT Vila Rica
FRIGOARI - FRIGORIFICO ARIQUEMES S/A
511 2,297.57 4 RO Ariquemes
JBS S/A 1110 2,207.89 4 PA Santana do Araguaia
UNIBRAX ALIMENTOS E PARTICIPACOES S/A ULL
3038 2,073.91 4 PA Jacunda
JBS S/A 4149 1,980.77 4 RO Porto Velho
JBS S/A 457 1,976.36 4 PA Marabá
FRIGORIFICO FORTEFRIGO LTDA
372 1,915.68 4 PA Paragominas
JBS S/A 3470 1,837.84 4 MT Confresa
JBS S/A 3297 1,723.31 4 AC Rio Branco
FRIGORIFICO REDENTOR S/A.
411 1,716.93 4 MT Guarantã do Norte
JBS S/A 4323 1,702.93 4 MT Matupá
VALE GRANDE INDUSTRIA E COMERCIO DE ALIMENTOS S/A
4490 1,654.56 4 MT Matupá

136
Company SIF Code Deforestation 2005-
2016 (km2) Rank State City
FRIGORIFICO NOSSO LTDA
4086 1,537.98 4 AC Senador Guiomard
JBS S/A 4268 1,489.89 4 MT Colíder
JBS S/A 4302 1,475.95 4 MT Alta Floresta
ABATEDOURO DE BOVINOS SAMPAIO LTDA – ME
2258 1,412.57 4 PA Redenção
AGROPAM - AGRICULTURA E PECUARIA AMAZONAS S/A
2803 1,388.68 4 AM Boca do Acre
VALE GRANDE INDUSTRIA E COMERCIO DE ALIMENTOS S/A
2937 1,379.71 3 MT Nova Canaã Norte
JBS S/A 200 1,332.41 3 MT Juara
JBS S/A 2350 1,317.39 3 PA Tucumã
MFB MARFRIG FRIGORFICOS BRASIL S. A.
1497 1,304.80 3 PA Tucumã
JBS S/A 807 1,280.55 3 PA Redenção
MASTERBOI LTDA 2437 1,247.85 3 PA São Geraldo do Araguaia
FRIGORIFICO RIO MARIA LTDA
112 1,245.37 3 PA Rio Maria
MAFRIPAR MATADOURO FRIGORIFICO PARAENSE LTDA
4413 1,217.28 3 PA Xinguara
XINGUARA INDSTRIA E COMRCIO S/A
4398 1,209.03 3 PA Xinguara
FRIGORFICO VALE DO TOCANTINS S/A
2431 1,194.13 3 MA Imperatriz
MFB MARFRIG FRIGORFICOS BRASIL S. A.
3250 1,118.22 3 RO Chupinguaia

137
Company SIF Code Deforestation 2005-
2016 (km2) Rank State City
JBS S/A 2942 1,092.08 3 MT Juína
FRIGOMIL FRIGORFICO MIL LTDA
4510 1,023.71 3 RO Pimenta Bueno
JBS S. A. 2880 1,009.05 3 RO Pimenta Bueno
VPR BRASIL – IMPORTAÇÕES E EXPORTAÇÕES LTDA
3801 994.00 3 MT São José do Rio Claro
MATADOURO FRIGORIFICO DO NORTE LTDA - MAFRINORTE
2801 986.39 3 PA Castanhal
MINERVA INDSTRIA E COMRCIO DE ALIMENTOS S/A
791 950.31 3 RO Rolim de Moura
FRIGOL S. A. 2583 922.88 3 PA Água Azul do Norte
COMPANHIA DE DESENVOLVIMENTO DE RORAIMA
2040 921.74 3 RR Boa Vista
INDUSTRIA DE CARNES E DERIVADOS BONUTT LTDA
2852 906.52 3 TO Araguaína
DISTRIBOI - INDUSTRIA COMÉRCIO E TRANSPORTE DE CARNE BOVINA LTDA
4334 904.27 3 RO Rolim de Moura
IRMOS GONALVES, COMRCIO E INDSTRIA LTDA
2443 896.44 2 RO Jaru
JBS S/A 175 868.79 2 RO São Miguel do Guaporé
MATADOURO E FRIGORIFICO EXTEMO NORTE LTDA
4554 750.07 2 PA Castanhal
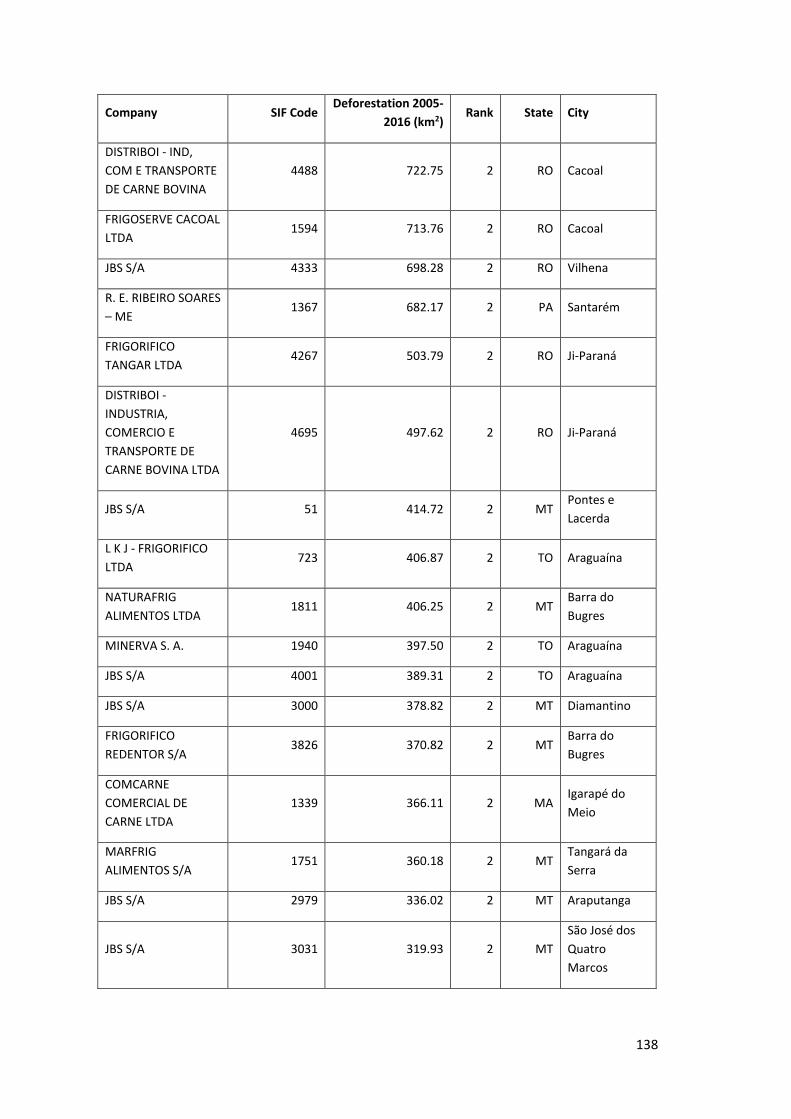
138
Company SIF Code Deforestation 2005-
2016 (km2) Rank State City
DISTRIBOI - IND, COM E TRANSPORTE DE CARNE BOVINA
4488 722.75 2 RO Cacoal
FRIGOSERVE CACOAL LTDA
1594 713.76 2 RO Cacoal
JBS S/A 4333 698.28 2 RO Vilhena
R. E. RIBEIRO SOARES – ME
1367 682.17 2 PA Santarém
FRIGORIFICO TANGAR LTDA
4267 503.79 2 RO Ji-Paraná
DISTRIBOI - INDUSTRIA, COMERCIO E TRANSPORTE DE CARNE BOVINA LTDA
4695 497.62 2 RO Ji-Paraná
JBS S/A 51 414.72 2 MT Pontes e Lacerda
L K J - FRIGORIFICO LTDA
723 406.87 2 TO Araguaína
NATURAFRIG ALIMENTOS LTDA
1811 406.25 2 MT Barra do Bugres
MINERVA S. A. 1940 397.50 2 TO Araguaína
JBS S/A 4001 389.31 2 TO Araguaína
JBS S/A 3000 378.82 2 MT Diamantino
FRIGORIFICO REDENTOR S/A
3826 370.82 2 MT Barra do Bugres
COMCARNE COMERCIAL DE CARNE LTDA
1339 366.11 2 MA Igarapé do Meio
MARFRIG ALIMENTOS S/A
1751 360.18 2 MT Tangará da Serra
JBS S/A 2979 336.02 2 MT Araputanga
JBS S/A 3031 319.93 2 MT São José dos Quatro Marcos
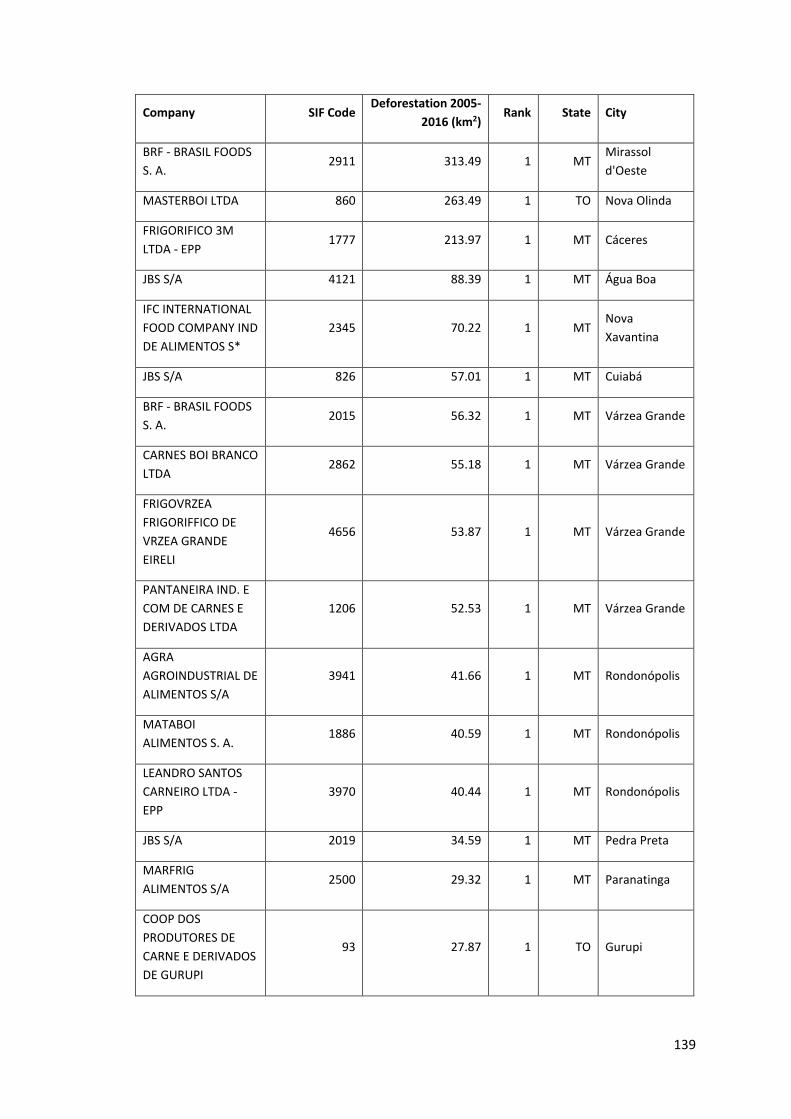
139
Company SIF Code Deforestation 2005-
2016 (km2) Rank State City
BRF - BRASIL FOODS S. A.
2911 313.49 1 MT Mirassol d'Oeste
MASTERBOI LTDA 860 263.49 1 TO Nova Olinda
FRIGORIFICO 3M LTDA - EPP
1777 213.97 1 MT Cáceres
JBS S/A 4121 88.39 1 MT Água Boa
IFC INTERNATIONAL FOOD COMPANY IND DE ALIMENTOS S*
2345 70.22 1 MT Nova Xavantina
JBS S/A 826 57.01 1 MT Cuiabá
BRF - BRASIL FOODS S. A.
2015 56.32 1 MT Várzea Grande
CARNES BOI BRANCO LTDA
2862 55.18 1 MT Várzea Grande
FRIGOVRZEA FRIGORIFFICO DE VRZEA GRANDE EIRELI
4656 53.87 1 MT Várzea Grande
PANTANEIRA IND. E COM DE CARNES E DERIVADOS LTDA
1206 52.53 1 MT Várzea Grande
AGRA AGROINDUSTRIAL DE ALIMENTOS S/A
3941 41.66 1 MT Rondonópolis
MATABOI ALIMENTOS S. A.
1886 40.59 1 MT Rondonópolis
LEANDRO SANTOS CARNEIRO LTDA - EPP
3970 40.44 1 MT Rondonópolis
JBS S/A 2019 34.59 1 MT Pedra Preta
MARFRIG ALIMENTOS S/A
2500 29.32 1 MT Paranatinga
COOP DOS PRODUTORES DE CARNE E DERIVADOS DE GURUPI
93 27.87 1 TO Gurupi
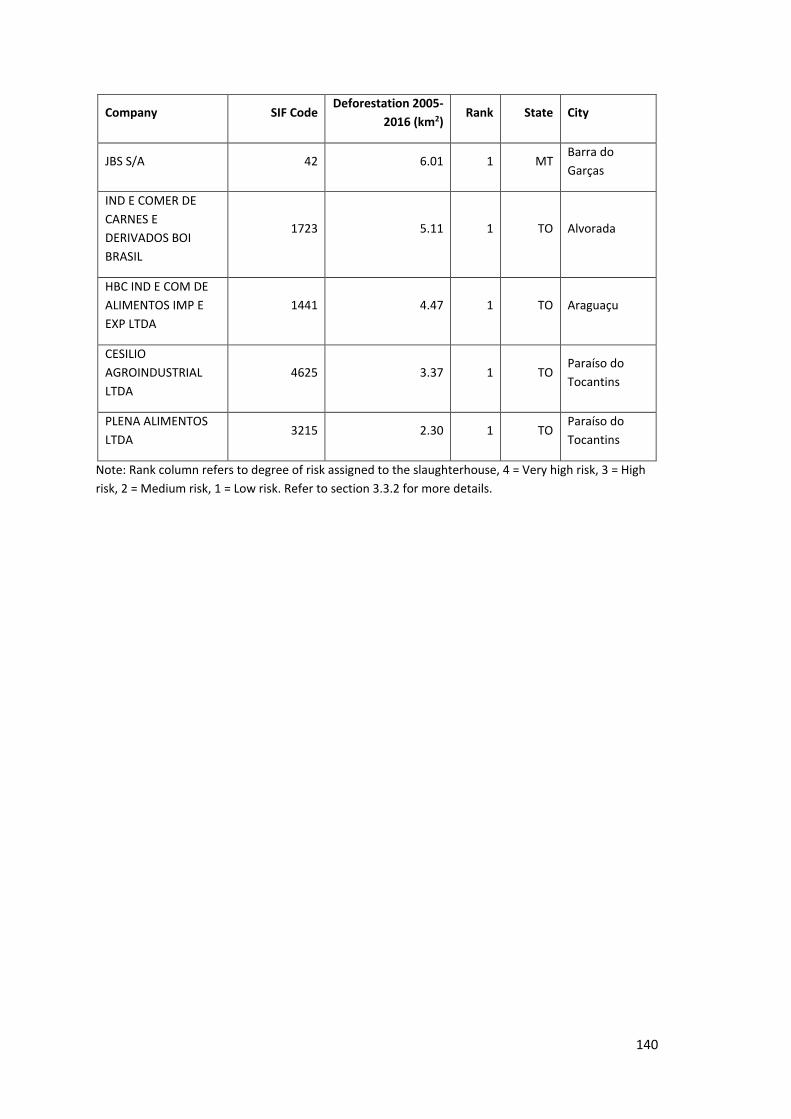
140
Company SIF Code Deforestation 2005-
2016 (km2) Rank State City
JBS S/A 42 6.01 1 MT Barra do Garças
IND E COMER DE CARNES E DERIVADOS BOI BRASIL
1723 5.11 1 TO Alvorada
HBC IND E COM DE ALIMENTOS IMP E EXP LTDA
1441 4.47 1 TO Araguaçu
CESILIO AGROINDUSTRIAL LTDA
4625 3.37 1 TO Paraíso do Tocantins
PLENA ALIMENTOS LTDA
3215 2.30 1 TO Paraíso do Tocantins
Note: Rank column refers to degree of risk assigned to the slaughterhouse, 4 = Very high risk, 3 = High risk, 2 = Medium risk, 1 = Low risk. Refer to section 3.3.2 for more details.

141
Annex 3: List of tanneries in Brazilian Legal Amazon
Table 10: List of tanneries in Brazilian Legal Amazon, the assigned deforestation risk and associated information
COMPANY Deforestation
2005-2016 (km2)
Rank State City LWG
certification
JBS S/A MARABA 2,039.04 4 PA Marabá Yes
CURTUME BLUBRAS 1,820.81 4 MT Sinop Yes
JBS COLIDER 1,522.88 4 MT Colíder Yes
DURLICOUROS INDÚSTRIA COMÉRCIO DE COUROS EXPORTAÇÃO E IMPORTAÇÃO LTDA
1,223.11 4 PA Xinguará Yes
CURTIDORA RIBEIRÃOZINHO LTDA
1,057.25 4 MA Governador
Edison Lobão No
CURTUME SANTA MARIA LTDA 1,054.57 4 MA Governador
Edison Lobão Yes
MARANHÃO INDÚSTRIA DE COURO LTDA.
1,051.88 3 MA Governador
Edison Lobão Yes
COUROS BOA VISTA LTDA. 976.97 3 RR Boa Vista Yes
MASTERCOUROS COMÉRCIO IMPORTAÇÃO E EXPORTAÇÃO DE COUROS LTDA.
961.14 3 PA Castanhal Yes
JBS S/A COLORADO DO OESTE 753.11 3 RO Colorado do
Oeste Yes
JBS S/A CACOAL 725.94 3 RO Cocal Yes
COURO DO NORTE LTDA 601.07 2 PA Belém No
MJ NOVAES DE LIMA E CIA LTDA
589.67 2 PA Belém No
CURTUME ARAPUTANGAS S/A 349.96 2 MT Araputanga Yes
CURTIDORA TOCANTINS LTDA 169.86 2 TO Colinas do Tocantins
Yes
CURTUME JANGADAS S/A 65.55 2 MT Jangada Yes
VIPOSA S/A 61.80 1 MT Várzea Grande Yes
DURLICOUROUS CUIBA 60.42 1 MT Cuiabá Yes
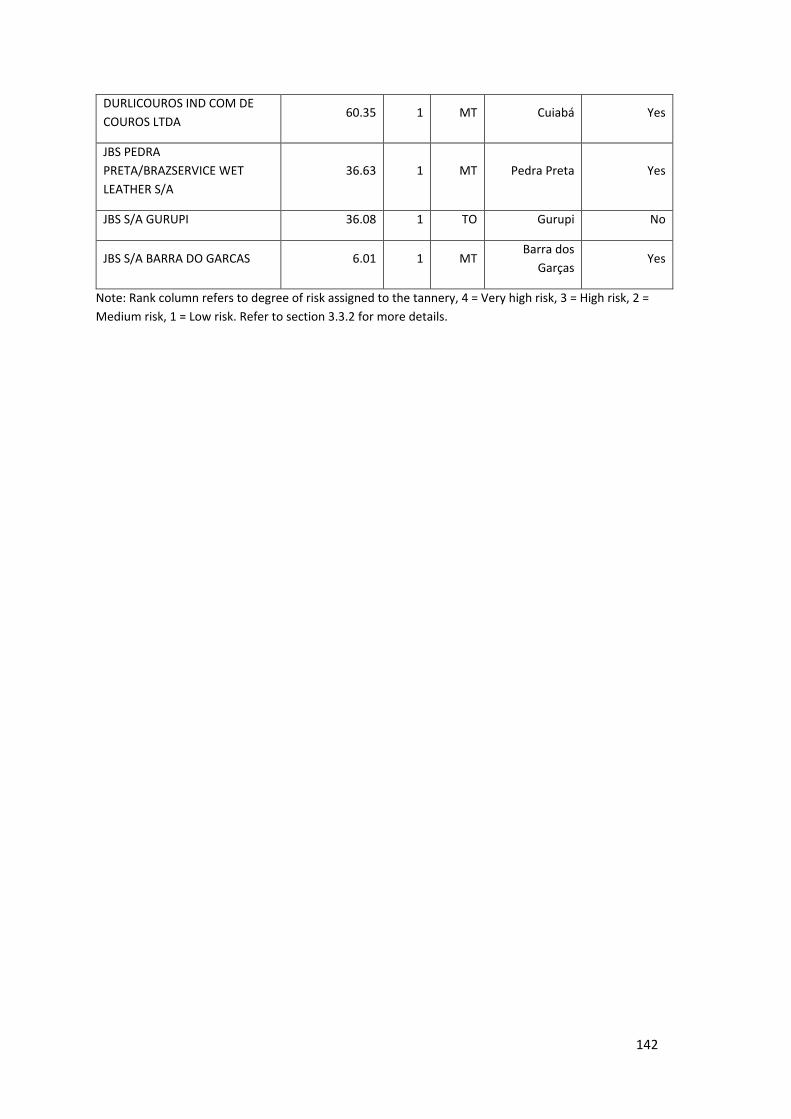
142
DURLICOUROS IND COM DE COUROS LTDA
60.35 1 MT Cuiabá Yes
JBS PEDRA PRETA/BRAZSERVICE WET LEATHER S/A
36.63 1 MT Pedra Preta Yes
JBS S/A GURUPI 36.08 1 TO Gurupi No
JBS S/A BARRA DO GARCAS 6.01 1 MT Barra dos
Garças Yes
Note: Rank column refers to degree of risk assigned to the tannery, 4 = Very high risk, 3 = High risk, 2 = Medium risk, 1 = Low risk. Refer to section 3.3.2 for more details.

143
Annex 4. The list of Harmonized Commodity Description and Coding Systems (HS) applicable to the case of bovine leather
Table 11. The list of Harmonized Commodity Description and Coding Systems (HS) applicable to the case of bovine leather
HS2 41-43. Raw Hides, Skins, Leather, & Furs 41. Raw hides and skins (other than furskins) and leather
42. Articles of leather; saddlery and harness; travel goods,handbags and similar containers; articles of animal gut(other than silk-worm gut)
43. Furskins and artificial fur; manufactures thereof
HS2 Description HS4 Description HS6 Description HS8 Description
41 Raw hides and skins (other than furskins) and leather
4101 Raw hides and skins of bovine (including buffalo) or equine animals (fresh, or salted, dried, limed, pickled or otherwise preserved, but not tanned, parchment-dressed or further prepared), whether or not dehaired or split
410110 Raw skins of bovine, whole, when dried<=8kg, etc.
41011000 Raw skins of bovine, whole, when dried<=8kg, etc.
410120 Whole raw hides and skins of bovine incl. buffalo or equine animals, whether or not dehaired or split, of a weight per skin <= 8 kg when simply dried, <= 10 kg when dry-salted, or <= 16 kg when fresh, wet-salted or otherwise preserved (excl. tanned and pa
41012000 Raw hides and skins, whole, with weight restriction
41012010 Whole leathers/skin of bovine, n/divided w<=8kg
41012020 Divid./whol.leathers/skin, bovine, grain splits, w<=8kg
41012030 Divid./whol.leat./skin, bovine, splits(than grain)w<=8kg
410121 Whole hides and skins of bovine animals (fresh or wet-salted)
41012110 Raw skins of bovine, whole, n/divided, fresh, etc.
41012120 Raw skins of bovine, whole, grain splits, fresh, etc
41012130 Raw skins of bov.whole, splits(than grain spl.)fresh, etc
410122 Buttes and bends (skins of bovine animals)
41012210 Raw skins of bovine, (backs), not slipt, fresh, etc

144
41012220 Raw skins of bovine, (backs), grain splits, fresh, etc
41012230 Raw skins of bovine, (backs), slipts(than grain)fresh, etc
410129 Other hides and skins of bovine animals (fresh or wet-salted)
41012910 Oth.raw skins of bov.(backs), n/slipt, fresh, etc
41012920 Oth.raw skins of bovine, (backs), grain splits, fresh, etc
41012930 Ot.raw skins of bovine, slipts(than grain spl.)fresh, etc
41013010 Raw skins of bovine, conser.of another way, not slipt
41013020 Raw skins, of bovine, conser.of another way, grain splits
41013030 Raw skins of bovine, cons.another way slipts(than grain)
410150 Whole raw hides and skins of bovine incl. buffalo or equine animals, whether or not dehaired or split, of a weight per skin > 16 kg, fresh,or salted, dried,limed, pickledor otherwisepreserved (excl.tanned,parchment-dressed orfurtherprepared)
41015010 Whole leathers/skin of bovine, not split, w<=16kg
41015020 Whole leathers/skin, bovine, grain splits, w<=16kg
41015030 Whole leath./skin, bov.slipts(ot.than grain sp.), w<=16kg
410190 Butts, bends, bellies and split raw hides and skins of bovine incl. buffalo or equine animals, whether or not dehaired, fresh, or salted, dried,
41019010 Other leathers/skin, bovine, not split
41019020 Other leathers/skin, of bovine, grain splits
41019030 Raw skins of bovine, cons.another way slipts(than grain)
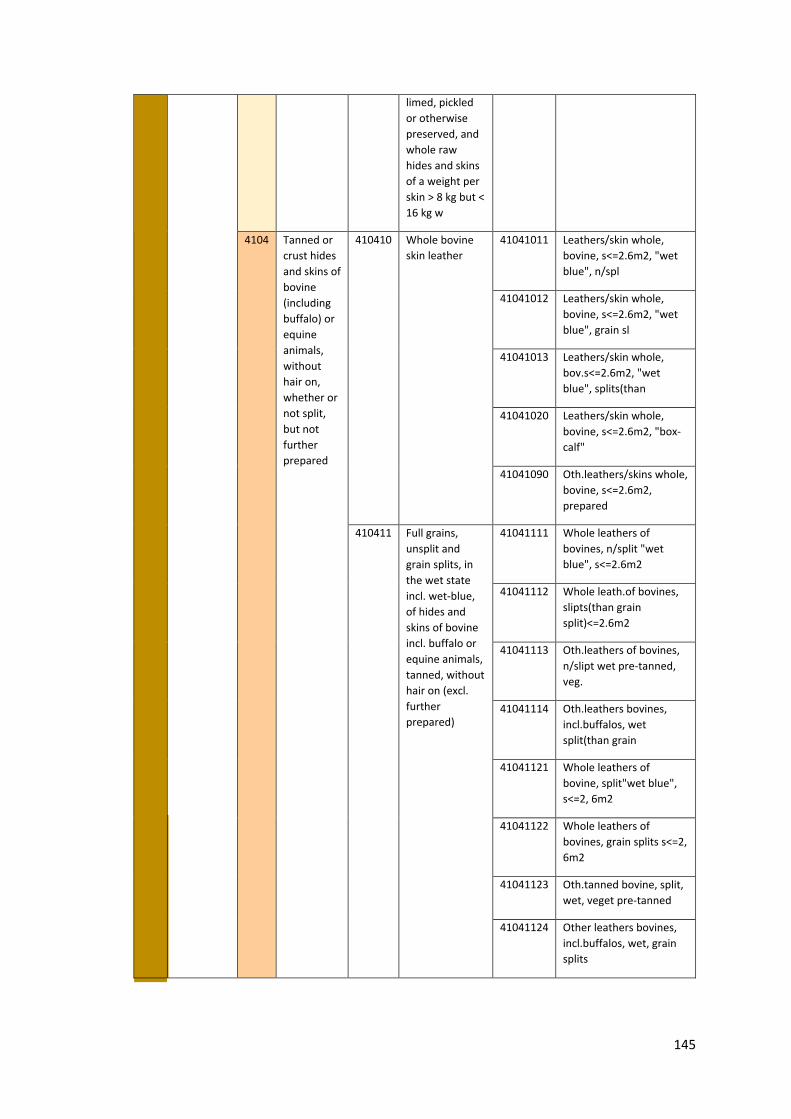
145
limed, pickled or otherwise preserved, and whole raw hides and skins of a weight per skin > 8 kg but < 16 kg w
4104 Tanned or crust hides and skins of bovine (including buffalo) or equine animals, without hair on, whether or not split, but not further prepared
410410 Whole bovine skin leather
41041011 Leathers/skin whole, bovine, s<=2.6m2, "wet blue", n/spl
41041012 Leathers/skin whole, bovine, s<=2.6m2, "wet blue", grain sl
41041013 Leathers/skin whole, bov.s<=2.6m2, "wet blue", splits(than
41041020 Leathers/skin whole, bovine, s<=2.6m2, "box-calf"
41041090 Oth.leathers/skins whole, bovine, s<=2.6m2, prepared
410411 Full grains, unsplit and grain splits, in the wet state incl. wet-blue, of hides and skins of bovine incl. buffalo or equine animals, tanned, without hair on (excl. further prepared)
41041111 Whole leathers of bovines, n/split "wet blue", s<=2.6m2
41041112 Whole leath.of bovines, slipts(than grain split)<=2.6m2
41041113 Oth.leathers of bovines, n/slipt wet pre-tanned, veg.
41041114 Oth.leathers bovines, incl.buffalos, wet split(than grain
41041121 Whole leathers of bovine, split"wet blue", s<=2, 6m2
41041122 Whole leathers of bovines, grain splits s<=2, 6m2
41041123 Oth.tanned bovine, split, wet, veget pre-tanned
41041124 Other leathers bovines, incl.buffalos, wet, grain splits

146
410419 Hides and skins of bovine incl. buffalo or equine animals, in the wet state incl. wet-blue, tanned, without hair on, whether or not split (excl. further prepared and full grains, unsplit and grain splits)
41041910 Other whole leathers of bovines, "wet blue", s<=2, 6m2
41041920 Oth.leathers/skins, whole, bovines, wet state s<=2, 6m2
41041930 Oth.leathers/skins, bovines, wet state veg.pre-tanned
41041940 Other leathers/skins, bovines, including buffalos, wet
410421 Leathers/skins, bovines, vegetable pre-tanned
41042100 Leathers/skins, bovines, vegetable pre-tanned
410422 Bovine leather (otherwise pre-tanned)
41042211 Leathers/skins, whole/half, bovines, wet blue, n/split
41042212 Leathers/skins, whole/half, bovines, wet blue, grain split
41042213 Leathers/skins, whole/half, bovines, wet blue, split(than g
41042219 Other leathers/skins, bovines, "wet blue"
41042290 Oth.leathers, bovines, pre-tanned of other way
410429 Other leathers/skins, of bovines/equine, tanned or retanned
41042900 Oth.leathers/skins, of bovines/equine, tanned or retanned
410431 Other bovine leather and equine leather (full grains and grain splits)
41043111 Leat./skins, bovin.veg.pre-tann.forsoles, grain split n/fi
41043119 Ot.leat./skins, bov.pre-tan.prepar.grain split n/finis.
41043120 Leat./skins, bov.after tann.prepar.grain split n/finis.

147
41043190 Ot.leat./skins, bov./equine pre-tan.prepar.grain split
410439 Other bovine leather and equine leather (parchment-dressed)
41043911 Ot.leat./ skins, bovine after-tann.prepar.n/ finishing
41043912 Ot.leat./skins, bovine, after-tann.prepar.with finishing
41043990 Oth.leath./skins, bovine/equine, parchment-dressed
410441 Full grains leather, unsplit and grain splits leather, in the dry state crust, of hides and skins of bovine incl. buffalo or equine animals, without hair on (excl. further prepared)
41044110 Whole leath.of bovines, dry state, grain splits s<=2, 6m2
41044120 Leat.of bovines, dry state, grain sp.tanned, foruse as sole
41044130 Other leathers/skins of bovines, dry state, grain slipts
410449 Hides and skins of bovine incl. buffalo or equine animals, in the dry state crust, without hair on, whether or not split (excl. further prepared and full grains, unsplit and grain splits)
41044910 Other leathers/skins, of bovines, dry state, s<=2, 6m2
41044920 Other leathers/skins of bovines, dry state
4107 Leather further prepared after tanning or crusting, including parchment-dressed leather, of bovine (including buffalo) or equine animals, without
410711 Full grains leather incl. parchment-dressed leather, unsplit, of the whole hides and skins of bovine incl. buffalo or equine animals, further prepared after tanning or crusting, without hair on (excl. chamois leather, patent
41071110 Whole leathers of bovines, full grains, prepared s<=2, 6m2
41071120 Oth.whole leathers/skins of bovines, full grain.prepar.

148
hair on, whether or not split, other than leather of heading 4114
leather and patent laminated l
410712 Grain splits leather incl. parchment-dressed leather, of the whole hides and skins of bovine incl. buffalo or equine animals, further prepared after tanning or crusting, without hair on (excl. chamois leather, patent leather and patent laminated leather,
41071210 Whole leathers/skins of bovines, prepared s<=2, 6m2
41071220 Oth.whole leathers/skins of bovines, prepared, etc.
410719 Leather incl. parchment-dressed leather of the whole hides and skins of bovine incl. buffalo or equine animals, further prepared after tanning or crusting, without hair on (excl. unsplit full grains leather, grain splits leather, chamois leather, patent l
41071910 Whole leathers/skins of bovines, prepared s<=2, 6m2
41071920 Oth.whole leathers/skins of bovines, prepared
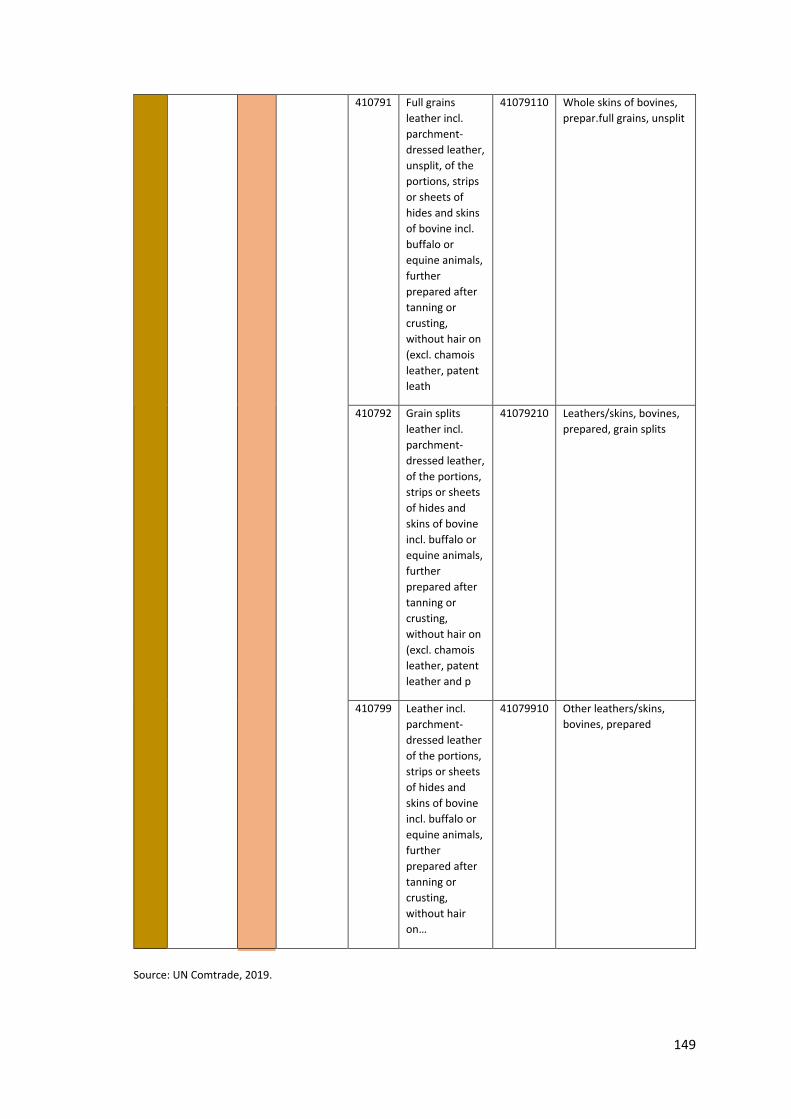
149
410791 Full grains leather incl. parchment-dressed leather, unsplit, of the portions, strips or sheets of hides and skins of bovine incl. buffalo or equine animals, further prepared after tanning or crusting, without hair on (excl. chamois leather, patent leath
41079110 Whole skins of bovines, prepar.full grains, unsplit
410792 Grain splits leather incl. parchment-dressed leather, of the portions, strips or sheets of hides and skins of bovine incl. buffalo or equine animals, further prepared after tanning or crusting, without hair on (excl. chamois leather, patent leather and p
41079210 Leathers/skins, bovines, prepared, grain splits
410799 Leather incl. parchment-dressed leather of the portions, strips or sheets of hides and skins of bovine incl. buffalo or equine animals, further prepared after tanning or crusting, without hair on…
41079910 Other leathers/skins, bovines, prepared
Source: UN Comtrade, 2019.

150

151
Annex 5. List of informants and field visits
Table 12. The list of informants and field visits in Brazil and Italy during the period of 2016-2019
Name Organization Position Type of interview
Date Location
Brazil Sao Paulo
Lisandro Inakake de Souza
IMAFLORA Expert Clima e Cadeias Agropecuárias
Face to Face
17/05/2018 Piracicaba, Sao Paulo
Isabel Garcia-Drigo
IMAFLORA Research director Face to face
17/05/2018 Piracicaba, Sao Paulo
Mauro J. Capossoli Armelin
Amigos da terra Amazonia Brasiliera
Executive Director Face to Face
18/05/2018 Sao Paulo
Kemel Kalif National Wildlife Federation
Agriculture Supply Chain Specialist
Face to face
10/05/2018 Sao Paulo
Beatriz Fonseca Domeniconi
GTPS/ Grupo de Trabalho da Pecuária Sustentável
Executive Coordinator Face to face
11/05/2018 Sao Paulo
Marcelo C C Stabile
IPAM Amazonia/ cattle producer
Researcher Face to face
08/07/2018 Sao Paulo
Daniela Teston
WWF Brazil Agriculture and Food Program
Face to face
27/07/2018 Sao Paulo
Pará
Ricardo A. Negrini
Federal Public Prosecutor’s Office, Pará
Attorney at the Federal Public Prosecutor’s Office (Procurador da República na Ministério Público Federal)
Face to face
05/06/2018
Belem, Pará
Paulo Barreto IMAZON Senior researcher Face to Face
24/05/2018
Belem, Pará
Ian S. Thompson
The Nature Conservancy
Diretor do Programa de Conservação da Amazônia da TNC
Face to Face
25/05/2018
Belem, Pará
Francisco Fonseca
The Nature Conservancy
Coordenador Produção Sustentável, Brasil
Face to face
25/05/2018
Belem, Pará

152
Vivian Dagnesi Timpiani
Embrapa Amazônia Oriental
Pesquisadora A - Melhoramento Genético Animal
Face to Face
23/05/2018
Maraba, Pará
Odilon J.C.Soares
@grolider Executive Director Face to Face
23/05/2018
Maraba, Pará
João Fernandes de Lima Neto
Consórcio TAMASA-CIMCOP
Environmental manager of the paving project of the BR 230 motorway
Face to Face
22/05/2018
Maraba, Pará
Jordan Timo Carvalho
Apoio Consultoria, Projetos e Certificações Ltda
Diretor Face to face
23/05/2018
Maraba, Pará
Maurício Fraga Filho
Associação dos Criadores do Estado do Pará (Acripará)
Presidente Face to face
22/05/2018
Maraba, Pará
Mato Grosso
Alice Thuault Instituto Centro de Vida
Deputy director Face to face
08/06/2018
Cuiaba, Mato Grosso
Luiz Alberto Esteves Scaloppe
Ministerio Publico do estado de Mato Grosso
Procurador de Justica da Defesa Ambiental e Ordem Urbanistica
Face to face
09/06/2018
Cuiaba, MT
Andressa Fereira Ribeiro
Earth Innovation Institute
Associate Policy Analyst Face to face
07/06/2018
Cuiaba, Mato Grosso
Joao Shimada Earth Innovation Institute
Senior Policy Analyst Face to face
07/06/2018
Cuiaba, Mato Grosso
Leone Furlanetto
Fazenda Sao Marcelo, Grupo JD
Gerente Geral Face to face
11/06/2018
Tangara da Serra, MT
Paulo Cesar Bittencourt de Carvalho
ARCA SIA Agropecuaria/Natur beef
Face to face
13/06/2018
Tangara da Serra, MT
Angla Jardim Duarte Vieira
Minsterio da Agricultura, Pecuaria e Abastecimento
Officer Fiscal Federal Agropecuario
Face to face
14/06/2018
Cuiaba, MT
Camila Horiye Rodrigues
Instituto Centro da Vida
Especialista cadeias socioprodutivas
Face to face
15/06/2018
Alta Floresta, MT
Vando Telles de Oliviera
PECSA Pecuaria Sustentavel da Amazonia
Executive director Face to face
16/06/18 Alta Floresta, MT
Thiago Farias PECSA Pecuaria Sustentavel da Amazonia
Environmental Supervisor Face to face
Alta Floresta, MT
Luciano Vacari
ACRIMAT Executive Director Face to face
12/06/18 Cuiaba, Mato Grosso

153
Caio Penido Dalla Vecchia
Grupo Roncador/ GTPS
Director Face to face
08/06/2018
Cuiaba, Mato Grosso
Paulo Moraes Ozaki
IMEA Gestor de Projetos Face to face
12/06/18 Cuiaba, Mato Grosso
Mato Grosso do sul
Dirceu Roveda Deboni
INDUSPAN – Industria e Comercio de Cuoros Pantanal Ltda.
Director Face to face
19/ 06/2018
Campo Grande- MS
Skype
Tharic Galuchi
IMAFLORA Certificação Agrícola skype 24/05/2018
Maraba, Pará
Paulo Moutinho
Amazon Environmental Research Institute IPAM
Senior Scientist skype 02/07/2018
Porto Alegre, Rio Grande do Sul
Fernando Bellese
JBS Marketing and Sustainability Manager
skype 07/05/2018
Cuiaba, MT
Adriana Charoux
Greenpeace Brazil Amazon campaigner skype 26/06/2018
Porto Alegre, Rio Grande do Sul
Virgílio Cançado Paculdino Ferreira
Safe Trace Industria e Comercio de Sistemas de Rastreabilidade S. A.
Director Skype 18/06/2018
Campo Grande, MS
Paulo Adalberto Reimann
JBS Divisão Couros Garantia da Qualidade
Expert Phone 30/05/2018
Belem, Pará
Mathias Almeida
NATCAP CEO Skype 16/06/2018
Campo Grande, MS
ItalyStephen Donofrio
Philip Rothrock
Supply Change, Forest Trends
Senior advisor Advisor
Skype 5/12/2017 Agripolis, Legnaro, Italy
Caroline Reid IKEA Sweden/International
Sustainability, Project Leader, Skype 21/04/2017
Agripolis, Legnaro, Italy

154
Christian Olivieri
Olivieri Pellami CEO Face to face
5/09/2017 Olivieri Pellami, Arzignano, Italy
Pablo Pacheco
The Center for International Forestry Research (CIFOR)
Principal Scientist Skype 17/01/2018
Agripolis, Legnaro, Italy
Camille Rojot
Origem Sustainable Sourcing
Expert Skype 7/05/2018 Agripolis, Legnaro, Italy
José Fernando Bello
Centre for the Brazilian Tanning Industry (CICB)
President Face to face
21/02/2019
Lineapelle, Milan, Italy
Diverse stakeholders
UNIC (Italian Tanners' Association) offices
--- Face to face
Multiple visits in 2016, 2017 and 2019
Milan, Italy
Diverse stakeholders and exhibitors
Lineapelle exhibiton --- Face to face
Multiple attendance in 2017 and 2019
Rho Fiera, Milan, Italy
Paolo Burlando
Kymera group Expert Face to face
13/02/2019
Agripolis, Legnaro, Italy
Paolo Gurisatti
Distretto Conciario Vicentino / Distretto della Pelle
Former CEO Face to face
11/03/2019
Agripolis, Legnaro, Italy
Field visits and observations Besides meeting with informants, trip to Brazil resulted in a number of field visits and observation venues. Example are provided below:
• Maraba, Pará – ride over the farm area, participation in the Cattle fair; • Alta Floresta, MT – PECSA farm; • Tangara, MT- Sao Marcelo farm; • Cuiaba, MS- Induspan Cuoros tannery visit; • Belem, Pará - Mafripar/Mercurio Alimentos meat packing plant; • Tumbira, Manaus, Amazonas- Community forest management practices.

155
Annex 6. Definitions
Deforestation: deforestation is the conversion of forest to other land use independently whether human-induced or not (FAO, 2018; EC, 2019).
Forest: generally referred as an area of land of minimum 0.5 hectares with a tree cover density of 10–30%, where trees have potential to reach a minimum height of 2–5 meters at maturity in place (FAO, 2001; UNFCC, 2002).
Forest degradation: forest degradation is a reduction in the capacity of a forest to deliver products and services, which means a forest that has lost, through human activities, the structure, function, species composition or productivity normally associated with a natural forest type expected on that site. Hence, a degraded forest delivers a reduced supply of goods and services from the given site and maintains only limited biological diversity. Biological diversity of degraded forests includes many non-tree components, which may dominate in the under-canopy vegetation (EC, 2019; IPBES, 2019).
Forest-risk commodities: agricultural products whose production processes drive significant deforestation, such as palm oil, pulp, cattle, soybean, cocoa, and coffee (Rautner et al., 2013).
Life Cycle Approach (analysis) (LCA): Life Cycle Approach refers to taking into consideration the spectrum of resource flows and environmental interventions associated with a product, service, or organization from a supply chain perspective, including all phases from raw material acquisition through processing, distribution, use, and end-of-life processes. The Life Cycle Approach contributes to improved environmental management of business activities, including planning, procurement, design, marketing & sales (De Rosa-Giglio et al., 2018).
Product Category Rules (PCR): set of specific rules, requirements and guidelines for developing Type III environmental declarations for one or more product categories (ISO 14025:2006) (De Rosa-Giglio et al., 2018).
Product Environmental Footprint Category Rules (PEFCRs): Product category-specific, life-cycle-based rules that complement general methodological guidance for PEF studies by providing further specification at the level of a specific product category. PEFCRs help to shift the focus of the PEF study towards those aspects and parameters that matter the most, and hence contribute to increased relevance, reproducibility and consistency of the results by reducing costs versus a study based on the comprehensive requirements of the PEF guide (De Rosa-Giglio et al., 2018).
Type III environmental declaration: an environmental declaration providing quantified environmental data using predetermined parameters and, where relevant, additional environmental information (ISO 14025:2006). The predetermined parameters are based on the ISO 14040 series of standards, which is made up of ISO 14040 and ISO 14044 (De Rosa-Giglio et al., 2018).
Zero-deforestation commitment: a type of voluntary sustainability pledge or initiative adopted by a company to signal its intention to reduce or eliminate deforestation associated with commodities that it produces, processes, or trades (FAO, 2018).