We examine the role of tax incentives, tax awareness, and ... examine the role of tax incentives,...
43
econstor www.econstor.eu Der Open-Access-Publikationsserver der ZBW – Leibniz-Informationszentrum Wirtschaft The Open Access Publication Server of the ZBW – Leibniz Information Centre for Economics Standard-Nutzungsbedingungen: Die Dokumente auf EconStor dürfen zu eigenen wissenschaftlichen Zwecken und zum Privatgebrauch gespeichert und kopiert werden. Sie dürfen die Dokumente nicht für öffentliche oder kommerzielle Zwecke vervielfältigen, öffentlich ausstellen, öffentlich zugänglich machen, vertreiben oder anderweitig nutzen. Sofern die Verfasser die Dokumente unter Open-Content-Lizenzen (insbesondere CC-Lizenzen) zur Verfügung gestellt haben sollten, gelten abweichend von diesen Nutzungsbedingungen die in der dort genannten Lizenz gewährten Nutzungsrechte. Terms of use: Documents in EconStor may be saved and copied for your personal and scholarly purposes. You are not to copy documents for public or commercial purposes, to exhibit the documents publicly, to make them publicly available on the internet, or to distribute or otherwise use the documents in public. If the documents have been made available under an Open Content Licence (especially Creative Commons Licences), you may exercise further usage rights as specified in the indicated licence. zbw Leibniz-Informationszentrum Wirtschaft Leibniz Information Centre for Economics Alstadsæter, Annette; Jacob, Martin Working Paper The Effect of Awareness and Incentives on Tax Evasion CESifo Working Paper, No. 4369 Provided in Cooperation with: Ifo Institute – Leibniz Institute for Economic Research at the University of Munich Suggested Citation: Alstadsæter, Annette; Jacob, Martin (2013) : The Effect of Awareness and Incentives on Tax Evasion, CESifo Working Paper, No. 4369 This Version is available at: http://hdl.handle.net/10419/80497
Transcript of We examine the role of tax incentives, tax awareness, and ... examine the role of tax incentives,...
econstor www.econstor.eu
Der Open-Access-Publikationsserver der ZBW – Leibniz-Informationszentrum WirtschaftThe Open Access Publication Server of the ZBW – Leibniz Information Centre for Economics
Standard-Nutzungsbedingungen:
Die Dokumente auf EconStor dürfen zu eigenen wissenschaftlichenZwecken und zum Privatgebrauch gespeichert und kopiert werden.
Sie dürfen die Dokumente nicht für öffentliche oder kommerzielleZwecke vervielfältigen, öffentlich ausstellen, öffentlich zugänglichmachen, vertreiben oder anderweitig nutzen.
Sofern die Verfasser die Dokumente unter Open-Content-Lizenzen(insbesondere CC-Lizenzen) zur Verfügung gestellt haben sollten,gelten abweichend von diesen Nutzungsbedingungen die in der dortgenannten Lizenz gewährten Nutzungsrechte.
Terms of use:
Documents in EconStor may be saved and copied for yourpersonal and scholarly purposes.
You are not to copy documents for public or commercialpurposes, to exhibit the documents publicly, to make thempublicly available on the internet, or to distribute or otherwiseuse the documents in public.
If the documents have been made available under an OpenContent Licence (especially Creative Commons Licences), youmay exercise further usage rights as specified in the indicatedlicence.
zbw Leibniz-Informationszentrum WirtschaftLeibniz Information Centre for Economics
Alstadsæter, Annette; Jacob, Martin
Working Paper
The Effect of Awareness and Incentives on TaxEvasion
CESifo Working Paper, No. 4369
Provided in Cooperation with:Ifo Institute – Leibniz Institute for Economic Research at the University ofMunich
Suggested Citation: Alstadsæter, Annette; Jacob, Martin (2013) : The Effect of Awareness andIncentives on Tax Evasion, CESifo Working Paper, No. 4369
This Version is available at:http://hdl.handle.net/10419/80497
The Effect of Awareness and Incentives on Tax Evasion
Annette Alstadsæter Martin Jacob
CESIFO WORKING PAPER NO. 4369 CATEGORY 1: PUBLIC FINANCE
AUGUST 2013
Presented at CESifo Area Conference on Public Sector Economics, April 2013
An electronic version of the paper may be downloaded • from the SSRN website: www.SSRN.com • from the RePEc website: www.RePEc.org
• from the CESifo website: Twww.CESifo-group.org/wp T
CESifo Working Paper No. 4369
The Effect of Awareness and Incentives on Tax Evasion
Abstract We examine the role of tax incentives, tax awareness, and complexity in tax evasion. We observe a specific type of tax evasion among business owners in Swedish administrative panel data, after the tax authority has approved all tax returns. For the period 2006–2009, approximately 5% of tax returns overstate a claimed dividend allowance. Tax awareness decreases and complexity increases the likelihood of misreporting. Our results indicate that some observed misreporting could be accidental, while some misreporting is deliberate tax evasion. We identify a positive and significant effect of tax rates on tax evasion, by exploiting a large kink in the tax schedule. The majority of misreporting cases remains undetected by the tax authority. Self-correction of tax evasion by taxpayers is the dominant type of detection.
JEL-Code: H260, H240, D140.
Keywords: tax evasion, tax compliance, tax enforcement, tax awareness, detection.
Annette Alstadsæter University of Oslo
Institute of Health Management and Health Economics
P.O. Box 1089 Blindern Norway – 0317 Oslo
Martin Jacob* WHU – Otto Beisheim School of
Management Burgplatz 2
Germany – 56179 Vallendar [email protected]
*corresponding author August 14, 2013 We thank Jan-Erik Bäckman, Kay Blaufus, Michael Devereux, Sebastian Eichfelder, Tim Goodspeed, Igor Goncharov, Christina Günther, Ingemar Hansson, Jochen Hundsdoerfer, Claus Thustrup Kreiner, Kaisa Kotakorpi, Christian Leuz, Henry Ohlsson, Michael Overesch, Agnar Sandmo, Thorsten Sellhorn, Joel Slemrod, Altin Vejsiu, and seminar participants at the University of Copenhagen, University of Frankfurt am Main, WHU - Otto Beisheim School of Management, Oxford Centre for Business Taxation 2013 Annual Symposium, 2013 CESifo Area Conference on Public Sector Economics in Munich, the 2013 Nordic Workshop on Tax Evasion in Stockholm, 9th arqus-meeting in Bochum, and the Swedish tax authority Skatteverket for helpful comments and suggestions. Alstadsæter gratefully acknowledges financial support from the Research Council of Norway, grant 217139/H20.
1 Introduction
Taxpayers try to minimize tax liability through legal or illegal means. At the same time, tax
authorities attempt to improve compliance, detect tax evasion, enforce tax rules, and close un-
intended loopholes for legal tax avoidance.1 A growing literature emphasizes tax awareness as
an explanation as to why some taxpayers engage in legal tax avoidance activities while others
do not. Taxpayer awareness of tax rules depends on the salience of taxes (Chetty, Looney, and
Kroft, 2009; Finkelstein, 2009). Slowness in adaption to changing income levels or procrastination
may also explain why not all individuals respond to tax incentives (Jones, 2012; Kopczuk, 2012).
Further, the ability to process available tax information varies across individuals and depends
on the flow of information through informal networks (Alstadsæter, Kopczuk, and Telle, 2012;
Chetty, Friedman, and Saez, 2013; Alstadsæter and Jacob, 2013). These arguments also explain
why we observe less illegal tax evasion than we would expect from standard economic models.
Kleven, Knudsen, Kreiner, Pedersen, and Saez (2011) show that not everyone with access to tax
evasion opportunities actually chooses to participate in such activity. Non-pecuniary factors such
as moral disposition, norms, social conscience, and attitudes towards government all play a role in
explaining non-participation in tax evasion (Andreoni, Erard, and Feinstein, 1998; Slemrod, 2003;
Sandmo, 2005, 2012).
While most of these arguments relate to the conscious decision to evade taxes, some taxpayers
may accidently file erroneous tax returns. Complexity of the tax system can increase unintentional
as well as intentional non-compliance (Kopczuk, 2006; Slemrod, 2007). The design of the tax
return form can induce non-compliance if taxpayers have difficulty understanding the information
provided and asked for in the form. At the same time, taxpayers may deliberately take advantage of
complex rules and tax forms if they perceive a low probability of detection. Therefore, organization
of the tax administration and strength of tax enforcement additionally affect non-compliance by
taxpayers. For example, if control routines of tax authorities are not adjusted following a tax
reform that changes incentives, neither accidental nor intended tax evasion may be detected. This
study examines the effects of complexity, tax awareness, and tax incentives on tax evasion.
The general challenge of any empirical study on tax evasion is the lack of appropriate data and
an unobservable dependent variable. When using administrative data, the extent of tax evasion is
unknown, since tax evasion is defined as the difference between true and (under-)reported income.
In contrast to other studies (e.g., Clotfelter, 1983; Feinstein, 1991; Kleven, Knudsen, Kreiner,
Pedersen, and Saez, 2011), we have a unique setting to empirically study tax evasion and non-
compliance. We directly observe systematic errors in tax returns of business owners after the
tax authority has approved the tax returns. By merging information across taxpayers and across
1In practice there is a blurry line between legal tax avoidance and illegal tax evasion, due to unclear regulations,lack of enforcement, and tax agencies’ focus on particular types of transactions (Slemrod and Yitzhaki, 2002).
1
corporate and individual tax returns, we are able to uncover a specific type of tax evasion in
administrative data.
We use a large Swedish micro-panel data set for the years 2006–2009 with information on
income, tax rates, and other socioeconomic variables for individuals. This panel covers the popu-
lation of all tax returns of all active Swedish closely held corporation (CHC) owners, including the
corresponding corporate tax returns.2 The advantage of our tax evasion measure is that the extent
of evasion is observable. We define tax evasion as the difference between a claimed allowance,
which is observed in the data, and the legal maximum allowance, which is defined in the tax code.
More specifically, we are interested in the dividend allowance, which determines the amount of
dividends from a CHC that active owners may receive at a preferential tax rate. This dividend
allowance is defined as a fixed lump-sum per firm in a fiscal year.3 The allowance is allocated
across owners according to their share in equity. As the dividend allowance is claimed by each
shareholder individually, shareholders in a CHC with more than one owner can claim outright a
dividend allowance above their actual share. By overstating this dividend allowance, taxpayers
attempt to illegally reclassify labor income as dividend income to reduce the total tax burden.
Over our sample period, approximately 5% of active owners overstate their dividend allowance
and, consequently, evade taxes. However, since 60% of individuals overstating the dividend al-
lowance do not generate tax benefits from such overstatement (based on current tax status), some
of the tax evasion observed on the tax return data appears to be accidental. That is, some observed
misreporting is due to accidental mistakes and some is due to intended tax evasion. Both cases
are treated as tax evasion under Swedish tax law. Both accidental and intentional tax evasion
lead to penalties if detected and if the evasion generates a tax benefit in the current tax year. In
contrast, if there is no dividend payout in the year of overstatement and detection, the authority
does not impose a penalty.4 The tax authority treats this case as evasion but simply corrects the
“mistake.” The taxpayer’s advantage from the latter treatment of tax evasion is that an overstated
and undetected dividend allowance in a year without a dividend payout can be carried forward
with interest. This is a valuable option on future tax savings, as dividends of private, and in par-
ticular of closely held firms, are very flexible and are paid out irregularly (Jacob and Alstadsæter,
2013). The Swedish tax administration did not systematically control for this type of tax evasion
in the past. The tax authority does not merge information across shareholders to test if owners
jointly claim a dividend allowance above the legal maximum per firm.
2CHCs form the one of the most important organizational forms in Sweden. About 60% of all Swedish corpora-tions are treated as CHCs.
3This allowance is used by 80% of CHC owners. Owners can choose an alternative calculation method, wherethe dividend allowance depends on equity and wages paid by the corporation.
4In other jurisdictions, accidental and unintended tax evasion, i.e., negligence, usually yields lower penalties thanintentional tax evasion, i.e., tax fraud. For example, the Internal Revenue Service (IRS) imposes fines of up to 20%on accidental tax evasion while tax fraud can lead to a fine of up to 75%.
2
We are interested in three questions. First, who overstates the dividend allowance and what
characteristics increase the likelihood of evading taxes? Second, is overstating the dividend al-
lowance driven by the tax benefit from re-classifying labor income as dividend income? Third,
what drives the dynamics of detecting the overstated dividend allowance?
We first develop a simple model of overstating the dividend allowance with endogenous prob-
ability of detection and a risk-neutral taxpayer based on the tax evasion model of Allingham and
Sandmo (1972) and Kleven, Knudsen, Kreiner, Pedersen, and Saez (2011). Our model shows
that if the tax rate on dividends is below the tax rate on labor income, overstating the dividend
allowance can increase net-of-tax income. Overstating the dividend allowance for each owner is
limited to the maximum per firm, as the probability of detection becomes 1 above the maximum.
Our model predicts that if an individual expects the dividend tax rate to be below the tax rate
on labor income, he overstates the dividend allowance up to the legal maximum. In contrast, if
the tax rate on dividends is expected to be above the tax rate on labor income, overstating the
dividend allowance and paying out dividends reduces net-of-tax income and would be irrational.
We empirically test the effect of firm-level and individual-level characteristics on the probability
of evading taxes. Our results suggest that the likelihood that a taxpayer overstates the dividend
allowance is affected by tax complexity and tax awareness. For example, the likelihood of over-
stating the dividend allowance increases with the number of owners per firm, with the number of
firms an individual owns, and whether owners live in different municipalities. In contrast, paying
out dividends reduces the likelihood of overstating the dividend allowance, as it raises awareness
of the level of the dividend allowance, increasing the probability of detection. Variables related
to awareness and financial literacy, such as higher education, being born in Sweden, and income,
reduce the probability of evading taxes. We also control for the purpose of the firm. Alstadsæter
and Jacob (2013) show that some CHC types, such as holding, shell, and low-turnover corpora-
tions, are used for legal tax avoidance. We find that the probability of overstating the dividend
allowance is lower if the firm is used for legal tax sheltering. This finding indicates that illegal tax
evasion and legal tax avoidance are not used as complementary methods of tax minimization.
Second, we use an alternative identification strategy to test the effect of tax rates on tax
evasion. The Swedish tax rate schedule, with its large kink, offers a suitable setting for identifying
the predicted effect of tax rates on tax evasion in our model. If an individual is subject to an
additional surtax of 20% on labor income, the dividend tax rate is below the income tax rate on
labor income. This tax wedge creates an incentive to overstate the dividend allowance. If the
individual is not subject to the state tax, the individual has no tax incentive to reclassify labor
income as dividend income and to overstate the dividend allowance. That is, around the cutoff
point of the state tax, the incentive to evade taxes changes. To identify the tax rate effect, we
use local linear regressions with very narrow ranges of SEK 1,000 and SEK 500 (about USD 136
and USD 68) around this kink. As observable characteristics are smooth around the kink, the
3
identification stems only from differences in the tax rate. We find that crossing state tax threshold
increases the likelihood of overstating the dividend allowance by 2.0 percentage points, or about
40% of the unconditional sample mean. We characterize this as intentional tax evasion, since the
decision to evade taxes is driven by the tax advantage. We find that this tax rate effect, i.e.,
deliberate tax evasion, is stronger for less complex tax returns. In contrast, individuals with more
complex tax returns do not respond to the tax incentive. Taken together, our findings suggest that
complexity and lack of awareness can result in accidental tax evasion, while tax benefits explain
intentional tax evasion behavior.
Finally, we analyze the dynamics of detection. We distinguish two cases in the data. First, the
taxpayer changes behavior and complies with the tax rules after having overstated the dividend
allowance for some years. Second, the tax authority detects evasion and automatically corrects
prior-year outrightly claimed dividend allowances. Surprisingly, about 70% of the mistakes are
corrected by the taxpayer. Only 30% are corrected by the tax administration. This observation
relates to the importance of changing enforcement and control strategies following implementation
of new tax rules. We use a competing risks proportional hazards model to analyze the dynamics of
detecting the overstated dividend allowance, either by the taxpayer or by the tax authority. Our
results suggest that complexity in compliance increases time until detection. If a firm has many
owners, it requires more effort to coordinate both the preparation of tax returns and their audit.
However, our results indicate that only a few factors explain self-correction and external detection
of overstated dividend allowances.
Our results relate to the literature on tax enforcement strategies and the quality of tax com-
pliance in general (e.g., Sanchez and Sobel, 1993; Chander and Wilde, 1998; Boadway and Sato,
2009; Alm, Jackson, and McKee, 2009; Bigio and Zilberman, 2011). Our findings have four main
implications. First, economic models of tax evasion and avoidance should acknowledge that tax
administration, enforcement strategies, and the design of the tax return form can affect partici-
pation in non-compliance and the level of tax evasion. Second, when designing tax reforms that
change incentives for taxpayers, policy makers should also adjust enforcement and audit strategies.
Third, to implement effective control and compliance strategies, tax authorities need to merge in-
formation across taxpayers and use automated, computer-based plausibility checks. Fourth, some
of the observed tax evasion observed in this paper appears to be accidental. Complex tax rules
and tax forms can trigger unintended tax evasion if mistakes stem from lack of tax awareness and
slowness to adapt to new rules.
Our results also point toward more general challenges in complying with rules, norms, and
forms. Business owners and corporations need to comply with employee health insurance require-
ments, environmental standards, and tariff regulations. All these non-tax regulations change over
time and are vulnerable to accidental as well as intentional non-compliance.
4
2 Institutional Background
2.1 The Swedish tax system and tax treatment of CHCs
Sweden has a dual income tax, with a progressive tax on labor income and a proportional tax on
capital income. Progressivity in the tax on labor income is achieved through a municipality tax (on
average 31.5%) and two levels of state taxes of 20% and 5%, which apply at different thresholds.
In addition, social security contributions apply to all wage payments and are remitted by the
employer. These contributions generate substantial benefits, such as health care, unemployment
payments, and future pensions. Above a certain threshold, social security contributions stop
generating benefits (see Column 4, Table 1). We thus consider these contributions as insurance
and benefit contributions, rather than as a tax below this threshold; we consider them as a tax
above the cutoff. Table 1 provides an overview of marginal tax rates and thresholds for the two
levels of state taxes and social security contributions for our sample period, 2006–2009.
[Insert Table 1 about here]
Table 1 also shows the combined dividend tax rate (τd), which consists of the corporate income
tax of 28% (26.3% in 2009) and the dividend tax rate for CHCs at the individual level of 20%.
The difference between the marginal tax rates on labor and capital income creates incentives for
individuals subject to the state tax to reclassify wage income as dividend income. Alstadsæter
and Jacob (2013) show that informed, highly taxed individuals establish CHCs with low turnover
to legally benefit from the tax rate difference between τd and τi. If earned income is below the
threshold for the first-level state tax (Column 2, Table 1), τi is below τd. That is, labor income is
taxed at lower rates than dividend income. As soon as earned income is subject to the first level
of the state tax, the combined tax rate on dividends is below the labor income tax rate (τi > τd),
and individuals then have an incentive to reclassify labor income as dividend income.
To reduce this type of income shifting by firm owners, the Swedish government implemented
the so-called 3:12 rules for active owners5 of CHCs.6 The purpose of these rules is to prevent
income shifting from the labor income tax base to the capital income tax base by owner-managers.
According to the 3:12 rules, dividends within an imputed dividend allowance are treated as divi-
dends for tax purposes. Dividends in excess of the dividend allowance are taxed as labor income.
The dividend allowance is a function of equity and wage costs of the corporation (general rule).7
5According to Swedish tax law, a shareholder is deemed active if the shareholder contributes to profit generationin the firm to a considerable extent.
6The tax law defines a corporation as closely held if four or fewer shareholders own at least 50% of the shares.Multiple family members count as a single shareholder. Therefore, few firms have more than four owners. If thesecriteria are not met, the corporation is considered to be widely held. There are no differences in corporate taxationbetween widely and CHCs. Dividends from unlisted widely held corporations have been taxed at 25% since 2006.
7The general rule defines the dividend allowance as a fixed interest on nominal equity (around 11%) and a fixedpercentage of wages (25% or 50%) paid by the corporation to its employees. A more detailed description of the3:12 rules and Swedish tax rates is found in Alstadsæter and Jacob (2012).
5
The allowance is calculated by each shareholder for each firm. In case of multiple owners, the
dividend allowance is allocated across active shareholders according to the ownership share in the
corporation. Any unused dividend allowances are carried forward with interest at the shareholder
level, to be utilized on future dividends from the same corporation. In 2006, the 3:12 rules were
reformulated to foster entrepreneurship and growth of CHCs. The reform included a reduction in
the dividend tax rate from 30% to 20%, an increase in the dividend allowance from the general rule,
and an introduction of an optional, fixed dividend allowance per corporation (the Simplification
Rule—Forenklingsregeln).
2.2 Identifying misreporting
Each active shareholder in a CHC must file a K10-form. The K10-form is a four page document
with which each shareholder calculates the dividend allowance for their particular corporation.8
The K10-form is often filled out by the owner-manager.9 The active owner chooses the calculation
method for imputing the dividend allowance under the 3:12 rules. That is, the active owner chooses
either the general rule or the simplification rule. We focus on the simplification rule and on tax
evasion through overstating this lump-sum allowance. One reason behind implementation of this
rule was to simplify compliance. The dividend allowance, according to the simplification rule, is
independent of activity, equity, and employment in the firm. Approximately 80% of active owners
under the 3:12 rules choose the simplification rule to calculate dividend allowance. These taxpayers
fill out only the first page of the form.10
Each active shareholder is entitled to a share of the fixed dividend allowance in accordance
with that shareholder’s ownership share in the CHC. Around the introduction of the new tax form
in 2006, which includes the new simplification rule, there was an ongoing process of reducing the
number of entries in tax forms and of simplifying compliance. As a result, the shareholder is not
asked to report actual ownership share on the K10-form. Instead, the shareholder declares only
the resulting dividend allowance, X, according to the following simple calculation (2006 value, 1
USD ≈ 7 SEK).
(SEK64, 950)× (Number of own shares)
(Number of total shares in the corporation)= X.
8The K10-form is available at the homepage of the Swedish tax authority (in Swedish for 2009, retrieved August,2013.): http://www.skatteverket.se/download/18.6d02084411db6e252fe80001510/211020.pdf.
9We are, unfortunately, not able to observe whether a tax consultant assisted in the preparation of a tax return.Owners of very large CHCs are likely to have tax consultants. In our empirical model, we include firm size tocontrol for this effect.
10In case a taxpayer fills out both methods, the tax authority chooses the method that results in the higherdividend allowance. We follow this approach when identifying whether a taxpayer uses the simplification rule.
6
Figure 1 shows the corresponding excerpt from the K10-form of the simplification rule for fiscal
year 2006. This is the first line in the K10-form. The taxpayer fills in field 410 (X) without
explicitly stating ownership share.
[Insert Figure 1 about here]
While this appears fairly straightforward, it does require some minimum level of mathematical
and cognitive ability. There are several potential sources of error in the case of multiple active firm
owners. Let us consider an active shareholder who owns 50% of CHC equity. Instead of the share-
holder’s actual 50% share of the dividend allowance (SEK 32,475 in year 2006), the shareholder
could fill in the maximum annual fixed dividend allowance (SEK 64,950 in year 2006). Since there
is no shareholder register for CHCs or third-party reporting of ownership structure of privately
held corporations in Sweden, the tax authority is not able to cross-check implied ownership share
with an external source. Further, the tax authority apparently does not systematically merge
information across shareholders to check whether shareholders in a CHC jointly claim more than
the legal maximum per firm. As a result, taxpayers are able to overstate the dividend allowance.
Overstating the dividend allowance is regarded as tax evasion by Swedish tax law, but the
consequences depend on the tax benefits. If the overstated dividend allowance leads to a tax
reduction in the current year, and if the overstated dividend allowance is detected (e.g., through our
detection strategy), the Swedish tax authority imposes a penalty. However, if there is no dividend
payout in the year of overstatement and detection, the authority does not impose a penalty. The
tax authority simply corrects the “mistake.” The taxpayer’s advantage from the latter approach
toward tax evasion is that the overstated dividend allowance can be carried forward with interest
and can be utilized when dividends are paid out in later years. This option is valuable, since
dividends of private, in particular CHCs, are very flexible and are paid out irregularly (Jacob and
Alstadsæter, 2013). The possibility of accumulating and forwarding unused dividend allowances
represents an option to generate future tax savings, even if they generate no tax saving in the
present period. By overstating the dividend allowance in the present period, the taxpayer reduces
the present or future tax burden, depending on when (and whether) dividends are distributed to
the active owner. This type of tax evasion can therefore more or less be carried out without risk
of penalty.
We illustrate the effect of overstating dividend allowance in Table 2. We consider an individual
with an ownership share of 50%. Columns (2) through (4) show the tax evasion case for overstating
the dividend allowance. Columns (5) through (8) show the correct reporting. In case of evasion, the
taxpayer effectively doubles the dividend allowance. The potential tax benefits are substantial.
Consider a taxpayer who is in the top marginal tax bracket and subject to an income tax of
56.6%. If such taxpayer receives a dividend (after corporate taxes) of SEK 396,717, the dividend
tax burden equals SEK 79,343 (=396,717×20%). In the case of correct reporting, only half the
7
dividend payment is treated as dividends. The remaining portion of the dividend is taxed as labor
income but is not subject to social security contributions. This leads to a total tax burden of SEK
151,942 (=198,358×20% + 198,358×56.6%). Overstating the dividend allowance can thus have a
substantial impact on the tax burden of individuals.
[Insert Table 2 here]
2.3 Detection and correction of overstated dividend allowance
The Swedish tax administration is organized under eight income tax regions with numerous tax
offices in each. Each tax office covers on average 3 to 4 of the 290 Swedish municipalities. Tax
audit decisions are centralized at the national level. The selected tax returns are then distributed
to the relevant local tax offices, where the audits are carried out. Over our sample period, there is
no automatic control routine at the national level prior to audit assignments to check whether the
jointly claimed dividend allowance of all shareholders per firm exceeds the maximum allowance.
This may explain why not all over-reported dividend allowances are detected.
We observe two ways of detecting and correcting the overstated dividend allowance in the data.
If a shareholder who overstates the prior year’s dividend allowance (year t-1 ) reports the allowance
correctly in year t with no changes to the accumulated dividend allowance, we label this as Self-
Correction. That is, the shareholder changes behavior but retains the outrightly claimed dividend
allowance from prior years. Columns (2) through (4), Table 3 show an example where overstating
the dividend allowance is self-detected in 2008. In 2008, the correct amount of SEK 45,900 (=50%
×91,800) is declared. The overstated dividend allowances (in total SEK 158,198 in 2007) of the
preceding years are not corrected. The taxpayer corrects the reporting on the taxpayer’s own
initiative without consulting the tax administration.
In Columns (5) through (7), Table 3, we show cases that we label External Correction. In these
cases, the active owner who previously over-reported the dividend allowance also begins reporting it
correctly in year t. However, the accumulated dividend allowance from the previous year decreases
by the prior year overstated dividend allowance.11 If an auditor from the Swedish tax authority
detects the overstated dividend allowance or is actively involved in the correction process, for
example, in cases of amended tax returns, the auditor ultimately corrects the overstated dividend
allowance of the current and preceding year. This is how we distinguish between self-correction and
external correction. However, adjustment of previously overstated dividend allowances does not go
back two or more years in the data. In our case, the difference in accumulated dividend allowances
between self-correction and external detection amounts to SEK 47,686 (= 169,525−121,839).
[Insert Table 3 here]
11When identifying overstatement of the dividend allowance, self-correction, and external correction, we take intoaccount any dividend payments that reduce the dividend allowance.
8
Note that we may underestimate tax evasion in the data. We have information only on active
owners of CHCs. As long as active owners claim a total dividend allowance that is not above the
legal maximum, we define this as correct reporting. However, if there is a (are) passive owner(s) in
this corporation, active owners should claim less than the maximum allowed dividend allowance.
We are not able to identify this in the data, as there is no shareholder register and no third-party
reporting of ownership structure of privately held corporations in Sweden.
3 A simple model for overstating dividend allowance
We formalize our predictions about the tax rate effect on tax evasion in a simple model. This
model is based on the Allingham and Sandmo (1972) model. We assume risk-neutral taxpayers
who maximize expected income in the presence of an endogenous detection probability (Kleven,
Knudsen, Kreiner, Pedersen, and Saez, 2011).12 In contrast to the standard approach in modeling
tax evasion by under-reporting true income, our measure of tax evasion refers to overstating the
dividend allowance. This allowance defines the portion of dividend income that is to be taxed at a
proportional dividend tax rate rather than a progressive tax rate on wage income. If dividends are
taxed at a lower rate than wage income, taxes are illegally minimized. However, it could well be
that individuals face an increase in tax burden if they accidently overstate the dividend allowance
in cases where the marginal labor income tax rate is below the dividend tax rate. Kleven, Knudsen,
Kreiner, Pedersen, and Saez (2011), for example, find that some taxpayers overstate true income
on their tax returns.
In our model, we first consider a taxpayer with true income y that is equal to his taxable
reported income y. We adjust the model to facilitate the dual income tax. A part α of the income
is subject to the income tax rate τi. The remaining portion (1− α) is subject to the dividend tax
rate τd. We define the effective overall tax rate on y as τe = α · τi + (1− α) · τd. The taxpayer can
overstate the dividend allowance by e. Overstating the dividend allowance by e does not affect
total income y, but leads to a change in the tax burden of e · (τd − τi) = e ·∆τ . Depending on the
relation between dividend taxes and income taxes, overstating the dividend allowance can reduce
or increase the overall tax burden.
With probability p, the tax authority detects the overstated dividend allowance. We assume
that, in case of detection, the dividend allowance is fully adjusted. We assume that the probability
of detection is increasing in the overstated dividend allowance. For example, as the individual
benefits of overstating the dividend allowance increase with the number of owners, the likelihood
of being detected increases when more owners participate in tax evasion. If the tax authority
exposes the tax evasion of one owner, it checks the tax returns of the other owners as well. Since
12See Sandmo (2005, 2012) for thorough literature overviews on tax evasion as a portfolio choice, following theseminal Allingham and Sandmo (1972).
9
the dividend allowance is capped at the firm level (see Column 1, Table 2), any overstatement
of the dividend allowance above this cap, denoted as e, in one tax return is ultimately detected.
Hence, p(e) is a non-monotonic function that we define as p = p(e) with p′(e) ≥ 0 and p′′(e) ≥ 0 if
0 ≤ e ≤ e and p(e) = 1 if e > e. Put differently, so long as the claimed dividend allowance in one
tax return does not exceed the legal maximum, the probability of detection is below 1. If, however,
the claimed dividend allowance in one K10-form exceeds the annual limit per firm, the probability
of detection is 1. Empirically, we observe no case where a taxpayer successfully claimed more than
e. Therefore, the ability to evade taxes depends on the number of owners of a firm. Not everyone
who may be willing to cheat has the ability to do so (see also Kleven, Knudsen, Kreiner, Pedersen,
and Saez, 2011). Only owners of firms with multiple owners have access to this type of tax evasion
and are able to overstate their share of the dividend allowance to the maximum per firm.
If an overstated dividend allowance is detected, the Swedish tax authority corrects the calcu-
lated dividend allowance but does not necessarily impose a penalty.13 In case no dividends are
paid out, there is no penalty. Therefore, we simplify our model and assume that individuals do
not pay out dividends in the year of overstatement. In this case, ∆τ represents the present value
of the expected change in the deferred dividend tax burden. While this reduces the present value
of evasion, it does not alter the sign of ∆τ , which depends on expected tax rates. The risk-neutral
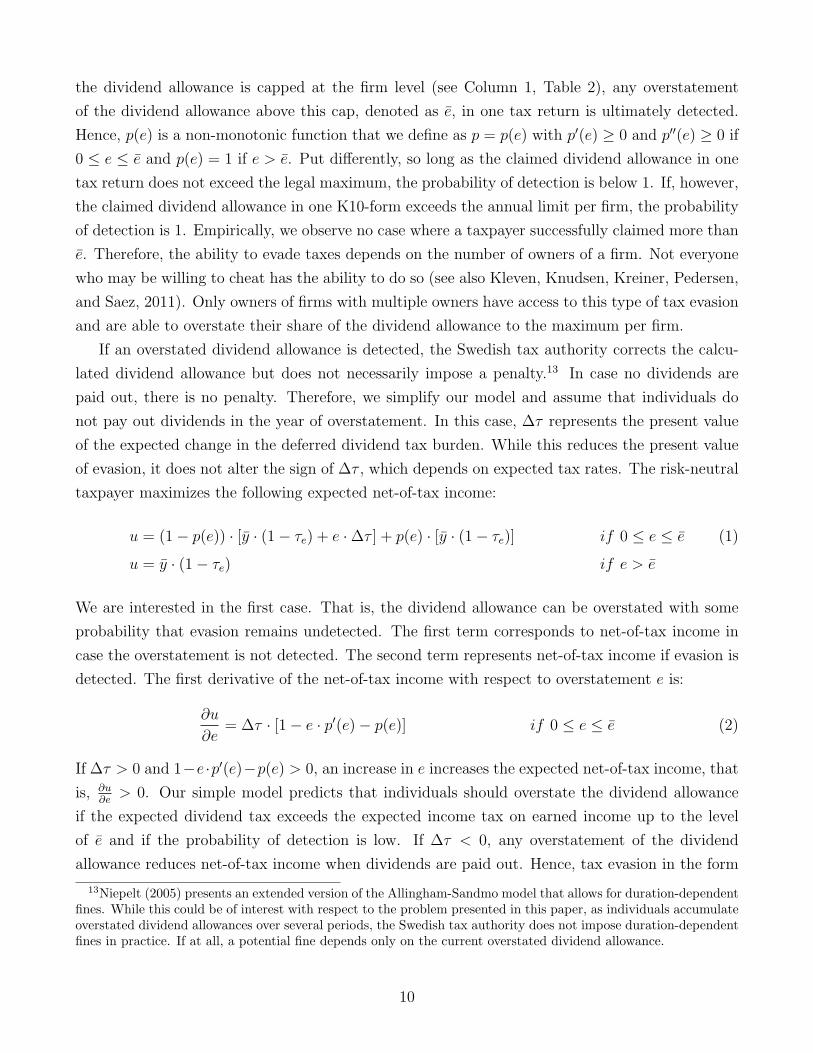
taxpayer maximizes the following expected net-of-tax income:
u = (1− p(e)) · [y · (1− τe) + e ·∆τ ] + p(e) · [y · (1− τe)] if 0 ≤ e ≤ e (1)
u = y · (1− τe) if e > e
We are interested in the first case. That is, the dividend allowance can be overstated with some
probability that evasion remains undetected. The first term corresponds to net-of-tax income in
case the overstatement is not detected. The second term represents net-of-tax income if evasion is
detected. The first derivative of the net-of-tax income with respect to overstatement e is:
∂u
∂e= ∆τ · [1− e · p′(e)− p(e)] if 0 ≤ e ≤ e (2)
If ∆τ > 0 and 1−e ·p′(e)−p(e) > 0, an increase in e increases the expected net-of-tax income, that
is, ∂u∂e
> 0. Our simple model predicts that individuals should overstate the dividend allowance
if the expected dividend tax exceeds the expected income tax on earned income up to the level
of e and if the probability of detection is low. If ∆τ < 0, any overstatement of the dividend
allowance reduces net-of-tax income when dividends are paid out. Hence, tax evasion in the form
13Niepelt (2005) presents an extended version of the Allingham-Sandmo model that allows for duration-dependentfines. While this could be of interest with respect to the problem presented in this paper, as individuals accumulateoverstated dividend allowances over several periods, the Swedish tax authority does not impose duration-dependentfines in practice. If at all, a potential fine depends only on the current overstated dividend allowance.
10
of overstating the dividend allowance is very likely to be accidental. However, there are two
potential problems with this conclusion. First, the model uses current tax status. Since we assume
a case where the dividend payout is in later periods, our prediction should be based on expected
rather than current tax status. That is, our model prediction relates to the uncertain future tax
rate difference ∆τ . Second, individuals with ∆τ < 0 may also overstate the dividend allowance,
as it represents an option on future tax savings; individuals decide on the real dividend-wage-mix
through their payout behavior.
From our model, we formulate a simple prediction for the effect of tax rates on tax evasion,
which we test empirically. The sign of ∆τ depends on the expected relation of τd to τi. The
advantage of our setting is that τi < τd if the individual is subject to the municipality tax. If an
individual is additionally subject to the state tax, τi > τd and ∆τ become positive. Empirically,
we expect that the likelihood of overstating the dividend allowance is higher for taxpayers that are
subject to the state tax.
4 Data sample, variable definitions, and estimation strategy
4.1 Data
We use the Firm Register and Individual Database (FRIDA) provided by Statistics Sweden. This
panel data set is a combination of three main data sources: corporate tax statements, income tax
statements, and the K10-form for owners of closely held firms. The corporate and individual data
sets are full samples of all CHCs and their active owners. Individual data contain information
on income and other socioeconomic variables. Due to unique identifiers, we can link information
from the individual database and the corporate tax database to the population of K10-forms filed
in the period 2006–2009. We include all observations where we can successfully link information
from the corporation (from the corporate tax database) and the individual (from the individual
tax database) to the respective K10-form. The final sample consists of 574,030 observations (K10-
forms) from 163,097 CHCs and 213,380 individuals over the period 2006–2009.
4.2 Identifying tax evasion in the data
We use a simple algorithm to detect overstated dividend allowances. We compute the claimed
dividend allowance for firm j in year t using the simplification rule. We do so by summing up
the claimed dividend allowances by all active owners of one firm. If the total claimed dividend
allowance exceeds the maximum per firm, we flag each owner as having overstated the dividend
allowance and set the dummy variable Failure to 1. This classification follows Swedish tax laws,
according to which these cases are treated as tax evasion. If the claimed dividend allowance per
firm does not exceed the maximum per firm, we set Failure to zero.
11
There are several concerns about this measure, as we treat every owner as a tax evader. It
could be that only one of the shareholders overstates the dividend allowance, e.g., by claiming
the maximum for himself. As a robustness test, we re-run all tests using an alternative definition
where we set the dummy to 1 if the total claimed dividend allowance exceeds the maximum per
firm and if the owner claims the legal maximum for himself.14 However, we use Failure throughout
the paper, since owners can overstate the dividend allowance without claiming the full allowance.
For example, we observe cases where two owners each claim 75% of the dividend allowance. The
alternative and stricter definition ignores this case. Most importantly, results for this alternative
definition are similar to the results when using Failure.
We observe overstated dividend allowances (Failure = 1) in about 5% of the filed K10-forms.15
The overstated dividend allowances amount to approximately SEK 3.3 bn. This is a non-trivial
amount, as it does not take into account that the outrightly claimed dividend allowances can be
carried forward with interest rates of about 7% to 8%. Figure 2 plots the distribution of claimed
dividend allowances per firm relative to the legal maximum. For example, a value of 2 indicates
that a firm has claimed 200% of e. We plot the distribution for each sample year. We find that
misreporting is highest in the year of introduction of the new rule. Thereafter, tax authorities
and/or taxpayers adapt to the new rules. Misreporting decreases but is still present. This is a
first indication of inertia in the adoption of the new rules. The spikes in the distribution at the
values of 1.5, 2, 3, 4, and 5 indicate that the majority of misreporting is due to firms with multiple
owners, where each owner claims the full annual dividend allowance per firm without coordinating
dividend allowances across owners.
[Insert Figure 2 about here]
4.3 Estimation strategy
4.3.1 Likelihood of overstating dividend allowance
We test the implications our theoretical considerations using a linear probability model that con-
trasts the likelihood of evading taxes by overstating the dividend allowance against correct state-
ment of the dividend allowance.16 We specify the regression model as
yi,j,t = α1 + δΠj,t + γΘi,t + αt + αc + ϵj,t (3)
14Results using this alternative dependent variable are presented in Tables A.1 through A.4 in the Appendix.15Taxpayers may also underreport the dividend allowance. We are, unfortunately, not able to observe this,
because we do not know the true share due to lack of a shareholder register. However, as mentioned above, thedividend allowance represents an option to pay out dividends; this option may or may not be utilized.
16We run additional sensitivity tests and re-estimate the model using a probit model. Results (not reported) arevery similar.
12
where the dependent variable yi,j,t is an indicator variable for individual i, firm j measured in year
t, taking the value 1 if the dividend allowance is overstated, i.e., if individual i evades taxes, and
0 otherwise (Failure). We use a set of firm-level and individual-level control variables that are
related to the incentive to evade taxes, awareness of tax rules, complexity of tax compliance, and
probability of detection.
The vector Πj,t contains firm-level characteristics of firm j in year t. First, we include the num-
ber of active owners (Number Owners).17 The expected effect of number of owners is ambiguous.
If a firm is owned by many active owners, costs of coordination and of tax compliance increase.
The effect of Number Owners is further related to incentives, since the marginal benefit for one
owner increases with the number of owners. Both arguments would predict a positive sign. At the
same time, it is more difficult to collude with larger numbers of owners, which suggests a negative
effect. Second, we include a dummy variable indicating whether owners of a closely held firm live
in different states (Different Region). This variables is a proxy for complexity and relates to the
costs of coordination across firm owners. If firm owners reside in various states, costs of coordi-
nation increase and the likelihood of over-reporting should also increase. Third, we include age of
the firm (Firm Age) as a measure for inertia and slowness of adoption (Jones, 2012). Owners of
well-established firms may have greater difficulty in adapting to new rules than individuals start-
ing a new firm. In contrast, firm age could also decrease over-reporting of dividend allowances,
since the owners are more experienced in filing tax returns. Fourth, we include a dummy variable
Dividend Payout, equal to 1 if the CHC pays out a dividend in year t. We expect that paying
out dividends reduces the likelihood of overstating the dividend allowance, for two reasons. First,
it raises taxpayer’s awareness of calculation of the dividend allowance. Second, the probability of
detection increases as the tax administration more closely considers cases where dividends are paid
out.18 Fifth, we include the natural logarithm of total assets (Ln(Assets)) as a measure of firm
size. Since we have no information on tax advisers, we use firm size as a control for tax advice. We
expect that smaller firms are more likely to overstate the dividend allowance, since larger firms are
more likely to have a tax consultant. Sixth, we include the profitability measure Return on Equity.
The return to tax evasion is higher for profitable firms, since more profits are to be distributed.
Such firms have an incentive to overstate the dividend allowance. In contrast, we could observe
the opposite effect. Less profitable firms may have incentives to increase net-of-tax return of their
company by illegal means. We therefore additionally include a squared term of Return on Equity
in the regression and expect a positive sign for the squared term. Seventh, we use the ratio of
17One concern about Number Owners is that only firms with more than one active owner have access to over-reporting the dividend allowance. As a robustness test, we re-run equation (3) where we focus on firms with morethan two owners. Results are reported in Table A.5 and are qualitative similar.
18While one would expect that calculation of the dividend allowance is always thoroughly checked by the taxadministration when dividends are paid out, we find no empirical support for this expectation. The tax authorityapparently does not automatically audit calculation of the dividend allowance when dividends are paid out. Weobserve cases where outrightly claimed dividend allowances are utilized by taxpayers.
13
financial assets and cash holdings to total firm assets (Financial Assets) as a measure of passive
firms. Finally, we include Shifter CHC, a dummy variable indicating whether the firm is a holding,
shell, or low-turnover corporation. These three firm types facilitate legal tax avoidance following
the 2006 tax reform (Alstadsæter and Jacob, 2013). The sign of Shifter CHC indicates whether
illegal tax avoidance and legal tax evasion are substitutes or complements.
The vector Θi,t contains controls for characteristics of individual i in year t. We include the
number of firms (Number Firms) in which the taxpayer actively participates. Number of firms
is an individual-level control for complexity in compliance. At the same time, number of firms
is positively related to experience in tax compliance. Second, we control for tax incentive. For
example, Clotfelter (1983); Feinstein (1991); Hanlon, Maydew, and Thornock (2013) document
a positive relation between tax rates and tax evasion. In our sample, we measure tax incentive
through the dummy State Tax, equal to 1 if the individual is subject to state tax. In this case,
the current dividend tax rate τd is below the current income tax rate on labor income τi and
∆τ becomes positive. According to our model, we expect a positive effect from the state tax
dummy on overstating the dividend allowance. We additionally include an interaction between the
number of owners and ∆τ . If Number Owners is related to the incentive to overstate the dividend
allowance, we should obtain a positive coefficient for the interaction term. Third, we include
dummy variables for each of the 10 deciles of the 3-year average income distribution to account
for a non-linear relationship between income and tax evasion. Income comprises labor income,
income from self-employment, income related to CHC, capital income such as dividends, interest,
and capital gains, and any other taxable income. We additionally include variables related to tax
awareness. If the observed type of tax evasion is unintended, tax-aware individuals are less likely
to overstate the dividend allowance. In contrast, if an individual is not tax aware, the individual
may accidently overstate the dividend allowance. As proxies for tax awareness, we include level of
education, type of education, experience (measured through age), and a dummy Born in Sweden,
equal to 1 if the individual was born in Sweden. K10-forms and detailed tax rule information are
available only in Swedish. We thus expect that individuals who are born in Sweden understand
available information more easily and predict that Swedish-born taxpayers have a lower probability
of accidentally overstating the dividend allowance. The same applies for individuals with tertiary
education.
As additional socioeconomic controls we include a dummy for being married and number of
children in the household. We additionally include controls for gender and marital status, as
well as year-fixed effects (αt). We also include county-fixed effects (αc) to account for regional
differences across the 21 first-level administrative regions in Sweden.19 Our statistical inference
19As a robustness test, we re-run the regression with shareholder-fixed effects. Results for time-varying variables,e.g., the tax incentive, are similar to the baseline model, which allows identification of time-invariant controls.
14
is based on heteroskedasticity-robust standard errors clustered at the individual level. Table 4
presents summary statistics and variable definitions for our sample.
[Insert Table 4 about here]
4.3.2 Identifying tax incentive—local linear regressions
The model from equation (3) includes the variable State Tax to test the effect of the tax wedge
between dividend taxes and labor income taxes, ∆τ , on tax evasion. We use an alternative identi-
fication strategy to test the effect of tax rates on tax evasion. The Swedish tax rate schedule offers
a suitable setting for testing the tax effect on tax evasion using a local linear regression. If an
individual is subject to the additional state tax of 20%, the tax rate on dividends falls below the
income tax rate on labor income. ∆τ from equation (2) becomes positive and the individual has a
tax incentive to overstate the dividend allowance. Below the threshold, ∆τ is negative and there is
no incentive to overstate the dividend allowance. We take advantage of this major kink in the tax
code and the sign change in ∆τ . We run a local linear regression to empirically test the relation
between evasion and tax rates. Since we use a very narrow range around the kink, the effect is not
due to a large tax benefit, since the average tax rate changes little. The effect is more related to
the salience of the kink to taxpayers (Chetty, Looney, and Kroft, 2009; Finkelstein, 2009). Below
the kink, individuals pay municipality tax, whereas individuals above the kink pay municipality
and state tax. For example, Alstadsæter and Jacob (2013) use this kink to identify a tax effect on
legal income shifting. We follow their approach and run the following local linear regression:
yi,j,t = β1 + β2State Tax + µj,t (4)
yi,j,t = β1 + β2State Tax + ϑΠj,t + ξΘi,t + βt + βc + µj,t (5)
where yi,j,t is an indicator variable taking the value 1 if individual i overstates the dividend al-
lowance of firm j in year t, and 0 otherwise. We choose very narrow ranges of SEK 1,000 and
SEK 500 (about USD 136 and USD 68) around the state tax threshold to ensure that there are
no differences between individuals above and below the threshold in observable characteristics.
In fact, we detect no statistically significant differences in all variables of vectors Πj,t and Θi,t
for individuals above and below the threshold (see Table A.6 of the Appendix). We are mainly
interested in the β2 coefficient. According to our model, β2 is expected to be positive. We test the
model with and without control variables. The specification in equation (4) includes no control
variables. In equation (5), we control for firm-level controls (Πj,t), individual-level controls (Θi,t),
time (βt), and county-fixed effects (βc). If our identifying assumptions hold, we should not observe
differences in the β2 coefficients across the two equations.
We are additionally interested in the role of complexity in the effect of the tax incentive. For
this purpose, we split the sample into firms with either two active owners (lower complexity) or
15
more than two active owners (higher complexity).20 The complexity of tax compliance increases
in the number of taxpayers who need to align their dividend allowances across tax returns. At
the same time, more owners increase their tax benefits from overstating the dividend allowance.
Using these cross-sectional differences in the number of owners, we test (1) whether the number
of owners is related to complexity and, given that this is true, (2) whether complexity is related
to intentional or accidental tax evasion. If taxpayers deliberately abuse complexity when evading
taxes, the effect of crossing the cutoff for the state tax should increase in complexity. That is, the
effect of ∆τ should be larger in the high-complexity sample. In contrast, if complexity leads to
unintentional tax evasion, the effect of tax rates on tax evasion should be more pronounced in the
low-complexity sample. It is an empirical question as to which of these two effects dominates.
5 Empirical results on participation in tax evasion
5.1 Likelihood to overstate dividend allowance
Table 5 presents regression results for the OLS regression from equation (3). We present results for
the firm-level variables (Πj,t), individual-level variables (Θi,t), and for the full set of independent
variables. Our results suggest that the likelihood of overstating the dividend allowance is affected
by complexity and the cost of coordination. The likelihood of tax evasion increases with the
number of owners of a firm and whether the owners live in different regions. The effects we find
are economically significant. For example, an increase in the number of active owners by 1 increases
the likelihood of overstating the dividend allowance by 3.87 percentage points, or about 79% of the
unconditional sample mean. In contrast, paying out dividends raises awareness of the potentially
incorrect calculation of the dividend allowance. We find that the likelihood of overstating the
dividend allowance decreases by 1.25 percentage points, or 25% of the unconditional mean, if a
firm distributes dividends. We further find that the likelihood of overstating the allowance is higher
for older as well as for smaller firms. We observe a significant effect of the squared term of return
on equity. The resulting U-shape pattern for the return on equity effect reflects our expectation
that the least profitable as well as the most profitable firms evade taxes. While less profitable
firms may seek out illegal opportunities to increase net profits, owners of highly profitable firms
may overstate the dividend allowance as they enjoy large benefits in the form of tax reductions.
Finally, the negative coefficient of Shifting CHC indicates that owners of CHC that are designed
for legal tax sheltering are less likely to also participate in illegal tax minimization. Being an owner
of a CHC designed for tax avoidance reduces the likelihood of overstating the dividend allowance
by 12%. This result indicates that tax evasion and tax avoidance are not used as complementary
20We use alternative sample split variables (number of firms, living in different regions). Results (reported inTable A.7 and A.8 of the Appendix) are qualitatively similar when using these alternative variables.
16
ways of minimizing taxes. Taxpayers who avoid taxes are less likely to evade taxes. Our results
for the firm-level variables are not affected by inclusion of individual-level variables.
[Insert Table 5 about here]
We next turn to our individual-level variables. Our results suggest that variables related to
complexity and awareness have a significant effect on the likelihood to overstate dividend allowance;
for example, this likelihood increases with the number of firms. Even though experience with tax
compliance increases with the number of firms, the complexity of tax compliance increases if an
individual actively participates in many firms. Our results suggest that an increase in the number of
firms by 1 increases the likelihood of overstating the dividend allowance by 0.28 percentage points.
We find that tertiary education and being born in Sweden reduces the likelihood of tax evasion.
For example, if an individual is born in Sweden, that individual has a 15% lower probability
of evading taxes. Likewise, having a university degree reduces the probability of overstating the
dividend allowance by 24%. This result indicates that tax-aware individuals are less likely to evade
taxes. Further, we control for income, which is also related to tax awareness, financial literacy,
and potential tax advice. Seven of nine of our income indicator variables are significant and have
negative signs.
In line with our theoretical model, we find a positive estimate for the tax incentive coefficient
(State Tax ). This is a first indication that tax incentives positively affect tax evasion. However,
the dummy State Tax is correlated with other variables, for example, our income decile indicator
variables. Therefore, we use the alternative estimation strategy set forth below to estimate the
effect of ∆τ from our model on tax evasion. In Table 5, we further find that the interaction between
Number Owners and State Tax is negative and significant. This indicates that the number of
owners is more related to complexity than to increased potential tax benefits. Finally, it appears
that there is a learning effect. The likelihood of overstating the dividend allowance decreases over
time, as indicated by the decreasing year–dummy variables.
Taken together, it appears that at least some of the observed tax evasion can be explained
by complexity and lack of awareness. Not all individuals who overstate the dividend allowance
actually benefit from tax evasion. In fact, the overall tax burden could increase for individuals
subject only to the municipality tax. Summary statistics (not reported) show that 60% of business
owners who overstate the dividend allowance are currently not subject to the state tax (∆τ < 0).
Still, some of the observed tax evasion may be due to deliberate tax evasion. Otherwise, owners of
highly profitable firms and owners subject to the state tax would not be more likely to overstate
the dividend allowance.
17
5.2 Tax incentive and evasion: evidence from local linear regressions
This section presents an alternative identification strategy to analyze the relation between tax
rates and tax evasion and the effect of complexity on intended tax evasion. If individuals respond
to the tax incentive, we may interpret this as deliberate tax evasion. Taxpayers would only
overstate the dividend allowance because of the tax benefit. Our model from Section 3 has a clear
prediction: if the expected dividend tax is below the expected labor income tax, overstating the
dividend allowance can increase net-of-tax income. To test this prediction, we use the state tax
cutoff that increases the marginal labor income tax rate by 20% and that changes the sign of ∆τ .
This approach has several advantages. First, since individuals above and below the threshold are
statistically not different from each other in observable characteristics, the identification stems
only from the difference in ∆τ . Second, the tax rate increase is salient. This increase is due to
the state-level tax in addition to the municipality tax. While the actual tax benefit changes little
around the kink, the increase in the marginal tax becomes quite salient. The cutoff, however,
changes the marginal and not the average tax rate. Therefore, the increase in tax benefits is
only marginal. A potential reaction to the increase in the marginal labor income tax rate may
be explained by the salience of the tax cut or by taxpayer confusion of marginal with average tax
rates (see, e.g., de Bartolome, 1995). Third, the threshold for the state tax changes each year.
This time-series variation improves identification of the tax effect.
We generate empirical evidence on the effect of the increase in marginal tax rate on overstating
the dividend allowance in two ways. We first provide graphical evidence. We sort the data into
SEK 250 bins and calculate the percentage of CHC owners overstating the dividend allowance in
each bin. Figure 3 shows the resulting percentages in each bin. The likelihood of overstating the
dividend allowance decreases up to the state tax cutoff (indicated by the vertical line). Above the
state tax threshold, the percentage of individuals overstating the dividend allowance increases.
[Insert Figure 3 about here]
Second, we quantify the effect of tax rates on tax evasion using local linear regressions around
very narrow ranges of SEK 500 and SEK 1000 around the state tax threshold. Table 6 reports the
coefficient of the state tax dummy without control variables (Columns 1 and 3) and with control
variables (Columns 2 and 4).
[Insert Table 6 about here]
We find that crossing the state tax threshold significantly increases the likelihood of overstating
the dividend allowance. Results are very similar for both ranges around the threshold. Crossing the
state tax threshold increases the likelihood of overstating the dividend allowance by 2 percentage
points—about 40% of the unconditional sample mean. Results are very similar when including
18

controls. This confirms that the sample is reasonably smooth around the kink, as coefficient
estimates are not affected by inclusion of control variables, year-fixed effects, and county-fixed
effects. Hence, some of the observed tax evasion is driven by the tax wedge between dividend
taxes and labor income taxes. Individuals intentionally overstate the dividend allowance to benefit
from lower dividend taxes as opposed to higher labor income taxes.
We are next interested in the role of complexity in intentional tax evasion. Since complex
tax compliance reduces the probability of detection, taxpayers may deliberately take advantage of
complex situations. In contrast, complexity in compliance may result in accidental tax evasion.
We therefore split the sample into two groups that differ in complexity. In Table 7, we present
coefficient estimates for State Tax from local linear regressions for CHCs with two owners (lower-
complexity sample) and for CHCs with more than two owners (higher-complexity sample). Our
results indicate that complexity is related to accidental tax evasion. If incentives explain the
results of Number Owners, we would see a stronger effect of State Tax in the group of CHCs with
more than two owners. We find a positive effect of crossing the state tax threshold only in the
low-complexity sample. In the high-complexity sample, crossing the state tax threshold does not
affect the probability of overstating the dividend allowance.
[Insert Table 7 about here]
We run robustness tests and use the number of firms an individual owns and whether the
owners live in different states (Different Regions) as alternative proxies for complexity (Table
A.7 and A.8 in the Appendix). Results are qualitatively similar. This robustness analysis also
addresses concerns that Number Owners is additionally related to collusion. Owners of firms with
many owners may not be able and willing to collude in tax evasion. In both robustness tests, we
find a positive and significant effect only in the low-complexity group.
We conclude that some tax evasion is driven by the tax advantage of dividend income over labor
income and tax awareness of the kink in the Swedish dual income tax. Individuals intentionally
evade taxes once they have a tax incentive. Hence, not only legal tax avoidance (Alstadsæter and
Jacob, 2013), but also tax evasion through overstating the dividend allowance is driven by tax
incentives and tax awareness. Further, since one requires business partners for this type of tax
evasion, this type of tax evasion is another example that not everyone who may be willing to cheat
also has the ability to do so (Kleven, Knudsen, Kreiner, Pedersen, and Saez, 2011).
6 Self-correction versus external correction of tax evasion
6.1 Detection of tax evasion
We distinguish between two different types of detection, which we label self-correction and external
correction, according to the legal consequences of detection by the tax administration (see above).
19
We set the indicator variable Self-Correction to 1 if the individual corrects the dividend allowance
himself, zero otherwise. We treat a case as self-detection only if the accumulated overstated
dividend allowance from past years is not corrected. If the accumulated dividend allowance from
t-1 is corrected as shown in Columns (5) to (7) of Table 3, we set External Correction to 1.
Self-Correction and External Correction are mutually exclusive. Either the taxpayer or the tax
authority detects the overstated dividend allowance.
Figure 4 summarizes the percentage of K10-forms with overstated dividend allowances in the
preceding year and the percentage of cases detected. In 2007, about 40% of incorrect K10-forms
from 2006 are corrected and now declared correctly. Surprisingly, 70% of these detected cases do
not lead to a readjustment of the outrightly claimed dividend allowance. These cases are detected
by taxpayers themselves without consequences. The remaining 30% are corrections by the tax
authority. Overstating the dividend allowance is discovered by the authorities in only 12% (40%
× 30%) of all evasion cases. This is a surprising result, as an automatic check across firm owners
could have discovered all evasion cases.
Figure 4 also provides some first indications that the probability of detection with consequences
(External Correction) decreases over time. First, the percentage of detected cases (self-corrected
and externally detected) decreases from 40% in 2007 to 36.6% in 2009. Second, the share of
external corrections decreases from 30% in 2007 and over 22% in 2008 to 20% in 2009. That is,
only 7.23% of overstated dividend allowances are detected by tax authorities in 2009. In case of
detection, the vast majority has no consequences on the accumulated dividend allowance; that
is, there is no penalty for taxpayers who self-correct misreporting. The motivation behind self-
correction is not entirely clear. One may argue that self-correction is related to accidental tax
evasion. If taxpayers unintentionally overstate the dividend allowance, they may correct their
mistake without further obligation. However, one may also argue that self-correction can be used
by intentional tax evaders. These evaders overstate the dividend allowance up to the year in which
they wish to pay out dividends. In the year of dividend payout, they comply with the rules, since
there is no fine as long as the error does not lead to a reduction in income taxes in the year of
misreporting.
[Insert Figure 4 about here]
6.2 Time until detection of overstated dividend allowance
Finally, we are interested in the factors that affect the dynamics of self-correction (taxpayer detects
the mistake in calculating the dividend allowance) versus external correction (the tax authority
corrects the dividend allowance). We examine the risk, or hazard, of being detected due either to
self-correction or to external detection. As these two outcomes are mutually exclusive, i.e., com-
peting events, we use a competing risks proportional hazards model with time-varying covariates
20
(Fine and Gray, 1999). We specify the model as:
λ(t) = λ(0)exp(θΠj,t + νΘi,t) (6)
where we use the time until self-correction and the time until external correction as dependent
variables and competing events. The advantage of a hazard model is that it informs us about the
dynamics of detecting tax evasion. As independent variables, we include the firm-level controls
(Πj,t) and individual-level controls (Πj,t) from above. We run the competing risks model for all
individuals considered at risk. That is, we restrict the sample to owners who overstate the dividend
allowance in at least one sample year; only these individuals can be detected. This restriction
creates a sample-selection bias that we need to correct. To account for selection, we first run a
one-to-one matching procedure based on equation (3). We then use the predicted probability scores
from this probit regression as weights in the competing risks proportional hazards model (second
stage, equation (6)) to control for sample selection in our main model. Our statistical inference in
the competing risks hazards model is based on heteroskedasticity-robust standard errors clustered
at the individual level.
Table 8 presents regression results for the duration model from equation (6). We present results
for the time to self-correction in Panel A. We find that the likelihood that a taxpayer corrects the
overstated dividend allowance on his own decreases with number of owners. Put differently, the
time until the overstated dividend allowance is self-corrected decreases as the number of owners
increases. We find a similar effect for least profitable and most profitable firms, as indicated by
the negative coefficient of the squared term of return on equity. That is, the least profitable and
most profitable firms are detected earlier than other firms. The positive coefficient of our firm size
variable ln(Assets) suggests that owners of larger firms have a higher likelihood of self-correction.
From the individual-level variables, we find a negative effect from being married and a positive
effect from family size on self-correction. Overall, the results in Panel A of Table 8 suggest that self-
correction is not well explained by awareness and incentives. It appears that complexity increases
the time until self-correction.
[Insert Table 8 about here]
Panel B of Table 8 presents results for time until external detection. Again, only a few variables
are significant. For example, if the CHC is a tax sheltering firm, the likelihood of detection is higher
and the tax authority detects the mistake earlier. Further, being married and living in a smaller
town (Rural) is associated with earlier external detection. In rural areas, the auditor may be
more familiar with businesses and their actual ownership structure in smaller municipalities. The
positive sign on Born in Sweden could also be the result of amended tax returns. If a taxpayers
consults the tax authority about his past overstated dividend allowance, the tax authority is
required to change the prior year’s dividend allowance.
21
Comparison of the results from Table 5 and Table 8 points toward the difference between
the characteristics of individuals who overstate the dividend allowance and the determinants of
detection. Not all factors that increase the likelihood of filing erroneous tax returns also decrease
time until detection by the tax authority, i.e., external correction. For example, while the number
of owners is associated with a higher likelihood of overstating the dividend allowance, it has no
effect on time until external correction. In fact, we find that only a few variables are significant
in the detection equations. One implication of this finding is that there is a lack of effective “red-
flag” mechanisms. Such mechanisms should be based on empirical evidence of the characteristics
of individuals evading taxes and on factors that increase the complexity of compliance.
7 Conclusion
Tax authorities in many countries experience budget cuts while simultaneously trying to maintain
the quality and efficiency of tax compliance. The challenge is to improve tax revenue collection
when resources allocated to tax administration are reduced. Audits are costly and there are
continuous efforts to automate controls and audit selection of taxpayers. This paper shows that
lack of awareness of the tax code and complexity in compliance can increase tax evasion. We also
find evidence for a relation between tax rates and observed tax evasion. The type of tax evasion,
which we directly observe and identify in tax returns approved by the Swedish tax administration, is
often corrected by the taxpayer. Complexity increases the likelihood of misreporting and decreases
the probability of detection. The relatively low detection rate of tax authorities can be explained
by slowness in adjusting enforcement and audit strategies following implementation of new tax
rules and tax forms.
Our findings have four main implications. First, economic models of tax evasion and avoidance
should take into account that tax administration and enforcement strategies can affect the tax
evasion decision and the level of tax evasion (Shaw, Slemrod, and Whiting, 2010). Second, when
designing tax reforms that change taxpayer incentives, policymakers should also adjust enforcement
and audit strategies. Otherwise, a tax reform may have unintended consequences, or the desired
effect may not occur at all. This argument not only applies to tax policy but to laws in general.
For example, Christensen, Hail, and Leuz (2012) show that the liquidity benefits of adopting inter-
national financial reporting standards are limited to those countries that also changed enforcement
of accounting standards. Also, the threat of stronger enforcement and higher detection risk can
effectively decrease tax evasion (Alm, Jackson, and McKee, 2009; Fellner, Sausgruber, and Traxler,
2013). Third, our results add to the literature on tax enforcement strategies (e.g., Sanchez and
Sobel, 1993; Chander and Wilde, 1998; Boadway and Sato, 2009; Shaw, Slemrod, and Whiting,
2010; Bigio and Zilberman, 2011). To implement effective control and compliance strategies, tax
authorities should merge information across taxpayers and use automated, computer-based plau-
22
sibility checks, which are capable of automatically detecting all overstated dividend allowances
examined in this study. Fourth, at least some of the observed tax evasion observed in this paper
appears to be accidental. Overall, only 40% of taxpayers actually benefit from the observed tax
evasion given their current tax status. Complex tax rules and tax forms can trigger unintended
tax evasion if mistakes are based on a lack of tax awareness and slowness in adapting to new rules.
The main challenge for tax authorities is to distinguish between accidental tax evaders and
those that deliberately evade taxes. Easily understandable and well-designed tax forms provide
information to taxpayers and can reduce accidental misreporting. Integrating “easy-to-comply” tax
forms into the design of control routines enables more automated auditing by tax administrations.
Also, by reducing accidental misreporting, tax authorities can shift scarce auditing resources toward
detecting intentional tax evasion. Disentangling empirically unintentional and intentional tax
non-compliance is a relevant and challenging avenue for future research, policymakers, and tax
authorities. The challenge of non-compliance is not related exclusively to taxes. It is a central
issue in other areas, such as social security insurance, environmental standards, trade, and tariff
regulations, where intended and accidental non-compliance are likely to be present.
23
References
Allingham, Michael G. and Agnar Sandmo (1972): Income Tax Evasion: A Theoretical Analysis,
Journal of Public Economics, 1: 323–339.
Alm, James, Betty R. Jackson, and Michael McKee (2009): Getting the word out: Enforcement
information dissemination and compliance behavior, Journal of Public Economics, 93: 392–402.
Alstadsæter, Annette and Martin Jacob (2012): Income Shifting in Sweden – An empirical evalu-
ation of the 3:12 rules. Report to the Expert Group for Public Economics, Ministry of Finance,
Stockholm.
Alstadsæter, Annette and Martin Jacob (2013): Who Participates in Tax Avoidance?, FAccT
Center Working Paper No. 08/2012.
Alstadsæter, Annette, Wojciech Kopczuk, and Kjetil Telle (2012): Social networks and individuals’
tax avoidance participation, Mimeo, University of Oslo, Columbia University, and Statistics
Norway.
Andreoni, James, Brian Erard, and Jonathan Feinstein (1998): Tax compliance, Journal of Eco-
nomic Literature, 36: 818–860.
Bigio, Saki and Eduardo Zilberman (2011): Optimal self-employment income tax enforcement,
Journal of Public Economics, 95: 1021–1035.
Boadway, Robin and Motohiro Sato (2009): Optimal Tax Design and Enforcement with an Informal
Sector, American Economic Journal: Economic Policy, 1: 1–27.
Chander, Parkash and Louis L. Wilde (1998): A General Characterization of Optimal Income Tax
Enforcement, Review of Economic Studies, 65: 165–183.
Chetty, Raj, John N. Friedman, and Emmanuel Saez (2013): Using Differences in Knowledge
Across Neighborhoods to Uncover the Impacts of the EITC on Earnings, American Economic
Review, forthcoming.
Chetty, Raj, Adam Looney, and Kory Kroft (2009): Salience and Taxation: Theory and Evidence,
American Economic Review, 99: 1145–1177.
Christensen, Hans B., Luzi Hail, and Christian Leuz (2012): Mandatory IFRS Reporting and
Changes in Enforcement, SSRN Working Paper.
Clotfelter, Charles T. (1983): Tax Evasion and Tax Rates: An Analysis of Individual Returns,
Review of Economics and Statistics, 65: 363–373.
24
de Bartolome, Charles A.M. (1995): Which tax rate do people use: Average or marginal?, Journal
of Public Economics, 56: 79–96.
Feinstein, Jonathan S. (1991): An econometric analysis of income tax evasion and its detection,
RAND Journal of Economics, 22: 14–36.
Fellner, Gerlinde, Rupert Sausgruber, and Christian Traxler (2013): Testing enforcement strategies
in the field: Threat, moral appeal and social information, Journal of the European Economic
Association, 11: 634–660.
Fine, Jason P. and Robert J. Gray (1999): A Proportional Hazards Model for the Subdistribution
of a Competing Risk, Journal of the American Statistical Association, 94: 496–509.
Finkelstein, Amy (2009): E-ZTAX: Tax Salience and Tax Rates, Quarterly Journal of Economics,
124: 969–1010.
Hanlon, Michelle, Edward L. Maydew, and Jacob R. Thornock (2013): Taking the Long Way
Home: U.S. Tax Evasion and Offshore Investments in U.S. Equity and Debt Markets, Journal
of Finance, forthcoming.
Jacob, Martin and Annette Alstadsæter (2013): Payout Policies of Privately Held Firms: Flexi-
bility and the Role of Income Taxes, Mimeo, WHU, Vallendar.
Jones, Damon (2012): Inertia and Overwithholding: Explaining the Prevalence of Income Tax
Refunds, American Economic Journal: Economic Policy, 4: 158–185.
Kleven, Henrik, Martin Knudsen, Claus Thustrup Kreiner, Soren Pedersen, and Emmanuel Saez
(2011): Unwilling or Unable to Cheat? Evidence from a Tax Audit Experiment in Denmark,
Econometrica, 79: 651–692.
Kopczuk, Wojciech (2006): Tax Simplification and Tax Compliance: An Economic Perspective, In
Max Sawicky, editor, Bridging the Tax Gap. Addressing the Crisis in Tax Administration, pages
111–143. Economic Policy Institute, Washington, DC.
Kopczuk, Wojciech (2012): The Polish business “flat” tax and its effect on reported incomes: a
Pareto improving tax reform?, Mimeo, Columbia University.
Niepelt, Dirk (2005): Timing tax evasion, Journal of Public Economics, 89: 1612–1637.
Sandmo, Agnar (2005): The Theory of Tax Evasion: A Retrospective View, National Tax Journal,
58: 543–663.
Sandmo, Agnar (2012): An evasive topic: theorizing about the hidden economy, International Tax
and Public Finance, 19: 5–24.
25
Shaw, Jonathan, Joel B. Slemrod, and John Whiting (2010): Administration and Compliance, In
Dimensions of Tax Design. The Mirrlees Review. Oxford University Press, pages 1100–1162.
Slemrod, Joel B. (2003): Trust in Public Finance, In Sijbren Cnossen and Hans-Werner Sinn, edi-
tors, Public Finance and Public Policy in the New Century, page 49–88. MIT Press, Cambridge,
MA.
Slemrod, Joel B. (2007): Cheating ourselves: The economics of tax evasion, Journal of Economic
Perspectives, 21: 25–48.
Slemrod, Joel B. and Shlomo Yitzhaki (2002): Tax avoidance, evasion, and administration, In
Alan J. Auerbach and Martin Feldstein, editors, Handbook of Public Economics, volume 3, page
1423–1470. Elsevier.
Sanchez, Isabel and Joel Sobel (1993): Hierarchical design and enforcement of income tax policies,
Journal of Public Economics, 50: 345–369.
26
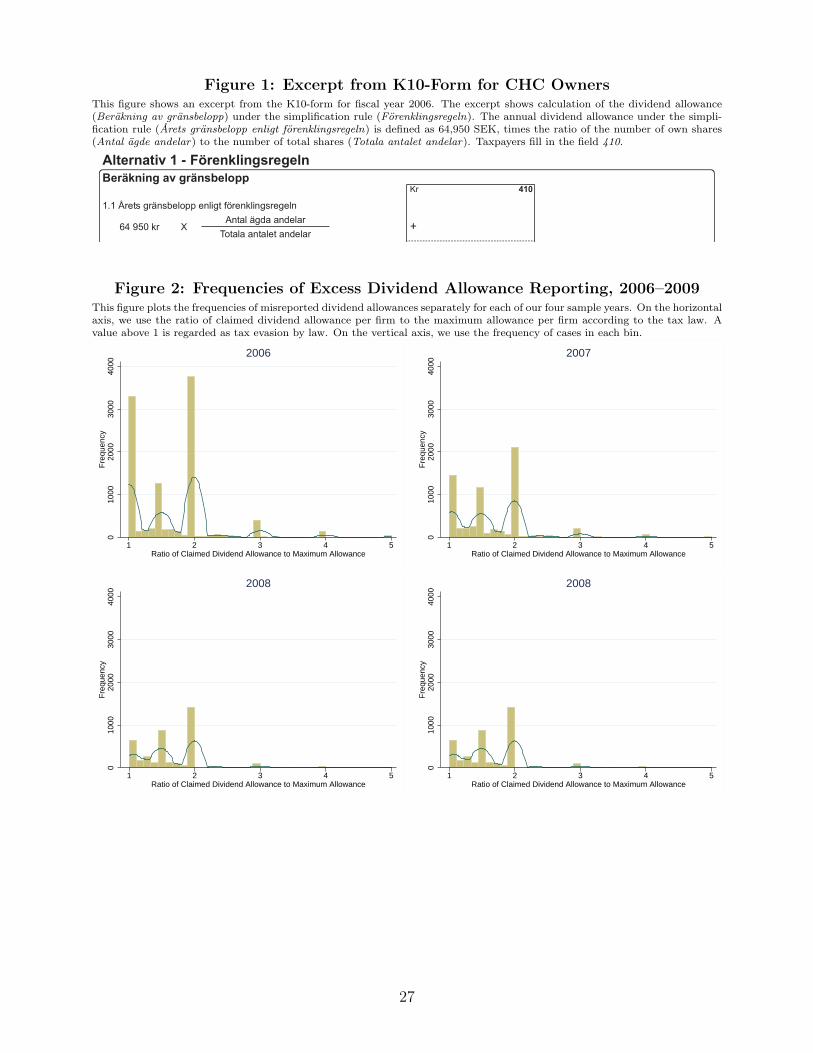
Figure 1: Excerpt from K10-Form for CHC OwnersThis figure shows an excerpt from the K10-form for fiscal year 2006. The excerpt shows calculation of the dividend allowance(Berakning av gransbelopp) under the simplification rule (Forenklingsregeln). The annual dividend allowance under the simpli-fication rule (Arets gransbelopp enligt forenklingsregeln) is defined as 64,950 SEK, times the ratio of the number of own shares(Antal agde andelar) to the number of total shares (Totala antalet andelar). Taxpayers fill in the field 410.
Alternativ 1 - Förenklingsregeln
1.1 Årets gränsbelopp enligt förenklingsregeln
Kr
+
+
Beräkning av gränsbelopp
Antal ägda andelar
Totala antalet andelar64 950 kr X
410
411
Figure 2: Frequencies of Excess Dividend Allowance Reporting, 2006–2009This figure plots the frequencies of misreported dividend allowances separately for each of our four sample years. On the horizontalaxis, we use the ratio of claimed dividend allowance per firm to the maximum allowance per firm according to the tax law. Avalue above 1 is regarded as tax evasion by law. On the vertical axis, we use the frequency of cases in each bin.
010
0020
0030
0040
00F
requ
ency
1 2 3 4 5Ratio of Claimed Dividend Allowance to Maximum Allowance
2006
010
0020
0030
0040
00F
requ
ency
1 2 3 4 5Ratio of Claimed Dividend Allowance to Maximum Allowance
2007
010
0020
0030
0040
00F
requ
ency
1 2 3 4 5Ratio of Claimed Dividend Allowance to Maximum Allowance
2008
010
0020
0030
0040
00F
requ
ency
1 2 3 4 5Ratio of Claimed Dividend Allowance to Maximum Allowance
2008
27
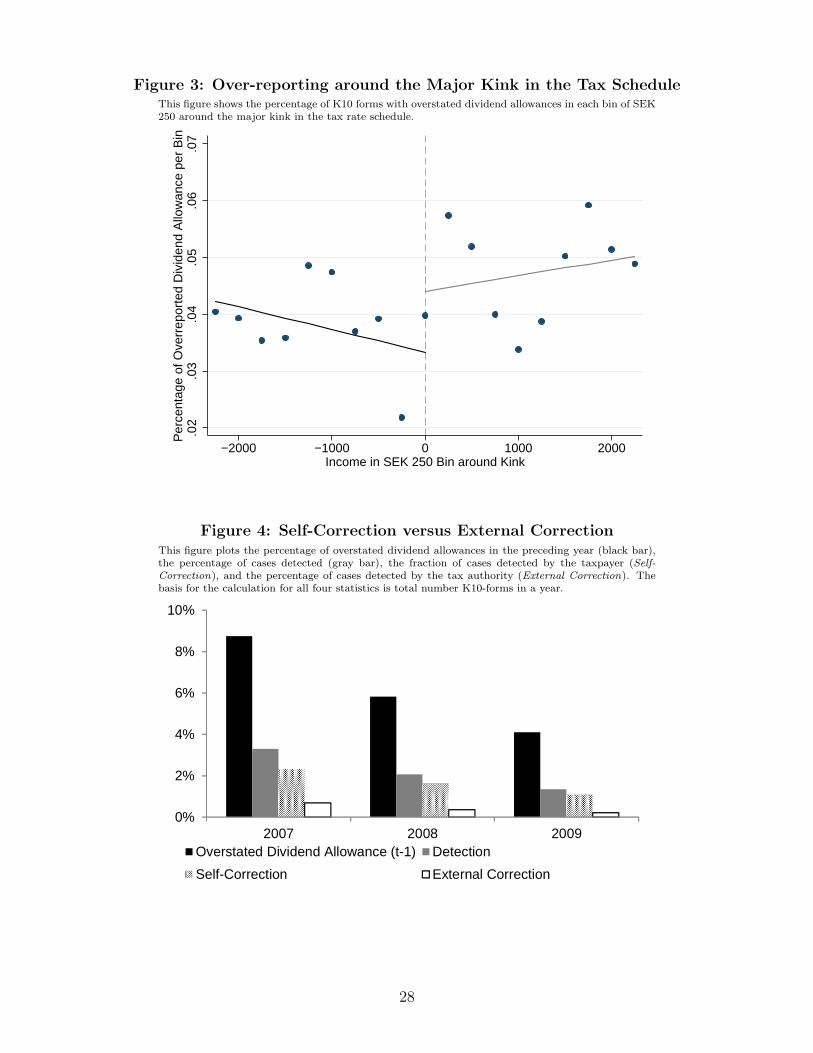
Figure 3: Over-reporting around the Major Kink in the Tax ScheduleThis figure shows the percentage of K10 forms with overstated dividend allowances in each bin of SEK250 around the major kink in the tax rate schedule.
.02
.03
.04
.05
.06
.07
Per
cent
age
of O
verr
epor
ted
Div
iden
d A
llow
ance
per
Bin
−2000 −1000 0 1000 2000Income in SEK 250 Bin around Kink
Figure 4: Self-Correction versus External CorrectionThis figure plots the percentage of overstated dividend allowances in the preceding year (black bar),the percentage of cases detected (gray bar), the fraction of cases detected by the taxpayer (Self-Correction), and the percentage of cases detected by the tax authority (External Correction). Thebasis for the calculation for all four statistics is total number K10-forms in a year.
��������������������������������������������������������������������������������������������������������������������������������������������������������������������������������������������������������������������������������������������������������������������������������������������������������������������������������������������������������������������������������������������������������������������������������������������������������������������������������������������������������������������������������������������������������������������������������������������������������������������������������������������������������������������������������������������������������������������������������������������������������������������������������������������������������������������������������������������������������������������������������������������������������������������������������������������������������������������������������������������������������������������������������������������������������������������������������������������������������������������������������������������������������������������������������������������������������������������������������������������������������������������������������������������������������������������������������������������������������������������������������������������������������������������������������������������������������������������������������������������������������������������������������������������������������������������������������������������������������������������������������������������������������������������������������������������������������������������������������������������������������������������������������������������������������
0%
2%
4%
6%
8%
10%
2007 2008 2009Overstated Dividend Allowance (t-1) Detection
������������ Self-Correction External Correction
28
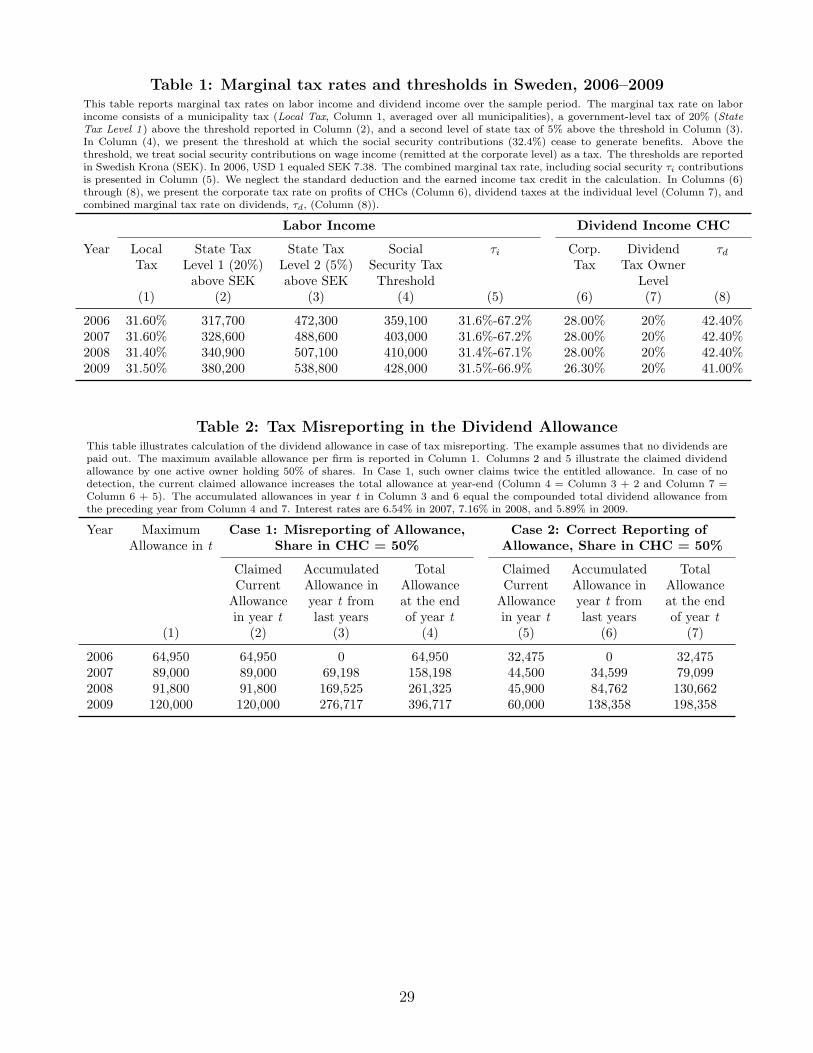
Table 1: Marginal tax rates and thresholds in Sweden, 2006–2009This table reports marginal tax rates on labor income and dividend income over the sample period. The marginal tax rate on laborincome consists of a municipality tax (Local Tax, Column 1, averaged over all municipalities), a government-level tax of 20% (StateTax Level 1 ) above the threshold reported in Column (2), and a second level of state tax of 5% above the threshold in Column (3).In Column (4), we present the threshold at which the social security contributions (32.4%) cease to generate benefits. Above thethreshold, we treat social security contributions on wage income (remitted at the corporate level) as a tax. The thresholds are reportedin Swedish Krona (SEK). In 2006, USD 1 equaled SEK 7.38. The combined marginal tax rate, including social security τi contributionsis presented in Column (5). We neglect the standard deduction and the earned income tax credit in the calculation. In Columns (6)through (8), we present the corporate tax rate on profits of CHCs (Column 6), dividend taxes at the individual level (Column 7), andcombined marginal tax rate on dividends, τd, (Column (8)).
Labor Income Dividend Income CHC
Year Local State Tax State Tax Social τi Corp. Dividend τdTax Level 1 (20%) Level 2 (5%) Security Tax Tax Tax Owner
above SEK above SEK Threshold Level(1) (2) (3) (4) (5) (6) (7) (8)
2006 31.60% 317,700 472,300 359,100 31.6%-67.2% 28.00% 20% 42.40%2007 31.60% 328,600 488,600 403,000 31.6%-67.2% 28.00% 20% 42.40%2008 31.40% 340,900 507,100 410,000 31.4%-67.1% 28.00% 20% 42.40%2009 31.50% 380,200 538,800 428,000 31.5%-66.9% 26.30% 20% 41.00%
Table 2: Tax Misreporting in the Dividend AllowanceThis table illustrates calculation of the dividend allowance in case of tax misreporting. The example assumes that no dividends arepaid out. The maximum available allowance per firm is reported in Column 1. Columns 2 and 5 illustrate the claimed dividendallowance by one active owner holding 50% of shares. In Case 1, such owner claims twice the entitled allowance. In case of nodetection, the current claimed allowance increases the total allowance at year-end (Column 4 = Column 3 + 2 and Column 7 =Column 6 + 5). The accumulated allowances in year t in Column 3 and 6 equal the compounded total dividend allowance fromthe preceding year from Column 4 and 7. Interest rates are 6.54% in 2007, 7.16% in 2008, and 5.89% in 2009.
Year Maximum Case 1: Misreporting of Allowance, Case 2: Correct Reporting ofAllowance in t Share in CHC = 50% Allowance, Share in CHC = 50%
Claimed Accumulated Total Claimed Accumulated TotalCurrent Allowance in Allowance Current Allowance in AllowanceAllowance year t from at the end Allowance year t from at the endin year t last years of year t in year t last years of year t
(1) (2) (3) (4) (5) (6) (7)
2006 64,950 64,950 0 64,950 32,475 0 32,4752007 89,000 89,000 69,198 158,198 44,500 34,599 79,0992008 91,800 91,800 169,525 261,325 45,900 84,762 130,6622009 120,000 120,000 276,717 396,717 60,000 138,358 198,358
29
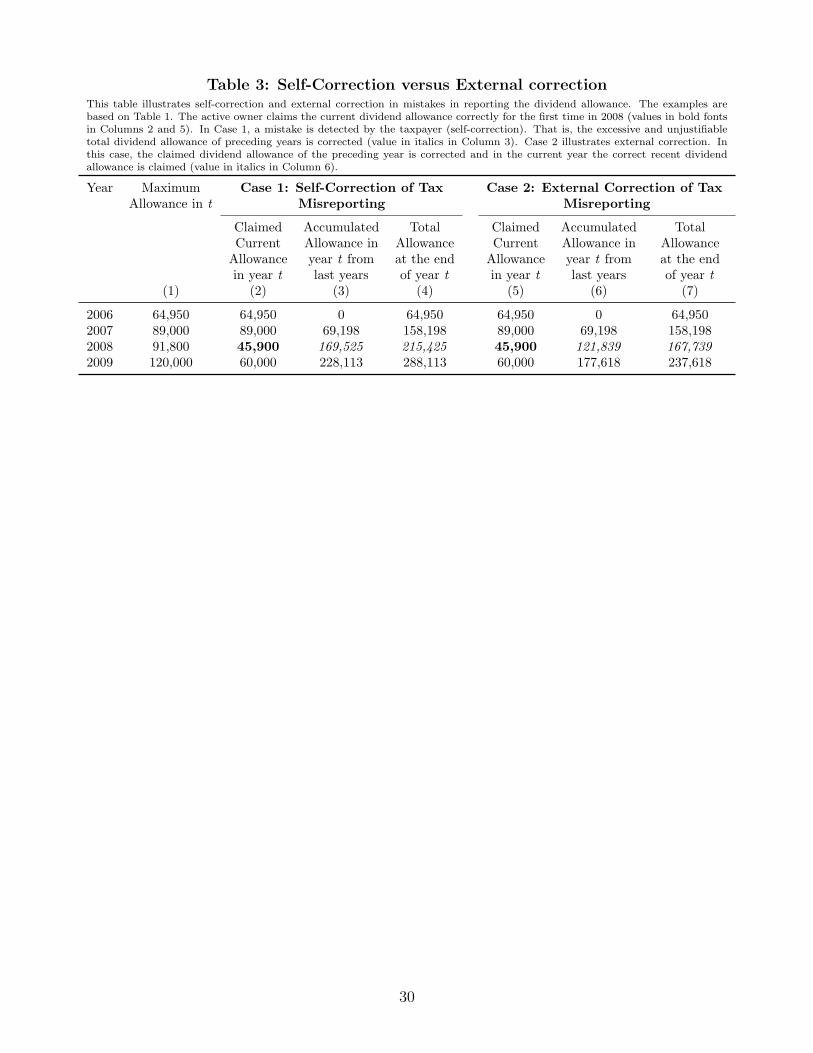
Table 3: Self-Correction versus External correctionThis table illustrates self-correction and external correction in mistakes in reporting the dividend allowance. The examples arebased on Table 1. The active owner claims the current dividend allowance correctly for the first time in 2008 (values in bold fontsin Columns 2 and 5). In Case 1, a mistake is detected by the taxpayer (self-correction). That is, the excessive and unjustifiabletotal dividend allowance of preceding years is corrected (value in italics in Column 3). Case 2 illustrates external correction. Inthis case, the claimed dividend allowance of the preceding year is corrected and in the current year the correct recent dividendallowance is claimed (value in italics in Column 6).
Year Maximum Case 1: Self-Correction of Tax Case 2: External Correction of TaxAllowance in t Misreporting Misreporting
Claimed Accumulated Total Claimed Accumulated TotalCurrent Allowance in Allowance Current Allowance in AllowanceAllowance year t from at the end Allowance year t from at the endin year t last years of year t in year t last years of year t
(1) (2) (3) (4) (5) (6) (7)
2006 64,950 64,950 0 64,950 64,950 0 64,9502007 89,000 89,000 69,198 158,198 89,000 69,198 158,1982008 91,800 45,900 169,525 215,425 45,900 121,839 167,7392009 120,000 60,000 228,113 288,113 60,000 177,618 237,618
30
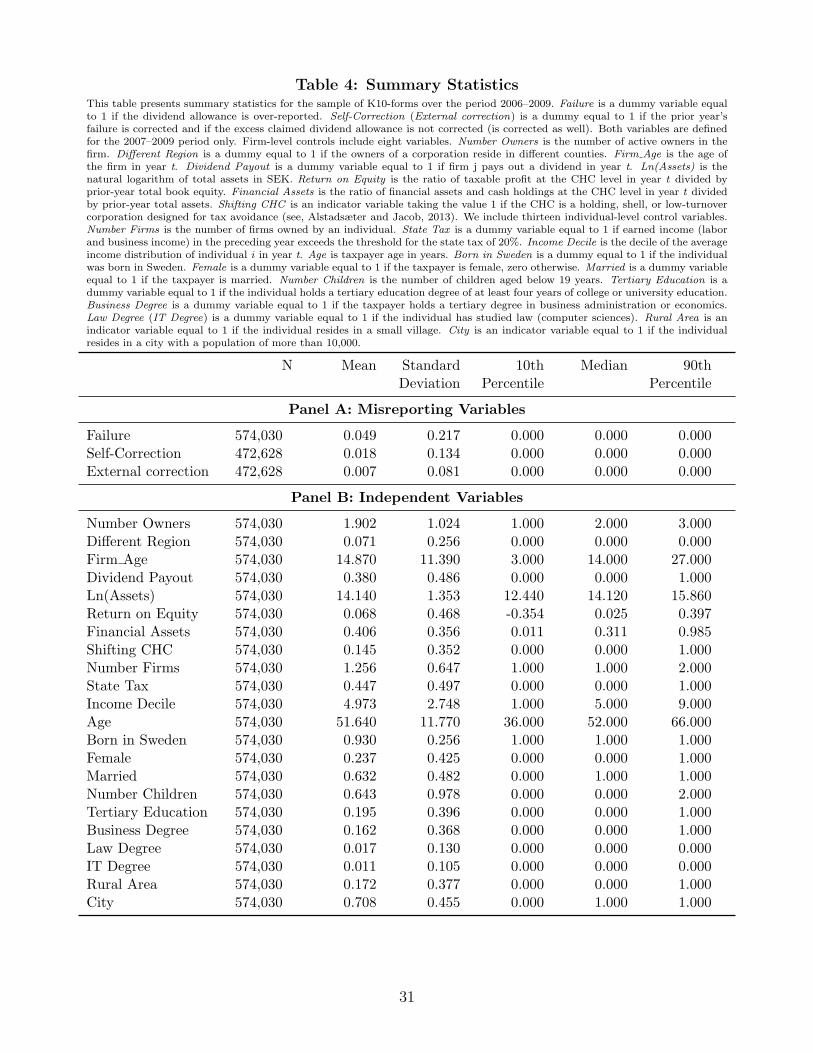
Table 4: Summary StatisticsThis table presents summary statistics for the sample of K10-forms over the period 2006–2009. Failure is a dummy variable equalto 1 if the dividend allowance is over-reported. Self-Correction (External correction) is a dummy equal to 1 if the prior year’sfailure is corrected and if the excess claimed dividend allowance is not corrected (is corrected as well). Both variables are definedfor the 2007–2009 period only. Firm-level controls include eight variables. Number Owners is the number of active owners in thefirm. Different Region is a dummy equal to 1 if the owners of a corporation reside in different counties. Firm Age is the age ofthe firm in year t. Dividend Payout is a dummy variable equal to 1 if firm j pays out a dividend in year t. Ln(Assets) is thenatural logarithm of total assets in SEK. Return on Equity is the ratio of taxable profit at the CHC level in year t divided byprior-year total book equity. Financial Assets is the ratio of financial assets and cash holdings at the CHC level in year t dividedby prior-year total assets. Shifting CHC is an indicator variable taking the value 1 if the CHC is a holding, shell, or low-turnovercorporation designed for tax avoidance (see, Alstadsæter and Jacob, 2013). We include thirteen individual-level control variables.Number Firms is the number of firms owned by an individual. State Tax is a dummy variable equal to 1 if earned income (laborand business income) in the preceding year exceeds the threshold for the state tax of 20%. Income Decile is the decile of the averageincome distribution of individual i in year t. Age is taxpayer age in years. Born in Sweden is a dummy equal to 1 if the individualwas born in Sweden. Female is a dummy variable equal to 1 if the taxpayer is female, zero otherwise. Married is a dummy variableequal to 1 if the taxpayer is married. Number Children is the number of children aged below 19 years. Tertiary Education is adummy variable equal to 1 if the individual holds a tertiary education degree of at least four years of college or university education.Business Degree is a dummy variable equal to 1 if the taxpayer holds a tertiary degree in business administration or economics.Law Degree (IT Degree) is a dummy variable equal to 1 if the individual has studied law (computer sciences). Rural Area is anindicator variable equal to 1 if the individual resides in a small village. City is an indicator variable equal to 1 if the individualresides in a city with a population of more than 10,000.
N Mean Standard 10th Median 90thDeviation Percentile Percentile
Panel A: Misreporting Variables
Failure 574,030 0.049 0.217 0.000 0.000 0.000Self-Correction 472,628 0.018 0.134 0.000 0.000 0.000External correction 472,628 0.007 0.081 0.000 0.000 0.000
Panel B: Independent Variables
Number Owners 574,030 1.902 1.024 1.000 2.000 3.000Different Region 574,030 0.071 0.256 0.000 0.000 0.000Firm Age 574,030 14.870 11.390 3.000 14.000 27.000Dividend Payout 574,030 0.380 0.486 0.000 0.000 1.000Ln(Assets) 574,030 14.140 1.353 12.440 14.120 15.860Return on Equity 574,030 0.068 0.468 -0.354 0.025 0.397Financial Assets 574,030 0.406 0.356 0.011 0.311 0.985Shifting CHC 574,030 0.145 0.352 0.000 0.000 1.000Number Firms 574,030 1.256 0.647 1.000 1.000 2.000State Tax 574,030 0.447 0.497 0.000 0.000 1.000Income Decile 574,030 4.973 2.748 1.000 5.000 9.000Age 574,030 51.640 11.770 36.000 52.000 66.000Born in Sweden 574,030 0.930 0.256 1.000 1.000 1.000Female 574,030 0.237 0.425 0.000 0.000 1.000Married 574,030 0.632 0.482 0.000 1.000 1.000Number Children 574,030 0.643 0.978 0.000 0.000 2.000Tertiary Education 574,030 0.195 0.396 0.000 0.000 1.000Business Degree 574,030 0.162 0.368 0.000 0.000 1.000Law Degree 574,030 0.017 0.130 0.000 0.000 0.000IT Degree 574,030 0.011 0.105 0.000 0.000 0.000Rural Area 574,030 0.172 0.377 0.000 0.000 1.000City 574,030 0.708 0.455 0.000 1.000 1.000
31
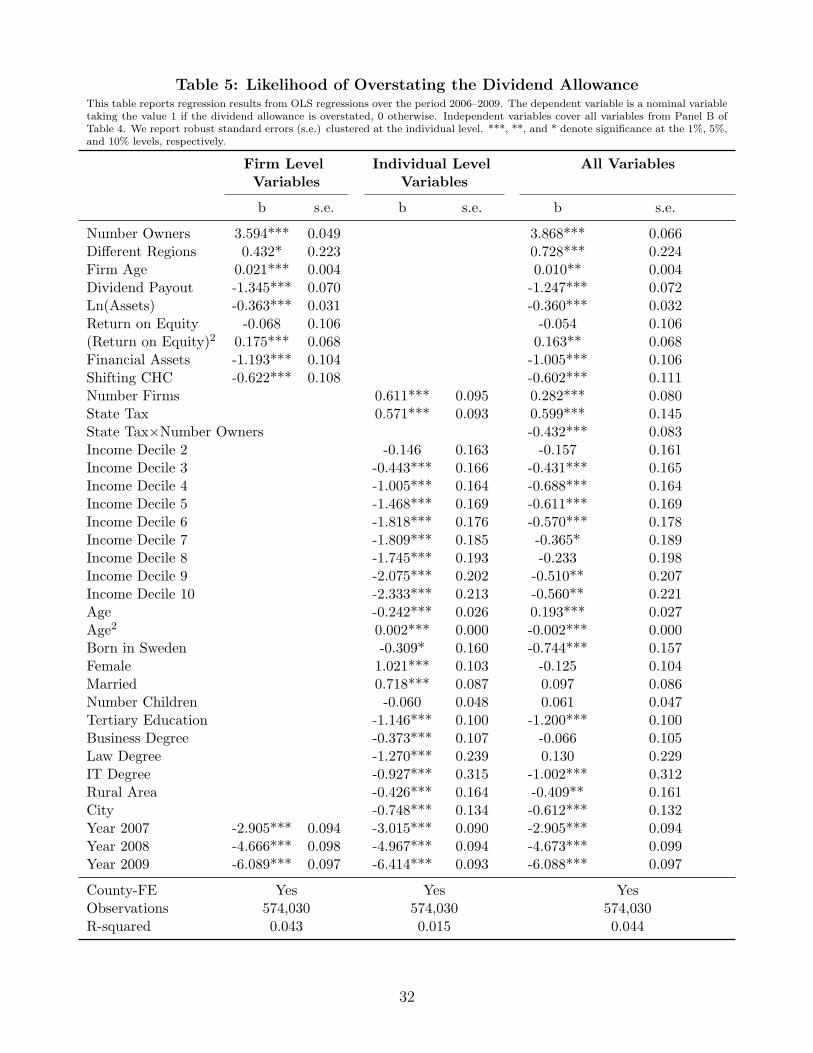
Table 5: Likelihood of Overstating the Dividend AllowanceThis table reports regression results from OLS regressions over the period 2006–2009. The dependent variable is a nominal variabletaking the value 1 if the dividend allowance is overstated, 0 otherwise. Independent variables cover all variables from Panel B ofTable 4. We report robust standard errors (s.e.) clustered at the individual level. ***, **, and * denote significance at the 1%, 5%,and 10% levels, respectively.
Firm Level Individual Level All VariablesVariables Variables
b s.e. b s.e. b s.e.
Number Owners 3.594*** 0.049 3.868*** 0.066Different Regions 0.432* 0.223 0.728*** 0.224Firm Age 0.021*** 0.004 0.010** 0.004Dividend Payout -1.345*** 0.070 -1.247*** 0.072Ln(Assets) -0.363*** 0.031 -0.360*** 0.032Return on Equity -0.068 0.106 -0.054 0.106(Return on Equity)2 0.175*** 0.068 0.163** 0.068Financial Assets -1.193*** 0.104 -1.005*** 0.106Shifting CHC -0.622*** 0.108 -0.602*** 0.111Number Firms 0.611*** 0.095 0.282*** 0.080State Tax 0.571*** 0.093 0.599*** 0.145State Tax×Number Owners -0.432*** 0.083Income Decile 2 -0.146 0.163 -0.157 0.161Income Decile 3 -0.443*** 0.166 -0.431*** 0.165Income Decile 4 -1.005*** 0.164 -0.688*** 0.164Income Decile 5 -1.468*** 0.169 -0.611*** 0.169Income Decile 6 -1.818*** 0.176 -0.570*** 0.178Income Decile 7 -1.809*** 0.185 -0.365* 0.189Income Decile 8 -1.745*** 0.193 -0.233 0.198Income Decile 9 -2.075*** 0.202 -0.510** 0.207Income Decile 10 -2.333*** 0.213 -0.560** 0.221Age -0.242*** 0.026 0.193*** 0.027Age2 0.002*** 0.000 -0.002*** 0.000Born in Sweden -0.309* 0.160 -0.744*** 0.157Female 1.021*** 0.103 -0.125 0.104Married 0.718*** 0.087 0.097 0.086Number Children -0.060 0.048 0.061 0.047Tertiary Education -1.146*** 0.100 -1.200*** 0.100Business Degree -0.373*** 0.107 -0.066 0.105Law Degree -1.270*** 0.239 0.130 0.229IT Degree -0.927*** 0.315 -1.002*** 0.312Rural Area -0.426*** 0.164 -0.409** 0.161City -0.748*** 0.134 -0.612*** 0.132Year 2007 -2.905*** 0.094 -3.015*** 0.090 -2.905*** 0.094Year 2008 -4.666*** 0.098 -4.967*** 0.094 -4.673*** 0.099Year 2009 -6.089*** 0.097 -6.414*** 0.093 -6.088*** 0.097
County-FE Yes Yes YesObservations 574,030 574,030 574,030R-squared 0.043 0.015 0.044
32
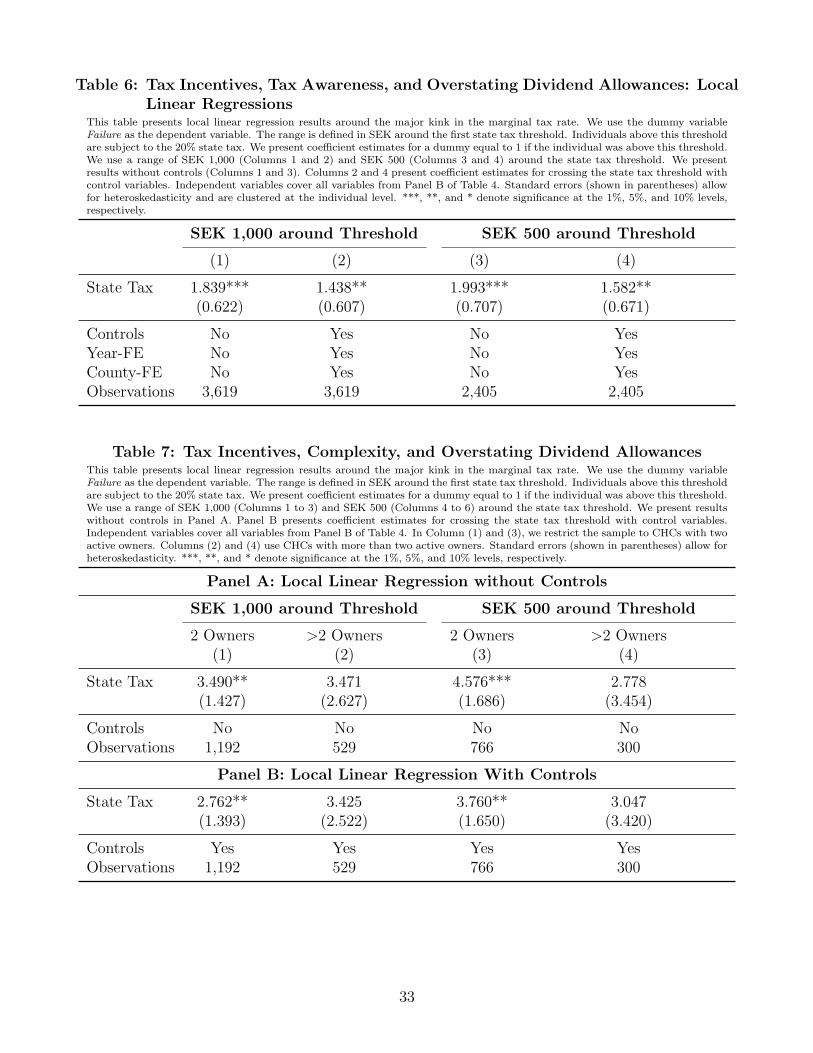
Table 6: Tax Incentives, Tax Awareness, and Overstating Dividend Allowances: LocalLinear Regressions
This table presents local linear regression results around the major kink in the marginal tax rate. We use the dummy variableFailure as the dependent variable. The range is defined in SEK around the first state tax threshold. Individuals above this thresholdare subject to the 20% state tax. We present coefficient estimates for a dummy equal to 1 if the individual was above this threshold.We use a range of SEK 1,000 (Columns 1 and 2) and SEK 500 (Columns 3 and 4) around the state tax threshold. We presentresults without controls (Columns 1 and 3). Columns 2 and 4 present coefficient estimates for crossing the state tax threshold withcontrol variables. Independent variables cover all variables from Panel B of Table 4. Standard errors (shown in parentheses) allowfor heteroskedasticity and are clustered at the individual level. ***, **, and * denote significance at the 1%, 5%, and 10% levels,respectively.
SEK 1,000 around Threshold SEK 500 around Threshold
(1) (2) (3) (4)
State Tax 1.839*** 1.438** 1.993*** 1.582**(0.622) (0.607) (0.707) (0.671)
Controls No Yes No YesYear-FE No Yes No YesCounty-FE No Yes No YesObservations 3,619 3,619 2,405 2,405
Table 7: Tax Incentives, Complexity, and Overstating Dividend AllowancesThis table presents local linear regression results around the major kink in the marginal tax rate. We use the dummy variableFailure as the dependent variable. The range is defined in SEK around the first state tax threshold. Individuals above this thresholdare subject to the 20% state tax. We present coefficient estimates for a dummy equal to 1 if the individual was above this threshold.We use a range of SEK 1,000 (Columns 1 to 3) and SEK 500 (Columns 4 to 6) around the state tax threshold. We present resultswithout controls in Panel A. Panel B presents coefficient estimates for crossing the state tax threshold with control variables.Independent variables cover all variables from Panel B of Table 4. In Column (1) and (3), we restrict the sample to CHCs with twoactive owners. Columns (2) and (4) use CHCs with more than two active owners. Standard errors (shown in parentheses) allow forheteroskedasticity. ***, **, and * denote significance at the 1%, 5%, and 10% levels, respectively.
Panel A: Local Linear Regression without Controls
SEK 1,000 around Threshold SEK 500 around Threshold
2 Owners >2 Owners 2 Owners >2 Owners(1) (2) (3) (4)
State Tax 3.490** 3.471 4.576*** 2.778(1.427) (2.627) (1.686) (3.454)
Controls No No No NoObservations 1,192 529 766 300
Panel B: Local Linear Regression With Controls
State Tax 2.762** 3.425 3.760** 3.047(1.393) (2.522) (1.650) (3.420)
Controls Yes Yes Yes YesObservations 1,192 529 766 300
33
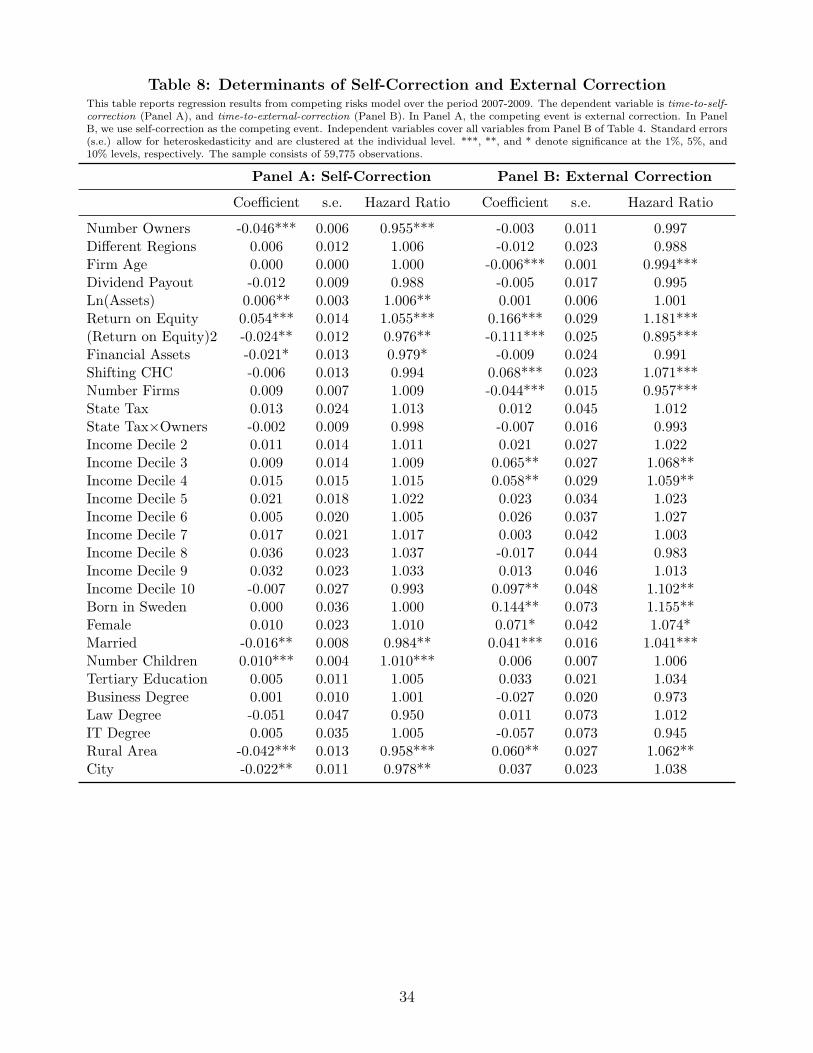
Table 8: Determinants of Self-Correction and External CorrectionThis table reports regression results from competing risks model over the period 2007-2009. The dependent variable is time-to-self-correction (Panel A), and time-to-external-correction (Panel B). In Panel A, the competing event is external correction. In PanelB, we use self-correction as the competing event. Independent variables cover all variables from Panel B of Table 4. Standard errors(s.e.) allow for heteroskedasticity and are clustered at the individual level. ***, **, and * denote significance at the 1%, 5%, and10% levels, respectively. The sample consists of 59,775 observations.
Panel A: Self-Correction Panel B: External Correction
Coefficient s.e. Hazard Ratio Coefficient s.e. Hazard Ratio
Number Owners -0.046*** 0.006 0.955*** -0.003 0.011 0.997Different Regions 0.006 0.012 1.006 -0.012 0.023 0.988Firm Age 0.000 0.000 1.000 -0.006*** 0.001 0.994***Dividend Payout -0.012 0.009 0.988 -0.005 0.017 0.995Ln(Assets) 0.006** 0.003 1.006** 0.001 0.006 1.001Return on Equity 0.054*** 0.014 1.055*** 0.166*** 0.029 1.181***(Return on Equity)2 -0.024** 0.012 0.976** -0.111*** 0.025 0.895***Financial Assets -0.021* 0.013 0.979* -0.009 0.024 0.991Shifting CHC -0.006 0.013 0.994 0.068*** 0.023 1.071***Number Firms 0.009 0.007 1.009 -0.044*** 0.015 0.957***State Tax 0.013 0.024 1.013 0.012 0.045 1.012State Tax×Owners -0.002 0.009 0.998 -0.007 0.016 0.993Income Decile 2 0.011 0.014 1.011 0.021 0.027 1.022Income Decile 3 0.009 0.014 1.009 0.065** 0.027 1.068**Income Decile 4 0.015 0.015 1.015 0.058** 0.029 1.059**Income Decile 5 0.021 0.018 1.022 0.023 0.034 1.023Income Decile 6 0.005 0.020 1.005 0.026 0.037 1.027Income Decile 7 0.017 0.021 1.017 0.003 0.042 1.003Income Decile 8 0.036 0.023 1.037 -0.017 0.044 0.983Income Decile 9 0.032 0.023 1.033 0.013 0.046 1.013Income Decile 10 -0.007 0.027 0.993 0.097** 0.048 1.102**Born in Sweden 0.000 0.036 1.000 0.144** 0.073 1.155**Female 0.010 0.023 1.010 0.071* 0.042 1.074*Married -0.016** 0.008 0.984** 0.041*** 0.016 1.041***Number Children 0.010*** 0.004 1.010*** 0.006 0.007 1.006Tertiary Education 0.005 0.011 1.005 0.033 0.021 1.034Business Degree 0.001 0.010 1.001 -0.027 0.020 0.973Law Degree -0.051 0.047 0.950 0.011 0.073 1.012IT Degree 0.005 0.035 1.005 -0.057 0.073 0.945Rural Area -0.042*** 0.013 0.958*** 0.060** 0.027 1.062**City -0.022** 0.011 0.978** 0.037 0.023 1.038
34
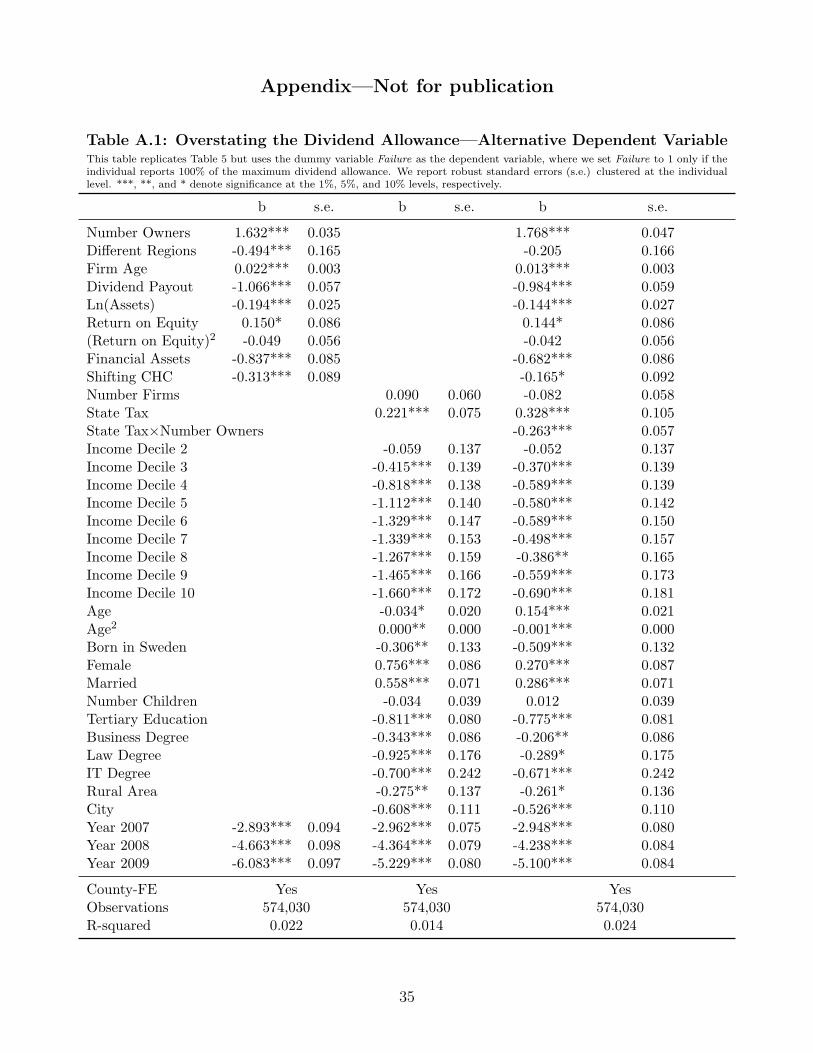
Appendix—Not for publication
Table A.1: Overstating the Dividend Allowance—Alternative Dependent VariableThis table replicates Table 5 but uses the dummy variable Failure as the dependent variable, where we set Failure to 1 only if theindividual reports 100% of the maximum dividend allowance. We report robust standard errors (s.e.) clustered at the individuallevel. ***, **, and * denote significance at the 1%, 5%, and 10% levels, respectively.
b s.e. b s.e. b s.e.
Number Owners 1.632*** 0.035 1.768*** 0.047Different Regions -0.494*** 0.165 -0.205 0.166Firm Age 0.022*** 0.003 0.013*** 0.003Dividend Payout -1.066*** 0.057 -0.984*** 0.059Ln(Assets) -0.194*** 0.025 -0.144*** 0.027Return on Equity 0.150* 0.086 0.144* 0.086(Return on Equity)2 -0.049 0.056 -0.042 0.056Financial Assets -0.837*** 0.085 -0.682*** 0.086Shifting CHC -0.313*** 0.089 -0.165* 0.092Number Firms 0.090 0.060 -0.082 0.058State Tax 0.221*** 0.075 0.328*** 0.105State Tax×Number Owners -0.263*** 0.057Income Decile 2 -0.059 0.137 -0.052 0.137Income Decile 3 -0.415*** 0.139 -0.370*** 0.139Income Decile 4 -0.818*** 0.138 -0.589*** 0.139Income Decile 5 -1.112*** 0.140 -0.580*** 0.142Income Decile 6 -1.329*** 0.147 -0.589*** 0.150Income Decile 7 -1.339*** 0.153 -0.498*** 0.157Income Decile 8 -1.267*** 0.159 -0.386** 0.165Income Decile 9 -1.465*** 0.166 -0.559*** 0.173Income Decile 10 -1.660*** 0.172 -0.690*** 0.181Age -0.034* 0.020 0.154*** 0.021Age2 0.000** 0.000 -0.001*** 0.000Born in Sweden -0.306** 0.133 -0.509*** 0.132Female 0.756*** 0.086 0.270*** 0.087Married 0.558*** 0.071 0.286*** 0.071Number Children -0.034 0.039 0.012 0.039Tertiary Education -0.811*** 0.080 -0.775*** 0.081Business Degree -0.343*** 0.086 -0.206** 0.086Law Degree -0.925*** 0.176 -0.289* 0.175IT Degree -0.700*** 0.242 -0.671*** 0.242Rural Area -0.275** 0.137 -0.261* 0.136City -0.608*** 0.111 -0.526*** 0.110Year 2007 -2.893*** 0.094 -2.962*** 0.075 -2.948*** 0.080Year 2008 -4.663*** 0.098 -4.364*** 0.079 -4.238*** 0.084Year 2009 -6.083*** 0.097 -5.229*** 0.080 -5.100*** 0.084
County-FE Yes Yes YesObservations 574,030 574,030 574,030R-squared 0.022 0.014 0.024
35
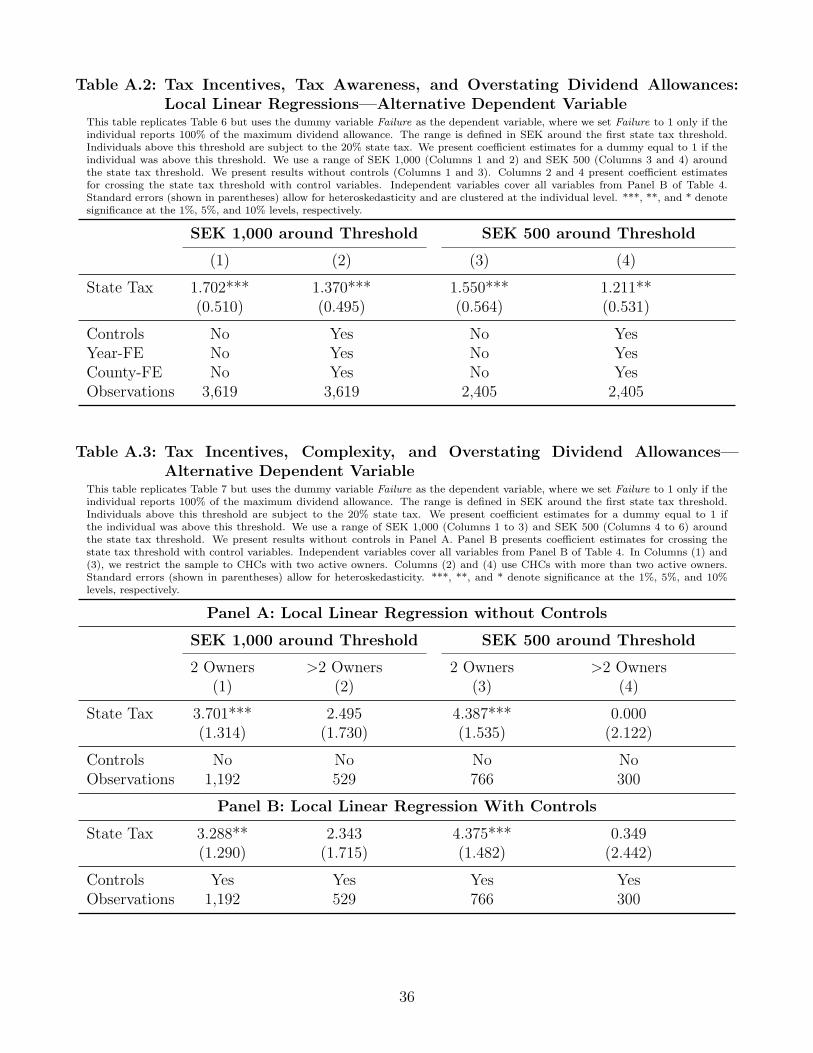
Table A.2: Tax Incentives, Tax Awareness, and Overstating Dividend Allowances:Local Linear Regressions—Alternative Dependent Variable
This table replicates Table 6 but uses the dummy variable Failure as the dependent variable, where we set Failure to 1 only if theindividual reports 100% of the maximum dividend allowance. The range is defined in SEK around the first state tax threshold.Individuals above this threshold are subject to the 20% state tax. We present coefficient estimates for a dummy equal to 1 if theindividual was above this threshold. We use a range of SEK 1,000 (Columns 1 and 2) and SEK 500 (Columns 3 and 4) aroundthe state tax threshold. We present results without controls (Columns 1 and 3). Columns 2 and 4 present coefficient estimatesfor crossing the state tax threshold with control variables. Independent variables cover all variables from Panel B of Table 4.Standard errors (shown in parentheses) allow for heteroskedasticity and are clustered at the individual level. ***, **, and * denotesignificance at the 1%, 5%, and 10% levels, respectively.
SEK 1,000 around Threshold SEK 500 around Threshold
(1) (2) (3) (4)
State Tax 1.702*** 1.370*** 1.550*** 1.211**(0.510) (0.495) (0.564) (0.531)
Controls No Yes No YesYear-FE No Yes No YesCounty-FE No Yes No YesObservations 3,619 3,619 2,405 2,405
Table A.3: Tax Incentives, Complexity, and Overstating Dividend Allowances—Alternative Dependent Variable
This table replicates Table 7 but uses the dummy variable Failure as the dependent variable, where we set Failure to 1 only if theindividual reports 100% of the maximum dividend allowance. The range is defined in SEK around the first state tax threshold.Individuals above this threshold are subject to the 20% state tax. We present coefficient estimates for a dummy equal to 1 ifthe individual was above this threshold. We use a range of SEK 1,000 (Columns 1 to 3) and SEK 500 (Columns 4 to 6) aroundthe state tax threshold. We present results without controls in Panel A. Panel B presents coefficient estimates for crossing thestate tax threshold with control variables. Independent variables cover all variables from Panel B of Table 4. In Columns (1) and(3), we restrict the sample to CHCs with two active owners. Columns (2) and (4) use CHCs with more than two active owners.Standard errors (shown in parentheses) allow for heteroskedasticity. ***, **, and * denote significance at the 1%, 5%, and 10%levels, respectively.
Panel A: Local Linear Regression without Controls
SEK 1,000 around Threshold SEK 500 around Threshold
2 Owners >2 Owners 2 Owners >2 Owners(1) (2) (3) (4)
State Tax 3.701*** 2.495 4.387*** 0.000(1.314) (1.730) (1.535) (2.122)
Controls No No No NoObservations 1,192 529 766 300
Panel B: Local Linear Regression With Controls
State Tax 3.288** 2.343 4.375*** 0.349(1.290) (1.715) (1.482) (2.442)
Controls Yes Yes Yes YesObservations 1,192 529 766 300
36
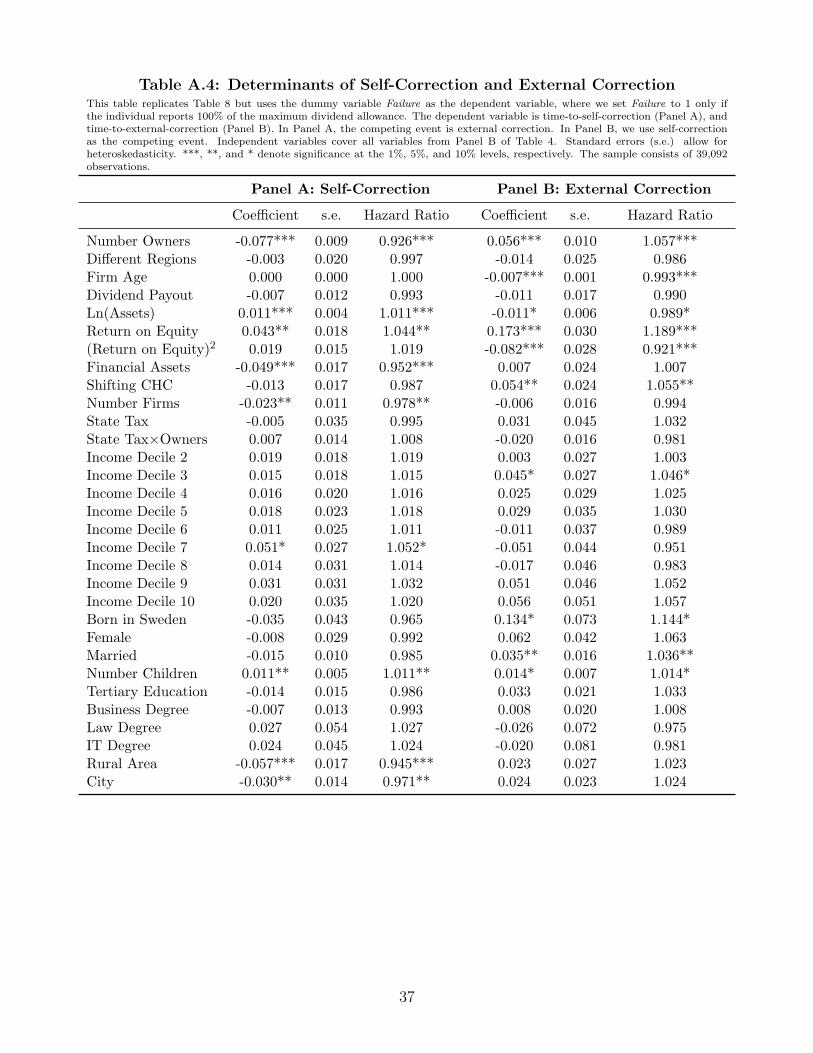
Table A.4: Determinants of Self-Correction and External CorrectionThis table replicates Table 8 but uses the dummy variable Failure as the dependent variable, where we set Failure to 1 only ifthe individual reports 100% of the maximum dividend allowance. The dependent variable is time-to-self-correction (Panel A), andtime-to-external-correction (Panel B). In Panel A, the competing event is external correction. In Panel B, we use self-correctionas the competing event. Independent variables cover all variables from Panel B of Table 4. Standard errors (s.e.) allow forheteroskedasticity. ***, **, and * denote significance at the 1%, 5%, and 10% levels, respectively. The sample consists of 39,092observations.
Panel A: Self-Correction Panel B: External Correction
Coefficient s.e. Hazard Ratio Coefficient s.e. Hazard Ratio
Number Owners -0.077*** 0.009 0.926*** 0.056*** 0.010 1.057***Different Regions -0.003 0.020 0.997 -0.014 0.025 0.986Firm Age 0.000 0.000 1.000 -0.007*** 0.001 0.993***Dividend Payout -0.007 0.012 0.993 -0.011 0.017 0.990Ln(Assets) 0.011*** 0.004 1.011*** -0.011* 0.006 0.989*Return on Equity 0.043** 0.018 1.044** 0.173*** 0.030 1.189***(Return on Equity)2 0.019 0.015 1.019 -0.082*** 0.028 0.921***Financial Assets -0.049*** 0.017 0.952*** 0.007 0.024 1.007Shifting CHC -0.013 0.017 0.987 0.054** 0.024 1.055**Number Firms -0.023** 0.011 0.978** -0.006 0.016 0.994State Tax -0.005 0.035 0.995 0.031 0.045 1.032State Tax×Owners 0.007 0.014 1.008 -0.020 0.016 0.981Income Decile 2 0.019 0.018 1.019 0.003 0.027 1.003Income Decile 3 0.015 0.018 1.015 0.045* 0.027 1.046*Income Decile 4 0.016 0.020 1.016 0.025 0.029 1.025Income Decile 5 0.018 0.023 1.018 0.029 0.035 1.030Income Decile 6 0.011 0.025 1.011 -0.011 0.037 0.989Income Decile 7 0.051* 0.027 1.052* -0.051 0.044 0.951Income Decile 8 0.014 0.031 1.014 -0.017 0.046 0.983Income Decile 9 0.031 0.031 1.032 0.051 0.046 1.052Income Decile 10 0.020 0.035 1.020 0.056 0.051 1.057Born in Sweden -0.035 0.043 0.965 0.134* 0.073 1.144*Female -0.008 0.029 0.992 0.062 0.042 1.063Married -0.015 0.010 0.985 0.035** 0.016 1.036**Number Children 0.011** 0.005 1.011** 0.014* 0.007 1.014*Tertiary Education -0.014 0.015 0.986 0.033 0.021 1.033Business Degree -0.007 0.013 0.993 0.008 0.020 1.008Law Degree 0.027 0.054 1.027 -0.026 0.072 0.975IT Degree 0.024 0.045 1.024 -0.020 0.081 0.981Rural Area -0.057*** 0.017 0.945*** 0.023 0.027 1.023City -0.030** 0.014 0.971** 0.024 0.023 1.024
37
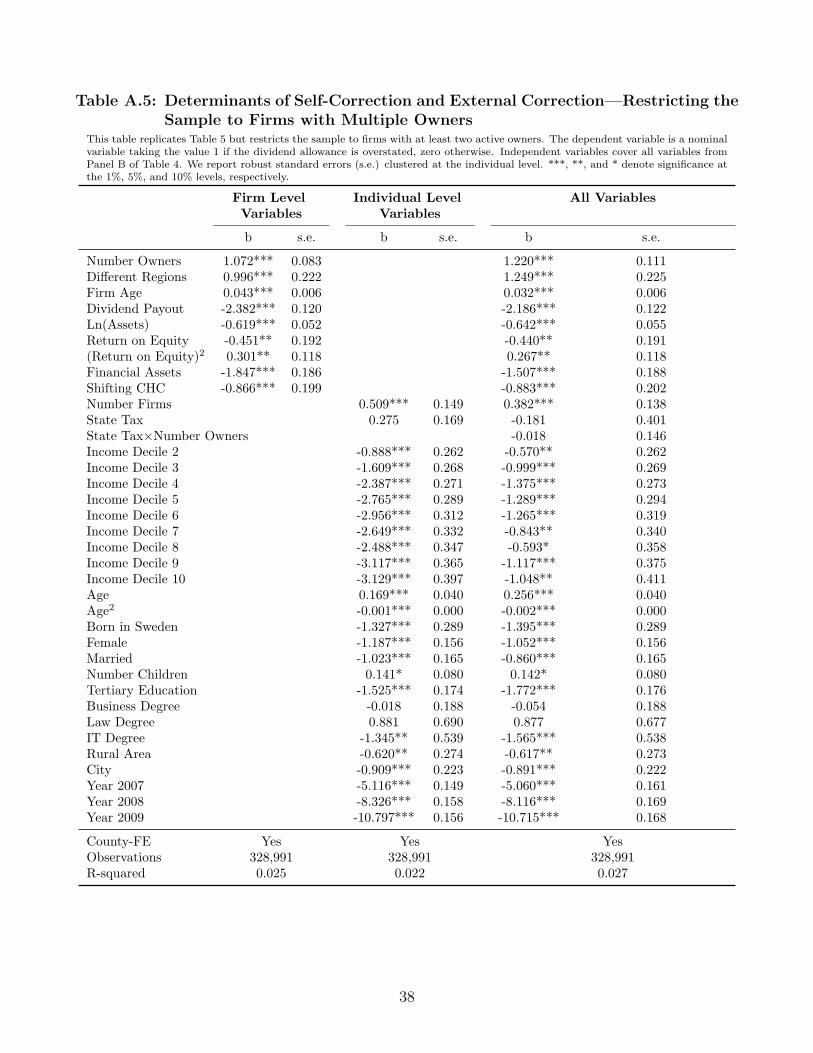
Table A.5: Determinants of Self-Correction and External Correction—Restricting theSample to Firms with Multiple Owners
This table replicates Table 5 but restricts the sample to firms with at least two active owners. The dependent variable is a nominalvariable taking the value 1 if the dividend allowance is overstated, zero otherwise. Independent variables cover all variables fromPanel B of Table 4. We report robust standard errors (s.e.) clustered at the individual level. ***, **, and * denote significance atthe 1%, 5%, and 10% levels, respectively.
Firm Level Individual Level All VariablesVariables Variables
b s.e. b s.e. b s.e.
Number Owners 1.072*** 0.083 1.220*** 0.111Different Regions 0.996*** 0.222 1.249*** 0.225Firm Age 0.043*** 0.006 0.032*** 0.006Dividend Payout -2.382*** 0.120 -2.186*** 0.122Ln(Assets) -0.619*** 0.052 -0.642*** 0.055Return on Equity -0.451** 0.192 -0.440** 0.191(Return on Equity)2 0.301** 0.118 0.267** 0.118Financial Assets -1.847*** 0.186 -1.507*** 0.188Shifting CHC -0.866*** 0.199 -0.883*** 0.202Number Firms 0.509*** 0.149 0.382*** 0.138State Tax 0.275 0.169 -0.181 0.401State Tax×Number Owners -0.018 0.146Income Decile 2 -0.888*** 0.262 -0.570** 0.262Income Decile 3 -1.609*** 0.268 -0.999*** 0.269Income Decile 4 -2.387*** 0.271 -1.375*** 0.273Income Decile 5 -2.765*** 0.289 -1.289*** 0.294Income Decile 6 -2.956*** 0.312 -1.265*** 0.319Income Decile 7 -2.649*** 0.332 -0.843** 0.340Income Decile 8 -2.488*** 0.347 -0.593* 0.358Income Decile 9 -3.117*** 0.365 -1.117*** 0.375Income Decile 10 -3.129*** 0.397 -1.048** 0.411Age 0.169*** 0.040 0.256*** 0.040Age2 -0.001*** 0.000 -0.002*** 0.000Born in Sweden -1.327*** 0.289 -1.395*** 0.289Female -1.187*** 0.156 -1.052*** 0.156Married -1.023*** 0.165 -0.860*** 0.165Number Children 0.141* 0.080 0.142* 0.080Tertiary Education -1.525*** 0.174 -1.772*** 0.176Business Degree -0.018 0.188 -0.054 0.188Law Degree 0.881 0.690 0.877 0.677IT Degree -1.345** 0.539 -1.565*** 0.538Rural Area -0.620** 0.274 -0.617** 0.273City -0.909*** 0.223 -0.891*** 0.222Year 2007 -5.116*** 0.149 -5.060*** 0.161Year 2008 -8.326*** 0.158 -8.116*** 0.169Year 2009 -10.797*** 0.156 -10.715*** 0.168
County-FE Yes Yes YesObservations 328,991 328,991 328,991R-squared 0.025 0.022 0.027
38
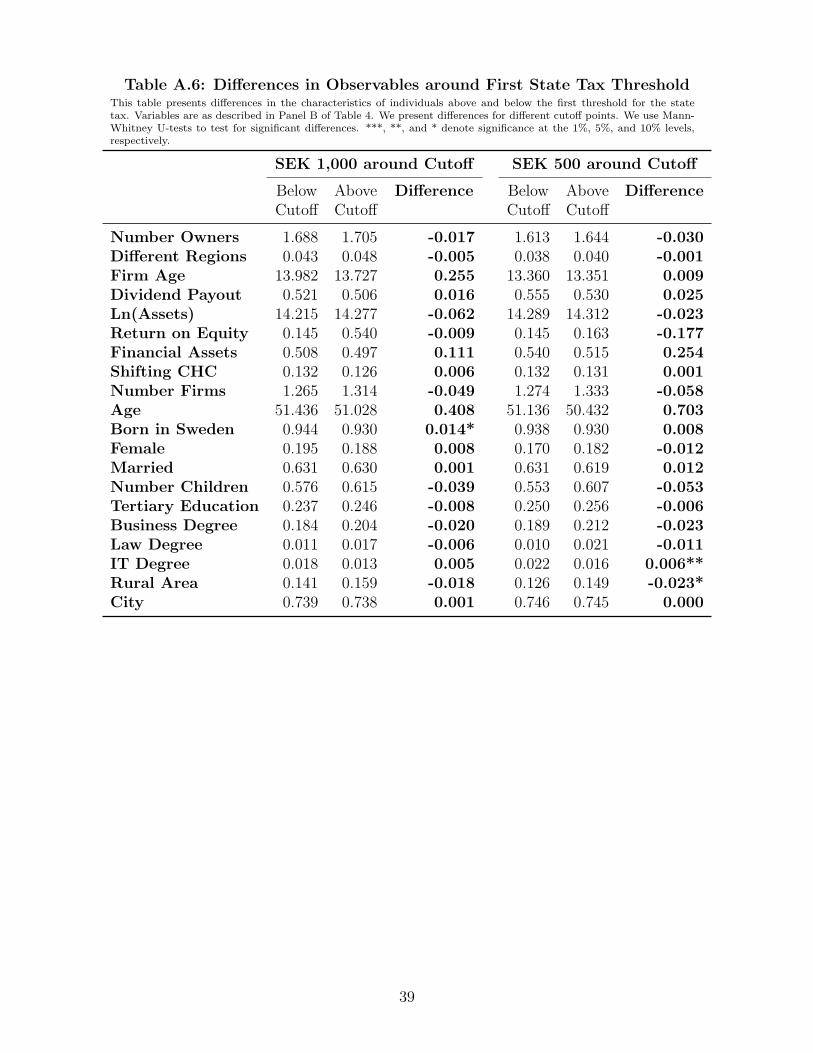
Table A.6: Differences in Observables around First State Tax ThresholdThis table presents differences in the characteristics of individuals above and below the first threshold for the statetax. Variables are as described in Panel B of Table 4. We present differences for different cutoff points. We use Mann-Whitney U-tests to test for significant differences. ***, **, and * denote significance at the 1%, 5%, and 10% levels,respectively.
SEK 1,000 around Cutoff SEK 500 around Cutoff
Below Above Difference Below Above DifferenceCutoff Cutoff Cutoff Cutoff
Number Owners 1.688 1.705 -0.017 1.613 1.644 -0.030Different Regions 0.043 0.048 -0.005 0.038 0.040 -0.001Firm Age 13.982 13.727 0.255 13.360 13.351 0.009Dividend Payout 0.521 0.506 0.016 0.555 0.530 0.025Ln(Assets) 14.215 14.277 -0.062 14.289 14.312 -0.023Return on Equity 0.145 0.540 -0.009 0.145 0.163 -0.177Financial Assets 0.508 0.497 0.111 0.540 0.515 0.254Shifting CHC 0.132 0.126 0.006 0.132 0.131 0.001Number Firms 1.265 1.314 -0.049 1.274 1.333 -0.058Age 51.436 51.028 0.408 51.136 50.432 0.703Born in Sweden 0.944 0.930 0.014* 0.938 0.930 0.008Female 0.195 0.188 0.008 0.170 0.182 -0.012Married 0.631 0.630 0.001 0.631 0.619 0.012Number Children 0.576 0.615 -0.039 0.553 0.607 -0.053Tertiary Education 0.237 0.246 -0.008 0.250 0.256 -0.006Business Degree 0.184 0.204 -0.020 0.189 0.212 -0.023Law Degree 0.011 0.017 -0.006 0.010 0.021 -0.011IT Degree 0.018 0.013 0.005 0.022 0.016 0.006**Rural Area 0.141 0.159 -0.018 0.126 0.149 -0.023*City 0.739 0.738 0.001 0.746 0.745 0.000
39
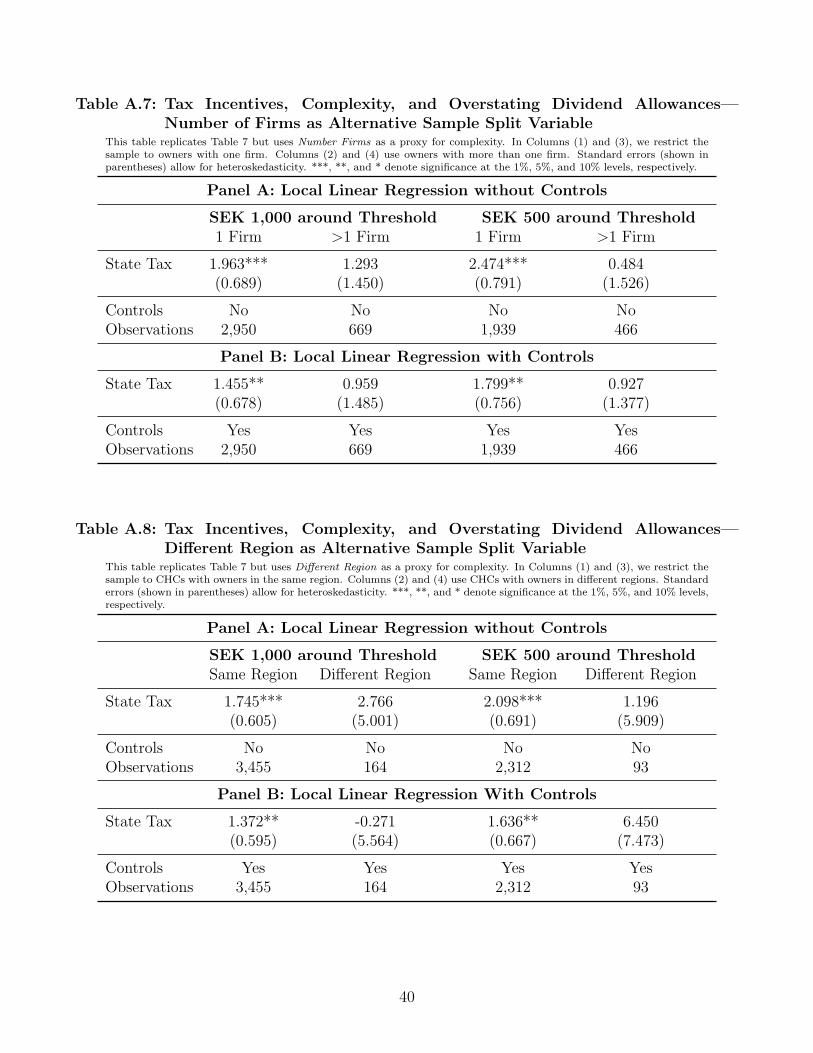
Table A.7: Tax Incentives, Complexity, and Overstating Dividend Allowances—Number of Firms as Alternative Sample Split Variable
This table replicates Table 7 but uses Number Firms as a proxy for complexity. In Columns (1) and (3), we restrict thesample to owners with one firm. Columns (2) and (4) use owners with more than one firm. Standard errors (shown inparentheses) allow for heteroskedasticity. ***, **, and * denote significance at the 1%, 5%, and 10% levels, respectively.
Panel A: Local Linear Regression without Controls
SEK 1,000 around Threshold SEK 500 around Threshold1 Firm >1 Firm 1 Firm >1 Firm
State Tax 1.963*** 1.293 2.474*** 0.484(0.689) (1.450) (0.791) (1.526)
Controls No No No NoObservations 2,950 669 1,939 466
Panel B: Local Linear Regression with Controls
State Tax 1.455** 0.959 1.799** 0.927(0.678) (1.485) (0.756) (1.377)
Controls Yes Yes Yes YesObservations 2,950 669 1,939 466
Table A.8: Tax Incentives, Complexity, and Overstating Dividend Allowances—Different Region as Alternative Sample Split Variable
This table replicates Table 7 but uses Different Region as a proxy for complexity. In Columns (1) and (3), we restrict thesample to CHCs with owners in the same region. Columns (2) and (4) use CHCs with owners in different regions. Standarderrors (shown in parentheses) allow for heteroskedasticity. ***, **, and * denote significance at the 1%, 5%, and 10% levels,respectively.
Panel A: Local Linear Regression without Controls
SEK 1,000 around Threshold SEK 500 around ThresholdSame Region Different Region Same Region Different Region
State Tax 1.745*** 2.766 2.098*** 1.196(0.605) (5.001) (0.691) (5.909)
Controls No No No NoObservations 3,455 164 2,312 93
Panel B: Local Linear Regression With Controls
State Tax 1.372** -0.271 1.636** 6.450(0.595) (5.564) (0.667) (7.473)
Controls Yes Yes Yes YesObservations 3,455 164 2,312 93
40