
Aptamers for targeted activation of T cell-mediated immunity · Aptamers for targeted activation of...
134
Aptamers for targeted activation of T cell-mediated immunity Dissertation zur Erlangung des Doktorgrades (Dr. rer. nat.) der Mathematisch-Naturwissenschaftlichen Fakultät der Rheinischen Friedrich-Wilhelms-Universität Bonn vorgelegt von Silvana Katharina Haßel, geb. Albers aus Bielefeld Bonn 2016
Transcript of Aptamers for targeted activation of T cell-mediated immunity · Aptamers for targeted activation of...
Aptamers for targeted activation of
T cell-mediated immunity
Dissertation
zur
Erlangung des Doktorgrades (Dr. rer. nat.)
der
Mathematisch-Naturwissenschaftlichen Fakultät
der
Rheinischen Friedrich-Wilhelms-Universität Bonn
vorgelegt von
Silvana Katharina Haßel, geb. Albers
aus
Bielefeld
Bonn 2016

Angefertigt mit Genehmigung der Mathematisch-Naturwissenschaftlichen Fakultät der
Rheinischen Friedrich-Wilhelms-Universität Bonn
1. Gutachter: Prof. Dr. Günter Mayer
2. Gutachter: Prof. Dr. Sven Burgdorf
Tag der Promotion: 16.08.2016
Erscheinungsjahr: 2016

Y≤Ü WÉÅ|Ç|Öâx? |Ç _|xux âÇw WtÇ~utÜ~x|à

Index
1 ABSTRACT ............................................................................................................ 9
2 ZUSAMMENFASSUNG ........................................................................................ 10
3 INTRODUCTION ................................................................................................... 12
3.1 The immune system .................................................................................................. 12
3.2 T cell-mediated immunity ......................................................................................... 13
3.2.1 T cell priming ........................................................................................................... 14
3.3 Dendritic cells ............................................................................................................ 16
3.3.1 Antigen presentation ............................................................................................... 17
3.3.1.1 MHC I-mediated antigen presentation to CD8 T cells ........................................... 18
3.3.1.2 MHC II-mediated antigen presentation to CD4 T cells .......................................... 19
3.3.2 Internalization mechanisms ..................................................................................... 21
3.4 DCs as targets for immunotherapy ......................................................................... 22
3.5 Aptamers .................................................................................................................... 25
3.5.1 Identification of aptamers ........................................................................................ 26
3.5.2 Cell-binding aptamers ............................................................................................. 27
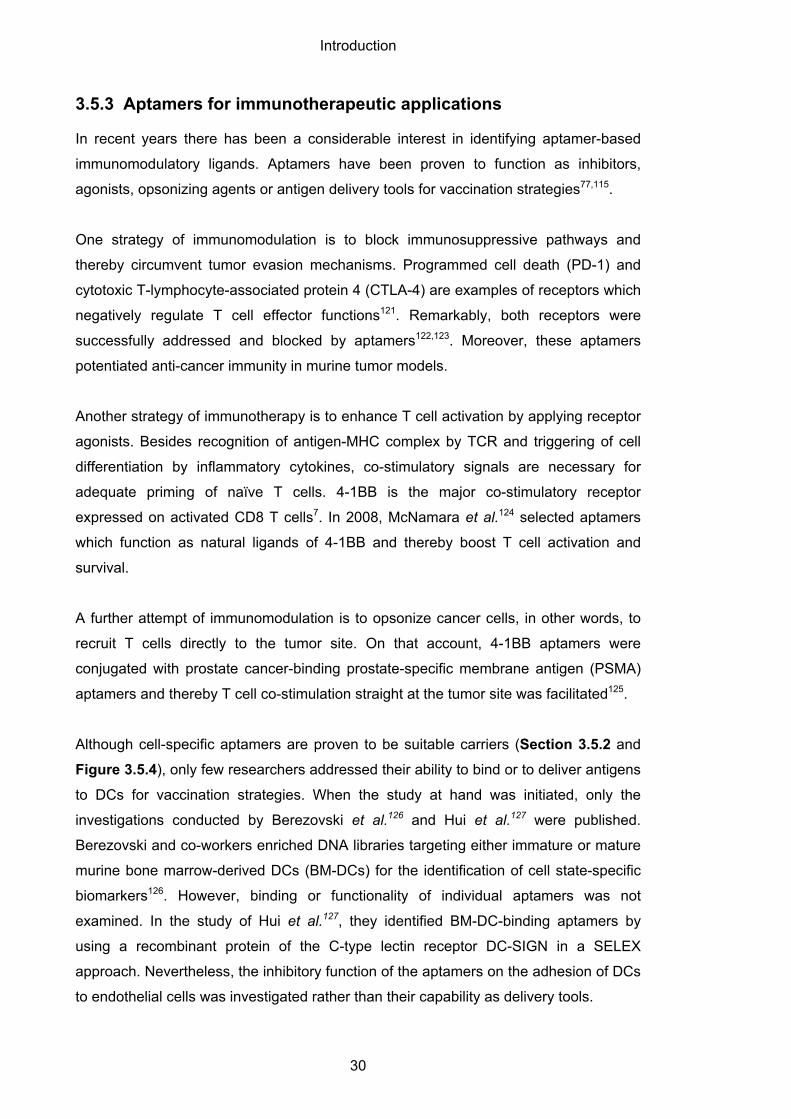
3.5.3 Aptamers for immunotherapeutic applications ........................................................ 30
3.6 Aims of the thesis ..................................................................................................... 31
4 RESULTS ............................................................................................................. 33
4.1 Identification of BM-DC targeting aptamers ........................................................... 33
4.1.1 Enrichment of DNA libraries targeting Fc-CTL and Fc-FN ..................................... 34
4.1.1.1 Selectivity of Fc-CTL and Fc-FN binding DNA libraries ........................................ 36
4.1.1.2 Identification of aptamer sequences obtained from protein-SELEX ...................... 37
4.1.1.3 Binding of Fc-CTL selected DNA sequences ........................................................ 38
4.1.2 Enrichment of DNA libraries in cell-SELEX ............................................................. 39
4.1.2.1 Identification of aptamer sequences obtained from cell-SELEX ........................... 41
4.1.2.2 Binding of selected DNA sequences to BM-DCs .................................................. 42
4.1.2.3 Analysis of cell-SELEX by NGS ............................................................................ 42
4.2 Characterization of BM-DC targeting aptamers ..................................................... 45
4.2.1 Binding and specificity of BM-DC-binding aptamers ............................................... 45
4.2.1.1 Binding of aptamers to BM-DCs ............................................................................ 45
4.2.1.2 Specificity of aptamers to BM-DCs ........................................................................ 46
4.2.2 CTL#5 specificity towards MR ................................................................................. 47
4.2.3 Internalization and cellular localization of BM-DC-binding aptamers ...................... 50
4.2.3.1 Internalization of aptamers by BM-DCs ................................................................. 50
4.2.3.2 Cellular localization of aptamers ........................................................................... 52
4.2.4 Immunogenicity of BM-DC-binding aptamers ......................................................... 54
4.3 Aptamer-targeted activation of T cell-mediated immunity ................................... 56
4.3.1 Synthesis and binding ability of aptamer-peptide conjugates ................................. 58
4.3.1.1 Coupling of aptamers and OVA peptides .............................................................. 58
4.3.1.2 Binding capability of aptamer-peptide conjugates ................................................. 59
4.3.2 Activation of T cell-mediated immunity .................................................................... 61
4.3.2.1 Aptamer-targeted activation of CD4 T cells ........................................................... 61
4.3.2.2 Cytotoxic capacity of activated CD4 T cells ........................................................... 63
4.3.2.3 Aptamer-targeted activation of CD8 T cells ........................................................... 64
4.3.2.4 Cytotoxic capacity of activated CD8 T cells ........................................................... 66
5 DISCUSSION ........................................................................................................ 68
5.1 Selection of DC-targeting aptamers ........................................................................ 68
5.1.1 Protein-SELEX ......................................................................................................... 68
5.1.2 Cell-SELEX .............................................................................................................. 71
5.2 Properties of DC-aptamers ....................................................................................... 71
5.2.1 Immunogenicity of aptamers .................................................................................... 72
5.2.2 CTL#5 specificity towards MR ................................................................................. 74
5.3 Aptamer-targeted activation of T cell-mediated immunity .................................... 74
5.3.1 Aptamer-targeted activation of CD4 T cells ............................................................. 74
5.3.2 Aptamer-targeted activation of CD8 T cells ............................................................. 76
5.4 Perspective for future research ............................................................................... 77
5.5 Concluding remarks .................................................................................................. 79
6 MATERIALS .......................................................................................................... 80
6.1 Equipment .................................................................................................................. 80
6.2 Consumables ............................................................................................................. 80
6.3 Chemicals and reagents ........................................................................................... 81
6.4 Commercially available kits ...................................................................................... 82
6.5 Buffers and solutions ................................................................................................ 83
6.5.1 Gel electrophoresis .................................................................................................. 83
6.5.2 Bacteria culture ........................................................................................................ 84
6.5.3 Flow cytometry ......................................................................................................... 84
6.5.4 SELEX ..................................................................................................................... 84
6.5.5 Cell culture ............................................................................................................... 84
6.6 Oligonucleotides ........................................................................................................ 84
6.7 Mouse strains ............................................................................................................. 86
6.8 Proteins ....................................................................................................................... 86
6.9 Antibodies .................................................................................................................. 87
7 METHODS ............................................................................................................. 88
7.1 Handling of nucleic acids ......................................................................................... 88
7.1.1 General handling and storage ................................................................................. 88
7.1.2 Agarose gel electrophoresis .................................................................................... 88
7.1.3 Polyacrylamide gel electrophoresis (PAGE) ............................................................ 88
7.1.4 Polymerase chain reaction (PCR) ........................................................................... 89
7.1.5 Reverse transcription-PCR (RT-PCR) ..................................................................... 90
7.1.6 Single strand displacement by lambda exonuclease digestion ............................... 90
7.1.7 In vitro transcription ................................................................................................. 91
7.1.8 Phenol/Chloroform extraction and ethanol precipitation ......................................... 92
7.1.9 Quantification .......................................................................................................... 92
7.1.10 32P-labeling of nucleic acids ................................................................................ 92
7.1.11 Cloning and sequencing ...................................................................................... 93
7.1.12 Next-generation sequencing (NGS) .................................................................... 94
7.2 Working with proteins and peptides ....................................................................... 96
7.2.1 General handling and storage ................................................................................. 96
7.2.2 SDS polyacrylamide gel electrophoresis (SDS PAGE)........................................... 96
7.2.3 Production of fusionproteins Fc-CTL and Fc-FN .................................................... 98
7.3 Handling of mice and cells ....................................................................................... 99
7.3.1 Mice ......................................................................................................................... 99
7.3.2 Cell culture .............................................................................................................. 99
7.3.3 Isolation and cultivation of bone marrow-derived dendritic cells (BM-DC) and macrophages (BM-macrophages) ...................................................................................... 99
7.3.4 Isolation and cultivation of splenocytes ................................................................... 99
7.3.5 Human peripheral blood mononuclear cells (PBMCs) ............................................ 99
7.4 SELEX ....................................................................................................................... 100
7.4.1 Coupling of Fc-fusionproteins to Protein G magnetic beads ................................ 100
7.4.2 Protein SELEX ...................................................................................................... 100
7.4.3 Cell-SELEX ........................................................................................................... 100
7.5 Characterization assays ......................................................................................... 101
7.5.1 Flow cytometry binding assay ............................................................................... 101
7.5.2 Radioactive binding assay .................................................................................... 102
7.5.2.1 Filter retention assay ........................................................................................... 102
7.5.2.2 Cell binding assay using Cherenkov protocol ..................................................... 102
7.5.3 Confocal microscopy ............................................................................................. 102
7.5.4 TNF-α HTRF assay ............................................................................................... 103
7.6 Generation of aptamer-peptide conjugates .......................................................... 103
7.6.1 Thiol-maleimide coupling ...................................................................................... 103
7.7 Functional assays ................................................................................................... 104
7.7.1 In vitro proliferation assay ..................................................................................... 104
7.7.2 In vitro cytotoxicity assay ...................................................................................... 104
7.8 Experimental analysis ............................................................................................ 105
7.8.1 Statistics ................................................................................................................ 105
8 REFERENCES .................................................................................................... 106
9 SUPPLEMENTARY DATA ................................................................................. 118
9.1 DNA sequences obtained from Fc-FN SELEX ...................................................... 118
9.2 DNA sequences derived from Fc-CTL SELEX ...................................................... 118
9.3 NGS analysis of DNA sequences obtained by cell-SELEX ................................. 119
9.4 Aptamer-targeted activation of CD4 T cells ......................................................... 122
9.5 Aptamer-targeted activation of CD8 T cells ......................................................... 125

9.6 Binding of CTL#5 to BM-macrophages ................................................................. 128
9.7 Binding of NGS patterns to BM-DCs ..................................................................... 129
9.8 Binding of BM-DC aptamers to human blood cells .............................................. 130
10 ABBREVIATIONS ............................................................................................... 131
11 DANKSAGUNG ................................................................................................... 133
Abstract
9
1 Abstract
An attractive way of preventing or curing infections and diseases is to mobilize patient’s
own defense mechanisms, the immune system. Treatments following this approach are
commonly known as immunotherapies. The development of protective long-term
immunity requires activation of the effectors of the adaptive immune system, in
particular T cells, by cells involved in innate immunity.
Dendritic cells (DCs) represent the interface between the non-specific innate immunity
and the highly specific adaptive immunity. Upon recognition of antigenic structures,
DCs deliver all signals necessary for adequate T cell priming. Hence, immunization
with DC-based vaccines became of utmost importance in immunotherapy. One
remarkable approach is to conjugate antigens to carrier molecules that specifically
target DCs.
In the study at hand, it was investigated if aptamers represent a promising novel class
of DC-targeting carriers for immunotherapeutic applications. Aptamers are nucleic
acids ligands with a defined shape that bind with high affinity and specificity to their
particular targets.
Herein, DC-binding aptamers were selected by two different strategies. First, aptamer
CTL#5 was identified by addressing recombinant proteins originated from the murine
mannose receptor (MR) in a protein-SELEX approach. The MR is an endocytic
receptor crucial in recognizing, uptake and processing of antigens by DCs. Second,
aptamers D#5 and D#7 were selected by directly using murine bone marrow-derived
DCs as complex targets in a cell-SELEX process.
It was demonstrated that the selected aptamers exhibit all properties to function as
suitable carriers. They bind specifically to DCs, are internalized and localized within
adequate antigen processing compartments and are low immunogenic.
Most importantly, the present study revealed that the selected aptamers are potent
mediators of targeted activation of specific T cells. By using an ovalbumin (OVA) model
system it was demonstrated that aptamer-based delivery of antigenic OVA peptides to
DCs resulted in a strong activation of OVA-specific CD4 or CD8 T cells.
In summary, the present thesis demonstrates the potential applicability of aptamers as
DC-targeting carriers and paves the way for the development of aptamer-based DC
vaccines for in vivo applications.
Zusammenfassung
10
2 Zusammenfassung
Das körpereigene Immunsystem von Patienten kann therapeutisch angeregt werden
zur Prävention und Heilung von Erkrankungen und Infektionen. Anwendungen dieser
Art sind allgemein bekannt als Immunotherapien. Ziel ist hierbei die Ausbildung einer
schützenden Langzeit-Immunität, die durch spezialisierte Effektorzellen des
erworbenen Immunsystems vermittelt wird. Diese sogenannten T-Zellen müssen
hierfür durch Zellen des angeborenen Immunsystems aktiviert werden.
Dendritische Zellen (DZ) repräsentieren die Interphase zwischen dem relativ
unspezifischen angeborenen Immunsystems und dem hoch-spezifischen erworbenen
Immunsystems. Diese Zellen erkennen antigene Strukturen und unterlaufen dabei
einen Reifungsprozess. Reife DZ generieren alle nötigen Signale, um T-Zellen optimal
zu aktivieren. Es besteht daher ein großes Interesse an DZ-basierten
Immunotherapien. Hervorzuheben ist hierbei die Vakzinierung mit Antigenen, die durch
Trägermoleküle spezifisch zu DZ transportiert werden.
Im Rahmen dieser Arbeit wurde untersucht, ob Aptamere eine neue Klasse an DZ-
spezifischen Trägermolekülen darstellen. Aptamere sind Nukleinsäure-Liganden, die
aufgrund ihrer Konformation affin und spezifisch an ihre Zielstruktur binden.
Zwei unterschiedliche Strategien wurden verfolgt, um die hier beschriebenen DZ-
bindenden Aptamere zu selektieren. Einerseits wurde Aptamer CTL#5 mit einer
Protein-SELEX Methode identifiziert. Rekombinante Proteine, die vom Mannose
Rezeptor (MR) stammen, wurden hierbei als Zielstruktur verwendet. Der MR ist ein
endozytischer Rezeptor und ist entscheidend für die Erkennung, Aufnahme und
Prozessierung von Antigenen durch DZ. Die Aptamere D#5 und D#7 wurden
andererseits durch die sogenannte Zell-SELEX Methode identifiziert, hierfür wurden DZ
isoliert aus dem Knochenmark von Mäusen als komplexe Zielstrukturen eingesetzt.
Es konnte gezeigt werden, dass die Aptamere alle notwendigen Eigenschaften als
Trägermoleküle besitzen. Sie binden spezifisch an DZ, werden internalisiert und
gelangen in adäquate Zellkompartimente, die wichtig für die Prozessierung von
Antigenen sind. Zudem sind die Aptamere nur schwach immunogen.
Abschließend wurde in dieser Arbeit demonstriert, dass die Aptamere zur
zielgerichteten Aktivierung von T-Zellen verwendet werden können. Durch Verwendung
eines Ovalbumin (OVA) Modellsystems konnte gezeigt werden, dass der Aptamer-
vermittelte Transport von antigenen OVA-Peptiden eine starke Aktivierung von OVA-
spezifischen CD4 oder CD8 T-Zellen auslöst.

Zusammenfassung
11
Die Ergebnisse der vorliegenden Arbeit zeigen deutlich die Verwendbarkeit von
Aptameren als DZ-spezifische Trägermoleküle und ebnen den Weg für die Entwicklung
einer Aptamer-basierten Vakzinierung von DZ in vivo.
Introduction
12
3 Introduction
A patient’s own immune system can be used to clear the body from infections,
diseases or cancer. Treatments following this approach are commonly known as
immunotherapies.
Already in the late 18th century the surgeon William B. Coley observed that cancer
disappeared in patients suffering severe bacterial infections. Therefore, he injected a
mix of attenuated Streptococcus pyogenes and Serratia marcescens into tumors of
patients and it is described that some patients experienced tumor reduction1.
Since then, much work has been carried out to identify the mechanisms of the immune
system and how these are applicable for therapeutic treatments.
3.1 The immune system
The mammalian immune system is a complex network of organs, cells and proteins. It
protects the host from invading pathogens like microorganisms and pollutants.
In general, the mammalian immune system is divided into innate and adaptive
immunity2. Initial defense mechanisms are mediated by the innate immunity. Various
components like physical barriers, innate immune cells, antimicrobial proteins,
complement and cytokines are involved in the rapid and relatively non-specific
response towards broad classes of pathogenic structures.
A key feature of the innate immunity is the discrimination between self and non-self
molecules. Monocytes, granulocytes, macrophages, dendritic cells (DCs) and natural
killer cells, for example, recognize highly conserved pathogen-associated molecular
patterns (PAMPs) by a range of pattern recognition receptors (PRRs)3. As a
consequence, these cells degrade ingested pathogens and secrete cytokines and
chemokines to promote inflammation. In turn, inflammation triggers the recruitment of
more immune cells and anti-microbial molecules such as complement to the site of
infection4. Innate immune responses occur within the first 96 hours of infections and
lead to the elimination of pathogens. The establishment of infection is thereby
hampered or retarded.
If the innate immunity is evaded or overwhelmed, an adaptive immune response is
required2. Adaptive immune responses take days rather than hours to develop and
Introduction
13
result in protective immunological memory formation. Consequently, upon exposure to
the same antigen, an amplified immune response is induced.
Specialized lymphocytes, namely B and T cells, are the effector cells of adaptive
immunity. They are activated by cells involved in innate immunity and realize highly
antigen-specific immunity. One discriminates between humoral and T cell-mediated
immunity. Activated B cells differentiate into antibody-producing plasma cells and
execute humoral immunity, whereby T cell-mediated immunity is initiated by activated T
cells. Activation of T cells is the critical event of most adaptive immune responses2.
3.2 T cell-mediated immunity
The transition between innate and adaptive immune responses is mediated by
specialized immune cells. These cells, including dendritic cells, macrophages and B
cells, are termed professional antigen-presenting cells (APCs). The interaction of APCs
with T cells in peripheral lymphoid tissues, i.e. lymph nodes, spleen and mucosal-
associated lymphoid tissues, initiates T cell-mediated immunity2.
During cell development, every T cell is equipped with a specific T cell receptor (TCR)
that recognizes a single antigenic structure bound to major histocompatibility complex
(MHC) molecules present on the surface of an activated APC. Remarkably, every
mammalian organism expresses millions of different TCR gene variants. On the
plasma membrane TCR pairs with CD4 or CD8 co-receptors2.
Naïve T cells continuously circulate through peripheral lymphoid tissues to encounter
their appropriate peptide-MHC complex presented on an activated APC. Consequently,
T cells undergo clonal expansion and differentiation into highly antigen-specific CD4 or
CD8 effector T cells. Activated CD8 T cells acquire cytotoxic capability, whereas CD4 T
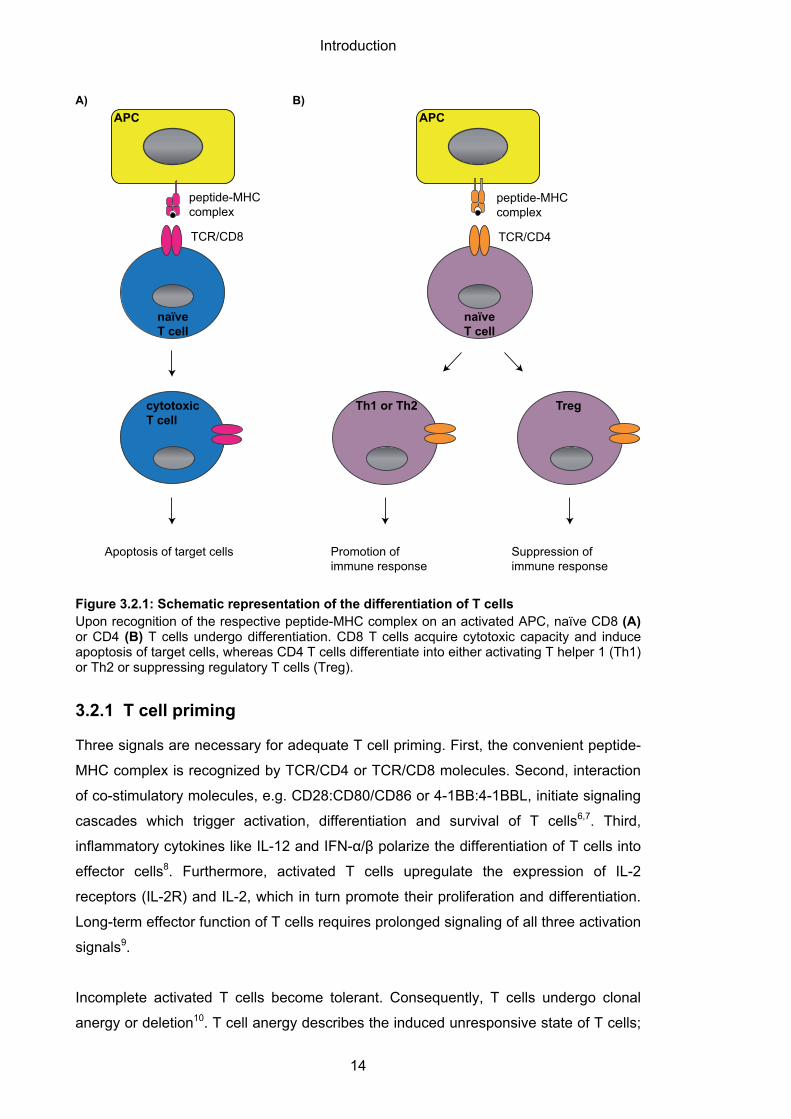
cells polarize into either activator or suppressor cells5 (Figure 3.2.1AB).
Cytotoxic CD8 T cells mediate apoptosis of target cells expressing the respective
antigen-MHC complex; in doing so, they either interact with death receptors such as
Fas or directly release cytotoxic granules like perforin and granzymes.
Activating CD4 T helper 1 (Th1) or Th2 cells promote the differentiation of B cells into
antibody-producing plasma cells or enhance the development of cytotoxic CD8 T cells,
while suppressing regulatory CD4 T cells negatively regulate the activation of T cells5.
Introduction
14
Figure 3.2.1: Schematic representation of the differentiation of T cells Upon recognition of the respective peptide-MHC complex on an activated APC, naïve CD8 (A) or CD4 (B) T cells undergo differentiation. CD8 T cells acquire cytotoxic capacity and induce apoptosis of target cells, whereas CD4 T cells differentiate into either activating T helper 1 (Th1) or Th2 or suppressing regulatory T cells (Treg).
3.2.1 T cell priming
Three signals are necessary for adequate T cell priming. First, the convenient peptide-
MHC complex is recognized by TCR/CD4 or TCR/CD8 molecules. Second, interaction
of co-stimulatory molecules, e.g. CD28:CD80/CD86 or 4-1BB:4-1BBL, initiate signaling
cascades which trigger activation, differentiation and survival of T cells6,7. Third,
inflammatory cytokines like IL-12 and IFN-α/β polarize the differentiation of T cells into
effector cells8. Furthermore, activated T cells upregulate the expression of IL-2
receptors (IL-2R) and IL-2, which in turn promote their proliferation and differentiation.
Long-term effector function of T cells requires prolonged signaling of all three activation
signals9.
Incomplete activated T cells become tolerant. Consequently, T cells undergo clonal
anergy or deletion10. T cell anergy describes the induced unresponsive state of T cells;
peptide-MHCcomplex
naïveT cell
APC
TCR/CD8
APC
naïveT cell
peptide-MHCcomplex
TCR/CD4
A) B)
cytotoxicT cell
Th1 or Th2 Treg
Suppression of immune response
Promotion of immune response
Apoptosis of target cells
Introduction
15
in other words, these cells fail to develop effector functions and additionally become
refractory to activation by the respective antigen even if adequate activation signals are
present. Apart from that, some incomplete activated T cells undergo clonal deletion
through activation-induced cell death initiated by e.g. Fas/Fas ligand-mediated
apoptosis11. After a brief period of activation and cell division, these T cells experience
apoptosis. Both mechanisms, anergy and deletion, are thought to maintain the
peripheral self-tolerance of mammals10.
After an infection is effectively repelled, some effector T cells undergo apoptosis and
are rapidly cleared by cells of the innate immunity. However, a small population of
effector cells persists as so-called memory T cells. These cells mediate long-lasting
immunological protection for a certain antigen. Upon re-infection, memory T cells
induce immediate and amplified immune responses12.
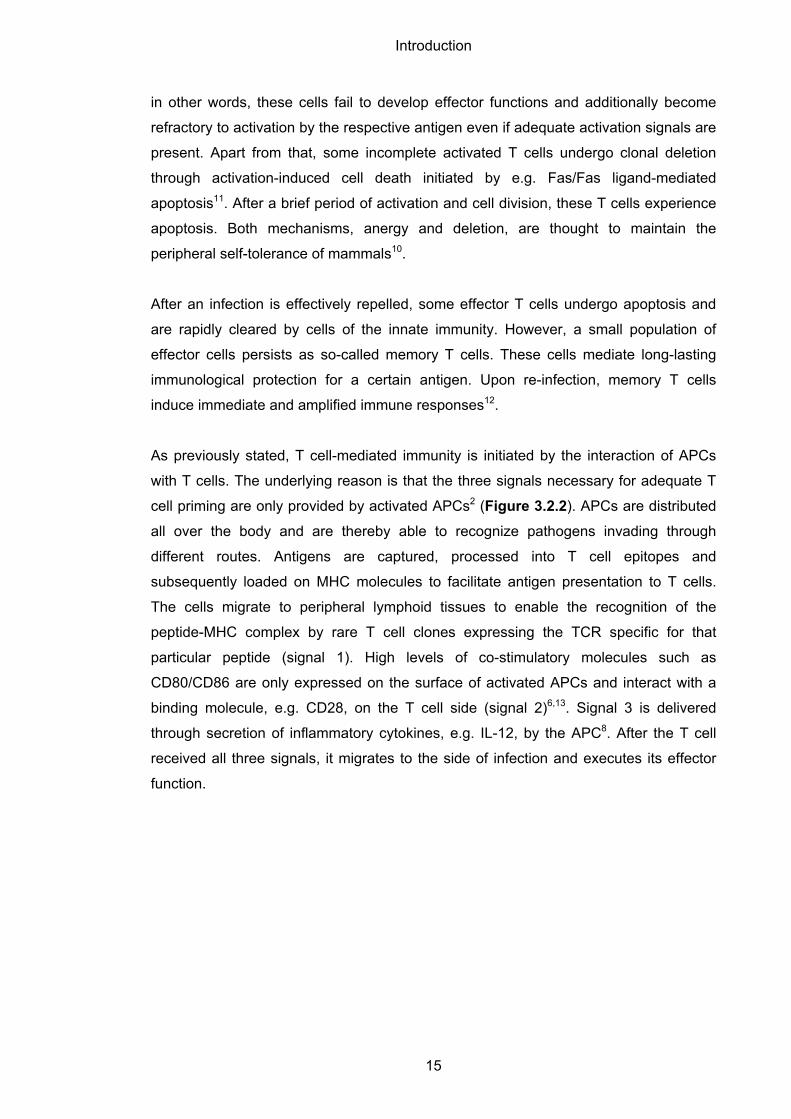
As previously stated, T cell-mediated immunity is initiated by the interaction of APCs
with T cells. The underlying reason is that the three signals necessary for adequate T
cell priming are only provided by activated APCs2 (Figure 3.2.2). APCs are distributed
all over the body and are thereby able to recognize pathogens invading through
different routes. Antigens are captured, processed into T cell epitopes and
subsequently loaded on MHC molecules to facilitate antigen presentation to T cells.
The cells migrate to peripheral lymphoid tissues to enable the recognition of the
peptide-MHC complex by rare T cell clones expressing the TCR specific for that
particular peptide (signal 1). High levels of co-stimulatory molecules such as
CD80/CD86 are only expressed on the surface of activated APCs and interact with a
binding molecule, e.g. CD28, on the T cell side (signal 2)6,13. Signal 3 is delivered
through secretion of inflammatory cytokines, e.g. IL-12, by the APC8. After the T cell
received all three signals, it migrates to the side of infection and executes its effector
function.
Introduction
16
Figure 3.2.2: Schematic representation of the priming of T cells Efficient T cell priming requires three signals delivered by an APC. First, the respective antigen bound to MHC molecules is presented by the APC and recognized by the TCR and, in this example, a CD8 co-receptor. Second, co-stimulatory molecules like CD80/CD86 and CD28 are expressed and interact. Third, the APC secretes inflammatory cytokines such as IL-12. The priming of T cells results in proliferation and clonal expansion, differentiation into effector cells and expression of IL-2 and IL-2R.
3.3 Dendritic cells
It is generally accepted that dendritic cells (DCs) are the most potent T cell activators
among the APCs14,15. DCs link the unspecific innate immunity to the antigen-specific
adaptive immunity by priming T cells.
DCs originate from both myeloid and lymphoid progenitors within the bone marrow.
Under non-inflammatory steady-state conditions immature DCs reside in most tissues
and continuously sample a wide array of pathogens13. Consequent to inflammatory
stimuli, DCs mature into professional APCs and thus acquire capability to initiate T cell-
mediated immunity.
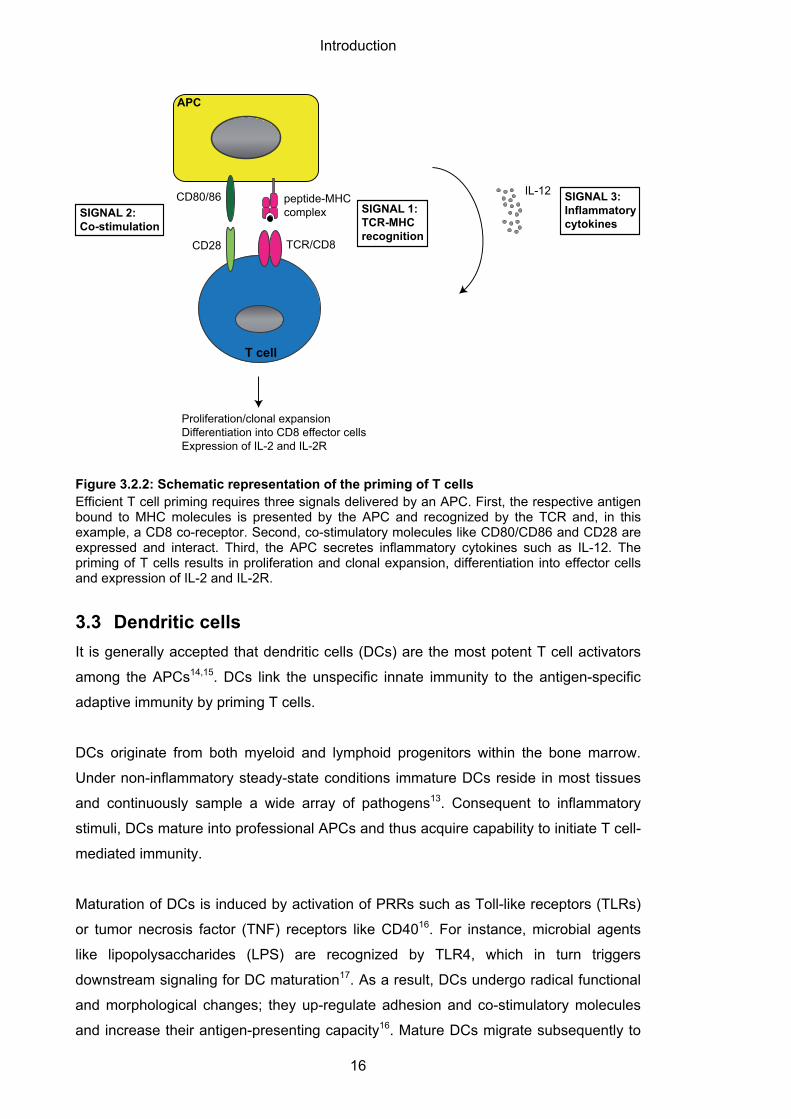
Maturation of DCs is induced by activation of PRRs such as Toll-like receptors (TLRs)
or tumor necrosis factor (TNF) receptors like CD4016. For instance, microbial agents
like lipopolysaccharides (LPS) are recognized by TLR4, which in turn triggers
downstream signaling for DC maturation17. As a result, DCs undergo radical functional
and morphological changes; they up-regulate adhesion and co-stimulatory molecules
and increase their antigen-presenting capacity16. Mature DCs migrate subsequently to
peptide-MHCcomplex
T cell
APC
TCR/CD8
CD80/86
CD28
IL-12
Proliferation/clonal expansionDifferentiation into CD8 effector cellsExpression of IL-2 and IL-2R
SIGNAL 1:TCR-MHCrecognition
SIGNAL 2:Co-stimulation
SIGNAL 3:Inflammatorycytokines
Introduction
17
peripheral lymphoid tissues to present peptide-MHC complexes to T cells (Figure
3.3.1A).
In the absence of inflammatory stimuli, DCs become tolerogenic upon pathogen
recognition. Tolerogenic DCs are deficient in adequate signaling for T cell activation or
they only deliver co-inhibitory signals18. Consequently, T cells become tolerant or
polarize into regulatory T cells (Figure 3.3.1B).
Figure 3.3.1: Schematic representation of the maturation of DCs Immature DCs recognize a wide array of pathogens. Dependent on the presence (A) or absence (B) of inflammatory stimuli such as lipopolysaccharides (LPS), DCs polarize into activating or tolerogenic DCs. The TLR4 ligand LPS triggers the expression of adhesion and co-stimulatory molecules and enhance the antigen-presenting capacity. Activating DCs activate T cells, whereas tolerogenic DCs induce T cell tolerance or the differentiation of T cells into regulatory T cells (Treg).
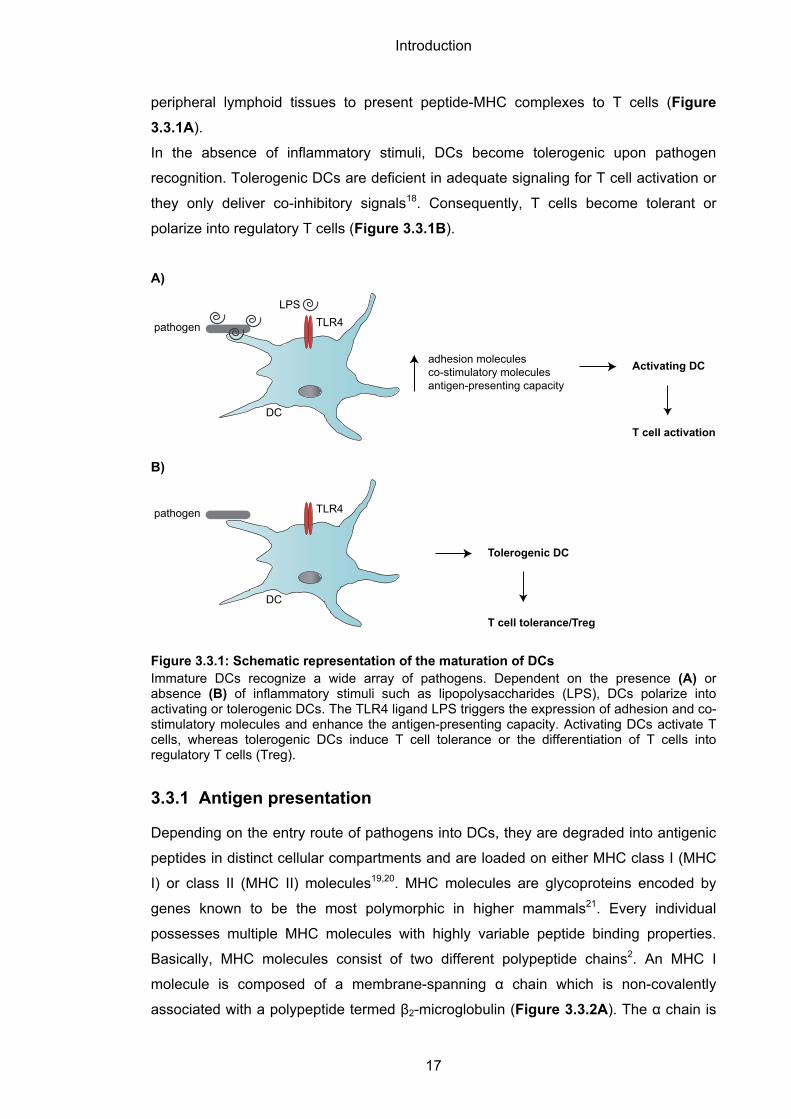
3.3.1 Antigen presentation
Depending on the entry route of pathogens into DCs, they are degraded into antigenic
peptides in distinct cellular compartments and are loaded on either MHC class I (MHC
I) or class II (MHC II) molecules19,20. MHC molecules are glycoproteins encoded by
genes known to be the most polymorphic in higher mammals21. Every individual
possesses multiple MHC molecules with highly variable peptide binding properties.
Basically, MHC molecules consist of two different polypeptide chains2. An MHC I
molecule is composed of a membrane-spanning α chain which is non-covalently
associated with a polypeptide termed β2-microglobulin (Figure 3.3.2A). The α chain is
TLR4LPS
pathogen
adhesion moleculesco-stimulatory moleculesantigen-presenting capacity
pathogen TLR4
Activating DC
DC
DC
Tolerogenic DC
A)
B)
T cell activation
T cell tolerance/Treg
Introduction
18
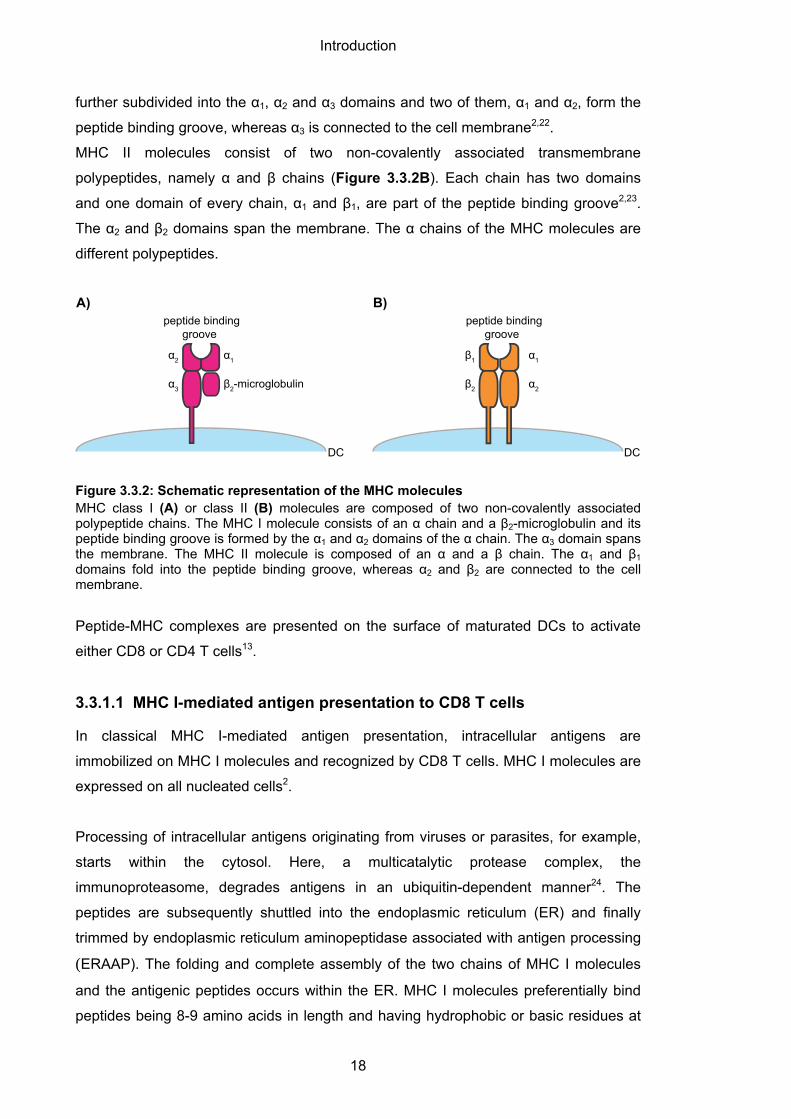
further subdivided into the α1, α2 and α3 domains and two of them, α1 and α2, form the
peptide binding groove, whereas α3 is connected to the cell membrane2,22.
MHC II molecules consist of two non-covalently associated transmembrane
polypeptides, namely α and β chains (Figure 3.3.2B). Each chain has two domains
and one domain of every chain, α1 and β1, are part of the peptide binding groove2,23.
The α2 and β2 domains span the membrane. The α chains of the MHC molecules are
different polypeptides.
Figure 3.3.2: Schematic representation of the MHC molecules MHC class I (A) or class II (B) molecules are composed of two non-covalently associated polypeptide chains. The MHC I molecule consists of an α chain and a β2-microglobulin and its peptide binding groove is formed by the α1 and α2 domains of the α chain. The α3 domain spans the membrane. The MHC II molecule is composed of an α and a β chain. The α1 and β1 domains fold into the peptide binding groove, whereas α2 and β2 are connected to the cell membrane.
Peptide-MHC complexes are presented on the surface of maturated DCs to activate
either CD8 or CD4 T cells13.
3.3.1.1 MHC I-mediated antigen presentation to CD8 T cells
In classical MHC I-mediated antigen presentation, intracellular antigens are
immobilized on MHC I molecules and recognized by CD8 T cells. MHC I molecules are
expressed on all nucleated cells2.
Processing of intracellular antigens originating from viruses or parasites, for example,
starts within the cytosol. Here, a multicatalytic protease complex, the
immunoproteasome, degrades antigens in an ubiquitin-dependent manner24. The
peptides are subsequently shuttled into the endoplasmic reticulum (ER) and finally
trimmed by endoplasmic reticulum aminopeptidase associated with antigen processing
(ERAAP). The folding and complete assembly of the two chains of MHC I molecules
and the antigenic peptides occurs within the ER. MHC I molecules preferentially bind
peptides being 8-9 amino acids in length and having hydrophobic or basic residues at
α1α2
α3 β2-microglobulin
peptide binding groove
DC
α1
α2
β1
β2
peptide binding groove
DC
A) B)
Introduction
19
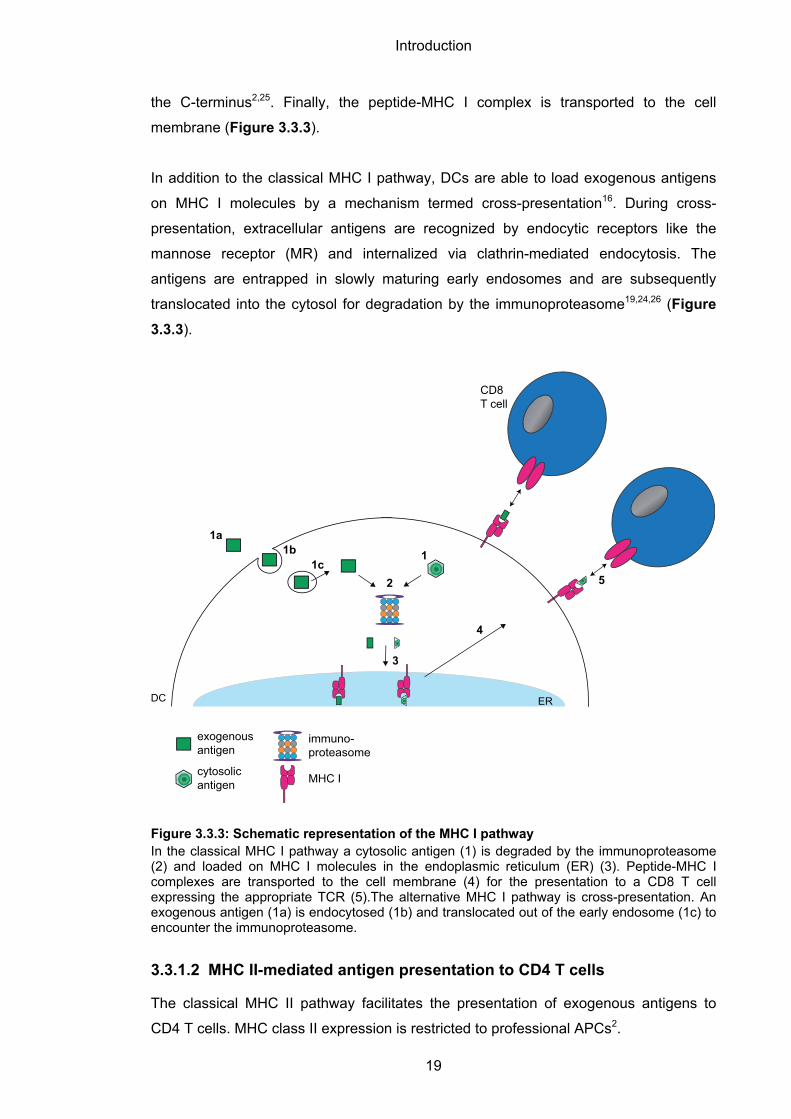
the C-terminus2,25. Finally, the peptide-MHC I complex is transported to the cell
membrane (Figure 3.3.3).
In addition to the classical MHC I pathway, DCs are able to load exogenous antigens
on MHC I molecules by a mechanism termed cross-presentation16. During cross-
presentation, extracellular antigens are recognized by endocytic receptors like the
mannose receptor (MR) and internalized via clathrin-mediated endocytosis. The
antigens are entrapped in slowly maturing early endosomes and are subsequently
translocated into the cytosol for degradation by the immunoproteasome19,24,26 (Figure
3.3.3).
Figure 3.3.3: Schematic representation of the MHC I pathway In the classical MHC I pathway a cytosolic antigen (1) is degraded by the immunoproteasome (2) and loaded on MHC I molecules in the endoplasmic reticulum (ER) (3). Peptide-MHC I complexes are transported to the cell membrane (4) for the presentation to a CD8 T cell expressing the appropriate TCR (5).The alternative MHC I pathway is cross-presentation. An exogenous antigen (1a) is endocytosed (1b) and translocated out of the early endosome (1c) to encounter the immunoproteasome.
3.3.1.2 MHC II-mediated antigen presentation to CD4 T cells
The classical MHC II pathway facilitates the presentation of exogenous antigens to
CD4 T cells. MHC class II expression is restricted to professional APCs2.
DC ER
CD8 T cell
exogenousantigen
cytosolicantigen
immuno-proteasome
MHC I
1
2
3
4
5
1b1c
1a
Introduction
20
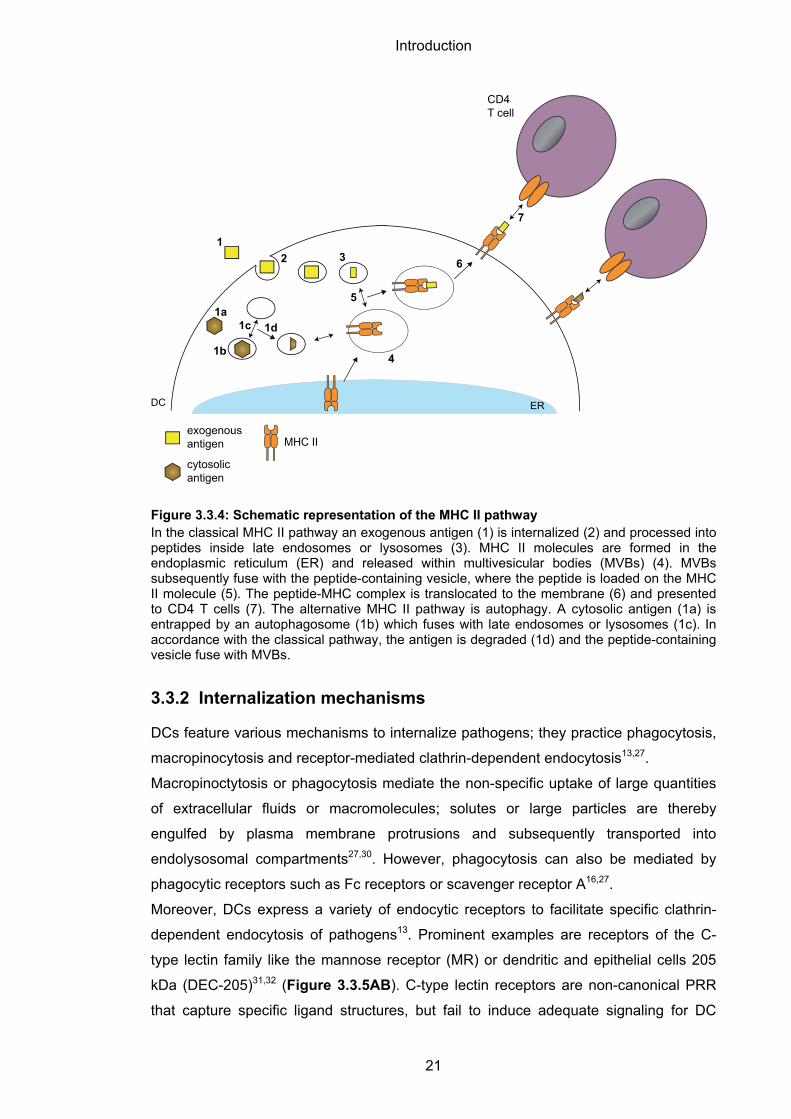
MHC II-restricted antigens are endocytosed by macropinocytosis, phagocytic or
endocytic receptors, and are degraded in late endosomes or lysosomes27. These late
endolysosomal antigen-processing compartments are enriched in acid proteases like
cathepsin S and L, and disulphide reductases2,27. The two chains of MHC II molecules
are assembled in the ER, the peptide binding groove is thereby blocked by a protein
so-called the invariant chain, and the whole complex is enclosed and released within
multivesicular bodies (MVBs)2. Subsequently, MVBs fuse with peptide-containing
vesicles, the invariant chain is degraded and supplemented by the antigenic peptide.
MHC II molecules bind peptides being at least 18 amino acids in length28. In the end,
the peptide-MHC II complex is inserted into the plasma membrane2,27 (Figure 3.3.4).
The classical MHC II pathway can be bypassed by a process named autophagy.
Cytosolic macromolecules and organelles that are entrapped within autophagosomes
are delivered to late endolysosomal antigen-processing compartments for
degradation27,29 (Figure 3.3.4).
Introduction
21
Figure 3.3.4: Schematic representation of the MHC II pathway In the classical MHC II pathway an exogenous antigen (1) is internalized (2) and processed into peptides inside late endosomes or lysosomes (3). MHC II molecules are formed in the endoplasmic reticulum (ER) and released within multivesicular bodies (MVBs) (4). MVBs subsequently fuse with the peptide-containing vesicle, where the peptide is loaded on the MHC II molecule (5). The peptide-MHC complex is translocated to the membrane (6) and presented to CD4 T cells (7). The alternative MHC II pathway is autophagy. A cytosolic antigen (1a) is entrapped by an autophagosome (1b) which fuses with late endosomes or lysosomes (1c). In accordance with the classical pathway, the antigen is degraded (1d) and the peptide-containing vesicle fuse with MVBs.
3.3.2 Internalization mechanisms
DCs feature various mechanisms to internalize pathogens; they practice phagocytosis,
macropinocytosis and receptor-mediated clathrin-dependent endocytosis13,27.
Macropinoctytosis or phagocytosis mediate the non-specific uptake of large quantities
of extracellular fluids or macromolecules; solutes or large particles are thereby
engulfed by plasma membrane protrusions and subsequently transported into
endolysosomal compartments27,30. However, phagocytosis can also be mediated by
phagocytic receptors such as Fc receptors or scavenger receptor A16,27.
Moreover, DCs express a variety of endocytic receptors to facilitate specific clathrin-
dependent endocytosis of pathogens13. Prominent examples are receptors of the C-
type lectin family like the mannose receptor (MR) or dendritic and epithelial cells 205
kDa (DEC-205)31,32 (Figure 3.3.5AB). C-type lectin receptors are non-canonical PRR
that capture specific ligand structures, but fail to induce adequate signaling for DC
DC ER
CD4 T cell
exogenousantigen
cytosolicantigen
MHC II
12 3
4
6
1a
1b
1c
5
7
1d
Introduction
22
maturation33. Basically, C-type lectins were identified to bind carbohydrates in a Ca2+-
dependent manner using highly conserved C-type lectin like domains (CTLDs)34. For
example, the MR is described to recognize glycan residues of various microorganisms
such as Candida albicans and Mycobacterium tuberculosis35. However, other C-type
lectin receptors such as DEC-205 were reported to express non-classical CTLDs
lacking the ability to bind carbohydrates31. The natural ligand for DEC-205 has not
been defined yet36.
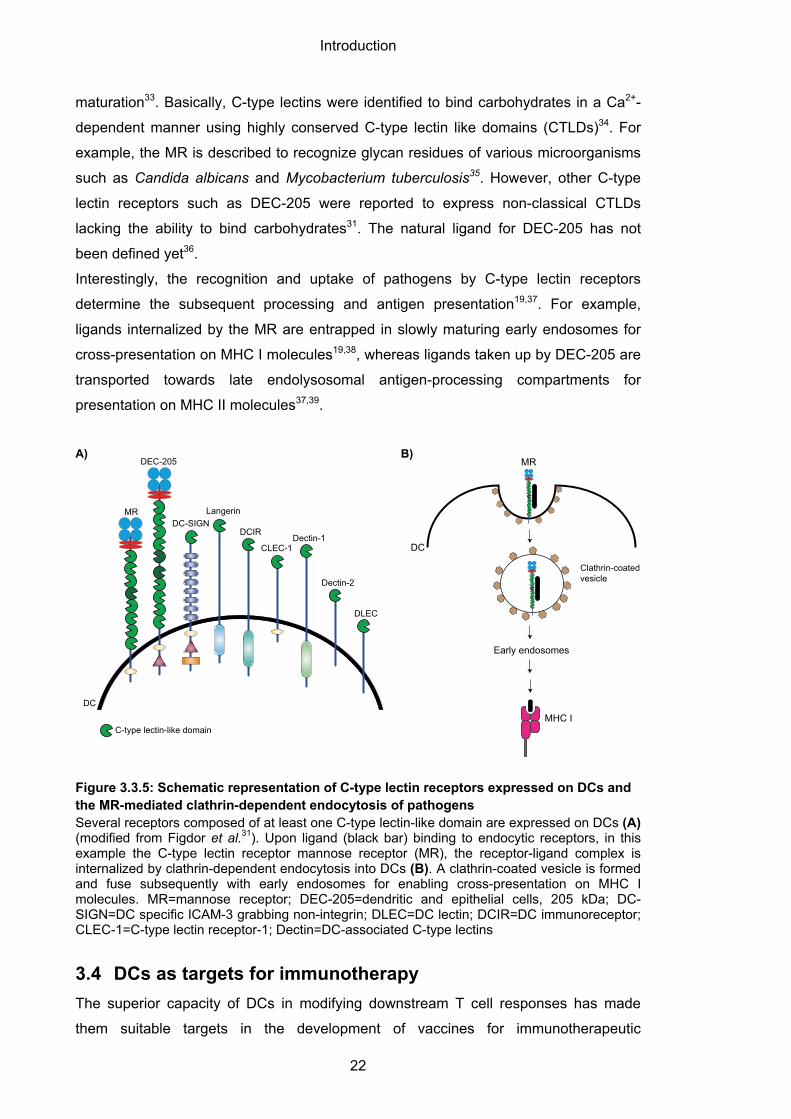
Interestingly, the recognition and uptake of pathogens by C-type lectin receptors
determine the subsequent processing and antigen presentation19,37. For example,
ligands internalized by the MR are entrapped in slowly maturing early endosomes for
cross-presentation on MHC I molecules19,38, whereas ligands taken up by DEC-205 are
transported towards late endolysosomal antigen-processing compartments for
presentation on MHC II molecules37,39.
Figure 3.3.5: Schematic representation of C-type lectin receptors expressed on DCs and the MR-mediated clathrin-dependent endocytosis of pathogens Several receptors composed of at least one C-type lectin-like domain are expressed on DCs (A) (modified from Figdor et al.31). Upon ligand (black bar) binding to endocytic receptors, in this example the C-type lectin receptor mannose receptor (MR), the receptor-ligand complex is internalized by clathrin-dependent endocytosis into DCs (B). A clathrin-coated vesicle is formed and fuse subsequently with early endosomes for enabling cross-presentation on MHC I molecules. MR=mannose receptor; DEC-205=dendritic and epithelial cells, 205 kDa; DC-SIGN=DC specific ICAM-3 grabbing non-integrin; DLEC=DC lectin; DCIR=DC immunoreceptor; CLEC-1=C-type lectin receptor-1; Dectin=DC-associated C-type lectins
3.4 DCs as targets for immunotherapy
The superior capacity of DCs in modifying downstream T cell responses has made
them suitable targets in the development of vaccines for immunotherapeutic
MR
DEC-205
DC-SIGNLangerin
DCIR
CLEC-1Dectin-1
Dectin-2
DLEC
C-type lectin-like domain
DC
Clathrin-coatedvesicle
DC
Early endosomes
MR
MHC I
A) B)
Introduction
23
applications. DC-based vaccines are currently under investigation for the prevention
and treatment of infections, cancer, allograft rejections or autoimmune diseases40-44. To
this end, DCs are either stimulated to become activating or tolerogenic (Figure
3.3.1AB). Immunologists follow different strategies to generate these
immunocompetent DCs. DCs are either pulsed ex vivo with antigens or targeted in situ
by different carriers coupled to antigens.
Autologous DCs are loaded ex vivo with antigens and reinfused into the patient.
Depending on the kind of co-delivered stimuli, DCs develop an activating or tolerogenic
phenotype.
To date, one DC-based vaccine, which is based on pulsed DCs, has been approved by
the Food and Drug Administration (FDA). Sipuleucel-T, sold under the trade name
Provenge®, is used in prostate cancer therapy45. For this purpose, autologous APCs
are isolated and activated ex vivo with the recombinant protein PA2024 consisting of
prostatic acid phosphatase (PAP) fused to granulocyte macrophage colony-stimulating
factor (GM-CSF). GM-CSF is a hematopoietic growth factor that initiates activation and
maturation of DCs13. Consequently, DCs up-regulate adhesion and co-stimulatory
molecules and increase their antigen-presenting capacity. PAP is a prostate-derived
enzyme which is often up-regulated in prostate cancers46. Although the precise
mechanism of action of sipuleucel-T is not defined yet, it was demonstrated that the
PA2024 fusion protein is internalized, processed and presented by DCs47,48. Upon re-
infusion, a T cell-mediated anti-tumor immune response is initiated48. Because of the
high treatment costs of $ 104,534 (around € 93,000) for the three prescribed
infusions49, the marketing authorization of sipuleucel-T in the European Union was
withdrawn by the European Commission in 201550.
Ex vivo generation of tolerant DCs has also been tested for the treatment of several
autoimmune diseases. For example, DCs isolated from patients suffering multiple
sclerosis were incubated with a tolerogenicity-inducing vitamin D3 metabolite in addition
to myelin peptides as specific self-antigen51. As a result, DCs developed a tolerogenic
phenotype and mediated anergy of myelin-reactive T cells.
Much work on the potential of ex vivo pulsed DCs has been carried out40,42,43,52,
however there are still some critical issues. For example, it is proven to be difficult to
sufficiently recapitulate DC maturation ex vivo52 and ex vivo induced tolerogenicity of
DCs was observed to be rapidly inverted into an activating phenotype after reinfusion
into the patient53. Moreover, treatments with ex vivo pulsed DCs can result in the
development of severe autoimmune diseases54-56.
Introduction
24
Therefore, enabling DC-based vaccination in their natural environment in vivo is a
major goal in the field of DC-based immunotherapy. For this purpose, carrier molecules
were applied to deliver antigens specifically to DCs. Often, monoclonal antibodies
targeting DC surface molecules such as C-type lectin receptors, are used and two are
currently investigated in clinical trials44,57 (Table 3-1). For example, vaccination with the
mannose receptor antibody CDX-1307 is currently tested in phase II clinical trial for the
treatment of muscle-invasive bladder cancer58. CDX-1307 consists of a human anti-MR
monoclonal antibody fused to the human chorionic gonadotropin beta-chain, a tumor
antigen frequently expressed by epithelial tumors59. When co-administered with the
hematopoietic growth factor GM-CSF and TLR agonists, CDX-1307 induces activation
of APCs and subsequent activation of a T cell-mediated anti-tumor immune
response58,60.
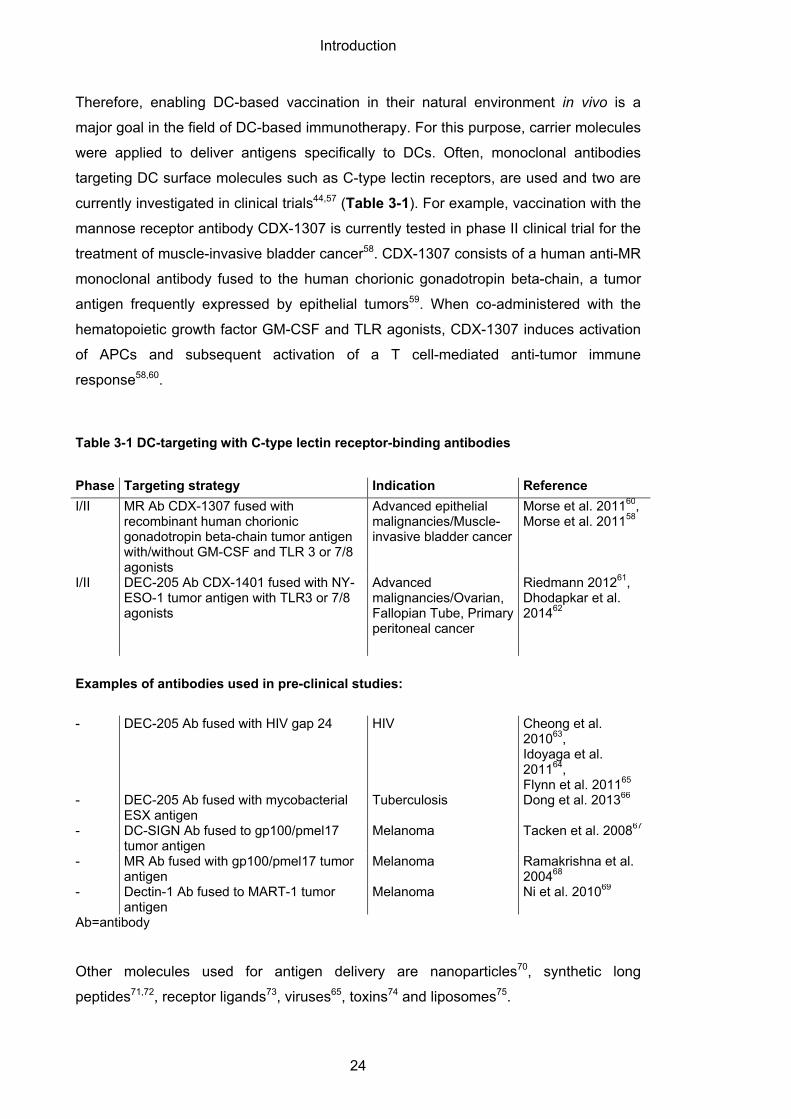
Table 3-1 DC-targeting with C-type lectin receptor-binding antibodies
Phase Targeting strategy Indication Reference
I/II MR Ab CDX-1307 fused with recombinant human chorionic gonadotropin beta-chain tumor antigen with/without GM-CSF and TLR 3 or 7/8 agonists
Advanced epithelial malignancies/Muscle-invasive bladder cancer
Morse et al. 201160, Morse et al. 201158
I/II DEC-205 Ab CDX-1401 fused with NY-ESO-1 tumor antigen with TLR3 or 7/8 agonists
Advanced malignancies/Ovarian, Fallopian Tube, Primary peritoneal cancer
Riedmann 201261, Dhodapkar et al. 201462
Examples of antibodies used in pre-clinical studies:
- DEC-205 Ab fused with HIV gap 24 HIV Cheong et al. 201063, Idoyaga et al. 201164, Flynn et al. 201165
- DEC-205 Ab fused with mycobacterial ESX antigen
Tuberculosis Dong et al. 201366
- DC-SIGN Ab fused to gp100/pmel17 tumor antigen
Melanoma Tacken et al. 200867
- MR Ab fused with gp100/pmel17 tumor antigen
Melanoma Ramakrishna et al. 200468
- Dectin-1 Ab fused to MART-1 tumor antigen
Melanoma Ni et al. 201069
Ab=antibody
Other molecules used for antigen delivery are nanoparticles70, synthetic long
peptides71,72, receptor ligands73, viruses65, toxins74 and liposomes75.
Introduction
25
Even though more than 100 DC-targeting studies were published so far44, efficient and
specific delivery of antigens remains a challenge. The reasons are multifarious.
Carriers like antibodies, viruses or toxins, for example, exhibit intrinsic
immunostimulatory potential and, thus, increase the risk of adverse side effects41,76.
Furthermore, the design and development of some carrier molecules are pricey, time-
consuming and associated with technical challenges41,77,78. For example, the
generation and screening of monoclonal antibodies is time-consuming and
expensive77,78 and liposomal vesicles have critical stability issues41. Moreover, the
shelf-life of antibodies or proteins is limited and cell-based products like antibodies are
difficult to process into clinical grade reagents with invariable quality41. Last, liposomes
and nanoparticles lack specificity for DCs and they are internalized by highly
phagocytically active macrophages rather than by DCs79.
Obviously, there is a need for eligible carriers and a promising alternative are nucleic
acids ligands, known as aptamers.
3.5 Aptamers
In general, aptamers are nucleic acids, which bind target molecules with high specificity
and affinity80. They adopt unique conformations like stems, loops, hairpins or
quadruplexes that enable the specific interaction with their targets81,82. Aptamer-target
interactions are mediated through pi-stacking of aromatic rings, electrostatic and van
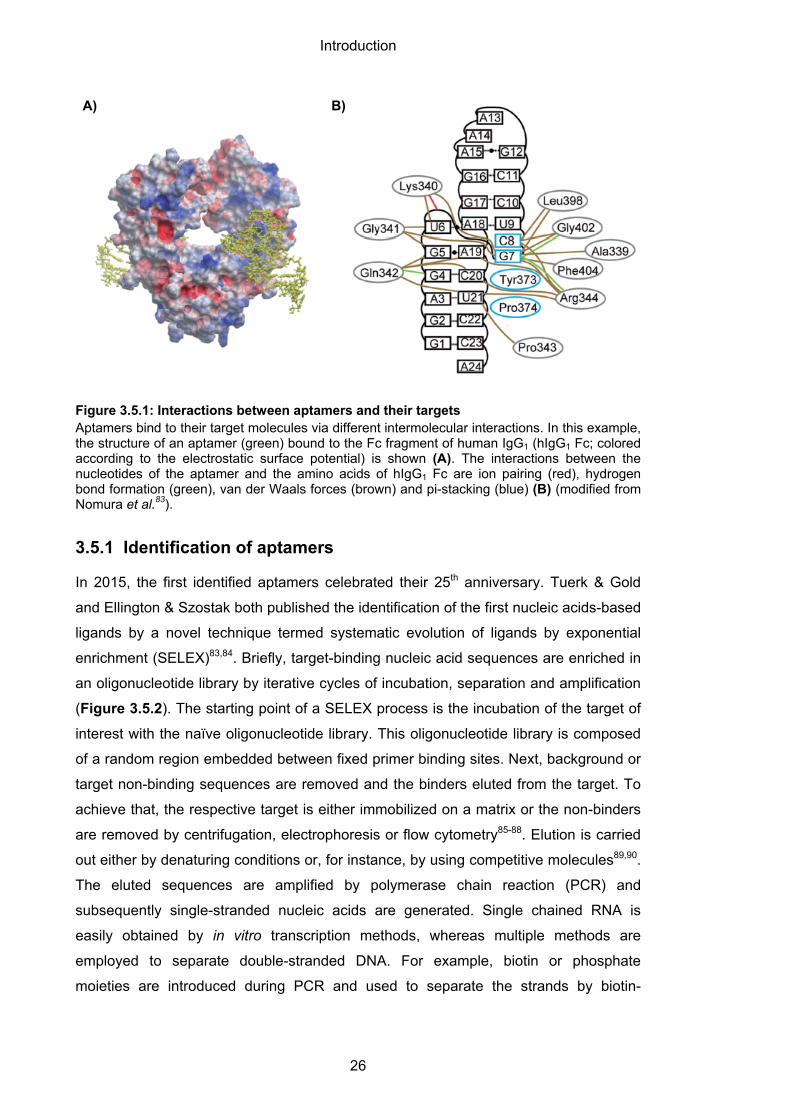
der Waals forces, or by hydrogen bond formation81 (Figure 3.5.1AB).
Introduction
26
Figure 3.5.1: Interactions between aptamers and their targets Aptamers bind to their target molecules via different intermolecular interactions. In this example, the structure of an aptamer (green) bound to the Fc fragment of human IgG1 (hIgG1 Fc; colored according to the electrostatic surface potential) is shown (A). The interactions between the nucleotides of the aptamer and the amino acids of hIgG1 Fc are ion pairing (red), hydrogen bond formation (green), van der Waals forces (brown) and pi-stacking (blue) (B) (modified from Nomura et al.83).
3.5.1 Identification of aptamers
In 2015, the first identified aptamers celebrated their 25th anniversary. Tuerk & Gold
and Ellington & Szostak both published the identification of the first nucleic acids-based
ligands by a novel technique termed systematic evolution of ligands by exponential
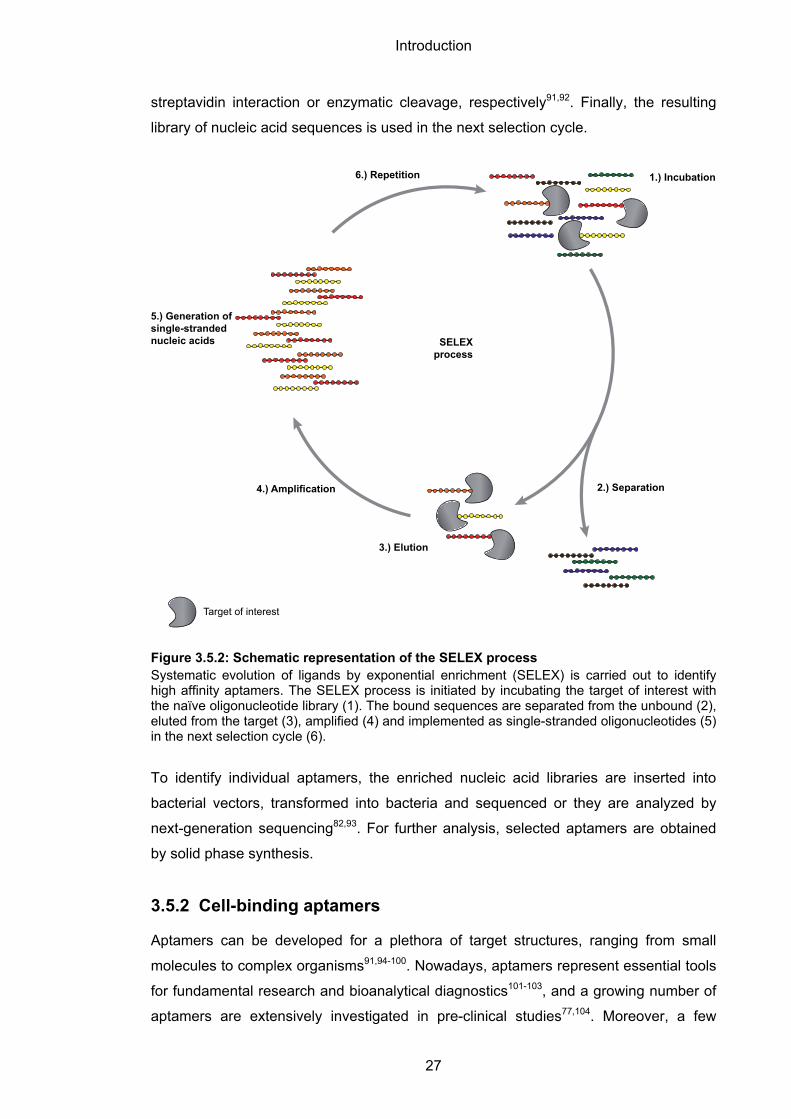
enrichment (SELEX)83,84. Briefly, target-binding nucleic acid sequences are enriched in
an oligonucleotide library by iterative cycles of incubation, separation and amplification
(Figure 3.5.2). The starting point of a SELEX process is the incubation of the target of
interest with the naïve oligonucleotide library. This oligonucleotide library is composed
of a random region embedded between fixed primer binding sites. Next, background or
target non-binding sequences are removed and the binders eluted from the target. To
achieve that, the respective target is either immobilized on a matrix or the non-binders
are removed by centrifugation, electrophoresis or flow cytometry85-88. Elution is carried
out either by denaturing conditions or, for instance, by using competitive molecules89,90.
The eluted sequences are amplified by polymerase chain reaction (PCR) and
subsequently single-stranded nucleic acids are generated. Single chained RNA is
easily obtained by in vitro transcription methods, whereas multiple methods are
employed to separate double-stranded DNA. For example, biotin or phosphate
moieties are introduced during PCR and used to separate the strands by biotin-
A) B)
Introduction
27
streptavidin interaction or enzymatic cleavage, respectively91,92. Finally, the resulting
library of nucleic acid sequences is used in the next selection cycle.
Figure 3.5.2: Schematic representation of the SELEX process Systematic evolution of ligands by exponential enrichment (SELEX) is carried out to identify high affinity aptamers. The SELEX process is initiated by incubating the target of interest with the naïve oligonucleotide library (1). The bound sequences are separated from the unbound (2), eluted from the target (3), amplified (4) and implemented as single-stranded oligonucleotides (5) in the next selection cycle (6).
To identify individual aptamers, the enriched nucleic acid libraries are inserted into
bacterial vectors, transformed into bacteria and sequenced or they are analyzed by
next-generation sequencing82,93. For further analysis, selected aptamers are obtained
by solid phase synthesis.
3.5.2 Cell-binding aptamers
Aptamers can be developed for a plethora of target structures, ranging from small
molecules to complex organisms91,94-100. Nowadays, aptamers represent essential tools
for fundamental research and bioanalytical diagnostics101-103, and a growing number of
aptamers are extensively investigated in pre-clinical studies77,104. Moreover, a few
1.) Incubation
2.) Separation4.) Amplification
6.) Repetition
SELEXprocess
Target of interest
3.) Elution
5.) Generation ofsingle-strandednucleic acids
Introduction
28
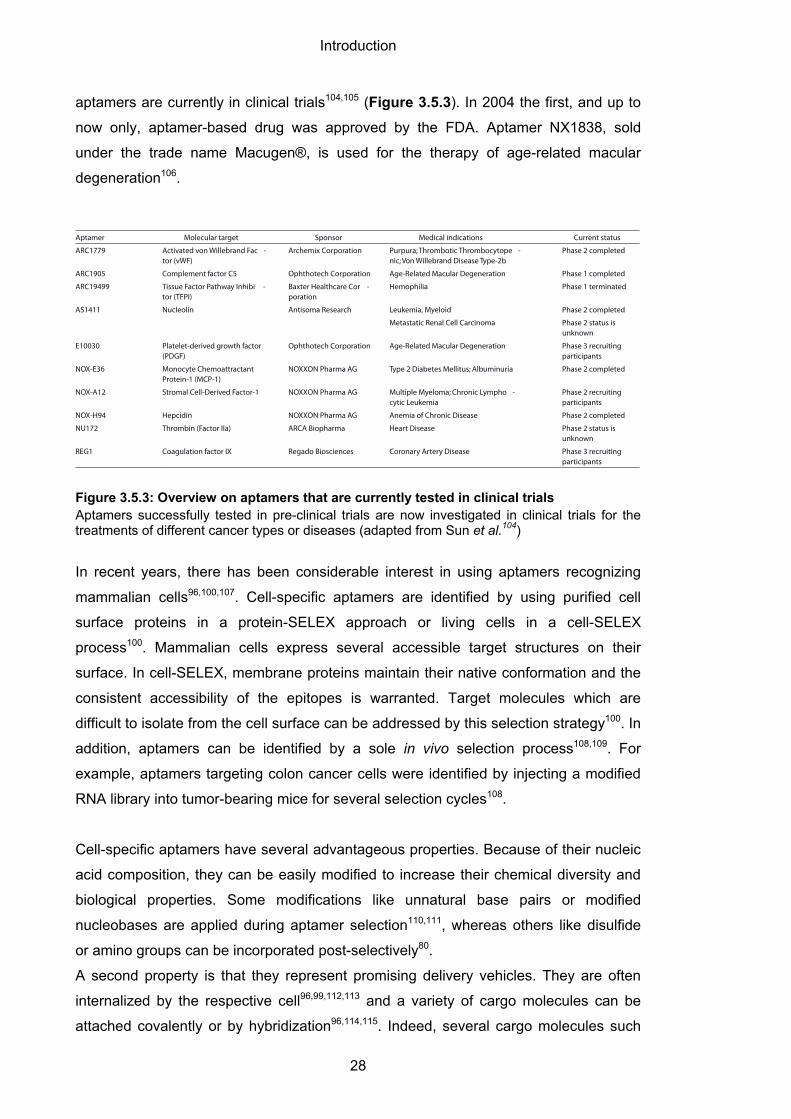
aptamers are currently in clinical trials104,105 (Figure 3.5.3). In 2004 the first, and up to
now only, aptamer-based drug was approved by the FDA. Aptamer NX1838, sold
under the trade name Macugen®, is used for the therapy of age-related macular
degeneration106.
Figure 3.5.3: Overview on aptamers that are currently tested in clinical trials Aptamers successfully tested in pre-clinical trials are now investigated in clinical trials for the treatments of different cancer types or diseases (adapted from Sun et al.104)
In recent years, there has been considerable interest in using aptamers recognizing
mammalian cells96,100,107. Cell-specific aptamers are identified by using purified cell
surface proteins in a protein-SELEX approach or living cells in a cell-SELEX
process100. Mammalian cells express several accessible target structures on their
surface. In cell-SELEX, membrane proteins maintain their native conformation and the
consistent accessibility of the epitopes is warranted. Target molecules which are
difficult to isolate from the cell surface can be addressed by this selection strategy100. In
addition, aptamers can be identified by a sole in vivo selection process108,109. For
example, aptamers targeting colon cancer cells were identified by injecting a modified
RNA library into tumor-bearing mice for several selection cycles108.
Cell-specific aptamers have several advantageous properties. Because of their nucleic
acid composition, they can be easily modified to increase their chemical diversity and
biological properties. Some modifications like unnatural base pairs or modified
nucleobases are applied during aptamer selection110,111, whereas others like disulfide
or amino groups can be incorporated post-selectively80.
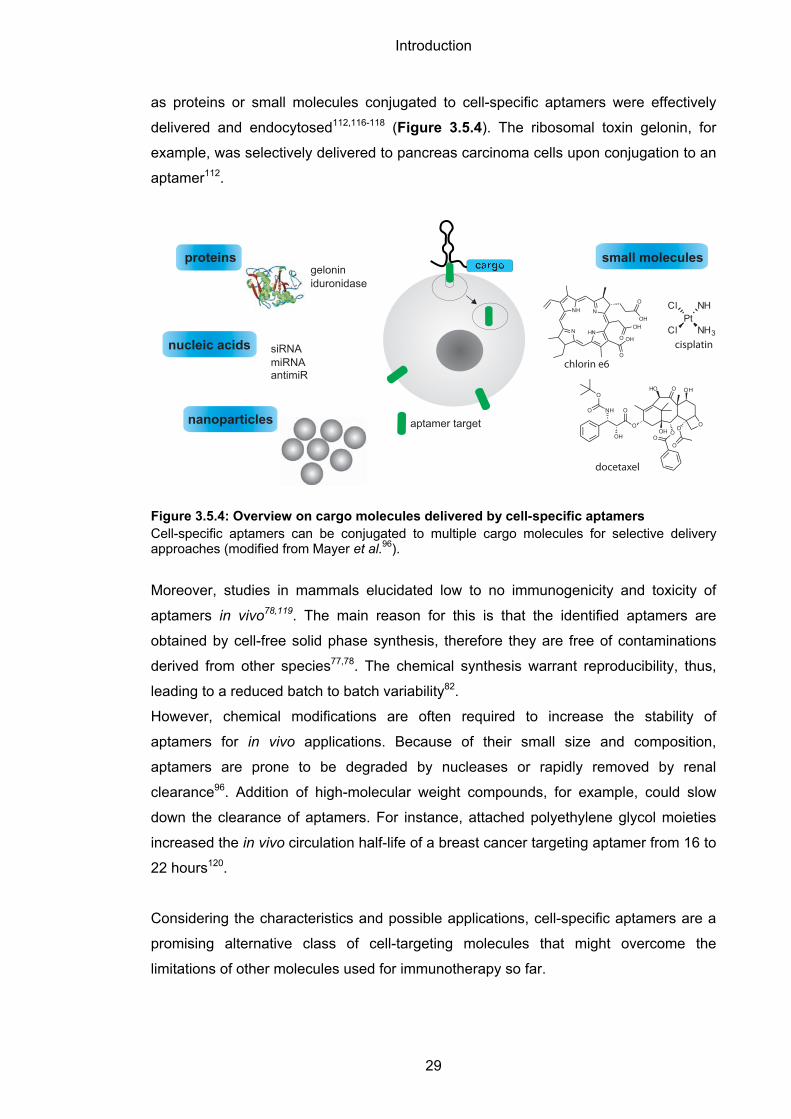
A second property is that they represent promising delivery vehicles. They are often
internalized by the respective cell96,99,112,113 and a variety of cargo molecules can be
attached covalently or by hybridization96,114,115. Indeed, several cargo molecules such
Aptamer Molecular target Sponsor Medical indications Current status
ARC1779 Activated von Willebrand Fac -tor (vWF)
Archemix Corporation Purpura; Thrombotic Thrombocytope -nic; Von Willebrand Disease Type-2b
Phase 2 completed
ARC1905 Complement factor C5 Ophthotech Corporation Age-Related Macular Degeneration Phase 1 completed
ARC19499 Tissue Factor Pathway Inhibi -tor (TFPI)
Baxter Healthcare Cor -poration
Hemophilia Phase 1 terminated
AS1411 Nucleolin Antisoma Research Leukemia, Myeloid Phase 2 completed
Metastatic Renal Cell Carcinoma Phase 2 status is unknown
E10030 Platelet-derived growth factor (PDGF)
Ophthotech Corporation Age-Related Macular Degeneration Phase 3 recruiting participants
NOX-E36 Monocyte Chemoattractant Protein-1 (MCP-1)
NOXXON Pharma AG Type 2 Diabetes Mellitus; Albuminuria Phase 2 completed
NOX-A12 Stromal Cell-Derived Factor-1 NOXXON Pharma AG Multiple Myeloma; Chronic Lympho -cytic Leukemia
Phase 2 recruiting participants
NOX-H94 Hepcidin NOXXON Pharma AG Anemia of Chronic Disease Phase 2 completed
NU172 Thrombin (Factor IIa) ARCA Biopharma Heart Disease Phase 2 status is unknown
REG1 Coagulation factor IX Regado Biosciences Coronary Artery Disease Phase 3 recruiting participants
Introduction
29
as proteins or small molecules conjugated to cell-specific aptamers were effectively
delivered and endocytosed112,116-118 (Figure 3.5.4). The ribosomal toxin gelonin, for
example, was selectively delivered to pancreas carcinoma cells upon conjugation to an
aptamer112.
Figure 3.5.4: Overview on cargo molecules delivered by cell-specific aptamers Cell-specific aptamers can be conjugated to multiple cargo molecules for selective delivery approaches (modified from Mayer et al.96).
Moreover, studies in mammals elucidated low to no immunogenicity and toxicity of
aptamers in vivo78,119. The main reason for this is that the identified aptamers are
obtained by cell-free solid phase synthesis, therefore they are free of contaminations
derived from other species77,78. The chemical synthesis warrant reproducibility, thus,
leading to a reduced batch to batch variability82.
However, chemical modifications are often required to increase the stability of
aptamers for in vivo applications. Because of their small size and composition,
aptamers are prone to be degraded by nucleases or rapidly removed by renal
clearance96. Addition of high-molecular weight compounds, for example, could slow
down the clearance of aptamers. For instance, attached polyethylene glycol moieties
increased the in vivo circulation half-life of a breast cancer targeting aptamer from 16 to
22 hours120.
Considering the characteristics and possible applications, cell-specific aptamers are a
promising alternative class of cell-targeting molecules that might overcome the
limitations of other molecules used for immunotherapy so far.
geloniniduronidase
NH N
HNNOH
O
O
OH
O
OH
ClPt
NH
Cl NH3
O
OH
O
O
HO O
OO
O
O
OH
NH
OH
O
O
nanoparticles
proteins
nucleic acids
small molecules
chlorin e6
cisplatin
docetaxel
aptamer target
siRNAmiRNAantimiR
Introduction
30
3.5.3 Aptamers for immunotherapeutic applications
In recent years there has been a considerable interest in identifying aptamer-based
immunomodulatory ligands. Aptamers have been proven to function as inhibitors,
agonists, opsonizing agents or antigen delivery tools for vaccination strategies77,115.
One strategy of immunomodulation is to block immunosuppressive pathways and
thereby circumvent tumor evasion mechanisms. Programmed cell death (PD-1) and
cytotoxic T-lymphocyte-associated protein 4 (CTLA-4) are examples of receptors which
negatively regulate T cell effector functions121. Remarkably, both receptors were
successfully addressed and blocked by aptamers122,123. Moreover, these aptamers
potentiated anti-cancer immunity in murine tumor models.
Another strategy of immunotherapy is to enhance T cell activation by applying receptor
agonists. Besides recognition of antigen-MHC complex by TCR and triggering of cell
differentiation by inflammatory cytokines, co-stimulatory signals are necessary for
adequate priming of naïve T cells. 4-1BB is the major co-stimulatory receptor
expressed on activated CD8 T cells7. In 2008, McNamara et al.124 selected aptamers
which function as natural ligands of 4-1BB and thereby boost T cell activation and
survival.
A further attempt of immunomodulation is to opsonize cancer cells, in other words, to
recruit T cells directly to the tumor site. On that account, 4-1BB aptamers were
conjugated with prostate cancer-binding prostate-specific membrane antigen (PSMA)
aptamers and thereby T cell co-stimulation straight at the tumor site was facilitated125.
Although cell-specific aptamers are proven to be suitable carriers (Section 3.5.2 and
Figure 3.5.4), only few researchers addressed their ability to bind or to deliver antigens
to DCs for vaccination strategies. When the study at hand was initiated, only the
investigations conducted by Berezovski et al.126 and Hui et al.127 were published.
Berezovski and co-workers enriched DNA libraries targeting either immature or mature
murine bone marrow-derived DCs (BM-DCs) for the identification of cell state-specific
biomarkers126. However, binding or functionality of individual aptamers was not
examined. In the study of Hui et al.127, they identified BM-DC-binding aptamers by
using a recombinant protein of the C-type lectin receptor DC-SIGN in a SELEX
approach. Nevertheless, the inhibitory function of the aptamers on the adhesion of DCs
to endothelial cells was investigated rather than their capability as delivery tools.
Introduction
31
In 2014 the first, and to date sole, aptamer-based antigen delivery was reported by
Wengerter et al.115. Here, DC-targeting aptamers were selected against the C-type
lectin receptor DEC-205 using a combinatorial approach of protein- and cell-SELEX.
These aptamers were subsequently conjugated with ovalbumin (OVA) and reported to
facilitate cross-presentation by DCs following CD8 T cell activation. In addition,
multivalent aptamer-OVA conjugates were observed to induce CD8 cytotoxicity against
OVA-expressing melanoma cells in vivo. Still, open questions remain. First and
foremost, no investigations concerning CD4 T cell activation were done, although the
used antigen OVA exhibits both MHC I- and MHC II-restricted epitopes128,129. Second,
there is no general agreement on DEC-205 mediated MHC I-restricted CD8 T cell
activation. In other studies, it was demonstrated that targeting of DEC-205 boost MHC
II-restricted CD4 T cell activation rather than CD8 T cell stimulation37,39. Third, OVA
was demonstrated to be internalized, processed and cross-presented by DCs in its
natural unconjugated form19,38. It is then questionable if the aptamers improve the effect
of OVA on DCs and T cells.
Obviously, it is worth to further investigate the potential of aptamer-based DC vaccines.
3.6 Aims of the thesis
One approach of DC-based immunotherapy is to deliver antigens specifically to DCs
for efficient T cell activation. Even though several molecules like antibodies, viruses or
nanoparticles are currently under investigations, antigen delivery to DCs remains a
challenge41,44.
The aim of this thesis was to investigate the potential applicability of aptamers as a
novel class of DC-targeting carriers for immunotherapeutic applications. In particular,
we were interested in answering the following questions.
What is the best SELEX strategy to identify DC-binding aptamers? Two strategies can
be followed to identify DC-binding aptamers. On the one hand, purified membrane
proteins can be implemented in a protein-SELEX approach, and on the other hand,
DCs can be directly used in a cell-SELEX process.
Does the choice of SELEX strategy influence the properties of the aptamers? In
protein-SELEX, specific membrane proteins can be chosen, because of their ability to
facilitate presentation on MHC I or MHC II molecules. For example, the C-type lectin
receptor MR is described to direct its ligands towards cross-presentation19,38. Thus,
aptamers specific for MR may be internalized into cellular compartments adequate for
presentation on MHC I molecules. In cell-SELEX, the specific target structure is

Introduction
32
unknown. Nevertheless, aptamers could be identified for targets that enable
presentation to T cells and that are not easy to isolate from the membrane.
Are the aptamers exhibiting all properties of suitable carrier molecules? Potential DC-
based antigen delivery tools have to meet several criteria. They need to bind
specifically to DCs, internalize within adequate antigen processing compartments and
be non-immunogenic.
Can the aptamers be conjugated to antigenic peptides without loss of binding ability?
Selective delivery of antigens to DCs is only warranted if the aptamers keep their
binding ability upon conjugation.
Do the aptamers deliver antigens to DCs and does this delivery result in specific T cell
activation? Effective targeting of antigens to DCs results in activation of T cell-mediated
immunity. To investigate whether the selected aptamers are functional in antigen
delivery, an OVA model system was chosen. Both targeted CD4 and CD8 T cell
activation were analyzed.
Results
33
4 Results
This chapter describes the investigations on the potential applicability of aptamers as
DC-targeting carriers for targeted activation of T cell-mediated immunity.
The first part of the chapter outlines the identification of aptamers recognizing dendritic
cells (DCs) (Section 4.1). In the second part, the properties of aptamers in terms of cell
binding, specificity, internalization and immunogenicity are investigated (Section 4.2).
The chapter concludes with the analysis on the potential of aptamers to deliver
antigens for specific T cell activation (Section 4.3).
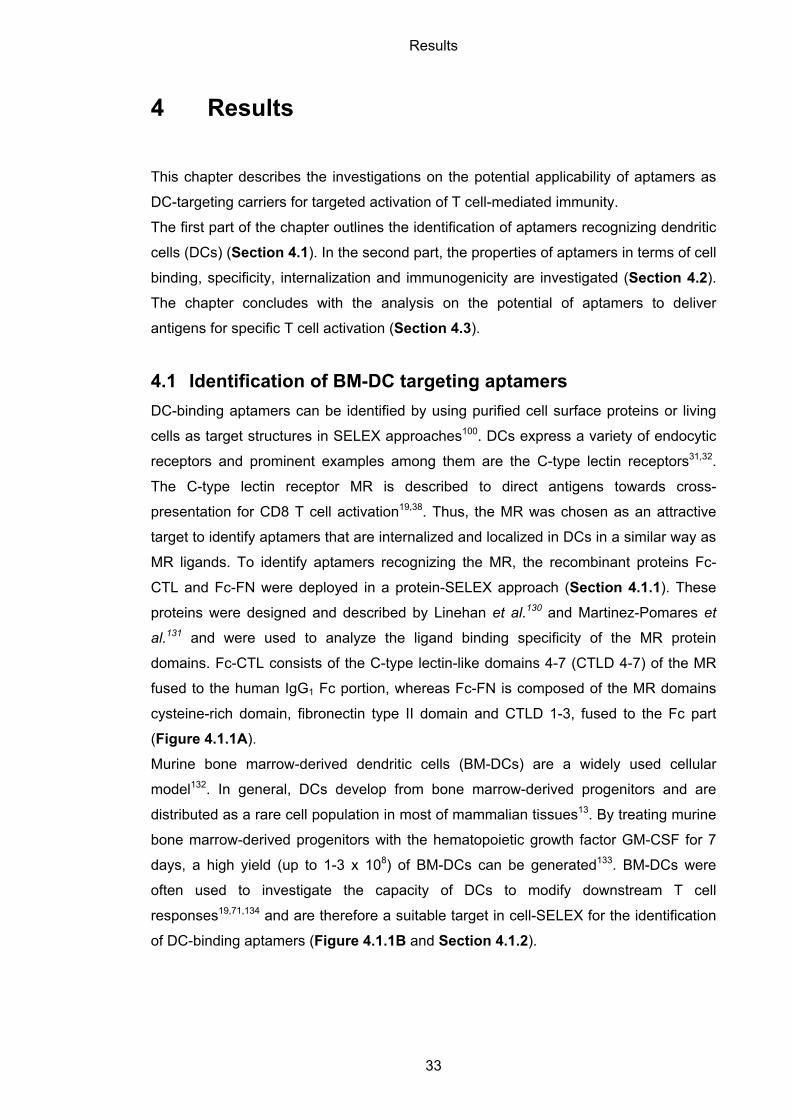
4.1 Identification of BM-DC targeting aptamers
DC-binding aptamers can be identified by using purified cell surface proteins or living
cells as target structures in SELEX approaches100. DCs express a variety of endocytic
receptors and prominent examples among them are the C-type lectin receptors31,32.
The C-type lectin receptor MR is described to direct antigens towards cross-
presentation for CD8 T cell activation19,38. Thus, the MR was chosen as an attractive
target to identify aptamers that are internalized and localized in DCs in a similar way as
MR ligands. To identify aptamers recognizing the MR, the recombinant proteins Fc-
CTL and Fc-FN were deployed in a protein-SELEX approach (Section 4.1.1). These
proteins were designed and described by Linehan et al.130 and Martinez-Pomares et
al.131 and were used to analyze the ligand binding specificity of the MR protein
domains. Fc-CTL consists of the C-type lectin-like domains 4-7 (CTLD 4-7) of the MR
fused to the human IgG1 Fc portion, whereas Fc-FN is composed of the MR domains
cysteine-rich domain, fibronectin type II domain and CTLD 1-3, fused to the Fc part
(Figure 4.1.1A).
Murine bone marrow-derived dendritic cells (BM-DCs) are a widely used cellular
model132. In general, DCs develop from bone marrow-derived progenitors and are
distributed as a rare cell population in most of mammalian tissues13. By treating murine
bone marrow-derived progenitors with the hematopoietic growth factor GM-CSF for 7
days, a high yield (up to 1-3 x 10⁸) of BM-DCs can be generated133. BM-DCs were
often used to investigate the capacity of DCs to modify downstream T cell
responses19,71,134 and are therefore a suitable target in cell-SELEX for the identification
of DC-binding aptamers (Figure 4.1.1B and Section 4.1.2).
Results
34
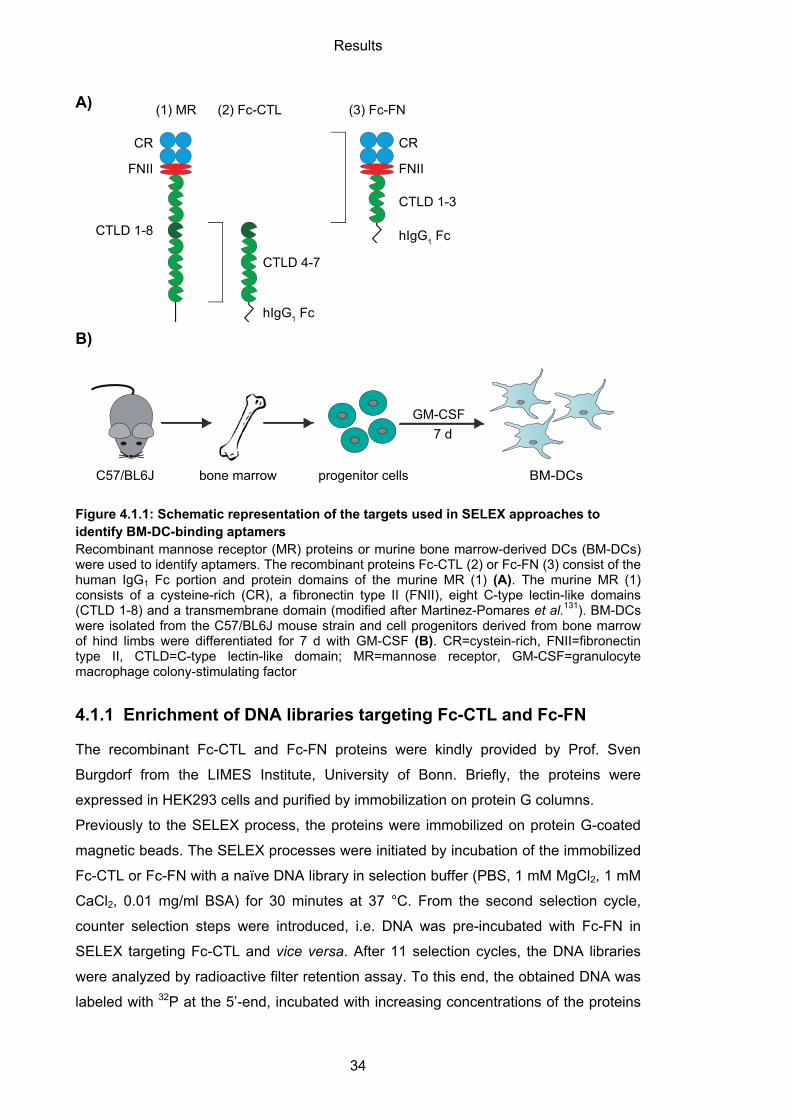
Figure 4.1.1: Schematic representation of the targets used in SELEX approaches to identify BM-DC-binding aptamers Recombinant mannose receptor (MR) proteins or murine bone marrow-derived DCs (BM-DCs) were used to identify aptamers. The recombinant proteins Fc-CTL (2) or Fc-FN (3) consist of the human IgG1 Fc portion and protein domains of the murine MR (1) (A). The murine MR (1) consists of a cysteine-rich (CR), a fibronectin type II (FNII), eight C-type lectin-like domains (CTLD 1-8) and a transmembrane domain (modified after Martinez-Pomares et al.131). BM-DCs were isolated from the C57/BL6J mouse strain and cell progenitors derived from bone marrow of hind limbs were differentiated for 7 d with GM-CSF (B). CR=cystein-rich, FNII=fibronectin type II, CTLD=C-type lectin-like domain; MR=mannose receptor, GM-CSF=granulocyte macrophage colony-stimulating factor
4.1.1 Enrichment of DNA libraries targeting Fc-CTL and Fc-FN
The recombinant Fc-CTL and Fc-FN proteins were kindly provided by Prof. Sven
Burgdorf from the LIMES Institute, University of Bonn. Briefly, the proteins were
expressed in HEK293 cells and purified by immobilization on protein G columns.
Previously to the SELEX process, the proteins were immobilized on protein G-coated
magnetic beads. The SELEX processes were initiated by incubation of the immobilized
Fc-CTL or Fc-FN with a naïve DNA library in selection buffer (PBS, 1 mM MgCl2, 1 mM
CaCl2, 0.01 mg/ml BSA) for 30 minutes at 37 °C. From the second selection cycle,
counter selection steps were introduced, i.e. DNA was pre-incubated with Fc-FN in
SELEX targeting Fc-CTL and vice versa. After 11 selection cycles, the DNA libraries
were analyzed by radioactive filter retention assay. To this end, the obtained DNA was
labeled with 32P at the 5’-end, incubated with increasing concentrations of the proteins
GM-CSF7 d
BM-DCsbone marrow progenitor cellsC57/BL6J
CR
FNII
CTLD 1-8
(1) MR (2) Fc-CTL
CTLD 4-7
hIgG1 Fc
A)
B)
hIgG1 Fc
(3) Fc-FN
CR
FNII
CTLD 1-3
Results
35
in selection buffer, the mixture was then passed through a nitrocellulose membrane,
washed and the retained 32P-DNA on the proteins was quantified by autoradiography.
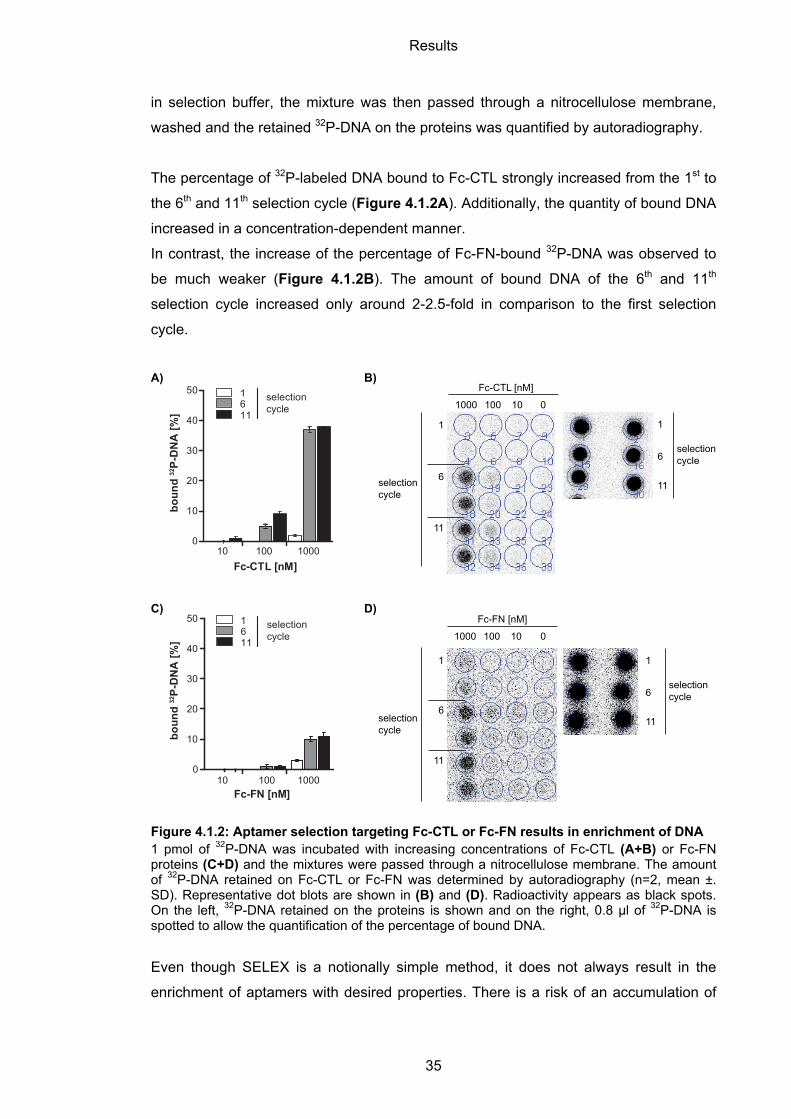
The percentage of 32P-labeled DNA bound to Fc-CTL strongly increased from the 1st to
the 6th and 11th selection cycle (Figure 4.1.2A). Additionally, the quantity of bound DNA
increased in a concentration-dependent manner.
In contrast, the increase of the percentage of Fc-FN-bound 32P-DNA was observed to
be much weaker (Figure 4.1.2B). The amount of bound DNA of the 6th and 11th
selection cycle increased only around 2-2.5-fold in comparison to the first selection
cycle.
Figure 4.1.2: Aptamer selection targeting Fc-CTL or Fc-FN results in enrichment of DNA 1 pmol of 32P-DNA was incubated with increasing concentrations of Fc-CTL (A+B) or Fc-FN proteins (C+D) and the mixtures were passed through a nitrocellulose membrane. The amount of 32P-DNA retained on Fc-CTL or Fc-FN was determined by autoradiography (n=2, mean ±. SD). Representative dot blots are shown in (B) and (D). Radioactivity appears as black spots. On the left, 32P-DNA retained on the proteins is shown and on the right, 0.8 µl of 32P-DNA is spotted to allow the quantification of the percentage of bound DNA.
Even though SELEX is a notionally simple method, it does not always result in the
enrichment of aptamers with desired properties. There is a risk of an accumulation of
10 100 10000
10
20
30
40
50
Fc-CTL [nM]
1611
boun
d 32
P-D
NA
[%]
selectioncycle
10 100 10000
10
20
30
40
50
Fc-FN [nM]
boun
d 32
P-D
NA
[%]
1611
selectioncycle
A)
C)
1000 100 10 0
1
6
11
Fc-FN [nM]
selectioncycle
1
6
11
selectioncycle
1
6
11
selectioncycle
1000 100 10 0
Fc-CTL [nM]
1
6
11
selectioncycle
B)
D)
Results
36
non-selective background binders82. Therefore, the enriched libraries of the sixth
selection cycle were taken for the analysis of target selectivity.
4.1.1.1 Selectivity of Fc-CTL and Fc-FN binding DNA libraries
The selectivity of the enriched DNA libraries for recombinant Fc-CTL or Fc-FN protein
was tested by radioactive filter retention assay. To this end, the obtained DNA libraries
of the 1st and 6th cycle of both selections were 5’-labeled with 32P and incubated with
Fc-CTL, Fc-FN, hIgG1 Fc, protein G, activated protein C (aPC), thrombin, extracellular
signal-regulated kinase 2 (Erk2) or the Sec7 domain of cytohesin-1 (Cyt1 Sec7) in
selection buffer for 30 minutes at 37 °C.
During SELEX, Fc-CTL and Fc-FN were immobilized on protein G magnetic beads
through their hIgG1 Fc tag. To exclude the binding of the enriched libraries to the
protein tag or the immobilization matrix, hIgG1 Fc and protein G were included in the
radioactive filter retention assays. In addition, the binding to the proteins thrombin,
aPC, Erk2 and Cyt1 Sec7 which differ in their protein structures and were successfully
addressed in previous aptamer selections91,94,98,135,136, were also examined.
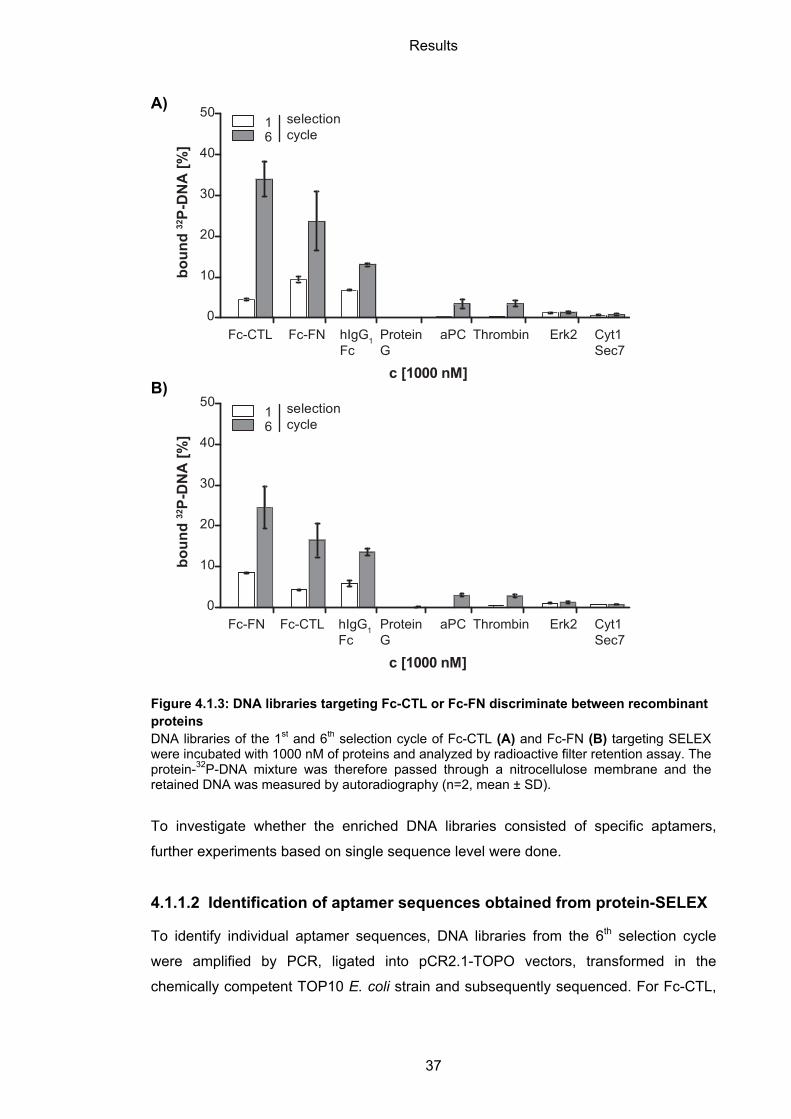
The DNA libraries derived from the 6th selection cycle targeting Fc-CTL (Figure 4.1.3A)
or Fc-FN (Figure 4.1.3B) bound to both Fc-CTL and Fc-FN proteins. This result was
not expected, because Fc-FN was used in the counter selection step in Fc-CTL-SELEX
and vice versa. However, binding to both proteins is partly mediated by addressing the
hIgG1 Fc tag (Figure 4.1.3AB). Plus, Fc-CTL as well as Fc-FN contains C-type lectin-
like domains (Figure 4.1.1A). Although the eight CTLDs of MR differ in their function
and ligand specificity, they share conserved amino acid residues to form the typical
CTLD fold35,137-140.
Apart from that, no or a low amount of 32P-DNA retained on aPC, thrombin, Erk2 or
Cyt1 Sec7 was observed. Plus, no binding to the immobilization matrix protein G was
detected. It can be concluded that the enriched DNA specifically bound to the protein
domains used in SELEX.
Results
37
Figure 4.1.3: DNA libraries targeting Fc-CTL or Fc-FN discriminate between recombinant proteins DNA libraries of the 1st and 6th selection cycle of Fc-CTL (A) and Fc-FN (B) targeting SELEX were incubated with 1000 nM of proteins and analyzed by radioactive filter retention assay. The protein-32P-DNA mixture was therefore passed through a nitrocellulose membrane and the retained DNA was measured by autoradiography (n=2, mean ± SD).
To investigate whether the enriched DNA libraries consisted of specific aptamers,
further experiments based on single sequence level were done.
4.1.1.2 Identification of aptamer sequences obtained from protein-SELEX
To identify individual aptamer sequences, DNA libraries from the 6th selection cycle
were amplified by PCR, ligated into pCR2.1-TOPO vectors, transformed in the
chemically competent TOP10 E. coli strain and subsequently sequenced. For Fc-CTL,
0
10
20
30
40
50
c [1000 nM]
boun
d 32
P-D
NA
[%]
selectioncycle
16
Fc-CTL hIgG1 Fc
Protein G
aPC Thrombin Erk2 Cyt1 Sec7
Fc-FN
0
10
20
30
40
50
c [1000 nM]
boun
d 32
P-D
NA
[%]
selectioncycle
16
Fc-CTL hIgG1 Fc
Protein G
aPC Thrombin Erk2 Cyt1 Sec7
Fc-FN
A)
B)
Results
38
19 DNA sequences were obtained (Figure 4.1.4 and Table S 9-2) and 14 DNA
sequences were found within the Fc-FN selected DNA library (Table S 9-1).
At this point, the selection against Fc-FN was not further investigated. First of all, the
libraries of the 6th and 11th selection cycles bound weakly to Fc-FN (Figure 4.1.2B).
Second, on the single sequence level no similarities within the DNA sequences were
found (Table S 9-1). Taking all this into account, no enrichment of high-affinity and
specific DNA aptamers against Fc-FN was achieved.
On contrary, Fc-CTL-targeting DNA libraries bound strongly to Fc-CTL (Figure 4.1.2A
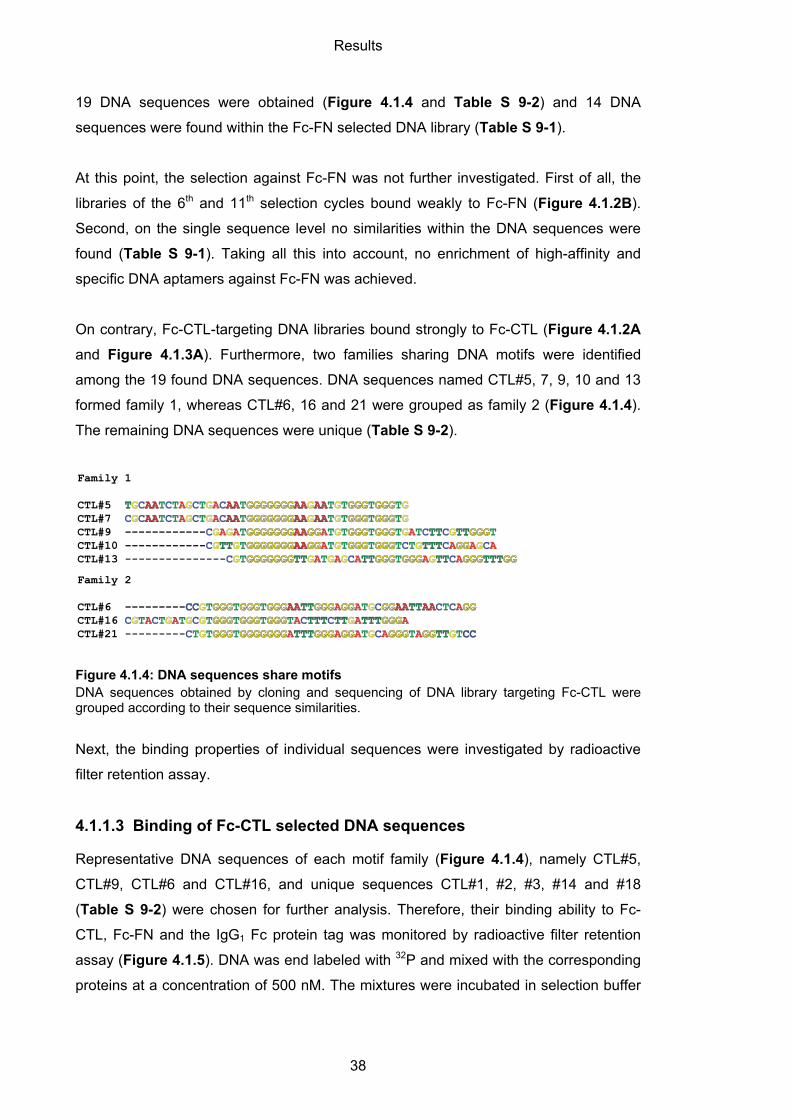
and Figure 4.1.3A). Furthermore, two families sharing DNA motifs were identified
among the 19 found DNA sequences. DNA sequences named CTL#5, 7, 9, 10 and 13
formed family 1, whereas CTL#6, 16 and 21 were grouped as family 2 (Figure 4.1.4).
The remaining DNA sequences were unique (Table S 9-2).
Figure 4.1.4: DNA sequences share motifs DNA sequences obtained by cloning and sequencing of DNA library targeting Fc-CTL were grouped according to their sequence similarities.
Next, the binding properties of individual sequences were investigated by radioactive
filter retention assay.
4.1.1.3 Binding of Fc-CTL selected DNA sequences
Representative DNA sequences of each motif family (Figure 4.1.4), namely CTL#5,
CTL#9, CTL#6 and CTL#16, and unique sequences CTL#1, #2, #3, #14 and #18
(Table S 9-2) were chosen for further analysis. Therefore, their binding ability to Fc-
CTL, Fc-FN and the IgG1 Fc protein tag was monitored by radioactive filter retention
assay (Figure 4.1.5). DNA was end labeled with 32P and mixed with the corresponding
proteins at a concentration of 500 nM. The mixtures were incubated in selection buffer
Family 1
CTL#5 TTGCAAAATCTAGCTGACAAAATGGGGGGGGGGGGGGAAAAGAAAATGTGGGGGGTGGGGGGTGCTL#7 CGCAAAATCTAGCTGACAAAATGGGGGGGGGGGGGGAAAAGAAAATGTGGGGGGTGGGGGGTGCTL#9 ------------ ------------CGAGATGGGGGGGGGGGGGGAAAAGGGGATGTGGGGGGTGGGGGGTGATCTTTTCGTTTTGGGGGGTCTL#10 ------------ ------------CGTTTTGTGGGGGGGGGGGGGGAAAAGGGGATGTGGGGGGTGGGGGGTCTGTTTTTTCAGGGGAGCACTL#13 ---------------CGTGGGGGGGGGGGGGGTTTTGATGAGCATTTTGGGGGGTGGGGGGAGTTTTCAGGGGGGTTTTTTGGGG
Family 2
CTL#6 --------- ---------CCCCGTGGGGGGTGGGGGGTGGGGGGAAAATTTTGGGGGGAGGGGATGCGGGGAAAATTTTAAAACTCAGGGGCTL#16 CGTACTGATGCGTGGGGGGTGGGGGGTGGGGGGTACTTTTTTCTTTTGATTTTTTGGGGGGACTL#21 ---------CTGTGGGGGGTGGGGGGGGGGGGGGATTTTTTGGGGGGAGGGGATGCAGGGGGGTAGGGGTTTTGTCCCC

Results
39
for 30 minutes at 37 °C and applied on a nitrocellulose membrane. Finally, the amount
of bound DNA was detected by autoradiography.
Equally to the 6th selection cycle library (Figure 4.1.3A), some sequences targeted
both proteins, Fc-CTL and Fc-FN (Figure 4.1.5). Exceptions were CTL#5 and CTL#9
which showed more than two-fold higher binding to Fc-CTL in comparison to Fc-FN,
and a low binding to the protein tag.
Figure 4.1.5: Binding behavior of DNA sequences to Fc-CTL, Fc-FN and hIgG1 Fc
1 pmol of 32P-DNA was incubated with 500 nM of proteins, the mixture was passed through a nitrocellulose membrane and the retained 32P-DNA was measured by autoradiography (n=2, mean ± SD).
CTL#5 and CTL#9 belong to sequence family 1 whereby the shared motif is located
differently within these sequences (Figure 4.1.4). As CTL#5 showed a higher degree of
discrimination between Fc-CTL and Fc-FN, it is most likely that its sequence
composition favors tertiary structure formation critical for specific Fc-CTL binding. For
that reason, CTL#5 was picked for further analysis.
4.1.2 Enrichment of DNA libraries in cell-SELEX
The second approach to identify DC-binding aptamers was the use of living murine
BM-DCs as targets in a cell-SELEX process (Figure 4.1.1B). BM-DCs express a
variety of molecules on their surface that are involved in modulating downstream T cell
responses13. These molecules represent accessible targets for aptamer selection.
Previously to every selection cycle, murine bone marrow-derived progenitor cells were
isolated from the hind limbs and differentiated for 7 days into BM-DCs with the
hematopoietic factor GM-CSF. The cell-SELEX process was initiated by incubating
living BM-DCs with a naïve DNA or 2’F-RNA library in cell-SELEX selection buffer
(DPBS, 1 mM MgCl2, 0.01 mg/ml BSA) at 37 °C for 30 minutes. To increase the
1 6 1 2 3 5 6 9 14 16 180
10
20
30
40
50 Fc-CTLFc-FNhIgG1 Fc
DNA sequence CTL#
selection cycle
boun
d 32
P-D
NA
[%]
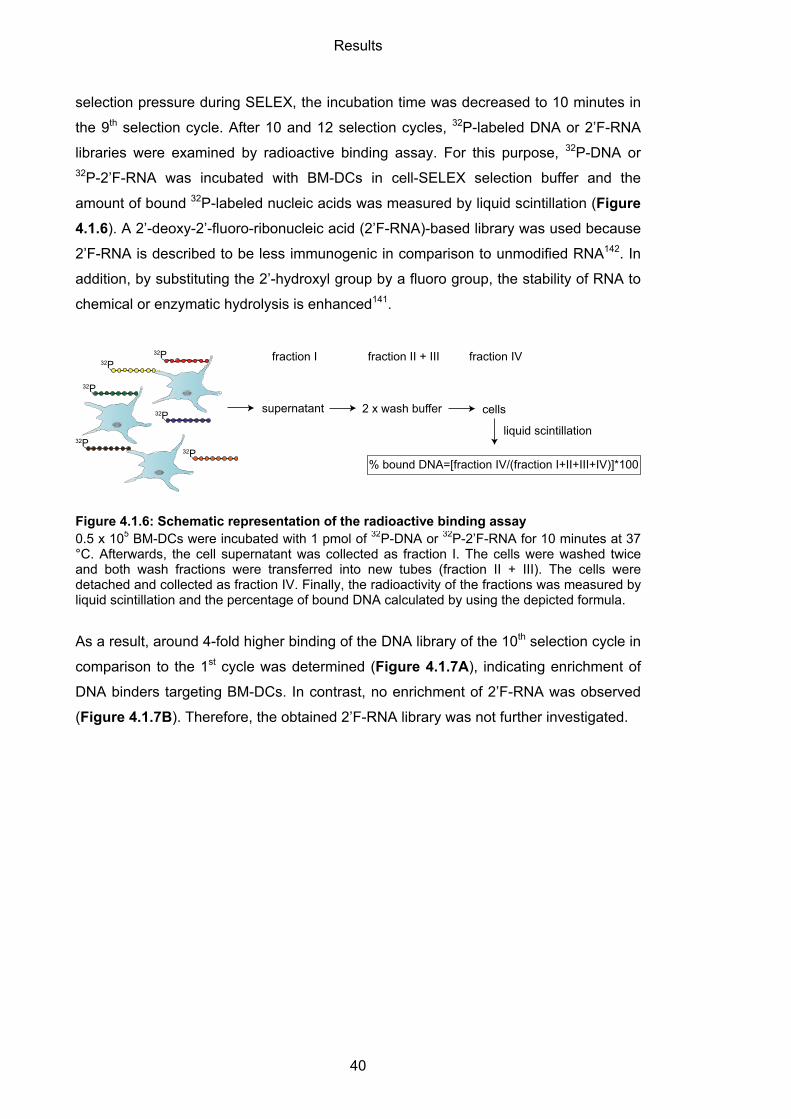
Results
40
selection pressure during SELEX, the incubation time was decreased to 10 minutes in
the 9th selection cycle. After 10 and 12 selection cycles, 32P-labeled DNA or 2’F-RNA
libraries were examined by radioactive binding assay. For this purpose, 32P-DNA or 32P-2’F-RNA was incubated with BM-DCs in cell-SELEX selection buffer and the
amount of bound 32P-labeled nucleic acids was measured by liquid scintillation (Figure
4.1.6). A 2’-deoxy-2’-fluoro-ribonucleic acid (2’F-RNA)-based library was used because
2’F-RNA is described to be less immunogenic in comparison to unmodified RNA142. In
addition, by substituting the 2’-hydroxyl group by a fluoro group, the stability of RNA to
chemical or enzymatic hydrolysis is enhanced141.
Figure 4.1.6: Schematic representation of the radioactive binding assay 0.5 x 10⁵ BM-DCs were incubated with 1 pmol of 32P-DNA or 32P-2’F-RNA for 10 minutes at 37 °C. Afterwards, the cell supernatant was collected as fraction I. The cells were washed twice and both wash fractions were transferred into new tubes (fraction II + III). The cells were detached and collected as fraction IV. Finally, the radioactivity of the fractions was measured by liquid scintillation and the percentage of bound DNA calculated by using the depicted formula.
As a result, around 4-fold higher binding of the DNA library of the 10th selection cycle in
comparison to the 1st cycle was determined (Figure 4.1.7A), indicating enrichment of
DNA binders targeting BM-DCs. In contrast, no enrichment of 2’F-RNA was observed
(Figure 4.1.7B). Therefore, the obtained 2’F-RNA library was not further investigated.
32P32P
32P
32P
32P
32P
fraction I
supernatant 2 x wash buffer cells
fraction II + III fraction IV
% bound DNA=[fraction IV/(fraction I+II+III+IV)]*100
liquid scintillation
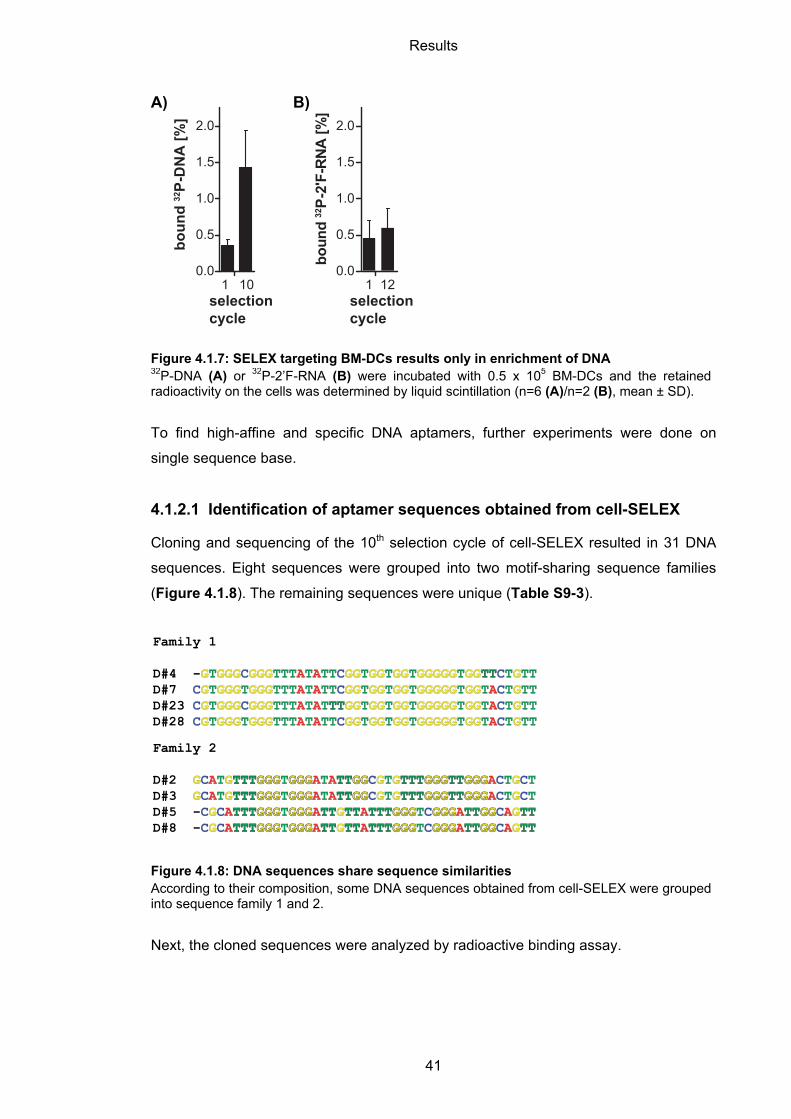
Results
41
Figure 4.1.7: SELEX targeting BM-DCs results only in enrichment of DNA 32P-DNA (A) or 32P-2’F-RNA (B) were incubated with 0.5 x 10⁵ BM-DCs and the retained radioactivity on the cells was determined by liquid scintillation (n=6 (A)/n=2 (B), mean ± SD).
To find high-affine and specific DNA aptamers, further experiments were done on
single sequence base.
4.1.2.1 Identification of aptamer sequences obtained from cell-SELEX
Cloning and sequencing of the 10th selection cycle of cell-SELEX resulted in 31 DNA
sequences. Eight sequences were grouped into two motif-sharing sequence families
(Figure 4.1.8). The remaining sequences were unique (Table S9-3).
Figure 4.1.8: DNA sequences share sequence similarities According to their composition, some DNA sequences obtained from cell-SELEX were grouped into sequence family 1 and 2.
Next, the cloned sequences were analyzed by radioactive binding assay.
1 120.0
0.5
1.0
1.5
2.0
boun
d 32
P-2'
F-RN
A [%
]selection cycle
A)
1 100.0
0.5
1.0
1.5
2.0
selection cycle
boun
d 32
P-D
NA
[%]
B)
Family 1
D#4 - -GTGGGCGGGTTTATATTCGGTGGTGGTGGGGGTGGTTTTCTGTTD#7 CGTGGGTGGGTTTATATTCGGTGGTGGTGGGGGTGGTACTGTT D#23 CGTGGGCGGGTTTATATTTTTGGTGGTGGTGGGGGTGGTACTGTT D#28 CGTGGGTGGGTTTATATTCGGTGGTGGTGGGGGTGGTACTGTT
Family 2
D#2 GCATGTTTTTTGGGGGGTGGGGGGATATTTTGGGGCGTGTTTTTTGGGGGGTTTTGGGGGGACTGCTD#3 GCATGTTTTTTGGGGGGTGGGGGGATATTTTGGGGCGTGTTTTTTGGGGGGTTTTGGGGGGACTGCTD#5 - -CGCATTTTTTGGGGGGTGGGGGGATTTTGTTTTATTTTTTGGGGGGTCGGGGGGATTTTGGGGCAGTTTTD#8 - -CGCATTTTTTGGGGGGTGGGGGGATTTTGTTTTATTTTTTGGGGGGTCGGGGGGATTTTGGGGCAGTTTT
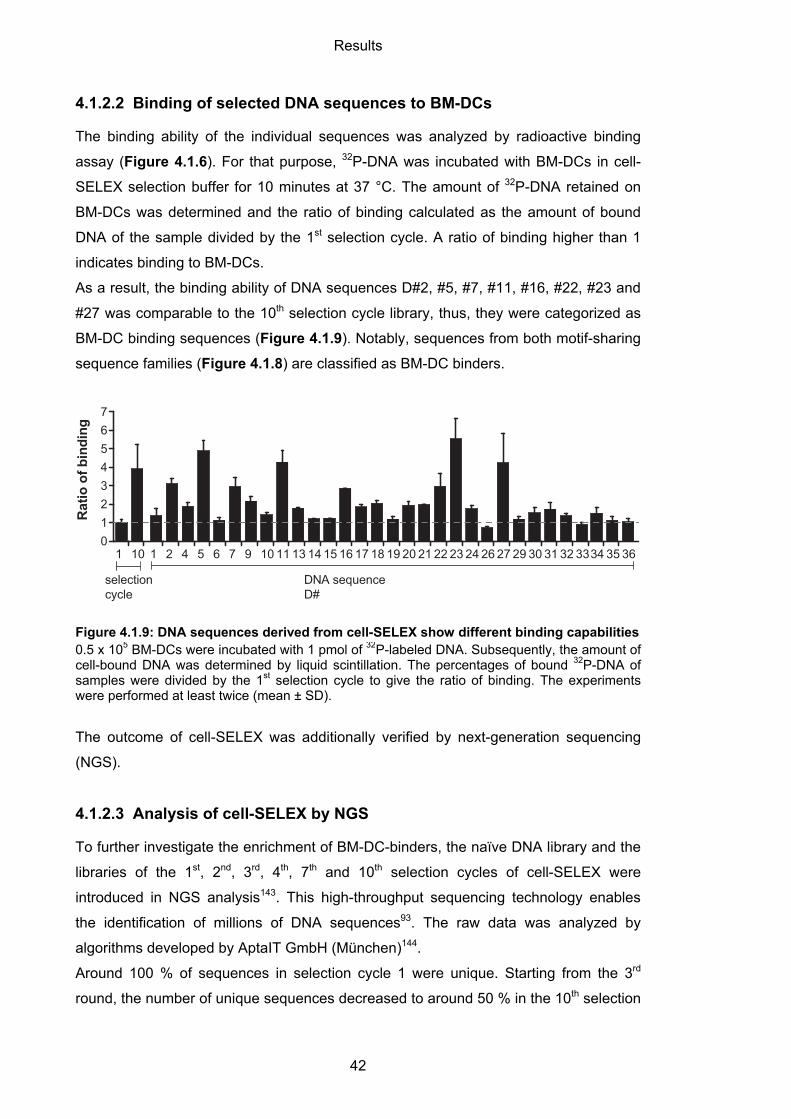
Results
42
4.1.2.2 Binding of selected DNA sequences to BM-DCs
The binding ability of the individual sequences was analyzed by radioactive binding
assay (Figure 4.1.6). For that purpose, 32P-DNA was incubated with BM-DCs in cell-
SELEX selection buffer for 10 minutes at 37 °C. The amount of 32P-DNA retained on
BM-DCs was determined and the ratio of binding calculated as the amount of bound
DNA of the sample divided by the 1st selection cycle. A ratio of binding higher than 1
indicates binding to BM-DCs.
As a result, the binding ability of DNA sequences D#2, #5, #7, #11, #16, #22, #23 and
#27 was comparable to the 10th selection cycle library, thus, they were categorized as
BM-DC binding sequences (Figure 4.1.9). Notably, sequences from both motif-sharing
sequence families (Figure 4.1.8) are classified as BM-DC binders.
Figure 4.1.9: DNA sequences derived from cell-SELEX show different binding capabilities 0.5 x 10⁵ BM-DCs were incubated with 1 pmol of 32P-labeled DNA. Subsequently, the amount of cell-bound DNA was determined by liquid scintillation. The percentages of bound 32P-DNA of samples were divided by the 1st selection cycle to give the ratio of binding. The experiments were performed at least twice (mean ± SD).
The outcome of cell-SELEX was additionally verified by next-generation sequencing
(NGS).
4.1.2.3 Analysis of cell-SELEX by NGS
To further investigate the enrichment of BM-DC-binders, the naïve DNA library and the
libraries of the 1st, 2nd, 3rd, 4th, 7th and 10th selection cycles of cell-SELEX were
introduced in NGS analysis143. This high-throughput sequencing technology enables
the identification of millions of DNA sequences93. The raw data was analyzed by
algorithms developed by AptaIT GmbH (München)144.
Around 100 % of sequences in selection cycle 1 were unique. Starting from the 3rd
round, the number of unique sequences decreased to around 50 % in the 10th selection
1 10 1 2 4 5 6 7 9 10 11 13 14 15 16 17 18 19 20 21 22 23 24 26 27 29 30 31 32 3334 35 3601234567
Rat
io o
f bin
ding
selectioncycle
DNA sequenceD#
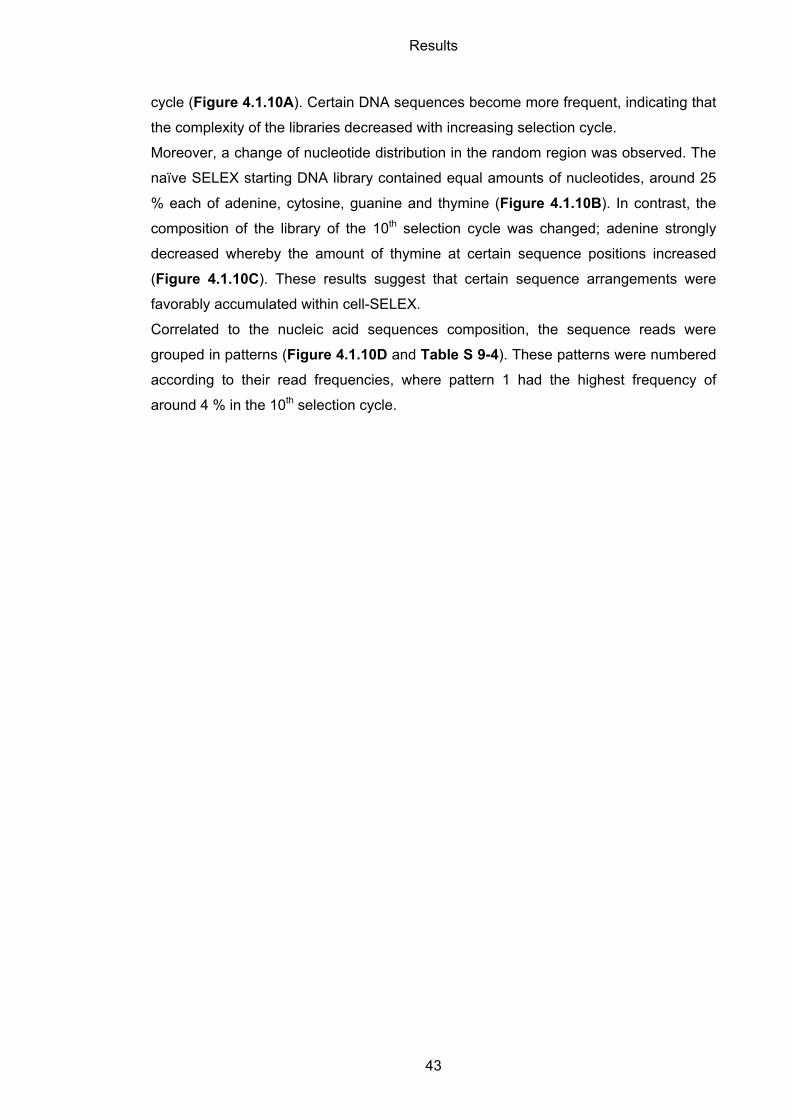
Results
43
cycle (Figure 4.1.10A). Certain DNA sequences become more frequent, indicating that
the complexity of the libraries decreased with increasing selection cycle.
Moreover, a change of nucleotide distribution in the random region was observed. The
naïve SELEX starting DNA library contained equal amounts of nucleotides, around 25
% each of adenine, cytosine, guanine and thymine (Figure 4.1.10B). In contrast, the
composition of the library of the 10th selection cycle was changed; adenine strongly
decreased whereby the amount of thymine at certain sequence positions increased
(Figure 4.1.10C). These results suggest that certain sequence arrangements were
favorably accumulated within cell-SELEX.
Correlated to the nucleic acid sequences composition, the sequence reads were
grouped in patterns (Figure 4.1.10D and Table S 9-4). These patterns were numbered
according to their read frequencies, where pattern 1 had the highest frequency of
around 4 % in the 10th selection cycle.
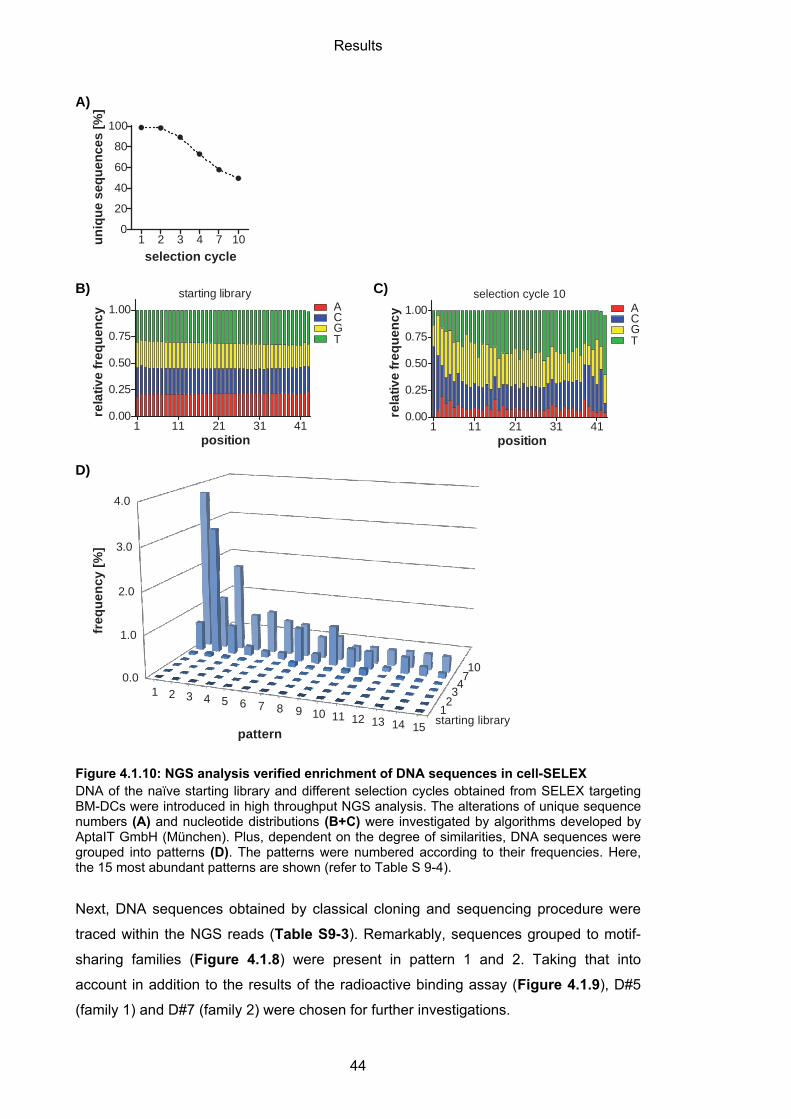
Results
44
Figure 4.1.10: NGS analysis verified enrichment of DNA sequences in cell-SELEX DNA of the naïve starting library and different selection cycles obtained from SELEX targeting BM-DCs were introduced in high throughput NGS analysis. The alterations of unique sequence numbers (A) and nucleotide distributions (B+C) were investigated by algorithms developed by AptaIT GmbH (München). Plus, dependent on the degree of similarities, DNA sequences were grouped into patterns (D). The patterns were numbered according to their frequencies. Here, the 15 most abundant patterns are shown (refer to Table S 9-4).
Next, DNA sequences obtained by classical cloning and sequencing procedure were
traced within the NGS reads (Table S9-3). Remarkably, sequences grouped to motif-
sharing families (Figure 4.1.8) were present in pattern 1 and 2. Taking that into
account in addition to the results of the radioactive binding assay (Figure 4.1.9), D#5
(family 1) and D#7 (family 2) were chosen for further investigations.
selection cycle
uniq
ue s
eque
nces
[%]
1 2 3 4 7 100
20
40
60
80
100
starting library
position
rela
tive
freq
uenc
y
1 11 21 31 410.00
0.25
0.50
0.75
1.00 ACGT
position
rela
tive
freq
uenc
y
1 11 21 31 410.00
0.25
0.50
0.75
1.00selection cycle 10
ACGT
A)
B) C)
D)
2.0
3.0
4.0
starting library12347
100.0
1.0
1 2 3 4 5 6 7 8 9 10 11 12 13 14 15pattern
freq
uenc
y [%
]
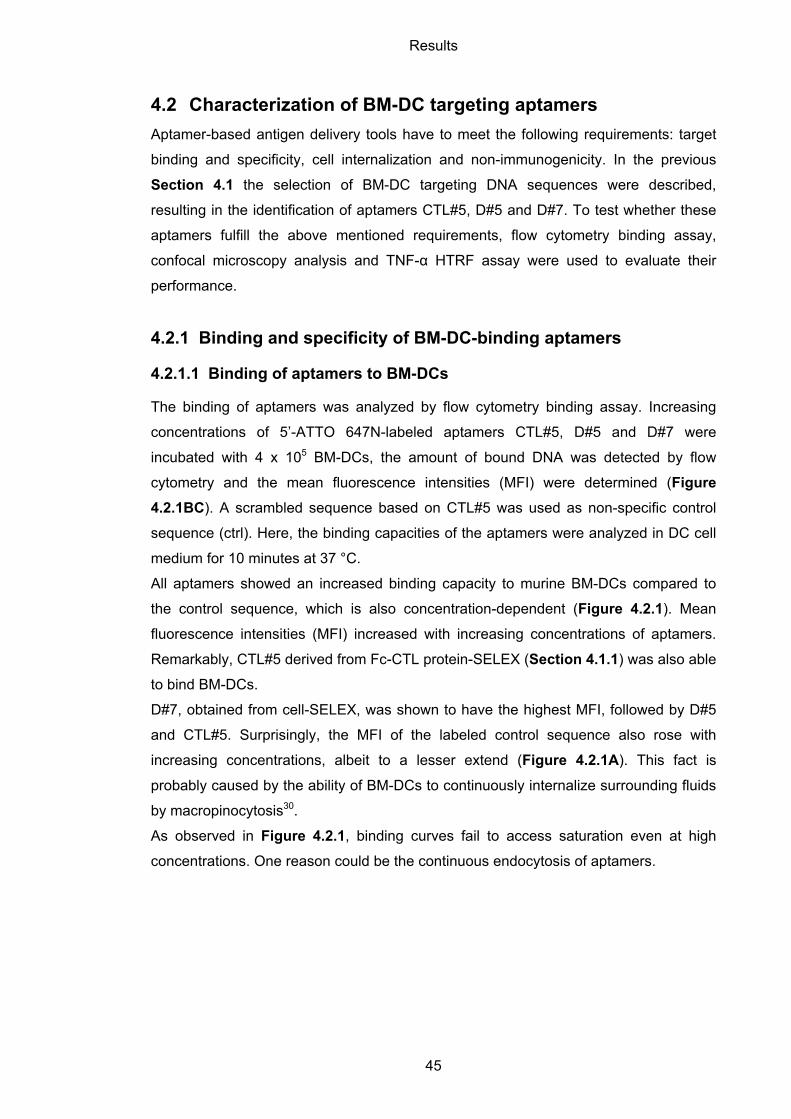
Results
45
4.2 Characterization of BM-DC targeting aptamers
Aptamer-based antigen delivery tools have to meet the following requirements: target
binding and specificity, cell internalization and non-immunogenicity. In the previous
Section 4.1 the selection of BM-DC targeting DNA sequences were described,
resulting in the identification of aptamers CTL#5, D#5 and D#7. To test whether these
aptamers fulfill the above mentioned requirements, flow cytometry binding assay,
confocal microscopy analysis and TNF-α HTRF assay were used to evaluate their
performance.
4.2.1 Binding and specificity of BM-DC-binding aptamers
4.2.1.1 Binding of aptamers to BM-DCs
The binding of aptamers was analyzed by flow cytometry binding assay. Increasing
concentrations of 5’-ATTO 647N-labeled aptamers CTL#5, D#5 and D#7 were
incubated with 4 x 10⁵ BM-DCs, the amount of bound DNA was detected by flow
cytometry and the mean fluorescence intensities (MFI) were determined (Figure
4.2.1BC). A scrambled sequence based on CTL#5 was used as non-specific control
sequence (ctrl). Here, the binding capacities of the aptamers were analyzed in DC cell
medium for 10 minutes at 37 °C.
All aptamers showed an increased binding capacity to murine BM-DCs compared to
the control sequence, which is also concentration-dependent (Figure 4.2.1). Mean
fluorescence intensities (MFI) increased with increasing concentrations of aptamers.
Remarkably, CTL#5 derived from Fc-CTL protein-SELEX (Section 4.1.1) was also able
to bind BM-DCs.
D#7, obtained from cell-SELEX, was shown to have the highest MFI, followed by D#5
and CTL#5. Surprisingly, the MFI of the labeled control sequence also rose with
increasing concentrations, albeit to a lesser extend (Figure 4.2.1A). This fact is
probably caused by the ability of BM-DCs to continuously internalize surrounding fluids
by macropinocytosis30.
As observed in Figure 4.2.1, binding curves fail to access saturation even at high
concentrations. One reason could be the continuous endocytosis of aptamers.
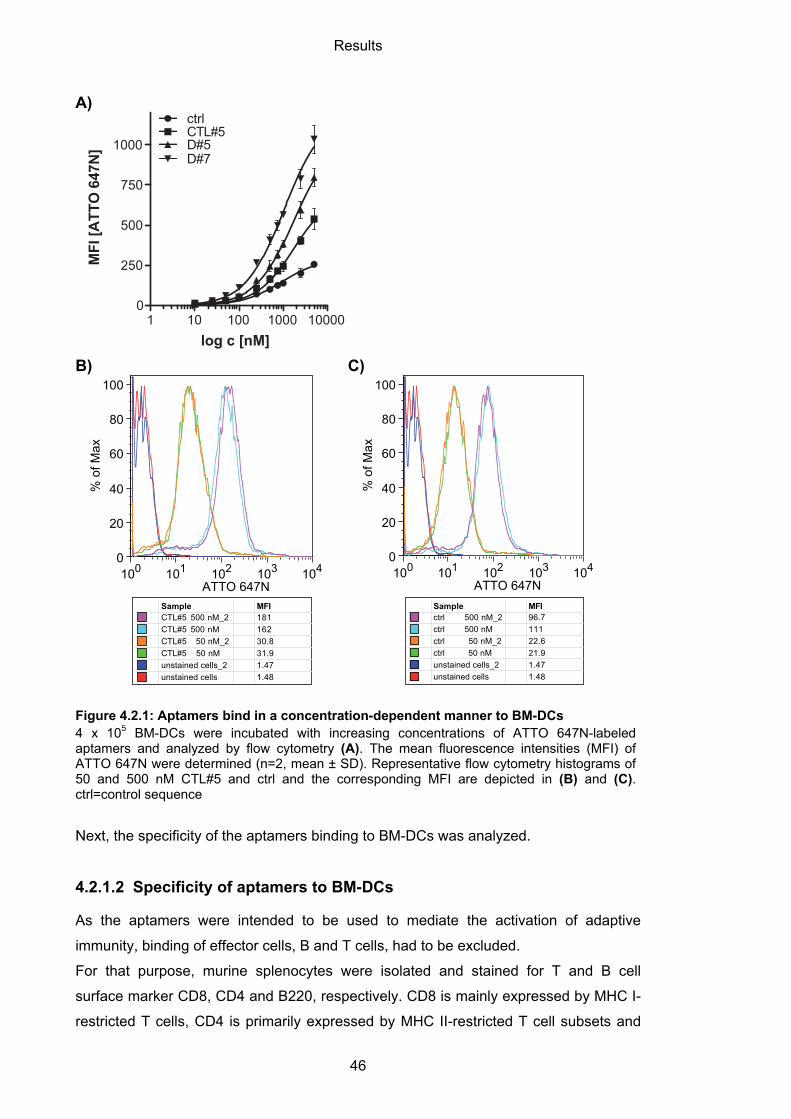
Results
46
Figure 4.2.1: Aptamers bind in a concentration-dependent manner to BM-DCs 4 x 10⁵ BM-DCs were incubated with increasing concentrations of ATTO 647N-labeled aptamers and analyzed by flow cytometry (A). The mean fluorescence intensities (MFI) of ATTO 647N were determined (n=2, mean ± SD). Representative flow cytometry histograms of 50 and 500 nM CTL#5 and ctrl and the corresponding MFI are depicted in (B) and (C). ctrl=control sequence
Next, the specificity of the aptamers binding to BM-DCs was analyzed.
4.2.1.2 Specificity of aptamers to BM-DCs
As the aptamers were intended to be used to mediate the activation of adaptive
immunity, binding of effector cells, B and T cells, had to be excluded.
For that purpose, murine splenocytes were isolated and stained for T and B cell
surface marker CD8, CD4 and B220, respectively. CD8 is mainly expressed by MHC I-
restricted T cells, CD4 is primarily expressed by MHC II-restricted T cell subsets and
log c [nM]
MFI
[ATT
O 6
47N
]
1 10 100 1000 100000
250
500
750
1000
ctrl
D#5D#7
CTL#5
B) C)
100 101 102 103 104
ATTO 647N
0
20
40
60
80
100
% o
f Max
Sample MFI
unstained cells 1.48unstained cells_2 1.47CTL#5 50 nM 31.9CTL#5 50 nM_2 30.8CTL#5 500 nM 162CTL#5 500 nM_2 181
100 101 102 103 104
ATTO 647N
0
20
40
60
80
100%
of M
ax
Sample MFI
unstained cells 1.48unstained cells_2 1.47ctrl 50 nM 21.9ctrl 50 nM_2 22.6ctrl 500 nM 111ctrl 500 nM_2 96.7
A)
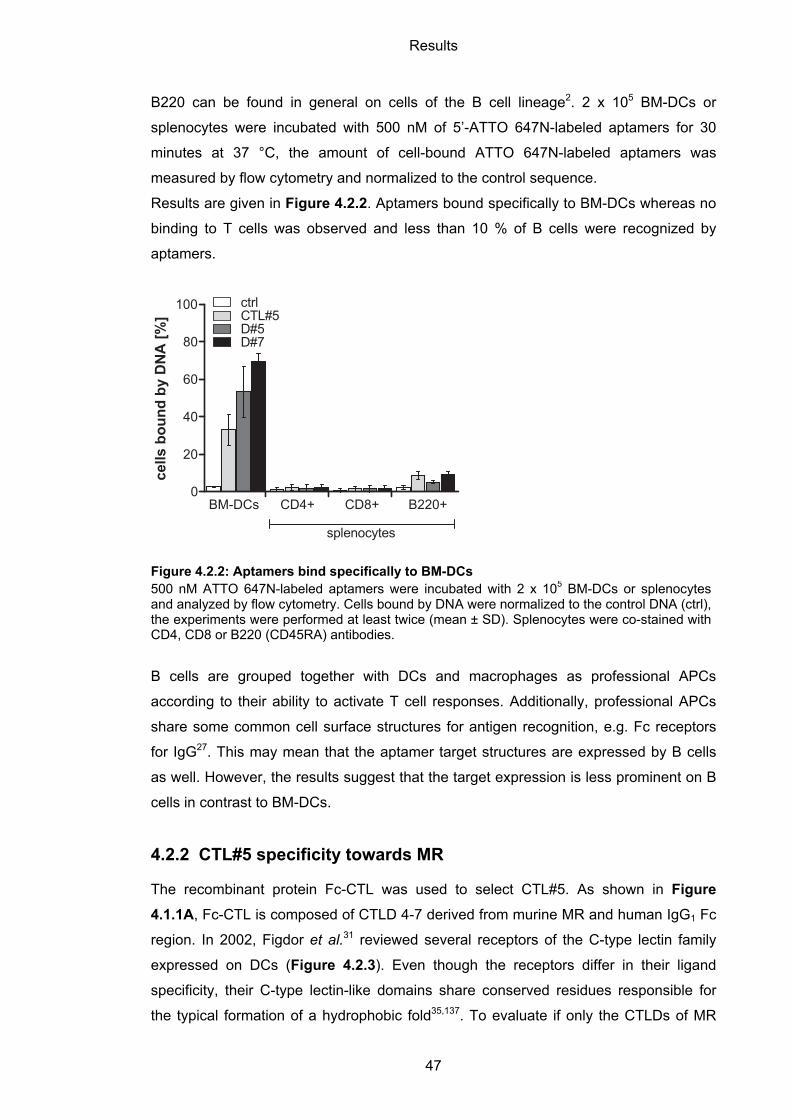
Results
47
B220 can be found in general on cells of the B cell lineage2. 2 x 10⁵ BM-DCs or
splenocytes were incubated with 500 nM of 5’-ATTO 647N-labeled aptamers for 30
minutes at 37 °C, the amount of cell-bound ATTO 647N-labeled aptamers was
measured by flow cytometry and normalized to the control sequence.
Results are given in Figure 4.2.2. Aptamers bound specifically to BM-DCs whereas no
binding to T cells was observed and less than 10 % of B cells were recognized by
aptamers.
Figure 4.2.2: Aptamers bind specifically to BM-DCs 500 nM ATTO 647N-labeled aptamers were incubated with 2 x 10⁵ BM-DCs or splenocytes and analyzed by flow cytometry. Cells bound by DNA were normalized to the control DNA (ctrl), the experiments were performed at least twice (mean ± SD). Splenocytes were co-stained with CD4, CD8 or B220 (CD45RA) antibodies.
B cells are grouped together with DCs and macrophages as professional APCs
according to their ability to activate T cell responses. Additionally, professional APCs
share some common cell surface structures for antigen recognition, e.g. Fc receptors
for IgG27. This may mean that the aptamer target structures are expressed by B cells
as well. However, the results suggest that the target expression is less prominent on B
cells in contrast to BM-DCs.
4.2.2 CTL#5 specificity towards MR
The recombinant protein Fc-CTL was used to select CTL#5. As shown in Figure
4.1.1A, Fc-CTL is composed of CTLD 4-7 derived from murine MR and human IgG1 Fc
region. In 2002, Figdor et al.31 reviewed several receptors of the C-type lectin family
expressed on DCs (Figure 4.2.3). Even though the receptors differ in their ligand
specificity, their C-type lectin-like domains share conserved residues responsible for
the typical formation of a hydrophobic fold35,137. To evaluate if only the CTLDs of MR
BM-DCs CD4+ CD8+ B220+0
20
40
60
80
100 ctrl
cells
bou
nd b
y D
NA
[%] CTL#5
D#5D#7
splenocytes
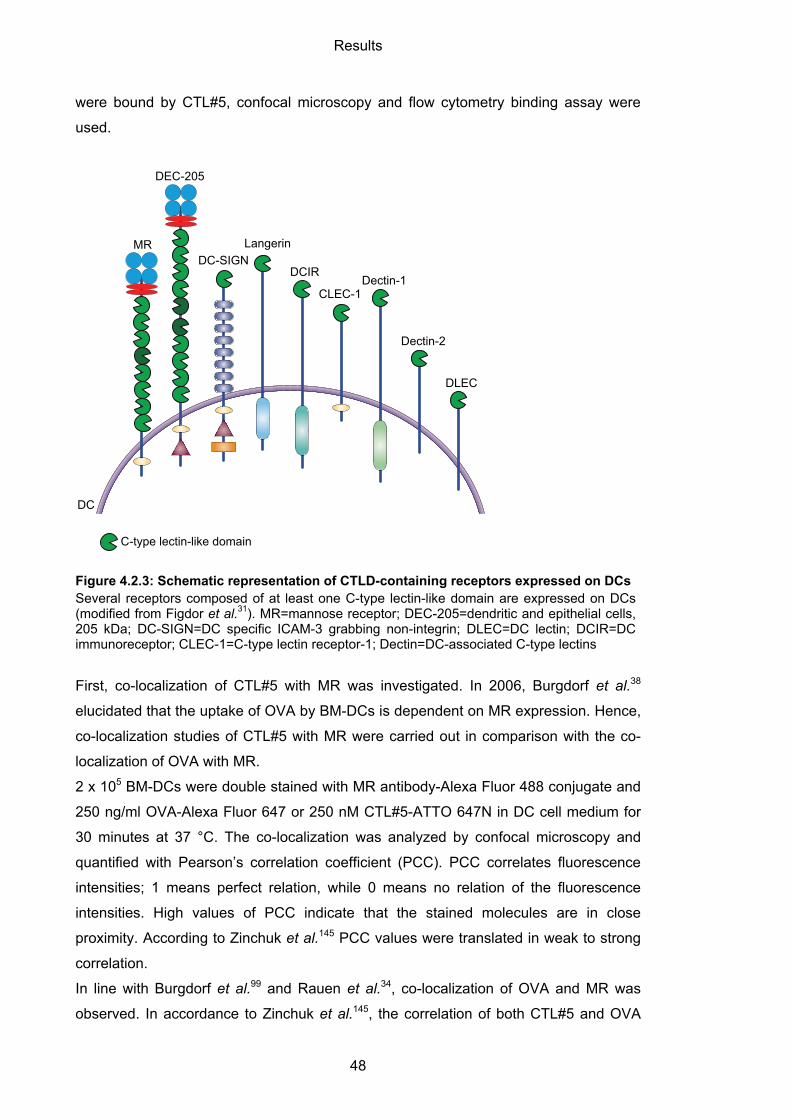
Results
48
were bound by CTL#5, confocal microscopy and flow cytometry binding assay were
used.
Figure 4.2.3: Schematic representation of CTLD-containing receptors expressed on DCs Several receptors composed of at least one C-type lectin-like domain are expressed on DCs (modified from Figdor et al.31). MR=mannose receptor; DEC-205=dendritic and epithelial cells, 205 kDa; DC-SIGN=DC specific ICAM-3 grabbing non-integrin; DLEC=DC lectin; DCIR=DC immunoreceptor; CLEC-1=C-type lectin receptor-1; Dectin=DC-associated C-type lectins
First, co-localization of CTL#5 with MR was investigated. In 2006, Burgdorf et al.38
elucidated that the uptake of OVA by BM-DCs is dependent on MR expression. Hence,
co-localization studies of CTL#5 with MR were carried out in comparison with the co-
localization of OVA with MR.
2 x 10⁵ BM-DCs were double stained with MR antibody-Alexa Fluor 488 conjugate and
250 ng/ml OVA-Alexa Fluor 647 or 250 nM CTL#5-ATTO 647N in DC cell medium for
30 minutes at 37 °C. The co-localization was analyzed by confocal microscopy and
quantified with Pearson’s correlation coefficient (PCC). PCC correlates fluorescence
intensities; 1 means perfect relation, while 0 means no relation of the fluorescence
intensities. High values of PCC indicate that the stained molecules are in close
proximity. According to Zinchuk et al.145 PCC values were translated in weak to strong
correlation.
In line with Burgdorf et al.99 and Rauen et al.34, co-localization of OVA and MR was
observed. In accordance to Zinchuk et al.145, the correlation of both CTL#5 and OVA
MR
DEC-205
DC-SIGNLangerin
DCIR
CLEC-1Dectin-1
Dectin-2
DLEC
C-type lectin-like domain
DC
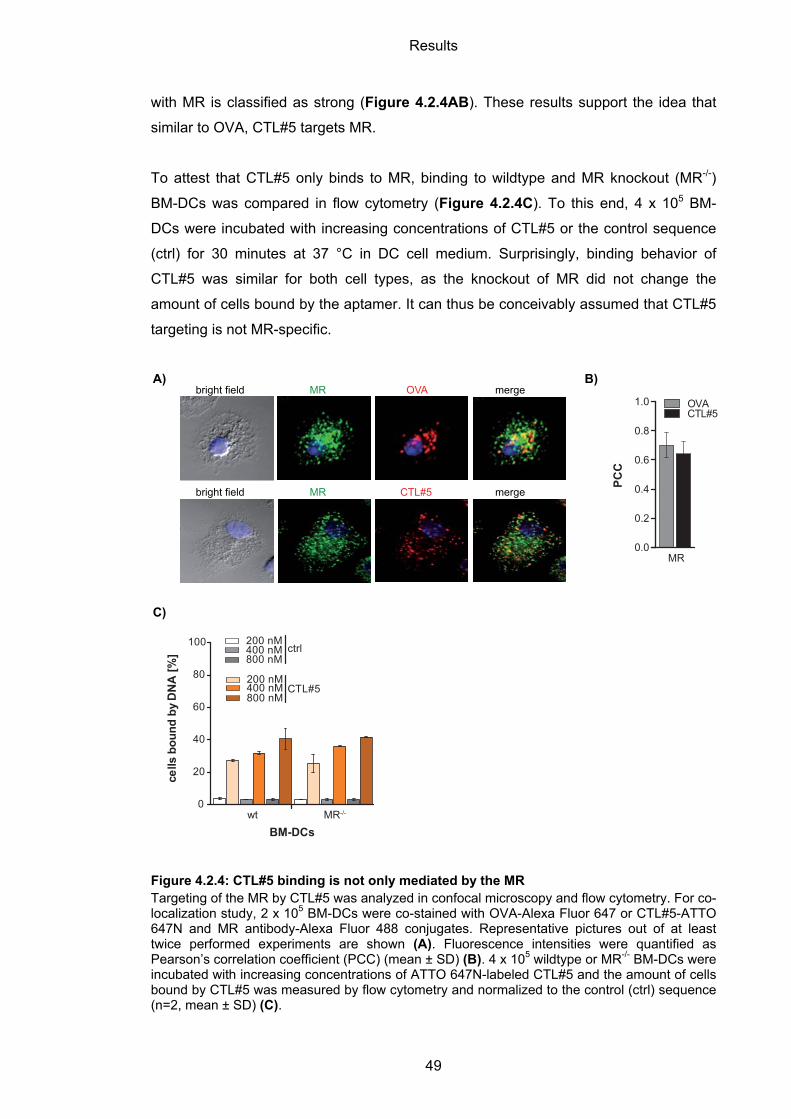
Results
49
with MR is classified as strong (Figure 4.2.4AB). These results support the idea that
similar to OVA, CTL#5 targets MR.
To attest that CTL#5 only binds to MR, binding to wildtype and MR knockout (MR-/-)
BM-DCs was compared in flow cytometry (Figure 4.2.4C). To this end, 4 x 10⁵ BM-
DCs were incubated with increasing concentrations of CTL#5 or the control sequence
(ctrl) for 30 minutes at 37 °C in DC cell medium. Surprisingly, binding behavior of
CTL#5 was similar for both cell types, as the knockout of MR did not change the
amount of cells bound by the aptamer. It can thus be conceivably assumed that CTL#5
targeting is not MR-specific.
Figure 4.2.4: CTL#5 binding is not only mediated by the MR Targeting of the MR by CTL#5 was analyzed in confocal microscopy and flow cytometry. For co-localization study, 2 x 10⁵ BM-DCs were co-stained with OVA-Alexa Fluor 647 or CTL#5-ATTO 647N and MR antibody-Alexa Fluor 488 conjugates. Representative pictures out of at least twice performed experiments are shown (A). Fluorescence intensities were quantified as Pearson’s correlation coefficient (PCC) (mean ± SD) (B). 4 x 10⁵ wildtype or MR-/- BM-DCs were incubated with increasing concentrations of ATTO 647N-labeled CTL#5 and the amount of cells bound by CTL#5 was measured by flow cytometry and normalized to the control (ctrl) sequence (n=2, mean ± SD) (C).
CTL#5
bright field merge
bright field merge
OVAMR
MR
A)
MR0.0
0.2
0.4
0.6
0.8
1.0 OVA
PCC
CTL#5
B)
wt MR-/-0
20
40
60
80
100 200 nM
BM-DCs
cells
bou
nd b
y D
NA
[%]
200 nM400 nM
400 nM800 nM
800 nM
ctrl
CTL#5
C)
Results
50
4.2.3 Internalization and cellular localization of BM-DC-binding
aptamers
4.2.3.1 Internalization of aptamers by BM-DCs
Cell-specific aptamers were often reported to be internalized into cells96,99,112,113. To
investigate if aptamers CTL#5, D#5 and D#7 were taken up by BM-DCs, confocal
microscopy was used. 2 x 10⁵ BM-DCs were incubated with 250 nM ATTO 647N-
conjugated aptamers in DC cell medium at 37 °C for 30 minutes (CTL#5) or 10 minutes
(D#5 and D#7), then, the cells were fixed in paraformaldehyde and co-stained with the
membrane marker wheat germ agglutinin (WGA)-Alexa Fluor 488 and the nuclear stain
DAPI. In confocal microscopy, pictures of cells at various depths within the Z-axis were
taken (Z-stacks). The incubation times were chosen in accordance to the incubation
times used in the SELEX approaches.
All aptamers were localized within almost every BM-DC whereby only ~2 % of cells
contained the control sequence (Figure 4.2.5).
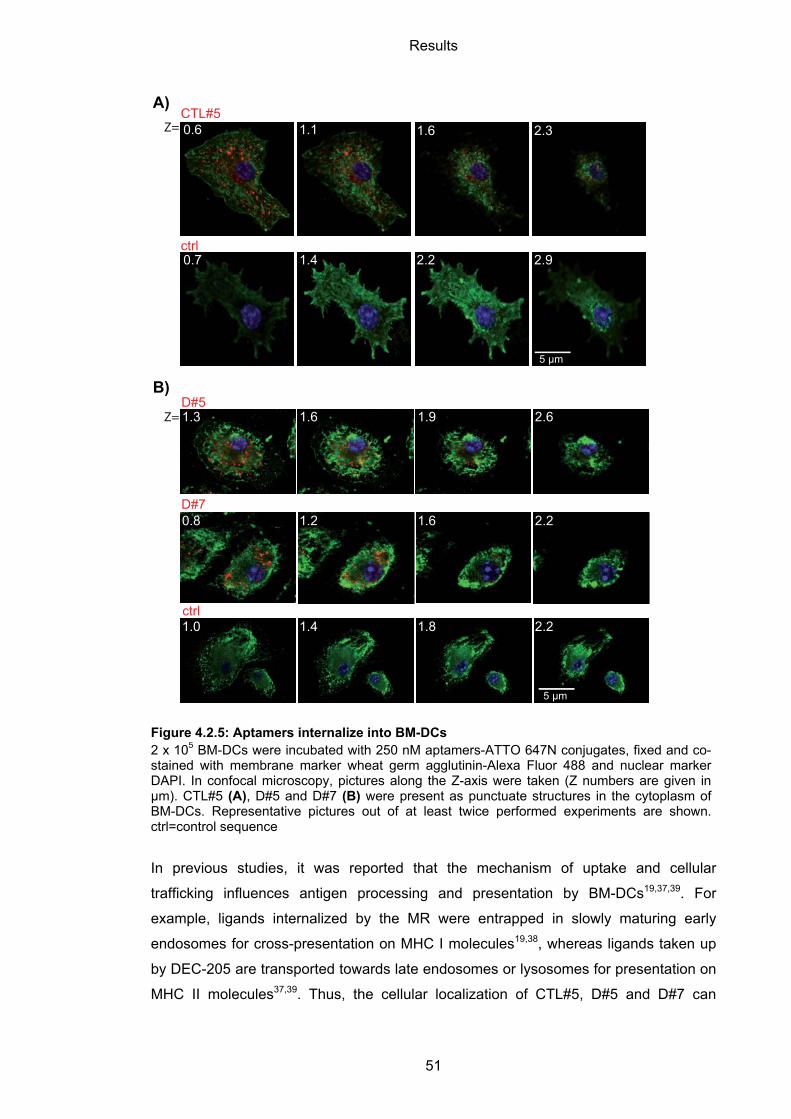
Results
51
Figure 4.2.5: Aptamers internalize into BM-DCs 2 x 10⁵ BM-DCs were incubated with 250 nM aptamers-ATTO 647N conjugates, fixed and co-stained with membrane marker wheat germ agglutinin-Alexa Fluor 488 and nuclear marker DAPI. In confocal microscopy, pictures along the Z-axis were taken (Z numbers are given in µm). CTL#5 (A), D#5 and D#7 (B) were present as punctuate structures in the cytoplasm of BM-DCs. Representative pictures out of at least twice performed experiments are shown. ctrl=control sequence
In previous studies, it was reported that the mechanism of uptake and cellular
trafficking influences antigen processing and presentation by BM-DCs19,37,39. For
example, ligands internalized by the MR were entrapped in slowly maturing early
endosomes for cross-presentation on MHC I molecules19,38, whereas ligands taken up
by DEC-205 are transported towards late endosomes or lysosomes for presentation on
MHC II molecules37,39. Thus, the cellular localization of CTL#5, D#5 and D#7 can
0.6 1.1 1.6 2.3 CTL#5
ctrl0.7 1.4 2.2 2.9
Z=
Z=
1.0 1.4 1.8
D#5
ctrl
D#7
2.2
A)
B)
1.4 1.8 2.2
1.3 1.6 1.9 2.6
222.2.2.2.22.22.2.22222.22.22.22.2222....2...22.2.222222222 2 2 2 222 2222 22222222.11.1.11.1.11.1.1.11.11.1.1.11.1.111.11.111.111111.11.111111.11.11.111.1111.111111.1.1111111.11111.11.111..11.111.1.1111111111.1111111111111111...1111111111111111111111111111111111111 44444444444 444444444 4 4444 4444444444444 4444444444444 44444444444444444444 4444444444444444444444444444444444444444444444444444444 444 44444444444444
0.8 1.2 1.6 2.2
5 μm
5 μm
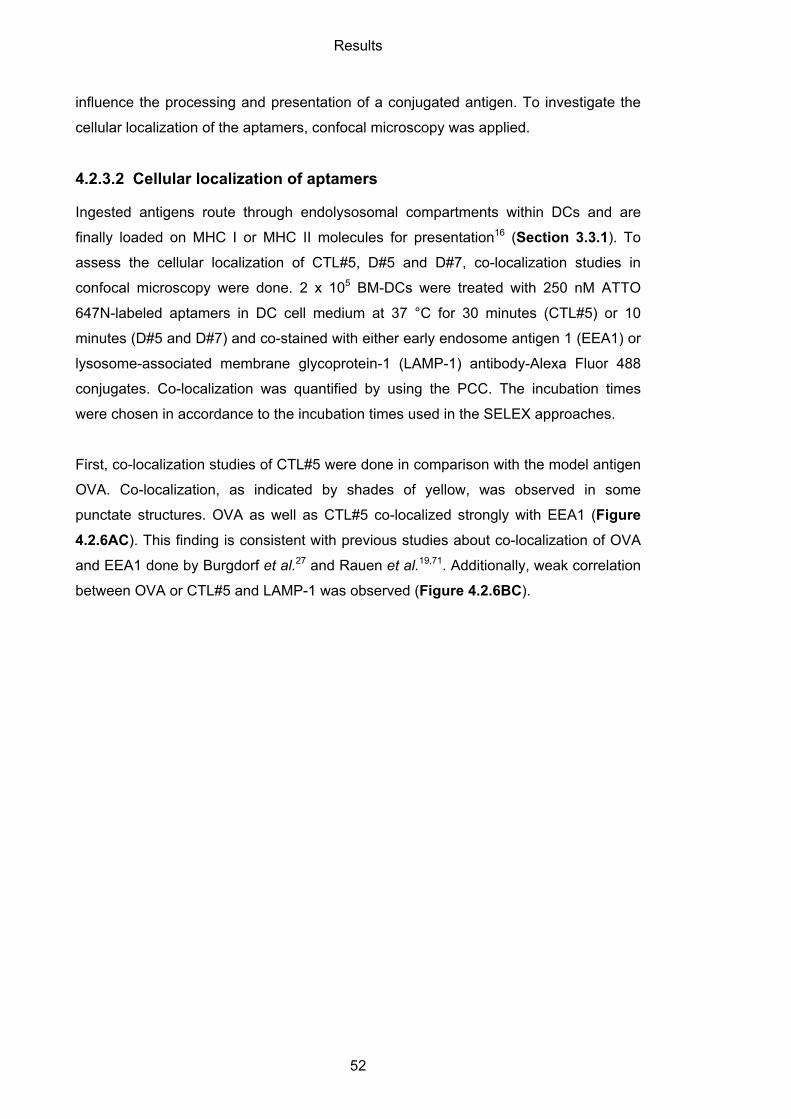
Results
52
influence the processing and presentation of a conjugated antigen. To investigate the
cellular localization of the aptamers, confocal microscopy was applied.
4.2.3.2 Cellular localization of aptamers
Ingested antigens route through endolysosomal compartments within DCs and are
finally loaded on MHC I or MHC II molecules for presentation16 (Section 3.3.1). To
assess the cellular localization of CTL#5, D#5 and D#7, co-localization studies in
confocal microscopy were done. 2 x 10⁵ BM-DCs were treated with 250 nM ATTO
647N-labeled aptamers in DC cell medium at 37 °C for 30 minutes (CTL#5) or 10
minutes (D#5 and D#7) and co-stained with either early endosome antigen 1 (EEA1) or
lysosome-associated membrane glycoprotein-1 (LAMP-1) antibody-Alexa Fluor 488
conjugates. Co-localization was quantified by using the PCC. The incubation times
were chosen in accordance to the incubation times used in the SELEX approaches.
First, co-localization studies of CTL#5 were done in comparison with the model antigen
OVA. Co-localization, as indicated by shades of yellow, was observed in some
punctate structures. OVA as well as CTL#5 co-localized strongly with EEA1 (Figure
4.2.6AC). This finding is consistent with previous studies about co-localization of OVA
and EEA1 done by Burgdorf et al.27 and Rauen et al.19,71. Additionally, weak correlation
between OVA or CTL#5 and LAMP-1 was observed (Figure 4.2.6BC).
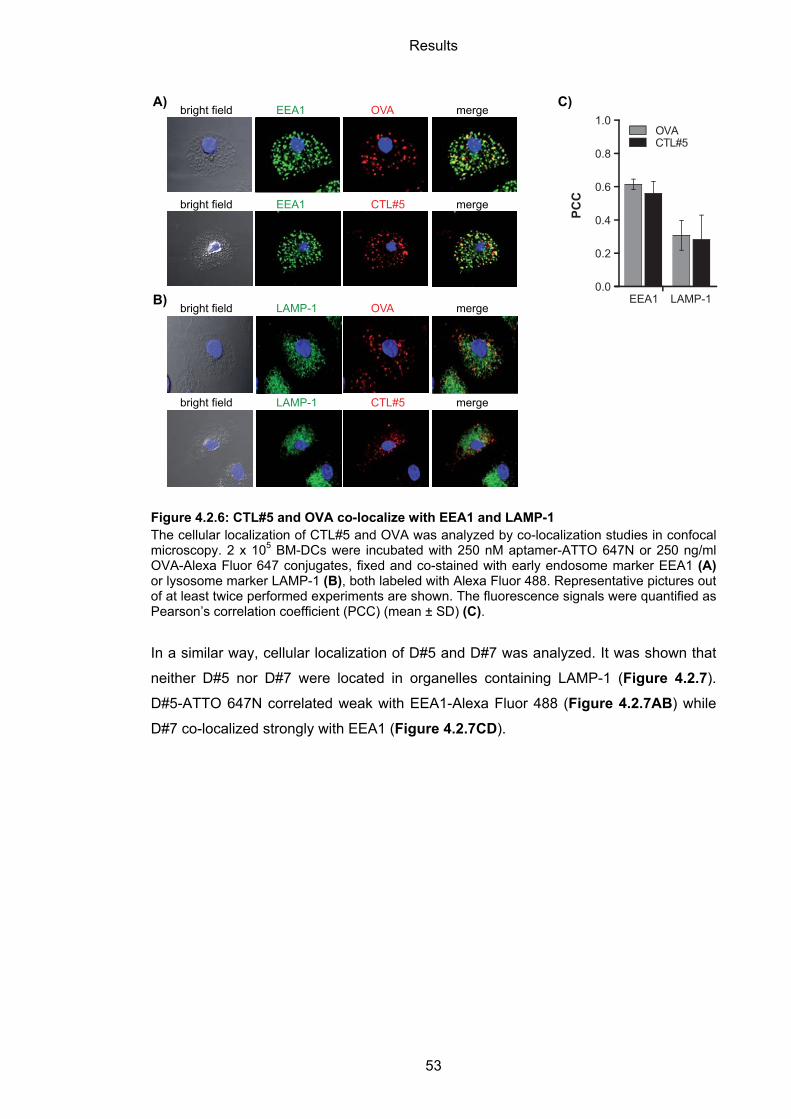
Results
53
Figure 4.2.6: CTL#5 and OVA co-localize with EEA1 and LAMP-1 The cellular localization of CTL#5 and OVA was analyzed by co-localization studies in confocal microscopy. 2 x 10⁵ BM-DCs were incubated with 250 nM aptamer-ATTO 647N or 250 ng/ml OVA-Alexa Fluor 647 conjugates, fixed and co-stained with early endosome marker EEA1 (A) or lysosome marker LAMP-1 (B), both labeled with Alexa Fluor 488. Representative pictures out of at least twice performed experiments are shown. The fluorescence signals were quantified as Pearson’s correlation coefficient (PCC) (mean ± SD) (C).
In a similar way, cellular localization of D#5 and D#7 was analyzed. It was shown that
neither D#5 nor D#7 were located in organelles containing LAMP-1 (Figure 4.2.7).
D#5-ATTO 647N correlated weak with EEA1-Alexa Fluor 488 (Figure 4.2.7AB) while
D#7 co-localized strongly with EEA1 (Figure 4.2.7CD).
A)EEA1bright field
bright field EEA1
merge
mergeCTL#5
OVA
bright field
bright field
merge
merge
LAMP-1
LAMP-1 CTL#5
OVAEEA1 LAMP-1
0.0
0.2
0.4
0.6
0.8
1.0OVA
PCC
CTL#5
C)
B)
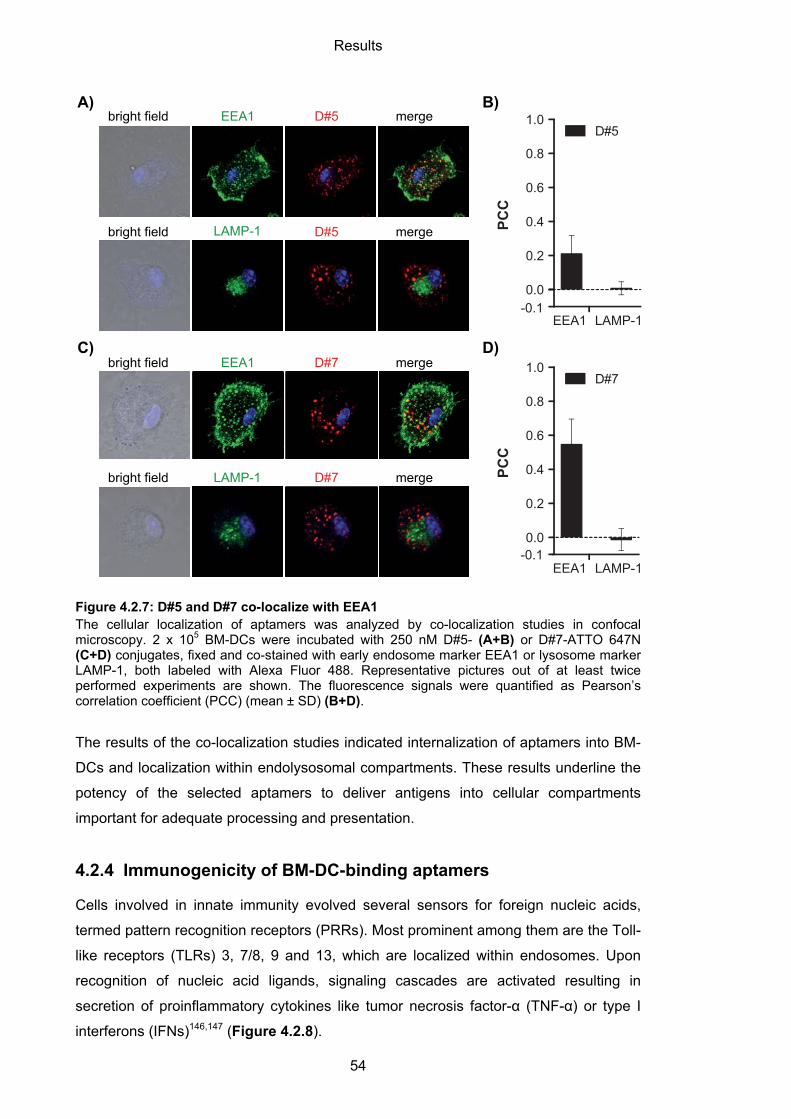
Results
54
Figure 4.2.7: D#5 and D#7 co-localize with EEA1 The cellular localization of aptamers was analyzed by co-localization studies in confocal microscopy. 2 x 10⁵ BM-DCs were incubated with 250 nM D#5- (A+B) or D#7-ATTO 647N (C+D) conjugates, fixed and co-stained with early endosome marker EEA1 or lysosome marker LAMP-1, both labeled with Alexa Fluor 488. Representative pictures out of at least twice performed experiments are shown. The fluorescence signals were quantified as Pearson’s correlation coefficient (PCC) (mean ± SD) (B+D).
The results of the co-localization studies indicated internalization of aptamers into BM-
DCs and localization within endolysosomal compartments. These results underline the
potency of the selected aptamers to deliver antigens into cellular compartments
important for adequate processing and presentation.
4.2.4 Immunogenicity of BM-DC-binding aptamers
Cells involved in innate immunity evolved several sensors for foreign nucleic acids,
termed pattern recognition receptors (PRRs). Most prominent among them are the Toll-
like receptors (TLRs) 3, 7/8, 9 and 13, which are localized within endosomes. Upon
recognition of nucleic acid ligands, signaling cascades are activated resulting in
secretion of proinflammatory cytokines like tumor necrosis factor-α (TNF-α) or type I
interferons (IFNs)146,147 (Figure 4.2.8).
D#5EEA1bright field merge
D#5bright field mergeLAMP-1
D#7EEA1bright field merge
LAMP-1bright field mergeD#7
EEA1 LAMP-1
0.0
0.2
0.4
0.6
0.8
1.0D#7
PCC
-0.1
EEA1 LAMP-1
0.0
0.2
0.4
0.6
0.8
1.0D#5
PCC
-0.1
A) B)
C) D)
Results
55
Figure 4.2.8: Schematic representation of TLR signaling TLR 3, 7/8, 9 and 13 are localized in endosomal compartments. Upon recognition of their nucleic acid ligands, transcription factors such as nuclear factor-κB (NF-κB) and interferon-regulatory factors (IRFs) get activated. Consequence of TLR signaling is the induction of proinflammatory cytokines, e.g. tumor necrosis factor-α (TNF- α) and type I interferons (IFNs). ds=double-stranded, ss=single-stranded, r=ribosomal
To investigate if BM-DC targeting aptamers were sensed by TLRs, secretion of TNF-α
was measured by homogeneous time-resolved fluorescence (HTRF) assay. It was
performed in close collaboration with Prof. Eicke Latz. HTRF is based on fluorescence
resonance energy transfer (FRET). Here, FRET donor and acceptor molecules were
attached to anti-TNF-α antibodies and in close proximity to the molecules the
fluorescence emission spectrum changes. This change is proportional to the TNF-α
concentration in the sample.
Immortalized murine embryonic stem cell-derived macrophages were used to
investigate TLR activation. CpG ODN 1826 is described to activate TLR9148 and was
used as positive control. In general, CpG ODNs are composed of unmethylated CpG
motif (cytosine - phosphodiester or phosphorothioate - guanosine) flanked by 5’ purines
and 3’ pyrimidines149. Here, to increase stability, CpG ODN 1826 has a
phosphorothioate backbone. As expected, CpG ODN 1826 activated TNF-α secretion
at concentrations in the nanomolar range (Figure 4.2.9A). The DNA library used for
aptamer selection induced TNF-α production at concentrations higher than 0.5 µM
(Figure 4.2.9AB). In comparison, all aptamers demonstrated low TLR activation only at
the highest concentration of 3 µM. D#5 mediated secretion of around 220 pg/ml TNF-α
Endosome
TLR3
TLR7/8 TLR9
TLR13
ds RNA
ssRNACpG-DNA
rRNA
type I IFN (IFNα and IFNβ)
proinflammatory cytokines (e.g. TNF-α)
NF-κB IRFs
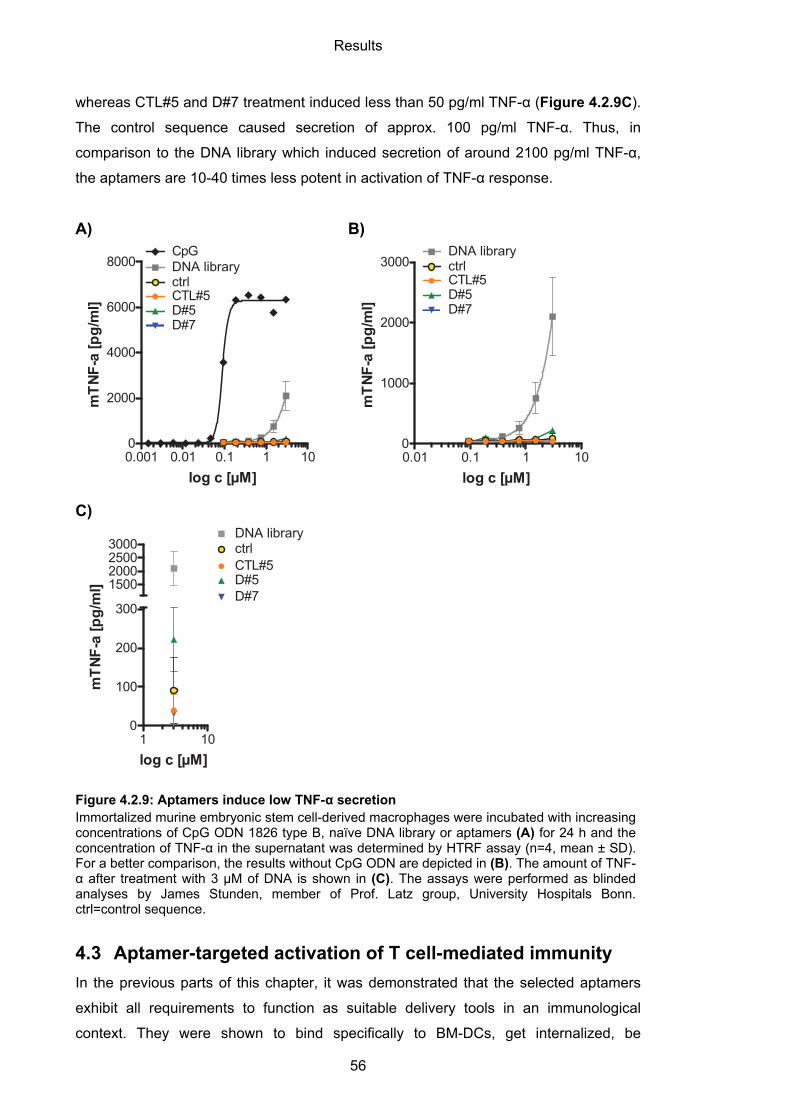
Results
56
whereas CTL#5 and D#7 treatment induced less than 50 pg/ml TNF-α (Figure 4.2.9C).
The control sequence caused secretion of approx. 100 pg/ml TNF-α. Thus, in
comparison to the DNA library which induced secretion of around 2100 pg/ml TNF-α,
the aptamers are 10-40 times less potent in activation of TNF-α response.
Figure 4.2.9: Aptamers induce low TNF-α secretion Immortalized murine embryonic stem cell-derived macrophages were incubated with increasing concentrations of CpG ODN 1826 type B, naïve DNA library or aptamers (A) for 24 h and the concentration of TNF-α in the supernatant was determined by HTRF assay (n=4, mean ± SD). For a better comparison, the results without CpG ODN are depicted in (B). The amount of TNF-α after treatment with 3 µM of DNA is shown in (C). The assays were performed as blinded analyses by James Stunden, member of Prof. Latz group, University Hospitals Bonn. ctrl=control sequence.
4.3 Aptamer-targeted activation of T cell-mediated immunity
In the previous parts of this chapter, it was demonstrated that the selected aptamers
exhibit all requirements to function as suitable delivery tools in an immunological
context. They were shown to bind specifically to BM-DCs, get internalized, be
B)
0.01 0.1 1 100
1000
2000
3000
log c [μM]
mTN
F-a
[pg/
ml]
DNA library
D#7D#5
ctrlCTL#5
A)
0.001 0.01 0.1 1 100
2000
4000
6000
8000
log c [μM]
mTN
F-a
[pg/
ml]
DNA libraryCpG
D#7D#5
ctrlCTL#5
1 100
100
200
300
1500200025003000
log c [μM]
mTN
F-a
[pg/
ml]
DNA library
D#7D#5
ctrlCTL#5
C)
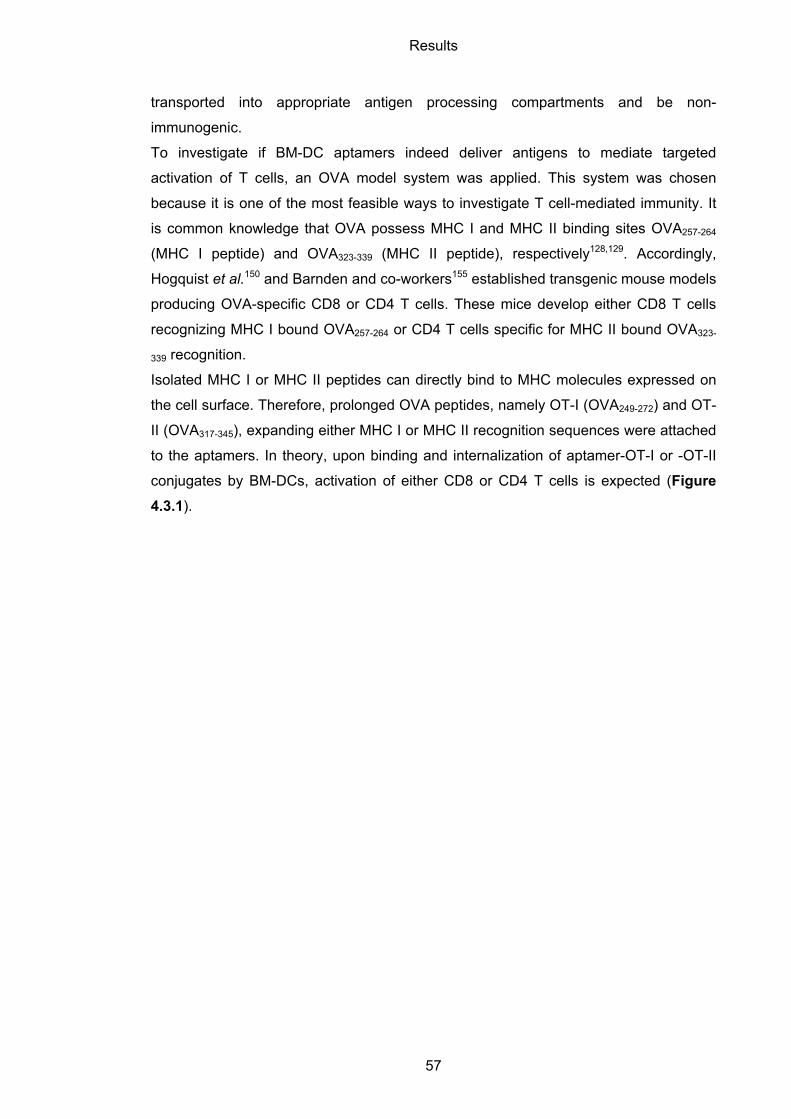
Results
57
transported into appropriate antigen processing compartments and be non-
immunogenic.
To investigate if BM-DC aptamers indeed deliver antigens to mediate targeted
activation of T cells, an OVA model system was applied. This system was chosen
because it is one of the most feasible ways to investigate T cell-mediated immunity. It
is common knowledge that OVA possess MHC I and MHC II binding sites OVA257-264
(MHC I peptide) and OVA323-339 (MHC II peptide), respectively128,129. Accordingly,
Hogquist et al.150 and Barnden and co-workers155 established transgenic mouse models
producing OVA-specific CD8 or CD4 T cells. These mice develop either CD8 T cells
recognizing MHC I bound OVA257-264 or CD4 T cells specific for MHC II bound OVA323-
339 recognition.
Isolated MHC I or MHC II peptides can directly bind to MHC molecules expressed on
the cell surface. Therefore, prolonged OVA peptides, namely OT-I (OVA249-272) and OT-
II (OVA317-345), expanding either MHC I or MHC II recognition sequences were attached
to the aptamers. In theory, upon binding and internalization of aptamer-OT-I or -OT-II
conjugates by BM-DCs, activation of either CD8 or CD4 T cells is expected (Figure
4.3.1).
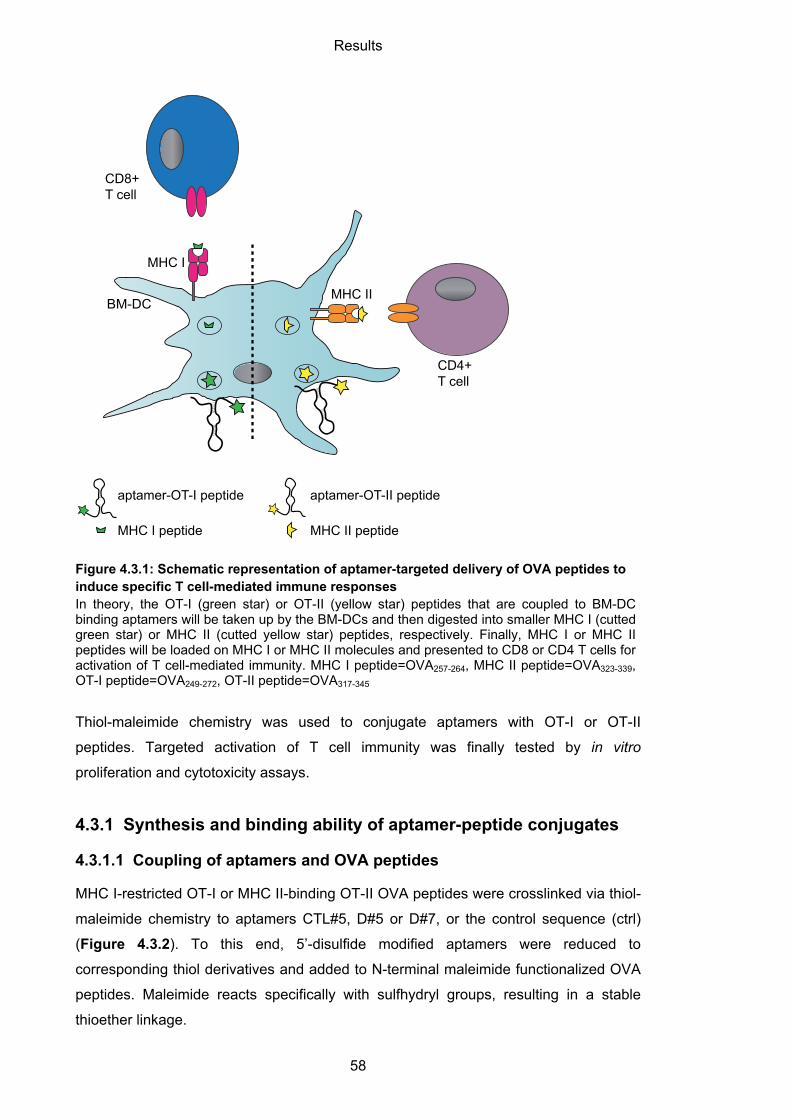
Results
58
Figure 4.3.1: Schematic representation of aptamer-targeted delivery of OVA peptides to induce specific T cell-mediated immune responses In theory, the OT-I (green star) or OT-II (yellow star) peptides that are coupled to BM-DC binding aptamers will be taken up by the BM-DCs and then digested into smaller MHC I (cutted green star) or MHC II (cutted yellow star) peptides, respectively. Finally, MHC I or MHC II peptides will be loaded on MHC I or MHC II molecules and presented to CD8 or CD4 T cells for activation of T cell-mediated immunity. MHC I peptide=OVA257-264, MHC II peptide=OVA323-339, OT-I peptide=OVA249-272, OT-II peptide=OVA317-345
Thiol-maleimide chemistry was used to conjugate aptamers with OT-I or OT-II
peptides. Targeted activation of T cell immunity was finally tested by in vitro
proliferation and cytotoxicity assays.
4.3.1 Synthesis and binding ability of aptamer-peptide conjugates
4.3.1.1 Coupling of aptamers and OVA peptides
MHC I-restricted OT-I or MHC II-binding OT-II OVA peptides were crosslinked via thiol-
maleimide chemistry to aptamers CTL#5, D#5 or D#7, or the control sequence (ctrl)
(Figure 4.3.2). To this end, 5’-disulfide modified aptamers were reduced to
corresponding thiol derivatives and added to N-terminal maleimide functionalized OVA
peptides. Maleimide reacts specifically with sulfhydryl groups, resulting in a stable
thioether linkage.
CD8+ T cell
BM-DC
MHC I
CD4+ T cell
MHC II
aptamer-OT-I peptide aptamer-OT-II peptide
MHC I peptide MHC II peptide
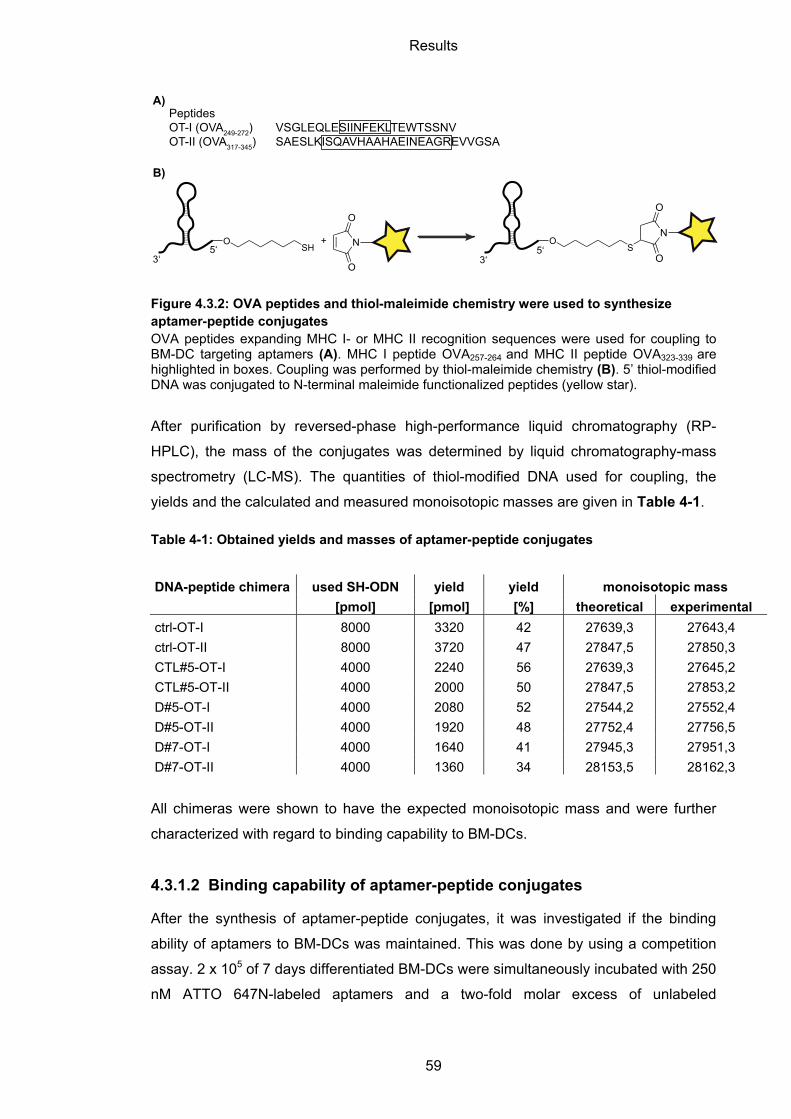
Results
59
Figure 4.3.2: OVA peptides and thiol-maleimide chemistry were used to synthesize aptamer-peptide conjugates OVA peptides expanding MHC I- or MHC II recognition sequences were used for coupling to BM-DC targeting aptamers (A). MHC I peptide OVA257-264 and MHC II peptide OVA323-339 are highlighted in boxes. Coupling was performed by thiol-maleimide chemistry (B). 5’ thiol-modified DNA was conjugated to N-terminal maleimide functionalized peptides (yellow star).
After purification by reversed-phase high-performance liquid chromatography (RP-
HPLC), the mass of the conjugates was determined by liquid chromatography-mass
spectrometry (LC-MS). The quantities of thiol-modified DNA used for coupling, the
yields and the calculated and measured monoisotopic masses are given in Table 4-1.
Table 4-1: Obtained yields and masses of aptamer-peptide conjugates
DNA-peptide chimera used SH-ODN yield yield monoisotopic mass
[pmol] [pmol] [%] theoretical experimental
ctrl-OT-I 8000 3320 42 27639,3 27643,4
ctrl-OT-II 8000 3720 47 27847,5 27850,3
CTL#5-OT-I 4000 2240 56 27639,3 27645,2
CTL#5-OT-II 4000 2000 50 27847,5 27853,2
D#5-OT-I 4000 2080 52 27544,2 27552,4
D#5-OT-II 4000 1920 48 27752,4 27756,5
D#7-OT-I 4000 1640 41 27945,3 27951,3
D#7-OT-II 4000 1360 34 28153,5 28162,3
All chimeras were shown to have the expected monoisotopic mass and were further
characterized with regard to binding capability to BM-DCs.
4.3.1.2 Binding capability of aptamer-peptide conjugates
After the synthesis of aptamer-peptide conjugates, it was investigated if the binding
ability of aptamers to BM-DCs was maintained. This was done by using a competition
assay. 2 x 10⁵ of 7 days differentiated BM-DCs were simultaneously incubated with 250
nM ATTO 647N-labeled aptamers and a two-fold molar excess of unlabeled
PeptidesOT-I (OVA249-272) VSGLEQLESIINFEKLTEWTSSNVOT-II (OVA317-345) SAESLKISQAVHAAHAEINEAGREVVGSA
N
O
OS
ON
O
O
OSH
3‘5‘
3‘5‘
+
A)
B)
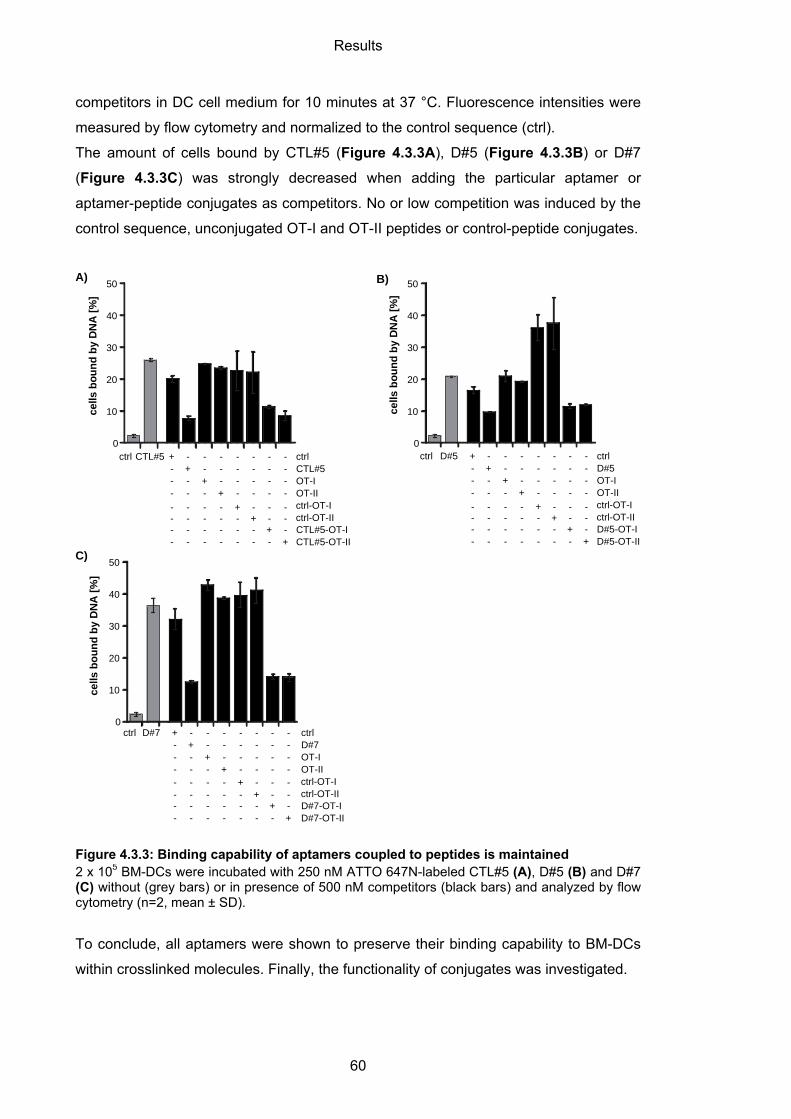
Results
60
competitors in DC cell medium for 10 minutes at 37 °C. Fluorescence intensities were
measured by flow cytometry and normalized to the control sequence (ctrl).
The amount of cells bound by CTL#5 (Figure 4.3.3A), D#5 (Figure 4.3.3B) or D#7
(Figure 4.3.3C) was strongly decreased when adding the particular aptamer or
aptamer-peptide conjugates as competitors. No or low competition was induced by the
control sequence, unconjugated OT-I and OT-II peptides or control-peptide conjugates.
Figure 4.3.3: Binding capability of aptamers coupled to peptides is maintained 2 x 10⁵ BM-DCs were incubated with 250 nM ATTO 647N-labeled CTL#5 (A), D#5 (B) and D#7 (C) without (grey bars) or in presence of 500 nM competitors (black bars) and analyzed by flow cytometry (n=2, mean ± SD).
To conclude, all aptamers were shown to preserve their binding capability to BM-DCs
within crosslinked molecules. Finally, the functionality of conjugates was investigated.
ctrl D#7 ctrl D#7 OT-I OT-II
D#7-OT-I D#7-OT-II
0
10
20
30
40
50
cells
bou
nd b
y D
NA
[%]
++
++
--
- - - - -- - - -
- - - - -- - - - -
- -- - -- - - - --
ctrl-OT-Ictrl-OT-II
++- - - - -
- - - - -
++
- -- -- -- -- -- -
--
0
10
20
30
40
50
cells
bou
nd b
y D
NA
[%]
ctrl D#5 ctrl D#5 OT-I OT-II
D#5-OT-I D#5-OT-II
++
++
--
- - - - -- - - -
- - - - -- - - - -
- -- - -- - - - --
ctrl-OT-Ictrl-OT-II
++- - - - -
- - - - -
++
- -- -- -- -- -- -
--
B)
C)
A)
0
10
20
30
40
50
cells
bou
nd b
y D
NA
[%]
ctrl CTL#5 ctrl CTL#5 OT-I OT-II
CTL#5-OT-I CTL#5-OT-II
++
++
--
- - - - -- - - -
- - - - -- - - - -
- -- - -- - - - --
ctrl-OT-Ictrl-OT-II
++- - - - -
- - - - -
++
- -- -- -- -- -- -
--
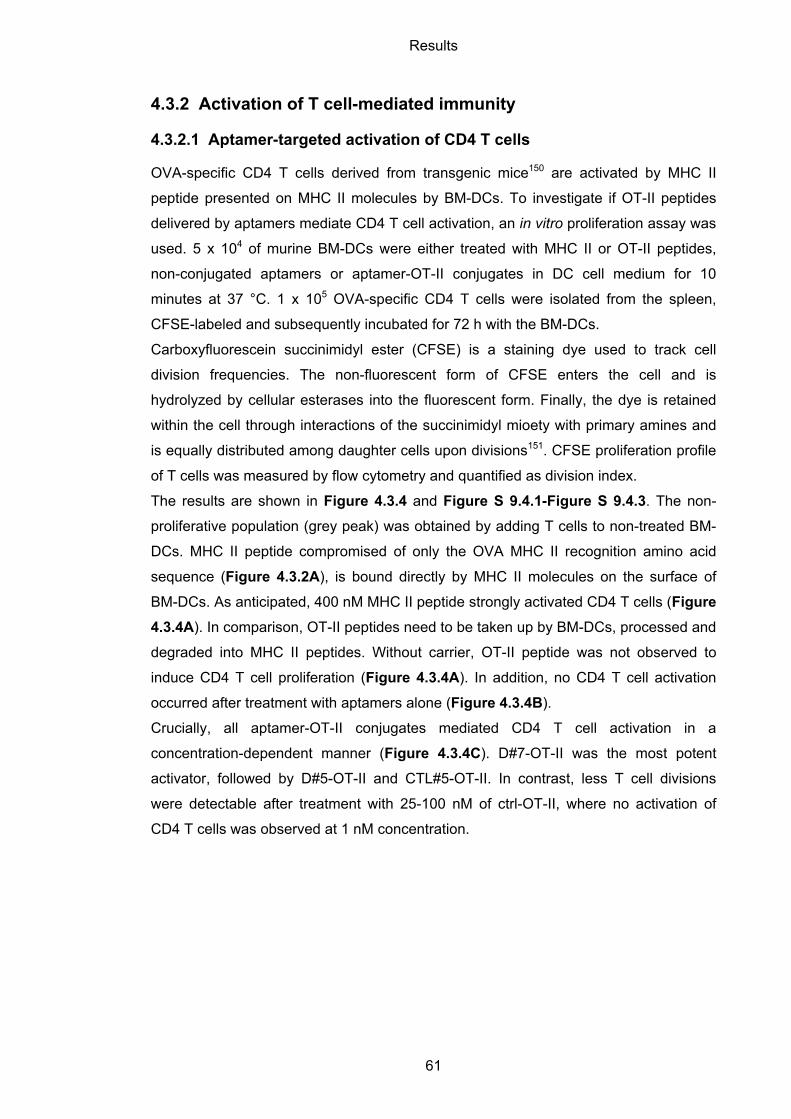
Results
61
4.3.2 Activation of T cell-mediated immunity
4.3.2.1 Aptamer-targeted activation of CD4 T cells
OVA-specific CD4 T cells derived from transgenic mice150 are activated by MHC II
peptide presented on MHC II molecules by BM-DCs. To investigate if OT-II peptides
delivered by aptamers mediate CD4 T cell activation, an in vitro proliferation assay was
used. 5 x 10⁴ of murine BM-DCs were either treated with MHC II or OT-II peptides,
non-conjugated aptamers or aptamer-OT-II conjugates in DC cell medium for 10
minutes at 37 °C. 1 x 10⁵ OVA-specific CD4 T cells were isolated from the spleen,
CFSE-labeled and subsequently incubated for 72 h with the BM-DCs.
Carboxyfluorescein succinimidyl ester (CFSE) is a staining dye used to track cell
division frequencies. The non-fluorescent form of CFSE enters the cell and is
hydrolyzed by cellular esterases into the fluorescent form. Finally, the dye is retained
within the cell through interactions of the succinimidyl mioety with primary amines and
is equally distributed among daughter cells upon divisions151. CFSE proliferation profile
of T cells was measured by flow cytometry and quantified as division index.
The results are shown in Figure 4.3.4 and Figure S 9.4.1-Figure S 9.4.3. The non-
proliferative population (grey peak) was obtained by adding T cells to non-treated BM-
DCs. MHC II peptide compromised of only the OVA MHC II recognition amino acid
sequence (Figure 4.3.2A), is bound directly by MHC II molecules on the surface of
BM-DCs. As anticipated, 400 nM MHC II peptide strongly activated CD4 T cells (Figure
4.3.4A). In comparison, OT-II peptides need to be taken up by BM-DCs, processed and
degraded into MHC II peptides. Without carrier, OT-II peptide was not observed to
induce CD4 T cell proliferation (Figure 4.3.4A). In addition, no CD4 T cell activation
occurred after treatment with aptamers alone (Figure 4.3.4B).
Crucially, all aptamer-OT-II conjugates mediated CD4 T cell activation in a
concentration-dependent manner (Figure 4.3.4C). D#7-OT-II was the most potent
activator, followed by D#5-OT-II and CTL#5-OT-II. In contrast, less T cell divisions
were detectable after treatment with 25-100 nM of ctrl-OT-II, where no activation of
CD4 T cells was observed at 1 nM concentration.
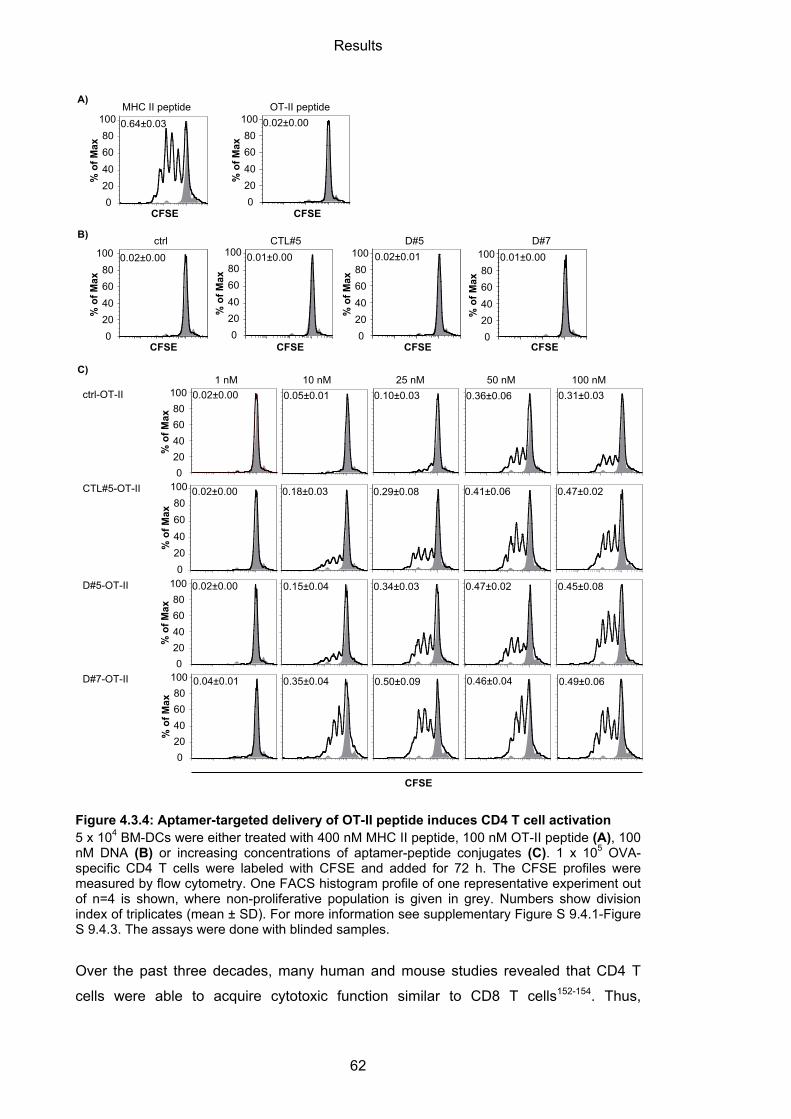
Results
62
Figure 4.3.4: Aptamer-targeted delivery of OT-II peptide induces CD4 T cell activation 5 x 10⁴ BM-DCs were either treated with 400 nM MHC II peptide, 100 nM OT-II peptide (A), 100 nM DNA (B) or increasing concentrations of aptamer-peptide conjugates (C). 1 x 10⁵ OVA-specific CD4 T cells were labeled with CFSE and added for 72 h. The CFSE profiles were measured by flow cytometry. One FACS histogram profile of one representative experiment out of n=4 is shown, where non-proliferative population is given in grey. Numbers show division index of triplicates (mean ± SD). For more information see supplementary Figure S 9.4.1-Figure S 9.4.3. The assays were done with blinded samples.
Over the past three decades, many human and mouse studies revealed that CD4 T
cells were able to acquire cytotoxic function similar to CD8 T cells152-154. Thus,
A)
D#7
OT-II peptideMHC II peptide
100 nM 50 nM 25 nM 10 nM 1 nM ctrl-OT-II
D#7-OT-II
D#5-OT-II
CFSE
CFSE
ctrl
CFSE CFSE
CFSE
C)
CFSE
D#5CTL#5
020406080
100
% o
f Max
0.64±0.03
020406080
100
% o
f Max
0.02±0.00
020406080
100
% o
f Max
0.02±0.00
020406080
100
% o
f Max
0.01±0.00
020406080
100
% o
f Max
0.02±0.01
020406080
100
% o
f Max
0.01±0.00
020406080
100
% o
f Max
0.02±0.00 0.05±0.01 0.10±0.03 0.36±0.06 0.31±0.03
020406080
100
% o
f Max
0.02±0.00 0.18±0.03 0.29±0.08 0.41±0.06 0.47±0.02CTL#5-OT-II
020406080
100
% o
f Max
0.02±0.00 0.15±0.04 0.34±0.03 0.47±0.02 0.45±0.08
020406080
100
% o
f Max
0.04±0.01 0.35±0.04 0.50±0.09 0.46±0.04 0.49±0.06
CFSE
B)
Results
63
activation of OVA-specific CD4 T cells was further analyzed by an in vitro cytotoxicity
assay.
4.3.2.2 Cytotoxic capacity of activated CD4 T cells
In theory, cytotoxic CD4 T cells recognize their respective antigens on MHC II
molecules and induce apoptosis of the carrier cell.
To investigate if the most potent CD4 T cell activator D#7-OT-II (Figure 4.3.4C)
induces CD4-mediated cytotoxicity, an in vitro cytotoxicity assay was applied. On that
account, 2 x 10⁵ BM-DCs were incubated with MHC II peptide, D#7-OT-II or ctrl-OT-II
in DC cell medium for 10 minutes at 37 °C. 4 x 10⁵ CD4 T cells were primed for 72 h by
the differently treated BM-DCs, isolated and added to a mixture of differently CFSE-
labeled target cells loaded with MHC II peptide and non-loaded control cells. On day 5,
the target and control cells were stained with the viability marker Hoechst and analyzed
by flow cytometry.
As a result, no cytotoxic capacity of CD4 T cells was detectable upon priming with
MHC II peptide, ctrl-OT-II or D#7-OT-II treated BM-DCs (Figure 4.3.5).
Figure 4.3.5: CD4 cytotoxicity is not induced by aptamer-peptide conjugates 2 x 10⁵ BM-DCs were treated with 400 nM MHC II peptide, 100 nM D#7-OT-II or ctrl-OT-II conjugates. Next, 4 x 10⁵ OVA-specific CD4 T cells were added. After 72 h, T cells were isolated by density gradient separation and incubated for another 24 h with CFSE-labeled target and control cells. Alive and dead target and control cells were distinguished by flow cytometry according to CFSE and Hoechst 33258 signals. The percentages of T cell cytotoxicity were determined (n=3, mean ± SD).
In summary, the results of the in vitro proliferation assay (Figure 4.3.4) validate the
usefulness of aptamers CTL#5, D#5 and D#7 as potent mediators of specific CD4 T
cell activation. However, activation of T cells by D#7-OT-II was not resulting in cytotoxic
capability.
1:1 5:1 10:10
10
20
30
40
CD4 T cells/Target cells
MHC II peptide
ctrl-OT-IID#7-OT-II
cyto
toxi
city
[%]
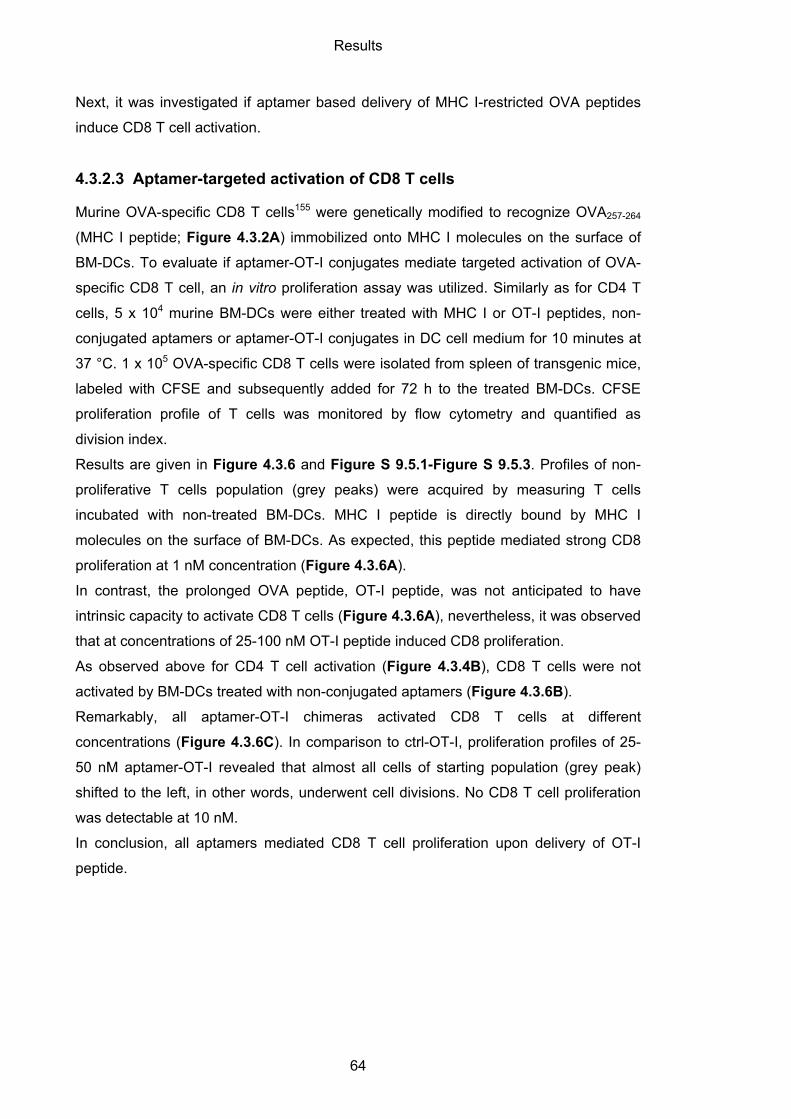
Results
64
Next, it was investigated if aptamer based delivery of MHC I-restricted OVA peptides
induce CD8 T cell activation.
4.3.2.3 Aptamer-targeted activation of CD8 T cells
Murine OVA-specific CD8 T cells155 were genetically modified to recognize OVA257-264
(MHC I peptide; Figure 4.3.2A) immobilized onto MHC I molecules on the surface of
BM-DCs. To evaluate if aptamer-OT-I conjugates mediate targeted activation of OVA-
specific CD8 T cell, an in vitro proliferation assay was utilized. Similarly as for CD4 T
cells, 5 x 10⁴ murine BM-DCs were either treated with MHC I or OT-I peptides, non-
conjugated aptamers or aptamer-OT-I conjugates in DC cell medium for 10 minutes at
37 °C. 1 x 10⁵ OVA-specific CD8 T cells were isolated from spleen of transgenic mice,
labeled with CFSE and subsequently added for 72 h to the treated BM-DCs. CFSE
proliferation profile of T cells was monitored by flow cytometry and quantified as
division index.
Results are given in Figure 4.3.6 and Figure S 9.5.1-Figure S 9.5.3. Profiles of non-
proliferative T cells population (grey peaks) were acquired by measuring T cells
incubated with non-treated BM-DCs. MHC I peptide is directly bound by MHC I
molecules on the surface of BM-DCs. As expected, this peptide mediated strong CD8
proliferation at 1 nM concentration (Figure 4.3.6A).
In contrast, the prolonged OVA peptide, OT-I peptide, was not anticipated to have
intrinsic capacity to activate CD8 T cells (Figure 4.3.6A), nevertheless, it was observed
that at concentrations of 25-100 nM OT-I peptide induced CD8 proliferation.
As observed above for CD4 T cell activation (Figure 4.3.4B), CD8 T cells were not
activated by BM-DCs treated with non-conjugated aptamers (Figure 4.3.6B).
Remarkably, all aptamer-OT-I chimeras activated CD8 T cells at different
concentrations (Figure 4.3.6C). In comparison to ctrl-OT-I, proliferation profiles of 25-
50 nM aptamer-OT-I revealed that almost all cells of starting population (grey peak)
shifted to the left, in other words, underwent cell divisions. No CD8 T cell proliferation
was detectable at 10 nM.
In conclusion, all aptamers mediated CD8 T cell proliferation upon delivery of OT-I
peptide.
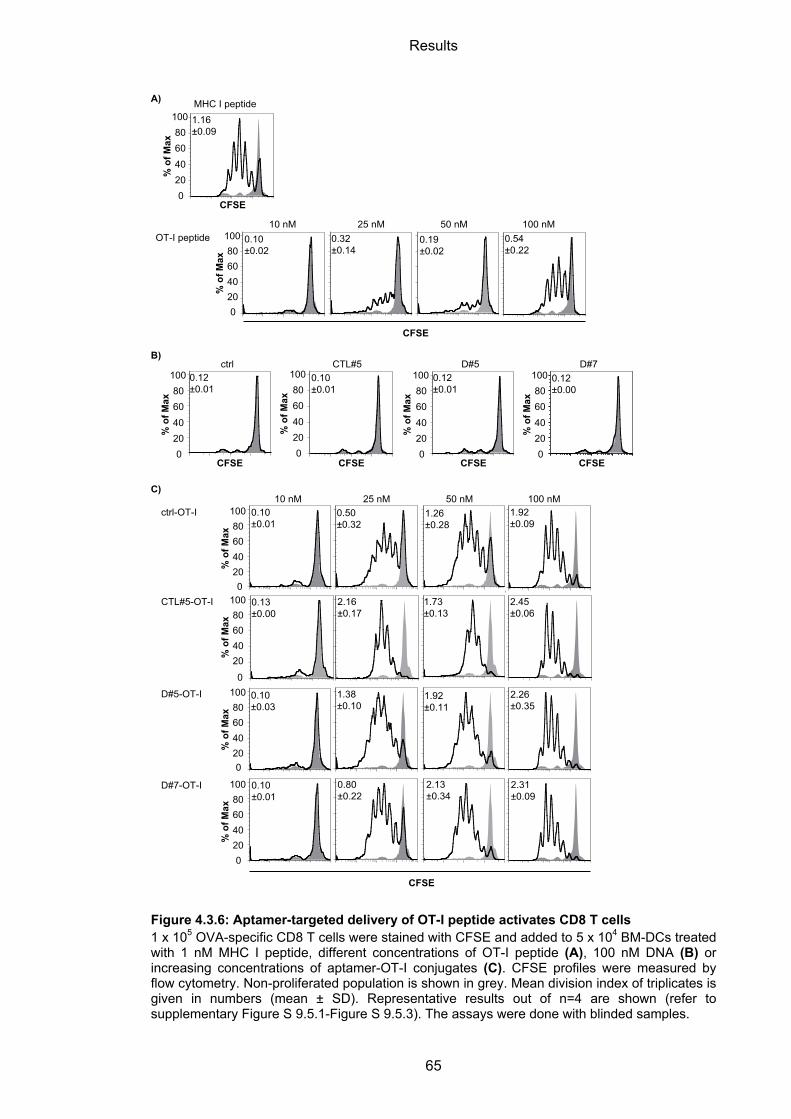
Results
65
Figure 4.3.6: Aptamer-targeted delivery of OT-I peptide activates CD8 T cells 1 x 10⁵ OVA-specific CD8 T cells were stained with CFSE and added to 5 x 10⁴ BM-DCs treated with 1 nM MHC I peptide, different concentrations of OT-I peptide (A), 100 nM DNA (B) or increasing concentrations of aptamer-OT-I conjugates (C). CFSE profiles were measured by flow cytometry. Non-proliferated population is shown in grey. Mean division index of triplicates is given in numbers (mean ± SD). Representative results out of n=4 are shown (refer to supplementary Figure S 9.5.1-Figure S 9.5.3). The assays were done with blinded samples.
100 nM 25 nM 10 nM ctrl-OT-I
D#7-OT-I
D#5-OT-I
CFSE
C)
A) MHC I peptide
CFSE
ctrl
CFSE
D#5
CFSE
D#7
CFSE
CTL#5-OT-I
CFSE
CTL#5
020406080
100
% o
f Max
1.16±0.09
020406080
100
% o
f Max
0.12±0.01
020406080
100
% o
f Max
0.10±0.01
020406080
100
% o
f Max
0.12±0.01
020406080
100
% o
f Max
0.12±0.00
20406080
100
% o
f Max
0
0.10±0.01
1.92±0.09
20406080
100
% o
f Max
0
0.13±0.00
2.16±0.17
2.45±0.06
020406080
100
% o
f Max
0.10±0.03
1.38±0.10
2.26±0.35
020406080
100
% o
f Max
0.10±0.01
0.80±0.22
2.31±0.09
2.13±0.34
1.92±0.11
1.73±0.13
1.26±0.28
B)
50 nM 0.50±0.32
100 nM 25 nM 10 nM OT-I peptide
020406080
100
% o
f Max
0.10±0.02
0.32±0.14
0.54±0.22
0.19±0.02
50 nM
CFSE
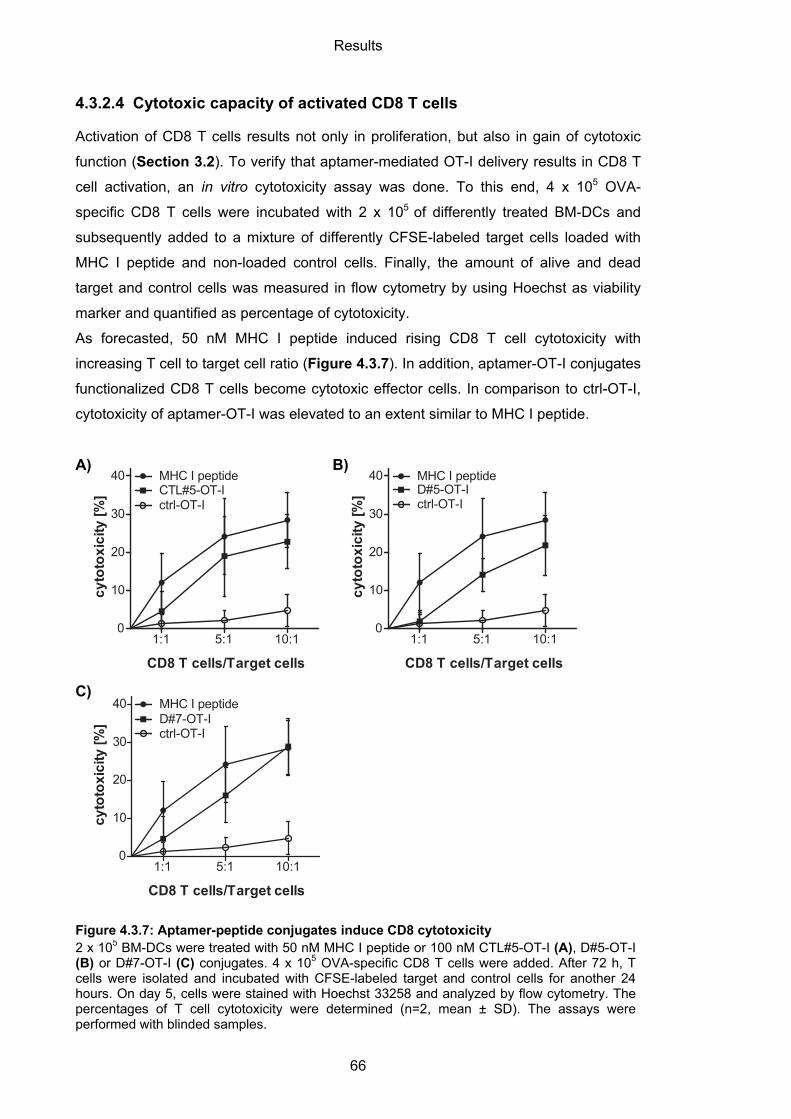
Results
66
4.3.2.4 Cytotoxic capacity of activated CD8 T cells
Activation of CD8 T cells results not only in proliferation, but also in gain of cytotoxic
function (Section 3.2). To verify that aptamer-mediated OT-I delivery results in CD8 T
cell activation, an in vitro cytotoxicity assay was done. To this end, 4 x 10⁵ OVA-
specific CD8 T cells were incubated with 2 x 10⁵ of differently treated BM-DCs and
subsequently added to a mixture of differently CFSE-labeled target cells loaded with
MHC I peptide and non-loaded control cells. Finally, the amount of alive and dead
target and control cells was measured in flow cytometry by using Hoechst as viability
marker and quantified as percentage of cytotoxicity.
As forecasted, 50 nM MHC I peptide induced rising CD8 T cell cytotoxicity with
increasing T cell to target cell ratio (Figure 4.3.7). In addition, aptamer-OT-I conjugates
functionalized CD8 T cells become cytotoxic effector cells. In comparison to ctrl-OT-I,
cytotoxicity of aptamer-OT-I was elevated to an extent similar to MHC I peptide.
Figure 4.3.7: Aptamer-peptide conjugates induce CD8 cytotoxicity 2 x 10⁵ BM-DCs were treated with 50 nM MHC I peptide or 100 nM CTL#5-OT-I (A), D#5-OT-I (B) or D#7-OT-I (C) conjugates. 4 x 10⁵ OVA-specific CD8 T cells were added. After 72 h, T cells were isolated and incubated with CFSE-labeled target and control cells for another 24 hours. On day 5, cells were stained with Hoechst 33258 and analyzed by flow cytometry. The percentages of T cell cytotoxicity were determined (n=2, mean ± SD). The assays were performed with blinded samples.
B)A)
C)
1:1 5:1 10:10
10
20
30
40
CD8 T cells/Target cells
cyto
toxi
city
[%]
MHC I peptide
ctrl-OT-ICTL#5-OT-I
1:1 5:1 10:10
10
20
30
40
CD8 T cells/Target cells
cyto
toxi
city
[%]
MHC I peptide
ctrl-OT-ID#7-OT-I
1:1 5:1 10:10
10
20
30
40
CD8 T cells/Target cells
cyto
toxi
city
[%]
MHC I peptide
ctrl-OT-ID#5-OT-I

Results
67
These data highlight that aptamer-targeted delivery of OT-I peptide indeed activates
CD8 T cells.
Discussion
68
5 Discussion
Protective immunity requires strong activation of T cells. DCs mediate the transition
between innate immunity and adaptive T cell-mediated immunity allowing for such
activation to occur. Hence, DC-based vaccination is an emerging field in
immunotherapy. One approach for developing a DC vaccine is to conjugate antigens to
carrier molecules that specifically target DCs.
Carrier molecules used thus far exhibit several limitations such as cost-intensive
manufacturing, chemical stability, variations in production charges or intrinsic
immunostimulatory potential. A novel promising class of carriers that might overcome
these limitations are aptamers.
In the study at hand, it was investigated if aptamers are capable to mediate T cell
activation through targeted delivery of antigens to DCs. Therefore, aptamers targeting
DCs were selected by two different strategies. First, aptamer CTL#5 was identified by
addressing recombinant proteins originated from the cell surface receptor MR in a
SELEX approach. Second, aptamers D#5 and D#7 were selected without knowledge of
the respective target structure by directly using BM-DCs in a cell-SELEX process.
Next, the properties of the selected aptamers were elucidated. All identified candidate
aptamers were found to bind BM-DCs, were internalized and localized within
appropriate antigen processing compartments and had low immunogenicity.
Finally, functionality of aptamers as DC-targeting carrier molecules was analyzed in an
OVA model system. Remarkably, aptamers conjugated to antigenic OVA peptides are
potent mediators of targeted activation of OVA-specific T cells.
5.1 Selection of DC-targeting aptamers
5.1.1 Protein-SELEX
DCs express a variety of endocytic receptors that are crucial for recognizing and
processing antigenic structures for efficient T cell activation. Prominent examples are
C-type lectin receptors, e.g. the MR31,138 (Section 3.3.2). It is described that the
recognition and uptake of pathogens by C-type lectin receptors determine the
subsequent processing and antigen presentation19,37. The C-type lectin receptor MR is
known to direct antigens towards cross-presentation for CD8 T cell activation19,38. Thus,
the MR was chosen as an attractive target to identify aptamers that are internalized
and localized in DCs in a similar way as MR ligands. In this work, the recombinant
proteins Fc-CTL and Fc-FN, composed of domains of murine MR, were used in a
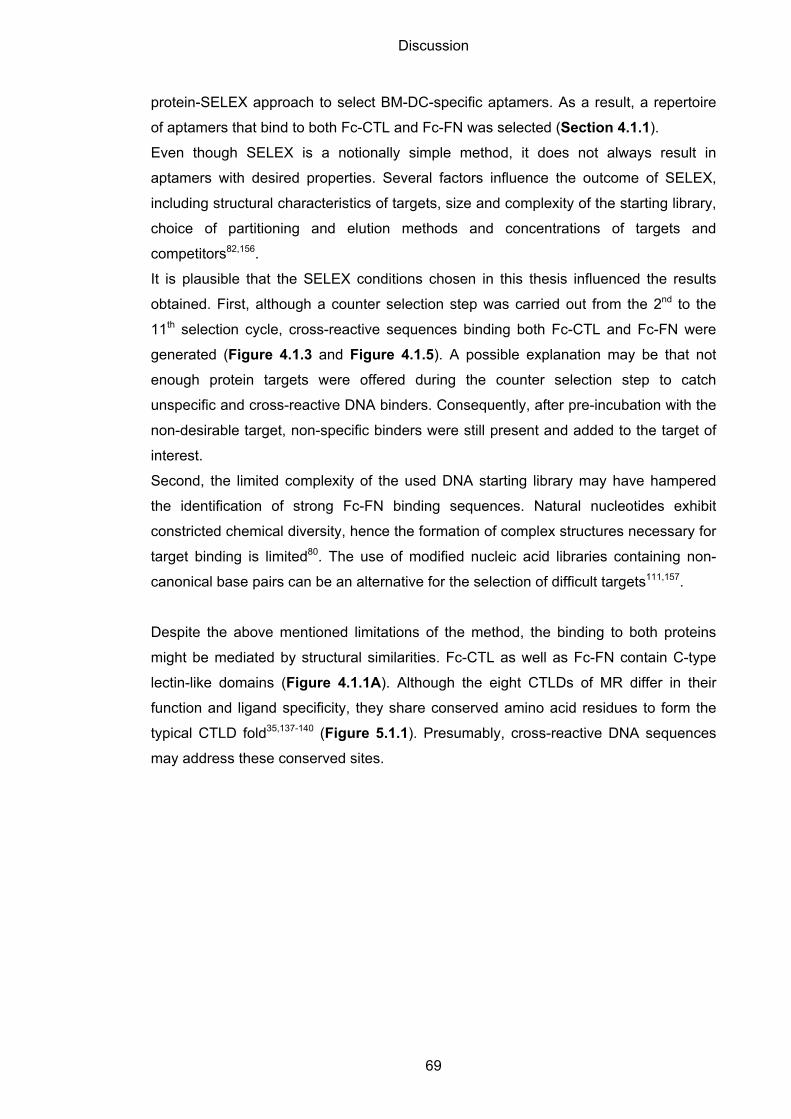
Discussion
69
protein-SELEX approach to select BM-DC-specific aptamers. As a result, a repertoire
of aptamers that bind to both Fc-CTL and Fc-FN was selected (Section 4.1.1).
Even though SELEX is a notionally simple method, it does not always result in
aptamers with desired properties. Several factors influence the outcome of SELEX,
including structural characteristics of targets, size and complexity of the starting library,
choice of partitioning and elution methods and concentrations of targets and
competitors82,156.
It is plausible that the SELEX conditions chosen in this thesis influenced the results
obtained. First, although a counter selection step was carried out from the 2nd to the
11th selection cycle, cross-reactive sequences binding both Fc-CTL and Fc-FN were
generated (Figure 4.1.3 and Figure 4.1.5). A possible explanation may be that not
enough protein targets were offered during the counter selection step to catch
unspecific and cross-reactive DNA binders. Consequently, after pre-incubation with the
non-desirable target, non-specific binders were still present and added to the target of
interest.
Second, the limited complexity of the used DNA starting library may have hampered
the identification of strong Fc-FN binding sequences. Natural nucleotides exhibit
constricted chemical diversity, hence the formation of complex structures necessary for
target binding is limited80. The use of modified nucleic acid libraries containing non-
canonical base pairs can be an alternative for the selection of difficult targets111,157.
Despite the above mentioned limitations of the method, the binding to both proteins
might be mediated by structural similarities. Fc-CTL as well as Fc-FN contain C-type
lectin-like domains (Figure 4.1.1A). Although the eight CTLDs of MR differ in their
function and ligand specificity, they share conserved amino acid residues to form the
typical CTLD fold35,137-140 (Figure 5.1.1). Presumably, cross-reactive DNA sequences
may address these conserved sites.
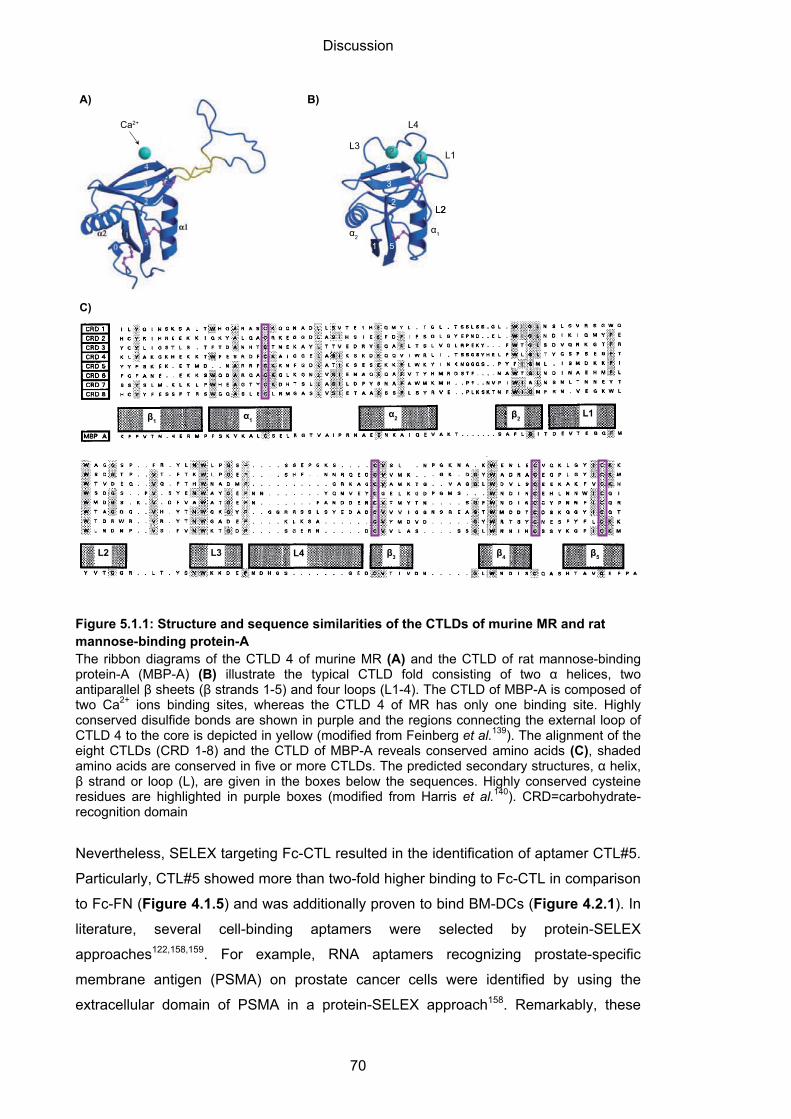
Discussion
70
Figure 5.1.1: Structure and sequence similarities of the CTLDs of murine MR and rat mannose-binding protein-A The ribbon diagrams of the CTLD 4 of murine MR (A) and the CTLD of rat mannose-binding protein-A (MBP-A) (B) illustrate the typical CTLD fold consisting of two α helices, two antiparallel β sheets (β strands 1-5) and four loops (L1-4). The CTLD of MBP-A is composed of two Ca2+ ions binding sites, whereas the CTLD 4 of MR has only one binding site. Highly conserved disulfide bonds are shown in purple and the regions connecting the external loop of CTLD 4 to the core is depicted in yellow (modified from Feinberg et al.139). The alignment of the eight CTLDs (CRD 1-8) and the CTLD of MBP-A reveals conserved amino acids (C), shaded amino acids are conserved in five or more CTLDs. The predicted secondary structures, α helix, β strand or loop (L), are given in the boxes below the sequences. Highly conserved cysteine residues are highlighted in purple boxes (modified from Harris et al.140). CRD=carbohydrate-recognition domain
Nevertheless, SELEX targeting Fc-CTL resulted in the identification of aptamer CTL#5.
Particularly, CTL#5 showed more than two-fold higher binding to Fc-CTL in comparison
to Fc-FN (Figure 4.1.5) and was additionally proven to bind BM-DCs (Figure 4.2.1). In
literature, several cell-binding aptamers were selected by protein-SELEX
approaches122,158,159. For example, RNA aptamers recognizing prostate-specific
membrane antigen (PSMA) on prostate cancer cells were identified by using the
extracellular domain of PSMA in a protein-SELEX approach158. Remarkably, these
β1α1
α2 β2L1
L3 L4 β3 β4 β5L2
A) B)
C)
L1
L2
L4
L3
α1
L2
α2
1 5
4
3
2
Ca2+
Discussion
71
aptamers were functional in vitro and in vivo as selective carriers for several cargo
molecules such as siRNAs or toxins112,118,160.
5.1.2 Cell-SELEX
As outlined in the introduction, in-depth knowledge of the respective target is not
necessary for cell-aptamer selection (Section 3.5.2). BM-DCs express a variety of
molecules on their surface that are involved in modulating downstream T cell
responses13. These molecules represent accessible targets for aptamer selection. In
the present work, aptamers D#5 and D#7 that are functional in targeted activation of T
cells through antigen delivery to DCs, were identified without knowledge of the
respective target structures on BM-DCs (Section 4.1.2). This result extends previous
findings in the literature. Since 1998, a growing number of aptamers recognizing
mammalian cell types were identified by cell-SELEX96,161-163. In several studies, cancer
cell lines are the target of interest162. For example, Tang and co-workers reported the
generation of a series of aptamers as molecular probes for Burkitt lymphoma cells164.
Moreover, one aptamer, namely TD05, was observed to be functional in targeting of
lymphoma cells in vivo165.
The use of somatic cells in cell-SELEX has been also reported126,166. Interestingly,
Berezovski and co-workers enriched DNA libraries targeting either immature or mature
murine BM-DCs for identification of cell state-specific biomarkers126. In fact, biomarkers
such as protein CXorf17 homologue and serine β-lactamase-like protein were until then
unknown. However, binding or functionality of individual DNA sequences was not
investigated.
5.2 Properties of DC-aptamers
Aptamers CTL#5, D#5 and D#7 were found to clearly discriminate between BM-DCs
and splenic T and B cells (Figure 4.2.2). This highlights the specificity of the selected
aptamers for targets mainly expressed by BM-DCs.
However, a small amount of B cells were bound by the aptamers. Since B cells and
DCs are classified as professional APCs with common functions and shared
expression of surface receptors2,27, this finding is hardly surprising. Moreover,
preliminary data revealed binding of CTL#5 to murine bone marrow-derived
macrophages that represent the third type of professional APC (Figure S 9.6.1).
This result is comparable with previous studies, which utilize the mannose receptor
targeting vaccine CDX-1307, and indicate binding to DCs as well as macrophages58.
Interestingly, binding to both cell types does not negatively influence the therapeutic
Discussion
72
efficacy; CDX-1307 is currently tested in phase II clinical trials for treatment of muscle-
invasive bladder cancer (Table 3-1).
Whether the binding of aptamers to other APCs might influence the outcome of
downstream T cell responses, will be further investigated. This is in particular of great
interest for in vivo applications in which the aptamers encounter all types of APCs
simultaneously. However, if the binding to B cells or macrophages negatively influence
aptamer-based vaccination, DCs could be alternatively treated ex vivo and re-
implanted in patients.
5.2.1 Immunogenicity of aptamers
Repeated administration of immunogenic molecules can cause severe adverse
immunological reactions ranging from dizziness, flushing and headache, to inducing
the secretion of autoantibodies77,167.
In comparison to other carrier molecules like antibodies or viruses, aptamers are
described to be low or non-immunogenic78,119. This was confirmed for the selected
aptamers in this work by the obtained results.
Here, the immunogenicity of the selected aptamers was investigated by measuring the
TNF-α concentration in the supernatant of treated cells. Basically, upon recognition of
nucleic acids ligands by TLR3, 7/8, 9 or 13, signaling cascades are activated which
triggers the secretion of the proinflammatory cytokine TNF-α (Figure 4.2.8). As a
result, only the naïve DNA library induced strong cytokine secretion (Figure 4.2.9). In
theory, the library is composed of up to 1015-1017 unique DNA sequences. Thus, it is
very likely that some sequences resemble TLR ligands such as CpG rich motifs
(Figure 5.2.1).
Similar results were obtained in previous studies done by Avci-Adali et al.168. They
observed upregulation of TLR pathway-related transcripts after treating human blood
cells with a DNA starting library.
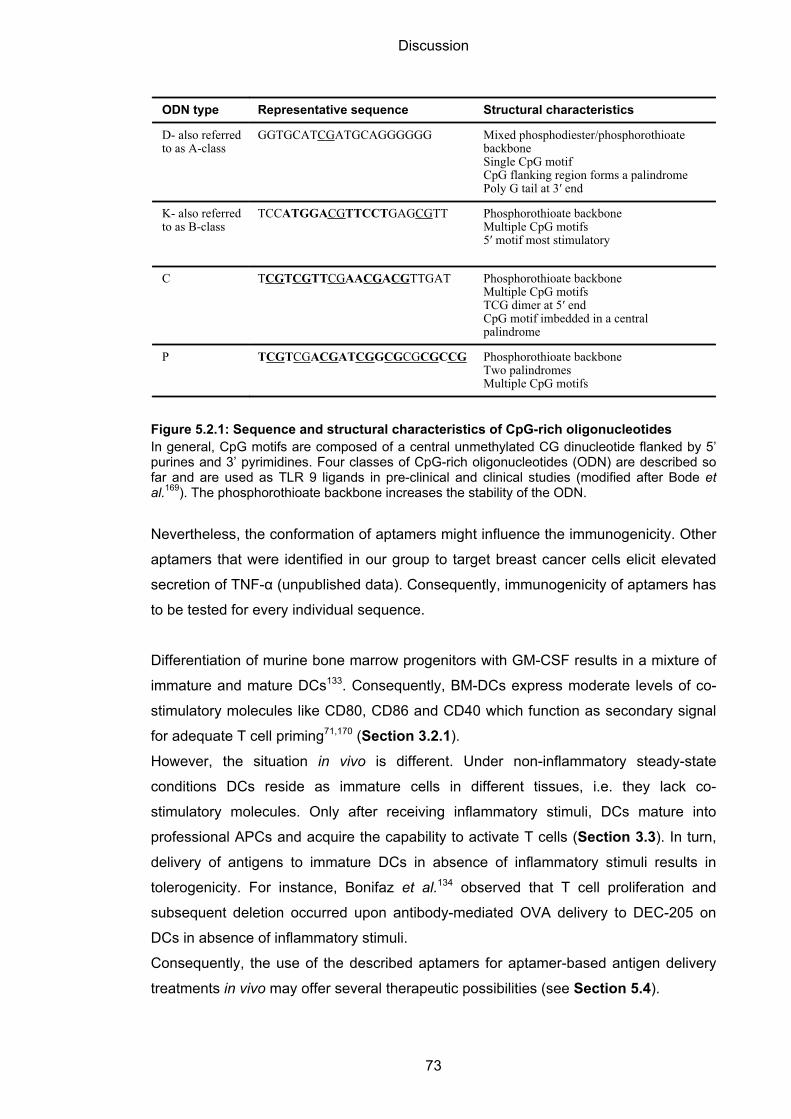
Discussion
73
Figure 5.2.1: Sequence and structural characteristics of CpG-rich oligonucleotides In general, CpG motifs are composed of a central unmethylated CG dinucleotide flanked by 5’ purines and 3’ pyrimidines. Four classes of CpG-rich oligonucleotides (ODN) are described so far and are used as TLR 9 ligands in pre-clinical and clinical studies (modified after Bode et al.169). The phosphorothioate backbone increases the stability of the ODN.
Nevertheless, the conformation of aptamers might influence the immunogenicity. Other
aptamers that were identified in our group to target breast cancer cells elicit elevated
secretion of TNF-α (unpublished data). Consequently, immunogenicity of aptamers has
to be tested for every individual sequence.
Differentiation of murine bone marrow progenitors with GM-CSF results in a mixture of
immature and mature DCs133. Consequently, BM-DCs express moderate levels of co-
stimulatory molecules like CD80, CD86 and CD40 which function as secondary signal
for adequate T cell priming71,170 (Section 3.2.1).
However, the situation in vivo is different. Under non-inflammatory steady-state
conditions DCs reside as immature cells in different tissues, i.e. they lack co-
stimulatory molecules. Only after receiving inflammatory stimuli, DCs mature into
professional APCs and acquire the capability to activate T cells (Section 3.3). In turn,
delivery of antigens to immature DCs in absence of inflammatory stimuli results in
tolerogenicity. For instance, Bonifaz et al.134 observed that T cell proliferation and
subsequent deletion occurred upon antibody-mediated OVA delivery to DEC-205 on
DCs in absence of inflammatory stimuli.
Consequently, the use of the described aptamers for aptamer-based antigen delivery
treatments in vivo may offer several therapeutic possibilities (see Section 5.4).
ODN type Representative sequence Structural characteristics
D- also referredto as A-class
GGTGCATCGATGCAGGGGGG Mixed phosphodiester/phosphorothioatebackboneSingle CpG motifCpG flanking region forms a palindromePoly G tail at 3′ end
K- also referredto as B-class
TCCATGGACGTTCCTGAGCGTT Phosphorothioate backboneMultiple CpG motifs5′ motif most stimulatory
C TCGTCGTTCGAACGACGTTGAT Phosphorothioate backboneMultiple CpG motifsTCG dimer at 5′ endCpG motif imbedded in a centralpalindrome
P TCGTCGACGATCGGCGCGCGCCG Phosphorothioate backboneTwo palindromesMultiple CpG motifs
Discussion
74
5.2.2 CTL#5 specificity towards MR
C-type lectin receptors are non-canonical PRRs that enable the discrimination of self
from non-self substances by cells involved in innate immunity35 (Section 3.3.2). The C-
type lectin receptor MR is mainly expressed by DCs and macrophages and described
to direct antigens towards cross-presentation for CD8 T cell activation19,138. Thus, the
MR is an attractive target for DC-based vaccine strategies to recruit cytotoxic CD8 T
cells.
In the study at hand, recombinant Fc-CTL, composed of CTLD 4-7 from the MR
(Figure 4.1.1), was used to identify aptamer CTL#5. Although CTL#5 was observed to
co-localize strongly with MR (Figure 4.2.4AB), MR-/- DCs were bound to the same
extent as wildtype DCs (Figure 4.2.4C). Thus, it can be assumed that DC-targeting by
CTL#5 is not only mediated by MR.
A reasonable explanation might be that other C-type lectin receptors expressed on BM-
DCs like DEC-205 or dectin-1 are recognized by CTL#5 (Figure 4.2.3). A common
structure of these receptors are CTLDs31. Although CTLDs exhibit different ligand
specificity among the receptors, they share conserved residues responsible for the
typical formation of a hydrophobic fold35,137 (Figure 5.1.1AB).
Previous studies demonstrated that antigens endocytosed by the MR are entrapped
within slowly maturating early endosomes for cross-presentation19,24,26. Thus, co-
localization of MR ligands with EEA1 is anticipated rather than lysosomal marker
LAMP-1. Within this study, both OVA and CTL#5 were observed to co-localize weakly
with LAMP-1 besides the co-localization with EEA1 (Figure 4.2.6). This implies that
upon endocytosis, both OVA and CTL#5 are shuttled into slowly as well as rapid
maturing early endosome populations. Plus, OVA and CTL#5 may be internalized by
other endocytic receptors apart from the MR or by distinct mechanisms like
phagocytosis. For example, targeting of other receptors of the C-type lectin family like
DEC-205 are described to potentiate internalization into early endosomes that rapidly
mature into late endosomes and lysosomes37,39. Subsequently, cargoes are
immobilized onto MHC II molecules and presented to CD4 T cells.
Hence, antigens coupled to CTL#5 can be directed towards cellular compartments
adequate for both MHC I and MHC II-epitope generation.
5.3 Aptamer-targeted activation of T cell-mediated immunity
5.3.1 Aptamer-targeted activation of CD4 T cells
The study at hand is the first that demonstrates aptamer-mediated CD4 T cell
activation through targeting of DCs with a MHC II-restricted antigen.
Discussion
75
CD4 T cells recognize antigenic peptides immobilized on MHC II. Basically, exogenous
antigens are degraded within late endosomes or lysosomes and subsequently loaded
onto MHC II in multivesicular bodies (MVBs) (Section 3.3.1.2). In the present study, all
aptamers conjugated to the MHC II-restricted OT-II peptide mediated CD4 T cell
activation in a concentration-dependent manner, as measured by in vitro proliferation
assays (Figure 4.3.4C).
However, only CTL#5 was observed to co-localize with the lysosomal marker LAMP-1
(Figure 4.2.6BC). A possible explanation may be that recycling of MHC II from the cell
surface might enable the loading or exchange of antigens within early
endosomes171,172. MHC II molecules are thought to be continuously recycled from the
plasma membrane to early endosomes and back to the membrane27. Some antigenic
MHC II-epitopes were demonstrated to simply require unfolding and mild proteolysis
that is enabled by proteases present in early endosomes172. These epitopes can bind
to recycled MHC II and are transported to the plasma membrane for presentation.
Another possible explanation is that aptamer-OT-II conjugates are internalized by
phagocytic receptors. Antigens taken up by these receptors are entrapped within
phagosomes. Phagosomes are composed of elements derived from early endosomes
and the ER173,174, thus they are detectable by staining of EEA1.
A third possible explanation may be that the attached OT-II peptide influenced the
trafficking and processing within DCs. In this thesis, co-localization studies were carried
out with non-conjugated aptamers. Further work will concentrate on the cellular
localization of aptamer-peptide conjugates.
Apart from that, ctrl-OT-II conjugates were observed to induce CD4 T cell division
(Figure 4.3.4C). This result was not anticipated, because neither the control sequence
nor unconjugated OT-II peptide elicited T cell proliferation in their singular,
unconjugated form (Figure 4.3.4AB). Furthermore, the control sequence was not
internalized by BM-DCs (Figure 4.2.5). However, one reason might be that the
coupling of both molecules affects the internalization and processing by BM-DCs.
Similar findings were obtained by the work of Wengerter et al.115. They observed
minimal CD8 T cell division after treatment of splenic DCs with control sequence- as
well as antibody isotype-OVA conjugates.
In general, activated CD4 T cells polarize into activator or suppressor cells that
regulate other effectors of the adaptive immunity5. However, a growing body of
literature has analyzed the ability of CD4 T cells to acquire cytotoxic activity upon
activation152-154. In the present work, no CD4 T cell cytotoxicity was detectable in in vitro
cytotoxicity assays (Figure 4.3.5). This was not unexpected; in fact, there is no general
Discussion
76
agreement on the nature and role of cytotoxic CD4 T cells. Some studies revealed the
development of cytotoxic CD4 T cells upon chronic viral infections152, whereas others
proposed their occurrence in anti-cancer immunity153. Moreover, there are
discrepancies if cytotoxic CD4 T cells represent a specialized subset of T cells or if
they are associated with the Th1 phenotype175,176.
Therefore, future work will focus on the ability of aptamers to cause CD4 T cell
polarization towards activating helper cells or suppressing regulatory T cells. First of all,
it is projected to monitor the cytokine profile of the activated T cells. Secretion of
different cytokines is characteristic for each effector subset, for example, Th2 cells
produce high levels of IL-42.
In addition, the functionality of aptamer-OT-II in vivo will be assessed by different
strategies. One strategy takes advantage of the effector function of activated CD4 T
helper cells to induce differentiation of B cells into antibody-producing plasma cells5.
Therefore, aptamer-OT-II mediated CD4 T cell activation will be assessed by
determining the titer of OT-II peptide-specific antibodies in serum of mice.
Another strategy is to stain isolated CD4 T cells from spleen or serum with fluorophore
labeled tetramers of MHC-peptide complexes177,178. In principle, activation and clonal
expansion of CD4 T cells can be determined by the increasing number of cells bound
to the tetramers.
5.3.2 Aptamer-targeted activation of CD8 T cells
CD8 T cells recognize antigens immobilized on MHC I molecules expressed by DCs. In
the classical MHC I pathway, endogenous antigens are loaded onto MHC I molecules.
However, this pathway can be bypassed by a process named cross-presentation.
Exogenous antigens are thereby endocytosed by DCs and actively translocated out of
slowly maturing early endosomes into the cytosol for generation of MHC I epitopes16
(Section 3.3.1.1).
In the present study, aptamer-targeted delivery of OT-I peptide elicited strong CD8 T
cell activation. This indicates that in accordance with the observed co-localization of all
aptamers with early endosomes marker EEA1 (Figure 4.2.6AC and Figure 4.2.7),
aptamer-based delivery of OT-I peptide mediated cross-presentation on MHC I
molecules for efficient CD8 T cell activation (Figure 4.3.6C).
These results are in agreement with Wengerter et al.115, where they targeted full-length
OVA attached to DEC-205 specific aptamers to splenic DCs and observed proliferation
of CD8 T cells. However, in other studies, OVA was demonstrated to be internalized,
Discussion
77
processed and cross-presented by DCs in its natural unconjugated form19,38. It is
questionable if the DEC-205 aptamers improved the effect of OVA on DCs and T cells.
Furthermore, activation of CD8 T cells was verified with in vitro cytotoxicity assays. In
comparison to ctrl-OT-I conjugates, CD8 T cell cytotoxicity induced by aptamer-OT-I
was elevated to an extent similar to MHC I peptide (Figure 4.3.7). This highlights the
potential of aptamers to mediate efficient cytotoxic activity of CD8 T cells.
Surprisingly, in contrast to the OT-II peptide (Figure 4.3.4A), the OT-I peptide was
observed to have an intrinsic capacity to activate CD8 T cell divisions (Figure 4.3.6A).
Moreover, although ctrl-OT-I mediated low cytotoxic activity (Figure 4.3.7), it was
observed to induce cell division (Figure 4.3.6C). Similar results were obtained with ctrl-
OT-II conjugates (Figure 4.3.4C and Section 5.3.1). Despite the fact that the
conjugation of the control sequence and the peptides might affect internalization and
processing, incomplete activation of T cells can also be considered. Complete
activation of CD8 T cells requires the continuous stimulation of all three signals, i.e.
antigen, co-stimulation and inflammatory cytokines, for more than 40 hours9. Cell
division alone is initiated by the recognition of the respective antigen loaded on MHC I
and co-stimulatory stimuli, whereas cell survival and effector function depend on
prolonged signaling of all three signals. Incomplete activation of T cells results in T cell
anergy or clonal deletion10 (Section 3.2.1). Analysis such as apoptosis or anergy
assays will shed light on the effect of OT-I peptide or control-peptide conjugates on T
cells.
Apart from that, it cannot be excluded that other yet unknown mechanisms lead to the
observed effect.
To further investigate aptamer targeted CD8 T cell activation in vivo, a cytotoxicity
assay in mice will be performed. On that account, mice will be immunized with
aptamer-OT-I conjugates and after several days, CFSE-labeled and MHC I peptide
loaded target cells and non-loaded control cells will be co-administrated. Finally, target
and control cells will be isolated from the spleen and analyzed by flow cytometry.
In addition, CD8 T cell activation will be determined by staining of isolated T cells with
fluorophore-labeled tetramers of MHC-peptide complexes177,178.
5.4 Perspective for future research
The present work clearly demonstrates the functionality of aptamers for DC-based
vaccination. Still, for their in vivo use, open questions remain.
Discussion
78
What are the pharmacokinetic properties of the described aptamers and aptamer-
peptide conjugates? Are the aptamers stable in whole blood or do they need
modifications to increase their nuclease-stability or elimination half-life? How are the
aptamers distributed in vivo? Depending on the administration, the nucleic acid
composition, modifications and conjugates, aptamers are described to exhibit
widespread half-lifes ranging from 10 minutes to more than 75 hours in mammals179.
Future work will explore if the selected aptamers need to be modified to increase their
stability in vivo (Section 3.5.2).
What is the optimal route of administration? In previous work, the impact of
administration on the immune response was demonstrated178. Vaccination with
mannosylated peptides in mice, for example, was more effective in CD8 activation
upon intradermal injection in comparison to subcutaneous administration71. This result
might be due to the fact that the layers of the skin are inhabited by DCs with different
presenting capacities or that intradermal injected vaccines are longer available for
efficient T cell priming180. Therefore, the optimal route of administration has to be
determined in mouse models.
What are the optimal conditioning and activation stimuli? Concerning the very low
immunogenic potential of the selected aptamers, aptamer-based targeting of DCs may
offer several therapeutic possibilities. Depending on how the non-immunogenic
aptamers are administrated, DCs become activating or tolerogenic (Figure 3.3.1).
On the one hand, aptamer-based delivery of cargo molecules in presence of
inflammatory stimuli could induce T cell-mediated immunity for prevention or treatment
of infection or cancer. This is done in particular by the co-delivery of adjuvants like pIC
(polyinosinic:polycytidylic acid)115,181. However, the type of adjuvant has to be chosen
carefully, because PRR ligands themselves influence the outcome of adaptive immune
responses182.
In addition, DC-aptamers can be conjugated to aptamers antagonizing receptors that
negatively regulate T cell effector functions such as CTLA-4 aptamers122.
On the other hand, aptamer-based DC vaccines administrated without inflammatory
stimuli might be useful for the prevention or treatment of allograft rejections or
autoimmune diseases. Lack of such stimuli facilitates the development of tolerogenic
DCs. Tolerogenic DCs are deficient in adequate signaling for T cell activation or they
only deliver co-inhibitory signals18. As a consequence, auto-reactive or allo-reactive T
cells interacting with tolerogenic DCs become anergic or are deleted.
Discussion
79
Moreover, aptamer-based delivery of siRNAs, miRNAs or antagomiRs could change
cellular phenotypes. Cancer or chronic inflammation facilitates the occurrence of
tolerogenic DCs and macrophages183,184. Inhibition of miR-22 and miR-503, for
example, was reported to restore the activating capacity of DCs within tumor
microenvironments185. We are in the process of investigating aptamer-based silencing
of miR-125a in human macrophages associated with granulomatous diseases184.
What is the optimal dose and frequency of aptamer-based DC vaccination? Even
though repeated administration of vaccines increases the frequencies of memory T
cells, overstimulation is reported to cause T cell deletion186. Similar observations were
done after treatment with high doses of peptide vaccines187. Therefore, the optimal
dose and vaccination schedule have to be determined in mouse models.
Which antigen should be conjugated? A wide range of cancer antigens and auto-
antigens associated with autoimmune diseases have been identified in the last
decades188-190. The choice of aptamer cargo molecule is dependent on the desired
therapeutic effect. Within this study, it was clearly demonstrated that all aptamers
delivered MHC I epitopes as well as MHC II epitopes (Section 5.3.1 and 5.3.2). This
feature could be beneficial for future treatments. For example, Tsuji et al.191 recently
reported that the cancer testis antigen NY-ESO-1 which contains both MHC I and MHC
II epitopes, enhances T cell responses. This is hardly surprising. In fact, most CD8 T
cell responses require activation of CD4 T helper cells by the same APC2 (Section
3.2).
Future work will elucidate if aptamer-based delivery of such antigens boosts CD4 and
CD8 T cell responses.
5.5 Concluding remarks
The present work demonstrates the potential of aptamers to function as delivery tools
in an immunological context. The investigated DC-aptamers were selected with and
without knowledge of the target structures. Noteworthy, both selections yielded
aptamers that are potent DC-based vaccines in vitro. All aptamers direct antigens into
eligible processing compartments for efficient antigen presentation and T cell
activation.
These results widen the knowledge about the potential applicability of aptamers as DC-
targeting carriers and pave the way for the development of aptamer-based DC
vaccines for in vivo applications.
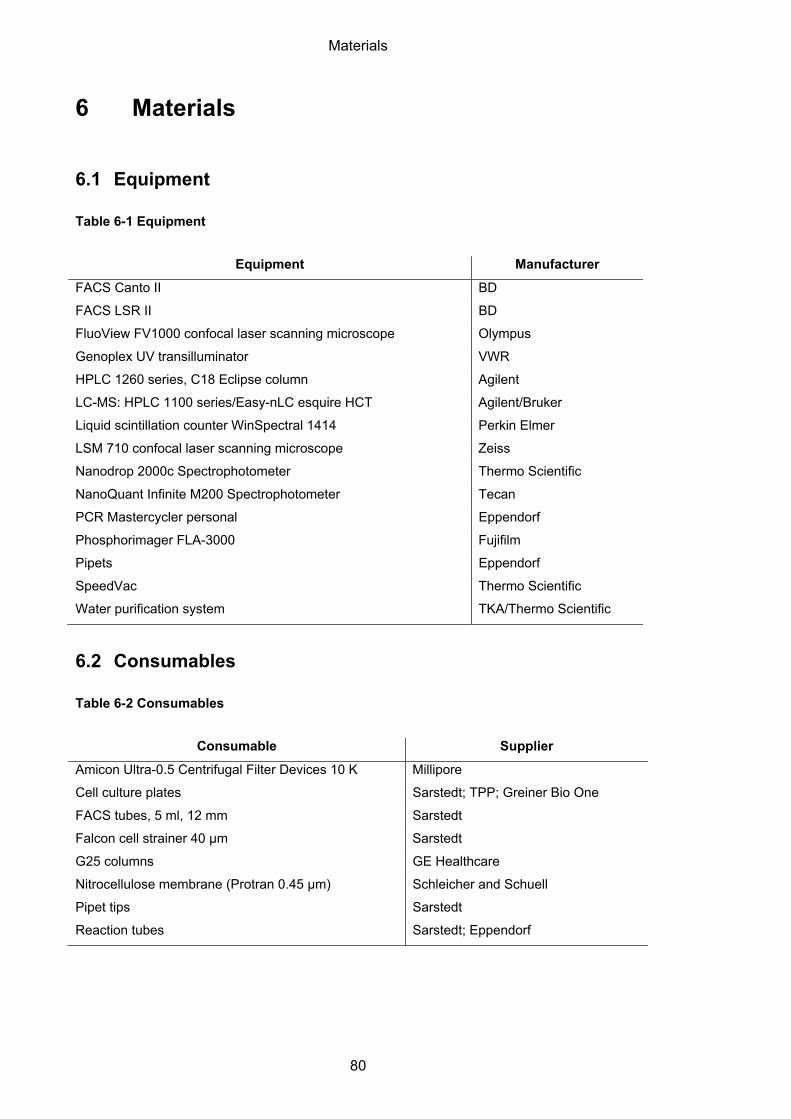
Materials
80
6 Materials
6.1 Equipment
Table 6-1 Equipment
Equipment Manufacturer
FACS Canto II BD
FACS LSR II BD
FluoView FV1000 confocal laser scanning microscope Olympus
Genoplex UV transilluminator VWR
HPLC 1260 series, C18 Eclipse column Agilent
LC-MS: HPLC 1100 series/Easy-nLC esquire HCT Agilent/Bruker
Liquid scintillation counter WinSpectral 1414 Perkin Elmer
LSM 710 confocal laser scanning microscope Zeiss
Nanodrop 2000c Spectrophotometer Thermo Scientific
NanoQuant Infinite M200 Spectrophotometer Tecan
PCR Mastercycler personal Eppendorf
Phosphorimager FLA-3000 Fujifilm
Pipets Eppendorf
SpeedVac Thermo Scientific
Water purification system TKA/Thermo Scientific
6.2 Consumables
Table 6-2 Consumables
Consumable Supplier
Amicon Ultra-0.5 Centrifugal Filter Devices 10 K Millipore
Cell culture plates Sarstedt; TPP; Greiner Bio One
FACS tubes, 5 ml, 12 mm Sarstedt
Falcon cell strainer 40 µm Sarstedt
G25 columns GE Healthcare
Nitrocellulose membrane (Protran 0.45 µm) Schleicher and Schuell
Pipet tips Sarstedt
Reaction tubes Sarstedt; Eppendorf
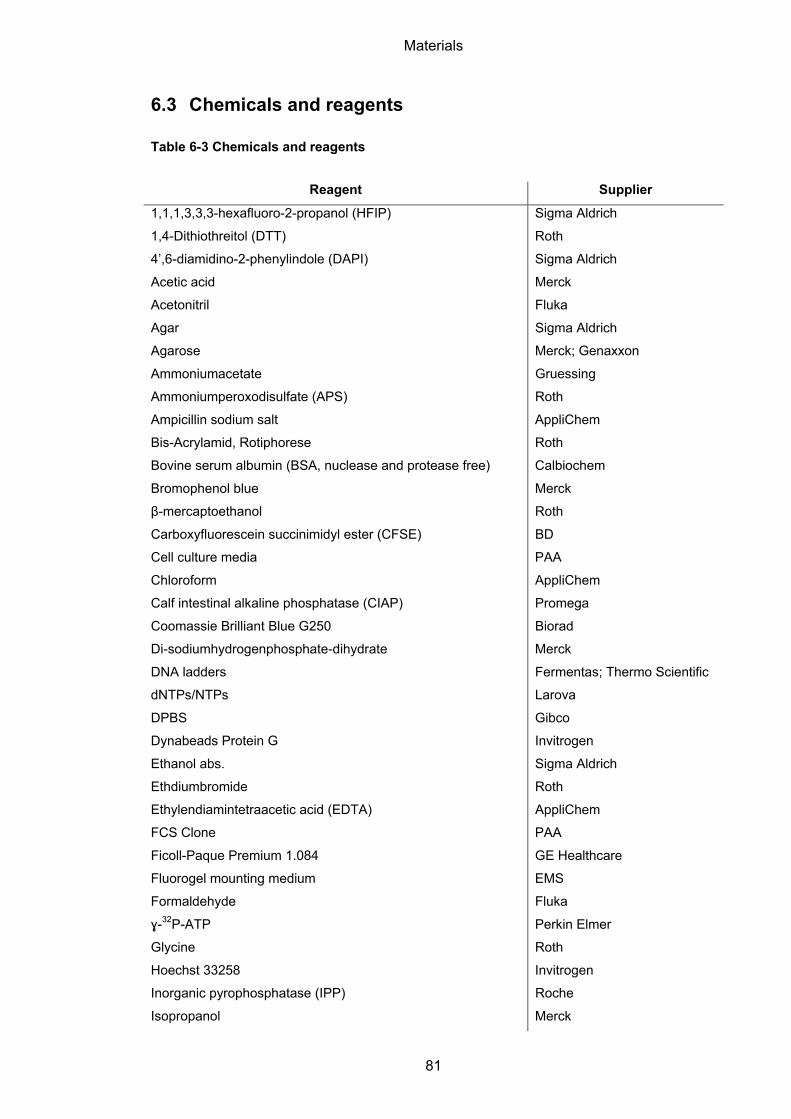
Materials
81
6.3 Chemicals and reagents
Table 6-3 Chemicals and reagents
Reagent Supplier
1,1,1,3,3,3-hexafluoro-2-propanol (HFIP) Sigma Aldrich
1,4-Dithiothreitol (DTT) Roth
4’,6-diamidino-2-phenylindole (DAPI) Sigma Aldrich
Acetic acid Merck
Acetonitril Fluka
Agar Sigma Aldrich
Agarose Merck; Genaxxon
Ammoniumacetate Gruessing
Ammoniumperoxodisulfate (APS) Roth
Ampicillin sodium salt AppliChem
Bis-Acrylamid, Rotiphorese Roth
Bovine serum albumin (BSA, nuclease and protease free) Calbiochem
Bromophenol blue Merck
β-mercaptoethanol Roth
Carboxyfluorescein succinimidyl ester (CFSE) BD
Cell culture media PAA
Chloroform AppliChem
Calf intestinal alkaline phosphatase (CIAP) Promega
Coomassie Brilliant Blue G250 Biorad
Di-sodiumhydrogenphosphate-dihydrate Merck
DNA ladders Fermentas; Thermo Scientific
dNTPs/NTPs Larova
DPBS Gibco
Dynabeads Protein G Invitrogen
Ethanol abs. Sigma Aldrich
Ethdiumbromide Roth
Ethylendiamintetraacetic acid (EDTA) AppliChem
FCS Clone PAA
Ficoll-Paque Premium 1.084 GE Healthcare
Fluorogel mounting medium EMS
Formaldehyde Fluka
ɣ-32P-ATP Perkin Elmer
Glycine Roth
Hoechst 33258 Invitrogen
Inorganic pyrophosphatase (IPP) Roche
Isopropanol Merck
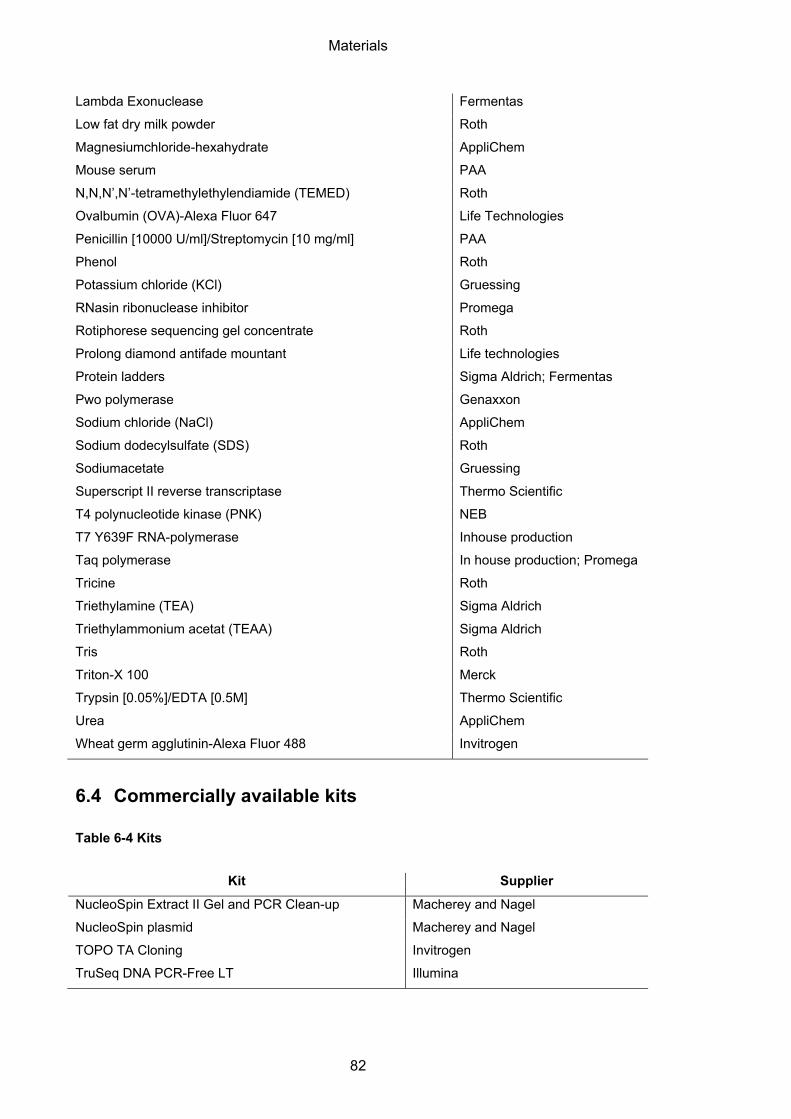
Materials
82
Lambda Exonuclease Fermentas
Low fat dry milk powder Roth
Magnesiumchloride-hexahydrate AppliChem
Mouse serum PAA
N,N,N’,N’-tetramethylethylendiamide (TEMED) Roth
Ovalbumin (OVA)-Alexa Fluor 647 Life Technologies
Penicillin [10000 U/ml]/Streptomycin [10 mg/ml] PAA
Phenol Roth
Potassium chloride (KCl) Gruessing
RNasin ribonuclease inhibitor Promega
Rotiphorese sequencing gel concentrate Roth
Prolong diamond antifade mountant Life technologies
Protein ladders Sigma Aldrich; Fermentas
Pwo polymerase Genaxxon
Sodium chloride (NaCl) AppliChem
Sodium dodecylsulfate (SDS) Roth
Sodiumacetate Gruessing
Superscript II reverse transcriptase Thermo Scientific
T4 polynucleotide kinase (PNK) NEB
T7 Y639F RNA-polymerase Inhouse production
Taq polymerase In house production; Promega
Tricine Roth
Triethylamine (TEA) Sigma Aldrich
Triethylammonium acetat (TEAA) Sigma Aldrich
Tris Roth
Triton-X 100 Merck
Trypsin [0.05%]/EDTA [0.5M] Thermo Scientific
Urea AppliChem
Wheat germ agglutinin-Alexa Fluor 488 Invitrogen
6.4 Commercially available kits
Table 6-4 Kits
Kit Supplier
NucleoSpin Extract II Gel and PCR Clean-up Macherey and Nagel
NucleoSpin plasmid Macherey and Nagel
TOPO TA Cloning Invitrogen
TruSeq DNA PCR-Free LT Illumina
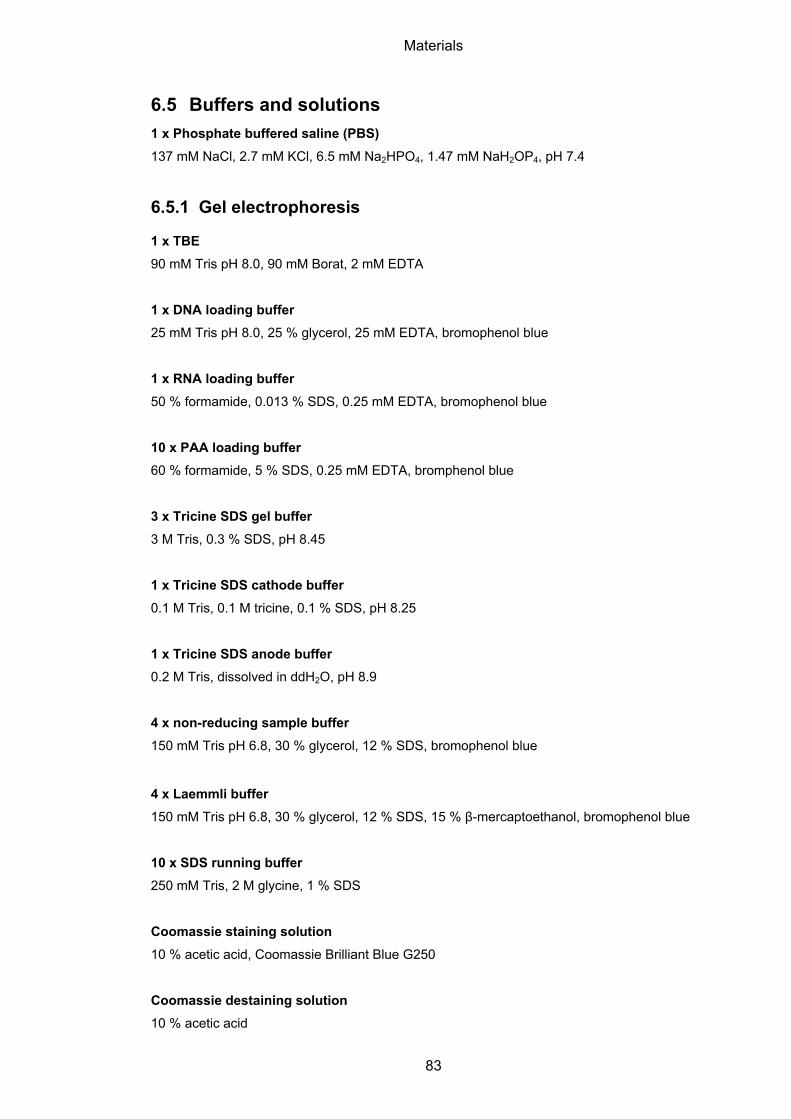
Materials
83
6.5 Buffers and solutions
1 x Phosphate buffered saline (PBS)
137 mM NaCl, 2.7 mM KCl, 6.5 mM Na2HPO4, 1.47 mM NaH2OP4, pH 7.4
6.5.1 Gel electrophoresis
1 x TBE
90 mM Tris pH 8.0, 90 mM Borat, 2 mM EDTA
1 x DNA loading buffer
25 mM Tris pH 8.0, 25 % glycerol, 25 mM EDTA, bromophenol blue
1 x RNA loading buffer
50 % formamide, 0.013 % SDS, 0.25 mM EDTA, bromophenol blue
10 x PAA loading buffer
60 % formamide, 5 % SDS, 0.25 mM EDTA, bromphenol blue
3 x Tricine SDS gel buffer
3 M Tris, 0.3 % SDS, pH 8.45
1 x Tricine SDS cathode buffer
0.1 M Tris, 0.1 M tricine, 0.1 % SDS, pH 8.25
1 x Tricine SDS anode buffer
0.2 M Tris, dissolved in ddH2O, pH 8.9
4 x non-reducing sample buffer
150 mM Tris pH 6.8, 30 % glycerol, 12 % SDS, bromophenol blue
4 x Laemmli buffer
150 mM Tris pH 6.8, 30 % glycerol, 12 % SDS, 15 % β-mercaptoethanol, bromophenol blue
10 x SDS running buffer
250 mM Tris, 2 M glycine, 1 % SDS
Coomassie staining solution
10 % acetic acid, Coomassie Brilliant Blue G250
Coomassie destaining solution
10 % acetic acid
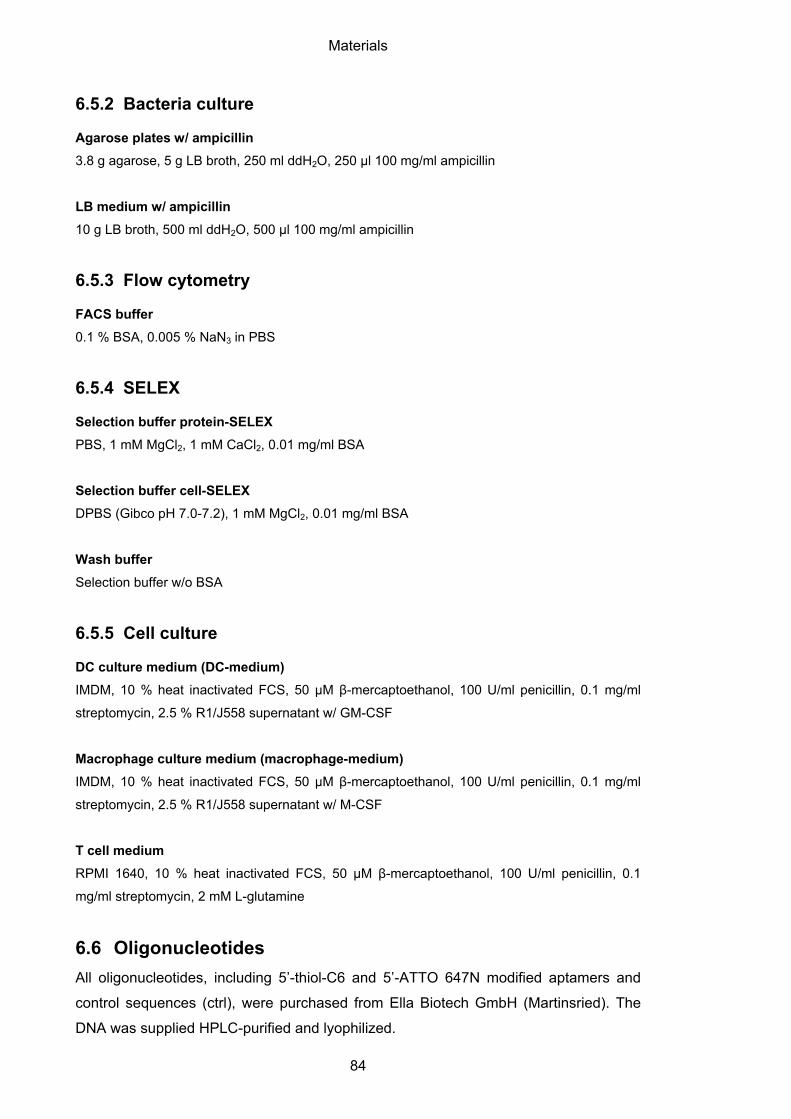
Materials
84
6.5.2 Bacteria culture
Agarose plates w/ ampicillin
3.8 g agarose, 5 g LB broth, 250 ml ddH2O, 250 µl 100 mg/ml ampicillin
LB medium w/ ampicillin
10 g LB broth, 500 ml ddH2O, 500 µl 100 mg/ml ampicillin
6.5.3 Flow cytometry
FACS buffer
0.1 % BSA, 0.005 % NaN3 in PBS
6.5.4 SELEX
Selection buffer protein-SELEX
PBS, 1 mM MgCl2, 1 mM CaCl2, 0.01 mg/ml BSA
Selection buffer cell-SELEX
DPBS (Gibco pH 7.0-7.2), 1 mM MgCl2, 0.01 mg/ml BSA
Wash buffer
Selection buffer w/o BSA
6.5.5 Cell culture
DC culture medium (DC-medium)
IMDM, 10 % heat inactivated FCS, 50 µM β-mercaptoethanol, 100 U/ml penicillin, 0.1 mg/ml
streptomycin, 2.5 % R1/J558 supernatant w/ GM-CSF
Macrophage culture medium (macrophage-medium)
IMDM, 10 % heat inactivated FCS, 50 µM β-mercaptoethanol, 100 U/ml penicillin, 0.1 mg/ml
streptomycin, 2.5 % R1/J558 supernatant w/ M-CSF
T cell medium
RPMI 1640, 10 % heat inactivated FCS, 50 µM β-mercaptoethanol, 100 U/ml penicillin, 0.1
mg/ml streptomycin, 2 mM L-glutamine
6.6 Oligonucleotides
All oligonucleotides, including 5’-thiol-C6 and 5’-ATTO 647N modified aptamers and
control sequences (ctrl), were purchased from Ella Biotech GmbH (Martinsried). The
DNA was supplied HPLC-purified and lyophilized.
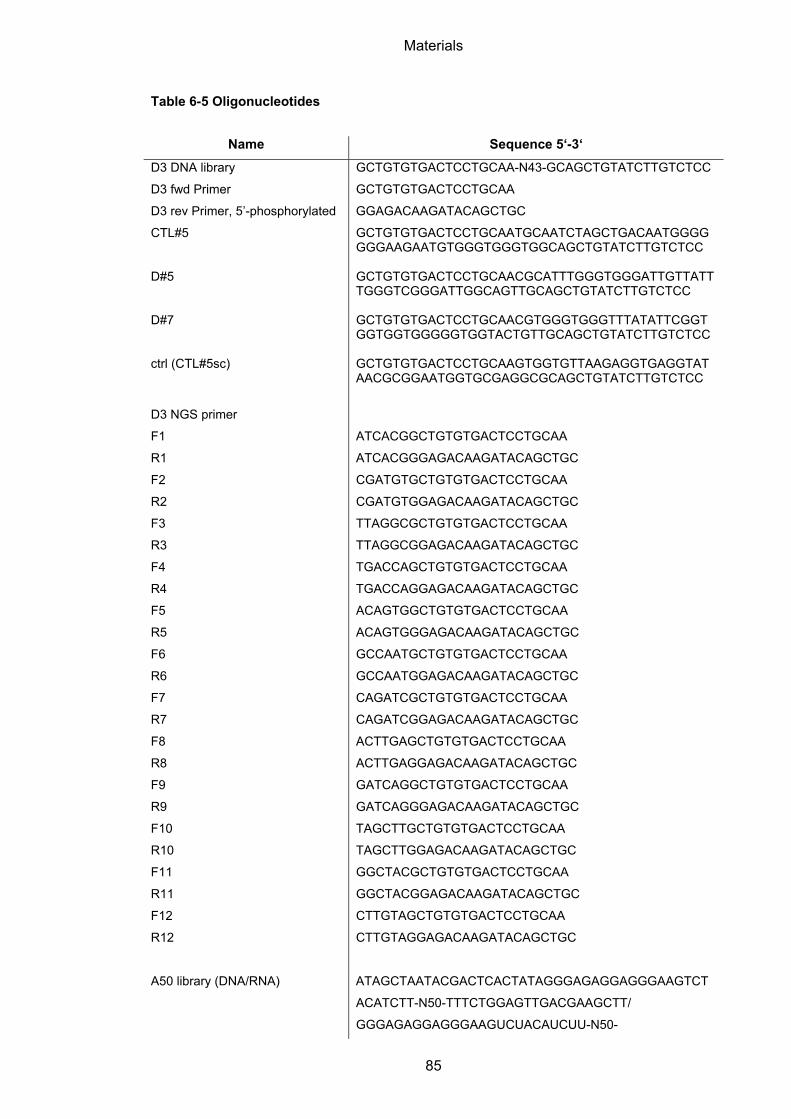
Materials
85
Table 6-5 Oligonucleotides
Name Sequence 5‘-3‘
D3 DNA library GCTGTGTGACTCCTGCAA-N43-GCAGCTGTATCTTGTCTCC
D3 fwd Primer GCTGTGTGACTCCTGCAA
D3 rev Primer, 5’-phosphorylated GGAGACAAGATACAGCTGC
CTL#5 GCTGTGTGACTCCTGCAATGCAATCTAGCTGACAATGGGGGGGAAGAATGTGGGTGGGTGGCAGCTGTATCTTGTCTCC
D#5 GCTGTGTGACTCCTGCAACGCATTTGGGTGGGATTGTTATTTGGGTCGGGATTGGCAGTTGCAGCTGTATCTTGTCTCC
D#7 GCTGTGTGACTCCTGCAACGTGGGTGGGTTTATATTCGGTGGTGGTGGGGGTGGTACTGTTGCAGCTGTATCTTGTCTCC
ctrl (CTL#5sc) GCTGTGTGACTCCTGCAAGTGGTGTTAAGAGGTGAGGTATAACGCGGAATGGTGCGAGGCGCAGCTGTATCTTGTCTCC
D3 NGS primer
F1
R1
F2
R2
F3
R3
F4
R4
F5
R5
F6
R6
F7
R7
F8
R8
F9
R9
F10
R10
F11
R11
F12
R12
ATCACGGCTGTGTGACTCCTGCAA
ATCACGGGAGACAAGATACAGCTGC
CGATGTGCTGTGTGACTCCTGCAA
CGATGTGGAGACAAGATACAGCTGC
TTAGGCGCTGTGTGACTCCTGCAA
TTAGGCGGAGACAAGATACAGCTGC
TGACCAGCTGTGTGACTCCTGCAA
TGACCAGGAGACAAGATACAGCTGC
ACAGTGGCTGTGTGACTCCTGCAA
ACAGTGGGAGACAAGATACAGCTGC
GCCAATGCTGTGTGACTCCTGCAA
GCCAATGGAGACAAGATACAGCTGC
CAGATCGCTGTGTGACTCCTGCAA
CAGATCGGAGACAAGATACAGCTGC
ACTTGAGCTGTGTGACTCCTGCAA
ACTTGAGGAGACAAGATACAGCTGC
GATCAGGCTGTGTGACTCCTGCAA
GATCAGGGAGACAAGATACAGCTGC
TAGCTTGCTGTGTGACTCCTGCAA
TAGCTTGGAGACAAGATACAGCTGC
GGCTACGCTGTGTGACTCCTGCAA
GGCTACGGAGACAAGATACAGCTGC
CTTGTAGCTGTGTGACTCCTGCAA
CTTGTAGGAGACAAGATACAGCTGC
A50 library (DNA/RNA) ATAGCTAATACGACTCACTATAGGGAGAGGAGGGAAGTCT
ACATCTT-N50-TTTCTGGAGTTGACGAAGCTT/
GGGAGAGGAGGGAAGUCUACAUCUU-N50-
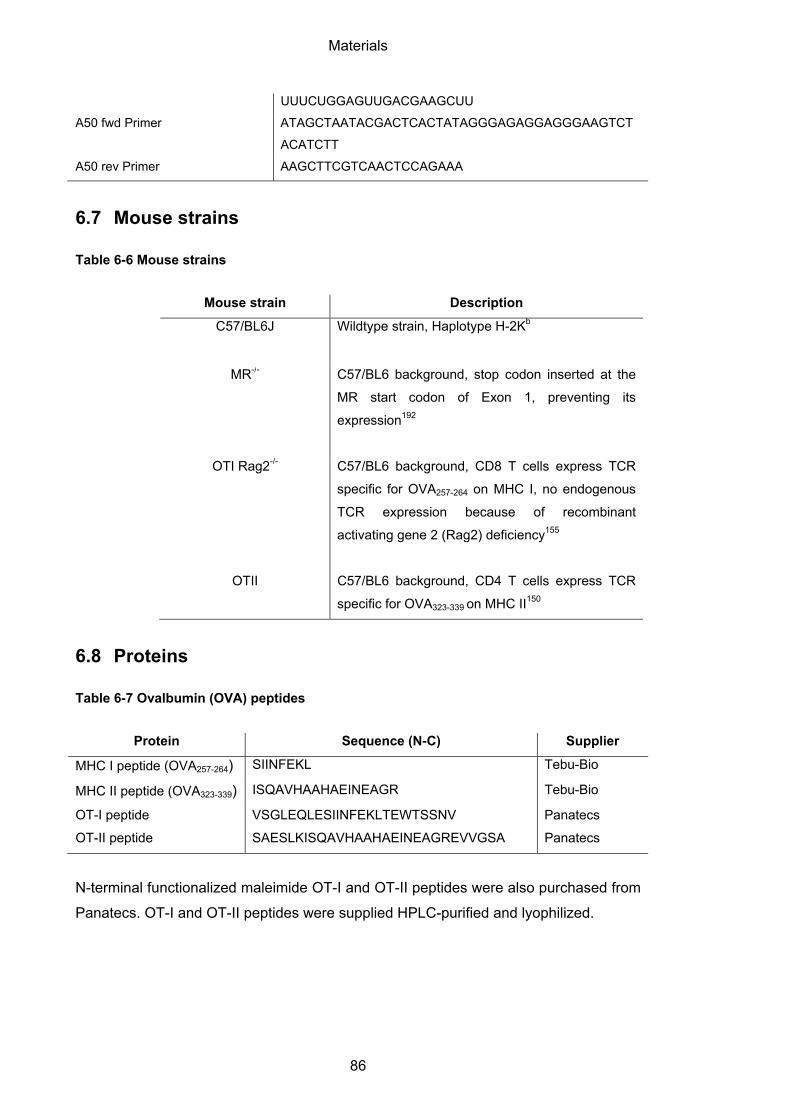
Materials
86
UUUCUGGAGUUGACGAAGCUU
A50 fwd Primer ATAGCTAATACGACTCACTATAGGGAGAGGAGGGAAGTCT
ACATCTT
A50 rev Primer AAGCTTCGTCAACTCCAGAAA
6.7 Mouse strains
Table 6-6 Mouse strains
Mouse strain Description
C57/BL6J Wildtype strain, Haplotype H-2Kb
MR-/- C57/BL6 background, stop codon inserted at the
MR start codon of Exon 1, preventing its
expression192
OTI Rag2-/- C57/BL6 background, CD8 T cells express TCR
specific for OVA257-264 on MHC I, no endogenous
TCR expression because of recombinant
activating gene 2 (Rag2) deficiency155
OTII C57/BL6 background, CD4 T cells express TCR
specific for OVA323-339 on MHC II150
6.8 Proteins
Table 6-7 Ovalbumin (OVA) peptides
Protein Sequence (N-C) Supplier
MHC I peptide (OVA257-264) SIINFEKL Tebu-Bio
MHC II peptide (OVA323-339) ISQAVHAAHAEINEAGR Tebu-Bio
OT-I peptide VSGLEQLESIINFEKLTEWTSSNV Panatecs
OT-II peptide SAESLKISQAVHAAHAEINEAGREVVGSA Panatecs
N-terminal functionalized maleimide OT-I and OT-II peptides were also purchased from
Panatecs. OT-I and OT-II peptides were supplied HPLC-purified and lyophilized.
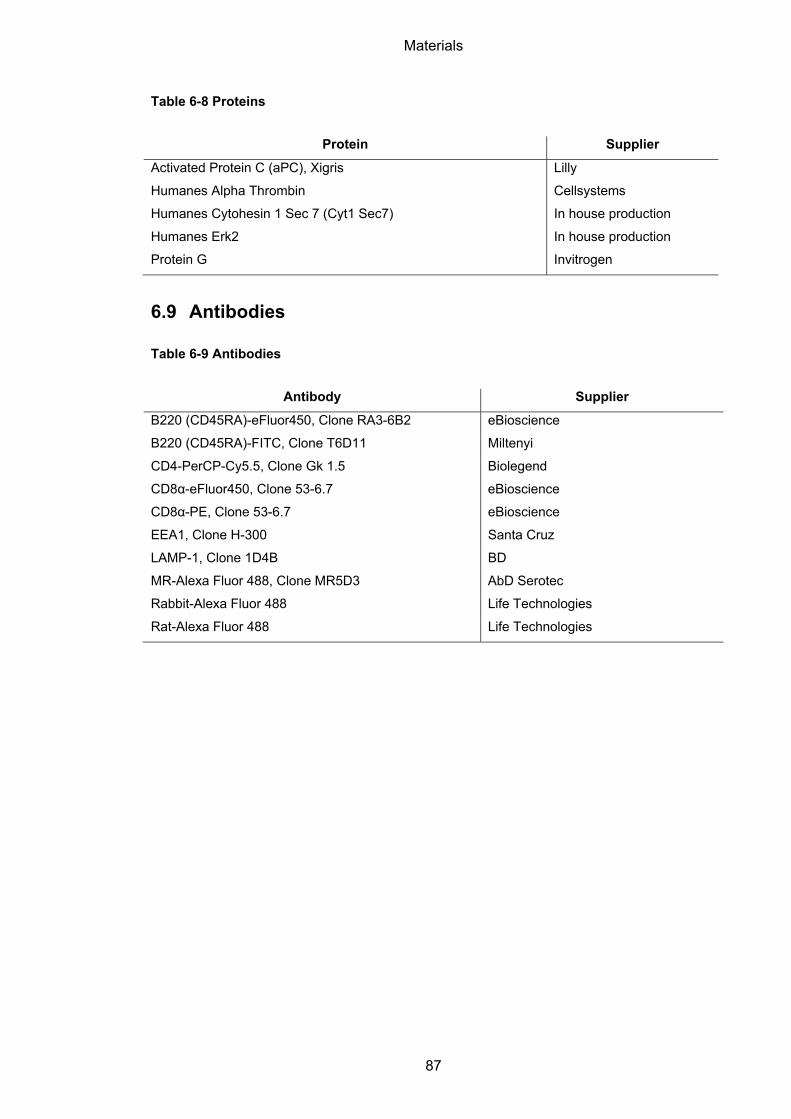
Materials
87
Table 6-8 Proteins
Protein Supplier
Activated Protein C (aPC), Xigris Lilly
Humanes Alpha Thrombin Cellsystems
Humanes Cytohesin 1 Sec 7 (Cyt1 Sec7) In house production
Humanes Erk2 In house production
Protein G Invitrogen
6.9 Antibodies
Table 6-9 Antibodies
Antibody Supplier
B220 (CD45RA)-eFluor450, Clone RA3-6B2 eBioscience
B220 (CD45RA)-FITC, Clone T6D11 Miltenyi
CD4-PerCP-Cy5.5, Clone Gk 1.5 Biolegend
CD8α-eFluor450, Clone 53-6.7 eBioscience
CD8α-PE, Clone 53-6.7 eBioscience
EEA1, Clone H-300 Santa Cruz
LAMP-1, Clone 1D4B BD
MR-Alexa Fluor 488, Clone MR5D3 AbD Serotec
Rabbit-Alexa Fluor 488 Life Technologies
Rat-Alexa Fluor 488 Life Technologies
Methods
88
7 Methods
If not noted otherwise, all experimental steps were done at room temperature.
7.1 Handling of nucleic acids
7.1.1 General handling and storage
Purchased lyophilized nucleic acids were dissolved in ddH20 according to the
manufacturer manuals. The concentration was determined by UV spectrometry at 260
and 280 nm and the quality checked by agarose gel electrophoresis. For long-term
storage, nucleic acids were kept at -20 °C.
To determine the labeling efficiency, ATTO 647 N-labeled DNA was separated by gel
electrophoresis and the fluorescence was monitored by Phosphorimager FLA-3000
(Fujifilm).
7.1.2 Agarose gel electrophoresis
4 % agarose gels were used to monitor purchased nucleic acids, PCR products,
generated single-stranded DNA or transcribed 2’F-RNA. To this end, 4 g agarose was
dissolved in 100 ml TBE buffer and boiled for several minutes in the microwave. 40 ml
was poured into the gel cast and stained with ethidiumbromide at a 1:10000 dilution.
Samples were diluted in DNA or RNA loading buffer, where RNA loading buffer was
used for single-stranded DNA or 2’F-RNA to enable optimal separation. Gels were run
in TBE buffer at 130 V for 25 minutes and bands were visualized by UV transilluminator
(VWR) and evaluated by comparison with the standard DNA ladder.
7.1.3 Polyacrylamide gel electrophoresis (PAGE)
Polyacrylamide gel electrophoresis was used to separate nucleic acids for monitoring
labeling efficiency of 32P-labeling. A 10 % gel was prepared as described below (Table
7-1) and poured into the gel cast. After polymerization for at least 1 hour, the gel was
placed into a running chamber filled with 1 x TBE buffer. The gel was pre-run for 30
minutes at 370 V and 15 W. Before loading the samples, the pockets were cleared with
1 x TBE. Samples were diluted in PAA loading buffer and boiled for 3 minutes at 95 °C.
The gel was run for 45 minutes at 370 V and 15 W.
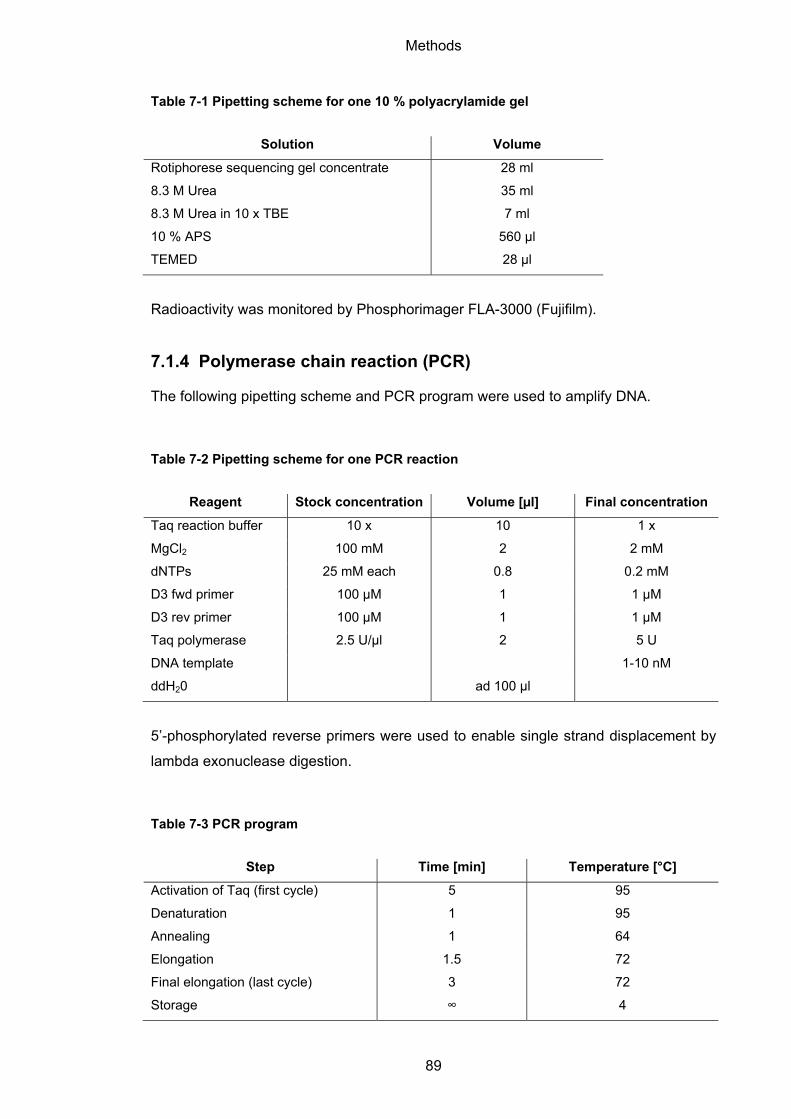
Methods
89
Table 7-1 Pipetting scheme for one 10 % polyacrylamide gel
Solution Volume
Rotiphorese sequencing gel concentrate 28 ml
8.3 M Urea 35 ml
8.3 M Urea in 10 x TBE 7 ml
10 % APS 560 µl
TEMED 28 µl
Radioactivity was monitored by Phosphorimager FLA-3000 (Fujifilm).
7.1.4 Polymerase chain reaction (PCR)
The following pipetting scheme and PCR program were used to amplify DNA.
Table 7-2 Pipetting scheme for one PCR reaction
Reagent Stock concentration Volume [µl] Final concentration
Taq reaction buffer 10 x 10 1 x
MgCl2 100 mM 2 2 mM
dNTPs 25 mM each 0.8 0.2 mM
D3 fwd primer 100 µM 1 1 µM
D3 rev primer 100 µM 1 1 µM
Taq polymerase 2.5 U/µl 2 5 U
DNA template 1-10 nM
ddH20 ad 100 µl
5’-phosphorylated reverse primers were used to enable single strand displacement by
lambda exonuclease digestion.
Table 7-3 PCR program
Step Time [min] Temperature [°C]
Activation of Taq (first cycle) 5 95
Denaturation 1 95
Annealing 1 64
Elongation 1.5 72
Final elongation (last cycle) 3 72
Storage ∞ 4
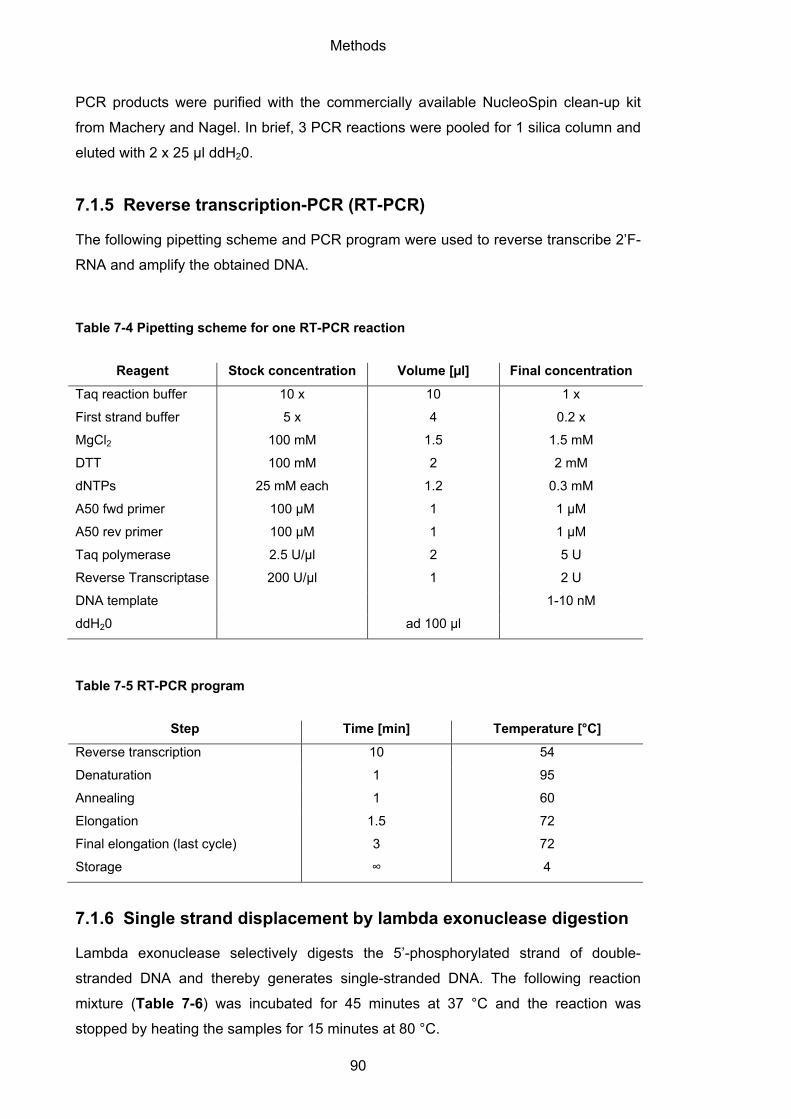
Methods
90
PCR products were purified with the commercially available NucleoSpin clean-up kit
from Machery and Nagel. In brief, 3 PCR reactions were pooled for 1 silica column and
eluted with 2 x 25 µl ddH20.
7.1.5 Reverse transcription-PCR (RT-PCR)
The following pipetting scheme and PCR program were used to reverse transcribe 2’F-
RNA and amplify the obtained DNA.
Table 7-4 Pipetting scheme for one RT-PCR reaction
Reagent Stock concentration Volume [µl] Final concentration
Taq reaction buffer 10 x 10 1 x
First strand buffer 5 x 4 0.2 x
MgCl2 100 mM 1.5 1.5 mM
DTT 100 mM 2 2 mM
dNTPs 25 mM each 1.2 0.3 mM
A50 fwd primer 100 µM 1 1 µM
A50 rev primer 100 µM 1 1 µM
Taq polymerase 2.5 U/µl 2 5 U
Reverse Transcriptase 200 U/µl 1 2 U
DNA template 1-10 nM
ddH20 ad 100 µl
Table 7-5 RT-PCR program
Step Time [min] Temperature [°C]
Reverse transcription 10 54
Denaturation 1 95
Annealing 1 60
Elongation 1.5 72
Final elongation (last cycle) 3 72
Storage ∞ 4
7.1.6 Single strand displacement by lambda exonuclease digestion
Lambda exonuclease selectively digests the 5’-phosphorylated strand of double-
stranded DNA and thereby generates single-stranded DNA. The following reaction
mixture (Table 7-6) was incubated for 45 minutes at 37 °C and the reaction was
stopped by heating the samples for 15 minutes at 80 °C.
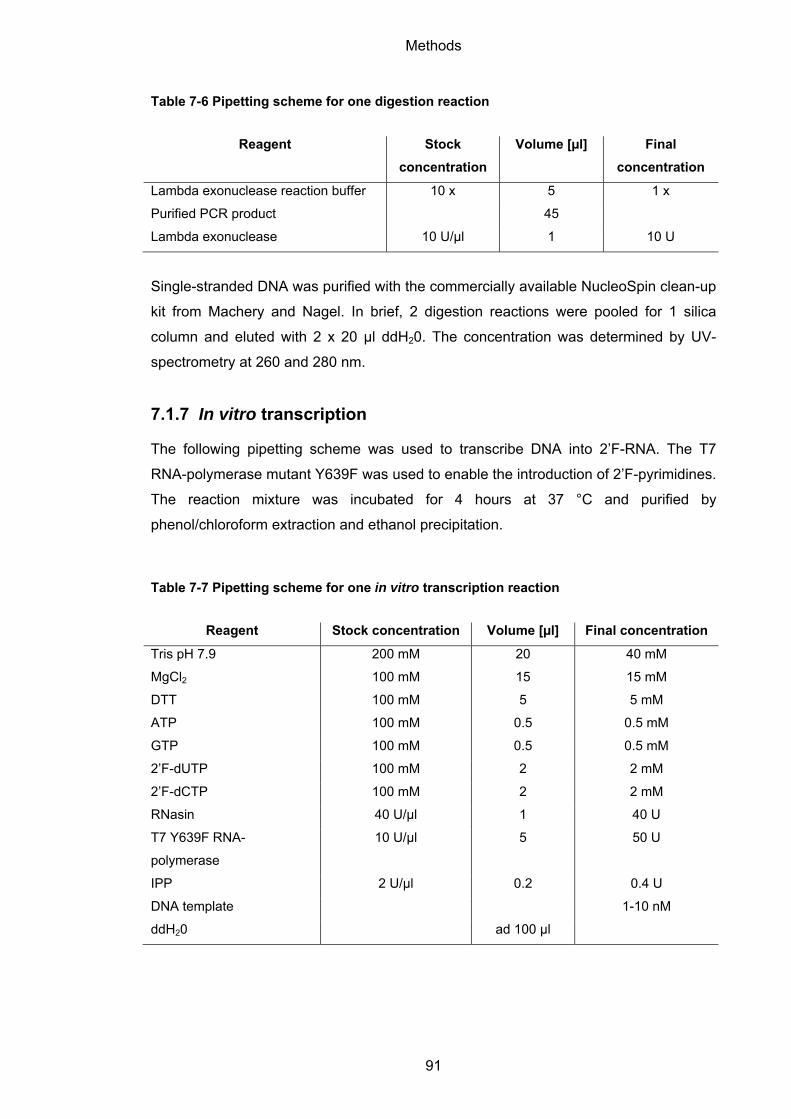
Methods
91
Table 7-6 Pipetting scheme for one digestion reaction
Reagent Stock
concentration
Volume [µl] Final
concentration
Lambda exonuclease reaction buffer 10 x 5 1 x
Purified PCR product 45
Lambda exonuclease 10 U/µl 1 10 U
Single-stranded DNA was purified with the commercially available NucleoSpin clean-up
kit from Machery and Nagel. In brief, 2 digestion reactions were pooled for 1 silica
column and eluted with 2 x 20 µl ddH20. The concentration was determined by UV-
spectrometry at 260 and 280 nm.
7.1.7 In vitro transcription
The following pipetting scheme was used to transcribe DNA into 2’F-RNA. The T7
RNA-polymerase mutant Y639F was used to enable the introduction of 2’F-pyrimidines.
The reaction mixture was incubated for 4 hours at 37 °C and purified by
phenol/chloroform extraction and ethanol precipitation.
Table 7-7 Pipetting scheme for one in vitro transcription reaction
Reagent Stock concentration Volume [µl] Final concentration
Tris pH 7.9 200 mM 20 40 mM
MgCl2 100 mM 15 15 mM
DTT 100 mM 5 5 mM
ATP 100 mM 0.5 0.5 mM
GTP 100 mM 0.5 0.5 mM
2’F-dUTP 100 mM 2 2 mM
2’F-dCTP 100 mM 2 2 mM
RNasin 40 U/µl 1 40 U
T7 Y639F RNA-
polymerase
10 U/µl 5 50 U
IPP 2 U/µl 0.2 0.4 U
DNA template 1-10 nM
ddH20 ad 100 µl
Methods
92
7.1.8 Phenol/Chloroform extraction and ethanol precipitation
Phenol/Chloroform extraction and ethanol precipitation was used to isolate DNA or 2’F-
RNA sequences from BM-DCs during cell-SELEX.
One volume of phenol was mixed with one volume of nucleic acid solution by extensive
vortexing. After spinning the samples at maximum speed for 3 minutes, the upper
phase was transferred into a new tube. Two volumes of chloroform were added and the
samples mixed and centrifuged. Again, the upper phase was transferred into a new
tube for ethanol precipitation. DNA was precipitated with 1/10 volume 3 M NaOAc pH
5.4 and 3 volumes of cold ethanol absolute for at least 10 minutes at -80 °C.
Afterwards the samples were centrifuged at maximum speed for 20 minutes and the
pellets washed with 70 % cold ethanol. After spinning at maximum speed for 5 minutes,
the pellets were air-dried and resuspended in 50 µl ddH20.
7.1.9 Quantification
Concentrations of nucleic acids were determined by using the NanoQuant infinite 200
(Tecan) or Nanodrop 2000c (Thermo Scientific) devices. In principle, absorption of
nucleic acids at 260 nm was measured and correlated to the respective concentration
by using the Lambert-Beer law. Ratio of absorbance at 260 nm and 280 nm determined
the purity of nucleic acid solutions.
7.1.10 32P-labeling of nucleic acids
For radioactive filter retention assay or binding assay, single-stranded DNA or
dephosphorylated 2’F-RNA (Table 7-8) was labeled with 32P at the 5’-end by using the
T4 polynucleotide kinase (PNK). The following reaction mixture (Table 7-9) was
incubated for 1 hour at 37 °C and subsequently desalted by passing through a G25
column.
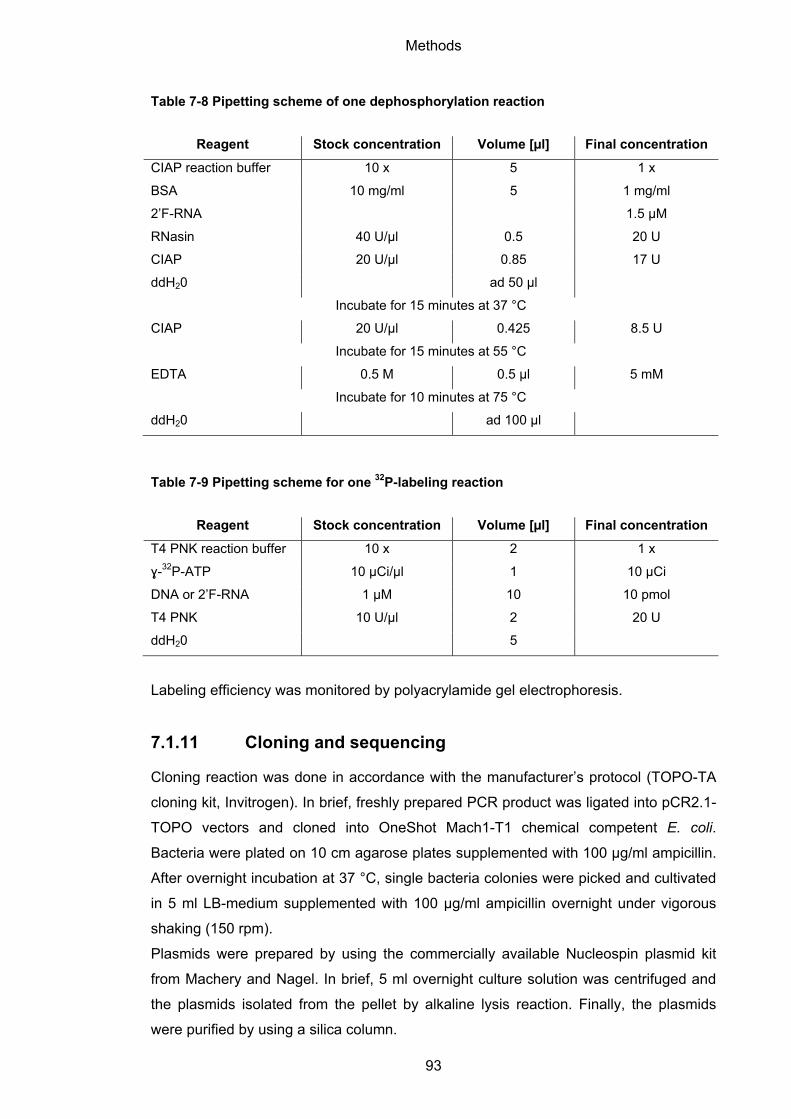
Methods
93
Table 7-8 Pipetting scheme of one dephosphorylation reaction
Reagent Stock concentration Volume [µl] Final concentration
CIAP reaction buffer 10 x 5 1 x
BSA 10 mg/ml 5 1 mg/ml
2’F-RNA 1.5 µM
RNasin 40 U/µl 0.5 20 U
CIAP 20 U/µl 0.85 17 U
ddH20 ad 50 µl
Incubate for 15 minutes at 37 °C
CIAP 20 U/µl 0.425 8.5 U
Incubate for 15 minutes at 55 °C
EDTA 0.5 M 0.5 µl 5 mM
Incubate for 10 minutes at 75 °C
ddH20 ad 100 µl
Table 7-9 Pipetting scheme for one 32P-labeling reaction
Reagent Stock concentration Volume [µl] Final concentration
T4 PNK reaction buffer 10 x 2 1 x
ɣ-32P-ATP 10 µCi/µl 1 10 µCi
DNA or 2’F-RNA 1 µM 10 10 pmol
T4 PNK 10 U/µl 2 20 U
ddH20 5
Labeling efficiency was monitored by polyacrylamide gel electrophoresis.
7.1.11 Cloning and sequencing
Cloning reaction was done in accordance with the manufacturer’s protocol (TOPO-TA
cloning kit, Invitrogen). In brief, freshly prepared PCR product was ligated into pCR2.1-
TOPO vectors and cloned into OneShot Mach1-T1 chemical competent E. coli.
Bacteria were plated on 10 cm agarose plates supplemented with 100 µg/ml ampicillin.
After overnight incubation at 37 °C, single bacteria colonies were picked and cultivated
in 5 ml LB-medium supplemented with 100 µg/ml ampicillin overnight under vigorous
shaking (150 rpm).
Plasmids were prepared by using the commercially available Nucleospin plasmid kit
from Machery and Nagel. In brief, 5 ml overnight culture solution was centrifuged and
the plasmids isolated from the pellet by alkaline lysis reaction. Finally, the plasmids
were purified by using a silica column.
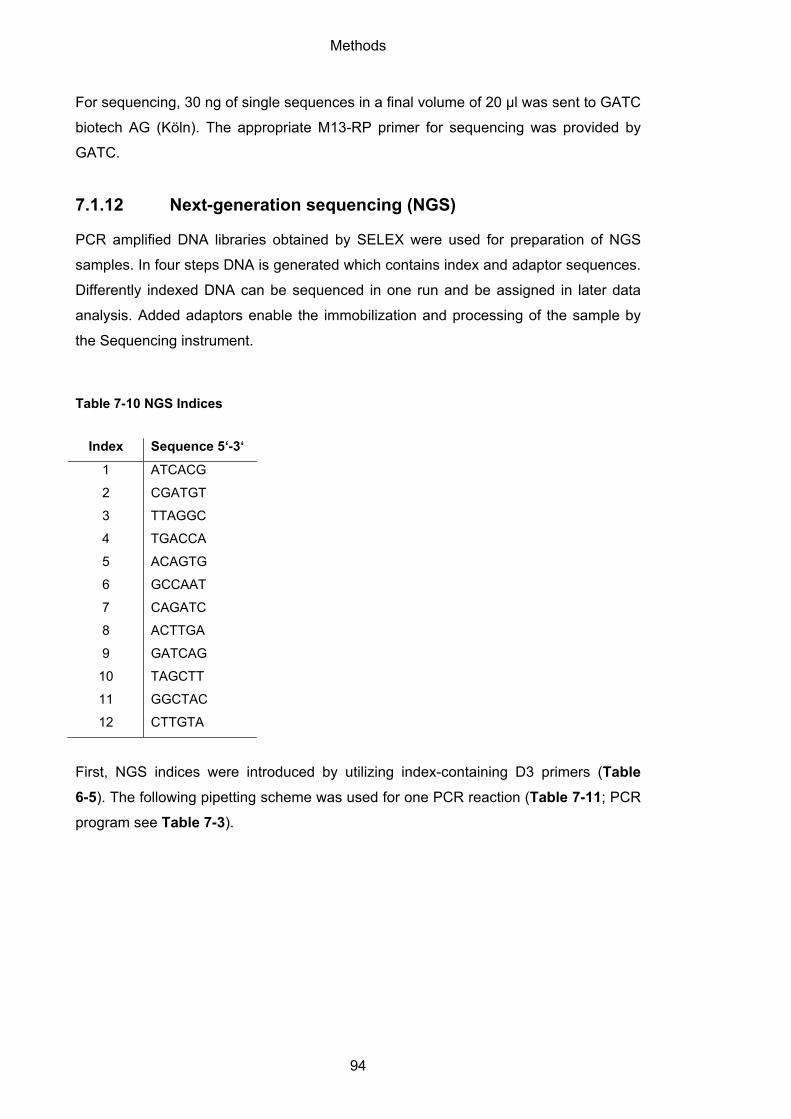
Methods
94
For sequencing, 30 ng of single sequences in a final volume of 20 µl was sent to GATC
biotech AG (Köln). The appropriate M13-RP primer for sequencing was provided by
GATC.
7.1.12 Next-generation sequencing (NGS)
PCR amplified DNA libraries obtained by SELEX were used for preparation of NGS
samples. In four steps DNA is generated which contains index and adaptor sequences.
Differently indexed DNA can be sequenced in one run and be assigned in later data
analysis. Added adaptors enable the immobilization and processing of the sample by
the Sequencing instrument.
Table 7-10 NGS Indices
Index Sequence 5‘-3‘
1
2
3
4
5
6
7
8
9
10
11
12
ATCACG
CGATGT
TTAGGC
TGACCA
ACAGTG
GCCAAT
CAGATC
ACTTGA
GATCAG
TAGCTT
GGCTAC
CTTGTA
First, NGS indices were introduced by utilizing index-containing D3 primers (Table
6-5). The following pipetting scheme was used for one PCR reaction (Table 7-11; PCR
program see Table 7-3).
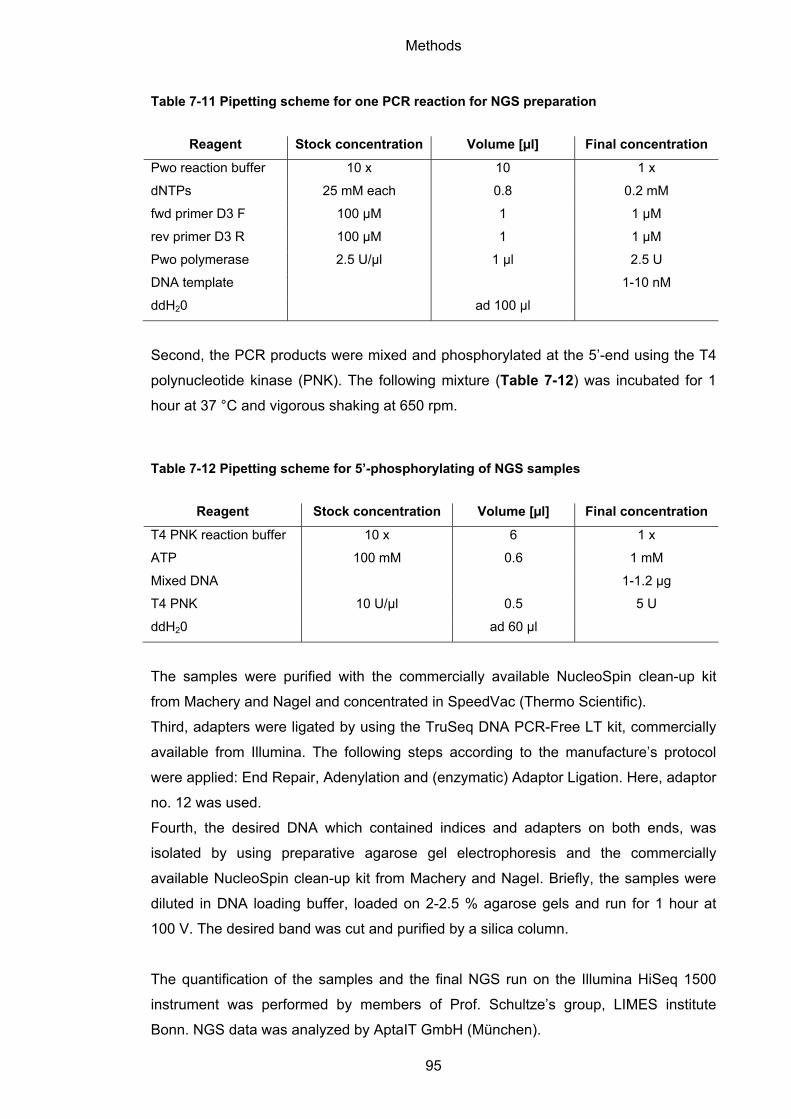
Methods
95
Table 7-11 Pipetting scheme for one PCR reaction for NGS preparation
Reagent Stock concentration Volume [µl] Final concentration
Pwo reaction buffer 10 x 10 1 x
dNTPs 25 mM each 0.8 0.2 mM
fwd primer D3 F 100 µM 1 1 µM
rev primer D3 R 100 µM 1 1 µM
Pwo polymerase 2.5 U/µl 1 µl 2.5 U
DNA template 1-10 nM
ddH20 ad 100 µl
Second, the PCR products were mixed and phosphorylated at the 5’-end using the T4
polynucleotide kinase (PNK). The following mixture (Table 7-12) was incubated for 1
hour at 37 °C and vigorous shaking at 650 rpm.
Table 7-12 Pipetting scheme for 5’-phosphorylating of NGS samples
Reagent Stock concentration Volume [µl] Final concentration
T4 PNK reaction buffer 10 x 6 1 x
ATP 100 mM 0.6 1 mM
Mixed DNA 1-1.2 µg
T4 PNK 10 U/µl 0.5 5 U
ddH20 ad 60 µl
The samples were purified with the commercially available NucleoSpin clean-up kit
from Machery and Nagel and concentrated in SpeedVac (Thermo Scientific).
Third, adapters were ligated by using the TruSeq DNA PCR-Free LT kit, commercially
available from Illumina. The following steps according to the manufacture’s protocol
were applied: End Repair, Adenylation and (enzymatic) Adaptor Ligation. Here, adaptor
no. 12 was used.
Fourth, the desired DNA which contained indices and adapters on both ends, was
isolated by using preparative agarose gel electrophoresis and the commercially
available NucleoSpin clean-up kit from Machery and Nagel. Briefly, the samples were
diluted in DNA loading buffer, loaded on 2-2.5 % agarose gels and run for 1 hour at
100 V. The desired band was cut and purified by a silica column.
The quantification of the samples and the final NGS run on the Illumina HiSeq 1500
instrument was performed by members of Prof. Schultze’s group, LIMES institute
Bonn. NGS data was analyzed by AptaIT GmbH (München).
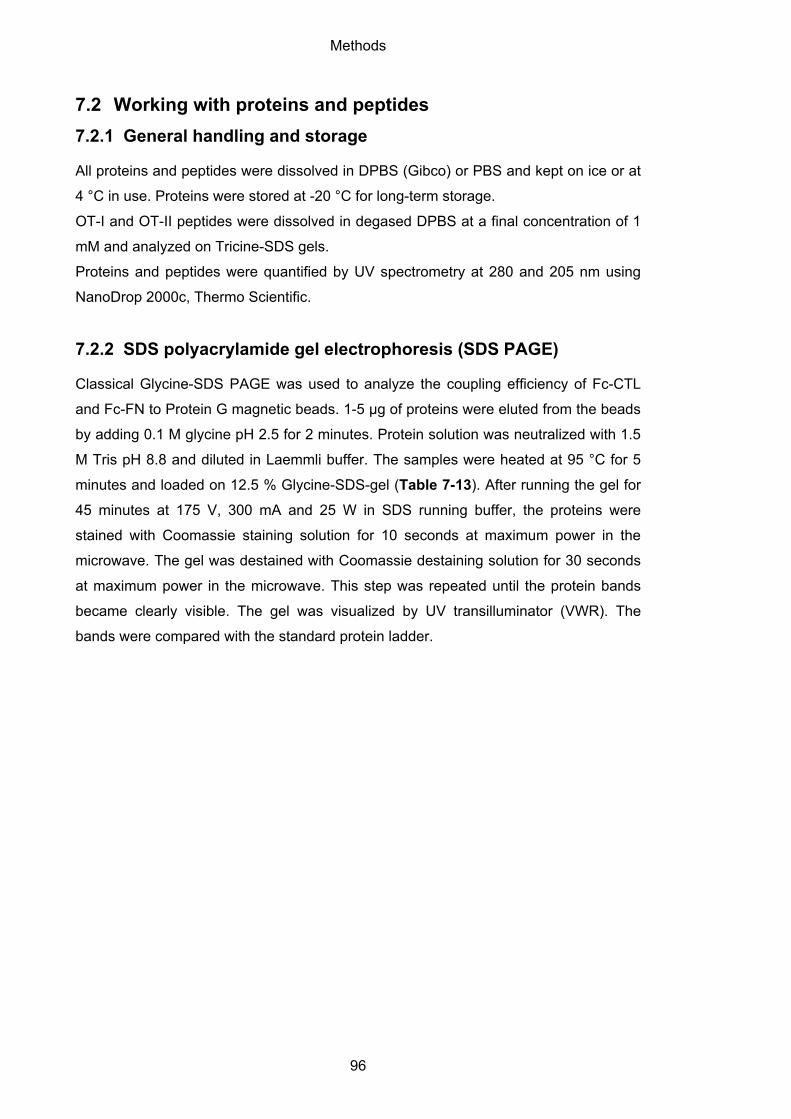
Methods
96
7.2 Working with proteins and peptides
7.2.1 General handling and storage
All proteins and peptides were dissolved in DPBS (Gibco) or PBS and kept on ice or at
4 °C in use. Proteins were stored at -20 °C for long-term storage.
OT-I and OT-II peptides were dissolved in degased DPBS at a final concentration of 1
mM and analyzed on Tricine-SDS gels.
Proteins and peptides were quantified by UV spectrometry at 280 and 205 nm using
NanoDrop 2000c, Thermo Scientific.
7.2.2 SDS polyacrylamide gel electrophoresis (SDS PAGE)
Classical Glycine-SDS PAGE was used to analyze the coupling efficiency of Fc-CTL
and Fc-FN to Protein G magnetic beads. 1-5 µg of proteins were eluted from the beads
by adding 0.1 M glycine pH 2.5 for 2 minutes. Protein solution was neutralized with 1.5
M Tris pH 8.8 and diluted in Laemmli buffer. The samples were heated at 95 °C for 5
minutes and loaded on 12.5 % Glycine-SDS-gel (Table 7-13). After running the gel for
45 minutes at 175 V, 300 mA and 25 W in SDS running buffer, the proteins were
stained with Coomassie staining solution for 10 seconds at maximum power in the
microwave. The gel was destained with Coomassie destaining solution for 30 seconds
at maximum power in the microwave. This step was repeated until the protein bands
became clearly visible. The gel was visualized by UV transilluminator (VWR). The
bands were compared with the standard protein ladder.
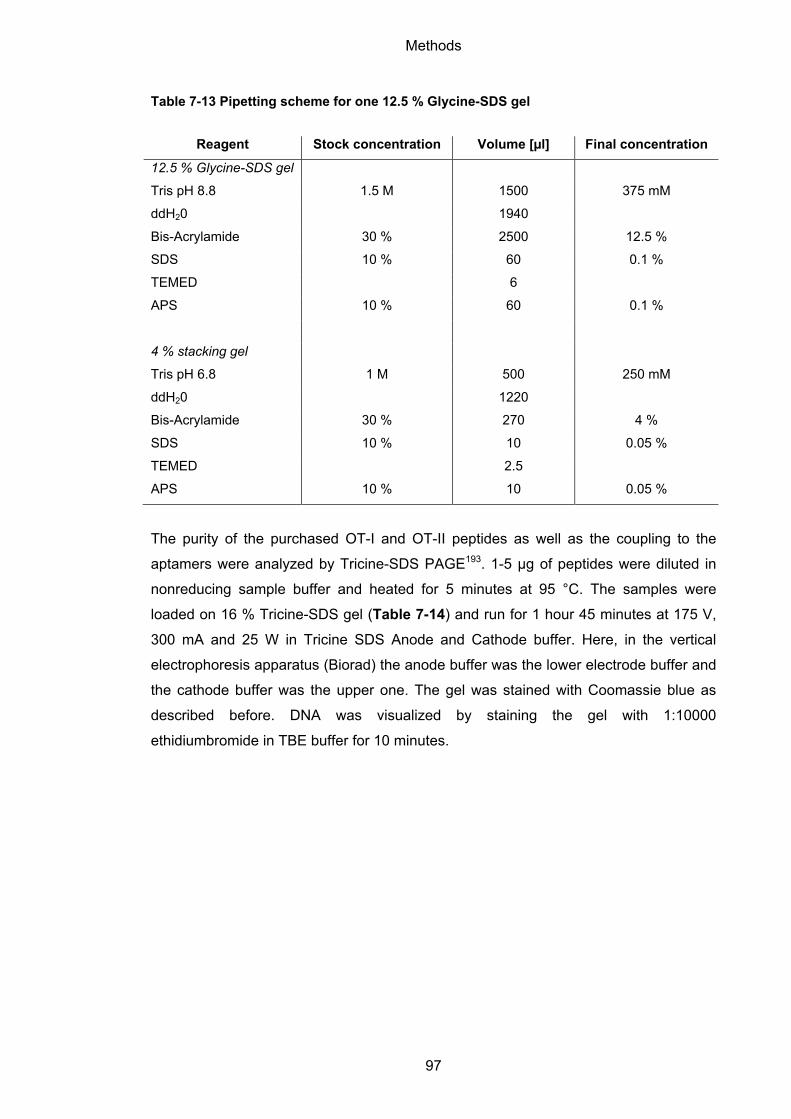
Methods
97
Table 7-13 Pipetting scheme for one 12.5 % Glycine-SDS gel
Reagent Stock concentration Volume [µl] Final concentration
12.5 % Glycine-SDS gel
Tris pH 8.8 1.5 M 1500 375 mM
ddH20 1940
Bis-Acrylamide 30 % 2500 12.5 %
SDS 10 % 60 0.1 %
TEMED 6
APS 10 % 60 0.1 %
4 % stacking gel
Tris pH 6.8 1 M 500 250 mM
ddH20 1220
Bis-Acrylamide 30 % 270 4 %
SDS 10 % 10 0.05 %
TEMED 2.5
APS 10 % 10 0.05 %
The purity of the purchased OT-I and OT-II peptides as well as the coupling to the
aptamers were analyzed by Tricine-SDS PAGE193. 1-5 µg of peptides were diluted in
nonreducing sample buffer and heated for 5 minutes at 95 °C. The samples were
loaded on 16 % Tricine-SDS gel (Table 7-14) and run for 1 hour 45 minutes at 175 V,
300 mA and 25 W in Tricine SDS Anode and Cathode buffer. Here, in the vertical
electrophoresis apparatus (Biorad) the anode buffer was the lower electrode buffer and
the cathode buffer was the upper one. The gel was stained with Coomassie blue as
described before. DNA was visualized by staining the gel with 1:10000
ethidiumbromide in TBE buffer for 10 minutes.
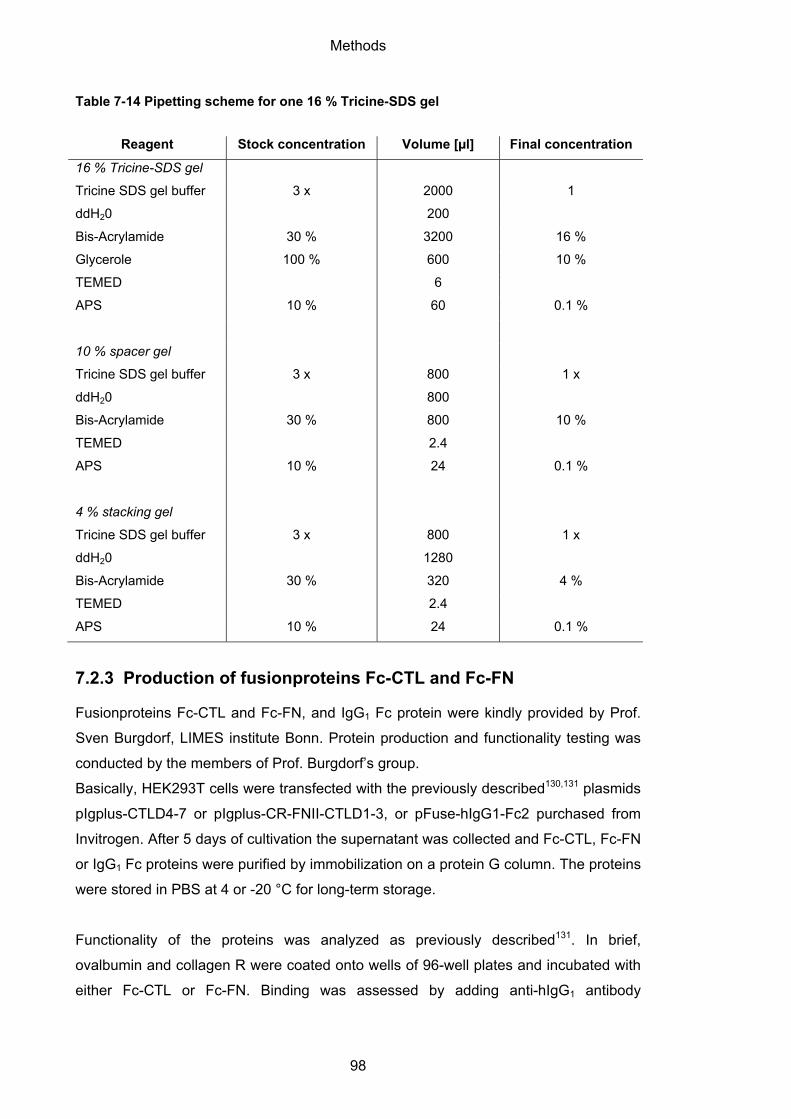
Methods
98
Table 7-14 Pipetting scheme for one 16 % Tricine-SDS gel
Reagent Stock concentration Volume [µl] Final concentration
16 % Tricine-SDS gel
Tricine SDS gel buffer 3 x 2000 1
ddH20 200
Bis-Acrylamide 30 % 3200 16 %
Glycerole 100 % 600 10 %
TEMED 6
APS 10 % 60 0.1 %
10 % spacer gel
Tricine SDS gel buffer 3 x 800 1 x
ddH20 800
Bis-Acrylamide 30 % 800 10 %
TEMED 2.4
APS 10 % 24 0.1 %
4 % stacking gel
Tricine SDS gel buffer 3 x 800 1 x
ddH20 1280
Bis-Acrylamide 30 % 320 4 %
TEMED 2.4
APS 10 % 24 0.1 %
7.2.3 Production of fusionproteins Fc-CTL and Fc-FN
Fusionproteins Fc-CTL and Fc-FN, and IgG1 Fc protein were kindly provided by Prof.
Sven Burgdorf, LIMES institute Bonn. Protein production and functionality testing was
conducted by the members of Prof. Burgdorf’s group.
Basically, HEK293T cells were transfected with the previously described130,131 plasmids
pIgplus-CTLD4-7 or pIgplus-CR-FNII-CTLD1-3, or pFuse-hIgG1-Fc2 purchased from
Invitrogen. After 5 days of cultivation the supernatant was collected and Fc-CTL, Fc-FN
or IgG1 Fc proteins were purified by immobilization on a protein G column. The proteins
were stored in PBS at 4 or -20 °C for long-term storage.
Functionality of the proteins was analyzed as previously described131. In brief,
ovalbumin and collagen R were coated onto wells of 96-well plates and incubated with
either Fc-CTL or Fc-FN. Binding was assessed by adding anti-hIgG1 antibody
Methods
99
horseradish conjugate and peroxidase substrate. Absorbance was measured at 450
and 620 nm.
7.3 Handling of mice and cells
7.3.1 Mice
C57BL/6J, MR-/-, OTI RAG2-/- and OTII mice were bred in the central animal facility of
the LIMES institute under specific pathogen-free conditions. Mice between 8-16 weeks
were used in accordance with local animal experimental guidelines.
7.3.2 Cell culture
Cells were cultured under standard conditions (37 °C, 5 % CO2, 95 % humidity). Cells
were handled under sterile conditions according to S1 lab regulations. BM-DCs were
centrifuged for 5 min at 200 x g, splenocytes for 10 min at 300 x g.
7.3.3 Isolation and cultivation of bone marrow-derived dendritic
cells (BM-DC) and macrophages (BM-macrophages)
Wildtype or MR-/- mice were sacrificed and the femur and tibia extracted. The bone
marrow was flushed out with PBS and filtered through a 40 µm nylon membrane. The
cells of the bone marrow were cultivated in DC-medium or macrophage-medium for 7
days. After 3-4 days the medium was changed.
7.3.4 Isolation and cultivation of splenocytes
The mouse (C57/BL6J, OTI RAG2-/- or OTII) was sacrificed and the spleen extracted.
The spleen was mashed with a syringe plunger into cold PBS and filtered through a 40
µm nylon membrane. The cells were centrifuged and resuspended in T-cell medium.
7.3.5 Human peripheral blood mononuclear cells (PBMCs)
Human PBMCs were kindly provided by Prof. Joachim Schultze, LIMES institute Bonn.
Cells were isolated and cultured as previously described184,194 by the members of Prof.
Schultze’s group. In brief, human blood PBMCs were obtained from healthy donor at
the Institute for Experimental Hematology and Transfusion Medicine of the University
Hospitals Bonn (local ethics votes no. 288/13). CD14+ blood monocytes were either
differentiated with GM-CSF alone or GM-CSF supplemented with IL-4, IFN-ɣ or TPP
Methods
100
stimuli (TNF-α/PGE2/P3C) to generate baseline macrophages, M1 or M2
macrophages, DCs or TPP macrophages (see Figure S 9.8.1).
7.4 SELEX
7.4.1 Coupling of Fc-fusionproteins to Protein G magnetic beads
Fc-CTL and Fc-FN were coupled to magnetic beads Protein G conjugates. 10 mg
beads were washed thrice with 50 mM NaOAc pH 5. 200 µg proteins were added for
30 minutes and vigorous shaking at 400 rpm. The mixture was thereby resuspended
every 5 minutes. The samples were finally washed thrice with PBS and stored in 2 ml
PBS supplemented with 0.01 mg/ml BSA at 4 °C until use.
Coupling efficiency was analyzed by SDS polyacrylamide gel electrophoresis.
7.4.2 Protein SELEX
The SELEX procedure was started by incubation of 1 nmol D3 DNA library with 400 µg
Fc-CTL- or Fc-FN-beads in a total volume of 100 µl selection buffer for 30 min at 37 °C.
The beads were resuspended every 5 minutes. After washing with wash buffer the
bound DNA was eluted in 65 µl ddH2O 3 min at 80 °C and amplified. After lambda
exonuclease digestion the DNA was purified by silica column and eluted in a total
volume of 30 µl ddH2O. 18 µl eluate was introduced in the subsequent rounds of
SELEX. From the second round counter selection was carried out, i.e. enriched DNA
was pre-incubated with 400 µg of the other Fc-fusionprotein-beads. To gradually
enhance the stringency of the selection process, the two washing cycles from round 1
were increased by two per selection round, ending with 24 at round 11.
7.4.3 Cell-SELEX
Before every selection experiment the cultivated BM-DCs were detached by using
PBS, containing 2 mM EDTA, and seeded in 6 cm petri dishes. After reattachment the
cells were washed twice with wash buffer. The naïve D3 DNA or A50 2’F-RNA library
and enriched libraries were denaturated by heating 5 min at 95 °C and immediately
added to the selection buffer. The naïve D3 DNA library was supplemented with the
mixture of enriched libraries of the 3rd round of protein-SELEX targeting Fc-CTL and
Fc-FN. The SELEX procedure was started by incubation of 1 nmol naïve library with 5
x 106 BM-DCs in a total volume of 2 ml selection buffer for 30 min at 37 °C. The cells
were rotated gently every 5 minutes. After washing the cells with wash buffer, they
were scraped and the bound oligonucleotides eluted in ddH2O 5 min at 95 °C. The
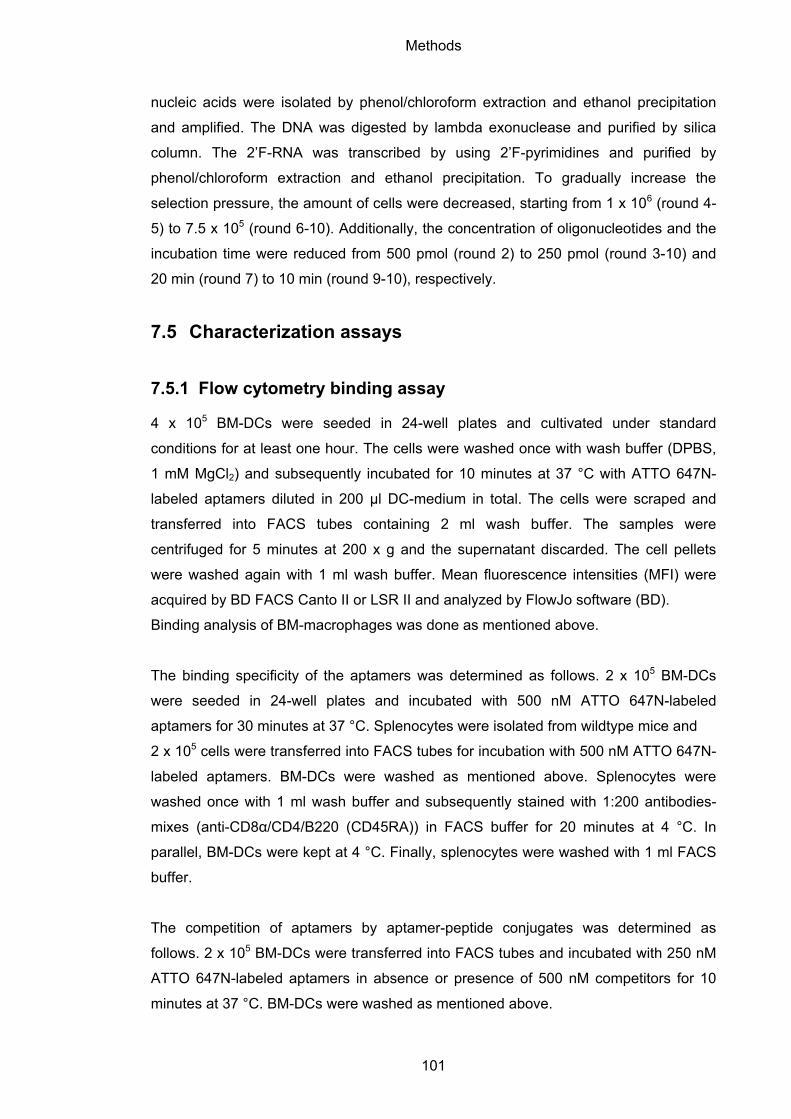
Methods
101
nucleic acids were isolated by phenol/chloroform extraction and ethanol precipitation
and amplified. The DNA was digested by lambda exonuclease and purified by silica
column. The 2’F-RNA was transcribed by using 2’F-pyrimidines and purified by
phenol/chloroform extraction and ethanol precipitation. To gradually increase the
selection pressure, the amount of cells were decreased, starting from 1 x 10⁶ (round 4-
5) to 7.5 x 10⁵ (round 6-10). Additionally, the concentration of oligonucleotides and the
incubation time were reduced from 500 pmol (round 2) to 250 pmol (round 3-10) and
20 min (round 7) to 10 min (round 9-10), respectively.
7.5 Characterization assays
7.5.1 Flow cytometry binding assay
4 x 10⁵ BM-DCs were seeded in 24-well plates and cultivated under standard
conditions for at least one hour. The cells were washed once with wash buffer (DPBS,
1 mM MgCl2) and subsequently incubated for 10 minutes at 37 °C with ATTO 647N-
labeled aptamers diluted in 200 µl DC-medium in total. The cells were scraped and
transferred into FACS tubes containing 2 ml wash buffer. The samples were
centrifuged for 5 minutes at 200 x g and the supernatant discarded. The cell pellets
were washed again with 1 ml wash buffer. Mean fluorescence intensities (MFI) were
acquired by BD FACS Canto II or LSR II and analyzed by FlowJo software (BD).
Binding analysis of BM-macrophages was done as mentioned above.
The binding specificity of the aptamers was determined as follows. 2 x 10⁵ BM-DCs
were seeded in 24-well plates and incubated with 500 nM ATTO 647N-labeled
aptamers for 30 minutes at 37 °C. Splenocytes were isolated from wildtype mice and
2 x 10⁵ cells were transferred into FACS tubes for incubation with 500 nM ATTO 647N-
labeled aptamers. BM-DCs were washed as mentioned above. Splenocytes were
washed once with 1 ml wash buffer and subsequently stained with 1:200 antibodies-
mixes (anti-CD8α/CD4/B220 (CD45RA)) in FACS buffer for 20 minutes at 4 °C. In
parallel, BM-DCs were kept at 4 °C. Finally, splenocytes were washed with 1 ml FACS
buffer.
The competition of aptamers by aptamer-peptide conjugates was determined as
follows. 2 x 10⁵ BM-DCs were transferred into FACS tubes and incubated with 250 nM
ATTO 647N-labeled aptamers in absence or presence of 500 nM competitors for 10
minutes at 37 °C. BM-DCs were washed as mentioned above.
Methods
102
7.5.2 Radioactive binding assay
7.5.2.1 Filter retention assay
The interaction of DNA with proteins was monitored by radioactive filter retention
assay. 32P-DNA was incubated with increasing concentrations of proteins in 25 µl
protein-SELEX selection buffer for 30 minutes at 37 °C. In the meantime, the
nitrocellulose membrane was soaked in 0.4 M KOH for 15-20 minutes and
subsequently rinsed with PBS. The dot blot unit and the vacuum manifold were
assembled. The membrane was equilibrated with 200 µl wash buffer (PBS, 1 mM
MgCl2, 1 mM CaCl2) and 20 µl sample was loaded. Afterwards, the membrane was
washed 4 times with 200 µl wash buffer. 0.8 µl 32P-DNA was spotted on a dry
membrane to allow the quantification of the percentage of DNA bound to the proteins.
Radioactivity was acquired on the Phosphorimager FLA-3000 (Fujifilm) and quantified
by using AIDA image software (raytest).
7.5.2.2 Cell binding assay using Cherenkov protocol
0.5 x 10⁵ BM-DCs were seeded in 24-well plates and cultivated under standard
conditions for at least one hour. The cells were washed once with wash buffer (DPBS,
1 mM MgCl2) and subsequently incubated for 10 minutes at 37 °C with 1 pmol 32P-DNA
or 32P-2’F-RNA diluted in 500 µl cell-SELEX selection buffer in total. The incubation
buffer was collected in 1.5 ml reaction tubes as fraction I. The cells were washed twice
with 500 µl wash buffer and both fractions were collected (fraction II and III). The cells
were detached by adding 500 µl Trypsin/EDTA for several minutes at 37 °C and
collected as fraction IV. Radioactivity was measured on the Liquid scintillation counter
WinSpectral (Perkin Elmer) using the Cherenkov protocol. The percentage of bound 32P-DNA or 32P-2’F-RNA was calculated with the following formula:
%
∗ 100
7.5.3 Confocal microscopy
2 x 10⁵ BM-DCs were seeded onto cover slips in 12-well plates and cultivated under
standard conditions for at least one hour. The cells were washed once with wash buffer
(DPBS, 1 mM MgCl2) and subsequently incubated for 30 minutes at 37 °C with 250 nM
ATTO 647N-labeled CTL#5 or for 10 minutes at 37 °C with 250 nM ATTO 647N-
labeled D#5 or D#7 diluted in 300 µl DC-medium in total. The cells were washed thrice
with wash buffer and once with 1 ml DPBS. After fixation in 4 % paraformaldehyde
Methods
103
diluted in DPBS for 20 minutes, cells were washed thrice with DPBS and permeabilized
in 0.1 % Triton X-100 in DPBS for 5 minutes. The cells were washed thrice with DPBS
and blocked in 10 % milk in DPBS for 1 hour. Primary antibodies were diluted in DPBS
at a dilution of 1:100. The cells were stained for 45 minutes and subsequently washed
thrice with DPBS. Secondary antibodies were diluted 1:400 in DPBS. The cells were
stained for 45 minutes and subsequently washed thrice with DPBS. The nuclei were
stained with 1:1000 1 mg/ml DAPI in DPBS for 5 minutes and washed once with DPBS
and twice with 2 ml ddH2O. Finally, cover slips were mounted onto slides with Fluorogel
or Prolong Diamond mouting medium.
The co-localization studies of CTL#5 was done in comparison with OVA. Here, the cells
were stained for 30 minutes at 37 °C with 250 ng/ml OVA-Alexa Fluor 647.
In internalization studies the membranes were stained after fixation with WGA-Alexa
Fluor 488 (1.5 µl 1 mg/ml WGA-AF488 in 500 µl DPBS) for 10 minutes.
Confocal microscopy data for CTL#5 were acquired by FluoView FV1000 confocal
laser scanning microscope (Olympus), and for D#5 and D#7 by LSM 710 confocal laser
scanning microscope (Zeiss). Co-localization was quantified by Olympus FluoView or
Zeiss Zen software.
7.5.4 TNF-α HTRF assay
In accordance with the manufacturer guidelines (Cisbio) TNF-α homogeneous time-
resolved fluorescence (HTRF) assay was performed by James Stunden, member of
Prof. Latz group, University Hospitals Bonn. In brief, immortalized murine embryonic
stem cell-derived macrophages were treated with increasing concentrations of
oligonucleotides for 24 hours. Subsequently, cell supernatants were stained with two
different anti-TNF-α antibodies attached to either fluorescence energy transfer (FRET)
donor or acceptor molecules. In close proximity of these molecules the fluorescence
emission spectrum changes and this change is proportional to the TNF-α concentration
in the sample.
7.6 Generation of aptamer-peptide conjugates
7.6.1 Thiol-maleimide coupling
5'-thiol-C6 oligonucleotides were purchased from Ella Biotech, dissolved in degased
ddH2O at a final concentration of 100 µM and stored at -20 °C. The oligonucleotides
Methods
104
were reduced with a 2000-fold molar excess of freshly prepared DTT in 1 M TEAA pH
8.3-8.5, heated up for 3 min at 70 °C following 1 h incubation at room temperature. The
reduced oligonucleotides were desalted using an Amicon 10 K column into degased
ddH2O and subsequently incubated with a 55-fold molar excess of N-maleimide-
peptides. The reaction mixture was incubated overnight at 4 °C and purified by reverse-
phase HPLC on a C18 column using a linear gradient of 100 mM HFIP and 10 mM
TEA. The collected fractions were analyzed by LC-MS and the concentration quantified
with UV spectrometry.
7.7 Functional assays
7.7.1 In vitro proliferation assay
5 x 10⁴ BM-DCs were seeded in 96-well plates and cultivated under standard
conditions for at least one hour. OTI or OTII T cells (OVA-specific CD8 or CD4 T cells)
were isolated from spleen and stained with 1 µM CFSE in PBS for 15 min at 37 °C. The
T cells were washed three times with 4 °C cold PBS and centrifuged. Meanwhile, MHC
I or MHC II peptides, aptamers, aptamer-peptide conjugates and OT-I or OT-II peptides
were diluted in DC-medium and added to the BM-DCs for 10 min at 37 °C.
Subsequently, the supernatants from BM-DCs were removed and 1 x 10⁵ OTI or OTII T
cells in 100 µl T cell medium were added. After 24 hours, 200 µl T cell medium was
given per well and the cells were incubated for another 48 hours. Finally, the T cells
were stained with anti-CD4 or anti-CD8alpha antibodies-fluorophore conjugates and
analyzed by flow cytometry. The antibodies were diluted 1:400 in FACS buffer
supplemented with mouse serum at a 1:100 dilution.
7.7.2 In vitro cytotoxicity assay
2 x 10⁵ BM-DCs were seeded in 24-well plates and cultivated under standard
conditions for at least one hour. OTI or OTII T cells (OVA-specific CD8 or CD4 T cells)
were isolated from spleen and centrifuged at 300 x g for 10 min. Meanwhile, MHC I or
MHC II peptides, aptamers, aptamer-peptide conjugates and OT-I or OT-II peptides
were diluted in DC-medium and added to the BM-DCs for 10 min at 37 °C.
Subsequently, the supernatants from BM-DCs were removed and 4 x 10⁵ OTI or OTII T
cells in 400 µl T cell medium were added. After 24 hours, 2 ml T cell medium was given
per well and the cells were incubated for another 48 hours. On day 4, T cells were
isolated using Ficoll density gradient centrifugation. Splenocytes derived from wildtype
mice were stained with different concentrations of CFSE and used as target or control
Methods
105
cells. Target cells stained with 0.1 µM CFSE and loaded with 2 µM MHC I or MHC II
peptides, and control cells stained with 1 µM CFSE were mixed equally and added in
different T cells:mixed cells ratios. After 24 hours, cells were labeled with Hoechst
33258 and analyzed by flow cytometry. The cytotoxic activity was calculated with the
following formula:
% 100 100 ∗ / / / ,
where p and n indicates if target and control cells were incubated for 24 hours without
T cells (no (n) T cells) or with primed (p) T cells.
7.8 Experimental analysis
7.8.1 Statistics
If not otherwise noted, data for statistical quantification were acquired from individual
experiments repeated at least two times. Samples of individual experiments were
prepared at least in duplicates. Mean and standard deviation values were calculated
with Microsoft Office Excel 2007.
References
106
8 References
1 Hoption Cann, S. A., van Netten, J. P. & van Netten, C. Dr William Coley and tumour regression: a place in history or in the future. Postgrad Med J 79, 672-680 (2003).
2 Murphy, K., Travers, P., Walport, M. Janeway's Immunobiology. 7th edn, 928 (Garland Science, 2007).
3 Kawai, T. & Akira, S. The role of pattern-recognition receptors in innate immunity: update on Toll-like receptors. Nat Immunol 11, 373-384, doi:10.1038/ni.1863 (2010).
4 Janeway, C. A., Jr. & Medzhitov, R. Innate immune recognition. Annu Rev Immunol 20, 197-216, doi:10.1146/annurev.immunol.20.083001.084359 (2002).
5 Behrens, G. et al. Helper T cells, dendritic cells and CTL Immunity. Immunol Cell Biol 82, 84-90, doi:10.1111/j.1440-1711.2004.01211.x (2004).
6 Chambers, C. A. & Allison, J. P. Costimulatory regulation of T cell function. Curr Opin Cell Biol 11, 203-210 (1999).
7 Cheuk, A. T., Mufti, G. J. & Guinn, B. A. Role of 4-1BB:4-1BB ligand in cancer immunotherapy. Cancer Gene Ther 11, 215-226, doi:10.1038/sj.cgt.7700670 (2004).
8 Curtsinger, J. M. & Mescher, M. F. Inflammatory cytokines as a third signal for T cell activation. Curr Opin Immunol 22, 333-340, doi:10.1016/j.coi.2010.02.013 (2010).
9 Curtsinger, J. M., Johnson, C. M. & Mescher, M. F. CD8 T cell clonal expansion and development of effector function require prolonged exposure to antigen, costimulation, and signal 3 cytokine. J Immunol 171, 5165-5171 (2003).
10 Xing, Y. & Hogquist, K. A. T-cell tolerance: central and peripheral. Cold Spring Harb Perspect Biol 4, doi:10.1101/cshperspect.a006957 (2012).
11 Green, D. R., Droin, N. & Pinkoski, M. Activation-induced cell death in T cells. Immunol Rev 193, 70-81 (2003).
12 Lanzavecchia, A. & Sallusto, F. Understanding the generation and function of memory T cell subsets. Curr Opin Immunol 17, 326-332, doi:10.1016/j.coi.2005.04.010 (2005).
13 Banchereau, J. & Steinman, R. M. Dendritic cells and the control of immunity. Nature 392, 245-252, doi:10.1038/32588 (1998).
14 Delamarre, L., Pack, M., Chang, H., Mellman, I. & Trombetta, E. S. Differential lysosomal proteolysis in antigen-presenting cells determines antigen fate. Science 307, 1630-1634, doi:10.1126/science.1108003 (2005).
15 Liu, K. & Nussenzweig, M. C. Origin and development of dendritic cells. Immunol Rev 234, 45-54, doi:10.1111/j.0105-2896.2009.00879.x (2010).
16 Mellman, I. & Steinman, R. M. Dendritic cells: specialized and regulated antigen processing machines. Cell 106, 255-258 (2001).
17 Kaisho, T. & Akira, S. Toll-like receptors and their signaling mechanism in innate immunity. Acta Odontol Scand 59, 124-130 (2001).
18 Steinman, R. M., Hawiger, D. & Nussenzweig, M. C. Tolerogenic dendritic cells. Annu Rev Immunol 21, 685-711, doi:10.1146/annurev.immunol.21.120601.141040 (2003).
References
107
19 Burgdorf, S., Kautz, A., Bohnert, V., Knolle, P. A. & Kurts, C. Distinct pathways of antigen uptake and intracellular routing in CD4 and CD8 T cell activation. Science 316, 612-616, doi:10.1126/science.1137971 (2007).
20 Platt, C. D. et al. Mature dendritic cells use endocytic receptors to capture and present antigens. Proc Natl Acad Sci U S A 107, 4287-4292, doi:10.1073/pnas.0910609107 (2010).
21 Sommer, S. The importance of immune gene variability (MHC) in evolutionary ecology and conservation. Front Zool 2, 16, doi:10.1186/1742-9994-2-16 (2005).
22 Bouvier, M. Accessory proteins and the assembly of human class I MHC molecules: a molecular and structural perspective. Mol Immunol 39, 697-706 (2003).
23 Fremont, D. H., Hendrickson, W. A., Marrack, P. & Kappler, J. Structures of an MHC class II molecule with covalently bound single peptides. Science 272, 1001-1004 (1996).
24 Schuette, V. & Burgdorf, S. The ins-and-outs of endosomal antigens for cross-presentation. Curr Opin Immunol 26, 63-68, doi:10.1016/j.coi.2013.11.001 (2014).
25 Blanchard, N. et al. Endoplasmic reticulum aminopeptidase associated with antigen processing defines the composition and structure of MHC class I peptide repertoire in normal and virus-infected cells. J Immunol 184, 3033-3042, doi:10.4049/jimmunol.0903712 (2010).
26 Lakadamyali, M., Rust, M. J. & Zhuang, X. Ligands for clathrin-mediated endocytosis are differentially sorted into distinct populations of early endosomes. Cell 124, 997-1009, doi:10.1016/j.cell.2005.12.038 (2006).
27 Roche, P. A. & Furuta, K. The ins and outs of MHC class II-mediated antigen processing and presentation. Nat Rev Immunol 15, 203-216, doi:10.1038/nri3818 (2015).
28 O'Brien, C., Flower, D. R. & Feighery, C. Peptide length significantly influences in vitro affinity for MHC class II molecules. Immunome Res 4, 6, doi:10.1186/1745-7580-4-6 (2008).
29 Klein, L., Munz, C. & Lunemann, J. D. Autophagy-mediated antigen processing in CD4(+) T cell tolerance and immunity. FEBS Lett 584, 1405-1410, doi:10.1016/j.febslet.2010.01.008 (2010).
30 Lim, J. P. & Gleeson, P. A. Macropinocytosis: an endocytic pathway for internalising large gulps. Immunol Cell Biol 89, 836-843, doi:10.1038/icb.2011.20 (2011).
31 Figdor, C. G., van Kooyk, Y. & Adema, G. J. C-type lectin receptors on dendritic cells and Langerhans cells. Nat Rev Immunol 2, 77-84, doi:10.1038/nri723 (2002).
32 van Vliet, S. J., Garcia-Vallejo, J. J. & van Kooyk, Y. Dendritic cells and C-type lectin receptors: coupling innate to adaptive immune responses. Immunol Cell Biol 86, 580-587, doi:10.1038/icb.2008.55 (2008).
33 Osorio, F. & Reis e Sousa, C. Myeloid C-type lectin receptors in pathogen recognition and host defense. Immunity 34, 651-664, doi:10.1016/j.immuni.2011.05.001 (2011).
34 East, L. & Isacke, C. M. The mannose receptor family. Biochim Biophys Acta 1572, 364-386 (2002).
35 McGreal, E. P., Martinez-Pomares, L. & Gordon, S. Divergent roles for C-type lectins expressed by cells of the innate immune system. Mol Immunol 41, 1109-1121, doi:10.1016/j.molimm.2004.06.013 (2004).
References
108
36 Frenz, T. et al. Antigen presenting cell-selective drug delivery by glycan-decorated nanocarriers. Eur J Pharm Biopharm 95, 13-17, doi:10.1016/j.ejpb.2015.02.008 (2015).
37 Chatterjee, B. et al. Internalization and endosomal degradation of receptor-bound antigens regulate the efficiency of cross presentation by human dendritic cells. Blood 120, 2011-2020, doi:10.1182/blood-2012-01-402370 (2012).
38 Burgdorf, S., Lukacs-Kornek, V. & Kurts, C. The mannose receptor mediates uptake of soluble but not of cell-associated antigen for cross-presentation. J Immunol 176, 6770-6776 (2006).
39 Mahnke, K. et al. The dendritic cell receptor for endocytosis, DEC-205, can recycle and enhance antigen presentation via major histocompatibility complex class II-positive lysosomal compartments. J Cell Biol 151, 673-684 (2000).
40 Bol, K. F., Schreibelt, G., Gerritsen, W. R., de Vries, I. J. & Figdor, C. G. Dendritic Cell-Based Immunotherapy: State of the Art and Beyond. Clin Cancer Res 22, 1897-1906, doi:10.1158/1078-0432.CCR-15-1399 (2016).
41 Kreutz, M., Tacken, P. J. & Figdor, C. G. Targeting dendritic cells--why bother? Blood 121, 2836-2844, doi:10.1182/blood-2012-09-452078 (2013).
42 Banchereau, J., Schuler-Thurner, B., Palucka, A. K. & Schuler, G. Dendritic cells as vectors for therapy. Cell 106, 271-274 (2001).
43 Figdor, C. G., de Vries, I. J., Lesterhuis, W. J. & Melief, C. J. Dendritic cell immunotherapy: mapping the way. Nat Med 10, 475-480, doi:10.1038/nm1039 (2004).
44 Kastenmuller, W., Kastenmuller, K., Kurts, C. & Seder, R. A. Dendritic cell-targeted vaccines--hope or hype? Nat Rev Immunol 14, 705-711, doi:10.1038/nri3727 (2014).
45 Kantoff, P. W. et al. Sipuleucel-T immunotherapy for castration-resistant prostate cancer. N Engl J Med 363, 411-422, doi:10.1056/NEJMoa1001294 (2010).
46 Makarov, D. V., Loeb, S., Getzenberg, R. H. & Partin, A. W. Biomarkers for prostate cancer. Annu Rev Med 60, 139-151, doi:10.1146/annurev.med.60.042307.110714 (2009).
47 Anassi, E. & Ndefo, U. A. Sipuleucel-T (provenge) injection: the first immunotherapy agent (vaccine) for hormone-refractory prostate cancer. P T 36, 197-202 (2011).
48 Hammerstrom, A. E., Cauley, D. H., Atkinson, B. J. & Sharma, P. Cancer immunotherapy: sipuleucel-T and beyond. Pharmacotherapy 31, 813-828, doi:10.1592/phco.31.8.813 (2011).
49 Bui, C. N. et al. Budget Impact of Enzalutamide for Chemotherapy-Naive Metastatic Castration-Resistant Prostate Cancer. J Manag Care Spec Pharm 22, 163-170, doi:10.18553/jmcp.2016.22.2.163 (2016).
50 Commission, E. Pharmaceuticals - Community register, <http://ec.europa.eu/health/documents/community-register/html/h867.htm> (2015).
51 Raich-Regue, D. et al. Differential effects of monophosphoryl lipid A and cytokine cocktail as maturation stimuli of immunogenic and tolerogenic dendritic cells for immunotherapy. Vaccine 30, 378-387, doi:10.1016/j.vaccine.2011.10.081 (2012).
52 Gilboa, E. DC-based cancer vaccines. J Clin Invest 117, 1195-1203, doi:10.1172/JCI31205 (2007).
53 Morelli, A. E. & Thomson, A. W. Tolerogenic dendritic cells and the quest for transplant tolerance. Nat Rev Immunol 7, 610-621, doi:10.1038/nri2132 (2007).
54 Amos, S. M. et al. Autoimmunity associated with immunotherapy of cancer. Blood 118, 499-509, doi:10.1182/blood-2011-01-325266 (2011).
References
109
55 Ludewig, B. et al. Immunotherapy with dendritic cells directed against tumor antigens shared with normal host cells results in severe autoimmune disease. J Exp Med 191, 795-804 (2000).
56 Roskrow, M. A. et al. Autoimmune disease induced by dendritic cell immunization against leukemia. Leuk Res 23, 549-557 (1999).
57 Leleux, J., Atalis, A. & Roy, K. Engineering immunity: Modulating dendritic cell subsets and lymph node response to direct immune-polarization and vaccine efficacy. J Control Release 219, 610-621, doi:10.1016/j.jconrel.2015.09.063 (2015).
58 Morse, M. A. et al. CDX-1307: a novel vaccine under study as treatment for muscle-invasive bladder cancer. Expert Rev Vaccines 10, 733-742, doi:10.1586/erv.11.20 (2011).
59 Dangles, V. et al. Tumor-associated antigen human chorionic gonadotropin beta contains numerous antigenic determinants recognized by in vitro-induced CD8+ and CD4+ T lymphocytes. Cancer Immunol Immunother 50, 673-681, doi:10.1007/s00262-001-0248-0 (2002).
60 Morse, M. A. et al. Phase I study utilizing a novel antigen-presenting cell-targeted vaccine with Toll-like receptor stimulation to induce immunity to self-antigens in cancer patients. Clin Cancer Res 17, 4844-4853, doi:10.1158/1078-0432.CCR-11-0891 (2011).
61 Riedmann, E. M. CDX-1401 combined with TLR agonist: positive phase 1 results. Hum Vaccin Immunother 8, 1742 (2012).
62 Dhodapkar, M. V. et al. Induction of antigen-specific immunity with a vaccine targeting NY-ESO-1 to the dendritic cell receptor DEC-205. Sci Transl Med 6, 232ra251, doi:10.1126/scitranslmed.3008068 (2014).
63 Cheong, C. et al. Improved cellular and humoral immune responses in vivo following targeting of HIV Gag to dendritic cells within human anti-human DEC205 monoclonal antibody. Blood 116, 3828-3838, doi:10.1182/blood-2010-06-288068 (2010).
64 Idoyaga, J. et al. Comparable T helper 1 (Th1) and CD8 T-cell immunity by targeting HIV gag p24 to CD8 dendritic cells within antibodies to Langerin, DEC205, and Clec9A. Proc Natl Acad Sci U S A 108, 2384-2389, doi:10.1073/pnas.1019547108 (2011).
65 Flynn, B. J. et al. Immunization with HIV Gag targeted to dendritic cells followed by recombinant New York vaccinia virus induces robust T-cell immunity in nonhuman primates. Proc Natl Acad Sci U S A 108, 7131-7136, doi:10.1073/pnas.1103869108 (2011).
66 Dong, H. et al. Induction of protective immunity against Mycobacterium tuberculosis by delivery of ESX antigens into airway dendritic cells. Mucosal Immunol 6, 522-534, doi:10.1038/mi.2012.92 (2013).
67 Tacken, P. J. et al. No advantage of cell-penetrating peptides over receptor-specific antibodies in targeting antigen to human dendritic cells for cross-presentation. J Immunol 180, 7687-7696 (2008).
68 Ramakrishna, V. et al. Mannose receptor targeting of tumor antigen pmel17 to human dendritic cells directs anti-melanoma T cell responses via multiple HLA molecules. J Immunol 172, 2845-2852 (2004).
69 Ni, L. et al. Concomitant activation and antigen uptake via human dectin-1 results in potent antigen-specific CD8+ T cell responses. J Immunol 185, 3504-3513, doi:10.4049/jimmunol.1000999 (2010).
References
110
70 Saluja, S. S. et al. Targeting human dendritic cells via DEC-205 using PLGA nanoparticles leads to enhanced cross-presentation of a melanoma-associated antigen. Int J Nanomedicine 9, 5231-5246, doi:10.2147/IJN.S66639 (2014).
71 Rauen, J. et al. Enhanced cross-presentation and improved CD8+ T cell responses after mannosylation of synthetic long peptides in mice. PLoS One 9, e103755, doi:10.1371/journal.pone.0103755 (2014).
72 Rosalia, R. A. et al. Dendritic cells process synthetic long peptides better than whole protein, improving antigen presentation and T-cell activation. Eur J Immunol 43, 2554-2565, doi:10.1002/eji.201343324 (2013).
73 Hartung, E. et al. Induction of potent CD8 T cell cytotoxicity by specific targeting of antigen to cross-presenting dendritic cells in vivo via murine or human XCR1. J Immunol 194, 1069-1079, doi:10.4049/jimmunol.1401903 (2015).
74 Vingert, B. et al. The Shiga toxin B-subunit targets antigen in vivo to dendritic cells and elicits anti-tumor immunity. Eur J Immunol 36, 1124-1135, doi:10.1002/eji.200535443 (2006).
75 Thomann, J. S. et al. Antitumor activity of liposomal ErbB2/HER2 epitope peptide-based vaccine constructs incorporating TLR agonists and mannose receptor targeting. Biomaterials 32, 4574-4583, doi:10.1016/j.biomaterials.2011.03.015 (2011).
76 Gangadhar, T. C. & Vonderheide, R. H. Mitigating the toxic effects of anticancer immunotherapy. Nat Rev Clin Oncol 11, 91-99, doi:10.1038/nrclinonc.2013.245 (2014).
77 Gilboa, E., McNamara, J., 2nd & Pastor, F. Use of oligonucleotide aptamer ligands to modulate the function of immune receptors. Clin Cancer Res 19, 1054-1062, doi:10.1158/1078-0432.CCR-12-2067 (2013).
78 Nimjee, S. M., Rusconi, C. P. & Sullenger, B. A. Aptamers: an emerging class of therapeutics. Annu Rev Med 56, 555-583, doi:10.1146/annurev.med.56.062904.144915 (2005).
79 Lehmann, C. H. et al. Direct Delivery of Antigens to Dendritic Cells via Antibodies Specific for Endocytic Receptors as a Promising Strategy for Future Therapies. Vaccines (Basel) 4, doi:10.3390/vaccines4020008 (2016).
80 Mayer, G. The chemical biology of aptamers. Angew Chem Int Ed Engl 48, 2672-2689, doi:10.1002/anie.200804643 (2009).
81 Hermann, T. & Patel, D. J. Adaptive recognition by nucleic acid aptamers. Science 287, 820-825 (2000).
82 Stoltenburg, R., Reinemann, C. & Strehlitz, B. SELEX--a (r)evolutionary method to generate high-affinity nucleic acid ligands. Biomol Eng 24, 381-403, doi:10.1016/j.bioeng.2007.06.001 (2007).
83 Tuerk, C. & Gold, L. Systematic evolution of ligands by exponential enrichment: RNA ligands to bacteriophage T4 DNA polymerase. Science 249, 505-510 (1990).
84 Ellington, A. D. & Szostak, J. W. In vitro selection of RNA molecules that bind specific ligands. Nature 346, 818-822, doi:10.1038/346818a0 (1990).
85 Hamedani, N. S. et al. Capture and Release (CaR): a simplified procedure for one-tube isolation and concentration of single-stranded DNA during SELEX. Chem Commun (Camb) 51, 1135-1138, doi:10.1039/c4cc08233h (2015).
86 Rhie, A. et al. Characterization of 2'-fluoro-RNA aptamers that bind preferentially to disease-associated conformations of prion protein and inhibit conversion. J Biol Chem 278, 39697-39705, doi:10.1074/jbc.M305297200 (2003).
87 Hamedani, N. S. & Muller, J. Capillary Electrophoresis for the Selection of DNA Aptamers Recognizing Activated Protein C. Methods Mol Biol 1380, 61-75, doi:10.1007/978-1-4939-3197-2_5 (2016).
References
111
88 Raddatz, M. S. et al. Enrichment of cell-targeting and population-specific aptamers by fluorescence-activated cell sorting. Angew Chem Int Ed Engl 47, 5190-5193, doi:10.1002/anie.200800216 (2008).
89 Stoltenburg, R., Reinemann, C. & Strehlitz, B. FluMag-SELEX as an advantageous method for DNA aptamer selection. Anal Bioanal Chem 383, 83-91, doi:10.1007/s00216-005-3388-9 (2005).
90 Bridonneau, P., Chang, Y. F., Buvoli, A. V., O'Connell, D. & Parma, D. Site-directed selection of oligonucleotide antagonists by competitive elution. Antisense Nucleic Acid Drug Dev 9, 1-11 (1999).
91 Mayer, G. et al. Controlling small guanine-nucleotide-exchange factor function through cytoplasmic RNA intramers. Proc Natl Acad Sci U S A 98, 4961-4965, doi:10.1073/pnas.091100698 (2001).
92 Avci-Adali, M., Paul, A., Wilhelm, N., Ziemer, G. & Wendel, H. P. Upgrading SELEX technology by using lambda exonuclease digestion for single-stranded DNA generation. Molecules 15, 1-11, doi:10.3390/molecules15010001 (2010).
93 Schutze, T. et al. Probing the SELEX process with next-generation sequencing. PLoS One 6, e29604, doi:10.1371/journal.pone.0029604 (2011).
94 Muller, J. et al. An exosite-specific ssDNA aptamer inhibits the anticoagulant functions of activated protein C and enhances inhibition by protein C inhibitor. Chem Biol 16, 442-451, doi:10.1016/j.chembiol.2009.03.007 (2009).
95 Huizenga, D. E. & Szostak, J. W. A DNA aptamer that binds adenosine and ATP. Biochemistry 34, 656-665 (1995).
96 Mayer, G., Pofahl, M., Schöler, K. M. U., Haßel, S. Cell-Specific Aptamers for Nano-medical Applications. Vol. 29 261-283 (Springer Berlin Heidelberg, 2013).
97 Mann, D., Reinemann, C., Stoltenburg, R. & Strehlitz, B. In vitro selection of DNA aptamers binding ethanolamine. Biochem Biophys Res Commun 338, 1928-1934, doi:10.1016/j.bbrc.2005.10.172 (2005).
98 Bock, L. C., Griffin, L. C., Latham, J. A., Vermaas, E. H. & Toole, J. J. Selection of single-stranded DNA molecules that bind and inhibit human thrombin. Nature 355, 564-566, doi:10.1038/355564a0 (1992).
99 Opazo, F. et al. Modular Assembly of Cell-targeting Devices Based on an Uncommon G-quadruplex Aptamer. Mol Ther Nucleic Acids 4, e251, doi:10.1038/mtna.2015.25 (2015).
100 Shamah, S. M., Healy, J. M. & Cload, S. T. Complex target SELEX. Acc Chem Res 41, 130-138, doi:10.1021/ar700142z (2008).
101 Ku, T. H. et al. Nucleic Acid Aptamers: An Emerging Tool for Biotechnology and Biomedical Sensing. Sensors (Basel) 15, 16281-16313, doi:10.3390/s150716281 (2015).
102 Vance, S. A. & Sandros, M. G. Zeptomole detection of C-reactive protein in serum by a nanoparticle amplified surface plasmon resonance imaging aptasensor. Sci Rep 4, 5129, doi:10.1038/srep05129 (2014).
103 Bruno, J. G. et al. Development of a fluorescent enzyme-linked DNA aptamer-magnetic bead sandwich assay and portable fluorometer for sensitive and rapid leishmania detection in sandflies. J Fluoresc 24, 267-277, doi:10.1007/s10895-013-1315-6 (2014).
104 Sun, H. et al. Oligonucleotide aptamers: new tools for targeted cancer therapy. Mol Ther Nucleic Acids 3, e182, doi:10.1038/mtna.2014.32 (2014).
References
112
105 Sundaram, P., Kurniawan, H., Byrne, M. E. & Wower, J. Therapeutic RNA aptamers in clinical trials. Eur J Pharm Sci 48, 259-271, doi:10.1016/j.ejps.2012.10.014 (2013).
106 Trujillo, C. A., Nery, A. A., Alves, J. M., Martins, A. H. & Ulrich, H. Development of the anti-VEGF aptamer to a therapeutic agent for clinical ophthalmology. Clin Ophthalmol 1, 393-402 (2007).
107 Meyer, C., Hahn, U. & Rentmeister, A. Cell-specific aptamers as emerging therapeutics. J Nucleic Acids 2011, 904750, doi:10.4061/2011/904750 (2011).
108 Mi, J. et al. In vivo selection of tumor-targeting RNA motifs. Nat Chem Biol 6, 22-24, doi:10.1038/nchembio.277 (2010).
109 Cheng, C., Chen, Y. H., Lennox, K. A., Behlke, M. A. & Davidson, B. L. In vivo SELEX for Identification of Brain-penetrating Aptamers. Mol Ther Nucleic Acids 2, e67, doi:10.1038/mtna.2012.59 (2013).
110 Sefah, K. et al. In vitro selection with artificial expanded genetic information systems. Proc Natl Acad Sci U S A 111, 1449-1454, doi:10.1073/pnas.1311778111 (2014).
111 Tolle, F., Brandle, G. M., Matzner, D. & Mayer, G. A Versatile Approach Towards Nucleobase-Modified Aptamers. Angew Chem Int Ed Engl 54, 10971-10974, doi:10.1002/anie.201503652 (2015).
112 Chu, T. C. et al. Aptamer:toxin conjugates that specifically target prostate tumor cells. Cancer Res 66, 5989-5992, doi:10.1158/0008-5472.CAN-05-4583 (2006).
113 Xiao, Z., Shangguan, D., Cao, Z., Fang, X. & Tan, W. Cell-specific internalization study of an aptamer from whole cell selection. Chemistry 14, 1769-1775, doi:10.1002/chem.200701330 (2008).
114 Yan, A. C. & Levy, M. Aptamers and aptamer targeted delivery. RNA Biol 6, 316-320 (2009).
115 Wengerter, B. C. et al. Aptamer-targeted antigen delivery. Mol Ther 22, 1375-1387, doi:10.1038/mt.2014.51 (2014).
116 Farokhzad, O. C. et al. Nanoparticle-aptamer bioconjugates: a new approach for targeting prostate cancer cells. Cancer Res 64, 7668-7672, doi:10.1158/0008-5472.CAN-04-2550 (2004).
117 McNamara, J. O., 2nd et al. Cell type-specific delivery of siRNAs with aptamer-siRNA chimeras. Nat Biotechnol 24, 1005-1015, doi:10.1038/nbt1223 (2006).
118 Kim, E. et al. Prostate cancer cell death produced by the co-delivery of Bcl-xL shRNA and doxorubicin using an aptamer-conjugated polyplex. Biomaterials 31, 4592-4599, doi:10.1016/j.biomaterials.2010.02.030 (2010).
119 Drolet, D. W. et al. Pharmacokinetics and safety of an anti-vascular endothelial growth factor aptamer (NX1838) following injection into the vitreous humor of rhesus monkeys. Pharm Res 17, 1503-1510 (2000).
120 Da Pieve, C., Blackshaw, E., Missailidis, S. & Perkins, A. C. PEGylation and biodistribution of an anti-MUC1 aptamer in MCF-7 tumor-bearing mice. Bioconjug Chem 23, 1377-1381, doi:10.1021/bc300128r (2012).
121 Parry, R. V. et al. CTLA-4 and PD-1 receptors inhibit T-cell activation by distinct mechanisms. Mol Cell Biol 25, 9543-9553, doi:10.1128/MCB.25.21.9543-9553.2005 (2005).
122 Santulli-Marotto, S., Nair, S. K., Rusconi, C., Sullenger, B. & Gilboa, E. Multivalent RNA aptamers that inhibit CTLA-4 and enhance tumor immunity. Cancer Res 63, 7483-7489 (2003).
References
113
123 Prodeus, A. et al. Targeting the PD-1/PD-L1 Immune Evasion Axis With DNA Aptamers as a Novel Therapeutic Strategy for the Treatment of Disseminated Cancers. Mol Ther Nucleic Acids 4, e237, doi:10.1038/mtna.2015.11 (2015).
124 McNamara, J. O. et al. Multivalent 4-1BB binding aptamers costimulate CD8+ T cells and inhibit tumor growth in mice. J Clin Invest 118, 376-386, doi:10.1172/JCI33365 (2008).
125 Pastor, F., Kolonias, D., McNamara, J. O., 2nd & Gilboa, E. Targeting 4-1BB costimulation to disseminated tumor lesions with bi-specific oligonucleotide aptamers. Mol Ther 19, 1878-1886, doi:10.1038/mt.2011.145 (2011).
126 Berezovski, M. V., Lechmann, M., Musheev, M. U., Mak, T. W. & Krylov, S. N. Aptamer-facilitated biomarker discovery (AptaBiD). J Am Chem Soc 130, 9137-9143, doi:10.1021/ja801951p (2008).
127 Hui, Y., Shan, L., Lin-Fu, Z. & Jian-Hua, Z. Selection of DNA aptamers against DC-SIGN protein. Mol Cell Biochem 306, 71-77, doi:10.1007/s11010-007-9555-x (2007).
128 Rotzschke, O. et al. Exact prediction of a natural T cell epitope. Eur J Immunol 21, 2891-2894, doi:10.1002/eji.1830211136 (1991).
129 McFarland, B. J., Sant, A. J., Lybrand, T. P. & Beeson, C. Ovalbumin(323-339) peptide binds to the major histocompatibility complex class II I-A(d) protein using two functionally distinct registers. Biochemistry 38, 16663-16670 (1999).
130 Linehan, S. A., Martinez-Pomares, L., da Silva, R. P. & Gordon, S. Endogenous ligands of carbohydrate recognition domains of the mannose receptor in murine macrophages, endothelial cells and secretory cells; potential relevance to inflammation and immunity. Eur J Immunol 31, 1857-1866, doi:10.1002/1521-4141(200106)31:6<1857::AID-IMMU1857>3.0.CO;2-D (2001).
131 Martinez-Pomares, L. et al. Carbohydrate-independent recognition of collagens by the macrophage mannose receptor. Eur J Immunol 36, 1074-1082, doi:10.1002/eji.200535685 (2006).
132 Lutz, M. B., Inaba, K., Schuler, G. & Romani, N. Still Alive and Kicking: In-Vitro-Generated GM-CSF Dendritic Cells! Immunity 44, 1-2, doi:10.1016/j.immuni.2015.12.013 (2016).
133 Lutz, M. B. et al. An advanced culture method for generating large quantities of highly pure dendritic cells from mouse bone marrow. J Immunol Methods 223, 77-92 (1999).
134 Bonifaz, L. et al. Efficient targeting of protein antigen to the dendritic cell receptor DEC-205 in the steady state leads to antigen presentation on major histocompatibility complex class I products and peripheral CD8+ T cell tolerance. J Exp Med 196, 1627-1638 (2002).
135 Heckel, A. & Mayer, G. Light regulation of aptamer activity: an anti-thrombin aptamer with caged thymidine nucleobases. J Am Chem Soc 127, 822-823, doi:10.1021/ja043285e (2005).
136 Lennarz, S., Heider, E., Blind, M. & Mayer, G. An aptamer to the MAP kinase insert region. ACS Chem Biol 10, 320-327, doi:10.1021/cb5005756 (2015).
137 Weis, W. I., Taylor, M. E. & Drickamer, K. The C-type lectin superfamily in the immune system. Immunol Rev 163, 19-34 (1998).
138 Martinez-Pomares, L. The mannose receptor. J Leukoc Biol 92, 1177-1186, doi:10.1189/jlb.0512231 (2012).
139 Feinberg, H. et al. Structure of a C-type carbohydrate recognition domain from the macrophage mannose receptor. J Biol Chem 275, 21539-21548, doi:10.1074/jbc.M002366200 (2000).
References
114
140 Harris, N., Super, M., Rits, M., Chang, G. & Ezekowitz, R. A. Characterization of the murine macrophage mannose receptor: demonstration that the downregulation of receptor expression mediated by interferon-gamma occurs at the level of transcription. Blood 80, 2363-2373 (1992).
141 Patra, A. et al. 2'-Fluoro RNA shows increased Watson-Crick H-bonding strength and stacking relative to RNA: evidence from NMR and thermodynamic data. Angew Chem Int Ed Engl 51, 11863-11866, doi:10.1002/anie.201204946 (2012).
142 Manoharan, M. et al. Unique gene-silencing and structural properties of 2'-fluoro-modified siRNAs. Angew Chem Int Ed Engl 50, 2284-2288, doi:10.1002/anie.201006519 (2011).
143 Su, Z. et al. Next-generation sequencing and its applications in molecular diagnostics. Expert Rev Mol Diagn 11, 333-343, doi:10.1586/erm.11.3 (2011).
144 Blank, M. Next-Generation Analysis of Deep Sequencing Data: Bringing Light into the Black Box of SELEX Experiments. Methods Mol Biol 1380, 85-95, doi:10.1007/978-1-4939-3197-2_7 (2016).
145 Zinchuk, V., Wu, Y. & Grossenbacher-Zinchuk, O. Bridging the gap between qualitative and quantitative colocalization results in fluorescence microscopy studies. Sci Rep 3, 1365, doi:10.1038/srep01365 (2013).
146 O'Neill, L. A., Golenbock, D. & Bowie, A. G. The history of Toll-like receptors - redefining innate immunity. Nat Rev Immunol 13, 453-460, doi:10.1038/nri3446 (2013).
147 Paludan, S. R. & Bowie, A. G. Immune sensing of DNA. Immunity 38, 870-880, doi:10.1016/j.immuni.2013.05.004 (2013).
148 Ballas, Z. K. et al. Divergent therapeutic and immunologic effects of oligodeoxynucleotides with distinct CpG motifs. J Immunol 167, 4878-4886 (2001).
149 Bauer, S., Pigisch, S., Hangel, D., Kaufmann, A. & Hamm, S. Recognition of nucleic acid and nucleic acid analogs by Toll-like receptors 7, 8 and 9. Immunobiology 213, 315-328, doi:10.1016/j.imbio.2007.10.010 (2008).
150 Barnden, M. J., Allison, J., Heath, W. R. & Carbone, F. R. Defective TCR expression in transgenic mice constructed using cDNA-based alpha- and beta-chain genes under the control of heterologous regulatory elements. Immunol Cell Biol 76, 34-40, doi:10.1046/j.1440-1711.1998.00709.x (1998).
151 Quah, B. J., Warren, H. S. & Parish, C. R. Monitoring lymphocyte proliferation in vitro and in vivo with the intracellular fluorescent dye carboxyfluorescein diacetate succinimidyl ester. Nat Protoc 2, 2049-2056, doi:10.1038/nprot.2007.296 (2007).
152 Appay, V. The physiological role of cytotoxic CD4(+) T-cells: the holy grail? Clin Exp Immunol 138, 10-13, doi:10.1111/j.1365-2249.2004.02605.x (2004).
153 Haabeth, O. A. et al. How Do CD4(+) T Cells Detect and Eliminate Tumor Cells That Either Lack or Express MHC Class II Molecules? Front Immunol 5, 174, doi:10.3389/fimmu.2014.00174 (2014).
154 Penaloza-MacMaster, P. et al. Vaccine-elicited CD4 T cells induce immunopathology after chronic LCMV infection. Science 347, 278-282, doi:10.1126/science.aaa2148 (2015).
155 Hogquist, K. A. et al. T cell receptor antagonist peptides induce positive selection. Cell 76, 17-27 (1994).
156 Wang, J., Rudzinski, J. F., Gong, Q., Soh, H. T. & Atzberger, P. J. Influence of target concentration and background binding on in vitro selection of affinity reagents. PLoS One 7, e43940, doi:10.1371/journal.pone.0043940 (2012).
157 Gold, L. et al. Aptamer-based multiplexed proteomic technology for biomarker discovery. PLoS One 5, e15004, doi:10.1371/journal.pone.0015004 (2010).
References
115
158 Lupold, S. E., Hicke, B. J., Lin, Y. & Coffey, D. S. Identification and characterization of nuclease-stabilized RNA molecules that bind human prostate cancer cells via the prostate-specific membrane antigen. Cancer Res 62, 4029-4033 (2002).
159 Hicke, B. J. et al. Tenascin-C aptamers are generated using tumor cells and purified protein. J Biol Chem 276, 48644-48654, doi:10.1074/jbc.M104651200 (2001).
160 Dassie, J. P. et al. Systemic administration of optimized aptamer-siRNA chimeras promotes regression of PSMA-expressing tumors. Nat Biotechnol 27, 839-849, doi:10.1038/nbt.1560 (2009).
161 Morris, K. N., Jensen, K. B., Julin, C. M., Weil, M. & Gold, L. High affinity ligands from in vitro selection: complex targets. Proc Natl Acad Sci U S A 95, 2902-2907 (1998).
162 Zhang, Y., Chen, Y., Han, D., Ocsoy, I. & Tan, W. Aptamers selected by cell-SELEX for application in cancer studies. Bioanalysis 2, 907-918, doi:10.4155/bio.10.46 (2010).
163 Ohuchi, S. Cell-SELEX Technology. Biores Open Access 1, 265-272, doi:10.1089/biores.2012.0253 (2012).
164 Tang, Z. et al. Selection of aptamers for molecular recognition and characterization of cancer cells. Anal Chem 79, 4900-4907, doi:10.1021/ac070189y (2007).
165 Mallikaratchy, P. R. et al. A multivalent DNA aptamer specific for the B-cell receptor on human lymphoma and leukemia. Nucleic Acids Res 39, 2458-2469, doi:10.1093/nar/gkq996 (2011).
166 Guo, K. T., Schafer, R., Paul, A., Ziemer, G. & Wendel, H. P. Aptamer-based strategies for stem cell research. Mini Rev Med Chem 7, 701-705 (2007).
167 Mitchell, D. A. et al. Severe adverse immunologic reaction in a patient with glioblastoma receiving autologous dendritic cell vaccines combined with GM-CSF and dose-intensified temozolomide. Cancer Immunol Res 3, 320-325, doi:10.1158/2326-6066.CIR-14-0100 (2015).
168 Avci-Adali, M., Steinle, H., Michel, T., Schlensak, C. & Wendel, H. P. Potential capacity of aptamers to trigger immune activation in human blood. PLoS One 8, e68810, doi:10.1371/journal.pone.0068810 (2013).
169 Bode, C., Zhao, G., Steinhagen, F., Kinjo, T. & Klinman, D. M. CpG DNA as a vaccine adjuvant. Expert Rev Vaccines 10, 499-511, doi:10.1586/erv.10.174 (2011).
170 Labeur, M. S. et al. Generation of tumor immunity by bone marrow-derived dendritic cells correlates with dendritic cell maturation stage. J Immunol 162, 168-175 (1999).
171 Walseng, E., Bakke, O. & Roche, P. A. Major histocompatibility complex class II-peptide complexes internalize using a clathrin- and dynamin-independent endocytosis pathway. J Biol Chem 283, 14717-14727, doi:10.1074/jbc.M801070200 (2008).
172 Tewari, M. K., Sinnathamby, G., Rajagopal, D. & Eisenlohr, L. C. A cytosolic pathway for MHC class II-restricted antigen processing that is proteasome and TAP dependent. Nat Immunol 6, 287-294, doi:10.1038/ni1171 (2005).
173 Gagnon, E. et al. Endoplasmic reticulum-mediated phagocytosis is a mechanism of entry into macrophages. Cell 110, 119-131 (2002).
174 Vieira, O. V. et al. Modulation of Rab5 and Rab7 recruitment to phagosomes by phosphatidylinositol 3-kinase. Mol Cell Biol 23, 2501-2514 (2003).
References
116
175 Marshall, N. B. & Swain, S. L. Cytotoxic CD4 T cells in antiviral immunity. J Biomed Biotechnol 2011, 954602, doi:10.1155/2011/954602 (2011).
176 Hahn, S. et al. Down-modulation of CD4+ T helper type 2 and type 0 cells by T helper type 1 cells via Fas/Fas-ligand interaction. Eur J Immunol 25, 2679-2685, doi:10.1002/eji.1830250942 (1995).
177 Bercovici, N., Duffour, M. T., Agrawal, S., Salcedo, M. & Abastado, J. P. New methods for assessing T-cell responses. Clin Diagn Lab Immunol 7, 859-864 (2000).
178 Ohlfest, J. R. et al. Vaccine injection site matters: qualitative and quantitative defects in CD8 T cells primed as a function of proximity to the tumor in a murine glioma model. J Immunol 190, 613-620, doi:10.4049/jimmunol.1201557 (2013).
179 Bouchard, P. R., Hutabarat, R. M. & Thompson, K. M. Discovery and development of therapeutic aptamers. Annu Rev Pharmacol Toxicol 50, 237-257, doi:10.1146/annurev.pharmtox.010909.105547 (2010).
180 Romani, N. et al. Targeting skin dendritic cells to improve intradermal vaccination. Curr Top Microbiol Immunol 351, 113-138, doi:10.1007/82_2010_118 (2012).
181 Bonifaz, L. C. et al. In vivo targeting of antigens to maturing dendritic cells via the DEC-205 receptor improves T cell vaccination. J Exp Med 199, 815-824, doi:10.1084/jem.20032220 (2004).
182 Agrawal, S. et al. Cutting edge: different Toll-like receptor agonists instruct dendritic cells to induce distinct Th responses via differential modulation of extracellular signal-regulated kinase-mitogen-activated protein kinase and c-Fos. J Immunol 171, 4984-4989 (2003).
183 Seliger, B. & Massa, C. The dark side of dendritic cells: development and exploitation of tolerogenic activity that favor tumor outgrowth and immune escape. Front Immunol 4, 419, doi:10.3389/fimmu.2013.00419 (2013).
184 Xue, J. et al. Transcriptome-based network analysis reveals a spectrum model of human macrophage activation. Immunity 40, 274-288, doi:10.1016/j.immuni.2014.01.006 (2014).
185 Min, S. et al. Multiple tumor-associated microRNAs modulate the survival and longevity of dendritic cells by targeting YWHAZ and Bcl2 signaling pathways. J Immunol 190, 2437-2446, doi:10.4049/jimmunol.1202282 (2013).
186 Wherry, E. J. T cell exhaustion. Nat Immunol 12, 492-499 (2011).
187 Leggatt, G. R. Peptide Dose and/or Structure in Vaccines as a Determinant of T Cell Responses. Vaccines (Basel) 2, 537-548, doi:10.3390/vaccines2030537 (2014).
188 Blankenstein, T., Coulie, P. G., Gilboa, E. & Jaffee, E. M. The determinants of tumour immunogenicity. Nat Rev Cancer 12, 307-313, doi:10.1038/nrc3246 (2012).
189 Liu, C. C., Yang, H., Zhang, R., Zhao, J. J. & Hao, D. J. Tumour-associated antigens and their anti-cancer applications. Eur J Cancer Care (Engl), doi:10.1111/ecc.12446 (2016).
190 Roep, B. O. & Peakman, M. Antigen targets of type 1 diabetes autoimmunity. Cold Spring Harb Perspect Med 2, a007781, doi:10.1101/cshperspect.a007781 (2012).
191 Tsuji, T. et al. Antibody-targeted NY-ESO-1 to mannose receptor or DEC-205 in vitro elicits dual human CD8+ and CD4+ T cell responses with broad antigen specificity. J Immunol 186, 1218-1227, doi:10.4049/jimmunol.1000808 (2011).
192 Lee, S. J. et al. Mannose receptor-mediated regulation of serum glycoprotein homeostasis. Science 295, 1898-1901, doi:10.1126/science.1069540 (2002).
193 Schagger, H. Tricine-SDS-PAGE. Nat Protoc 1, 16-22, doi:10.1038/nprot.2006.4 (2006).

References
117
194 Nino-Castro, A. et al. The IDO1-induced kynurenines play a major role in the antimicrobial effect of human myeloid cells against Listeria monocytogenes. Innate Immun 20, 401-411, doi:10.1177/1753425913496442 (2014).
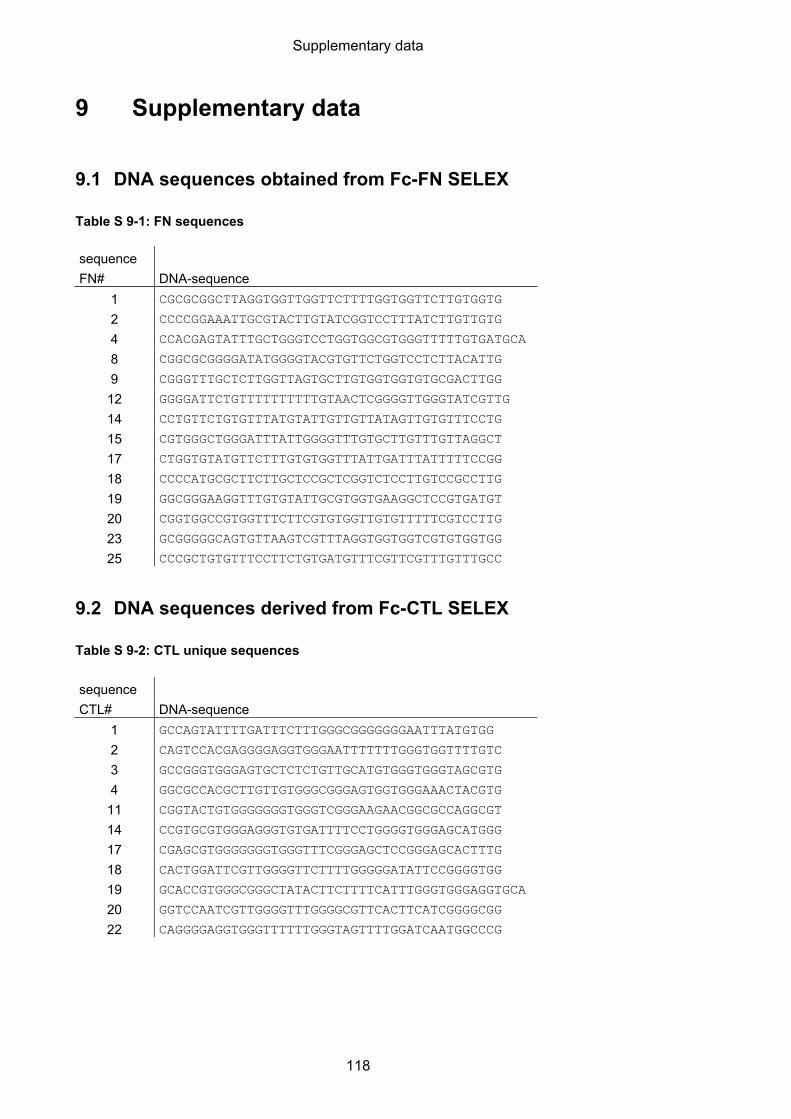
Supplementary data
118
9 Supplementary data
9.1 DNA sequences obtained from Fc-FN SELEX
Table S 9-1: FN sequences
sequence
FN# DNA-sequence
1 CGCGCGGCTTAGGTGGTTGGTTCTTTTGGTGGTTCTTGTGGTG
2 CCCCGGAAATTGCGTACTTGTATCGGTCCTTTATCTTGTTGTG
4 CCACGAGTATTTGCTGGGTCCTGGTGGCGTGGGTTTTTGTGATGCA
8 CGGCGCGGGGATATGGGGTACGTGTTCTGGTCCTCTTACATTG
9 CGGGTTTGCTCTTGGTTAGTGCTTGTGGTGGTGTGCGACTTGG
12 GGGGATTCTGTTTTTTTTTTGTAACTCGGGGTTGGGTATCGTTG
14 CCTGTTCTGTGTTTATGTATTGTTGTTATAGTTGTGTTTCCTG
15 CGTGGGCTGGGATTTATTGGGGTTTGTGCTTGTTTGTTAGGCT
17 CTGGTGTATGTTCTTTGTGTGGTTTATTGATTTATTTTTCCGG
18 CCCCATGCGCTTCTTGCTCCGCTCGGTCTCCTTGTCCGCCTTG
19 GGCGGGAAGGTTTGTGTATTGCGTGGTGAAGGCTCCGTGATGT
20 CGGTGGCCGTGGTTTCTTCGTGTGGTTGTGTTTTTCGTCCTTG
23 GCGGGGGCAGTGTTAAGTCGTTTAGGTGGTGGTCGTGTGGTGG
25 CCCGCTGTGTTTCCTTCTGTGATGTTTCGTTCGTTTGTTTGCC
9.2 DNA sequences derived from Fc-CTL SELEX
Table S 9-2: CTL unique sequences
sequence
CTL# DNA-sequence
1 GCCAGTATTTTGATTTCTTTGGGCGGGGGGGAATTTATGTGG
2 CAGTCCACGAGGGGAGGTGGGAATTTTTTTGGGTGGTTTTGTC
3 GCCGGGTGGGAGTGCTCTCTGTTGCATGTGGGTGGGTAGCGTG
4 GGCGCCACGCTTGTTGTGGGCGGGAGTGGTGGGAAACTACGTG
11 CGGTACTGTGGGGGGGTGGGTCGGGAAGAACGGCGCCAGGCGT
14 CCGTGCGTGGGAGGGTGTGATTTTCCTGGGGTGGGAGCATGGG
17 CGAGCGTGGGGGGGTGGGTTTCGGGAGCTCCGGGAGCACTTTG
18 CACTGGATTCGTTGGGGTTCTTTTGGGGGATATTCCGGGGTGG
19 GCACCGTGGGCGGGCTATACTTCTTTTCATTTGGGTGGGAGGTGCA
20 GGTCCAATCGTTGGGGTTTGGGGCGTTCACTTCATCGGGGCGG
22 CAGGGGAGGTGGGTTTTTTGGGTAGTTTTGGATCAATGGCCCG
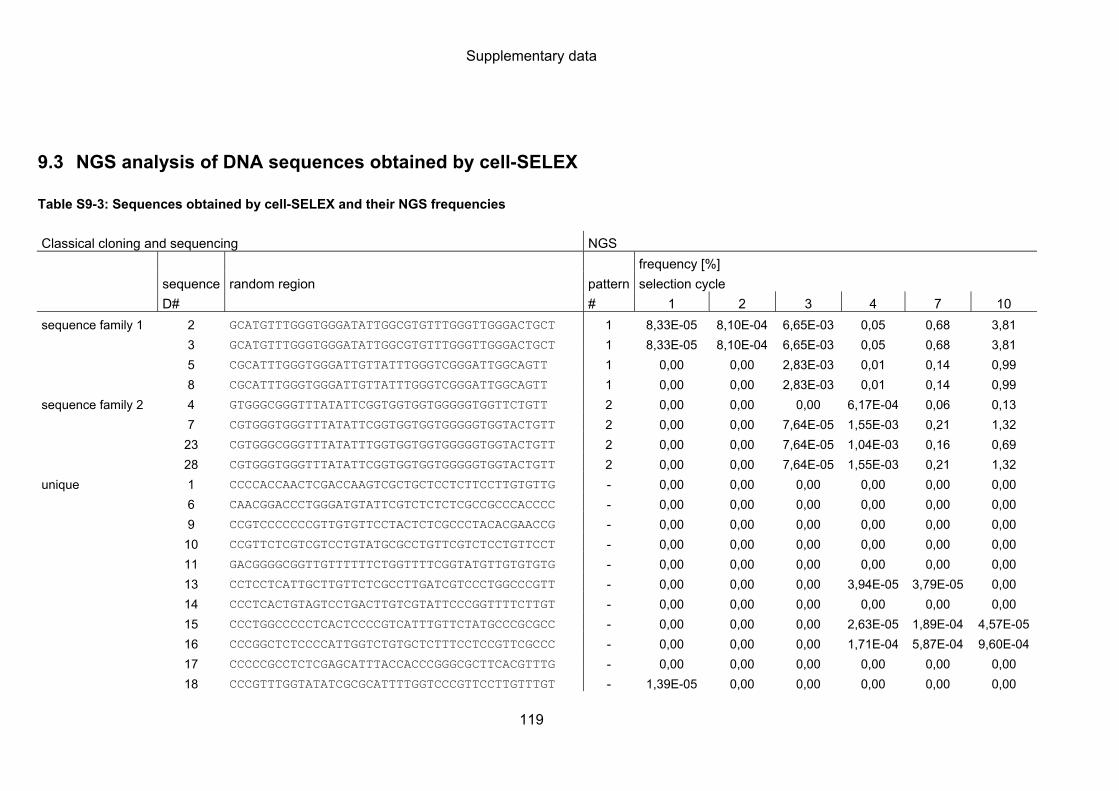
Supplementary data
119
9.3 NGS analysis of DNA sequences obtained by cell-SELEX
Table S9-3: Sequences obtained by cell-SELEX and their NGS frequencies
Classical cloning and sequencing NGS
frequency [%]
sequence random region pattern selection cycle
D# # 1 2 3 4 7 10
sequence family 1 2 GCATGTTTGGGTGGGATATTGGCGTGTTTGGGTTGGGACTGCT 1 8,33E-05 8,10E-04 6,65E-03 0,05 0,68 3,81
3 GCATGTTTGGGTGGGATATTGGCGTGTTTGGGTTGGGACTGCT 1 8,33E-05 8,10E-04 6,65E-03 0,05 0,68 3,81
5 CGCATTTGGGTGGGATTGTTATTTGGGTCGGGATTGGCAGTT 1 0,00 0,00 2,83E-03 0,01 0,14 0,99
8 CGCATTTGGGTGGGATTGTTATTTGGGTCGGGATTGGCAGTT 1 0,00 0,00 2,83E-03 0,01 0,14 0,99
sequence family 2 4 GTGGGCGGGTTTATATTCGGTGGTGGTGGGGGTGGTTCTGTT 2 0,00 0,00 0,00 6,17E-04 0,06 0,13
7 CGTGGGTGGGTTTATATTCGGTGGTGGTGGGGGTGGTACTGTT 2 0,00 0,00 7,64E-05 1,55E-03 0,21 1,32
23 CGTGGGCGGGTTTATATTTGGTGGTGGTGGGGGTGGTACTGTT 2 0,00 0,00 7,64E-05 1,04E-03 0,16 0,69
28 CGTGGGTGGGTTTATATTCGGTGGTGGTGGGGGTGGTACTGTT 2 0,00 0,00 7,64E-05 1,55E-03 0,21 1,32
unique 1 CCCCACCAACTCGACCAAGTCGCTGCTCCTCTTCCTTGTGTTG - 0,00 0,00 0,00 0,00 0,00 0,00
6 CAACGGACCCTGGGATGTATTCGTCTCTCTCGCCGCCCACCCC - 0,00 0,00 0,00 0,00 0,00 0,00
9 CCGTCCCCCCCGTTGTGTTCCTACTCTCGCCCTACACGAACCG - 0,00 0,00 0,00 0,00 0,00 0,00
10 CCGTTCTCGTCGTCCTGTATGCGCCTGTTCGTCTCCTGTTCCT - 0,00 0,00 0,00 0,00 0,00 0,00
11 GACGGGGCGGTTGTTTTTTCTGGTTTTCGGTATGTTGTGTGTG - 0,00 0,00 0,00 0,00 0,00 0,00
13 CCTCCTCATTGCTTGTTCTCGCCTTGATCGTCCCTGGCCCGTT - 0,00 0,00 0,00 3,94E-05 3,79E-05 0,00
14 CCCTCACTGTAGTCCTGACTTGTCGTATTCCCGGTTTTCTTGT - 0,00 0,00 0,00 0,00 0,00 0,00
15 CCCTGGCCCCCTCACTCCCCGTCATTTGTTCTATGCCCGCGCC - 0,00 0,00 0,00 2,63E-05 1,89E-04 4,57E-05
16 CCCGGCTCTCCCCATTGGTCTGTGCTCTTTCCTCCGTTCGCCC - 0,00 0,00 0,00 1,71E-04 5,87E-04 9,60E-04
17 CCCCCGCCTCTCGAGCATTTACCACCCGGGCGCTTCACGTTTG - 0,00 0,00 0,00 0,00 0,00 0,00
18 CCCGTTTGGTATATCGCGCATTTTGGTCCCGTTCCTTGTTTGT - 1,39E-05 0,00 0,00 0,00 0,00 0,00

Supplementary data
120
19 CAGGGGAGGTGGGTTTCTTTGGGTTGTTTGTGAAGTGGGGTGT 57 2,78E-05 8,10E-04 2,06E-03 7,31E-03 0,05 0,07
20 CCCGACCCCATCCGGTATTTTGTGTAATCTAGTCTCTTTGTGT 554 0,00 0,00 0,00 1,18E-04 4,16E-04 4,16E-03
21 CCCGACCGACGCTGTATTTTCGCCACCACGCTCGACCACCCCT 171 0,00 0,00 0,00 1,31E-05 5,68E-05 0,00
22 CCCGACCCGCCGCTTTTTCCCTCTTCCGTCACCTCCTTTCGAT - 0,00 0,00 0,00 0,00 3,79E-05 6,40E-04
24 GCGTCGGATTGGTGTTGTGGTCTTTGGGTTTTGGTTTGTGTGT - 0,00 0,00 0,00 0,00 1,89E-05 0,00
26 CCAGGGGAGGATGGGCGGGCTTTTCGTTGTCTTCTGTGTCGCT 18 8,33E-05 8,10E-04 3,74E-03 9,07E-03 0,09 0,36
27 GCGGTTCTGTGTGTGGGTGGGTGGGTGGTAATATTGTCTCGCT 3 6,95E-05 2,03E-03 7,95E-03 0,05 0,68 2,07
29 TCCCTCTTTGCATCTCCCGTATACCCCGCCCTTTAACCGTGTG - 0,00 0,00 0,00 0,00 0,00 0,00
30 TGGGGGTTGGGTGGGTTGGGTGTCGATTGCGTCTCTCTTCTTG - 0,00 0,00 0,00 0,00 0,00 0,00
31 CAGGGGAGGAGGGTGGGCAGAGGTGTTTAGTGTGTCCGGGTTT 61 0,00 0,00 0,00 1,31E-05 1,06E-03 4,11E-03
32 CCACCGCGCTGATCTTGCTCCCTTCCGTCCGTCCGTTCCTCCC 306 1,39E-05 0,00 1,53E-04 4,46E-04 2,73E-03 8,45E-03
33 CCCTCGACAGCCTTCTCGTCCTCTGTATTGGGCCATCCTCCC - 0,00 0,00 0,00 0,00 1,89E-05 0,00
34 CCTAGTACATTTCATCCGCCTCGTTGTCGCCCCTTCCCGCCGT - 0,00 0,00 0,00 0,00 0,00 0,00
35 CGGTTTGGTGTGTGGTTCGCGAGTACGTTTCCTTCTCGACTTG - 0,00 0,00 0,00 0,00 0,00 0,00
36 CGGGTGCTTTGTTGTATGTTGTGTGTGGGCTTTTTTGGTGTGG - 0,00 0,00 0,00 0,00 0,00 0,00
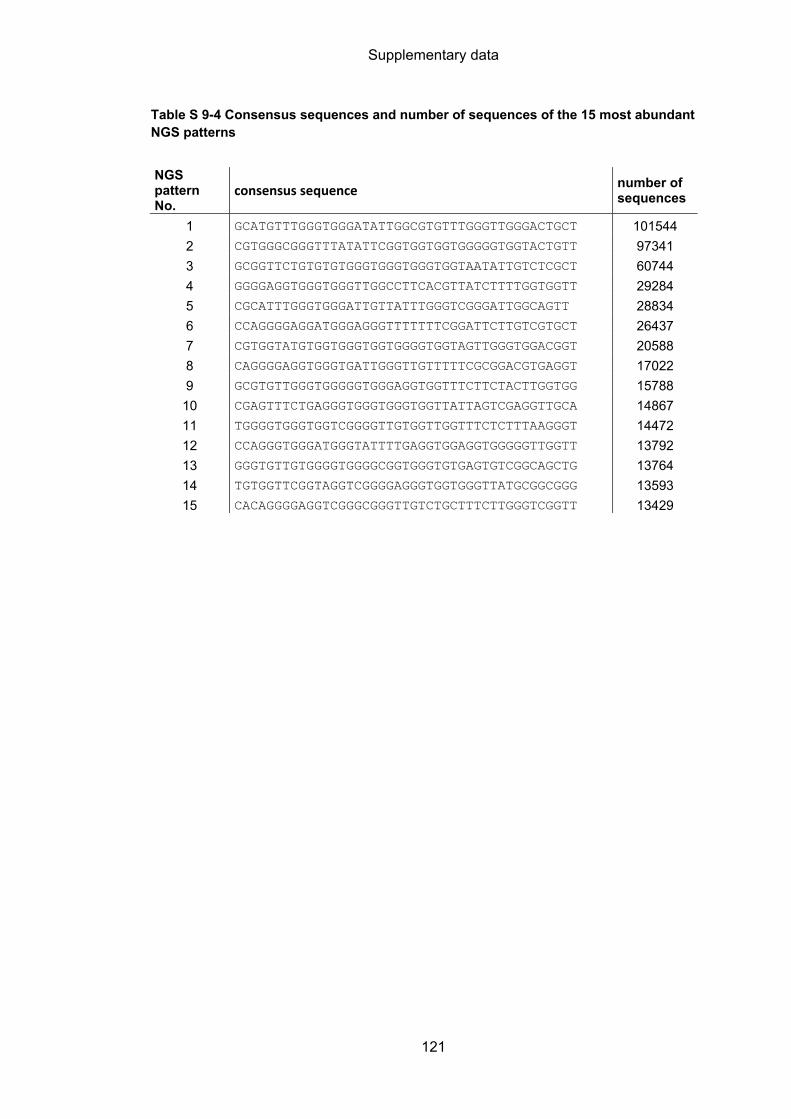
Supplementary data
121
Table S 9-4 Consensus sequences and number of sequences of the 15 most abundant NGS patterns
NGS pattern No.
consensus sequence number of sequences
1 GCATGTTTGGGTGGGATATTGGCGTGTTTGGGTTGGGACTGCT 101544
2 CGTGGGCGGGTTTATATTCGGTGGTGGTGGGGGTGGTACTGTT 97341
3 GCGGTTCTGTGTGTGGGTGGGTGGGTGGTAATATTGTCTCGCT 60744
4 GGGGAGGTGGGTGGGTTGGCCTTCACGTTATCTTTTGGTGGTT 29284
5 CGCATTTGGGTGGGATTGTTATTTGGGTCGGGATTGGCAGTT 28834
6 CCAGGGGAGGATGGGAGGGTTTTTTTCGGATTCTTGTCGTGCT 26437
7 CGTGGTATGTGGTGGGTGGTGGGGTGGTAGTTGGGTGGACGGT 20588
8 CAGGGGAGGTGGGTGATTGGGTTGTTTTTCGCGGACGTGAGGT 17022
9 GCGTGTTGGGTGGGGGTGGGAGGTGGTTTCTTCTACTTGGTGG 15788
10 CGAGTTTCTGAGGGTGGGTGGGTGGTTATTAGTCGAGGTTGCA 14867
11 TGGGGTGGGTGGTCGGGGTTGTGGTTGGTTTCTCTTTAAGGGT 14472
12 CCAGGGTGGGATGGGTATTTTGAGGTGGAGGTGGGGGTTGGTT 13792
13 GGGTGTTGTGGGGTGGGGCGGTGGGTGTGAGTGTCGGCAGCTG 13764
14 TGTGGTTCGGTAGGTCGGGGAGGGTGGTGGGTTATGCGGCGGG 13593
15 CACAGGGGAGGTCGGGCGGGTTGTCTGCTTTCTTGGGTCGGTT 13429
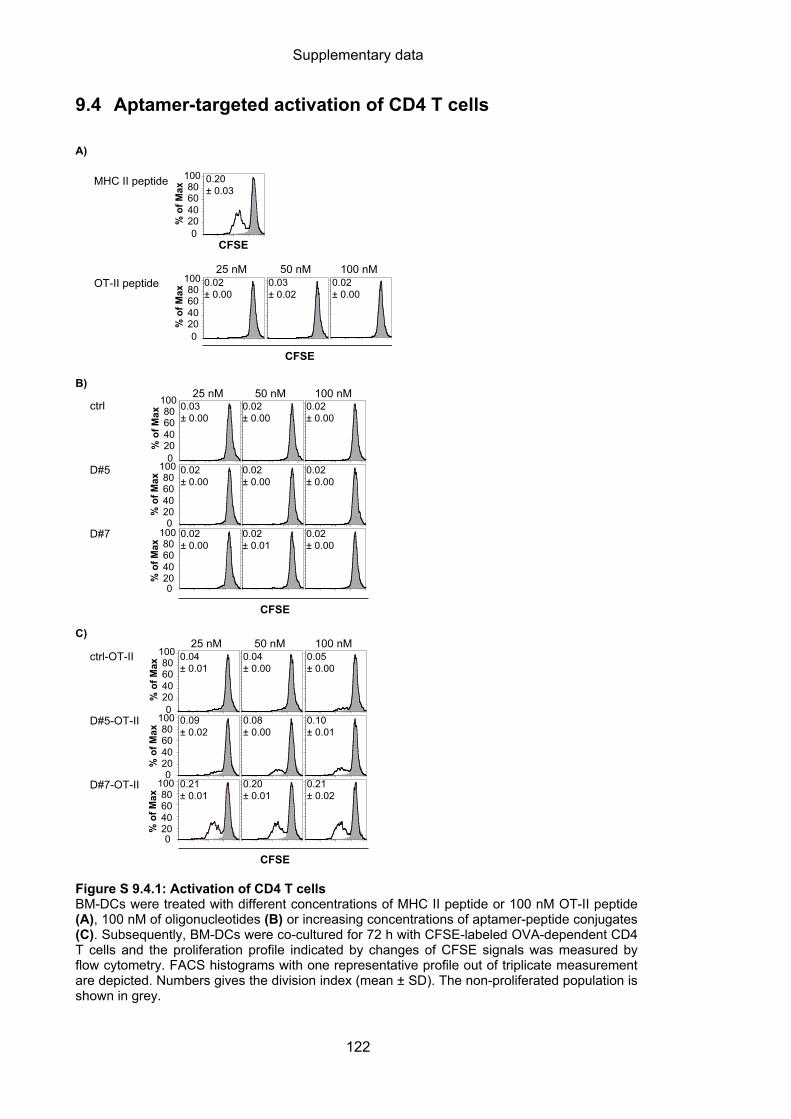
Supplementary data
122
9.4 Aptamer-targeted activation of CD4 T cells
Figure S 9.4.1: Activation of CD4 T cells BM-DCs were treated with different concentrations of MHC II peptide or 100 nM OT-II peptide (A), 100 nM of oligonucleotides (B) or increasing concentrations of aptamer-peptide conjugates (C). Subsequently, BM-DCs were co-cultured for 72 h with CFSE-labeled OVA-dependent CD4 T cells and the proliferation profile indicated by changes of CFSE signals was measured by flow cytometry. FACS histograms with one representative profile out of triplicate measurement are depicted. Numbers gives the division index (mean ± SD). The non-proliferated population is shown in grey.
A)
MHC II peptide
020406080
100%
of M
ax
CFSE
0.20 ± 0.03
OT-II peptide
B)
ctrl
D#7
D#5
C)
ctrl-OT-II
D#7-OT-II
D#5-OT-II
50 nM 100 nM 25 nM
020406080
100
% o
f Max
CFSE
0.02 ± 0.00
0.03 ± 0.02
0.02 ± 0.00
50 nM 100 nM 25 nM
020406080
100
% o
f Max
020406080
100
% o
f Max
020406080
100
% o
f Max
CFSE
0.03 ± 0.00
0.02 ± 0.00
0.02 ± 0.00
0.02 ± 0.00
0.02 ± 0.00
0.02 ± 0.00
0.02 ± 0.00
0.02 ± 0.01
0.02 ± 0.00
50 nM 100 nM 25 nM
020406080
100
% o
f Max
020406080
100
% o
f Max
020406080
100
% o
f Max
CFSE
0.04 ± 0.01
0.04 ± 0.00
0.05 ± 0.00
0.09 ± 0.02
0.08 ± 0.00
0.10 ± 0.01
0.21 ± 0.01
0.20 ± 0.01
0.21 ± 0.02
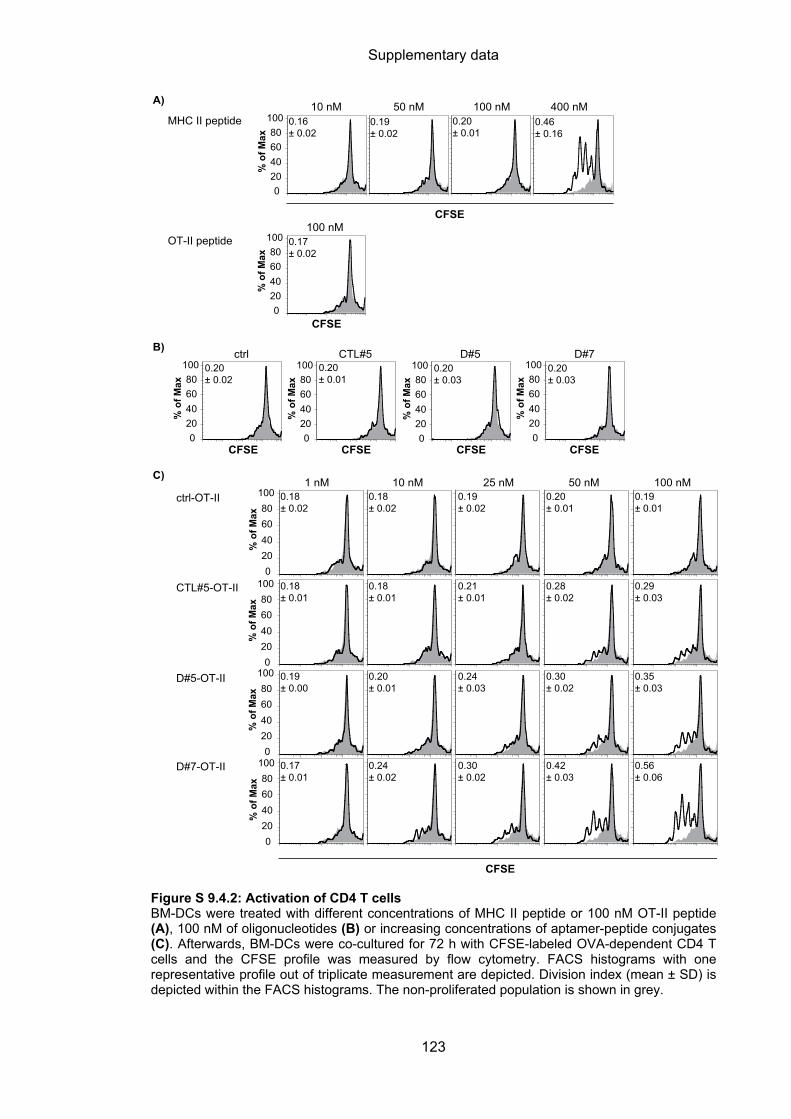
Supplementary data
123
Figure S 9.4.2: Activation of CD4 T cells BM-DCs were treated with different concentrations of MHC II peptide or 100 nM OT-II peptide (A), 100 nM of oligonucleotides (B) or increasing concentrations of aptamer-peptide conjugates (C). Afterwards, BM-DCs were co-cultured for 72 h with CFSE-labeled OVA-dependent CD4 T cells and the CFSE profile was measured by flow cytometry. FACS histograms with one representative profile out of triplicate measurement are depicted. Division index (mean ± SD) is depicted within the FACS histograms. The non-proliferated population is shown in grey.
MHC II peptide10 nM 50 nM 100 nM 400 nM
020406080
100
% o
f Max
A)
0.16 ± 0.02
0.19 ± 0.02
0.20 ± 0.01
0.46 ± 0.16
ctrl CTL#5 D#5 D#7
020406080
100
% o
f Max
020406080
100
% o
f Max
020406080
100
% o
f Max
020406080
100
% o
f Max
B)
CFSE CFSE CFSE CFSE
CFSE
C)
0.20 ± 0.02
0.20 ± 0.01
0.20 ± 0.03
0.20 ± 0.03
ctrl-OT-II
D#7-OT-II
D#5-OT-II
CTL#5-OT-II
10 nM 50 nM 100 nM 25 nM 1 nM
020406080
100
% o
f Max
020406080
100
% o
f Max
020406080
100
% o
f Max
020406080
100
% o
f Max
CFSE
0.18 ± 0.02
0.18 ± 0.02
0.19 ± 0.02
0.20 ± 0.01
0.19 ± 0.01
0.18 ± 0.01
0.18 ± 0.01
0.21 ± 0.01
0.28 ± 0.02
0.29 ± 0.03
0.19 ± 0.00
0.20 ± 0.01
0.24 ± 0.03
0.30 ± 0.02
0.35 ± 0.03
0.17 ± 0.01
0.24 ± 0.02
0.30 ± 0.02
0.42 ± 0.03
0.56 ± 0.06
OT-II peptide
020406080
100
% o
f Max
100 nM
CFSE
0.17 ± 0.02
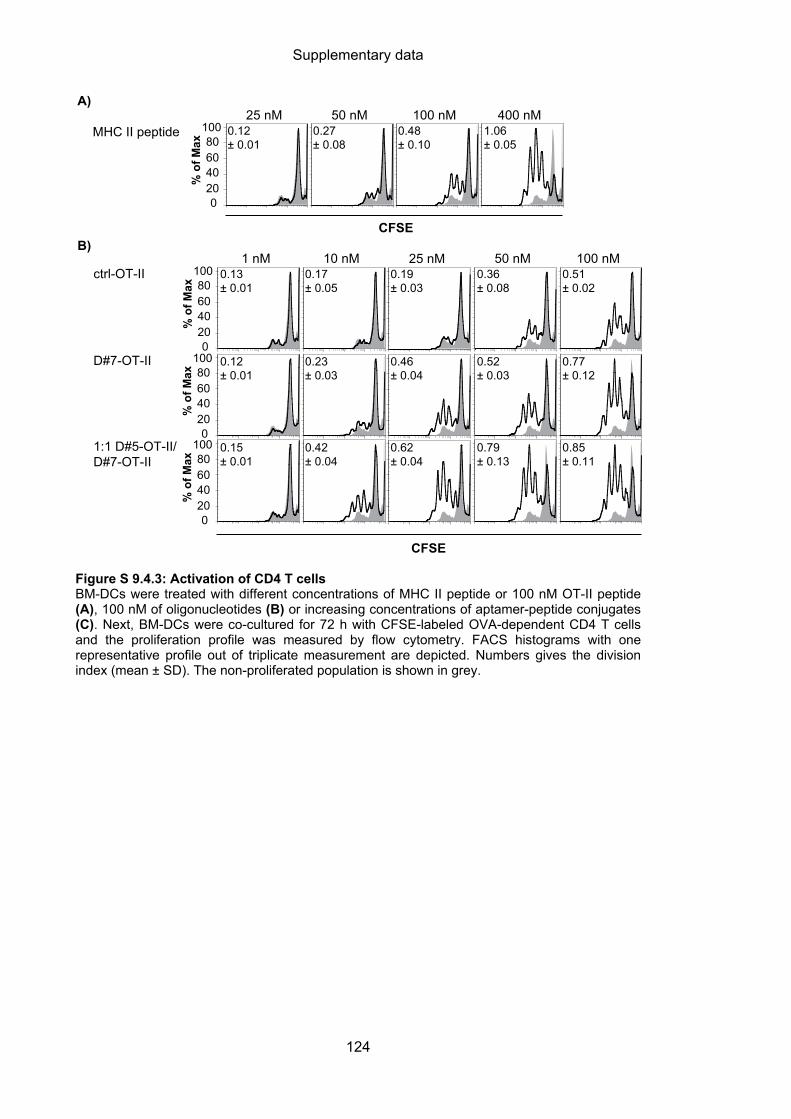
Supplementary data
124
Figure S 9.4.3: Activation of CD4 T cells BM-DCs were treated with different concentrations of MHC II peptide or 100 nM OT-II peptide (A), 100 nM of oligonucleotides (B) or increasing concentrations of aptamer-peptide conjugates (C). Next, BM-DCs were co-cultured for 72 h with CFSE-labeled OVA-dependent CD4 T cells and the proliferation profile was measured by flow cytometry. FACS histograms with one representative profile out of triplicate measurement are depicted. Numbers gives the division index (mean ± SD). The non-proliferated population is shown in grey.
A)
MHC II peptide50 nM 100 nM 25 nM
020406080
100
% o
f Max
CFSEB)
400 nM 0.12 ± 0.01
0.27 ± 0.08
0.48 ± 0.10
1.06 ± 0.05
50 nM 100 nM ctrl-OT-II
1:1 D#5-OT-II/D#7-OT-II
D#7-OT-II
10 nM 25 nM 1 nM
CFSE
020406080
100
% o
f Max
020406080
100
% o
f Max
020406080
100
% o
f Max
0.13 ± 0.01
0.17 ± 0.05
0.19 ± 0.03
0.36 ± 0.08
0.51 ± 0.02
0.12 ± 0.01
0.23 ± 0.03
0.46 ± 0.04
0.52 ± 0.03
0.77 ± 0.12
0.15 ± 0.01
0.42 ± 0.04
0.62 ± 0.04
0.79 ± 0.13
0.85 ± 0.11
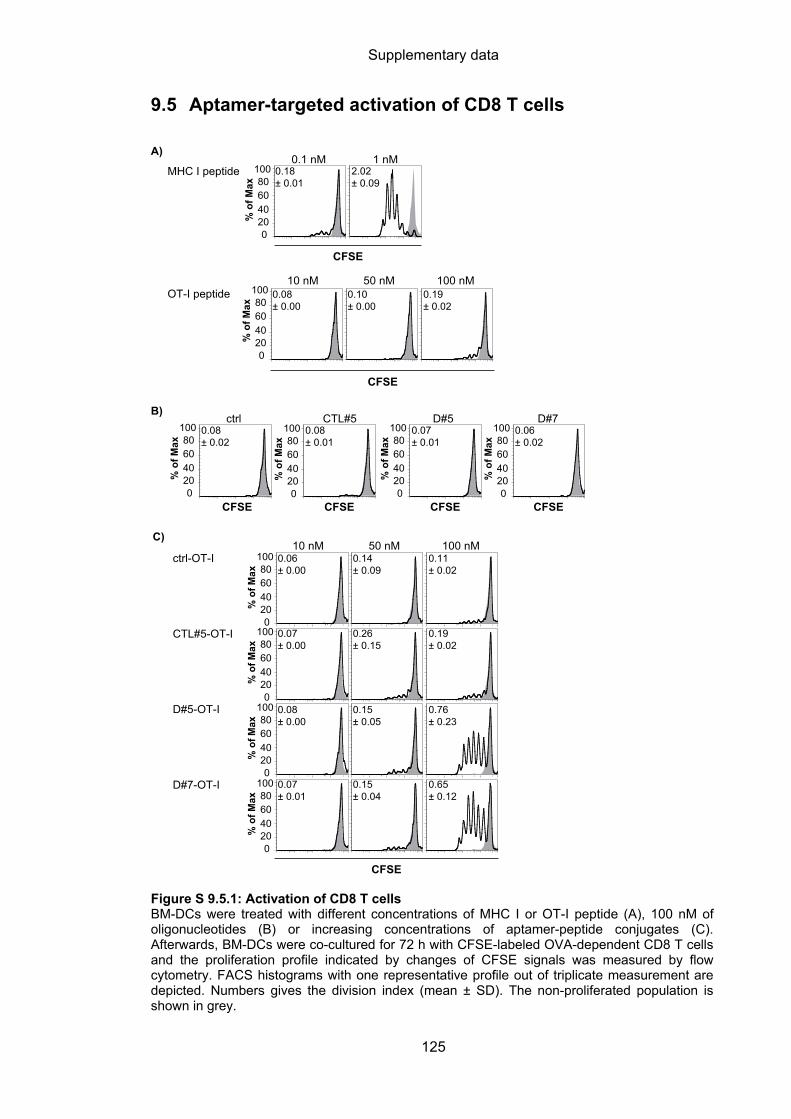
Supplementary data
125
9.5 Aptamer-targeted activation of CD8 T cells
Figure S 9.5.1: Activation of CD8 T cells BM-DCs were treated with different concentrations of MHC I or OT-I peptide (A), 100 nM of oligonucleotides (B) or increasing concentrations of aptamer-peptide conjugates (C). Afterwards, BM-DCs were co-cultured for 72 h with CFSE-labeled OVA-dependent CD8 T cells and the proliferation profile indicated by changes of CFSE signals was measured by flow cytometry. FACS histograms with one representative profile out of triplicate measurement are depicted. Numbers gives the division index (mean ± SD). The non-proliferated population is shown in grey.
C)
MHC I peptide1 nM 0.1 nM
0.18 ± 0.01
2.02 ± 0.09
A)
B)ctrl CTL#5 D#5 D#7
020406080
100
% o
f Max
020406080
100
% o
f Max
020406080
100
% o
f Max
020406080
100
% o
f Max
020406080
100
% o
f Max
0.08 ± 0.02
0.08 ± 0.01
0.07 ± 0.01
0.06 ± 0.02
CFSE
CFSE CFSE CFSE CFSE
ctrl-OT-I
D#7-OT-I
D#5-OT-I
CTL#5-OT-I
100 nM 10 nM 50 nM
CFSE
020406080
100
% o
f Max
020406080
100
% o
f Max
020406080
100
% o
f Max
020406080
100
% o
f Max
0.06 ± 0.00
0.14 ± 0.09
0.11 ± 0.02
0.07 ± 0.00
0.26 ± 0.15
0.19 ± 0.02
0.08 ± 0.00
0.15 ± 0.05
0.76 ± 0.23
0.07 ± 0.01
0.15 ± 0.04
0.65 ± 0.12
OT-I peptide100 nM 10 nM 50 nM
020406080
100
% o
f Max
0.08 ± 0.00
0.10 ± 0.00
0.19 ± 0.02
CFSE
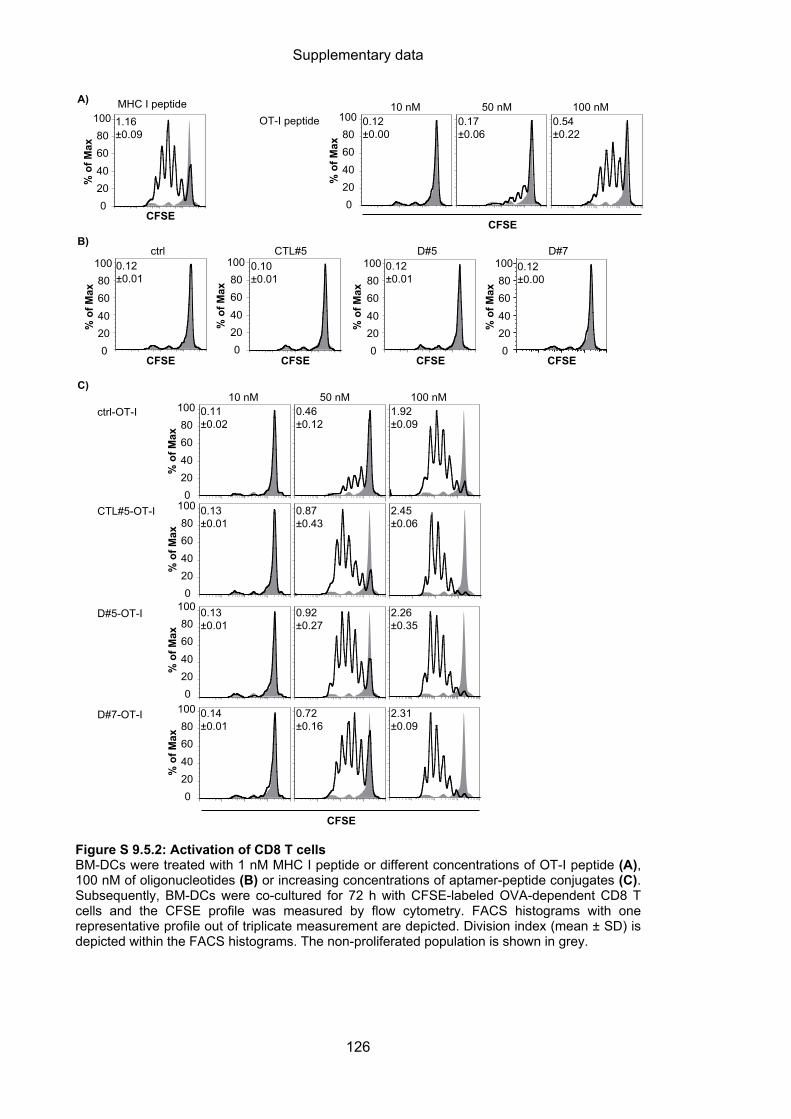
Supplementary data
126
Figure S 9.5.2: Activation of CD8 T cells BM-DCs were treated with 1 nM MHC I peptide or different concentrations of OT-I peptide (A), 100 nM of oligonucleotides (B) or increasing concentrations of aptamer-peptide conjugates (C). Subsequently, BM-DCs were co-cultured for 72 h with CFSE-labeled OVA-dependent CD8 T cells and the CFSE profile was measured by flow cytometry. FACS histograms with one representative profile out of triplicate measurement are depicted. Division index (mean ± SD) is depicted within the FACS histograms. The non-proliferated population is shown in grey.
100 nM 10 nM ctrl-OT-I
D#7-OT-I
D#5-OT-I
CFSE
C)
A) MHC I peptide
CFSE
ctrl
CFSE
D#5
CFSE
D#7
CFSE
CTL#5-OT-I
CFSE
CTL#5
020406080
100
% o
f Max
1.16±0.09
020406080
100
% o
f Max
0.12±0.01
020406080
100
% o
f Max
0.10±0.01
020406080
100
% o
f Max
0.12±0.01
020406080
100
% o
f Max
0.12±0.00
1.92±0.09
2.45±0.06
2.26±0.35
2.31±0.09
B)
50 nM
020406080
100
% o
f Max
020406080
100
% o
f Max
020406080
100
% o
f Max
020406080
100
% o
f Max
0.11±0.02
0.46±0.12
0.13±0.01
0.87±0.43
0.13±0.01
0.92±0.27
0.14±0.01
0.72±0.16
100 nM 10 nM OT-I peptide 0.54
±0.22
50 nM
020406080
100
% o
f Max
0.12±0.00
0.17±0.06
CFSE
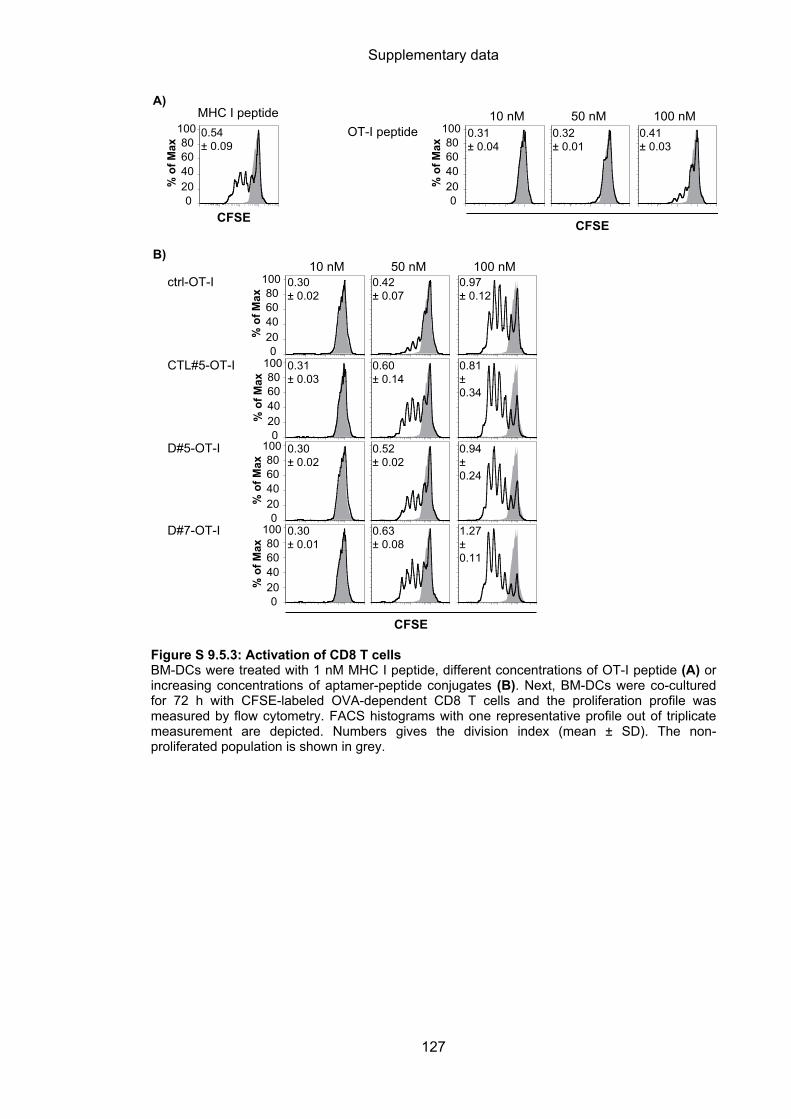
Supplementary data
127
Figure S 9.5.3: Activation of CD8 T cells BM-DCs were treated with 1 nM MHC I peptide, different concentrations of OT-I peptide (A) or increasing concentrations of aptamer-peptide conjugates (B). Next, BM-DCs were co-cultured for 72 h with CFSE-labeled OVA-dependent CD8 T cells and the proliferation profile was measured by flow cytometry. FACS histograms with one representative profile out of triplicate measurement are depicted. Numbers gives the division index (mean ± SD). The non-proliferated population is shown in grey.
B)
ctrl-OT-I
D#7-OT-I
D#5-OT-I
CTL#5-OT-I
100 nM 10 nM 50 nM
CFSE
0.30 ± 0.02
0.42 ± 0.07
0.97 ± 0.12
0.31 ± 0.03
0.60 ± 0.14
0.81 ± 0.34
0.30 ± 0.02
0.52 ± 0.02
0.94 ± 0.24
0.30 ± 0.01
0.63 ± 0.08
1.27 ± 0.11
020406080
100
% o
f Max
020406080
100
% o
f Max
020406080
100
% o
f Max
020406080
100
% o
f Max
A)
020406080
100
% o
f Max
MHC I peptide0.54 ± 0.09
OT-I peptide100 nM 10 nM 50 nM
0.31 ± 0.04
0.32 ± 0.01
0.41 ± 0.03
020406080
100
% o
f Max
CFSECFSE
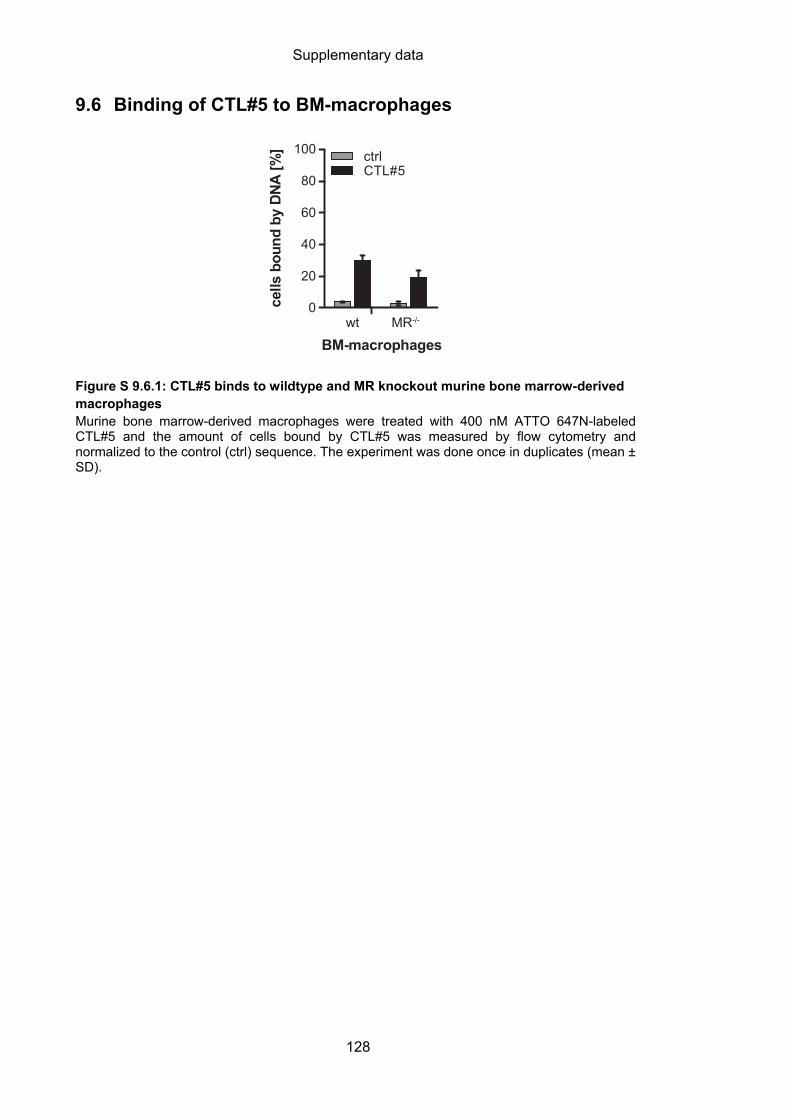
Supplementary data
128
9.6 Binding of CTL#5 to BM-macrophages
Figure S 9.6.1: CTL#5 binds to wildtype and MR knockout murine bone marrow-derived macrophages Murine bone marrow-derived macrophages were treated with 400 nM ATTO 647N-labeled CTL#5 and the amount of cells bound by CTL#5 was measured by flow cytometry and normalized to the control (ctrl) sequence. The experiment was done once in duplicates (mean ± SD).
wt MR-/-0
20
40
60
80
100 ctrl
BM-macrophages
cells
bou
nd b
y DN
A [%
]
CTL#5
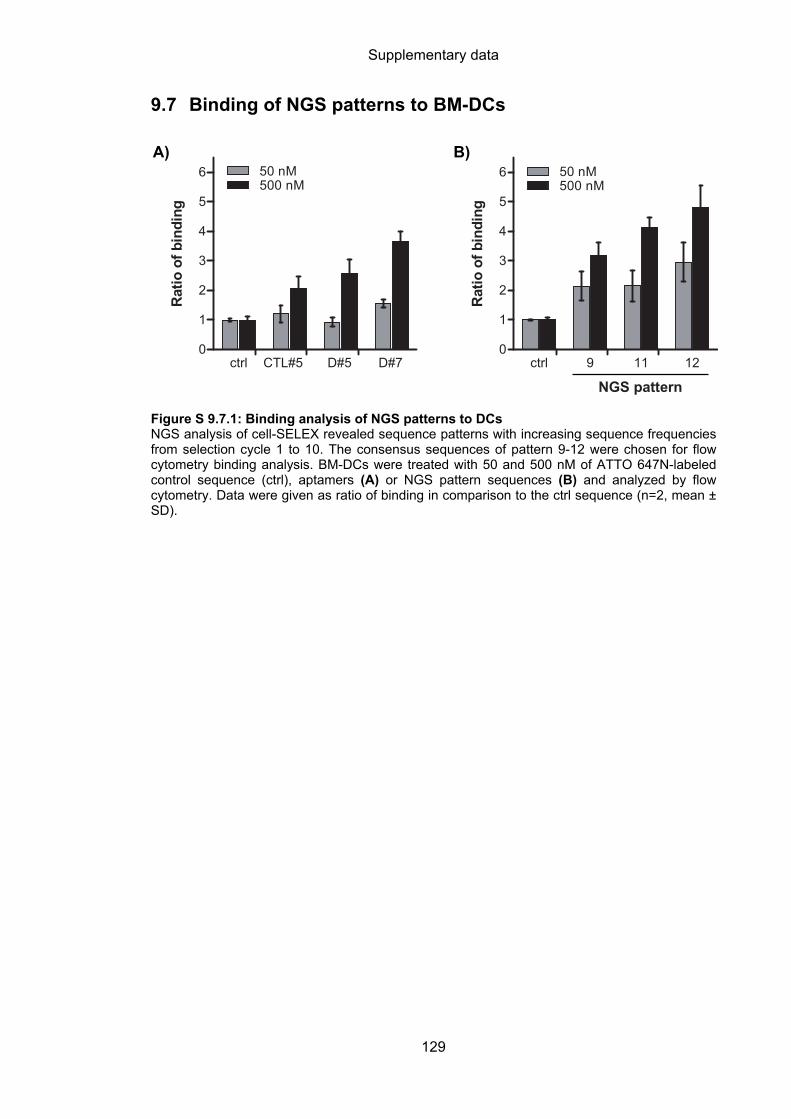
Supplementary data
129
9.7 Binding of NGS patterns to BM-DCs
Figure S 9.7.1: Binding analysis of NGS patterns to DCs NGS analysis of cell-SELEX revealed sequence patterns with increasing sequence frequencies from selection cycle 1 to 10. The consensus sequences of pattern 9-12 were chosen for flow cytometry binding analysis. BM-DCs were treated with 50 and 500 nM of ATTO 647N-labeled control sequence (ctrl), aptamers (A) or NGS pattern sequences (B) and analyzed by flow cytometry. Data were given as ratio of binding in comparison to the ctrl sequence (n=2, mean ± SD).
ctrl CTL#5 D#5 D#70
1
2
3
4
5
6R
atio
of b
indi
ng50 nM500 nM
ctrl 9 11 120
1
2
3
4
5
6
NGS pattern
Rat
io o
f bin
ding
50 nM500 nM
A) B)
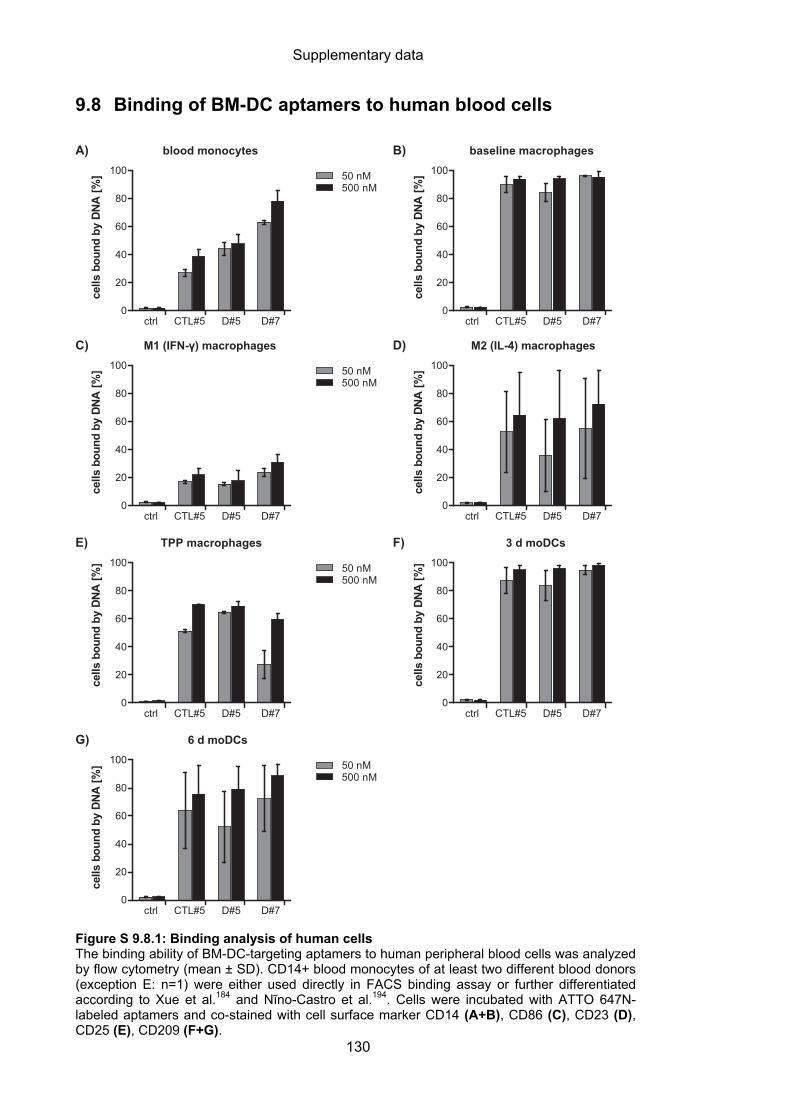
Supplementary data
130
9.8 Binding of BM-DC aptamers to human blood cells
Figure S 9.8.1: Binding analysis of human cells The binding ability of BM-DC-targeting aptamers to human peripheral blood cells was analyzed by flow cytometry (mean ± SD). CD14+ blood monocytes of at least two different blood donors (exception E: n=1) were either used directly in FACS binding assay or further differentiated according to Xue et al.184 and Nĩno-Castro et al.194. Cells were incubated with ATTO 647N-labeled aptamers and co-stained with cell surface marker CD14 (A+B), CD86 (C), CD23 (D), CD25 (E), CD209 (F+G).
blood monocytes
ctrl CTL#5 D#5 D#70
20
40
60
80
100 50 nM500 nM
baseline macrophages
ctrl CTL#5 D#5 D#70
20
40
60
80
100
M1 (IFN-γ) macrophages
ctrl CTL#5 D#5 D#70
20
40
60
80
100
cells
bou
nd b
y DN
A [%
]
M2 (IL-4) macrophages
ctrl CTL#5 D#5 D#70
20
40
60
80
100
TPP macrophages
ctrl CTL#5 D#5 D#70
20
40
60
80
100
3 d moDCs
ctrl CTL#5 D#5 D#70
20
40
60
80
100
6 d moDCs
ctrl CTL#5 D#5 D#70
20
40
60
80
100
cells
bou
nd b
y DN
A [%
]
cells
bou
nd b
y DN
A [%
]ce
lls b
ound
by
DNA
[%]
cells
bou
nd b
y DN
A [%
]
cells
bou
nd b
y DN
A [%
]
cells
bou
nd b
y DN
A [%
]
A) B)
C) D)
E) F)
G)
50 nM500 nM
50 nM500 nM
50 nM500 nM
Abbreviations
131
10 Abbreviations
APS Ammoniumperoxodisulfate BM-DC Bone marrow-derived dendritic cell BSA Bovine serum albumin CFSE Carboxyfluoresceine succinimidyl ester CLEC-1 C-type lectin receptor-1 CpG Cytosine-phosphodiester-guanosine CR Cystein-rich CTLA-4 Cytotoxic T-lymphocyte-associated protein 4 CTLD C-type lectin-like domain ctrl Control DNA sequence Cyt1 Sec7 Sec7 domain of Cytohesin 1 DAPI 4’,6-diamidino-2-phenylindole DC Dendritic cell DCIR DC immunoreceptor DC-SIGN DC-specific ICAM-3 grabbing non-integrin DEC-205 Dendritic and epithelial cells, 205 kDa Dectin DC-associated C-type lectin DLEC DC lectin DNA Deoxyribonucleic acid DTT 1,4-Dithiothreitol EDTA Ethylendiamintetraacetic acid EEA1 Early endosome antigen 1 ELISA Enzyme-linked immunosorbent assay ER Endoplasmatic recticulum ERAAP Endoplasmatic recticulum aminopeptidase associated with antigen
processing Erk2 Extracellular signal-regulated kinase 2 FDA Food and drug administration (USA) FNII Fibronectin type II FRET Fluorescence resonance energy transfer GM-CSF Granulocyte macrophage colony-stimulating factor h Human HFIP 1,1,1,3,3,3-hexafluoro-2-propanol HPLC High-performance liquid chromatography HTRF Homogenous time-resolved fluorescence IFN Type I interferons IL Interleukin LAMP-1 Lysosome-associated membrane glycoprotein 1 LC-MS Liquid chromatography-mass spectrometry LPS Lipopolysaccharide M-CSF Macrophage colony-stimulating factor MFI Mean fluorescence intensity MHC Major histocompatibility complex MR Mannose receptor MVB multivesicular body NGS Next generation sequencing ODN Oligonucleotide OVA Ovalbumin PAGE Polyacrylamide gel electrophoresis PAMP Pathogen-associated molecular pattern PBMC Peripheral blood mononuclear cell
Abbreviations
132
PCC Pearson's correlation coefficient PCR Polymerase chain reaction PD-1 Programmed cell death 1 PEG Polyethylene glycol pIC Polyinosinic:polycytidylic acid PNK Polynucleotide kinase PRR Pattern recognition receptor PSMA Prostate-specific membrane antigen Rag2 Recombinant activating gene 2 RNA Ribonucleic acid SD Standard deviation SDS Sodium dodecylsulfate SELEX Systematic evolution of ligands by exponential enrichment TCR T cell receptor TEA Triethylamine TEAA Triethylammonium acetat TEMED N,N,N’,N’-tetramethylethylendiamide Th T helper cell TLR Toll-like receptor TNF-α Tumor necrosis factor α WGA Wheat germ agglutinin

Danksagung
133
11 Danksagung
Als erstes danke ich Prof. Günter Mayer für die Möglichkeit dieses spannende Thema
zu bearbeiten und für seinen Enthusiasmus und seine Energie während der Betreuung
des Projekts.
Des Weiteren danke ich Prof. Sven Burgdorf für die fruchtbare Kooperation und seine
ständige Hilfsbereitschaft, sowie für die freundliche Übernahme des Zweitgutachtens.
Priv.-Doz. Gerhild van Echten-Deckert und Prof. Anton Bovier möchte ich dafür
danken, dass sie mich beim letzten Schritt zur Promotion begleiten und sich als
Mitglieder meiner Prüfungskommission zur Verfügung gestellt haben.
Alina Bartholomäus (intern), James Stunden (AK Latz) und den Mitgliedern der AK
Schultze, insbesondere Dr. Susanne Schmidt und Heidi Theis, danke ich für die
tatkräftige Unterstützung bei einigen experimentellen Teilen dieser Arbeit. Dr. Thomas
Quast (AK Kolanus) danke ich für die freundliche Unterstützung am konfokalen
Mikroskop.
Ich möchte mich bei allen Kollegen und Ex-Kollegen aus dem AK Mayer, dem AK
Burgdorf und dem AK Famulok bedanken für die freundliche und lustige
Arbeitsatmosphäre und die stete und große Hilfsbereitschaft. Besonders hervorheben
möchte ich hier Dr. Verena Schütte und Dr. Laia Civit. Thanks for your inestimable
support and friendship.
I am truly indebted and thankful to Dr. Verena Schütte, Dr. Laia Civit and Shannon
Smith for their conscientious proofreading of my thesis, their helpful comments and
suggestions.
Außerdem bedanke ich mich bei meinem Tantchen Claudia, meinem Schwesterherz
Claudia, meinem Cousin Philip und meinen Schwiegereltern Helga und Kalle für ihre
Liebe und ihre Unterstützung. Und dafür, dass sie stets versuchen zu verstehen was
ich beruflich mache. ;-)
Meinen Schätzeleins Sarah, Stephan, Micha, Melli, Martina und David, sowie den
Marburgern Anna, Michi, Cathi, Anne, Kathi, Johannes und Eve danke ich für das

Danksagung
134
Verständnis, die Ablenkungen und Freuden während der letzten Jahre. Ihr seid mein
Rückhalt.
Abschließend möchte ich meinem Mann Dominique für seine Liebe, Geduld und
Unterstützung danken. Du bist und bleibst mein Fels in der Brandung.