Bioimpedance analysis and physical functioning as ...
28
Accepted Manuscript Bioimpedance analysis and physical functioning as mortality indicators among older sarcopenic people Mikko P. Björkman, Kaisu H. Pitkala, Satu Jyväkorpi, Timo E. Strandberg, Reijo S. Tilvis PII: S0531-5565(19)30101-9 DOI: https://doi.org/10.1016/j.exger.2019.04.012 Reference: EXG 10604 To appear in: Experimental Gerontology Received date: 6 February 2019 Revised date: 19 April 2019 Accepted date: 20 April 2019 Please cite this article as: M.P. Björkman, K.H. Pitkala, S. Jyväkorpi, et al., Bioimpedance analysis and physical functioning as mortality indicators among older sarcopenic people, Experimental Gerontology, https://doi.org/10.1016/j.exger.2019.04.012 This is a PDF file of an unedited manuscript that has been accepted for publication. As a service to our customers we are providing this early version of the manuscript. The manuscript will undergo copyediting, typesetting, and review of the resulting proof before it is published in its final form. Please note that during the production process errors may be discovered which could affect the content, and all legal disclaimers that apply to the journal pertain.
Transcript of Bioimpedance analysis and physical functioning as ...

Accepted Manuscript
Bioimpedance analysis and physical functioning as mortalityindicators among older sarcopenic people
Mikko P. Björkman, Kaisu H. Pitkala, Satu Jyväkorpi, Timo E.Strandberg, Reijo S. Tilvis
PII: S0531-5565(19)30101-9DOI: https://doi.org/10.1016/j.exger.2019.04.012Reference: EXG 10604
To appear in: Experimental Gerontology
Received date: 6 February 2019Revised date: 19 April 2019Accepted date: 20 April 2019
Please cite this article as: M.P. Björkman, K.H. Pitkala, S. Jyväkorpi, et al., Bioimpedanceanalysis and physical functioning as mortality indicators among older sarcopenic people,Experimental Gerontology, https://doi.org/10.1016/j.exger.2019.04.012
This is a PDF file of an unedited manuscript that has been accepted for publication. Asa service to our customers we are providing this early version of the manuscript. Themanuscript will undergo copyediting, typesetting, and review of the resulting proof beforeit is published in its final form. Please note that during the production process errors maybe discovered which could affect the content, and all legal disclaimers that apply to thejournal pertain.

ACCEP
TED M
ANUSC
RIPT
1
Bioimpedance analysis and physical functioning as mortality indicators
among older sarcopenic people
Mikko P. Björkman1, Kaisu H. Pitkala
2, Satu Jyväkorpi
2, Timo E. Strandberg
1, Reijo S.
Tilvis1
1 University of Helsinki, Institute of Clinical Medicine, Department of Internal Medicine, Geriatric Unit, POB
20, 00014 University of Helsinki, Finland
2 University of Helsinki, Institute of Clinical Medicine, Department of General Practice, POB 20, 00014
University of Helsinki, Finland and Helsinki University Hospital, Unit of Primary Health Care
Corresponding Author:
Kaisu H Pitkala
University of Helsinki
Department of General Practice and Primary Health Care
PO Box 20
00014 University of Helsinki, Finland
tel. +358-50-3385546
Acknowledgements
This study is funded by the University of Helsinki, Konung Gustav V:s och Drottning Victorias
Frimurarestiftelse, the Yrjö Jahnsson Foundation, and Valio Ltd. The co-operation of Porvoo municipal
health care services is greatly appreciated.
ACCEPTED MANUSCRIPT
ACCEP
TED M
ANUSC
RIPT
2
Keywords: Sarcopenia, Bioimpedance analysis, physical functioning, survival prognosis
ACCEPTED MANUSCRIPT
ACCEP
TED M
ANUSC
RIPT
3
Abstract
Objectives: To assess the prognostic significance of various characteristics and measurements of
sarcopenia and physical functioning on all-cause mortality among home-dwelling older people with or
at-risk of sarcopenia.
Design: Cross-sectional and longitudinal analyses.
Setting: Porvoo sarcopenia trial in open care
Participants: Community-dwelling people aged 75 and older (N = 428, of which 182 were re-
examined at one year) with four years of follow-up.
Measurements: Body mass index (BMI), physical functioning (physical component of the RAND-36)
and physical performance tests (Short Physical Performance Battery (SPPB), hand grip strength,
walking speed, Charlson Comorbity Index, bioimpedance-based surrogates for muscle mass: Single
Frequency Skeletal Muscle Index (SF-SMI), and Calf Intracellular Resistance Skeletal Muscle Index
(CRi-SMI). Date of death was retrieved from central registers. Survival analyses were performed using
Life-Table analyses and Cox models.
Results: Most test variables (except BMI) were associated with four-year mortality in a dose-
dependent fashion. After controlling for age, gender and co-morbidity, physical performance and
functioning (both SPPB and RAND-36), muscle strength (hand grip strength) and CRi-SMI appeared to
be independent mortality risk indicators (p<0.001) whereas SF-SMI was not. When CRi-SMI values
were grouped by gender-specific cut-off points, the probability of surviving for four years decreased by
66% among the older people with low CRi-SMI (HR = 0.34, 95%CI 0.15-0.78, p = 0.011). When low
CRi-SMI was further controlled for SPPB, the prognostic significance remained significant (HR =
0.55, 95%CI 0.33-0.92, p=0.021). After controlling for age, gender, comorbidity, and CRi-SMI, the
ACCEPTED MANUSCRIPT

ACCEP
TED M
ANUSC
RIPT
4
physical component of the RAND-36 (p = 0.007), SPPB (p<0,001) and hand grip strength (p=0.009)
remained significant mortality predictors. Twelve-month changes were similarly associated with all-
cause mortality during the follow-up period.
Conclusion: CRi-SMI, muscle strength, physical performance and physical functioning are each
strong independent predictors of all-cause mortality among home-dwelling older people. Compared to
these indicators, BMI seemed to be clearly inferior. Of two bioimpedance-based muscle indices, CRi
SMI was better predictor of mortality than SF-SMI. In this regard, muscle mass, muscle strength and
physical performance are all suitable targets for the prevention of sarcopenia-related over-mortality.
ACCEPTED MANUSCRIPT
ACCEP
TED M
ANUSC
RIPT
5
1. Introduction
Sarcopenia, age-related muscle loss, has been recognized as a major clinical problem among older
people as it is common and associates with poorer health outcomes. A recent consensus panel has
defined it as low muscle strength, low muscle quantity and quality, and low physical performance
(Cruz Jentoft et al. 2019). Compared with the determination of strength and performance, the
assessment of muscle mass is challenging in clinical practice.
Different body imaging techniques such as computed tomography, magnetic resonance imaging, dual
energy X-ray absorptiometry (DEXA) and Bioimpedance analysis (BIA) have been recommended for
the measurement of muscle mass (Cruz Jentoft et al. 2019). However, the three first imaging
techniques require a visit to a laboratory or a hospital, which may be problematic for some older
sarcopenic people with disabilities. BIA is a portable alternative for assessing body composition
(Janssen et al. 2000) and thus suitable for primary health care settings, including home visits. The
bioimpedance spectroscopy (BIS) that scans 256 frequencies has been a useful tool for estimating the
health status and survival prognosis of selected patient groups such as dialysis patients (Avram et al.
2010; Koh et al. 2011; O'Lone et al. 2014). However, the prognostic significance of BIS has not been
studied thoroughly.
The use of different sarcopenia criteria in several studies has shown that increased sarcopenia is
associated with over-mortality (Roubenoff et al. 2003; Cesari et al. 2009; Bunout et al. 2011; Studenski
et al. 2011; Landi et al. 2011; Landi et al. 2012; Arango-Lopera et al. 2013; Atkins et al. 2014; Batsis et
al. 2014; Alexandre et al. 2014). In a recent long-term population-based cohort study, sarcopenia,
defined as low muscle mass in BIA and low gait speed, was associated with a 29% increase in all-cause
mortality and a 61% increase in cardiovascular mortality among women (Brown et al. 2016). Obesity
did not modify the relationships between sarcopenia and mortality in this study. Furthermore,
appendicular lean mass (muscle mass) distinguished the mortality risk among prefrail and frail older
ACCEPTED MANUSCRIPT
ACCEP
TED M
ANUSC
RIPT
6
people (Brown et al. 2017). However, the relative importance of muscle mass, strength and function,
and the role of concomitant obesity has been debated (Visser et al. 2005; Newman et al. 2006) and
requires further exploration. For instance, some studies suggested that muscle function may be a more
powerful predictor of disability and mortality than muscle mass (Newman et al. 2006; Rantanen 2003).
According to a recent meta-analysis, sarcopenic obesity is associated with a 24% increased risk of all-
cause mortality (Tian and Xu 2016). In a large English study, sarcopenic obesity did not confer any
greater risk than sarcopenia alone (Hamer and O'Donovan 2017). Weight loss combined with
sarcopenia presented the greatest mortality risk.
The aim of this study was to explore whether and to what extent the different characteristics of
sarcopenia predict mortality among older people at-risk or with sarcopenia. For this purpose, we
compared the prognostic significance of two bioimpedance-based muscle indices with that of muscle
strength, physical functioning, physical performance and body weight in the four-year follow-up study
of the Porvoo Sarcopenia trial. Both baseline data and their 12-month changes were tested as all-cause
mortality risk indicators.
ACCEPTED MANUSCRIPT

ACCEP
TED M
ANUSC
RIPT
7
2. Material and methods
2.1. Participants
We derived our data from the Porvoo Sarcopenia and Nutrition Trial (ACTRN12612001253897)
(Bjorkman et al. 2013). We approached the population aged 75+ living in Porvoo, Finland (N=3275)
by a postal questionnaire (response rate 60.5%) and the research group further examined the
individuals at risk of sarcopenia (N= 428). Of these, 182 participated in a three-armed 12-month
intervention trial and were re-examined one year later. We obtained the participants’ census status and
date of death from the bureau of Official Statistics of Finland (SVT) in 2016, 60 months after baseline
examination and 48 months after cessation of the trial period.
2.2.Data collection and examinations
Demographic data and medical history were collected by postal questionnaire. The questionnaires also
included a Finnish translation of the RAND-36 physical functioning scale (Hays and Morales, 2001) as
an indicator for physical functioning. Morbidity was classified according to the Charlson Comorbidity
Index (Charlson et al. 1987) indicating comorbidity.
To be included in the trial the participants had to be at least at risk of sarcopenia. The inclusion criteria
were: 1. low hand grip strength (men ≤30.0 kg, women ≤20.0 kg) or slow habitual gait speed
(≤0.80 m/s) and 2. low SMI (2 standard deviations below young adults) measured by segmental calf
BIS). They were clinically examined at a day clinic or during a home visit. A short physical
performance battery (SPPB) (Guralnik et al. 1994), with 0 points indicating poorest and 12 points best
performance, assessed physical performance. Its three components (balance, gait speed, and chair rise)
were also used to calculate continuous summary physical performance scores (CSPPS = 0 to 100)
(Nieves et al. 2005). Muscle strength was assessed using a hand grip dynamometer (JAMAR
ACCEPTED MANUSCRIPT

ACCEP
TED M
ANUSC
RIPT
8
dynamometer, Saehan Corp., Masan, Korea). We recorded the mean maximum strength of both hands,
and used gender specific cut-off points (30kg for men and 20kg for women), as suggested by the
European Working Group on Sarcopenia in Older People (Cruz Jentoft et al. 2019). We also assessed
two-minute walking distance (Connelly et al. 1996). Cognitive function was evaluated by mini mental
state examination (MMSE) (Folstein et al. 1975), with a score ranging from 0 (poorest) to 30 (best).
BIS was performed by a single channel, tetra polar device (SFB7, ImpediMed Ltd., Eight Miles Plains,
Queensland, Australia) (ImpediMed SFB7, 2019) that scans 256 frequencies between 4 and 1000 kHz.
This device has been shown to give accurate estimates of body composition and good agreement with
DXA (Thompson et al. 2007). We recorded the values without further software processing. Segmental
calf intracellular resistance skeletal muscle index (CRi-SMI) was calculated from the BIS data of calf
measurements as follows: CRi-SMI=electrode distance2/Ricalf (cm
2/Ω), using the means of both calves.
The whole-body single frequency skeletal muscle index (SF-SMI) was calculated from whole-body
skeletal muscle mass (SMM) and assessed according to Janssen et al. (2000). We then transformed this
into skeletal muscle index as SF-SMI=SMM/height2. The age-specific median values were used ass
cut-off points for low SMI (6.90 kg/m2 for women and 9.31 kg/m
2 for men). We also calculated Calf
Intracellular Resistance Skeletal Muscle Index (CRI-SMI) as described (Bjorkman et al. 2012). The
corresponding age-specific cut-off points for low Cri-SMI were 1.50 cm2/Ω for women and 2.06 cm
2/Ω
for men.
The study was approved by the Ethics Committee of the Helsinki University Central Hospital.
Informed consent was obtained from each patient or, if necessary, from their closest proxy for MMSE
of <19 points.
2.3.Statistics
ACCEPTED MANUSCRIPT

ACCEP
TED M
ANUSC
RIPT
9
We used SPSS software (IBM Corp. Released 2012. IBM SPSS Statistics for Windows, Version 21.0.
Armonk, NY: IBM Corp.) for the statistical analyses. Continuous variables with normal distribution
were expressed by means with standard deviations (SD) and those with skewed distribution by medians
with first and fourth quartile cut-off points. For the variables with normal distribution, we performed
statistical comparisons between the groups using Student’s t-test, and for those with skewed
distribution we used the Mann-Whitney U test. We used the Chi-Square test to examine the
relationships between two categorical variables, and Fischer’s exact test when appropriate.
We used Kaplan-Meier analyses to study time-dependent differences in survival, and Cox survival
analyses to test the prognostic significance of various risk conditions. Age, gender and comorbidity as
common confounders for mortality were forced into the regression analysis as covariates when
appropriate.
ACCEPTED MANUSCRIPT
ACCEP
TED M
ANUSC
RIPT
10
3. Results
3.1.Baseline characteristics as mortality risk indicators
The participants (N = 428) were old (83.4 ± 4.6 years), women outnumbered men (285 vs 143) and the
majority (56%) lived alone. They used a mean of 5.4 ± 3.0 prescribed regular medications. Their mean
BMI was 27.2 ± 4.6 kg/m2 and that of MMSE 25.6 ± 3.5. Up to 40% were considered to have a
sedentary lifestyle.
Of the screened participants, 88 died within four years. Mortality was twice as high among the men
than among the women and was closely associated with characteristics of physical functioning
(RAND-36), physical performance (SPPB, CSPPS, walking speed, two-minute walking distance, and
chair tests) among both genders (Table 1). We found no difference between the BMI of the survivors
and deceased women. Of the bioimpedance measures, only CRi-SMI values were significantly lower
among the deceased than among the survivors.
The survival analyses (Kaplan-Meier curves) revealed that case-fatality increased with CRi-SMI over
time. (Figure 1). The same also held true for several other indicators of sarcopenia, physical
functioning and Charlson comorbidity index (data not shown).
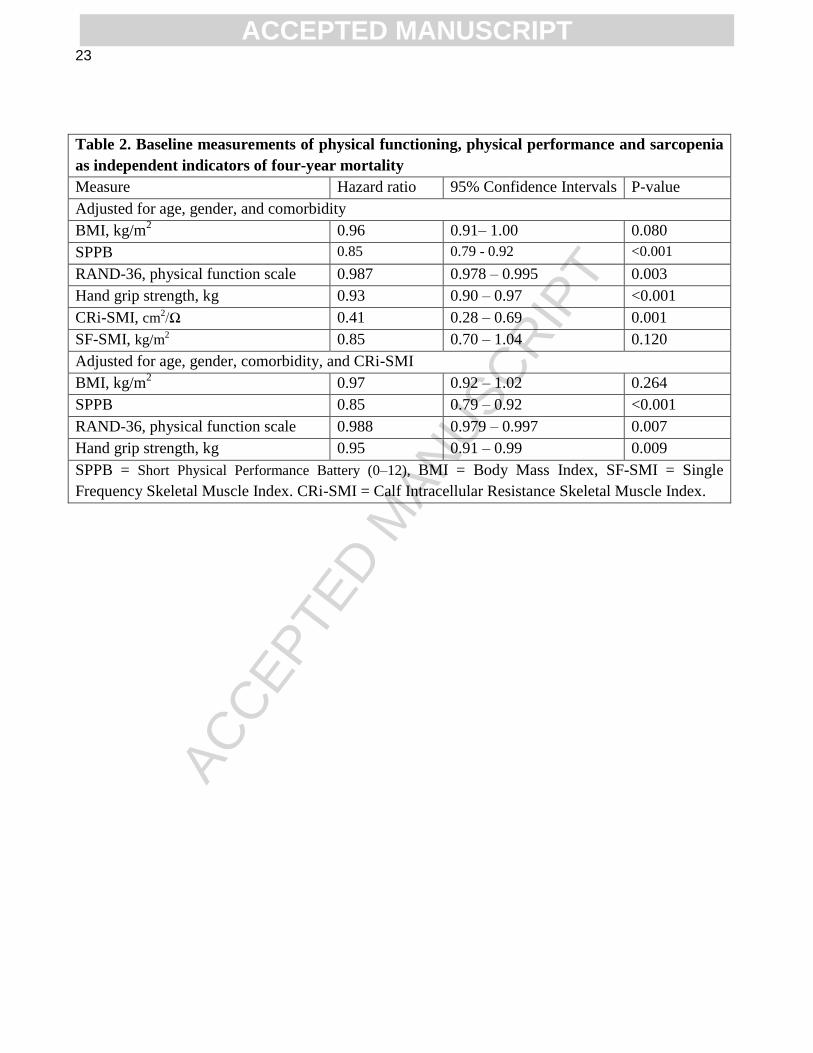
We further tested the significance of the risk indicators in Cox regression analyses, into which we
entered age, gender and comorbidity as covariates (Table 2). The indices of physical performance and
functioning (SPPB and RAND-36), muscle strength (hand grip strength), and CRi-SMI as an indicator
of muscle mass appeared to be independent mortality risk indicators. In this analysis, the prognostic
value of SF-SMI and BMI remained insignificant. When CRi-SMI values were grouped by age-specific
cut-off points, the probability of surviving for four years decreased by 66% among the older people
ACCEPTED MANUSCRIPT

ACCEP
TED M
ANUSC
RIPT
11
with low CRi-SMI (Fig. 1). When CRi-SMI was further controlled for SPPB, the prognostic
significance of low CRi-SMI remained significant (HR = 0.55, 95%CI 0.33-0.92, p = 0.021).
Finally, when we forced the muscle mass indicator CRi-SMI into the Cox survival analysis as an
additional covariant, both the hand grip strength and physical functioning indices retained statistical
significance as mortality predictors, whereas the prognostic value of BMI remained insignificant (Table
2).
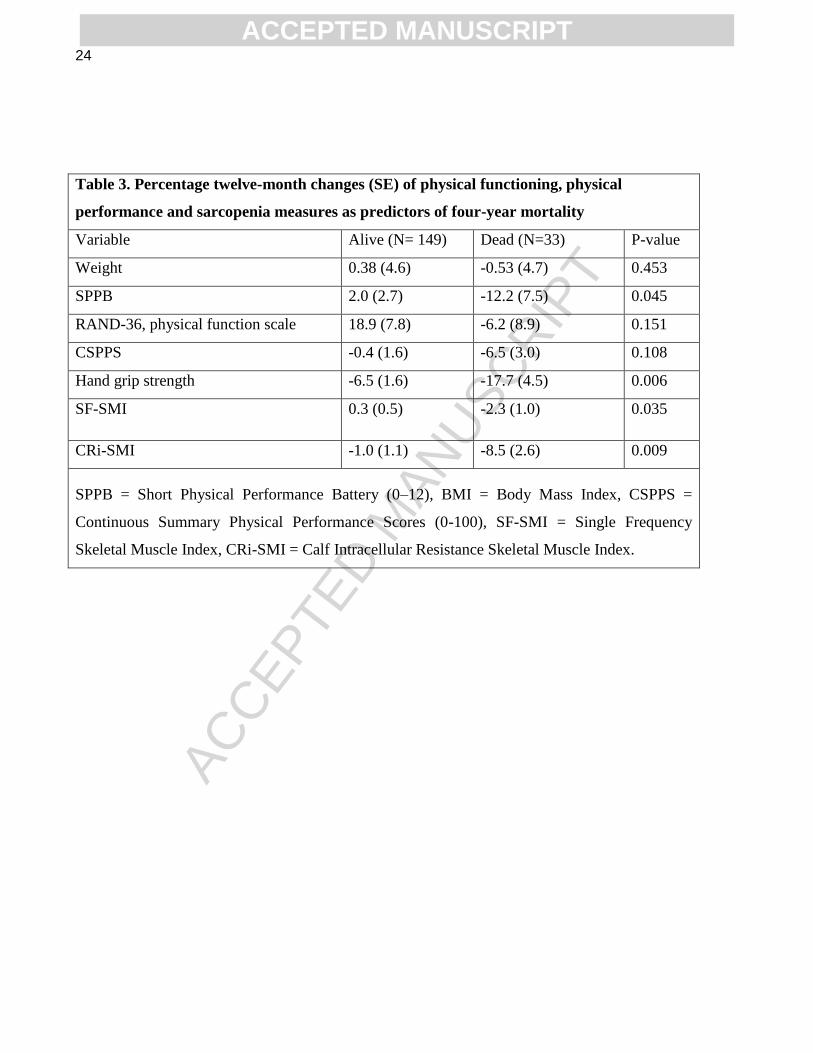
3.2. Twelve-month changes and mortality
Twelve-month changes in sarcopenia indicators were available from 182 individuals, of whom 33 died
within the four-year follow-up. Physical performance decline, measured as twelve-month changes in
the SPPB score and weakening of hand grip strength, were significantly associated with four-year
mortality (Table 3). Both bioimpedance measures, SF-SMI and CRi-SMI, also decreased to a
significantly greater extent among those who later died than among those who survived.
It was interesting to note that the intercorrelation between BMI and bioimpedance data were only
moderate. The age- and gender-adjusted correlation between the two bioimpedance datasets at entry
was 0.374 and at 12-month changes 0.384. Changes in BMI correlated significantly only with SF-SMI
(r=0.284, p<0.001) but not with changes in CRi-SMI. Of the 80 participants who lost weight during the
12-month follow-up, SF-SMI decreased among 51, CRi-SMI among 56, and CSSP deteriorated among
46. Changes in hand grip strength were associated with those of CRi-SMI (r = 0.238 p<0.01) but not at
all with changes in SF-SMI (r = 0.068).
In order to test the extent to which these variables were independent risk indicators, we first forced age,
gender and the Charlson comorbidity index into the equation of logistic regression analysis (Table 4).
A 1% decrease in CRi-SMI was associated with a 4% increase in four-year mortality. The respective
ACCEPTED MANUSCRIPT
ACCEP
TED M
ANUSC
RIPT
12
figure for the loss of hand grip strength was 2%. The prognostic values of changes in the SF-SMI,
weight and physical functioning scores were of similar magnitude but did not reach statistical
significance.
ACCEPTED MANUSCRIPT

ACCEP
TED M
ANUSC
RIPT
13
4. Discussion
This study shows that most characteristics of sarcopenia and frailty are associated with a significant
long-term all-cause mortality risk among older community-dwelling people who are at a high risk of or
already suffer from age-related muscle loss. In addition, mortality risk is increased by most test
variables in a dose-dependent fashion. The results were essentially similar in the two analyses (baseline
measurements vs. 12-month changes) of the present study, although due to the attrition of the study
population, the statistical significances were not as strong among the 12-month follow-up participants
(N = 182) as among the baseline screening population (N = 428).
When seeking potential prevention targets of sarcopenia-related health consequences, it is important to
distinguish between causes and consequences, as well as a plethora of epiphenomena. In this respect,
our data provide new valuable information.
Simultaneous testing of muscle mass, muscle strength, physical functioning scores and BMI revealed
that the three sarcopenia measures were superior to BMI as mortality predictors. It is worth noting that
the intercorrelations of different sarcopenia indicators were rather low at baseline and their changes
were not congruent during the one year of this study. It is conceivable that muscle strength and physical
functioning are influenced by several factors other than muscle mass. Our data clearly showed that
muscle strength (hand grip strength) and physical performance and functioning (SPPB and RAND-36)
were mortality predictors independently of CRi-SMI. Compared to these indicators, BMI seemed
clearly inferior. This observation accords well with the newest data on sarcopenic obesity (Hamer and
O'Donovan 2017). In this regard, muscle mass, muscle strength and physical performance are all
suitable targets for the prevention of sarcopenia-related over-mortality.
ACCEPTED MANUSCRIPT
ACCEP
TED M
ANUSC
RIPT
14
The superiority of CRi-SMI compared to SF-SMI as a mortality predictor, and their relatively weak
intercorrelations, deserve special attention. SF-SMI is based on an algorithm derived from relatively
healthy subjects, which may be a source of error among the older multimorbid disabled people of the
present study. This is why, in the present study, we used CRi-SMI, which is based on BIS data that
does not require population-specific algorithms to avoid these inaccuracies. Muscle atrophy during ageing
decreases the intracellular compartment of the muscle, but the extracellular fluid is maintained, resulting in an
increase in the proportion of non-functional muscle volume (Yamada et al. 2010, Yamada et al. 2013). This
extracellular water compartment may result in overestimation of actual muscle mass with SF-BIA and
imaging techniques. This overestimation in turn may mask age-related muscle loss (Yamada 2014). This could
explain the low association between SF-SMI and physical performance, as well the mortality in the present
study.
CRi-SMI is closely related to the intracellular water compartment, as fat and bone cells have low
intracellular water content. Thus, CRi-SMI may be considered a surrogate for skeletal muscle cell
mass. The results of the present study are in good accordance with those of our previous longitudinal
study, in which the changes in CRi-SMI associated with mobility decline among typical nursing home
residents (Bjorkman et al. 2012). Further research for comparisons of these methods are still warranted.
The main weakness of this study is the lack of confirmatory measurement of muscle mass (dual x-ray
absorptiometry, etc.). However, the usefulness of bioimpedance analysis in the estimation of muscle
mass and quality has been investigated thoroughly (Heymsfield et al. 2014). These measurements
require the presence of stable patient conditions at time of measurement, because hydration of the
participant, time of day, and meticulous adherence to manufacturer-specific conditions are important
for the reliability of the results.
ACCEPTED MANUSCRIPT
ACCEP
TED M
ANUSC
RIPT
15
Major strengths in turn are the representativeness of the population sample, the simultaneous use of a
large test battery, repeated measurements of key indicators, long follow-up and the consistency of
results. Furthermore, this is the first study to investigate the role of CRi-SMI as a mortality predictor
among community-dwelling older people.
5. Conclusions
CRi-SMI, muscle strength, and physical functioning are each strong independent predictors of all-cause
mortality in home-dwelling older people. Compared to these indicators, BMI seemed to be clearly
inferior. Of two bioimpedance-based muscle indices, CRi SMI was better predictor of mortality than SF-
SMI. In this regard, muscle mass, muscle strength and physical performance are all suitable targets for
the prevention sarcopenia-related over-mortality.
ACCEPTED MANUSCRIPT

ACCEP
TED M
ANUSC
RIPT
16
References
Alexandre, T.da. S., Duarte, Y.A., Santos, J.L., Wong, R., Lebrão, M.L., (2014). Sarcopenia according
to the European Working Group on Sarcopenia in Older People (EWGSOP) versus dynapenia as a risk
factor for mortality in the elderly. J. Nutr. Health Aging 18, 751-756.
Arango-Lopera, V.E., Arroyo, P., Gutiérrez-Robledo, L.M., Pérez-Zepeda, M.U., Cesari, M., (2013).
Mortality as an adverse outcome of sarcopenia. J. Nutr. Health Aging 17, 259-262.
Atkins, J.L., Whincup, P.H., Morris, R.W., Lennon, L.T., Papacosta, O., Wannamethee, S.G., (2014).
Sarcopenic obesity and risk of cardiovascular disease and mortality: a population-based cohort study of
older men. J. Am. Geriatr. Soc. 62, 253-560.
Avram, M.M., Fein, P.A., Borawski, C., Chattopadhyay, J., Matza, B., (2010). Extracellular mass/body
cell mass ratio is an independent predictor of survival in peritoneal dialysis patients. Kidney Int. Suppl.
(117), S37-40.
Batsis, J.A., Mackenzie, T.A., Barre, L.K., Lopez-Jimenez, F., Bartels, S.J., (2014). Sarcopenia,
sarcopenic obesity and mortality in older adults: results from the National Health and Nutrition
Examination Survey III. Eur. J. Clin. Nutr. 68, 1001-1007.
Bjorkman, M.P., Finne-Soveri, H., Pilvi, T.K., Tilvis, R.S., (2012). Bioimpedance spectroscopy as a
measure of physical functioning in nursing home residents. Aging Clin. Exp. Res. 24, 612-618.
Bjorkman, M.P., Suominen, M.H., Pitkala, K.H., Finne-Soveri, H.U., Tilvis, R.S., (2013). Porvoo
sarcopenia and nutrition trial: effects of protein supplementation on functional performance in home-
dwelling sarcopenic older people - study protocol for a randomized controlled trial. Trials 14, 387.
Brown, J.C., Harhay, M.O., Harhay, M.N., (2016). Sarcopenia and mortality among a population-based
sample of community-dwelling older adults. J. Cachexia Sarcopenia Muscle 7, 290-298.
ACCEPTED MANUSCRIPT

ACCEP
TED M
ANUSC
RIPT
17
Brown, J.C., Harhay, M.O., Harhay, M.N., (2017). Appendicular Lean Mass and Mortality among
Prefrail and Frail Older Adults. J. Nutr. Health Aging 21, 342-345.
Bunout, D., de la Maza, M.P., Barrera, G., Leiva, L., Hirsch, S., (2011). Association between
sarcopenia and mortality in healthy older people. Australas. J. Ageing 30, 89-92.
Cesari, M., Pahor, M., Lauretani, F., et al., (2009). Skeletal muscle and mortality results from the
InCHIANTI Study. J. Gerontol. A Biol. Sci. Med. Sci. 64, 377-384.
Charlson, M.E., Pompei, P., Ales, K.L., MacKenzie, C.R., (1987). A new method of classifying
prognostic comorbidity in longitudinal studies: development and validation. J. Chronic Dis. 40, 373-
383.
Connelly, D.M., Stevenson, T.J., Vandervoort, A.A., (1996). Between- and within-rater reliability of
walking tests in a frail elderly population. Physiother. Can. 48, 47-51.
Cruz-Jentoft, A.J., Bahat, G., Bauer, J., et al. Writing Group for the European Working Group on
Sarcopenia in Older People 2 (EWGSOP2), and the Extended Group for EWGSOP2, 2019.
Sarcopenia: revised European consensus on definition and diagnosis. Age Ageing 48, 16-31.
Folstein, M.F., Folstein, S.E., McHugh, P.R., (1975). "Mini-mental state". A practical method for
grading the cognitive state of patients for the clinician. J. Psychiatr. Res. 12, 189-198.
Guralnik, J.M., Simonsick, E.M., Ferrucci, L. et al., (1994). A short physical performance battery
assessing lower extremity function: association with self-reported disability and prediction of mortality
and nursing home admission. J. Gerontol. 49, M85-94.
Hamer, M., O'Donovan, G., (2017). Sarcopenic obesity, weight loss, and mortality: the English
Longitudinal Study of Ageing. Am. J. Clin. Nutr. 106, 125-129.
ACCEPTED MANUSCRIPT

ACCEP
TED M
ANUSC
RIPT
18
Hays, R.D., Morales, L.S., (2001). The RAND-36 measure of health-related quality of life. Ann. Med.
33, 350-357.
Heymsfield, S.B., Gonzalez, M.C., Lu, J., Jia, G., Zheng, J., (2015). Skeletal muscle mass and quality:
evolution of modern measurement concepts in the context of sarcopenia. Proc. Nutr. Soc. 74, 355-66.
ImpediMed SFB7: Improved Accuracy and Precision Using BIS. In:
https://www.impedimed.com/products/sfb7-for-body-composition/ Accessed Apr 18, 2019.
Janssen, I., Heymsfield, S.B., Baumgartner, R.N., Ross, R., (2000). Estimation of skeletal muscle mass
by bioelectrical impedance analysis. J. Appl. Physiol. 89, 465-471.
Koh, K.H., Wong, H.S., Go, K.W., Morad, Z., (2011). Normalized bioimpedance indices are better
predictors of outcome in peritoneal dialysis patients. Perit. Dial. Int. 31, 574-582.
Landi, F., Russo, A., Liperoti, R., et al., (2010). Midarm muscle circumference, physical performance
and mortality: results from the aging and longevity study in the Sirente geographic area (ilSIRENTE
study). Clin. Nutr. 29,441-447.
Landi, F., Liperoti, R., Fusco, D., et al., (2012).Sarcopenia and mortality among older nursing home
residents. J. Am. Med. Dir. Assoc. 13, 121-126.
Newman, A.B., Kupelian, V., Visser, M., et al., (2006). Strength, but not muscle mass, is associated
with mortality in the health, aging and body composition study cohort. J. Gerontol. A Biol. Sci. Med.
Sci. 61, 72-77.
Nieves, J.W., Zion, M., Pahor, M., et al., (2005). Evaluation of continuous summary physical
performance scores (CSPPS) in an elderly cohort. Aging Clin. Exp. Res. 17, 193-200.
ACCEPTED MANUSCRIPT

ACCEP
TED M
ANUSC
RIPT
19
O'Lone, E.L., Visser, A., Finney, H., Fan, S.L., (2014). Clinical significance of multi-frequency
bioimpedance spectroscopy in peritoneal dialysis patients: independent predictor of patient survival.
Nephrol. Dial. Transplant. 29, 1430-1437.
Rantanen, T., (2003). Muscle strength, disability and mortality. Scand. J. Med. Sci. Sports. 13, 3-8.
Roubenoff, R., Parise, H., Payette, H.A., et al., (2003). Cytokines, insulin-like growth factor 1,
sarcopenia, and mortality in very old community-dwelling men and women: the Framingham Heart
Study. Am. J. Med. 115, 429-435.
Studenski, S., Perera, S., Patel, K., et al., (2011). Gait speed and survival in older adults. JAMA. 305,
50-58.
Tian, S., Xu, Y., (2016). Association of sarcopenic obesity with the risk of all-cause mortality: A meta-
analysis of prospective cohort studies. Geriatr. Gerontol. Int. 16, 155-166.
Thomson, R., Brinkworth, G.D., Buckley, J.D., Noakes, M., Clifton, P.M., (2007). Good agreement
between bioelectrical impedance and dual-energy X-ray absorptiometry for estimating changes in body
composition during weight loss in overweight young women. Clin. Nutr. 26, 771-777.
Visser, M., Goodpaster, B.H., Kritchevsky, S.B., et al., (2005). Muscle mass, muscle strength, and
muscle fat infiltration as predictors of incident mobility limitations in well-functioning older persons.
J. Gerontol. A Biol. Sci. Med. Sci. 60, 324-333.
Yamada, Y., Schoeller, D.A., Nakamura, E., Morimoto, T., Kimura, M., Oda, S., (2010). Extracellular
water may mask actual muscle atrophy during aging. J. Gerontol. A Biol. Sci. Med. Sci. 65, 510-516.
ACCEPTED MANUSCRIPT

ACCEP
TED M
ANUSC
RIPT
20
Yamada, Y., Watanabe, Y., Ikenaga, M. et al., (2013). Comparison of single- or multifrequency
bioelectrical impedance analysis and spectroscopy for assessment of appendicular skeletal muscle in
the elderly. J. Appl. Physiol. 115, 812-818.
Yamada, Y., Matsuda, K., Björkman, M.P., Kimura, M., (2014). Application of segmental bioelectrical
impedance spectroscopy to the assessment of skeletal muscle cell mass in elderly men. Geriatr.
Gerontol. Int. 14, 129-134.
ACCEPTED MANUSCRIPT

ACCEP
TED M
ANUSC
RIPT
21
Legends to figure:
Fig. 1. Calf intracellular resistance muscle index (CRi-SMI) as independent four-year mortality
indicator. The age-specific cut-off points for low Cri-SMI were 1.50 cm2/Ω for women and 2.06
cm2/Ω for men. Data adjusted for age, gender and Charlson comorbidity index. OR = 0.34 (0.15-0.78, p
= 0.011).
ACCEPTED MANUSCRIPT

ACCEP
TED M
ANUSC
RIPT
22
Table 1. Baseline characteristics of men and women by four-year mortality
Variable Men Women
Alive
(N= 97)
Dead (n=46) P-value Alive
(N =243)
Dead
(N = 42)
P-value
Age, years 83.2 (4.4) 84.0 (4.2) 0.307 82.9 (4.6) 86.1 (4.4) <0.001
Charlson Comorbidity Index 2.33 (1.85) 3.43 (3.06) 0.008 1.84 (1.65) 2.86 (1.66) <0.001
MMSE 25.2 (3,1) 25.0 (5,3) 0.812 26.2 (2.6) 24.1 (5.0) 0.015
RAND-36, Physical function
scale
57.8 (28.5) 46.2 (32.9) 0.036 51.4 (25.9) 31.2 (24.7) <0.001
Short Physical Performance
Battery (0–12)
8.7 (2.7) 7.2 (3.3) 0.006 8.7 (2.7) 5.5 (3.4) <0.001
Continuous summary physical
performance score
68.1 (16.4) 57.5 (21.9) 0.002 68.0 (15.1) 47.0 (22.2) <0.001
Walking speed, m/s 0.95 (0.28) 0.79 (0. 35) 0.005 0.93 (0.29) 0.61 (0.34) <0.001
Chair test, sec. 15.5 (7.8) 18.6 (7.5) 0.028 15.4 (8.0) 22.1 (11.5) <0.001
2-min walking distance, m 81.3 (27.7) 74.0 (23.6) 0.141 79.1 (23.1) 58.4 (24.1) <0.001
Hand Grip Strength, kg 28.8 (7.1) 25.9 (6.4) 0.020 18.1 (4.2) 14.1 (4.7) <0.001
Body Mass Index kg/m2
27.3 (4.0) 25.8 (3.7) 0.034 27.4 (4.6) 27.1 (6.6) 0.783
SF-SMIa , kg/m
2 9.83 (1.14) 9.42 (1.29) 0.055 6.96 (0.94) 6.82 (1.34) 0.406
CRi-SMIb, cm
2/Ω 1.74 (0.54) 1.47 (0.40) 0.004 1.40 (0.37) 1.15 (0.42) <0.001
MMSE=Mini Mental State Examination aSingle Frequency Skeletal Muscle Index
bCalf Intracellular Resistance Skeletal Muscle Index
ACCEPTED MANUSCRIPT
ACCEP
TED M
ANUSC
RIPT
23
Table 2. Baseline measurements of physical functioning, physical performance and sarcopenia
as independent indicators of four-year mortality
Measure Hazard ratio 95% Confidence Intervals P-value
Adjusted for age, gender, and comorbidity
BMI, kg/m2
0.96 0.91– 1.00 0.080
SPPB 0.85 0.79 - 0.92 <0.001
RAND-36, physical function scale 0.987 0.978 – 0.995 0.003
Hand grip strength, kg 0.93 0.90 – 0.97 <0.001
CRi-SMI, cm2/Ω 0.41 0.28 – 0.69 0.001
SF-SMI, kg/m2 0.85 0.70 – 1.04 0.120
Adjusted for age, gender, comorbidity, and CRi-SMI
BMI, kg/m2 0.97 0.92 – 1.02 0.264
SPPB 0.85 0.79 – 0.92 <0.001
RAND-36, physical function scale 0.988 0.979 – 0.997 0.007
Hand grip strength, kg 0.95 0.91 – 0.99 0.009
SPPB = Short Physical Performance Battery (0–12), BMI = Body Mass Index, SF-SMI = Single
Frequency Skeletal Muscle Index. CRi-SMI = Calf Intracellular Resistance Skeletal Muscle Index.
ACCEPTED MANUSCRIPT
ACCEP
TED M
ANUSC
RIPT
24
Table 3. Percentage twelve-month changes (SE) of physical functioning, physical
performance and sarcopenia measures as predictors of four-year mortality
Variable Alive (N= 149) Dead (N=33) P-value
Weight 0.38 (4.6) -0.53 (4.7) 0.453
SPPB 2.0 (2.7) -12.2 (7.5) 0.045
RAND-36, physical function scale 18.9 (7.8) -6.2 (8.9) 0.151
CSPPS -0.4 (1.6) -6.5 (3.0) 0.108
Hand grip strength -6.5 (1.6) -17.7 (4.5) 0.006
SF-SMI
0.3 (0.5) -2.3 (1.0) 0.035
CRi-SMI -1.0 (1.1) -8.5 (2.6) 0.009
SPPB = Short Physical Performance Battery (0–12), BMI = Body Mass Index, CSPPS =
Continuous Summary Physical Performance Scores (0-100), SF-SMI = Single Frequency
Skeletal Muscle Index, CRi-SMI = Calf Intracellular Resistance Skeletal Muscle Index.
ACCEPTED MANUSCRIPT

ACCEP
TED M
ANUSC
RIPT
25
Table 4. Percentage changes in physical functioning, physical performance and bioimpedance
measures and probability for four-year survival
Change in Risk 95% Confidence Intervals P-value
Body Mass Index 0.95 0.89 – 1.02 0.174
RAND-36, physical function scale 0.995 0.989 - 1.002 0.166
SPPB 0.99 0.98 – 1.01 0.121
Hand grip strength 0.98 0.97 – 0.99 0.037
SF-SMI 0.96 0.91 – 1.01 0.099
CRi-SMI 0.96 0.96 – 0.99 0.010
Data adjusted for age, gender, and comorbidity. SF-SMI = Single Frequency Skeletal Muscle Index.
CRi-SMI = Calf Intracellular Resistance Skeletal Muscle Index.
ACCEPTED MANUSCRIPT

ACCEP
TED M
ANUSC
RIPT
26
Highlights:
-We tested the prognostic significance of various characteristics and measurements of sarcopenia in a
four-year follow-up of a randomized treatment trial.
-Physical functioning, physical performance including gait speed, hand grip strength, and Calf
Intracellular Skeletal Index as a muscle mass surrogate were independent mortality risk indicators in a
dose-dependent fashion.
- Among older people at risk of or with sarcopenia, the Calf Intracellular Skeletal Index based on
bioimpedance spectroscopy was a superior mortality risk indicator compared to Body Mass Index and
muscle mass measured using bioimpedance analysis.
- Muscle mass, muscle strength and physical performance are all suitable targets for the prevention of
sarcopenia-related over-mortality.
ACCEPTED MANUSCRIPT

Figure 1