The sun is no fun without rain: Physical environments ...
45
1 The sun is no fun without rain: Physical environments affect how we feel about yellow across 55 countries Jonauskaite, Domicele 1 Abdel-Khalek, Ahmed 2 Abu-Akel, Ahmad 1 (in Arabic: ﺍﺣﻤﺪ ﺍﺑﻮﻋﻘﻞ) Al-Rasheed, Abdulrahman Saud 3 Antonietti, Jean-Philippe 1 Ásgeirsson, Árni Gunnar 4,5 Atitsogbe, Kokou Amenyona 1 Barma, Marodégueba 6 Barratt, Daniel 7 Bogushevskaya, Victoria 8 Bouayed Meziane, Maliha Khadidja 9 Chamseddine, Amer 10 Charernboom, Thammanard 11 Chkonia, Eka 12 Ciobanu, Teofil 1 Corona, Violeta 13,14 Creed, Allison 15 (in Chinese: 艾莉森 克里德) Dael, Nele 1,16 Daouk, Hassan 17 Dimitrova, Nevena 18 Doorenbos, Cornelis B. 19 Fomins, Sergejs 20 Fonseca-Pedrero, Eduardo 21 Gaspar, Augusta 22,23, 24
Transcript of The sun is no fun without rain: Physical environments ...
1
The sun is no fun without rain: Physical environments affect how we feel about yellow across 55 countries
Jonauskaite, Domicele 1
Abdel-Khalek, Ahmed 2
Abu-Akel, Ahmad 1 (in Arabic: عقل ابو احمد)
Al-Rasheed, Abdulrahman Saud 3
Antonietti, Jean-Philippe 1
Ásgeirsson, Árni Gunnar 4,5
Atitsogbe, Kokou Amenyona 1
Barma, Marodégueba 6
Barratt, Daniel 7
Bogushevskaya, Victoria 8
Bouayed Meziane, Maliha Khadidja 9
Chamseddine, Amer 10
Charernboom, Thammanard 11
Chkonia, Eka 12
Ciobanu, Teofil 1
Corona, Violeta 13,14
Creed, Allison 15 (in Chinese: 艾莉森 克里德)
Dael, Nele 1,16
Daouk, Hassan 17
Dimitrova, Nevena 18
Doorenbos, Cornelis B. 19
Fomins, Sergejs 20
Fonseca-Pedrero, Eduardo 21
Gaspar, Augusta 22,23, 24
2
Gizdic, Alena 25
Griber, Yulia A. 26
Grimshaw, Gina 27
Hasan, Aya Ahmed 2
Havelka, Jelena 28
Hirnstein, Marco 29
Karlsson, Bodil S. A. 30
Kim, Jejoong 31
Konstantinou, Nikos 32
Laurent, Eric 33, 34
Lindeman, Marjaana 35
Manav, Banu 36
Marquardt, Lynn 29
Mefoh, Philip 37
Mroczko-Wąsowicz, Aleksandra 38
Mutandwa, Phillip 39
Muthusi, Steve 40, 41
Ngabolo, Georgette 42
Oberfeld, Daniel 43
Papadatou-Pastou, Marietta 44 (in Greek: Μαριέττα Παπαδάτου-Παστού)
Perchtold, Corinna M. 45
Pérez-Albéniz, Alicia 21
Pouyan, Niloufar 1
Rashid Soron, Tanjir 46
Roinishvili, Maya 47
3
Romanyuk, Lyudmyla 48,49,50
Salgado Montejo, Alejandro 51,52,53
Sultanova, Aygun 54
Tau, Ramiro 55,56
Uusküla, Mari 57
Vainio, Suvi 58
Vargas-Soto, Veronica 59
Volkan, Eliz 60
Wąsowicz, Grażyna 61
Zdravković, Sunčica 62, 63
Zhang, Meng 64 (in Chinese: 张萌)
Mohr, Christine 1
Affiliations:
Corresponding author: Domicele Jonauskaite, Institute of Psychology, University of Lausanne, Quartier Mouline, Bâtiment Géopolis, CH-1015, Lausanne, Switzerland. [email protected]
1 Institute of Psychology, University of Lausanne, Lausanne, Switzerland
2 Department of Psychology, Faculty of Arts, Alexandria University, Egypt
3 Department of Psychology, University of King Saud, Riyadh, Saudi Arabia
4 Department of Psychology, University of Akureyri, Akureyri, Iceland
5 Centre for Cognitive Neuroscience, Aalborg University, Aalborg, Denmark
6 Department of Applied Psychology, University of Lomé, Lomé, Togo
7 Department of Management, Society and Communication, Copenhagen Business School, Copenhagen, Denmark
8 Department of Linguistic Sciences and Foreign Literatures, Catholic University of the Sacred Heart, Brescia, Italy
4
9 Preparatory School, National Polytechnic School, Algiers, Algeria
10 School of Computer and Communication Sciences, Swiss Federal Institute of Technology Lausanne, Lausanne, Switzerland
11 Department of Clinical Epidemiology and Department of Psychiatry, Faculty of Medicine, Thammasat University, Pathumthani, Thailand
12 Department of Psychiatry, Tbilisi State Medical University, Tbilisi, Georgia
13 Business Management Department, Universidad Panamericana, Mexico City, Mexico.
14 Business Management Department, Universitat Politècnica de València, Camino de Vera s/n., 46022, Valencia, Spain
15 Faculty of Arts, University of Melbourne, Melbourne, Australia
16 Department of Organizational Behavior, HEC Lausanne, University of Lausanne, Lausanne, Switzerland
17 Mar Elias street, Dar Elbayda building, Bayrut, Lebanon
18 Department of Social Work, HES-SO Ecole d'Etudes Sociales et Pédagogiques, Lausanne, Switzerland
19 Department of Physics, University of Fribourg, Fribourg, Switzerland
20 Department of Optometry and Vision Science, University of Latvia, Riga, Latvia
21 Department of Educational Sciences, University of La Rioja, Logroño, Spain
22 Department of Psychology, School of Human Sciences, Catholic University of Portugal, Lisbon, Portugal
23 Catolica Research Centre for Psychological, Family and Social Wellbeing (CRC-W), Lisboa, Portugal
24 Centro de Investigação e Intervenção Social, CIS-IUL, Lisboa, Portugal
25 Department of Clinical and Health Psychology, Universitat Autònoma de Barcelona (UAB), Barcelona, Spain
26 Department of Sociology and Philosophy, Smolensk State University, Smolensk, Russia
27 School of Psychology, Victoria University of Wellington, Wellington, New Zealand
28 School of Psychology, University of Leeds, Leeds, UK
29 Department of Biological and Medical Psychology, University of Bergen, Bergen, Norway
30 Institution of Psychology, University of Gothenburg, Gothenburg, Sweden
5
31 Department of Psychology, Duksung Women's University, Seoul, South Korea
32 Department of Rehabilitation Sciences, Cyprus University of Technology, Limassol, Cyprus
33 Laboratory of Psychology, Bourgogne Franche–Comté University, Besançon, France
34 Maison des Sciences de l'Homme et de l'Environnement, CNRS & University of Franche-Comté, Besançon, France
35 Department of Psychology and Logopedics, University of Helsinki, Helsinki, Finland
36 Department of Interior Architecture and Environmental Design, Faculty of Art Design and Architecture, Istanbul Ayvansaray University, Istanbul, Turkey
37 Department of Psychology, University of Nigeria, Nsukka, Nigeria
38 Institute of Philosophy of Mind and Cognition, National Yang-Ming University, Taipei, Taiwan
39 Department of Student Affairs, Midlands State University, Gweru, Zimbabwe
40 Department of Psychology, University of Nairobi, Nairobi, Kenya
41 Institut für Psychologie, Humboldt-Universität zu Berlin, Berlin, Germany
42 Département de Psychologie, Université Omar-Bongo, Libreville, Gabon
43 Institute of Psychology, Johannes Gutenberg-Universitaet Mainz, Germany
44 School of Education, National and Kapodistrian University of Athens, Athens, Greece
45 Department of Psychology, University of Graz, Graz, Austria
46 Telepsychiatry Research and Innovation Network, Dhaka, Bangladesh
47 Laboratory of Vision Physiology, I. Beritashvili Center of Experimental Biomedicine, Tbilisi, Georgia
48 Faculty of Psychology, Taras Shevchenko National University of Kyiv, Kyiv, Ukraine
49 Department of Psychology, V.I. Vernadsky National University of Taurida, Kyiv, Ukraine
50 Department of Psychology, Kyiv National University of Culture and Arts, Kyiv, Ukraine
51 Escuela Internacional de Ciencias Económicas y Administrativas, Universidad de La Sabana, Chía, Colombia
52 Center for Multisensory Marketing, BI Norwegian Business School, Oslo, Norway
53 Neurosketch, Bogotá, Colombia
6
54 National Mental Health Centre of the Ministry of Health, Baku, Azerbaijan
55 Faculty of Psychology and Educational Sciences, University of Geneva, Geneva, Switzerland
56 Institute of Psychology and Education, University of Neuchâtel, Neuchâtel, Switzerland
57 School of Humanities, Tallinn University, Tallinn, Estonia
58 Faculty of Social Sciences, University of Helsinki, Helsinki, Finland
59 Facultad de Psychology, Universidad de Lima, Lima, Perú
60 Department of Psychology, Cyprus International University, Nicosia, Cyprus
61 Department of Economic Psychology, Koźmiński University, Warsaw, Poland
62 Department of Psychology, Faculty of Philosophy, University of Novi Sad, Serbia
63 Laboratory for Experimental Psychology, University of Belgrade, Serbia
64 Department of Psychology and Behavioral Sciences, Zhejiang University, Hangzhou Shi, Zhejiang Sheng, China
Authors’ contributions:
Conceptualisation: DJ, CM
Formal analysis: DJ, JPA, CBD
Funding acquisition: DJ, NDa, CM
Investigation: DJ, AAK, AAA, ASAR, ÁGÁ, KAA, MB, DB, VB, MKBM, ACh, TCh, EC, TCi, VC, ACr, NDa, HD, NDi, CBD, SF, EFP, AGa, AGi, YAG, GG, AAH, JH, MH, BSAK, JK, NK, EL, ML, BM, LM, PMe, AMW, PMu, SM, GN, DO, MPP, CMP, APAI, NP, TRS, MR, LR, ASM, AS, RT, MU, SV, VV, EV, GW, SZ, MZ, CM
Methodology: DJ, CM
Supervision: CM
Visualization: DJ
Writing – original draft: DJ, CM
Writing – review & editing: DJ, AAK, AAA, ASAR, JPA, ÁGÁ, KAA, MB, DB, VB, MKBM, ACh, TCh, EC, TCi, VC, ACr, NDa, HD, NDi, CBD, SF, EFP, AGa, AGi, YAG, GG, AAH, JH, MH, BSAK, JK, NK, EL, ML, BM, LM, PMe, AMW, PMu, SM, GN, DO, MPP, CMP, APAI, NP, TRS, MR, LR, ASM, AS, RT, MU, SV, VV, EV, GW, SZ, MZ, CM
7
Acknowledgements: This research was supported by the Swiss National Science Foundation, providing a Doc.CH fellowship grant to DJ (P0LAP1_175055) and a project funding grant to CM & NDa (100014_182138). MH was supported by a research grant from the Bergen Research Foundation (BFS2016REK03). YG was supported by the Russian Foundation for Basic Research (17‐29‐09145). The initiation of this research was possible through the support of AkzoNobel, Imperial Chemical Industries (ICI) Limited, and in particular David Elliott and Tom Curwen, Color R&I team, Slough, UK, and Stephanie Kraneveld, Sassenheim, the Netherlands. We would like to further thank all the people who have contributed to the translation of the survey or to data collection, but have not provided further contributions: Chaman Afrooz Chowdhury (Bengali), Gumru Ahmadova (Azerbaijani), Felipe Andrade (Portuguese), Archil Begiashvili (Georgian), Gildas Bika (Gabon), Oh-Hyeon Choung (Korean), Yishin Chuang (Traditional Chinese), Emilija Emma (Lithuanian), Agnieszka Gawda (Polish), Stephanie Hong (Korean), Aydan Ismayilova (Azerbaijani), Jamila Ismayilova (Azerbaijani), Aurika Jonauskienė (Lithuanian), Vita Kalnberziņa (Latvian), Bruno Kemm (Spanish & Portuguese), Richard Klein (French), Árni Kristjánsson (Icelandic), Gunta Krūmiņa (Latvian), Junghee Lee (Korean), Tiraya Lerthattasilp (Thai), Abraham Lim Ken Zhi (Traditional Chinese), Arnt Lykke Jakobsen (Danish), Sarah Malekolkalami (Persian), Lucian Marin (Romanian), Riina Martinson (Estonian), Marilena Syrimi (Cyprus), Jung Min Shin (Korean), Tanisha Momtaz (Bengali), Galina Paramei (Russian), Mushfiqur Rahman (Bengali), Anchalita Ratanajaruraks (Thai), Angela Rowe (Spanish), Juliet Rowe (Spanish), Haerin Shin (Korean), Kristian Tangsgaard Hvelplund (Danish), Angeliki Theodoridou (Greek), Evelina Thunell (Swedish), Alessandro Tremea (Italian), Laura Winther Balling (Danish), Ji Won Hur (Korean), Yaffa Yeshurun (Hebrew), and Sólveig Þorsteinsdóttir (Icelandic). Finally, we would like to thank all the participants.
Environment and yellow-joy associations cross-culturally
1
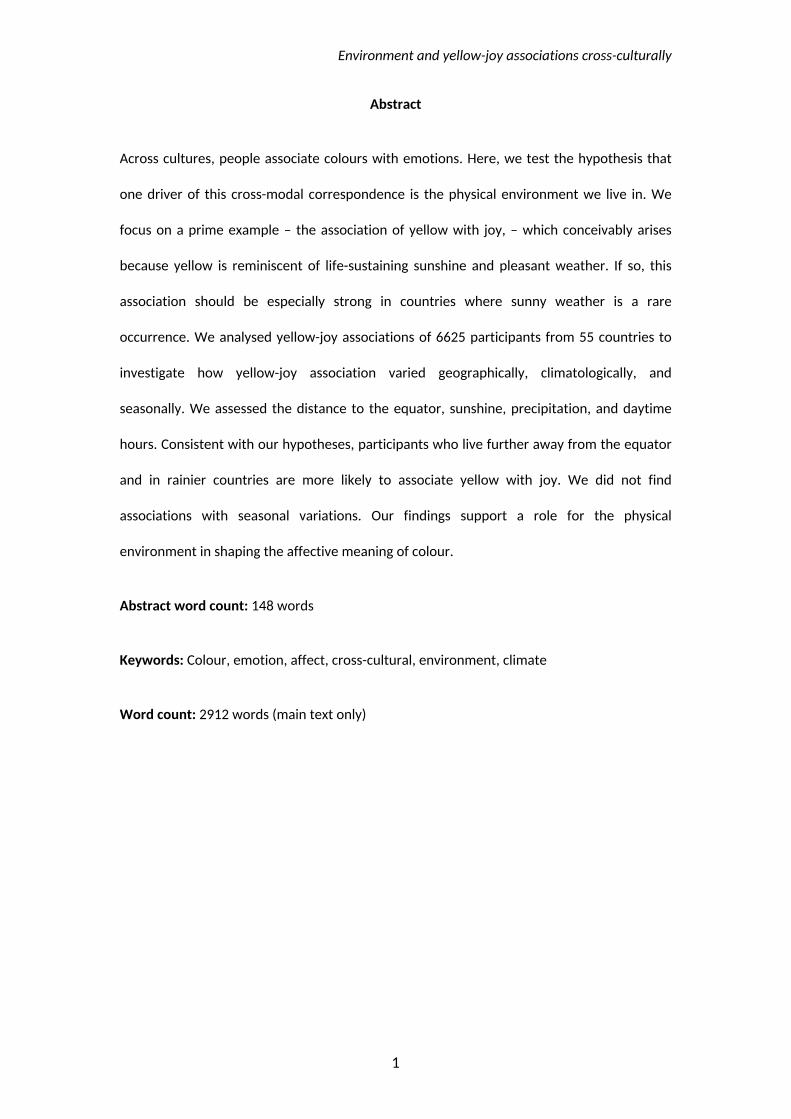
Abstract
Across cultures, people associate colours with emotions. Here, we test the hypothesis that
one driver of this cross-modal correspondence is the physical environment we live in. We
focus on a prime example – the association of yellow with joy, – which conceivably arises
because yellow is reminiscent of life-sustaining sunshine and pleasant weather. If so, this
association should be especially strong in countries where sunny weather is a rare
occurrence. We analysed yellow-joy associations of 6625 participants from 55 countries to
investigate how yellow-joy association varied geographically, climatologically, and
seasonally. We assessed the distance to the equator, sunshine, precipitation, and daytime
hours. Consistent with our hypotheses, participants who live further away from the equator
and in rainier countries are more likely to associate yellow with joy. We did not find
associations with seasonal variations. Our findings support a role for the physical
environment in shaping the affective meaning of colour.
Abstract word count: 148 words
Keywords: Colour, emotion, affect, cross-cultural, environment, climate
Word count: 2912 words (main text only)
Environment and yellow-joy associations cross-culturally
2
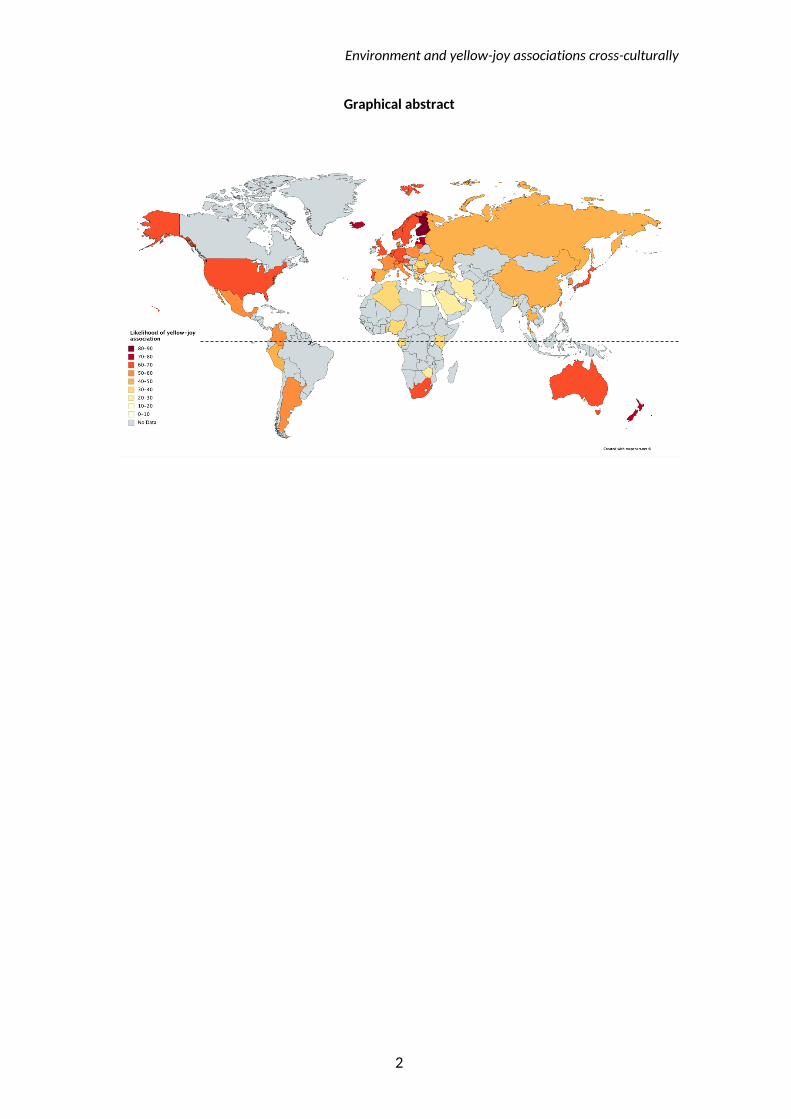
Graphical abstract
Environment and yellow-joy associations cross-culturally
3
Highlights
Yellow is associated with joy across the world.
This association might originate from yellow reminding of sun and warmth.
We analysed yellow-joy associations collected in 55 countries.
Yellow is more joyful in colder and rainier countries.
This joyfulness seems stable; it was independent of the current season.
Environment and yellow-joy associations cross-culturally
4
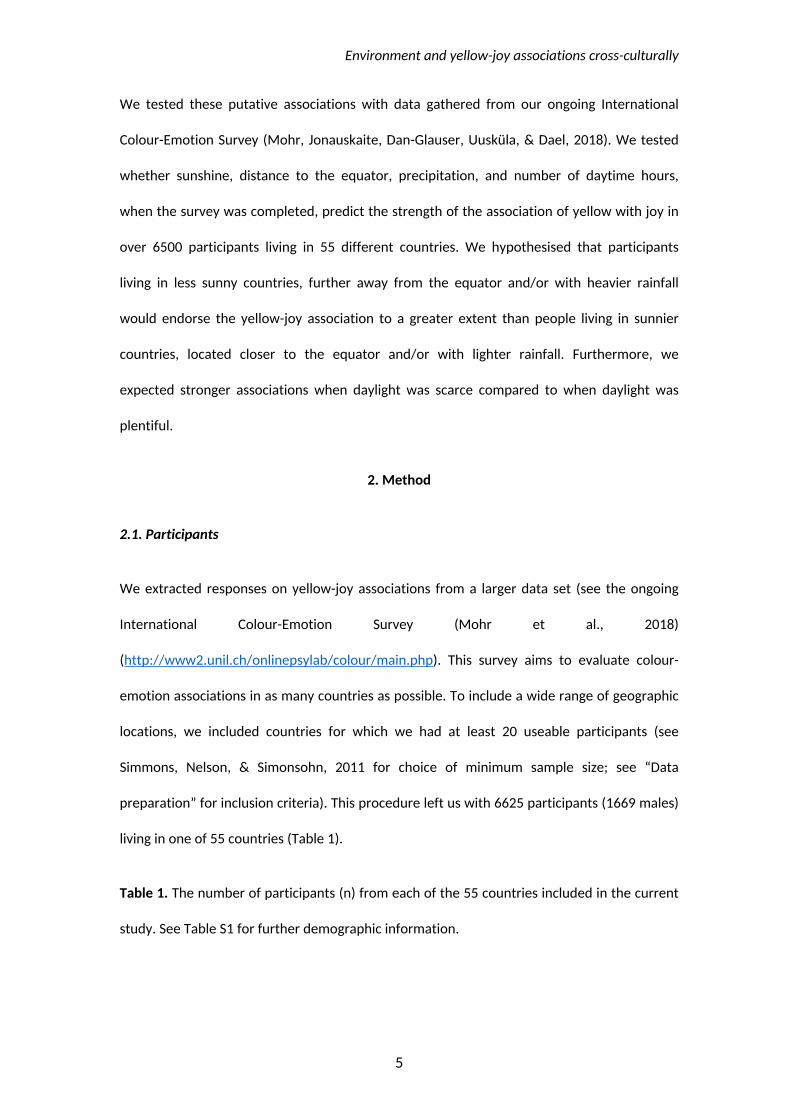
1. Introduction
Across cultures, people associate colours with emotions (Adams & Osgood, 1973). Although
these associations are commonly attributed to cultural or linguistic factors, they also may
arise from the co-occurrence of colours and emotions in our physical environments. If so,
variations in environmental conditions should predict variations in colour-emotion
associations. To test this hypothesis, we focus here on the colour yellow, which is commonly,
although not exclusively, associated with joy (Burkitt & Sheppard, 2014; Dael, Perseguers,
Marchand, Antonietti, & Mohr, 2015; Jonauskaite, Althaus, Dael, Dan-Glauser, & Mohr, 2019;
Kaya & Epps, 2004; Lindborg & Friberg, 2015; Sutton & Altarriba, 2016). This affective
association might originate from saturated yellow co-occurring with positive climatological
experiences like sunshine (Griber, Mylonas, & Paramei, 2018; Palmer & Schloss, 2010) and
warmth (Ou, Luo, Woodcock, & Wright, 2004).
Sunshine, and pleasant weather more generally, have been related to better mood in French
and American participants (Guéguen, 2013; Keller et al., 2005). However, since research is
primarily focused on individuals from Western countries (Henrich, Heine, & Norenzayan,
2010), this positive evaluation of sunshine might not hold globally. Rather, the association of
joy with sunshine might be further modulated by warmth and rainfall. Sunshine, warmth, and
sufficient rain are necessities for life and growth whereas sunshine alone might lead to
drought and death. Thus, people in the Sahara Desert, where yellow is the colour of sand and
the burning sun, might rate yellow as less joyful than Norwegians. Joyfulness of yellow might
be further reduced when daylight is plentiful (i.e., midsummer) compared to when daylight is
scarce (i.e., midwinter). Hence, geographic, climatological, and seasonal factors may
modulate one’s affective associations with yellow.
Environment and yellow-joy associations cross-culturally
5
We tested these putative associations with data gathered from our ongoing International
Colour-Emotion Survey (Mohr, Jonauskaite, Dan-Glauser, Uusküla, & Dael, 2018). We tested
whether sunshine, distance to the equator, precipitation, and number of daytime hours,
when the survey was completed, predict the strength of the association of yellow with joy in
over 6500 participants living in 55 different countries. We hypothesised that participants
living in less sunny countries, further away from the equator and/or with heavier rainfall
would endorse the yellow-joy association to a greater extent than people living in sunnier
countries, located closer to the equator and/or with lighter rainfall. Furthermore, we
expected stronger associations when daylight was scarce compared to when daylight was
plentiful.
2. Method
2.1. Participants
We extracted responses on yellow-joy associations from a larger data set (see the ongoing
International Colour-Emotion Survey (Mohr et al., 2018)
(http://www2.unil.ch/onlinepsylab/colour/main.php). This survey aims to evaluate colour-
emotion associations in as many countries as possible. To include a wide range of geographic
locations, we included countries for which we had at least 20 useable participants (see
Simmons, Nelson, & Simonsohn, 2011 for choice of minimum sample size; see “Data
preparation” for inclusion criteria). This procedure left us with 6625 participants (1669 males)
living in one of 55 countries (Table 1).
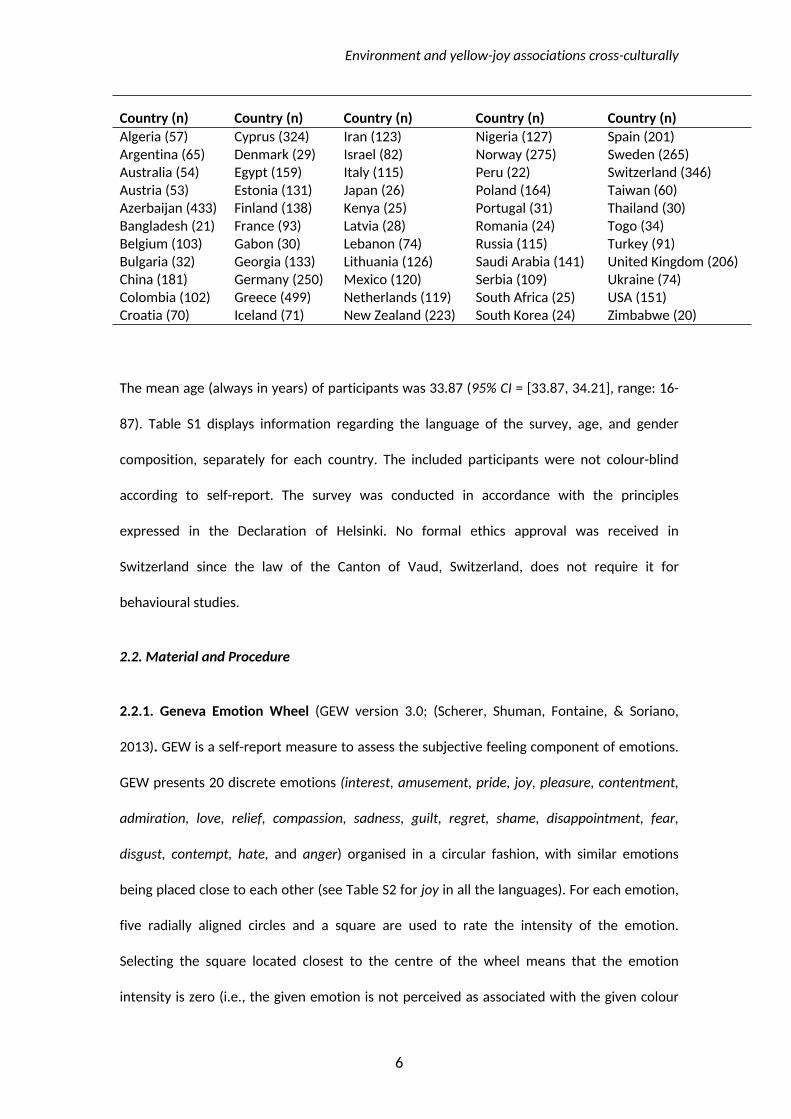
Table 1. The number of participants (n) from each of the 55 countries included in the current
study. See Table S1 for further demographic information.
Environment and yellow-joy associations cross-culturally
6
Country (n) Country (n) Country (n) Country (n) Country (n)Algeria (57) Cyprus (324) Iran (123) Nigeria (127) Spain (201)Argentina (65) Denmark (29) Israel (82) Norway (275) Sweden (265)Australia (54) Egypt (159) Italy (115) Peru (22) Switzerland (346)Austria (53) Estonia (131) Japan (26) Poland (164) Taiwan (60)Azerbaijan (433) Finland (138) Kenya (25) Portugal (31) Thailand (30)Bangladesh (21) France (93) Latvia (28) Romania (24) Togo (34)Belgium (103) Gabon (30) Lebanon (74) Russia (115) Turkey (91)Bulgaria (32) Georgia (133) Lithuania (126) Saudi Arabia (141) United Kingdom (206)China (181) Germany (250) Mexico (120) Serbia (109) Ukraine (74)Colombia (102) Greece (499) Netherlands (119) South Africa (25) USA (151)Croatia (70) Iceland (71) New Zealand (223) South Korea (24) Zimbabwe (20)
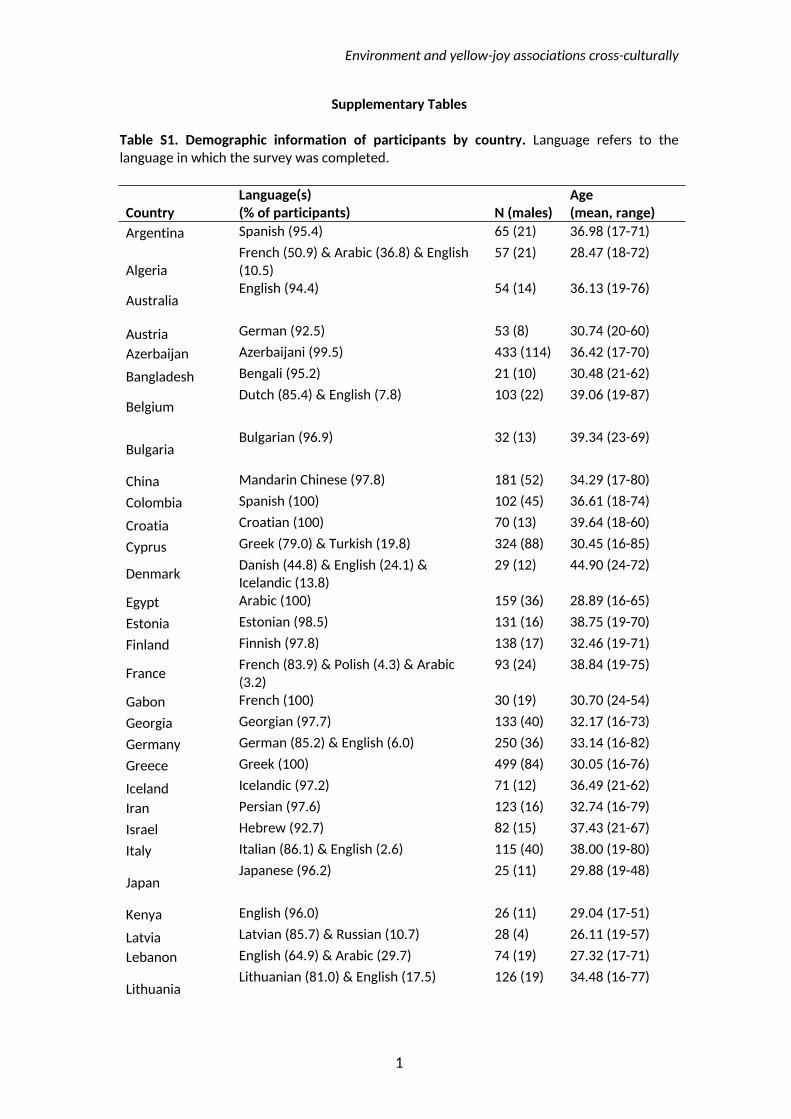
The mean age (always in years) of participants was 33.87 (95% CI = [33.87, 34.21], range: 16-
87). Table S1 displays information regarding the language of the survey, age, and gender
composition, separately for each country. The included participants were not colour-blind
according to self-report. The survey was conducted in accordance with the principles
expressed in the Declaration of Helsinki. No formal ethics approval was received in
Switzerland since the law of the Canton of Vaud, Switzerland, does not require it for
behavioural studies.
2.2. Material and Procedure
2.2.1. Geneva Emotion Wheel (GEW version 3.0; (Scherer, Shuman, Fontaine, & Soriano,
2013). GEW is a self-report measure to assess the subjective feeling component of emotions.
GEW presents 20 discrete emotions (interest, amusement, pride, joy, pleasure, contentment,
admiration, love, relief, compassion, sadness, guilt, regret, shame, disappointment, fear,
disgust, contempt, hate, and anger) organised in a circular fashion, with similar emotions
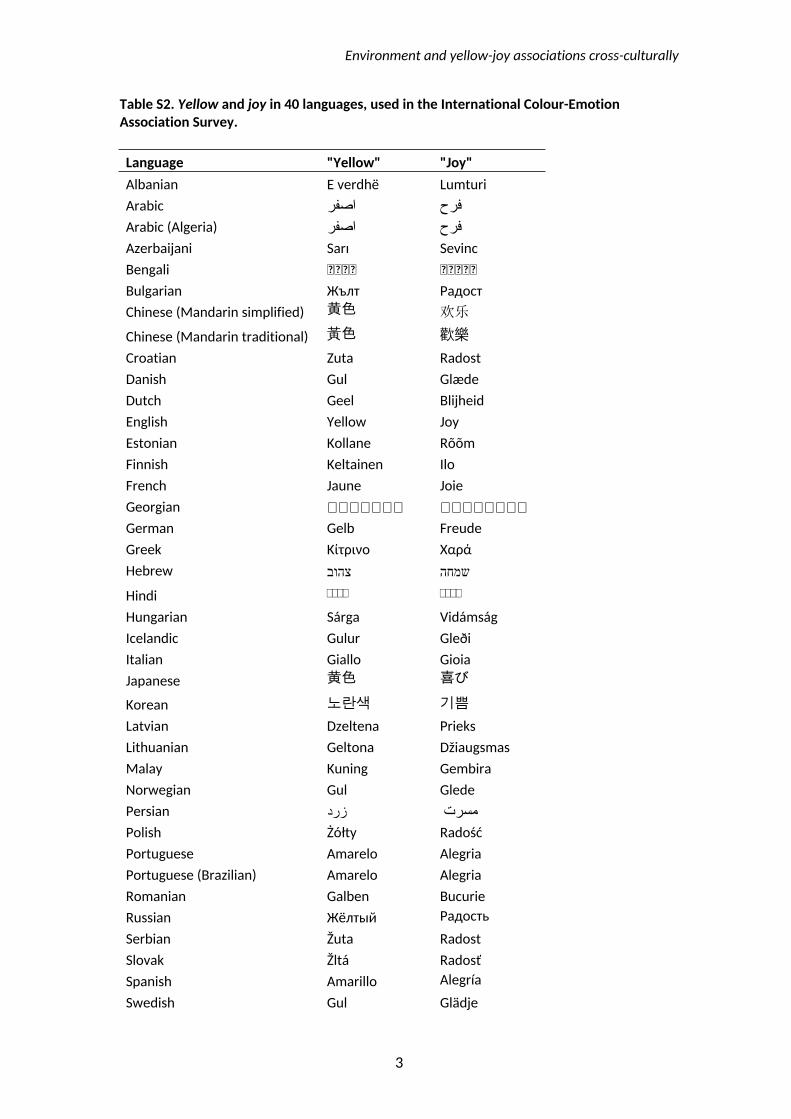
being placed close to each other (see Table S2 for joy in all the languages). For each emotion,
five radially aligned circles and a square are used to rate the intensity of the emotion.
Selecting the square located closest to the centre of the wheel means that the emotion
intensity is zero (i.e., the given emotion is not perceived as associated with the given colour
Environment and yellow-joy associations cross-culturally
7
term). Selecting one of the five circles of increasing size means that the emotion is perceived
as being associated with the colour term; the larger the selected circle, the more intense the
emotion. Thus, a six-point ordinal rating scale (0-5) was used, with the lowest scale category
representing the absence of a colour-emotion association.
2.2.2. International Colour-Emotion Association Survey
(http://www2.unil.ch/onlinepsylab/colour/main.php). The co-authors and collaborators were
responsible for data collection in their respective countries. Participants were invited to
complete the survey online, in their native language. Here, they were included regardless of
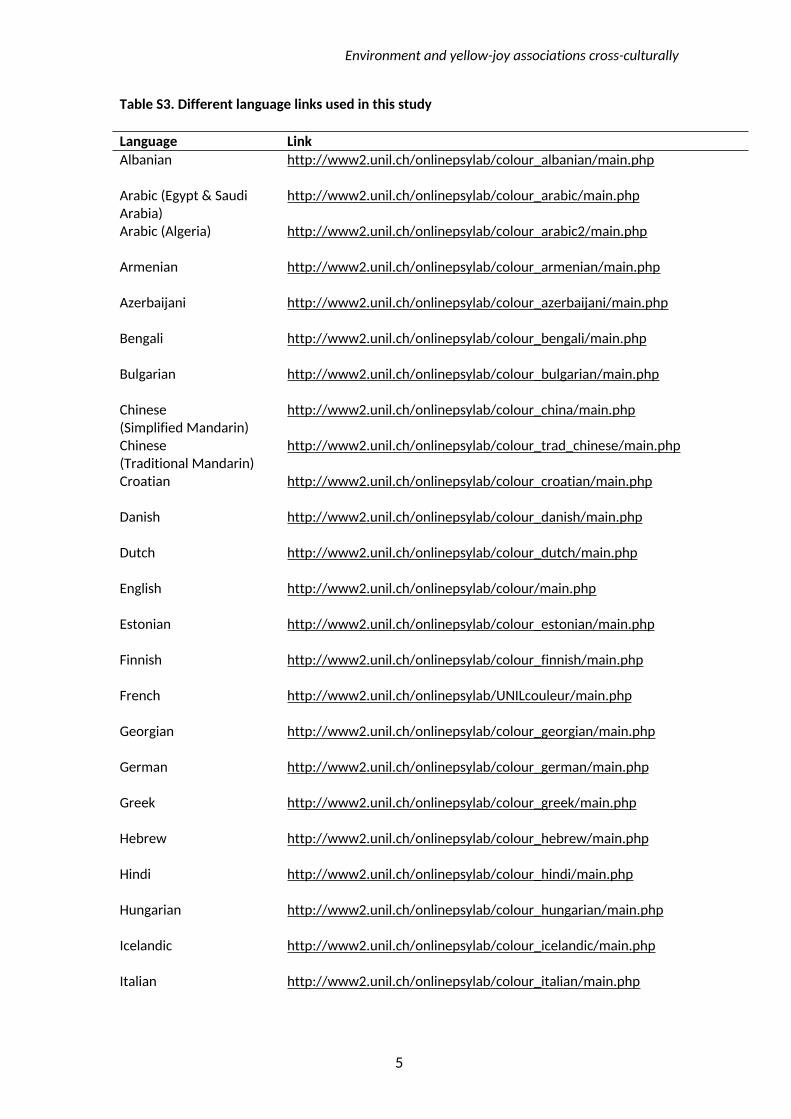
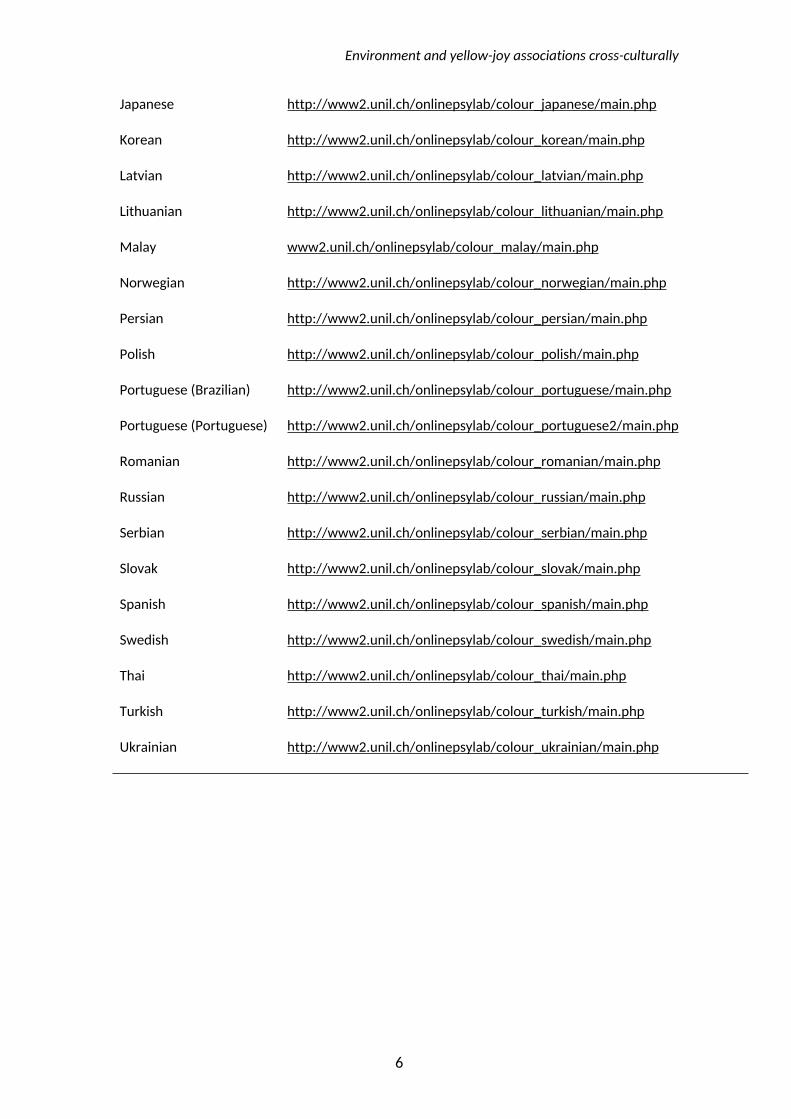
which language they chose (see “Data preparation”). We facilitated local data collection by
using links that directly opened in the target language (see Table S3). At the time of data
extraction (February 2019), our survey was available in 40 different languages. Native
speakers, many of whom co-author this article, had translated the survey and the GEW
emotion terms into their respective languages (see complete list of translators in the
Acknowledgments section). Bilingual speakers back-translated the emotion terms to ensure
compatibility between languages.
The survey started by stating its main goal, providing ethical information (i.e., participation is
anonymous and strictly confidential, responses are to be used for research purposes and its
dissemination, participants can stop the survey at any time with no consequences) and
collecting informed consent – participants knowingly consented by clicking on the “Let’s go”
button. The next two pages explained the task and how to use the GEW. To ensure that
participants had understood the task, they performed a practice trial for “beige”, a colour
term not used in the actual survey. Participants had to correct the choices made by Peter, a
fictional character. Once corrected, participants could continue to the experiment, in which
they associated emotions with 12 colour terms (red, orange, yellow, green, blue, turquoise,
purple, pink, brown, black, grey, and white; see Table S2 for yellow in all the languages) and
Environment and yellow-joy associations cross-culturally
8
evaluated emotion intensities. The colour terms were presented above the GEW display, and
colour order was randomised. Participants could select one, several, or none of the GEW
emotions. Participants rated the emotion intensities by clicking on the corresponding circle.
Colour terms were chosen instead of colour patches because accurate colour presentation
cannot be ensured when showing colour patches online.
After rating the 12 colour terms, participants reported age, gender, colour blindness (“Do you
have any trouble seeing certain colours?”), colour importance in their life, country of origin
and country of residence (“What is your country of residence? The most recent country you
have been living in for at least 2 years”), native language, and fluency of the language they
used to complete the colour-emotion survey. A “do not want to answer” option was available
for all questions. On the final page, participants were thanked and graphically presented with
the results from a previous, related study. Participants were further able to contact us via an
e-mail address. On average, our participants took 13.9 minutes to complete the survey.
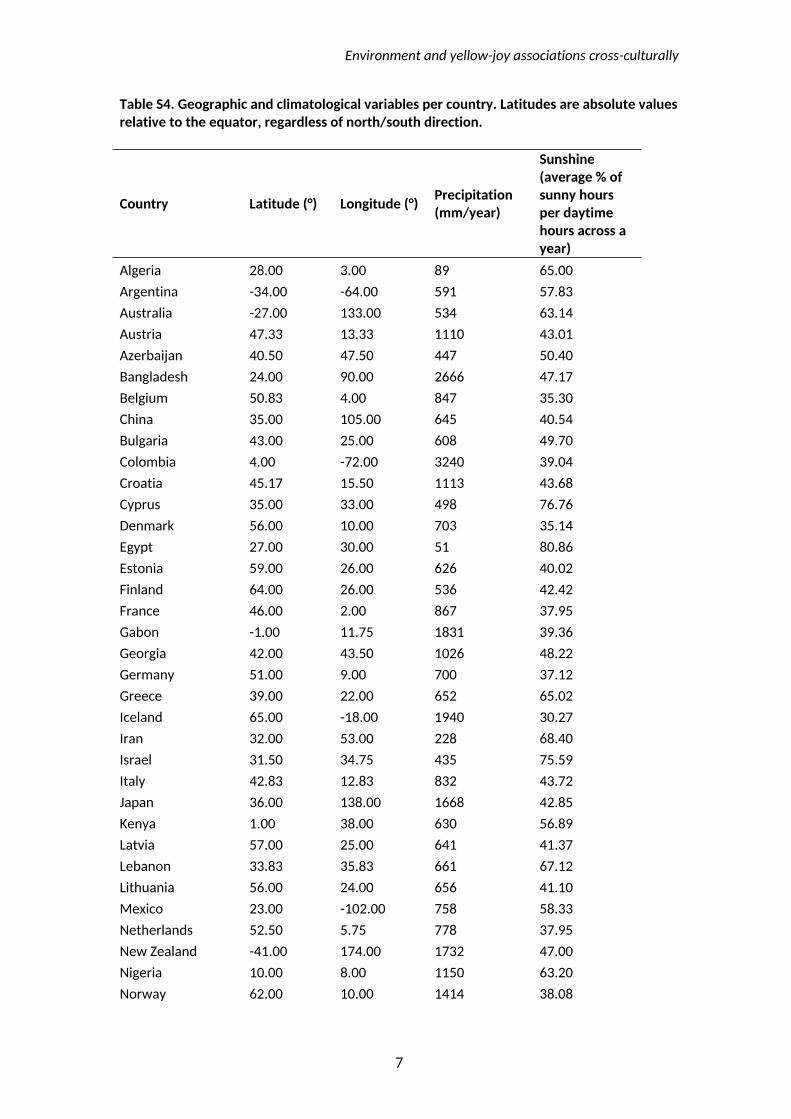
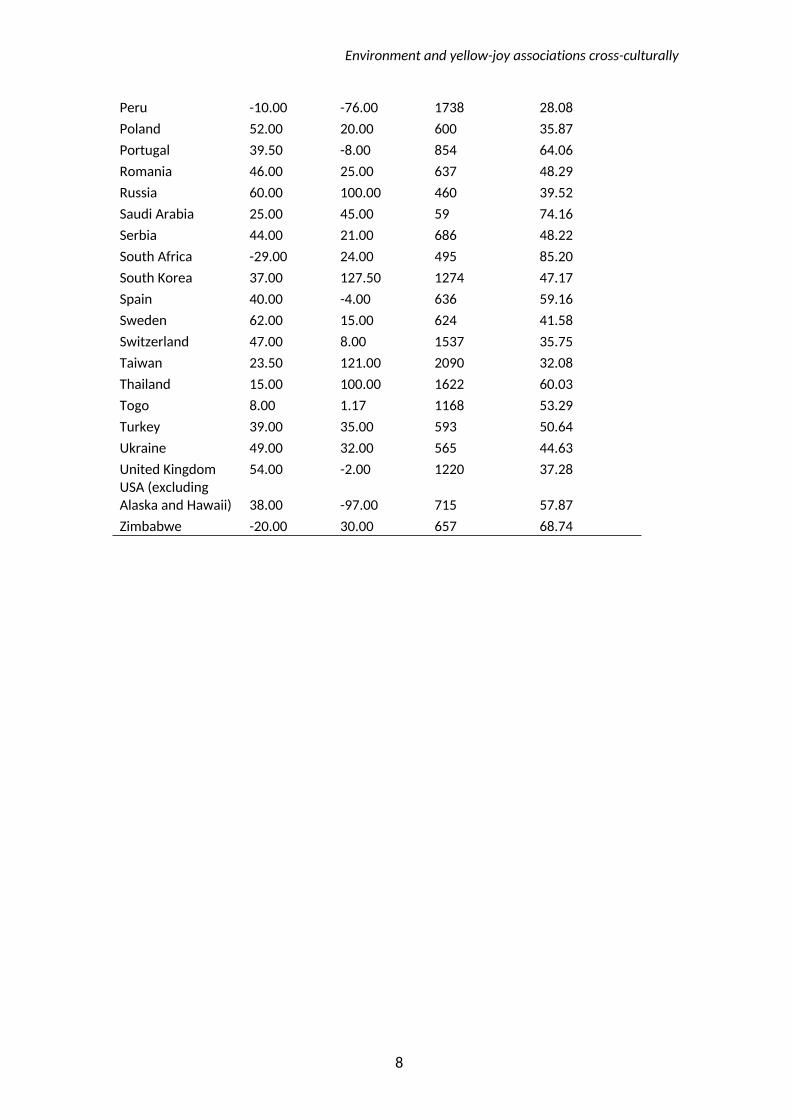
2.2.3. Geographic, climatological, and seasonal factors. We extracted three measures for
each country of residence. First, sunshine – percentage of sunny hours per year, calculated by
dividing the number of sunshine hours per year
(https://en.wikipedia.org/wiki/List_of_cities_by_sunshine_duration) by the total number of
daytime hours in a year (i.e., 12 h x 365 days = 4,380h). This number was then multiplied by
100. Second, absolute latitude – distance to the equator of each country (central point)
expressed in absolute latitude degrees (https://developers.google.com/public-
data/docs/canonical/countries_csv; we ignored the +/- sign). Higher absolute latitude degrees
indicate that a country is located further away from the equator and is colder. Third,
precipitation – annual precipitation levels measured as millimetres (mm) of rainfall per year
(https://data.worldbank.org/indicator/AG.LND.PRCP.MM). See Table S4 for data of each
country. This precipitation variable was chosen to complement the sunshine variable for two
Environment and yellow-joy associations cross-culturally
9
reasons. Firstly, few sunshine hours indicate more clouded hours, which may or may not be
accompanied by rain/snow. Second, precipitation provides information about the amount of
rainfall/snowfall that reached the ground. However, one could imagine situations when weak
rainfall lasts all day (i.e., low sunshine and low rainfall) or when heavy rainfall lasts for a short
period of time (i.e., high sunshine and high rainfall). Thus, we considered sunshine, latitude,
and precipitation as complementary predictor variables.
The sunshine, precipitation, and latitude measures were calculated per country and represent
values that were based on averages extracted from assessments over several years (sunshine
and precipitation). To account for individual, seasonal factors, we further calculated for each
participant the number of daytime hours on the day the participant completed the survey.
We defined daytime hours as the number of hours between the country-specific sunrise and
sunset time. To make the calculation, we took into account the day of the year when the
survey was completed and the latitude of participants’ country of residence (see
Supplementary Material for derivation and R code). A greater number of daytime hours occur
during local summer and fewer daytime hours during local winter, especially in countries
further away from the equator.
2.3. Data preparation
Our exclusion criteria are the same used before (e.g., Jonauskaite, Dael, et al., 2019). We
excluded participants who were too quick (i.e., took < 3 min to complete the main task) or too
slow (took > 90 min to complete the main task). We also excluded participants who seemed
not to engage with the task (i.e., spent < 20 seconds rating the first four colour terms). We did
not exclude participants even if they did not complete the survey in their indicated native
language, as long as their fluency of the survey language was sufficiently high (i.e., scored at
least 5 on 1-8 scale). This criterion allowed the inclusion of immigrants and accounted for
Environment and yellow-joy associations cross-culturally
10
native languages in formerly colonised countries (e.g., Swahili speakers in Kenya who
completed the survey in English). Finally, we excluded participants who had missing data on
the yellow-joy association (i.e., provided no association, not even 0). The dataset contained
the occasional missing data, because of technical problems when recording answers. See
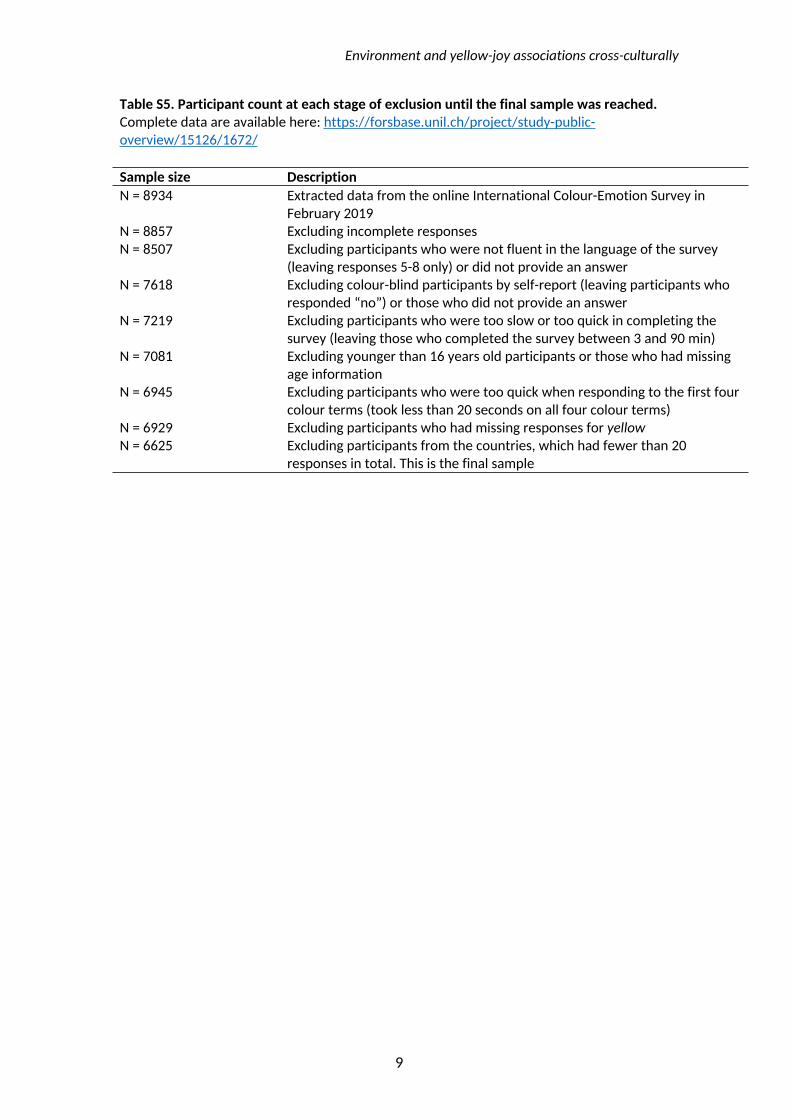
Table S5 for the count of excluded participants at each step of the data cleaning procedure.
Cleaned data are available here: https://forsbase.unil.ch/project/study-public-
overview/15126/1672/
2.4. Design and statistical analyses
All data were analysed and graphs were created using R (v. 3.4.0) statistical programming
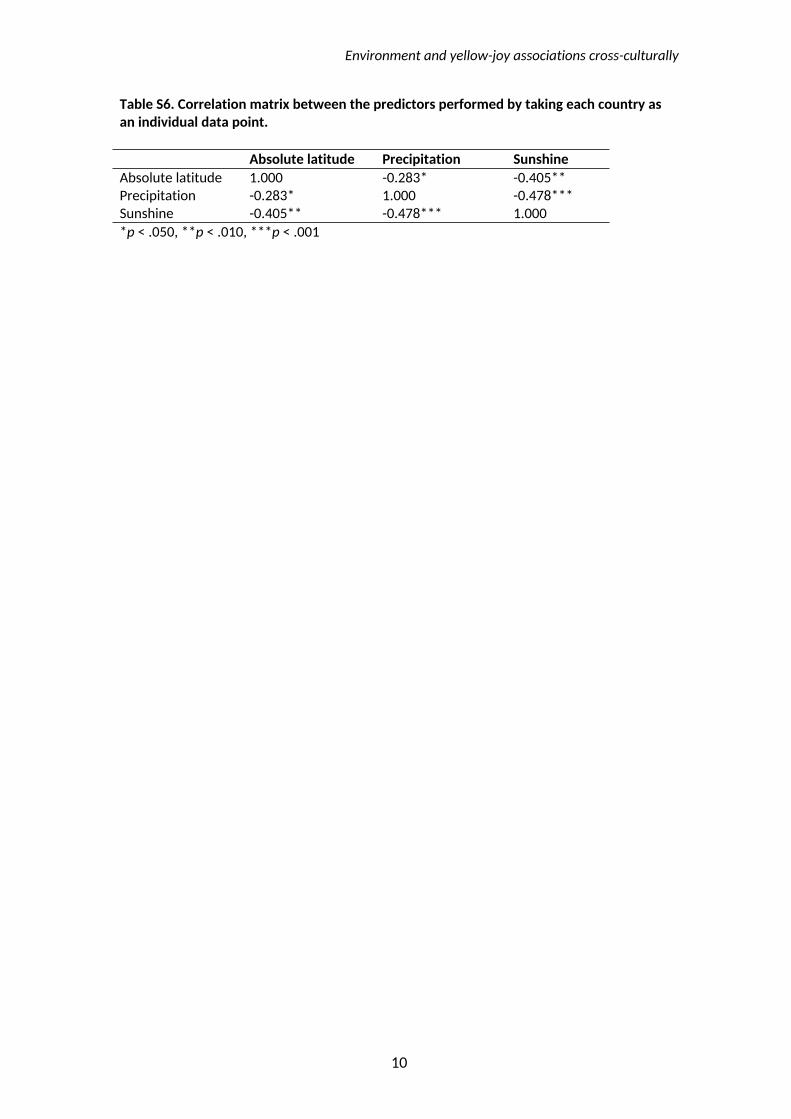
language. We started by assessing the correlations between the geographical and
climatological predictors. None of the predictors seemed redundant as shown by average
correlation coefficients (all |r| ≤ .478; Table S6). Also, the variance inflation factor in the
regression model was acceptable (VIF ≤ 2.35) indicating no issue of multicollinearity. Thus, we
kept all predictor variables to compute our models. These models were run on the intensity of
yellow-joy associations (scores of 0 to 5). For descriptive purposes, we also calculated the
percentage of participants associating yellow with joy (likelihood of association) by dividing
the number of participants who associated joy of any intensity (1-5) with yellow by the total
number of participants in each country and multiplying this outcome by 100%.
For the main analysis, we computed the hierarchical cumulative link mixed models with a
random effect via Laplace approximation (clmm function in R package ordinal; Christensen,
2018). This analysis is a hierarchical nested regression model for ordinal data. We estimated
the amount of explained variance in the intensity of yellow-joy associations (range of scores
from 0 to 5) by the geographical, climatological, and seasonal predictors. We chose a
hierarchical regression model to assess the explained variance of each predictor variable in
Environment and yellow-joy associations cross-culturally
11
order: from sunshine, which seemed an obvious variable according to our hypotheses, to
absolute latitude, precipitation, and, finally, daytime hours. We chose a cumulative link model
to account for the ordinal nature of the dependent variable (discrete responses measured on
a six-point ordinal scale from 0 to 5). We chose a mixed-effects model because geographical
and climatological variables varied by country and not by individual participants; therefore,
within country variance was of little interest here. Fixed effects were sunshine, absolute
latitude, precipitation, and daytime hours. Country was a random effect. To prevent
numerical issues in model estimations, we rescaled the precipitation variable by dividing all
precipitation values by 1000.
In block 0, we entered no predictors. In the next block (block 1; see Table 2), we added
sunshine. In the following blocks, we assessed, in this order, sunshine and latitude (block 2),
then sunshine, latitude, and precipitation (block 3), and finally sunshine, latitude,
precipitation, and daytime hours (block 4). We used likelihood ratio tests (R function anova),
because these tests sequentially compared every block to establish whether each new
predictor changed the amount of explained variance in the intensity of yellow-joy
associations. We determined the best model based on the significant change in the overall
goodness-of-fit of the model as well as based on the Akaike Information Criterion (AIC),
where lower values indicate a better fit.
3. Results
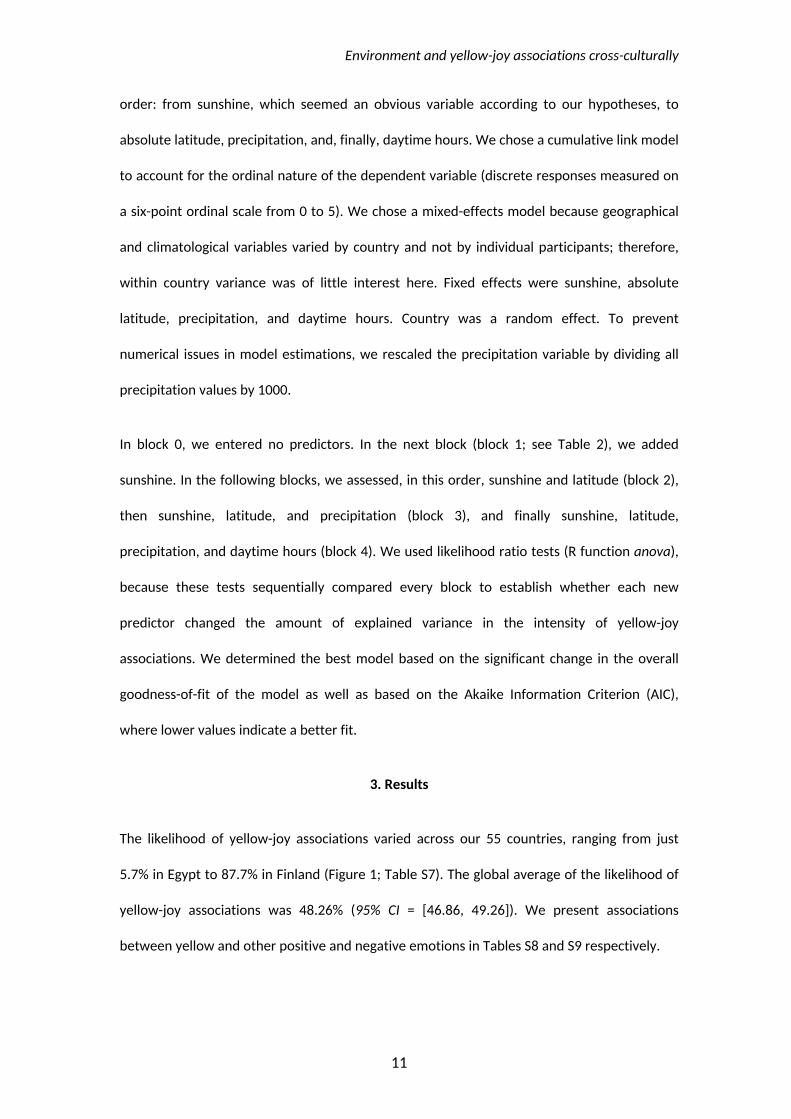
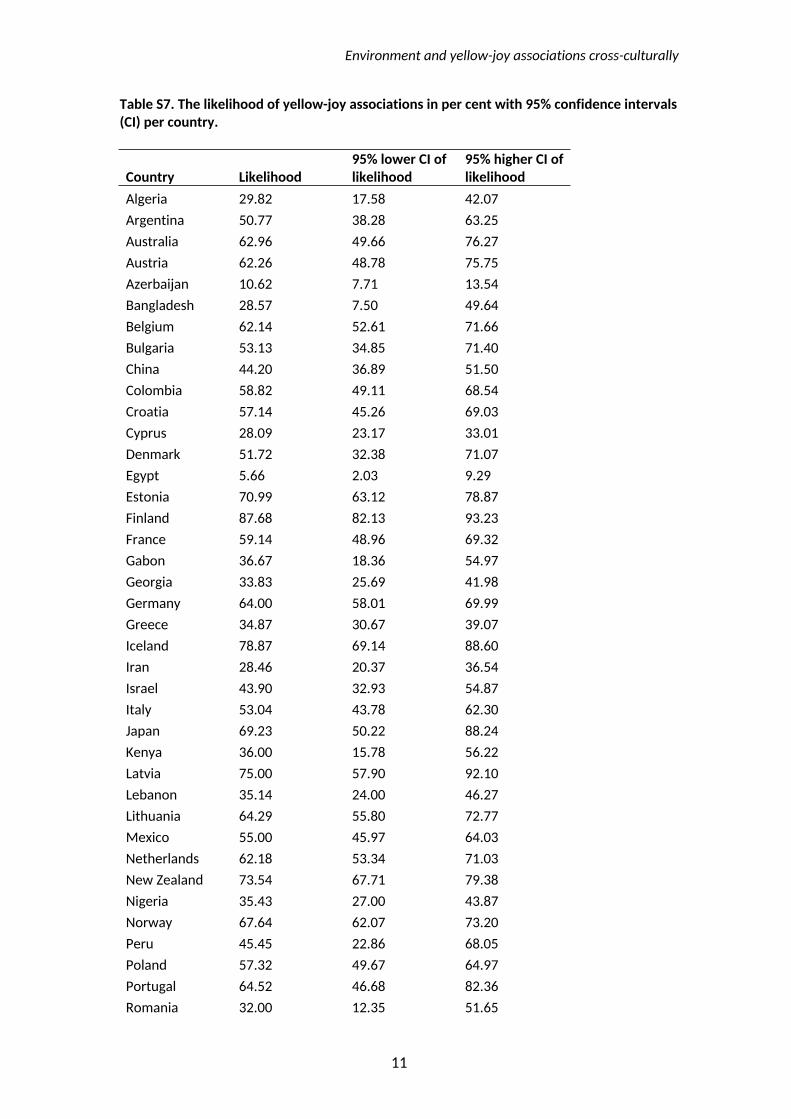
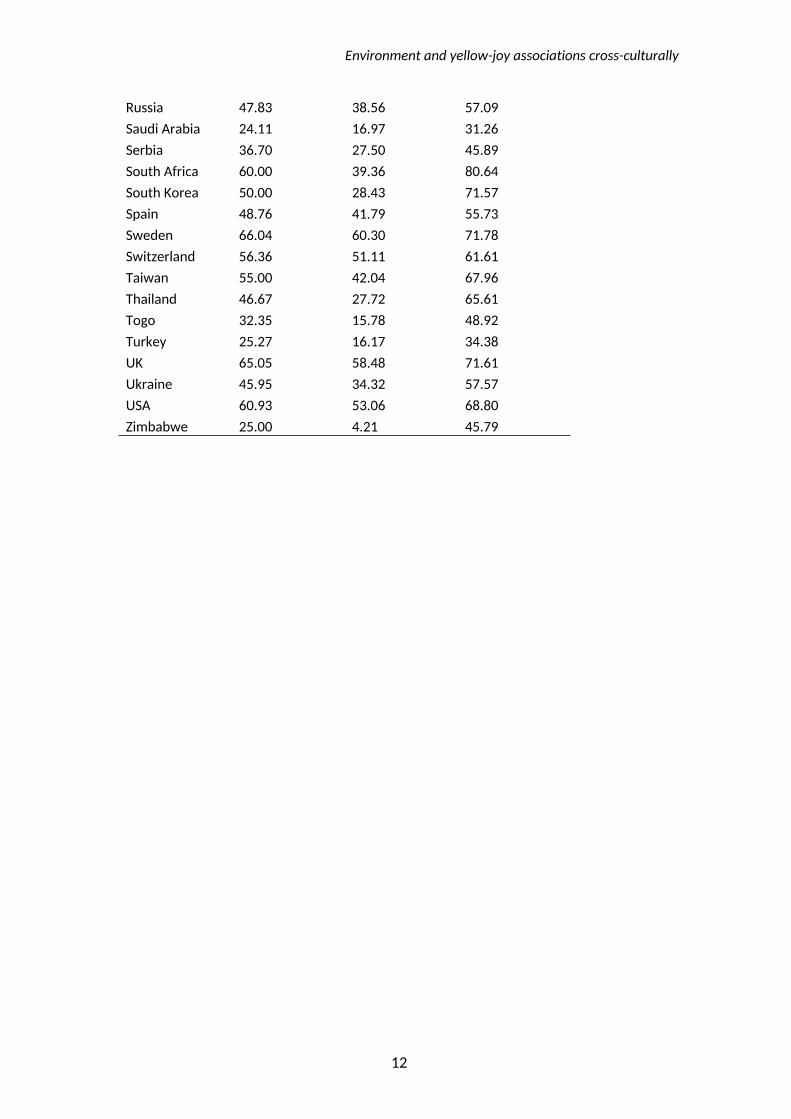
The likelihood of yellow-joy associations varied across our 55 countries, ranging from just
5.7% in Egypt to 87.7% in Finland (Figure 1; Table S7). The global average of the likelihood of
yellow-joy associations was 48.26% (95% CI = [46.86, 49.26]). We present associations
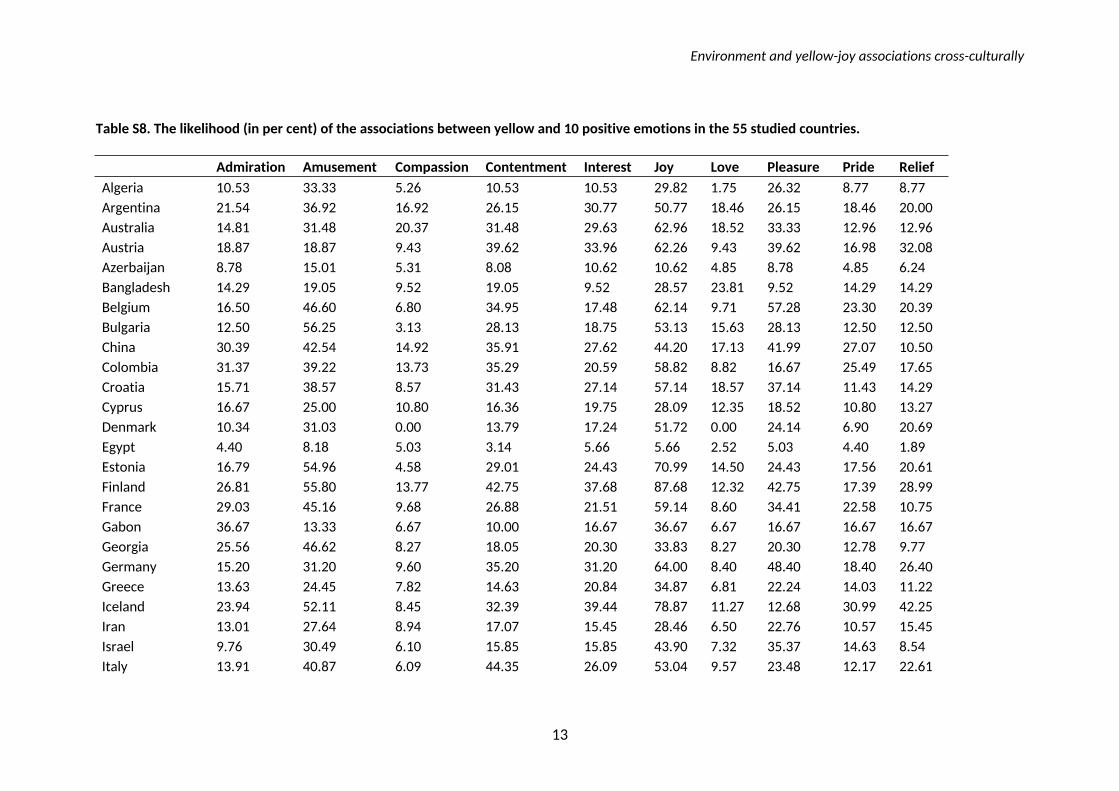
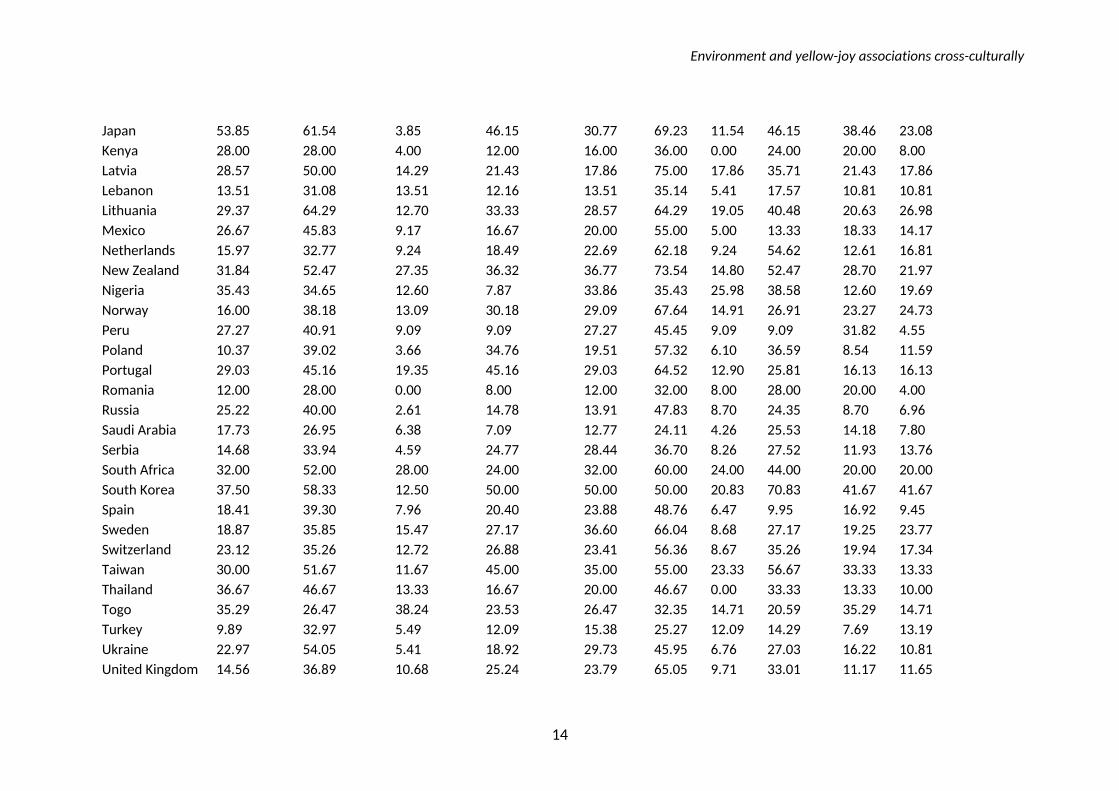
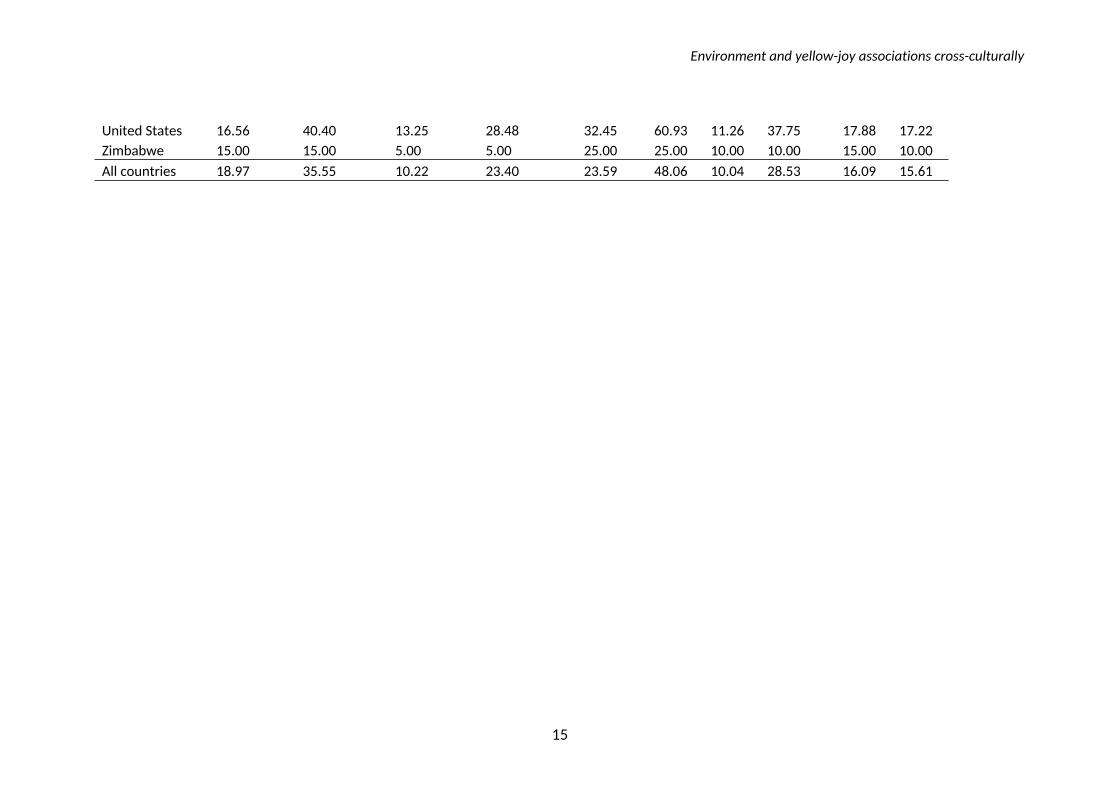
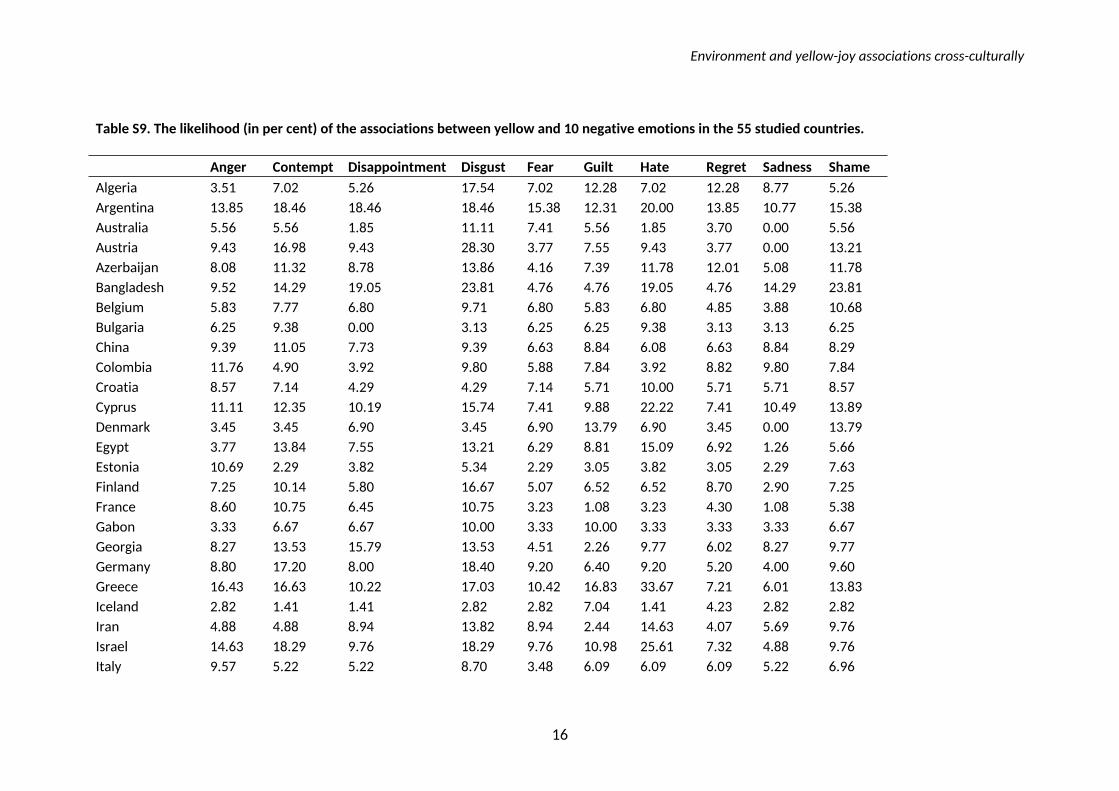
between yellow and other positive and negative emotions in Tables S8 and S9 respectively.
Environment and yellow-joy associations cross-culturally
12
Figure 1. Likelihood of associating yellow with joy in 55 countries. This map of the world
(data not collected in grey countries) shows the likelihood of associating yellow with joy (0%-
90%), where darker and redder areas indicate a higher likelihood (i.e., proportion of
participants endorsing the yellow-joy association). The dotted line shows the equator. Map
created with the free software on https://mapchart.net/.
The likelihood ratio test showed that the model with sunshine (block 1) was significant; LR(4)
= 17.98, p < .001, AIC = 17,116, pseudoR2 = .139 (Cox & Snell), .149 (Nagelkerke). The model with
sunshine and absolute latitude (block 2) was superior to the model with sunshine alone (block
1) in explaining the intensity of yellow-joy associations; LR(5) = 5.43, p = .020, AIC = 17,112,
pseudoR2 = .140 (Cox & Snell), .150 (Nagelkerke). The model accounting for sunshine, absolute
latitude, and precipitation (block 3) was superior again to the model accounting for sunshine
and absolute latitude alone (block 2); LR(6) = 5.78, p = 0.016, AIC = 17,109, pseudoR2 = .141 (Cox
& Snell), .151 (Nagelkerke). Finally, the goodness-of-fit of the model including sunshine,
absolute latitude, precipitation, and daytime hours (block 4) was not superior to the model
including just sunshine, absolute latitude, and precipitation (block 3); LR(7) = 0.53, p = 0.46,
AIC = 17,110, pseudoR2 = .141 (Cox & Snell), .151 (Nagelkerke). Therefore, this hierarchical
Environment and yellow-joy associations cross-culturally
13
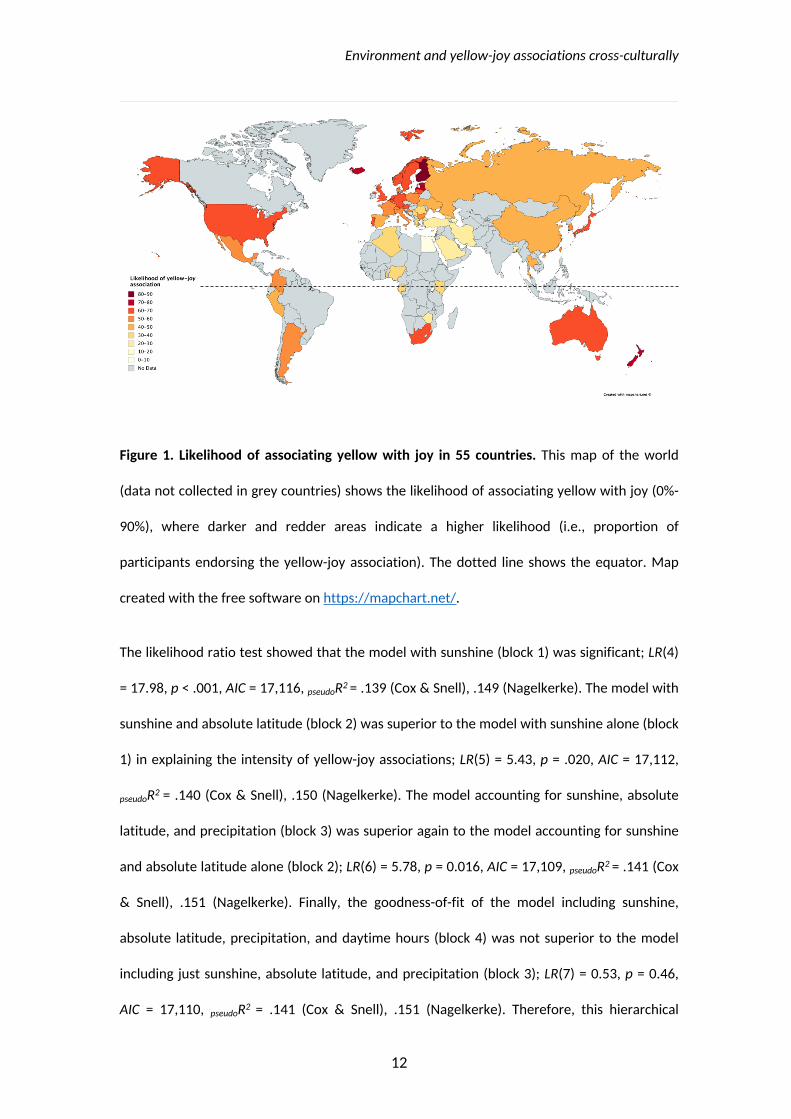
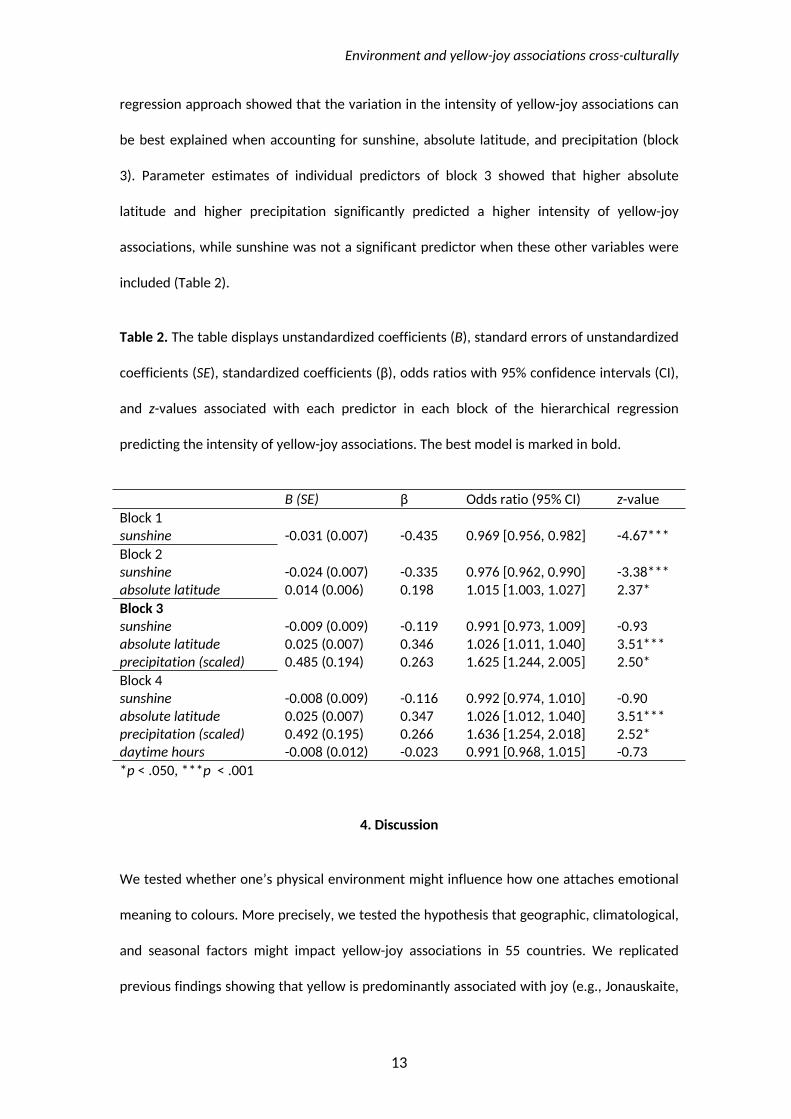
regression approach showed that the variation in the intensity of yellow-joy associations can
be best explained when accounting for sunshine, absolute latitude, and precipitation (block
3). Parameter estimates of individual predictors of block 3 showed that higher absolute
latitude and higher precipitation significantly predicted a higher intensity of yellow-joy
associations, while sunshine was not a significant predictor when these other variables were
included (Table 2).
Table 2. The table displays unstandardized coefficients (B), standard errors of unstandardized
coefficients (SE), standardized coefficients (β), odds ratios with 95% confidence intervals (CI),
and z-values associated with each predictor in each block of the hierarchical regression
predicting the intensity of yellow-joy associations. The best model is marked in bold.
B (SE) β Odds ratio (95% CI) z-valueBlock 1sunshine -0.031 (0.007) -0.435 0.969 [0.956, 0.982] -4.67***Block 2sunshine -0.024 (0.007) -0.335 0.976 [0.962, 0.990] -3.38***absolute latitude 0.014 (0.006) 0.198 1.015 [1.003, 1.027] 2.37*Block 3sunshine -0.009 (0.009) -0.119 0.991 [0.973, 1.009] -0.93absolute latitude 0.025 (0.007) 0.346 1.026 [1.011, 1.040] 3.51***precipitation (scaled) 0.485 (0.194) 0.263 1.625 [1.244, 2.005] 2.50*Block 4sunshine -0.008 (0.009) -0.116 0.992 [0.974, 1.010] -0.90absolute latitude 0.025 (0.007) 0.347 1.026 [1.012, 1.040] 3.51***precipitation (scaled) 0.492 (0.195) 0.266 1.636 [1.254, 2.018] 2.52*daytime hours -0.008 (0.012) -0.023 0.991 [0.968, 1.015] -0.73*p < .050, ***p < .001
4. Discussion
We tested whether one’s physical environment might influence how one attaches emotional
meaning to colours. More precisely, we tested the hypothesis that geographic, climatological,
and seasonal factors might impact yellow-joy associations in 55 countries. We replicated
previous findings showing that yellow is predominantly associated with joy (e.g., Jonauskaite,
Environment and yellow-joy associations cross-culturally
14
Althaus, et al., 2019; Kaya & Epps, 2004; Lindborg & Friberg, 2015). About 48.3% of our
participants endorsed an association between yellow and joy. We observed no comparably
compelling associations with any other emotions. Yet, the percentage of participants
endorsing this association varied widely, from just 5.8% in Egypt to 87.7% in Finland (see also
Barchard, Grob, & Roe, 2017). Overall, participants rated yellow as more joyful if they lived in
rainier countries located further away from the equator. This conclusion is based on an
analysis in which we used the centre of each country as the point of reference. Although this
provides a good estimate of a country’s latitude, it will be less reflective of the participant’s
latitude in large countries.
We initially hypothesized that scarcity of sunshine is a key contributor to yellow-joy
associations (Guéguen, 2013; Palmer & Schloss, 2010). Yet, after having accounted for the
distance to the equator and rainfall, the factor of sunshine became redundant. Our
correlational data indicate that joyful connotations of yellow are stronger when temperatures
are moderate and rainfall is ample. While sunshine might be positive, ample rainfall reduces
otherwise harmful effects of heat and too much sunshine (e.g., droughts). These associations
were driven by a country’s typical annual climate and were not modulated by transient
changes. We found that the number of daytime hours on the day of completing the survey
did not influence the intensity of yellow-joy associations, suggesting minor seasonal effects
on yellow-joy association.
The stability across seasons contrasts with previous studies on colour preferences, which vary
systematically between autumn and the other seasons (Schloss, Nelson, Parker, Heck, &
Palmer, 2017). Potentially, colour preferences are more dynamic than colour-emotion
associations, since preferences are shaped by one’s personal and shared past affective
experiences (Palmer & Schloss, 2010). This would explain why we found that yellow-joy
associations varied with global climatological factors, but not with seasonal fluctuations.
Environment and yellow-joy associations cross-culturally
15
Our results invite future research testing mechanisms by which climatological and
geographical factors may impact colour-emotion associations. One could imagine that yellow-
joy associations emerge because of an individual’s experience (sunshine makes all colours
more vibrant), physical sensations (the positive feeling of skin warmed by the sun), embodied
experience (doing joyful things when the sun is shining) or semantic pathways (talking about
joyful things and sunshine together). While we acknowledge that many questions remain, our
global study lays the groundwork for a better understanding of how the physical environment
comes to shape the human mind.
Environment and yellow-joy associations cross-culturally
16
References
Adams, F. M., & Osgood, C. E. (1973). A cross-cultural study of the affective meanings of
color. Journal of Cross-Cultural Psychology, 4(2), 135–157.
https://doi.org/10.1177/002202217300400201
Barchard, K. A., Grob, K. E., & Roe, M. J. (2017). Is sadness blue? The problem of using
figurative language for emotions on psychological tests. Behavior Research Methods,
49(2), 443–456. https://doi.org/10.3758/s13428-016-0713-5
Burkitt, E., & Sheppard, L. (2014). Children’s colour use to portray themselves and others with
happy, sad and mixed emotion. Educational Psychology, 34(2), 231–251.
https://doi.org/10.1080/01443410.2013.785059
Christensen, R. H. B. (2018). Ordinal - regression models for ordinal data. R package version
2018.8-25. Retrieved from http://www.cran.r-project.org/package=ordinal/
Dael, N., Perseguers, M.-N., Marchand, C., Antonietti, J.-P., & Mohr, C. (2015). Put on that
colour, it fits your emotion: Colour appropriateness as a function of expressed emotion.
Quarterly Journal of Experimental Psychology, 0218(October), 1–12.
https://doi.org/10.1080/17470218.2015.1090462
Griber, Y. A., Mylonas, D., & Paramei, G. V. (2018). Objects as culture-specific referents of
color terms in Russian. Color Research & Application, 43(6), 958–975.
https://doi.org/10.1002/col.22280
Guéguen, N. (2013). Weather and smiling contagion: A quasi experiment with the smiling
sunshine. Journal of Nonverbal Behavior, 37(1), 51–55. https://doi.org/10.1007/s10919-
012-0140-y
Henrich, J., Heine, S. J., & Norenzayan, A. (2010). The weirdest people in the world?
Behavioral and Brain Sciences, 33(2–3), 61–83.
Environment and yellow-joy associations cross-culturally
17
https://doi.org/10.1017/S0140525X0999152X
Jonauskaite, D., Althaus, B., Dael, N., Dan-Glauser, E., & Mohr, C. (2019). What color do you
feel? Color choices are driven by mood. Color Research & Application, 44(2), 272–284.
https://doi.org/10.1002/col.22327
Jonauskaite, D., Dael, N., Chèvre, L., Althaus, B., Tremea, A., Charalambides, L., & Mohr, C.
(2019). Pink for girls, red for boys, and blue for both genders: Colour preferences in
children and adults. Sex Roles, 80(9), 630–642. https://doi.org/10.1007/s11199-018-
0955-z
Kaya, N., & Epps, H. H. (2004). Relationship between color and emotion: a study of college
students. College Student Journal, 38(3), 396–406. Retrieved from
https://nzdis.org/projects/attachments/299/colorassociation-students.pdf
Keller, M. C., Fredrickson, B. L., Ybarra, O., Côté, S., Johnson, K., Mikels, J., … Wager, T. (2005).
A warm heart and a clear head: The contingent effects of weather on mood and
cognition. Psychological Science, 16(9), 724–731. https://doi.org/10.1111/j.1467-
9280.2005.01602.x
Lindborg, P., & Friberg, A. K. (2015). Colour association with music is mediated by emotion:
Evidence from an experiment using a CIE Lab interface and interviews. Plos One, 10(12),
e0144013. https://doi.org/10.1371/journal.pone.0144013
Mohr, C., Jonauskaite, D., Dan-Glauser, E. S., Uusküla, M., & Dael, N. (2018). Unifying research
on colour and emotion: Time for a cross-cultural survey on emotion associations with
colour terms. In L. W. MacDonald, C. P. Biggam, & G. V Paramei (Eds.), Progress in Colour
Studies: Cognition, language, and beyond (pp. 209–222). Amsterdam: John Benjamins
Publishing Company. https://doi.org/10.1075/z.217.11moh
Ou, L.-C., Luo, M. R., Woodcock, A., & Wright, A. (2004). A study of colour emotion and colour
preference. Part I: Colour emotions for single colours. Color Research & Application,
Environment and yellow-joy associations cross-culturally
18
29(3), 232–240. https://doi.org/10.1002/col.20010
Palmer, S. E., & Schloss, K. B. (2010). An ecological valence theory of human color preference.
Proceedings of the National Academy of Sciences of the United States of America,
107(19), 8877–8882. https://doi.org/10.1073/pnas.0906172107
Scherer, K. R., Shuman, V., Fontaine, J. R. J., & Soriano, C. (2013). The GRID meets the Wheel:
Assessing emotional feeling via self-report. In J. R. J. Fontaine, K. R. Scherer, & C. Soriano
(Eds.), Components of emotional meaning: A sourcebook (pp. 281–298). Oxford: Oxford
University Press. https://doi.org/10.13140/RG.2.1.2694.6406
Schloss, K. B., Nelson, R., Parker, L., Heck, I. A., & Palmer, S. E. (2017). Seasonal variations in
color preference. Cognitive Science, 41(6), 1589–1612.
https://doi.org/10.1111/cogs.12429
Simmons, J. P., Nelson, L. D., & Simonsohn, U. (2011). False-positive psychology: Undisclosed
flexibility in data collection and analysis allows presenting anything as significant.
Psychological Science, 22(11), 1359–1366. https://doi.org/10.1177/0956797611417632
Sutton, T. M., & Altarriba, J. (2016). Color associations to emotion and emotion-laden words:
A collection of norms for stimulus construction and selection. Behavior Research
Methods, 48(2), 686–728. https://doi.org/10.3758/s13428-015-0598-8
Environment and yellow-joy associations cross-culturally
1
Supplementary Tables
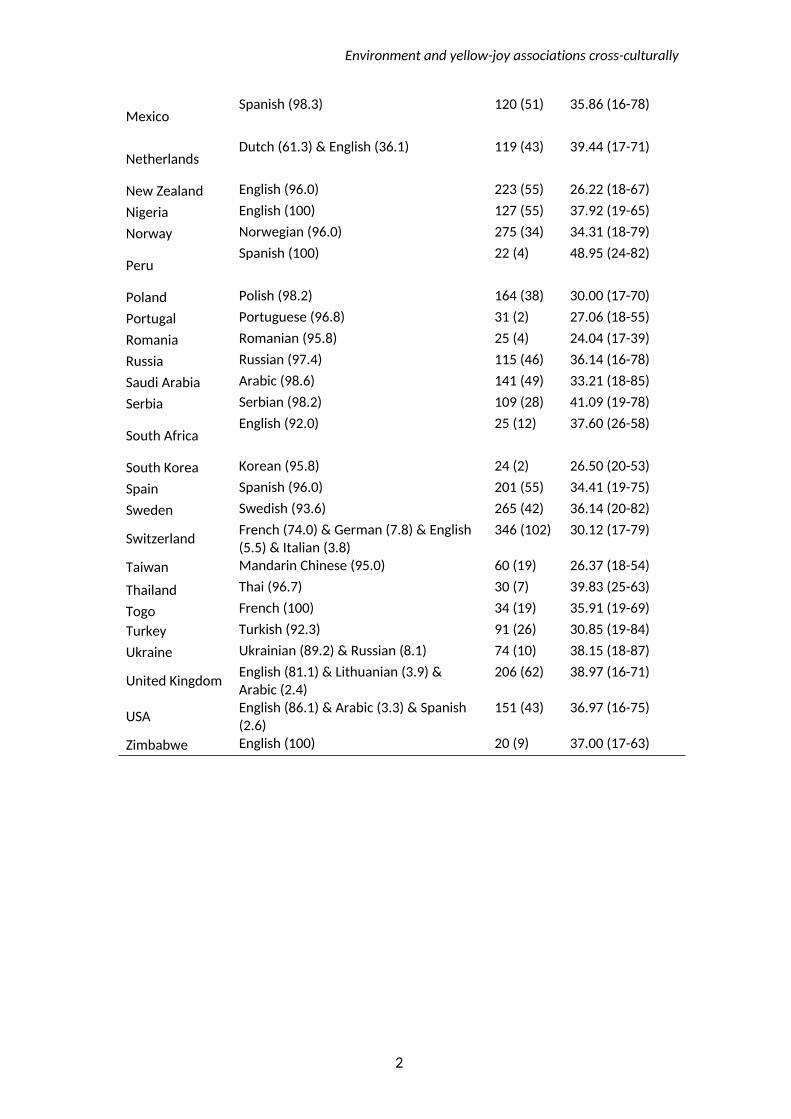
Table S1. Demographic information of participants by country. Language refers to the language in which the survey was completed.
CountryLanguage(s)(% of participants) N (males)
Age (mean, range)
Argentina Spanish (95.4) 65 (21) 36.98 (17-71)
AlgeriaFrench (50.9) & Arabic (36.8) & English (10.5)
57 (21) 28.47 (18-72)
AustraliaEnglish (94.4) 54 (14) 36.13 (19-76)
Austria German (92.5) 53 (8) 30.74 (20-60)Azerbaijan Azerbaijani (99.5) 433 (114) 36.42 (17-70)
Bangladesh Bengali (95.2) 21 (10) 30.48 (21-62)
BelgiumDutch (85.4) & English (7.8) 103 (22) 39.06 (19-87)
BulgariaBulgarian (96.9) 32 (13) 39.34 (23-69)
China Mandarin Chinese (97.8) 181 (52) 34.29 (17-80)Colombia Spanish (100) 102 (45) 36.61 (18-74)
Croatia Croatian (100) 70 (13) 39.64 (18-60)
Cyprus Greek (79.0) & Turkish (19.8) 324 (88) 30.45 (16-85)
Denmark Danish (44.8) & English (24.1) & Icelandic (13.8)
29 (12) 44.90 (24-72)
Egypt Arabic (100) 159 (36) 28.89 (16-65)Estonia Estonian (98.5) 131 (16) 38.75 (19-70)Finland Finnish (97.8) 138 (17) 32.46 (19-71)
France French (83.9) & Polish (4.3) & Arabic (3.2)
93 (24) 38.84 (19-75)
Gabon French (100) 30 (19) 30.70 (24-54)Georgia Georgian (97.7) 133 (40) 32.17 (16-73)Germany German (85.2) & English (6.0) 250 (36) 33.14 (16-82)Greece Greek (100) 499 (84) 30.05 (16-76)
Iceland Icelandic (97.2) 71 (12) 36.49 (21-62)Iran Persian (97.6) 123 (16) 32.74 (16-79)Israel Hebrew (92.7) 82 (15) 37.43 (21-67)Italy Italian (86.1) & English (2.6) 115 (40) 38.00 (19-80)
JapanJapanese (96.2) 25 (11) 29.88 (19-48)
Kenya English (96.0) 26 (11) 29.04 (17-51)
Latvia Latvian (85.7) & Russian (10.7) 28 (4) 26.11 (19-57)Lebanon English (64.9) & Arabic (29.7) 74 (19) 27.32 (17-71)
LithuaniaLithuanian (81.0) & English (17.5) 126 (19) 34.48 (16-77)
Environment and yellow-joy associations cross-culturally
2
MexicoSpanish (98.3) 120 (51) 35.86 (16-78)
NetherlandsDutch (61.3) & English (36.1) 119 (43) 39.44 (17-71)
New Zealand English (96.0) 223 (55) 26.22 (18-67)Nigeria English (100) 127 (55) 37.92 (19-65)Norway Norwegian (96.0) 275 (34) 34.31 (18-79)
PeruSpanish (100) 22 (4) 48.95 (24-82)
Poland Polish (98.2) 164 (38) 30.00 (17-70)Portugal Portuguese (96.8) 31 (2) 27.06 (18-55)Romania Romanian (95.8) 25 (4) 24.04 (17-39)Russia Russian (97.4) 115 (46) 36.14 (16-78)Saudi Arabia Arabic (98.6) 141 (49) 33.21 (18-85)Serbia Serbian (98.2) 109 (28) 41.09 (19-78)
South AfricaEnglish (92.0) 25 (12) 37.60 (26-58)
South Korea Korean (95.8) 24 (2) 26.50 (20-53)Spain Spanish (96.0) 201 (55) 34.41 (19-75)Sweden Swedish (93.6) 265 (42) 36.14 (20-82)
Switzerland French (74.0) & German (7.8) & English (5.5) & Italian (3.8)
346 (102) 30.12 (17-79)
Taiwan Mandarin Chinese (95.0) 60 (19) 26.37 (18-54)
Thailand Thai (96.7) 30 (7) 39.83 (25-63)
Togo French (100) 34 (19) 35.91 (19-69)Turkey Turkish (92.3) 91 (26) 30.85 (19-84)Ukraine Ukrainian (89.2) & Russian (8.1) 74 (10) 38.15 (18-87)
United Kingdom English (81.1) & Lithuanian (3.9) & Arabic (2.4)
206 (62) 38.97 (16-71)
USA English (86.1) & Arabic (3.3) & Spanish (2.6)
151 (43) 36.97 (16-75)
Zimbabwe English (100) 20 (9) 37.00 (17-63)
Environment and yellow-joy associations cross-culturally
3
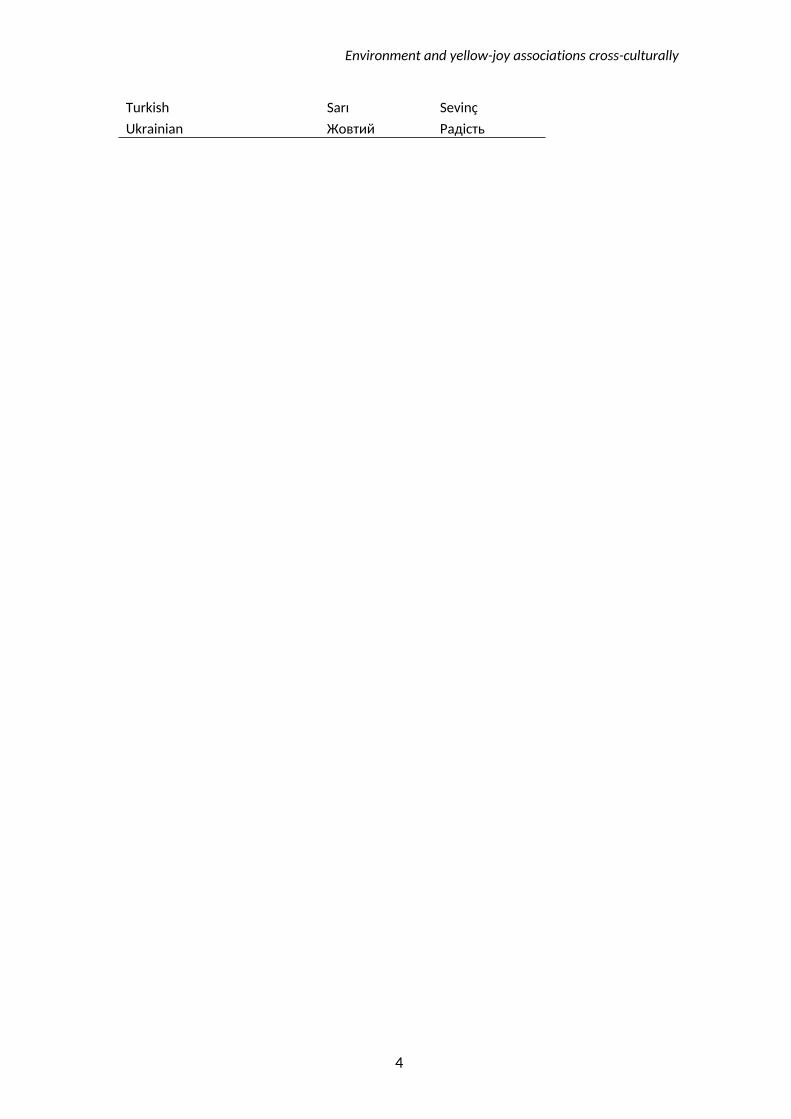
Table S2. Yellow and joy in 40 languages, used in the International Colour-Emotion Association Survey.
Language "Yellow" "Joy"Albanian E verdhë LumturiArabic اصفر فرحArabic (Algeria) اصفر فرحAzerbaijani Sarı SevincBengali আআআআ আআআআআBulgarian Жълт РадостChinese (Mandarin simplified) 黄色 欢乐
Chinese (Mandarin traditional) 黃色 歡樂
Croatian Zuta RadostDanish Gul GlædeDutch Geel BlijheidEnglish Yellow JoyEstonian Kollane RõõmFinnish Keltainen IloFrench Jaune JoieGeorgian ააააააა ააააააააGerman Gelb FreudeGreek Κίτρινο ΧαράHebrew צהוב שמחה
Hindi जजजज जजजजHungarian Sárga VidámságIcelandic Gulur GleðiItalian Giallo GioiaJapanese 黄色 喜び
Korean 노란색 기쁨
Latvian Dzeltena PrieksLithuanian Geltona DžiaugsmasMalay Kuning GembiraNorwegian Gul GledePersian زرد مسرت Polish Żółty RadośćPortuguese Amarelo AlegriaPortuguese (Brazilian) Amarelo AlegriaRomanian Galben BucurieRussian Жёлтый PадостьSerbian Žuta RadostSlovak Žltá RadosťSpanish Amarillo Alegría Swedish Gul Glädje
Environment and yellow-joy associations cross-culturally
4
Turkish Sarı SevinçUkrainian Жовтий Радість
Environment and yellow-joy associations cross-culturally
5
Table S3. Different language links used in this study
Language LinkAlbanian http://www2.unil.ch/onlinepsylab/colour_albanian/main.php
Arabic (Egypt & Saudi Arabia)
http://www2.unil.ch/onlinepsylab/colour_arabic/main.php
Arabic (Algeria) http://www2.unil.ch/onlinepsylab/colour_arabic2/main.php
Armenian http://www2.unil.ch/onlinepsylab/colour_armenian/main.php
Azerbaijani http://www2.unil.ch/onlinepsylab/colour_azerbaijani/main.php
Bengali http://www2.unil.ch/onlinepsylab/colour_bengali/main.php
Bulgarian http://www2.unil.ch/onlinepsylab/colour_bulgarian/main.php
Chinese (Simplified Mandarin)
http://www2.unil.ch/onlinepsylab/colour_china/main.php
Chinese (Traditional Mandarin)
http://www2.unil.ch/onlinepsylab/colour_trad_chinese/main.php
Croatian http://www2.unil.ch/onlinepsylab/colour_croatian/main.php
Danish http://www2.unil.ch/onlinepsylab/colour_danish/main.php
Dutch http://www2.unil.ch/onlinepsylab/colour_dutch/main.php
English http://www2.unil.ch/onlinepsylab/colour/main.php
Estonian http://www2.unil.ch/onlinepsylab/colour_estonian/main.php
Finnish http://www2.unil.ch/onlinepsylab/colour_finnish/main.php
French http://www2.unil.ch/onlinepsylab/UNILcouleur/main.php
Georgian http://www2.unil.ch/onlinepsylab/colour_georgian/main.php
German http://www2.unil.ch/onlinepsylab/colour_german/main.php
Greek http://www2.unil.ch/onlinepsylab/colour_greek/main.php
Hebrew http://www2.unil.ch/onlinepsylab/colour_hebrew/main.php
Hindi http://www2.unil.ch/onlinepsylab/colour_hindi/main.php
Hungarian http://www2.unil.ch/onlinepsylab/colour_hungarian/main.php
Icelandic http://www2.unil.ch/onlinepsylab/colour_icelandic/main.php
Italian http://www2.unil.ch/onlinepsylab/colour_italian/main.php
Environment and yellow-joy associations cross-culturally
6
Japanese http://www2.unil.ch/onlinepsylab/colour_japanese/main.php
Korean http://www2.unil.ch/onlinepsylab/colour_korean/main.php
Latvian http://www2.unil.ch/onlinepsylab/colour_latvian/main.php
Lithuanian http://www2.unil.ch/onlinepsylab/colour_lithuanian/main.php
Malay www2.unil.ch/onlinepsylab/colour_malay/main.php
Norwegian http://www2.unil.ch/onlinepsylab/colour_norwegian/main.php
Persian http://www2.unil.ch/onlinepsylab/colour_persian/main.php
Polish http://www2.unil.ch/onlinepsylab/colour_polish/main.php
Portuguese (Brazilian) http://www2.unil.ch/onlinepsylab/colour_portuguese/main.php
Portuguese (Portuguese) http://www2.unil.ch/onlinepsylab/colour_portuguese2/main.php
Romanian http://www2.unil.ch/onlinepsylab/colour_romanian/main.php
Russian http://www2.unil.ch/onlinepsylab/colour_russian/main.php
Serbian http://www2.unil.ch/onlinepsylab/colour_serbian/main.php
Slovak http://www2.unil.ch/onlinepsylab/colour_slovak/main.php
Spanish http://www2.unil.ch/onlinepsylab/colour_spanish/main.php
Swedish http://www2.unil.ch/onlinepsylab/colour_swedish/main.php
Thai http://www2.unil.ch/onlinepsylab/colour_thai/main.php
Turkish http://www2.unil.ch/onlinepsylab/colour_turkish/main.php
Ukrainian http://www2.unil.ch/onlinepsylab/colour_ukrainian/main.php
Environment and yellow-joy associations cross-culturally
7
Table S4. Geographic and climatological variables per country. Latitudes are absolute values relative to the equator, regardless of north/south direction.
Country Latitude (°) Longitude (°) Precipitation (mm/year)
Sunshine (average % of sunny hours per daytime hours across a year)
Algeria 28.00 3.00 89 65.00Argentina -34.00 -64.00 591 57.83Australia -27.00 133.00 534 63.14Austria 47.33 13.33 1110 43.01Azerbaijan 40.50 47.50 447 50.40Bangladesh 24.00 90.00 2666 47.17Belgium 50.83 4.00 847 35.30China 35.00 105.00 645 40.54Bulgaria 43.00 25.00 608 49.70Colombia 4.00 -72.00 3240 39.04Croatia 45.17 15.50 1113 43.68Cyprus 35.00 33.00 498 76.76Denmark 56.00 10.00 703 35.14Egypt 27.00 30.00 51 80.86Estonia 59.00 26.00 626 40.02Finland 64.00 26.00 536 42.42France 46.00 2.00 867 37.95Gabon -1.00 11.75 1831 39.36Georgia 42.00 43.50 1026 48.22Germany 51.00 9.00 700 37.12Greece 39.00 22.00 652 65.02Iceland 65.00 -18.00 1940 30.27Iran 32.00 53.00 228 68.40Israel 31.50 34.75 435 75.59Italy 42.83 12.83 832 43.72Japan 36.00 138.00 1668 42.85Kenya 1.00 38.00 630 56.89Latvia 57.00 25.00 641 41.37Lebanon 33.83 35.83 661 67.12Lithuania 56.00 24.00 656 41.10Mexico 23.00 -102.00 758 58.33Netherlands 52.50 5.75 778 37.95New Zealand -41.00 174.00 1732 47.00Nigeria 10.00 8.00 1150 63.20Norway 62.00 10.00 1414 38.08
Environment and yellow-joy associations cross-culturally
8
Peru -10.00 -76.00 1738 28.08Poland 52.00 20.00 600 35.87Portugal 39.50 -8.00 854 64.06Romania 46.00 25.00 637 48.29Russia 60.00 100.00 460 39.52Saudi Arabia 25.00 45.00 59 74.16Serbia 44.00 21.00 686 48.22South Africa -29.00 24.00 495 85.20South Korea 37.00 127.50 1274 47.17Spain 40.00 -4.00 636 59.16Sweden 62.00 15.00 624 41.58Switzerland 47.00 8.00 1537 35.75Taiwan 23.50 121.00 2090 32.08Thailand 15.00 100.00 1622 60.03Togo 8.00 1.17 1168 53.29Turkey 39.00 35.00 593 50.64Ukraine 49.00 32.00 565 44.63United Kingdom 54.00 -2.00 1220 37.28USA (excluding Alaska and Hawaii) 38.00 -97.00 715 57.87Zimbabwe -20.00 30.00 657 68.74
Environment and yellow-joy associations cross-culturally
9
Table S5. Participant count at each stage of exclusion until the final sample was reached. Complete data are available here: https://forsbase.unil.ch/project/study-public-overview/15126/1672/
Sample size DescriptionN = 8934 Extracted data from the online International Colour-Emotion Survey in
February 2019N = 8857 Excluding incomplete responsesN = 8507 Excluding participants who were not fluent in the language of the survey
(leaving responses 5-8 only) or did not provide an answerN = 7618 Excluding colour-blind participants by self-report (leaving participants who
responded “no”) or those who did not provide an answerN = 7219 Excluding participants who were too slow or too quick in completing the
survey (leaving those who completed the survey between 3 and 90 min)N = 7081 Excluding younger than 16 years old participants or those who had missing
age informationN = 6945 Excluding participants who were too quick when responding to the first four
colour terms (took less than 20 seconds on all four colour terms)N = 6929 Excluding participants who had missing responses for yellowN = 6625 Excluding participants from the countries, which had fewer than 20
responses in total. This is the final sample
Environment and yellow-joy associations cross-culturally
10
Table S6. Correlation matrix between the predictors performed by taking each country as an individual data point.
Absolute latitude Precipitation SunshineAbsolute latitude 1.000 -0.283* -0.405**Precipitation -0.283* 1.000 -0.478***Sunshine -0.405** -0.478*** 1.000*p < .050, **p < .010, ***p < .001
Environment and yellow-joy associations cross-culturally
11
Table S7. The likelihood of yellow-joy associations in per cent with 95% confidence intervals (CI) per country.
Country Likelihood95% lower CI of likelihood
95% higher CI of likelihood
Algeria 29.82 17.58 42.07Argentina 50.77 38.28 63.25Australia 62.96 49.66 76.27Austria 62.26 48.78 75.75Azerbaijan 10.62 7.71 13.54Bangladesh 28.57 7.50 49.64Belgium 62.14 52.61 71.66Bulgaria 53.13 34.85 71.40China 44.20 36.89 51.50Colombia 58.82 49.11 68.54Croatia 57.14 45.26 69.03Cyprus 28.09 23.17 33.01Denmark 51.72 32.38 71.07Egypt 5.66 2.03 9.29Estonia 70.99 63.12 78.87Finland 87.68 82.13 93.23France 59.14 48.96 69.32Gabon 36.67 18.36 54.97Georgia 33.83 25.69 41.98Germany 64.00 58.01 69.99Greece 34.87 30.67 39.07Iceland 78.87 69.14 88.60Iran 28.46 20.37 36.54Israel 43.90 32.93 54.87Italy 53.04 43.78 62.30Japan 69.23 50.22 88.24Kenya 36.00 15.78 56.22Latvia 75.00 57.90 92.10Lebanon 35.14 24.00 46.27Lithuania 64.29 55.80 72.77Mexico 55.00 45.97 64.03Netherlands 62.18 53.34 71.03New Zealand 73.54 67.71 79.38Nigeria 35.43 27.00 43.87Norway 67.64 62.07 73.20Peru 45.45 22.86 68.05Poland 57.32 49.67 64.97Portugal 64.52 46.68 82.36Romania 32.00 12.35 51.65
Environment and yellow-joy associations cross-culturally
12
Russia 47.83 38.56 57.09Saudi Arabia 24.11 16.97 31.26Serbia 36.70 27.50 45.89South Africa 60.00 39.36 80.64South Korea 50.00 28.43 71.57Spain 48.76 41.79 55.73Sweden 66.04 60.30 71.78Switzerland 56.36 51.11 61.61Taiwan 55.00 42.04 67.96Thailand 46.67 27.72 65.61Togo 32.35 15.78 48.92Turkey 25.27 16.17 34.38UK 65.05 58.48 71.61Ukraine 45.95 34.32 57.57USA 60.93 53.06 68.80Zimbabwe 25.00 4.21 45.79
Environment and yellow-joy associations cross-culturally
13
Table S8. The likelihood (in per cent) of the associations between yellow and 10 positive emotions in the 55 studied countries.
Admiration Amusement Compassion Contentment Interest Joy Love Pleasure Pride ReliefAlgeria 10.53 33.33 5.26 10.53 10.53 29.82 1.75 26.32 8.77 8.77Argentina 21.54 36.92 16.92 26.15 30.77 50.77 18.46 26.15 18.46 20.00Australia 14.81 31.48 20.37 31.48 29.63 62.96 18.52 33.33 12.96 12.96Austria 18.87 18.87 9.43 39.62 33.96 62.26 9.43 39.62 16.98 32.08Azerbaijan 8.78 15.01 5.31 8.08 10.62 10.62 4.85 8.78 4.85 6.24Bangladesh 14.29 19.05 9.52 19.05 9.52 28.57 23.81 9.52 14.29 14.29Belgium 16.50 46.60 6.80 34.95 17.48 62.14 9.71 57.28 23.30 20.39Bulgaria 12.50 56.25 3.13 28.13 18.75 53.13 15.63 28.13 12.50 12.50China 30.39 42.54 14.92 35.91 27.62 44.20 17.13 41.99 27.07 10.50Colombia 31.37 39.22 13.73 35.29 20.59 58.82 8.82 16.67 25.49 17.65Croatia 15.71 38.57 8.57 31.43 27.14 57.14 18.57 37.14 11.43 14.29Cyprus 16.67 25.00 10.80 16.36 19.75 28.09 12.35 18.52 10.80 13.27Denmark 10.34 31.03 0.00 13.79 17.24 51.72 0.00 24.14 6.90 20.69Egypt 4.40 8.18 5.03 3.14 5.66 5.66 2.52 5.03 4.40 1.89Estonia 16.79 54.96 4.58 29.01 24.43 70.99 14.50 24.43 17.56 20.61Finland 26.81 55.80 13.77 42.75 37.68 87.68 12.32 42.75 17.39 28.99France 29.03 45.16 9.68 26.88 21.51 59.14 8.60 34.41 22.58 10.75Gabon 36.67 13.33 6.67 10.00 16.67 36.67 6.67 16.67 16.67 16.67Georgia 25.56 46.62 8.27 18.05 20.30 33.83 8.27 20.30 12.78 9.77Germany 15.20 31.20 9.60 35.20 31.20 64.00 8.40 48.40 18.40 26.40Greece 13.63 24.45 7.82 14.63 20.84 34.87 6.81 22.24 14.03 11.22Iceland 23.94 52.11 8.45 32.39 39.44 78.87 11.27 12.68 30.99 42.25Iran 13.01 27.64 8.94 17.07 15.45 28.46 6.50 22.76 10.57 15.45Israel 9.76 30.49 6.10 15.85 15.85 43.90 7.32 35.37 14.63 8.54Italy 13.91 40.87 6.09 44.35 26.09 53.04 9.57 23.48 12.17 22.61
Environment and yellow-joy associations cross-culturally
14
Japan 53.85 61.54 3.85 46.15 30.77 69.23 11.54 46.15 38.46 23.08Kenya 28.00 28.00 4.00 12.00 16.00 36.00 0.00 24.00 20.00 8.00Latvia 28.57 50.00 14.29 21.43 17.86 75.00 17.86 35.71 21.43 17.86Lebanon 13.51 31.08 13.51 12.16 13.51 35.14 5.41 17.57 10.81 10.81Lithuania 29.37 64.29 12.70 33.33 28.57 64.29 19.05 40.48 20.63 26.98Mexico 26.67 45.83 9.17 16.67 20.00 55.00 5.00 13.33 18.33 14.17Netherlands 15.97 32.77 9.24 18.49 22.69 62.18 9.24 54.62 12.61 16.81New Zealand 31.84 52.47 27.35 36.32 36.77 73.54 14.80 52.47 28.70 21.97Nigeria 35.43 34.65 12.60 7.87 33.86 35.43 25.98 38.58 12.60 19.69Norway 16.00 38.18 13.09 30.18 29.09 67.64 14.91 26.91 23.27 24.73Peru 27.27 40.91 9.09 9.09 27.27 45.45 9.09 9.09 31.82 4.55Poland 10.37 39.02 3.66 34.76 19.51 57.32 6.10 36.59 8.54 11.59Portugal 29.03 45.16 19.35 45.16 29.03 64.52 12.90 25.81 16.13 16.13Romania 12.00 28.00 0.00 8.00 12.00 32.00 8.00 28.00 20.00 4.00Russia 25.22 40.00 2.61 14.78 13.91 47.83 8.70 24.35 8.70 6.96Saudi Arabia 17.73 26.95 6.38 7.09 12.77 24.11 4.26 25.53 14.18 7.80Serbia 14.68 33.94 4.59 24.77 28.44 36.70 8.26 27.52 11.93 13.76South Africa 32.00 52.00 28.00 24.00 32.00 60.00 24.00 44.00 20.00 20.00South Korea 37.50 58.33 12.50 50.00 50.00 50.00 20.83 70.83 41.67 41.67Spain 18.41 39.30 7.96 20.40 23.88 48.76 6.47 9.95 16.92 9.45Sweden 18.87 35.85 15.47 27.17 36.60 66.04 8.68 27.17 19.25 23.77Switzerland 23.12 35.26 12.72 26.88 23.41 56.36 8.67 35.26 19.94 17.34Taiwan 30.00 51.67 11.67 45.00 35.00 55.00 23.33 56.67 33.33 13.33Thailand 36.67 46.67 13.33 16.67 20.00 46.67 0.00 33.33 13.33 10.00Togo 35.29 26.47 38.24 23.53 26.47 32.35 14.71 20.59 35.29 14.71Turkey 9.89 32.97 5.49 12.09 15.38 25.27 12.09 14.29 7.69 13.19Ukraine 22.97 54.05 5.41 18.92 29.73 45.95 6.76 27.03 16.22 10.81United Kingdom 14.56 36.89 10.68 25.24 23.79 65.05 9.71 33.01 11.17 11.65
Environment and yellow-joy associations cross-culturally
15
United States 16.56 40.40 13.25 28.48 32.45 60.93 11.26 37.75 17.88 17.22Zimbabwe 15.00 15.00 5.00 5.00 25.00 25.00 10.00 10.00 15.00 10.00All countries 18.97 35.55 10.22 23.40 23.59 48.06 10.04 28.53 16.09 15.61
Environment and yellow-joy associations cross-culturally
16
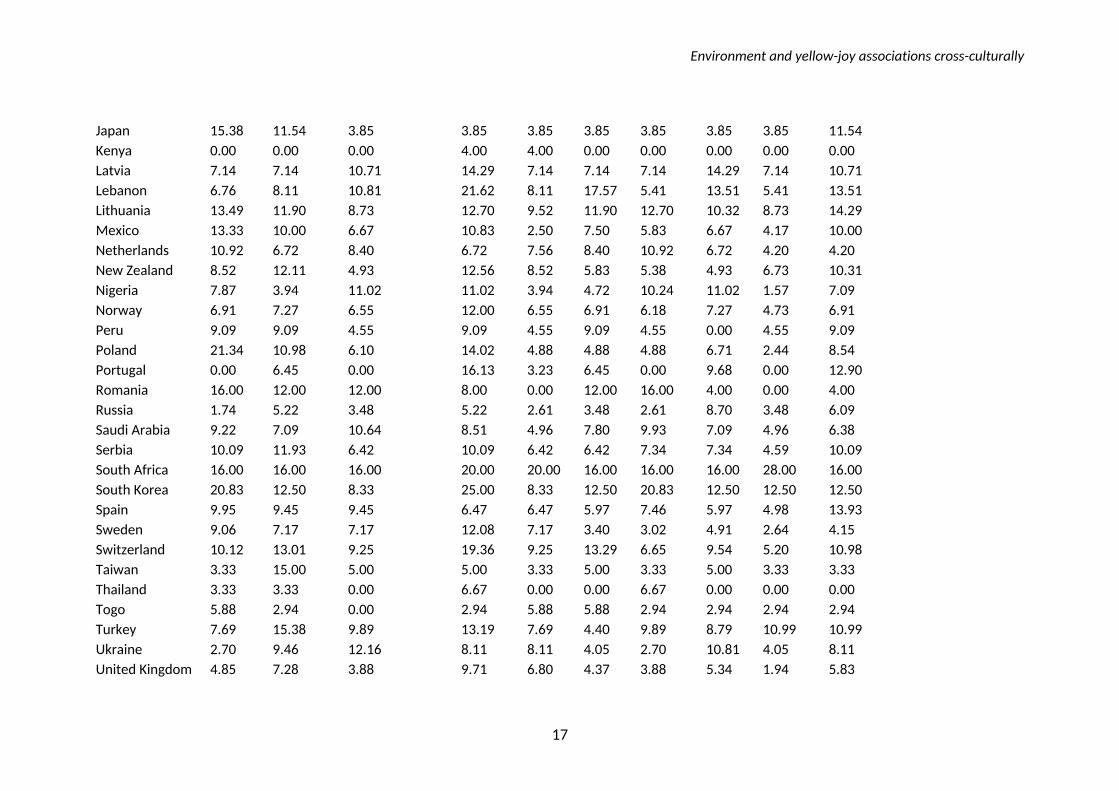
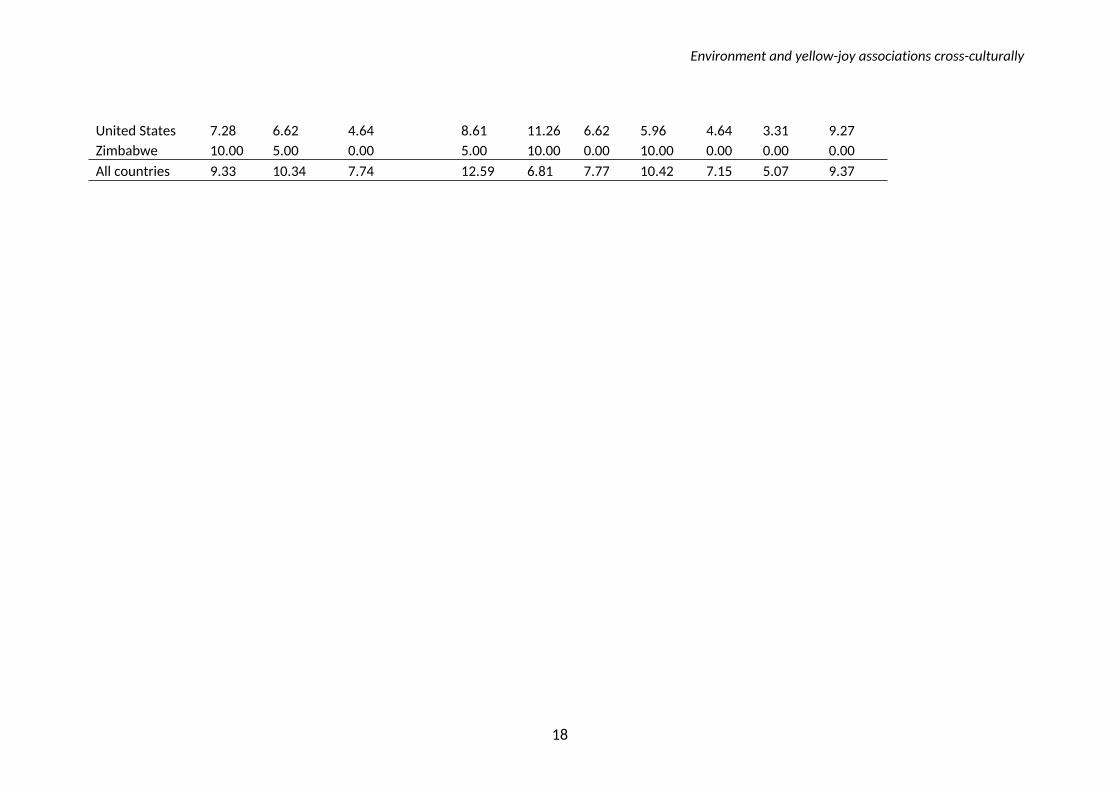
Table S9. The likelihood (in per cent) of the associations between yellow and 10 negative emotions in the 55 studied countries.
Anger Contempt Disappointment Disgust Fear Guilt Hate Regret Sadness ShameAlgeria 3.51 7.02 5.26 17.54 7.02 12.28 7.02 12.28 8.77 5.26Argentina 13.85 18.46 18.46 18.46 15.38 12.31 20.00 13.85 10.77 15.38Australia 5.56 5.56 1.85 11.11 7.41 5.56 1.85 3.70 0.00 5.56Austria 9.43 16.98 9.43 28.30 3.77 7.55 9.43 3.77 0.00 13.21Azerbaijan 8.08 11.32 8.78 13.86 4.16 7.39 11.78 12.01 5.08 11.78Bangladesh 9.52 14.29 19.05 23.81 4.76 4.76 19.05 4.76 14.29 23.81Belgium 5.83 7.77 6.80 9.71 6.80 5.83 6.80 4.85 3.88 10.68Bulgaria 6.25 9.38 0.00 3.13 6.25 6.25 9.38 3.13 3.13 6.25China 9.39 11.05 7.73 9.39 6.63 8.84 6.08 6.63 8.84 8.29Colombia 11.76 4.90 3.92 9.80 5.88 7.84 3.92 8.82 9.80 7.84Croatia 8.57 7.14 4.29 4.29 7.14 5.71 10.00 5.71 5.71 8.57Cyprus 11.11 12.35 10.19 15.74 7.41 9.88 22.22 7.41 10.49 13.89Denmark 3.45 3.45 6.90 3.45 6.90 13.79 6.90 3.45 0.00 13.79Egypt 3.77 13.84 7.55 13.21 6.29 8.81 15.09 6.92 1.26 5.66Estonia 10.69 2.29 3.82 5.34 2.29 3.05 3.82 3.05 2.29 7.63Finland 7.25 10.14 5.80 16.67 5.07 6.52 6.52 8.70 2.90 7.25France 8.60 10.75 6.45 10.75 3.23 1.08 3.23 4.30 1.08 5.38Gabon 3.33 6.67 6.67 10.00 3.33 10.00 3.33 3.33 3.33 6.67Georgia 8.27 13.53 15.79 13.53 4.51 2.26 9.77 6.02 8.27 9.77Germany 8.80 17.20 8.00 18.40 9.20 6.40 9.20 5.20 4.00 9.60Greece 16.43 16.63 10.22 17.03 10.42 16.83 33.67 7.21 6.01 13.83Iceland 2.82 1.41 1.41 2.82 2.82 7.04 1.41 4.23 2.82 2.82Iran 4.88 4.88 8.94 13.82 8.94 2.44 14.63 4.07 5.69 9.76Israel 14.63 18.29 9.76 18.29 9.76 10.98 25.61 7.32 4.88 9.76Italy 9.57 5.22 5.22 8.70 3.48 6.09 6.09 6.09 5.22 6.96
Environment and yellow-joy associations cross-culturally
17
Japan 15.38 11.54 3.85 3.85 3.85 3.85 3.85 3.85 3.85 11.54Kenya 0.00 0.00 0.00 4.00 4.00 0.00 0.00 0.00 0.00 0.00Latvia 7.14 7.14 10.71 14.29 7.14 7.14 7.14 14.29 7.14 10.71Lebanon 6.76 8.11 10.81 21.62 8.11 17.57 5.41 13.51 5.41 13.51Lithuania 13.49 11.90 8.73 12.70 9.52 11.90 12.70 10.32 8.73 14.29Mexico 13.33 10.00 6.67 10.83 2.50 7.50 5.83 6.67 4.17 10.00Netherlands 10.92 6.72 8.40 6.72 7.56 8.40 10.92 6.72 4.20 4.20New Zealand 8.52 12.11 4.93 12.56 8.52 5.83 5.38 4.93 6.73 10.31Nigeria 7.87 3.94 11.02 11.02 3.94 4.72 10.24 11.02 1.57 7.09Norway 6.91 7.27 6.55 12.00 6.55 6.91 6.18 7.27 4.73 6.91Peru 9.09 9.09 4.55 9.09 4.55 9.09 4.55 0.00 4.55 9.09Poland 21.34 10.98 6.10 14.02 4.88 4.88 4.88 6.71 2.44 8.54Portugal 0.00 6.45 0.00 16.13 3.23 6.45 0.00 9.68 0.00 12.90Romania 16.00 12.00 12.00 8.00 0.00 12.00 16.00 4.00 0.00 4.00Russia 1.74 5.22 3.48 5.22 2.61 3.48 2.61 8.70 3.48 6.09Saudi Arabia 9.22 7.09 10.64 8.51 4.96 7.80 9.93 7.09 4.96 6.38Serbia 10.09 11.93 6.42 10.09 6.42 6.42 7.34 7.34 4.59 10.09South Africa 16.00 16.00 16.00 20.00 20.00 16.00 16.00 16.00 28.00 16.00South Korea 20.83 12.50 8.33 25.00 8.33 12.50 20.83 12.50 12.50 12.50Spain 9.95 9.45 9.45 6.47 6.47 5.97 7.46 5.97 4.98 13.93Sweden 9.06 7.17 7.17 12.08 7.17 3.40 3.02 4.91 2.64 4.15Switzerland 10.12 13.01 9.25 19.36 9.25 13.29 6.65 9.54 5.20 10.98Taiwan 3.33 15.00 5.00 5.00 3.33 5.00 3.33 5.00 3.33 3.33Thailand 3.33 3.33 0.00 6.67 0.00 0.00 6.67 0.00 0.00 0.00Togo 5.88 2.94 0.00 2.94 5.88 5.88 2.94 2.94 2.94 2.94Turkey 7.69 15.38 9.89 13.19 7.69 4.40 9.89 8.79 10.99 10.99Ukraine 2.70 9.46 12.16 8.11 8.11 4.05 2.70 10.81 4.05 8.11United Kingdom 4.85 7.28 3.88 9.71 6.80 4.37 3.88 5.34 1.94 5.83
Environment and yellow-joy associations cross-culturally
18
United States 7.28 6.62 4.64 8.61 11.26 6.62 5.96 4.64 3.31 9.27Zimbabwe 10.00 5.00 0.00 5.00 10.00 0.00 10.00 0.00 0.00 0.00All countries 9.33 10.34 7.74 12.59 6.81 7.77 10.42 7.15 5.07 9.37
Environment and yellow-joy associations cross-culturally
19
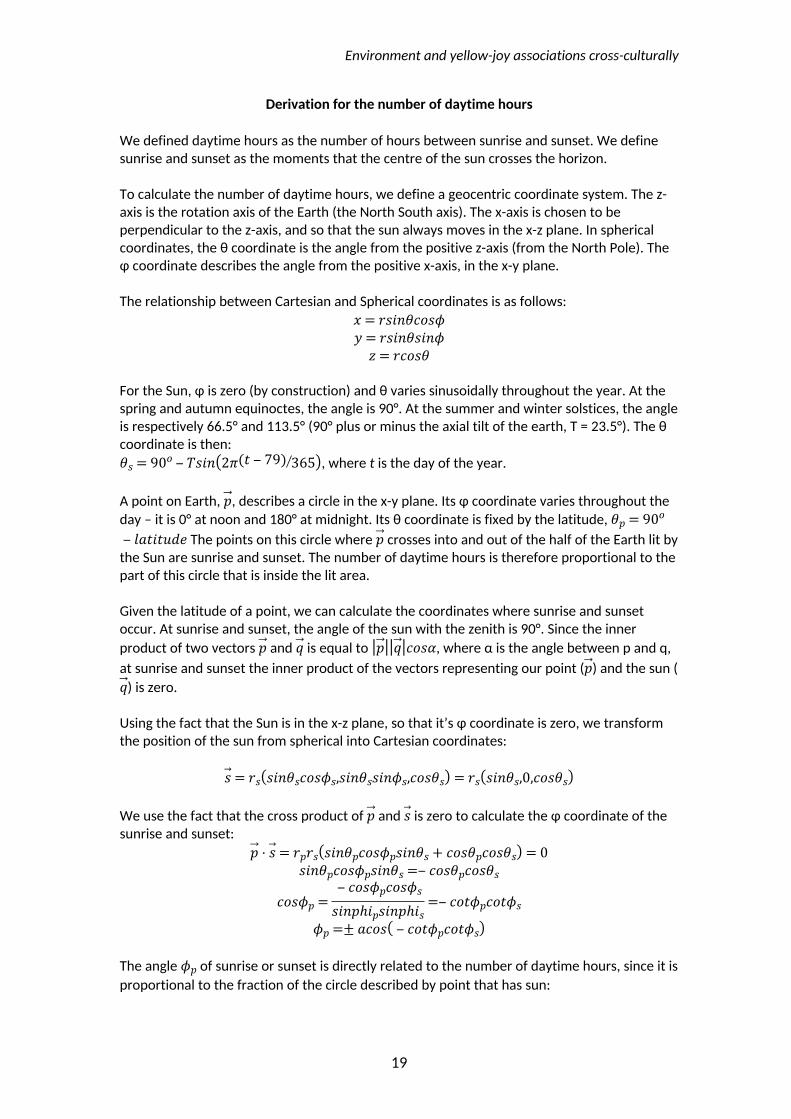
Derivation for the number of daytime hours
We defined daytime hours as the number of hours between sunrise and sunset. We define sunrise and sunset as the moments that the centre of the sun crosses the horizon.
To calculate the number of daytime hours, we define a geocentric coordinate system. The z-axis is the rotation axis of the Earth (the North South axis). The x-axis is chosen to be perpendicular to the z-axis, and so that the sun always moves in the x-z plane. In spherical coordinates, the θ coordinate is the angle from the positive z-axis (from the North Pole). The φ coordinate describes the angle from the positive x-axis, in the x-y plane.
The relationship between Cartesian and Spherical coordinates is as follows:𝑥 = 𝑟𝑠𝑖𝑛𝜃𝑐𝑜𝑠𝜙𝑦 = 𝑟𝑠𝑖𝑛𝜃𝑠𝑖𝑛𝜙
𝑧 = 𝑟𝑐𝑜𝑠𝜃
For the Sun, φ is zero (by construction) and θ varies sinusoidally throughout the year. At the spring and autumn equinoctes, the angle is 90°. At the summer and winter solstices, the angle is respectively 66.5° and 113.5° (90° plus or minus the axial tilt of the earth, T = 23.5°). The θ coordinate is then:
, where t is the day of the year.𝜃𝑠 = 90𝑜 ‒ 𝑇𝑠𝑖𝑛(2𝜋(𝑡 ‒ 79) 365)
A point on Earth, , describes a circle in the x-y plane. Its φ coordinate varies throughout the 𝑝day – it is 0° at noon and 180° at midnight. Its θ coordinate is fixed by the latitude, 𝜃𝑝 = 90𝑜
The points on this circle where crosses into and out of the half of the Earth lit by ‒ 𝑙𝑎𝑡𝑖𝑡𝑢𝑑𝑒 𝑝the Sun are sunrise and sunset. The number of daytime hours is therefore proportional to the part of this circle that is inside the lit area.
Given the latitude of a point, we can calculate the coordinates where sunrise and sunset occur. At sunrise and sunset, the angle of the sun with the zenith is 90°. Since the inner product of two vectors and is equal to , where α is the angle between p and q, 𝑝 𝑞 |𝑝||𝑞|𝑐𝑜𝑠𝛼at sunrise and sunset the inner product of the vectors representing our point ( ) and the sun (𝑝
) is zero.𝑞
Using the fact that the Sun is in the x-z plane, so that it’s φ coordinate is zero, we transform the position of the sun from spherical into Cartesian coordinates:
𝑠 = 𝑟𝑠(𝑠𝑖𝑛𝜃𝑠𝑐𝑜𝑠𝜙𝑠,𝑠𝑖𝑛𝜃𝑠𝑠𝑖𝑛𝜙𝑠,𝑐𝑜𝑠𝜃𝑠) = 𝑟𝑠(𝑠𝑖𝑛𝜃𝑠,0,𝑐𝑜𝑠𝜃𝑠)
We use the fact that the cross product of and is zero to calculate the φ coordinate of the 𝑝 𝑠sunrise and sunset:
𝑝 ⋅ 𝑠 = 𝑟𝑝𝑟𝑠(𝑠𝑖𝑛𝜃𝑝𝑐𝑜𝑠𝜙𝑝𝑠𝑖𝑛𝜃𝑠 + 𝑐𝑜𝑠𝜃𝑝𝑐𝑜𝑠𝜃𝑠) = 0𝑠𝑖𝑛𝜃𝑝𝑐𝑜𝑠𝜙𝑝𝑠𝑖𝑛𝜃𝑠 =‒ 𝑐𝑜𝑠𝜃𝑝𝑐𝑜𝑠𝜃𝑠
𝑐𝑜𝑠𝜙𝑝 =‒ 𝑐𝑜𝑠𝜙𝑝𝑐𝑜𝑠𝜙𝑠
𝑠𝑖𝑛𝑝ℎ𝑖𝑝𝑠𝑖𝑛𝑝ℎ𝑖𝑠=‒ 𝑐𝑜𝑡𝜙𝑝𝑐𝑜𝑡𝜙𝑠
𝜙𝑝 =± 𝑎𝑐𝑜𝑠( ‒ 𝑐𝑜𝑡𝜙𝑝𝑐𝑜𝑡𝜙𝑠)
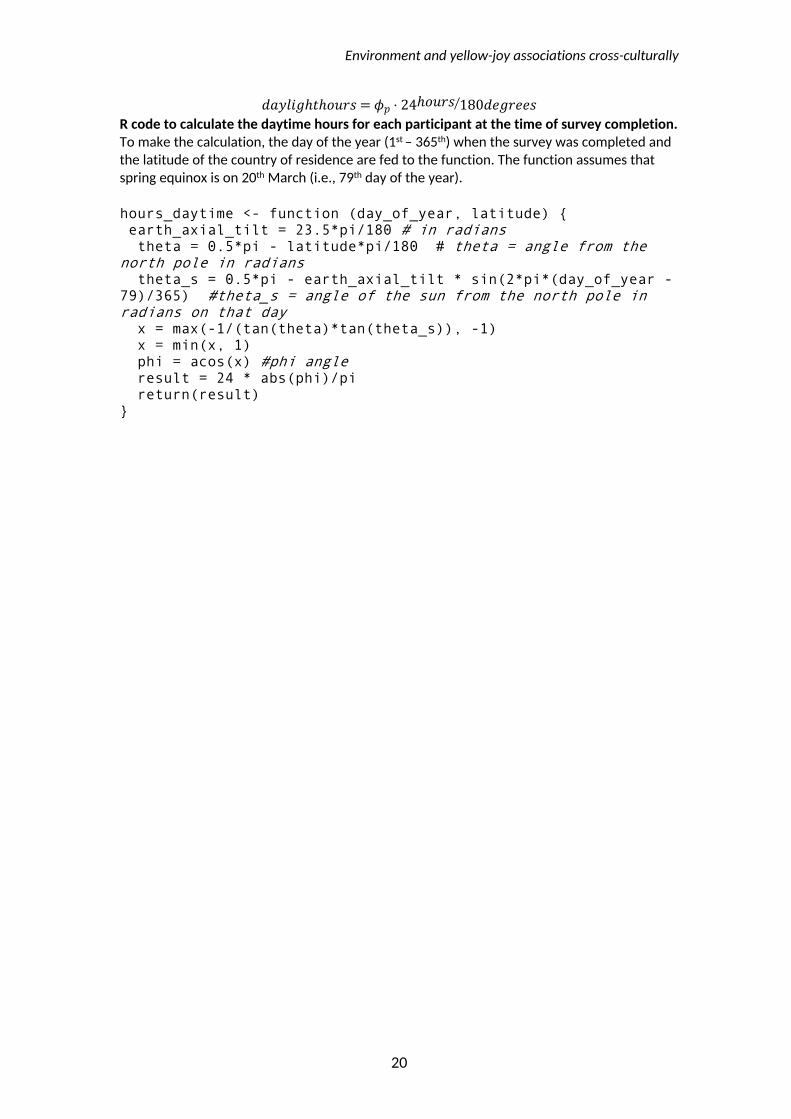
The angle of sunrise or sunset is directly related to the number of daytime hours, since it is 𝜙𝑝proportional to the fraction of the circle described by point that has sun:
Environment and yellow-joy associations cross-culturally
20
𝑑𝑎𝑦𝑙𝑖𝑔ℎ𝑡ℎ𝑜𝑢𝑟𝑠 = 𝜙𝑝 ⋅ 24ℎ𝑜𝑢𝑟𝑠 180𝑑𝑒𝑔𝑟𝑒𝑒𝑠R code to calculate the daytime hours for each participant at the time of survey completion. To make the calculation, the day of the year (1st – 365th) when the survey was completed and the latitude of the country of residence are fed to the function. The function assumes that spring equinox is on 20th March (i.e., 79th day of the year).
hours_daytime <- function (day_of_year, latitude) { earth_axial_tilt = 23.5*pi/180 # in radians theta = 0.5*pi - latitude*pi/180 # theta = angle from the north pole in radians theta_s = 0.5*pi - earth_axial_tilt * sin(2*pi*(day_of_year - 79)/365) #theta_s = angle of the sun from the north pole in radians on that day x = max(-1/(tan(theta)*tan(theta_s)), -1) x = min(x, 1) phi = acos(x) #phi angle result = 24 * abs(phi)/pi return(result)}