Characterization of the muscle proteome in cancer cachexia...
100
TECHNISCHE UNIVERSITÄT MÜNCHEN Lehrstuhl für Molekulare Ernährungsmedizin Characterization of the muscle proteome in cancer cachexia: Identification of novel targets for intervention Duarte das Neves Afonso Vollständiger Abdruck der von der Fakultät Wissenschaftszentrum Weihenstephan für Ernährung, Landnutzung und Umwelt der Technischen Universität München zur Erlangung des akademischen Grades eines Doktors der Naturwissenschaften genehmigten Dissertation. Vorsitzende: Univ.-Prof. Dr. H. Daniel Prüfer der Dissertation: 1. Univ.-Prof. Dr. M. Klingenspor 2. Univ.-Prof. Dr. M. Ebert Ruprecht-Karls-Universität Heidelberg Die Dissertation wurde am 02.04.2012 bei der Technischen Universität München eingereicht und durch die Fakultät Wissenschaftszentrum Weihenstephan für Ernährung, Landnutzung und Umwelt am 02.10.2012 angenommen.
-
Upload
phungkhanh -
Category
Documents
-
view
214 -
download
0
Transcript of Characterization of the muscle proteome in cancer cachexia...
TECHNISCHE UNIVERSITÄT MÜNCHEN
Lehrstuhl für Molekulare Ernährungsmedizin
Characterization of the muscle proteome in cancer cachexia:
Identification of novel targets for intervention
Duarte das Neves Afonso
Vollständiger Abdruck der von der Fakultät Wissenschaftszentrum Weihenstephan für Ernährung,
Landnutzung und Umwelt der Technischen Universität München zur Erlangung des akademischen
Grades eines
Doktors der Naturwissenschaften
genehmigten Dissertation.
Vorsitzende: Univ.-Prof. Dr. H. Daniel
Prüfer der Dissertation: 1. Univ.-Prof. Dr. M. Klingenspor
2. Univ.-Prof. Dr. M. Ebert
Ruprecht-Karls-Universität Heidelberg
Die Dissertation wurde am 02.04.2012 bei der Technischen Universität München eingereicht und
durch die Fakultät Wissenschaftszentrum Weihenstephan für Ernährung, Landnutzung und Umwelt
am 02.10.2012 angenommen.
TABLE OF CONTENTS
2
TABLE OF CONTENTS
ABBREVIATIONS 5
CHEMICALS AND CONSUMABLES 8
LIST OF FIGURES 10
LIST OF TABLES 12
1. INTRODUCTION 13
1.1. Cancer cachexia and skeletal muscle wasting 14
1.1.1. Cancer cachexia 14
1.1.2. Skeletal muscle wasting 18
1.1.3. Factors influencing muscle mass in cancer cachexia 20
1.2. Proteome research 22
1.2.1. Proteome and proteomics 22
1.2.2. Two-dimensional electrophoresis and mass spectrometry 23
1.2.3. Proteomics in cancer cachexia and muscle wasting research 26
1.3. Galectin-1 27
1.3.1. Galectins 27
1.3.2. Galectin-1 28
1.4. Aim of the study 32
TABLE OF CONTENTS
3
2. MATERIALS AND METHODS 33
2.1. Clinical Specimens 34
2.1.1. Preparation 34
2.1.2. Two-dimensional Electrophoresis 36
2.1.3. Immunoblotting 40
2.2. Mouse model 41
2.2.1. Skeletal muscle samples 41
2.2.2. Immunoblotting 41
2.3. In vitro models 41
2.3.1. Cell culture 41
2.3.2. Immunoblotting 43
2.3.3. Protein extraction from conditioned medium 43
2.3.4. Creatine kinase (CK) activity 43
2.4. Cloning, expression and purification of galectin-1 44
2.5. Data processing and statistical analysis 50
3. RESULTS 51
4. DISCUSSION 67
5. SUMMARY AND CONCLUSIONS 74

TABLE OF CONTENTS
4
ZUSAMMENFASSUNG 76
REFERENCES 77
CURRICULUM VITAE 99
ACKNOWLEDGMENTS 100
ABBREVIATIONS
5
ABBREVIATIONS
2-DE Two-dimensional electrophoresis
ACN Acetonitrile
Apc Adenomatous polyposis coli
APS Ammoniumpersulfate
Bis Bisacrylamide
BSA Bovine Serum Albumin
CHAPS (3-[(3-Cholamidopropyl)-dimethylammonio]-1-propane sulfonate)
CHCA α-Cyano-4-hydroxycinnamic acid
CM Conditioned medium
D0-D5 Day 0 – Day 5
Da Dalton
Dex Dexamethasone
DM Differentiation medium
DMEM Dulbecco´s modified eagle medium
DSMZ Deutsche Sammlung von Mikroorganismen und Zellkulturen (german
collection of microorganisms and cell cultures)
DTT Dithiothreitol
Erk1/2 Extracellular signal-regulated kinase 1 and 2
ESI Electropspray ionization
FBS Fetal Bovin Serum
GM Growth medium
h hour
HS Horse serum
ABBREVIATIONS
6
IEF Isoelectric focusing
IGF-1 Insulin-like growth factor-1
IL Interleukin
INF Interferon
IPG Immobilized pH gradient
LC Liquid chromatography
MALDI -TOF Matrix assisted laser desorption ionization - time-of-flight
Min Multiple intestinal neoplasia
min minute
Mr Relative molecular mass
MS Mass spectrometry
MS/MS Tandem mass spectrometry
MuRF-1 Muscle RING-finger protein-1
Na3VO4 Sodium orthovanadate
NF-kB Nuclear factor ‘kappa-light-chain-enhancer’ of activated B cells
NH4HCO3 Ammonium bicarbonate
PAGE Polyacrylamide gel electrophoresis
PBS Phosphate buffered saline
PFA Paraformaldehyde
pl Isoelectric point
PMF Peptide mass fingerprint
SDS Sodium dodecylsulfate
TEMED N,N,N',N'-tetramethylethylendiamine
TEV Tobacco etch virus

ABBREVIATIONS
7
TNF Tumor necrosis factor
TOF/TOF Tandem time-of-flight
CHEMICALS, CONSUMABLES AND ANTIBODIES
8
CHEMICALS, CONSUMABLES AND ANTIBODIES
Chemicals and consumables Company
Amicon centrifugal filters Millipore
BCA protein assay kit Thermo Scientific
CHAPS Serva Electrophoresis
CHCA Bruker
Complete Mini protease inhibitor cocktail Roche
Creatine kinase assay BioAssay Systems
Dexamethasone Merck
DTT Serva Electrophoresis
DMEM Gibco
ECL detection system GE Healthcare
FBS Gibco
Heat-inactivated horse serum Invitrogen
HiLoad 16/60 Superdex 200 column GE Healthcare
HiTrap Chelating HP column GE Healthcare
Immobiline Drystrip GE Healthcare
Iodoacetamide Serva Electrophoresis
IPG buffer GE Healthcare
Long-R3-IGF-1 GenScript
Microcon centrifugal filter Millipore
PlusOne 2-D Quant kit GE Healthcare
CHEMICALS, CONSUMABLES AND ANTIBODIES
9
PlusOne silver staining kit GE Healthcare
RAD001 (Everolimus) Novartis
Thiourea GE Healthcare
Urea Serva Electrophoresis
Antibodies Company
Rabbit polyclonal to galectin-1 Millipore
Rabbit polyclonal to galectin-1 Abcam
Mouse monoclonal to IGF-1 Abcam
Rabbit polyclonal to IGF-1 Millipore
Rabbit polyclonal to MuRF-1 Abcam
Rabbit polyclonal to myogenin Abcam
Rabbit polyclonal to beta-tubulin Abcam
Rabbit polyclonal to atrogin-1 Biotrend
Rabbit polyclonal to Erk1/2 Cell Signaling
ECL anti-rabbit 2nd horseradish peroxidase-conjugated GE Healthcare
ECL anti-mouse 2nd horseradish peroxidase-conjugated GE Healthcare
LIST OF FIGURES
10
LIST OF FIGURES
Figure 1. Main factors leading to cachexia and finally to muscle wasting
Figure 2. Cachexia diagnosis criteria
Figure 3. Three known proteolytic systems implicated in muscle atrophy resulting from disuse
or disease
Figure 4. IGF-1/PI3K/Akt signaling in hypertrophy and atrophy
Figure 5. Complexity increases from genome to proteome
Figure 6. Scheme showing protein separation during the two dimensions of 2-DE
Figure 7 . Scheme of MALDI-TOF mass spectrometry
Figure 8. Subdivision of galectins in three groups based on their structure
Figure 9. Biochemical features and structure–function relationships of galectins
Figure 10. Example of galectin-1 multifunctional roles
Figure 11. Scheme of skeletal muscle showing the colocalization of gal-1 with sarcomeric actin
in the I band region
Figure 12. Localization of the rectus abdominis muscle within trunk of the human body
Figure 13. Main steps during 2-DE procedure
Figure 14. Proteomics Analyzer 4700 (MALDI-TOF/TOF) mass spectrometer from Applied
Biosystems
Figure 15. Localization of the vastus lateralis muscle within the upper leg and an ApcMin/+
mouse
Figure 16. Experimental overview of differentiation
Figure 17. Experimental overview of induced-atrophy and -hypertrophy
Figure 18. Scheme of the enzyme-coupled reactions taken place at the CK assay showing when
NADPH is produced.
LIST OF FIGURES
11
Figure 19. pETM-11, an EMBL-made expression vector harbouring an N-terminal His6-tag
followed by a TEV protease cleavage site
Figure 20. Äkta Explorer with fixed columns
Figure 21. Representative 2-DE gels after silver-staining procedure
Figure 22. Representative 2-DE gel generated by REDFIN3 software highlighting differentially
expressed proteins (p < 0.05) from cancer cachexia versus cancer non-cachexia patients
Figure 23. PCA of 2-DE data shows evidence of separation between cachexia and non-cachexia
groups and the inexistence of significant outliers
Figure 24. Gal-1-corresponding spots obtained during image analysis
Figure 25. Validation of galectin-1 overexpression in human skeletal muscle by western blotting
Figure 26. Galectin-1 protein overexpression observed in skeletal muscle tissue of a mouse
model (ApcMin/+
), which develops cachexia between three and six months of age
Figure 27. Regulation of galectin-1 during myotubes differentiation and dexamethasone
treatment
Figure 28. Microscope pictures taken from D5 myotubes cultivated in differentiation medium
(control) and from myotubes treated with Dex at D3 for 24 h
Figure 29. Regulation of galectin-1 in myotubes atrophy, hypertrophy and regeneration using
IGF-1
Figure 30. Regulation of galectin-1 secretion
Figure 31. SDS-PAGE showing protein expression
Figure 32. Galectin-1 purification by affinity chromatography
Figure 33. Galectin-1 purification by size exclusion chromatography
Figure 34. Assessment of the differentiation state of C2C12 cells by CK activity
Figure 35. Effect of recombinant galectin-1 on myotubes differentiation after atrophy

LIST OF TABLES
12
LIST OF TABLES
Table 1. Examples of agents currently in clinical development for the treatment of cachexia
Table 2. Overview of recent clinical proteomics applications towards cancer biomarker
discovery
Table 3. Overview of the usefulness of galectin-1 in several diseases
Table 4. Characteristics of 19 patients with ductal adenocarcinoma of the pancreas
Table 5. Characteristics of 10 patients with pancreatic cancer without cachexia and 9 patients
with pancreatic cancer with cachexia
Table 6. MS-compatible silver staining protocol
Table 7. Reaction mixture used in the PCR amplification of the insert
Table 8. List of the identified differentially expressed proteins after 2-DE coupled with mass
spectrometry analysis
Table 9. Body weight and respective change in ApcMin/+
mice grouped by age and cachexia
development
Table 10. Percentages of slow-twitch type I fibers in rectus abdominis, vastus lateralis and
soleus muscles

INTRODUCTION
13
1. INTRODUCTION
INTRODUCTION
14
1. INTRODUCTION
1.1. Cancer cachexia and skeletal muscle wasting
1.1.1. Cancer cachexia
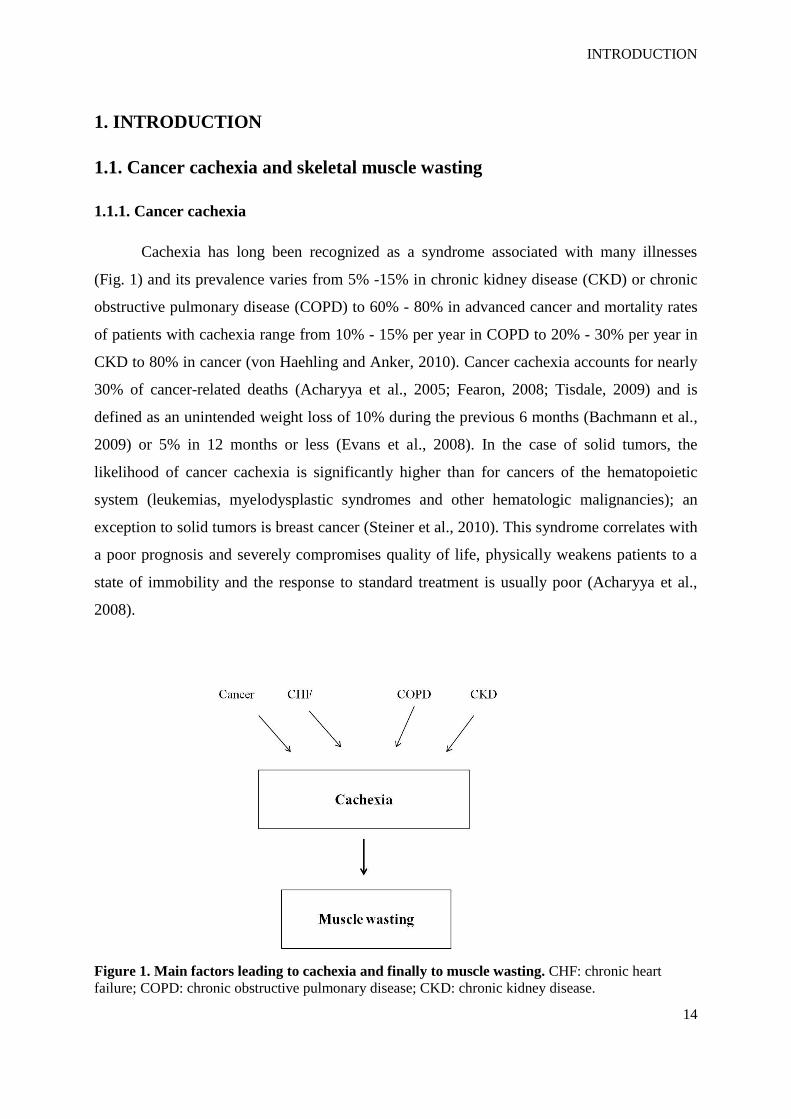
Cachexia has long been recognized as a syndrome associated with many illnesses
(Fig. 1) and its prevalence varies from 5% -15% in chronic kidney disease (CKD) or chronic
obstructive pulmonary disease (COPD) to 60% - 80% in advanced cancer and mortality rates
of patients with cachexia range from 10% - 15% per year in COPD to 20% - 30% per year in
CKD to 80% in cancer (von Haehling and Anker, 2010). Cancer cachexia accounts for nearly
30% of cancer-related deaths (Acharyya et al., 2005; Fearon, 2008; Tisdale, 2009) and is
defined as an unintended weight loss of 10% during the previous 6 months (Bachmann et al.,
2009) or 5% in 12 months or less (Evans et al., 2008). In the case of solid tumors, the
likelihood of cancer cachexia is significantly higher than for cancers of the hematopoietic
system (leukemias, myelodysplastic syndromes and other hematologic malignancies); an
exception to solid tumors is breast cancer (Steiner et al., 2010). This syndrome correlates with
a poor prognosis and severely compromises quality of life, physically weakens patients to a
state of immobility and the response to standard treatment is usually poor (Acharyya et al.,
2008).
Figure 1. Main factors leading to cachexia and finally to muscle wasting. CHF: chronic heart
failure; COPD: chronic obstructive pulmonary disease; CKD: chronic kidney disease.
INTRODUCTION
15
Cancer cachexia is a severely debilitating syndrome, which is characterized by
increased activity of intracellular proteolytic pathways, which is clinically manifest by loss of
body weight, lack of appetite, but also, and especially, a loss of muscle mass, with depletion
of fat deposits and deep metabolic changes (Beller et al., 1997; Tisdale, 2009). It adversely
affects the quality of life of cancer patients and is seen as the final consequence of a series of
metabolic and molecular alterations that occur very early, when it is seen as substantially non-
reversible with common nutritional or metabolic treatment (Bartlett et al., 1995; Fearon,
2008). The pathogenesis of loss of muscle mass in the course of cancer has not yet been fully
elucidated, since it depends on diverse factors, but it seems mainly due to an imbalance
between the rate of synthesis and protein degradation in skeletal muscle (Meguid et al., 2000;
Tisdale, 2009).
Typical patients suffering from malignant tumors (especially if located in the digestive
tract) have complex etiology in which different mechanisms come into play: anorexia,
abnormal glucose metabolism and the release of substances produced by the tumor or from
the host are capable of influencing the metabolism back toward catabolism. These
mechanisms are highly debilitating features in this disease process (Weindruch et al., 2001).
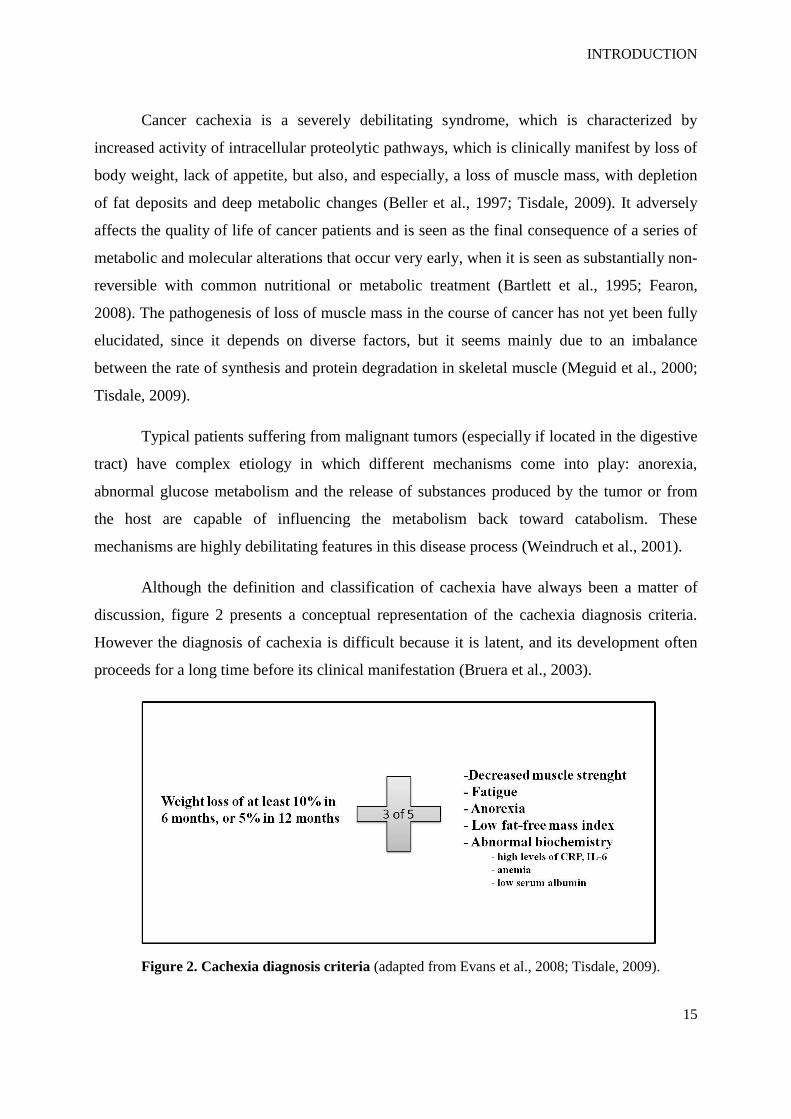
Although the definition and classification of cachexia have always been a matter of
discussion, figure 2 presents a conceptual representation of the cachexia diagnosis criteria.
However the diagnosis of cachexia is difficult because it is latent, and its development often
proceeds for a long time before its clinical manifestation (Bruera et al., 2003).
Figure 2. Cachexia diagnosis criteria (adapted from Evans et al., 2008; Tisdale, 2009).
INTRODUCTION
16
Many times cachexia is associated with anorexia that may result from cancer treatment
(chemotherapy, radiotherapy or immunotherapy), which often induces nausea and vomiting to
varying degrees (Leppanen et al., 2005). It can also contribute to reduced intake alterations in
perception of food and psychological reasons, such as depression. Sometimes anorexia can be
attributed as a direct effect of the tumor, when it is located in the hypothalamus or in the
digestive system (Beal et al., 1995). However, in most cases, the origin of the anorexia
associated with cachexia appears to be the metabolic alterations experienced by the patient as
a result of the presence of the tumor (Warmolts et al., 1975). Different factors, both humoral
and source segregated by the host in response to tumor growth, or secreted by the tumor cells
themselves may play an important role in the anorexic response (Fearon et al., 2006). In short,
anorexia appears to be more an effect than a cause of weight loss and, in fact, decreased
intake may manifest itself after there has been weight loss (Bhattacharyya et al., 2010). In any
case, malnutrition due to reduced food intake only exacerbates the cachectic state, promoting
a positive feedback mechanism that can eventually lead to death.
Treatments
The best approach to cure cachexia would be curing the cancer itself, however, if there
were a therapy for cachexia, treating cancer would be easier. However, currently there are no
effective treatments specifically targeting skeletal muscle cachexia. Being cancer cachexia a
multi-factorial syndrome, multimodal approaches that address the different issues could be a
key development in terms of therapy. Studies are being conducted, for example, in the
following areas: stabilizing and improving the nutritional status, finding and validating novel
biomarkers, developing better techniques for the estimation of muscle mass, and improving
exercise training.
Exercise training is recognized as having obvious and important roles in skeletal
muscle changes by acting in several pathways due to its multifactorial effects. Within the
muscle, it has anabolic effects mediated by cytokines, it exerts anti-inflammatory effects
inhibiting TNF-α in vitro, and it has antioxidative effects increasing the activity of radical
scavenger enzymes (Lenk et al., 2010).
Because cachexia is closely associated with anorexia, the use of drugs such as steroids
is administrated to help increase appetite (Zhou et al., 2011; Tisdale, 2009). Megestrol acetate
INTRODUCTION
17
is the most frequently used stimulant in the treatment of cancer cachexia; it is a progestin used
to treat the source of advanced breast cancer and is able to increase appetite and body weight
in cancer patients by down-regulating the synthesis and release of proinflammatory cytokines.
However, patients receiving megestrol acetate show an inferior response to chemotherapy and
a trend for inferior survival duration (Tisdale, 2009). Corticosteroids such as dexamethasone
are also used to stimulate appetite but only at late stages, since they enhance catabolism in
skeletal muscle (Tisdale, 2009). Ghrelin, a neuropeptide released from the stomach in
response to fasting, can also induce a positive energy balance by reducing fat and stimulating
the appetite (Fearon et al., 2006).
Others agents have been studied for their anti-inflammatory action, such as melatonin,
omega-3 polyunsaturated fatty acids, eicosapentaenoic acid, pentoxifylline and thalidomide,
but the latter still have scarce clinical data for everyday use (Bhattacharyya et al., 2010).
Table 1 provides examples of drugs currently in development (clinical trials) for the treatment
of cachexia.
Table 1. Examples of agents currently in clinical development for the treatment of cachexia
(adapted from Dodson et al., 2011).
Drug class Example Mechanism of action
Anti-TNF-α Thalidomide Inhibition of TNF-α, COX-2 and NF-kB
Anti-IL-6 antibodies ALD-518 Inhibition of IL-6
Anabolic steroid analogs Oxandrolone Up-regulation of protein synthesis,
production of IGF-1
Immunomodulators AVR-118 Stimulation of proinflammatory cytokines
COX-2 inhibitors Celecoxib Inhibition of COX-2
Validated markers, significant to the underlying metabolic irregularities in cancer
cachexia, are needed in order that interventions based on the understanding of its mechanisms
can be generated. Some factors associated with cancer cachexia have already been found in
INTRODUCTION
18
tumor tissue (Todorov et al., 1996), urine (Cariuk et al., 1997; Williams et al., 2004), serum
(Beck et al., 1990; Felix et al., 2011) and adipose tissue (Bing et al., 2004), but because the
skeletal muscle is one of the most affected tissues in cachexia, the identification of additional
markers within this tissue (Stephens et al., 2010; Workeneh et al., 2006), which could
improve diagnosis, prognosis or therapy of this cancer syndrome, is required.
1.1.2. Skeletal muscle wasting
Skeletal muscle atrophy or wasting refers to the decrease in the size of skeletal muscle.
Changes in cell morphology may affect isolated cells or groups of them, therefore the
modification of whole tissue. All stimuli that act on a cell are actually functional stimuli;
when they exceed the physiological limits, they may injure the cell and cause it to reverse the
processes of life, or cause significant regressive modifications (Warmolts et al., 1975).
Moreover, atrophy must be distinguished from a disease that entails structural reduction of an
organ, or part thereof, due to a necrotic destructive process, in which case there is massive cell
death (Ryan et al., 2009). Skeletal muscle satellite cells, specialized cells residing beneath the
basal lamina of myofibers, are usually in a quiescent state in adult muscle; but when minor
damage or injury occurs, signals are generated within the muscle that activate these satellite
cells into myoblasts and stimulate them to migrate to the site of an injury where they
proliferate, differentiate, and fuse with the damaged fibers or form new fibers (Sharples and
Stewart, 2011; Sakuma et al., 2010; Chargé et al., 2004).
There are several diseases and disorders that cause a decrease in muscle mass,
including cachexia, extensive burns, liver failure, electrolyte disturbances, anemia and
inactivity. Others can cause muscle wasting syndromes, such as malnutrition, denervation of
motor neurons in spinal muscular atrophy of childhood, and the inflammatory myopathies and
dystrophies, among others (Warmolts et al., 1975; Evans, 2010). In all cases of atrophy, the
cytoplasm is the most affected and there is almost always a reduction in quantity of it - so
much so that, observing the atrophic tissue under a microscope can distinguish a discrete cell
densification caused by the reduction uniform cell volume. These changes are accompanied
by profound alterations in cytoplasm, turbidity, presence of pigment granules and a decreased
number of mitochondria (Ryan et al., 2009).
INTRODUCTION
19
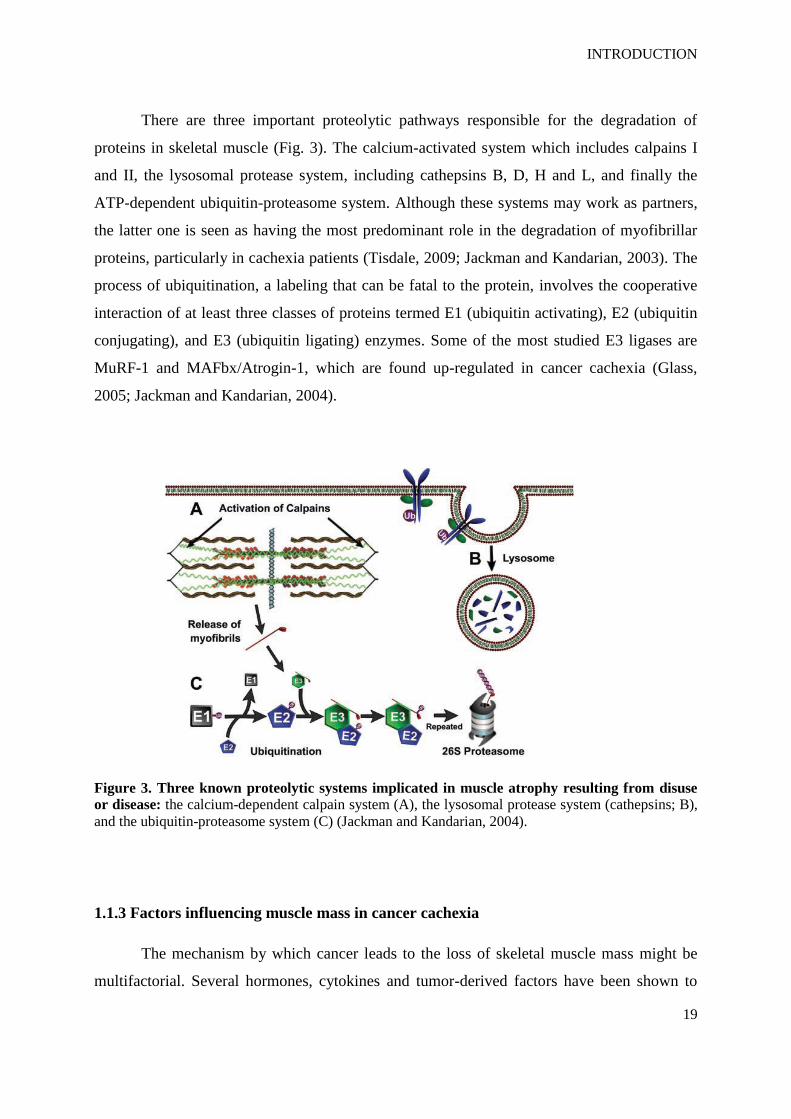
There are three important proteolytic pathways responsible for the degradation of
proteins in skeletal muscle (Fig. 3). The calcium-activated system which includes calpains I
and II, the lysosomal protease system, including cathepsins B, D, H and L, and finally the
ATP-dependent ubiquitin-proteasome system. Although these systems may work as partners,
the latter one is seen as having the most predominant role in the degradation of myofibrillar
proteins, particularly in cachexia patients (Tisdale, 2009; Jackman and Kandarian, 2003). The
process of ubiquitination, a labeling that can be fatal to the protein, involves the cooperative
interaction of at least three classes of proteins termed E1 (ubiquitin activating), E2 (ubiquitin
conjugating), and E3 (ubiquitin ligating) enzymes. Some of the most studied E3 ligases are
MuRF-1 and MAFbx/Atrogin-1, which are found up-regulated in cancer cachexia (Glass,
2005; Jackman and Kandarian, 2004).
Figure 3. Three known proteolytic systems implicated in muscle atrophy resulting from disuse
or disease: the calcium-dependent calpain system (A), the lysosomal protease system (cathepsins; B),
and the ubiquitin-proteasome system (C) (Jackman and Kandarian, 2004).
1.1.3 Factors influencing muscle mass in cancer cachexia
The mechanism by which cancer leads to the loss of skeletal muscle mass might be
multifactorial. Several hormones, cytokines and tumor-derived factors have been shown to
INTRODUCTION
20
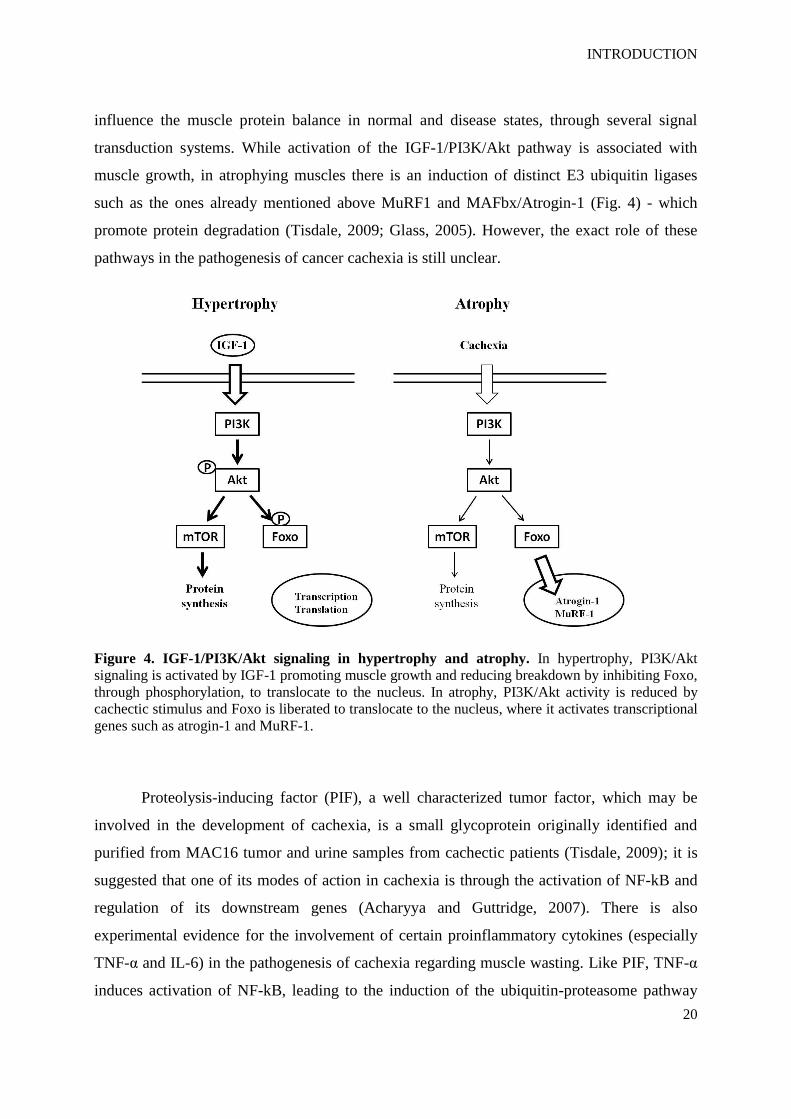
influence the muscle protein balance in normal and disease states, through several signal
transduction systems. While activation of the IGF-1/PI3K/Akt pathway is associated with
muscle growth, in atrophying muscles there is an induction of distinct E3 ubiquitin ligases
such as the ones already mentioned above MuRF1 and MAFbx/Atrogin-1 (Fig. 4) - which
promote protein degradation (Tisdale, 2009; Glass, 2005). However, the exact role of these
pathways in the pathogenesis of cancer cachexia is still unclear.
Figure 4. IGF-1/PI3K/Akt signaling in hypertrophy and atrophy. In hypertrophy, PI3K/Akt
signaling is activated by IGF-1 promoting muscle growth and reducing breakdown by inhibiting Foxo,
through phosphorylation, to translocate to the nucleus. In atrophy, PI3K/Akt activity is reduced by
cachectic stimulus and Foxo is liberated to translocate to the nucleus, where it activates transcriptional
genes such as atrogin-1 and MuRF-1.
Proteolysis-inducing factor (PIF), a well characterized tumor factor, which may be
involved in the development of cachexia, is a small glycoprotein originally identified and
purified from MAC16 tumor and urine samples from cachectic patients (Tisdale, 2009); it is
suggested that one of its modes of action in cachexia is through the activation of NF-kB and
regulation of its downstream genes (Acharyya and Guttridge, 2007). There is also
experimental evidence for the involvement of certain proinflammatory cytokines (especially
TNF-α and IL-6) in the pathogenesis of cachexia regarding muscle wasting. Like PIF, TNF-α
induces activation of NF-kB, leading to the induction of the ubiquitin-proteasome pathway
INTRODUCTION
21
(Tisdale, 2009), and its levels are elevated in patients with cancer cachexia, contributing to
negative nitrogen balance (Glass, 2005). In cell culture, TNF-α up-regulates NF-kB, augments
myofibrillar proteolysis and represses myosin synthesis, as well genetic inhibition of NF-kB
via the expression of a dominant negative form of IkB blocks protein degradation (Jackman
and Kandarian, 2004). Concerning IL-6, there is data showing that this cytokine is necessary
for the onset of adipose and skeletal muscle wasting in the ApcMin/+
mouse and that circulating
IL-6 can regulate ApcMin/+
mouse tumor burden (Baltgalvis et al., 2008). Also, muscle atrophy
is observed in IL-6 transgenic mice that overexpress IL-6 (Tisdale, 2009). Angiotensin II, a
hormone that plays a central role in cardiovascular homeostasis, induces the activation of
PKR, being responsible ultimately for the increase of protein breakdown via the ubiquitin-
proteasome pathway. Inhibition of PKR attenuates muscle atrophy increasing muscle mass in
a mouse model and also inhibited its tumor growth (Eley et al., 2007).
Myostatin is a transforming growth factor (TGF)-β and functions as a potent negative
regulator of muscle mass. Muscles from myostatin-null mice weigh ca. 2 to 4 times more than
the control group (Acharyya and Guttridge, 2007) and when binding to activin type IIB
receptor, myostatin is able to trigger the up-regulation of atrogin-1 and MuRF-1 and down-
regulation of important myogenesis genes such as myoD and myogenin (Elkina et al., 2011).
Also ActRIIB, a receptor that can be activated by myostatin and activin, has an important role
in limiting muscle growth and its antagonism has been seen as a promising new approach for
curing cancer cachexia. Using several models of cancer cachexia (cell lines and mice) and
utilizing sActRIIB as an antagonist, ActRIIB pathway was blocked, inducing the abolishment
of ubiquitin ligases and promoting muscle stem cell growth (Zhou et al., 2010).
In vitro studies have documented several molecules that can modulate satellite cell
activity particularly, insulin-like growth factor-1 (IGF-1), whose expression has a role in
regenerating muscle. IGF-1 positively regulated the proliferation and differentiation of
satellite cells/myoblasts in vitro via different pathways (Jennische et al., 1992; Latres et al.,
2005). In addition, IGF-1 system was shown to be down-regulated in experimental cancer
cachexia using a rat model (Costelli et al., 2006).
INTRODUCTION
22
1.2. Proteome research
1.2.1. Proteome and proteomics
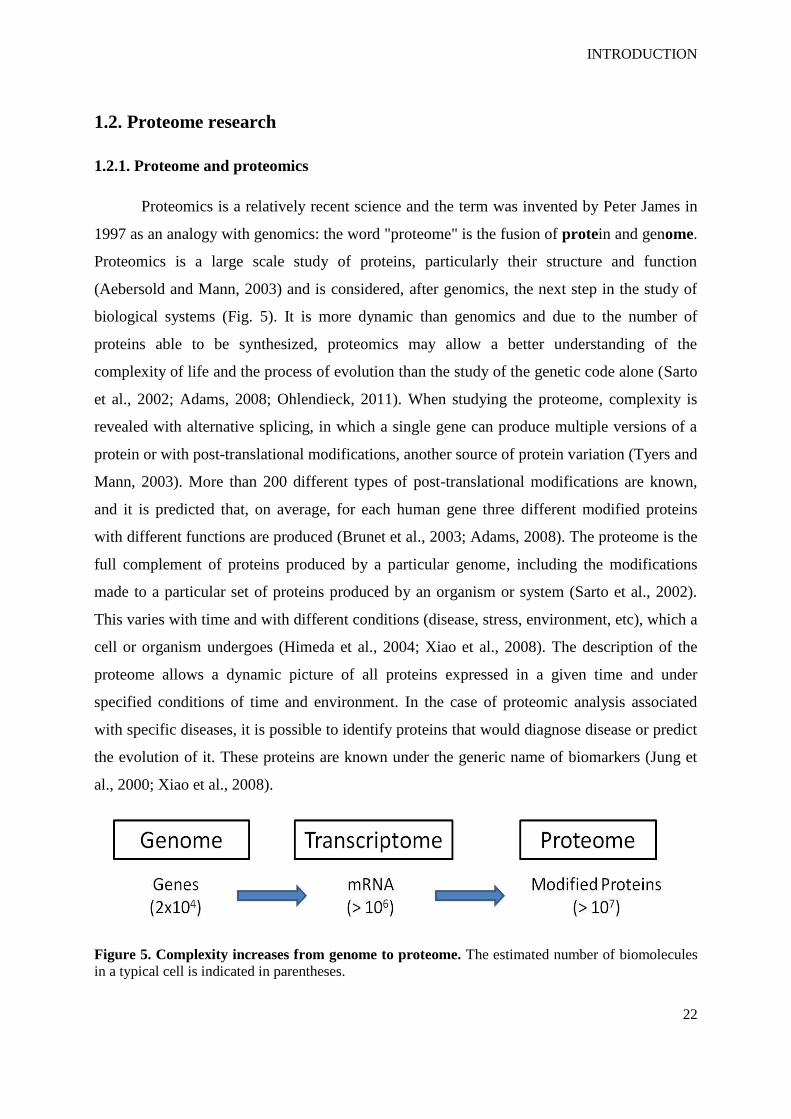
Proteomics is a relatively recent science and the term was invented by Peter James in
1997 as an analogy with genomics: the word "proteome" is the fusion of protein and genome.
Proteomics is a large scale study of proteins, particularly their structure and function
(Aebersold and Mann, 2003) and is considered, after genomics, the next step in the study of
biological systems (Fig. 5). It is more dynamic than genomics and due to the number of
proteins able to be synthesized, proteomics may allow a better understanding of the
complexity of life and the process of evolution than the study of the genetic code alone (Sarto
et al., 2002; Adams, 2008; Ohlendieck, 2011). When studying the proteome, complexity is
revealed with alternative splicing, in which a single gene can produce multiple versions of a
protein or with post-translational modifications, another source of protein variation (Tyers and
Mann, 2003). More than 200 different types of post-translational modifications are known,
and it is predicted that, on average, for each human gene three different modified proteins
with different functions are produced (Brunet et al., 2003; Adams, 2008). The proteome is the
full complement of proteins produced by a particular genome, including the modifications
made to a particular set of proteins produced by an organism or system (Sarto et al., 2002).
This varies with time and with different conditions (disease, stress, environment, etc), which a
cell or organism undergoes (Himeda et al., 2004; Xiao et al., 2008). The description of the
proteome allows a dynamic picture of all proteins expressed in a given time and under
specified conditions of time and environment. In the case of proteomic analysis associated
with specific diseases, it is possible to identify proteins that would diagnose disease or predict
the evolution of it. These proteins are known under the generic name of biomarkers (Jung et
al., 2000; Xiao et al., 2008).
Figure 5. Complexity increases from genome to proteome. The estimated number of biomolecules
in a typical cell is indicated in parentheses.
INTRODUCTION
23
The main technologies under development include two-dimensional electrophoresis
(2-DE), staining and analysis tools of the gels, technology for the identification of proteins,
such as mass spectrometry, electronic management technologies, such as databases and search
algorithms, and data recovery. The main challenge of proteomics is the automation and
integration of such technologies (Ornstein et al., 2000; Aebersold and Mann, 2003; Walther
and Mann, 2010). Mass spectrometry made possible the analysis of complex biological
molecules and the exponential growth in the number of entries for genes and proteins in the
databases (Sarto et al., 2002; Aebersold and Mann, 2003). This, combined with the use of
powerful methods of fractionation and separation of peptides and proteins such as 2-DE and
high resolution liquid chromatography (HPLC), has consolidated proteomics since the mid
1990s, as a science for massive protein analysis (Celis et al., 1999; Tyers and Mann, 2003;
Xiao et al., 2008).
1.2.2. Two-dimensional electrophoresis and mass spectrometry (MS)
Electrophoresis is the central technique for analyzing large numbers of proteins at the
same time. The electrophoretic technique was invented by Tiselius in the 1930s and further
developed in the 1950s by Poulick and Smithies; the first two-dimensional gel was described
in 1975 by O`Farrell. The streamlines of the process are still in use today (Rabilloud and
Chevallet, 2000).
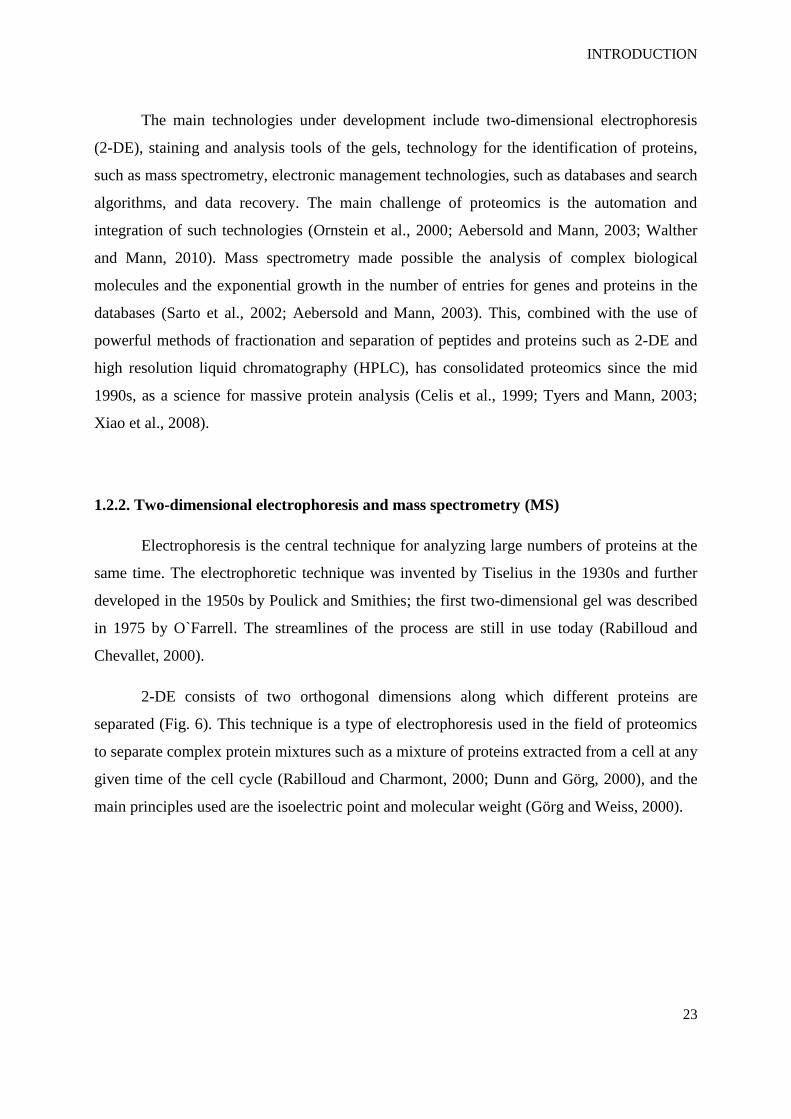
2-DE consists of two orthogonal dimensions along which different proteins are
separated (Fig. 6). This technique is a type of electrophoresis used in the field of proteomics
to separate complex protein mixtures such as a mixture of proteins extracted from a cell at any
given time of the cell cycle (Rabilloud and Charmont, 2000; Dunn and Görg, 2000), and the
main principles used are the isoelectric point and molecular weight (Görg and Weiss, 2000).
INTRODUCTION
24
Figure 6. Scheme showing protein separation during the two dimensions of 2-DE.
The first dimension, isoelectric focusing (IEF), usually uses a gradient of pH obtained
with amphoteric molecules being made to migrate within a gel of polyacrylamide placed in an
electric field. This system is based on strips and provides more stability of the gradient and a
higher experimental reproducibility (Rabilloud and Charmont, 2000; Görg et al., 2004). The
sample is loaded on the gel and the applied electric field causes the proteins to move towards
their isoelectric point, to which each molecule is in the zwitterionic form having a neutral
global charge (Rabilloud and Chevallet, 2000; Görg et al., 2004). If in the first dimension the
proteins are separated by their charge, in the second dimension, SDS-PAGE, the separation of
proteins is done in the presence of SDS and the proteins are separated by their molecular
mass. It is possible to separate thousands of proteins in one gel. Proper sample preparation is
often the most important step to a successful outcome (Görg and Weiss, 2000; Görg et al.,
2004). The spots on the gel are removed and each is treated with trypsin to produce a
characteristic pattern of peptides. The peptides are identified by mass spectrometry, a
technique that measures the mass of molecules (in this case the mass of the peptides produced
by digestion with trypsin) with a high degree of accuracy (Görg and Weiss, 2000).
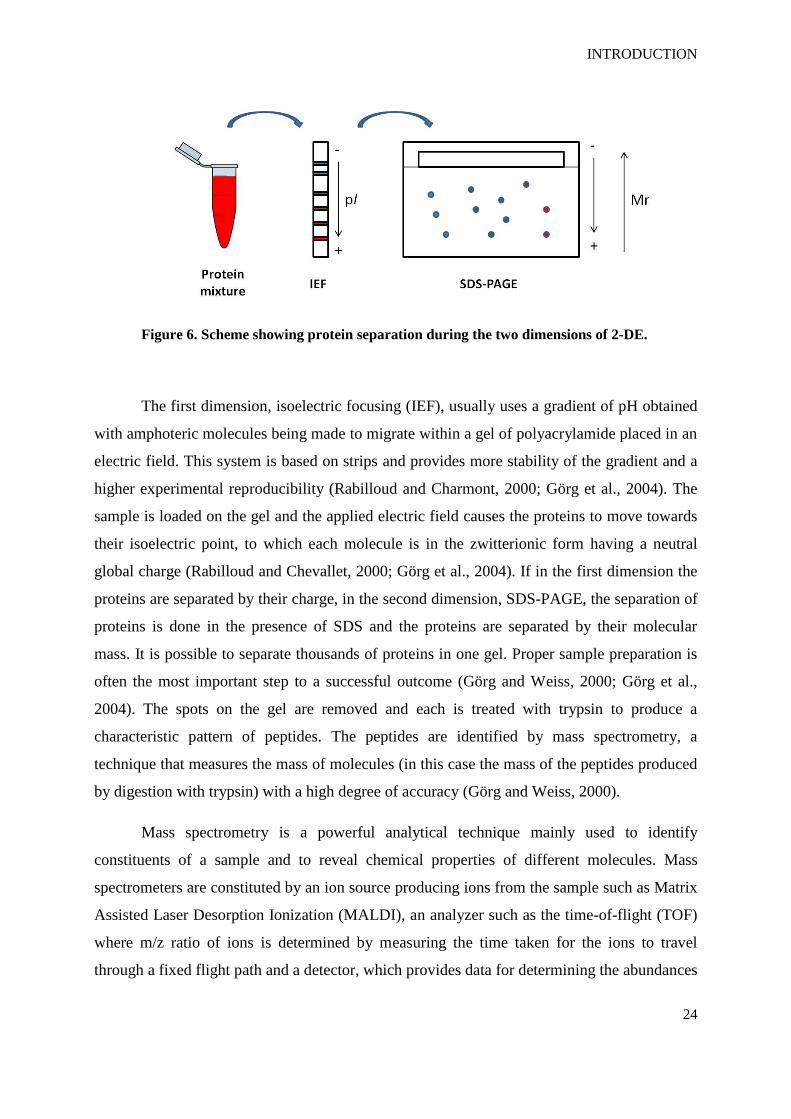
Mass spectrometry is a powerful analytical technique mainly used to identify
constituents of a sample and to reveal chemical properties of different molecules. Mass
spectrometers are constituted by an ion source producing ions from the sample such as Matrix
Assisted Laser Desorption Ionization (MALDI), an analyzer such as the time-of-flight (TOF)
where m/z ratio of ions is determined by measuring the time taken for the ions to travel
through a fixed flight path and a detector, which provides data for determining the abundances
INTRODUCTION
25
of each ion present (Dunn, 2011; Jung et al., 2000). The data coming out of mass
spectrometry are fingerprints of peptides separated by mass and the identification of proteins
is done by matching the identified particular patterns with a database (Fig. 7) (Himeda et al.,
2004; Ornstein et al., 2000).
Figure 7. Scheme of MALDI-TOF mass spectrometry.
One of the goals of clinical proteomics is to provide an opportunity to identify new
diagnostic, prognostic or therapeutic targets by discovering clinically important proteins
which could become biomarkers. According to the U.S. Food and Drug Administration
(FDA), a biomarker is a characteristic molecule that is objectively measured and evaluated as
an indicator of normal biologic or pathogenic processes or pharmacological responses to a
therapeutic intervention. Table 2 summarizes some recent clinical applications of proteomics
in biomarker discovery projects in cancer research.
INTRODUCTION
26
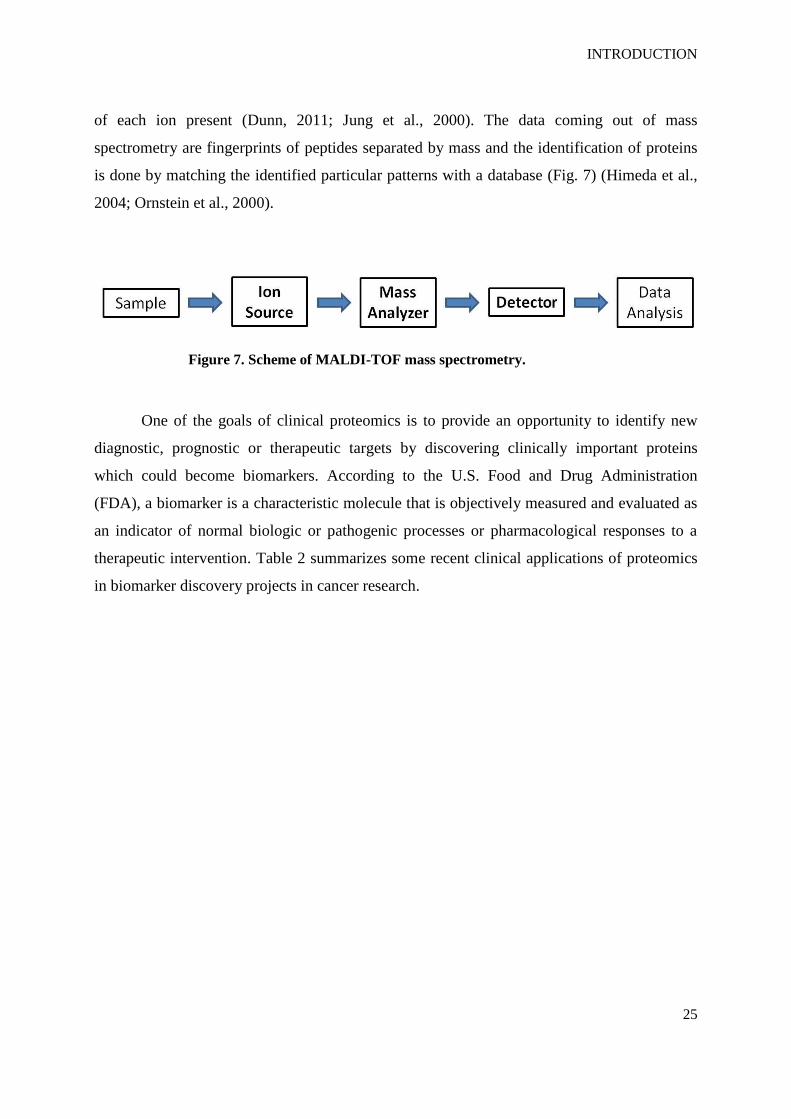
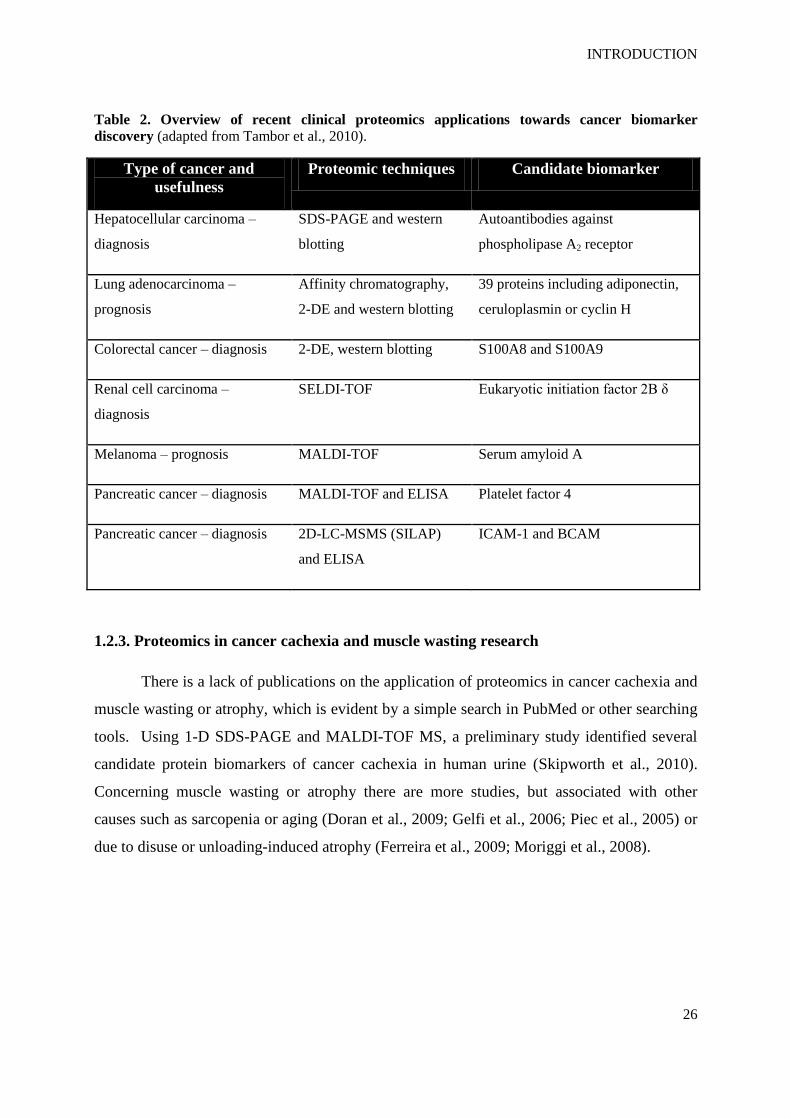
Table 2. Overview of recent clinical proteomics applications towards cancer biomarker
discovery (adapted from Tambor et al., 2010).
Type of cancer and
usefulness
Proteomic techniques Candidate biomarker
Hepatocellular carcinoma –
diagnosis
SDS-PAGE and western
blotting
Autoantibodies against
phospholipase A2 receptor
Lung adenocarcinoma –
prognosis
Affinity chromatography,
2-DE and western blotting
39 proteins including adiponectin,
ceruloplasmin or cyclin H
Colorectal cancer – diagnosis 2-DE, western blotting S100A8 and S100A9
Renal cell carcinoma –
diagnosis
SELDI-TOF Eukaryotic initiation factor 2B δ
Melanoma – prognosis MALDI-TOF Serum amyloid A
Pancreatic cancer – diagnosis MALDI-TOF and ELISA Platelet factor 4
Pancreatic cancer – diagnosis 2D-LC-MSMS (SILAP)
and ELISA
ICAM-1 and BCAM
1.2.3. Proteomics in cancer cachexia and muscle wasting research
There is a lack of publications on the application of proteomics in cancer cachexia and
muscle wasting or atrophy, which is evident by a simple search in PubMed or other searching
tools. Using 1-D SDS-PAGE and MALDI-TOF MS, a preliminary study identified several
candidate protein biomarkers of cancer cachexia in human urine (Skipworth et al., 2010).
Concerning muscle wasting or atrophy there are more studies, but associated with other
causes such as sarcopenia or aging (Doran et al., 2009; Gelfi et al., 2006; Piec et al., 2005) or
due to disuse or unloading-induced atrophy (Ferreira et al., 2009; Moriggi et al., 2008).
INTRODUCTION
27
1.3. Galectin-1
1.3.1 Galectins
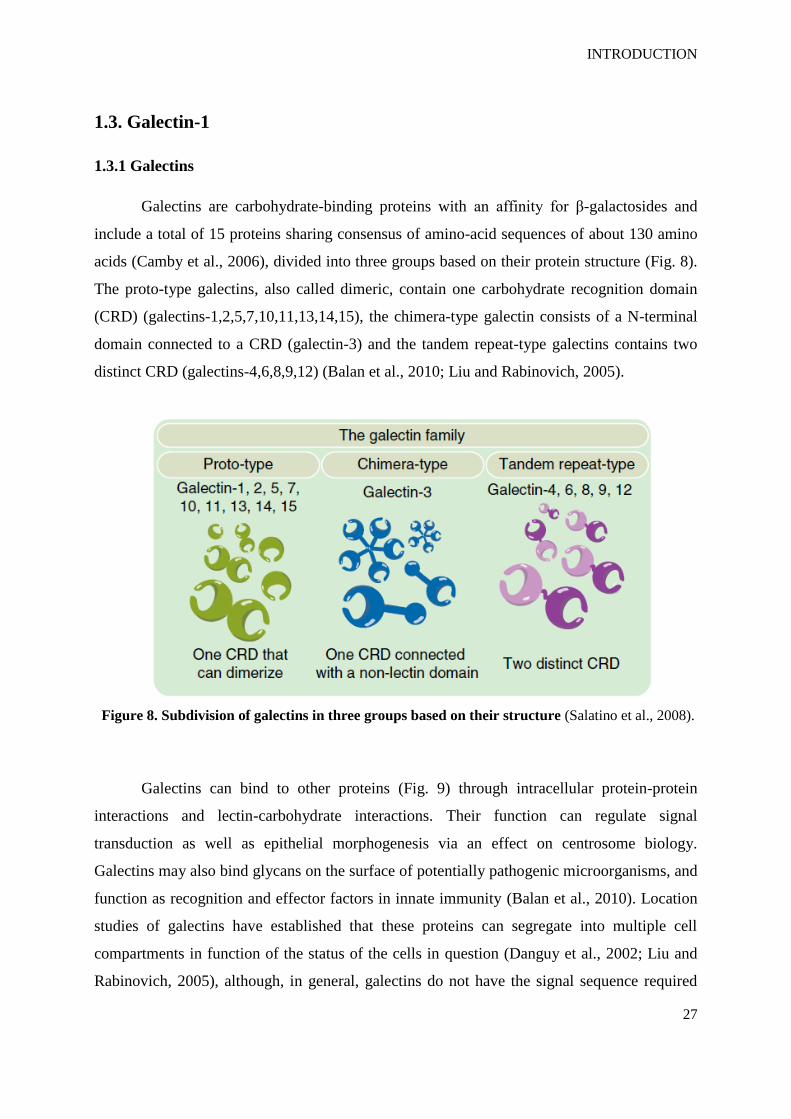
Galectins are carbohydrate-binding proteins with an affinity for β-galactosides and
include a total of 15 proteins sharing consensus of amino-acid sequences of about 130 amino
acids (Camby et al., 2006), divided into three groups based on their protein structure (Fig. 8).
The proto-type galectins, also called dimeric, contain one carbohydrate recognition domain
(CRD) (galectins-1,2,5,7,10,11,13,14,15), the chimera-type galectin consists of a N-terminal
domain connected to a CRD (galectin-3) and the tandem repeat-type galectins contains two
distinct CRD (galectins-4,6,8,9,12) (Balan et al., 2010; Liu and Rabinovich, 2005).
Figure 8. Subdivision of galectins in three groups based on their structure (Salatino et al., 2008).
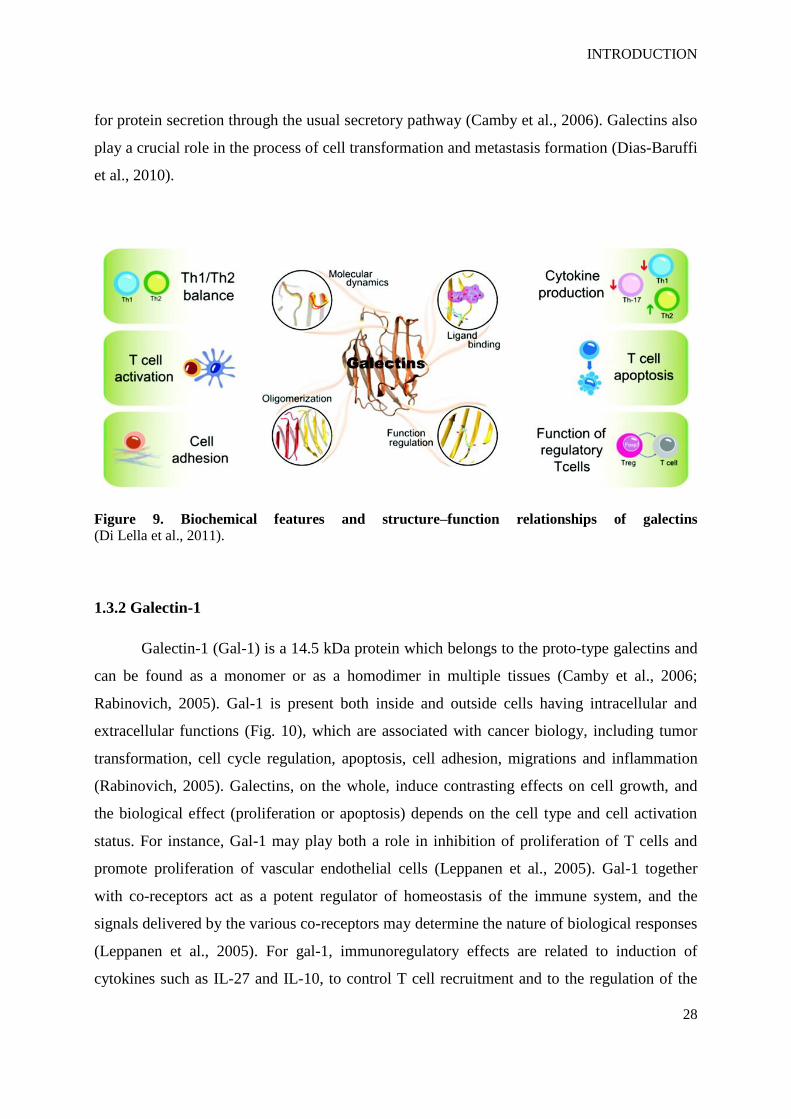
Galectins can bind to other proteins (Fig. 9) through intracellular protein-protein
interactions and lectin-carbohydrate interactions. Their function can regulate signal
transduction as well as epithelial morphogenesis via an effect on centrosome biology.
Galectins may also bind glycans on the surface of potentially pathogenic microorganisms, and
function as recognition and effector factors in innate immunity (Balan et al., 2010). Location
studies of galectins have established that these proteins can segregate into multiple cell
compartments in function of the status of the cells in question (Danguy et al., 2002; Liu and
Rabinovich, 2005), although, in general, galectins do not have the signal sequence required
INTRODUCTION
28
for protein secretion through the usual secretory pathway (Camby et al., 2006). Galectins also
play a crucial role in the process of cell transformation and metastasis formation (Dias-Baruffi
et al., 2010).
Figure 9. Biochemical features and structure–function relationships of galectins (Di Lella et al., 2011).
1.3.2 Galectin-1
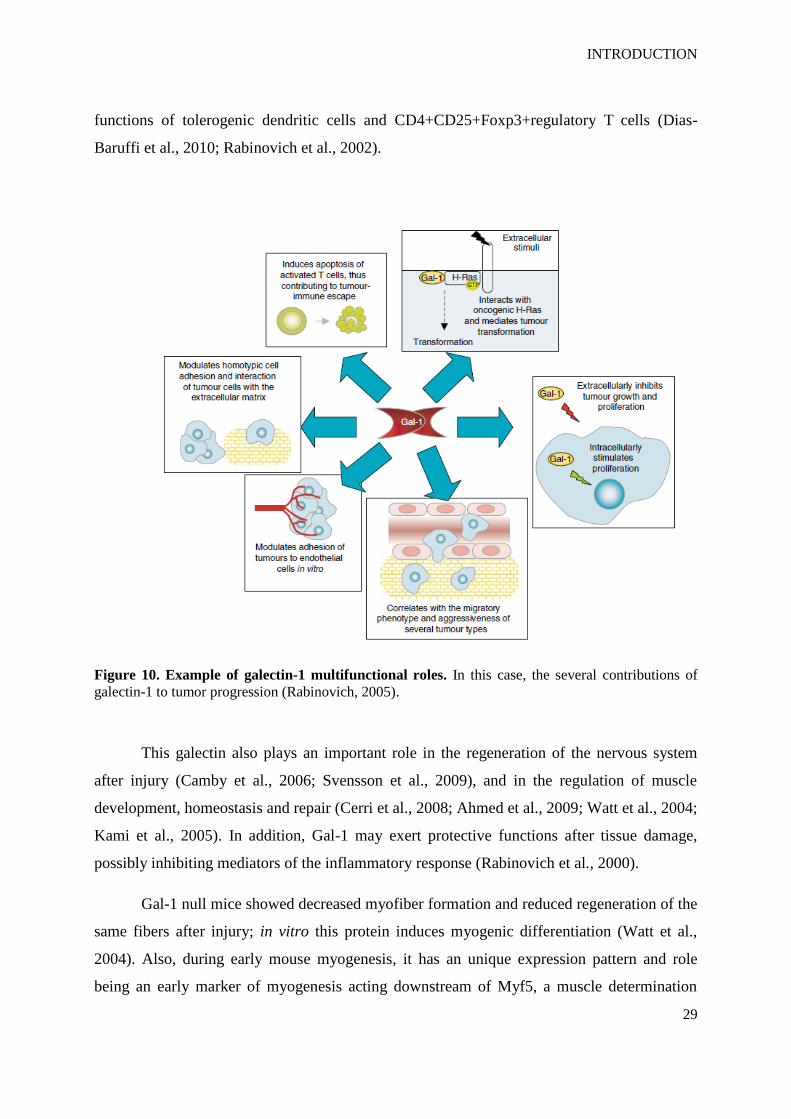
Galectin-1 (Gal-1) is a 14.5 kDa protein which belongs to the proto-type galectins and
can be found as a monomer or as a homodimer in multiple tissues (Camby et al., 2006;
Rabinovich, 2005). Gal-1 is present both inside and outside cells having intracellular and
extracellular functions (Fig. 10), which are associated with cancer biology, including tumor
transformation, cell cycle regulation, apoptosis, cell adhesion, migrations and inflammation
(Rabinovich, 2005). Galectins, on the whole, induce contrasting effects on cell growth, and
the biological effect (proliferation or apoptosis) depends on the cell type and cell activation
status. For instance, Gal-1 may play both a role in inhibition of proliferation of T cells and
promote proliferation of vascular endothelial cells (Leppanen et al., 2005). Gal-1 together
with co-receptors act as a potent regulator of homeostasis of the immune system, and the
signals delivered by the various co-receptors may determine the nature of biological responses
(Leppanen et al., 2005). For gal-1, immunoregulatory effects are related to induction of
cytokines such as IL-27 and IL-10, to control T cell recruitment and to the regulation of the
INTRODUCTION
29
functions of tolerogenic dendritic cells and CD4+CD25+Foxp3+regulatory T cells (Dias-
Baruffi et al., 2010; Rabinovich et al., 2002).
Figure 10. Example of galectin-1 multifunctional roles. In this case, the several contributions of
galectin-1 to tumor progression (Rabinovich, 2005).
This galectin also plays an important role in the regeneration of the nervous system
after injury (Camby et al., 2006; Svensson et al., 2009), and in the regulation of muscle
development, homeostasis and repair (Cerri et al., 2008; Ahmed et al., 2009; Watt et al., 2004;
Kami et al., 2005). In addition, Gal-1 may exert protective functions after tissue damage,
possibly inhibiting mediators of the inflammatory response (Rabinovich et al., 2000).
Gal-1 null mice showed decreased myofiber formation and reduced regeneration of the
same fibers after injury; in vitro this protein induces myogenic differentiation (Watt et al.,
2004). Also, during early mouse myogenesis, it has an unique expression pattern and role
being an early marker of myogenesis acting downstream of Myf5, a muscle determination
INTRODUCTION
30
factor (Shoji et al., 2009). But gal-1 has an even more important role in adult myogenesis
(Kami and Senba, 2005) and also contributes to muscle development in zebrafish (Ahmed et
al., 2009).
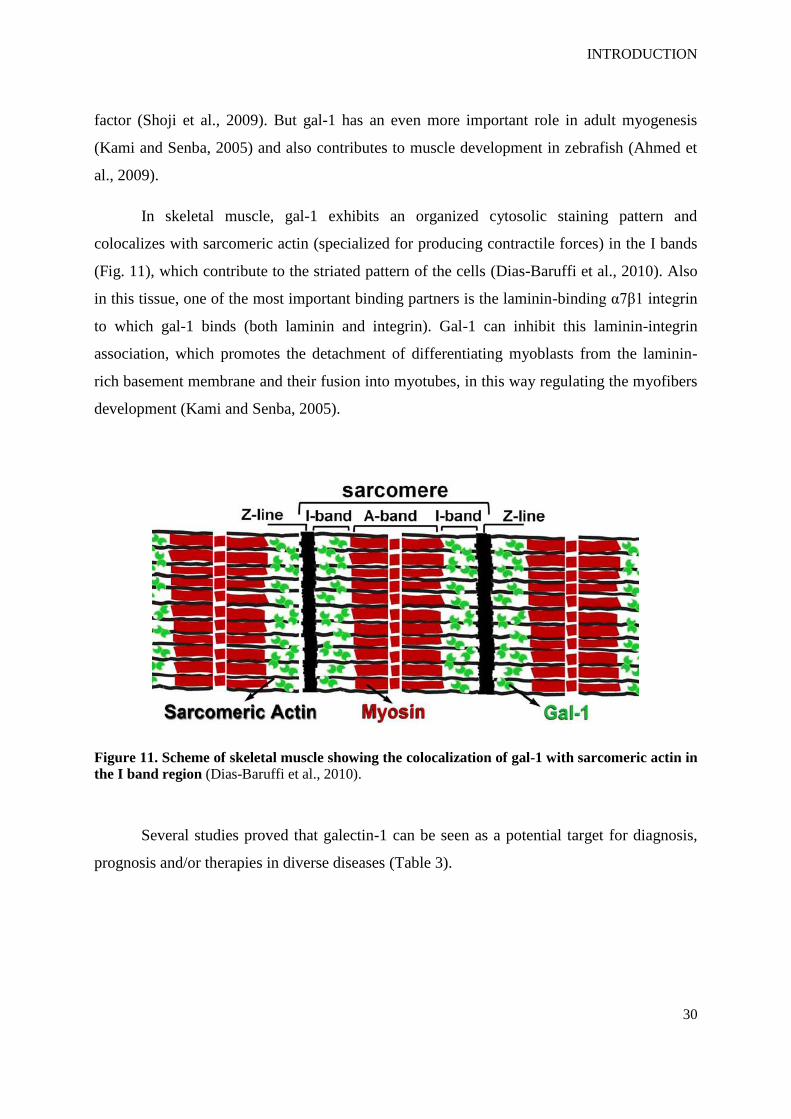
In skeletal muscle, gal-1 exhibits an organized cytosolic staining pattern and
colocalizes with sarcomeric actin (specialized for producing contractile forces) in the I bands
(Fig. 11), which contribute to the striated pattern of the cells (Dias-Baruffi et al., 2010). Also
in this tissue, one of the most important binding partners is the laminin-binding α7β1 integrin
to which gal-1 binds (both laminin and integrin). Gal-1 can inhibit this laminin-integrin
association, which promotes the detachment of differentiating myoblasts from the laminin-
rich basement membrane and their fusion into myotubes, in this way regulating the myofibers
development (Kami and Senba, 2005).
Figure 11. Scheme of skeletal muscle showing the colocalization of gal-1 with sarcomeric actin in
the I band region (Dias-Baruffi et al., 2010).
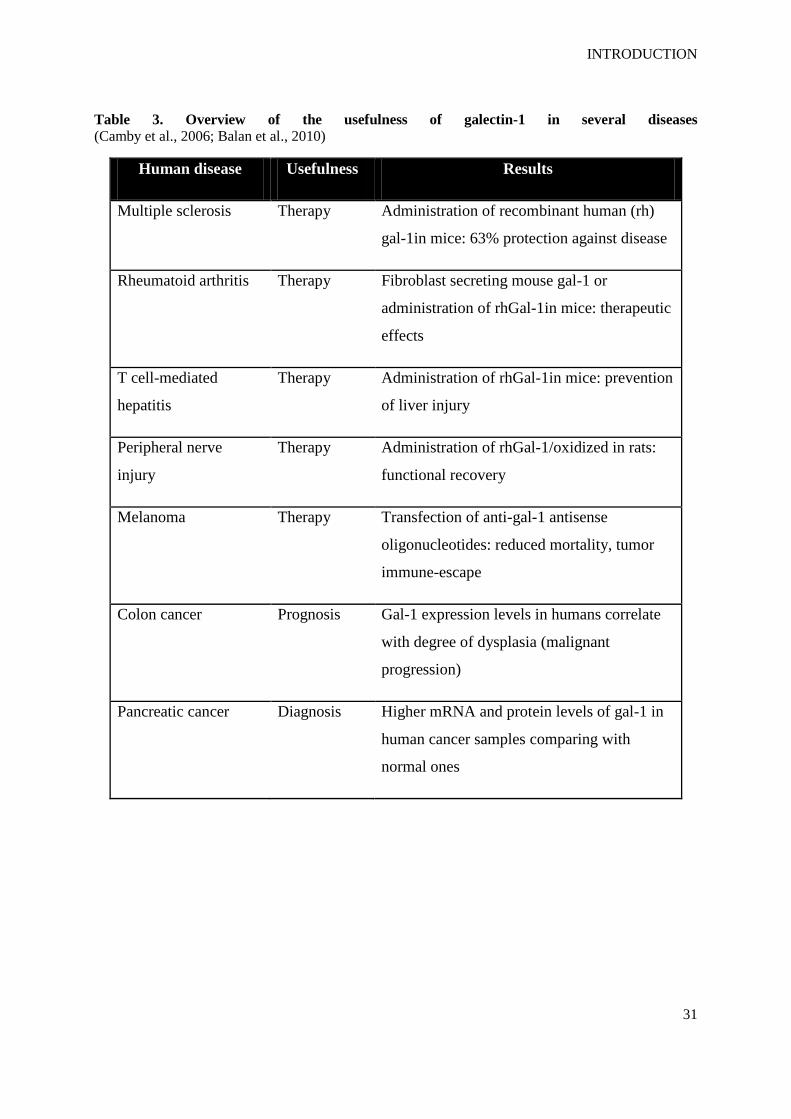
Several studies proved that galectin-1 can be seen as a potential target for diagnosis,
prognosis and/or therapies in diverse diseases (Table 3).
INTRODUCTION
31
Table 3. Overview of the usefulness of galectin-1 in several diseases (Camby et al., 2006; Balan et al., 2010)
Human disease Usefulness Results
Multiple sclerosis Therapy Administration of recombinant human (rh)
gal-1in mice: 63% protection against disease
Rheumatoid arthritis Therapy Fibroblast secreting mouse gal-1 or
administration of rhGal-1in mice: therapeutic
effects
T cell-mediated
hepatitis
Therapy Administration of rhGal-1in mice: prevention
of liver injury
Peripheral nerve
injury
Therapy Administration of rhGal-1/oxidized in rats:
functional recovery
Melanoma Therapy Transfection of anti-gal-1 antisense
oligonucleotides: reduced mortality, tumor
immune-escape
Colon cancer Prognosis Gal-1 expression levels in humans correlate
with degree of dysplasia (malignant
progression)
Pancreatic cancer Diagnosis Higher mRNA and protein levels of gal-1 in
human cancer samples comparing with
normal ones
AIM OF THE STUDY
32
1.4. Aim of the study
Cancer cachexia is a complex metabolic condition characterized by loss of skeletal
muscle. Despite several years of collaborative efforts in basic and clinical research, as well as
the existence of certain interventions that can increase muscle mass and appetite stimulation
and also reduce inflammation, there are currently no drugs approved for the prevention or
treatment of this cancer syndrome. Also, validated biomarkers relevant to the underlying
pathogenesis, which could work as diagnostic tools, are much needed.
The aim of the study was to identify and validate new putative diagnostic, prognostic
or therapeutic biomarkers for cancer cachexia. Two-dimensional electrophoresis, mass
spectrometry and western blotting were applied on skeletal muscle samples from cancer
patients with and without cachexia in order to find and, thereafter, validate the candidate
protein galectin-1. By means of western blotting, microscopy and creatine kinase activity
assays, a cancer cachexia mouse model (ApcMin/+
) and a cell line model of muscle wasting
(C2C12) were used to follow the regulation of the putative biomarker during the process of
skeletal muscle atrophy.
Furthermore, after cloning, expressing and purifying galectin-1, the addition of
recombinant protein to atrophied C2C12 cells aimed to postulate a role of the protein in the
regeneration of myotubes after atrophy.
MATERIALS AND METHODS
33
2. MATERIALS AND METHODS
MATERIALS AND METHODS
34
2. MATERIALS AND METHODS
2.1. Clinical Specimens
2.1.1. Preparation
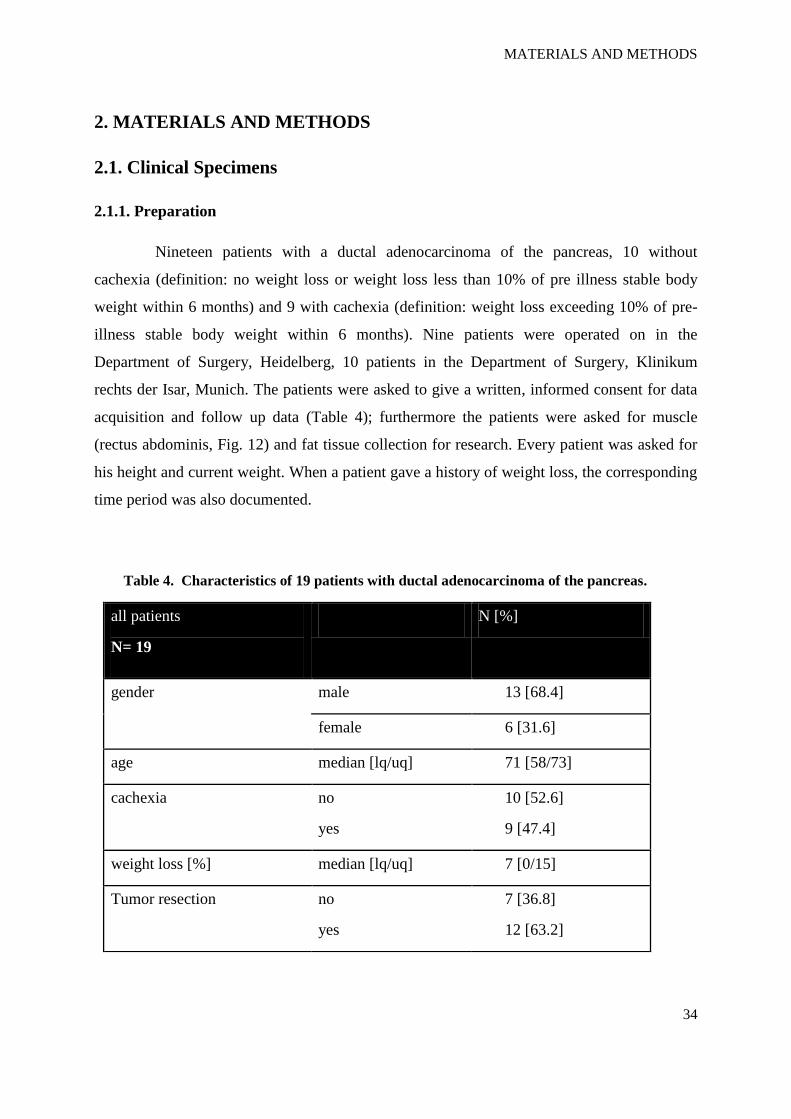
Nineteen patients with a ductal adenocarcinoma of the pancreas, 10 without
cachexia (definition: no weight loss or weight loss less than 10% of pre illness stable body
weight within 6 months) and 9 with cachexia (definition: weight loss exceeding 10% of pre-
illness stable body weight within 6 months). Nine patients were operated on in the
Department of Surgery, Heidelberg, 10 patients in the Department of Surgery, Klinikum
rechts der Isar, Munich. The patients were asked to give a written, informed consent for data
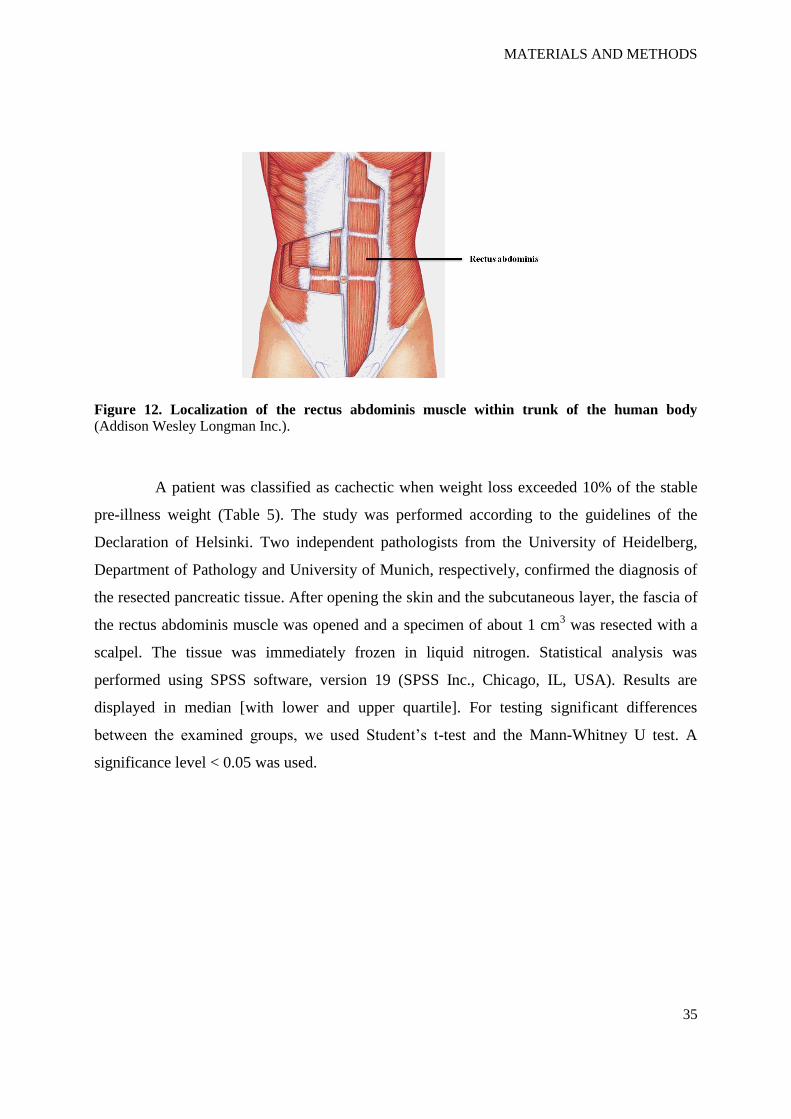
acquisition and follow up data (Table 4); furthermore the patients were asked for muscle
(rectus abdominis, Fig. 12) and fat tissue collection for research. Every patient was asked for
his height and current weight. When a patient gave a history of weight loss, the corresponding
time period was also documented.
Table 4. Characteristics of 19 patients with ductal adenocarcinoma of the pancreas.
all patients
N= 19
N [%]
gender male 13 [68.4]
female 6 [31.6]
age median [lq/uq] 71 [58/73]
cachexia no
yes
10 [52.6]
9 [47.4]
weight loss [%] median [lq/uq] 7 [0/15]
Tumor resection no
yes
7 [36.8]
12 [63.2]
MATERIALS AND METHODS
35
Figure 12. Localization of the rectus abdominis muscle within trunk of the human body (Addison Wesley Longman Inc.).
A patient was classified as cachectic when weight loss exceeded 10% of the stable
pre-illness weight (Table 5). The study was performed according to the guidelines of the
Declaration of Helsinki. Two independent pathologists from the University of Heidelberg,
Department of Pathology and University of Munich, respectively, confirmed the diagnosis of
the resected pancreatic tissue. After opening the skin and the subcutaneous layer, the fascia of
the rectus abdominis muscle was opened and a specimen of about 1 cm3 was resected with a
scalpel. The tissue was immediately frozen in liquid nitrogen. Statistical analysis was
performed using SPSS software, version 19 (SPSS Inc., Chicago, IL, USA). Results are
displayed in median [with lower and upper quartile]. For testing significant differences
between the examined groups, we used Student’s t-test and the Mann-Whitney U test. A
significance level < 0.05 was used.
MATERIALS AND METHODS
36
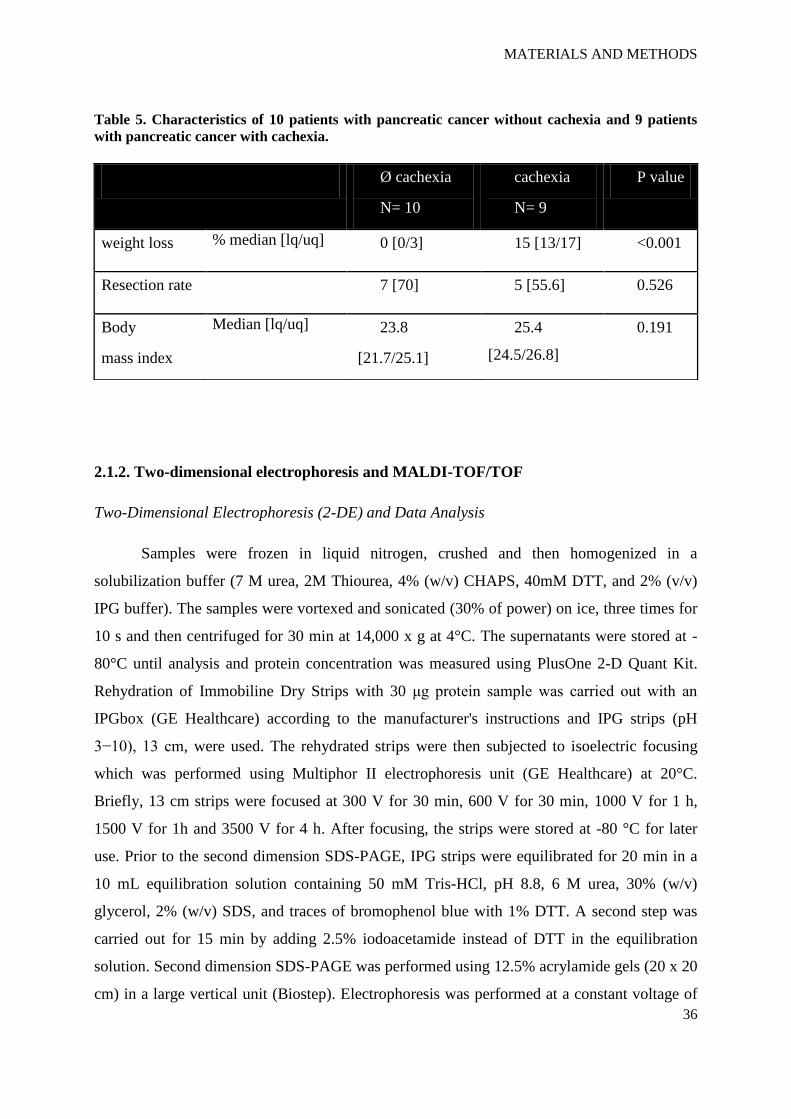
Table 5. Characteristics of 10 patients with pancreatic cancer without cachexia and 9 patients
with pancreatic cancer with cachexia.
2.1.2. Two-dimensional electrophoresis and MALDI-TOF/TOF
Two-Dimensional Electrophoresis (2-DE) and Data Analysis
Samples were frozen in liquid nitrogen, crushed and then homogenized in a
solubilization buffer (7 M urea, 2M Thiourea, 4% (w/v) CHAPS, 40mM DTT, and 2% (v/v)
IPG buffer). The samples were vortexed and sonicated (30% of power) on ice, three times for
10 s and then centrifuged for 30 min at 14,000 x g at 4°C. The supernatants were stored at -
80°C until analysis and protein concentration was measured using PlusOne 2-D Quant Kit.
Rehydration of Immobiline Dry Strips with 30 μg protein sample was carried out with an
IPGbox (GE Healthcare) according to the manufacturer's instructions and IPG strips (pH
3−10), 13 cm, were used. The rehydrated strips were then subjected to isoelectric focusing
which was performed using Multiphor II electrophoresis unit (GE Healthcare) at 20°C.
Briefly, 13 cm strips were focused at 300 V for 30 min, 600 V for 30 min, 1000 V for 1 h,
1500 V for 1h and 3500 V for 4 h. After focusing, the strips were stored at -80 °C for later
use. Prior to the second dimension SDS-PAGE, IPG strips were equilibrated for 20 min in a
10 mL equilibration solution containing 50 mM Tris-HCl, pH 8.8, 6 M urea, 30% (w/v)
glycerol, 2% (w/v) SDS, and traces of bromophenol blue with 1% DTT. A second step was
carried out for 15 min by adding 2.5% iodoacetamide instead of DTT in the equilibration
solution. Second dimension SDS-PAGE was performed using 12.5% acrylamide gels (20 x 20
cm) in a large vertical unit (Biostep). Electrophoresis was performed at a constant voltage of
Ø cachexia
N= 10
cachexia
N= 9
P value
weight loss % median [lq/uq] 0 [0/3] 15 [13/17] <0.001
Resection rate 7 [70] 5 [55.6] 0.526
Body
mass index
Median [lq/uq] 23.8
[21.7/25.1]
25.4
[24.5/26.8]
0.191
MATERIALS AND METHODS
37
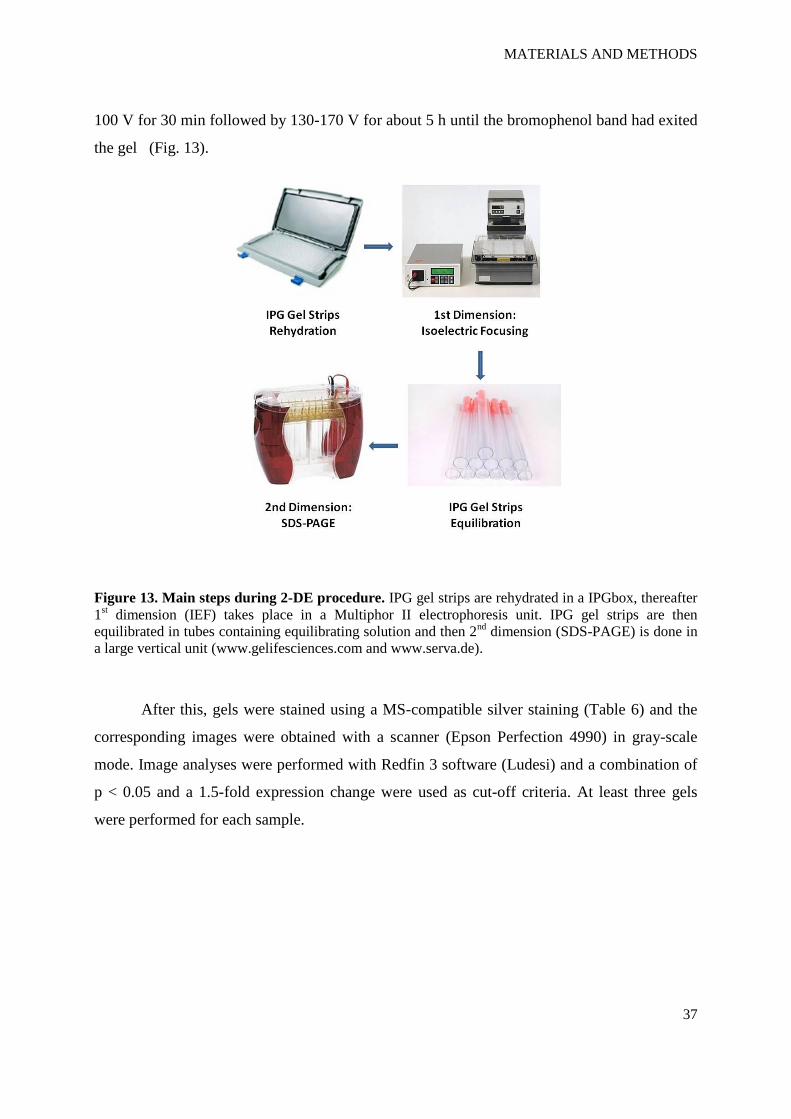
100 V for 30 min followed by 130-170 V for about 5 h until the bromophenol band had exited
the gel (Fig. 13).
Figure 13. Main steps during 2-DE procedure. IPG gel strips are rehydrated in a IPGbox, thereafter
1st dimension (IEF) takes place in a Multiphor II electrophoresis unit. IPG gel strips are then
equilibrated in tubes containing equilibrating solution and then 2nd
dimension (SDS-PAGE) is done in
a large vertical unit (www.gelifesciences.com and www.serva.de).
After this, gels were stained using a MS-compatible silver staining (Table 6) and the
corresponding images were obtained with a scanner (Epson Perfection 4990) in gray-scale
mode. Image analyses were performed with Redfin 3 software (Ludesi) and a combination of
p < 0.05 and a 1.5-fold expression change were used as cut-off criteria. At least three gels
were performed for each sample.
MATERIALS AND METHODS
38
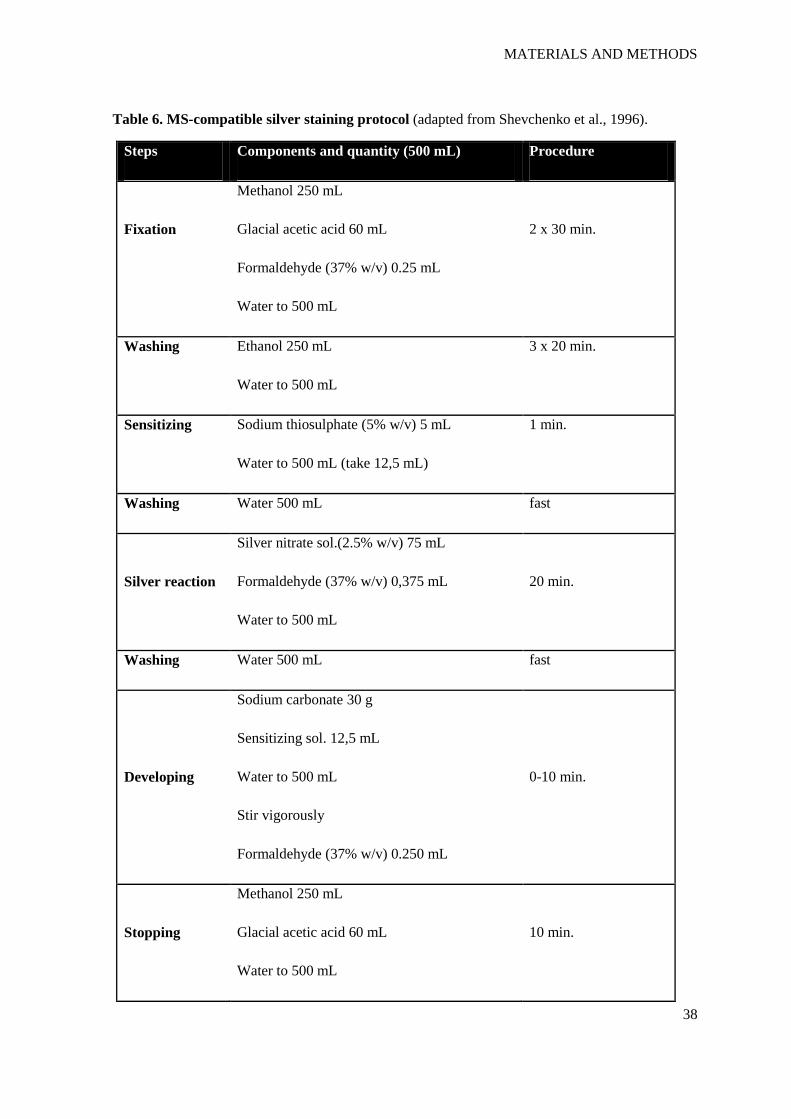
Table 6. MS-compatible silver staining protocol (adapted from Shevchenko et al., 1996).
Steps Components and quantity (500 mL) Procedure
Fixation
Methanol 250 mL
Glacial acetic acid 60 mL
Formaldehyde (37% w/v) 0.25 mL
Water to 500 mL
2 x 30 min.
Washing Ethanol 250 mL
Water to 500 mL
3 x 20 min.
Sensitizing Sodium thiosulphate (5% w/v) 5 mL
Water to 500 mL (take 12,5 mL)
1 min.
Washing Water 500 mL fast
Silver reaction
Silver nitrate sol.(2.5% w/v) 75 mL
Formaldehyde (37% w/v) 0,375 mL
Water to 500 mL
20 min.
Washing Water 500 mL fast
Developing
Sodium carbonate 30 g
Sensitizing sol. 12,5 mL
Water to 500 mL
Stir vigorously
Formaldehyde (37% w/v) 0.250 mL
0-10 min.
Stopping
Methanol 250 mL
Glacial acetic acid 60 mL
Water to 500 mL
10 min.
MATERIALS AND METHODS
39
Protein Identification by MALDI-TOF/TOF
Protein spots were manually cut, destained and washed with buffer containing 50 mM
NH4HCO3 in 30% ACN and equilibrated in 10 mM NH4HCO3 prior to proteolytic digestion.
Gel pieces were shrunk with 100% v/v ACN and rehydrated in 10 mM NH4HCO3. This
treatment was repeated, followed by the addition of 0.1-0.2 µg of modified trypsin (Sigma,
Germany) per piece. Digestion was carried out overnight at 37°C. The supernatant was
collected and combined with the eluates of subsequent elution steps with 80% v/v ACN, 1%
v/v TFA. The combined eluates were dried in a SpeedVac centrifuge. The dry samples were
dissolved in 20 µl 50% v/v ACN, 0.1% v/v TFA for the subsequent MALDI preparation.
Therefore 0.5µl of a 1:1 mixture of sample and a matrix solution consisting of 5 mg/mL
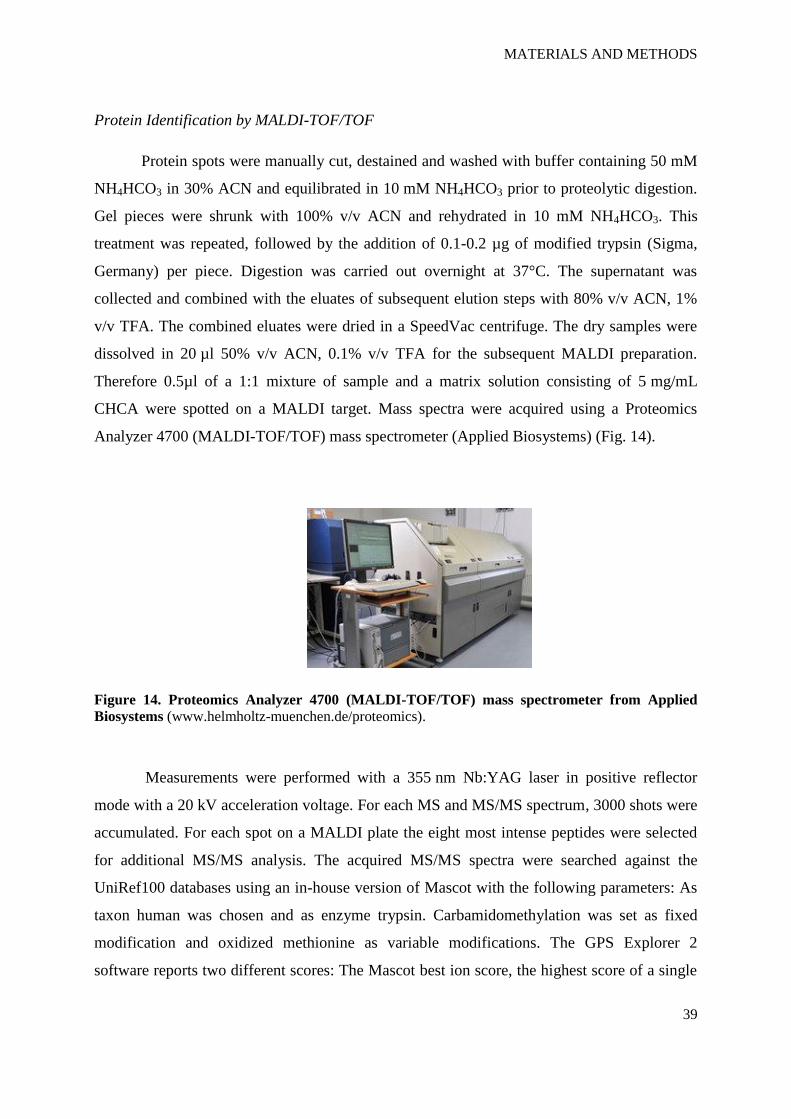
CHCA were spotted on a MALDI target. Mass spectra were acquired using a Proteomics
Analyzer 4700 (MALDI-TOF/TOF) mass spectrometer (Applied Biosystems) (Fig. 14).
Figure 14. Proteomics Analyzer 4700 (MALDI-TOF/TOF) mass spectrometer from Applied
Biosystems (www.helmholtz-muenchen.de/proteomics).
Measurements were performed with a 355 nm Nb:YAG laser in positive reflector
mode with a 20 kV acceleration voltage. For each MS and MS/MS spectrum, 3000 shots were
accumulated. For each spot on a MALDI plate the eight most intense peptides were selected
for additional MS/MS analysis. The acquired MS/MS spectra were searched against the
UniRef100 databases using an in-house version of Mascot with the following parameters: As
taxon human was chosen and as enzyme trypsin. Carbamidomethylation was set as fixed
modification and oxidized methionine as variable modifications. The GPS Explorer 2
software reports two different scores: The Mascot best ion score, the highest score of a single
MATERIALS AND METHODS
40
peptide, and a total ion score, the sum of all peptide scores of one protein. The significance
level for a peptide score is usually higher than 20 and for a protein score higher than 50-60.
Because different database searches have different Mascot significance levels, due to different
databases sizes and different numbers of masses submitted for a search, scores cannot be
compared directly. For this reason, the software calculates a confidence interval from Mascot
protein scores or ion scores, and the Mascot significance level for each search is defined as
the 95% confidence level. Therefore, the total ion score confidence level is a reliable and
comparable parameter for the significance of a database search.
2.1.3. Immunoblotting
Skeletal muscle samples were homogenized in a protein lysis buffer (20 mM Hepes, 1
mM EDTA, 50 mM β-glycerophosphate, 10% glycerol and 1% triton X-100, pH 7.4). For
myotubes lysis, SDS lysis buffer was used (50 mM Tris-HCl and 2% SDS, pH 7.4). To both
lysis buffers were freshly added 0.1 mM DTT, 0.1 mM Na3VO4 and Complete Mini protease
inhibitor cocktail. The mixtures were kept on ice for 30 min, centrifuged at 14,000 g for 15
min at 4°C and the supernatant was kept. Protein concentration was measured by BCA protein
assay kit. Aliquots containing 10 µg of protein were heat-denaturated in sample-loading
buffer (50 mM Tris-HCl, pH 6.8, 100 mM DTT, 2% SDS, 10% glycerol and traces of
bromophenol blue) separated by SDS-PAGE and blotted onto nitrocellulose membranes. The
membranes were blocked with phosphate buffered saline (PBS), containing 0.1% Tween and
5% non-fat dry milk, and incubated overnight with primary antibody at 4°C. Membranes were
then incubated with secondary horseradish peroxidase-conjugated antibody for 1 h. The
membrane-bound immune complexes were detected by an ECL system. Protein loading was
normalized according to beta-tubulin expression and quantification of the bands was
performed using Quantity One (Bio-Rad).
MATERIALS AND METHODS
41
2.2. Mouse model
2.2.1. Skeletal muscle samples
ApcMin/+
mice muscle tissues were kindly provided by Dr. E. Burgermeister from the
2nd
Medical Department, Klinikum rechts der Isar, TU München, Munich (current affiliation:
2nd
Medical Department, Universitätsmedizin Mannheim).
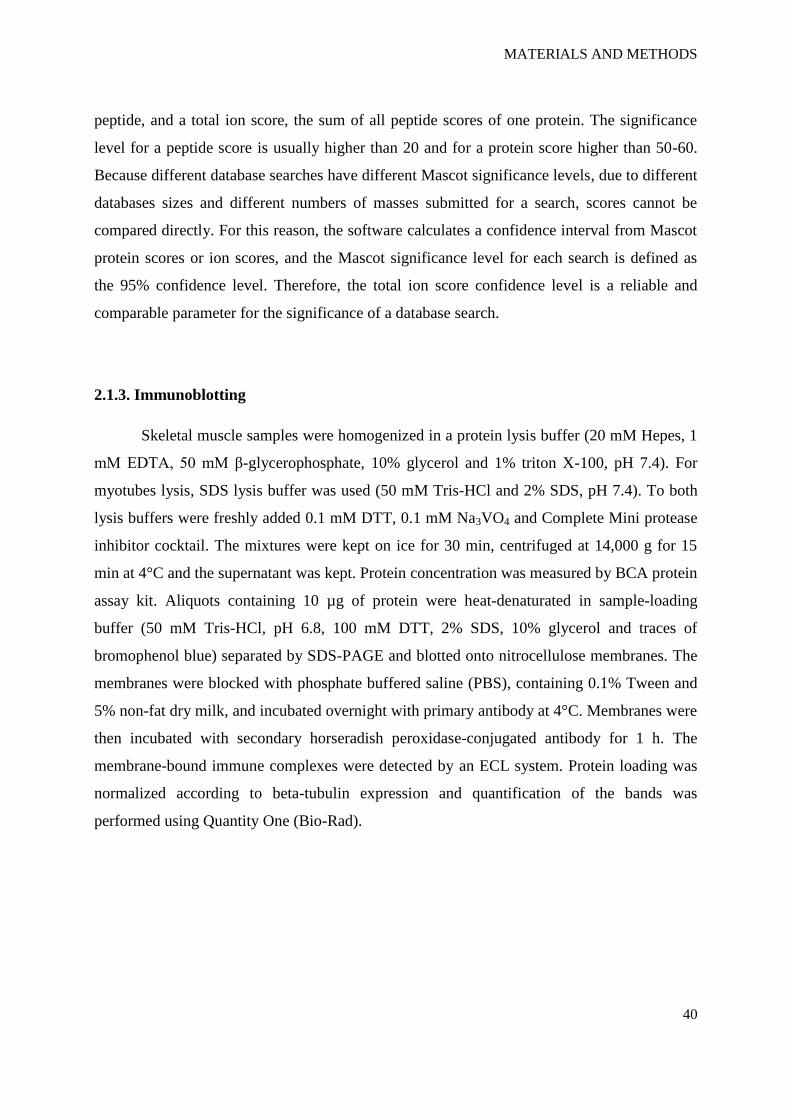
ApcMin/+
mice were sacrificed at the ages of 4, 5 and 6 months and vastus lateralis
muscle (Fig. 15) was excised, snap frozen in liquid nitrogen and stored at -80°C until further
analysis.
Figure 15. Localization of the vastus lateralis muscle within the upper leg and an ApcMin/+
mouse (www.vastuslateralis.com and www.jax.org).
2.2.2. Immunoblotting
See section 2.1.3.
2.3. In vitro models
2.3.1. Cell culture
C2C12 mouse myoblast cell line was obtained from the German Collection of
Microorganisms and Cell Cultures (DSMZ). Myoblasts were grown in DMEM supplemented
with 10% FBS, penicillin (100 U/mL) and streptomycin (100 µg/mL) at 37ºC in the presence
MATERIALS AND METHODS
42
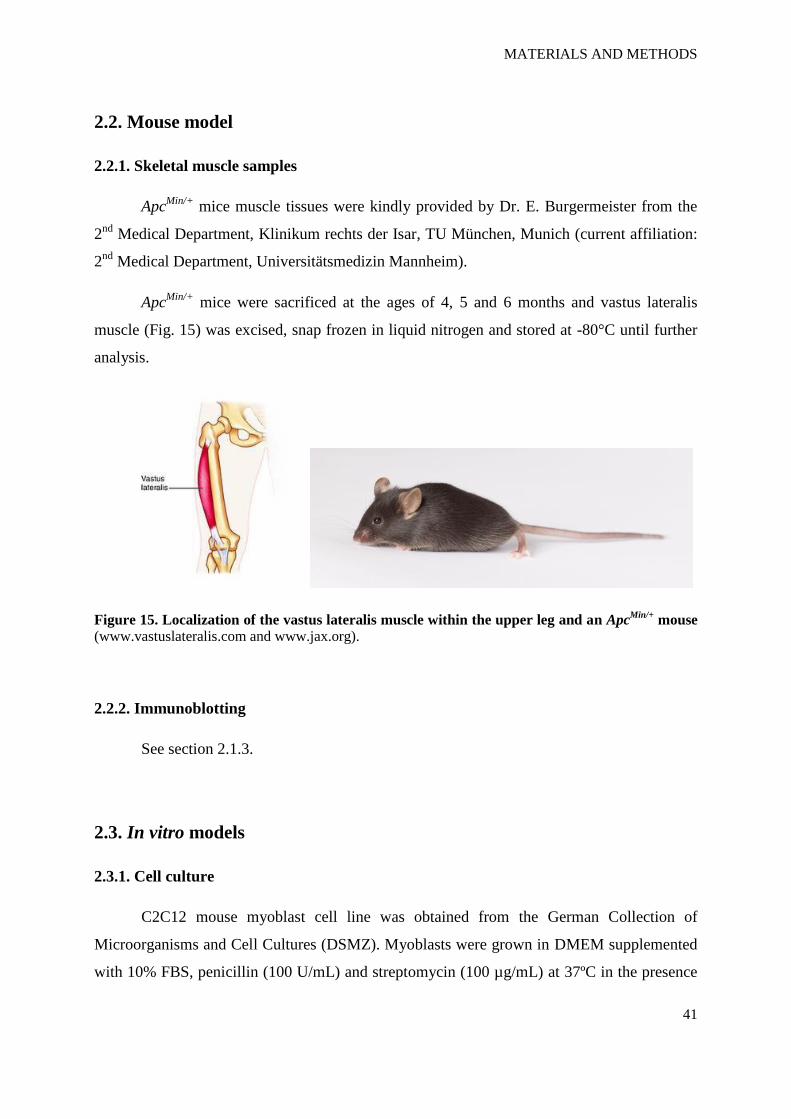
of 5% CO2 and all cells were used until passage 20. To stimulate differentiation, growth
medium (GM) was replaced by differentiation medium (DM) consisting of DMEM, 2% heat-
inactivated horse serum, penicillin (100 U/mL) and streptomycin (100 µg/mL). DM was
replaced every day and the time point at which differentiation is induced is referred to as day
0 (D0). (Fig. 16).
Figure 16. Experimental overview of differentiation: C2C12 myoblasts grow to about 80-90%
confluence (D0), and differentiation into myotubes is induced when GM is replaced with DM.
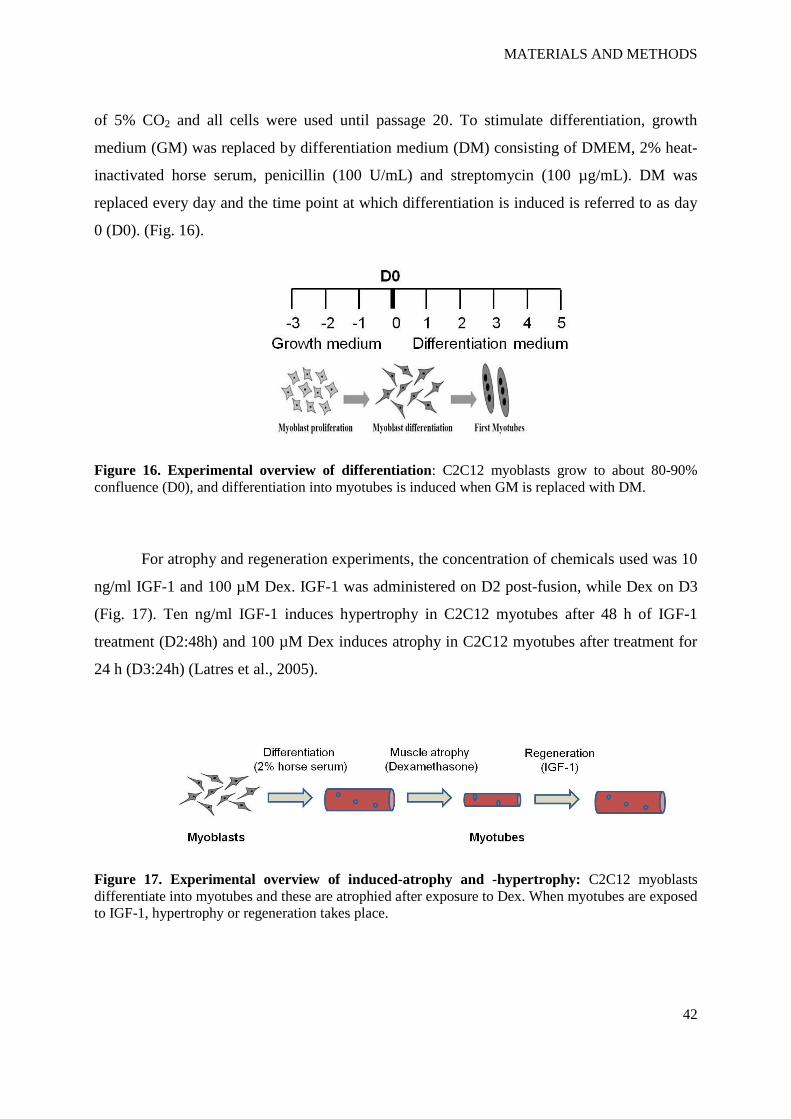
For atrophy and regeneration experiments, the concentration of chemicals used was 10
ng/ml IGF-1 and 100 µM Dex. IGF-1 was administered on D2 post-fusion, while Dex on D3
(Fig. 17). Ten ng/ml IGF-1 induces hypertrophy in C2C12 myotubes after 48 h of IGF-1
treatment (D2:48h) and 100 µM Dex induces atrophy in C2C12 myotubes after treatment for
24 h (D3:24h) (Latres et al., 2005).
Figure 17. Experimental overview of induced-atrophy and -hypertrophy: C2C12 myoblasts
differentiate into myotubes and these are atrophied after exposure to Dex. When myotubes are exposed
to IGF-1, hypertrophy or regeneration takes place.
MATERIALS AND METHODS
43
For mTOR signaling inhibition using RAD001, 100 nm RAD001 was added to DM
every day starting at D0 (Willett et al., 2009) and for experiments using recombinant galectin-
1, 100 µM of this protein was added to the medium.
To quantify the myotube diameter, 10 fields were chosen randomly and 10 myotubes
were measured per field at ×100 magnification. The average diameter per myotube was the
mean of 10 measurements taken along the length of the myotube.
All experiments were performed at least three times with three replicates, except for
the experiments using conditioned medium and recombinant galectin-1, where two replicates
were performed.
2.3.2. Immunoblotting
See section 2.1.3.
2.3.3. Protein extraction from Conditioned Medium
The conditioned medium (CM) was collected and filtered with a 0.2 µm syringe filter.
Proteins in the CM were precipitated by acetone for 60 min at -20°C and pelleted by
centrifugation at 14,000 g for 10 min. The pellet was air-dried to allow acetone to evaporate
and dissolved in SDS-loading buffer. Then it was concentrated using a Microcon YM-3
centrifugal filter at 14,000 g for 30 min at RT and protein concentration was determined using
the BCA assay.
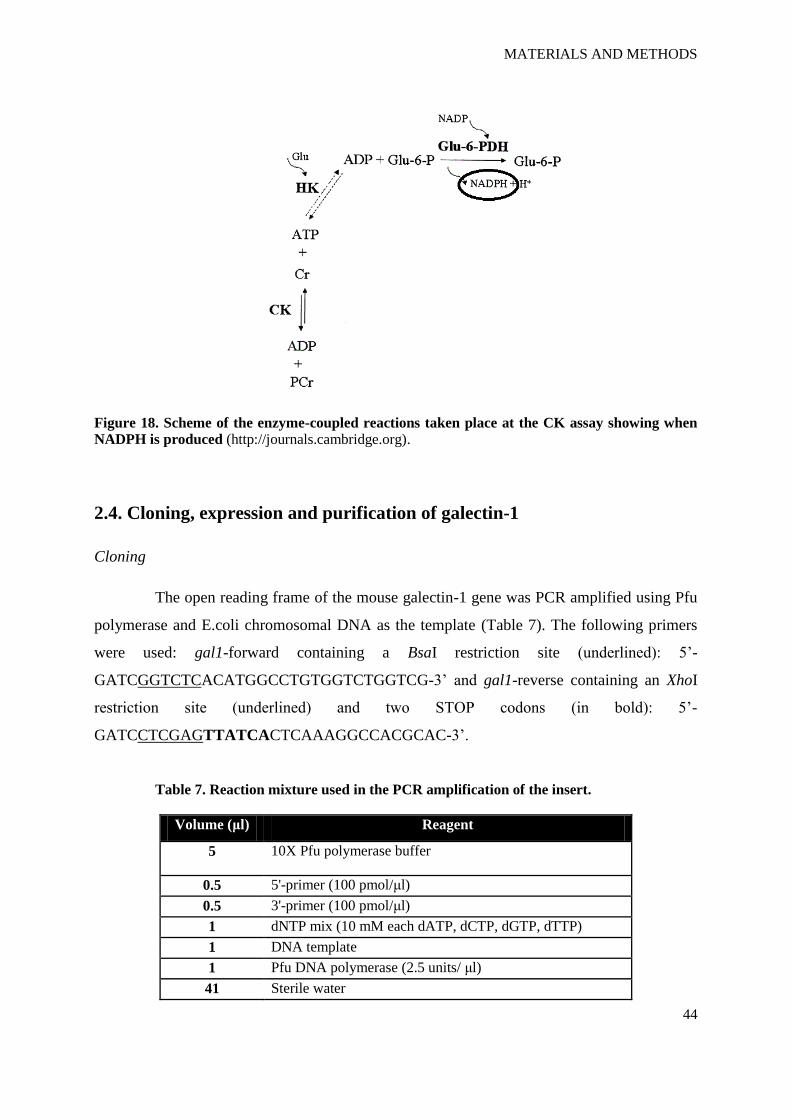
2.3.4. Creatine kinase (CK) activity
CK activity was determined in cell lysates following the protocol supplied by the
manufacturer (BioAssay Systems). This assay is based on enzyme-coupled reactions in which
creatine phosphate and ADP is converted to creatine and ATP by CK. The generated ATP is
used to phosphorylate glucose by hexokinase to generate glucose-6-phosphate, which is then
oxidized by NADP in the presence of glucose-6-phosphate dehydrogenase. The resulting
NADPH, measured at 340 nm, is proportionate to the CK activity in the sample (Fig. 18).
Unit (U) is defined as one unit of CK that transfers 1 µmole of phosphate from
phosphocreatine to ADP per minute at pH 6.0.
All experiments were performed at least three times with three replicates.
MATERIALS AND METHODS
44
Figure 18. Scheme of the enzyme-coupled reactions taken place at the CK assay showing when
NADPH is produced (http://journals.cambridge.org).
2.4. Cloning, expression and purification of galectin-1
Cloning
The open reading frame of the mouse galectin-1 gene was PCR amplified using Pfu
polymerase and E.coli chromosomal DNA as the template (Table 7). The following primers
were used: gal1-forward containing a BsaI restriction site (underlined): 5’-
GATCGGTCTCACATGGCCTGTGGTCTGGTCG-3’ and gal1-reverse containing an XhoI
restriction site (underlined) and two STOP codons (in bold): 5’-
GATCCTCGAGTTATCACTCAAAGGCCACGCAC-3’.
Table 7. Reaction mixture used in the PCR amplification of the insert.
Volume (μl) Reagent
5 10X Pfu polymerase buffer
0.5 5'-primer (100 pmol/μl)
0.5 3'-primer (100 pmol/μl)
1 dNTP mix (10 mM each dATP, dCTP, dGTP, dTTP)
1 DNA template
1 Pfu DNA polymerase (2.5 units/ μl)
41 Sterile water
MATERIALS AND METHODS
45
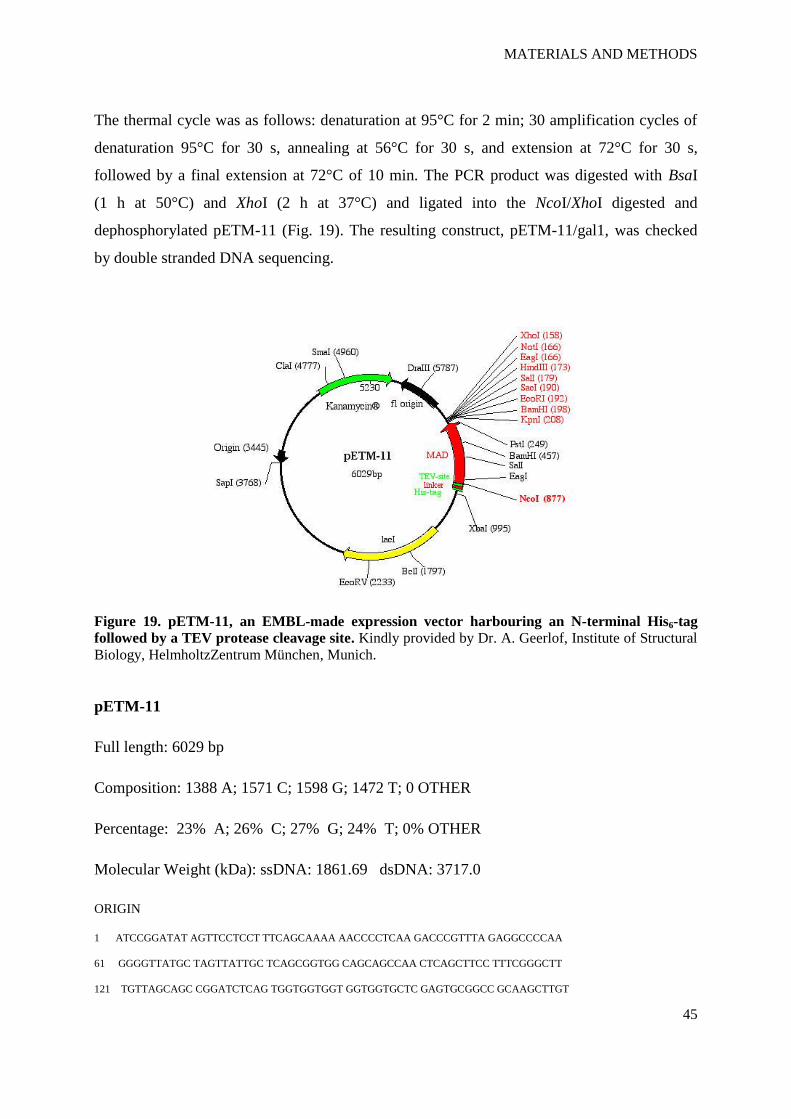
The thermal cycle was as follows: denaturation at 95°C for 2 min; 30 amplification cycles of
denaturation 95°C for 30 s, annealing at 56°C for 30 s, and extension at 72°C for 30 s,
followed by a final extension at 72°C of 10 min. The PCR product was digested with BsaI
(1 h at 50°C) and XhoI (2 h at 37°C) and ligated into the NcoI/XhoI digested and
dephosphorylated pETM-11 (Fig. 19). The resulting construct, pETM-11/gal1, was checked
by double stranded DNA sequencing.
Figure 19. pETM-11, an EMBL-made expression vector harbouring an N-terminal His6-tag
followed by a TEV protease cleavage site. Kindly provided by Dr. A. Geerlof, Institute of Structural
Biology, HelmholtzZentrum München, Munich.
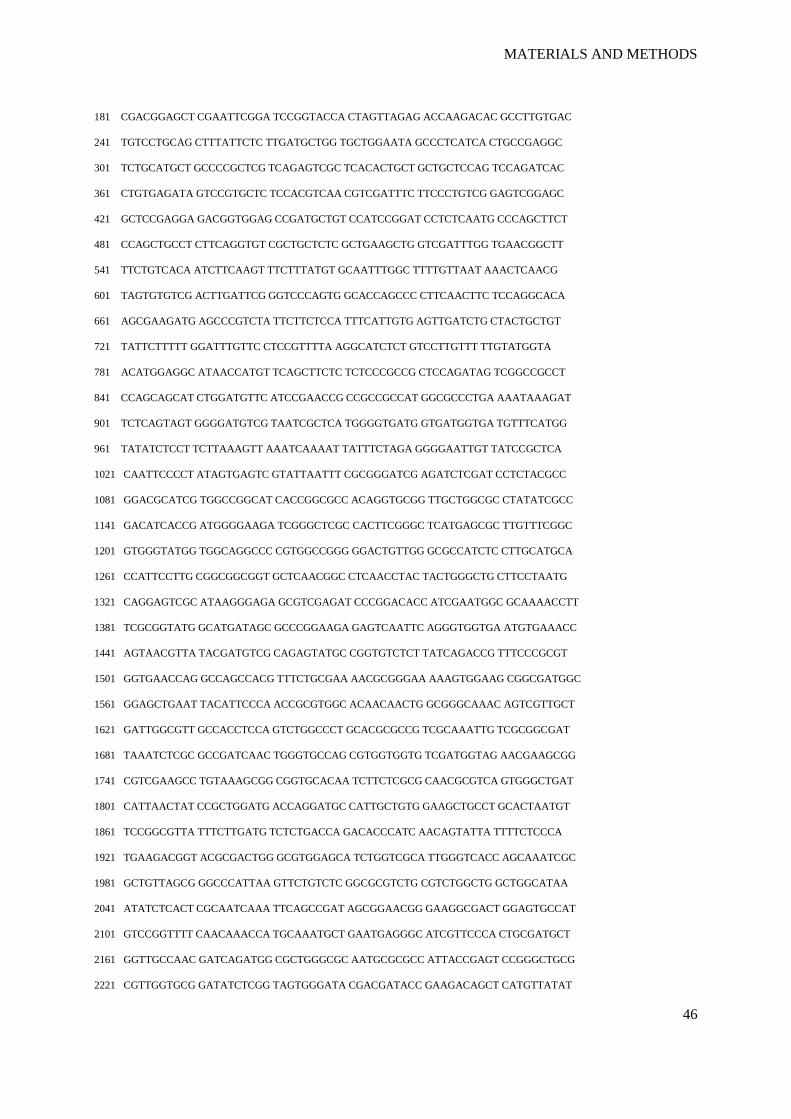
pETM-11
Full length: 6029 bp
Composition: 1388 A; 1571 C; 1598 G; 1472 T; 0 OTHER
Percentage: 23% A; 26% C; 27% G; 24% T; 0% OTHER
Molecular Weight (kDa): ssDNA: 1861.69 dsDNA: 3717.0
ORIGIN
1 ATCCGGATAT AGTTCCTCCT TTCAGCAAAA AACCCCTCAA GACCCGTTTA GAGGCCCCAA
61 GGGGTTATGC TAGTTATTGC TCAGCGGTGG CAGCAGCCAA CTCAGCTTCC TTTCGGGCTT
121 TGTTAGCAGC CGGATCTCAG TGGTGGTGGT GGTGGTGCTC GAGTGCGGCC GCAAGCTTGT
MATERIALS AND METHODS
46
181 CGACGGAGCT CGAATTCGGA TCCGGTACCA CTAGTTAGAG ACCAAGACAC GCCTTGTGAC
241 TGTCCTGCAG CTTTATTCTC TTGATGCTGG TGCTGGAATA GCCCTCATCA CTGCCGAGGC
301 TCTGCATGCT GCCCCGCTCG TCAGAGTCGC TCACACTGCT GCTGCTCCAG TCCAGATCAC
361 CTGTGAGATA GTCCGTGCTC TCCACGTCAA CGTCGATTTC TTCCCTGTCG GAGTCGGAGC
421 GCTCCGAGGA GACGGTGGAG CCGATGCTGT CCATCCGGAT CCTCTCAATG CCCAGCTTCT
481 CCAGCTGCCT CTTCAGGTGT CGCTGCTCTC GCTGAAGCTG GTCGATTTGG TGAACGGCTT
541 TTCTGTCACA ATCTTCAAGT TTCTTTATGT GCAATTTGGC TTTTGTTAAT AAACTCAACG
601 TAGTGTGTCG ACTTGATTCG GGTCCCAGTG GCACCAGCCC CTTCAACTTC TCCAGGCACA
661 AGCGAAGATG AGCCCGTCTA TTCTTCTCCA TTTCATTGTG AGTTGATCTG CTACTGCTGT
721 TATTCTTTTT GGATTTGTTC CTCCGTTTTA AGGCATCTCT GTCCTTGTTT TTGTATGGTA
781 ACATGGAGGC ATAACCATGT TCAGCTTCTC TCTCCCGCCG CTCCAGATAG TCGGCCGCCT
841 CCAGCAGCAT CTGGATGTTC ATCCGAACCG CCGCCGCCAT GGCGCCCTGA AAATAAAGAT
901 TCTCAGTAGT GGGGATGTCG TAATCGCTCA TGGGGTGATG GTGATGGTGA TGTTTCATGG
961 TATATCTCCT TCTTAAAGTT AAATCAAAAT TATTTCTAGA GGGGAATTGT TATCCGCTCA
1021 CAATTCCCCT ATAGTGAGTC GTATTAATTT CGCGGGATCG AGATCTCGAT CCTCTACGCC
1081 GGACGCATCG TGGCCGGCAT CACCGGCGCC ACAGGTGCGG TTGCTGGCGC CTATATCGCC
1141 GACATCACCG ATGGGGAAGA TCGGGCTCGC CACTTCGGGC TCATGAGCGC TTGTTTCGGC
1201 GTGGGTATGG TGGCAGGCCC CGTGGCCGGG GGACTGTTGG GCGCCATCTC CTTGCATGCA
1261 CCATTCCTTG CGGCGGCGGT GCTCAACGGC CTCAACCTAC TACTGGGCTG CTTCCTAATG
1321 CAGGAGTCGC ATAAGGGAGA GCGTCGAGAT CCCGGACACC ATCGAATGGC GCAAAACCTT
1381 TCGCGGTATG GCATGATAGC GCCCGGAAGA GAGTCAATTC AGGGTGGTGA ATGTGAAACC
1441 AGTAACGTTA TACGATGTCG CAGAGTATGC CGGTGTCTCT TATCAGACCG TTTCCCGCGT
1501 GGTGAACCAG GCCAGCCACG TTTCTGCGAA AACGCGGGAA AAAGTGGAAG CGGCGATGGC
1561 GGAGCTGAAT TACATTCCCA ACCGCGTGGC ACAACAACTG GCGGGCAAAC AGTCGTTGCT
1621 GATTGGCGTT GCCACCTCCA GTCTGGCCCT GCACGCGCCG TCGCAAATTG TCGCGGCGAT
1681 TAAATCTCGC GCCGATCAAC TGGGTGCCAG CGTGGTGGTG TCGATGGTAG AACGAAGCGG
1741 CGTCGAAGCC TGTAAAGCGG CGGTGCACAA TCTTCTCGCG CAACGCGTCA GTGGGCTGAT
1801 CATTAACTAT CCGCTGGATG ACCAGGATGC CATTGCTGTG GAAGCTGCCT GCACTAATGT
1861 TCCGGCGTTA TTTCTTGATG TCTCTGACCA GACACCCATC AACAGTATTA TTTTCTCCCA
1921 TGAAGACGGT ACGCGACTGG GCGTGGAGCA TCTGGTCGCA TTGGGTCACC AGCAAATCGC
1981 GCTGTTAGCG GGCCCATTAA GTTCTGTCTC GGCGCGTCTG CGTCTGGCTG GCTGGCATAA
2041 ATATCTCACT CGCAATCAAA TTCAGCCGAT AGCGGAACGG GAAGGCGACT GGAGTGCCAT
2101 GTCCGGTTTT CAACAAACCA TGCAAATGCT GAATGAGGGC ATCGTTCCCA CTGCGATGCT
2161 GGTTGCCAAC GATCAGATGG CGCTGGGCGC AATGCGCGCC ATTACCGAGT CCGGGCTGCG
2221 CGTTGGTGCG GATATCTCGG TAGTGGGATA CGACGATACC GAAGACAGCT CATGTTATAT
MATERIALS AND METHODS
47
2281 CCCGCCGTTA ACCACCATCA AACAGGATTT TCGCCTGCTG GGGCAAACCA GCGTGGACCG
2341 CTTGCTGCAA CTCTCTCAGG GCCAGGCGGT GAAGGGCAAT CAGCTGTTGC CCGTCTCACT
2401 GGTGAAAAGA AAAACCACCC TGGCGCCCAA TACGCAAACC GCCTCTCCCC GCGCGTTGGC
2461 CGATTCATTA ATGCAGCTGG CACGACAGGT TTCCCGACTG GAAAGCGGGC AGTGAGCGCA
2521 ACGCAATTAA TGTAAGTTAG CTCACTCATT AGGCACCGGG ATCTCGACCG ATGCCCTTGA
2581 GAGCCTTCAA CCCAGTCAGC TCCTTCCGGT GGGCGCGGGG CATGACTATC GTCGCCGCAC
2641 TTATGACTGT CTTCTTTATC ATGCAACTCG TAGGACAGGT GCCGGCAGCG CTCTGGGTCA
2701 TTTTCGGCGA GGACCGCTTT CGCTGGAGCG CGACGATGAT CGGCCTGTCG CTTGCGGTAT
2761 TCGGAATCTT GCACGCCCTC GCTCAAGCCT TCGTCACTGG TCCCGCCACC AAACGTTTCG
2821 GCGAGAAGCA GGCCATTATC GCCGGCATGG CGGCCCCACG GGTGCGCATG ATCGTGCTCC
2881 TGTCGTTGAG GACCCGGCTA GGCTGGCGGG GTTGCCTTAC TGGTTAGCAG AATGAATCAC
2941 CGATACGCGA GCGAACGTGA AGCGACTGCT GCTGCAAAAC GTCTGCGACC TGAGCAACAA
3001 CATGAATGGT CTTCGGTTTC CGTGTTTCGT AAAGTCTGGA AACGCGGAAG TCAGCGCCCT
3061 GCACCATTAT GTTCCGGATC TGCATCGCAG GATGCTGCTG GCTACCCTGT GGAACACCTA
3121 CATCTGTATT AACGAAGCGC TGGCATTGAC CCTGAGTGAT TTTTCTCTGG TCCCGCCGCA
3181 TCCATACCGC CAGTTGTTTA CCCTCACAAC GTTCCAGTAA CCGGGCATGT TCATCATCAG
3241 TAACCCGTAT CGTGAGCATC CTCTCTCGTT TCATCGGTAT CATTACCCCC ATGAACAGAA
3301 ATCCCCCTTA CACGGAGGCA TCAGTGACCA AACAGGAAAA AACCGCCCTT AACATGGCCC
3361 GCTTTATCAG AAGCCAGACA TTAACGCTTC TGGAGAAACT CAACGAGCTG GACGCGGATG
3421 AACAGGCAGA CATCTGTGAA TCGCTTCACG ACCACGCTGA TGAGCTTTAC CGCAGCTGCC
3481 TCGCGCGTTT CGGTGATGAC GGTGAAAACC TCTGACACAT GCAGCTCCCG GAGACGGTCA
3541 CAGCTTGTCT GTAAGCGGAT GCCGGGAGCA GACAAGCCCG TCAGGGCGCG TCAGCGGGTG
3601 TTGGCGGGTG TCGGGGCGCA GCCATGACCC AGTCACGTAG CGATAGCGGA GTGTATACTG
3661 GCTTAACTAT GCGGCATCAG AGCAGATTGT ACTGAGAGTG CACCATATAT GCGGTGTGAA
3721 ATACCGCACA GATGCGTAAG GAGAAAATAC CGCATCAGGC GCTCTTCCGC TTCCTCGCTC
3781 ACTGACTCGC TGCGCTCGGT CGTTCGGCTG CGGCGAGCGG TATCAGCTCA CTCAAAGGCG
3841 GTAATACGGT TATCCACAGA ATCAGGGGAT AACGCAGGAA AGAACATGTG AGCAAAAGGC
3901 CAGCAAAAGG CCAGGAACCG TAAAAAGGCC GCGTTGCTGG CGTTTTTCCA TAGGCTCCGC
3961 CCCCCTGACG AGCATCACAA AAATCGACGC TCAAGTCAGA GGTGGCGAAA CCCGACAGGA
4021 CTATAAAGAT ACCAGGCGTT TCCCCCTGGA AGCTCCCTCG TGCGCTCTCC TGTTCCGACC
4081 CTGCCGCTTA CCGGATACCT GTCCGCCTTT CTCCCTTCGG GAAGCGTGGC GCTTTCTCAT
4141 AGCTCACGCT GTAGGTATCT CAGTTCGGTG TAGGTCGTTC GCTCCAAGCT GGGCTGTGTG
4201 CACGAACCCC CCGTTCAGCC CGACCGCTGC GCCTTATCCG GTAACTATCG TCTTGAGTCC
4261 AACCCGGTAA GACACGACTT ATCGCCACTG GCAGCAGCCA CTGGTAACAG GATTAGCAGA
4321 GCGAGGTATG TAGGCGGTGC TACAGAGTTC TTGAAGTGGT GGCCTAACTA CGGCTACACT
MATERIALS AND METHODS
48
4381 AGAAGGACAG TATTTGGTAT CTGCGCTCTG CTGAAGCCAG TTACCTTCGG AAAAAGAGTT
4441 GGTAGCTCTT GATCCGGCAA ACAAACCACC GCTGGTAGCG GTGGTTTTTT TGTTTGCAAG
4501 CAGCAGATTA CGCGCAGAAA AAAAGGATCT CAAGAAGATC CTTTGATCTT TTCTACGGGG
4561 TCTGACGCTC AGTGGAACGA AAACTCACGT TAAGGGATTT TGGTCATGAA CAATAAAACT
4621 GTCTGCTTAC ATAAACAGTA ATACAAGGGG TGTTATGAGC CATATTCAAC GGGAAACGTC
4681 TTGCTCTAGG CCGCGATTAA ATTCCAACAT GGATGCTGAT TTATATGGGT ATAAATGGGC
4741 TCGCGATAAT GTCGGGCAAT CAGGTGCGAC AATCTATCGA TTGTATGGGA AGCCCGATGC
4801 GCCAGAGTTG TTTCTGAAAC ATGGCAAAGG TAGCGTTGCC AATGATGTTA CAGATGAGAT
4861 GGTCAGACTA AACTGGCTGA CGGAATTTAT GCCTCTTCCG ACCATCAAGC ATTTTATCCG
4921 TACTCCTGAT GATGCATGGT TACTCACCAC TGCGATCCCC GGGAAAACAG CATTCCAGGT
4981 ATTAGAAGAA TATCCTGATT CAGGTGAAAA TATTGTTGAT GCGCTGGCAG TGTTCCTGCG
5041 CCGGTTGCAT TCGATTCCTG TTTGTAATTG TCCTTTTAAC AGCGATCGCG TATTTCGTCT
5101 CGCTCAGGCG CAATCACGAA TGAATAACGG TTTGGTTGAT GCGAGTGATT TTGATGACGA
5161 GCGTAATGGC TGGCCTGTTG AACAAGTCTG GAAAGAAATG CATAAACTTT TGCCATTCTC
5221 ACCGGATTCA GTCGTCACTC ATGGTGATTT CTCACTTGAT AACCTTATTT TTGACGAGGG
5281 GAAATTAATA GGTTGTATTG ATGTTGGACG AGTCGGAATC GCAGACCGAT ACCAGGATCT
5341 TGCCATCCTA TGGAACTGCC TCGGTGAGTT TTCTCCTTCA TTACAGAAAC GGCTTTTTCA
5401 AAAATATGGT ATTGATAATC CTGATATGAA TAAATTGCAG TTTCATTTGA TGCTCGATGA
5461 GTTTTTCTAA GAATTAATTC ATGAGCGGAT ACATATTTGA ATGTATTTAG AAAAATAAAC
5521 AAATAGGGGT TCCGCGCACA TTTCCCCGAA AAGTGCCACC TGAAATTGTA AACGTTAATA
5581 TTTTGTTAAA ATTCGCGTTA AATTTTTGTT AAATCAGCTC ATTTTTTAAC CAATAGGCCG
5641 AAATCGGCAA AATCCCTTAT AAATCAAAAG AATAGACCGA GATAGGGTTG AGTGTTGTTC
5701 CAGTTTGGAA CAAGAGTCCA CTATTAAAGA ACGTGGACTC CAACGTCAAA GGGCGAAAAA
5761 CCGTCTATCA GGGCGATGGC CCACTACGTG AACCATCACC CTAATCAAGT TTTTTGGGGT
5821 CGAGGTGCCG TAAAGCACTA AATCGGAACC CTAAAGGGAG CCCCCGATTT AGAGCTTGAC
5881 GGGGAAAGCC GGCGAACGTG GCGAGAAAGG AAGGGAAGAA AGCGAAAGGA GCGGGCGCTA
5941 GGGCGCTGGC AAGTGTAGCG GTCACGCTGC GCGTAACCAC CACACCCGCC GCGCTTAATG
6001 CGCCGCTACA GGGCGCGTCC CATTCGCCA
MATERIALS AND METHODS
49
Expression and purification
pETM-11/gal1 was transformed into the E. coli expression strain Rosetta2 (DE3)
pLysS and cultured at 20°C in 2-L flasks containing 500 ml ZYM 5052 auto-induction
medium (Studier, 2005), 30 µg/ml kanamycin and 33 µg/ml chloramphenicol. Cells were
harvested by centrifugation (9,000 x g for 20 min) after reaching saturation, resuspended in 30
ml lysis buffer (50mM Tris-HCl, 300mM NaCl, 20mM imidazole, 1mM AEBSF.HCl (serine
protease inhibitor), 0.2% (v/v) NP-40, 0.02% (v/v) 1-thioglycerol, pH 8.0), and lysed by
sonication 2 times for 3 min on ice-water using a Bandelin Sonopuls HD2200 (duty cycle
30%, amplitude 60%). The lysate was clarified by centrifugation at 40,000 x g and filtration
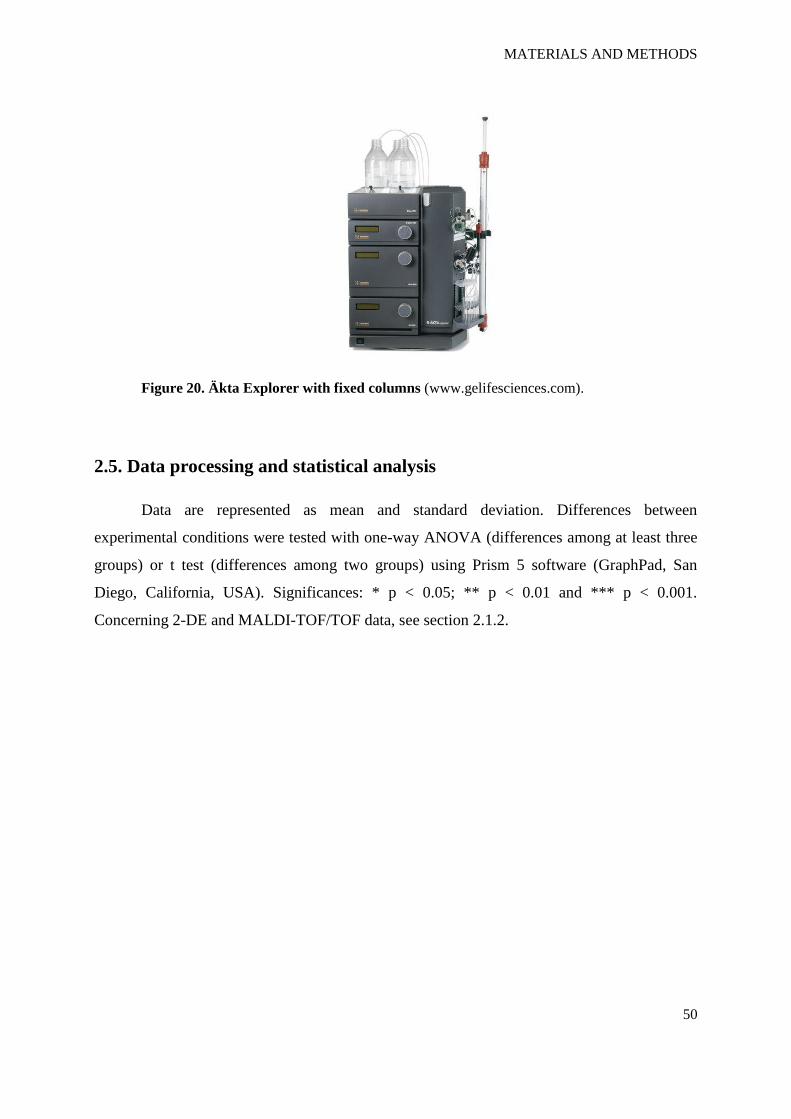
over a 0.22 µM filter. The supernatant was applied to a 5 ml HiTrap Chelating HP column
(GE Healthcare), equilibrated in binding buffer (50 mM Tris-HCl, 300 mM NaCl, 20 mM
imidazole, 0.01% (v/v) 1-thioglycerol, pH 8.0) using an Äkta Explorer (GE Healthcare)
(Fig. 20). The column was washed with binding buffer and binding buffer containing 50mM
imidazole until a stable baseline was reached (monitored at 280nm). Bound proteins were
eluted with elution buffer (50 mM Tris-HCl, 300 mM NaCl, 300 mM imidazole, 0.01% (v/v)
1-thioglycerol, pH 8.0) and fractions containing protein pooled and dialyzed overnight at 4°C
against 1-L GF buffer (50mM Tris-HCl, 150 mM NaCl, and 0.01% (v/v) 1-thioglycerol, pH
8.0) in the presence of His6-tagged TEV protease in a 1:50 molar ratio (TEV:protein). TEV-
cleaved protein was further purified by affinity chromatography, as described above, and the
flow-through and protein containing wash fractions were pooled and concentrated to less than
5 ml. This was subsequently subjected to size exclusion chromatography using a HiLoad
16/60 Superdex 200 column (GE Healthcare), equilibrated in GF buffer. The main elution
peak containing galectin-1 was collected, concentrated to 1.90 mg/ml using centrifugal
concentrators with a 3-kDa cut-off (Amicon), and stored in several aliquots at 4°C and 80ºC
in 8 mM DTT.
MATERIALS AND METHODS
50
Figure 20. Äkta Explorer with fixed columns (www.gelifesciences.com).
2.5. Data processing and statistical analysis
Data are represented as mean and standard deviation. Differences between
experimental conditions were tested with one-way ANOVA (differences among at least three
groups) or t test (differences among two groups) using Prism 5 software (GraphPad, San
Diego, California, USA). Significances: * p < 0.05; ** p < 0.01 and *** p < 0.001.
Concerning 2-DE and MALDI-TOF/TOF data, see section 2.1.2.

RESULTS
51
3. RESULTS
RESULTS
52
3. RESULTS
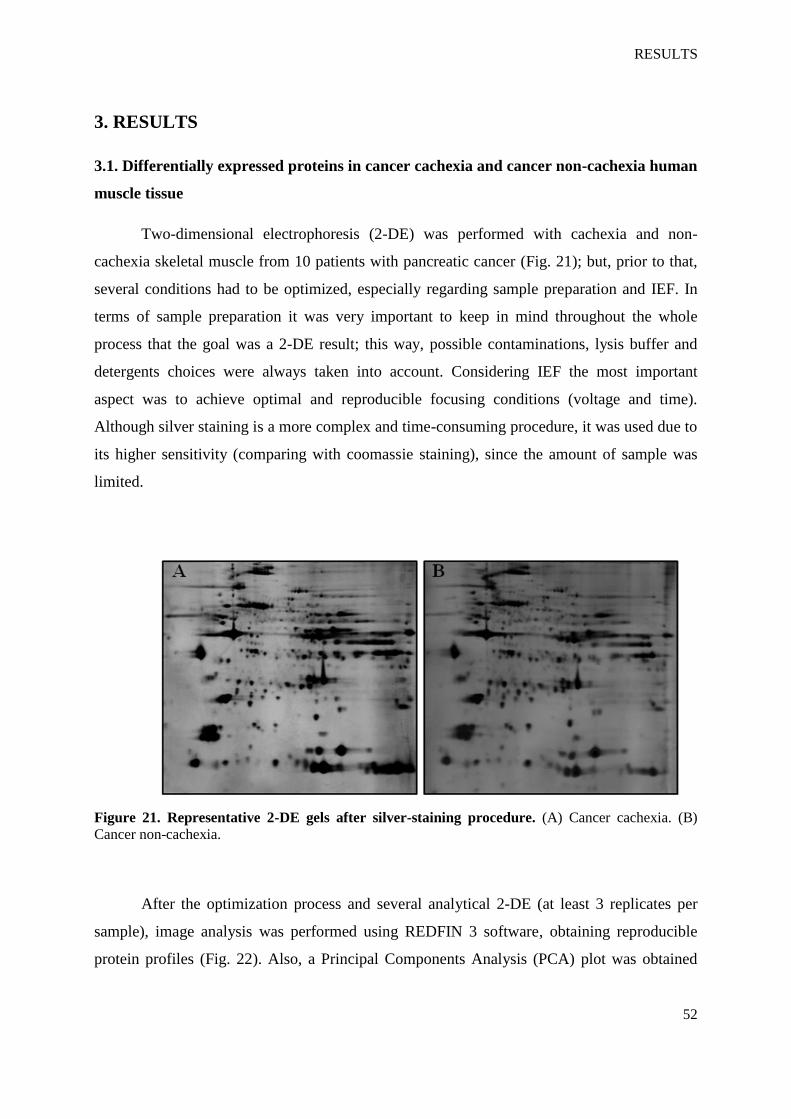
3.1. Differentially expressed proteins in cancer cachexia and cancer non-cachexia human
muscle tissue
Two-dimensional electrophoresis (2-DE) was performed with cachexia and non-
cachexia skeletal muscle from 10 patients with pancreatic cancer (Fig. 21); but, prior to that,
several conditions had to be optimized, especially regarding sample preparation and IEF. In
terms of sample preparation it was very important to keep in mind throughout the whole
process that the goal was a 2-DE result; this way, possible contaminations, lysis buffer and
detergents choices were always taken into account. Considering IEF the most important
aspect was to achieve optimal and reproducible focusing conditions (voltage and time).
Although silver staining is a more complex and time-consuming procedure, it was used due to
its higher sensitivity (comparing with coomassie staining), since the amount of sample was
limited.
Figure 21. Representative 2-DE gels after silver-staining procedure. (A) Cancer cachexia. (B)
Cancer non-cachexia.
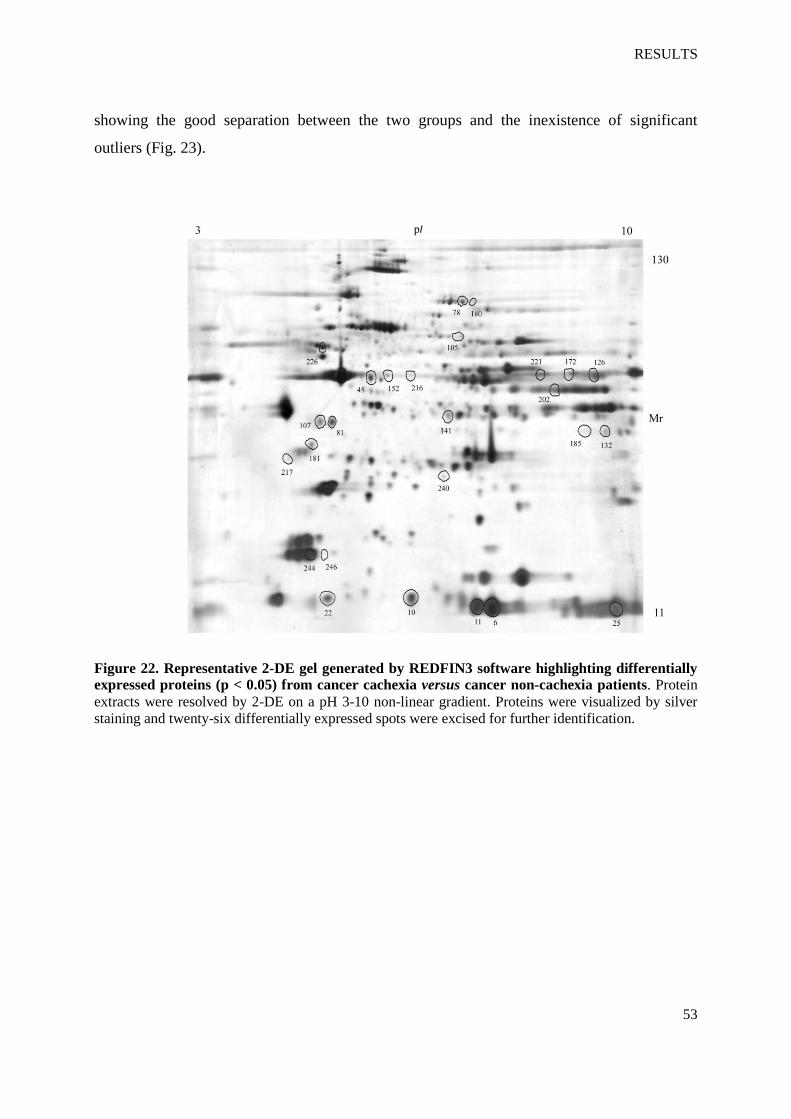
After the optimization process and several analytical 2-DE (at least 3 replicates per
sample), image analysis was performed using REDFIN 3 software, obtaining reproducible
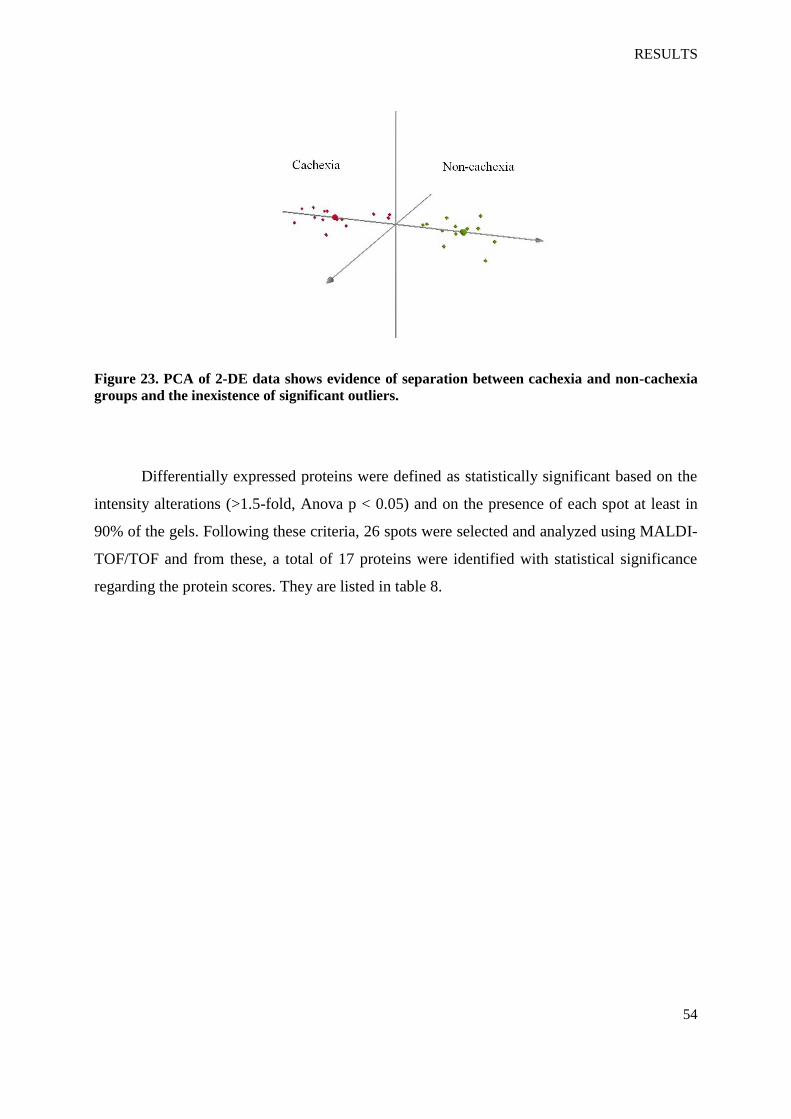
protein profiles (Fig. 22). Also, a Principal Components Analysis (PCA) plot was obtained
RESULTS
53
showing the good separation between the two groups and the inexistence of significant
outliers (Fig. 23).
Figure 22. Representative 2-DE gel generated by REDFIN3 software highlighting differentially
expressed proteins (p < 0.05) from cancer cachexia versus cancer non-cachexia patients. Protein
extracts were resolved by 2-DE on a pH 3-10 non-linear gradient. Proteins were visualized by silver
staining and twenty-six differentially expressed spots were excised for further identification.
RESULTS
54
Figure 23. PCA of 2-DE data shows evidence of separation between cachexia and non-cachexia
groups and the inexistence of significant outliers.
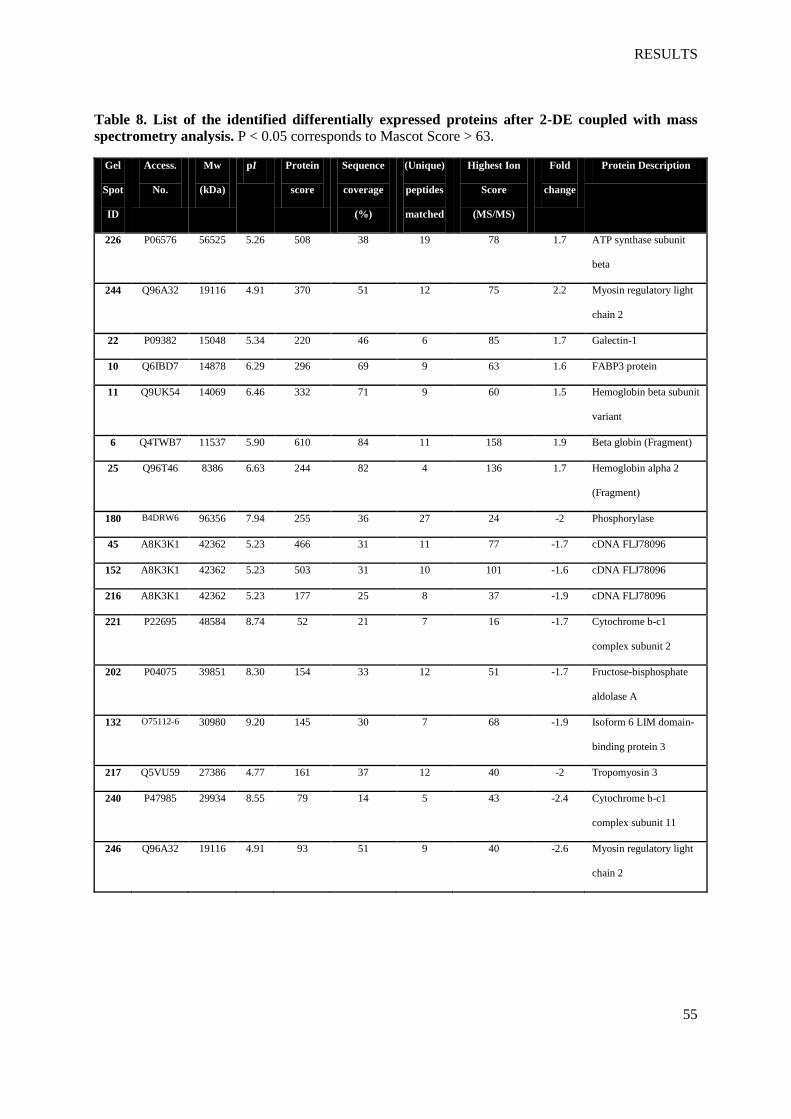
Differentially expressed proteins were defined as statistically significant based on the
intensity alterations (>1.5-fold, Anova p < 0.05) and on the presence of each spot at least in
90% of the gels. Following these criteria, 26 spots were selected and analyzed using MALDI-
TOF/TOF and from these, a total of 17 proteins were identified with statistical significance
regarding the protein scores. They are listed in table 8.
RESULTS
55
Table 8. List of the identified differentially expressed proteins after 2-DE coupled with mass
spectrometry analysis. P < 0.05 corresponds to Mascot Score > 63.
Gel
Spot
ID
Access.
No.
Mw
(kDa)
pI Protein
score
Sequence
coverage
(%)
(Unique)
peptides
matched
Highest Ion
Score
(MS/MS)
Fold
change
Protein Description
226 P06576 56525 5.26 508 38 19 78 1.7 ATP synthase subunit
beta
244 Q96A32 19116 4.91 370 51 12 75 2.2 Myosin regulatory light
chain 2
22 P09382 15048 5.34 220 46 6 85 1.7 Galectin-1
10 Q6IBD7 14878 6.29 296 69 9 63 1.6 FABP3 protein
11 Q9UK54 14069 6.46 332 71 9 60 1.5 Hemoglobin beta subunit
variant
6 Q4TWB7 11537 5.90 610 84 11 158 1.9 Beta globin (Fragment)
25 Q96T46 8386 6.63 244 82 4 136 1.7 Hemoglobin alpha 2
(Fragment)
180 B4DRW6 96356 7.94 255 36 27 24 -2 Phosphorylase
45 A8K3K1 42362 5.23 466 31 11 77 -1.7 cDNA FLJ78096
152 A8K3K1 42362 5.23 503 31 10 101 -1.6 cDNA FLJ78096
216 A8K3K1 42362 5.23 177 25 8 37 -1.9 cDNA FLJ78096
221 P22695 48584 8.74 52 21 7 16 -1.7 Cytochrome b-c1
complex subunit 2
202 P04075 39851 8.30 154 33 12 51 -1.7 Fructose-bisphosphate
aldolase A
132 O75112-6 30980 9.20 145 30 7 68 -1.9 Isoform 6 LIM domain-
binding protein 3
217 Q5VU59 27386 4.77 161 37 12 40 -2 Tropomyosin 3
240 P47985 29934 8.55 79 14 5 43 -2.4 Cytochrome b-c1
complex subunit 11
246 Q96A32 19116 4.91 93 51 9 40 -2.6 Myosin regulatory light
chain 2
RESULTS
56
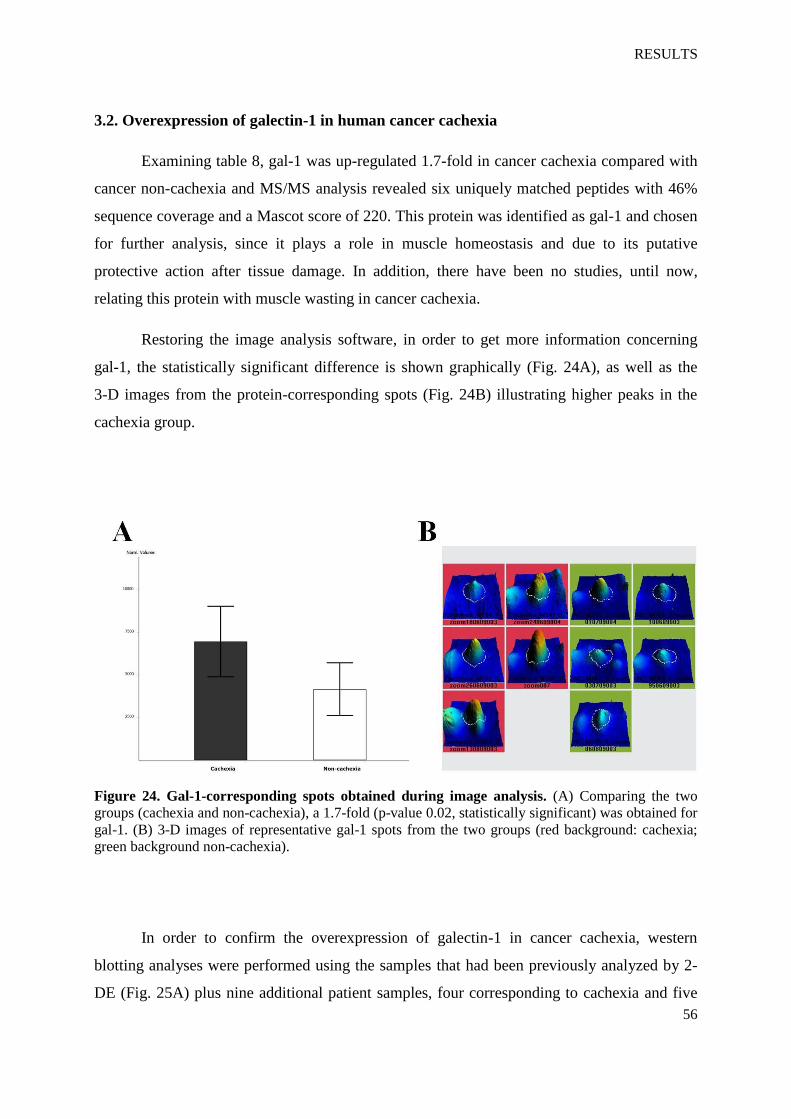
3.2. Overexpression of galectin-1 in human cancer cachexia
Examining table 8, gal-1 was up-regulated 1.7-fold in cancer cachexia compared with
cancer non-cachexia and MS/MS analysis revealed six uniquely matched peptides with 46%
sequence coverage and a Mascot score of 220. This protein was identified as gal-1 and chosen
for further analysis, since it plays a role in muscle homeostasis and due to its putative
protective action after tissue damage. In addition, there have been no studies, until now,
relating this protein with muscle wasting in cancer cachexia.
Restoring the image analysis software, in order to get more information concerning
gal-1, the statistically significant difference is shown graphically (Fig. 24A), as well as the
3-D images from the protein-corresponding spots (Fig. 24B) illustrating higher peaks in the
cachexia group.
Figure 24. Gal-1-corresponding spots obtained during image analysis. (A) Comparing the two
groups (cachexia and non-cachexia), a 1.7-fold (p-value 0.02, statistically significant) was obtained for
gal-1. (B) 3-D images of representative gal-1 spots from the two groups (red background: cachexia;
green background non-cachexia).
In order to confirm the overexpression of galectin-1 in cancer cachexia, western
blotting analyses were performed using the samples that had been previously analyzed by 2-
DE (Fig. 25A) plus nine additional patient samples, four corresponding to cachexia and five
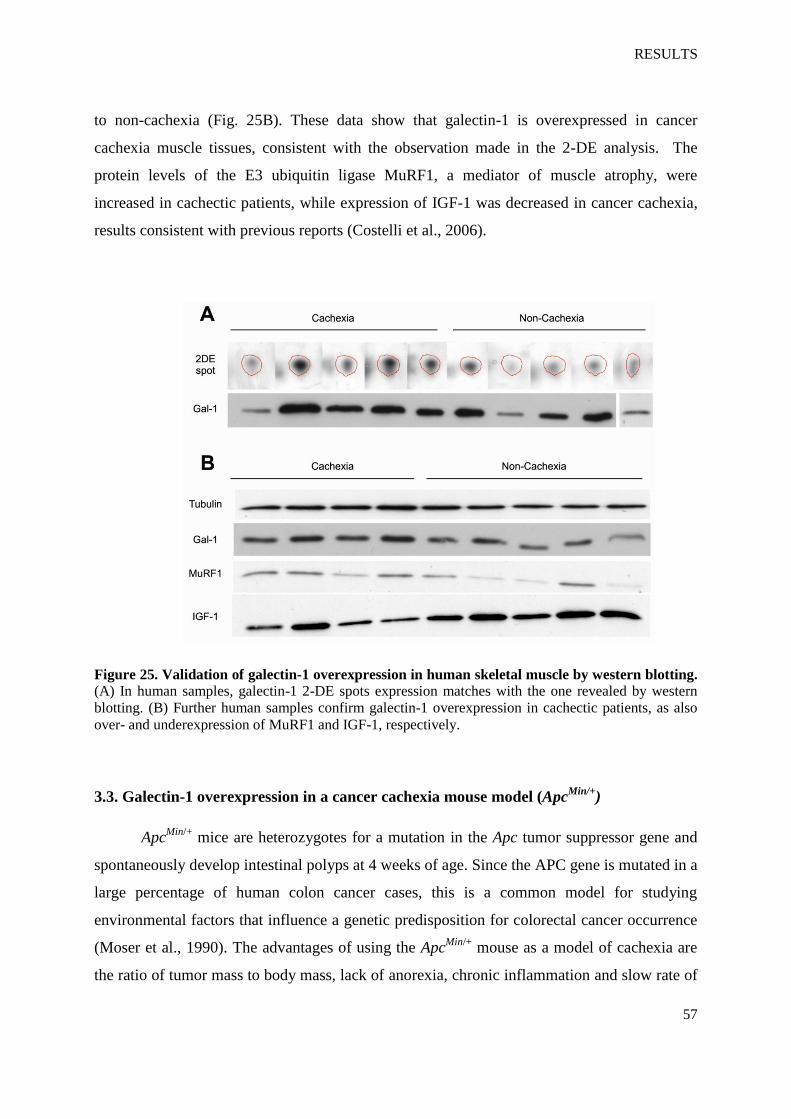
RESULTS
57
to non-cachexia (Fig. 25B). These data show that galectin-1 is overexpressed in cancer
cachexia muscle tissues, consistent with the observation made in the 2-DE analysis. The
protein levels of the E3 ubiquitin ligase MuRF1, a mediator of muscle atrophy, were
increased in cachectic patients, while expression of IGF-1 was decreased in cancer cachexia,
results consistent with previous reports (Costelli et al., 2006).
Figure 25. Validation of galectin-1 overexpression in human skeletal muscle by western blotting. (A) In human samples, galectin-1 2-DE spots expression matches with the one revealed by western
blotting. (B) Further human samples confirm galectin-1 overexpression in cachectic patients, as also
over- and underexpression of MuRF1 and IGF-1, respectively.
3.3. Galectin-1 overexpression in a cancer cachexia mouse model (ApcMin/+
)
ApcMin/+
mice are heterozygotes for a mutation in the Apc tumor suppressor gene and
spontaneously develop intestinal polyps at 4 weeks of age. Since the APC gene is mutated in a
large percentage of human colon cancer cases, this is a common model for studying
environmental factors that influence a genetic predisposition for colorectal cancer occurrence
(Moser et al., 1990). The advantages of using the ApcMin/+
mouse as a model of cachexia are
the ratio of tumor mass to body mass, lack of anorexia, chronic inflammation and slow rate of
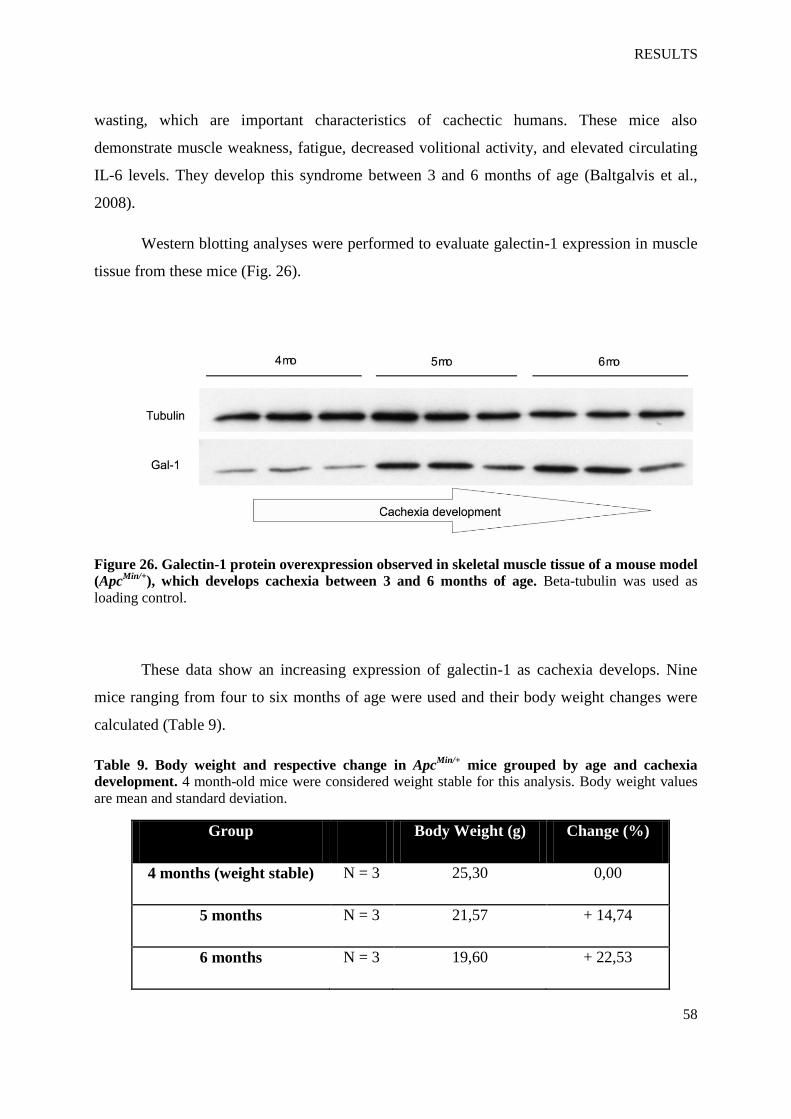
RESULTS
58
wasting, which are important characteristics of cachectic humans. These mice also
demonstrate muscle weakness, fatigue, decreased volitional activity, and elevated circulating
IL-6 levels. They develop this syndrome between 3 and 6 months of age (Baltgalvis et al.,
2008).
Western blotting analyses were performed to evaluate galectin-1 expression in muscle
tissue from these mice (Fig. 26).
Figure 26. Galectin-1 protein overexpression observed in skeletal muscle tissue of a mouse model
(ApcMin/+
), which develops cachexia between 3 and 6 months of age. Beta-tubulin was used as
loading control.
These data show an increasing expression of galectin-1 as cachexia develops. Nine
mice ranging from four to six months of age were used and their body weight changes were
calculated (Table 9).
Table 9. Body weight and respective change in ApcMin/+
mice grouped by age and cachexia
development. 4 month-old mice were considered weight stable for this analysis. Body weight values
are mean and standard deviation.
Group Body Weight (g) Change (%)
4 months (weight stable) N = 3 25,30 0,00
5 months N = 3 21,57 + 14,74
6 months N = 3 19,60 + 22,53
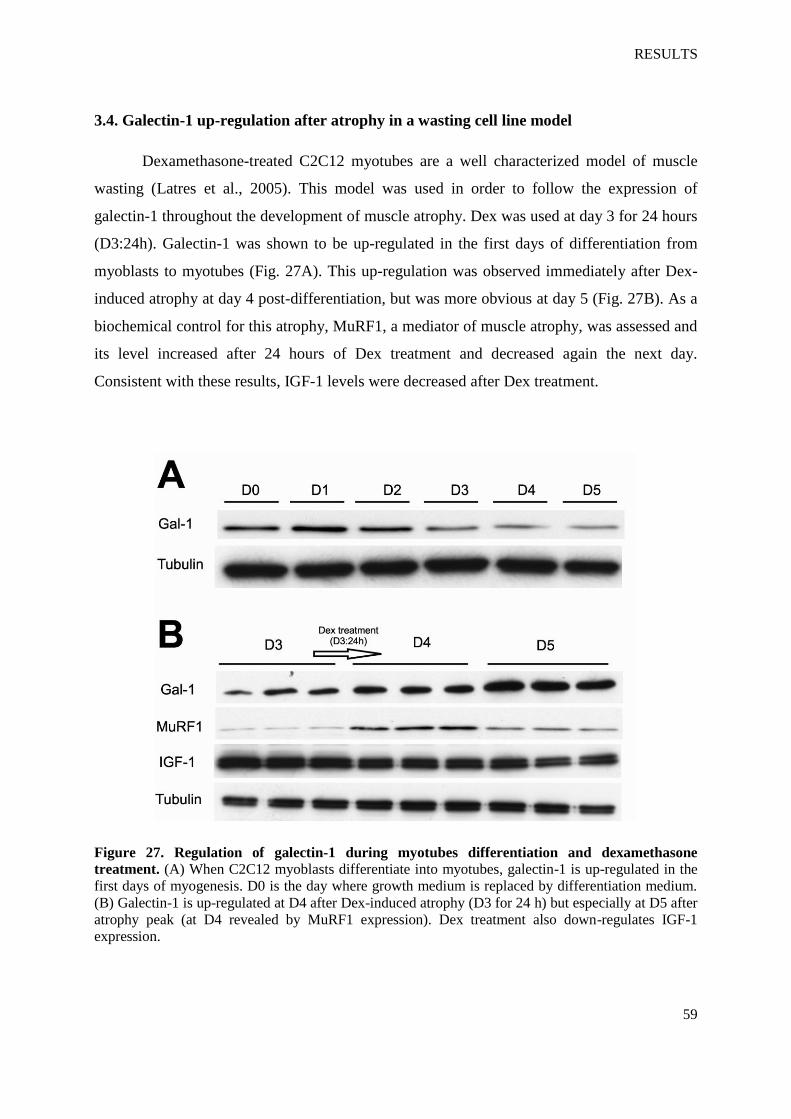
RESULTS
59
3.4. Galectin-1 up-regulation after atrophy in a wasting cell line model
Dexamethasone-treated C2C12 myotubes are a well characterized model of muscle
wasting (Latres et al., 2005). This model was used in order to follow the expression of
galectin-1 throughout the development of muscle atrophy. Dex was used at day 3 for 24 hours
(D3:24h). Galectin-1 was shown to be up-regulated in the first days of differentiation from
myoblasts to myotubes (Fig. 27A). This up-regulation was observed immediately after Dex-
induced atrophy at day 4 post-differentiation, but was more obvious at day 5 (Fig. 27B). As a
biochemical control for this atrophy, MuRF1, a mediator of muscle atrophy, was assessed and
its level increased after 24 hours of Dex treatment and decreased again the next day.
Consistent with these results, IGF-1 levels were decreased after Dex treatment.
Figure 27. Regulation of galectin-1 during myotubes differentiation and dexamethasone
treatment. (A) When C2C12 myoblasts differentiate into myotubes, galectin-1 is up-regulated in the
first days of myogenesis. D0 is the day where growth medium is replaced by differentiation medium.
(B) Galectin-1 is up-regulated at D4 after Dex-induced atrophy (D3 for 24 h) but especially at D5 after
atrophy peak (at D4 revealed by MuRF1 expression). Dex treatment also down-regulates IGF-1
expression.
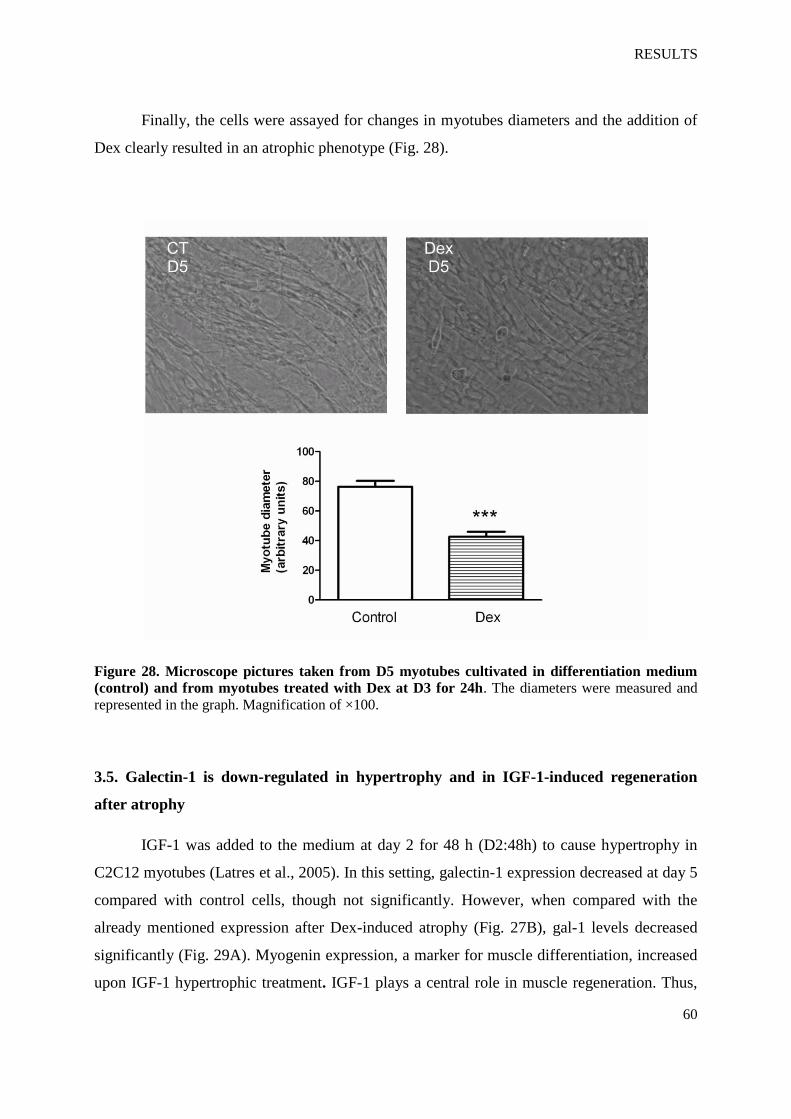
RESULTS
60
Finally, the cells were assayed for changes in myotubes diameters and the addition of
Dex clearly resulted in an atrophic phenotype (Fig. 28).
Figure 28. Microscope pictures taken from D5 myotubes cultivated in differentiation medium
(control) and from myotubes treated with Dex at D3 for 24h. The diameters were measured and
represented in the graph. Magnification of ×100.
3.5. Galectin-1 is down-regulated in hypertrophy and in IGF-1-induced regeneration
after atrophy
IGF-1 was added to the medium at day 2 for 48 h (D2:48h) to cause hypertrophy in
C2C12 myotubes (Latres et al., 2005). In this setting, galectin-1 expression decreased at day 5
compared with control cells, though not significantly. However, when compared with the
already mentioned expression after Dex-induced atrophy (Fig. 27B), gal-1 levels decreased
significantly (Fig. 29A). Myogenin expression, a marker for muscle differentiation, increased
upon IGF-1 hypertrophic treatment. IGF-1 plays a central role in muscle regeneration. Thus,
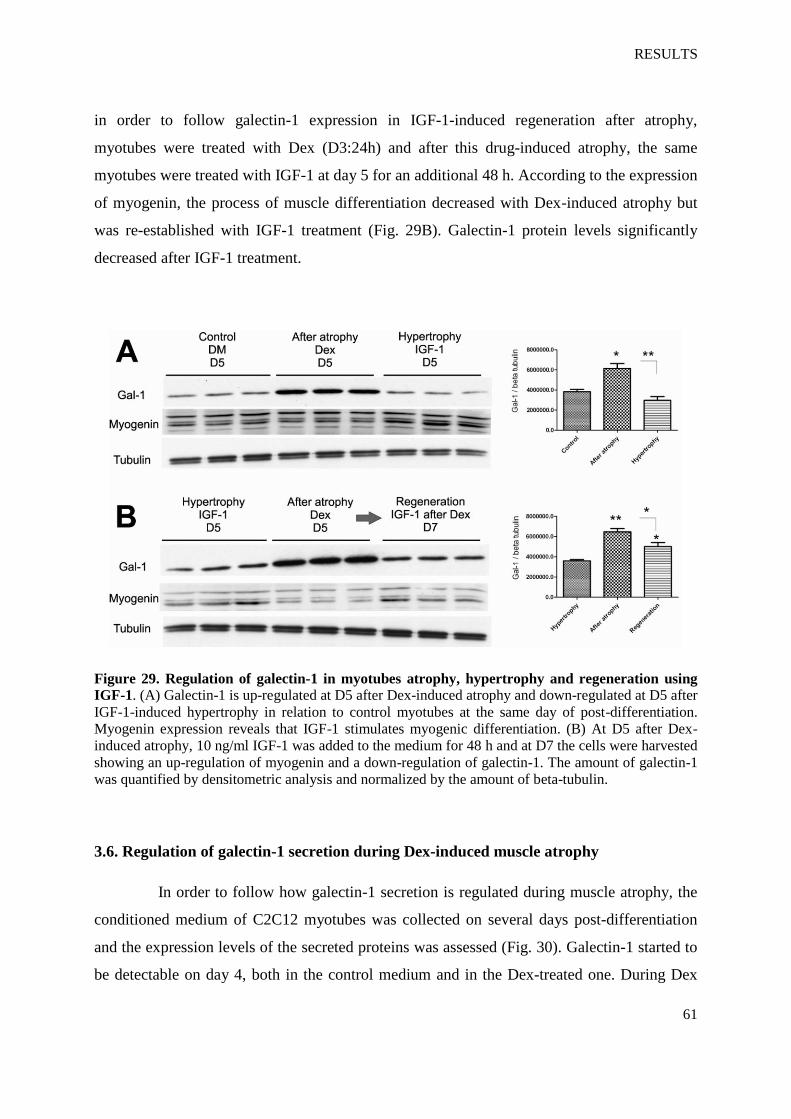
RESULTS
61
in order to follow galectin-1 expression in IGF-1-induced regeneration after atrophy,
myotubes were treated with Dex (D3:24h) and after this drug-induced atrophy, the same
myotubes were treated with IGF-1 at day 5 for an additional 48 h. According to the expression
of myogenin, the process of muscle differentiation decreased with Dex-induced atrophy but
was re-established with IGF-1 treatment (Fig. 29B). Galectin-1 protein levels significantly
decreased after IGF-1 treatment.
Figure 29. Regulation of galectin-1 in myotubes atrophy, hypertrophy and regeneration using
IGF-1. (A) Galectin-1 is up-regulated at D5 after Dex-induced atrophy and down-regulated at D5 after
IGF-1-induced hypertrophy in relation to control myotubes at the same day of post-differentiation.
Myogenin expression reveals that IGF-1 stimulates myogenic differentiation. (B) At D5 after Dex-
induced atrophy, 10 ng/ml IGF-1 was added to the medium for 48 h and at D7 the cells were harvested
showing an up-regulation of myogenin and a down-regulation of galectin-1. The amount of galectin-1
was quantified by densitometric analysis and normalized by the amount of beta-tubulin.
3.6. Regulation of galectin-1 secretion during Dex-induced muscle atrophy
In order to follow how galectin-1 secretion is regulated during muscle atrophy, the
conditioned medium of C2C12 myotubes was collected on several days post-differentiation
and the expression levels of the secreted proteins was assessed (Fig. 30). Galectin-1 started to
be detectable on day 4, both in the control medium and in the Dex-treated one. During Dex
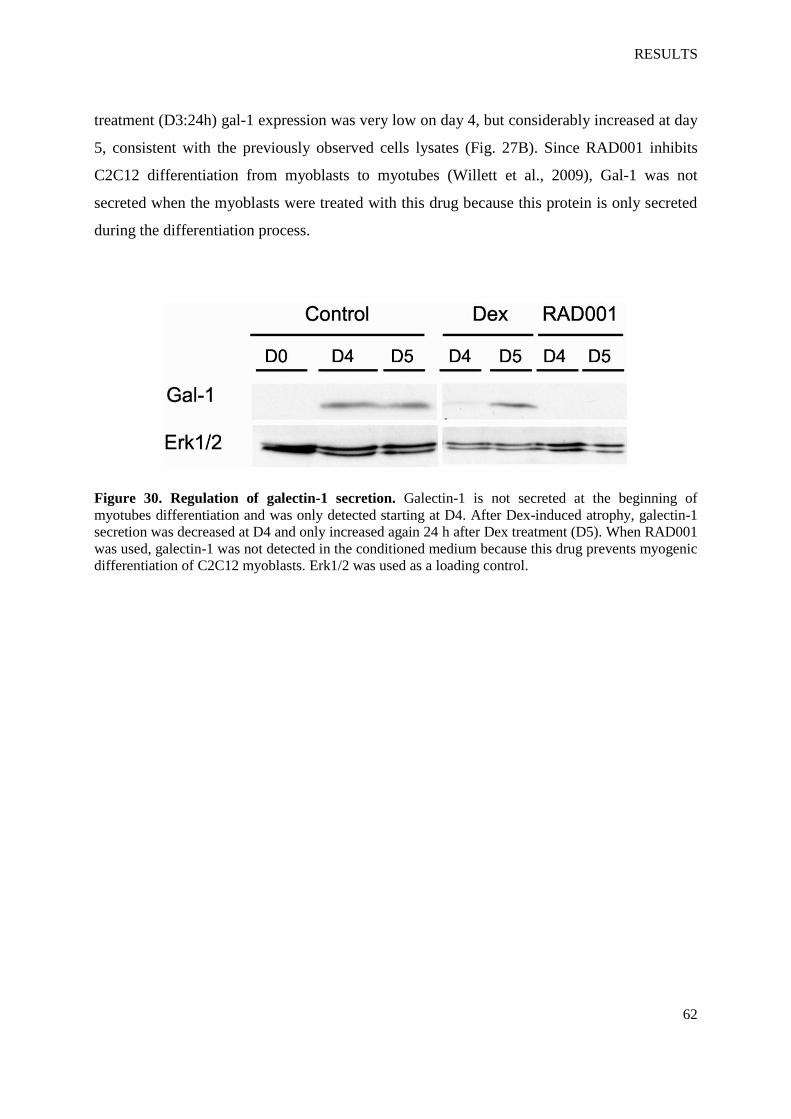
RESULTS
62
treatment (D3:24h) gal-1 expression was very low on day 4, but considerably increased at day
5, consistent with the previously observed cells lysates (Fig. 27B). Since RAD001 inhibits
C2C12 differentiation from myoblasts to myotubes (Willett et al., 2009), Gal-1 was not
secreted when the myoblasts were treated with this drug because this protein is only secreted
during the differentiation process.
Figure 30. Regulation of galectin-1 secretion. Galectin-1 is not secreted at the beginning of
myotubes differentiation and was only detected starting at D4. After Dex-induced atrophy, galectin-1
secretion was decreased at D4 and only increased again 24 h after Dex treatment (D5). When RAD001
was used, galectin-1 was not detected in the conditioned medium because this drug prevents myogenic
differentiation of C2C12 myoblasts. Erk1/2 was used as a loading control.
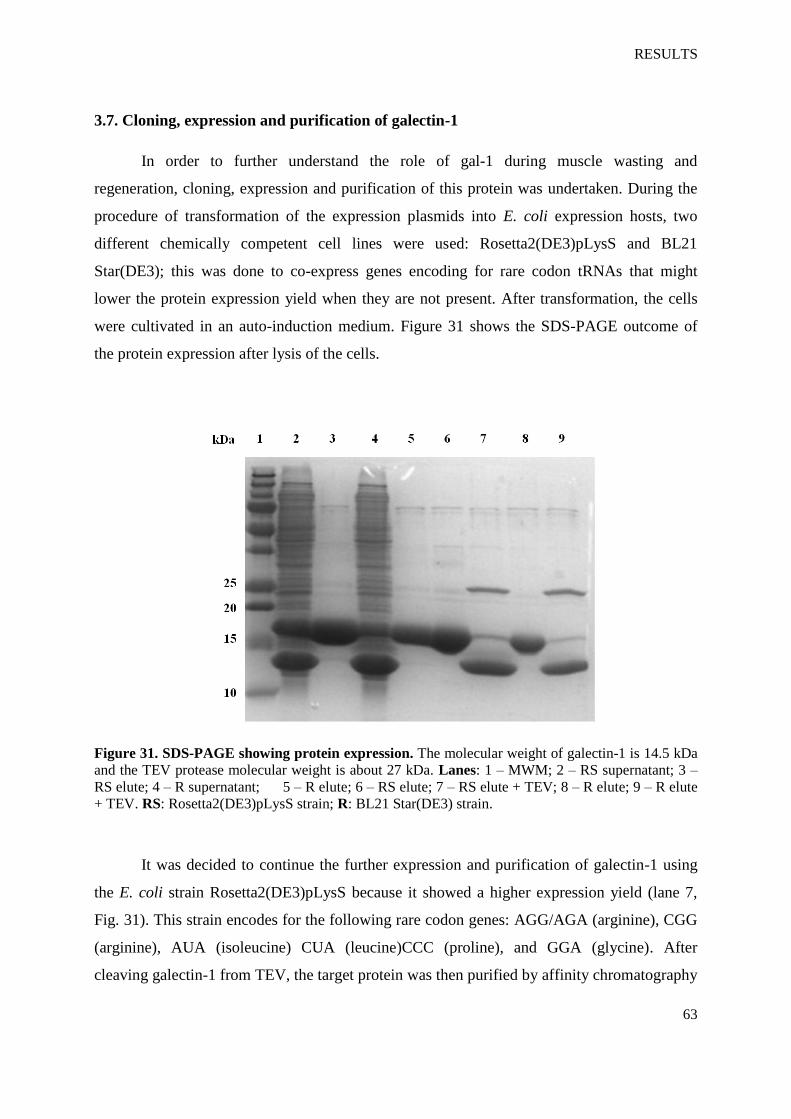
RESULTS
63
3.7. Cloning, expression and purification of galectin-1
In order to further understand the role of gal-1 during muscle wasting and
regeneration, cloning, expression and purification of this protein was undertaken. During the
procedure of transformation of the expression plasmids into E. coli expression hosts, two
different chemically competent cell lines were used: Rosetta2(DE3)pLysS and BL21
Star(DE3); this was done to co-express genes encoding for rare codon tRNAs that might
lower the protein expression yield when they are not present. After transformation, the cells
were cultivated in an auto-induction medium. Figure 31 shows the SDS-PAGE outcome of
the protein expression after lysis of the cells.
Figure 31. SDS-PAGE showing protein expression. The molecular weight of galectin-1 is 14.5 kDa
and the TEV protease molecular weight is about 27 kDa. Lanes: 1 – MWM; 2 – RS supernatant; 3 –
RS elute; 4 – R supernatant; 5 – R elute; 6 – RS elute; 7 – RS elute + TEV; 8 – R elute; 9 – R elute
+ TEV. RS: Rosetta2(DE3)pLysS strain; R: BL21 Star(DE3) strain.
It was decided to continue the further expression and purification of galectin-1 using
the E. coli strain Rosetta2(DE3)pLysS because it showed a higher expression yield (lane 7,
Fig. 31). This strain encodes for the following rare codon genes: AGG/AGA (arginine), CGG
(arginine), AUA (isoleucine) CUA (leucine)CCC (proline), and GGA (glycine). After
cleaving galectin-1 from TEV, the target protein was then purified by affinity chromatography
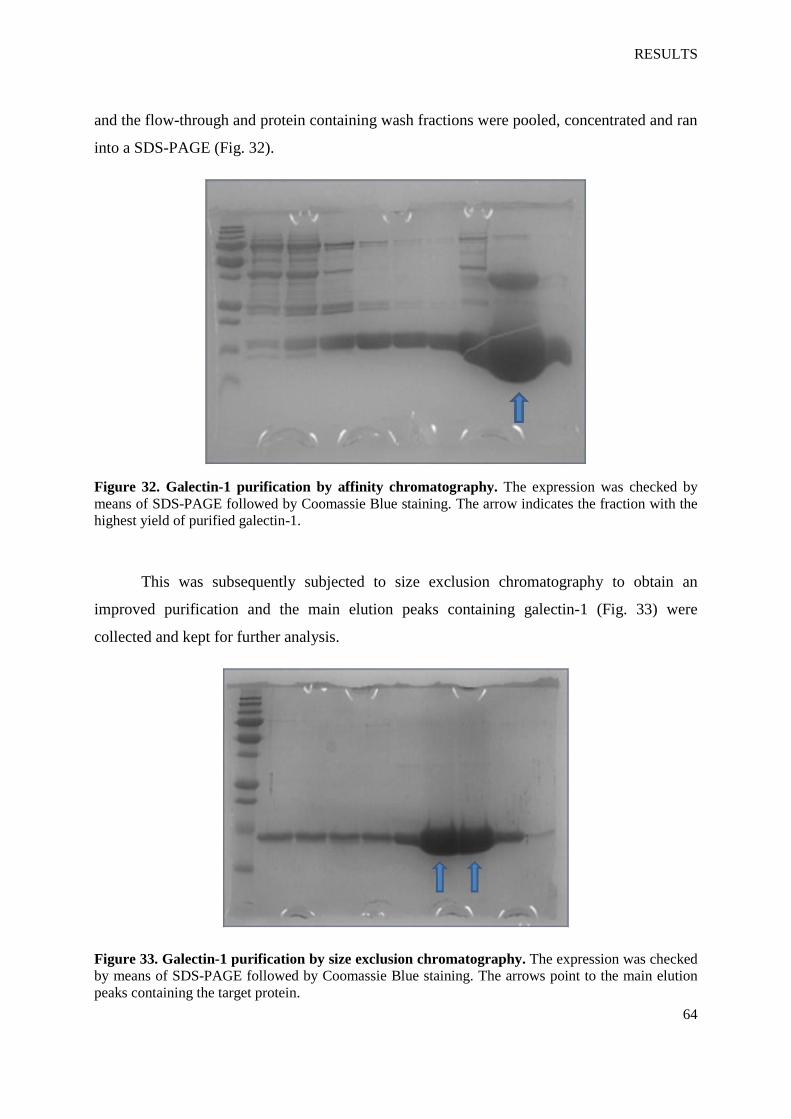
RESULTS
64
and the flow-through and protein containing wash fractions were pooled, concentrated and ran
into a SDS-PAGE (Fig. 32).
Figure 32. Galectin-1 purification by affinity chromatography. The expression was checked by
means of SDS-PAGE followed by Coomassie Blue staining. The arrow indicates the fraction with the
highest yield of purified galectin-1.
This was subsequently subjected to size exclusion chromatography to obtain an
improved purification and the main elution peaks containing galectin-1 (Fig. 33) were
collected and kept for further analysis.
Figure 33. Galectin-1 purification by size exclusion chromatography. The expression was checked
by means of SDS-PAGE followed by Coomassie Blue staining. The arrows point to the main elution
peaks containing the target protein.
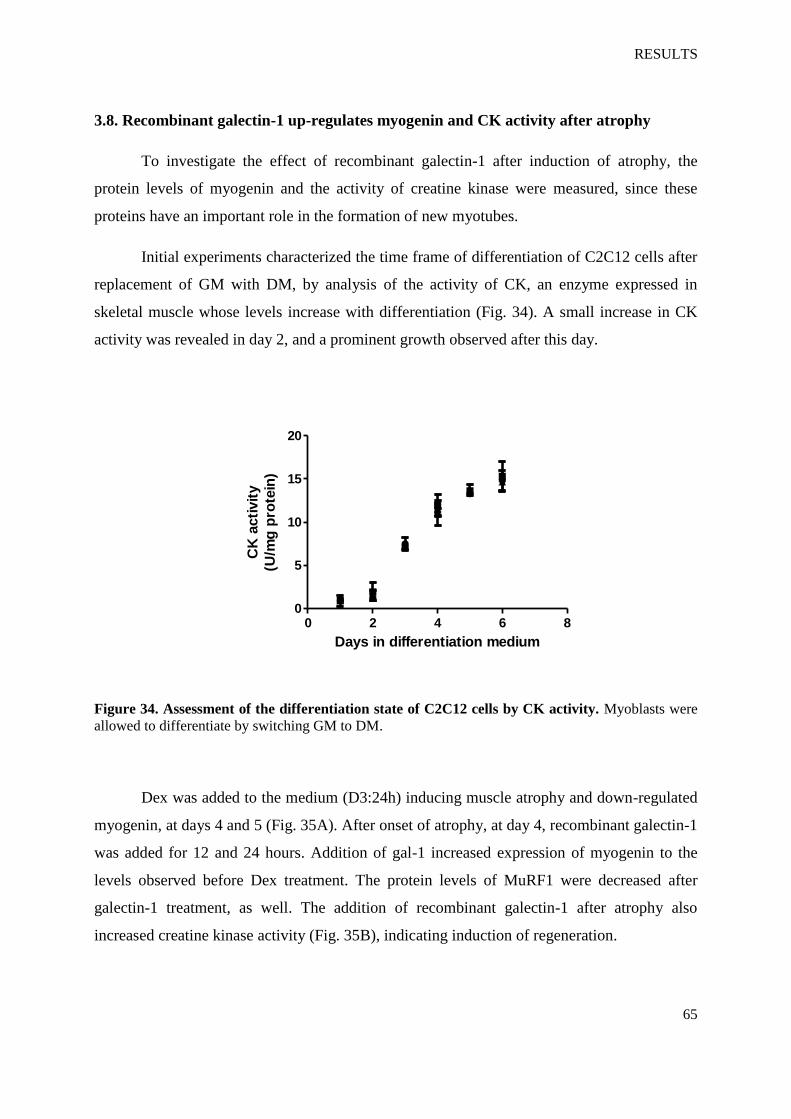
RESULTS
65
3.8. Recombinant galectin-1 up-regulates myogenin and CK activity after atrophy
To investigate the effect of recombinant galectin-1 after induction of atrophy, the
protein levels of myogenin and the activity of creatine kinase were measured, since these
proteins have an important role in the formation of new myotubes.
Initial experiments characterized the time frame of differentiation of C2C12 cells after
replacement of GM with DM, by analysis of the activity of CK, an enzyme expressed in
skeletal muscle whose levels increase with differentiation (Fig. 34). A small increase in CK
activity was revealed in day 2, and a prominent growth observed after this day.
Days in differentiation medium
CK
acti
vit
y
(U/m
g p
rote
in)
0 2 4 6 80
5
10
15
20
Figure 34. Assessment of the differentiation state of C2C12 cells by CK activity. Myoblasts were
allowed to differentiate by switching GM to DM.
Dex was added to the medium (D3:24h) inducing muscle atrophy and down-regulated
myogenin, at days 4 and 5 (Fig. 35A). After onset of atrophy, at day 4, recombinant galectin-1
was added for 12 and 24 hours. Addition of gal-1 increased expression of myogenin to the
levels observed before Dex treatment. The protein levels of MuRF1 were decreased after
galectin-1 treatment, as well. The addition of recombinant galectin-1 after atrophy also
increased creatine kinase activity (Fig. 35B), indicating induction of regeneration.
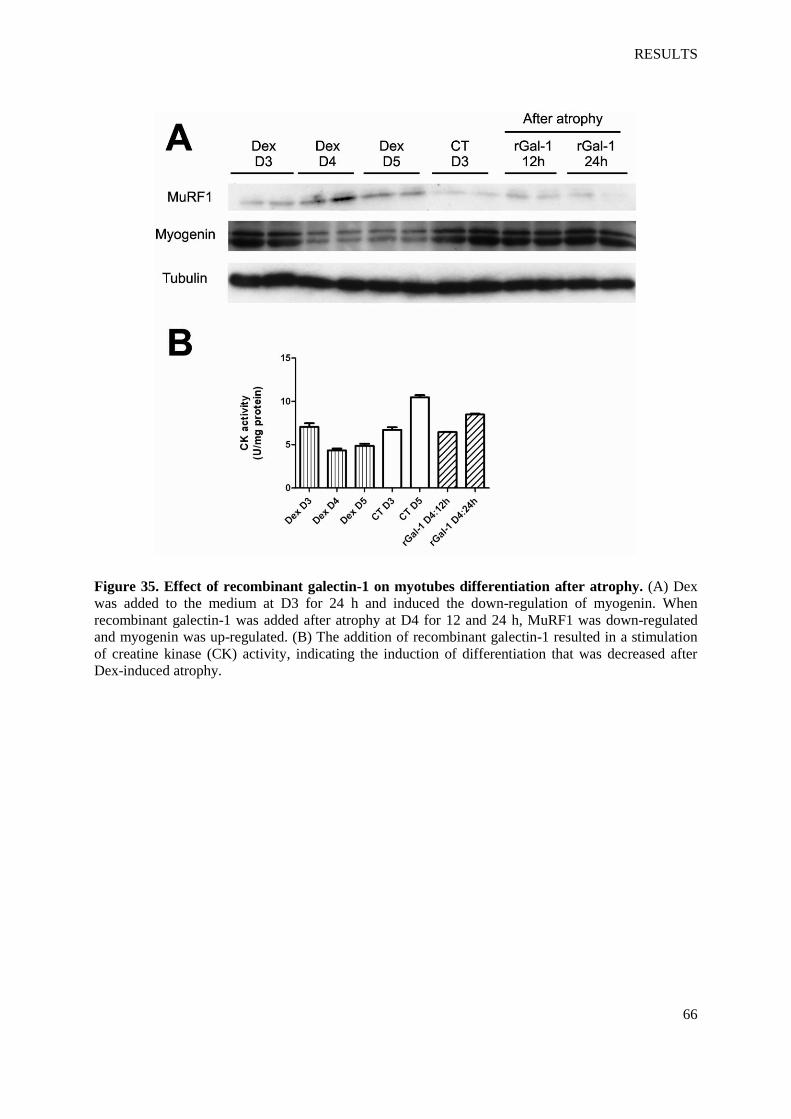
RESULTS
66
Figure 35. Effect of recombinant galectin-1 on myotubes differentiation after atrophy. (A) Dex
was added to the medium at D3 for 24 h and induced the down-regulation of myogenin. When
recombinant galectin-1 was added after atrophy at D4 for 12 and 24 h, MuRF1 was down-regulated
and myogenin was up-regulated. (B) The addition of recombinant galectin-1 resulted in a stimulation
of creatine kinase (CK) activity, indicating the induction of differentiation that was decreased after
Dex-induced atrophy.

DISCUSSION
67
4. DISCUSSION
DISCUSSION
68
4. DISCUSSION
4.1. Skeletal muscle in cancer cachexia: overexpression of galectin-1
For the first time, a proteomic approach was applied in skeletal muscle tissue from
cancer patients with and without cachexia, since the atrophy of this tissue is a hallmark of this
cancer syndrome, with the aim to search for new putative diagnostic markers or therapeutic
targets.
Since the introduction of two-dimensional electrophoresis, this method went through
several modifications; after becoming a significant and widely used separation technique, it
was found to be useful in detection of disease markers, monitoring therapies, drug discovery,
cancer research and in general for monitoring differential protein expression in cells and
tissues, since it enables screening a large number of proteins at the same time. Several
biomarkers have already been discovered using this technique (Tambor et al., 2010).
For this study, it was first necessary to optimize the technique, especially concerning
sample preparation, IEF conditions and silver staining. This was effectuated in order to
achieve a higher resolution and reproducibility of the 2D gels. Subsequently, using 2-DE, 26
differentially expressed spots were found in muscle tissue from patients with cancer cachexia
and cancer non-cachexia. As seen in the introduction above, the definition and classification
of cachexia have always been and still are a matter of discussion. However, during this study,
the definition of cachexia taken into account was “weight loss exceeding 10% of pre-illness
stable body weight within 6 months,” since it is the one used by the surgery departments
whence the samples originally came.
Performing a MALDI-TOF/TOF analysis, 17 of these proteins were identified and
galectin-1 was chosen for further evaluation mainly because (a) the expression of this protein
was significantly higher in cancer cachexia tissues; (b) there is evidence of its role in the
regeneration of the nervous system after injury (Camby et al., 2006; Svensson et al., 2009),
and in the regulation of muscle development, homeostasis and repair (Cerri et al., 2008;
Ahmed et al., 2009; Watt et al., 2004; Kami et al., 2005); and (c) there is a lack of knowledge
on the relation of galectin-1 to cancer cachexia. Furthermore, several studies have proved that
galectin-1 can work as a potential target for diagnosis, prognosis and/or therapies in several
diseases (Camby et al., 2006; Balan et al., 2010).
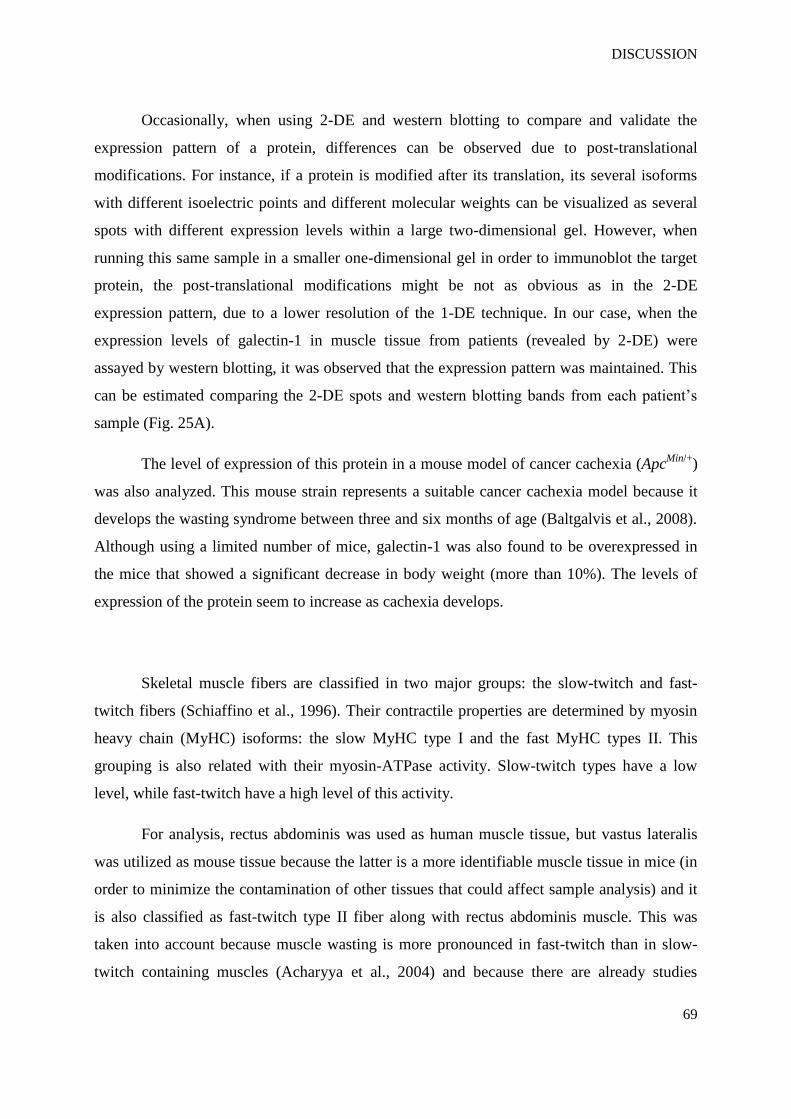
DISCUSSION
69
Occasionally, when using 2-DE and western blotting to compare and validate the
expression pattern of a protein, differences can be observed due to post-translational
modifications. For instance, if a protein is modified after its translation, its several isoforms
with different isoelectric points and different molecular weights can be visualized as several
spots with different expression levels within a large two-dimensional gel. However, when
running this same sample in a smaller one-dimensional gel in order to immunoblot the target
protein, the post-translational modifications might be not as obvious as in the 2-DE
expression pattern, due to a lower resolution of the 1-DE technique. In our case, when the
expression levels of galectin-1 in muscle tissue from patients (revealed by 2-DE) were
assayed by western blotting, it was observed that the expression pattern was maintained. This
can be estimated comparing the 2-DE spots and western blotting bands from each patient’s
sample (Fig. 25A).
The level of expression of this protein in a mouse model of cancer cachexia (ApcMin/+
)
was also analyzed. This mouse strain represents a suitable cancer cachexia model because it
develops the wasting syndrome between three and six months of age (Baltgalvis et al., 2008).
Although using a limited number of mice, galectin-1 was also found to be overexpressed in
the mice that showed a significant decrease in body weight (more than 10%). The levels of
expression of the protein seem to increase as cachexia develops.
Skeletal muscle fibers are classified in two major groups: the slow-twitch and fast-
twitch fibers (Schiaffino et al., 1996). Their contractile properties are determined by myosin
heavy chain (MyHC) isoforms: the slow MyHC type I and the fast MyHC types II. This
grouping is also related with their myosin-ATPase activity. Slow-twitch types have a low
level, while fast-twitch have a high level of this activity.
For analysis, rectus abdominis was used as human muscle tissue, but vastus lateralis
was utilized as mouse tissue because the latter is a more identifiable muscle tissue in mice (in
order to minimize the contamination of other tissues that could affect sample analysis) and it
is also classified as fast-twitch type II fiber along with rectus abdominis muscle. This was
taken into account because muscle wasting is more pronounced in fast-twitch than in slow-
twitch containing muscles (Acharyya et al., 2004) and because there are already studies
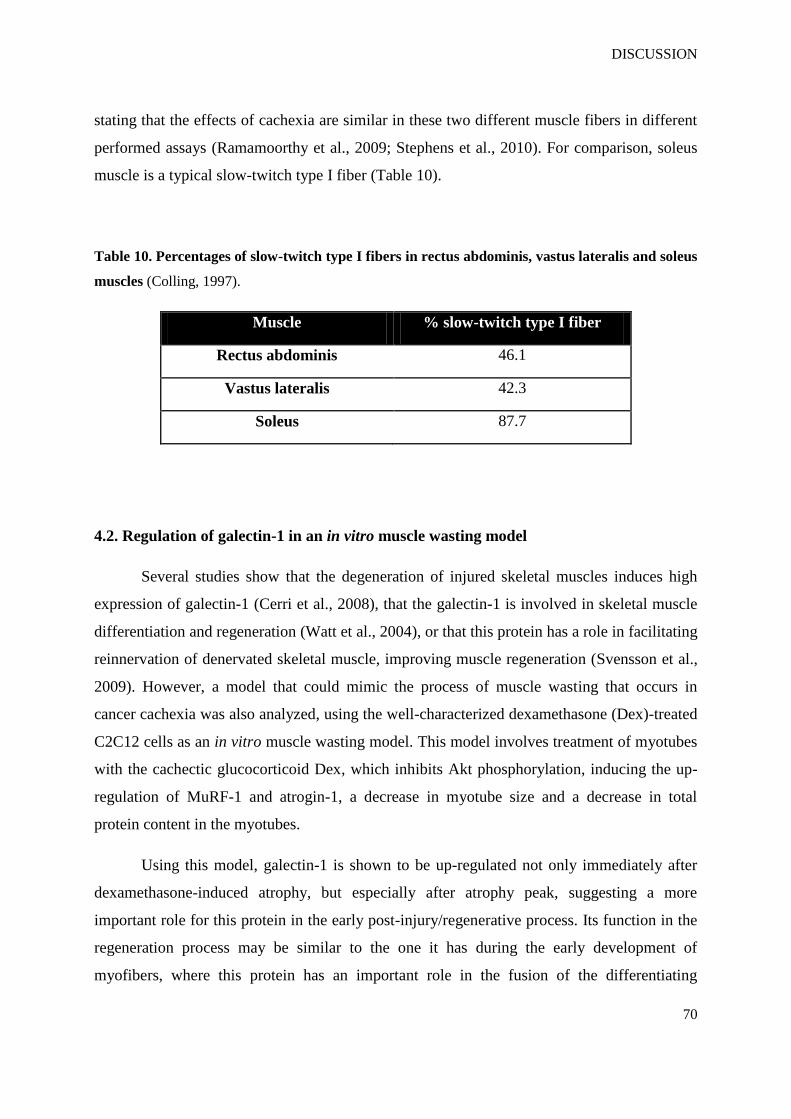
DISCUSSION
70
stating that the effects of cachexia are similar in these two different muscle fibers in different
performed assays (Ramamoorthy et al., 2009; Stephens et al., 2010). For comparison, soleus
muscle is a typical slow-twitch type I fiber (Table 10).
Table 10. Percentages of slow-twitch type I fibers in rectus abdominis, vastus lateralis and soleus
muscles (Colling, 1997).
Muscle % slow-twitch type I fiber
Rectus abdominis 46.1
Vastus lateralis 42.3
Soleus 87.7
4.2. Regulation of galectin-1 in an in vitro muscle wasting model
Several studies show that the degeneration of injured skeletal muscles induces high
expression of galectin-1 (Cerri et al., 2008), that the galectin-1 is involved in skeletal muscle
differentiation and regeneration (Watt et al., 2004), or that this protein has a role in facilitating
reinnervation of denervated skeletal muscle, improving muscle regeneration (Svensson et al.,
2009). However, a model that could mimic the process of muscle wasting that occurs in
cancer cachexia was also analyzed, using the well-characterized dexamethasone (Dex)-treated
C2C12 cells as an in vitro muscle wasting model. This model involves treatment of myotubes
with the cachectic glucocorticoid Dex, which inhibits Akt phosphorylation, inducing the up-
regulation of MuRF-1 and atrogin-1, a decrease in myotube size and a decrease in total
protein content in the myotubes.
Using this model, galectin-1 is shown to be up-regulated not only immediately after
dexamethasone-induced atrophy, but especially after atrophy peak, suggesting a more
important role for this protein in the early post-injury/regenerative process. Its function in the
regeneration process may be similar to the one it has during the early development of
myofibers, where this protein has an important role in the fusion of the differentiating
DISCUSSION
71
myoblasts (Kami and Senba, 2005; Watt et al., 2004) dissociating them from their substrates,
such as laminin, in order for them to fuse and differentiate into myotubes. Also, in chick
myogenesis, the highest level of gal-1 expression is observed when the fusion of myoblasts
reaches its peak (Nowak et al., 1976).
In has already been shown that, through IGF-1, the hypertrophy-inducing PI3K/Akt
pathway can dominantly block the atrophic effects of Dex via Akt-mediated phosphorylation
and subsequent inhibition of the ubiquitin ligases (Latres et al., 2005; Glass, 2005). Further
exploring the regulation of galectin-1 in the Dex-treated C2C12 cells model, it was observed
that this protein is not significantly regulated under IGF-1-induced-hypertrophy, but down-
regulated when IGF-1 rescues muscle regeneration after atrophy. The addition of IGF-1 in
vitro to differentiated myotubes promoting myotube hypertrophy supports the idea that IGF-1
is sufficient to induce hypertrophy (Latres et al., 2005). Since IGF-1 is down-regulated in
cancer cachexia (Costelli et al., 2006), it can be postulated that galectin-1 plays a role in
muscle regeneration in the absence of IGF-1.
Galectin-1 expression and its cellular localization, following muscle atrophy and
during regeneration, change significantly. This galectin can be found distributed diffusely
throughout the cytoplasm, but can also be secreted interacting with laminin in the basement
membrane (Svensson and Tågerud, 2009). Thus, how its secretion is regulated during muscle
atrophy was analyzed. Collecting and analyzing the conditioned medium, it was observed
that: (a) the level of secretion of gal-1 was very low, almost undetectable, immediately after
Dex-induced atrophy; and (b) the gal-1 secretion reached its maximum 24 h after Dex-
treatment, consistent with the previous results obtained with the cell lysates. This may
attribute a more direct/functional role to galectin-1 in the muscle regeneration process, rather
than being merely an epiphenomenon of the muscle atrophy progression.
4.3. Contribution of recombinant galectin-1 to muscle regeneration
It is has been reported that exposure of C2C12 cells to galectin-1 have resulted in an
increase of myoblasts fusion into myotubes, and myoblasts derived from galectin-1 null
DISCUSSION
72
mouse showed reduced fusion (Watt et al., 2004); there is also evidence that the stimulation of
laminin receptors of C2C12 cells increases myoblasts proliferation, myotubes formation and
the expression levels of positive myogenic factors, such as myoD and myogenin (Grossi et al.,
2007). Mechanical stimulation via laminin receptors is also reported to induce myoblasts
differentiation and to promote an increase of galectin-1 expression (Grossi et al., 2011).
Therefore, whether the addition of exogenous galectin-1 to the Dex-induced atrophied
cells would have a positive effect was verified. For expressing the recombinant galectin-1, the
E. coli strain Rosetta2(DE3)pLysS was used because it showed a higher expression yield than
the other strains. Two purification steps were taken: affinity chromatography and size
exclusion chromatography. In order to maintain the carbohydrate-binding activity of the
recombinant protein, the purification and storage of galectin-1 were carried out in the
presence of a thiol-reducing agent (DTT) to prevent oxidative inactivation due to the
formation of intramolecular disulfide bonds.
Using the recombinant galectin-1 at day 4 for 12 and 24 h, the induction of
differentiation after muscle atrophy could be restarted. Although both treatments had positive
results, the second one (24 h) resulted in higher levels of the differentiation markers. Besides
the fact of longer exposure to the protein, this might also have to do with the fact that
galectin-1 could have a more important role not right after the muscle injury, but at a later
time. As observed previously, galectin-1 expression and secretion were always higher on day
5, 24 h after Dex-induced atrophy, pointing to a more important function during this time.
Although cancer cachexia is a complex metabolic condition, the present findings suggest that
galectin-1 could be taken into account as a potential therapeutic target in muscle wasting,
which is the hallmark of this cancer syndrome.
4.4. Future perspectives
Currently there are no drugs approved for the prevention or treatment of cancer
cachexia and specific diagnosis tools are needed to differentiate this cancer syndrome from
others, such as sarcopenia or anorexia.
DISCUSSION
73
To validate galectin-1 as a diagnostic tool, due to its overexpression in skeletal muscle
of pancreatic cancer patients with cachexia, it would be necessary to screen more samples
from this type of patient to check whether this overexpression is maintained within a larger
number of samples. Also, it would be interesting to screen patients suffering with cachexia
due to other types of cancer, such as gastric or colon cancer (which also have a high
prevalence of cachexia) to see if gal-1 is also overexpressed. Moreover, it would bring greater
knowledge if other types of fast-twitch type II muscle, such as vastus lateralis, could be
analyzed. This way it would be possible to foresee the specificity or ambiguity of galectin-1,
concerning type of cancer and type of skeletal muscle within cachexia. Furthermore, a larger
number of more ApcMin/+
mice could be analyzed as well as other cachexia animal models,
such as the murine adenocarcinoma (MAC) 16 tumor model or the rat Yoshida AH-130
model.
Using recombinant gal-1, the induction of differentiation after muscle atrophy could
be restarted. These results indicate that a suitable application of gal-1 might have great
potential in the therapy of muscle wasting. The administration of recombinant gal-1 in
cachexia mouse models at different stages of development would be a good next step to check
its effect on putative muscle regeneration.
At a fundamental scientific level, more functional studies should be carried out in
order to improve our understanding of gal-1 functions in muscle atrophy and regeneration, as
well as its interaction with key players, such as IGF-1 or laminin and other receptors.

SUMMARY AND CONCLUSIONS
74
5. SUMMARY AND CONCLUSIONS
SUMMARY AND CONCLUSIONS
75
5. SUMMARY AND CONCLUSIONS
Cancer cachexia is defined as an unintended weight loss of 10% within 6 months and
is a complex metabolic condition that affects up to 80% of patients with advanced cancer and
accounts for nearly 30% of cancer-related deaths. Loss of skeletal muscle is one of the most
important components of the pathophysiology of this condition.
In the present thesis, a proteomic approach shows that skeletal muscle from patients
with cancer cachexia, as well as from a mouse model (ApcMin/+
) of this cancer syndrome,
express higher levels of galectin-1. Using the well-characterized dexamethasone-treated
C2C12 cells as an in vitro muscle wasting model, it was observed that galectin-1 is up-
regulated after muscle atrophy when IGF-1 signaling is down-regulated, which is
characteristic for cancer cachexia.
Adding recombinant galectin-1, atrophied C2C12 cells started to redifferentiate. It is
postulated that galectin-1 could have a role in the regeneration process after muscle wasting
induced by cancer cachexia, and that this protein could be a potential diagnostic biomarker
and a therapeutic target in the treatment of muscle wasting due to this cancer syndrome.
ZUSAMMENFASSUNG
76
ZUSAMMENFASSUNG
Tumorkachexie ist eine komplexe Stoffwechselstörung, bei der der Verlust von
Skelettmuskulatur eine der wichtigsten pathophysiologischen Komponenten ist. Mittels eines
proteomischen Ansatzes wurde gezeigt, dass die Skelettmuskulatur von Patienten mit
Tumorkachexie und die des Mausmodells höhere Mengen des Proteins Galectin-1
exprimieren. In einem in vitro Muskelverlustmodell zeigte sich, dass Galectin-1 bei
Muskelatrophie hochreguliert wird, wenn der IGF-1 Signalweg herunterreguliert ist, was bei
Tumorkachexie typischerweise der Fall ist. Bei Zugabe von rekombinanten Galectin-1
begannen atrophierte C2C12 Zellen zu redifferenzieren. Galectin-1 könnte eine Rolle im
Regenerationsprozess nach durch Kachexie induziertem Muskelverlust spielen und sowohl
einen diagnostischer Marker als auch ein therapeutisches Ziel in der Behandlung von
Muskelverlust durch Kachexie darstellen.
REFERENCES
77
REFERENCES
Acharyya, S., Guttridge, D.C. (2007) Cancer cachexia signaling pathways continue to
emerge yet much still points to the proteasome. Clin Cancer Res 13(5), 1356-1361.
Acharyya, S., Ladner, K.J., Nelsen, L.L., et al. (2004) Cancer cachexia is regulated by
selective targeting of skeletal muscle gene products. J. Clin. Invest.114(3), 370–378
Acharyya, S., Butchbach, M.E., Sahenk, Z., et al. (2005) Dystrophin glycoprotein complex
dysfunction: a regulatory link between muscular dystrophy and cancer cachexia. Cancer Cell
8(5), 421-432
Adams, J. (2008) The proteome: discovering the structure and function of proteins. Nature
Education 1(3)
Aebersold, R., and Mann, M. (2003) Mass spectrometry-based proteomics. Nature 422,
198–207
Ahmed, H., Du, S.J., Vasta, G.R. (2009) Knockdown of a galectin-1-like protein in
zebrafish (Danio rerio) causes defects in skeletal muscle development. Glycoconj. J 26(3),
277-283
Bachmann, J., Ketterer, K., Marsch, C., et al. (2009) Pancreatic cancerrelated cachexia:
influence on metabolism and correlation to weight loss and pulmonary function. BMC Cancer
9, 255
REFERENCES
78
Baltgalvis, K.A., Berger, F.G., Pena, M.M.O., et al. (2008) Interleukin-6 and cachexia in
Apc (Min/+) mice. Am. J. Physiol. Regul. Integr. Comp. Physiol 294, R393-R401
Balan, V., Nangia-Makker, P., Raz, A. (2010) Galectins as cancer biomarkers. Cancers 2,
592-610
Banks, R., Dunn, M., Forbes, M. et al. (1999) The potential use of laser capture
microdissection to selectively obtain distinct populations of cells for proteomic analysis—
preliminary findings. Electrophoresis 20(4–5), 689–700
Barber, M.D., Ross, J.A., Voss, A.C. et al. (1999) The effect of an oral nutritional
supplement enriched with fish oil on weight-loss in patients with pancreatic cancer. Br. J.
Cancer 81, 80-86
Bartlett, D.L., Stein, P., Torosian, M.H. (1995) Effect of growth hormone and protein
intake on tumour growth and host cachexia. Surgery 117, 260-267
Beal, J.E., Olson, R., Laubenstein, L. et al. (1995) Dronabinol as a treatment for anorexia
associated with weight loss in patients with AIDS. J. Pain Symptom Manage 10, 89-97
Beck, S.A., Groundwater, P., Barton, C., et al. (1990) Alterations in serum lipolytic activity
of cancer patients with response to therapy. Br. J. Cancer 62, 822–825
REFERENCES
79
Beller, E., Tattersall, M., Lumley, T. et al. (1997) Improved quality of life with megestrol
acetate in patients with endocrine-insensitive advanced cancer: a randomised placebo-
controlled trial. Ann. Oncol 8, 277-283
Bhattacharyya, G.S., Julka, P.K., Bondarde, S. et al. (2010) Phase II study evaluating
safety and efficacy of coadministering propranolol and etodolac for treating cancer cachexia.
2010 ASCO Annual Meeting, 56-78
Bing, C., Bao, Y., Jenkins, J., et al. (2004) Zinc-a2-glycoprotein, a lipid mobilising factor, is
expressed in adipocytes and upregulated in mice with cancer cachexia. Proc. Natl. Acad. Sci.
USA 101, 2500–2505
Bozzetti, F., Amadori, D., Bruera, E. et al. (1996) Guidelines on artificial nutrition versus
hydration in terminal cancer patients. Nutrition 12, 163-167
Breuer, B., Trungold, S., Martucci, C. et al. (2001) Relationships of sex hormone levels to
dependence in activities of daily living in the frail elderly. Maturitas 39, 147-159
Bruera, E., Strasser, F., Palmer, J.L., et al. (2003) Effect of fish oil on appetite and other
symptoms in patients with advanced cancer and anorexia/cachexia: a double-blind, placebo-
controlled study. J Clin Oncol 21, 129-134
Bruera, E., Neumann, C.M., Pituskin, E. et al. (1999) Thalidomide in patients with
cachexia due to terminal cancer: preliminary report. Ann. Oncol 10, 857-859
Bruera, E. (1998) Pharmacological treatment of cachexia: any progress? Support Care
Cancer 6, 109-113
REFERENCES
80
Bruera, E., MacEachern, T., Spachynski, K. et al. (1994) Comparison of the efficacy,
safety and pharmacokinetics of controlled release and immediate release metoclopramide for
the management of chronic nausea in patients with advanced cancer. Cancer 74, 3204-3211
Bruera, E., Chadwick, S., Fox, R. et al. (1986) Study of cardiovascular autonomic
insufficiency in advanced cancer patients. Cancer Treat. Rep 70, 1383-1387
Brunet, S., Thibault, P., Gagnon, E. et al. (2003) Organelle proteomics: Looking at less to
see more. Trends Cell Boil. 13, 629–638
Burman, R., Chamberlain, J. (1996) The assessment of the nutritional status, caloric intake,
and appetite of patients with advanced cancer. In: Bruera E, Higginson I, eds. Cachexia-
anorexia in cancer patients. Oxford: Oxford University Press, 83-93
Camby, I., Le Mercier, M., Lefranc, F., et al. (2006) Galectin-1: a small protein with major
functions. Glycobiology 16(11), 137R-157R
Cariuk, P., Lorite, M.J., Todorov, P.T., et al. (1997) Induction of cachexia in mice by a
product isolated from the urine of cachectic cancer patients. Br. J. Cancer 76, 606– 613
Celis, J.E., Celis, P., Ostergaard, M. et al. (1999) Proteomics and immunohistochemistry
define some of the steps involved in the squamous differentiation of the bladder transitional
epithelium: A novel strategy for idenfying metaplastic lesions. Cancer Res 59(12), 3003–3009
REFERENCES
81
Cerri, D.G., Rodrigues, L.C., Stowell, S.R., et al. (2008) Degeneration of dystrophic or
injured skeletal muscles induces high expression of galectin-1. Glycobiology 18(11), 842–850
Chargé, S.B., Rudnicki, M.A. (2004) Cellular and molecular regulation of muscle
regeneration. Physiol Rev 84(1), 209 – 238
Choo, J., Horan, M., Little, R. et al. (1990) Effects of the beta 2- adrenoceptor agonist,
clenbuterol, on muscle atrophy due to food deprivation in the rat. Metabolism 39, 647-650
Colling, R. (1997) Fibre Type Distribution in Human Muscles. Exercise Physiology
Educational Resources, Curtin University, Australia
Colman, R.J., Roecker, E.B., Ramsey, J.J. et al. (1998) The effect of dietary restriction on
body composition in adult male and female rhesus macaques. Aging Clin Exp Res 10, 83-92
Conlisk, E.A., Haas, J.D., Martinez, E.J. et al. (1992) Predicting body composition from
anthropometry and bioimpedance. Am J Clin Nutr 55, 1051-1059
Costelli, P., Muscaritoli, M., Bossola, M., et al. (2006) IGF-1 is downregulated in
experimental cancer cachexia. Am. J. Physiol. Regul. Integr. Comp. Physiol 291(3), R674-
683
Costelli, P., Baccino, F.M. (2000) Cancer cachexia: from experimental models to patient
management. Curr Opin Clin Nutr Metab Care 3, 177-181
REFERENCES
82
Davis, M.P., Dickerson, E.D. (2001) Thalidomide: dual benefits in palliative medicine and
oncology. Am J Hpsp Palliative Care 18, 347-351
DeWys, W.D., Begg, C., Lavin, P.T. et al. (1980) Prognostic effect of weight loss prior to
chemotherapy in cancer patients. Am J Med 69, 491-497
Dias-Baruffi, M., Stowell, S.R., Song, S.C. (2010) Differential expression of
immunomodulatory galectin-1 in peripheral leukocytes and adult tissues and its cytosolic
organization in striated muscle. Glycobiology 20(5), 507-520
Dodson, S., Baracos, V.E., Jatoi, A. (2011) Muscle wasting in cancer cachexia: Clinical
implications, diagnosis, and emerging treatment strategies. Annu Rev Med 62, 265-279
Doran, P., Donoghue, P., O’Connell, K. et al. (2009) Proteomics of skeletal muscle aging.
Proteomics 9, 989-1003
Dunlop, R. (1996) Clinical epidemiology of cancer cachexia. In: Bruera E, Higginson I, eds.
Cachexia-anorexia in cancer patients. Oxford: Oxford University Press, 76-82
Dunn, W.B. (2011) Mass spectrometry in systems biology an introduction. Methods Enzymol
500, 15-35.
Dunn, M.J., Görg, A. (2000) Two-dimensional polyacrylamide gel electrophoresis for
proteome analysis. In: Proteomics (Pennington S, Dunn MJ, eds.). BIOS Scientific Publishers,
43-63
REFERENCES
83
Earl, L.A., Bi, S., Baum, L.G. (2010) N- and O-glycans modulate galectin-1 binding, CD45
signaling, and T cell death. J. Biol. Chem 285, 2232-2244
Eigler, A., Sinha, B., Hartmann, G. et al. (1997) Taming TNF: strategies to restrain this
proinflammatory cytokine. Immunol Today. 18,487
Eley, H.L., Russell, S.T., Tisdale, M.J. (2007) Attenuation of muscle atrophy in a murine
model of cachexia by inhibition of the dsRNA-dependent protein kinase. Br J Cancer 96(8),
1216-1222
Elkina, Y., von Haehling, S., Anker, S.D. et al. (2011) The role of myostatin in muscle
wasting: an overview. J Cachexia Sarcopenia Muscle 2(3), 143-151
Evans, W.J. (2010) Skeletal muscle loss: cachexia, sarcopenia, and inactivity. Am J Clin
Nutr 91(4), 1123S-1127S
Evans, W.J., Morley, J.E., Argilés, J. et al. (2008) Cachexia: a new definition. Clin. Nutr.
27(6),793-799
Fahey, J.L., Schnelle, J.F., Boscardin, J. et al. (2000) Distinct categories of immunologic
changes in frail elderly. Mech Aging Dev 115, 1-20
Fearon, K.C.H. (2008) Cancer cachexia: Developing multimodal therapy for a
multidimensional problem. Eur. J. Cancer 44(8), 1124-1132
REFERENCES
84
Fearon, K.C.H., Voss, A.C., Hustead, D.S. (2006) Definition of cancer cachexia: effect of
weight loss, reduced food intake, and systemic inflammation on functional status and
prognosis. Am J Clin Nutr 83, 1345–1350
Feingold, K.R., Grunfeld, C. (1987) Tumour necrosis factor-alpha stimulates lipogenesis in
the rat in vivo. J Clin Invest 80, 184-190
Felix, K., Fakelman, F., Hartmann, D., et al. (2011) Identification of serum proteins
involved in pancreatic cancer cachexia. Life Sci 88, 218-225
Ferrando, A.A., Paddon-Jones, D., Hays, N.P. et al. (2010) EAA supplementation to
increase nitrogen intake improves muscle function during bed rest in the elderly. Clin Nutr 23,
18–23
Ferreira, R., Vitorino, R., Neuparth, M.J. et al. (2009) Proteolysis activation and proteome
alterations in murine skeletal muscle submitted to 1 week of hindlimb suspension. Eur J Appl
Physiol 107(5), 553-563
Gagnon, B., Bruera, E. (1998) A review of the drug treatment of cachexia associated with
cancer. Drugs 55, 675-688
Gelfi, C., Vigano, A., Ripamonti, M. et al. (2006) The human muscle proteome in aging. J
Proteome Res 5(6), 1344-53
REFERENCES
85
Glass, D.J. (2005) Skeletal muscle hypertrophy and atrophy signaling pathways. Int. J.
Biochem. Cell Biol 37(10), 1974-1984
Görg, A., Weiss, W, Dunn, M.J. (2004) Current two-dimensional electrophoresis technology
for proteomics. Proteomics 4, 3665-3685
Görg, A., Weiss, W. (2000) 2D electrophoresis with immobilized pH gradients. In: Proteome
Research: Two-Dimensional Electrophoresis and Identification Methods (Ed: Rabilloud T),
Springer 57-106
Grinspoon, S., Corcoran, C., Anderson, E. et al. (1999) Sustained anabolic effects of long-
term androgen administration in men with AIDS wasting. Clin Infect Dis 28, 634-636
Grossi, A., Lametsch, R., Karlsson, A.H. et al. (2011) Mechanical stimuli on C2C12
myoblasts affect myoblast differentiation, focal adhesion kinase phosphorylation and galectin-
1 expression: a proteomic approach. Cell Biol Int 35, 579-586
Grossi, A., Yadav, K., Lawson, M.A. (2007) Mechanical stimulation increases proliferation,
differentiation and protein expression in culture: stimulation effects are substrate dependent.
J. Biomech. 40(15), 3354-3362
Hathout, Y. (2007) Approaches to the study of the cell secretome. Expert Review Proteomics
4 (2), 239–248
REFERENCES
86
Hengge, U.R., Baumann, M., Maleba, R. et al. (1996) Oxymetholone promotes weight gain
in patients with advanced human immunodeficiency virus (HIV-1) infection. Br J Nutr 75,
129-138
Himeda, C.L., Ranish, J.A., Angello, J.C. et al. (2004) Quantitative proteomic
identification of six4 as the trex-binding factor in the muscle creatine kinase enhancer. Mol.
Cell Biol. 24, 2132–2143
Hotamisligil. G.S. (2000) Molecular mechanisms of insulin resistance and the role of the
adipocyte. Int J Obesity 24, S23-S27
Jackman, R.W., Kandarian, S.C. (2004) The molecular basis of skeletal muscle atrophy.
Am J Physiol Cell Physiol 287, C834-C843
Jennische, E, Matejka, G.L. (1992) IGF-I binding and IGF-I expression in regenerating
muscle of normal and hypophysectomized rats. Acta Physiol Scand 146(1), 79 – 86
Jung, E., Heller, M., Sanchez, J.C. et al. (2000) Proteomics meets cell biology: The
establishment of subcellular proteomes. Electrophoresis 21(16), 3369–3377
Kami, K., Senba, E. (2005) Galectin-1 is a novel factor that regulates myotube growth in
regenerating skeletal muscles. Curr. Drug Targets 6(4), 395 – 405
Kardinal, C.G., Loprinzi, C.L., Schaid, D.J. et al. (1990) A controlled trial of
cyproheptadine in cancer patients with anorexia and/or cachexia. Cancer 65, 2657-2662
REFERENCES
87
Klein, S., Koretz, R.L. (1994) Nutrition support in patients with cancer: what do the data
really show? Nutr Clin Practice 9, 91-100
Koretz RL. (1984) Parenteral nutrition is it oncologically logical? J Clin Oncol 5, 534-538
Kosty, M.P., Fleishman, S.B., Herndon, J.E. et al. (1994) Cisplatin, vinblastine, and
hydrazine sulphate in advanced non-small-cell lung cancer; a randomized placebo-controlled
double-blind phase III study of the cancer and leukaemia group B. J Clin Oncol 12, 1113-
1120
Kung, T., Springer, J., Doehner, W. et al. (2010) Novel treatment approaches to cachexia
and sarcopenia: highlights from the 5th Cachexia Conference. Expert Opin Investig Drugs
19(4), 579–585
Latres, E., Amini, A.R., Amini, A.A., et al. (2005) Insulin-like growth factor-1 (IGF-1)
inversely regulates atrophy-induced genes via the phosphatidylinositol 3-
kinase/Akt/mammalian target of rapamycin (PI3K/Akt/mTOR) pathway. J. Biol. Chem
280(4), 2737 – 2744
Leinung, M.C., Liporace, R., Miller, C.H. (1995) Induction of adrenal suppression by
megestrol acetate in patients with AIDS. Ann Intern Med 122, 843-845
Lenk, K., Schuler, G., Adams, V. (2010) Skeletal muscle wasting in cachexia and
sarcopenia: molecular pathophysiology and impact of exercise training. J Cachexia
Sarcopenia Muscle 1, 9-21
REFERENCES
88
Leppanen, A., Stowell, S., Blixt, O. et al. (2005) Dimeric galectin-1 binds with high affinity
to alpha2,3-sialylated and non-sialylated terminal N-acetyllactosamine units on surface-bound
extended glycans. J Biol Chem 280, 5549-5562
Lissoni, P., Paolorossi, F., Tancini, G. et al. (1996) Is there a role for melatonin in the
treatment of neoplastic cachexia? Eur J Cancer 32A, 1340-1343
Liu, F.T, Rabinovich, G.A. (2005) Galectins as modulators of tumour progression. Nature
Reviews Cancer 5, 29-41
Loprinzi, C.L., Michalak, J.C., Schaid, D.J. et al. (1993) Phase III evaluation of four doses
of megestrol acetate as therapy for patients with cancer anorexia and/or cachexia. J Clin
Oncol 11, 762-767
Loprinzi, C.L., Goldberg, R.M., Su, J.Q. (1994) Placebo-controlled trial of hydrazine
sulphate in patients with newly diagnosed non-smallcell lung cancer. J Clin Oncol 12, 1126-
1129
Loprinzi, C.L., Kuross, S.A., O'Fallon, J.R. et al. (1994) Randomised placebo-controlled
evaluation on hydrazine sulphate in patients with advanced colorectal cancer. J Clin Oncol 12,
1121-1125
Loprinzi, C., Kugler, J., Sloan, J. et al. (1999) Randomised comparison of megestrol acetate
versus dexamethasone versus fluoxymesterone for the treatment of cancer cachexia. J Clin
Oncol 17, 3299-3306
REFERENCES
89
Lundholm, K., Gelin, J., Hyltander, A. et al. (1994) Anti-inflamatory treatment may
prolong survival in undernourished patients with metastatic solid tumours. Cancer Res 54,
5602-5606
Lynch, M.E. (1995) The assessment of and prevalence of affective disorders in advanced
cancer. J Palliat Care 11, 10-18
Ma, G., Alexandar, H.R. (1998) Prevalence and pathophysiology of cancer cachexia. In:
Bruera E, Portenoy RK, eds: Topics in palliative care, vol 2. New York: Oxford University
Press, 91-129
Maini, R.N., Taylor, P.C. (2000) Anti-cytokine therapy for rheumatoid arthritis. Ann Rev
Med. 51, 207-229
Mantovani, G., Maccio, A., Esue, S. et al. (1997) Medroxyprogesterone acetate reduces the
production of cytokines and serotonin involved in anorexia/cachexia and emesis by peripheral
blood mononuclear cells of cancer patients. Biochem Soc Trans 25, 296
Masoro, E.J. (2000) Caloric restriction and aging: an update. Exp Gerontol 35, 299-305
McDermott, M.F. (2001) TNF and TNFR biology in health and disease. Cell Mol BM 47,
619-625
REFERENCES
90
Meguid, M.M., Fetissov, S.O., Varma, M. et al. (2000) Hypothalamic dopamine and
serotonin in the regulation of food intake. Nutrition 16, 843-857
Mendoza TR, Wang XS, Cleeland CS, et al. (1999) The rapid assessment of fatigue severity
in cancer patients: use of the Brief Fatigue Inventory. Cancer 85, 1186-96
Moriggi, M., Cassano, P., Vasso, M. et al. (2008) A DIGE approach for the assessment of
rat soleus muscle changes during unloading: effect of acetyl-L-carnitine supplementation.
Proteomics 8(17), 3588-3604
Moser, A.R., Pitot, H.C., Dove, W.F. (1990) A dominant mutation that predisposes to
multiple intestinal neoplasia in the mouse. Science 247(4940), 322-324
Muscaritoli, M., Bossola, M., Aversa, Z., et al. (2006) Prevention and treatment of cancer
cachexia: new insights into an old problem. Eur. J. Cancer 42(1), 31-41
Neuenschwander, H., Bruera, E. (1998) Asthenia. In: Doyle D, Hanks GWC, MacDonald
N, eds. Oxford textbook of palliative care, 2nd ed. Oxford: Oxford University Press, 573-581
Neuenschwander, H., Bruera, E. (1998) Pathophysiology of cancer asthenia. In: Bruera E,
Portenoy R, eds. Topics in palliative care. Oxford: Oxford University Press, 171-183
Nowak, T.P., Haywood, P.L., Barondes, S.H. (1976). Developmentally regulated lectin in
embryonic chick muscle and a myogenic cell line. Biochem Biophys Res Commun 68(3), 650-
657
REFERENCES
91
Ohlendieck K. (2011) Skeletal muscle proteomics: current approaches, technical challenges
and emerging techniques. Skeletal Muscle 1(1), 6
Ornstein, D.K., Gillespie, J.W., Paweletz, C.P. et al. (2000) Proteomic analysis of laser
capture microdissected human prostate cancer and in vitro prostate cell lines. Electrophoresis
21(11), 2235–2242
Pawlicki, M., Jassem, J., Bosze, P. et al. (1997) A multicenter study of recombinant human
erythropoietin (epoietin alpha) in the management of anaemia in cancer patients receiving
chemotherapy. Anti-Cancer Drugs 8, 949-957
Pecorelli, S. (2000) Suboptimal hemoglobin levels: do they impact patients and their therapy?
Semin Oncol 27, 1-3
Pereira, J., Bruera, E. (1996) Chronic nausea. In: Bruera E, Higginson I, eds. Cachexia-
anorexia in cancer patients. Oxford: Oxford University Press, 23-27
Piec, I., Listrat, A., Alliot, J. et al. (2005) Differential proteome analysis of aging in rat
skeletal muscle. FASEB J 19(9), 1143-1145
Plata-Salaman, C.R. (1996) Anorexia during acute and chronic disease. Nutr Int J Appl
Basic Nutr Sci 12, 69-78
REFERENCES
92
Plum, F. (1995) Asthenia, weakness and fatigue. In: Wyngaarden J, Smith L, eds. Cecil
textbook of medicine. Philadelphia: Saunders, 2044-2052
Poehlman, E.T., Turturro, A., Bodkin, N. et al. (2001) Caloric restriction mimetics:
physical activity and body composition changes. J Gerontol BM Sci Med Sci 56A(Special
Issue I), 45-54
Rabilloud, T. (2002) Two-dimensional gel electrophoresis in proteomics: Old, old fashioned,
but it still climbs up the mountains. Proteomics 2, 3–10
Rabilloud, T, Chevallet M. (2000) Solubilization of proteins in 2D electrophoresis. In:
Proteome Research: Two-Dimensional Gel Techniques and Identification Methods. (T.
Rabilloud, Ed.) Springer pp. 9-29
Rabilloud, T., Charmont, S. (2000) Detection of proteins on two-dimensional gels. In:
Proteome Research: Two-dimensional Gel Electrophoresis and Identification Methods (T.
Rabilloud, Ed.) Springer pp. 107-126
Rabinovich, G.A. (2005) Galectin-1 as a potential cancer target. Br. J. Cancer 92(7), 1188 –
1192
Rabinovich, G.A., Rubinstein, N., Fainboim, L.J. (2002) Unlocking the secrets of
galectins: a challenge at the frontier of glyco-immunology. Leukoc. Biol 71(5), 741 – 752
Rabinovich, G.A., Sotomayor, C.E., Riera, C.M., et al. (2000) Evidence of a role for
galectin-1 in acute inflammation. Eur. J. Immunol 30(5), 1331 – 1339
REFERENCES
93
Ramamoorthy, S., Donohue, M., Buck, M. (2009) Decreased Jun-D and myogenin
expression in muscle wasting of human cachexia. Am. J. Physiol Endocrinol. Metab. 297(2),
E392-401
Ramsey, J.J., Harper, M.E., Weindruch, R. (2000) Restriction of energy intake, energy
expenditure, and aging. Free Radie Biol Med 10, 946-968
Roth, G.S., Ingram, D.K., Lane, M.A. (2001) Caloric restriction in primates and relevance
to humans. Ann N Y Acad Sci 928, 305-315
Rowe, P., Bou-Holaigah, I., Kan, J. et al. (1995) Is neurally mediated hypotension an
unrecognised cause of chronic fatigue? Lancet 345, 623-624
Rowland, K.M., Loprinzi, C.L., Shw, E.G. et al. (1996) Randomised doubleblind placebo-
controlled trial of cisplatin and etoposide plus megestrol acette/placebo in extensive stage
small cell lung cancer: a North America Cancer Treatment Group study. J Clin Oncol 14,
135-141
Ryan, A.M., Reynolds, J.V., Healy, L. et al. (2009) Enteral nutrition enriched with
eicosapentaenoic acid (EPA) preserves lean body mass following esophageal cancer surgery:
results of a double-blinded randomized controlled trial. Ann. Surg 249(3), 355–363
Sakuma, K., Yamaguchi, A. J. (2010) The functional role of calcineurin in hypertrophy,
regeneration, and disorders of skeletal muscle. Biomed. Biotechnol 2010, 721219
REFERENCES
94
Salatino, M., Croci, D.O., Bianco, G.A. et al. (2008) Galectin-1 as a potential therapeutic
target in autoimmune disorders and cancer. Expert Opin Biol Ther 8(1), 45-57
Sarto, C., Valsecchi, C., Mocarelli, P. (2002) Renal cell carcinoma: Handling and treatment.
Proteomics 2, 1627–1629
Schambelan, M., Mulligan, K., Grunfeld, C. et al. (1996) Recombinant human growth
hormone in patients with HIV-associated wasting: a randomised, placebo-controlled trial. Ann
Intern Med 125, 873-882
Schiaffino, S., Reggiani, C. (1996) Molecular diversity of myofibrillar proteins: gene
regulation and functional significance. Physiol. Rev 76(2), 371-423
Sharples, A.P., Stewart, C.E. (2011) Myoblasts models of skeletal muscle hypertrophy and
atrophy. Curr Opin Clin Nutr Metab Care 14, 230-236
Shevchenko, A., Jensen O.N., Podtelejnikov A.V., et al. (1996) Linking genome and
proteome by mass spectrometry: large-scale identification of yeast proteins from two
dimensional gels, Proc. Natl. Acad. Sci. USA 93(25), 14440-14445
Shoji, H., Deltour, L., Nakamura, T., et al. (2009) Expression pattern and role of Galectin1
during early mouse myogenesis. Dev Growth Differ 51(7), 607-615
Simons, J.P., Aaronson, N.K., Vansteenkiste, J.F. et al. (1996) Effects of
medroxyprogesterone acetate on appetite, weight, and quality of life in advanced-stage non-
REFERENCES
95
hormone-sensitive cancer: a placebo-controlled multicenter study. J Clin Oncol 14, 1077-
1084
Skipworth, R.J., Stewart, G.D., Bhana, M. et al. (2010) Mass spectrometric detection of
candidate protein biomarkers of cancer cachexia in human urine. Int J Oncol 36(4), 973-982
Song, X., Xia, B., Stowell, S.R. et al. (2009) Novel fluorescent glycan microarray strategy
reveals ligands for galectins, Chem Biol 16, 36-47
Steiner, M.S., Barnette, K.G., Hancock, M.L. et al. (2010) Effect of GTx-024, a selective
androgen receptor modulator (SARM), on stair climb performance and quality of life (QOL)
in patients with cancer cachexia. 2010 ASCO Annual Meeting, 144-149
Stephens, N.A., Gallagher, I.J., Rooyackers, O., et al. (2010) Using transcriptomics to
identify and validate novel biomarkers of human skeletal muscle cancer cachexia. Genome
Med 2(1), 1-12
Straub, R.H., Cutolo, M., Zietz, B. et al. (2001) The process of aging changes the interplay
of the immune, endocrine and nervous systems. Mech Ageing Dev 12, 1591-1611
Studier, F.W. (2005) Protein production by auto-induction in high-density shaking cultures.
Protein Exp. Purif 41(1), 207-234
Svensson, A., Tågerud, S. (2009) Galectin-1 expression in innervated and denervated
skeletal muscle. Cell Mol Biol Lett 14(1), 128-138
REFERENCES
96
Tambor, V., Fucíková, A., Lenco, J. et al. (2010) Application of proteomics in biomarker
discovery: a primer for the clinician. Physiol Res 59(4), 471-497
Tisdale, M.J. (2009) Mechanisms of cancer cachexia. Physiol. Rev 89, 381- 410
Tisdale, M.J. (1998) New cachexia factors. Curr Opin Clin Nutr Metab Care 1, 253-56
Todorov, P.T., Cariuk, P., McDevitt, T., et al. (1996) Characterization of a cancer cachectic
factor. Nature 379, 739–742
Tyers, M., Mann, M. (2003) From genomics to proteomics. Nature 422, 193-197
von Haehling, S., Anker, S.D. (2010) Cachexia as a major underestimated and unmet
medical need: facts and numbers. J Cachexia Sarcopenia Muscle 1(1), 1-5
Walther, T.C, Mann, M. (2010) Mass spectrometry-based proteomics in cell biology. J Cell
Biol 190(4), 491-500
Warmolts, J.R., Re, P.K., Lewis, R.J. et al. (1975) Type II muscle fibre atrophy (II-
atrophy): an early systemic effect of cancer. Neurology 2, 374-379
Watt, D.J., Jones, G.E., Goldring, K. (2004) The involvement of galectin-1 in skeletal
muscle determination, differentiation and regeneration. Glycoconj. J 19(7-9), 615-619
REFERENCES
97
Weindruch, R., Keenan, K.P., Carney, J.M. et al. (2001) Caloric restriction mimetics:
metabolic interventions. J Gerontol Biol Sci Med Sci 56A(Special Issue I), 20-33
Whinningham, M.L., Nail, L.M., Burke, M. et al. (1994) Fatigue and the cancer
experience: the state of the knowledge. Oncol Nurs Forum 21, 23-36
Wigmore, S.J., Ross, J.A., Falconer, J.S. et al. (1996) The effects of polyunsaturated fatty
acids on the progress of cachexia in patients with pancreatic cancer, Nutrition 12, S27-30
Willett, M.W., Cowan, J.L., Vlasak, M., et al. (2009) Inhibition of mammalian target of
rapamycin (mTOR) signalling in C2C12 myoblasts prevents myogenic differentiation without
affecting the hyperphosphorylation of 4E-BP1. Cell. Signal 21(10), 1504-1512
Williams, M.L., Torres-Duarte, A., Brant, L.J., et al. (2004) The relationship between a
urinary cachectic factor and weight loss in advanced cancer patients. Cancer Invest 22, 866–
870
Workeneh, B.T., Rondon-Berrios, H., Zhang, L., et al. (2006) Development of a diagnostic
method for detecting increased muscle protein degradation in patients with catabolic
conditions. J. Am. Soc. Nephrol 17 (11), 3233-3239
Xiao, G.G., Recker, R.R., Deng, H-W. (2008) Recent advances in proteomics and cancer
biomarker discovery. Clin Med Oncol 2, 63-72

REFERENCES
98
Zhou, X, Wang, J.L., Lu, J., et al. (2011) Reversal of cancer cachexia and muscle wasting
by ActRIIB antagonism leads to prolonged survival. Cell 142, 531-543
CURIICULUM VITAE
99
CURRICULUM VITAE
Persönliche Daten:
Duarte das Neves Afonso
Helmut-Käutner-Str. 25, 81739 München
Tel: 0151 54697781
Geburtsdatum und –ort: 06.02.1981 in Mönchengladbach
Staatsangehörigkeit: Portugiesisch
Ausbildung:
2009-2012 Promotion an der Technischen Universität München,
Lehrstuhl für Molekulare Ernährungsmedizin
2006-2008 Masterstudium Entwicklungsbiologie,
Universidade Lusófona de Humanidades e Tecnologias, Lissabon, Portugal
2002-2006 Licenciatura (Hochschulabschluss) Biochemie,
Universidade de Lisboa, Lissabon, Portugal
ACKNOWLEDGEMENTS
100
ACKNOWLEDGEMENTS
I would like to thank Prof. Dr. Matthias Ebert for entrusting me with the interesting topic of
my doctoral thesis and for giving me all the opportunities to develop my own ideas. I am
grateful for all your time, availability, help and constructive criticism. I am happy that I had
the chance to work with you and to be a member of your working group.
I also would like to thank Prof. Dr. Roland Schmid, head of the 2nd
medical clinic, for giving
me the opportunity to work at his department.
Special thanks to the group’s actual and former members: Dr. E. Burgermeister, Dr. I. Regel,
Dr. M. Tänzer, Dr. F. Lian, Dr. G. Yuan, Dr. A. Kretzschmar, B. Balluff, E. Prade, S.
Hausmann, M. Tobiasch, I. Hitkova, T. Friedrich, I. Schäffer, M. Hiber, S. Niessen, L. Merkl.
Thanks for all the help and fun time we had in and out of work. I also thank the colleagues
from the other research groups of the department.
Also special thanks to Prof. Dr. Martin Klingenspor, for accepting me as his student and for
all his help and time spent with me.
I thank my collaborators throughout this study: Dr. A. Geerlof, Dr. H. Sarioglu, Dr. J.
Bachmann, Dr. M. Martignogni.
I am thankful to the Fundação para a Ciência e a Tecnologia (FCT) from Portugal for
supporting me financially with the grant SFRH/ BD/ 43918/ 2008 from the program
POPH-QREN.
Many thanks to my family for their loving support while being abroad, and to Sabine and her
family always present when I needed.