Data Documentation - DIW · 2020-03-02 · Deutsches Institut für Wirtschaftsforschung Peter...
52
Deutsches Institut für Wirtschaftsforschung Peter Hintze • Tobia Lakes Geographically Referenced Data in Social Science A Service Paper for SOEP Data Users 46 Data Documentation Berlin, September 2009
Transcript of Data Documentation - DIW · 2020-03-02 · Deutsches Institut für Wirtschaftsforschung Peter...
Deutsches Institut für Wirtschaftsforschung
www.diw.de
Peter Hintze • Tobia Lakes
Geographically Referenced Data in Social ScienceA Service Paper for SOEP Data Users
46
Data Documentation
Berlin, September 2009
IMPRESSUM
© DIW Berlin, 2009
DIW Berlin Deutsches Institut für Wirtschaftsforschung Mohrenstr. 58 10117 Berlin Tel. +49 (30) 897 89-0 Fax +49 (30) 897 89-200 www.diw.de ISSN 1861-1532
All rights reserved. Reproduction and distribution in any form, also in parts, requires the express written permission of DIW Berlin.
Geographically Referenced Data in Social Science
A service paper for SOEP data users
Peter Hinze and Tobia Lakes
Data Documentation
German Socio-Economic Panel Study (SOEP)
Corrected Version
DIW Berlin
German Institute for Economic Research
Peter Hintze, [email protected], +491636864771
Tobia Lakes, Geomatics Lab, Geography Department, Humboldt-Universität zu Berlin, [email protected]

Table of Contents
1 Introduction ............................................................................................. 1
1.1 The Socio-Economic Panel from a spatial perspective ................. 1
1.2 What is Geographically Referenced Data? ....................................... 2
1.3 What is a Geographic Information System? .................................... 4
1.3.1 Types of GIS software systems ................................................................................... 4
1.3.2 Performing basic tasks with GIS ................................................................................ 6
2 Geodata and its use in the social sciences ....................................... 8
2.1 Target user group ..................................................................................... 8
2.2 Geodata focus ........................................................................................... 8
2.3 Benefits and challenges of using Geodata ......................................... 9
3 Combining Geodata and SOEP data ................................................ 10
3.1 The potential of spatial analysis of SOEP data ............................. 10
3.1.1 Georeferencing SOEP data ....................................................................................... 10
3.1.2 Producing spatial indicators ..................................................................................... 11
3.2 Processing Geodata and typical GIS tasks of interest for SOEP data users .................................................................................................. 12
3.2.1 Obtaining Geodata from the Internet ....................................................................... 12
3.2.2 Manage and explore Geodata ................................................................................... 13
3.2.3 Visualizing information on a map ............................................................................ 14
3.2.4 Georeferencing Postal Addresses - Geocoding ......................................................... 15
3.2.5 Proximity and Overlay analysis - Catchment area of schools .................................. 16
3.2.6 Overlay analysis – Percentage of green space in residential areas .......................... 17
3.2.7 Geodata and the link with SOEP data ...................................................................... 18
3.3 Socio-economic studies using Geodata ........................................... 19
3.3.1 Accessibility of University locations ........................................................................ 19
3.3.2 Valuing air quality using the life satisfaction approach ........................................... 19
3.3.3 Distance from urban agglomeration economies and rural poverty ........................ 20
3.4 Conclusions .............................................................................................. 21
4 Survey of Geodata for Germany ....................................................... 22
4.1 The ATKIS ................................................................................................ 23
4.1.1 Digital Landscape Models (DLM) ............................................................................ 24
4.1.2 Digital Terrain Models (DGM) ................................................................................. 26
4.1.3 Digital Topographic Maps (DTK) ............................................................................. 26
4.1.4 Digital Orthophotos (DOP) ...................................................................................... 27
4.2 The ALKIS ................................................................................................ 28
4.2.1 Digital Real Estate Cadastre Map (ALK) ................................................................. 28
4.2.2 Digital Real Estate Cadastre Book (ALB) ................................................................. 29
4.3 Specialized Geodata .............................................................................. 30
4.3.1 Geographic Names ................................................................................................... 30
4.3.2 Administrative Boundaries ....................................................................................... 31
4.3.3 Digital Street Map ................................................................................................... 32
4.3.4 Publicly Registered Land Value ............................................................................... 32
4.3.5 Postal Codes ............................................................................................................. 33
4.4 Selected Federal State Survey Offices .............................................. 33
4.4.1 Baden-Württemberg ................................................................................................ 34
4.4.2 Bavaria .................................................................................................................... 34
4.4.3 Berlin ...................................................................................................................... 34
4.4.4 Hamburg ................................................................................................................... 35
4.4.5 North Rhine Westphalia ........................................................................................... 35
5 Appendix ................................................................................................ 38
5.1 SOEP at DIW Berlin .............................................................................. 38
5.2 Original dataset names and translation .......................................... 38
5.3 Selected GIS and analysis software .................................................. 39
5.4 Further information and resources .................................................. 41
5.4.1 Research centres - Geodata and social science ........................................................ 41
5.4.2 Data resources ......................................................................................................... 42
5.4.3 Other resources ........................................................................................................ 45
Introduction
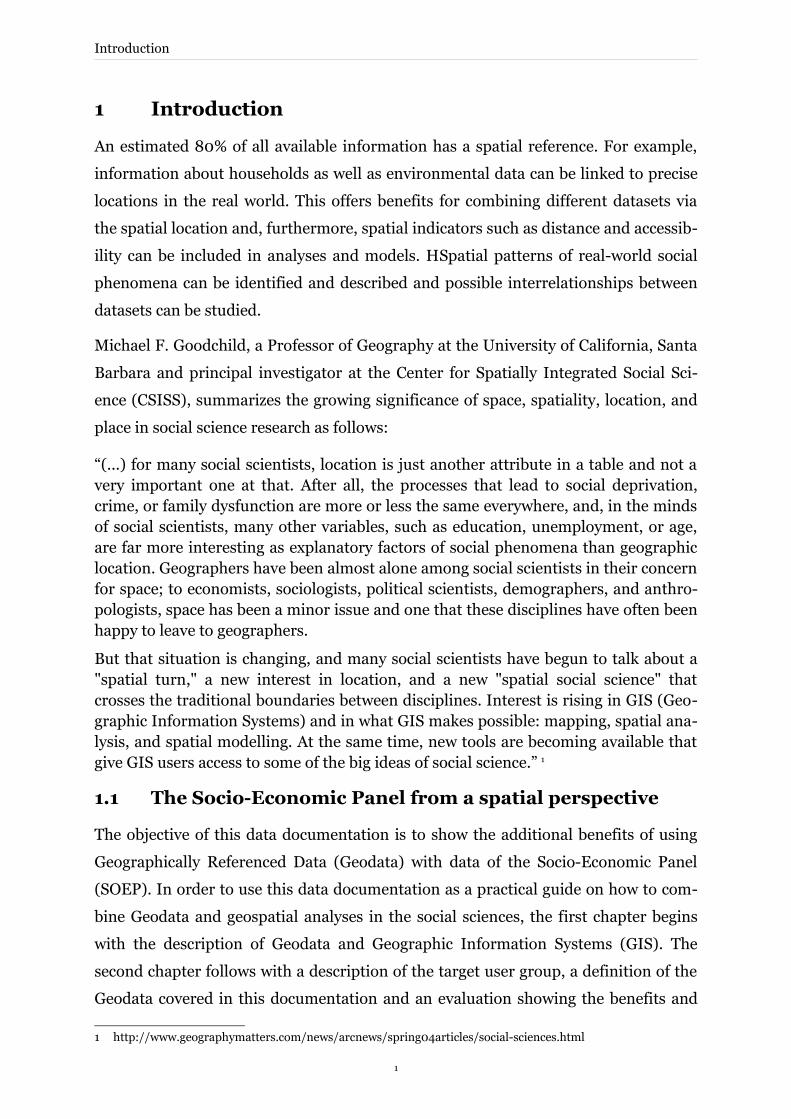
1 Introduction
An estimated 80% of all available information has a spatial reference. For example,
information about households as well as environmental data can be linked to precise
locations in the real world. This offers benefits for combining different datasets via
the spatial location and, furthermore, spatial indicators such as distance and accessib-
ility can be included in analyses and models. HSpatial patterns of real-world social
phenomena can be identified and described and possible interrelationships between
datasets can be studied.
Michael F. Goodchild, a Professor of Geography at the University of California, Santa
Barbara and principal investigator at the Center for Spatially Integrated Social Sci-
ence (CSISS), summarizes the growing significance of space, spatiality, location, and
place in social science research as follows:
“(...) for many social scientists, location is just another attribute in a table and not a very important one at that. After all, the processes that lead to social deprivation, crime, or family dysfunction are more or less the same everywhere, and, in the minds of social scientists, many other variables, such as education, unemployment, or age, are far more interesting as explanatory factors of social phenomena than geographic location. Geographers have been almost alone among social scientists in their concern for space; to economists, sociologists, political scientists, demographers, and anthro-pologists, space has been a minor issue and one that these disciplines have often been happy to leave to geographers.
But that situation is changing, and many social scientists have begun to talk about a "spatial turn," a new interest in location, and a new "spatial social science" that crosses the traditional boundaries between disciplines. Interest is rising in GIS (Geo-graphic Information Systems) and in what GIS makes possible: mapping, spatial ana-lysis, and spatial modelling. At the same time, new tools are becoming available that give GIS users access to some of the big ideas of social science.” 1
1.1 The Socio-Economic Panel from a spatial perspective
The objective of this data documentation is to show the additional benefits of using
Geographically Referenced Data (Geodata) with data of the Socio-Economic Panel
(SOEP). In order to use this data documentation as a practical guide on how to com-
bine Geodata and geospatial analyses in the social sciences, the first chapter begins
with the description of Geodata and Geographic Information Systems (GIS). The
second chapter follows with a description of the target user group, a definition of the
Geodata covered in this documentation and an evaluation showing the benefits and
1 http://www.geographymatters.com/news/arcnews/spring04articles/social-sciences.html
1
Introduction
challenges of using Geodata in the social sciences. Chapter 3 shows the potential of
using Geodata as an additional information source for studies in the social sciences.
This includes the description of tasks carried out with GIS and valuable examples on
how Geodata is used in social research. Finally, an overview of available Geodata in
Germany is given with a focus on the most frequent data demands in the social sci-
ences. Additionally, Internet links for data resources, available GIS software and fur-
ther information are listed in the appendix.
In this documentation, the following questions will be addressed:
• What are Geographically Referenced Data (Geodata) and GIS?
• What is the potential of combining Geodata with SOEP data?
• What are the benefits and challenges for the target user group?
• How can Geodata and GIS operations be applied in research practice?
• Which studies already combine SOEP data with spatial data?
• What are the characteristics of Geodata in Germany; where and under which con-ditions are they available?
1.2 What is Geographically Referenced Data?
Geographic location is the element that distinguishes geographic information from all
other types. Geodata describe both the location and the characteristics of spatial fea-
tures such as households, roads, land parcels and water bodies. Geodata represent
real-world objects (also called features) in a digital data format. A geographically ref-
erenced object has two main components: spatial data representing its location, and
attribute data representing its characteristics. While attribute data of objects, such as
the number of people living in a household or the status of employment, are fre-
quently used in socio-economic analyses, the information about the location of an ob-
ject and the existing interrelationships between datasets is rarely exploited.
To define an object's position on the earth, a spatial reference known as a georefer-
ence is used. In the case of a direct spatial reference, the information about the loca-
tion is defined by two- or three-dimensional coordinates in a coordinate reference
system. The most commonly used systems in Germany are the Gauss-Krüger and
WGS84 coordinate systems.
In case of an indirect spatial reference, systems closer to everyday human experience
are used to georeference the locations of real-world objects, such as administrative
areas, postal addresses, postal codes and place names.
2
Introduction
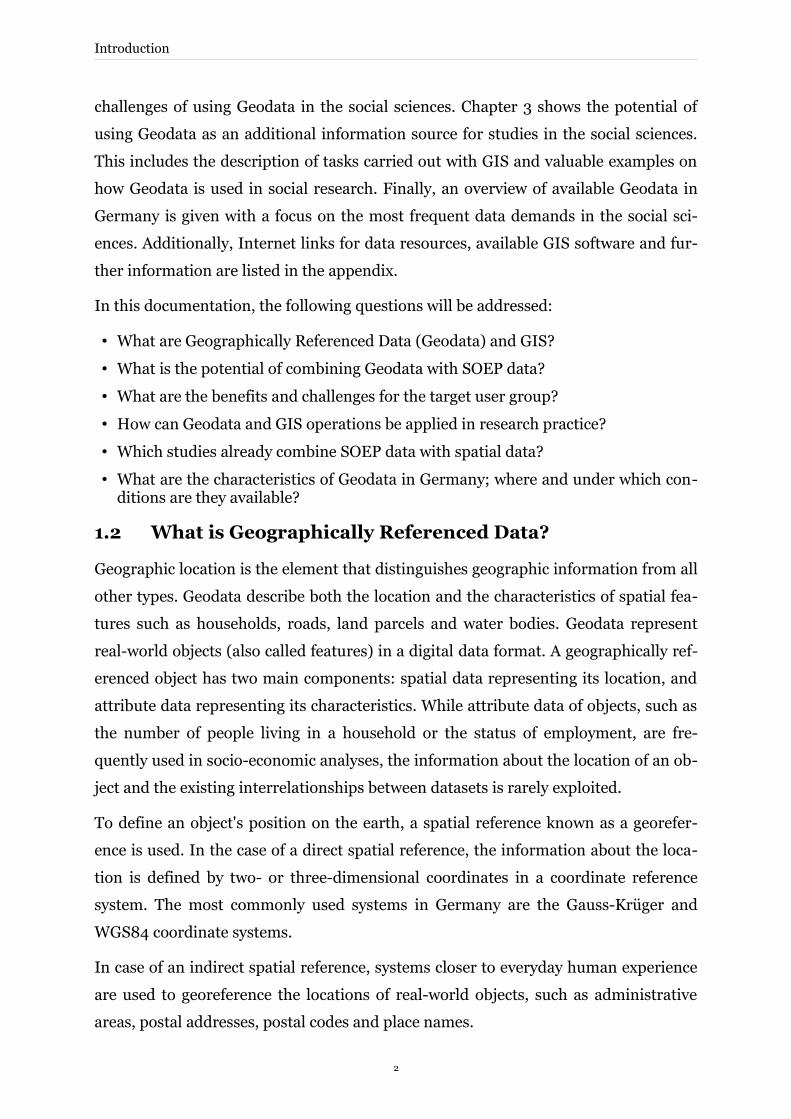
Real-world objects are very complex. In order to store them digitally, they must be
simplified and —in most cases— they are modelled on the basis of two main ap-
proaches: discrete objects and continuous fields. Discrete objects are individually dis-
tinguishable features and include points (e.g., trees, cities), lines (e.g., roads, rivers)
and areas/polygons (e.g., city parcels, administrative boundaries). Continuous fea-
tures are, for example, elevation, precipitation or air quality. These two approaches
follow the two most frequent ways of data abstraction: the vector model (discrete)
and the raster model (continuous) with their respective digital storage type and visual
representation (see fig. 1).
Geometric Element
Vector Raster
Digital Storage Representation Digital Storage Representation
Point x, y coordinates(e.g. 3,4)
Pixel
Line series of x, y co-ordinates
(e.g. 3,4; 4,5)
Pixel
Polygon a closed series of x, y coordinates
(e.g. 3,4; 4,4; 4,7; 3,7; 2,6)
Pixel
Figure 1: Table of geometric elements in the Vector- and Raster model, the storage type and representations
Vector data are often derived from digitized analogue maps or from the input of GPS
(Global Positioning System)-based coordinates. In the vector model every object is
composed out of a series of x,y coordinate pairs and is generally stored in tables with
an unique identification number (ID) for each object, spatial properties (e.g., coordin-
ates, altitude) and further optional attributes.
The raster data model, on the other hand, consists of cells within a rectangular grid.
Each cell carries a value and can be used to represent real-world phenomena such as
land use. Raster data are often derived from scanned maps or from remote sensing
data such as satellite images. The spatial reference of a raster image is accomplished
by relating the pixels in the grid to an absolute coordinate system and thus georefer-
3
Introduction
encing the entire image. The spatial accuracy, i.e., the spatial resolution, depends on
the pixel size and hence on what area of the real world is covered by each pixel.
In order to exploit the available Geodata specialized applications, Geographic Inform-
ation Systems can be applied.
1.3 What is a Geographic Information System?
A Geographic Information System (GIS) is a computer system for capturing, man-
aging, analysing, and displaying Geodata. GIS includes hardware, software, networks,
standards and protocols for data handling and analysis (LONGLEY et. al. 2005).
The benefits of GIS and similar information systems have been proven in various ap-
plications and research projects to analyse, relate and visualize spatial data . Since the
1980s, the use of GIS has been rapidly growing in fields like natural resource manage-
ment, land-use planning and natural hazard assessment (BILL 1999). In recent years,
GIS is increasingly being used in a wider spectrum of fields, such as market analysis,
social science research, crime analysis, and transportation. The evolving interest in
GIS is linked to a growing amount of available Geodata and is further supported by
improved user-friendly software, widely distributed GPS-based systems (e.g., loca-
tion-based services, navigation systems) and new Internet technologies (e.g., web-
mapping and online data distribution).
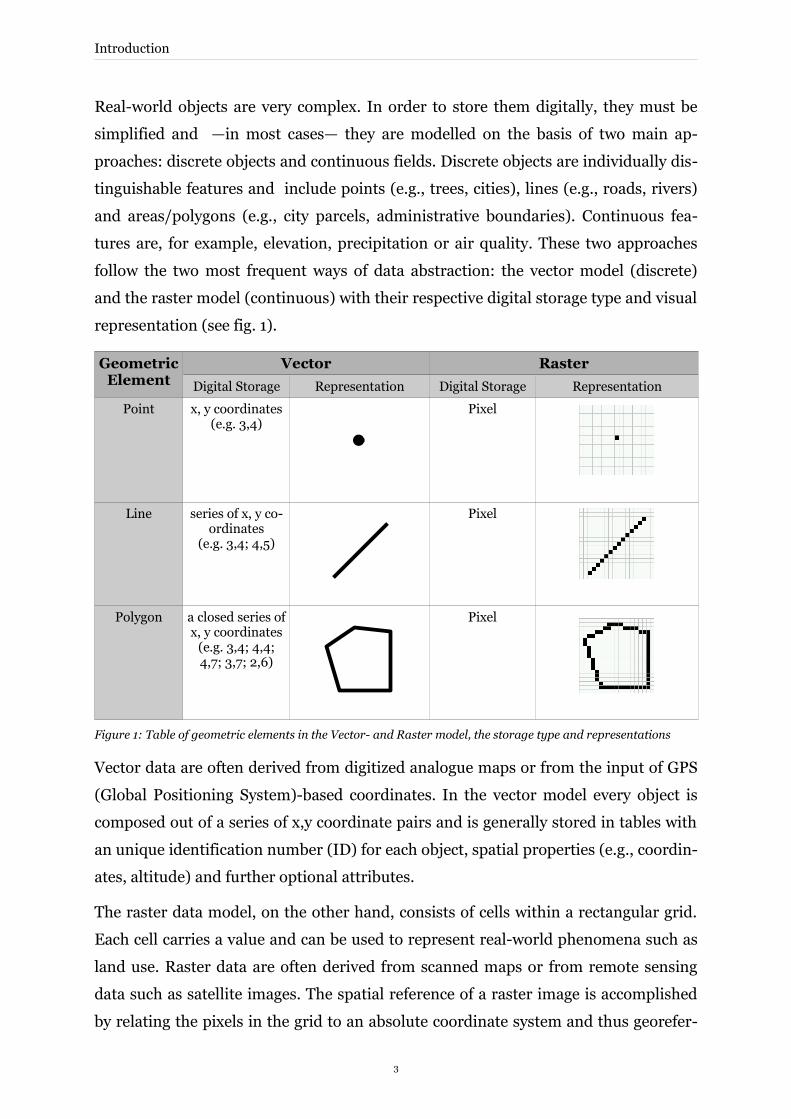
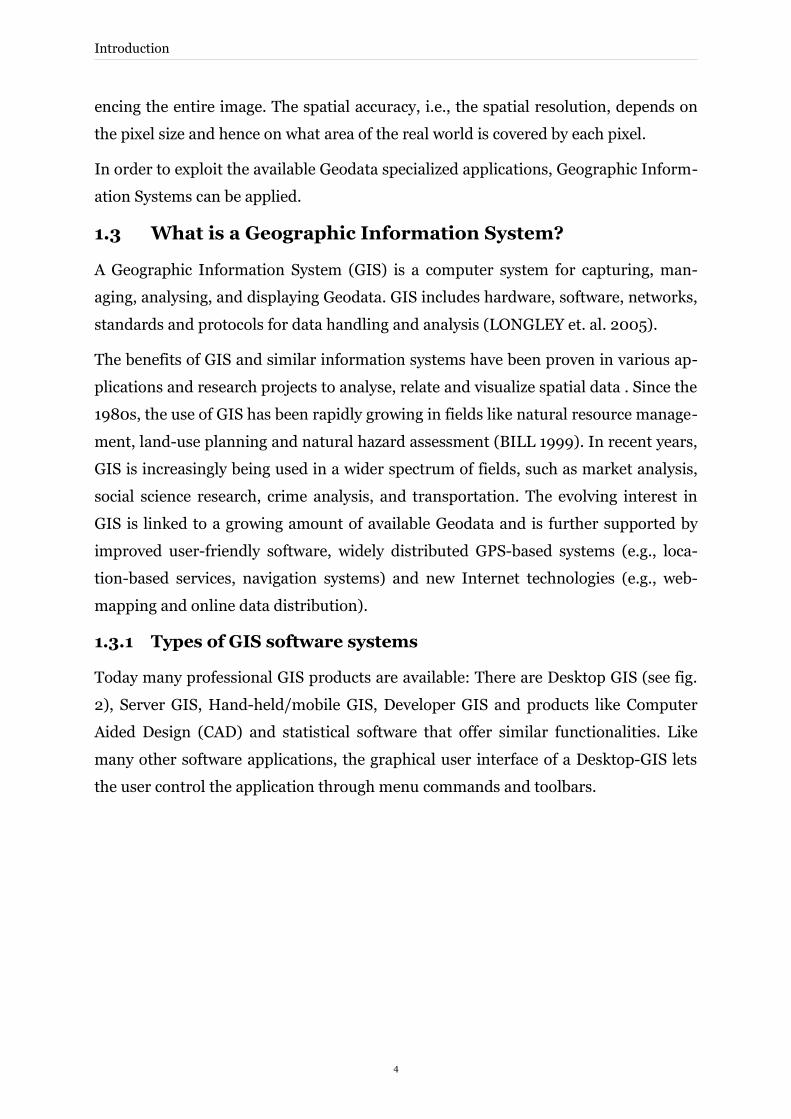
1.3.1 Types of GIS software systems
Today many professional GIS products are available: There are Desktop GIS (see fig.
2), Server GIS, Hand-held/mobile GIS, Developer GIS and products like Computer
Aided Design (CAD) and statistical software that offer similar functionalities. Like
many other software applications, the graphical user interface of a Desktop-GIS lets
the user control the application through menu commands and toolbars.
4
Introduction
One example of a widespread sophisticated commercial GIS software product is Arc-
GIS by the company ESRI2. Vector data is commonly stored in the ESRI shapefile
format with the file extension .shp. It is a quasi-standard and many data products are
distributed in this format. Besides such a file-based storage method, Geodata are of-
ten stored in databases that support spatial extensions, such as Oracle Spatial3. Its
spatial database management systems allows GIS-functions to directly access and
modify the database, enabling the user to manage and manipulate Geodata with all its
spatial characteristics. Besides the more sophisticated storage systems, Geodata can
also be stored in a simple relational database such as an MS Excel Table, MS Access
Database or dBase as well as in simple text or .csv files. As in most cases, the lower
the file format level the better the compatibility for applications such as SPSS, Stata
and SAS. Nevertheless, an increasing number of software applications support spatial
data formats and are thus “spatially enabled”. This development supports scientific
research in other fields by making work with Geodata less system-dependent and also
by allowing the results to be visualized and distributed via Internet software like
Google Earth 4.
The following table shows a selection of frequently used data formats.
2 ESRI: http://www.esri.com3 Oracle: http://www.oracle.com4 Google Earth: http://earth.google.com/
5
Figure 2: Graphical user interface of a typical Desktop GIS
Introduction
Vector formats Raster formats Other formats Database
SHP (SHAPE)DXFKML/KMZE00
BMPTIFF (GEOTIFF)PNGAGFJPG
ASCIIXLS (EXCEL)PDFCSVTXT
ESRI Geodatabase Oracle SpatialMS AccessPostGISEDBS
Open Source GIS and databases increasingly provide an interesting alternative to pro-
prietary software. They often offer sufficient functionalities to accomplish basic tasks
such as converting data, as well as more complex operations5. A noteworthy example
is PostGIS or GeoDA from the SCISS project6. The later one is specialized in the spa-
tial analysis of socio-economic data combining statistical analysis with spatial analys-
is and visualization. For further information on available GIS software please refer to
the list in the appendix.
1.3.2 Performing basic tasks with GIS
Regardless of the application, all GIS provide a range of operations to carry out tasks
like data capturing and management, data analysis, data export, and presentation7.
Data collection and Data management
Data capturing and management is accomplished by tools for digitizing maps, data
import, geodatabase development, and geographic data modelling.
Data analysis
Data analysis is carried out by geoprocessing tools that include overlay analysis, prox-
imity analysis, table management, selection and extraction of features, topology ana-
lysis, and geostatistical analyses.
An overlay analysis addresses the question “What is on top of what?”. Depending on
the research objectives, two or more datasets in the form of data layers are related in
the GIS. In most cases an overlay of two datasets simply creates a new output dataset
under different specified conditions, for example “Which household lies in which
county?” or “Which postal zones have the most households with the highest
income?”.
A proximity analysis addresses the question “What is the distance between
locations?”. Distances between cities, find the catchment area of a school, or calculate
traffic emissions around streets and highways. Questions could be “How far is the res-
5 MapWindow: http://www.mapwindow.com6 GeoDA and CSISS: www.csiss.org/clearinghouse/geoda7 ESRI Developer Network and Help Documentation: http://edn.esri.com/ and http://webhelp.esri.com/
6
Introduction
idence from the next hospital, park, etc.?” or “Which school is closest to a residence?”.
Table management involves functionalities such as adding or deleting fields, creating
relationships between tables, or creating features from tables that contain coordin-
ates. Table management also includes joining tables and converting spatial objects
from coordinates or coordinates to spatial objects. The process of geocoding, for ex-
ample, includes the conversion of street addresses (house numbers) to coordinates.
With reverse geocoding, coordinates are, for example, compared to house coordinates
and then converted into house numbers.
The extraction of Geodata includes a set of tasks to reduce or extract data from larger,
more complex datasets. One can modify data by clipping, splitting, or unifying it. It is
also possible to interpolate and aggregate data by user defined specifications8.
Besides the knowledge about the exact location or distances, these methods enable to
gather topological information that refers to the spatial relations between features,
such as “next to” or “lies within”. These spatially relative queries include, for example,
neighbourhood analysis (which area borders on which), routing in a network (find
shortest way between locations) and calculations such as whether an object is inside
or outside a specific area.
Data export/ Data presentation
Analysis results can be displayed and exported in various ways. While maps are the
standard for geographic data, other visualisations and export forms are possible such
as histograms, scatter plots, 3d-views, tables, and diagrams. Finally these results can
be displayed on screen, converted, or printed. Additionally, the data can either be dis-
tributed via file libraries on CD-ROM or accessed interactively via web-mapping on
the Internet.
8 For further information on geoprocessing and geoanalysis please refer to examples in chapter 3 and the appendix.
7
Geodata and its use in the social sciences
2 Geodata and its use in the social sciences
2.1 Target user group
To what extent Geodata can be utilized in social sciences varies according to the spe-
cific research objectives. However, it is also very much the required data and software
knowledge of the user that frames the possible applications combining Geodata with
SOEP data. The target user group considered in this data documentation are social
scientists who want or need to spatially analyse the SOEP data. No matter the extent
to which Geodata will be integrated into the particular research project, it can be
valuable at all levels.
An introductory level of Geodata integration involves relating Geodata to SOEP data
while mainly using advanced statistical software such as Stata, SPSS, or SAS for the
research process. Here, the user regards Geodata only as an additional information
source to the already existing main dataset, the SOEP data, while maintaining the
current workflow within the research process. A more advanced usage includes em-
ploying GIS in order to conduct spatial analyses combining SOEP data with Geodata.
Here, Geodata may be one of the basic data sources for the research. In order to an-
swer SOEP research questions, a primary task at both levels is to produce spatial in-
dicators (e.g., regional variation of income) to provide additional spatial information
for the household dataset9.
Although an increasing number of research projects show a high level of spatial data
integration in the social sciences (e.g., CSISS, SEDAC), up to now analysis of SOEP
data shows a relatively low level of Geodata integration and is in most cases accom-
plished with statistical software such as SPSS, SAS, or Stata. The combined use of
Geodata and SOEP data may increase in the future depending on the information de-
mands of the SOEP-research projects and the access to adequate Geodata.
2.2 Geodata focus
Geodata can be used to address a number of scientific problems when working with
SOEP data. Hence, the identification of the data for a specific problem represents one
of the most challenging tasks. In Germany, a large variety of different types of
Geodata is available. In order to narrow down appropriate and standardized datasets
from reliable official sources, this documentation focuses on Geodata,
9 See chapter 3.1.2 for examples of possible spatial indicators.
8
Geodata and its use in the social sciences
• which is suitable for research in the social sciences,• which is available in digital format,• which can be obtained from official federal agencies,• which is available nationwide for Germany as well as for the two city-states Berlin
and Hamburg as well as for the densely populated countries of Bavaria, North Rhine-Westphalia, and Baden-Württemberg),
• which is available from 1984 onwards; of particular interest is data available since 2000 due to the extension of the SOEP data, and
• which is (or can be made) suitable to use with the SOEP data.
The continuously growing Geodata market requires searching large amounts of
Geodata. To find the requested data, search algorithms scan through the available
meta-information. In order to find and characterize the Geodata surveyed in this data
documentation, the following meta-information will be provided:
• Content• Data format• Date• Distribution / accessibility• Price and payment conditions• Accuracy (spatial resolution, temporal resolution)• Other data specific information (suitable applications, etc.)
2.3 Benefits and challenges of using Geodata
The following list provides an overview of the main benefits and challenges of integ-
rating Geodata into SOEP data analyses.
Benefits of using Geodata Challenges of using Geodata
Geodata is an additional information source to ex-isting socio-economic data
GIS requires basic knowledge about GIS data management and analysis methods
GIS analysis allows the examination and verifica-tion of spatial patterns and non-spatial variables
Acquiring data that might not be available, up-to-date, or affordable
A database allows all georeferenced data to be queried, organized, and stored
Detailed and descriptive information in the form of maps, spreadsheets, or scatter plots
Data distributable and accessible via online inter-faces and interactive web-maps
Data conversion time extensive due to interoper-ability problems between different systems
9
Combining Geodata and SOEP data
3 Combining Geodata and SOEP data
3.1 The potential of spatial analysis of SOEP data
The SOEP is an annual survey of Germans, foreigners and immigrants in the old and
new federal states of Germany since 1984. The sample in the survey year 2006 in-
cluded almost 11,000 households with more than 20,000 members. The SOEP data
contains household information about income, living, as well as subjective indicators
such as satisfaction. Main topics include, e.g., household composition, work and fam-
ily biography, labour force participation and occupational mobility, income histories,
health, and life satisfaction.
Regional-level data on the Postal Code/ZIP (PLZ), county/administrative district
(Landkreis) or community (Gemeinde) has been available since the 1990s. Since
2000, the SOEP data expanded into a larger sample and the households are now
georeferenced through geographic coordinates (house coordinates, GPS). This spatial
information allows linking the SOEP data with additional Geodata and thus makes
extended regional analyses possible.
The SOEP data is provided to higher education and research institutions in Germany
and abroad. The data is available in SPSS, SAS, Stata, and ASCII formats. Extensive
documentation is available online in German and English10.
3.1.1 Georeferencing SOEP data
One of the main objectives of social scientists employing Geodata is to locate and
identify the SOEP data in the form of precise household information as well as ag-
gregate data. Georeferencing and GIS analyses can be carried out on different accur-
acy levels (scales), depending on the available data and the permitted spatial accuracy
of the household locations. SOEP-remote supports analysis jobs even outside the
DIW Berlin by securely automating the regional query and anonymising the identific-
ation of each household. In doing so, it enables the SOEP user to accomplish regional
analyses on a county level from the workplace without having access to the location of
a household.
Linking the information supplied by the SOEP dataset to the exact household loca-
tions is highly restricted due to data security regulations. Therefore the spatial linking
and assignment of SOEP household data may only be done with aggregated informa-
10 Please refer to the appendix for further information about the SOEP
10
Combining Geodata and SOEP data
tion. This aggregated and thus anonymous information can then be used on a less
precise level (e.g., ZIP-codes or communities).
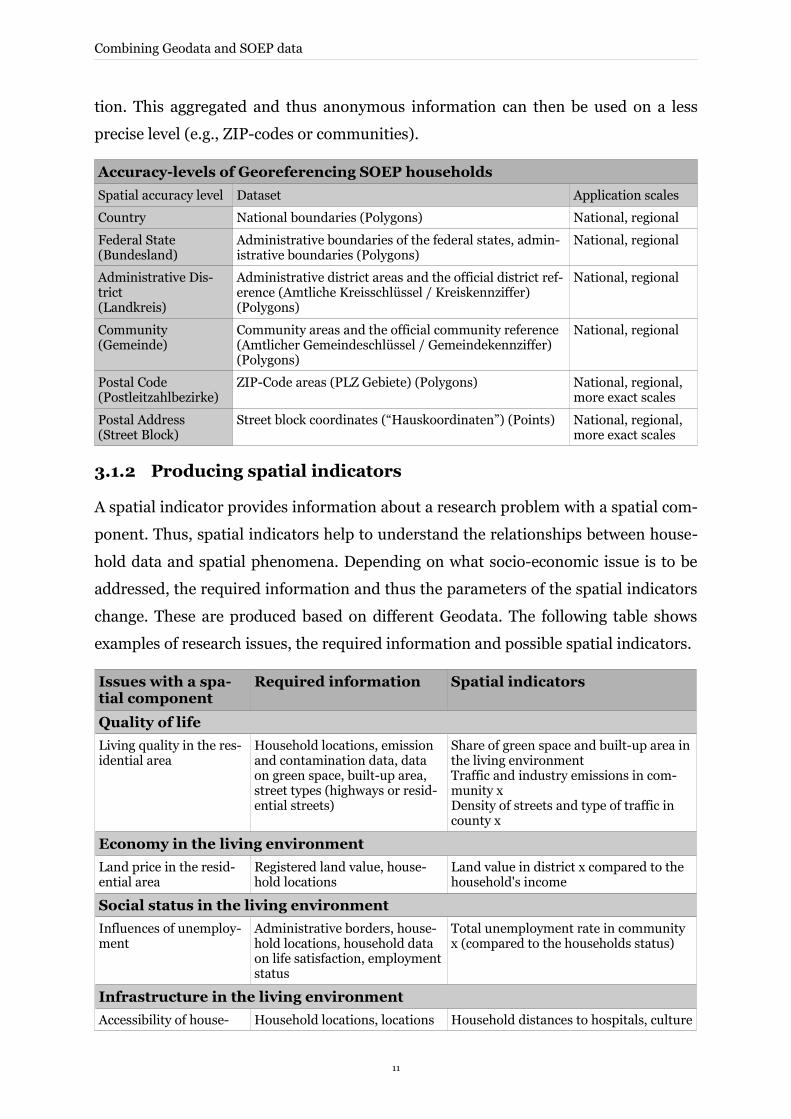
Accuracy-levels of Georeferencing SOEP households
Spatial accuracy level Dataset Application scales
Country National boundaries (Polygons) National, regional
Federal State (Bundesland)
Administrative boundaries of the federal states, admin-istrative boundaries (Polygons)
National, regional
Administrative Dis-trict (Landkreis)
Administrative district areas and the official district ref-erence (Amtliche Kreisschlüssel / Kreiskennziffer)(Polygons)
National, regional
Community(Gemeinde)
Community areas and the official community reference (Amtlicher Gemeindeschlüssel / Gemeindekennziffer)(Polygons)
National, regional
Postal Code(Postleitzahlbezirke)
ZIP-Code areas (PLZ Gebiete) (Polygons) National, regional, more exact scales
Postal Address (Street Block)
Street block coordinates (“Hauskoordinaten”) (Points) National, regional, more exact scales
3.1.2 Producing spatial indicators
A spatial indicator provides information about a research problem with a spatial com-
ponent. Thus, spatial indicators help to understand the relationships between house-
hold data and spatial phenomena. Depending on what socio-economic issue is to be
addressed, the required information and thus the parameters of the spatial indicators
change. These are produced based on different Geodata. The following table shows
examples of research issues, the required information and possible spatial indicators.
Issues with a spa-tial component
Required information Spatial indicators
Quality of life
Living quality in the res-idential area
Household locations, emission and contamination data, data on green space, built-up area, street types (highways or resid-ential streets)
Share of green space and built-up area in the living environmentTraffic and industry emissions in com-munity xDensity of streets and type of traffic in county x
Economy in the living environment
Land price in the resid-ential area
Registered land value, house-hold locations
Land value in district x compared to the household's income
Social status in the living environment
Influences of unemploy-ment
Administrative borders, house-hold locations, household data on life satisfaction, employment status
Total unemployment rate in community x (compared to the households status)
Infrastructure in the living environment
Accessibility of house- Household locations, locations Household distances to hospitals, culture
11
Combining Geodata and SOEP data
Issues with a spa-tial component
Required information Spatial indicators
holds to general infra-structure
of different infrastructure, qual-ity and quantity of infrastruc-ture in an area
centres, public transport, schools (e.g., schools within a radius of 500 metres to a household)
Environmental impact in the living environment
Air pollution Emission and contamination data, household locations
Air quality spatially differentiated (e.g., air quality in each county)
Noise pollution Emission and contamination data, household locations
Household distance to noise sources (e.g., streets, airports)
Time series and location change
Household mobility (so-cial and spatial mobility)
Household locations, moving behaviour and dates, adminis-trative borders
Moving Rate between different cities, within a city (e.g. , moving between the districts of a city)
3.2 Processing Geodata and typical GIS tasks of interest for SOEP data users
In order to prepare geospatial indicators for use with SOEP data, one has to prepro-
cess the Geodata. Some of the typical GIS tasks of interest for SOEP data users will be
described in the following chapter. For the examples, the open source GIS software
MapWindow and mainly freely available Geodata will be used in place of many simi-
lar software applications.
3.2.1 Obtaining Geodata from the Internet
Geodata can be obtained from a range of data providers, among them public and
commercial data providers (see chapter 4). Geodata freely available in the Internet
has played an increasingly important role within the last few years.
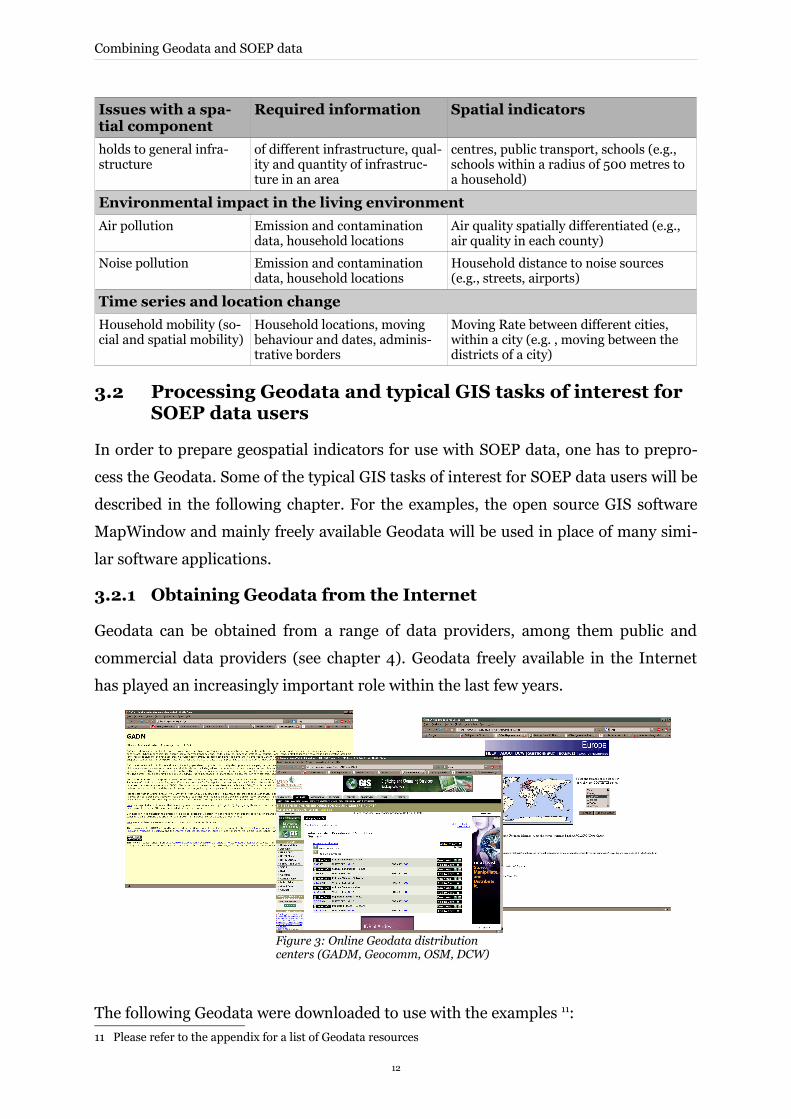
The following Geodata were downloaded to use with the examples 11:
11 Please refer to the appendix for a list of Geodata resources
12
Figure 3: Online Geodata distribution centers (GADM, Geocomm, OSM, DCW)
Combining Geodata and SOEP data
• Administrative boundaries data from Global Administrative Areas (GADM)• Roads, railways, POI, buildings, natural from Open Street Map Project (OSM)• Populated places from GeoComm • Other data from Digital Chart of the World DCW• OSM dataset for Germany (Roads, Natural)• DDS Testdata (Administrative Boundaries, Socio-Street dataset with information
about the population on the street level, e.g., age, purchasing power, children/no children, etc.)
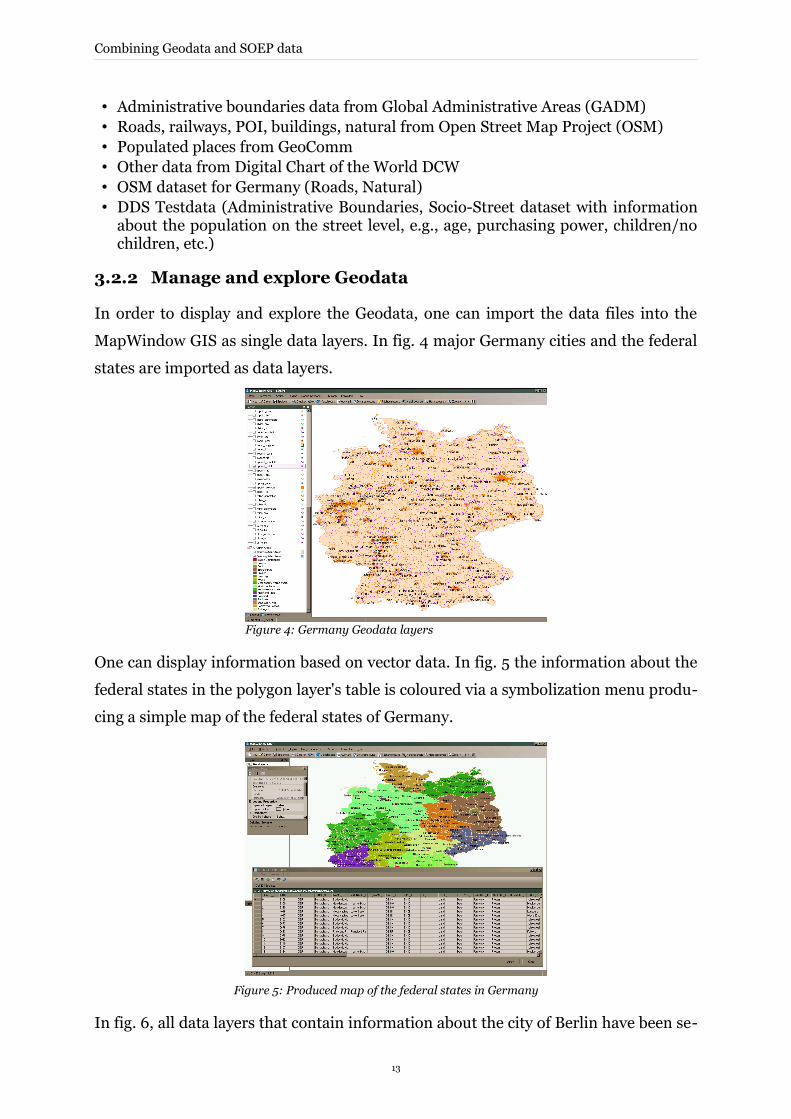
3.2.2 Manage and explore Geodata
In order to display and explore the Geodata, one can import the data files into the
MapWindow GIS as single data layers. In fig. 4 major Germany cities and the federal
states are imported as data layers.
One can display information based on vector data. In fig. 5 the information about the
federal states in the polygon layer's table is coloured via a symbolization menu produ-
cing a simple map of the federal states of Germany.
In fig. 6, all data layers that contain information about the city of Berlin have been se-
13
Figure 5: Produced map of the federal states in Germany
Figure 4: Germany Geodata layers
Combining Geodata and SOEP data
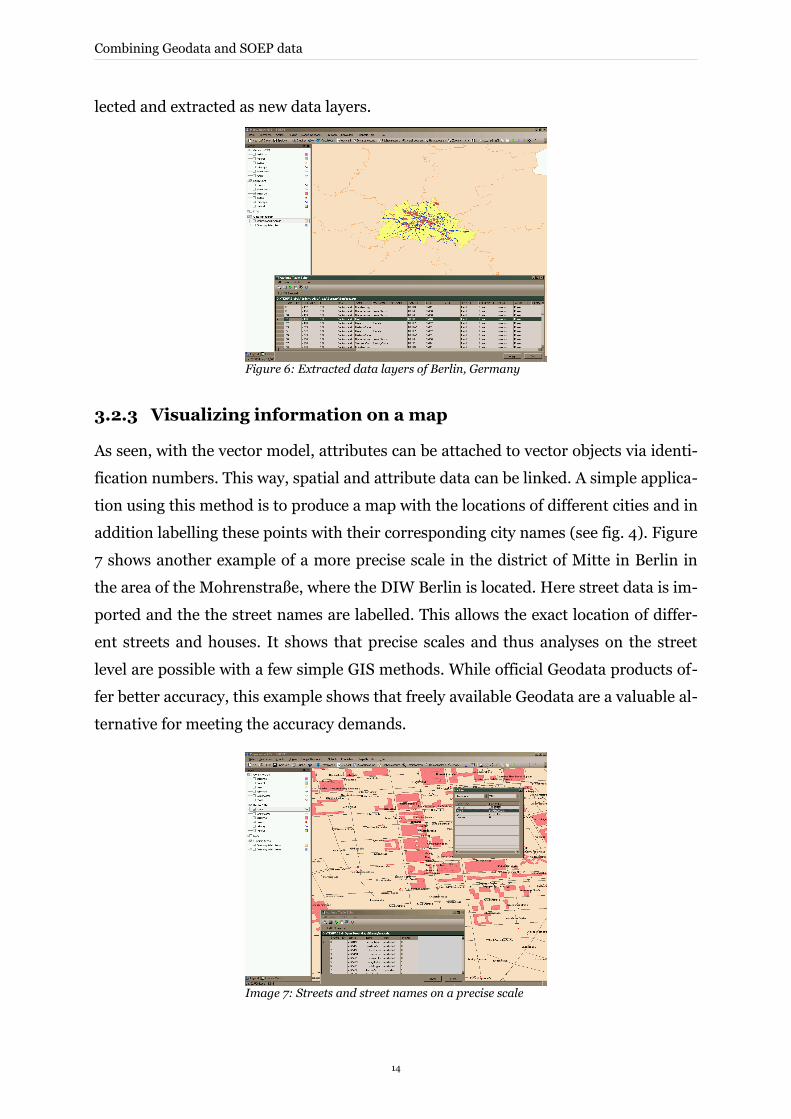
lected and extracted as new data layers.
3.2.3 Visualizing information on a map
As seen, with the vector model, attributes can be attached to vector objects via identi-
fication numbers. This way, spatial and attribute data can be linked. A simple applica-
tion using this method is to produce a map with the locations of different cities and in
addition labelling these points with their corresponding city names (see fig. 4). Figure
7 shows another example of a more precise scale in the district of Mitte in Berlin in
the area of the Mohrenstraße, where the DIW Berlin is located. Here street data is im-
ported and the the street names are labelled. This allows the exact location of differ-
ent streets and houses. It shows that precise scales and thus analyses on the street
level are possible with a few simple GIS methods. While official Geodata products of-
fer better accuracy, this example shows that freely available Geodata are a valuable al-
ternative for meeting the accuracy demands.
14
Figure 6: Extracted data layers of Berlin, Germany
Image 7: Streets and street names on a precise scale
Combining Geodata and SOEP data
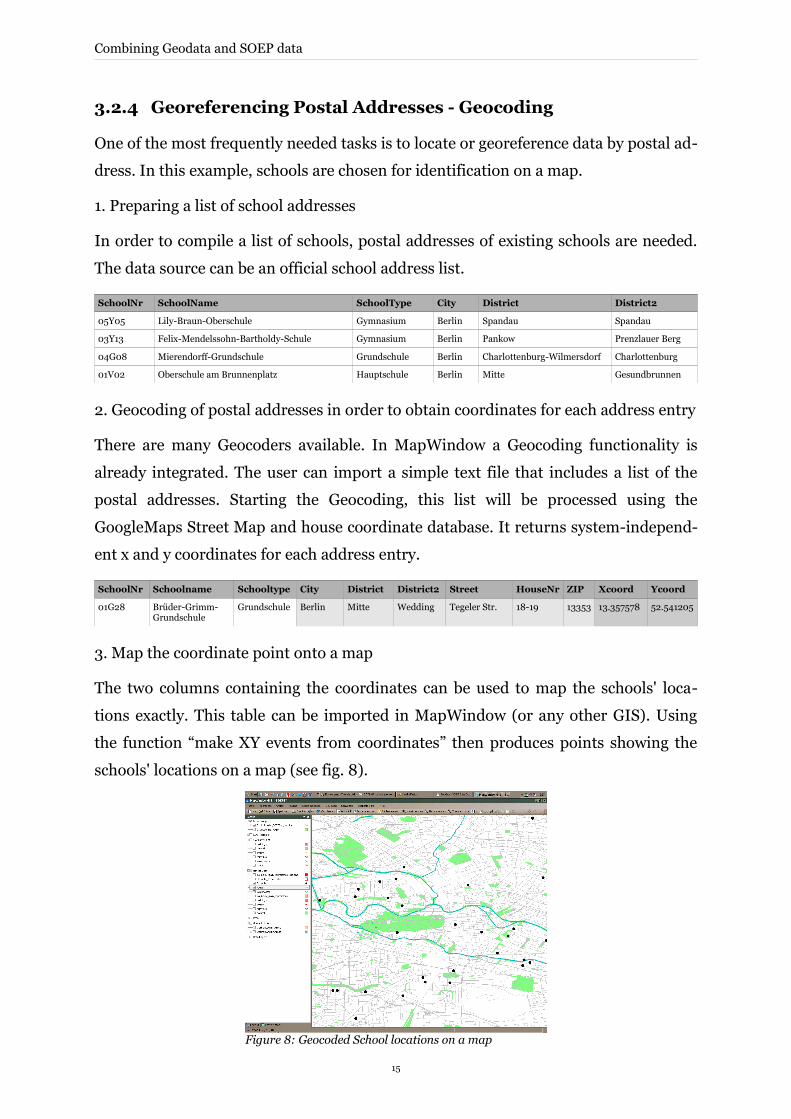
3.2.4 Georeferencing Postal Addresses - Geocoding
One of the most frequently needed tasks is to locate or georeference data by postal ad-
dress. In this example, schools are chosen for identification on a map.
1. Preparing a list of school addresses
In order to compile a list of schools, postal addresses of existing schools are needed.
The data source can be an official school address list.
SchoolNr SchoolName SchoolType City District District2
05Y05 Lily-Braun-Oberschule Gymnasium Berlin Spandau Spandau
03Y13 Felix-Mendelssohn-Bartholdy-Schule Gymnasium Berlin Pankow Prenzlauer Berg
04G08 Mierendorff-Grundschule Grundschule Berlin Charlottenburg-Wilmersdorf Charlottenburg
01V02 Oberschule am Brunnenplatz Hauptschule Berlin Mitte Gesundbrunnen
2. Geocoding of postal addresses in order to obtain coordinates for each address entry
There are many Geocoders available. In MapWindow a Geocoding functionality is
already integrated. The user can import a simple text file that includes a list of the
postal addresses. Starting the Geocoding, this list will be processed using the
GoogleMaps Street Map and house coordinate database. It returns system-independ-
ent x and y coordinates for each address entry.
SchoolNr Schoolname Schooltype City District District2 Street HouseNr ZIP Xcoord Ycoord
01G28 Brüder-Grimm-Grundschule
Grundschule Berlin Mitte Wedding Tegeler Str. 18-19 13353 13.357578 52.541205
3. Map the coordinate point onto a map
The two columns containing the coordinates can be used to map the schools' loca-
tions exactly. This table can be imported in MapWindow (or any other GIS). Using
the function “make XY events from coordinates” then produces points showing the
schools' locations on a map (see fig. 8).
15
Figure 8: Geocoded School locations on a map
Combining Geodata and SOEP data
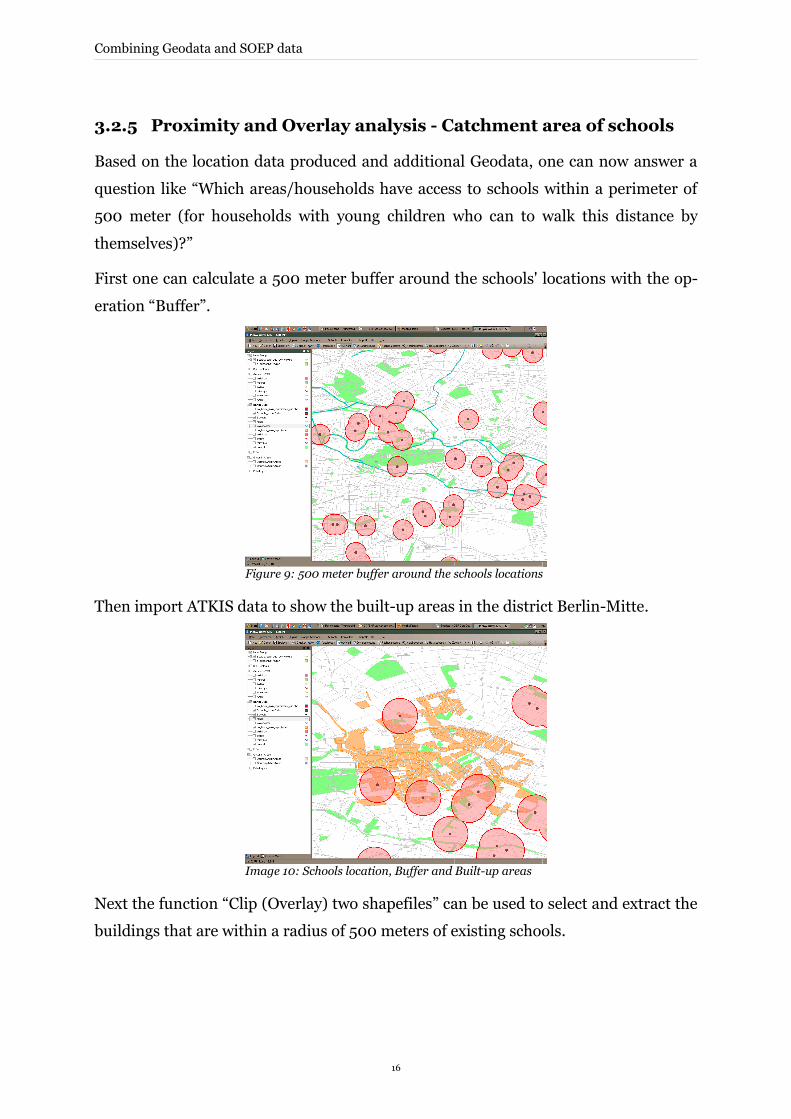
3.2.5 Proximity and Overlay analysis - Catchment area of schools
Based on the location data produced and additional Geodata, one can now answer a
question like “Which areas/households have access to schools within a perimeter of
500 meter (for households with young children who can to walk this distance by
themselves)?”
First one can calculate a 500 meter buffer around the schools' locations with the op-
eration “Buffer”.
Then import ATKIS data to show the built-up areas in the district Berlin-Mitte.
Next the function “Clip (Overlay) two shapefiles” can be used to select and extract the
buildings that are within a radius of 500 meters of existing schools.
16
Figure 9: 500 meter buffer around the schools locations
Image 10: Schools location, Buffer and Built-up areas
Combining Geodata and SOEP data
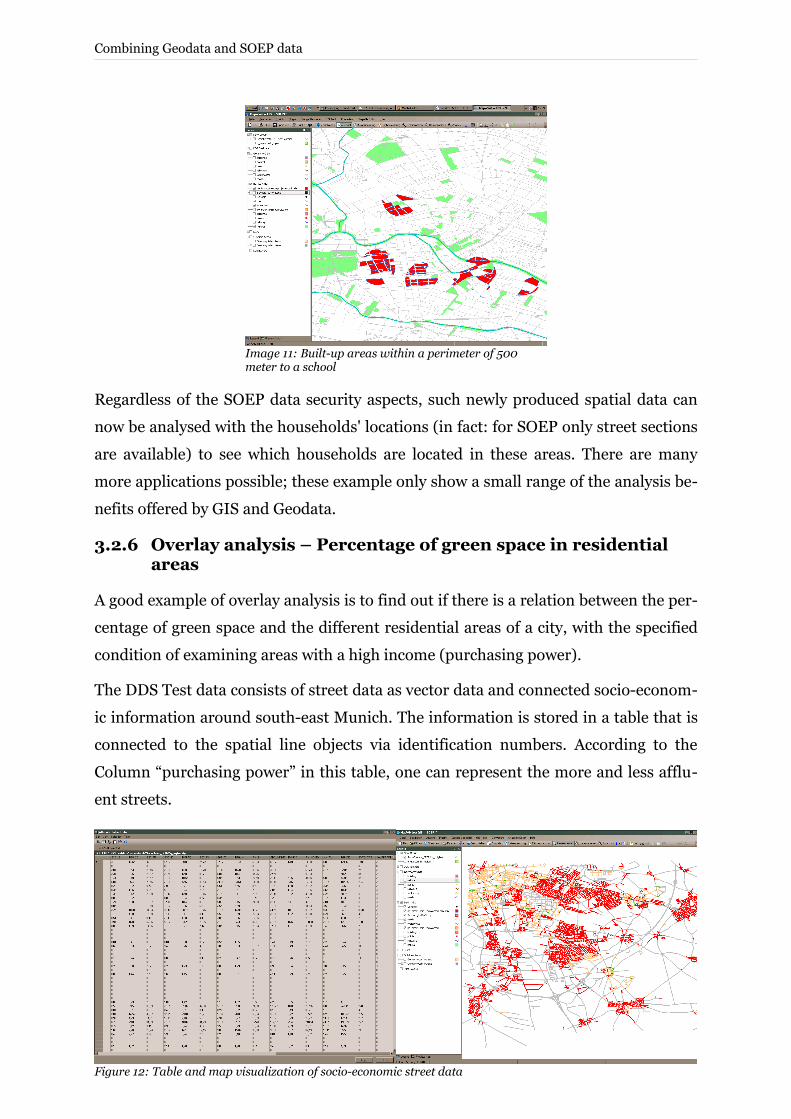
Regardless of the SOEP data security aspects, such newly produced spatial data can
now be analysed with the households' locations (in fact: for SOEP only street sections
are available) to see which households are located in these areas. There are many
more applications possible; these example only show a small range of the analysis be-
nefits offered by GIS and Geodata.
3.2.6 Overlay analysis – Percentage of green space in residential areas
A good example of overlay analysis is to find out if there is a relation between the per-
centage of green space and the different residential areas of a city, with the specified
condition of examining areas with a high income (purchasing power).
The DDS Test data consists of street data as vector data and connected socio-econom-
ic information around south-east Munich. The information is stored in a table that is
connected to the spatial line objects via identification numbers. According to the
Column “purchasing power” in this table, one can represent the more and less afflu-
ent streets.
17
Image 11: Built-up areas within a perimeter of 500 meter to a school
Figure 12: Table and map visualization of socio-economic street data
Combining Geodata and SOEP data
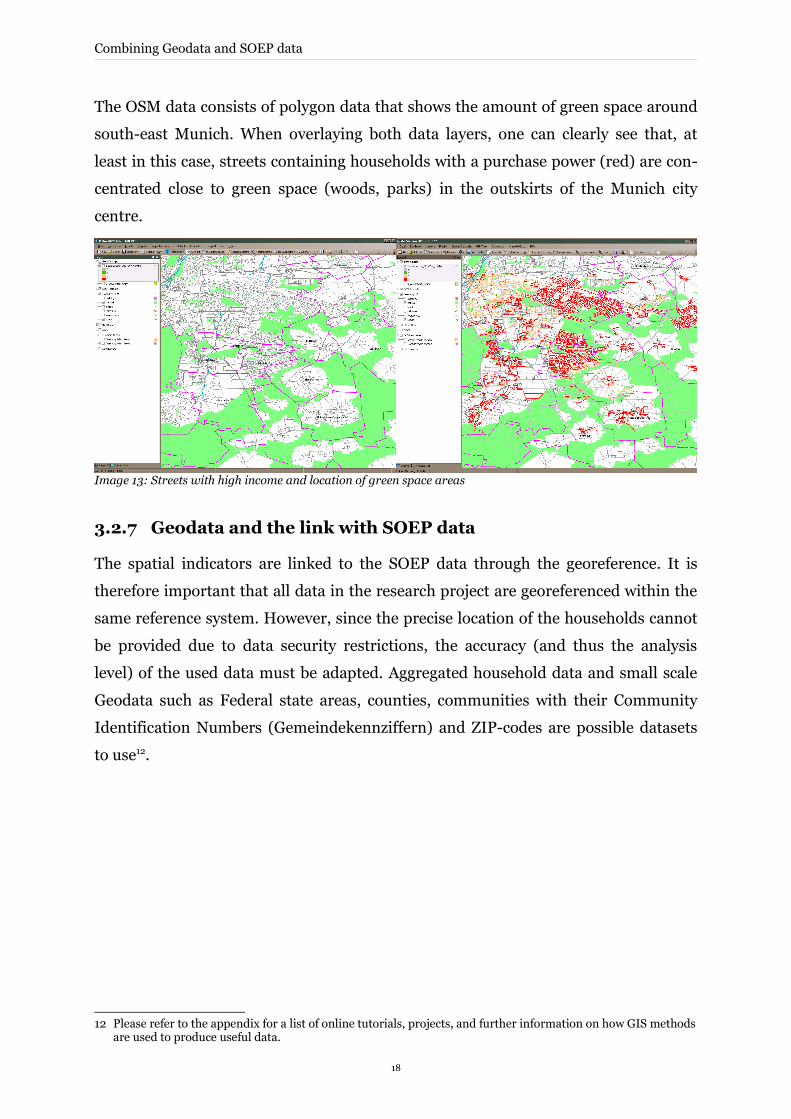
The OSM data consists of polygon data that shows the amount of green space around
south-east Munich. When overlaying both data layers, one can clearly see that, at
least in this case, streets containing households with a purchase power (red) are con-
centrated close to green space (woods, parks) in the outskirts of the Munich city
centre.
3.2.7 Geodata and the link with SOEP data
The spatial indicators are linked to the SOEP data through the georeference. It is
therefore important that all data in the research project are georeferenced within the
same reference system. However, since the precise location of the households cannot
be provided due to data security restrictions, the accuracy (and thus the analysis
level) of the used data must be adapted. Aggregated household data and small scale
Geodata such as Federal state areas, counties, communities with their Community
Identification Numbers (Gemeindekennziffern) and ZIP-codes are possible datasets
to use12.
12 Please refer to the appendix for a list of online tutorials, projects, and further information on how GIS methods are used to produce useful data.
18
Image 13: Streets with high income and location of green space areas
Combining Geodata and SOEP data
3.3 Socio-economic studies using Geodata
The following chapter presents three socio-economic studies that combine Geodata
and GIS methods with the SOEP data or similar datasets.
3.3.1 Accessibility of University locations
In a study about the decision of Abiturienten (academic-track high school seniors) on
the choice of further education, spatial information was used in addition to different
parameters of the SOEP household data ranging from academic status to parental in-
come. An indirect spatial reference was used for each household and University by re-
lying on the postal zip codes. In a first step, the distances between the households and
Universities were calculated and the nearest one was determined. In a second step, a
spatial interpolation method was used to derive a Germany-wide map of estimated
nearest distances to Universities. By using this spatial analysis method, area-wide in-
formation is generated by interpolating distributed point information. Within the
overall model, distance turns out to be of high significance for explaining the choice
of career.
Further information about this study
Title Accessibility of University locations
Author Katharina Spieß, DIW Berlin
Author Tobia Lakes, Geomatics Lab, Geography Department, Humboldt-Universität zu Berlin
3.3.2 Valuing air quality using the life satisfaction approach
In this study the life satisfaction approach is used to value air quality, combining indi-
vidual-level panel and high-resolution SO2 data. It has has two major objectives. First,
the effect of SO2 concentration on life satisfaction and housing rent is estimated using
high-resolution pollution data (raster data) and a large panel survey for Germany
(SOEP data). Second, using the results of the hedonic housing regression and the life
satisfaction regressions, the total willingness-to-pay (WTP) for improvements in air
quality is calculated as the sum of the estimates based on the two different methods.
The Umweltbundesamt (German federal environmental agency, UBA) provides data
on the annual mean SO2 concentration measured at the monitors belonging to the
monitoring networks of the 16 Landesumweltämter (state environmental agencies)
and the UBA from 1985 to 2003. The study is based on SO2 data from 553 monitors
or, in individual years, between 196 monitors in 1985 and 416 monitors in 1994.
There are fewer locations of monitors in 1985. In order to estimate the SO2 concentra-
19
Combining Geodata and SOEP data
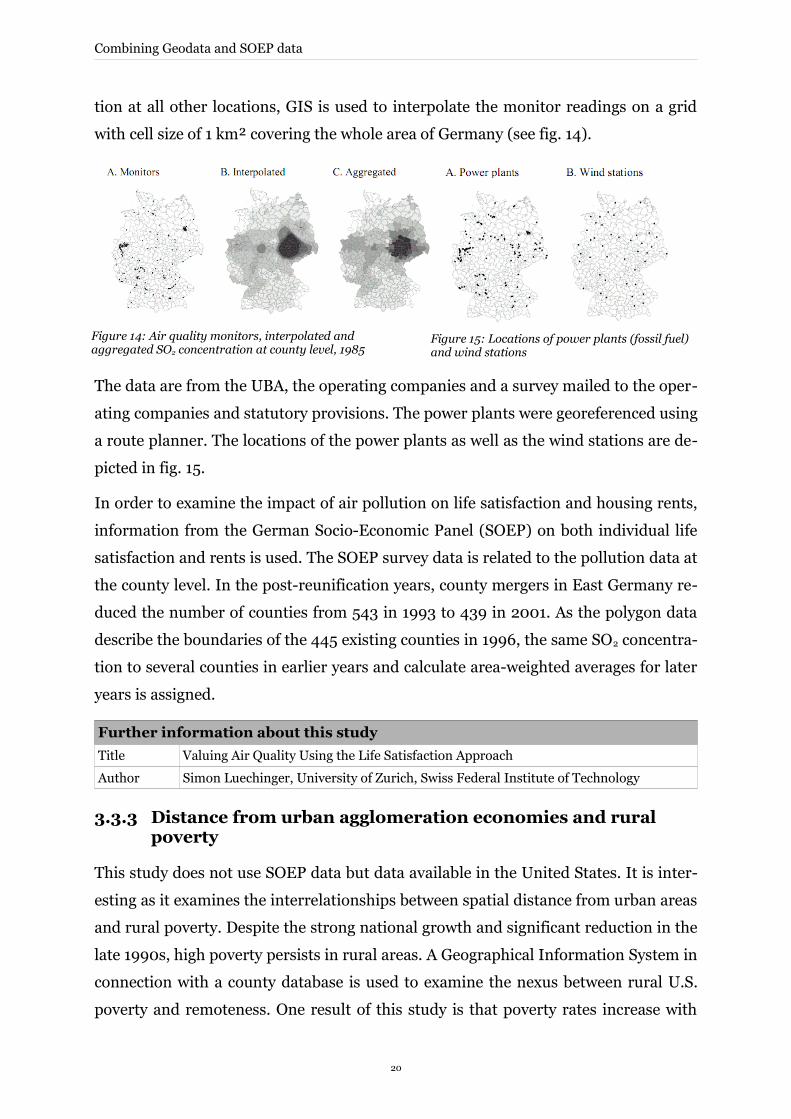
tion at all other locations, GIS is used to interpolate the monitor readings on a grid
with cell size of 1 km² covering the whole area of Germany (see fig. 14).
The data are from the UBA, the operating companies and a survey mailed to the oper-
ating companies and statutory provisions. The power plants were georeferenced using
a route planner. The locations of the power plants as well as the wind stations are de-
picted in fig. 15.
In order to examine the impact of air pollution on life satisfaction and housing rents,
information from the German Socio-Economic Panel (SOEP) on both individual life
satisfaction and rents is used. The SOEP survey data is related to the pollution data at
the county level. In the post-reunification years, county mergers in East Germany re-
duced the number of counties from 543 in 1993 to 439 in 2001. As the polygon data
describe the boundaries of the 445 existing counties in 1996, the same SO2 concentra-
tion to several counties in earlier years and calculate area-weighted averages for later
years is assigned.
Further information about this study
Title Valuing Air Quality Using the Life Satisfaction Approach
Author Simon Luechinger, University of Zurich, Swiss Federal Institute of Technology
3.3.3 Distance from urban agglomeration economies and rural poverty
This study does not use SOEP data but data available in the United States. It is inter-
esting as it examines the interrelationships between spatial distance from urban areas
and rural poverty. Despite the strong national growth and significant reduction in the
late 1990s, high poverty persists in rural areas. A Geographical Information System in
connection with a county database is used to examine the nexus between rural U.S.
poverty and remoteness. One result of this study is that poverty rates increase with
20
Figure 14: Air quality monitors, interpolated and aggregated SO2 concentration at county level, 1985
Figure 15: Locations of power plants (fossil fuel) and wind stations
Combining Geodata and SOEP data
growing rural distances from larger metropolitan areas. This is explained as arising
from the attenuation of urban agglomeration effects at greater distances and incom-
plete commuting and migration responses to lower labour demand in rural areas. One
implication is that remote areas in particular may experience greater reductions in
poverty from place-based economic development policies.
Further information about this study
Title Distance from urban agglomeration economies and rural poverty
Author Mark D. Partidge, Ohio State University
Author Dan S. Rickman, Ohio State University
3.4 Conclusions
Using Geodata allows one to expand the analysis of socio-economic data such as
SOEP data to incorporate a spatial dimension. This permits new scientific questions
to be addressed at the intersection of socio-economics and geography. A variety of
possible relations and linkages between SOEP data and Geodata is possible. However,
it is not only the additional information provided by Geodata but also geographic ana-
lysis techniques, such as proximity or overlay, that offer new benefits. While simple
analysis and presentation tasks may be done by non-experienced Geodata and GIS-
users, more complex analyses need to be based on profound knowledge of spatial
technologies. Increasingly, GIS can be combined with widely distributed statistical
analysis software packages such as SPSS and SAS. In addition to desktop technology,
web mapping applications and web-server technologies open up possibilities for data
exchange and presentation that have not yet been exploited to a wide extent.
21
Survey of Geodata for Germany
4 Survey of Geodata for Germany
Primary sources for Geodata in Germany include governmental organisations, uni-
versities, and scientific institutes. Geodata is available on a nationwide level, federal
state level (single federal states), and also on a regional level (cities, specific regions),
as well as on street and house level.
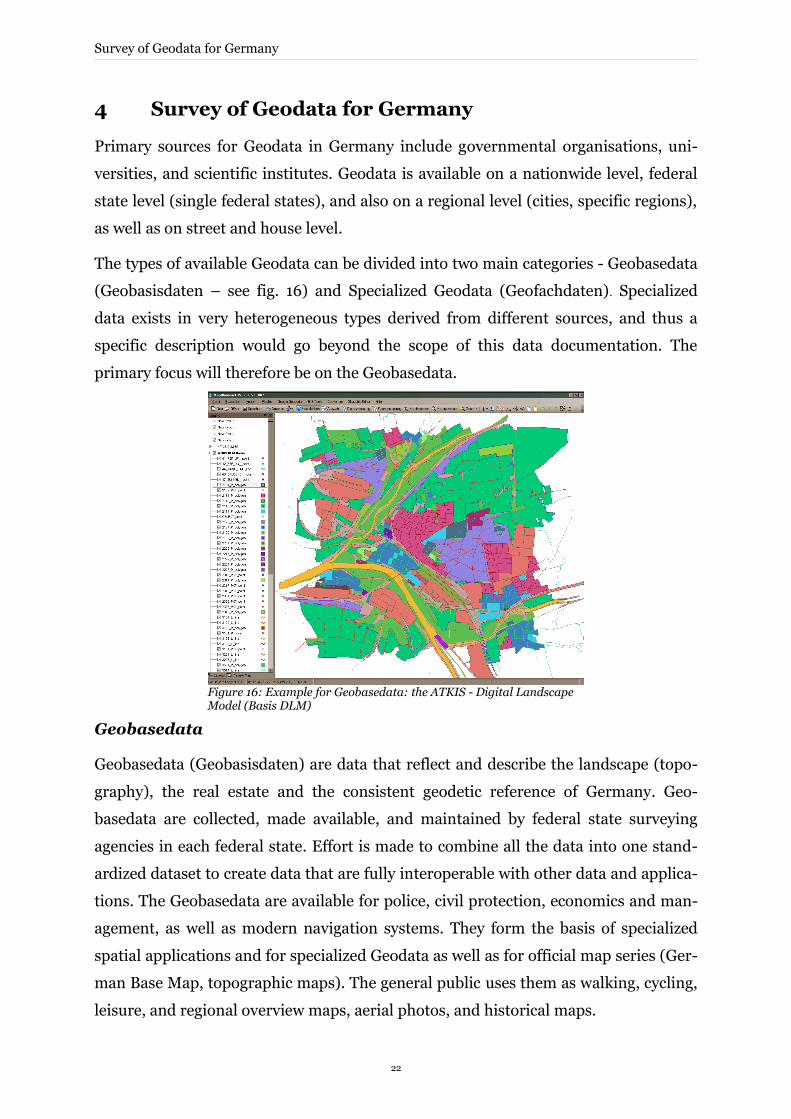
The types of available Geodata can be divided into two main categories - Geobasedata
(Geobasisdaten – see fig. 16) and Specialized Geodata (Geofachdaten). Specialized
data exists in very heterogeneous types derived from different sources, and thus a
specific description would go beyond the scope of this data documentation. The
primary focus will therefore be on the Geobasedata.
Geobasedata
Geobasedata (Geobasisdaten) are data that reflect and describe the landscape (topo-
graphy), the real estate and the consistent geodetic reference of Germany. Geo-
basedata are collected, made available, and maintained by federal state surveying
agencies in each federal state. Effort is made to combine all the data into one stand-
ardized dataset to create data that are fully interoperable with other data and applica-
tions. The Geobasedata are available for police, civil protection, economics and man-
agement, as well as modern navigation systems. They form the basis of specialized
spatial applications and for specialized Geodata as well as for official map series (Ger-
man Base Map, topographic maps). The general public uses them as walking, cycling,
leisure, and regional overview maps, aerial photos, and historical maps.
22
Figure 16: Example for Geobasedata: the ATKIS - Digital Landscape Model (Basis DLM)
Survey of Geodata for Germany
Federal Office for Cartography and Geodesy
The Federal Office for Cartography and Geodesy (Bundesamt für Kartographie und
Geodäsie, BKG) compiles the Geodata collected by the federal state survey agencies.
Its main task is to prepare Geobasedata for the area of the Federal Republic of Ger-
many (thus with a nationwide coverage) and to advise the federal government in the
areas of geodesy and geoinformatics.
The BKG provides, in cooperation with the association of the survey administrations
of the federal states (Arbeitsgemeinschaft der Vermessungsverwaltung der Länder
der Bundesrepublik Deutschland, AdV), spatial data in the form of vector data (digital
landscape models, administrative boundaries, and geographical names) and raster
data (digital elevation models, digital topographic maps).
The meta information system of the BKG's Geodata Centre (Geodatenzentrum)
provides information about the availability and quality of the available Geodata. It is
the central distribution service of the German national survey agencies and provides
Geodata ordered via their website.
Geobasedata at national level
Geobasedata are currently available within the following three datasets:
• ATKIS (Amtliches Topographisch-Kartographisches Informationssystem, Official Topographic-Cartographic Information System)
• ALKIS (Automatisiertes Liegenschaftskataster Informationssystem, Automated Real Estate and Cadastre Information System)
• AFIS (Festpunkt Information System - The AFIS forms the basis for all surveying activities, e.g., property measurements, but is not of significant interest to the reader of this documentation as it does not contain any usable data).
In the future, the combined AFIS-ALKIS-ATKIS data (the AAA model) will serve as a
standardized basis for specialized information systems. The data products available
today will be described in the following.
4.1 The ATKIS
The ATKIS describes the surface of the earth with digital landscape and terrain mod-
els. The topography (landscape) includes the objects, such as settlements, transport
networks, vegetation, water, terrain, and the boundaries of political and administrat-
ive units with names and other descriptive information throughout the entire federal
territory. The type of objects that are included and how they are described is defined
23
Survey of Geodata for Germany
in the ATKIS object type catalogues (ATKIS OK). Four main datasets are included in
the ATKIS: the Digital Landscape Models (DLM), the Digital terrain models - Digitale
Geländemodelle (DGM), the Digital Topographical Maps - Digitale Topographische
Karten (DTK) and the Digital Orthophotos (DOP).
All primary ATKIS datasets are shown in the following table. Due to generalisation
processes, the information provided by the datasets depends on the scale or resolu-
tion.
Data Group
Data Dataset Name Abbrevi-ation
Scale/ Resolution
ATKIS Digital Land Models (DLM) Digital Base Land Model DLM-B -
Digital Land Model DLM 250 1:250.000
Digital Land Model DLM 1000 1:1.000.000
Digital Elevation Models (DEM) Digital Elevation Model DGM-B -
Digital Elevation Model DGM 250 1:250.000
Digital Elevation Model DGM 1000 1:1.000.000
Digital Orthophotos Digital Orthophotos DOP 20 20 cm
Digital Orthophotos DOP 40 40 cm
Digital Topographic Maps Digital Topographic Map DTK 25 1:25.000
Digital Topographic Map DTK 50 1:50.000
Digital Topographic Map DTK 100 1:100.000
Digital Topographic Map DTK 200 1:200.000
Digital Topographic Map DTK 500 1:500.000
Digital Topographic Map DTK 1000 1:1.000.000
Other digital products Digital Street Map DSM 1:25.000
Geographic Names GN 1:250.000
Geographic Names GN 1:1.000.000
Administrative borders VG 1:250.000
Administrative borders VG 1:1.000.000
4.1.1 Digital Landscape Models (DLM)
The DLM describes the topographical landscape and the relief of the earth's surface in
vector format. The objects are listed in the ATKIS object catalogue (ATKIS OK DLM)
and are described by its geometric type, descriptive attributes and relationships to
other objects. Each object in Germany has a unique identification number (identifier).
Basic Digital Landscape Models (Basis DLM)
Content The dataset contains about 160 object types and their main attributes. It in-cludes streets, roads, railways, water and borders. The landscape elements include land use, residential areas, industrial and commercial areas, agricul-tural land and forests, water areas, communal areas
24
Survey of Geodata for Germany
Scales available Digitales Basis-Landschaftsmodell (Basis-DLM)Digitales Landschaftsmodell 50 (DLM50) 1:5.000, DLM250 (1:250.000), DLM1000 (1:1.000.000)
Coverage Germany in its borders as polygons (Nationwide)
Date ATKIS DLM: depending on the federal state, at least 20.10.2000ATKIS OK DLM: 01.07.2003
Source Federal state survey offices, BKG, AdV, Geodatenzentrum
Price and payment conditions
Basic unit: 1 km²For pricing examples, see table on page 37Individual object areas are priced in proportion, such as Municipal 25%, Traffic 40%. For more than single-user license prices are increased in rela-tionship to number of workstations. Charges for data updates and exploita-tion rights on demand.
Data format Vector format: ESRI Geodatabase (8.3), EDBS, DXF, SHAPE, ArcInfo-EX-PORT, ArcInfo-COVERAGE
Spatial Accuracy Absolute accuracy for position or height: approximately 15 m
Applicability Application areas: energy, forestry, agriculture, administration, demography, housing, land, regional and route planning, road management, traffic naviga-tion, transport, mining, water science, ecology, environmental protection, geodesy, geology, but also culture, recreation, leisure, communication etc.
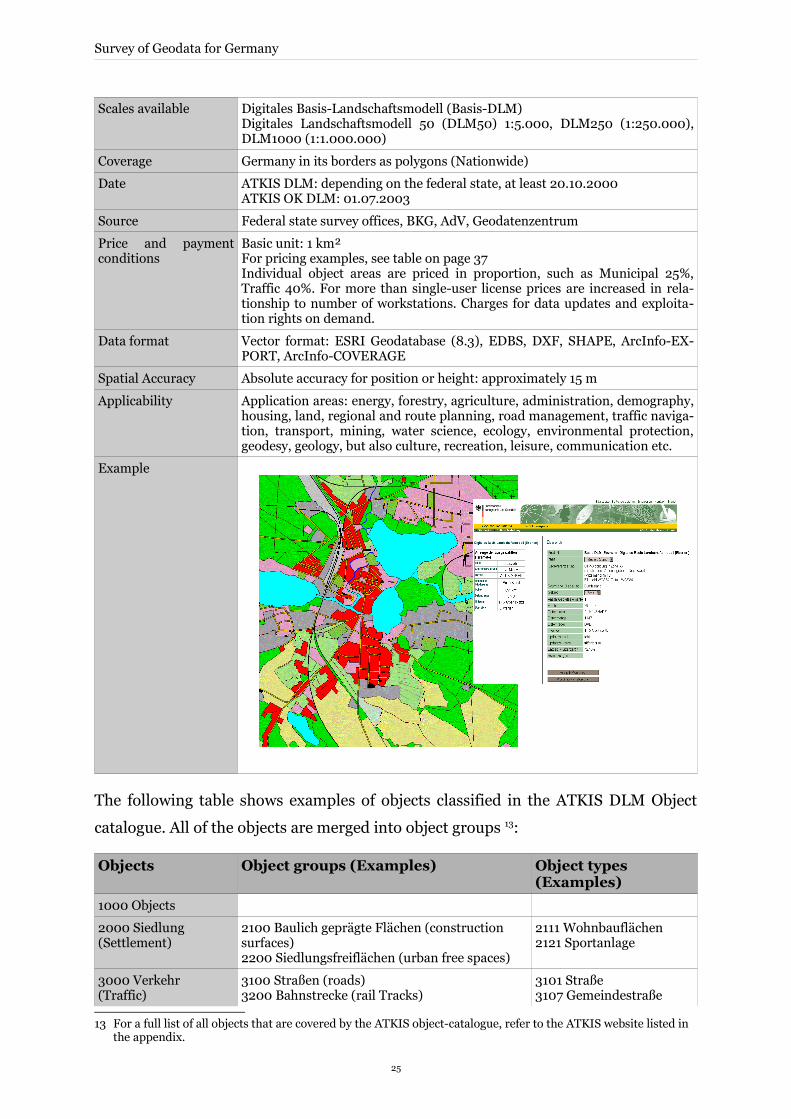
Example
The following table shows examples of objects classified in the ATKIS DLM Object
catalogue. All of the objects are merged into object groups 13:
Objects Object groups (Examples) Object types(Examples)
1000 Objects
2000 Siedlung (Settlement)
2100 Baulich geprägte Flächen (construction surfaces)2200 Siedlungsfreiflächen (urban free spaces)
2111 Wohnbauflächen2121 Sportanlage
3000 Verkehr (Traffic)
3100 Straßen (roads)3200 Bahnstrecke (rail Tracks)
3101 Straße 3107 Gemeindestraße
13 For a full list of all objects that are covered by the ATKIS object-catalogue, refer to the ATKIS website listed in the appendix.
25
Survey of Geodata for Germany
4000 Vegetation (Vegetation)
4100 Vegetationstyp 01 (vegetation areas) 4101 Ackerland4107 Wald
5000 Gewässer (Waterbodies)
5100 Gewässer (water bodies) 5101 Strom, Fluss, Bach5102 Kanal
6000 Relief(Relief)
6200 Geländehöhen (terrain elevation) 6201 Damm, Wall
7000 Gebiete (Areas)
7100 Verwaltungsgebiete (administrative areas)7300 Schutzgebiete (protected areas)
7101 Administrative unit7302 Naturreservat
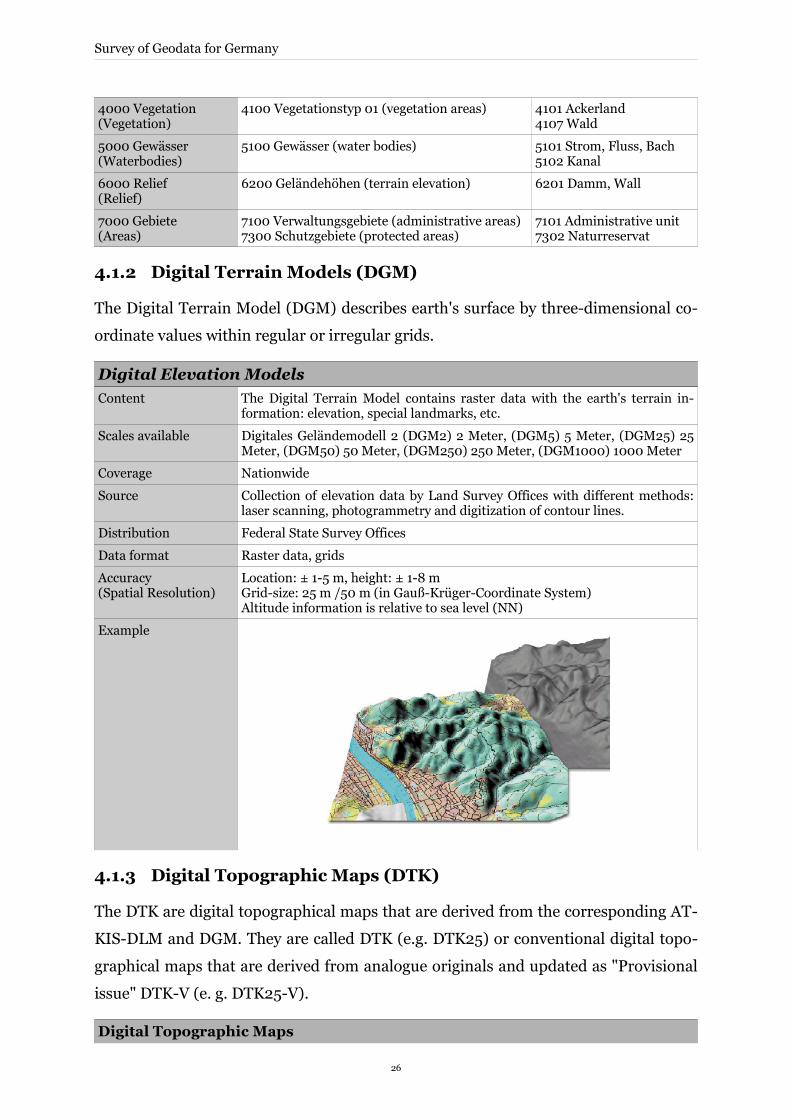
4.1.2 Digital Terrain Models (DGM)
The Digital Terrain Model (DGM) describes earth's surface by three-dimensional co-
ordinate values within regular or irregular grids.
Digital Elevation Models
Content The Digital Terrain Model contains raster data with the earth's terrain in-formation: elevation, special landmarks, etc.
Scales available Digitales Geländemodell 2 (DGM2) 2 Meter, (DGM5) 5 Meter, (DGM25) 25 Meter, (DGM50) 50 Meter, (DGM250) 250 Meter, (DGM1000) 1000 Meter
Coverage Nationwide
Source Collection of elevation data by Land Survey Offices with different methods: laser scanning, photogrammetry and digitization of contour lines.
Distribution Federal State Survey Offices
Data format Raster data, grids
Accuracy (Spatial Resolution)
Location: ± 1-5 m, height: ± 1-8 mGrid-size: 25 m /50 m (in Gauß-Krüger-Coordinate System)Altitude information is relative to sea level (NN)
Example
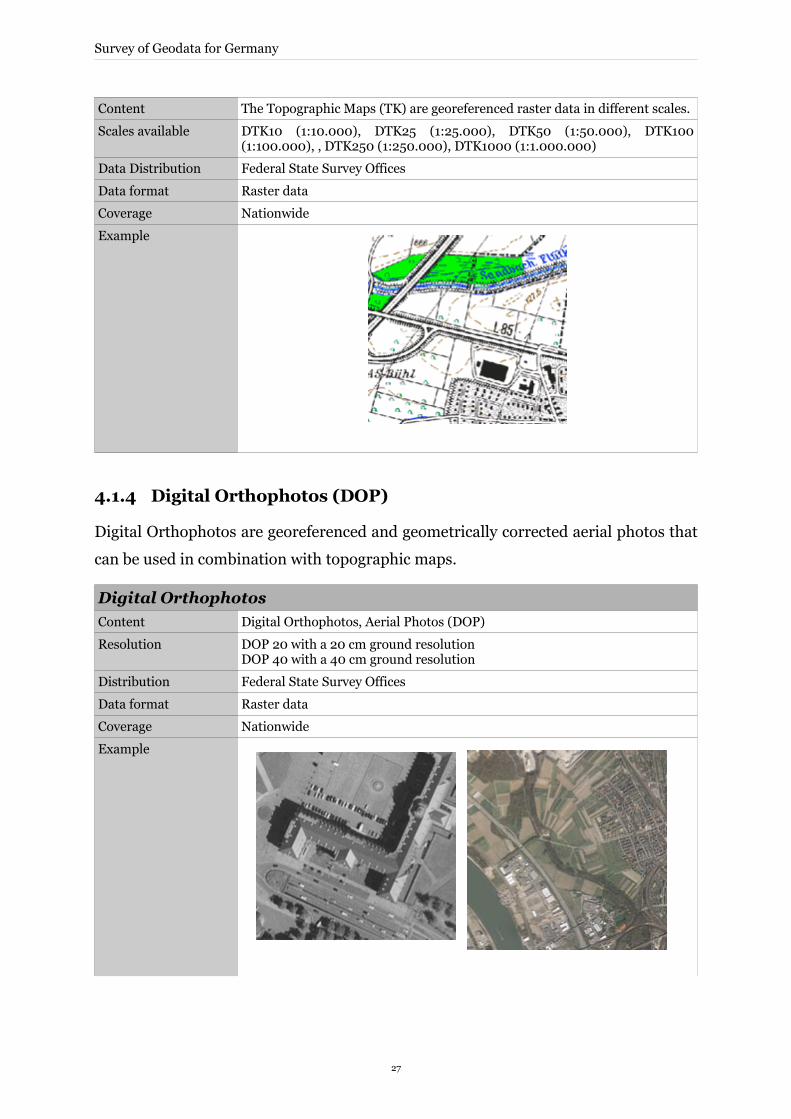
4.1.3 Digital Topographic Maps (DTK)
The DTK are digital topographical maps that are derived from the corresponding AT-
KIS-DLM and DGM. They are called DTK (e.g. DTK25) or conventional digital topo-
graphical maps that are derived from analogue originals and updated as "Provisional
issue" DTK-V (e. g. DTK25-V).
Digital Topographic Maps
26
Survey of Geodata for Germany
Content The Topographic Maps (TK) are georeferenced raster data in different scales.
Scales available DTK10 (1:10.000), DTK25 (1:25.000), DTK50 (1:50.000), DTK100 (1:100.000), , DTK250 (1:250.000), DTK1000 (1:1.000.000)
Data Distribution Federal State Survey Offices
Data format Raster data
Coverage Nationwide
Example
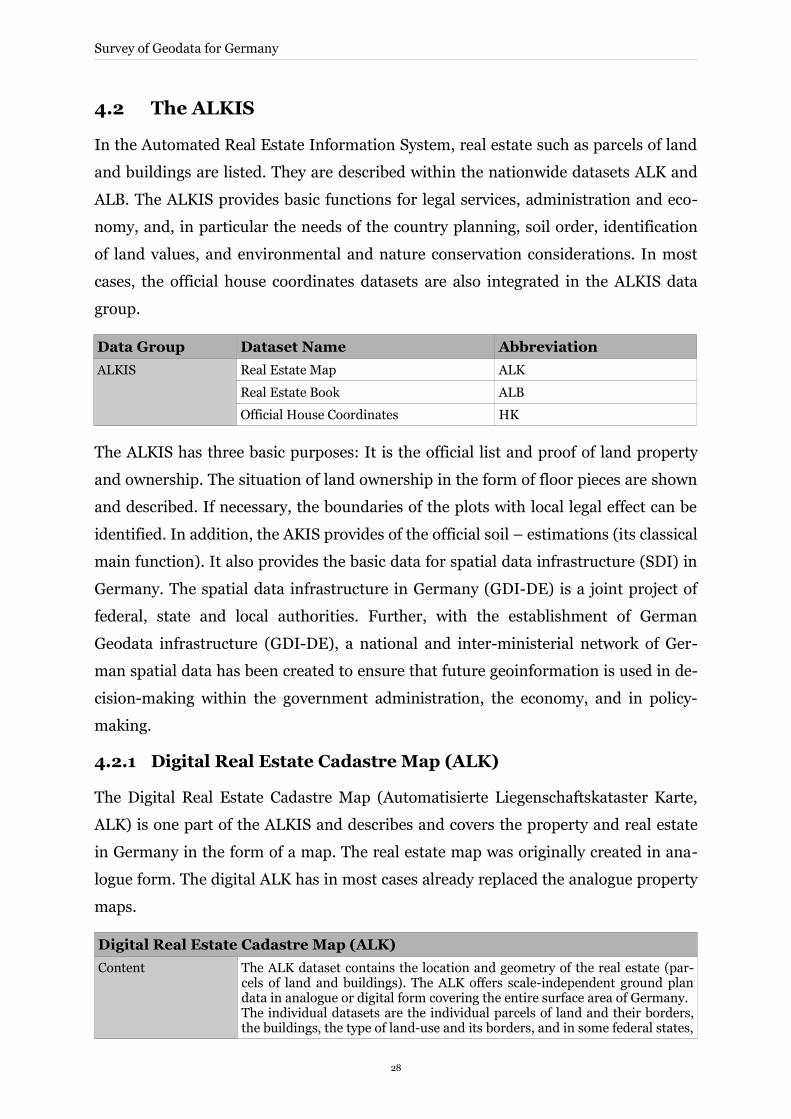
4.1.4 Digital Orthophotos (DOP)
Digital Orthophotos are georeferenced and geometrically corrected aerial photos that
can be used in combination with topographic maps.
Digital Orthophotos
Content Digital Orthophotos, Aerial Photos (DOP)
Resolution DOP 20 with a 20 cm ground resolutionDOP 40 with a 40 cm ground resolution
Distribution Federal State Survey Offices
Data format Raster data
Coverage Nationwide
Example
27
Survey of Geodata for Germany
4.2 The ALKIS
In the Automated Real Estate Information System, real estate such as parcels of land
and buildings are listed. They are described within the nationwide datasets ALK and
ALB. The ALKIS provides basic functions for legal services, administration and eco-
nomy, and, in particular the needs of the country planning, soil order, identification
of land values, and environmental and nature conservation considerations. In most
cases, the official house coordinates datasets are also integrated in the ALKIS data
group.
Data Group Dataset Name Abbreviation
ALKIS Real Estate Map ALK
Real Estate Book ALB
Official House Coordinates HK
The ALKIS has three basic purposes: It is the official list and proof of land property
and ownership. The situation of land ownership in the form of floor pieces are shown
and described. If necessary, the boundaries of the plots with local legal effect can be
identified. In addition, the AKIS provides of the official soil – estimations (its classical
main function). It also provides the basic data for spatial data infrastructure (SDI) in
Germany. The spatial data infrastructure in Germany (GDI-DE) is a joint project of
federal, state and local authorities. Further, with the establishment of German
Geodata infrastructure (GDI-DE), a national and inter-ministerial network of Ger-
man spatial data has been created to ensure that future geoinformation is used in de-
cision-making within the government administration, the economy, and in policy-
making.
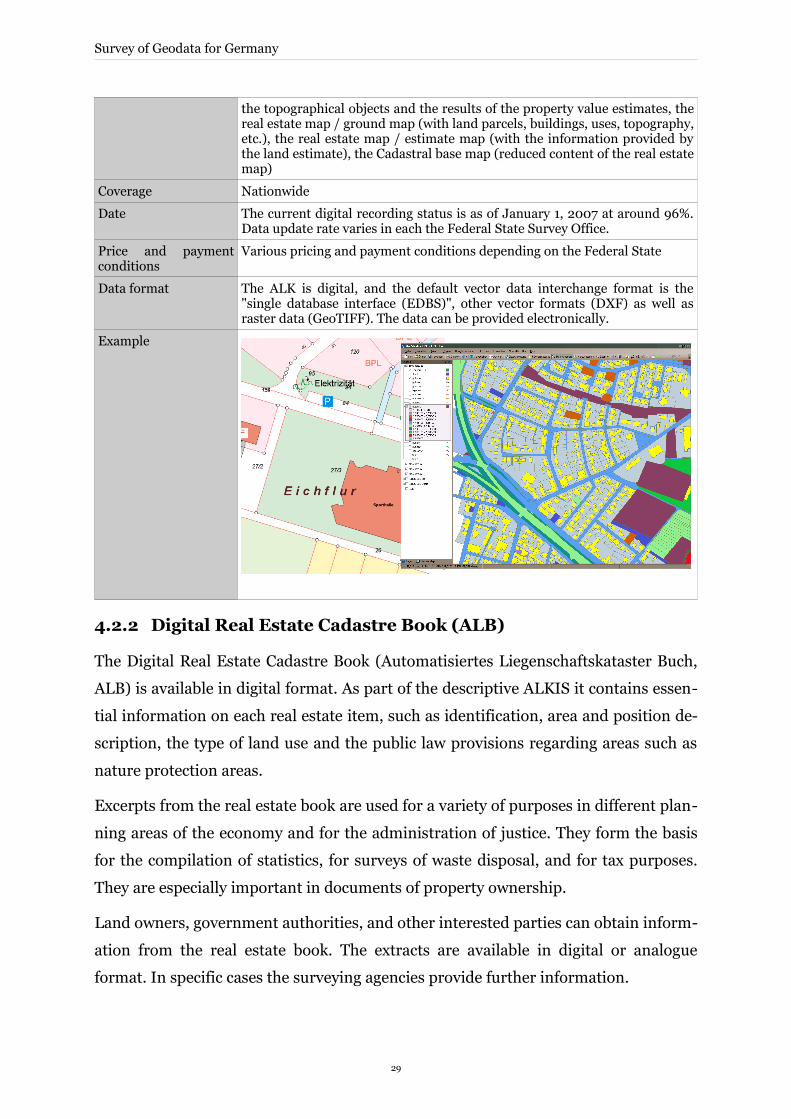
4.2.1 Digital Real Estate Cadastre Map (ALK)
The Digital Real Estate Cadastre Map (Automatisierte Liegenschaftskataster Karte,
ALK) is one part of the ALKIS and describes and covers the property and real estate
in Germany in the form of a map. The real estate map was originally created in ana-
logue form. The digital ALK has in most cases already replaced the analogue property
maps.
Digital Real Estate Cadastre Map (ALK)
Content The ALK dataset contains the location and geometry of the real estate (par-cels of land and buildings). The ALK offers scale-independent ground plan data in analogue or digital form covering the entire surface area of Germany. The individual datasets are the individual parcels of land and their borders, the buildings, the type of land-use and its borders, and in some federal states,
28
Survey of Geodata for Germany
the topographical objects and the results of the property value estimates, the real estate map / ground map (with land parcels, buildings, uses, topography, etc.), the real estate map / estimate map (with the information provided by the land estimate), the Cadastral base map (reduced content of the real estate map)
Coverage Nationwide
Date The current digital recording status is as of January 1, 2007 at around 96%. Data update rate varies in each the Federal State Survey Office.
Price and payment conditions
Various pricing and payment conditions depending on the Federal State
Data format The ALK is digital, and the default vector data interchange format is the "single database interface (EDBS)", other vector formats (DXF) as well as raster data (GeoTIFF). The data can be provided electronically.
Example
4.2.2 Digital Real Estate Cadastre Book (ALB)
The Digital Real Estate Cadastre Book (Automatisiertes Liegenschaftskataster Buch,
ALB) is available in digital format. As part of the descriptive ALKIS it contains essen-
tial information on each real estate item, such as identification, area and position de-
scription, the type of land use and the public law provisions regarding areas such as
nature protection areas.
Excerpts from the real estate book are used for a variety of purposes in different plan-
ning areas of the economy and for the administration of justice. They form the basis
for the compilation of statistics, for surveys of waste disposal, and for tax purposes.
They are especially important in documents of property ownership.
Land owners, government authorities, and other interested parties can obtain inform-
ation from the real estate book. The extracts are available in digital or analogue
format. In specific cases the surveying agencies provide further information.
29
Survey of Geodata for Germany
Digital Real Estate Cadastre Map (ALB)
Content The data of the ALB describes the location and geometry of the real estate (land parcels and buildings), which uses the distinctive topography and pub-lic legal definitions (classification of roads for road law, the water surface of the water law and land for re-routing, renovation, or reparcelling). The ALK offers scale-independent ground plan data in analogue or digital form cover-ing the entire surface area of Germany. The digital real estate cadastre book contains information on:the real estate map with land parcels, buildings, uses, topography, etc.the real estate map with the information provided by the property estimatecadastral base map (reduced content of the real estate map / ground map at the scale 1: 5000, especially without land parcel unit numbers) all ground items such as ground unit mark, area, location names and history,the results of the property estimatethe public law provisions on the base areasthe owners of the land within the land corridor or the holders of rights to the same
Coverage Nationwide
Date The current digital recording status is as of January 1, 2007 at around 96%. Data updating rate depends on the Federal State Survey Offices
Price Various pricing and payment conditions depending on the federal state
Data format The ALB is digital, and the default vector data interchange format is the "single database interface (EDBS)", other vector formats (DXF) as well as raster data (GeoTIFF). The data can be provided electronically.
In general, the data from the ALB is to be used in conjunction with the digital ALK.
4.3 Specialized Geodata
Specialized Geodata are in most cases based on official Geobasedata. They often are
derived from spatial data of an area of expertise, such as demography, epidemiology,
soil science, climatology, electoral statistics. Common applications for specialized
Geodata are administrative surveys and research in environmental, statistical re-
search or planning fields.
4.3.1 Geographic Names
The Geographic Names (Geographische Namen) database lists the names of urban,
rural communities and community parts, administrative units, landscapes, moun-
tains, islands, mountains, rivers, canals, lakes, seas and data with similar attributes.
Geographic Names
Content The geographical names dataset GN250 covers about 61,000 entries. The data set GN1000 is an extract of the GN250 and covers about 13,000 entries.
Scales available Geographic Names (GN250) 1: 250,000 and GN1000 (1:1,000,000)
Coverage Nationwide
Distribution BKG
Data format ASCII
30
Survey of Geodata for Germany
Example
4.3.2 Administrative Boundaries
The Administrative Boundaries (Verwaltungsgrenzen) datasets include all adminis-
trative units of all hierarchical administration levels as polygon data.
Administrative Boundaries
Content According to product definition of the AdV, the dataset from the national state level to the districts VG250, and from state level to the lowest adminis-trative level (municipalities). This includes their borders, statistical key fig-ures, the name of the administrative unit and the specific name of the admin-istrative level in the respective region. The geometry of the borders, in terms of accuracy and resolution is based on the DLM250.
Coverage Nationwide
Scales available Administrative boundaries VG250 (1: 250,000 ) and VG1000 (1:1,000,000)
Source Initial production: analogue and digital output data from the National Survey facilities.Acquisition scale depends on the federal state: 1: 5,000 to 1: 200,000
Distribution Federal State Survey Offices
Price and payment conditions
Price for the complete data set: 300.00 EUR (when using the data on 1 DV workstation (single-user license)). Multi-seat licenses includes charges with the following factors: 1.5 by 2 to 5 licenses, 2.0 at 6 to 20 licenses, 2.5 in 21 - 50 licenses 3.0 at 51 - 100 licenses, 3.5 at 101 - 150 licenses, 4.0 at 151 - 200 licenses.
Data format Vector data
Accuracy 2 meters, with the highest accuracy of all objects at about 100 meters.
31
Survey of Geodata for Germany
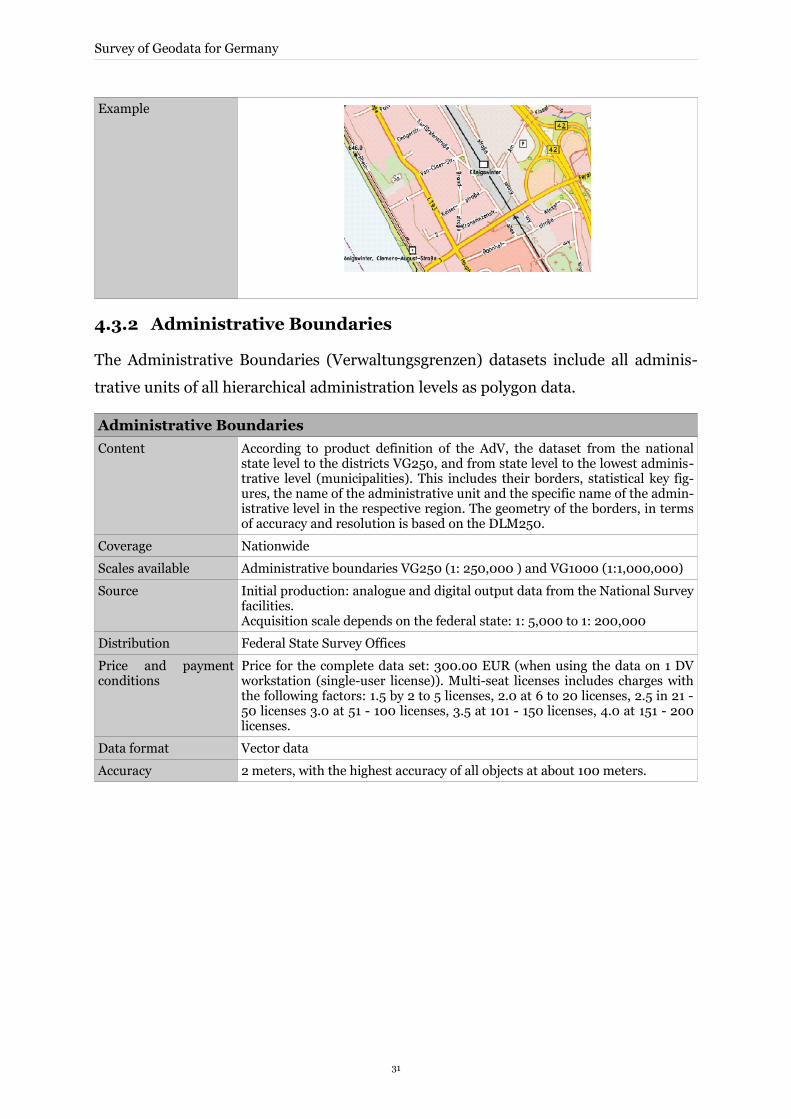
Example
Administrative territ-orial boundaries in Baden-Württemberg 1111 municipalities 35 Rural counties 9 Urban counties 12 Regions 4 Regions/districts 1 Federal district
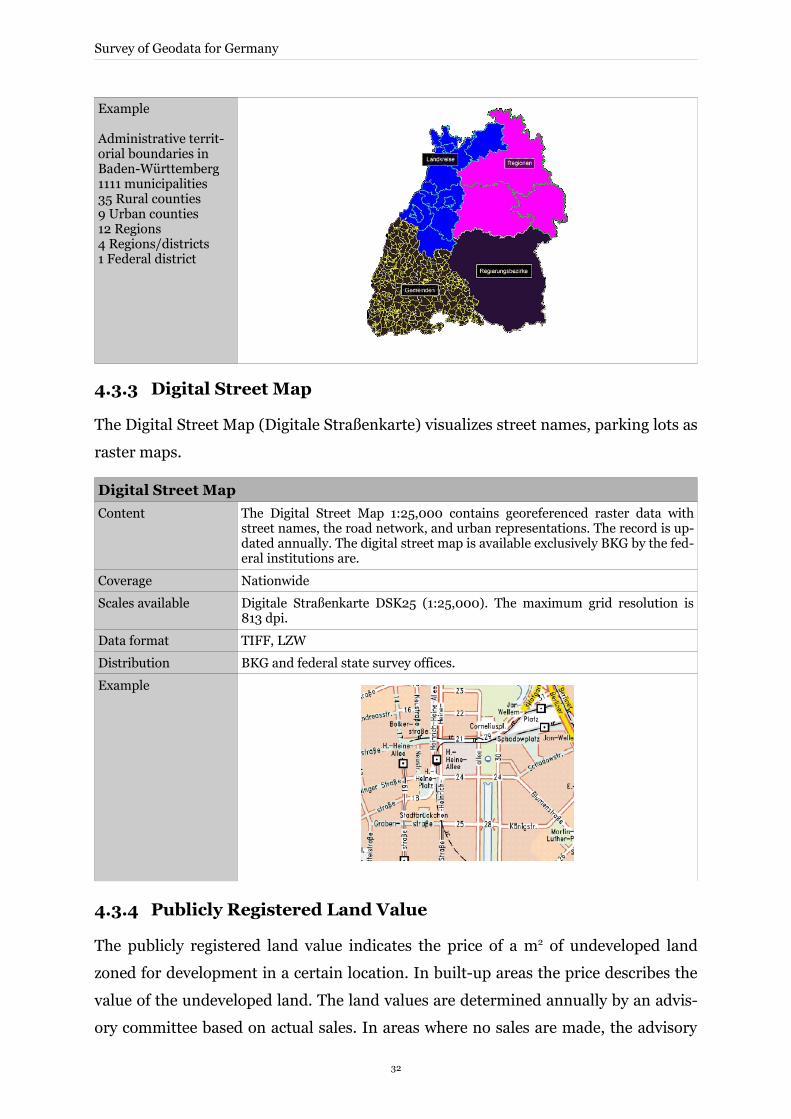
4.3.3 Digital Street Map
The Digital Street Map (Digitale Straßenkarte) visualizes street names, parking lots as
raster maps.
Digital Street Map
Content The Digital Street Map 1:25,000 contains georeferenced raster data with street names, the road network, and urban representations. The record is up-dated annually. The digital street map is available exclusively BKG by the fed-eral institutions are.
Coverage Nationwide
Scales available Digitale Straßenkarte DSK25 (1:25,000). The maximum grid resolution is 813 dpi.
Data format TIFF, LZW
Distribution BKG and federal state survey offices.
Example
4.3.4 Publicly Registered Land Value
The publicly registered land value indicates the price of a m2 of undeveloped land
zoned for development in a certain location. In built-up areas the price describes the
value of the undeveloped land. The land values are determined annually by an advis-
ory committee based on actual sales. In areas where no sales are made, the advisory
32
Survey of Geodata for Germany
committee compares similar areas.
Publicly Registered Land Value
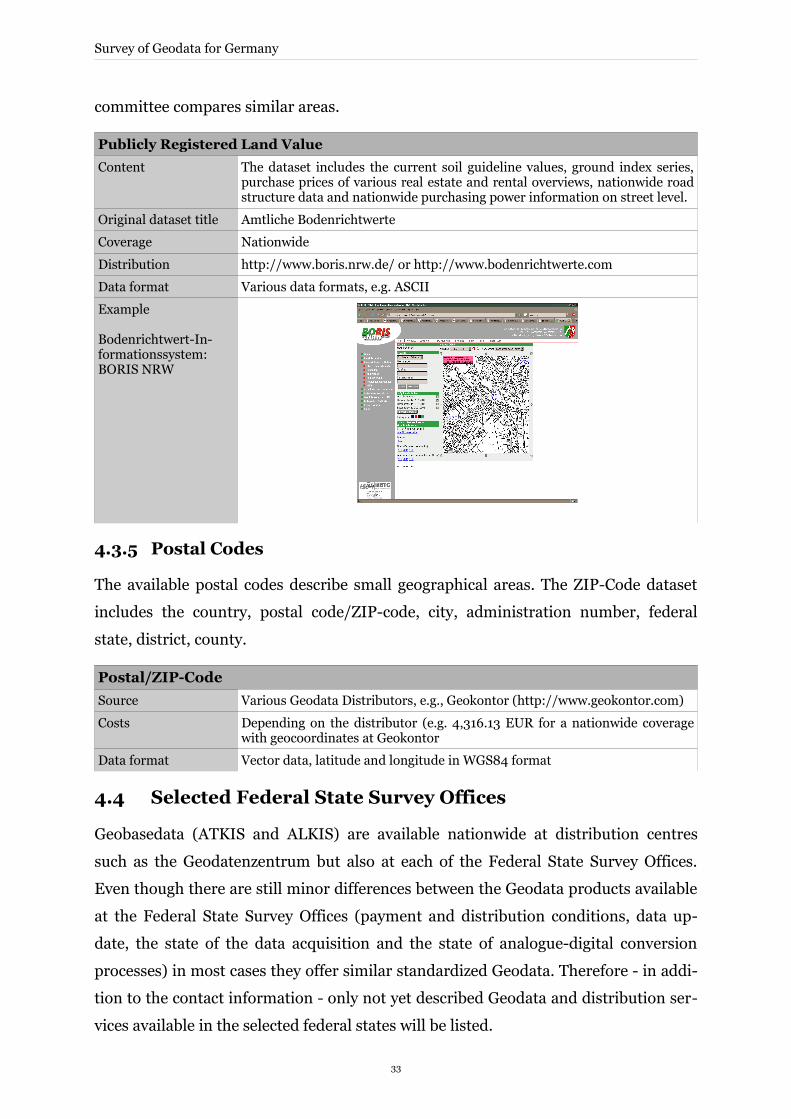
Content The dataset includes the current soil guideline values, ground index series, purchase prices of various real estate and rental overviews, nationwide road structure data and nationwide purchasing power information on street level.
Original dataset title Amtliche Bodenrichtwerte
Coverage Nationwide
Distribution http://www.boris.nrw.de/ or http://www.bodenrichtwerte.com
Data format Various data formats, e.g. ASCII
Example
Bodenrichtwert-In-formationssystem: BORIS NRW
4.3.5 Postal Codes
The available postal codes describe small geographical areas. The ZIP-Code dataset
includes the country, postal code/ZIP-code, city, administration number, federal
state, district, county.
Postal/ZIP-Code
Source Various Geodata Distributors, e.g., Geokontor (http://www.geokontor.com)
Costs Depending on the distributor (e.g. 4,316.13 EUR for a nationwide coverage with geocoordinates at Geokontor
Data format Vector data, latitude and longitude in WGS84 format
4.4 Selected Federal State Survey Offices
Geobasedata (ATKIS and ALKIS) are available nationwide at distribution centres
such as the Geodatenzentrum but also at each of the Federal State Survey Offices.
Even though there are still minor differences between the Geodata products available
at the Federal State Survey Offices (payment and distribution conditions, data up-
date, the state of the data acquisition and the state of analogue-digital conversion
processes) in most cases they offer similar standardized Geodata. Therefore - in addi-
tion to the contact information - only not yet described Geodata and distribution ser-
vices available in the selected federal states will be listed.
33
Survey of Geodata for Germany
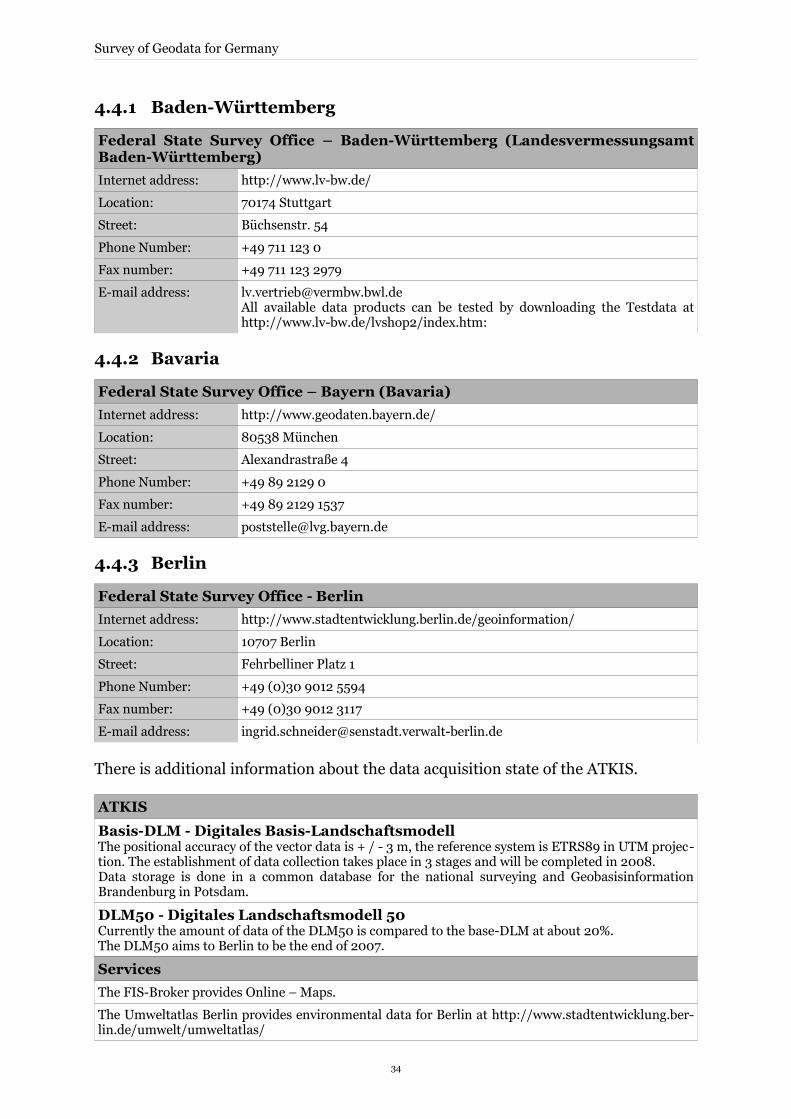
4.4.1 Baden-Württemberg
Federal State Survey Office – Baden-Württemberg (Landesvermessungsamt Baden-Württemberg)
Internet address: http://www.lv-bw.de/
Location: 70174 Stuttgart
Street: Büchsenstr. 54
Phone Number: +49 711 123 0
Fax number: +49 711 123 2979
E-mail address: [email protected] available data products can be tested by downloading the Testdata at http://www.lv-bw.de/lvshop2/index.htm:
4.4.2 Bavaria
Federal State Survey Office – Bayern (Bavaria)
Internet address: http://www.geodaten.bayern.de/
Location: 80538 München
Street: Alexandrastraße 4
Phone Number: +49 89 2129 0
Fax number: +49 89 2129 1537
E-mail address: [email protected]
4.4.3 Berlin
Federal State Survey Office - Berlin
Internet address: http://www.stadtentwicklung.berlin.de/geoinformation/
Location: 10707 Berlin
Street: Fehrbelliner Platz 1
Phone Number: +49 (0)30 9012 5594
Fax number: +49 (0)30 9012 3117
E-mail address: [email protected]
There is additional information about the data acquisition state of the ATKIS.
ATKIS
Basis-DLM - Digitales Basis-LandschaftsmodellThe positional accuracy of the vector data is + / - 3 m, the reference system is ETRS89 in UTM projec-tion. The establishment of data collection takes place in 3 stages and will be completed in 2008.Data storage is done in a common database for the national surveying and Geobasisinformation Brandenburg in Potsdam.
DLM50 - Digitales Landschaftsmodell 50 Currently the amount of data of the DLM50 is compared to the base-DLM at about 20%.The DLM50 aims to Berlin to be the end of 2007.
Services
The FIS-Broker provides Online – Maps.
The Umweltatlas Berlin provides environmental data for Berlin at http://www.stadtentwicklung.ber-lin.de/umwelt/umweltatlas/
34
Survey of Geodata for Germany
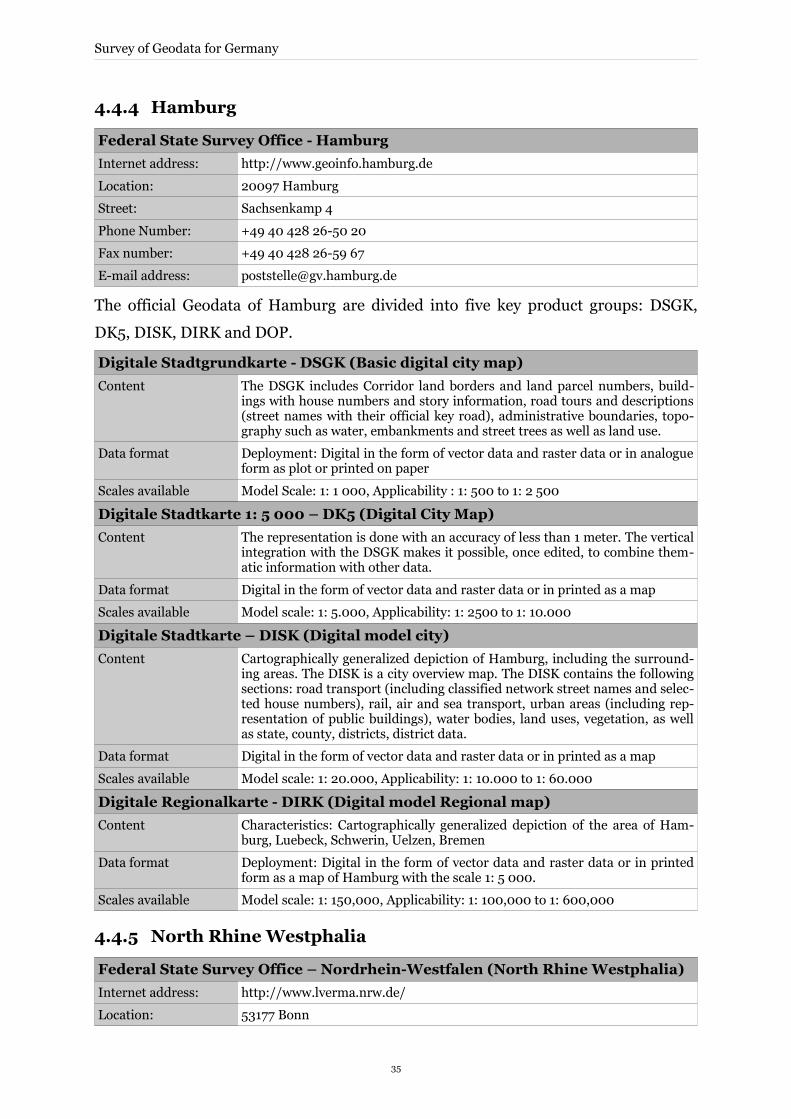
4.4.4 Hamburg
Federal State Survey Office - Hamburg
Internet address: http://www.geoinfo.hamburg.de
Location: 20097 Hamburg
Street: Sachsenkamp 4
Phone Number: +49 40 428 26-50 20
Fax number: +49 40 428 26-59 67
E-mail address: [email protected]
The official Geodata of Hamburg are divided into five key product groups: DSGK,
DK5, DISK, DIRK and DOP.
Digitale Stadtgrundkarte - DSGK (Basic digital city map)
Content The DSGK includes Corridor land borders and land parcel numbers, build-ings with house numbers and story information, road tours and descriptions (street names with their official key road), administrative boundaries, topo-graphy such as water, embankments and street trees as well as land use.
Data format Deployment: Digital in the form of vector data and raster data or in analogue form as plot or printed on paper
Scales available Model Scale: 1: 1 000, Applicability : 1: 500 to 1: 2 500
Digitale Stadtkarte 1: 5 000 – DK5 (Digital City Map)
Content The representation is done with an accuracy of less than 1 meter. The vertical integration with the DSGK makes it possible, once edited, to combine them-atic information with other data.
Data format Digital in the form of vector data and raster data or in printed as a map
Scales available Model scale: 1: 5.000, Applicability: 1: 2500 to 1: 10.000
Digitale Stadtkarte – DISK (Digital model city)
Content Cartographically generalized depiction of Hamburg, including the surround-ing areas. The DISK is a city overview map. The DISK contains the following sections: road transport (including classified network street names and selec-ted house numbers), rail, air and sea transport, urban areas (including rep-resentation of public buildings), water bodies, land uses, vegetation, as well as state, county, districts, district data.
Data format Digital in the form of vector data and raster data or in printed as a map
Scales available Model scale: 1: 20.000, Applicability: 1: 10.000 to 1: 60.000
Digitale Regionalkarte - DIRK (Digital model Regional map)
Content Characteristics: Cartographically generalized depiction of the area of Ham-burg, Luebeck, Schwerin, Uelzen, Bremen
Data format Deployment: Digital in the form of vector data and raster data or in printed form as a map of Hamburg with the scale 1: 5 000.
Scales available Model scale: 1: 150,000, Applicability: 1: 100,000 to 1: 600,000
4.4.5 North Rhine Westphalia
Federal State Survey Office – Nordrhein-Westfalen (North Rhine Westphalia)
Internet address: http://www.lverma.nrw.de/
Location: 53177 Bonn
35

Survey of Geodata for Germany
Street: Muffendorfer Str. 19-21
Phone Number: 0228-846-4646
Fax number: 0228-846-4648
E-mail address: [email protected]
36
Survey of Geodata for Germany
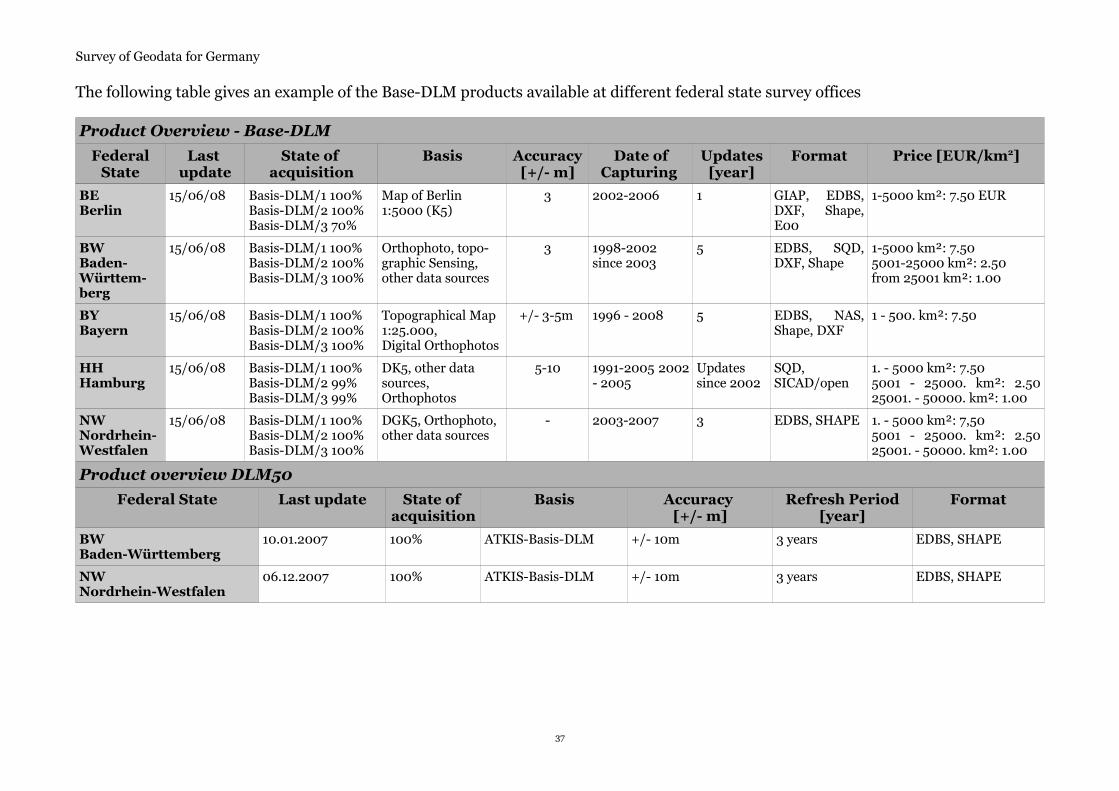
The following table gives an example of the Base-DLM products available at different federal state survey offices
Product Overview - Base-DLM
Federal State
Last update
State of acquisition
Basis Accuracy [+/- m]
Date of Capturing
Updates [year]
Format Price [EUR/km2]
BEBerlin
15/06/08 Basis-DLM/1 100%Basis-DLM/2 100%Basis-DLM/3 70%
Map of Berlin 1:5000 (K5)
3 2002-2006 1 GIAP, EDBS, DXF, Shape, E00
1-5000 km²: 7.50 EUR
BWBaden-Württem-berg
15/06/08 Basis-DLM/1 100%Basis-DLM/2 100%Basis-DLM/3 100%
Orthophoto, topo-graphic Sensing, other data sources
3 1998-2002since 2003
5 EDBS, SQD, DXF, Shape
1-5000 km²: 7.505001-25000 km²: 2.50 from 25001 km²: 1.00
BYBayern
15/06/08 Basis-DLM/1 100%Basis-DLM/2 100%Basis-DLM/3 100%
Topographical Map 1:25.000,Digital Orthophotos
+/- 3-5m 1996 - 2008 5 EDBS, NAS, Shape, DXF
1 - 500. km²: 7.50
HHHamburg
15/06/08 Basis-DLM/1 100%Basis-DLM/2 99%Basis-DLM/3 99%
DK5, other data sources, Orthophotos
5-10 1991-2005 2002 - 2005
Updates since 2002
SQD, SICAD/open
1. - 5000 km²: 7.50 5001 - 25000. km²: 2.50 25001. - 50000. km²: 1.00
NWNordrhein-Westfalen
15/06/08 Basis-DLM/1 100%Basis-DLM/2 100%Basis-DLM/3 100%
DGK5, Orthophoto, other data sources
- 2003-2007 3 EDBS, SHAPE 1. - 5000 km²: 7,50 5001 - 25000. km²: 2.50 25001. - 50000. km²: 1.00
Product overview DLM50
Federal State Last update State of acquisition
Basis Accuracy [+/- m]
Refresh Period [year]
Format
BWBaden-Württemberg
10.01.2007 100% ATKIS-Basis-DLM +/- 10m 3 years EDBS, SHAPE
NWNordrhein-Westfalen
06.12.2007 100% ATKIS-Basis-DLM +/- 10m 3 years EDBS, SHAPE
37
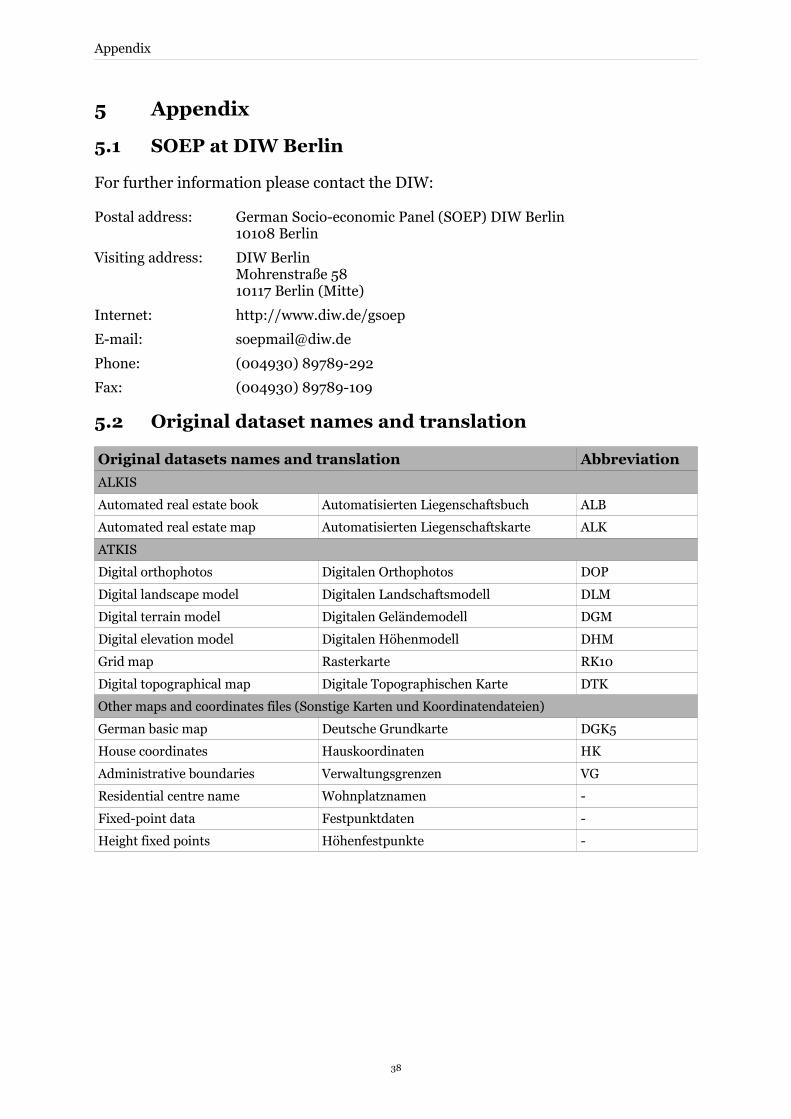
Appendix
5 Appendix
5.1 SOEP at DIW Berlin
For further information please contact the DIW:
Postal address: German Socio-economic Panel (SOEP) DIW Berlin10108 Berlin
Visiting address: DIW Berlin Mohrenstraße 58 10117 Berlin (Mitte)
Internet: http://www.diw.de/gsoep
E-mail: [email protected]
Phone: (004930) 89789-292
Fax: (004930) 89789-109
5.2 Original dataset names and translation
Original datasets names and translation Abbreviation
ALKIS
Automated real estate book Automatisierten Liegenschaftsbuch ALB
Automated real estate map Automatisierten Liegenschaftskarte ALK
ATKIS
Digital orthophotos Digitalen Orthophotos DOP
Digital landscape model Digitalen Landschaftsmodell DLM
Digital terrain model Digitalen Geländemodell DGM
Digital elevation model Digitalen Höhenmodell DHM
Grid map Rasterkarte RK10
Digital topographical map Digitale Topographischen Karte DTK
Other maps and coordinates files (Sonstige Karten und Koordinatendateien)
German basic map Deutsche Grundkarte DGK5
House coordinates Hauskoordinaten HK
Administrative boundaries Verwaltungsgrenzen VG
Residential centre name Wohnplatznamen -
Fixed-point data Festpunktdaten -
Height fixed points Höhenfestpunkte -
38
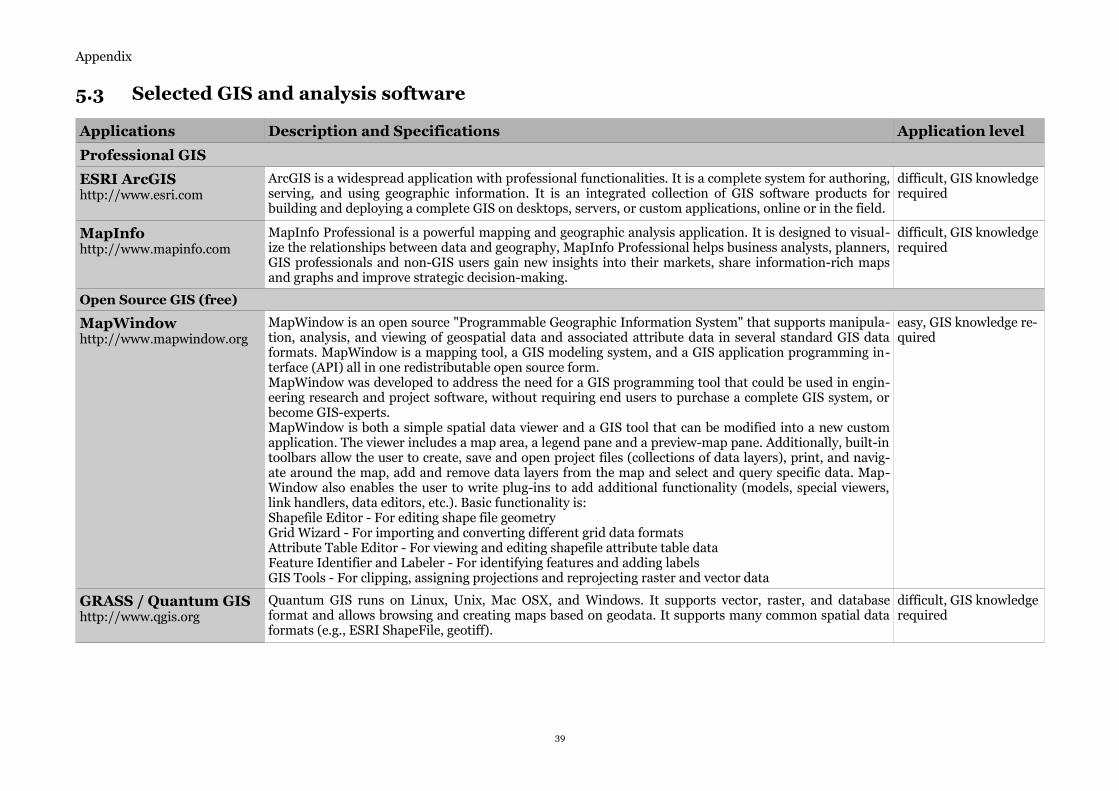
Appendix
5.3 Selected GIS and analysis software
Applications Description and Specifications Application level
Professional GIS
ESRI ArcGIShttp://www.esri.com
ArcGIS is a widespread application with professional functionalities. It is a complete system for authoring, serving, and using geographic information. It is an integrated collection of GIS software products for building and deploying a complete GIS on desktops, servers, or custom applications, online or in the field.
difficult, GIS knowledge required
MapInfohttp://www.mapinfo.com
MapInfo Professional is a powerful mapping and geographic analysis application. It is designed to visual-ize the relationships between data and geography, MapInfo Professional helps business analysts, planners, GIS professionals and non-GIS users gain new insights into their markets, share information-rich maps and graphs and improve strategic decision-making.
difficult, GIS knowledge required
Open Source GIS (free)
MapWindowhttp://www.mapwindow.org
MapWindow is an open source "Programmable Geographic Information System" that supports manipula-tion, analysis, and viewing of geospatial data and associated attribute data in several standard GIS data formats. MapWindow is a mapping tool, a GIS modeling system, and a GIS application programming in-terface (API) all in one redistributable open source form. MapWindow was developed to address the need for a GIS programming tool that could be used in engin-eering research and project software, without requiring end users to purchase a complete GIS system, or become GIS-experts.MapWindow is both a simple spatial data viewer and a GIS tool that can be modified into a new custom application. The viewer includes a map area, a legend pane and a preview-map pane. Additionally, built-in toolbars allow the user to create, save and open project files (collections of data layers), print, and navig-ate around the map, add and remove data layers from the map and select and query specific data. Map-Window also enables the user to write plug-ins to add additional functionality (models, special viewers, link handlers, data editors, etc.). Basic functionality is:Shapefile Editor - For editing shape file geometryGrid Wizard - For importing and converting different grid data formatsAttribute Table Editor - For viewing and editing shapefile attribute table dataFeature Identifier and Labeler - For identifying features and adding labelsGIS Tools - For clipping, assigning projections and reprojecting raster and vector data
easy, GIS knowledge re-quired
GRASS / Quantum GIShttp://www.qgis.org
Quantum GIS runs on Linux, Unix, Mac OSX, and Windows. It supports vector, raster, and database format and allows browsing and creating maps based on geodata. It supports many common spatial data formats (e.g., ESRI ShapeFile, geotiff).
difficult, GIS knowledge required
39
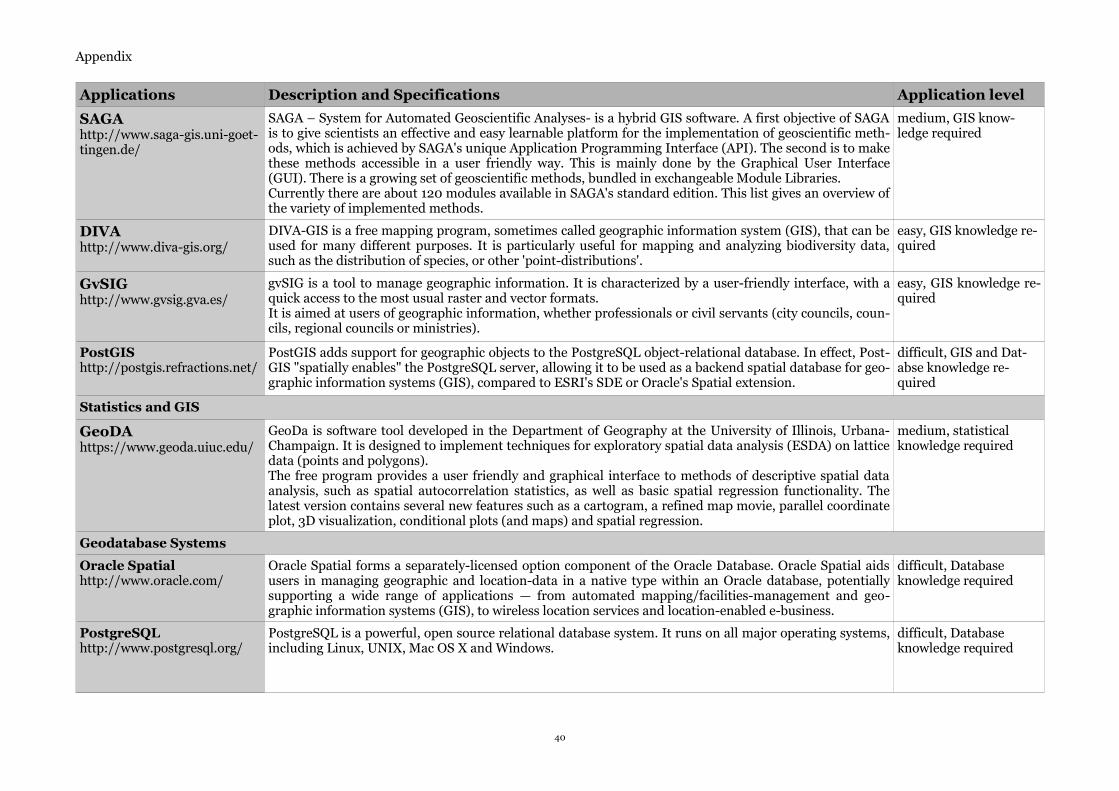
Appendix
Applications Description and Specifications Application level
SAGAhttp://www.saga-gis.uni-goet-tingen.de/
SAGA – System for Automated Geoscientific Analyses- is a hybrid GIS software. A first objective of SAGA is to give scientists an effective and easy learnable platform for the implementation of geoscientific meth-ods, which is achieved by SAGA's unique Application Programming Interface (API). The second is to make these methods accessible in a user friendly way. This is mainly done by the Graphical User Interface (GUI). There is a growing set of geoscientific methods, bundled in exchangeable Module Libraries.Currently there are about 120 modules available in SAGA's standard edition. This list gives an overview of the variety of implemented methods.
medium, GIS know-ledge required
DIVAhttp://www.diva-gis.org/
DIVA-GIS is a free mapping program, sometimes called geographic information system (GIS), that can be used for many different purposes. It is particularly useful for mapping and analyzing biodiversity data, such as the distribution of species, or other 'point-distributions'.
easy, GIS knowledge re-quired
GvSIGhttp://www.gvsig.gva.es/
gvSIG is a tool to manage geographic information. It is characterized by a user-friendly interface, with a quick access to the most usual raster and vector formats. It is aimed at users of geographic information, whether professionals or civil servants (city councils, coun-cils, regional councils or ministries).
easy, GIS knowledge re-quired
PostGIShttp://postgis.refractions.net/
PostGIS adds support for geographic objects to the PostgreSQL object-relational database. In effect, Post-GIS "spatially enables" the PostgreSQL server, allowing it to be used as a backend spatial database for geo-graphic information systems (GIS), compared to ESRI's SDE or Oracle's Spatial extension.
difficult, GIS and Dat-abse knowledge re-quired
Statistics and GIS
GeoDA https://www.geoda.uiuc.edu/
GeoDa is software tool developed in the Department of Geography at the University of Illinois, Urbana-Champaign. It is designed to implement techniques for exploratory spatial data analysis (ESDA) on lattice data (points and polygons). The free program provides a user friendly and graphical interface to methods of descriptive spatial data analysis, such as spatial autocorrelation statistics, as well as basic spatial regression functionality. The latest version contains several new features such as a cartogram, a refined map movie, parallel coordinate plot, 3D visualization, conditional plots (and maps) and spatial regression.
medium, statistical knowledge required
Geodatabase Systems
Oracle Spatial http://www.oracle.com/
Oracle Spatial forms a separately-licensed option component of the Oracle Database. Oracle Spatial aids users in managing geographic and location-data in a native type within an Oracle database, potentially supporting a wide range of applications — from automated mapping/facilities-management and geo-graphic information systems (GIS), to wireless location services and location-enabled e-business.
difficult, Database knowledge required
PostgreSQLhttp://www.postgresql.org/
PostgreSQL is a powerful, open source relational database system. It runs on all major operating systems, including Linux, UNIX, Mac OS X and Windows.
difficult, Database knowledge required
40
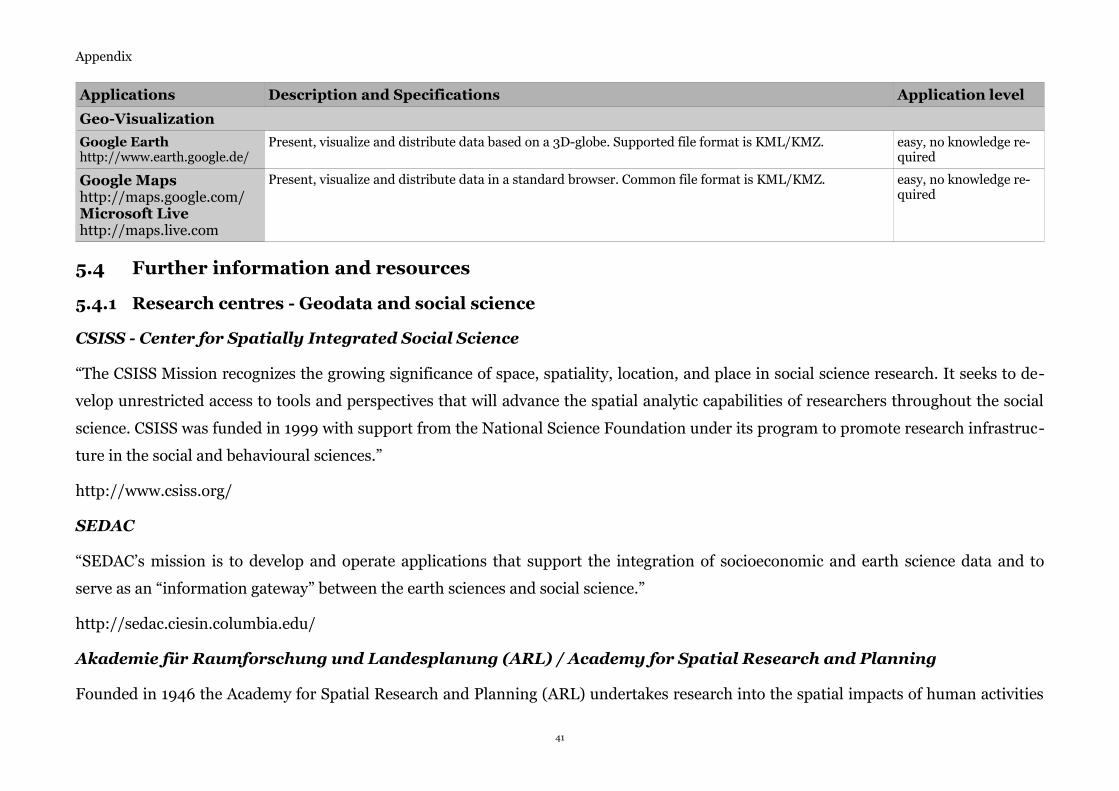
Appendix
Applications Description and Specifications Application level
Geo-Visualization
Google Earthhttp://www.earth.google.de/
Present, visualize and distribute data based on a 3D-globe. Supported file format is KML/KMZ. easy, no knowledge re-quired
Google Mapshttp://maps.google.com/Microsoft Livehttp://maps.live.com
Present, visualize and distribute data in a standard browser. Common file format is KML/KMZ. easy, no knowledge re-quired
5.4 Further information and resources
5.4.1 Research centres - Geodata and social science
CSISS - Center for Spatially Integrated Social Science
“The CSISS Mission recognizes the growing significance of space, spatiality, location, and place in social science research. It seeks to de-
velop unrestricted access to tools and perspectives that will advance the spatial analytic capabilities of researchers throughout the social
science. CSISS was funded in 1999 with support from the National Science Foundation under its program to promote research infrastruc-
ture in the social and behavioural sciences.”
http://www.csiss.org/
SEDAC
“SEDAC’s mission is to develop and operate applications that support the integration of socioeconomic and earth science data and to
serve as an “information gateway” between the earth sciences and social science.”
http://sedac.ciesin.columbia.edu/
Akademie für Raumforschung und Landesplanung (ARL) / Academy for Spatial Research and Planning
Founded in 1946 the Academy for Spatial Research and Planning (ARL) undertakes research into the spatial impacts of human activities
41
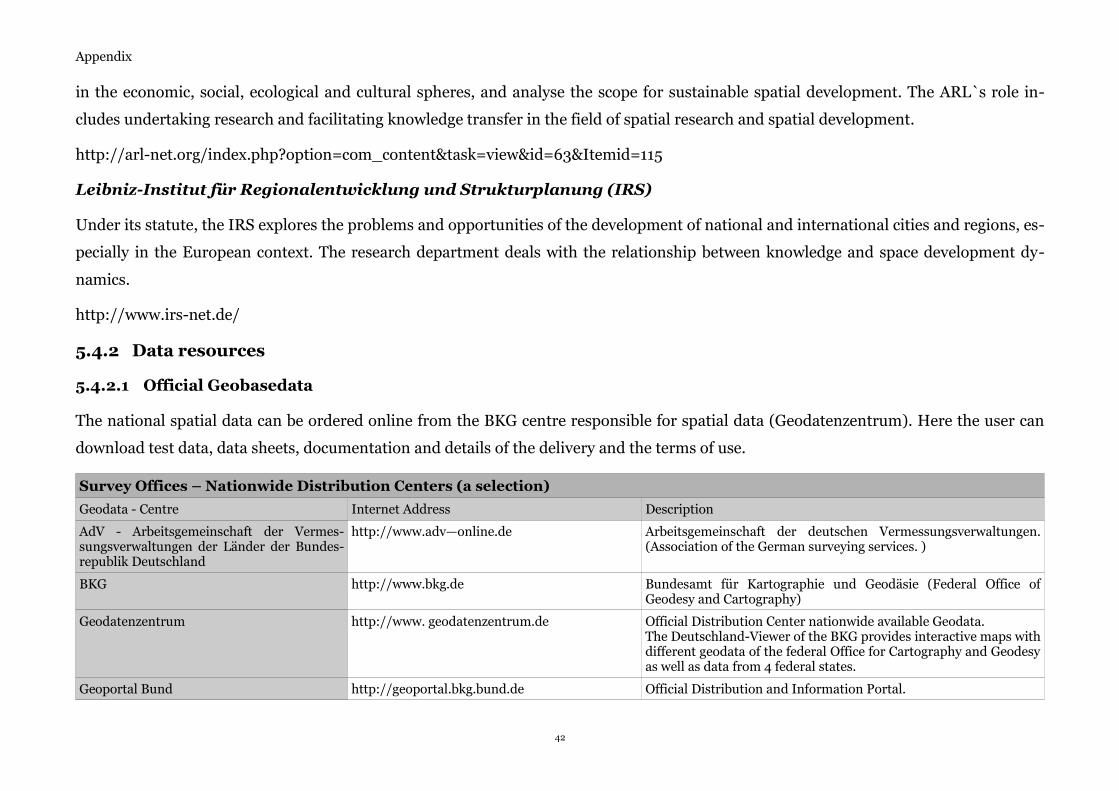
Appendix
in the economic, social, ecological and cultural spheres, and analyse the scope for sustainable spatial development. The ARL`s role in-
cludes undertaking research and facilitating knowledge transfer in the field of spatial research and spatial development.
http://arl-net.org/index.php?option=com_content&task=view&id=63&Itemid=115
Leibniz-Institut für Regionalentwicklung und Strukturplanung (IRS)
Under its statute, the IRS explores the problems and opportunities of the development of national and international cities and regions, es-
pecially in the European context. The research department deals with the relationship between knowledge and space development dy-
namics.
http://www.irs-net.de/
5.4.2 Data resources
5.4.2.1 Official Geobasedata
The national spatial data can be ordered online from the BKG centre responsible for spatial data (Geodatenzentrum). Here the user can
download test data, data sheets, documentation and details of the delivery and the terms of use.
Survey Offices – Nationwide Distribution Centers (a selection)
Geodata - Centre Internet Address Description
AdV - Arbeitsgemeinschaft der Vermes-sungsverwaltungen der Länder der Bundes-republik Deutschland
http://www.adv—online.de Arbeitsgemeinschaft der deutschen Vermessungsverwaltungen. (Association of the German surveying services. )
BKG http://www.bkg.de Bundesamt für Kartographie und Geodäsie (Federal Office of Geodesy and Cartography)
Geodatenzentrum http://www. geodatenzentrum.de Official Distribution Center nationwide available Geodata.The Deutschland-Viewer of the BKG provides interactive maps with different geodata of the federal Office for Cartography and Geodesy as well as data from 4 federal states.
Geoportal Bund http://geoportal.bkg.bund.de Official Distribution and Information Portal.
42
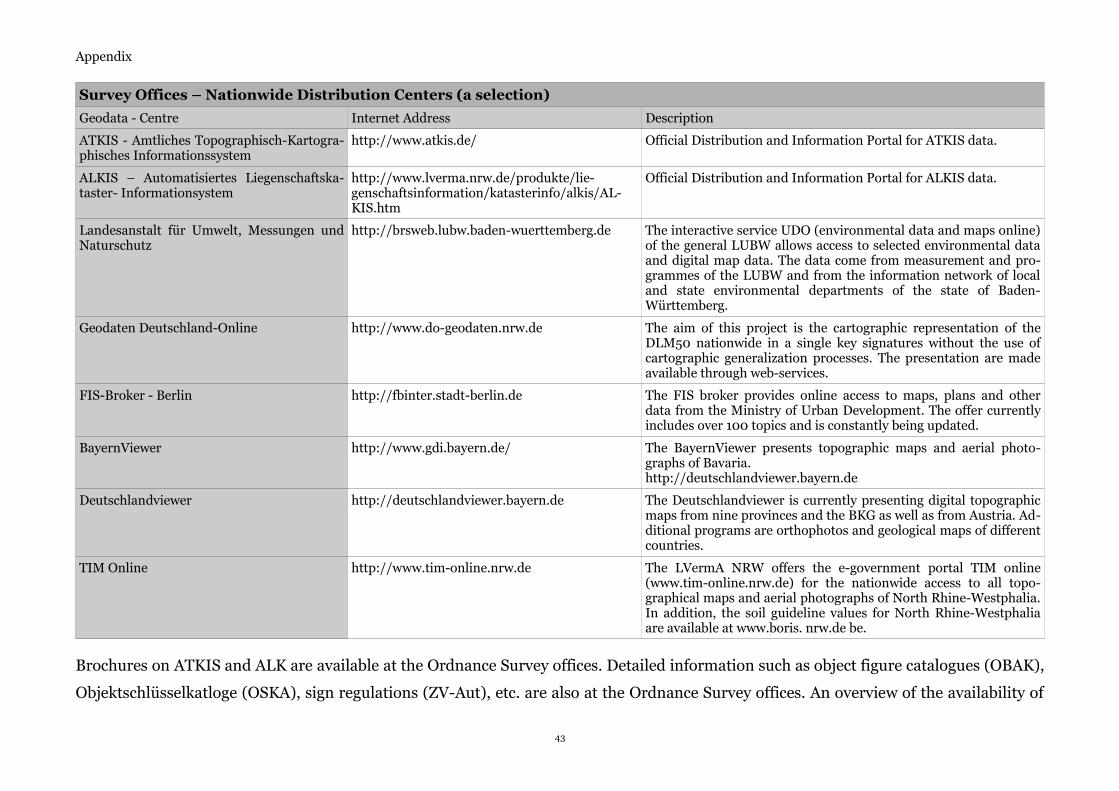
Appendix
Survey Offices – Nationwide Distribution Centers (a selection)
Geodata - Centre Internet Address Description
ATKIS - Amtliches Topographisch-Kartogra-phisches Informationssystem
http://www.atkis.de/ Official Distribution and Information Portal for ATKIS data.
ALKIS – Automatisiertes Liegenschaftska-taster- Informationsystem
http://www.lverma.nrw.de/produkte/lie-genschaftsinformation/katasterinfo/alkis/AL-KIS.htm
Official Distribution and Information Portal for ALKIS data.
Landesanstalt für Umwelt, Messungen und Naturschutz
http://brsweb.lubw.baden-wuerttemberg.de The interactive service UDO (environmental data and maps online) of the general LUBW allows access to selected environmental data and digital map data. The data come from measurement and pro-grammes of the LUBW and from the information network of local and state environmental departments of the state of Baden-Württemberg.
Geodaten Deutschland-Online http://www.do-geodaten.nrw.de The aim of this project is the cartographic representation of the DLM50 nationwide in a single key signatures without the use of cartographic generalization processes. The presentation are made available through web-services.
FIS-Broker - Berlin http://fbinter.stadt-berlin.de The FIS broker provides online access to maps, plans and other data from the Ministry of Urban Development. The offer currently includes over 100 topics and is constantly being updated.
BayernViewer http://www.gdi.bayern.de/ The BayernViewer presents topographic maps and aerial photo-graphs of Bavaria. http://deutschlandviewer.bayern.de
Deutschlandviewer http://deutschlandviewer.bayern.de The Deutschlandviewer is currently presenting digital topographic maps from nine provinces and the BKG as well as from Austria. Ad-ditional programs are orthophotos and geological maps of different countries.
TIM Online http://www.tim-online.nrw.de The LVermA NRW offers the e-government portal TIM online (www.tim-online.nrw.de) for the nationwide access to all topo-graphical maps and aerial photographs of North Rhine-Westphalia. In addition, the soil guideline values for North Rhine-Westphalia are available at www.boris. nrw.de be.
Brochures on ATKIS and ALK are available at the Ordnance Survey offices. Detailed information such as object figure catalogues (OBAK),
Objektschlüsselkatloge (OSKA), sign regulations (ZV-Aut), etc. are also at the Ordnance Survey offices. An overview of the availability of
43
Appendix
geotopographical data and digital data from the real estate map has been published by the AdV (Association of Survey Administrations).
5.4.2.2 Environment (a selection)
Umweltbundesamt
German environmental data is provided by the Umweltbundesamt (German federal environmental agency, UBA). The German Environ-
mental Information Portal (PortalU) is a cooperative project by the federal government and the federal states. It offers access to web
pages and database entries of public institutions and organizations.
http://www.umweltbundesamt.de/; http://www.portalu.de ; http://www.env-it.de/luftdaten
GISU - Geographisches Informationssystem Umwelt
The State Environmental Protection Agency offers with its service GISU an extensive collection of information and spatial information
from the field of environmental monitoring data.
http://gisu.uba.de
Räumliches Informations- und Planungssystem (RIPS) Baden Württemberg
The State Institute of the Environment, Nature Conservation and measurements of Baden-Württemberg (LUBW) provides environmental
data on thematic maps on the map service RIPS interactively on the Internet.
http://rips-uis.lfu.baden-wuerttemberg
5.4.2.3 Statistics (a selection)
Statistic offices of the federal states
Statistical data in Germany is provided by the statistical offices of the federal states (Statistikämter der Bundesländer).
http://www.destatis.de/ ; http://www.destatis.de/onlineatlas
44
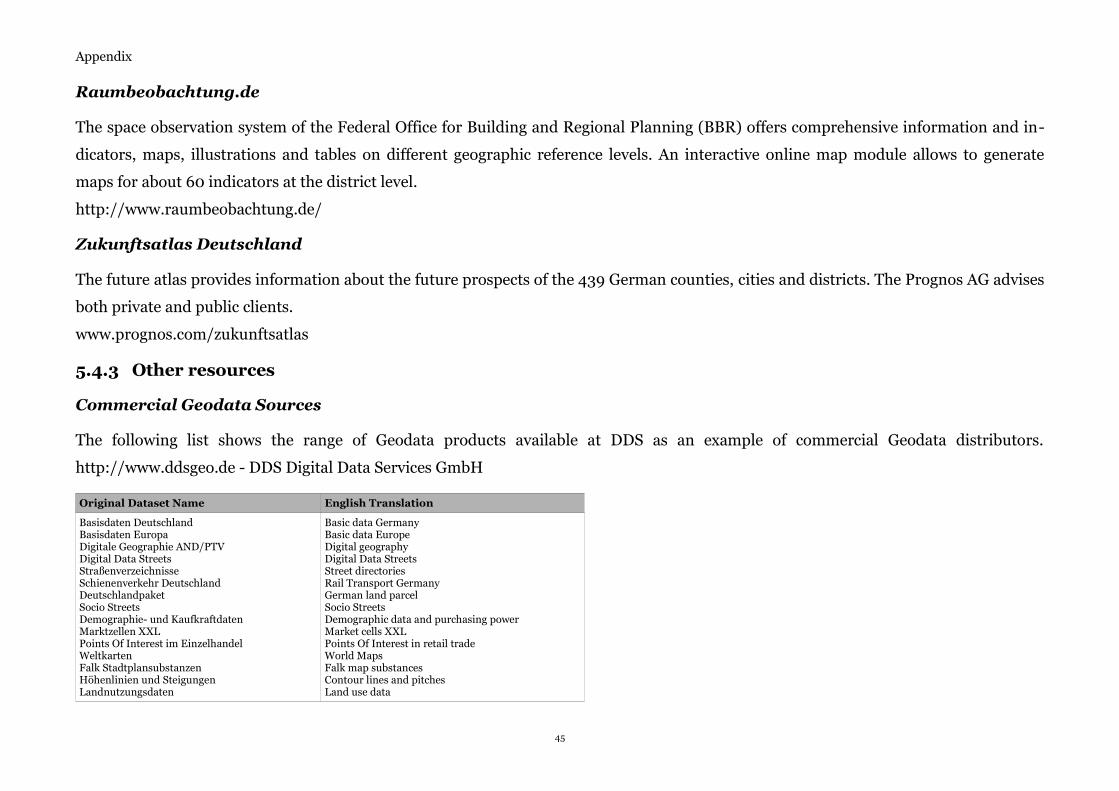
Appendix
Raumbeobachtung.de
The space observation system of the Federal Office for Building and Regional Planning (BBR) offers comprehensive information and in-
dicators, maps, illustrations and tables on different geographic reference levels. An interactive online map module allows to generate
maps for about 60 indicators at the district level.
http://www.raumbeobachtung.de/
Zukunftsatlas Deutschland
The future atlas provides information about the future prospects of the 439 German counties, cities and districts. The Prognos AG advises
both private and public clients.
www.prognos.com/zukunftsatlas
5.4.3 Other resources
Commercial Geodata Sources
The following list shows the range of Geodata products available at DDS as an example of commercial Geodata distributors.
http://www.ddsgeo.de - DDS Digital Data Services GmbH
Original Dataset Name English Translation
Basisdaten DeutschlandBasisdaten EuropaDigitale Geographie AND/PTVDigital Data StreetsStraßenverzeichnisseSchienenverkehr DeutschlandDeutschlandpaketSocio StreetsDemographie- und KaufkraftdatenMarktzellen XXLPoints Of Interest im EinzelhandelWeltkartenFalk StadtplansubstanzenHöhenlinien und SteigungenLandnutzungsdaten
Basic data GermanyBasic data EuropeDigital geographyDigital Data StreetsStreet directoriesRail Transport GermanyGerman land parcelSocio StreetsDemographic data and purchasing powerMarket cells XXLPoints Of Interest in retail tradeWorld MapsFalk map substancesContour lines and pitchesLand use data
45
Appendix
Free Geodata Sources, Testdata
• http://www.freegis.org/• http://opengeodb.de – Free Geodatabase• http://OSGeo.org• http://www.geonames.org - Webservice for geographical names of locations and countries• http://download.geofabrik.de/osm/europe/ - OSM Open Street Map database• http://geodata.gov – U.S. Geodata Center• http://www.census.gov/geo/www/tiger/tigerua/ua_tgr2k.html – U.S. Census TIGER/Line data• http://www.usgs.gov/ - U.S. Geodata Center• http://www.maproom.psu.edu/dcw/ - Digital Chart of the World (DCW), worldwide vector data• http://biogeo.berkeley.edu/gadm/ - Global administrative areas (GADM)
• GADM is a database of the location of the world's administrative areas (boundaries). Administrative areas in this database are countries and lower level subdivisions such as federal states, departments or counties. GADM describes where these administrat-ive areas are (the "spatial features"), and for each area it provides some attributes. The data are in ESRI shapefile and geodatabase format. Shapefiles can be used in, or imported into, most mapping and spatial data analysis programs (GIS).
• http://data.geocomm.com/ - Geodata center• http://opengeodb.hoppe-media.com/ - OpenGeoDB - free database for geocoordinates• http://www.schulweb.de/de/schulsuche/index.html?auswahl_1=5 http://www.berlin.de/sen/bildung/schulverzeichnis_und_por-
traets/anwendung/SchulListe.aspx
Metadata catalogues, Geodata-Search and Online Maps
• http://geolocationdb.myemotions.ch – Free Geodata Webservice• http://geodata.grid.unep.ch - UNEP's GEO Data Portal• http://www.geocatalogue.de - GEOcatalogue des Center for Geoinformation• http://www.geometa.info – Searchengine for geo-services , geodata and online-maps• http://gis-news.de - Geodata, Testdata, Survey of data distributors
Online GIS tutorials
• http://www.colorado.edu/geography/gcraft/notes/notes.html• http://www.geoinformatik.uni-rostock.de/default.asp• http://biogeo.berkeley.edu/gis/courses.html
46