
Development of mRNA patterns for screening of anabolic ... fileTECHNISCHE UNIVERSITÄT MÜNCHEN...
113
TECHNISCHE UNIVERSITÄT MÜNCHEN Lehrstuhl für Physiologie Development of mRNA patterns for screening of anabolic steroids in bovine and primate tissues Irmgard Riedmaier Vollständiger Abdruck der von der Fakultät Wissenschaftszentrum Weihenstephan für Ernährung, Landnutzung und Umwelt der Technischen Universität München zur Erlangung des akademischen Grades eines Doktors der Naturwissenschaften genehmigten Dissertation. Vorsitzender: Univ.-Prof. Dr. M. Klingenspor Prüfer der Dissertation: 1. Univ.-Prof. Dr. H. H. D. Meyer 2. Univ.-Prof. Dr. Dr. h. c. J. Bauer 3. Priv.-Doz. Dr. M. W. Pfaffl Die Dissertation wurde am 16. 03. 2009 bei der Technischen Universität München eingereicht und durch die Fakultät Wissenschaftszentrum Weihenstephan für Ernährung, Landnutzung und Umwelt am 23. 07. 2009 angenommen.
-
Upload
truongduong -
Category
Documents
-
view
222 -
download
0
Transcript of Development of mRNA patterns for screening of anabolic ... fileTECHNISCHE UNIVERSITÄT MÜNCHEN...
TECHNISCHE UNIVERSITÄT MÜNCHEN
Lehrstuhl für Physiologie
Development of mRNA patterns for screening of anabolic steroids in
bovine and primate tissues
Irmgard Riedmaier
Vollständiger Abdruck der von der Fakultät Wissenschaftszentrum Weihenstephan
für Ernährung, Landnutzung und Umwelt der Technischen Universität München
zur Erlangung des akademischen Grades eines
Doktors der Naturwissenschaften
genehmigten Dissertation.
Vorsitzender: Univ.-Prof. Dr. M. Klingenspor
Prüfer der Dissertation: 1. Univ.-Prof. Dr. H. H. D. Meyer
2. Univ.-Prof. Dr. Dr. h. c. J. Bauer
3. Priv.-Doz. Dr. M. W. Pfaffl
Die Dissertation wurde am 16. 03. 2009 bei der Technischen Universität München
eingereicht und durch die Fakultät Wissenschaftszentrum Weihenstephan für
Ernährung, Landnutzung und Umwelt am 23. 07. 2009 angenommen.

Contents
i
Table of Contents
Abbreviations........................................................................................................... ii
Zusammenfassung................................................................................................. iv
Abstract .................................................................................................................. vi
1 Introduction................................................................................................ 1
1.1 Anabolic Steroid Hormones – use and misuse in animal husbandry.............. 1
1.2 Steroid Hormones in Hormone Replacement Therapy................................... 1
1.3 Potential of transcriptomics for biomarker development to trace anabolic
steroid hormone functions ............................................................................. 2
1.4 Aims .............................................................................................................. 4
2 Materials and Methods .............................................................................. 5
2.1 Animal Experiments....................................................................................... 5
2.2 RNA Extraction and Quality Determination .................................................... 8
2.3 Selection of Target Genes ............................................................................. 9
2.4 Specific Primer Design .................................................................................13
2.5 Two-Step RT-qPCR Analysis........................................................................13
2.6 One-Step RT-qPCR Analysis........................................................................14
2.7 Data Analysis and Statistics..........................................................................15
3 Results and Discussion ...........................................................................17
3.1 Anabolics study on Nguni Cattle ...................................................................17
3.2 Pour on anabolics study in veal calves .........................................................25
3.3 SARM Study on Macaca fascicularis ............................................................29
4 Conclusions and Perspectives................................................................34
5 References ................................................................................................37
Acknowledgements ...............................................................................................46
Scientific Communication ......................................................................................47
Curriculum Vitae....................................................................................................49
Appendix ...............................................................................................................50
Abbreviations
ii
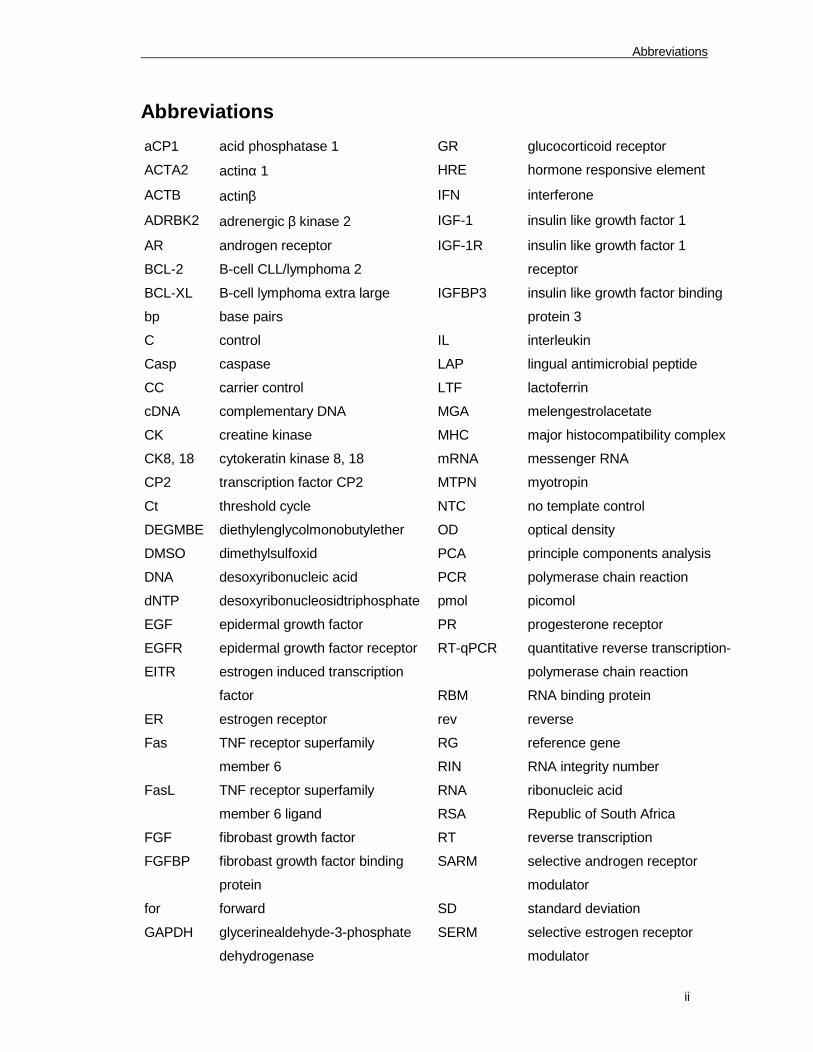
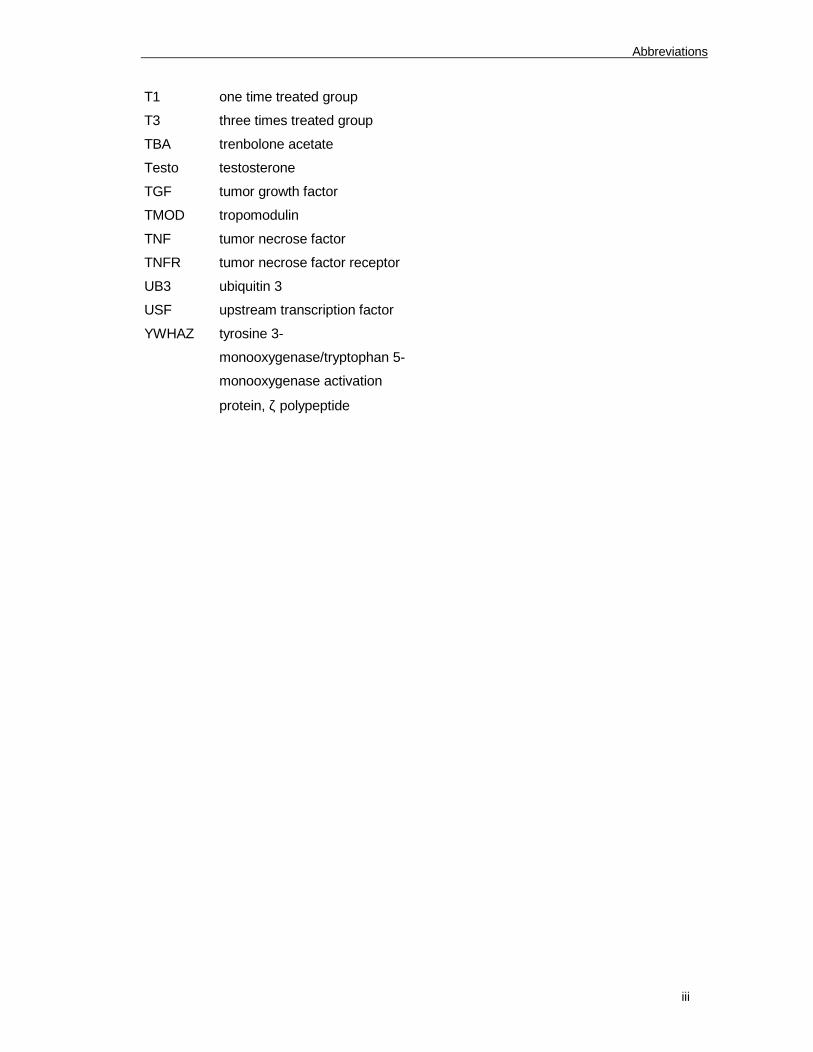
Abbreviations
aCP1 acid phosphatase 1 GR glucocorticoid receptor
ACTA2 actinα 1 HRE hormone responsive element
ACTB actinβ IFN interferone
ADRBK2 adrenergic β kinase 2 IGF-1 insulin like growth factor 1
AR androgen receptor IGF-1R insulin like growth factor 1
BCL-2 B-cell CLL/lymphoma 2 receptor
BCL-XL B-cell lymphoma extra large IGFBP3 insulin like growth factor binding
bp base pairs protein 3
C control IL interleukin
Casp caspase LAP lingual antimicrobial peptide
CC carrier control LTF lactoferrin
cDNA complementary DNA MGA melengestrolacetate
CK creatine kinase MHC major histocompatibility complex
CK8, 18 cytokeratin kinase 8, 18 mRNA messenger RNA
CP2 transcription factor CP2 MTPN myotropin
Ct threshold cycle NTC no template control
DEGMBE diethylenglycolmonobutylether OD optical density
DMSO dimethylsulfoxid PCA principle components analysis
DNA desoxyribonucleic acid PCR polymerase chain reaction
dNTP desoxyribonucleosidtriphosphate pmol picomol
EGF epidermal growth factor PR progesterone receptor
EGFR epidermal growth factor receptor RT-qPCR quantitative reverse transcription-
EITR estrogen induced transcription polymerase chain reaction
factor RBM RNA binding protein
ER estrogen receptor rev reverse
Fas TNF receptor superfamily RG reference gene
member 6 RIN RNA integrity number
FasL TNF receptor superfamily RNA ribonucleic acid
member 6 ligand RSA Republic of South Africa
FGF fibrobast growth factor RT reverse transcription
FGFBP fibrobast growth factor binding SARM selective androgen receptor
protein modulator
for forward SD standard deviation
GAPDH glycerinealdehyde-3-phosphate SERM selective estrogen receptor
dehydrogenase modulator
Abbreviations
iii
T1 one time treated group
T3 three times treated group
TBA trenbolone acetate
Testo testosterone
TGF tumor growth factor
TMOD tropomodulin
TNF tumor necrose factor
TNFR tumor necrose factor receptor
UB3 ubiquitin 3
USF upstream transcription factor
YWHAZ tyrosine 3-
monooxygenase/tryptophan 5-
monooxygenase activation
protein, ζ polypeptide
Zusammenfassung
iv
Zusammenfassung
Natürliche Steroidhormone werden ausgehend von Cholesterin gebildet und sind in die
endo- und parakrine Wachstumsregulation verschiedener Gewebe involviert. Einzelne
Steroidhormone, wie Östrogene und Androgene wirken anabol, indem sie die
Proteinretention im Körper verbessern und Fettreserven abbauen, was zu einer Erhöhung
der Wachstumsrate führt. In der Tiermast werden diese anabolen Eigenschaften genutzt,
um die Gewichtszunahme und die Futterverwertung zu verbessern, womit die
Produktivität erhöht und Kosten gesenkt werden.
In einigen Ländern, wie den USA, Kanada, Australien, Mexiko und Südafrika ist der
Gebrauch von Wachstumsförderern in der Tiermast zugelassen. Aufgrund erwiesener
Nebenwirkungen für den Konsumenten ist der Gebrauch anaboler Substanzen in der EU
verboten, wo die Einhaltung dieser Richtlinie (88/146/EEC) streng überwacht wird.
Ein weiteres Anwendungsgebiet anaboler Steroidhormone ist die Behandlung
altersbedingter Krankheiten, wie Osteoporose oder Sarkopenie, welche durch eine
Abnahme der endogenen Produktion von Östradiol und Testosteron bei rückläufiger
Gonadenfunktion verursacht werden. Für die Behandlung dieser altersbedingten
Krankheiten wurden so genannte selektive Androgen Rezeptor Modulatoren (SARM)
entwickelt. Darunter versteht man synthetische Moleküle, welche die nützlichen zentralen
und peripheren Eigenschaften von Testosteron besitzen, jedoch kaum Nebenwirkungen
aufweisen. Aufgrund der positiven Wirkungen eines SARM auf die Muskelmasse ist das
Risiko des Missbrauchs dieser Substanzen in der Tiermast oder im Sport vorhanden.
Um den Missbrauch anaboler Substanzen in der Tiermast oder im Sport zu kontrollieren,
werden Hormonrückstände mittels Immunoassays oder chromatographischer Methoden in
Kombination mit Massenspektrometrie detektiert. Mit Hilfe dieser Methoden können nur
bekannte Substanzen nachgewiesen werden. Um eine effiziente Kontrolle des
Missbrauchs anaboler Stoffe zu gewährleisten, ist es nötig neue Technologien zu
entwickeln, mit welchen man den Gebrauch einer breiten Masse an illegalen
Medikamenten, inklusive neu entwickelter Xenobiotika nachweisen kann.
Ein Ansatz zur Entwicklung einer neuen Nachweismethode ist das Aufzeigen
physiologischer Effekte, welche durch die Einnahme anaboler Substanzen verursacht
werden. Ein viel versprechender Weg solche physiologischen Veränderungen
nachzuweisen, ist die Bestimmung von Veränderungen in der mRNA Expression mittels
quantitativer real-time RT-PCR (RT-qPCR).
Ziel dieser Arbeit war es zu prüfen, ob die Bestimmung von
Genexpressionsveränderungen Potential für die Entwicklung neuer Technologien zum
Nachweis missbräuchlicher Anwendung anaboler Substanzen hat. Hierfür wurde die
Zusammenfassung
v
mRNA Expression steroidabhängiger Gene im Blut und in vaginalen Epithelzellen –
Gewebe, welche leicht vom lebenden Individuum genommen werden können - mittels RT-
qPCR quantifiziert und mögliche Veränderungen statistisch bewertet.
In allen drei Tierversuchen, die im Rahmen dieser Arbeit durchgeführt wurden, konnten
Genexpressionsveränderungen festgestellt werden. In zwei dieser Studien konnte aus
den signifikant regulierten Genen mit Hilfe biostatistischer Methoden, wie der Principle
Components Analyse (PCA) oder der hierarchischen Clusteranalyse eine Trennung von
Kontrollgruppe und Behandlungsgruppe dargestellt werden.
Die Ergebnisse dieser Arbeit zeigen, dass die Quantifizierung von
Genexpressionsveränderungen eine vielversprechende Herangehensweise für die
Entwicklung neuer Technologien zum Nachweis des missbräuchlichen Gebrauchs
anaboler Substanzen darstellt.
Abstract
vi
Abstract
Natural steroid hormones are synthesized from cholesterol and are involved in endocrine
and paracrine regulation of growth in different tissues. Some steroid hormones like
androgens and estrogens have anabolic functions by enhancing body protein accretion
and mobilizing fat stores, which results in an increased growth rate. These properties are
useful in animal husbandry to improve weight gain and feed efficiency and thereby
increase productivity and reduce costs. In some countries like the USA, Canada,
Australia, Mexico and South Africa the use of growth promoters is approved. Due to
proven negative side effects for consumers the use of anabolic substances is forbidden in
the EU, where the compliance of this directive (88/146/EEC) is strictly controlled.
Another application area of anabolic steroid hormones is the treatment of age related
diseases like osteoporosis or sarcopenia, which are related to a decrease of the
endogenous production of anabolic steroid hormones during diminishing gonade function,
mainly estradiol and testosterone. For the treatment of these age related diseases,
synthetic molecules called selective androgen receptor modulators (SARMs) are
developed, which have the potential to mimic the desirable central and peripheral
androgenic anabolic effects of testosterone but with less side effects. Due to the positive
effects on muscle strength of SARMs the risk of the misuse of these substances in animal
husbandry or human sports as anabolic agent is present.
To uncover the abuse of anabolic agents in animal husbandry or human sports, hormone
residues are detected by immuno assays or chromatographical methods in combination
with mass spectrometry. With these methods only known substances can be discovered.
To enable an efficient tracing of unknown misused anabolic substances it is necessary to
develop new technologies to screen for a broad range of illegal drugs including newly
designed xenobiotic anabolic agents.
Verifying physiological effects caused by anabolic agents will be a new way to develop
potential monitoring systems. The determination of changes in mRNA expression by
quantitative real-time RT-PCR (RT-qPCR) is a promising approach to verify those
physiological changes.
The aim of this thesis was to proof the potential of the determination of mRNA expression
changes for the development of a screening method to detect the misuse of anabolic
steroid hormones. Therefore expression changes of steroid responsive genes that were
selected by screening the actual literature were quantified in blood and vaginal epithelial
cells – tissues that can easily been taken from the living individual. Gene expression
changes were measured by RT-qPCR.

Abstract
vii
In all three animal trials included in this thesis, expression changes of multiple genes in
blood and bovine vaginal smear could be quantified. In two studies, biostatistical tools, like
Principle Components Analysis (PCA) or Hierarchical Cluster Analysis were successfully
used to distinguish treated and untreated animals by involving all significantly regulated
genes.
The results of this thesis indicate that the quantification of gene expression changes is a
promising approach for the development of new screening methods to trace the abuse of
anabolic agents.
Introduction
1
1 Introduction
1.1 Anabolic Steroid Hormones – use and misuse in animal
husbandry
Natural steroid hormones are synthesized from cholesterol and can be classified in five
subgroups: mineralocorticoids, glucocorticoids, gestagens, androgens, and estrogens and
are involved in endocrine and paracrine regulation of different tissues. Some steroid
hormones like androgens and estrogens have anabolic functions by enhancing body
protein accretion and mobilizing fat stores, which results in an increased growth rate [1, 2].
These properties are deep-rooted in the evolution of vertebrates. The sex steroids
testosterone and estradiol have effects on behavioral, morphological and physiological
traits. Estrogens stimulate protein- and mineral retention during pregnancy, which is
important for the development of the embryo. Testosterone promotes sexual behaviours
like courtship and improves growth of skeletal muscle which is important for defending the
territory [3, 4].
In animal husbandry the myotropic, growth promoting properties of steroid hormones are
beneficial. Used orally, the natural steroid hormones testosterone and estradiol are almost
inactive. Besides these natural steroids also the xenobiotic hormones trenbolone acetate
(TBA), zeranol and melengestrol acetate (MGA) were developed by US companies to be
used as anabolics in food producing animals. As only MGA is orally active, the other drugs
have to be applied by implantation [5]. In meat production growth promoters are used to
increase productivity and to reduce costs by improving weight gain and feed efficiency [6,
7]. The use of growth promoters is approved in some countries like the USA, Canada,
Australia, Mexico, and South Africa. It has been proven that hormone residues in meat are
increased and have adverse side effects for the consumer [8-11]. Therefore the use of
anabolic agents in meat producing animals and also the import of meat derived from cattle
given these substances is forbidden in the EU since 1988. To enforce the directive
(88/146/EEC), permanent surveillance is essential [12-17].
1.2 Steroid Hormones in Hormone Replacement Therapy
Over the last decades the proportion of elderly people in the population has increased
[18]. This is the reason why the incidence of age related conditions like sarcopenia (loss
of muscle mass) and osteoporosis (loss of bone density) is rising and becoming one of the
major topics in health care [19-22]. The combination of sarcopenia and osteoporosis
Introduction
2
results in a high incidence of bone fractures relating to accidental falls, which is a
significant cause of morbidity in the elderly population. Both conditions are related to the
decrease in the endogenous production of anabolic steroid hormones, mainly estradiol
and testosterone [23]. Hormone replacement therapy is a major topic in the treatment of
frailty. Men and women suffering from frailty are treated with testosterone or estradiol but
both therapies are associated with various side effects, like skin virilization in women,
prostate hypertrophy in men and an increased risk of cancer [24-26]. An alternative to the
treatment with natural testosterone or estradiol are synthetic molecules called SARM
(selective androgen receptor modulators) and SERM (selective estrogen receptor
modulators), which bind to the steroid hormone receptors exhibiting predominantly tissue
selective effects [27]. An “ideal” SARM or SERM is an orally active compound that
provides an increase in muscle mass and strength and has a positive effect on bone
density without inducing undesirable side effects [28]. Due to the positive effects on
muscle strength of SARMs and SERMs the risk of the misuse of these substances as
anabolic agent is present.
1.3 Potential of transcriptomics for biomarker development to trace
anabolic steroid hormone functions
To uncover the abuse of anabolic agents in animal husbandry hormone residues are
detected using immuno assays or chromatographical methods in combination with mass
spectrometry [29-32]. With these methods only known substances can be discovered. To
enable an efficient tracing of misused anabolic substances, it is necessary to develop new
technologies to screen for a broad range of illegal drugs including newly designed
xenobiotic anabolic agents.
In molecular medicine, e.g in cancer research, the development of molecular biomarkers
is already a common approach in diagnostics. Plasma biomarkers are developed for
prognostic use and tumor biomarkers are used to develop treatment strategies for each
individual patient [33, 34]. To develop such biomarkers omic technologies, like
transcriptomics, proteomics and metabolomics are applied [35-37].
The use of these omic technologies to develop biomarker patterns by tracing anabolic
steroid hormone functions will be a promising way to develop a new screening method for
the detection of the misuse of anabolic agents [38].
Steroid hormone receptors belong to the family of nuclear receptors and show a high
affinity to their corresponding hormone [39, 40]. They are either localized in the cytoplasm
moving to the cell nucleus upon activation or directly in the nucleus waiting for the steroid
Introduction
3
hormones or active analoga to enter the nucleus and activate them [41]. Without a bound
ligand the steroid receptors exist as a steroid receptor complex, associated with different
heat shock proteins (hsp90, hsp 56, hsp70) and p23 [42-44]. Binding of the ligand results
in a conformational change leading to the dissociation of the HSP-complex from the
receptor. After dimerization the receptor binds to specific sequences in the promoter
region of steroid hormone regulated genes, called hormone responsive elements (HRE)
[40, 45, 46]. After DNA binding, different coregulators that are recruited to activate
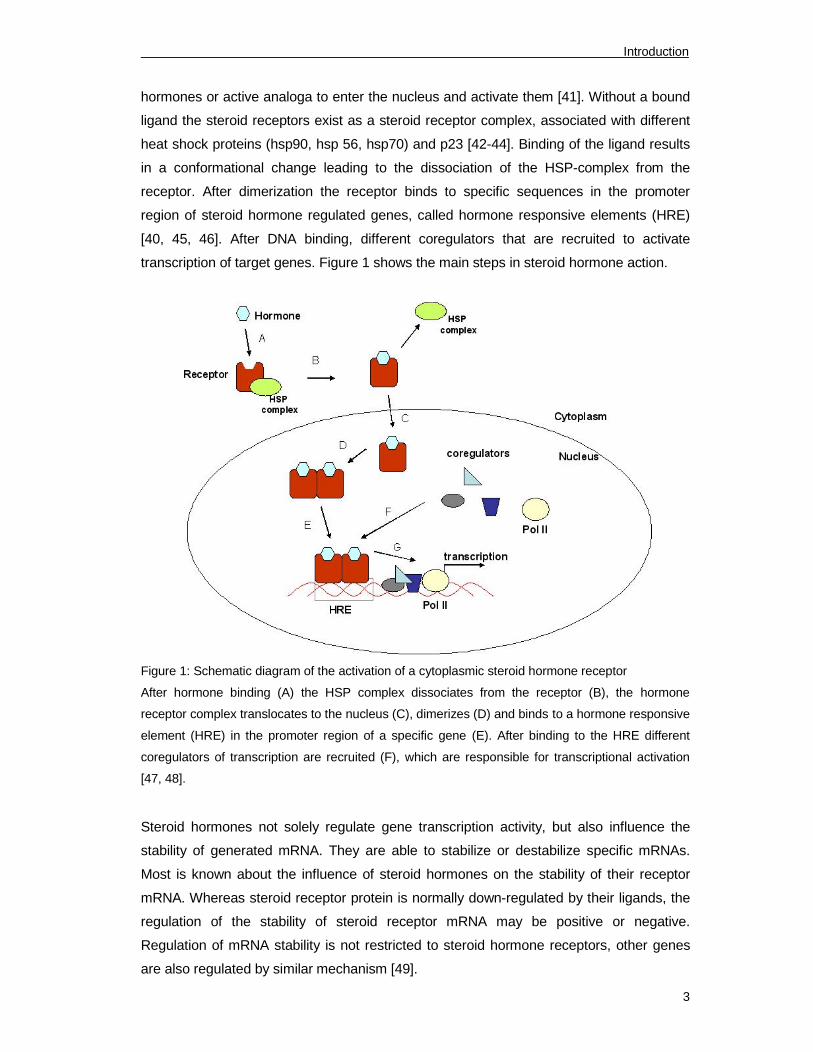
transcription of target genes. Figure 1 shows the main steps in steroid hormone action.
Figure 1: Schematic diagram of the activation of a cytoplasmic steroid hormone receptor
After hormone binding (A) the HSP complex dissociates from the receptor (B), the hormone
receptor complex translocates to the nucleus (C), dimerizes (D) and binds to a hormone responsive
element (HRE) in the promoter region of a specific gene (E). After binding to the HRE different
coregulators of transcription are recruited (F), which are responsible for transcriptional activation
[47, 48].
Steroid hormones not solely regulate gene transcription activity, but also influence the
stability of generated mRNA. They are able to stabilize or destabilize specific mRNAs.
Most is known about the influence of steroid hormones on the stability of their receptor
mRNA. Whereas steroid receptor protein is normally down-regulated by their ligands, the
regulation of the stability of steroid receptor mRNA may be positive or negative.
Regulation of mRNA stability is not restricted to steroid hormone receptors, other genes
are also regulated by similar mechanism [49].
Introduction
4
1.4 Aims
The objective of this thesis was to proof the potential of transcriptomics technology for the
development of a screening method to detect the misuse of anabolic steroid hormones.
Therefore three different animal trials were employed. Two studies on female cattle,
where the effects of different combinations of steroid hormones on gene expression in
blood and vaginal smear was quantified and one study on cynomolgus monkeys (Macaca
fascicularis) where the effects a novel SARM on gene expression of whole blood was
compared to the effects of natural testosterone. In all three animal trials expression
changes of steroid responsive genes that were selected by screening the actual literature
were quantified. Gene expression changes were measured by RT-qPCR. Biostatistical
tools, like PCA or Hierarchical Cluster Analysis could be helpful to proof, if quantified gene
expression changes will be promising biomarkers for the development of a new screening
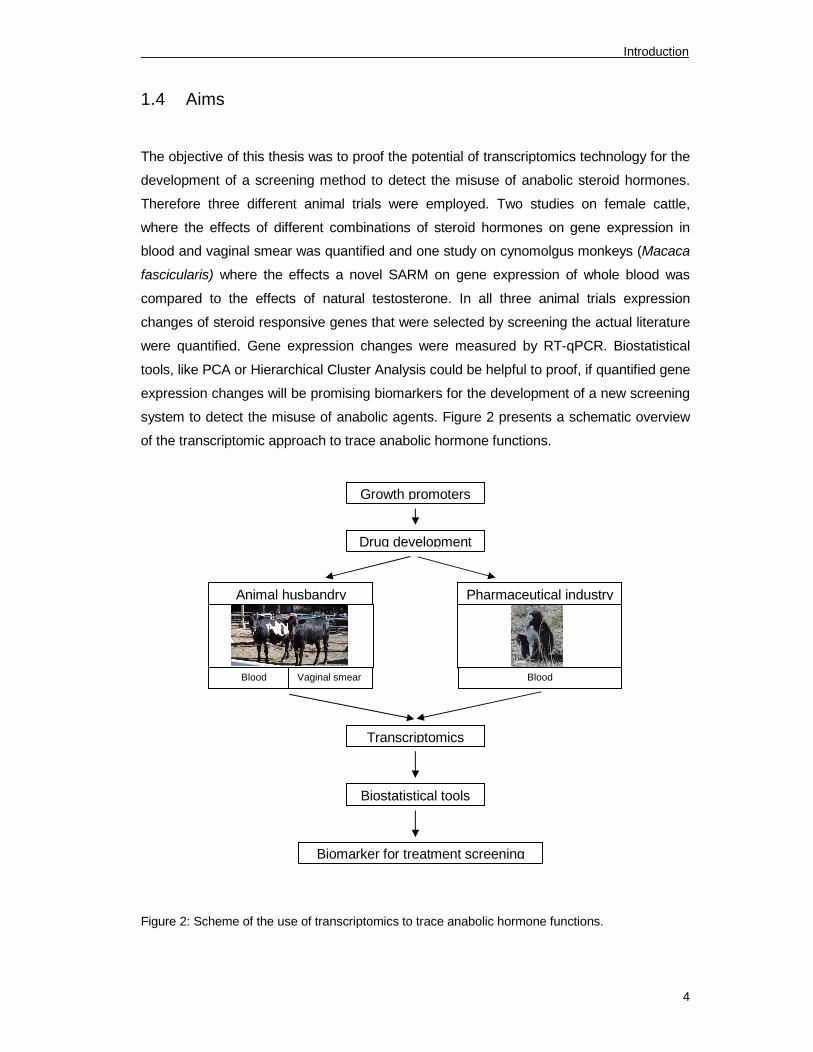
system to detect the misuse of anabolic agents. Figure 2 presents a schematic overview
of the transcriptomic approach to trace anabolic hormone functions.
Figure 2: Scheme of the use of transcriptomics to trace anabolic hormone functions.
Growth promoters
Biostatistical tools
Biomarker for treatment screening
Drug development
Animal husbandry Pharmaceutical industry
Blood Vaginal smear Blood
Transcriptomics
Materials and Methods
5
2 Materials and Methods
2.1 Animal Experiments
Anabolics study on Nguni Cattle
To test the potential to use transcriptomics for the development of a new sensitive test
system to screen for the misuse of anabolic agents in food producing animals, an animal
study that represents the situation in praxis had to be organized. In the Republic South
Africa the use of certain anabolic agents for improvement of growth of meat producing
animals is permitted. Anabolic preparations are available on the market there. Therefore it
was easier to get the permission for such an animal study in South Africa than it would be
in Germany. So it was part of this PhD thesis to organize all steps (study design, sampling
of blood and vaginal smear, tissue sampling at slaughter) of an animal study in
cooperation with the Onderstepoort Veterinary Institute in Pretoria, South Africa. A journey
to Pretoria of two weeks for organizing the transfer of the samples to Germany and for
organizing and performing tissue sampling at slaughter was part of this PhD thesis.
Earlier animal studies that were performed to analyze the effects of anabolic substances
on growth performance in cattle showed, that 5-10 animals per group are adequate if the
natural variance between the animals is minimized by using animals within one breed, one
gender and of similar age [50]. It is assumed that gene expression will vary like growth
performance and so this aspect was considered in the planning of the study.
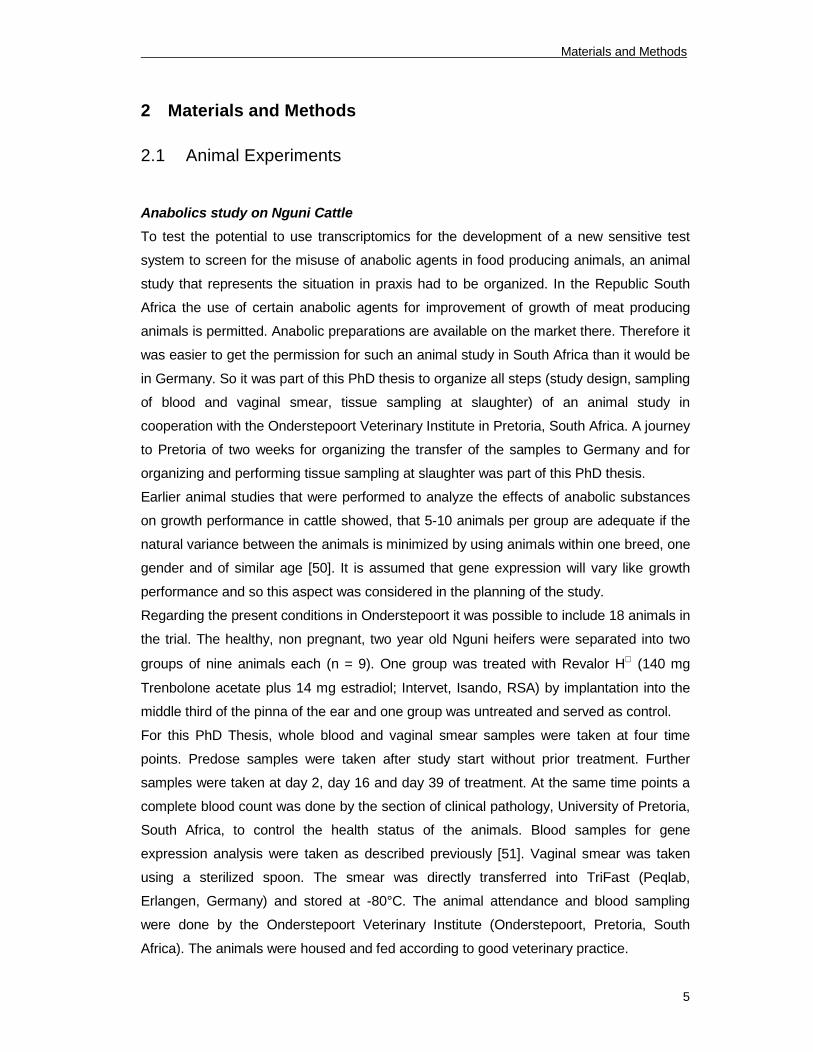
Regarding the present conditions in Onderstepoort it was possible to include 18 animals in
the trial. The healthy, non pregnant, two year old Nguni heifers were separated into two
groups of nine animals each (n = 9). One group was treated with Revalor H
(140 mg
Trenbolone acetate plus 14 mg estradiol; Intervet, Isando, RSA) by implantation into the
middle third of the pinna of the ear and one group was untreated and served as control.
For this PhD Thesis, whole blood and vaginal smear samples were taken at four time
points. Predose samples were taken after study start without prior treatment. Further
samples were taken at day 2, day 16 and day 39 of treatment. At the same time points a
complete blood count was done by the section of clinical pathology, University of Pretoria,
South Africa, to control the health status of the animals. Blood samples for gene
expression analysis were taken as described previously [51]. Vaginal smear was taken
using a sterilized spoon. The smear was directly transferred into TriFast (Peqlab,
Erlangen, Germany) and stored at -80°C. The animal attendance and blood sampling
were done by the Onderstepoort Veterinary Institute (Onderstepoort, Pretoria, South
Africa). The animals were housed and fed according to good veterinary practice.
Materials and Methods
6
Pour on anabolics study on veal calves
To test the potential of the identified biomarker candidates from the anabolics study on
Nguni cattle a second study in which animals are treated with an illicit hormone cocktail
was conducted. The application of such hormone cocktail is not allowed, even in countries
where the use of anabolic agents in food producing animals is permitted, and so the
performance of this trial required a special permission from the government. This trial was
organized in cooperation with the RIKILT Institute of food safety, Wageningen,
Netherlands. The design of the study in cooperation with the RIKILT Institute of food
safety, the study performance in Freising-Weihenstephan and sampling of blood, hair,
urine and different tissues at slaughter was part of this PhD thesis.
In planning such animal experiments there are many factors that have to be considered
especially concerning the number of animals included in the trial. The guidelines for that
trial was to have four different groups. Regarding the present conditions at the
Versuchsstation Veitshof, Freising, Germany it was possible to include 20 animals in the
trial. The trial was permitted by the Regierung von Oberbayern (Reference Number 55.2-
1-5412531.8-102-07). A statistical report required for the application for that animal trial
demonstrates that by including two control groups and two groups treated with different
doses of hormones, 5 animals per group are adequate for statistical analysis.
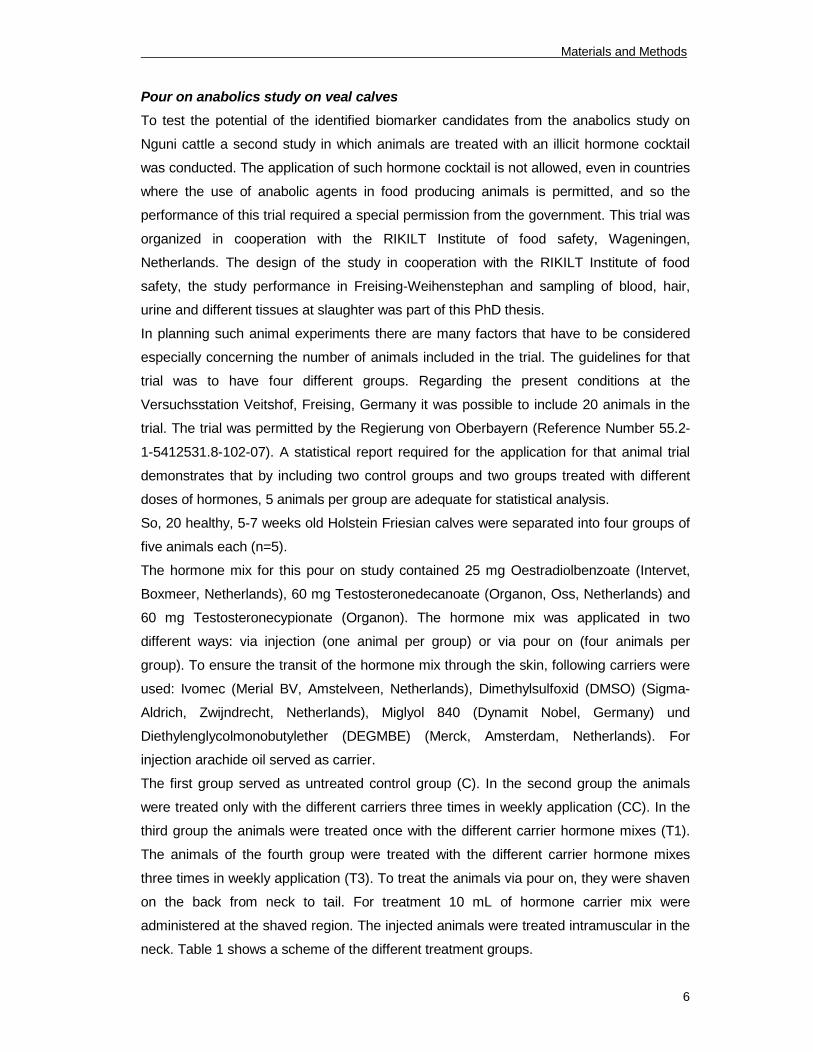
So, 20 healthy, 5-7 weeks old Holstein Friesian calves were separated into four groups of
five animals each (n=5).
The hormone mix for this pour on study contained 25 mg Oestradiolbenzoate (Intervet,
Boxmeer, Netherlands), 60 mg Testosteronedecanoate (Organon, Oss, Netherlands) and
60 mg Testosteronecypionate (Organon). The hormone mix was applicated in two
different ways: via injection (one animal per group) or via pour on (four animals per
group). To ensure the transit of the hormone mix through the skin, following carriers were
used: Ivomec (Merial BV, Amstelveen, Netherlands), Dimethylsulfoxid (DMSO) (Sigma-
Aldrich, Zwijndrecht, Netherlands), Miglyol 840 (Dynamit Nobel, Germany) und
Diethylenglycolmonobutylether (DEGMBE) (Merck, Amsterdam, Netherlands). For
injection arachide oil served as carrier.
The first group served as untreated control group (C). In the second group the animals
were treated only with the different carriers three times in weekly application (CC). In the
third group the animals were treated once with the different carrier hormone mixes (T1).
The animals of the fourth group were treated with the different carrier hormone mixes
three times in weekly application (T3). To treat the animals via pour on, they were shaven
on the back from neck to tail. For treatment 10 mL of hormone carrier mix were
administered at the shaved region. The injected animals were treated intramuscular in the
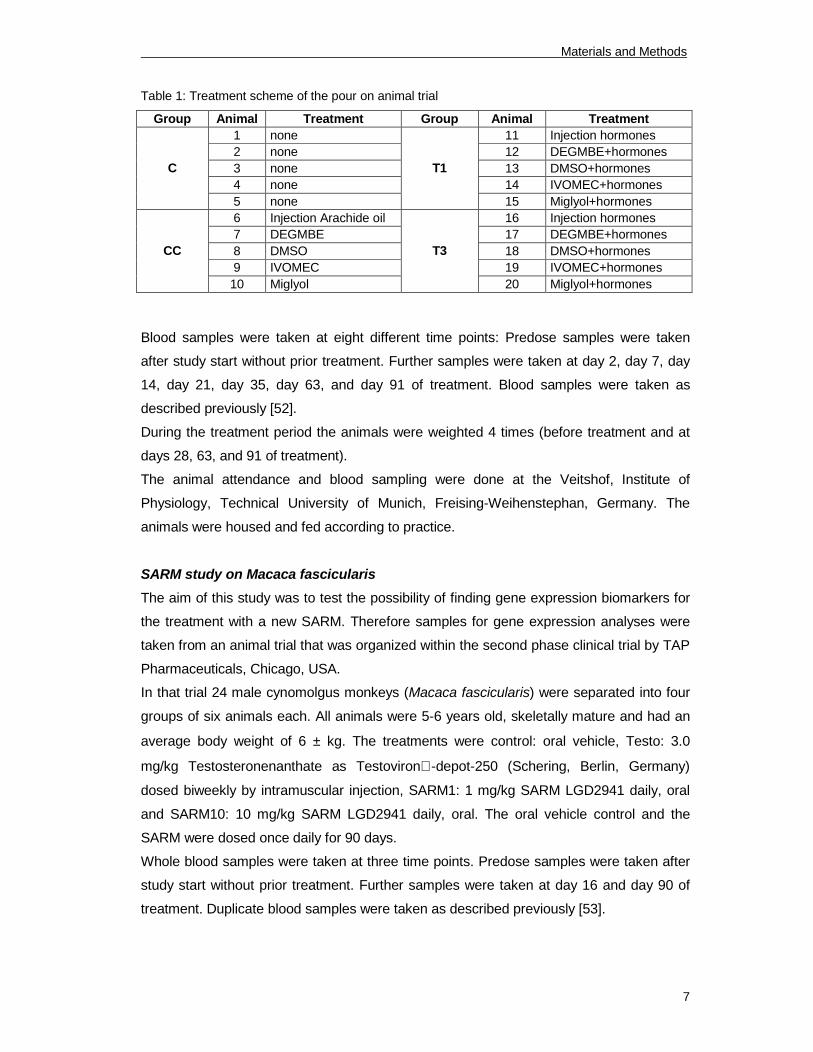
neck. Table 1 shows a scheme of the different treatment groups.
Materials and Methods
7
Table 1: Treatment scheme of the pour on animal trial
Group Animal Treatment Group Animal Treatment
1 none 11 Injection hormones
2 none 12 DEGMBE+hormones
3 none 13 DMSO+hormones
4 none 14 IVOMEC+hormones
C
5 none
T1
15 Miglyol+hormones
6 Injection Arachide oil 16 Injection hormones
7 DEGMBE 17 DEGMBE+hormones
8 DMSO 18 DMSO+hormones
9 IVOMEC 19 IVOMEC+hormones
CC
10 Miglyol
T3
20 Miglyol+hormones
Blood samples were taken at eight different time points: Predose samples were taken
after study start without prior treatment. Further samples were taken at day 2, day 7, day
14, day 21, day 35, day 63, and day 91 of treatment. Blood samples were taken as
described previously [52].
During the treatment period the animals were weighted 4 times (before treatment and at
days 28, 63, and 91 of treatment).
The animal attendance and blood sampling were done at the Veitshof, Institute of
Physiology, Technical University of Munich, Freising-Weihenstephan, Germany. The
animals were housed and fed according to practice.
SARM study on Macaca fascicularis
The aim of this study was to test the possibility of finding gene expression biomarkers for
the treatment with a new SARM. Therefore samples for gene expression analyses were
taken from an animal trial that was organized within the second phase clinical trial by TAP
Pharmaceuticals, Chicago, USA.
In that trial 24 male cynomolgus monkeys (Macaca fascicularis) were separated into four
groups of six animals each. All animals were 5-6 years old, skeletally mature and had an
average body weight of 6 ± kg. The treatments were control: oral vehicle, Testo: 3.0
mg/kg Testosteronenanthate as Testoviron-depot-250 (Schering, Berlin, Germany)
dosed biweekly by intramuscular injection, SARM1: 1 mg/kg SARM LGD2941 daily, oral
and SARM10: 10 mg/kg SARM LGD2941 daily, oral. The oral vehicle control and the
SARM were dosed once daily for 90 days.
Whole blood samples were taken at three time points. Predose samples were taken after
study start without prior treatment. Further samples were taken at day 16 and day 90 of
treatment. Duplicate blood samples were taken as described previously [53].
Materials and Methods
8
The animal attendance and blood sampling were done by Covance Laboratories GmbH
(Münster, Germany) and was conducted with permission from the local veterinary
authorities and in accordance with accepted standards of Human Animal Care.
2.2 RNA Extraction and Quality Determination
RNA from blood samples was extracted using the PAXgene Blood RNA Kit (Qiagen,
Hilden, Germany). This system is designed for the stabilization and extraction of RNA
from human whole blood. Before using it for Macaca fascicularis or cattle it had to be
tested, if this system also works for these species. Due to the high homology between
human and primate blood the PAXgene system worked well for Macaca fascicularis. The
cellular composition of bovine blood differs from that of human blood. There are for
example no reticulocytes present, because the maturation of bovine erythrocytes
completely takes place in the bone marrow. For testing the PAXgene system with bovine
blood, several blood volumes were used. The RNA yield was generally lower compared to
the RNA extracted from human blood. It was not practicable to use more than 2.5 ml
bovine blood, because by using higher volumes, the stabilizer was not able to lyse all cells
and so erythrocytes accumulated and RNA extraction was not possible. Therefore RNA
extraction from bovine blood was performed according to the manufacturer´s instructions.
There is no information available about the extraction of RNA from bovine vaginal
epithelial cells. The literature only describes how to extract RNA from vaginal epithelial
cells obtained from euthanized mice. Our intention was to extract RNA from vaginal
epithelial cells of living cattle. A method to get vaginal epithelial cells is to take vaginal
smear containing keratinized epithelial cells. The high amount of cervical mucus present
in bovine vagina at the end of the estrous cycle was problematic for sampling but by using
a sterilized spoon sampling could be successfully performed.
For RNA extraction several systems were tested including phenol based methods and kits
using silica membranes. After comparing RNA yield and RNA quality, the method of
choice was peqGold Tri-Fast (PeqLab Biotechologies) based on the manufacturer´s
instructions.
To quantify the amount of total RNA extracted, optical density (OD) was measured with
the Biophotometer (Eppendorf, Hamburg, Germany) or with the NanoDrop 1000 (PeqLab
Biotechnologies) for each sample. RNA purity was calculated with the OD260/280
ratio.
RNA integrity and quality control was performed via automated capillary electrophoresis in
the 2100 Bioanalyzer (Agilent Technologies, Palo Alto, USA). Eukaryotic total RNA Nano
Assay (Agilent Technologies) was taken for sample analysis and the RNA Integrity
Materials and Methods
9
Number (RIN) served as RNA quality parameter. Agilent 2100 Bioanalyzer calculated the
RIN value based on a numbering system from 1 to 10 (1 being the most degraded profile,
10 being the most intact) for all samples.
2.3 Selection of Target Genes
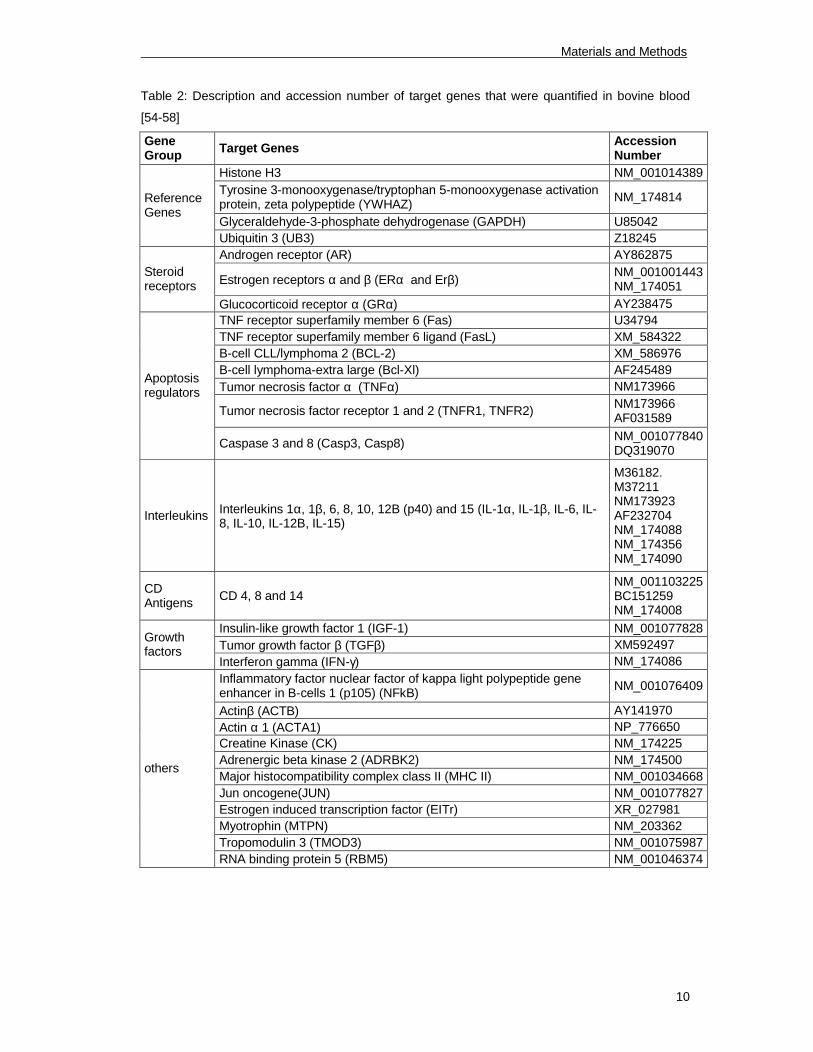
Candidate genes that might be biomarkers in blood or vaginal smear were chosen by
screening the respective literature for steroid related effects on blood or vaginal epithelial
cells. Quantified target genes are listed in tables 2-4.
Materials and Methods
10
Table 2: Description and accession number of target genes that were quantified in bovine blood
[54-58]
Gene
GroupTarget Genes
Accession
Number
Histone H3 NM_001014389
Tyrosine 3-monooxygenase/tryptophan 5-monooxygenase activation
protein, zeta polypeptide (YWHAZ)
NM_174814
Glyceraldehyde-3-phosphate dehydrogenase (GAPDH) U85042
Reference
Genes
Ubiquitin 3 (UB3) Z18245
Androgen receptor (AR) AY862875
Estrogen receptors α and β (ERα and Erβ)
NM_001001443
NM_174051
Steroid
receptors
Glucocorticoid receptor α (GRα) AY238475
TNF receptor superfamily member 6 (Fas) U34794
TNF receptor superfamily member 6 ligand (FasL) XM_584322
B-cell CLL/lymphoma 2 (BCL-2) XM_586976
B-cell lymphoma-extra large (Bcl-Xl) AF245489
Tumor necrosis factor α (TNFα) NM173966
Tumor necrosis factor receptor 1 and 2 (TNFR1, TNFR2)
NM173966
AF031589
Apoptosis
regulators
Caspase 3 and 8 (Casp3, Casp8)
NM_001077840
DQ319070
Interleukins
Interleukins 1α, 1β, 6, 8, 10, 12B (p40) and 15 (IL-1α, IL-1β, IL-6, IL-
8, IL-10, IL-12B, IL-15)
M36182.
M37211
NM173923
AF232704
NM_174088
NM_174356
NM_174090
CD
Antigens
CD 4, 8 and 14
NM_001103225
BC151259
NM_174008
Insulin-like growth factor 1 (IGF-1) NM_001077828
Tumor growth factor β (TGFβ) XM592497
Growth
factors
Interferon gamma (IFN-γ) NM_174086
Inflammatory factor nuclear factor of kappa light polypeptide gene
enhancer in B-cells 1 (p105) (NFkB)
NM_001076409
Actinβ (ACTB) AY141970
Actin α 1 (ACTA1) NP_776650
Creatine Kinase (CK) NM_174225
Adrenergic beta kinase 2 (ADRBK2) NM_174500
Major histocompatibility complex class II (MHC II) NM_001034668
Jun oncogene(JUN) NM_001077827
Estrogen induced transcription factor (EITr) XR_027981
Myotrophin (MTPN) NM_203362
Tropomodulin 3 (TMOD3) NM_001075987
others
RNA binding protein 5 (RBM5) NM_001046374
Materials and Methods
11
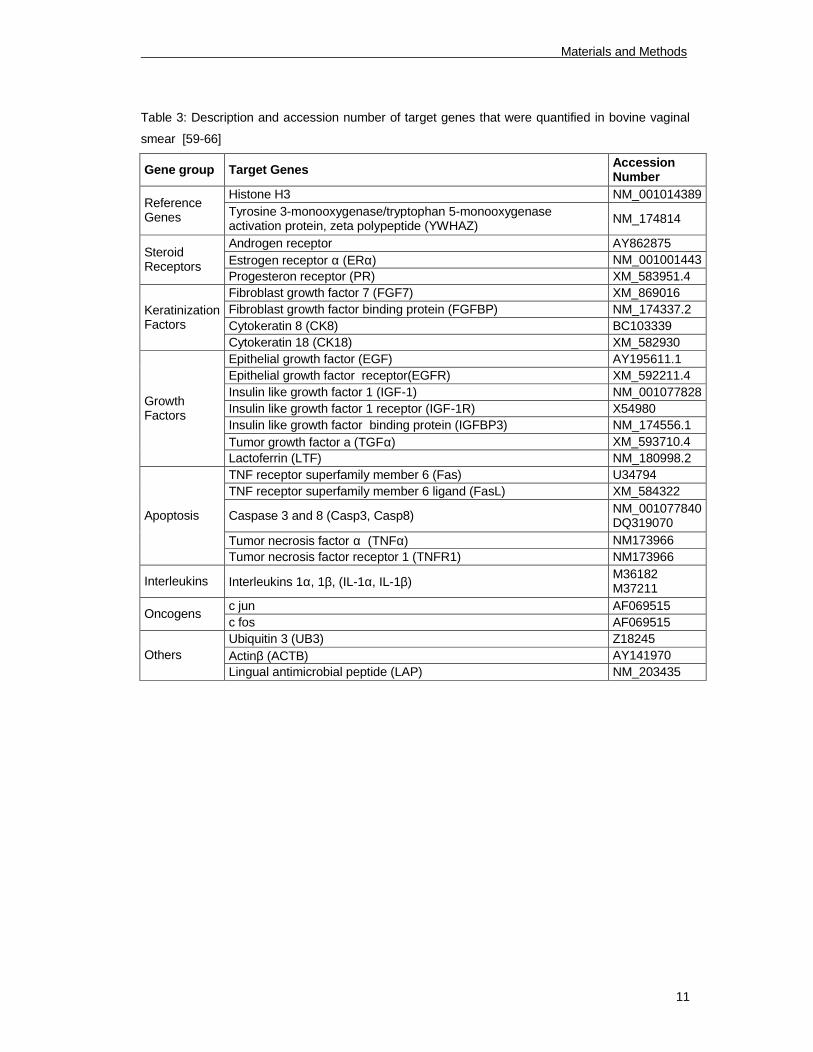
Table 3: Description and accession number of target genes that were quantified in bovine vaginal
smear [59-66]
Gene group Target GenesAccession
Number
Histone H3 NM_001014389
Reference
Genes
Tyrosine 3-monooxygenase/tryptophan 5-monooxygenase
activation protein, zeta polypeptide (YWHAZ)
NM_174814
Androgen receptor AY862875
Estrogen receptor α (ERα) NM_001001443
Steroid
Receptors
Progesteron receptor (PR) XM_583951.4
Fibroblast growth factor 7 (FGF7) XM_869016
Fibroblast growth factor binding protein (FGFBP) NM_174337.2
Cytokeratin 8 (CK8) BC103339
Keratinization
Factors
Cytokeratin 18 (CK18) XM_582930
Epithelial growth factor (EGF) AY195611.1
Epithelial growth factor receptor(EGFR) XM_592211.4
Insulin like growth factor 1 (IGF-1) NM_001077828
Insulin like growth factor 1 receptor (IGF-1R) X54980
Insulin like growth factor binding protein (IGFBP3) NM_174556.1
Tumor growth factor a (TGFα) XM_593710.4
Growth
Factors
Lactoferrin (LTF) NM_180998.2
TNF receptor superfamily member 6 (Fas) U34794
TNF receptor superfamily member 6 ligand (FasL) XM_584322
Caspase 3 and 8 (Casp3, Casp8)
NM_001077840
DQ319070
Tumor necrosis factor α (TNFα) NM173966
Apoptosis
Tumor necrosis factor receptor 1 (TNFR1) NM173966
Interleukins Interleukins 1α, 1β, (IL-1α, IL-1β)
M36182
M37211
c jun AF069515
Oncogens
c fos AF069515
Ubiquitin 3 (UB3) Z18245
Actinβ (ACTB) AY141970Others
Lingual antimicrobial peptide (LAP) NM_203435
Materials and Methods
12
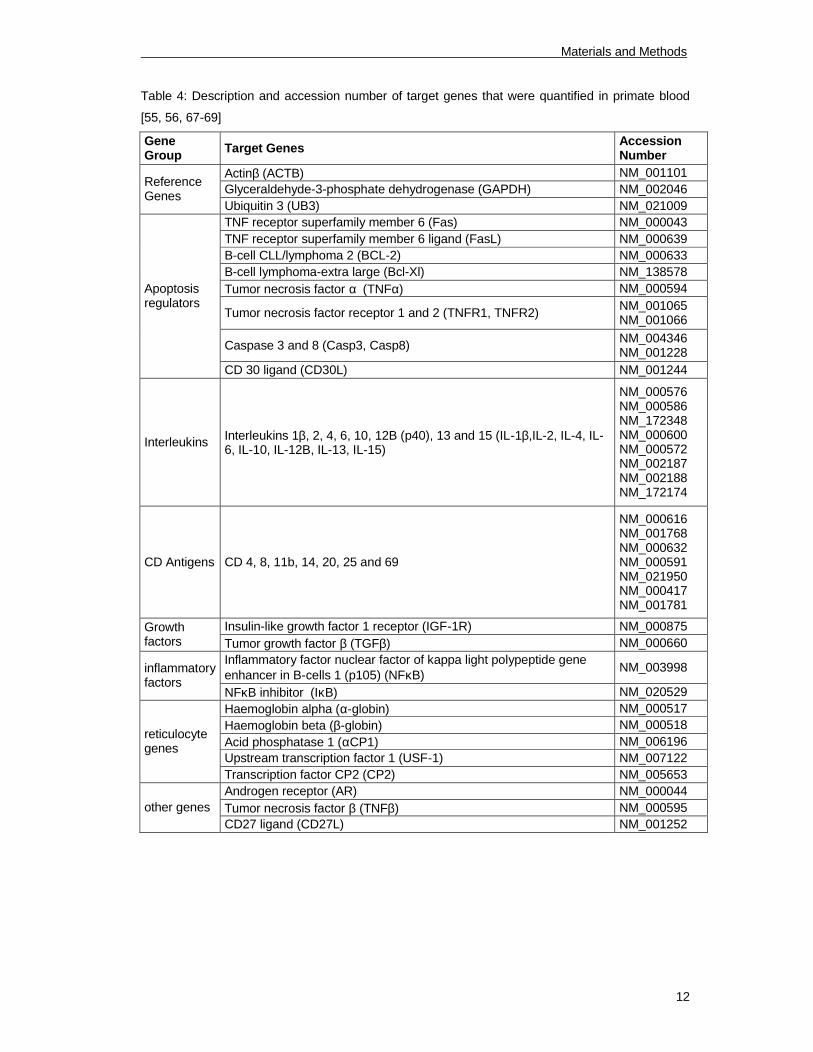
Table 4: Description and accession number of target genes that were quantified in primate blood
[55, 56, 67-69]
Gene
GroupTarget Genes
Accession
Number
Actinβ (ACTB) NM_001101
Glyceraldehyde-3-phosphate dehydrogenase (GAPDH) NM_002046
Reference
Genes
Ubiquitin 3 (UB3) NM_021009
TNF receptor superfamily member 6 (Fas) NM_000043
TNF receptor superfamily member 6 ligand (FasL) NM_000639
B-cell CLL/lymphoma 2 (BCL-2) NM_000633
B-cell lymphoma-extra large (Bcl-Xl) NM_138578
Tumor necrosis factor α (TNFα) NM_000594
Tumor necrosis factor receptor 1 and 2 (TNFR1, TNFR2)
NM_001065
NM_001066
Caspase 3 and 8 (Casp3, Casp8)
NM_004346
NM_001228
Apoptosis
regulators
CD 30 ligand (CD30L) NM_001244
Interleukins
Interleukins 1β, 2, 4, 6, 10, 12B (p40), 13 and 15 (IL-1β,IL-2, IL-4, IL-
6, IL-10, IL-12B, IL-13, IL-15)
NM_000576
NM_000586
NM_172348
NM_000600
NM_000572
NM_002187
NM_002188
NM_172174
CD Antigens CD 4, 8, 11b, 14, 20, 25 and 69
NM_000616
NM_001768
NM_000632
NM_000591
NM_021950
NM_000417
NM_001781
Insulin-like growth factor 1 receptor (IGF-1R) NM_000875Growth
factors Tumor growth factor β (TGFβ) NM_000660
Inflammatory factor nuclear factor of kappa light polypeptide gene
enhancer in B-cells 1 (p105) (NFκB)
NM_003998inflammatory
factors
NFκB inhibitor (IκB) NM_020529
Haemoglobin alpha (α-globin) NM_000517
Haemoglobin beta (β-globin) NM_000518
Acid phosphatase 1 (αCP1) NM_006196
Upstream transcription factor 1 (USF-1) NM_007122
reticulocyte
genes
Transcription factor CP2 (CP2) NM_005653
Androgen receptor (AR) NM_000044
Tumor necrosis factor β (TNFβ) NM_000595other genes
CD27 ligand (CD27L) NM_001252
Materials and Methods
13
2.4 Specific Primer Design
All bovine primers were designed using published bovine nucleic acid sequences of
GenBank (http://www.ncbi.nlm.nih.gov/entrez/query.fcgi). There are almost no nucleic
acid sequences available for Macaca fascicularis. For primer design human sequences of
the target genes were used. Primer design using human sequences was not possible for
all target genes. In this case homologue sequence parts between different species, like
mouse, rat and humans were detected using the sequence alignment tool (bl2seq) of the
National Center for Biotechnology Information (NCBI) and primer pairs were designed
including sequences of the detected homologue parts.
Primer design and optimization was done with primer design program of MWG Biotech
(MWG, Ebersberg, Germany) and primer3 (http://frodo.wi.mit.edu/cgi-
bin/primer3/primer3_www.cgi) with regard to primer dimer and self-priming formation.
Newly designed primers were ordered and synthesized at MWG Biotech (Ebersberg,
Germany). Primer testing was performed with three optional samples and a no template
control (NTC contains only RNAse free water). To determine the optimal annealing
temperature for each primer set a temperature gradient PCR was done.
2.5 Two-Step RT-qPCR Analysis
For the studies on bovine tissues, two step RT-qPCR was performed.
RNA Reverse Transcription
Constant amounts of 500 ng or 1 µg RNA were reverse transcribed respectively to cDNA
using the following RT master mix: 12 µL 5×Buffer (Promega, Mannheim, Germany), 3 µL
Random Hexamer Primers (50 mM; Invitrogen, Carlsbad, USA), 3 µL dNTP Mix (10 mM;
Fermentas, St Leon-Rot, Germany) and 200U of MMLV H- Reverse Transcriptase
(Promega) according to the manufacturer’s instructions.
qPCR Analysis
To analyze gene expression of candidate genes, RT-qPCR analysis was done with the
iQ5 (Bio-Rad, Munich, Germany), using MESA GREEN qPCR MasterMix Plus for SYBR®
Assay w/fluorescein Kit (Eurogentec, Cologne, Germany) by a standard protocol,
recommended by the manufacture.
Materials and Methods
14
With the kit a PCR master mix was prepared as follows: For one sample it is 7.5 µL MESA
GREEN 2x PCR Mix, 1.5 µL forward primer (10 pmol/µl), 1.5 µL reverse primer (10
pmol/µl) and 3 µL RNAse free water. For qPCR analysis 1.5 µL cDNA was added to 13.5
µL PCR master mix (total PCR mix: 15µL). qPCR was performed in 96 Well Plates
(Eppendorf) and pipetting was done by the epMotion 5075 (Eppendorf).
The following real-time PCR cycling protocol was employed for all investigated factors:
denaturation for 5 min at 95°C, 40 cycles of a two segmented amplification and
quantification program (denaturation for 3 s at 95°C, annealing for 10 s at primer specific
annealing temperature listed in table 1), a melting step by slow heating from 60 to 95°C
with a dwell time of 10 s and continous fluorescence measurement. Threshold cycle (Ct)
and melting curves were acquired by using the iQ5 Optical System software 2.0 (Bio-
Rad). Only genes with clear melting curves were taken for further data analysis. Samples
that showed irregular melting peaks were excluded from the quantification procedure.
2.6 One-Step RT-qPCR Analysis
For the SARM Study, one step quantitative real time RT-PCR analysis was used, which
was performed using SuperScript III Platinum SYBR Green One-Step qPCR Kit
(Invitrogen) by a standard protocol, recommended by the manufacture. With the kit a PCR
master mix was prepared as follows: For one sample it is 5 µL 2x SYBR Green Reaction
Mix, 0.5 µL forward primer (10 pmol/µL), 0.5 µL reverse primer (10 pmol/µL) and 0.2 µL
SYBR Green One-Step Enzyme Mix (Invitrogen). 6.2 µL of the PCR master mix was filled
in the special 100 µL tubes and 3.8 µL RNA (concentration 1 ng/µL respectively 10 ng/µL)
was added (total PCR mix: 10µL). Tubes were closed, placed into the Rotor-Gene 3000
and Analysis Software v6.0 was started (Corbett Life Science, Sydney, Australia). The
following uniform one-step RT-qPCR temperature cycling program was used for all genes:
Reverse transcription took place at 55°C for 10 min. After 5 min of denaturation at 95°C,
40 cycles of real-time PCR with 3-segment amplification were performed consisting of 15
s at 95°C for denaturation, 30 s at primer dependent temperature for annealing and 20 s
at 68°C for polymerase elongation. The melting step was then performed with slow
heating starting at 60°C with a rate of 0.5°C per second up to 95°C with continuous
measurement of fluorescence.
Threshold cycle (Ct) and melting curves were acquired by using the “Comparative
quantitation” and “Melting curve” program of the Rotor-Gene 3000 Analysis software v6.0.
Only genes with clear melting curves were taken for further data analysis. Samples that
showed irregular melting peaks were excluded from the quantification procedure.
Materials and Methods
15
2.7 Data Analysis and Statistics
Haemogram in bovine studies
Significant changes of the amount of the different blood cells between the treatment
groups were determined using an unpaired t-test. Results with p < 0.05 were considered
as statistically significant.
Weight gain in bovine studies
For the pour on study, significant changes of carcass weight and the weight gain of the
different weighting time points relatively to the beginning of the trial was done by
comparing the treatment groups to the control group using an unpaired t-test. Results with
p < 0.05 were considered as statistically significant.
Statistical analysis of gene expression data
Statistical description of the expression data as well as statistical tests were produced with
Sigma Stat for the bovine studies and with SAS v. 9.1.3 for Windows (SAS Institute, Cary,
USA) for the SARM study. Since the amplification efficiency was not known, the
assumption of identical amplification efficiency 100% was made, allowing more simple
quantification model [70].
The Ct values of each gene were averaged by arithmetic mean for each animal. The
obtained mean Ct values were then translated to normalized expression quantities using
two reference genes (RG) in form of normalization index. The normalization index was
calculated as an arithmetic mean of the Ct values of the two RG:
normalization index = mean (CtRG1
, CtRG2
) (1)
Then, the expression of every target gene was calculated relatively to the expression of
the RG as:
normalized expression = 2 reference index
/ 2 Ct target gene
, (2)
where the 2 represents the 100% amplification efficiency.
For quantification of gene expression in blood samples the normalized expressions of the
treatment timepoints were divided with the normalized expressions of the baseline
(predose), generating the expression ratio R as:
R timepoint/baseline
= normalized expression timepoint
/ normalized expression baseline
(3)
Materials and Methods
16
The expression ratio R for blood and the normalized expression for vaginal smear was
then analysed statistically using the t-test. Results with p < 0.05 were considered as
statistically significant.
Principal components analysis (PCA)
To disclose multivariate response to the treatment, the method of principal components
analysis (PCA) was employed using GenEx v. 4.3.x (MultiD Analyses AB, Gothenburg,
Sweden). PCA involves a mathematical procedure that transforms a number of variables
(here normalized expression values) into a smaller number of uncorrelated variables
called principal components. By this the dimensionality of the data is reduced to a number
of dimensions that can be plotted in a scatter plot, here two dimensions. The first principal
component accounts for as much of the variability in the data as possible, and each
succeeding component accounts for as much of the remaining variability as possible.
Normalized expression values of all responding genes were taken as the initial variables
and reduced to two principal components only, facilitating thus resolution of treatment
clusters in the scatter plot.
Hierarchical Cluster Analysis
Another method for visualizing treatment patterns based on multivariate data is
hierarchical cluster analysis. The hierarchical order is represented by a tree dendogram,
in which related samples are more closely together than samples that are more different
[71, 72]. Hierarchical clustering was employed using GenEx v. 4.3.6 (MultiD Analyses
AB).
Results and Discussion
17
3 Results and Discussion
3.1 Anabolics study on Nguni Cattle
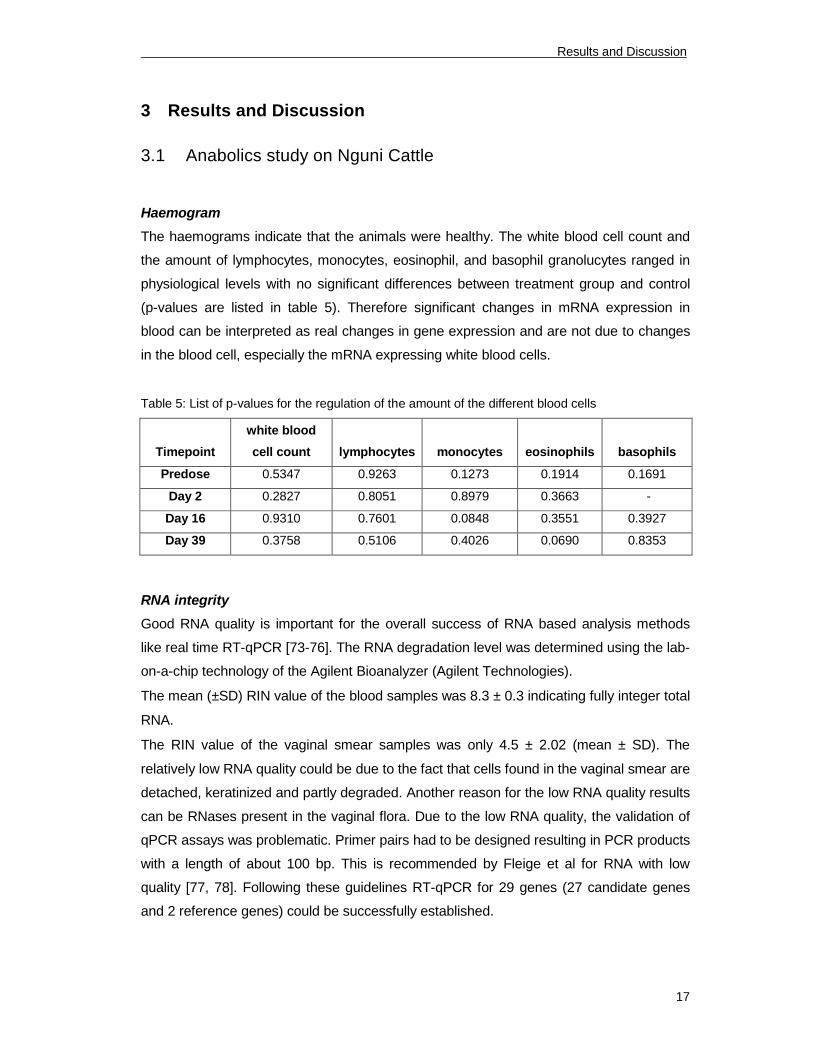
Haemogram
The haemograms indicate that the animals were healthy. The white blood cell count and
the amount of lymphocytes, monocytes, eosinophil, and basophil granolucytes ranged in
physiological levels with no significant differences between treatment group and control
(p-values are listed in table 5). Therefore significant changes in mRNA expression in
blood can be interpreted as real changes in gene expression and are not due to changes
in the blood cell, especially the mRNA expressing white blood cells.
Table 5: List of p-values for the regulation of the amount of the different blood cells
Timepoint
white blood
cell count lymphocytes monocytes eosinophils basophils
Predose 0.5347 0.9263 0.1273 0.1914 0.1691
Day 2 0.2827 0.8051 0.8979 0.3663 -
Day 16 0.9310 0.7601 0.0848 0.3551 0.3927
Day 39 0.3758 0.5106 0.4026 0.0690 0.8353
RNA integrity
Good RNA quality is important for the overall success of RNA based analysis methods
like real time RT-qPCR [73-76]. The RNA degradation level was determined using the lab-
on-a-chip technology of the Agilent Bioanalyzer (Agilent Technologies).
The mean (±SD) RIN value of the blood samples was 8.3 ± 0.3 indicating fully integer total
RNA.
The RIN value of the vaginal smear samples was only 4.5 ± 2.02 (mean ± SD). The
relatively low RNA quality could be due to the fact that cells found in the vaginal smear are
detached, keratinized and partly degraded. Another reason for the low RNA quality results
can be RNases present in the vaginal flora. Due to the low RNA quality, the validation of
qPCR assays was problematic. Primer pairs had to be designed resulting in PCR products
with a length of about 100 bp. This is recommended by Fleige et al for RNA with low
quality [77, 78]. Following these guidelines RT-qPCR for 29 genes (27 candidate genes
and 2 reference genes) could be successfully established.
Results and Discussion
18
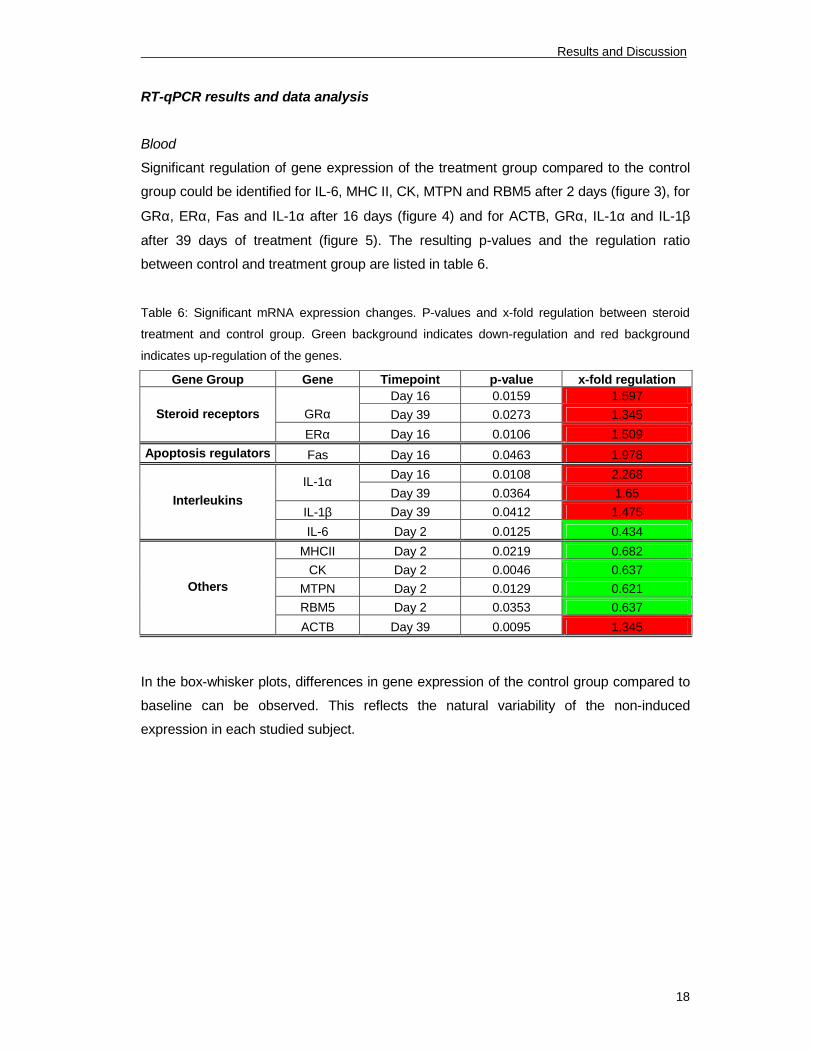
RT-qPCR results and data analysis
Blood
Significant regulation of gene expression of the treatment group compared to the control
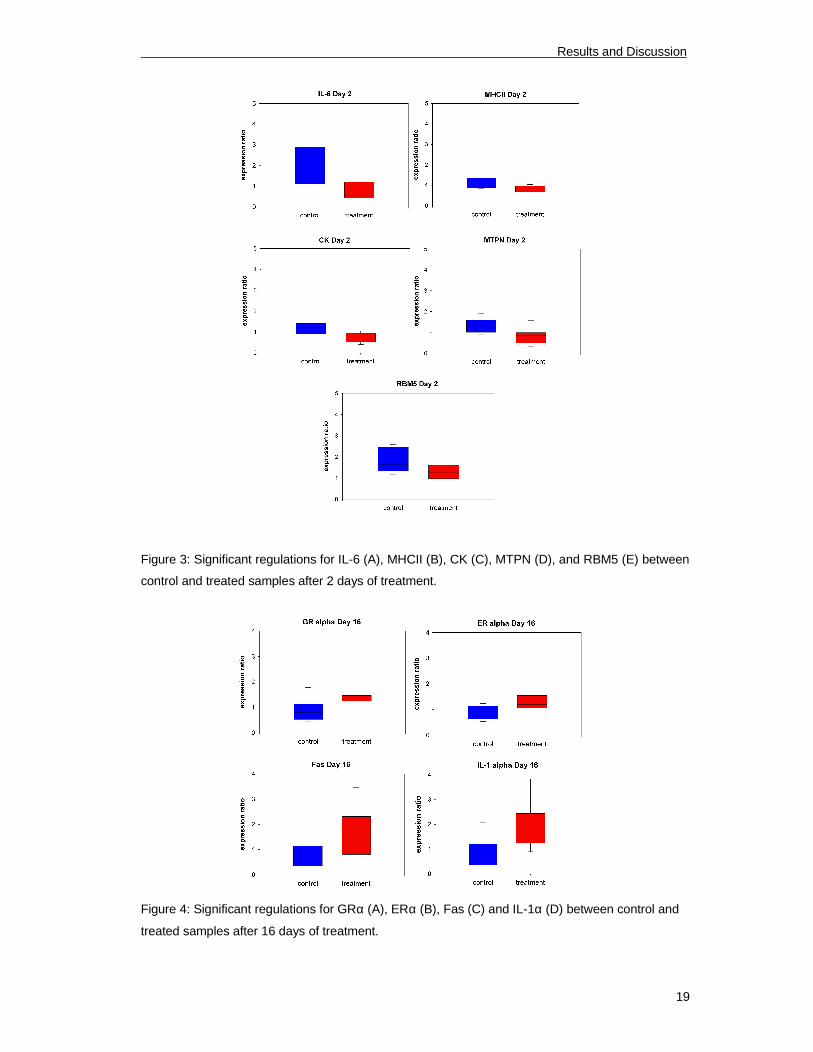
group could be identified for IL-6, MHC II, CK, MTPN and RBM5 after 2 days (figure 3), for
GRα, ERα, Fas and IL-1α after 16 days (figure 4) and for ACTB, GRα, IL-1α and IL-1β
after 39 days of treatment (figure 5). The resulting p-values and the regulation ratio
between control and treatment group are listed in table 6.
Table 6: Significant mRNA expression changes. P-values and x-fold regulation between steroid
treatment and control group. Green background indicates down-regulation and red background
indicates up-regulation of the genes.
Gene Group Gene Timepoint p-value x-fold regulation
Day 16 0.0159 1.597
GRα Day 39 0.0273 1.345Steroid receptors
ERα Day 16 0.0106 1.509
Apoptosis regulators Fas Day 16 0.0463 1.978
Day 16 0.0108 2.268
IL-1α
Day 39 0.0364 1.65
IL-1β Day 39 0.0412 1.475
Interleukins
IL-6 Day 2 0.0125 0.434
MHCII Day 2 0.0219 0.682
CK Day 2 0.0046 0.637
MTPN Day 2 0.0129 0.621
RBM5 Day 2 0.0353 0.637
Others
ACTB Day 39 0.0095 1.345
In the box-whisker plots, differences in gene expression of the control group compared to
baseline can be observed. This reflects the natural variability of the non-induced
expression in each studied subject.
Results and Discussion
19
Figure 3: Significant regulations for IL-6 (A), MHCII (B), CK (C), MTPN (D), and RBM5 (E) between
control and treated samples after 2 days of treatment.
Figure 4: Significant regulations for GRα (A), ERα (B), Fas (C) and IL-1α (D) between control and
treated samples after 16 days of treatment.
Results and Discussion
20
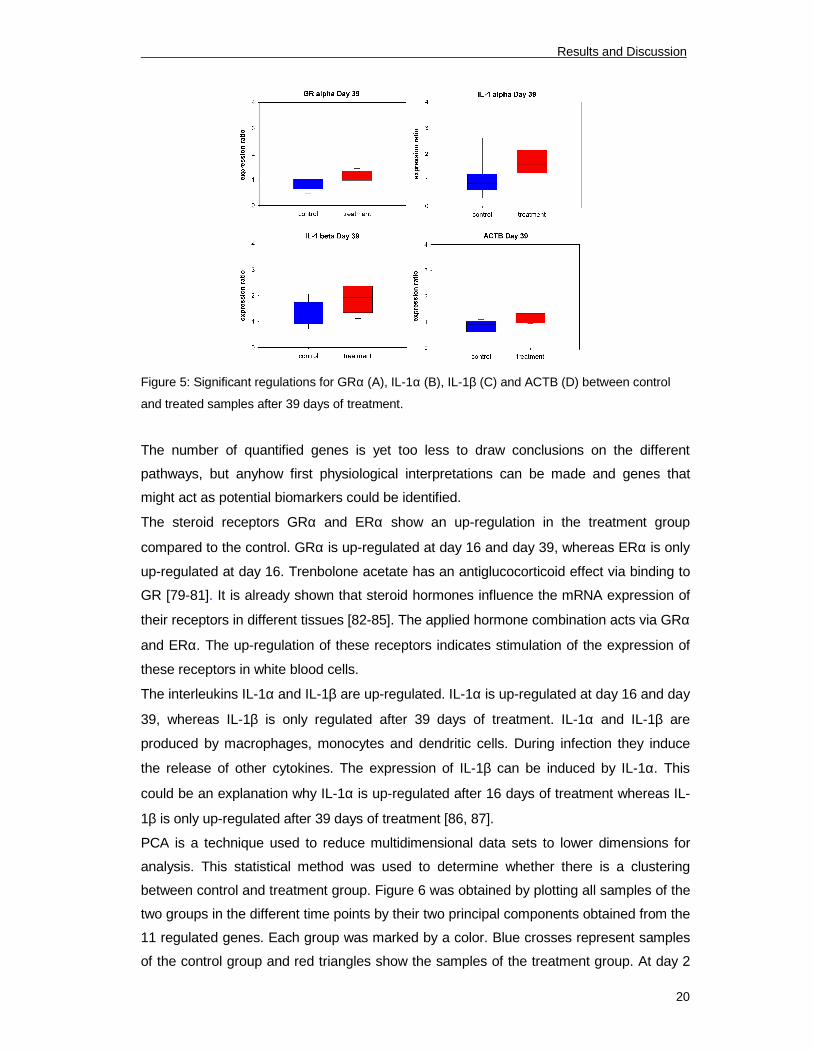
Figure 5: Significant regulations for GRα (A), IL-1α (B), IL-1β (C) and ACTB (D) between control
and treated samples after 39 days of treatment.
The number of quantified genes is yet too less to draw conclusions on the different
pathways, but anyhow first physiological interpretations can be made and genes that
might act as potential biomarkers could be identified.
The steroid receptors GRα and ERα show an up-regulation in the treatment group
compared to the control. GRα is up-regulated at day 16 and day 39, whereas ERα is only
up-regulated at day 16. Trenbolone acetate has an antiglucocorticoid effect via binding to
GR [79-81]. It is already shown that steroid hormones influence the mRNA expression of
their receptors in different tissues [82-85]. The applied hormone combination acts via GRα
and ERα. The up-regulation of these receptors indicates stimulation of the expression of
these receptors in white blood cells.
The interleukins IL-1α and IL-1β are up-regulated. IL-1α is up-regulated at day 16 and day
39, whereas IL-1β is only regulated after 39 days of treatment. IL-1α and IL-1β are
produced by macrophages, monocytes and dendritic cells. During infection they induce
the release of other cytokines. The expression of IL-1β can be induced by IL-1α. This
could be an explanation why IL-1α is up-regulated after 16 days of treatment whereas IL-
1β is only up-regulated after 39 days of treatment [86, 87].
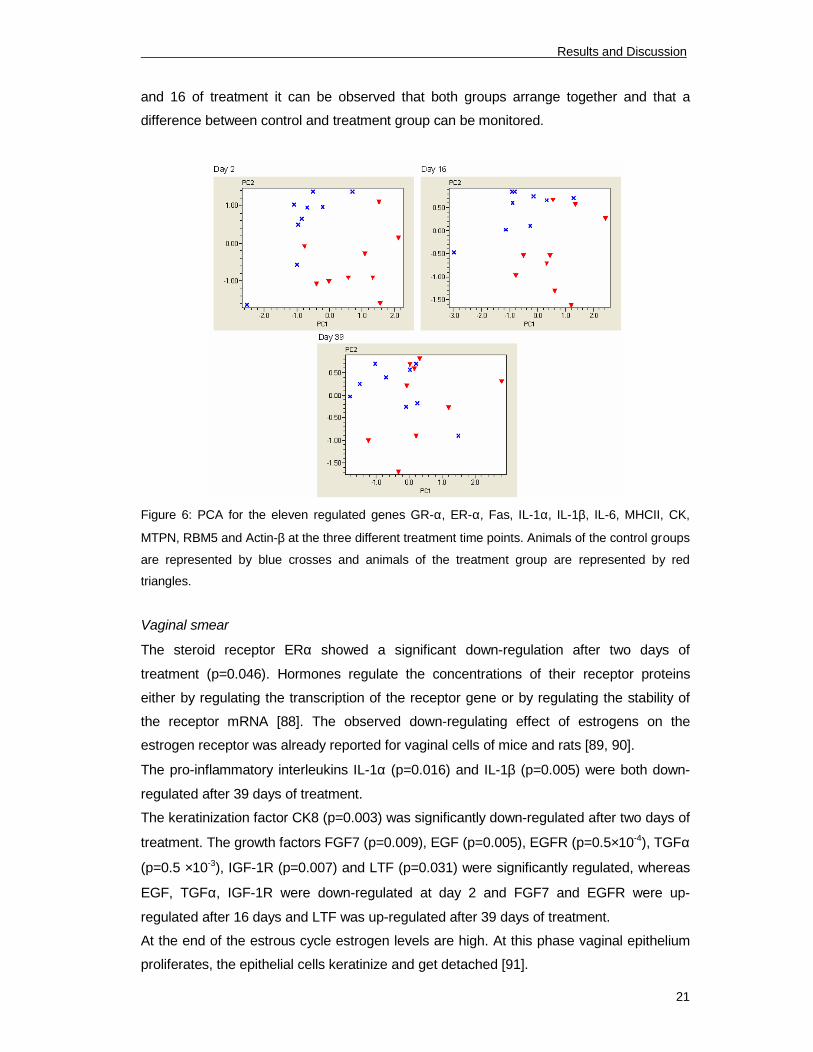
PCA is a technique used to reduce multidimensional data sets to lower dimensions for
analysis. This statistical method was used to determine whether there is a clustering
between control and treatment group. Figure 6 was obtained by plotting all samples of the
two groups in the different time points by their two principal components obtained from the
11 regulated genes. Each group was marked by a color. Blue crosses represent samples
of the control group and red triangles show the samples of the treatment group. At day 2
Results and Discussion
21
and 16 of treatment it can be observed that both groups arrange together and that a
difference between control and treatment group can be monitored.
Figure 6: PCA for the eleven regulated genes GR-α, ER-α, Fas, IL-1α, IL-1β, IL-6, MHCII, CK,
MTPN, RBM5 and Actin-β at the three different treatment time points. Animals of the control groups
are represented by blue crosses and animals of the treatment group are represented by red
triangles.
Vaginal smear
The steroid receptor ERα showed a significant down-regulation after two days of
treatment (p=0.046). Hormones regulate the concentrations of their receptor proteins
either by regulating the transcription of the receptor gene or by regulating the stability of
the receptor mRNA [88]. The observed down-regulating effect of estrogens on the
estrogen receptor was already reported for vaginal cells of mice and rats [89, 90].
The pro-inflammatory interleukins IL-1α (p=0.016) and IL-1β (p=0.005) were both down-
regulated after 39 days of treatment.
The keratinization factor CK8 (p=0.003) was significantly down-regulated after two days of
treatment. The growth factors FGF7 (p=0.009), EGF (p=0.005), EGFR (p=0.5×10⁻⁴
), TGFα
(p=0.5 ×10⁻³
), IGF-1R (p=0.007) and LTF (p=0.031) were significantly regulated, whereas
EGF, TGFα, IGF-1R were down-regulated at day 2 and FGF7 and EGFR were up-
regulated after 16 days and LTF was up-regulated after 39 days of treatment.
At the end of the estrous cycle estrogen levels are high. At this phase vaginal epithelium
proliferates, the epithelial cells keratinize and get detached [91].
Results and Discussion
22
The keratinization factor CK8 is preferentially expressed in epithelial cells, e.g. in vaginal
epithelium. In mice it was already shown that estrogens down-regulate the mRNA
expression of this factor [92]. Factors that are involved in the stimulation of the
proliferation of epithelial cells are the growth factors FGF7, EGF and EGFR [93-95]. FGF7
and EGF stimulate epithelial growth in vaginal epithelium in mice [96-98]. Both factors
were up-regulated after 16 days of treatment. The expression of EGFR was down-
regulated after two days of treatment. The effect of estrogens on mRNA expression of
these three factors was already shown in mice vaginal epithelial cells [99-102]. The
regulation of the growth factors IGF-1R and LTF also goes in line with effects of estrogens
that could already be shown in mice. Miyagawa et al. (2004) reported, that the mRNA
expression of members of the IGF family is regulated by diethylstilbestrol, a synthetic
nonsteroidal estrogen [103]. In this study the down-regulating effect of estrogens on IGF-
1R could also be observed. Sato et al. (2004) demonstrated that neonatal exposure of
mice with diethylstilbestrol results in an up-regulation of EGF and LTF [104, 105].
It is already known that estrogens stimulate LTF mRNA expression in uterine tissue [65,
106] and that LTF is present at various stages of the estrous cycle in human uterus and
vaginal epithelium [65, 107, 108]. This study shows that LTF mRNA expression is
increased by estrogen treatment in the bovine vaginal epithelium. The expression of LAP,
another defensin was not influenced by the treatment.
Most effects on mRNA expression shown in this study were already obvious in mice and
rats. This indicates that the effect of estrogen on the vaginal epithelium is highly
conserved. In the 1950s Edgren et al. (1957, 1959) reported that androgens inhibit vaginal
effects of estrogens like keratinization of the vaginal epithelium [109, 110]. This study
indicates that trenbolone acetate does not show this antagonistic effect.
The oncogene c jun showed a down-regulation at day 2 (p=0.005). Furthermore ACTB
(down-regulation at day 2, p=0.007) and UB3 (down-regulation at day 2, p=0.018, and day
16, p=0.001) were significantly regulated. The expression ratios of all regulated genes are
listed in table 7.
Results and Discussion
23
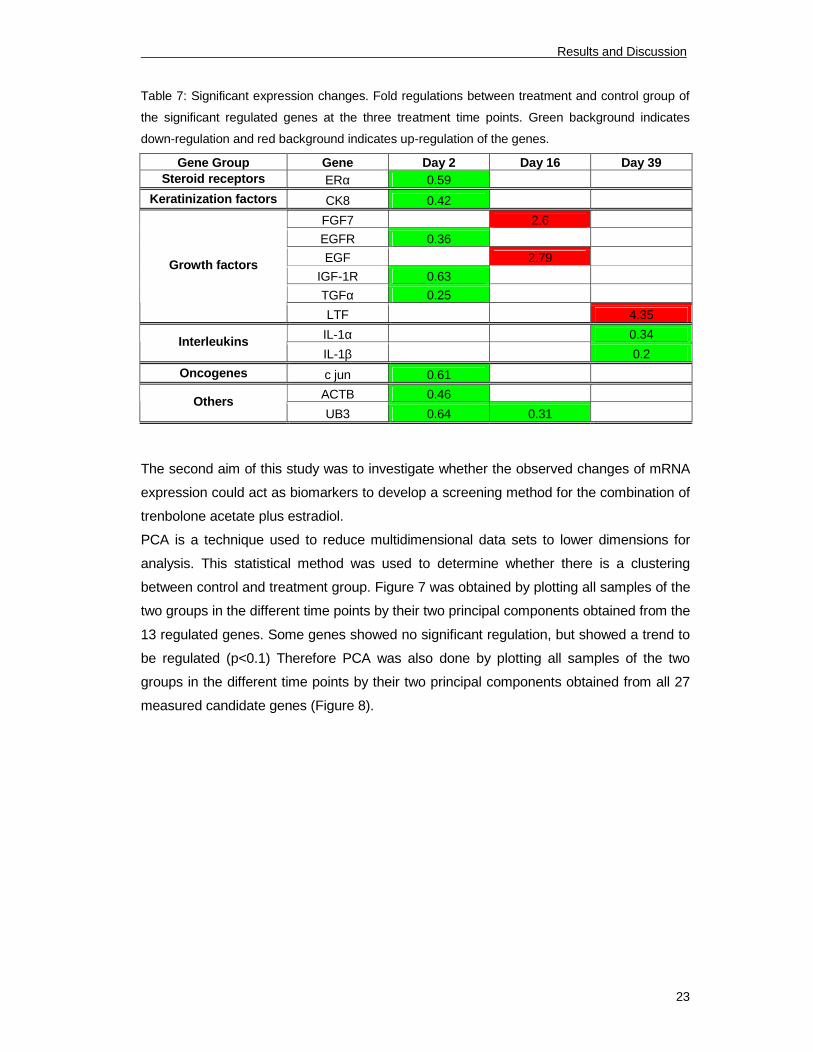
Table 7: Significant expression changes. Fold regulations between treatment and control group of
the significant regulated genes at the three treatment time points. Green background indicates
down-regulation and red background indicates up-regulation of the genes.
Gene Group Gene Day 2 Day 16 Day 39
Steroid receptors ERα 0.59
Keratinization factors CK8 0.42
FGF7 2.6
EGFR 0.36
EGF 2.79
IGF-1R 0.63
TGFα 0.25
Growth factors
LTF 4.35
IL-1α 0.34
Interleukins
IL-1β 0.2
Oncogenes c jun 0.61
ACTB 0.46
Others
UB3 0.64 0.31
The second aim of this study was to investigate whether the observed changes of mRNA
expression could act as biomarkers to develop a screening method for the combination of
trenbolone acetate plus estradiol.
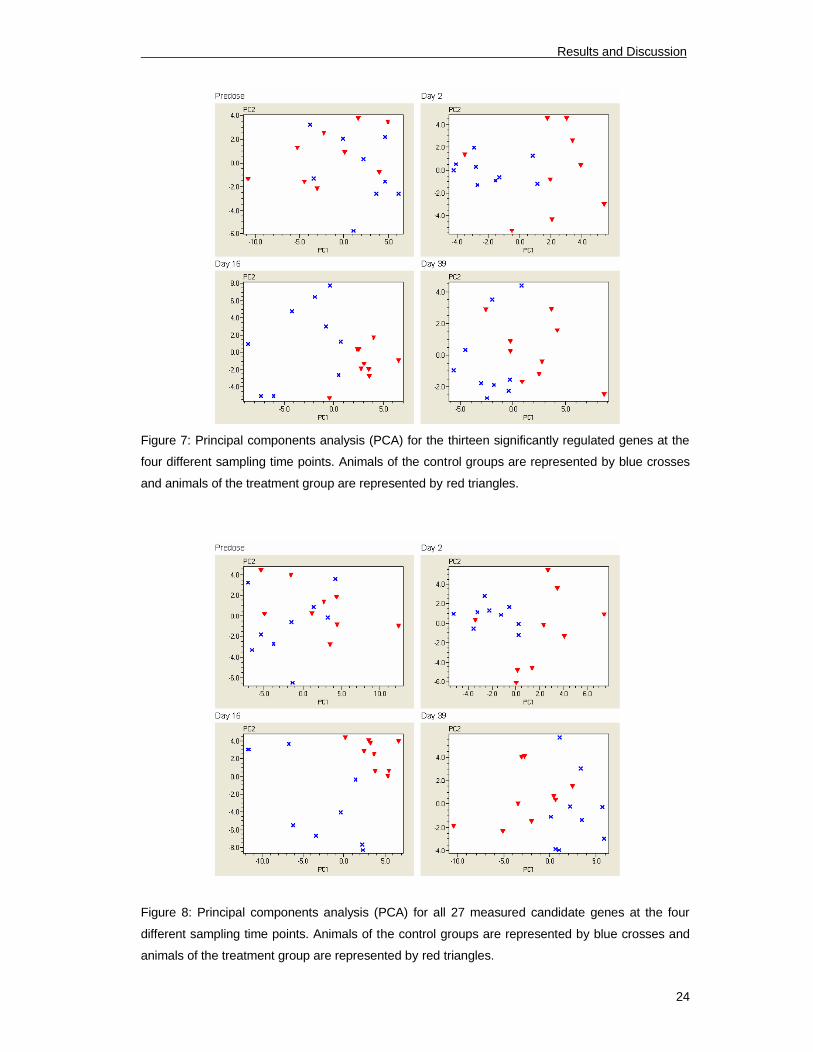
PCA is a technique used to reduce multidimensional data sets to lower dimensions for
analysis. This statistical method was used to determine whether there is a clustering
between control and treatment group. Figure 7 was obtained by plotting all samples of the
two groups in the different time points by their two principal components obtained from the
13 regulated genes. Some genes showed no significant regulation, but showed a trend to
be regulated (p<0.1) Therefore PCA was also done by plotting all samples of the two
groups in the different time points by their two principal components obtained from all 27
measured candidate genes (Figure 8).
Results and Discussion
24
Figure 7: Principal components analysis (PCA) for the thirteen significantly regulated genes at the
four different sampling time points. Animals of the control groups are represented by blue crosses
and animals of the treatment group are represented by red triangles.
Figure 8: Principal components analysis (PCA) for all 27 measured candidate genes at the four
different sampling time points. Animals of the control groups are represented by blue crosses and
animals of the treatment group are represented by red triangles.
Results and Discussion
25
At all three treatment time points both groups arrange together and a difference between
control and treatment group can be monitored. Before treatment the groups show no
difference in gene expression of analyzed target genes. This effect is better visible using
all 27 quantified genes.
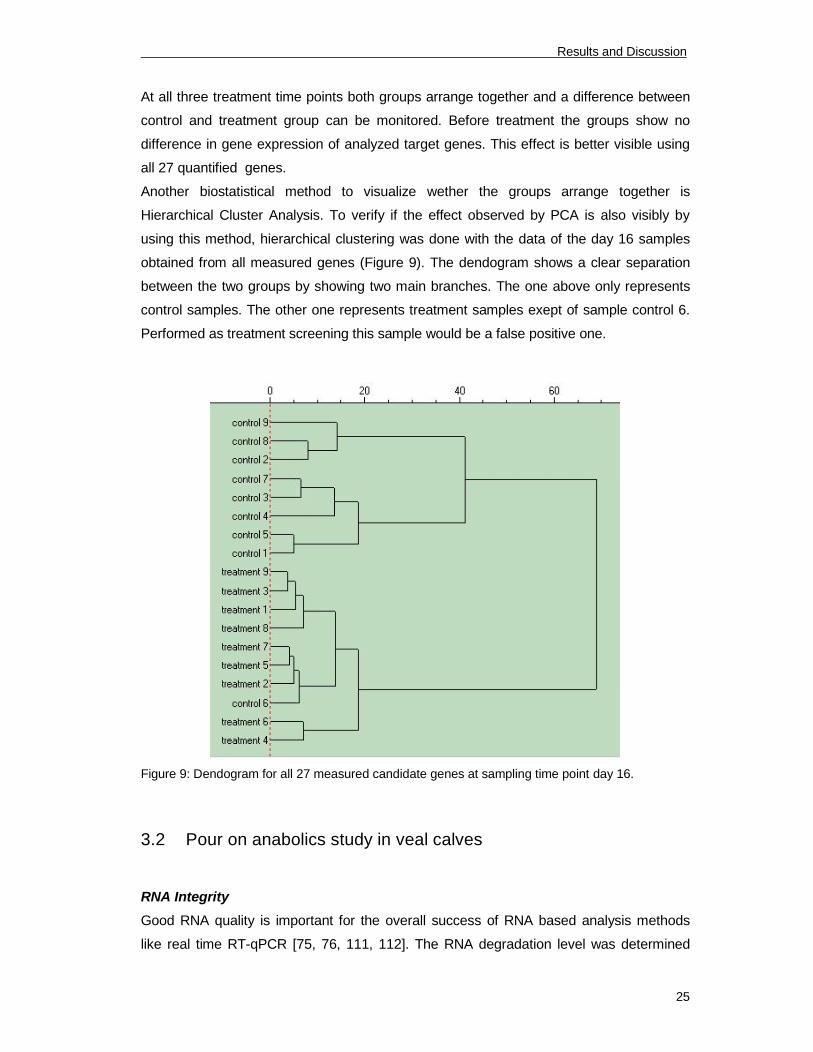
Another biostatistical method to visualize wether the groups arrange together is
Hierarchical Cluster Analysis. To verify if the effect observed by PCA is also visibly by
using this method, hierarchical clustering was done with the data of the day 16 samples
obtained from all measured genes (Figure 9). The dendogram shows a clear separation
between the two groups by showing two main branches. The one above only represents
control samples. The other one represents treatment samples exept of sample control 6.
Performed as treatment screening this sample would be a false positive one.
Figure 9: Dendogram for all 27 measured candidate genes at sampling time point day 16.
3.2 Pour on anabolics study in veal calves
RNA Integrity
Good RNA quality is important for the overall success of RNA based analysis methods
like real time RT-qPCR [75, 76, 111, 112]. The RNA degradation level was determined
Results and Discussion
26
using the lab-on-a-chip technology of the Agilent Bioanalyzer (Agilent Technologies). The
RIN value of the blood samples was 8.5 ± 0.4 (mean ± SD) indicating well intact RNA.
Primer testing
Primer pairs of 32 genes were successfully used in RT-qPCR analysis to get single peaks
and uniform melting curves.
RT-qPCR results and data analysis
The carrier control group (CC) showed no significant differences in gene expression
compared to the untreated control group and hence the two groups were layed together
as one control group of 10 animals for further analyses.
There were no significant differences in the expression of measured target genes 2 and 7
days after treatment start. The steroid receptors ERα, ERβ and GRα were significantly
down-regulated in the T3 group, whereas GRα was regulated 14 (p=0.006), ERβ 63
(p=0.031) and ERα 63 (p=0.054) and 91 (p=0.003) days after treatment start. The
apoptosis regulators FasL and TNFα were significantly down-regulated in the T3 group,
whereas FasL was only regulated 63 days (p=0.050) and TNFα showed a significant
regulation 14 (p=0.0005), 21 (p=0.002) and 63 (p=0.004) days after treatment start. The
pro-inflammatory factor IL-12B was significantly down-regulated in the T3 group 63 days
after treatment start (p=0.010). The transcription factor NFκB showed a significant down-
regulation in the T1 (p=0.011) and the T3 group (p=0.012) 63 days after treatment start.
CD4 was significantly down-regulated in the T3 group 35 days after treatment start
(p=0.025). ACTB was significantly up-regulated in the T3 group 91 days after treatment
start (p=0.035) and UB 3 was significantly down-regulated in the T3 group 35 days after
treatment start (p=0.045). Table 8 shows the x-fold regulations of all significantly regulated
genes at each time point.
Results and Discussion
27
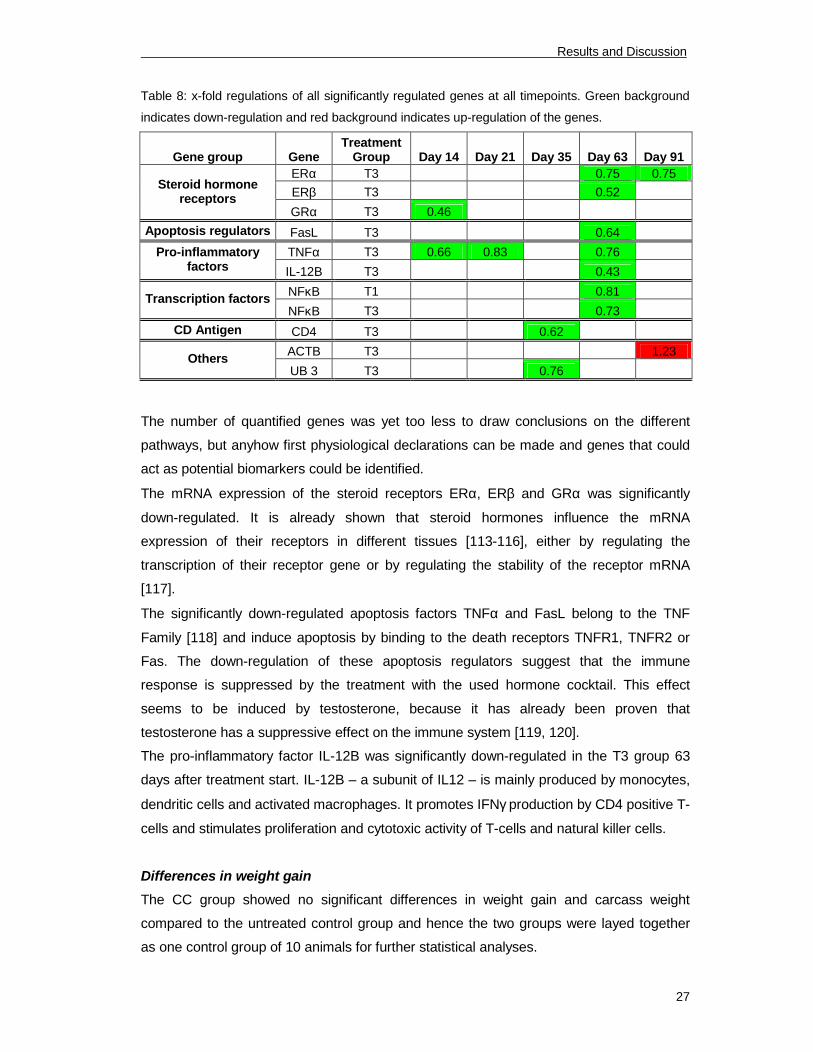
Table 8: x-fold regulations of all significantly regulated genes at all timepoints. Green background
indicates down-regulation and red background indicates up-regulation of the genes.
Gene group Gene
Treatment
Group Day 14 Day 21 Day 35 Day 63 Day 91
ERα T3 0.75 0.75
ERβ T3 0.52
Steroid hormone
receptors
GRα T3 0.46
Apoptosis regulators FasL T3 0.64
TNFα T3 0.66 0.83 0.76Pro-inflammatory
factorsIL-12B T3 0.43
NFκB T1 0.81
Transcription factors
NFκB T3 0.73
CD Antigen CD4 T3 0.62
ACTB T3 1.23
Others
UB 3 T3 0.76
The number of quantified genes was yet too less to draw conclusions on the different
pathways, but anyhow first physiological declarations can be made and genes that could
act as potential biomarkers could be identified.
The mRNA expression of the steroid receptors ERα, ERβ and GRα was significantly
down-regulated. It is already shown that steroid hormones influence the mRNA
expression of their receptors in different tissues [113-116], either by regulating the
transcription of their receptor gene or by regulating the stability of the receptor mRNA
[117].
The significantly down-regulated apoptosis factors TNFα and FasL belong to the TNF
Family [118] and induce apoptosis by binding to the death receptors TNFR1, TNFR2 or
Fas. The down-regulation of these apoptosis regulators suggest that the immune
response is suppressed by the treatment with the used hormone cocktail. This effect
seems to be induced by testosterone, because it has already been proven that
testosterone has a suppressive effect on the immune system [119, 120].
The pro-inflammatory factor IL-12B was significantly down-regulated in the T3 group 63
days after treatment start. IL-12B – a subunit of IL12 – is mainly produced by monocytes,
dendritic cells and activated macrophages. It promotes IFNγ production by CD4 positive T-
cells and stimulates proliferation and cytotoxic activity of T-cells and natural killer cells.
Differences in weight gain
The CC group showed no significant differences in weight gain and carcass weight
compared to the untreated control group and hence the two groups were layed together
as one control group of 10 animals for further statistical analyses.
Results and Discussion
28
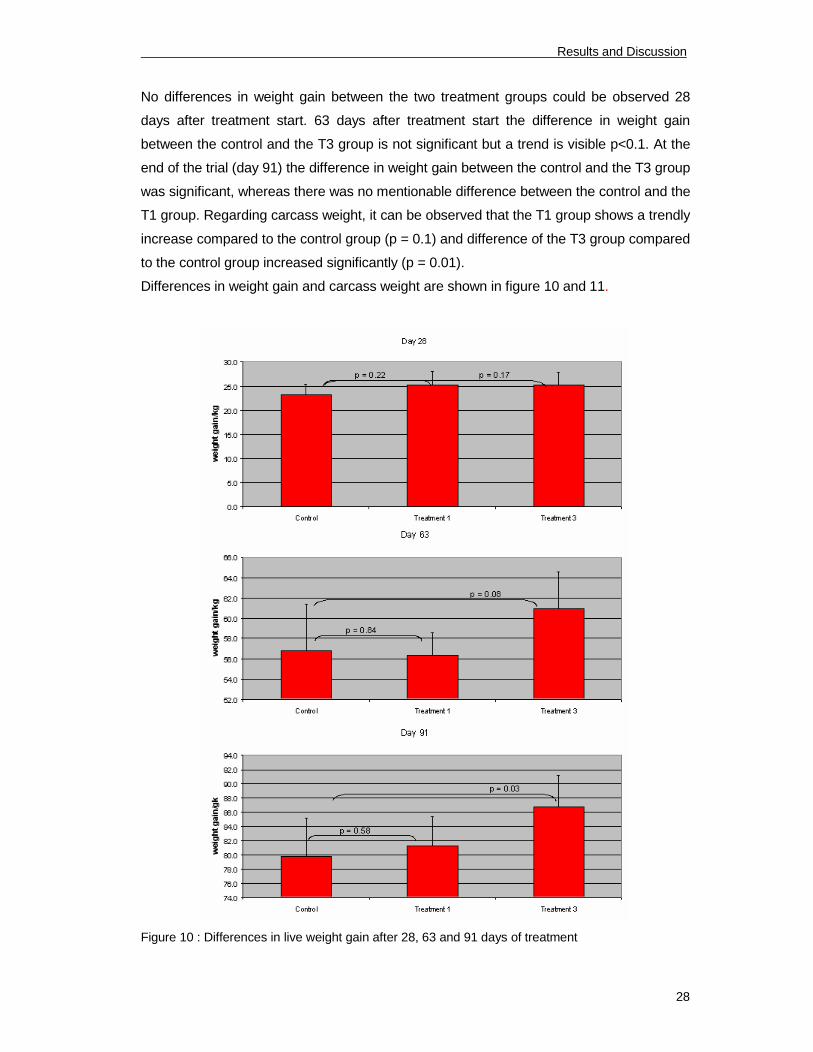
No differences in weight gain between the two treatment groups could be observed 28
days after treatment start. 63 days after treatment start the difference in weight gain
between the control and the T3 group is not significant but a trend is visible p<0.1. At the
end of the trial (day 91) the difference in weight gain between the control and the T3 group
was significant, whereas there was no mentionable difference between the control and the
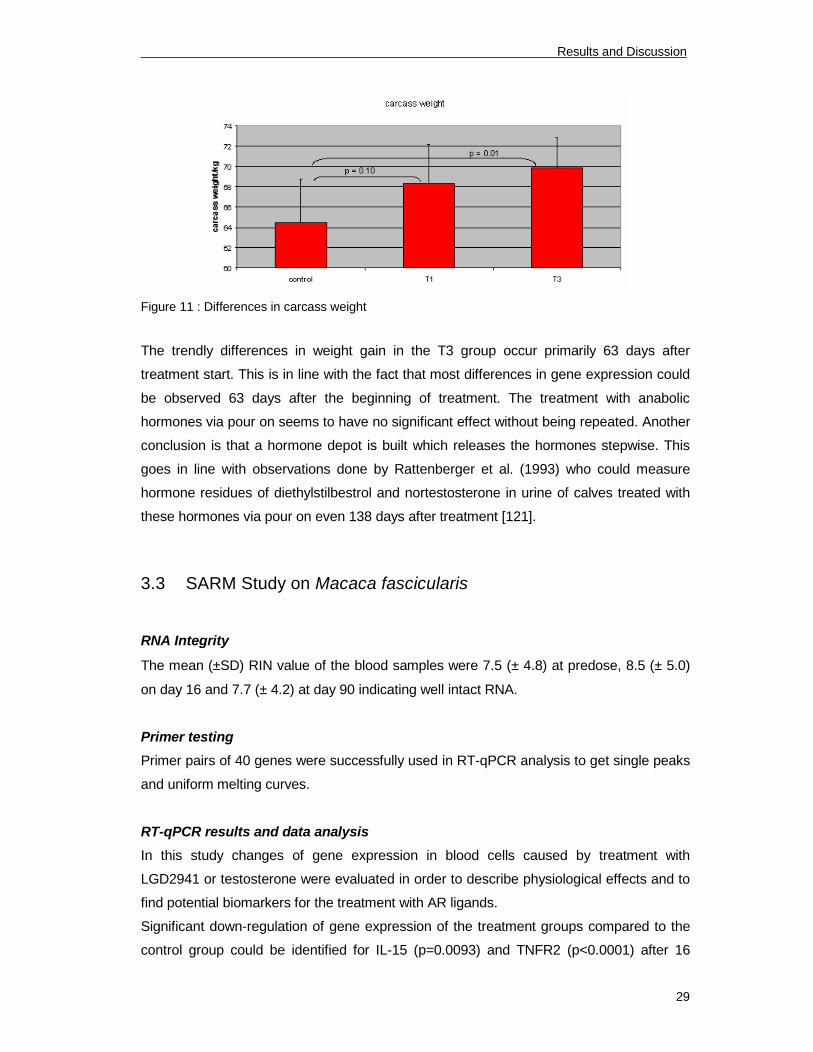
T1 group. Regarding carcass weight, it can be observed that the T1 group shows a trendly
increase compared to the control group (p = 0.1) and difference of the T3 group compared
to the control group increased significantly (p = 0.01).
Differences in weight gain and carcass weight are shown in figure 10 and 11.
Figure 10 : Differences in live weight gain after 28, 63 and 91 days of treatment
Results and Discussion
29
Figure 11 : Differences in carcass weight
The trendly differences in weight gain in the T3 group occur primarily 63 days after
treatment start. This is in line with the fact that most differences in gene expression could
be observed 63 days after the beginning of treatment. The treatment with anabolic
hormones via pour on seems to have no significant effect without being repeated. Another
conclusion is that a hormone depot is built which releases the hormones stepwise. This
goes in line with observations done by Rattenberger et al. (1993) who could measure
hormone residues of diethylstilbestrol and nortestosterone in urine of calves treated with
these hormones via pour on even 138 days after treatment [121].
3.3 SARM Study on Macaca fascicularis
RNA Integrity
The mean (±SD) RIN value of the blood samples were 7.5 (± 4.8) at predose, 8.5 (± 5.0)
on day 16 and 7.7 (± 4.2) at day 90 indicating well intact RNA.
Primer testing
Primer pairs of 40 genes were successfully used in RT-qPCR analysis to get single peaks
and uniform melting curves.
RT-qPCR results and data analysis
In this study changes of gene expression in blood cells caused by treatment with
LGD2941 or testosterone were evaluated in order to describe physiological effects and to
find potential biomarkers for the treatment with AR ligands.
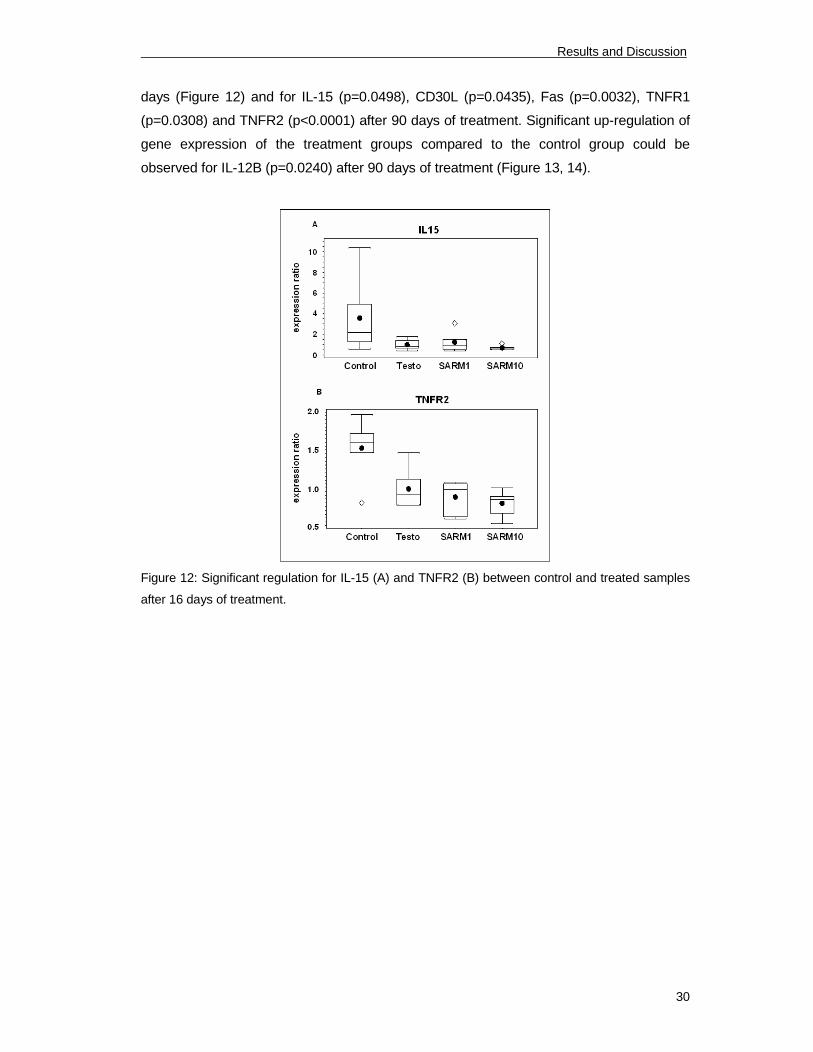
Significant down-regulation of gene expression of the treatment groups compared to the
control group could be identified for IL-15 (p=0.0093) and TNFR2 (p<0.0001) after 16
Results and Discussion
30
days (Figure 12) and for IL-15 (p=0.0498), CD30L (p=0.0435), Fas (p=0.0032), TNFR1
(p=0.0308) and TNFR2 (p<0.0001) after 90 days of treatment. Significant up-regulation of
gene expression of the treatment groups compared to the control group could be
observed for IL-12B (p=0.0240) after 90 days of treatment (Figure 13, 14).
Figure 12: Significant regulation for IL-15 (A) and TNFR2 (B) between control and treated samples
after 16 days of treatment.
Results and Discussion
31
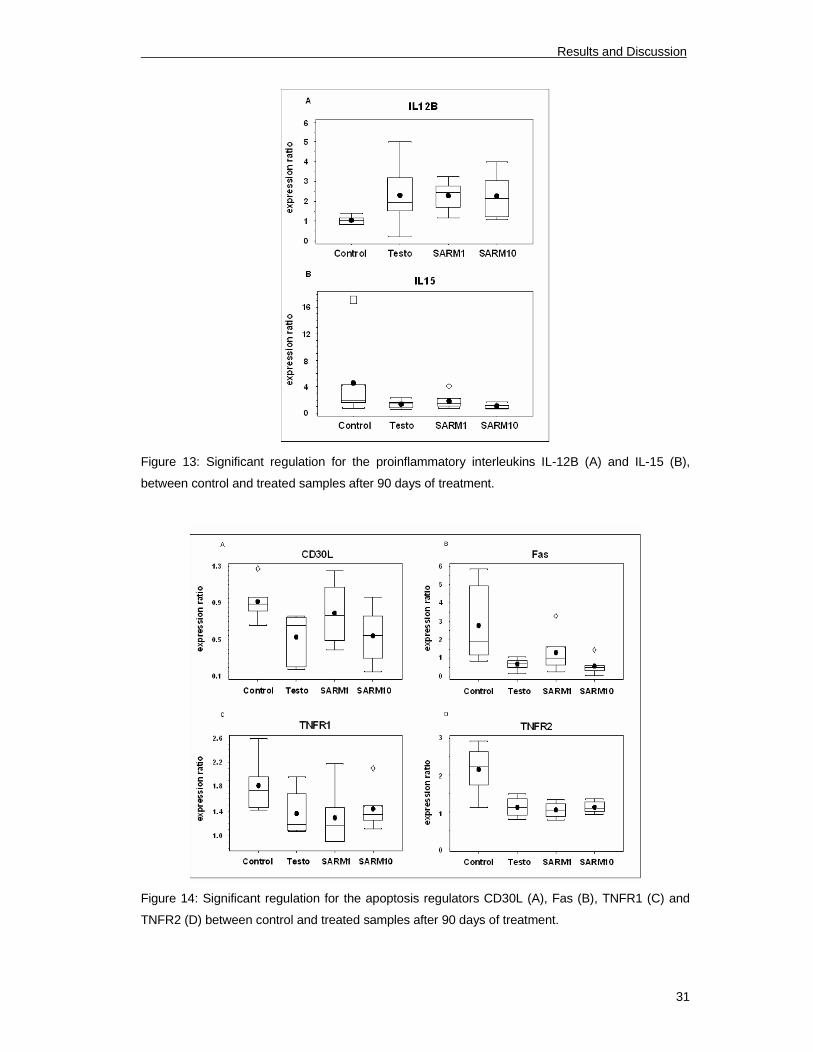
Figure 13: Significant regulation for the proinflammatory interleukins IL-12B (A) and IL-15 (B),
between control and treated samples after 90 days of treatment.
Figure 14: Significant regulation for the apoptosis regulators CD30L (A), Fas (B), TNFR1 (C) and
TNFR2 (D) between control and treated samples after 90 days of treatment.
Results and Discussion
32
Regarding the Box-whisker plots it can be monitored that the statistical variance in the
control group is higher than in the treatment groups. The reason for this could be the
natural variability of the non induced expression in each studied subject. Suppression of
gene expression by an external stimulus like treatment with testosterone or the SARM
reduces natural variability of gene expression.
The main physiological effect that could be observed in this study is the down-regulation
of various apoptotic marker genes in all three treatment groups. This is shown by the
significant regulation (p<0.05) of the apoptosis receptors Fas, TNFR1, TNFR2 and the
apoptosis ligand CD30L. All regulated apoptosis factors belong either to the TNF Family
(CD30L) or to the TNF-Receptor Family (TNFR1, TNFR2, Fas) [122]. The down-regulation
of these apoptosis regulators suggest that the immune response is suppressed by the
treatment with testosterone and the SARM. This is consistent with the fact that
testosterone has a suppressive effect on the immune system [123, 124]. If the
physiological effects of testosterone and the SARM are compared it became obvious that
the SARM is similarly active to natural androgens.
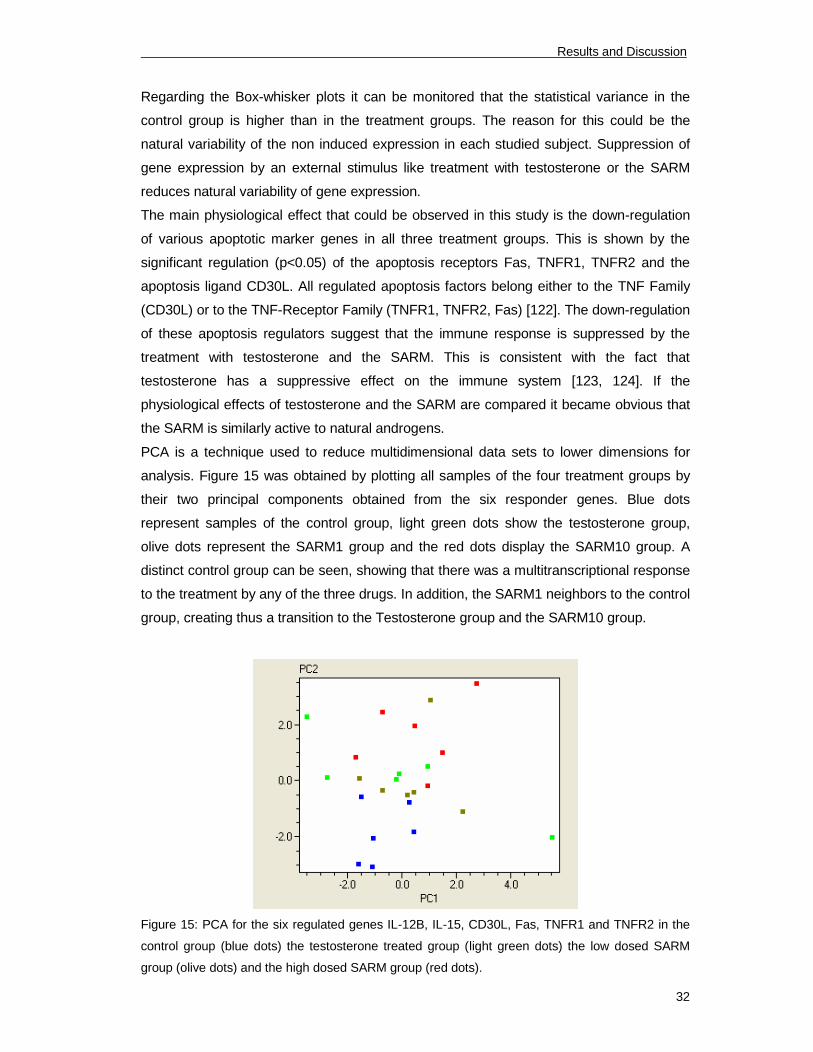
PCA is a technique used to reduce multidimensional data sets to lower dimensions for
analysis. Figure 15 was obtained by plotting all samples of the four treatment groups by
their two principal components obtained from the six responder genes. Blue dots
represent samples of the control group, light green dots show the testosterone group,
olive dots represent the SARM1 group and the red dots display the SARM10 group. A
distinct control group can be seen, showing that there was a multitranscriptional response
to the treatment by any of the three drugs. In addition, the SARM1 neighbors to the control
group, creating thus a transition to the Testosterone group and the SARM10 group.
Figure 15: PCA for the six regulated genes IL-12B, IL-15, CD30L, Fas, TNFR1 and TNFR2 in the
control group (blue dots) the testosterone treated group (light green dots) the low dosed SARM
group (olive dots) and the high dosed SARM group (red dots).
Results and Discussion
33
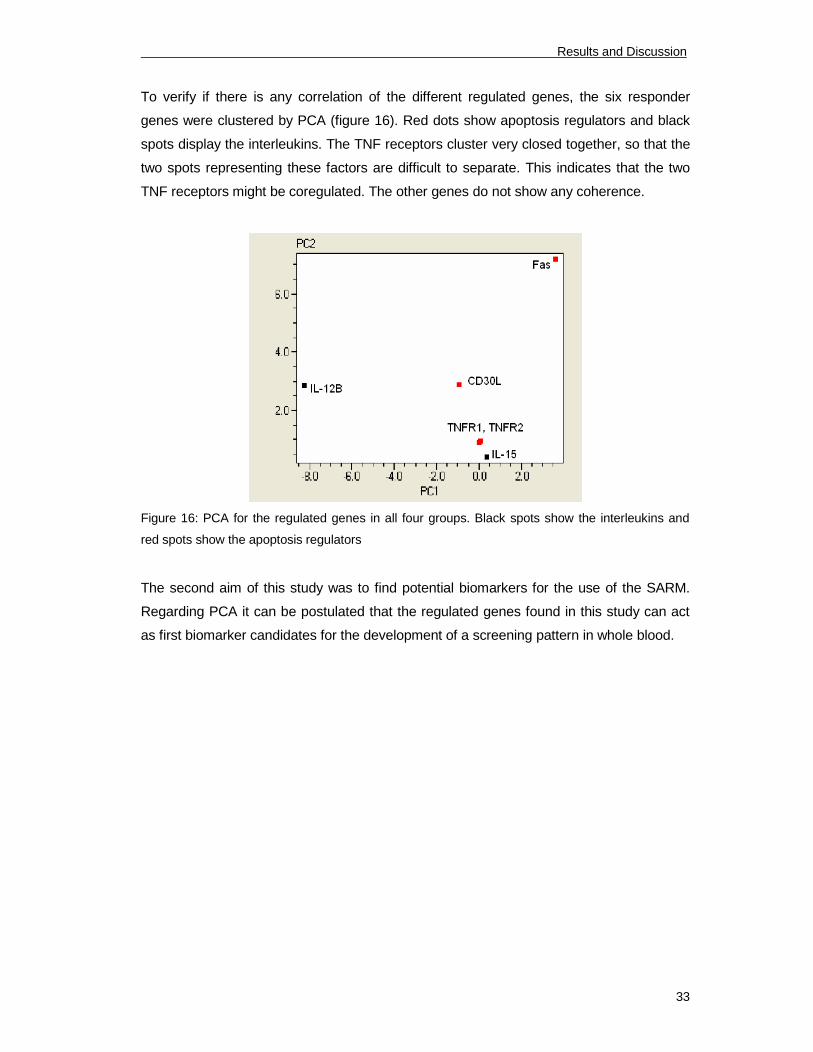
To verify if there is any correlation of the different regulated genes, the six responder
genes were clustered by PCA (figure 16). Red dots show apoptosis regulators and black
spots display the interleukins. The TNF receptors cluster very closed together, so that the
two spots representing these factors are difficult to separate. This indicates that the two
TNF receptors might be coregulated. The other genes do not show any coherence.
Figure 16: PCA for the regulated genes in all four groups. Black spots show the interleukins and
red spots show the apoptosis regulators
The second aim of this study was to find potential biomarkers for the use of the SARM.
Regarding PCA it can be postulated that the regulated genes found in this study can act
as first biomarker candidates for the development of a screening pattern in whole blood.
Conclusions and Perspectives
34
4 Conclusions and Perspectives
In all three animal trials included in this thesis the potential of gene expression analysis for
developing a new screening method to trace the use of anabolic steroid hormones is
examined. Combined with biostatistical methods, like PCA or hierarchical cluster analysis
this approach seems to be auspicious.
Although the quality of RNA obtained from bovine vaginal smear is poor, gene expression
data in combination with PCA or hierarchical cluster analysis show promising results for
the development of potential gene expression biomarkers. Both biostatistical methods
show a clear clustering of the treatment groups. The disadvantage of this matrix is, that
vaginal smear is only available from female animals. Regarding this, blood samples
display a better matrix, because blood can be taken from the living animal independent of
gender.
In all three animal trials, changes in gene expression could be quantified in blood
samples. Comparing the results obtained from the bovine animal trials it could be
observed that only a few genes show expression changes in both studies. Genes like the
steroid receptors ERα and GRα are regulated in both experiments but are regulated in
different directions. The only gene whose mRNA expression is similarly regulated in both
studies is ACTB. Comparing the results obtained from blood samples of the bovine trials
and the SARM study it could be shown that only Fas and IL-12B are regulated in both
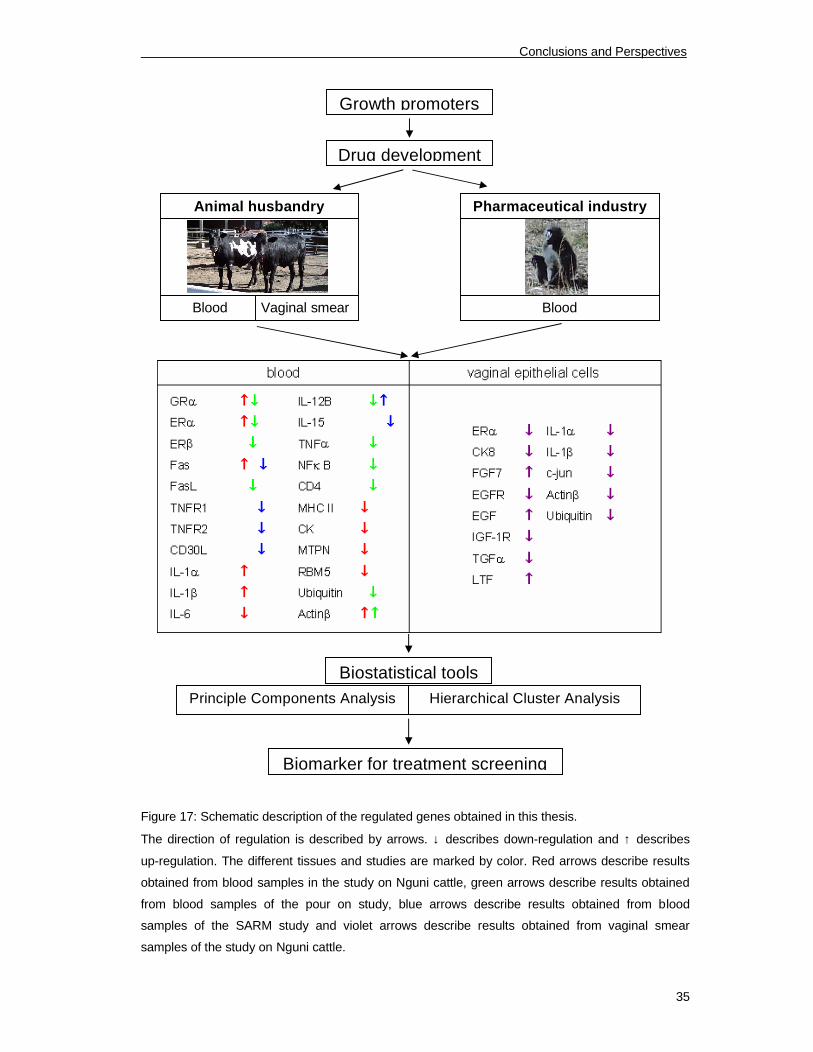
systems, whereas the genes are regulated in different directions. Figure 17 presents an
overview of all regulated genes obtained from the three animal trials.
These results indicate that the influence of anabolic steroid hormones on gene expression
in blood is species specific and dependent on breed, age, application method and
possibly the applied hormone.
Conclusions and Perspectives
35
Figure 17: Schematic description of the regulated genes obtained in this thesis.
The direction of regulation is described by arrows. ↓ describes down-regulation and ↑ describes
up-regulation. The different tissues and studies are marked by color. Red arrows describe results
obtained from blood samples in the study on Nguni cattle, green arrows describe results obtained
from blood samples of the pour on study, blue arrows describe results obtained from blood
samples of the SARM study and violet arrows describe results obtained from vaginal smear
samples of the study on Nguni cattle.
Blood Vaginal smear
Growth promoters
Biostatistical tools
Biomarker for treatment screening
Drug development
Animal husbandry Pharmaceutical industry
Blood
Principle Components Analysis Hierarchical Cluster Analysis
Conclusions and Perspectives
36
In all three studies the method of PCA was employed to prove if a treatment pattern is
visible. Using results obtained from blood samples in the trial on Nguni heifers and the
SARM study, clustering of the treatment groups is visible.
Regarding the pour on trial, most changes in gene expression are present 63 days after
treatment start, but only in the three times treated group. Obtained gene expression
changes are minimal so that biostatistical tools like PCA or hierarchical cluster analysis do
not show any successful clustering of the animals.
Although weight gain results of the pour on trial indicate that application of anabolic
hormones via pour on show the intended anabolic effect, the use of anabolic steroid
hormones by this application method seems not to be detectable on the level of gene
expression in blood. This indicates first problems of using gene expression analysis for
the development of a new method to screen for a broad range of anabolic agents
independent of their way of application. Nevertheless, to determine if the use of gene
expression changes to develop a biomarker pattern for the use of anabolic agents is still
promising, other tissues, like liver, kidney or different hormone responsive muscles have
to be taken into account.
To develop a screening method by regarding physiological effects of anabolic hormones
in blood, the additional use of other omic technologies like proteomics or metabolomics
will be a promising way. From the literature it is known that the blood levels of different
proteins, like IGF-1, IGF-1BP3, GH, HDL-C or LDL-C are changed by the treatment of
anabolic agents. Regarding metabolomics, most is known about the influence of β-
-methylhistidine, creatinine, non-esterified fatty
acids or natural catecholamines are influenced by the use of β-agonists [38]. There have
also been efforts to detect perturbations in the metabolic profile after the administration of
steroid hormones to reveal the illict application as growth promoters. Blood metabolites
like creatinine or creatine kinase, which are associated with muscle function, or the
plasma urea levels, which are known to be an early indicator for anabolic effects in cattle,
could serve as potential biomarkers for treatment screening [38].
The combination of transcriptomics, proteomics and metabolomics with special
biostatistical methods, like hierarchical cluster analysis, canonical correlation analysis and
linear or multiple discriminant analysis will be a new perspective for developing a new
screening method to trace the abuse of anabolic steroid hormones [38].

References
37
5 References
1. Meyer, H. H. D. Biochemistry and physiology of anabolic hormones used for
improvement of meat production. APMIS. 2001; 109: 1-8
2. Lange, I. G., Daxenberger, A., and Meyer, H. H. Hormone contents in peripheral
tissues after correct and off-label use of growth promoting hormones in
cattle: effect of the implant preparations Filaplix-H, Raglo, Synovex-H and
Synovex Plus. APMIS. 2001; 109: 53-65
3. Meyer, H. H. D. Biochemistry and physiology of anabolic hormones used for
improvement of meat production. APMIS. 2001; 109: 1-8
4. Hau, M. Regulation of male traits by testosterone: implications for the evolution of
vertebrate life histories. Bioessays. 2007; 29: 133-144
5. Saudan, C., Baume, N., Robinson, N., Avois, L., Mangin, P., and Saugy, M.
Testosterone and doping control. Br.J.Sports Med. 2006; 40 Suppl 1: i21-
i24
6. Lange, I. G., Daxenberger, A., and Meyer, H. H. Hormone contents in peripheral
tissues after correct and off-label use of growth promoting hormones in
cattle: effect of the implant preparations Filaplix-H, Raglo, Synovex-H and
Synovex Plus. APMIS. 2001; 109: 53-65
7. Moran, C., Quirke, J. F., Prendiville, D. J., Bourke, S., and Roche, J. F. The effect
of estradiol, trenbolone acetate, or zeranol on growth rate, mammary
development, carcass traits, and plasma estradiol concentrations of beef
heifers. J.Anim Sci. 1991; 69: 4249-4258
8. Lange, I. G., Daxenberger, A., and Meyer, H. H. Hormone contents in peripheral
tissues after correct and off-label use of growth promoting hormones in
cattle: effect of the implant preparations Filaplix-H, Raglo, Synovex-H and
Synovex Plus. APMIS. 2001; 109: 53-65
9. Daxenberger, A., Ibarreta, D., and Meyer, H. H. D. Possible health impact of
animal oestrogens in food. Hum.Reprod.Update. 2001; 7: 340-355
10. Swan, S. H., Liu, F., Overstreet, J. W., Brazil, C., and Skakkebaek, N. E. Semen
quality of fertile US males in relation to their mothers' beef consumption
during pregnancy. Hum.Reprod. 2007; 22: 1497-1502
11. Maume, D., Deceuninck, Y., Pouponneau, K., Paris, A., Le Bizec, B., and Andre,
F. Assessment of estradiol and its metabolites in meat. APMIS. 2001; 109:
32-38
12. Meyer, H. H. D. Biochemistry and physiology of anabolic hormones used for
improvement of meat production. APMIS. 2001; 109: 1-8
13. Lange, I. G., Daxenberger, A., and Meyer, H. H. Hormone contents in peripheral
tissues after correct and off-label use of growth promoting hormones in
cattle: effect of the implant preparations Filaplix-H, Raglo, Synovex-H and
Synovex Plus. APMIS. 2001; 109: 53-65
References
38
14. Daxenberger, A., Ibarreta, D., and Meyer, H. H. D. Possible health impact of
animal oestrogens in food. Hum.Reprod.Update. 2001; 7: 340-355
15. Moran, C., Quirke, J. F., Prendiville, D. J., Bourke, S., and Roche, J. F. The effect
of estradiol, trenbolone acetate, or zeranol on growth rate, mammary
development, carcass traits, and plasma estradiol concentrations of beef
heifers. J.Anim Sci. 1991; 69: 4249-4258
16. Schilt, R., Groot, M. J., Berende, P. L., Ramazza, V., Ossenkoppele, J. S.,
Haasnoot, W., Van Bennekom, E. O., Brouwer, L., and Hooijerink, H. Pour
on application of growth promoters in veal calves: analytical and
histological results. Analyst. 1998; 123: 2665-2670
17. Stephany, R. W. Hormones in meat: different approaches in the EU and in the
USA. APMIS Suppl. 2001; S357-S363
18. Walsh, M. C., Hunter, G. R., and Livingstone, M. B. Sarcopenia in premenopausal
and postmenopausal women with osteopenia, osteoporosis and normal
bone mineral density. Osteoporos.Int. 2006; 17: 61-67
19. Morley, J. E. Anorexia, sarcopenia, and aging. Nutrition. 2001; 17: 660-663
20. Morley, J. E., Kim, M. J., and Haren, M. T. Frailty and hormones.
Rev.Endocr.Metab Disord. 2005; 6: 101-108
21. Morley, J. E., Baumgartner, R. N., Roubenoff, R., Mayer, J., and Nair, K. S.
Sarcopenia. J.Lab Clin.Med. 2001; 137: 231-243
22. Marcell, T. J. Sarcopenia: causes, consequences, and preventions. J.Gerontol.A
Biol.Sci.Med.Sci. 2003; 58: M911-M916
23. Morley, J. E., Kim, M. J., and Haren, M. T. Frailty and hormones.
Rev.Endocr.Metab Disord. 2005; 6: 101-108
24. Lopez, F. J. New approaches to the treatment of osteoporosis.
Curr.Opin.Chem.Biol. 2000; 4: 383-393
25. Deschenes, M. R. Effects of aging on muscle fibre type and size. Sports Med.
2004; 34: 809-824
26. Doherty, T. J. Invited review: Aging and sarcopenia. J.Appl.Physiol. 2003; 95:
1717-1727
27. Negro-Vilar, A. Selective androgen receptor modulators (SARMs): a novel
approach to androgen therapy for the new millennium.
J.Clin.Endocrinol.Metab. 1999; 84: 3459-3462
28. Negro-Vilar, A. Selective androgen receptor modulators (SARMs): a novel
approach to androgen therapy for the new millennium.
J.Clin.Endocrinol.Metab. 1999; 84: 3459-3462
29. Meyer, H. H. D. and Hoffmann, S. Development of a sensitive microtitration plate
enzyme-immunoassay for the anabolic steroid trenbolone. Food
Addit.Contam. 1987; 4: 149-160
30. Meyer, H. H. D., Rinke, L., and Dursch, I. Residue screening for the beta-agonists
clenbuterol, salbutamol and cimaterol in urine using enzyme immunoassay

References
39
and high-performance liquid chromatography. J.Chromatogr. 4-5-1991;
564: 551-556
31. Scippo, M. L., Degand, G., Duyckaerts, A., Maghuin-Rogister, G., and Delahaut, P.
Control of the illegal administration of natural steroid hormones in the
plasma of bulls and heifers. Analyst. 1994; 119: 2639-2644
32. van Ginkel, L. A. Immunoaffinity chromatography, its applicability and limitations in
multi-residue analysis of anabolizing and doping agents. J.Chromatogr. 4-
5-1991; 564: 363-384
33. Becker, K. F., Metzger, V., Hipp, S., and Hofler, H. Clinical proteomics: new trends
for protein microarrays. Curr.Med.Chem. 2006; 13: 1831-1837
34. Ludwig, J. A. and Weinstein, J. N. Biomarkers in cancer staging, prognosis and
treatment selection. Nat.Rev.Cancer. 2005; 5: 845-856
35. Ludwig, J. A. and Weinstein, J. N. Biomarkers in cancer staging, prognosis and
treatment selection. Nat.Rev.Cancer. 2005; 5: 845-856
36. Ilyin, S. E., Belkowski, S. M., and Plata-Salaman, C. R. Biomarker discovery and
validation: technologies and integrative approaches. Trends Biotechnol.
2004; 22: 411-416
37. Zhang, X., Li, L., Wei, D., Yap, Y., and Chen, F. Moving cancer diagnostics from
bench to bedside. Trends Biotechnol. 2007; 25: 166-173
38. Riedmaier, I., Becker, C., Pfaffl, M. W., and Meyer, H. H. D. The use of omic
technologies for biomarker development to trace functions of anabolic
agents. J.Chrom.A. 2009;
39. Beato, M., Chavez, S., and Truss, M. Transcriptional regulation by steroid
hormones. Steroids. 1996; 61: 240-251
40. Edwards, D. P. Regulation of signal transduction pathways by estrogen and
progesterone. Annu.Rev.Physiol. 2005; 67: 335-376
41. Picard, D., Kumar, V., Chambon, P., and Yamamoto, K. R. Signal transduction by
steroid hormones: nuclear localization is differentially regulated in estrogen
and glucocorticoid receptors. Cell Regul. 1990; 1: 291-299
42. Rehberger, P., Rexin, M., and Gehring, U. Heterotetrameric structure of the human
progesterone receptor. Proc.Natl.Acad.Sci.U.S.A. 9-1-1992; 89: 8001-8005
43. Rexin, M., Busch, W., Segnitz, B., and Gehring, U. Structure of the glucocorticoid
receptor in intact cells in the absence of hormone. J.Biol.Chem. 5-15-1992;
267: 9619-9621
44. Segnitz, B. and Gehring, U. Subunit structure of the nonactivated human estrogen
receptor. Proc.Natl.Acad.Sci.U.S.A. 3-14-1995; 92: 2179-2183
45. Beato, M. Gene regulation by steroid hormones. Cell. 2-10-1989; 56: 335-344
46. Beato, M., Chavez, S., and Truss, M. Transcriptional regulation by steroid
hormones. Steroids. 1996; 61: 240-251

References
40
47. Griekspoor, A., Zwart, W., Neefjes, J., and Michalides, R. Visualizing the action of
steroid hormone receptors in living cells. Nucl.Recept.Signal. 2007; 5: e003
48. Weigel, N. L. and Moore, N. L. Kinases and protein phosphorylation as regulators
of steroid hormone action. Nucl.Recept.Signal. 2007; 5: e005
49. Ing, N. H. Steroid hormones regulate gene expression posttranscriptionally by
altering the stabilities of messenger RNAs. Biol.Reprod. 2005; 72: 1290-
1296
50. Meisonnier, E. and Mitchell-Vigneron, J.; Anabolics in Animal Production - Public
health aspects, analytical methods and regulation; 1983; 92-9044-118-6
51. Riedmaier, I., Tichopad, A., Reiter, M., Pfaffl, M. W., and Meyer, H. H.
Identification of potential gene expression biomarkers for the surveillance
of anabolic agents in bovine blood cells. Anal.Chim.Acta. 4-6-2009; 638:
106-113
52. Riedmaier, I., Tichopad, A., Reiter, M., Pfaffl, M. W., and Meyer, H. H.
Identification of potential gene expression biomarkers for the surveillance
of anabolic agents in bovine blood cells. Anal.Chim.Acta. 4-6-2009; 638:
106-113
53. Riedmaier, I., Tichopad, A., Reiter, M., Pfaffl, M. W., and Meyer, H. H. D. Influence
of testosterone and a novel SARM on gene expression in whole blood of
macaca fascicularis. J.Steroid Biochem.Mol.Biol. 2009;
54. Ing, N. H. Steroid hormones regulate gene expression posttranscriptionally by
altering the stabilities of messenger RNAs. Biol.Reprod. 2005; 72: 1290-
1296
55. Cutolo, M., Capellino, S., Montagna, P., Ghiorzo, P., Sulli, A., and Villaggio, B. Sex
hormone modulation of cell growth and apoptosis of the human
monocytic/macrophage cell line. Arthritis Research & Therapy. 2005; 7:
R1124-R1132
56. Huber, S. A., Kupperman, J., and Newell, M. K. Estradiol prevents and
testosterone promotes Fas-dependent apoptosis in CD4+ Th2 cells by
altering Bcl 2 expression. Lupus. 1999; 8: 384-387
57. Jacobson, J. D. and Ansari, M. A. Immunomodulatory actions of gonadal steroids
may be mediated by gonadotropin-releasing hormone. Endocrinology.
2004; 145: 330-336
58. Lehmann, D., Siebold, K., Emmons, L. R., and Muller, H. Androgens inhibit
proliferation of human peripheral blood lymphocytes in vitro.
Clin.Immunol.Immunopathol. 1988; 46: 122-128
59. Kang, J. S., Lee, B. J., Ahn, B., Kim, D. J., Nam, S. Y., Yun, Y. W., Nam, K. T.,
Choi, M., Kim, H. S., Jang, D. D., Lee, Y. S., and Yang, K. H. Expression of
estrogen receptor alpha and beta in the uterus and vagina of immature rats
treated with 17-ethinyl estradiol. J.Vet.Med.Sci. 2003; 65: 1293-1297
60. Ing, N. H. Steroid hormones regulate gene expression posttranscriptionally by
altering the stabilities of messenger RNAs. Biol.Reprod. 2005; 72: 1290-
1296
References
41
61. Pessina, M. A., Hoyt, R. F., Jr., Goldstein, I., and Traish, A. M. Differential
regulation of the expression of estrogen, progesterone, and androgen
receptors by sex steroid hormones in the vagina: immunohistochemical
studies. J.Sex Med. 2006; 3: 804-814
62. Sato, T., Fukazawa, Y., Ohta, Y., and Iguchi, T. Involvement of growth factors in
induction of persistent proliferation of vaginal epithelium of mice exposed
neonatally to diethylstilbestrol. Reprod.Toxicol. 2004; 19: 43-51
63. Traish, A. M., Kim, S. W., Stankovic, M., Goldstein, I., and Kim, N. N. Testosterone
increases blood flow and expression of androgen and estrogen receptors in
the rat vagina. J.Sex Med. 2007; 4: 609-619
64. Miyagawa, S., Suzuki, A., Katsu, Y., Kobayashi, M., Goto, M., Handa, H.,
Watanabe, H., and Iguchi, T. Persistent gene expression in mouse vagina
exposed neonatally to diethylstilbestrol. J.Mol.Endocrinol. 2004; 32: 663-
677
65. Teng, C. T. Lactoferrin gene expression and regulation: an overview. Biochem.Cell
Biol. 2002; 80: 7-16
66. Pfaffl, M. W., Daxenberger, A., Hageleit, M., and Meyer, H. H. D. Effects of
synthetic progestagens on the mRNA expression of androgen receptor,
progesterone receptor, oestrogen receptor alpha and beta, insulin-like
growth factor-1 (IGF-1) and IGF-1 receptor in heifer tissues. J.Vet.Med.A
Physiol Pathol.Clin.Med. 2002; 49: 57-64
67. McMurray, R. W., Suwannaroj, S., Ndebele, K., and Jenkins, J. K. Differential
effects of sex steroids on T and B cells: modulation of cell cycle phase
distribution, apoptosis and bcl-2 protein levels. Pathobiology. 2001; 69: 44-
58
68. Jacobson, J. D. and Ansari, M. A. Immunomodulatory actions of gonadal steroids
may be mediated by gonadotropin-releasing hormone. Endocrinology.
2004; 145: 330-336
69. Lehmann, D., Siebold, K., Emmons, L. R., and Muller, H. Androgens inhibit
proliferation of human peripheral blood lymphocytes in vitro.
Clin.Immunol.Immunopathol. 1988; 46: 122-128
70. Livak, K. J. and Schmittgen, T. D. Analysis of relative gene expression data using
real-time quantitative PCR and the 2(-Delta Delta C(T)) Method. Methods.
2001; 25: 402-408
71. Pfaffl, M. W., Vandesompele, J., and Kubista, M. Real-Time PCR: Current
Technology and Applications. Caister Academic Press. London, GB. 2009,
5.
72. Beyene, J., Tritchler, D., Bull, S. B., Cartier, K. C., Jonasdottir, G., Kraja, A. T., Li,
N., Nock, N. L., Parkhomenko, E., Rao, J. S., Stein, C. M., Sutradhar, R.,
Waaijenborg, S., Wang, K. S., Wang, Y., and Wolkow, P. Multivariate
analysis of complex gene expression and clinical phenotypes with genetic
marker data. Genet.Epidemiol. 2007; 31 Suppl 1: S103-S109
73. Fleige, S., Walf, V., Huch, S., Prgomet, C., Sehm, J., and Pfaffl, M. W.
Comparison of relative mRNA quantification models and the impact of RNA

References
42
integrity in quantitative real-time RT-PCR. Biotechnol.Lett. 2006; 28: 1601-
1613
74. Fleige, S. and Pfaffl, M. W. RNA integrity and the effect on the real-time qRT-PCR
performance. Mol.Aspects Med. 2006; 27: 126-139
75. Pfaffl, M., Fleige, S., and Riedmaier, I. Validation of lab-on-chip capillary
electrophoresis systems for total RNA quality and quality control.
Biotechnol & Biotechnol eq. 2008; 22: 829-834
76. Schroeder, A., Mueller, O., Stocker, S., Salowsky, R., Leiber, M., Gassmann, M.,
Lightfoot, S., Menzel, W., Granzow, M., and Ragg, T. The RIN: an RNA
integrity number for assigning integrity values to RNA measurements.
BMC.Mol.Biol. 2006; 7: 3
77. Fleige, S., Walf, V., Huch, S., Prgomet, C., Sehm, J., and Pfaffl, M. W.
Comparison of relative mRNA quantification models and the impact of RNA
integrity in quantitative real-time RT-PCR. Biotechnol.Lett. 2006; 28: 1601-
1613
78. Fleige, S. and Pfaffl, M. W. RNA integrity and the effect on the real-time qRT-PCR
performance. Mol.Aspects Med. 2006; 27: 126-139
79. Bauer, E. R., Daxenberger, A., Petri, T., Sauerwein, H., and Meyer, H. H.
Characterisation of the affinity of different anabolics and synthetic
hormones to the human androgen receptor, human sex hormone binding
globulin and to the bovine progestin receptor. APMIS. 2000; 108: 838-846
80. Meyer, H. H. D. Biochemistry and physiology of anabolic hormones used for
improvement of meat production. APMIS. 2001; 109: 1-8
81. Pottier, J., Cousty, C., Heitzman, R. J., and Reynolds, I. P. Differences in the
biotransformation of a 17 beta-hydroxylated steroid, trenbolone acetate, in
rat and cow. Xenobiotica. 1981; 11: 489-500
82. Pfaffl, M. W., Daxenberger, A., Hageleit, M., and Meyer, H. H. D. Effects of
synthetic progestagens on the mRNA expression of androgen receptor,
progesterone receptor, oestrogen receptor alpha and beta, insulin-like
growth factor-1 (IGF-1) and IGF-1 receptor in heifer tissues. J.Vet.Med.A
Physiol Pathol.Clin.Med. 2002; 49: 57-64
83. Pfaffl, M. W., Lange, I. G., and Meyer, H. H. D. The gastrointestinal tract as target
of steroid hormone action: quantification of steroid receptor mRNA
expression (AR, ERalpha, ERbeta and PR) in 10 bovine gastrointestinal
tract compartments by kinetic RT-PCR. J.Steroid Biochem.Mol.Biol. 2003;
84: 159-166
84. Reiter, M., Walf, V. M., Christians, A., Pfaffl, M. W., and Meyer, H. H. Modification
of mRNA expression after treatment with anabolic agents and the
usefulness for gene expression-biomarkers. Anal.Chim.Acta. 3-14-2007;
586: 73-81
85. Toffolatti, L., Rosa, Gastaldo L., Patarnello, T., Romualdi, C., Merlanti, R.,
Montesissa, C., Poppi, L., Castagnaro, M., and Bargelloni, L. Expression
analysis of androgen-responsive genes in the prostate of veal calves
treated with anabolic hormones. Domest.Anim Endocrinol. 2006; 30: 38-55
References
43
86. Dinarello, C. A. The biological properties of interleukin-1. Eur.Cytokine Netw. 1994;
5: 517-531
87. Dinarello, C. A. The interleukin-1 family: 10 years of discovery. FASEB J. 1994; 8:
1314-1325
88. Ing, N. H. Steroid hormones regulate gene expression posttranscriptionally by
altering the stabilities of messenger RNAs. Biol.Reprod. 2005; 72: 1290-
1296
89. Kang, J. S., Lee, B. J., Ahn, B., Kim, D. J., Nam, S. Y., Yun, Y. W., Nam, K. T.,
Choi, M., Kim, H. S., Jang, D. D., Lee, Y. S., and Yang, K. H. Expression of
estrogen receptor alpha and beta in the uterus and vagina of immature rats
treated with 17-ethinyl estradiol. J.Vet.Med.Sci. 2003; 65: 1293-1297
90. Sato, T., Fukazawa, Y., Ohta, Y., and Iguchi, T. Involvement of growth factors in
induction of persistent proliferation of vaginal epithelium of mice exposed
neonatally to diethylstilbestrol. Reprod.Toxicol. 2004; 19: 43-51
91. Kronenberg, M. S. and Clark, J. H. Changes in keratin expression during the
estrogen-mediated differentiation of rat vaginal epithelium. Endocrinology.
1985; 117: 1480-1489
92. Miyagawa, S., Suzuki, A., Katsu, Y., Kobayashi, M., Goto, M., Handa, H.,
Watanabe, H., and Iguchi, T. Persistent gene expression in mouse vagina
exposed neonatally to diethylstilbestrol. J.Mol.Endocrinol. 2004; 32: 663-
677
93. Sato, T., Fukazawa, Y., Ohta, Y., and Iguchi, T. Involvement of growth factors in
induction of persistent proliferation of vaginal epithelium of mice exposed
neonatally to diethylstilbestrol. Reprod.Toxicol. 2004; 19: 43-51
94. Iguchi, T., Uchima, F. D., and Bern, H. A. Growth of mouse vaginal epithelial cells
in culture: effect of sera and supplemented serum-free media. In Vitro Cell
Dev.Biol. 1987; 23: 535-540
95. Iguchi, T., Uchima, F. D., Ostrander, P. L., and Bern, H. A. Growth of normal
mouse vaginal epithelial cells in and on collagen gels.
Proc.Natl.Acad.Sci.U.S.A. 1983; 80: 3743-3747
96. Miyagawa, S., Suzuki, A., Katsu, Y., Kobayashi, M., Goto, M., Handa, H.,
Watanabe, H., and Iguchi, T. Persistent gene expression in mouse vagina
exposed neonatally to diethylstilbestrol. J.Mol.Endocrinol. 2004; 32: 663-
677
97. Hom, Y. K., Young, P., Thomson, A. A., and Cunha, G. R. Keratinocyte growth
factor injected into female mouse neonates stimulates uterine and vaginal
epithelial growth. Endocrinology. 1998; 139: 3772-3779
98. Hom, Y. K., Young, P., Wiesen, J. F., Miettinen, P. J., Derynck, R., Werb, Z., and
Cunha, G. R. Uterine and vaginal organ growth requires epidermal growth
factor receptor signaling from stroma. Endocrinology. 1998; 139: 913-921
99. Sato, T., Fukazawa, Y., Ohta, Y., and Iguchi, T. Involvement of growth factors in
induction of persistent proliferation of vaginal epithelium of mice exposed
neonatally to diethylstilbestrol. Reprod.Toxicol. 2004; 19: 43-51
References
44
100. Hom, Y. K., Young, P., Thomson, A. A., and Cunha, G. R. Keratinocyte growth
factor injected into female mouse neonates stimulates uterine and vaginal
epithelial growth. Endocrinology. 1998; 139: 3772-3779
101. Hom, Y. K., Young, P., Wiesen, J. F., Miettinen, P. J., Derynck, R., Werb, Z., and
Cunha, G. R. Uterine and vaginal organ growth requires epidermal growth
factor receptor signaling from stroma. Endocrinology. 1998; 139: 913-921
102. Nelson, K. G., Sakai, Y., Eitzman, B., Steed, T., and McLachlan, J. Exposure to
diethylstilbestrol during a critical developmental period of the mouse
reproductive tract leads to persistent induction of two estrogen-regulated
genes. Cell Growth Differ. 1994; 5: 595-606
103. Miyagawa, S., Suzuki, A., Katsu, Y., Kobayashi, M., Goto, M., Handa, H.,
Watanabe, H., and Iguchi, T. Persistent gene expression in mouse vagina
exposed neonatally to diethylstilbestrol. J.Mol.Endocrinol. 2004; 32: 663-
677
104. Sato, T., Fukazawa, Y., Ohta, Y., and Iguchi, T. Involvement of growth factors in
induction of persistent proliferation of vaginal epithelium of mice exposed
neonatally to diethylstilbestrol. Reprod.Toxicol. 2004; 19: 43-51
105. Nelson, K. G., Sakai, Y., Eitzman, B., Steed, T., and McLachlan, J. Exposure to
diethylstilbestrol during a critical developmental period of the mouse
reproductive tract leads to persistent induction of two estrogen-regulated
genes. Cell Growth Differ. 1994; 5: 595-606
106. Pentecost, B. T. and Teng, C. T. Lactotransferrin is the major estrogen inducible
protein of mouse uterine secretions. J.Biol.Chem. 7-25-1987; 262: 10134-
10139
107. Cohen, M. S., Britigan, B. E., French, M., and Bean, K. Preliminary observations
on lactoferrin secretion in human vaginal mucus: variation during the
menstrual cycle, evidence of hormonal regulation, and implications for
infection with Neisseria gonorrhoeae. Am.J.Obstet.Gynecol. 1987; 157:
1122-1125
108. Kelver, M. E., Kaul, A., Nowicki, B., Findley, W. E., Hutchens, T. W., and
Nagamani, M. Estrogen regulation of lactoferrin expression in human
endometrium. Am.J.Reprod.Immunol. 1996; 36: 243-247
109. EDGREN, R. A. Oestrogen antagonisms: the effects of testosterone propionate
and 17-ethyl-19-nortestosterone on oestrone-induced changes in vaginal
cytology. Acta Endocrinol.(Copenh). 1957; 25: 365-370
110. EDGREN, R. A. The modification of estrogen-induced changes in rat vaginas with
steroids and related agents. Ann.N.Y.Acad.Sci. 11-18-1959; 83: 160-184
111. Fleige, S., Walf, V., Huch, S., Prgomet, C., Sehm, J., and Pfaffl, M. W.
Comparison of relative mRNA quantification models and the impact of RNA
integrity in quantitative real-time RT-PCR. Biotechnol.Lett. 2006; 28: 1601-
1613
112. Fleige, S. and Pfaffl, M. W. RNA integrity and the effect on the real-time qRT-PCR
performance. Mol.Aspects Med. 2006; 27: 126-139
References
45
113. Pfaffl, M. W., Daxenberger, A., Hageleit, M., and Meyer, H. H. D. Effects of
synthetic progestagens on the mRNA expression of androgen receptor,
progesterone receptor, oestrogen receptor alpha and beta, insulin-like
growth factor-1 (IGF-1) and IGF-1 receptor in heifer tissues. J.Vet.Med.A
Physiol Pathol.Clin.Med. 2002; 49: 57-64
114. Pfaffl, M. W., Lange, I. G., and Meyer, H. H. D. The gastrointestinal tract as target
of steroid hormone action: quantification of steroid receptor mRNA
expression (AR, ERalpha, ERbeta and PR) in 10 bovine gastrointestinal
tract compartments by kinetic RT-PCR. J.Steroid Biochem.Mol.Biol. 2003;
84: 159-166
115. Reiter, M., Walf, V. M., Christians, A., Pfaffl, M. W., and Meyer, H. H. Modification
of mRNA expression after treatment with anabolic agents and the
usefulness for gene expression-biomarkers. Anal.Chim.Acta. 3-14-2007;
586: 73-81
116. Toffolatti, L., Rosa, Gastaldo L., Patarnello, T., Romualdi, C., Merlanti, R.,
Montesissa, C., Poppi, L., Castagnaro, M., and Bargelloni, L. Expression
analysis of androgen-responsive genes in the prostate of veal calves
treated with anabolic hormones. Domest.Anim Endocrinol. 2006; 30: 38-55
117. Ing, N. H. Steroid hormones regulate gene expression posttranscriptionally by
altering the stabilities of messenger RNAs. Biol.Reprod. 2005; 72: 1290-
1296
118. Nagata, S. Apoptosis by death factor. Cell. 2-7-1997; 88: 355-365
119. Morell, V. Zeroing in on how hormones affect the immune system. Science. 8-11-
1995; 269: 773-775
120. Verthelyi, D. Sex hormones as immunomodulators in health and disease.
Int.Immunopharmacol. 2001; 1: 983-993
121. Rattenberger, E., Wnuk, I., and Matzke, P. Pharmacokinetics of des and 19-
Nortestosterone in Calves After Spot-on Treatment. Archiv für
Lebensmittelhygiene. 1993; 44: 73-76
122. Nagata, S. Apoptosis by death factor. Cell. 2-7-1997; 88: 355-365
123. Morell, V. Zeroing in on how hormones affect the immune system. Science. 8-11-
1995; 269: 773-775
124. Verthelyi, D. Sex hormones as immunomodulators in health and disease.
Int.Immunopharmacol. 2001; 1: 983-993

Acknowldegements
46
Acknowledgements
First of all I would like to thank Prof. Dr. Dr. Heinrich H.D. Meyer for offering me the
opportunity to work in the interesting research field of anabolic steroid hormones at the
chair of Physiology and for supervising me during this time. I want to thank him for all the
very inspiring discussions concerning my work and for his patience to answer all my
questions throughout the time span of my PhD thesis.
Many thanks to PD Dr. Michael W. Pfaffl for supervising me concerning all methodological
questions and for the really good working athmosphere.
I want to thank Dr. Ales Tichopad who showed me how to deal with great amounts of data
and who taught me statistical thinking.
Special thanks to Azel Swemmer and Dr. Maria Groot without whom the bovine studies
included in this thesis could not take place.
I would like to thank Christiane Becker, Christine Fochtmann, Gabriele Jobst and all other
participants of the “pour on anabolics” trial who helped me to successfully carry out this
trial.
Many thanks to my colleagues and friends Dr. Martina Reiter, Dr. Simone Fleige, Dr.
Bettina Griesbeck-Zilch, Dr. Heike Kliem, all my neighbors in the “Denkerzentrale” and to
all employees at the Institute for the nice working atmosphere and good collaboration.
Special thanks to Christiane Becker and Andrea Hammerle-Fickinger for their friendship
and for cheering me up when not everything went the right way.
I want to thank all my friends at home, who tolerated the lack of time present during the
last three years.
Many thanks to my parents and siblings for enabling me this education and for supporting
me in all its forms
Special thanks goes to my boyfriend Klaus for simply everything.
I am deeply grateful for the financial support of the projects by “TAP Pharmaceuticals”, the
“Onderstepoort Veterinary Institute, Pretoria” and the “RIKILT Institute of Food Safety”.

Scientific Communication
47
Scientific Communication
Original Publications
M.W. Pfaffl, S. Fleige, I. Riedmaier
Validation of lab-on-chip capillary electrophoresis systems for total RNA quality and
quantity control
Biotechnology and Biotechnological Equipment, 2008, 22/3.
I. Riedmaier, C. Becker, M.W. Pfaffl, H.H.D. Meyer
The use of omic technologies for biomarker development to trace anabolic hormone
functions
Journal of Chromatography A (2009), doi:10.1016/j.chroma.2009.01.094
I. Riedmaier, A. Tichopad, M. Reiter, M.W. Pfaffl, H.H.D. Meyer
Influence of testosterone and a novel SARM on gene expression in whole blood of
Macaca fascicularis
Journal of Steroid Biochemistry and Molecular Biology, 2009, 114: 167-173
I. Riedmaier, A. Tichopad, M. Reiter, M.W. Pfaffl, H.H.D. Meyer
Identification of potential gene expression biomarkers for the surveillance of anabolic
agents in bovine blood cells
Analytica Chimica Acta, 2009; 638: 106-113
I. Riedmaier, M. Reiter, A. Tichopad, M.W. Pfaffl, H.H.D. Meyer
The potential of bovine vaginal smear for biomarker development to trace the misuse of
anabolic agents
Submitted: “The Analyst”
Oral Presentations:
I. Riedmaier, C. Becker, M.W. Pfaffl, H.H.D. Meyer
The use of transcriptomics for biomarker development to trace anabolic hormone
functions
4th
International qPCR Symposium, Technische Universität München, 09.03.-13.03.2009,
Freising-Weihenstephan, Germany.
Scientific Communication
48
Poster Presentations:
I. Riedmaier, A. Tichopad, M. Reiter, M.W. Pfaffl, H.H.D. Meyer
Influence of testosterone and a novel SARM on gene expression in whole blood of
Macaca fascicularis
18th
Symposium of the Journal of Steroid Biochemistry and Molecular Biology, 18.09.-
21.09. 2008, Seefeld in Tirol, Österreich
I. Riedmaier, M. Reiter, A. Tichopad, M.W. Pfaffl, H.H.D. Meyer
Identification of potential gene expression biomarkers in bovine vaginal smear after
application of the anabolic combination trenbolone acetate plus estradiol
18th
Symposium of the Journal of Steroid Biochemistry and Molecular Biology, 18.09.-
21.09. 2008, Seefeld in Tirol, Österreich
I. Riedmaier, M. Bergmaier, M.W. Pfaffl
Comparison of two available platforms for the determination of RNA quality
4th
International qPCR Symposium, Technische Universität München, 09.03.-13.03.2009,
Freising-Weihenstephan, Germany.

Scientific Communication
49
Curriculum Vitae
Irmgard Riedmaier
Date of birth November, 11
th
1980
Place of birth Ebersberg, Germany
09/1987 – 07/1991 Primary school Egmating
09/1991 – 07/2000 Gymnasium Grafing
Graduation “Allgemeine Hochschulreife”
10/2000 – 12/2004 Studies in Biology, Technical University of
Munich
Degree “Diplom”
Since 08/2005 PhD student at Physiology-Weihenstephan
Technical University of Munich

Appendix
50
Appendix
Appendix I:
M.W. Pfaffl, S. Fleige, I. Riedmaier
Validation of lab-on-chip capillary electrophoresis systems for total RNA quality and
quantity control
Biotechnology and Biotechnological Equipment, 2008, 22/3.
Appendix II:
I. Riedmaier, C. Becker, M.W. Pfaffl, H.H.D. Meyer
The use of omic technologies for biomarker development to trace anabolic hormone
functions
Journal of Chromatography A (2009), doi:10.1016/j.chroma.2009.01.094
Appendix III:
I. Riedmaier, A. Tichopad, M. Reiter, M.W. Pfaffl, H.H.D. Meyer
Influence of testosterone and a novel SARM on gene expression in whole blood of
Macaca fascicularis
Journal of Steroid Biochemistry and Molecular Biology, 2009, 114: 167-173
Appendix IV:
I. Riedmaier, A. Tichopad, M. Reiter, M.W. Pfaffl, H.H.D. Meyer
Identification of potential gene expression biomarkers for the surveillance of anabolic
agents in bovine blood cells
Analytica Chimica Acta, 2009; 638: 106-113
Appendix V:
I. Riedmaier, M. Reiter, A. Tichopad, M.W. Pfaffl, H.H.D. Meyer
The potential of bovine vaginal smear for biomarker development to trace the misuse of
anabolic agents
Submitted: “Analytical and Bioanalytical Chemistry”

Appendix I
829Biotechnol. & Biotechnol. eq. 22/2008/3
Articles sb
Keywords: RnA integrity, RnA quality, RnA quantity, transcriptomics, lab-on-chip, capillary electrophoresis
IntroductionMethods for Gene expression measurements like microarray technology and quantitative real time Rt-PcR (qRt-PcR) require high quality RnA (1, 3, 4, 5). the purity of RnA is normally assessed by its oD260 nm/oD280 nm ratio (2) but using this tool no information is given according RnA integrity. For decades, scientists have gained essential data about their nucleic acid RnA samples from the use of agarose gel-based electrophoresis. Gel electrophoresis, the movement and separation of charged particles in response to an electric field, results in an unparalleled and irreproducible resolution of RnA molecules. however, the process is composed of a series of manual steps that require numerous pieces of equipment, various reagents, and several hours to gain the information needed from sample separations. Since this traditional process requires significant time and manual labour, automation has been a key desire of scientists. the experion (Bio-Rad laboratories, hercules, cA) and the 2100 Bioanalyzer (Agilent technologies, Palo Alto, cA) system apply innovative micro-fluidic separation technology to both automate and accelerate this process.
the lab-on-chip is an integrated part of the micro-fluidic system, working together with specialized computer-controlled instrumentation used to manipulate the timing and sequence of the processes designed into the chip. As a result, these systems inherently generate accurate and reproducible data. nevertheless, chip design must provide optimal channel and sample well dimensions, and system design must provide precise control over temperature, flow rates, and sample injection and separation voltages, amongst good laboratory praxis, in order to produce optimal results. When micro-fluidic chips are used for electrophoresis, the process is very similar
to that of traditional gel-based electrophoresis. the main difference is that micro-fluidics enables the miniaturization and combination of multiple steps of gel-based electrophoresis – separation, staining, containing, imaging, and even basic data analysis – into a single automated process.
in this study we determined the RnA quality and quantity of different bovine tissues by using the experion (Bio-Rad laboratories) and the 2100 Bioanalyzer (Agilent technologies). the intention was to investigate the comparability and validity of the results delivered by both lab-on-chip systems. As the policy for these two devices does not differ, the analysis of all samples should lead to similar results. the appearance of differences in the achieved results has to be borne in mind when interpreting data from these two devices.
Materials and MethodsTotal RNATotal RNA purification was performed by an in-house standardized phenol-based extraction methods using triFast reagent (Peqlab, erlangen, Germany) according to the manufacturer’s instructions. total RnA was extracted from various bovine tissues, and was carried out in RnAse-free environment. to show tissue independent quality and quantity studies, eleven different bovine tissue sources were under investigation. Purified total RNA was eluted in the column using RnAse-free water (eppendorf, hamburg, Germany). First RNA integrity was verified in triplicates by UV measurement, using the BioPhotometer (eppendorf) and additionally the nanoDrop 1000 (Peqlab). only samples with an oD260 nm/oD280 nm absorption ratio higher than 1.85 were used for the further investigations.
HardwareFor microcapillary electrophoresis measurement, the experion system was used in conjunction with the experion RnA
VAlIdATIoN of lAb-oN-cHIp cApIllARy elecTRopHoResIs sysTeMs foR ToTAl RNA quAlITy ANd quANTITy coNTRol
M.W. Pfaffl, S. Fleige, and I. Riedmaiertechnical University of Munich, center of life and Food Sciences (Ziel), Physiology Weihenstephan, Freising, GermanyCorrespondence to: Michael W. PfafflE-mail: [email protected]
AbsTRAcTPurity and good RNA quality are important elements for the overall success of RNA based analysis methods like microarrays and real time qRT-PCR. There are two commercially available automated systems – the Experion (Bio-Rad Laboratories) and the 2100 Bioanalyzer (Agilent Technologies) – that provide both RNA sample quality and quantity analysis. In this study different aspects like the reproducibility and sensitivity of both systems were analyzed by determining the total RNA quality and quantity extracted from various bovine tissues. Regarding quantitation, the Experion is more sensitive than the 2100 Bioanalyzer. Both systems overstate the concentration by 19-29% compared to the photometric values. For RNA quality determination, both systems show highly comparable reproducibility. With the RNA integrity number (RIN) the 2100 Bioanalyzer offers an additional opportunity to quantify the RNA quality.
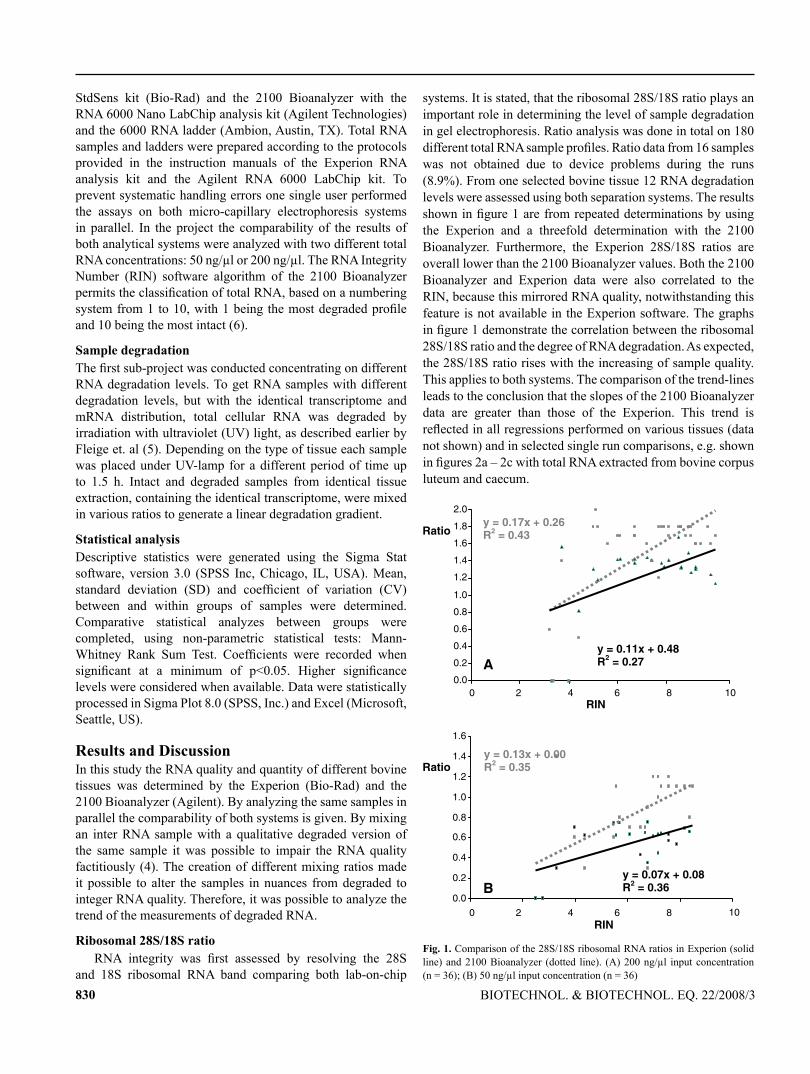
830 Biotechnol. & Biotechnol. eq. 22/2008/3
StdSens kit (Bio-Rad) and the 2100 Bioanalyzer with the RnA 6000 nano labchip analysis kit (Agilent technologies) and the 6000 RnA ladder (Ambion, Austin, tX). total RnA samples and ladders were prepared according to the protocols provided in the instruction manuals of the experion RnA analysis kit and the Agilent RnA 6000 labchip kit. to prevent systematic handling errors one single user performed the assays on both micro-capillary electrophoresis systems in parallel. in the project the comparability of the results of both analytical systems were analyzed with two different total RnA concentrations: 50 ng/µl or 200 ng/µl. the RnA integrity number (Rin) software algorithm of the 2100 Bioanalyzer permits the classification of total RNA, based on a numbering system from 1 to 10, with 1 being the most degraded profile and 10 being the most intact (6).
sample degradationThe first sub-project was conducted concentrating on different RnA degradation levels. to get RnA samples with different degradation levels, but with the identical transcriptome and mRnA distribution, total cellular RnA was degraded by irradiation with ultraviolet (UV) light, as described earlier by Fleige et. al (5). Depending on the type of tissue each sample was placed under UV-lamp for a different period of time up to 1.5 h. intact and degraded samples from identical tissue extraction, containing the identical transcriptome, were mixed in various ratios to generate a linear degradation gradient.
statistical analysisDescriptive statistics were generated using the Sigma Stat software, version 3.0 (SPSS inc, chicago, il, USA). Mean, standard deviation (SD) and coefficient of variation (CV) between and within groups of samples were determined. comparative statistical analyzes between groups were completed, using non-parametric statistical tests: Mann-Whitney Rank Sum Test. Coefficients were recorded when significant at a minimum of p<0.05. Higher significance levels were considered when available. Data were statistically processed in Sigma Plot 8.0 (SPSS, inc.) and excel (Microsoft, Seattle, US).
Results and discussionin this study the RnA quality and quantity of different bovine tissues was determined by the experion (Bio-Rad) and the 2100 Bioanalyzer (Agilent). By analyzing the same samples in parallel the comparability of both systems is given. By mixing an inter RnA sample with a qualitative degraded version of the same sample it was possible to impair the RnA quality factitiously (4). the creation of different mixing ratios made it possible to alter the samples in nuances from degraded to integer RnA quality. therefore, it was possible to analyze the trend of the measurements of degraded RnA.
Ribosomal 28s/18s ratioRNA integrity was first assessed by resolving the 28S
and 18S ribosomal RnA band comparing both lab-on-chip
systems. it is stated, that the ribosomal 28S/18S ratio plays an important role in determining the level of sample degradation in gel electrophoresis. Ratio analysis was done in total on 180 different total RNA sample profiles. Ratio data from 16 samples was not obtained due to device problems during the runs (8.9%). From one selected bovine tissue 12 RnA degradation levels were assessed using both separation systems. the results shown in figure 1 are from repeated determinations by using the experion and a threefold determination with the 2100 Bioanalyzer. Furthermore, the experion 28S/18S ratios are overall lower than the 2100 Bioanalyzer values. Both the 2100 Bioanalyzer and experion data were also correlated to the Rin, because this mirrored RnA quality, notwithstanding this feature is not available in the experion software. the graphs in figure 1 demonstrate the correlation between the ribosomal 28S/18S ratio and the degree of RnA degradation. As expected, the 28S/18S ratio rises with the increasing of sample quality. this applies to both systems. the comparison of the trend-lines leads to the conclusion that the slopes of the 2100 Bioanalyzer data are greater than those of the experion. this trend is reflected in all regressions performed on various tissues (data not shown) and in selected single run comparisons, e.g. shown in figures 2a – 2c with total RNA extracted from bovine corpus luteum and caecum.
0.0
0.2
0.4
0.6
0.8
1.0
1.2
1.4
1.6
10RIN
B
y = 0.13x + 0.00 R2 = 0.35
y = 0.07x + 0.08 R2 = 0.36
0.0
0.2
0.4
0.6
0.8
1.0
1.2
1.4
1.6
1.8
2.0
0 2 4 6 8
0 2 4 6 8
10RIN
A
y = 0.17x + 0.26 R2 = 0.43
y = 0.11x + 0.48 R2 = 0.27
Ratio
Ratio
fig. 1. comparison of the 28S/18S ribosomal RnA ratios in experion (solid line) and 2100 Bioanalyzer (dotted line). (A) 200 ng/µl input concentration (n = 36); (B) 50 ng/µl input concentration (n = 36)
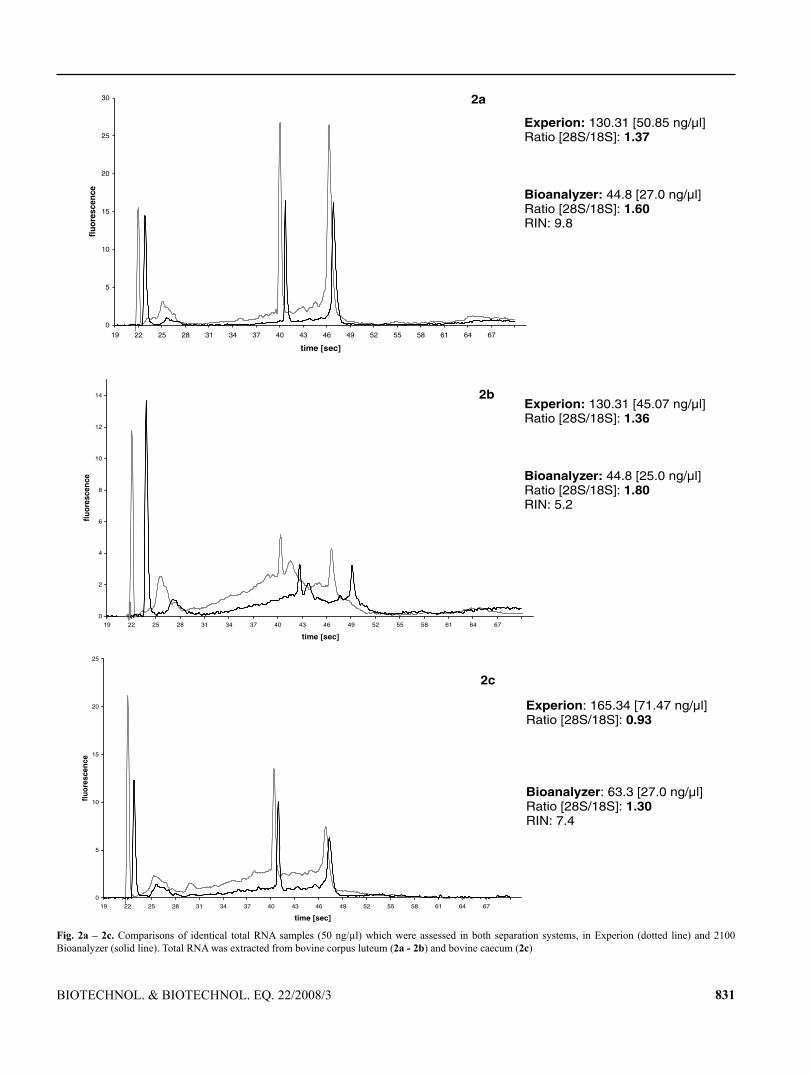
831Biotechnol. & Biotechnol. eq. 22/2008/3
0
5
10
15
20
25
30
19 22 25 28 31 34 37 40 43 46 49 52 55 58 61 64 67
time [sec]
fluo
resc
ence
0
2
4
6
8
10
12
14
19 22 25 28 31 34 37 40 43 46 49 52 55 58 61 64 67
time [sec]
fluo
resc
ence
0
5
10
15
20
25
19 22 25 28 31 34 37 40 43 46 49 52 55 58 61 64 67
time [sec]
fluor
esce
nce
Experion: 165.34 [71.47 ng/µl] Ratio [28S/18S]: 0.93
Bioanalyzer: 63.3 [27.0 ng/µl] Ratio [28S/18S]: 1.30RIN: 7.4
Experion: 130.31 [45.07 ng/µl] Ratio [28S/18S]: 1.36
Bioanalyzer: 44.8 [25.0 ng/µl] Ratio [28S/18S]: 1.80 RIN: 5.2
Experion: 130.31 [50.85 ng/µl] Ratio [28S/18S]: 1.37
Bioanalyzer: 44.8 [27.0 ng/µl] Ratio [28S/18S]: 1.60RIN: 9.8
2a
2c
2b
fig. 2a – 2c. comparisons of identical total RnA samples (50 ng/µl) which were assessed in both separation systems, in experion (dotted line) and 2100 Bioanalyzer (solid line). total RnA was extracted from bovine corpus luteum (2a - 2b) and bovine caecum (2c)
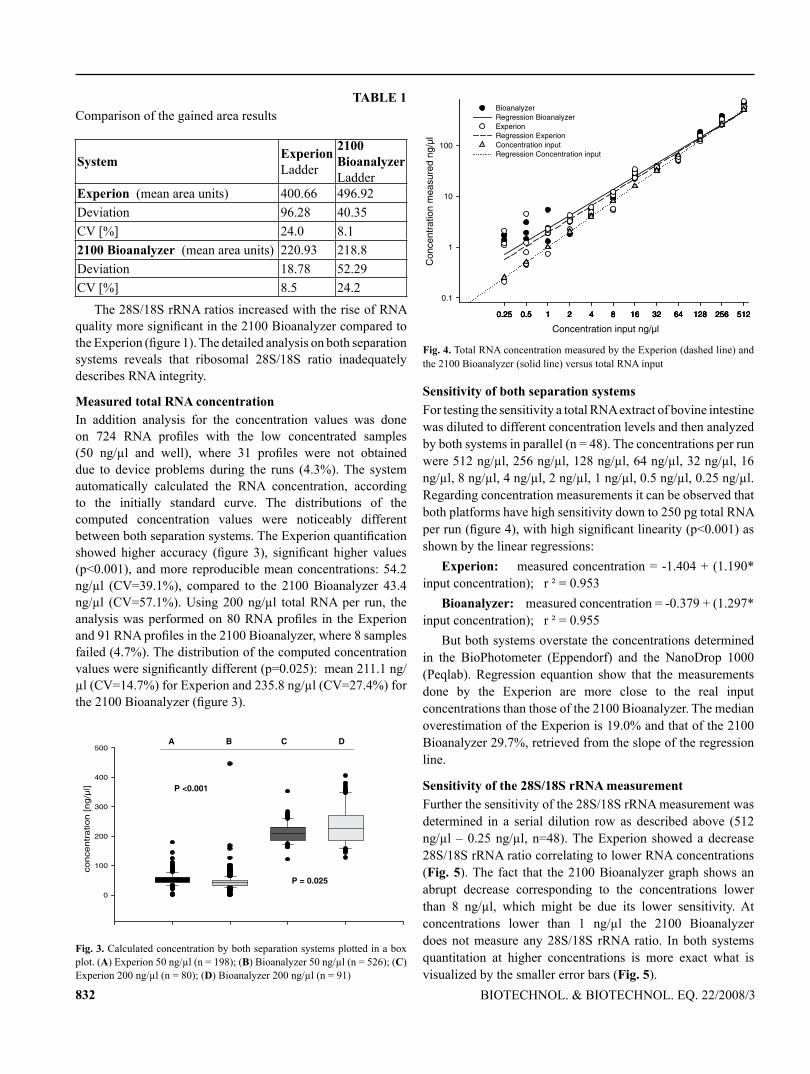
832 Biotechnol. & Biotechnol. eq. 22/2008/3
TAble 1comparison of the gained area results
system experionladder
2100 bioanalyzer ladder
experion (mean area units) 400.66 496.92Deviation 96.28 40.35cV [%] 24.0 8.12100 bioanalyzer (mean area units) 220.93 218.8Deviation 18.78 52.29cV [%] 8.5 24.2
the 28S/18S rRnA ratios increased with the rise of RnA quality more significant in the 2100 Bioanalyzer compared to the Experion (figure 1). The detailed analysis on both separation systems reveals that ribosomal 28S/18S ratio inadequately describes RnA integrity.
Measured total RNA concentrationin addition analysis for the concentration values was done on 724 RNA profiles with the low concentrated samples (50 ng/µl and well), where 31 profiles were not obtained due to device problems during the runs (4.3%). the system automatically calculated the RnA concentration, according to the initially standard curve. the distributions of the computed concentration values were noticeably different between both separation systems. The Experion quantification showed higher accuracy (figure 3), significant higher values (p<0.001), and more reproducible mean concentrations: 54.2 ng/µl (cV=39.1%), compared to the 2100 Bioanalyzer 43.4 ng/µl (cV=57.1%). Using 200 ng/µl total RnA per run, the analysis was performed on 80 RNA profiles in the Experion and 91 RNA profiles in the 2100 Bioanalyzer, where 8 samples failed (4.7%). the distribution of the computed concentration values were significantly different (p=0.025): mean 211.1 ng/µl (cV=14.7%) for experion and 235.8 ng/µl (cV=27.4%) for the 2100 Bioanalyzer (figure 3).
co
nce
ntr
atio
n [
ng
/µl]
0
100
200
300
400
500 A B C D
P = 0.025
P <0.001
fig. 3. calculated concentration by both separation systems plotted in a box plot. (A) experion 50 ng/µl (n = 198); (b) Bioanalyzer 50 ng/µl (n = 526); (c) experion 200 ng/µl (n = 80); (d) Bioanalyzer 200 ng/µl (n = 91)
Concentration input ng/µl
51225612864321684210.5 21552.0 25612864321684210.5 21552.0 25612864321684210.5 21552.0 25612864321684210.50.25
Con
cent
ratio
n m
easu
red
ng/µ
l
0.1
1
10
100
BioanalyzerRegression BioanalyzerExperionRegression ExperionConcentration inputRegression Concentration input
fig. 4. total RnA concentration measured by the experion (dashed line) and the 2100 Bioanalyzer (solid line) versus total RnA input
sensitivity of both separation systemsFor testing the sensitivity a total RnA extract of bovine intestine was diluted to different concentration levels and then analyzed by both systems in parallel (n = 48). the concentrations per run were 512 ng/µl, 256 ng/µl, 128 ng/µl, 64 ng/µl, 32 ng/µl, 16 ng/µl, 8 ng/µl, 4 ng/µl, 2 ng/µl, 1 ng/µl, 0.5 ng/µl, 0.25 ng/µl. Regarding concentration measurements it can be observed that both platforms have high sensitivity down to 250 pg total RnA per run (figure 4), with high significant linearity (p<0.001) as shown by the linear regressions:
experion: measured concentration = -1.404 + (1.190* input concentration); r ² = 0.953
bioanalyzer: measured concentration = -0.379 + (1.297* input concentration); r ² = 0.955
But both systems overstate the concentrations determined in the BioPhotometer (eppendorf) and the nanoDrop 1000 (Peqlab). Regression equantion show that the measurements done by the experion are more close to the real input concentrations than those of the 2100 Bioanalyzer. the median overestimation of the experion is 19.0% and that of the 2100 Bioanalyzer 29.7%, retrieved from the slope of the regression line.
sensitivity of the 28s/18s rRNA measurementFurther the sensitivity of the 28S/18S rRnA measurement was determined in a serial dilution row as described above (512 ng/µl – 0.25 ng/µl, n=48). the experion showed a decrease 28S/18S rRnA ratio correlating to lower RnA concentrations (fig. 5). the fact that the 2100 Bioanalyzer graph shows an abrupt decrease corresponding to the concentrations lower than 8 ng/µl, which might be due its lower sensitivity. At concentrations lower than 1 ng/µl the 2100 Bioanalyzer does not measure any 28S/18S rRnA ratio. in both systems quantitation at higher concentrations is more exact what is visualized by the smaller error bars (fig. 5).
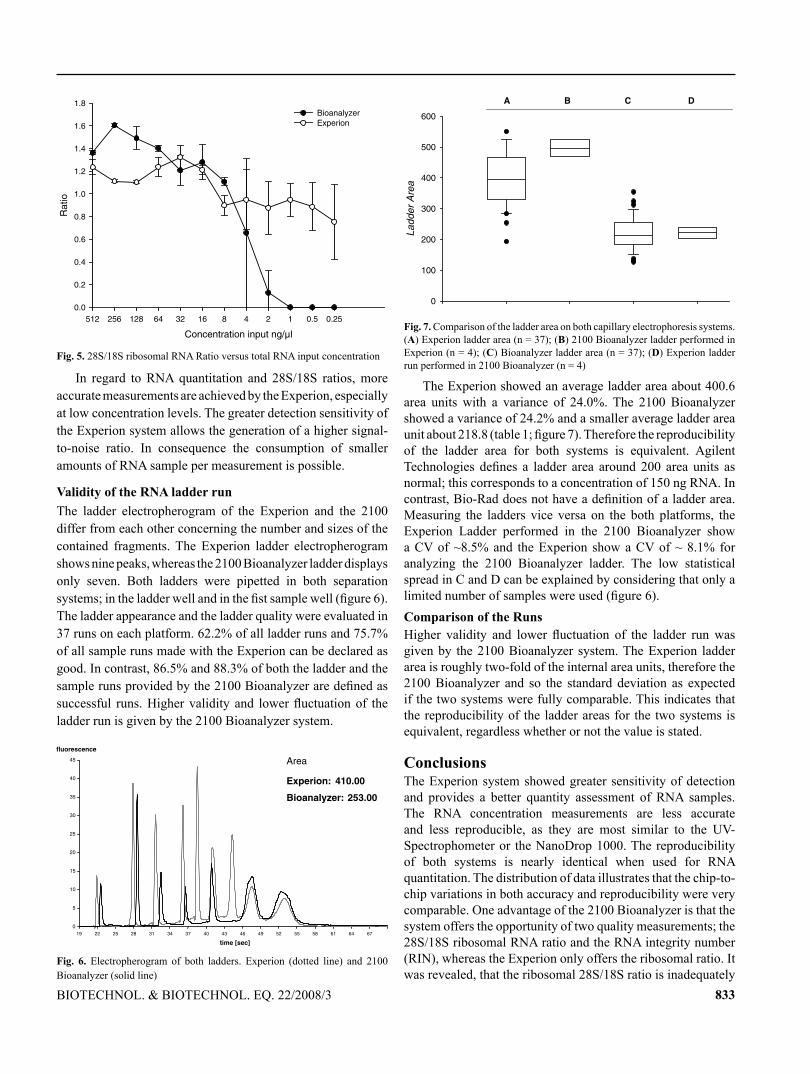
833Biotechnol. & Biotechnol. eq. 22/2008/3
Concentration input ng/µl
512 256 128 64 32 16 8 4 2 1 0.5 0.25
Rat
io
0.0
0.2
0.4
0.6
0.8
1.0
1.2
1.4
1.6
1.8BioanalyzerExperion
fig. 5. 28S/18S ribosomal RnA Ratio versus total RnA input concentration
in regard to RnA quantitation and 28S/18S ratios, more accurate measurements are achieved by the experion, especially at low concentration levels. the greater detection sensitivity of the experion system allows the generation of a higher signal-to-noise ratio. in consequence the consumption of smaller amounts of RnA sample per measurement is possible.
Validity of the RNA ladder runthe ladder electropherogram of the experion and the 2100 differ from each other concerning the number and sizes of the contained fragments. the experion ladder electropherogram shows nine peaks, whereas the 2100 Bioanalyzer ladder displays only seven. Both ladders were pipetted in both separation systems; in the ladder well and in the fist sample well (figure 6). the ladder appearance and the ladder quality were evaluated in 37 runs on each platform. 62.2% of all ladder runs and 75.7% of all sample runs made with the experion can be declared as good. in contrast, 86.5% and 88.3% of both the ladder and the sample runs provided by the 2100 Bioanalyzer are defined as successful runs. Higher validity and lower fluctuation of the ladder run is given by the 2100 Bioanalyzer system.
0
5
10
15
20
25
30
35
40
45
19 22 25 28 31 34 37 40 43 46 49 52 55 58 61 64 67
time [sec]
fluorescence
Area
Experion: 410.00
Bioanalyzer: 253.00
fig. 6. electropherogram of both ladders. experion (dotted line) and 2100 Bioanalyzer (solid line)
Ladd
er A
rea
0
100
200
300
400
500
600
A B C D
fig. 7. comparison of the ladder area on both capillary electrophoresis systems. (A) experion ladder area (n = 37); (b) 2100 Bioanalyzer ladder performed in experion (n = 4); (c) Bioanalyzer ladder area (n = 37); (d) experion ladder run performed in 2100 Bioanalyzer (n = 4)
the experion showed an average ladder area about 400.6 area units with a variance of 24.0%. the 2100 Bioanalyzer showed a variance of 24.2% and a smaller average ladder area unit about 218.8 (table 1; figure 7). Therefore the reproducibility of the ladder area for both systems is equivalent. Agilent Technologies defines a ladder area around 200 area units as normal; this corresponds to a concentration of 150 ng RnA. in contrast, Bio-Rad does not have a definition of a ladder area. Measuring the ladders vice versa on the both platforms, the experion ladder performed in the 2100 Bioanalyzer show a cV of ~8.5% and the experion show a cV of ~ 8.1% for analyzing the 2100 Bioanalyzer ladder. the low statistical spread in c and D can be explained by considering that only a limited number of samples were used (figure 6).comparison of the RunsHigher validity and lower fluctuation of the ladder run was given by the 2100 Bioanalyzer system. the experion ladder area is roughly two-fold of the internal area units, therefore the 2100 Bioanalyzer and so the standard deviation as expected if the two systems were fully comparable. this indicates that the reproducibility of the ladder areas for the two systems is equivalent, regardless whether or not the value is stated.
conclusionsthe experion system showed greater sensitivity of detection and provides a better quantity assessment of RnA samples. the RnA concentration measurements are less accurate and less reproducible, as they are most similar to the UV-Spectrophometer or the nanoDrop 1000. the reproducibility of both systems is nearly identical when used for RnA quantitation. the distribution of data illustrates that the chip-to-chip variations in both accuracy and reproducibility were very comparable. one advantage of the 2100 Bioanalyzer is that the system offers the opportunity of two quality measurements; the 28S/18S ribosomal RnA ratio and the RnA integrity number (Rin), whereas the experion only offers the ribosomal ratio. it was revealed, that the ribosomal 28S/18S ratio is inadequately
834 Biotechnol. & Biotechnol. eq. 22/2008/3
to describe RnA integrity. A general recommendation couldn’t be expressed, because both systems offer same applications and good handling. the experion system is more convenient through the automatic priming station, which might be the reason of more reproducibility and higher sensitivity in the lower RnA range.
RefeReNces1. Auer H., lyianarachchi s., Newsom d., Klisovic M.I.,
Marcucci G., Kornacker K., Marcucci u. (2003) nature Genet, 35, 292-293
2. baelde H.J., cleton-Jansen A.M., van beerendock H., Namba M., bovée J.V., Hogendoorn p.c. (2001) J. clin. Pathol., 54, 778–782.
3. copois V., bibeau f., bascoul-Mollevi c., salvetat N., chalbos p., bareil c., candeil l., fraslon c., conseiller e., Granci V., Mazière p., Kramar A., ychou M., pau b., Martineau p., Molina f., del Rio M. (2007) J. Biotechnol. 127, 549-559.
4. FleigeS.,PfafflM.W. (2006) Mol. Aspects Med., 27, 126-139.
5. FleigeS.,WalfV.,HuchS.,PrgometC.,SehmJ.,PfafflM.W. (2006) Biotechnol. lett., 28, 1601-1613.
6. Mueller o., lightfoot s., schroeder A. (2004) RnA integrity number (Rin) – Standardization of RnA quality control. Agilent technologies, technical Report 5989, 1165en.

Appendix II
C
R
To
IP
a
AA
KOTPMH
C
1
tomerr
0d
ARTICLE IN PRESSG ModelHROMA-349755; No. of Pages 8
Journal of Chromatography A, xxx (2009) xxx–xxx
Contents lists available at ScienceDirect
Journal of Chromatography A
journa l homepage: www.e lsev ier .com/ locate /chroma
eview
he use of omic technologies for biomarker development to trace functionsf anabolic agents
rmgard Riedmaier ∗, Christiane Becker, Michael W. Pfaffl, Heinrich H.D. Meyerhysiology Weihenstephan, Technische Universitaet Muenchen, Weihenstephaner Berg 3, 85354 Freising, Germany
r t i c l e i n f o
rticle history:vailable online xxx
eywords:mic technologiesranscriptomics
a b s t r a c t
The combat against misuse of growth promoting agents is a major topic in agricultural meat productionand human sports. In routine screening, hormone residues of all known growth promoting agents aredetected by immuno assays or chromatographical methods in combination with mass spectrometry. Toovercome the detection by these routine screening methods new xenobiotic growth promoters and newways of application were developed, e.g. the combination of different agents in hormone cocktails are
roteomicsetabolomicsormone analysis
employed. To enable an efficient tracing of misused anabolic substances it is necessary to develop newscreening technologies for a broad range of illegal drugs including newly designed xenobiotic anabolicagents. The use of omic technologies like, transcriptomics, proteomics or metabolomics is a promisingapproach to discover the misuse of anabolic hormones by indirectly detecting their physiological action.With the help of biostatistical tools it is possible to extract the quested information from the data setsretrieved from the omic technologies. This review describes the potential of these omic technologies for
the development of such new screening methods and presents recent literature in this field.© 2009 Elsevier B.V. All rights reserved.
ontents
1. Introduction. . . . . . . . . . . . . . . . . . . . . . . . . . . . . . . . . . . . . . . . . . . . . . . . . . . . . . . . . . . . . . . . . . . . . . . . . . . . . . . . . . . . . . . . . . . . . . . . . . . . . . . . . . . . . . . . . . . . . . . . . . . . . . . . . . . . . . . . . . . 002. Molecular mechanisms of steroid hormone signaling . . . . . . . . . . . . . . . . . . . . . . . . . . . . . . . . . . . . . . . . . . . . . . . . . . . . . . . . . . . . . . . . . . . . . . . . . . . . . . . . . . . . . . . . . . . . . . . 003. Molecular mechanisms of �-agonist signaling . . . . . . . . . . . . . . . . . . . . . . . . . . . . . . . . . . . . . . . . . . . . . . . . . . . . . . . . . . . . . . . . . . . . . . . . . . . . . . . . . . . . . . . . . . . . . . . . . . . . . . . 004. The use of omic technologies for biomarker research . . . . . . . . . . . . . . . . . . . . . . . . . . . . . . . . . . . . . . . . . . . . . . . . . . . . . . . . . . . . . . . . . . . . . . . . . . . . . . . . . . . . . . . . . . . . . . . . 00
4.1. Transcriptomics . . . . . . . . . . . . . . . . . . . . . . . . . . . . . . . . . . . . . . . . . . . . . . . . . . . . . . . . . . . . . . . . . . . . . . . . . . . . . . . . . . . . . . . . . . . . . . . . . . . . . . . . . . . . . . . . . . . . . . . . . . . . . . . 004.2. Proteomics . . . . . . . . . . . . . . . . . . . . . . . . . . . . . . . . . . . . . . . . . . . . . . . . . . . . . . . . . . . . . . . . . . . . . . . . . . . . . . . . . . . . . . . . . . . . . . . . . . . . . . . . . . . . . . . . . . . . . . . . . . . . . . . . . . . . 004.3. Metabolomics . . . . . . . . . . . . . . . . . . . . . . . . . . . . . . . . . . . . . . . . . . . . . . . . . . . . . . . . . . . . . . . . . . . . . . . . . . . . . . . . . . . . . . . . . . . . . . . . . . . . . . . . . . . . . . . . . . . . . . . . . . . . . . . . . 00
5. Bioinformatics . . . . . . . . . . . . . . . . . . . . . . . . . . . . . . . . . . . . . . . . . . . . . . . . . . . . . . . . . . . . . . . . . . . . . . . . . . . . . . . . . . . . . . . . . . . . . . . . . . . . . . . . . . . . . . . . . . . . . . . . . . . . . . . . . . . . . . . . 006. Conclusions . . . . . . . . . . . . . . . . . . . . . . . . . . . . . . . . . . . . . . . . . . . . . . . . . . . . . . . . . . . . . . . . . . . . . . . . . . . . . . . . . . . . . . . . . . . . . . . . . . . . . . . . . . . . . . . . . . . . . . . . . . . . . . . . . . . . . . . . . . . 00
References . . . . . . . . . . . . . . . . . . . . . . . . . . . . . . . . . . . . . . . . . . . . . . . . . . . . . . . . . . . . . . . . . . . . . . . . . . . . . . . . . . . . . . . . . . . . . . . . . . . . . . . . . . . . . . . . . . . . . . . . . . . . . . . . . . . . . . . . . . . . 00
. Introduction
Natural steroid hormones are synthesized from cholesterol andhey are strongly involved in endocrine and paracrine regulationf growth and differentiation in most tissues. Some steroid hor-
and estradiol have effects on behavioral, morphological and phys-iological traits. Estrogens stimulate protein- and mineral retentionduring pregnancy which is important for the development of theembryo. Testosterone promotes sexual behaviors like courtship,and improves growth of skeletal muscle which is important for
Please cite this article in press as: I. Riedmaier, et al., J. Chromatogr. A
ones, like estradiol or testosterone show anabolic functions bynhancing body protein accretion and mobilizing fat stores, whichesults in an increased growth rate [1]. These properties are deep-ooted in the evolution of vertebrates. The sex steroids testosterone
∗ Corresponding author. Fax: +49 8161 714204.E-mail address: [email protected] (I. Riedmaier).
021-9673/$ – see front matter © 2009 Elsevier B.V. All rights reserved.oi:10.1016/j.chroma.2009.01.094
defending the territory [1,2].Steroid hormones participate in the establishment of muscle
tissue and bone density. After menopause women and also oldermen often suffer from a loss in muscle mass (sarcopenia) and bone
(2009), doi:10.1016/j.chroma.2009.01.094
mineral density (osteoporosis) which may lead to frailty [3–6].Both conditions are related to the decrease in the endogenousproduction of anabolic sex hormones, mainly estradiol and testos-terone [5]. Men and women suffering from frailty are treated with
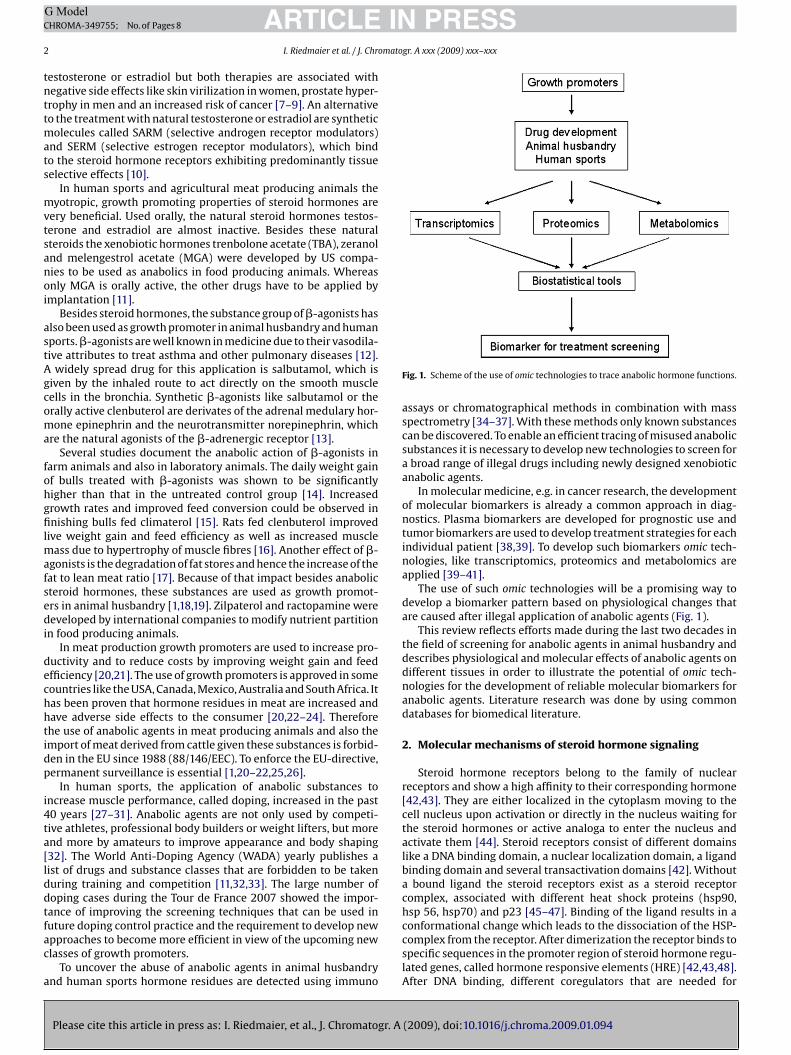
IN PRESSC
2 omatogr. A xxx (2009) xxx–xxx
tnttmats
mvtsanoi
astAgcoma
fohgfilmafsedi
dechhtidp
i4ta[lddtfac
a
ARTICLEG ModelHROMA-349755; No. of Pages 8
I. Riedmaier et al. / J. Chr
estosterone or estradiol but both therapies are associated withegative side effects like skin virilization in women, prostate hyper-rophy in men and an increased risk of cancer [7–9]. An alternativeo the treatment with natural testosterone or estradiol are synthetic
olecules called SARM (selective androgen receptor modulators)nd SERM (selective estrogen receptor modulators), which bindo the steroid hormone receptors exhibiting predominantly tissueelective effects [10].
In human sports and agricultural meat producing animals theyotropic, growth promoting properties of steroid hormones are
ery beneficial. Used orally, the natural steroid hormones testos-erone and estradiol are almost inactive. Besides these naturalteroids the xenobiotic hormones trenbolone acetate (TBA), zeranolnd melengestrol acetate (MGA) were developed by US compa-ies to be used as anabolics in food producing animals. Whereasnly MGA is orally active, the other drugs have to be applied bymplantation [11].
Besides steroid hormones, the substance group of �-agonists haslso been used as growth promoter in animal husbandry and humanports. �-agonists are well known in medicine due to their vasodila-ive attributes to treat asthma and other pulmonary diseases [12].
widely spread drug for this application is salbutamol, which isiven by the inhaled route to act directly on the smooth muscleells in the bronchia. Synthetic �-agonists like salbutamol or therally active clenbuterol are derivates of the adrenal medulary hor-one epinephrin and the neurotransmitter norepinephrin, which
re the natural agonists of the �-adrenergic receptor [13].Several studies document the anabolic action of �-agonists in
arm animals and also in laboratory animals. The daily weight gainf bulls treated with �-agonists was shown to be significantlyigher than that in the untreated control group [14]. Increasedrowth rates and improved feed conversion could be observed innishing bulls fed climaterol [15]. Rats fed clenbuterol improved
ive weight gain and feed efficiency as well as increased muscleass due to hypertrophy of muscle fibres [16]. Another effect of �-
gonists is the degradation of fat stores and hence the increase of theat to lean meat ratio [17]. Because of that impact besides anabolicteroid hormones, these substances are used as growth promot-rs in animal husbandry [1,18,19]. Zilpaterol and ractopamine wereeveloped by international companies to modify nutrient partition
n food producing animals.In meat production growth promoters are used to increase pro-
uctivity and to reduce costs by improving weight gain and feedfficiency [20,21]. The use of growth promoters is approved in someountries like the USA, Canada, Mexico, Australia and South Africa. Itas been proven that hormone residues in meat are increased andave adverse side effects to the consumer [20,22–24]. Thereforehe use of anabolic agents in meat producing animals and also themport of meat derived from cattle given these substances is forbid-en in the EU since 1988 (88/146/EEC). To enforce the EU-directive,ermanent surveillance is essential [1,20–22,25,26].
In human sports, the application of anabolic substances toncrease muscle performance, called doping, increased in the past0 years [27–31]. Anabolic agents are not only used by competi-ive athletes, professional body builders or weight lifters, but morend more by amateurs to improve appearance and body shaping32]. The World Anti-Doping Agency (WADA) yearly publishes aist of drugs and substance classes that are forbidden to be takenuring training and competition [11,32,33]. The large number ofoping cases during the Tour de France 2007 showed the impor-ance of improving the screening techniques that can be used in
Please cite this article in press as: I. Riedmaier, et al., J. Chromatogr. A
uture doping control practice and the requirement to develop newpproaches to become more efficient in view of the upcoming newlasses of growth promoters.
To uncover the abuse of anabolic agents in animal husbandrynd human sports hormone residues are detected using immuno
Fig. 1. Scheme of the use of omic technologies to trace anabolic hormone functions.
assays or chromatographical methods in combination with massspectrometry [34–37]. With these methods only known substancescan be discovered. To enable an efficient tracing of misused anabolicsubstances it is necessary to develop new technologies to screen fora broad range of illegal drugs including newly designed xenobioticanabolic agents.
In molecular medicine, e.g. in cancer research, the developmentof molecular biomarkers is already a common approach in diag-nostics. Plasma biomarkers are developed for prognostic use andtumor biomarkers are used to develop treatment strategies for eachindividual patient [38,39]. To develop such biomarkers omic tech-nologies, like transcriptomics, proteomics and metabolomics areapplied [39–41].
The use of such omic technologies will be a promising way todevelop a biomarker pattern based on physiological changes thatare caused after illegal application of anabolic agents (Fig. 1).
This review reflects efforts made during the last two decades inthe field of screening for anabolic agents in animal husbandry anddescribes physiological and molecular effects of anabolic agents ondifferent tissues in order to illustrate the potential of omic tech-nologies for the development of reliable molecular biomarkers foranabolic agents. Literature research was done by using commondatabases for biomedical literature.
2. Molecular mechanisms of steroid hormone signaling
Steroid hormone receptors belong to the family of nuclearreceptors and show a high affinity to their corresponding hormone[42,43]. They are either localized in the cytoplasm moving to thecell nucleus upon activation or directly in the nucleus waiting forthe steroid hormones or active analoga to enter the nucleus andactivate them [44]. Steroid receptors consist of different domainslike a DNA binding domain, a nuclear localization domain, a ligandbinding domain and several transactivation domains [42]. Withouta bound ligand the steroid receptors exist as a steroid receptorcomplex, associated with different heat shock proteins (hsp90,hsp 56, hsp70) and p23 [45–47]. Binding of the ligand results in a
(2009), doi:10.1016/j.chroma.2009.01.094
conformational change which leads to the dissociation of the HSP-complex from the receptor. After dimerization the receptor binds tospecific sequences in the promoter region of steroid hormone regu-lated genes, called hormone responsive elements (HRE) [42,43,48].After DNA binding, different coregulators that are needed for
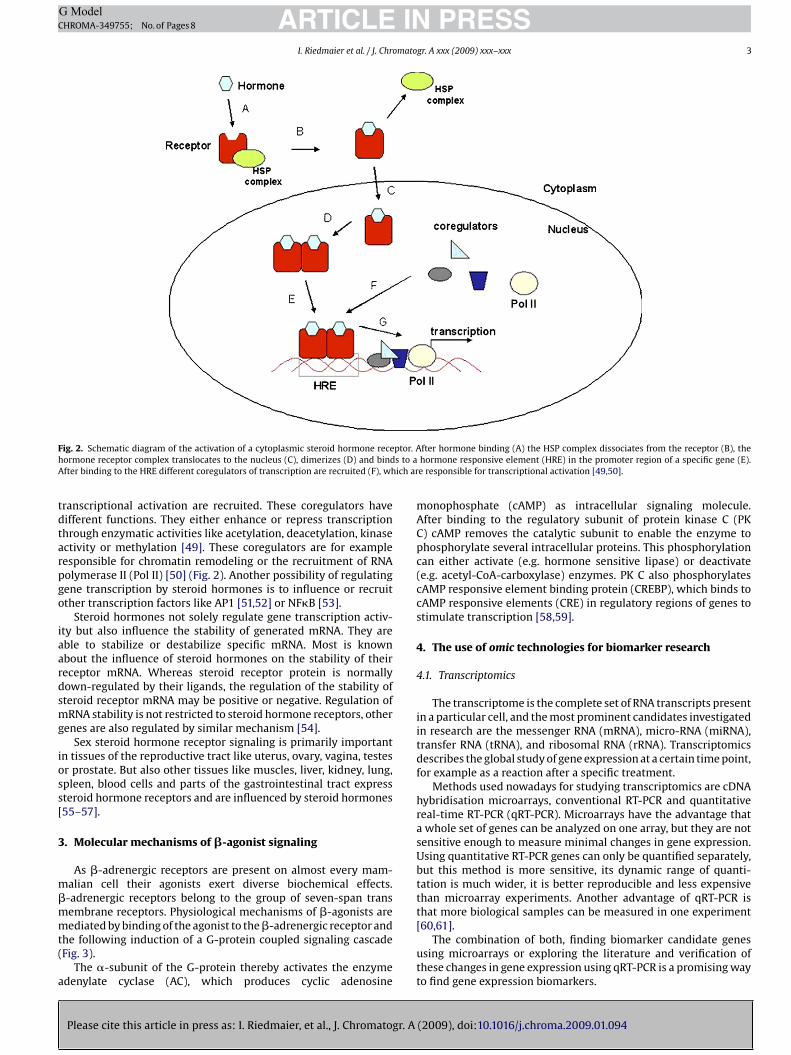
ARTICLE IN PRESSG ModelCHROMA-349755; No. of Pages 8
I. Riedmaier et al. / J. Chromatogr. A xxx (2009) xxx–xxx 3
F ptor. Ah s to aA ich ar
tdtarpgo
iaardsmg
ioss[
3
m�mmt(
a
ig. 2. Schematic diagram of the activation of a cytoplasmic steroid hormone receormone receptor complex translocates to the nucleus (C), dimerizes (D) and bindfter binding to the HRE different coregulators of transcription are recruited (F), wh
ranscriptional activation are recruited. These coregulators haveifferent functions. They either enhance or repress transcriptionhrough enzymatic activities like acetylation, deacetylation, kinasectivity or methylation [49]. These coregulators are for exampleesponsible for chromatin remodeling or the recruitment of RNAolymerase II (Pol II) [50] (Fig. 2). Another possibility of regulatingene transcription by steroid hormones is to influence or recruitther transcription factors like AP1 [51,52] or NF�B [53].
Steroid hormones not solely regulate gene transcription activ-ty but also influence the stability of generated mRNA. They areble to stabilize or destabilize specific mRNA. Most is knownbout the influence of steroid hormones on the stability of theireceptor mRNA. Whereas steroid receptor protein is normallyown-regulated by their ligands, the regulation of the stability ofteroid receptor mRNA may be positive or negative. Regulation ofRNA stability is not restricted to steroid hormone receptors, other
enes are also regulated by similar mechanism [54].Sex steroid hormone receptor signaling is primarily important
n tissues of the reproductive tract like uterus, ovary, vagina, testesr prostate. But also other tissues like muscles, liver, kidney, lung,pleen, blood cells and parts of the gastrointestinal tract expressteroid hormone receptors and are influenced by steroid hormones55–57].
. Molecular mechanisms of �-agonist signaling
As �-adrenergic receptors are present on almost every mam-alian cell their agonists exert diverse biochemical effects.-adrenergic receptors belong to the group of seven-span transembrane receptors. Physiological mechanisms of �-agonists are
Please cite this article in press as: I. Riedmaier, et al., J. Chromatogr. A
ediated by binding of the agonist to the �-adrenergic receptor andhe following induction of a G-protein coupled signaling cascadeFig. 3).
The �-subunit of the G-protein thereby activates the enzymedenylate cyclase (AC), which produces cyclic adenosine
fter hormone binding (A) the HSP complex dissociates from the receptor (B), thehormone responsive element (HRE) in the promoter region of a specific gene (E).e responsible for transcriptional activation [49,50].
monophosphate (cAMP) as intracellular signaling molecule.After binding to the regulatory subunit of protein kinase C (PKC) cAMP removes the catalytic subunit to enable the enzyme tophosphorylate several intracellular proteins. This phosphorylationcan either activate (e.g. hormone sensitive lipase) or deactivate(e.g. acetyl-CoA-carboxylase) enzymes. PK C also phosphorylatescAMP responsive element binding protein (CREBP), which binds tocAMP responsive elements (CRE) in regulatory regions of genes tostimulate transcription [58,59].
4. The use of omic technologies for biomarker research
4.1. Transcriptomics
The transcriptome is the complete set of RNA transcripts presentin a particular cell, and the most prominent candidates investigatedin research are the messenger RNA (mRNA), micro-RNA (miRNA),transfer RNA (tRNA), and ribosomal RNA (rRNA). Transcriptomicsdescribes the global study of gene expression at a certain time point,for example as a reaction after a specific treatment.
Methods used nowadays for studying transcriptomics are cDNAhybridisation microarrays, conventional RT-PCR and quantitativereal-time RT-PCR (qRT-PCR). Microarrays have the advantage thata whole set of genes can be analyzed on one array, but they are notsensitive enough to measure minimal changes in gene expression.Using quantitative RT-PCR genes can only be quantified separately,but this method is more sensitive, its dynamic range of quanti-tation is much wider, it is better reproducible and less expensivethan microarray experiments. Another advantage of qRT-PCR isthat more biological samples can be measured in one experiment
(2009), doi:10.1016/j.chroma.2009.01.094
[60,61].The combination of both, finding biomarker candidate genes
using microarrays or exploring the literature and verification ofthese changes in gene expression using qRT-PCR is a promising wayto find gene expression biomarkers.
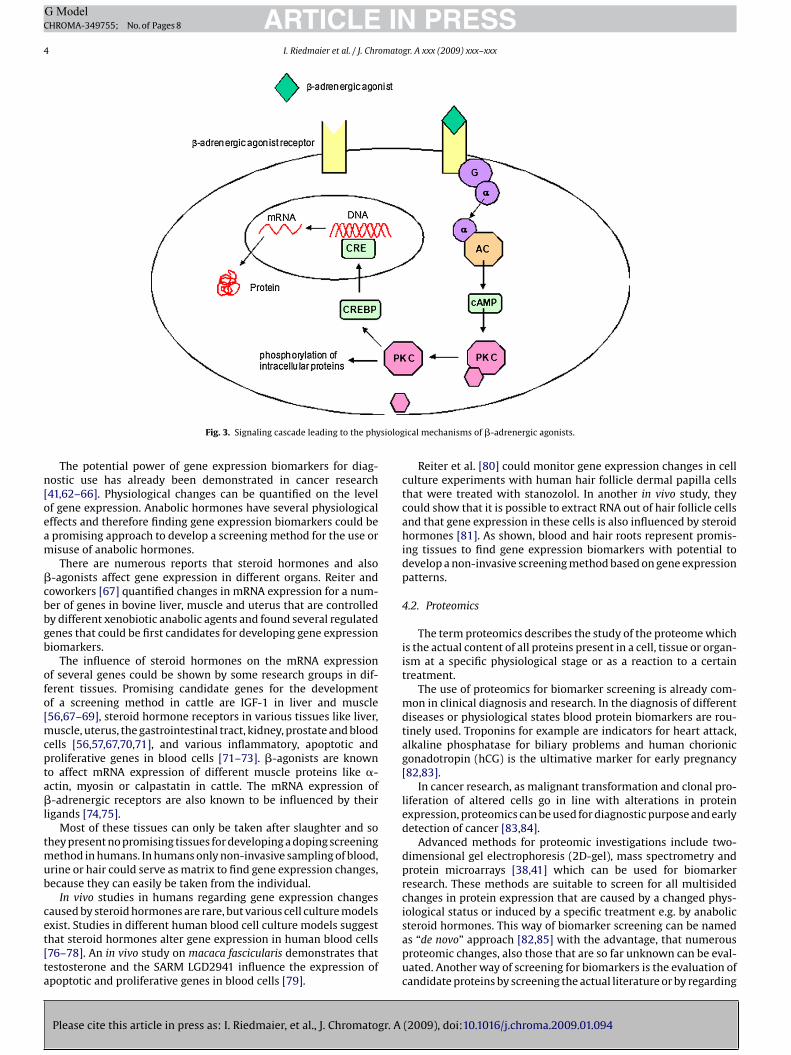
ARTICLE IN PRESSG ModelCHROMA-349755; No. of Pages 8
4 I. Riedmaier et al. / J. Chromatogr. A xxx (2009) xxx–xxx
siolog
n[oeam
�cbbgb
ofo[mcpta�l
tmub
cet[ta
Fig. 3. Signaling cascade leading to the phy
The potential power of gene expression biomarkers for diag-ostic use has already been demonstrated in cancer research41,62–66]. Physiological changes can be quantified on the levelf gene expression. Anabolic hormones have several physiologicalffects and therefore finding gene expression biomarkers could bepromising approach to develop a screening method for the use orisuse of anabolic hormones.There are numerous reports that steroid hormones and also
-agonists affect gene expression in different organs. Reiter andoworkers [67] quantified changes in mRNA expression for a num-er of genes in bovine liver, muscle and uterus that are controlledy different xenobiotic anabolic agents and found several regulatedenes that could be first candidates for developing gene expressioniomarkers.
The influence of steroid hormones on the mRNA expressionf several genes could be shown by some research groups in dif-erent tissues. Promising candidate genes for the developmentf a screening method in cattle are IGF-1 in liver and muscle56,67–69], steroid hormone receptors in various tissues like liver,
uscle, uterus, the gastrointestinal tract, kidney, prostate and bloodells [56,57,67,70,71], and various inflammatory, apoptotic androliferative genes in blood cells [71–73]. �-agonists are knowno affect mRNA expression of different muscle proteins like �-ctin, myosin or calpastatin in cattle. The mRNA expression of-adrenergic receptors are also known to be influenced by their
igands [74,75].Most of these tissues can only be taken after slaughter and so
hey present no promising tissues for developing a doping screeningethod in humans. In humans only non-invasive sampling of blood,
rine or hair could serve as matrix to find gene expression changes,ecause they can easily be taken from the individual.
In vivo studies in humans regarding gene expression changesaused by steroid hormones are rare, but various cell culture models
Please cite this article in press as: I. Riedmaier, et al., J. Chromatogr. A
xist. Studies in different human blood cell culture models suggesthat steroid hormones alter gene expression in human blood cells76–78]. An in vivo study on macaca fascicularis demonstrates thatestosterone and the SARM LGD2941 influence the expression ofpoptotic and proliferative genes in blood cells [79].
ical mechanisms of �-adrenergic agonists.
Reiter et al. [80] could monitor gene expression changes in cellculture experiments with human hair follicle dermal papilla cellsthat were treated with stanozolol. In another in vivo study, theycould show that it is possible to extract RNA out of hair follicle cellsand that gene expression in these cells is also influenced by steroidhormones [81]. As shown, blood and hair roots represent promis-ing tissues to find gene expression biomarkers with potential todevelop a non-invasive screening method based on gene expressionpatterns.
4.2. Proteomics
The term proteomics describes the study of the proteome whichis the actual content of all proteins present in a cell, tissue or organ-ism at a specific physiological stage or as a reaction to a certaintreatment.
The use of proteomics for biomarker screening is already com-mon in clinical diagnosis and research. In the diagnosis of differentdiseases or physiological states blood protein biomarkers are rou-tinely used. Troponins for example are indicators for heart attack,alkaline phosphatase for biliary problems and human chorionicgonadotropin (hCG) is the ultimative marker for early pregnancy[82,83].
In cancer research, as malignant transformation and clonal pro-liferation of altered cells go in line with alterations in proteinexpression, proteomics can be used for diagnostic purpose and earlydetection of cancer [83,84].
Advanced methods for proteomic investigations include two-dimensional gel electrophoresis (2D-gel), mass spectrometry andprotein microarrays [38,41] which can be used for biomarkerresearch. These methods are suitable to screen for all multisidedchanges in protein expression that are caused by a changed phys-iological status or induced by a specific treatment e.g. by anabolic
(2009), doi:10.1016/j.chroma.2009.01.094
steroid hormones. This way of biomarker screening can be namedas “de novo” approach [82,85] with the advantage, that numerousproteomic changes, also those that are so far unknown can be eval-uated. Another way of screening for biomarkers is the evaluation ofcandidate proteins by screening the actual literature or by regarding
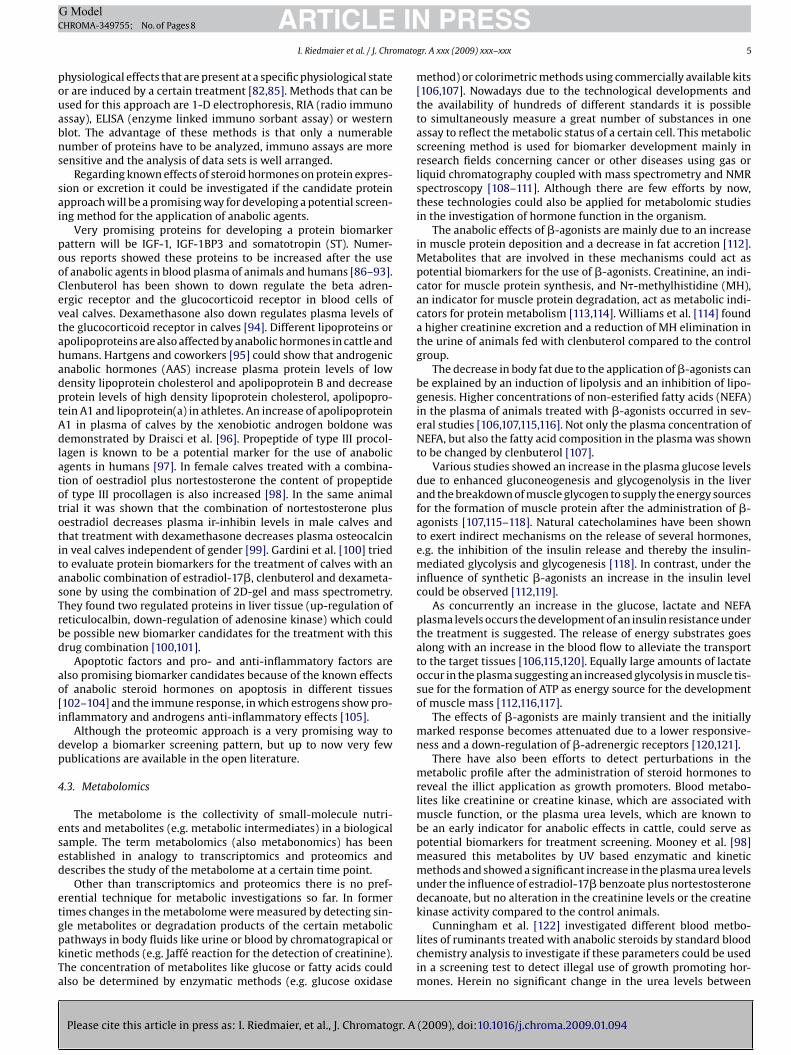
INC
omato
pouabns
sai
pooCevtahadptAdlatototitasTrbd
ao[i
dp
4
esed
etgpkTa
ARTICLEG ModelHROMA-349755; No. of Pages 8
I. Riedmaier et al. / J. Chr
hysiological effects that are present at a specific physiological stater are induced by a certain treatment [82,85]. Methods that can besed for this approach are 1-D electrophoresis, RIA (radio immunossay), ELISA (enzyme linked immuno sorbant assay) or westernlot. The advantage of these methods is that only a numerableumber of proteins have to be analyzed, immuno assays are moreensitive and the analysis of data sets is well arranged.
Regarding known effects of steroid hormones on protein expres-ion or excretion it could be investigated if the candidate proteinpproach will be a promising way for developing a potential screen-ng method for the application of anabolic agents.
Very promising proteins for developing a protein biomarkerattern will be IGF-1, IGF-1BP3 and somatotropin (ST). Numer-us reports showed these proteins to be increased after the usef anabolic agents in blood plasma of animals and humans [86–93].lenbuterol has been shown to down regulate the beta adren-rgic receptor and the glucocorticoid receptor in blood cells ofeal calves. Dexamethasone also down regulates plasma levels ofhe glucocorticoid receptor in calves [94]. Different lipoproteins orpolipoproteins are also affected by anabolic hormones in cattle andumans. Hartgens and coworkers [95] could show that androgenicnabolic hormones (AAS) increase plasma protein levels of lowensity lipoprotein cholesterol and apolipoprotein B and decreaserotein levels of high density lipoprotein cholesterol, apolipopro-ein A1 and lipoprotein(a) in athletes. An increase of apolipoprotein1 in plasma of calves by the xenobiotic androgen boldone wasemonstrated by Draisci et al. [96]. Propeptide of type III procol-
agen is known to be a potential marker for the use of anabolicgents in humans [97]. In female calves treated with a combina-ion of oestradiol plus nortestosterone the content of propeptidef type III procollagen is also increased [98]. In the same animalrial it was shown that the combination of nortestosterone plusestradiol decreases plasma ir-inhibin levels in male calves andhat treatment with dexamethasone decreases plasma osteocalcinn veal calves independent of gender [99]. Gardini et al. [100] triedo evaluate protein biomarkers for the treatment of calves with annabolic combination of estradiol-17�, clenbuterol and dexameta-one by using the combination of 2D-gel and mass spectrometry.hey found two regulated proteins in liver tissue (up-regulation ofeticulocalbin, down-regulation of adenosine kinase) which coulde possible new biomarker candidates for the treatment with thisrug combination [100,101].
Apoptotic factors and pro- and anti-inflammatory factors arelso promising biomarker candidates because of the known effectsf anabolic steroid hormones on apoptosis in different tissues102–104] and the immune response, in which estrogens show pro-nflammatory and androgens anti-inflammatory effects [105].
Although the proteomic approach is a very promising way toevelop a biomarker screening pattern, but up to now very fewublications are available in the open literature.
.3. Metabolomics
The metabolome is the collectivity of small-molecule nutri-nts and metabolites (e.g. metabolic intermediates) in a biologicalample. The term metabolomics (also metabonomics) has beenstablished in analogy to transcriptomics and proteomics andescribes the study of the metabolome at a certain time point.
Other than transcriptomics and proteomics there is no pref-rential technique for metabolic investigations so far. In formerimes changes in the metabolome were measured by detecting sin-
Please cite this article in press as: I. Riedmaier, et al., J. Chromatogr. A
le metabolites or degradation products of the certain metabolicathways in body fluids like urine or blood by chromatograpical orinetic methods (e.g. Jaffé reaction for the detection of creatinine).he concentration of metabolites like glucose or fatty acids couldlso be determined by enzymatic methods (e.g. glucose oxidase
PRESSgr. A xxx (2009) xxx–xxx 5
method) or colorimetric methods using commercially available kits[106,107]. Nowadays due to the technological developments andthe availability of hundreds of different standards it is possibleto simultaneously measure a great number of substances in oneassay to reflect the metabolic status of a certain cell. This metabolicscreening method is used for biomarker development mainly inresearch fields concerning cancer or other diseases using gas orliquid chromatography coupled with mass spectrometry and NMRspectroscopy [108–111]. Although there are few efforts by now,these technologies could also be applied for metabolomic studiesin the investigation of hormone function in the organism.
The anabolic effects of �-agonists are mainly due to an increasein muscle protein deposition and a decrease in fat accretion [112].Metabolites that are involved in these mechanisms could act aspotential biomarkers for the use of �-agonists. Creatinine, an indi-cator for muscle protein synthesis, and N�-methylhistidine (MH),an indicator for muscle protein degradation, act as metabolic indi-cators for protein metabolism [113,114]. Williams et al. [114] founda higher creatinine excretion and a reduction of MH elimination inthe urine of animals fed with clenbuterol compared to the controlgroup.
The decrease in body fat due to the application of �-agonists canbe explained by an induction of lipolysis and an inhibition of lipo-genesis. Higher concentrations of non-esterified fatty acids (NEFA)in the plasma of animals treated with �-agonists occurred in sev-eral studies [106,107,115,116]. Not only the plasma concentration ofNEFA, but also the fatty acid composition in the plasma was shownto be changed by clenbuterol [107].
Various studies showed an increase in the plasma glucose levelsdue to enhanced gluconeogenesis and glycogenolysis in the liverand the breakdown of muscle glycogen to supply the energy sourcesfor the formation of muscle protein after the administration of �-agonists [107,115–118]. Natural catecholamines have been shownto exert indirect mechanisms on the release of several hormones,e.g. the inhibition of the insulin release and thereby the insulin-mediated glycolysis and glycogenesis [118]. In contrast, under theinfluence of synthetic �-agonists an increase in the insulin levelcould be observed [112,119].
As concurrently an increase in the glucose, lactate and NEFAplasma levels occurs the development of an insulin resistance underthe treatment is suggested. The release of energy substrates goesalong with an increase in the blood flow to alleviate the transportto the target tissues [106,115,120]. Equally large amounts of lactateoccur in the plasma suggesting an increased glycolysis in muscle tis-sue for the formation of ATP as energy source for the developmentof muscle mass [112,116,117].
The effects of �-agonists are mainly transient and the initiallymarked response becomes attenuated due to a lower responsive-ness and a down-regulation of �-adrenergic receptors [120,121].
There have also been efforts to detect perturbations in themetabolic profile after the administration of steroid hormones toreveal the illict application as growth promoters. Blood metabo-lites like creatinine or creatine kinase, which are associated withmuscle function, or the plasma urea levels, which are known tobe an early indicator for anabolic effects in cattle, could serve aspotential biomarkers for treatment screening. Mooney et al. [98]measured this metabolites by UV based enzymatic and kineticmethods and showed a significant increase in the plasma urea levelsunder the influence of estradiol-17� benzoate plus nortestosteronedecanoate, but no alteration in the creatinine levels or the creatinekinase activity compared to the control animals.
(2009), doi:10.1016/j.chroma.2009.01.094
Cunningham et al. [122] investigated different blood metbo-lites of ruminants treated with anabolic steroids by standard bloodchemistry analysis to investigate if these parameters could be usedin a screening test to detect illegal use of growth promoting hor-mones. Herein no significant change in the urea levels between
IN PRESSC
6 omatogr. A xxx (2009) xxx–xxx
tcasleoa
aptcccrmuaold
aib
5
ri
apgeTsTfsrd
ospnamnsswpgtts
rrmo(
ARTICLEG ModelHROMA-349755; No. of Pages 8
I. Riedmaier et al. / J. Chr
reated and untreated animals, but a significant increase in thereatine levels of heifers treated with nortestosterone decanoatend steers treated with estradiol benzoate was demonstrated. Alsoubstance specific effects on the billirubin levels were shown, withevels being increased in steers and decreased in heifers. As theseffects just occur on certain days and not over the complete coursef the study period these parameter could not serve as marker fornabolic treatment [122].
In human sports the investigation of the steroid profile is useds a versatile screening tool for routine doping control. The steroidattern in urine shows distinct ratios of several endogenously syn-hesized steroid hormones due to the natural excretion. These ratiosan be perturbated by increasing or decreasing certain steroidoncentrations during the administration of exogenous anabolicompounds [123]. As these ratios can also be altered by naturaleasons like the belonging to different ethnic groups this measure-ent is not sufficient to prove a doping suspicion. GC-C-IRMS can be
sed to reveal the origin of the applied substance as exogenouslypplied and endogenously synthesized steroids vary in the ratiof the carbon isotopes 12C and 13C. Pharmaceutical steroids showower amounts of 13C, as they are not synthesized de novo, buterived from plant materials [124].
However compared to the �-adrenergic agonists few is knownbout the metabolic effects of steroid hormones and more targetednvestigation have to be done to make a statement on changes inody fluids.
. Bioinformatics
Regardless of which omic technology is used for biomarkeresearch, bioinformatical tools are necessary to extract the needednformation from the resulting data set.
There are very few examples of unequivocal evidence given bysingle biomarker like the trophoblast marker hCG being only
resent in early pregnancy. In biomarker research the scientistets a pattern of biomarkers with multiple factors being influ-nced quantitatively by the drug or the specific physiological stage.he most important question is how do deal with a huge dataet to extract, interpret and visualize the intended information.o transform the high-dimensional data into a reduced subspaceor representing data in far fewer dimensions, methods for dimen-ionality reduction are needed [125]. In combination with patternecognition technologies the identification and visualization of theesired information is approached.
A simple method to classify samples by genomic, proteomicr metabolomic expression patterns is two or three dimensionalcatter plot [61]. Using this method only two or three transcripts,roteins or metabolites can be included [60,61]. If more compo-ents should be taken into account, multivariate analysis methodsre required. Principle components analysis (PCA) reduces multidi-ensional data sets to lower dimensions called “principle compo-
ents” [60,61,126]. Each analyzed sample will be visualized by onepot that results from diminishing all collected data of the specificample to two principle components and so each analyzed sampleill be represented by one spot. Employing this method for growthromoter treatment screening will ideally result in a graph with tworoups of spots. One group representing the untreated controls andhe other group representing the treated individuals. PCA was effec-ively used by Riedmaier et al. [71] to identify potential gene expres-ion biomarker patterns for anabolic treatment in bovine blood.
To combine the results of two omic technologies canonical cor-
Please cite this article in press as: I. Riedmaier, et al., J. Chromatogr. A
elation analysis (CCA) can be used. This method summarizes theelationship between two sets of variables and shows what is com-on amongst the two sets [126]. To combine the results of two
r more omic technologies linear or multiple discriminant analysisLDA or MDA) can be used [126]. Based on a set of measurable fea-
Fig. 4. Cluster dendogram of a qRT-PCR experiment with hormone treated anduntreated heifers. Quantitative RT-PCR expression results of vaginal epithelial cellsof untreated (control) and treated (treatment) heifers were clustered using GenExversion 4.3.6 Software (MultiD Analyses AB, Gothenburg, Sweden).
tures, these methods classify objects into groups. Screening for theuse of anabolic hormones by CCA, LDA or MDA should result in apicture similar to those of PCA, where the treated individuals areseparated from the untreated controls.
Another method for visualizing treatment patterns based onmultivariate data is hierarchical cluster analysis. The hierarchicalorder is represented by a tree dendogram in which related sam-ples are more closely together than samples that are more different[60,126]. Used in anabolic treatment screening hierarchical clusteranalysis should result in a tree where the treated or the untreatedsamples respectively are close together and the group of treatedsamples is separated from the group of untreated samples. Fig. 4shows a dendogram of qRT-PCR data received from vaginal epithe-lial cells of heifers, treated with anabolic hormones (unpublisheddata). The treated (n = 9) and untreated (n = 9) individuals are closetogether.
Regardless of which biostatistical method will be employed fortreatment screening, it is always necessary to have a high num-ber of untreated controls serving as basis for physiological normalindividuals. High biological variance between each individual arecaused by genetically diversity or environmental conditions [127].To deal with these differences between various individuals a highnumber of control samples representing the investigated group ofanimals of humans is needed.
In summary with advanced biostatistical method marking andreliable classification of treated animals is possible.
6. Conclusions
The use of omic technologies will be a promising way to developnew screening methods for the detection of the misuse of anabolicsteroids and �-agonists based on the physiological changes causedby these substances. Very sensitive methods, like quantitative RT-PCR and mass spectrometry allow the quantification of very small
(2009), doi:10.1016/j.chroma.2009.01.094
changes in gene expression, protein expression or in the presenceof metabolites. With the help of biostatistical tools it is possible toextract the quested information from the resulting data sets.
The discovery of newly designed substances, new modes of drugmisuse or other kinds of manipulation in animal husbandry or
INC
omato
sc
R
[
ARTICLEG ModelHROMA-349755; No. of Pages 8
I. Riedmaier et al. / J. Chr
ports – like erythropoietin, blood or gene doping – will be a futurehallenge to omic techniques.
eferences
[1] H.H.D. Meyer, APMIS 109 (2001) 1.[2] M. Hau, Bioessays 29 (2007) 2.[3] J.E. Morley, R.N. Baumgartner, R. Roubenoff, J. Mayer, K.S. Nair, J. Lab. Clin. Med.
137 (2001) 4.[4] J.E. Morley, Nutrition 17 (2001) 7.[5] J.E. Morley, M.J. Kim, M.T. Haren, Rev. Endocr. Metab. Disord. 6 (2005) 2.[6] T.J. Marcell, J. Gerontol. A Biol. Sci. Med. Sci. 58 (2003) 10.[7] F.J. Lopez, Curr. Opin. Chem. Biol. 4 (2000) 4.[8] M.R. Deschenes, Sports Med. 34 (2004) 12.[9] T.J. Doherty, J. Appl. Physiol. 95 (2003) 4.
[10] A. Negro-Vilar, J. Clin. Endocrinol. Metab. 84 (1999) 10.[11] C. Saudan, N. Baume, N. Robinson, L. Avois, P. Mangin, M. Saugy, Br. J. Sports
Med. 40 (Suppl. 1) (2006).[12] G. Mazzanti, C. Daniele, G. Boatto, G. Manca, G. Brambilla, A. Loizzo, Toxicology
187 (2003) 2.[13] A.W. Bell, D.E. Bauman, D.H. Beermann, R.J. Harrell, J. Nutr. 128 (2 Suppl.)
(1998).[14] A. Chwalibog, K. Jensen, G. Thorbek, Arch. Tierernahr. 49 (1996) 2.[15] L.O. Fiems, C.V. Boucque, B.G. Cottyn, Arch. Tierernahr. 45 (1993) 2.[16] K. Reichel, C. Rehfeldt, R. Weikard, R. Schadereit, K. Krawielitzki, Arch. Tier-
ernahr. 45 (1993) 3.[17] H.A. Kuiper, M.Y. Noordam, M.M. Dooren-Flipsen, R. Schilt, A.H. Roos, J. Anim.
Sci. 76 (1998) 1.[18] H.H.D. Meyer, L.M. Rinke, J. Anim. Sci. 69 (1991) 11.[19] H.J. Mersmann, J. Anim. Sci. 76 (1998) 1.[20] I.G. Lange, A. Daxenberger, H.H.D. Meyer, APMIS 109 (2001) 1.[21] C. Moran, J.F. Quirke, D.J. Prendiville, S. Bourke, J.F. Roche, J. Anim. Sci. 69 (1991)
11.[22] A. Daxenberger, D. Ibarreta, H.H.D. Meyer, Hum. Reprod. Update 7 (2001) 3.[23] S.H. Swan, F. Liu, J.W. Overstreet, C. Brazil, N.E. Skakkebaek, Hum. Reprod. 22
(2007) 6.[24] D. Maume, Y. Deceuninck, K. Pouponneau, A. Paris, B. Le Bizec, F. Andre, APMIS
109 (2001) 1.[25] R. Schilt, M.J. Groot, P.L. Berende, V. Ramazza, J.S. Ossenkoppele, W. Haasnoot,
E.O. Van Bennekom, L. Brouwer, H. Hooijerink, Analyst 123 (1998) 12.[26] R.W. Stephany, APMIS Suppl. (2001) 103.[27] A.H. Beckett, D.A. Cowan, Br. J. Sports Med. 12 (1978) 4.[28] D.H. Catlin, T.H. Murray, JAMA 276 (1996) 3.[29] L.E. Grivetti, E.A. Applegate, J. Nutr. 127 (5 Suppl.) (1997).[30] H.M. Prendergast, T. Bannen, T.B. Erickson, K.R. Honore, Vet. Hum. Toxicol. 45
(2003) 2.[31] W.W. Franke, B. Berendonk, Clin. Chem. 43 (1997) 7.[32] F. Sjoqvist, M. Garle, A. Rane, Lancet 371 (2008) 9627.[33] W. Schanzer, M. Thevis, Med. Klin. (Munich) 102 (2007) 8.[34] H.H.D. Meyer, S. Hoffmann, Food Addit. Contam. 4 (1987) 2.[35] H.H.D. Meyer, L. Rinke, I. Dursch, J. Chromatogr. 564 (1991) 2.[36] M.L. Scippo, G. Degand, A. Duyckaerts, G. Maghuin-Rogister, P. Delahaut, Ana-
lyst 119 (1994) 12.[37] L.A. van Ginkel, J. Chromatogr. 564 (1991) 2.[38] K.F. Becker, V. Metzger, S. Hipp, H. Hofler, Curr. Med. Chem. 13 (2006) 15.[39] J.A. Ludwig, J.N. Weinstein, Nat. Rev. Cancer 5 (2005) 11.[40] S.E. Ilyin, S.M. Belkowski, C.R. Plata-Salaman, Trends Biotechnol. 22 (2004) 8.[41] X. Zhang, L. Li, D. Wei, Y. Yap, F. Chen, Trends Biotechnol. 25 (2007) 4.[42] M. Beato, S. Chavez, M. Truss, Steroids 61 (1996) 4.[43] D.P. Edwards, Annu. Rev. Physiol. 67 (2005).[44] D. Picard, V. Kumar, P. Chambon, K.R. Yamamoto, Cell Regul. 1 (1990) 3.[45] M. Rexin, W. Busch, B. Segnitz, U. Gehring, J. Biol. Chem. 267 (1992) 14.[46] P. Rehberger, M. Rexin, U. Gehring, Proc. Natl. Acad. Sci. U.S.A. 89 (1992) 17.[47] B. Segnitz, U. Gehring, Proc. Natl. Acad. Sci. U.S.A. 92 (1995) 6.[48] M. Beato, Cell 56 (1989) 3.[49] A. Griekspoor, W. Zwart, J. Neefjes, R. Michalides, Nucl. Recept. Signal. 5 (2007).[50] N.L. Weigel, N.L. Moore, Nucl. Recept. Signal. 5 (2007).[51] A. Philips, D. Chalbos, H. Rochefort, J. Biol. Chem. 268 (1993) 19.[52] P. Webb, G.N. Lopez, R.M. Uht, P.J. Kushner, Mol. Endocrinol. 9 (1995) 4.[53] B. Stein, M.X. Yang, Mol. Cell Biol. 15 (1995) 9.[54] N.H. Ing, Biol. Reprod. 72 (2005) 6.[55] G.G. Kuiper, B. Carlsson, K. Grandien, E. Enmark, J. Haggblad, S. Nilsson, J.A.
Gustafsson, Endocrinology 138 (1997) 3.[56] M.W. Pfaffl, A. Daxenberger, M. Hageleit, H.H.D. Meyer, J. Vet. Med. A Physiol.
Pathol. Clin. Med. 49 (2002) 2.[57] M.W. Pfaffl, I.G. Lange, H.H.D. Meyer, J. Steroid Biochem. Mol. Biol. 84 (2003)
2.[58] D. Strosberg, Pathol. Biol. (Paris) 40 (1992) 8.[59] S.B. Liggett, J.R. Raymond, Baillieres Clin. Endocrinol. Metab. 7 (1993) 2.
Please cite this article in press as: I. Riedmaier, et al., J. Chromatogr. A
[60] J. Logan, J. Edwards, N. Saunders, Applied and Functional Genomics, HealthProtection Agency, Real-Time PCR: Current Technology and Applications. Cais-ter Academic Press, London, GB, 2009, p. 5.
[61] M. Kubista, J.M. Andrade, M. Bengtsson, A. Forootan, J. Jonak, K. Lind, R. Sin-delka, R. Sjoback, B. Sjogreen, L. Strombom, A. Stahlberg, N. Zoric, Mol. AspectsMed. 27 (2006) 2.
PRESSgr. A xxx (2009) xxx–xxx 7
[62] A. Abdullah-Sayani, J.M. Bueno-de-Mesquita, M.J. van de Vijver, Nat. Clin. Pract.Oncol. 3 (2006) 9.
[63] G.S. Ginsburg, S.B. Haga, Expert. Rev. Mol. Diagn. 6 (2006) 2.[64] J. Quackenbush, New Engl. J. Med. 354 (2006) 23.[65] A.K. Sandvik, B.K. Alsberg, K.G. Norsett, F. Yadetie, H.L. Waldum, A. Laegreid,
Clin. Chim. Acta 363 (2006) 1.[66] A.V. Tinker, A. Boussioutas, D.D. Bowtell, Cancer Cell 9 (2006) 5.[67] M. Reiter, V.M. Walf, A. Christians, M.W. Pfaffl, H.H.D. Meyer, Anal. Chim. Acta
586 (2007) 1.[68] B.J. Johnson, M.E. White, M.R. Hathaway, C.J. Christians, W.R. Dayton, J. Anim.
Sci. 76 (1998) 2.[69] M.E. White, B.J. Johnson, M.R. Hathaway, W.R. Dayton, J. Anim. Sci. 81 (2003)
4.[70] L. Toffolatti, G.L. Rosa, T. Patarnello, C. Romualdi, R. Merlanti, C. Montesissa, L.
Poppi, M. Castagnaro, L. Bargelloni, Domest. Anim. Endocrinol. 30 (2006) 1.[71] I. Riedmaier, A. Tichopad, M. Reiter, M.W. Pfaffl, H.H.D. Meyer, Anal. Chim. Acta,
doi:10.1016/j.aca.2009.02.014.[72] L.C. Chang, S.A. Madsen, T. Toelboell, P.S. Weber, J.L. Burton, J. Endocrinol. 183
(2004) 3.[73] M. Cantiello, M. Carletti, F.T. Cannizzo, C. Nebbia, C. Bellino, S. Pie, I.P. Oswald,
E. Bollo, M. Dacasto, Toxicology 242 (2007) 1.[74] S. Sato, S. Nomura, F. Kawano, J. Tanihata, K. Tachiyashiki, K. Imaizumi, J. Phar-
macol. Sci. 107 (2008) 4.[75] D.H. Beermann, J. Anim. Sci. 80 (2002).[76] S. Capellino, V. Villaggio, P. Montagna, A. Sulli, C. Craviotto, M. Cutolo, Reuma-
tismo 57 (2005) 3.[77] N. Kanda, S. Watanabe, J. Invest. Dermatol. 118 (2002) 3.[78] P.R. Kramer, S.F. Kramer, G. Guan, Arthritis Rheum. 50 (2004) 6.[79] I. Riedmaier, A. Tichopad, M. Reiter, M.W. Pfaffl, H.H.D. Meyer, J. Steroid
Biochem. Mol. Biol. (2008), doi:10.1016/j.jsbmb.2009.01.019.[80] M. Reiter, M.W. Pfaffl, M. Schoenfelder, H.H.D. Meyer, Biomarker Insights 4
(2009).[81] M. Reiter, S. Lüderwald, M.W. Pfaffl, H.H.D. Meyer, Doping J., dj052008-01.[82] A.G. Paulovich, J.R. Whiteaker, A.N. Hoofnagle, P. Wang, Proteomics Clin. Appl.
2 (2008).[83] N. Ramachandran, S. Srivastava, J. LaBaer, Proteomics Clin. Appl. 2 (2008).[84] W.C. Cho, Mol. Cancer 6 (2007).[85] P. Matt, Z. Fu, Q. Fu, J.E. Van Eyk, Physiol. Genom. 33 (2008) 1.[86] B.J. Johnson, M.R. Hathaway, P.T. Anderson, J.C. Meiske, W.R. Dayton, J. Anim.
Sci. 74 (1996) 2.[87] P.J. Buttery, J.M. Dawson, Proc. Nutr. Soc. 49 (1990) 3.[88] D.D. Hongerholt, B.A. Crooker, J.E. Wheaton, K.M. Carlson, D.M. Jorgenson, J.
Anim. Sci. 70 (1992) 5.[89] E.J. Duschek, L.J. Gooren, C. Netelenbos, Maturitas 51 (2005) 3.[90] M. Alen, P. Rahkila, M. Reinila, R. Vihko, Am. J. Sports Med. 15 (1987) 4.[91] J.O. Jorgensen, J.J. Christensen, M. Krag, S. Fisker, P. Ovesen, J.S. Christiansen,
Horm. Res. 62 (Suppl. 1) (2004).[92] P.D. Gluckman, B.H. Breier, S.R. Davis, J. Dairy Sci. 70 (1987) 2.[93] W.J. Enright, L.T. Chapin, W.M. Moseley, S.A. Zinn, M.B. Kamdar, L.F. Krabill,
H.A. Tucker, J. Endocrinol. 122 (1989) 3.[94] R. Odore, P. Badino, S. Pagliasso, C. Nebbia, B. Cuniberti, R. Barbero, G. Re, J.
Vet. Pharmacol. Ther. 29 (2006) 2.[95] F. Hartgens, G. Rietjens, H.A. Keizer, H. Kuipers, B.H. Wolffenbuttel, Br. J. Sports
Med. 38 (2004) 3.[96] R. Draisci, C. Montesissa, B. Santamaria, C. D’Ambrosio, G. Ferretti, R. Merlanti,
C. Ferranti, M. De Liguoro, C. Cartoni, E. Pistarino, L. Ferrara, M. Tiso, A. Scaloni,M.E. Cosulich, Proteomics 7 (2007) 17.
[97] R. Abellan, R. Ventura, S. Pichini, J.A. Pascual, R. Pacifici, S. Di Carlo, A. Bacosi,J. Segura, P. Zuccaro, Clin. Chem. Lab. Med. 43 (2005) 1.
[98] M.H. Mooney, C. Situ, G. Cacciatore, T. Hutchinson, C. Elliott, A.A. Bergwerff,Biomarkers 13 (2008) 3.
[99] G. Cacciatore, S.W.F. Eisenberg, C. Situ, M.H. Mooney, P. Delahaut, S. Klaren-beek, A.C. Huet, A.A. Bergwerff, C.T. Elliott, Anal. Chim. Acta (2008),doi:10.1016/j.aca.2008.11.027.
100] G. Gardini, P. Del Boccio, S. Colombatto, G. Testore, D. Corpillo, C. Di Ilio, A.Urbani, C. Nebbia, Proteomics 6 (2006) 9.
[101] C. Nebbia, D.L. Della, M. Carletti, A. Balbo, G. Barbarino, G. Gardini, J. Vet.Pharmacol. Ther. 31 (2008) 3.
[102] M. Cutolo, S. Capellino, P. Montagna, P. Ghiorzo, A. Sulli, B. Villaggio, ArthritisRes. Therapy 7 (2005) 5.
[103] R. Boland, A. Vasconsuelo, L. Milanesi, A.C. Ronda, A.R. de Boland, Steroids 73(2008) 9.
[104] R.W. McMurray, S. Suwannaroj, K. Ndebele, J.K. Jenkins, Pathobiology 69(2001) 1.
[105] D. Janele, T. Lang, S. Capellino, M. Cutolo, J.A. Da Silva, R.H. Straub, Ann. NYAcad. Sci. 1069 (2006).
[106] T.M. Byrem, D.H. Beermann, T.F. Robinson, J. Anim. Sci. 76 (1998) 4.[107] B. Stoffel, H.H.D. Meyer, J. Anim. Sci. 71 (1993) 7.[108] W.M. Claudino, A. Quattrone, L. Biganzoli, M. Pestrin, I. Bertini, L.A. Di, J. Clin.
Oncol. 25 (2007) 19.
(2009), doi:10.1016/j.chroma.2009.01.094
[109] G.D. Lewis, A. Asnani, R.E. Gerszten, J. Am. Coll. Cardiol. 52 (2008) 2.[110] S. Cubbon, T. Bradbury, J. Wilson, J. Thomas-Oates, Anal. Chem. 79 (2007)
23.[111] M.E. Dumas, C. Canlet, J. Vercauteren, F. Andre, A. Paris, J. Proteome Res. 4
(2005) 5.[112] J.W. Blum, N. Flueckiger, Eur. J. Pharmacol. 151 (1988) 2.

INC
8 omato
[
ARTICLEG ModelHROMA-349755; No. of Pages 8
I. Riedmaier et al. / J. Chr
[113] E.G. Afting, W. Bernhardt, R.W. Janzen, H.J. Rothig, Biochem. J. 200 (1981)2.
[114] P.E. Williams, L. Pagliani, G.M. Innes, K. Pennie, C.I. Harris, P. Garthwaite, Br. J.Nutr. 57 (1987) 3.
[115] J.H. Eisemann, G.B. Huntington, C.L. Ferrell, J. Anim. Sci. 66 (1988) 2.[116] O. Adeola, B.W. McBride, L.G. Young, J. Nutr. 122 (1992) 6.[117] J.B. Li, L.S. Jefferson, Am. J. Physiol. 232 (1977) 2.
Please cite this article in press as: I. Riedmaier, et al., J. Chromatogr. A
[118] E. Barth, G. Albuszies, K. Baumgart, M. Matejovic, U. Wachter, J. Vogt, P. Rader-macher, E. Calzia, Crit. Care Med. 35 (9 Suppl.) (2007).
[119] J.K. Zimmerli, J.W. Blum, J. Anim. Physiol. Anim. Nutr. 63 (1990).120] J.K. Eadara, R.H. Dalrymple, R.L. DeLay, C.A. Ricks, D.R. Romsos, Metabolism 38
(1989) 9.[121] W.P. Hausdorff, M.G. Caron, R.J. Lefkowitz, FASEB J. 4 (1990) 11.
PRESSgr. A xxx (2009) xxx–xxx
[122] R.T. Cunningham, M.H. Mooney, X.L. Xia, S. Crooks, D. Matthews, M. O’Keeffe,K. Li, C.T. Elliott, Anal. Chem. (2009).
[123] U. Mareck, H. Geyer, G. Opfermann, M. Thevis, W. Schanzer, J. Mass Spectrom.43 (2008) 7.
[124] T. Piper, U. Mareck, H. Geyer, U. Flenker, M. Thevis, P. Platen, W. Schanzer, RapidCommun. Mass Spectrom. 22 (2008) 14.
[125] G. Lee, C. Rodriguez, A. Madabhushi, IEEE/ACM. Trans. Comput. Biol. Bioinform.
(2009), doi:10.1016/j.chroma.2009.01.094
5 (2008) 3.[126] J. Beyene, D. Tritchler, S.B. Bull, K.C. Cartier, G. Jonasdottir, A.T. Kraja, N. Li, N.L.
Nock, E. Parkhomenko, J.S. Rao, C.M. Stein, R. Sutradhar, S. Waaijenborg, K.S.Wang, Y. Wang, P. Wolkow, Genet. Epidemiol. 31 (Suppl. 1) (2007).
[127] C.C. Pritchard, L. Hsu, J. Delrow, P.S. Nelson, Proc. Natl. Acad. Sci. U.S.A. 98(2001) 23.

Appendix III
Ib
IP
a
ARRA
KTSBGR
1
poatfwnoc
gTpa
T
0d
Journal of Steroid Biochemistry & Molecular Biology 114 (2009) 167–173
Contents lists available at ScienceDirect
Journal of Steroid Biochemistry and Molecular Biology
journa l homepage: www.e lsev ier .com/ locate / j sbmb
nfluence of testosterone and a novel SARM on gene expression in wholelood of Macaca fascicularis�
rmgard Riedmaier ∗, Ales Tichopad, Martina Reiter, Michael W. Pfaffl, Heinrich H.D. Meyerhysiology Weihenstephan, Technische Universität München, Weihenstephaner Berg 3, 85354 Freising, Germany
r t i c l e i n f o
rticle history:eceived 5 November 2008eceived in revised form 26 January 2009ccepted 28 January 2009
eywords:estosteroneARMiomarkerene expressioneal-time qRT-PCR
a b s t r a c t
Anabolic hormones, including testosterone, have been suggested as a therapy for aging-related conditions,such as osteoporosis and sarcopenia. These therapies are sometimes associated with severe androgenicside effects. A promising alternative to testosterone replacement therapy are selective androgen receptormodulators (SARMs). SARMs have the potential to mimic the desirable central and peripheral androgenicanabolic effects of testosterone without having its side effects.
In this study we evaluated the effects of LGD2941, in comparison to testosterone, on mRNA expressionof selected target genes in whole blood in an non-human model. The regulated genes can act as potentialblood biomarker candidates in future studies with AR ligands.
Cynomolgus monkeys (Macaca fascicularis) were treated either with testosterone or LGD2941 for 90days in order to compare their effects on mRNA expression in blood. Blood samples were taken before
SARM application, on day 16 and on day 90 of treatment.Gene expression of 37 candidate genes was measured using quantitative real-time RT-PCR (qRT-PCR)technology.
Our study shows that both testosterone and LGD2941 influence mRNA expression of 6 selected genesout of 37 in whole blood. The apoptosis regulators CD30L, Fas, TNFR1 and TNFR2 and the interleukins IL-12B and IL-15 showed significant changes in gene expression between control and the treatment groups
ioma
and represent potential b. Introduction
Over the last decades the proportion of elderly people in theopulation has increased [1]. This is the reason why the incidencef age-related conditions like sarcopenia and osteoporosis is risingnd becoming one of the major topics in health care. Sarcopenia ishe loss of muscle mass during the aging process that may lead torailty [2–5]. Sarcopenia is commonly associated with osteoporosis,hich is the age-related loss of bone mineral density. The combi-ation of sarcopenia and osteoporosis results in a high incidencef bone fractures relating to accidental falls, which is a significantause of morbidity and mortality in the elderly population.
Both conditions are associated with a decrease in the endo-
en production of anabolic hormones, including testosterone [4].estosterone treatment has been proposed as a therapy for osteo-orosis and frailty in both men and women [6,7]. However, thendrogen therapies available today are associated with androgenic� The poster version of this manuscript was presented at the Congress in Seefeld,irol 2008.∗ Corresponding author. Fax: +49 8161 714204.
E-mail address: [email protected] (I. Riedmaier).
960-0760/$ – see front matter © 2009 Elsevier Ltd. All rights reserved.oi:10.1016/j.jsbmb.2009.01.019
rkers for androgen receptor ligands in whole blood.© 2009 Elsevier Ltd. All rights reserved.
side effects, such as skin virilization in women and prostate hyper-trophy in men [8–10].
A promising alternative for testosterone replacement therapyis the development of selective androgen receptor modulators(SARMs) [6]. SARMs are synthetic molecules that bind to the andro-gen receptor exhibiting tissue-selective effects. An “ideal” SARMis an orally active compound that provides an increase in musclemass and strength and has an anabolic effect on bone density with-out inducing undesirable androgenic side effects [6]. LGD2941 is anovel non-steroidal, orally active SARM, which has shown potentanabolic activity on bone and muscle in rats and monkeys, butreduced effects on the prostate [7].
It is already known that androgens cause changes in thebiochemical pathways of different organs and tissues. Specificenzymes, receptors and cytokines can be activated or suppressedon the cellular mRNA expression level. Using appropriate specificand sensitive quantification methods, like quantitative real-timeRT-PCR, such mRNA expression changes are measurable.
The aim of this study was to evaluate the effects of LGD2941, incomparison to testosterone, on mRNA expression of selected tar-get genes in whole blood samples. Whole blood is chosen becausesamples can easily been taken from the living organism. Further-more there is evidence in the literature that androgens affect gene
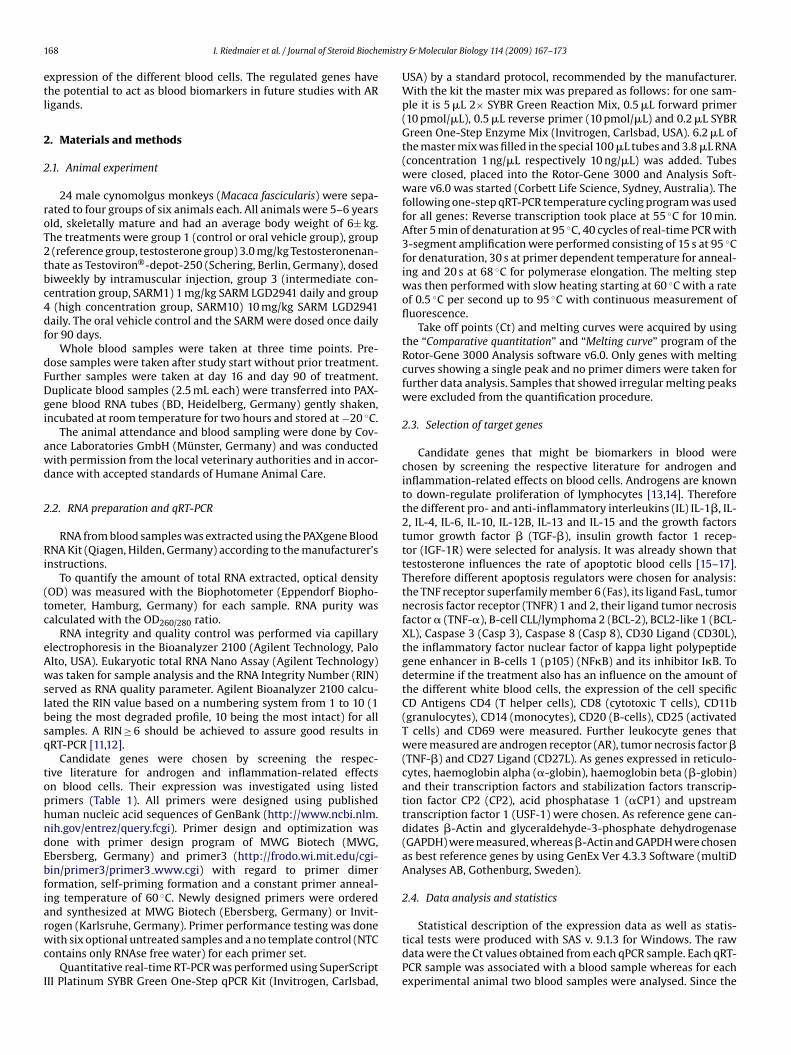
1 emistr
etl
2
2
roT2tbc4df
dFDgi
awd
2
Ri
(tc
eAwslbsq
tophndEbfiarwc
I
68 I. Riedmaier et al. / Journal of Steroid Bioch
xpression of the different blood cells. The regulated genes havehe potential to act as blood biomarkers in future studies with ARigands.
. Materials and methods
.1. Animal experiment
24 male cynomolgus monkeys (Macaca fascicularis) were sepa-ated to four groups of six animals each. All animals were 5–6 yearsld, skeletally mature and had an average body weight of 6± kg.he treatments were group 1 (control or oral vehicle group), group(reference group, testosterone group) 3.0 mg/kg Testosteronenan-
hate as Testoviron®-depot-250 (Schering, Berlin, Germany), dosediweekly by intramuscular injection, group 3 (intermediate con-entration group, SARM1) 1 mg/kg SARM LGD2941 daily and group(high concentration group, SARM10) 10 mg/kg SARM LGD2941
aily. The oral vehicle control and the SARM were dosed once dailyor 90 days.
Whole blood samples were taken at three time points. Pre-ose samples were taken after study start without prior treatment.urther samples were taken at day 16 and day 90 of treatment.uplicate blood samples (2.5 mL each) were transferred into PAX-ene blood RNA tubes (BD, Heidelberg, Germany) gently shaken,ncubated at room temperature for two hours and stored at −20 ◦C.
The animal attendance and blood sampling were done by Cov-nce Laboratories GmbH (Münster, Germany) and was conductedith permission from the local veterinary authorities and in accor-ance with accepted standards of Humane Animal Care.
.2. RNA preparation and qRT-PCR
RNA from blood samples was extracted using the PAXgene BloodNA Kit (Qiagen, Hilden, Germany) according to the manufacturer’s
nstructions.To quantify the amount of total RNA extracted, optical density
OD) was measured with the Biophotometer (Eppendorf Biopho-ometer, Hamburg, Germany) for each sample. RNA purity wasalculated with the OD260/280 ratio.
RNA integrity and quality control was performed via capillarylectrophoresis in the Bioanalyzer 2100 (Agilent Technology, Palolto, USA). Eukaryotic total RNA Nano Assay (Agilent Technology)as taken for sample analysis and the RNA Integrity Number (RIN)
erved as RNA quality parameter. Agilent Bioanalyzer 2100 calcu-ated the RIN value based on a numbering system from 1 to 10 (1eing the most degraded profile, 10 being the most intact) for allamples. A RIN ≥ 6 should be achieved to assure good results inRT-PCR [11,12].
Candidate genes were chosen by screening the respec-ive literature for androgen and inflammation-related effectsn blood cells. Their expression was investigated using listedrimers (Table 1). All primers were designed using publisheduman nucleic acid sequences of GenBank (http://www.ncbi.nlm.ih.gov/entrez/query.fcgi). Primer design and optimization wasone with primer design program of MWG Biotech (MWG,bersberg, Germany) and primer3 (http://frodo.wi.mit.edu/cgi-in/primer3/primer3 www.cgi) with regard to primer dimerormation, self-priming formation and a constant primer anneal-ng temperature of 60 ◦C. Newly designed primers were orderednd synthesized at MWG Biotech (Ebersberg, Germany) or Invit-
ogen (Karlsruhe, Germany). Primer performance testing was doneith six optional untreated samples and a no template control (NTContains only RNAse free water) for each primer set.Quantitative real-time RT-PCR was performed using SuperScript
II Platinum SYBR Green One-Step qPCR Kit (Invitrogen, Carlsbad,
y & Molecular Biology 114 (2009) 167–173
USA) by a standard protocol, recommended by the manufacturer.With the kit the master mix was prepared as follows: for one sam-ple it is 5 �L 2× SYBR Green Reaction Mix, 0.5 �L forward primer(10 pmol/�L), 0.5 �L reverse primer (10 pmol/�L) and 0.2 �L SYBRGreen One-Step Enzyme Mix (Invitrogen, Carlsbad, USA). 6.2 �L ofthe master mix was filled in the special 100 �L tubes and 3.8 �L RNA(concentration 1 ng/�L respectively 10 ng/�L) was added. Tubeswere closed, placed into the Rotor-Gene 3000 and Analysis Soft-ware v6.0 was started (Corbett Life Science, Sydney, Australia). Thefollowing one-step qRT-PCR temperature cycling program was usedfor all genes: Reverse transcription took place at 55 ◦C for 10 min.After 5 min of denaturation at 95 ◦C, 40 cycles of real-time PCR with3-segment amplification were performed consisting of 15 s at 95 ◦Cfor denaturation, 30 s at primer dependent temperature for anneal-ing and 20 s at 68 ◦C for polymerase elongation. The melting stepwas then performed with slow heating starting at 60 ◦C with a rateof 0.5 ◦C per second up to 95 ◦C with continuous measurement offluorescence.
Take off points (Ct) and melting curves were acquired by usingthe “Comparative quantitation” and “Melting curve” program of theRotor-Gene 3000 Analysis software v6.0. Only genes with meltingcurves showing a single peak and no primer dimers were taken forfurther data analysis. Samples that showed irregular melting peakswere excluded from the quantification procedure.
2.3. Selection of target genes
Candidate genes that might be biomarkers in blood werechosen by screening the respective literature for androgen andinflammation-related effects on blood cells. Androgens are knownto down-regulate proliferation of lymphocytes [13,14]. Thereforethe different pro- and anti-inflammatory interleukins (IL) IL-1�, IL-2, IL-4, IL-6, IL-10, IL-12B, IL-13 and IL-15 and the growth factorstumor growth factor � (TGF-�), insulin growth factor 1 recep-tor (IGF-1R) were selected for analysis. It was already shown thattestosterone influences the rate of apoptotic blood cells [15–17].Therefore different apoptosis regulators were chosen for analysis:the TNF receptor superfamily member 6 (Fas), its ligand FasL, tumornecrosis factor receptor (TNFR) 1 and 2, their ligand tumor necrosisfactor � (TNF-�), B-cell CLL/lymphoma 2 (BCL-2), BCL2-like 1 (BCL-XL), Caspase 3 (Casp 3), Caspase 8 (Casp 8), CD30 Ligand (CD30L),the inflammatory factor nuclear factor of kappa light polypeptidegene enhancer in B-cells 1 (p105) (NF�B) and its inhibitor I�B. Todetermine if the treatment also has an influence on the amount ofthe different white blood cells, the expression of the cell specificCD Antigens CD4 (T helper cells), CD8 (cytotoxic T cells), CD11b(granulocytes), CD14 (monocytes), CD20 (B-cells), CD25 (activatedT cells) and CD69 were measured. Further leukocyte genes thatwere measured are androgen receptor (AR), tumor necrosis factor �(TNF-�) and CD27 Ligand (CD27L). As genes expressed in reticulo-cytes, haemoglobin alpha (�-globin), haemoglobin beta (�-globin)and their transcription factors and stabilization factors transcrip-tion factor CP2 (CP2), acid phosphatase 1 (�CP1) and upstreamtranscription factor 1 (USF-1) were chosen. As reference gene can-didates �-Actin and glyceraldehyde-3-phosphate dehydrogenase(GAPDH) were measured, whereas �-Actin and GAPDH were chosenas best reference genes by using GenEx Ver 4.3.3 Software (multiDAnalyses AB, Gothenburg, Sweden).
2.4. Data analysis and statistics
Statistical description of the expression data as well as statis-tical tests were produced with SAS v. 9.1.3 for Windows. The rawdata were the Ct values obtained from each qPCR sample. Each qRT-PCR sample was associated with a blood sample whereas for eachexperimental animal two blood samples were analysed. Since the
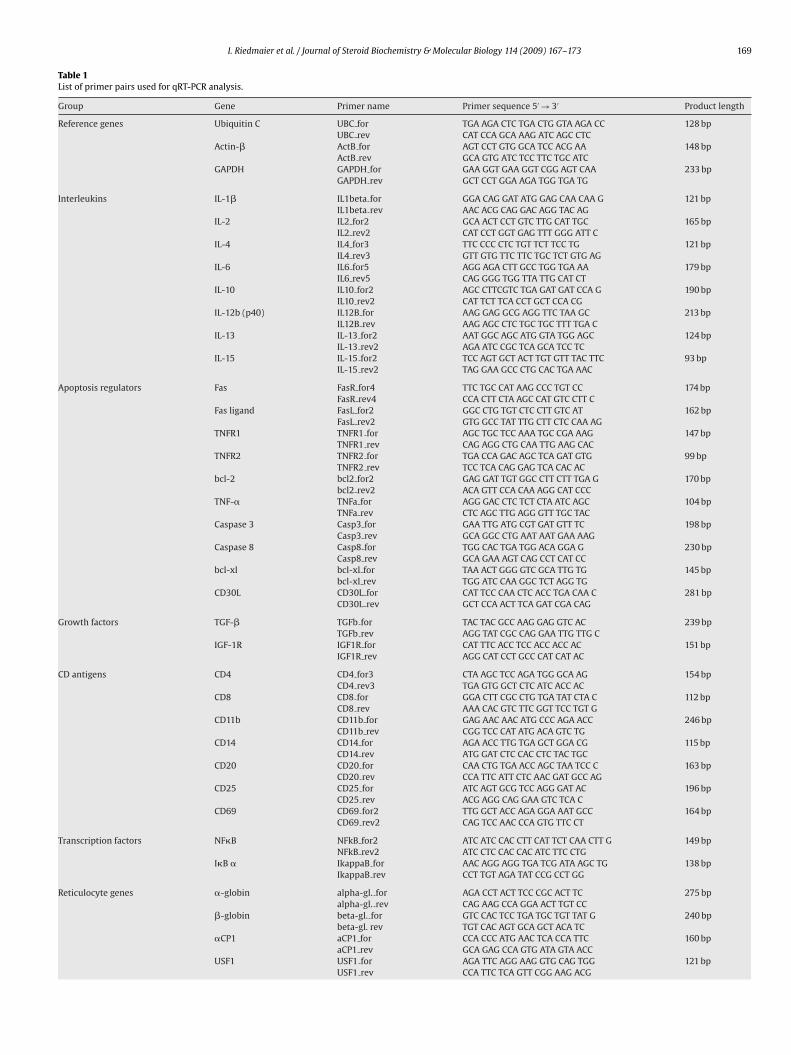
I. Riedmaier et al. / Journal of Steroid Biochemistry & Molecular Biology 114 (2009) 167–173 169
Table 1List of primer pairs used for qRT-PCR analysis.
Group Gene Primer name Primer sequence 5′ → 3′ Product length
Reference genes Ubiquitin C UBC for TGA AGA CTC TGA CTG GTA AGA CC 128 bpUBC rev CAT CCA GCA AAG ATC AGC CTC
Actin-� ActB for AGT CCT GTG GCA TCC ACG AA 148 bpActB rev GCA GTG ATC TCC TTC TGC ATC
GAPDH GAPDH for GAA GGT GAA GGT CGG AGT CAA 233 bpGAPDH rev GCT CCT GGA AGA TGG TGA TG
Interleukins IL-1� IL1beta for GGA CAG GAT ATG GAG CAA CAA G 121 bpIL1beta rev AAC ACG CAG GAC AGG TAC AG
IL-2 IL2 for2 GCA ACT CCT GTC TTG CAT TGC 165 bpIL2 rev2 CAT CCT GGT GAG TTT GGG ATT C
IL-4 IL4 for3 TTC CCC CTC TGT TCT TCC TG 121 bpIL4 rev3 GTT GTG TTC TTC TGC TCT GTG AG
IL-6 IL6 for5 AGG AGA CTT GCC TGG TGA AA 179 bpIL6 rev5 CAG GGG TGG TTA TTG CAT CT
IL-10 IL10 for2 AGC CTTCGTC TGA GAT GAT CCA G 190 bpIL10 rev2 CAT TCT TCA CCT GCT CCA CG
IL-12b (p40) IL12B for AAG GAG GCG AGG TTC TAA GC 213 bpIL12B rev AAG AGC CTC TGC TGC TTT TGA C
IL-13 IL-13 for2 AAT GGC AGC ATG GTA TGG AGC 124 bpIL-13 rev2 AGA ATC CGC TCA GCA TCC TC
IL-15 IL-15 for2 TCC AGT GCT ACT TGT GTT TAC TTC 93 bpIL-15 rev2 TAG GAA GCC CTG CAC TGA AAC
Apoptosis regulators Fas FasR for4 TTC TGC CAT AAG CCC TGT CC 174 bpFasR rev4 CCA CTT CTA AGC CAT GTC CTT C
Fas ligand FasL for2 GGC CTG TGT CTC CTT GTC AT 162 bpFasL rev2 GTG GCC TAT TTG CTT CTC CAA AG
TNFR1 TNFR1 for AGC TGC TCC AAA TGC CGA AAG 147 bpTNFR1 rev CAG AGG CTG CAA TTG AAG CAC
TNFR2 TNFR2 for TGA CCA GAC AGC TCA GAT GTG 99 bpTNFR2 rev TCC TCA CAG GAG TCA CAC AC
bcl-2 bcl2 for2 GAG GAT TGT GGC CTT CTT TGA G 170 bpbcl2 rev2 ACA GTT CCA CAA AGG CAT CCC
TNF-� TNFa for AGG GAC CTC TCT CTA ATC AGC 104 bpTNFa rev CTC AGC TTG AGG GTT TGC TAC
Caspase 3 Casp3 for GAA TTG ATG CGT GAT GTT TC 198 bpCasp3 rev GCA GGC CTG AAT AAT GAA AAG
Caspase 8 Casp8 for TGG CAC TGA TGG ACA GGA G 230 bpCasp8 rev GCA GAA AGT CAG CCT CAT CC
bcl-xl bcl-xl for TAA ACT GGG GTC GCA TTG TG 145 bpbcl-xl rev TGG ATC CAA GGC TCT AGG TG
CD30L CD30L for CAT TCC CAA CTC ACC TGA CAA C 281 bpCD30L rev GCT CCA ACT TCA GAT CGA CAG
Growth factors TGF-� TGFb for TAC TAC GCC AAG GAG GTC AC 239 bpTGFb rev AGG TAT CGC CAG GAA TTG TTG C
IGF-1R IGF1R for CAT TTC ACC TCC ACC ACC AC 151 bpIGF1R rev AGG CAT CCT GCC CAT CAT AC
CD antigens CD4 CD4 for3 CTA AGC TCC AGA TGG GCA AG 154 bpCD4 rev3 TGA GTG GCT CTC ATC ACC AC
CD8 CD8 for GGA CTT CGC CTG TGA TAT CTA C 112 bpCD8 rev AAA CAC GTC TTC GGT TCC TGT G
CD11b CD11b for GAG AAC AAC ATG CCC AGA ACC 246 bpCD11b rev CGG TCC CAT ATG ACA GTC TG
CD14 CD14 for AGA ACC TTG TGA GCT GGA CG 115 bpCD14 rev ATG GAT CTC CAC CTC TAC TGC
CD20 CD20 for CAA CTG TGA ACC AGC TAA TCC C 163 bpCD20 rev CCA TTC ATT CTC AAC GAT GCC AG
CD25 CD25 for ATC AGT GCG TCC AGG GAT AC 196 bpCD25 rev ACG AGG CAG GAA GTC TCA C
CD69 CD69 for2 TTG GCT ACC AGA GGA AAT GCC 164 bpCD69 rev2 CAG TCC AAC CCA GTG TTC CT
Transcription factors NF�B NFkB for2 ATC ATC CAC CTT CAT TCT CAA CTT G 149 bpNFkB rev2 ATC CTC CAC CAC ATC TTC CTG
I�B � IkappaB for AAC AGG AGG TGA TCG ATA AGC TG 138 bpIkappaB rev CCT TGT AGA TAT CCG CCT GG
Reticulocyte genes �-globin alpha-gl. for AGA CCT ACT TCC CGC ACT TC 275 bpalpha-gl. rev CAG AAG CCA GGA ACT TGT CC
�-globin beta-gl. for GTC CAC TCC TGA TGC TGT TAT G 240 bpbeta-gl. rev TGT CAC AGT GCA GCT ACA TC
�CP1 aCP1 for CCA CCC ATG AAC TCA CCA TTC 160 bpaCP1 rev GCA GAG CCA GTG ATA GTA ACC
USF1 USF1 for AGA TTC AGG AAG GTG CAG TGG 121 bpUSF1 rev CCA TTC TCA GTT CGG AAG ACG
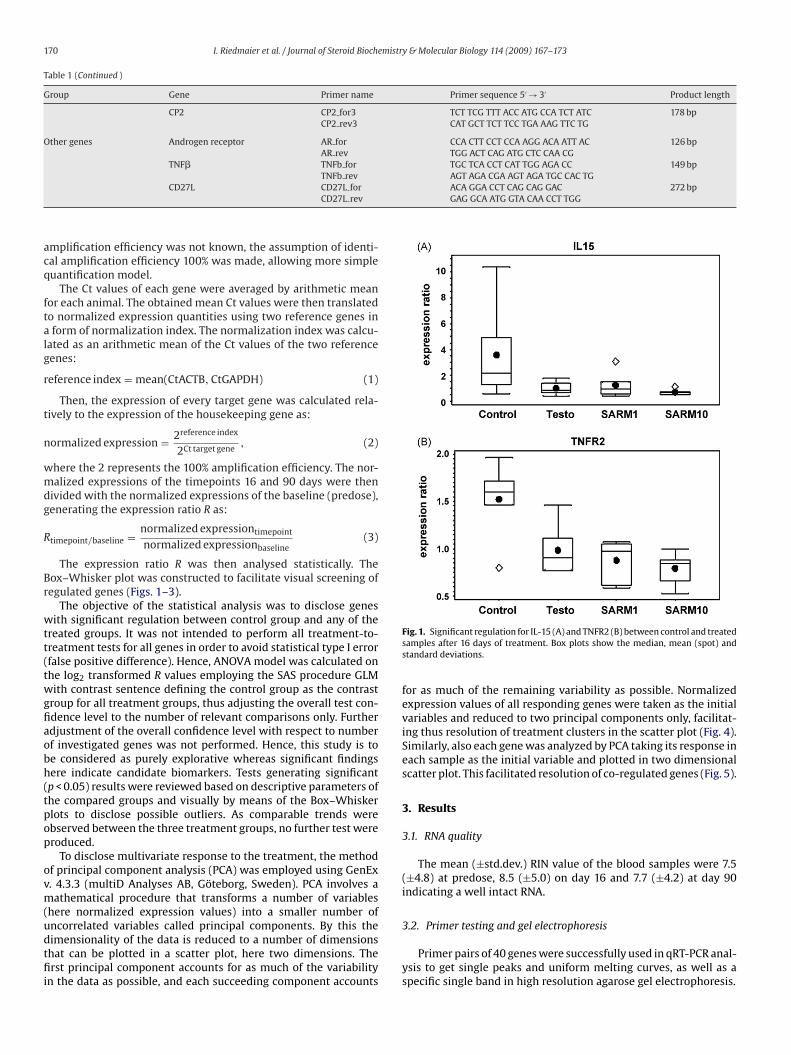
170 I. Riedmaier et al. / Journal of Steroid Biochemistry & Molecular Biology 114 (2009) 167–173
Table 1 (Continued )
Group Gene Primer name Primer sequence 5′ → 3′ Product length
CP2 CP2 for3 TCT TCG TTT ACC ATG CCA TCT ATC 178 bpCP2 rev3 CAT GCT TCT TCC TGA AAG TTC TG
Other genes Androgen receptor AR for CCA CTT CCT CCA AGG ACA ATT AC 126 bpAR rev TGG ACT CAG ATG CTC CAA CG
TNF� TNFb for TGC TCA CCT CAT TGG AGA CC 149 bpTNFb rev AGT AGA CGA AGT AGA TGC CAC TG
ACA GGA CCT CAG CAG GAC 272 bpGAG GCA ATG GTA CAA CCT TGG
acq
ftalg
r
t
n
wmdg
R
Br
wtt(twgfiaobh(tpop
ovm(udtfii
CD27L CD27L forCD27L rev
mplification efficiency was not known, the assumption of identi-al amplification efficiency 100% was made, allowing more simpleuantification model.
The Ct values of each gene were averaged by arithmetic meanor each animal. The obtained mean Ct values were then translatedo normalized expression quantities using two reference genes inform of normalization index. The normalization index was calcu-
ated as an arithmetic mean of the Ct values of the two referenceenes:
eference index = mean(CtACTB, CtGAPDH) (1)
Then, the expression of every target gene was calculated rela-ively to the expression of the housekeeping gene as:
ormalized expression = 2reference index
2Ct target gene, (2)
here the 2 represents the 100% amplification efficiency. The nor-alized expressions of the timepoints 16 and 90 days were then
ivided with the normalized expressions of the baseline (predose),enerating the expression ratio R as:
timepoint/baseline = normalized expressiontimepoint
normalized expressionbaseline(3)
The expression ratio R was then analysed statistically. Theox–Whisker plot was constructed to facilitate visual screening ofegulated genes (Figs. 1–3).
The objective of the statistical analysis was to disclose genesith significant regulation between control group and any of the
reated groups. It was not intended to perform all treatment-to-reatment tests for all genes in order to avoid statistical type I errorfalse positive difference). Hence, ANOVA model was calculated onhe log2 transformed R values employing the SAS procedure GLMith contrast sentence defining the control group as the contrast
roup for all treatment groups, thus adjusting the overall test con-dence level to the number of relevant comparisons only. Furtherdjustment of the overall confidence level with respect to numberf investigated genes was not performed. Hence, this study is toe considered as purely explorative whereas significant findingsere indicate candidate biomarkers. Tests generating significantp < 0.05) results were reviewed based on descriptive parameters ofhe compared groups and visually by means of the Box–Whiskerlots to disclose possible outliers. As comparable trends werebserved between the three treatment groups, no further test wereroduced.
To disclose multivariate response to the treatment, the methodf principal component analysis (PCA) was employed using GenEx. 4.3.3 (multiD Analyses AB, Göteborg, Sweden). PCA involves aathematical procedure that transforms a number of variables
here normalized expression values) into a smaller number of
ncorrelated variables called principal components. By this theimensionality of the data is reduced to a number of dimensionshat can be plotted in a scatter plot, here two dimensions. Therst principal component accounts for as much of the variabilityn the data as possible, and each succeeding component accounts
Fig. 1. Significant regulation for IL-15 (A) and TNFR2 (B) between control and treatedsamples after 16 days of treatment. Box plots show the median, mean (spot) andstandard deviations.
for as much of the remaining variability as possible. Normalizedexpression values of all responding genes were taken as the initialvariables and reduced to two principal components only, facilitat-ing thus resolution of treatment clusters in the scatter plot (Fig. 4).Similarly, also each gene was analyzed by PCA taking its response ineach sample as the initial variable and plotted in two dimensionalscatter plot. This facilitated resolution of co-regulated genes (Fig. 5).
3. Results
3.1. RNA quality
The mean (±std.dev.) RIN value of the blood samples were 7.5(±4.8) at predose, 8.5 (±5.0) on day 16 and 7.7 (±4.2) at day 90indicating a well intact RNA.
3.2. Primer testing and gel electrophoresis
Primer pairs of 40 genes were successfully used in qRT-PCR anal-ysis to get single peaks and uniform melting curves, as well as aspecific single band in high resolution agarose gel electrophoresis.
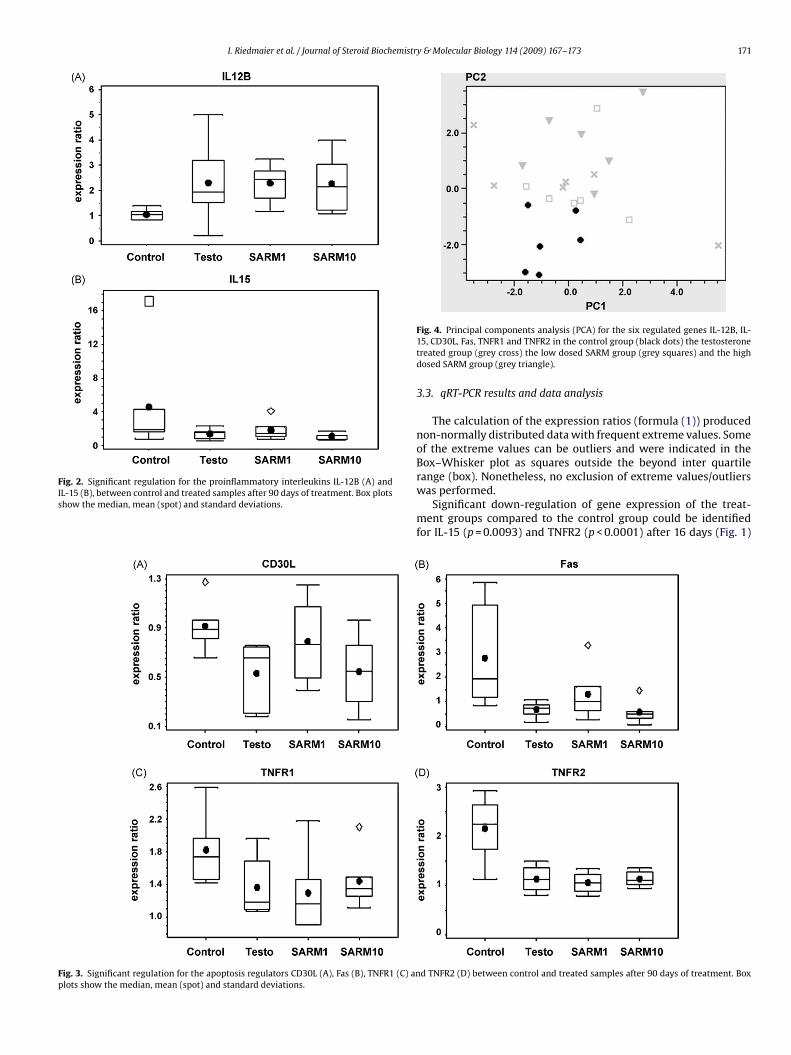
I. Riedmaier et al. / Journal of Steroid Biochemistry & Molecular Biology 114 (2009) 167–173 171
Fig. 2. Significant regulation for the proinflammatory interleukins IL-12B (A) andIL-15 (B), between control and treated samples after 90 days of treatment. Box plotsshow the median, mean (spot) and standard deviations.
Fig. 3. Significant regulation for the apoptosis regulators CD30L (A), Fas (B), TNFR1 (C) anplots show the median, mean (spot) and standard deviations.
Fig. 4. Principal components analysis (PCA) for the six regulated genes IL-12B, IL-15, CD30L, Fas, TNFR1 and TNFR2 in the control group (black dots) the testosteronetreated group (grey cross) the low dosed SARM group (grey squares) and the highdosed SARM group (grey triangle).
3.3. qRT-PCR results and data analysis
The calculation of the expression ratios (formula (1)) producednon-normally distributed data with frequent extreme values. Someof the extreme values can be outliers and were indicated in theBox–Whisker plot as squares outside the beyond inter quartile
range (box). Nonetheless, no exclusion of extreme values/outlierswas performed.Significant down-regulation of gene expression of the treat-ment groups compared to the control group could be identifiedfor IL-15 (p = 0.0093) and TNFR2 (p < 0.0001) after 16 days (Fig. 1)
d TNFR2 (D) between control and treated samples after 90 days of treatment. Box
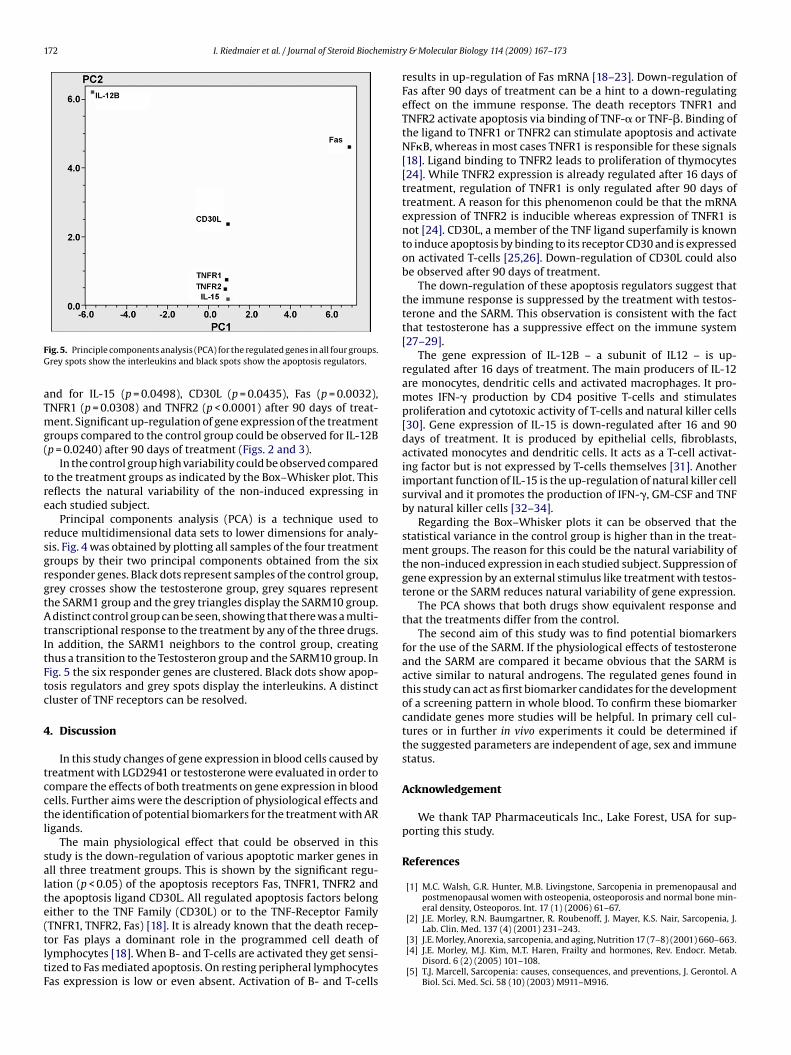
172 I. Riedmaier et al. / Journal of Steroid Biochemistr
FG
aTmg(
tre
rsgrgtAtItFtc
4
tcctl
salte(tltF
ig. 5. Principle components analysis (PCA) for the regulated genes in all four groups.rey spots show the interleukins and black spots show the apoptosis regulators.
nd for IL-15 (p = 0.0498), CD30L (p = 0.0435), Fas (p = 0.0032),NFR1 (p = 0.0308) and TNFR2 (p < 0.0001) after 90 days of treat-ent. Significant up-regulation of gene expression of the treatment
roups compared to the control group could be observed for IL-12Bp = 0.0240) after 90 days of treatment (Figs. 2 and 3).
In the control group high variability could be observed comparedo the treatment groups as indicated by the Box–Whisker plot. Thiseflects the natural variability of the non-induced expressing inach studied subject.
Principal components analysis (PCA) is a technique used toeduce multidimensional data sets to lower dimensions for analy-is. Fig. 4 was obtained by plotting all samples of the four treatmentroups by their two principal components obtained from the sixesponder genes. Black dots represent samples of the control group,rey crosses show the testosterone group, grey squares representhe SARM1 group and the grey triangles display the SARM10 group.distinct control group can be seen, showing that there was a multi-
ranscriptional response to the treatment by any of the three drugs.n addition, the SARM1 neighbors to the control group, creatinghus a transition to the Testosteron group and the SARM10 group. Inig. 5 the six responder genes are clustered. Black dots show apop-osis regulators and grey spots display the interleukins. A distinctluster of TNF receptors can be resolved.
. Discussion
In this study changes of gene expression in blood cells caused byreatment with LGD2941 or testosterone were evaluated in order toompare the effects of both treatments on gene expression in bloodells. Further aims were the description of physiological effects andhe identification of potential biomarkers for the treatment with ARigands.
The main physiological effect that could be observed in thistudy is the down-regulation of various apoptotic marker genes inll three treatment groups. This is shown by the significant regu-ation (p < 0.05) of the apoptosis receptors Fas, TNFR1, TNFR2 andhe apoptosis ligand CD30L. All regulated apoptosis factors belongither to the TNF Family (CD30L) or to the TNF-Receptor Family
TNFR1, TNFR2, Fas) [18]. It is already known that the death recep-or Fas plays a dominant role in the programmed cell death ofymphocytes [18]. When B- and T-cells are activated they get sensi-ized to Fas mediated apoptosis. On resting peripheral lymphocytesas expression is low or even absent. Activation of B- and T-cellsy & Molecular Biology 114 (2009) 167–173
results in up-regulation of Fas mRNA [18–23]. Down-regulation ofFas after 90 days of treatment can be a hint to a down-regulatingeffect on the immune response. The death receptors TNFR1 andTNFR2 activate apoptosis via binding of TNF-� or TNF-�. Binding ofthe ligand to TNFR1 or TNFR2 can stimulate apoptosis and activateNF�B, whereas in most cases TNFR1 is responsible for these signals[18]. Ligand binding to TNFR2 leads to proliferation of thymocytes[24]. While TNFR2 expression is already regulated after 16 days oftreatment, regulation of TNFR1 is only regulated after 90 days oftreatment. A reason for this phenomenon could be that the mRNAexpression of TNFR2 is inducible whereas expression of TNFR1 isnot [24]. CD30L, a member of the TNF ligand superfamily is knownto induce apoptosis by binding to its receptor CD30 and is expressedon activated T-cells [25,26]. Down-regulation of CD30L could alsobe observed after 90 days of treatment.
The down-regulation of these apoptosis regulators suggest thatthe immune response is suppressed by the treatment with testos-terone and the SARM. This observation is consistent with the factthat testosterone has a suppressive effect on the immune system[27–29].
The gene expression of IL-12B – a subunit of IL12 – is up-regulated after 16 days of treatment. The main producers of IL-12are monocytes, dendritic cells and activated macrophages. It pro-motes IFN-� production by CD4 positive T-cells and stimulatesproliferation and cytotoxic activity of T-cells and natural killer cells[30]. Gene expression of IL-15 is down-regulated after 16 and 90days of treatment. It is produced by epithelial cells, fibroblasts,activated monocytes and dendritic cells. It acts as a T-cell activat-ing factor but is not expressed by T-cells themselves [31]. Anotherimportant function of IL-15 is the up-regulation of natural killer cellsurvival and it promotes the production of IFN-�, GM-CSF and TNFby natural killer cells [32–34].
Regarding the Box–Whisker plots it can be observed that thestatistical variance in the control group is higher than in the treat-ment groups. The reason for this could be the natural variability ofthe non-induced expression in each studied subject. Suppression ofgene expression by an external stimulus like treatment with testos-terone or the SARM reduces natural variability of gene expression.
The PCA shows that both drugs show equivalent response andthat the treatments differ from the control.
The second aim of this study was to find potential biomarkersfor the use of the SARM. If the physiological effects of testosteroneand the SARM are compared it became obvious that the SARM isactive similar to natural androgens. The regulated genes found inthis study can act as first biomarker candidates for the developmentof a screening pattern in whole blood. To confirm these biomarkercandidate genes more studies will be helpful. In primary cell cul-tures or in further in vivo experiments it could be determined ifthe suggested parameters are independent of age, sex and immunestatus.
Acknowledgement
We thank TAP Pharmaceuticals Inc., Lake Forest, USA for sup-porting this study.
References
[1] M.C. Walsh, G.R. Hunter, M.B. Livingstone, Sarcopenia in premenopausal andpostmenopausal women with osteopenia, osteoporosis and normal bone min-eral density, Osteoporos. Int. 17 (1) (2006) 61–67.
[2] J.E. Morley, R.N. Baumgartner, R. Roubenoff, J. Mayer, K.S. Nair, Sarcopenia, J.
Lab. Clin. Med. 137 (4) (2001) 231–243.[3] J.E. Morley, Anorexia, sarcopenia, and aging, Nutrition 17 (7–8) (2001) 660–663.[4] J.E. Morley, M.J. Kim, M.T. Haren, Frailty and hormones, Rev. Endocr. Metab.
Disord. 6 (2) (2005) 101–108.[5] T.J. Marcell, Sarcopenia: causes, consequences, and preventions, J. Gerontol. A
Biol. Sci. Med. Sci. 58 (10) (2003) M911–M916.
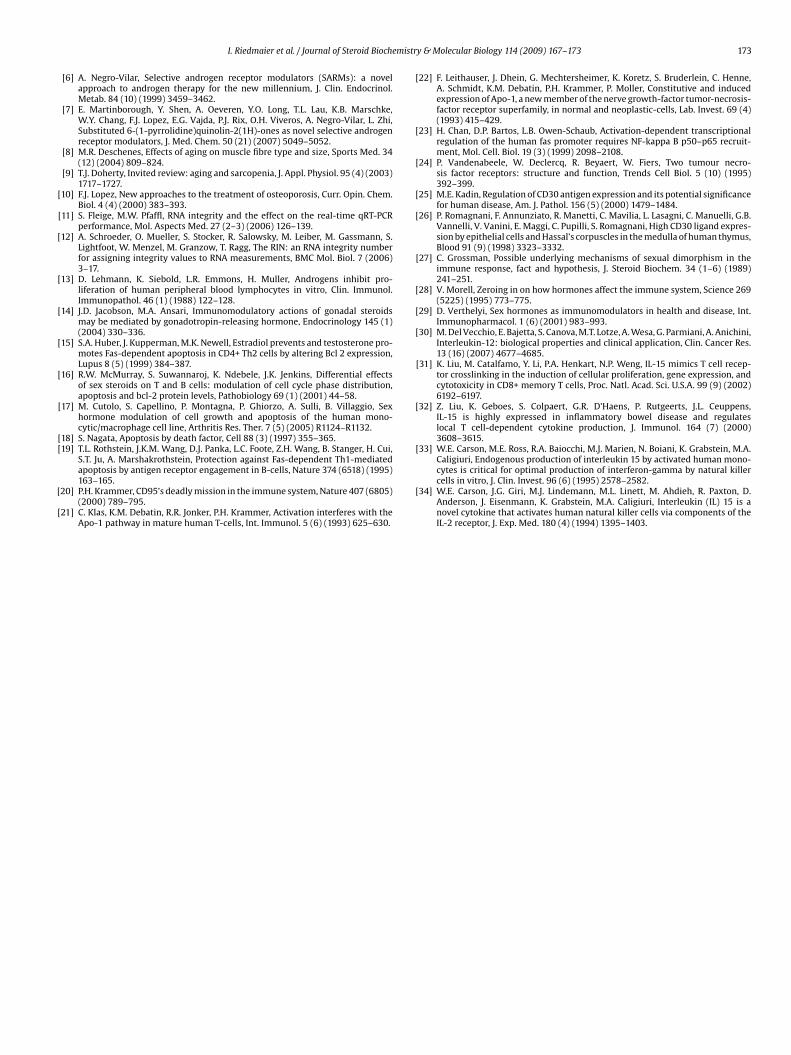
mistr
[
[
[
[
[
[
[
[
[[
[
[
[
[
[
[
[
[
[
[
[
[
[
[
I. Riedmaier et al. / Journal of Steroid Bioche
[6] A. Negro-Vilar, Selective androgen receptor modulators (SARMs): a novelapproach to androgen therapy for the new millennium, J. Clin. Endocrinol.Metab. 84 (10) (1999) 3459–3462.
[7] E. Martinborough, Y. Shen, A. Oeveren, Y.O. Long, T.L. Lau, K.B. Marschke,W.Y. Chang, F.J. Lopez, E.G. Vajda, P.J. Rix, O.H. Viveros, A. Negro-Vilar, L. Zhi,Substituted 6-(1-pyrrolidine)quinolin-2(1H)-ones as novel selective androgenreceptor modulators, J. Med. Chem. 50 (21) (2007) 5049–5052.
[8] M.R. Deschenes, Effects of aging on muscle fibre type and size, Sports Med. 34(12) (2004) 809–824.
[9] T.J. Doherty, Invited review: aging and sarcopenia, J. Appl. Physiol. 95 (4) (2003)1717–1727.
10] F.J. Lopez, New approaches to the treatment of osteoporosis, Curr. Opin. Chem.Biol. 4 (4) (2000) 383–393.
11] S. Fleige, M.W. Pfaffl, RNA integrity and the effect on the real-time qRT-PCRperformance, Mol. Aspects Med. 27 (2–3) (2006) 126–139.
12] A. Schroeder, O. Mueller, S. Stocker, R. Salowsky, M. Leiber, M. Gassmann, S.Lightfoot, W. Menzel, M. Granzow, T. Ragg, The RIN: an RNA integrity numberfor assigning integrity values to RNA measurements, BMC Mol. Biol. 7 (2006)3–17.
13] D. Lehmann, K. Siebold, L.R. Emmons, H. Muller, Androgens inhibit pro-liferation of human peripheral blood lymphocytes in vitro, Clin. Immunol.Immunopathol. 46 (1) (1988) 122–128.
14] J.D. Jacobson, M.A. Ansari, Immunomodulatory actions of gonadal steroidsmay be mediated by gonadotropin-releasing hormone, Endocrinology 145 (1)(2004) 330–336.
15] S.A. Huber, J. Kupperman, M.K. Newell, Estradiol prevents and testosterone pro-motes Fas-dependent apoptosis in CD4+ Th2 cells by altering Bcl 2 expression,Lupus 8 (5) (1999) 384–387.
16] R.W. McMurray, S. Suwannaroj, K. Ndebele, J.K. Jenkins, Differential effectsof sex steroids on T and B cells: modulation of cell cycle phase distribution,apoptosis and bcl-2 protein levels, Pathobiology 69 (1) (2001) 44–58.
17] M. Cutolo, S. Capellino, P. Montagna, P. Ghiorzo, A. Sulli, B. Villaggio, Sexhormone modulation of cell growth and apoptosis of the human mono-cytic/macrophage cell line, Arthritis Res. Ther. 7 (5) (2005) R1124–R1132.
18] S. Nagata, Apoptosis by death factor, Cell 88 (3) (1997) 355–365.19] T.L. Rothstein, J.K.M. Wang, D.J. Panka, L.C. Foote, Z.H. Wang, B. Stanger, H. Cui,
S.T. Ju, A. Marshakrothstein, Protection against Fas-dependent Th1-mediated
apoptosis by antigen receptor engagement in B-cells, Nature 374 (6518) (1995)163–165.20] P.H. Krammer, CD95’s deadly mission in the immune system, Nature 407 (6805)(2000) 789–795.
21] C. Klas, K.M. Debatin, R.R. Jonker, P.H. Krammer, Activation interferes with theApo-1 pathway in mature human T-cells, Int. Immunol. 5 (6) (1993) 625–630.
[
y & Molecular Biology 114 (2009) 167–173 173
22] F. Leithauser, J. Dhein, G. Mechtersheimer, K. Koretz, S. Bruderlein, C. Henne,A. Schmidt, K.M. Debatin, P.H. Krammer, P. Moller, Constitutive and inducedexpression of Apo-1, a new member of the nerve growth-factor tumor-necrosis-factor receptor superfamily, in normal and neoplastic-cells, Lab. Invest. 69 (4)(1993) 415–429.
23] H. Chan, D.P. Bartos, L.B. Owen-Schaub, Activation-dependent transcriptionalregulation of the human fas promoter requires NF-kappa B p50–p65 recruit-ment, Mol. Cell. Biol. 19 (3) (1999) 2098–2108.
24] P. Vandenabeele, W. Declercq, R. Beyaert, W. Fiers, Two tumour necro-sis factor receptors: structure and function, Trends Cell Biol. 5 (10) (1995)392–399.
25] M.E. Kadin, Regulation of CD30 antigen expression and its potential significancefor human disease, Am. J. Pathol. 156 (5) (2000) 1479–1484.
26] P. Romagnani, F. Annunziato, R. Manetti, C. Mavilia, L. Lasagni, C. Manuelli, G.B.Vannelli, V. Vanini, E. Maggi, C. Pupilli, S. Romagnani, High CD30 ligand expres-sion by epithelial cells and Hassal’s corpuscles in the medulla of human thymus,Blood 91 (9) (1998) 3323–3332.
27] C. Grossman, Possible underlying mechanisms of sexual dimorphism in theimmune response, fact and hypothesis, J. Steroid Biochem. 34 (1–6) (1989)241–251.
28] V. Morell, Zeroing in on how hormones affect the immune system, Science 269(5225) (1995) 773–775.
29] D. Verthelyi, Sex hormones as immunomodulators in health and disease, Int.Immunopharmacol. 1 (6) (2001) 983–993.
30] M. Del Vecchio, E. Bajetta, S. Canova, M.T. Lotze, A. Wesa, G. Parmiani, A. Anichini,Interleukin-12: biological properties and clinical application, Clin. Cancer Res.13 (16) (2007) 4677–4685.
31] K. Liu, M. Catalfamo, Y. Li, P.A. Henkart, N.P. Weng, IL-15 mimics T cell recep-tor crosslinking in the induction of cellular proliferation, gene expression, andcytotoxicity in CD8+ memory T cells, Proc. Natl. Acad. Sci. U.S.A. 99 (9) (2002)6192–6197.
32] Z. Liu, K. Geboes, S. Colpaert, G.R. D’Haens, P. Rutgeerts, J.L. Ceuppens,IL-15 is highly expressed in inflammatory bowel disease and regulateslocal T cell-dependent cytokine production, J. Immunol. 164 (7) (2000)3608–3615.
33] W.E. Carson, M.E. Ross, R.A. Baiocchi, M.J. Marien, N. Boiani, K. Grabstein, M.A.Caligiuri, Endogenous production of interleukin 15 by activated human mono-
cytes is critical for optimal production of interferon-gamma by natural killercells in vitro, J. Clin. Invest. 96 (6) (1995) 2578–2582.34] W.E. Carson, J.G. Giri, M.J. Lindemann, M.L. Linett, M. Ahdieh, R. Paxton, D.Anderson, J. Eisenmann, K. Grabstein, M.A. Caligiuri, Interleukin (IL) 15 is anovel cytokine that activates human natural killer cells via components of theIL-2 receptor, J. Exp. Med. 180 (4) (1994) 1395–1403.

Appendix IV
Ia
IP
a
ARRAA
KATEBGQpP
1
aarrgueaedapt
0d
Analytica Chimica Acta 638 (2009) 106–113
Contents lists available at ScienceDirect
Analytica Chimica Acta
journa l homepage: www.e lsev ier .com/ locate /aca
dentification of potential gene expression biomarkers for the surveillance ofnabolic agents in bovine blood cells
rmgard Riedmaier ∗, Ales Tichopad, Martina Reiter, Michael W. Pfaffl, Heinrich H.D. Meyerhysiology Weihenstephan, Technische Universitaet Muenchen, Weihenstephaner Berg 3, 85354 Freising, Germany
r t i c l e i n f o
rticle history:eceived 21 November 2008eceived in revised form 9 February 2009ccepted 9 February 2009vailable online 20 February 2009
eywords:nabolic agentsrenbolone acetatestradioliomarkerene expressionuantitative real time reverse transcription
a b s t r a c t
In the EU, the use of anabolic steroids in food producing animals has been forbidden since 1988. Theroutine methods used in practice are based on the detection of hormonal residues. To overcome theseroutine methods, growth-promoting agents are sometimes administered at concentrations below thedetection limit and new anabolic substances are designed. Therefore, new monitoring systems are neededto overcome the misuse of anabolic agents in meat production.
In this study, a new monitoring system was applied: the quantification of mRNA gene expressionchanges by quantitative real time reverse transcription polymerase chain reaction (qRT-PCR). Blood wasselected as ideal tissue for biomarker screening. From the literature, it is known that steroid hormonesaffect mRNA gene expression of the different blood cells, which can easily be taken from the living animal.
In an animal trial, 18 Nguni heifers were separated to two groups of nine animals. One group served asuntreated control and the other group was treated with a combination of trenbolone acetate plus estradiolfor 39 days in order to allow the detection of the effect on mRNA expression in blood at three time points.
olymerase chain reaction (qRT-PCR)rincipal components analysis
Candidate genes used for developing a biomarker pattern were chosen by screening the actual literaturefor anabolic effects on blood cells.
It could be demonstrated that the combination of trenbolone acetate plus estradiol significantlyinfluences mRNA expression of the steroid receptors (ER-� and GR-�), the apotosis regulator Fas, theproinflammatory interleukins IL-1�, IL-1� and IL-6 and of MHCII, CK, MTPN, RBM5 and Actin-�. Advancedstatistical analysis by Principal Components Analysis (PCA) indicated that these genes represent potentialbiomarkers for this hormone combination in whole blood.
. Introduction
Growth-promoting agents like anabolic steroids or �-agonistsre used in meat producing animals to improve weight gainnd feed efficiency in order to increase the productivity and toeduce production costs [13,20]. Due to adverse effects of hormoneesidues for the consumer [4,27] the use of anabolic hormones forrowth promotion is forbidden in the European Union since 1988nder Directive 88/146/EEC. Routine methods like immuno assays,ither radio immuno assay (RIA) or enzyme immuno assay (EIA),nd chromatographical methods combined with mass spectrom-try are used to detect hormone residues [18,19,26,29]. To avoid
etection of residues during routine control, growth-promotinggents are often administered in cocktails with such low amountser agent that residues are below the detection limit [1]. Alterna-ively, new compounds, not yet included in testing programs, are∗ Corresponding author. Tel.: +49 8161 715552; fax: +49 8161 714204.E-mail address: [email protected] (I. Riedmaier).
003-2670/$ – see front matter © 2009 Elsevier B.V. All rights reserved.oi:10.1016/j.aca.2009.02.014
© 2009 Elsevier B.V. All rights reserved.
used. Therefore, it is necessary to develop new monitoring systemsto detect a broad range of agents at the lowest concentration that isused to get a growth-promoting effect. A potential way to developa new monitoring system is to find gene expression biomarkers forthe illegal use of anabolic steroids [23,24,28].
It is well known that steroid hormones influence biochemicalpathways of different organs and tissues. mRNA expression of hor-mone dependent genes can be activated or suppressed.
Using appropriate specific and sensitive quantification methods,like quantitative real time reverse transcription polymerase chainreaction (qRT-PCR), such mRNA expression changes are measurableat very low levels. From the literature it is known that sex steroidhormones show physiological effects on the different blood cells[3,9,16].
The aim of this pilot study was to monitor the effects of a
commercially available combination of trenbolone acetate plusestradiol on mRNA expression of selected target genes in bovinewhole blood and to perform a bioinformatic evaluation in orderto find potential biomarkers for the effective surveillance of thishormone combination.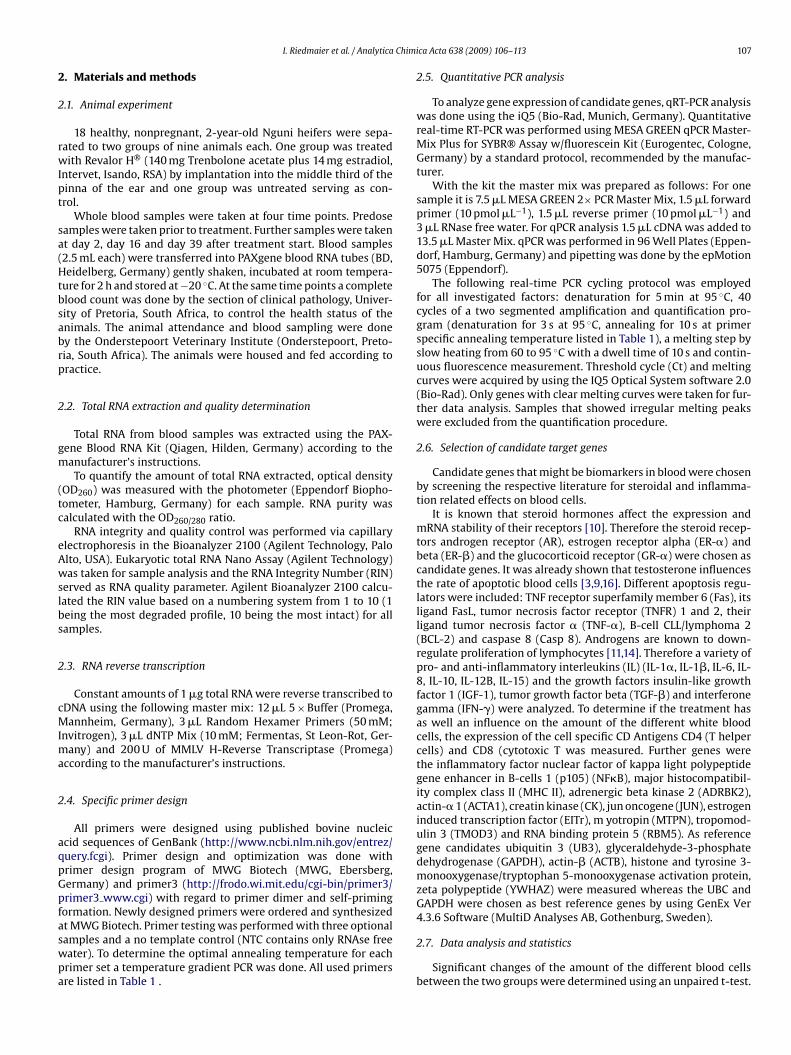
Chimi
2
2
rwIpt
sa(Htbsabrp
2
gm
(tc
eAwslbs
2
cMIma
2
aqpGpfaswpa
I. Riedmaier et al. / Analytica
. Materials and methods
.1. Animal experiment
18 healthy, nonpregnant, 2-year-old Nguni heifers were sepa-ated to two groups of nine animals each. One group was treatedith Revalor H® (140 mg Trenbolone acetate plus 14 mg estradiol,
ntervet, Isando, RSA) by implantation into the middle third of theinna of the ear and one group was untreated serving as con-rol.
Whole blood samples were taken at four time points. Predoseamples were taken prior to treatment. Further samples were takent day 2, day 16 and day 39 after treatment start. Blood samples2.5 mL each) were transferred into PAXgene blood RNA tubes (BD,eidelberg, Germany) gently shaken, incubated at room tempera-
ure for 2 h and stored at −20 ◦C. At the same time points a completelood count was done by the section of clinical pathology, Univer-ity of Pretoria, South Africa, to control the health status of thenimals. The animal attendance and blood sampling were doney the Onderstepoort Veterinary Institute (Onderstepoort, Preto-ia, South Africa). The animals were housed and fed according toractice.
.2. Total RNA extraction and quality determination
Total RNA from blood samples was extracted using the PAX-ene Blood RNA Kit (Qiagen, Hilden, Germany) according to theanufacturer’s instructions.To quantify the amount of total RNA extracted, optical density
OD260) was measured with the photometer (Eppendorf Biopho-ometer, Hamburg, Germany) for each sample. RNA purity wasalculated with the OD260/280 ratio.
RNA integrity and quality control was performed via capillarylectrophoresis in the Bioanalyzer 2100 (Agilent Technology, Palolto, USA). Eukaryotic total RNA Nano Assay (Agilent Technology)as taken for sample analysis and the RNA Integrity Number (RIN)
erved as RNA quality parameter. Agilent Bioanalyzer 2100 calcu-ated the RIN value based on a numbering system from 1 to 10 (1eing the most degraded profile, 10 being the most intact) for allamples.
.3. RNA reverse transcription
Constant amounts of 1 �g total RNA were reverse transcribed toDNA using the following master mix: 12 �L 5 × Buffer (Promega,annheim, Germany), 3 �L Random Hexamer Primers (50 mM;
nvitrogen), 3 �L dNTP Mix (10 mM; Fermentas, St Leon-Rot, Ger-any) and 200 U of MMLV H-Reverse Transcriptase (Promega)
ccording to the manufacturer’s instructions.
.4. Specific primer design
All primers were designed using published bovine nucleiccid sequences of GenBank (http://www.ncbi.nlm.nih.gov/entrez/uery.fcgi). Primer design and optimization was done withrimer design program of MWG Biotech (MWG, Ebersberg,ermany) and primer3 (http://frodo.wi.mit.edu/cgi-bin/primer3/
rimer3 www.cgi) with regard to primer dimer and self-primingormation. Newly designed primers were ordered and synthesizedt MWG Biotech. Primer testing was performed with three optionalamples and a no template control (NTC contains only RNAse freeater). To determine the optimal annealing temperature for eachrimer set a temperature gradient PCR was done. All used primersre listed in Table 1 .ca Acta 638 (2009) 106–113 107
2.5. Quantitative PCR analysis
To analyze gene expression of candidate genes, qRT-PCR analysiswas done using the iQ5 (Bio-Rad, Munich, Germany). Quantitativereal-time RT-PCR was performed using MESA GREEN qPCR Master-Mix Plus for SYBR® Assay w/fluorescein Kit (Eurogentec, Cologne,Germany) by a standard protocol, recommended by the manufac-turer.
With the kit the master mix was prepared as follows: For onesample it is 7.5 �L MESA GREEN 2× PCR Master Mix, 1.5 �L forwardprimer (10 pmol �L−1), 1.5 �L reverse primer (10 pmol �L−1) and3 �L RNase free water. For qPCR analysis 1.5 �L cDNA was added to13.5 �L Master Mix. qPCR was performed in 96 Well Plates (Eppen-dorf, Hamburg, Germany) and pipetting was done by the epMotion5075 (Eppendorf).
The following real-time PCR cycling protocol was employedfor all investigated factors: denaturation for 5 min at 95 ◦C, 40cycles of a two segmented amplification and quantification pro-gram (denaturation for 3 s at 95 ◦C, annealing for 10 s at primerspecific annealing temperature listed in Table 1), a melting step byslow heating from 60 to 95 ◦C with a dwell time of 10 s and contin-uous fluorescence measurement. Threshold cycle (Ct) and meltingcurves were acquired by using the IQ5 Optical System software 2.0(Bio-Rad). Only genes with clear melting curves were taken for fur-ther data analysis. Samples that showed irregular melting peakswere excluded from the quantification procedure.
2.6. Selection of candidate target genes
Candidate genes that might be biomarkers in blood were chosenby screening the respective literature for steroidal and inflamma-tion related effects on blood cells.
It is known that steroid hormones affect the expression andmRNA stability of their receptors [10]. Therefore the steroid recep-tors androgen receptor (AR), estrogen receptor alpha (ER-�) andbeta (ER-�) and the glucocorticoid receptor (GR-�) were chosen ascandidate genes. It was already shown that testosterone influencesthe rate of apoptotic blood cells [3,9,16]. Different apoptosis regu-lators were included: TNF receptor superfamily member 6 (Fas), itsligand FasL, tumor necrosis factor receptor (TNFR) 1 and 2, theirligand tumor necrosis factor � (TNF-�), B-cell CLL/lymphoma 2(BCL-2) and caspase 8 (Casp 8). Androgens are known to down-regulate proliferation of lymphocytes [11,14]. Therefore a variety ofpro- and anti-inflammatory interleukins (IL) (IL-1�, IL-1�, IL-6, IL-8, IL-10, IL-12B, IL-15) and the growth factors insulin-like growthfactor 1 (IGF-1), tumor growth factor beta (TGF-�) and interferonegamma (IFN-�) were analyzed. To determine if the treatment hasas well an influence on the amount of the different white bloodcells, the expression of the cell specific CD Antigens CD4 (T helpercells) and CD8 (cytotoxic T was measured. Further genes werethe inflammatory factor nuclear factor of kappa light polypeptidegene enhancer in B-cells 1 (p105) (NF�B), major histocompatibil-ity complex class II (MHC II), adrenergic beta kinase 2 (ADRBK2),actin-� 1 (ACTA1), creatin kinase (CK), jun oncogene (JUN), estrogeninduced transcription factor (EITr), m yotropin (MTPN), tropomod-ulin 3 (TMOD3) and RNA binding protein 5 (RBM5). As referencegene candidates ubiquitin 3 (UB3), glyceraldehyde-3-phosphatedehydrogenase (GAPDH), actin-� (ACTB), histone and tyrosine 3-monooxygenase/tryptophan 5-monooxygenase activation protein,zeta polypeptide (YWHAZ) were measured whereas the UBC andGAPDH were chosen as best reference genes by using GenEx Ver4.3.6 Software (MultiD Analyses AB, Gothenburg, Sweden).
2.7. Data analysis and statistics
Significant changes of the amount of the different blood cellsbetween the two groups were determined using an unpaired t-test.
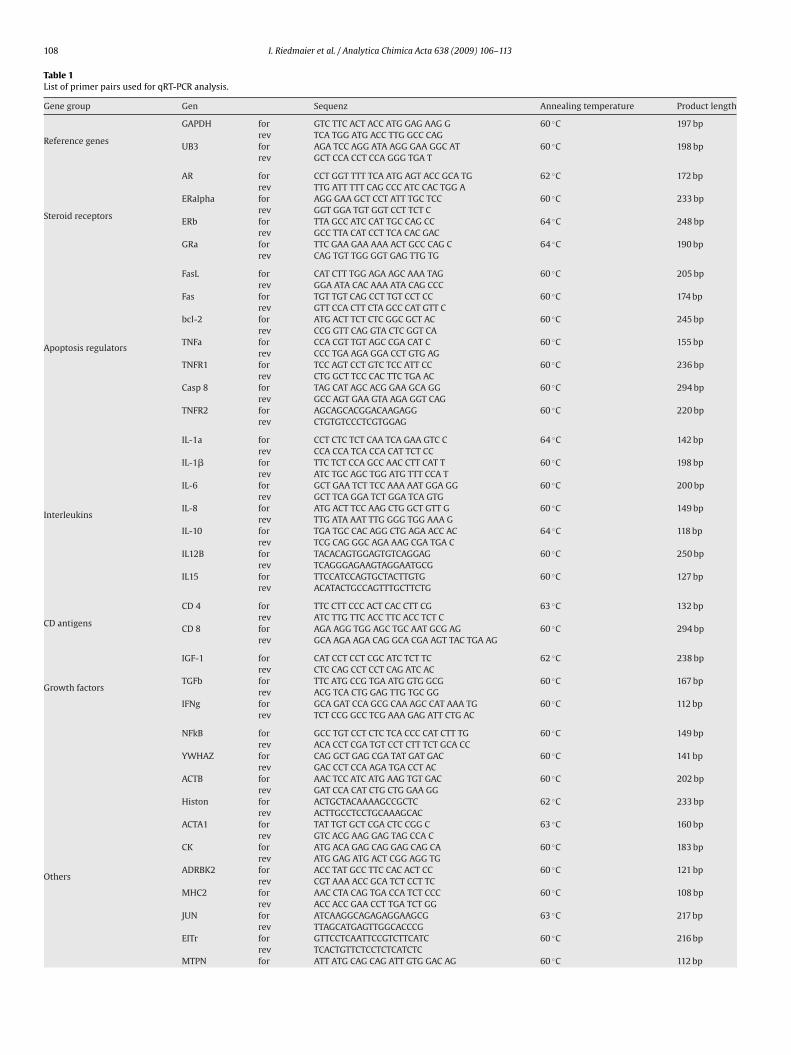
108 I. Riedmaier et al. / Analytica Chimica Acta 638 (2009) 106–113
Table 1List of primer pairs used for qRT-PCR analysis.
Gene group Gen Sequenz Annealing temperature Product length
Reference genes
GAPDH for GTC TTC ACT ACC ATG GAG AAG G 60 ◦C 197 bprev TCA TGG ATG ACC TTG GCC CAG
UB3 for AGA TCC AGG ATA AGG GAA GGC AT 60 ◦C 198 bprev GCT CCA CCT CCA GGG TGA T
Steroid receptors
AR for CCT GGT TTT TCA ATG AGT ACC GCA TG 62 ◦C 172 bprev TTG ATT TTT CAG CCC ATC CAC TGG A
ERalpha for AGG GAA GCT CCT ATT TGC TCC 60 ◦C 233 bprev GGT GGA TGT GGT CCT TCT C
ERb for TTA GCC ATC CAT TGC CAG CC 64 ◦C 248 bprev GCC TTA CAT CCT TCA CAC GAC
GRa for TTC GAA GAA AAA ACT GCC CAG C 64 ◦C 190 bprev CAG TGT TGG GGT GAG TTG TG
Apoptosis regulators
FasL for CAT CTT TGG AGA AGC AAA TAG 60 ◦C 205 bprev GGA ATA CAC AAA ATA CAG CCC
Fas for TGT TGT CAG CCT TGT CCT CC 60 ◦C 174 bprev GTT CCA CTT CTA GCC CAT GTT C
bcl-2 for ATG ACT TCT CTC GGC GCT AC 60 ◦C 245 bprev CCG GTT CAG GTA CTC GGT CA
TNFa for CCA CGT TGT AGC CGA CAT C 60 ◦C 155 bprev CCC TGA AGA GGA CCT GTG AG
TNFR1 for TCC AGT CCT GTC TCC ATT CC 60 ◦C 236 bprev CTG GCT TCC CAC TTC TGA AC
Casp 8 for TAG CAT AGC ACG GAA GCA GG 60 ◦C 294 bprev GCC AGT GAA GTA AGA GGT CAG
TNFR2 for AGCAGCACGGACAAGAGG 60 ◦C 220 bprev CTGTGTCCCTCGTGGAG
Interleukins
IL-1a for CCT CTC TCT CAA TCA GAA GTC C 64 ◦C 142 bprev CCA CCA TCA CCA CAT TCT CC
IL-1� for TTC TCT CCA GCC AAC CTT CAT T 60 ◦C 198 bprev ATC TGC AGC TGG ATG TTT CCA T
IL-6 for GCT GAA TCT TCC AAA AAT GGA GG 60 ◦C 200 bprev GCT TCA GGA TCT GGA TCA GTG
IL-8 for ATG ACT TCC AAG CTG GCT GTT G 60 ◦C 149 bprev TTG ATA AAT TTG GGG TGG AAA G
IL-10 for TGA TGC CAC AGG CTG AGA ACC AC 64 ◦C 118 bprev TCG CAG GGC AGA AAG CGA TGA C
IL12B for TACACAGTGGAGTGTCAGGAG 60 ◦C 250 bprev TCAGGGAGAAGTAGGAATGCG
IL15 for TTCCATCCAGTGCTACTTGTG 60 ◦C 127 bprev ACATACTGCCAGTTTGCTTCTG
CD antigens
CD 4 for TTC CTT CCC ACT CAC CTT CG 63 ◦C 132 bprev ATC TTG TTC ACC TTC ACC TCT C
CD 8 for AGA AGG TGG AGC TGC AAT GCG AG 60 ◦C 294 bprev GCA AGA AGA CAG GCA CGA AGT TAC TGA AG
Growth factors
IGF-1 for CAT CCT CCT CGC ATC TCT TC 62 ◦C 238 bprev CTC CAG CCT CCT CAG ATC AC
TGFb for TTC ATG CCG TGA ATG GTG GCG 60 ◦C 167 bprev ACG TCA CTG GAG TTG TGC GG
IFNg for GCA GAT CCA GCG CAA AGC CAT AAA TG 60 ◦C 112 bprev TCT CCG GCC TCG AAA GAG ATT CTG AC
Others
NFkB for GCC TGT CCT CTC TCA CCC CAT CTT TG 60 ◦C 149 bprev ACA CCT CGA TGT CCT CTT TCT GCA CC
YWHAZ for CAG GCT GAG CGA TAT GAT GAC 60 ◦C 141 bprev GAC CCT CCA AGA TGA CCT AC
ACTB for AAC TCC ATC ATG AAG TGT GAC 60 ◦C 202 bprev GAT CCA CAT CTG CTG GAA GG
Histon for ACTGCTACAAAAGCCGCTC 62 ◦C 233 bprev ACTTGCCTCCTGCAAAGCAC
ACTA1 for TAT TGT GCT CGA CTC CGG C 63 ◦C 160 bprev GTC ACG AAG GAG TAG CCA C
CK for ATG ACA GAG CAG GAG CAG CA 60 ◦C 183 bprev ATG GAG ATG ACT CGG AGG TG
ADRBK2 for ACC TAT GCC TTC CAC ACT CC 60 ◦C 121 bprev CGT AAA ACC GCA TCT CCT TC
MHC2 for AAC CTA CAG TGA CCA TCT CCC 60 ◦C 108 bprev ACC ACC GAA CCT TGA TCT GG
JUN for ATCAAGGCAGAGAGGAAGCG 63 ◦C 217 bprev TTAGCATGAGTTGGCACCCG
EITr for GTTCCTCAATTCCGTCTTCATC 60 ◦C 216 bprev TCACTGTTCTCCTCTCATCTC
MTPN for ATT ATG CAG CAG ATT GTG GAC AG 60 ◦C 112 bp
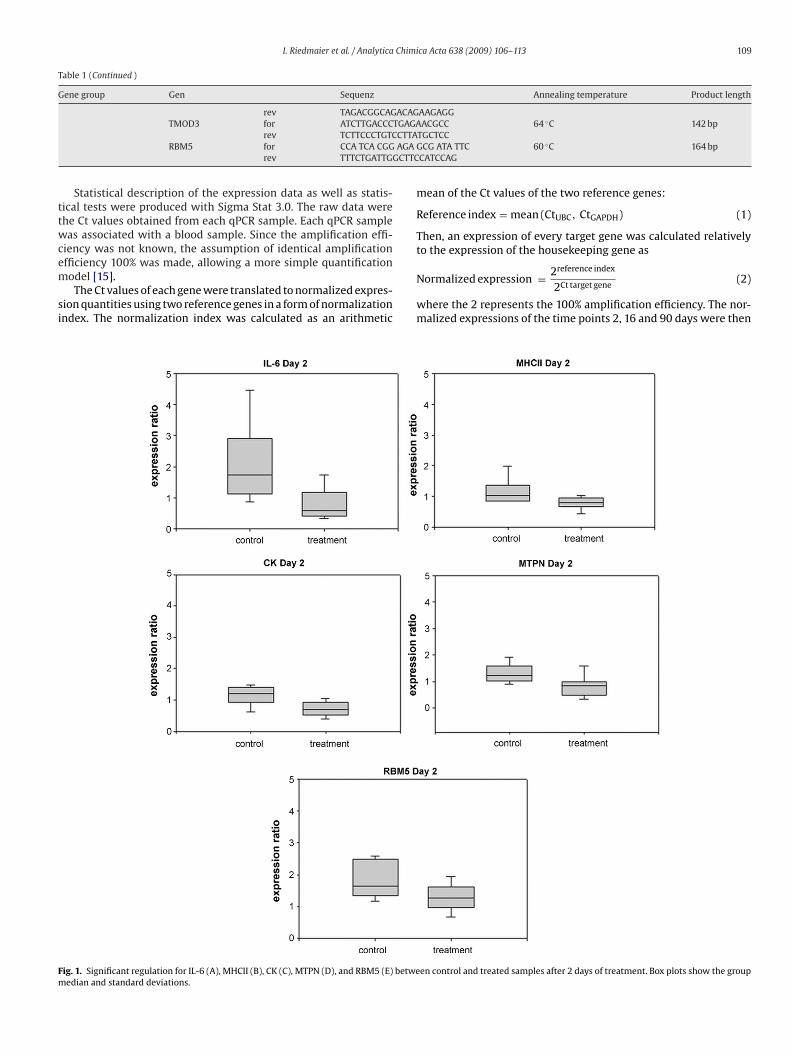
I. Riedmaier et al. / Analytica Chimica Acta 638 (2009) 106–113 109
Table 1 (Continued )
Gene group Gen Sequenz Annealing temperature Product length
rev TAGACGGCAGACAGAAGAGGTGAGA ◦
CTTAAGA
GCTTC
ttwcem
si
Fm
TMOD3 for ATCTTGACCCrev TCTTCCCTGTC
RBM5 for CCA TCA CGGrev TTTCTGATTG
Statistical description of the expression data as well as statis-ical tests were produced with Sigma Stat 3.0. The raw data werehe Ct values obtained from each qPCR sample. Each qPCR sampleas associated with a blood sample. Since the amplification effi-
iency was not known, the assumption of identical amplification
fficiency 100% was made, allowing a more simple quantificationodel [15].The Ct values of each gene were translated to normalized expres-ion quantities using two reference genes in a form of normalizationndex. The normalization index was calculated as an arithmetic
ig. 1. Significant regulation for IL-6 (A), MHCII (B), CK (C), MTPN (D), and RBM5 (E) betweedian and standard deviations.
ACGCC 64 C 142 bpTGCTCCGCG ATA TTC 60 ◦C 164 bpCATCCAG
mean of the Ct values of the two reference genes:
Reference index = mean (CtUBC, CtGAPDH) (1)
Then, an expression of every target gene was calculated relativelyto the expression of the housekeeping gene as
Normalized expression = 2reference index
2Ct target gene(2)
where the 2 represents the 100% amplification efficiency. The nor-malized expressions of the time points 2, 16 and 90 days were then
en control and treated samples after 2 days of treatment. Box plots show the group
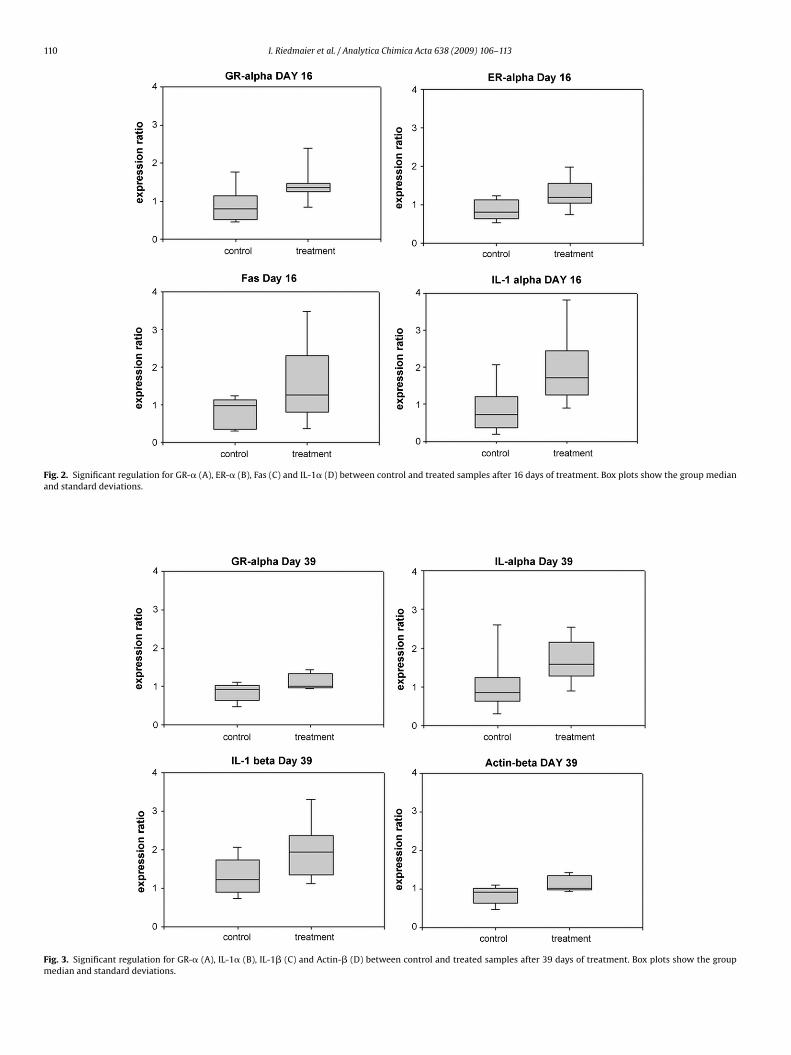
110 I. Riedmaier et al. / Analytica Chimica Acta 638 (2009) 106–113
Fig. 2. Significant regulation for GR-� (A), ER-� (B), Fas (C) and IL-1� (D) between control and treated samples after 16 days of treatment. Box plots show the group medianand standard deviations.
Fig. 3. Significant regulation for GR-� (A), IL-1� (B), IL-1� (C) and Actin-� (D) between control and treated samples after 39 days of treatment. Box plots show the groupmedian and standard deviations.
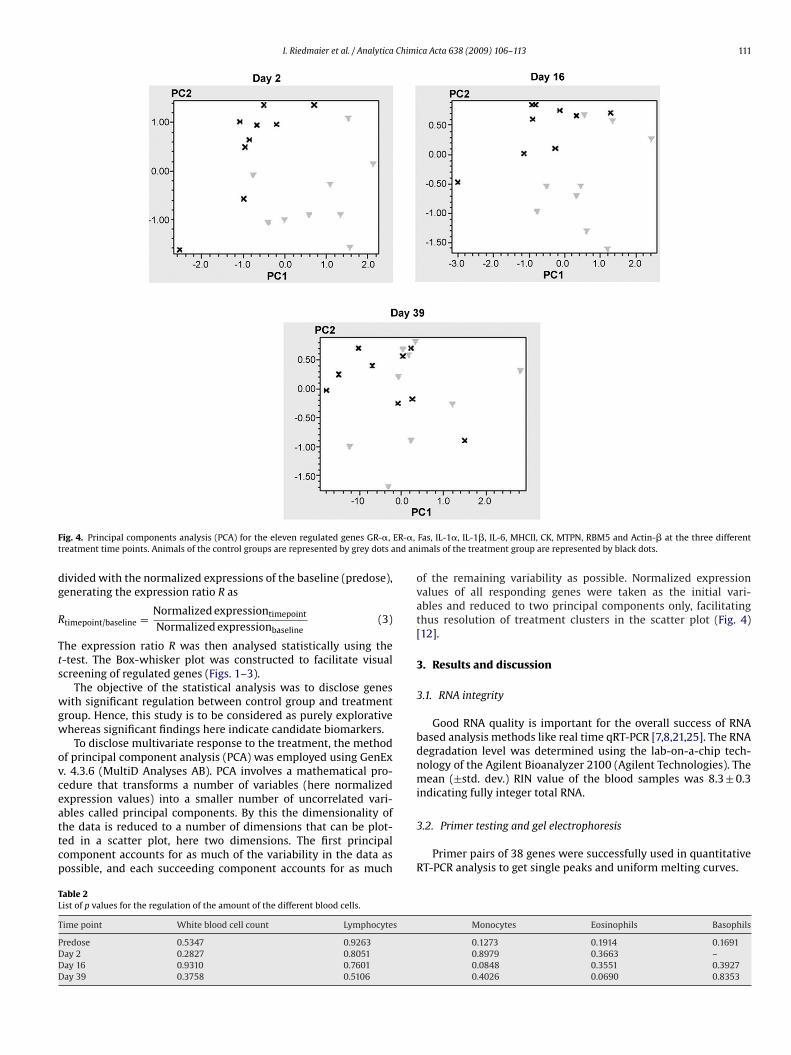
I. Riedmaier et al. / Analytica Chimica Acta 638 (2009) 106–113 111
F ER-�,t nd an
dg
R
Tts
wgw
ovceattcp
TL
T
PDDD
ig. 4. Principal components analysis (PCA) for the eleven regulated genes GR-�,reatment time points. Animals of the control groups are represented by grey dots a
ivided with the normalized expressions of the baseline (predose),enerating the expression ratio R as
timepoint/baseline = Normalized expressiontimepoint
Normalized expressionbaseline(3)
he expression ratio R was then analysed statistically using the-test. The Box-whisker plot was constructed to facilitate visualcreening of regulated genes (Figs. 1–3).
The objective of the statistical analysis was to disclose genesith significant regulation between control group and treatment
roup. Hence, this study is to be considered as purely explorativehereas significant findings here indicate candidate biomarkers.
To disclose multivariate response to the treatment, the methodf principal component analysis (PCA) was employed using GenEx. 4.3.6 (MultiD Analyses AB). PCA involves a mathematical pro-edure that transforms a number of variables (here normalizedxpression values) into a smaller number of uncorrelated vari-
bles called principal components. By this the dimensionality ofhe data is reduced to a number of dimensions that can be plot-ed in a scatter plot, here two dimensions. The first principalomponent accounts for as much of the variability in the data asossible, and each succeeding component accounts for as muchable 2ist of p values for the regulation of the amount of the different blood cells.
ime point White blood cell count Lymphocytes
redose 0.5347 0.9263ay 2 0.2827 0.8051ay 16 0.9310 0.7601ay 39 0.3758 0.5106
Fas, IL-1�, IL-1�, IL-6, MHCII, CK, MTPN, RBM5 and Actin-� at the three differentimals of the treatment group are represented by black dots.
of the remaining variability as possible. Normalized expressionvalues of all responding genes were taken as the initial vari-ables and reduced to two principal components only, facilitatingthus resolution of treatment clusters in the scatter plot (Fig. 4)[12].
3. Results and discussion
3.1. RNA integrity
Good RNA quality is important for the overall success of RNAbased analysis methods like real time qRT-PCR [7,8,21,25]. The RNAdegradation level was determined using the lab-on-a-chip tech-nology of the Agilent Bioanalyzer 2100 (Agilent Technologies). Themean (±std. dev.) RIN value of the blood samples was 8.3 ± 0.3indicating fully integer total RNA.
Monocytes Eosinophils Basophils
0.1273 0.1914 0.16910.8979 0.3663 –0.0848 0.3551 0.39270.4026 0.0690 0.8353
3.2. Primer testing and gel electrophoresis
Primer pairs of 38 genes were successfully used in quantitativeRT-PCR analysis to get single peaks and uniform melting curves.
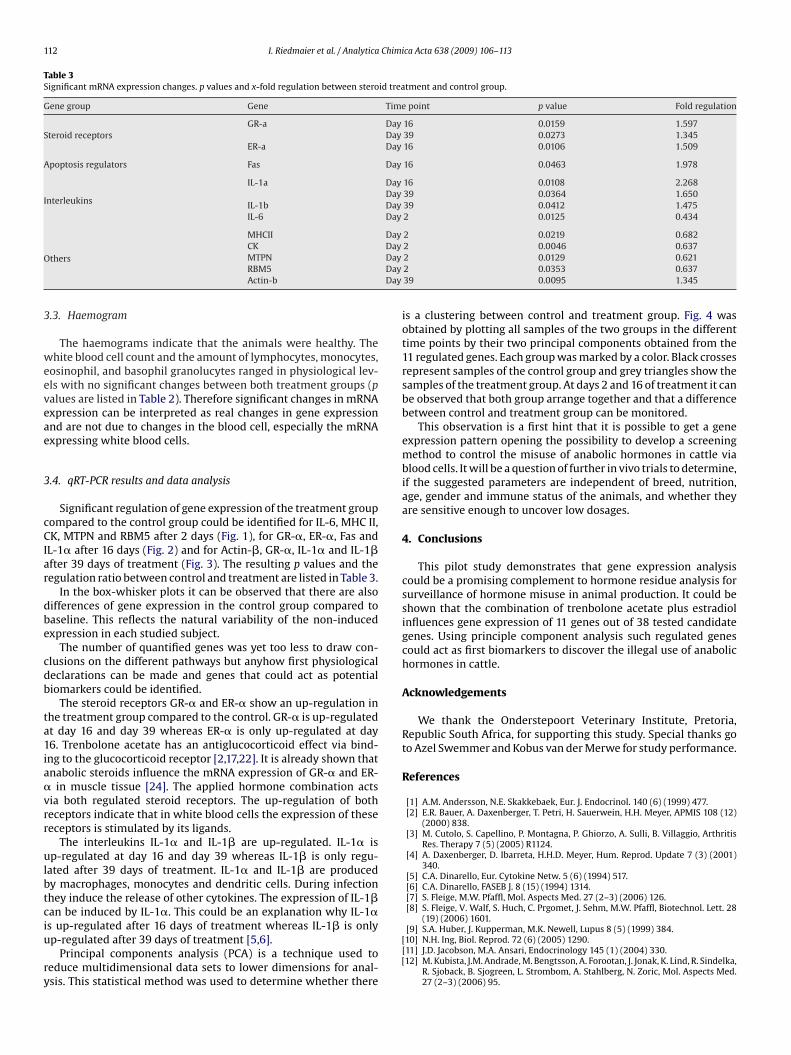
112 I. Riedmaier et al. / Analytica Chimica Acta 638 (2009) 106–113
Table 3Significant mRNA expression changes. p values and x-fold regulation between steroid treatment and control group.
Gene group Gene Time point p value Fold regulation
Steroid receptorsGR-a Day 16 0.0159 1.597
Day 39 0.0273 1.345ER-a Day 16 0.0106 1.509
Apoptosis regulators Fas Day 16 0.0463 1.978
Interleukins
IL-1a Day 16 0.0108 2.268Day 39 0.0364 1.650
IL-1b Day 39 0.0412 1.475IL-6 Day 2 0.0125 0.434
O
MHCII Day 2 0.0219 0.682DayDayDayDay
3
weeveae
3
cCIar
dbe
cdb
ta1ia�vrr
ulbtciu
ry
thersCKMTPNRBM5Actin-b
.3. Haemogram
The haemograms indicate that the animals were healthy. Thehite blood cell count and the amount of lymphocytes, monocytes,
osinophil, and basophil granolucytes ranged in physiological lev-ls with no significant changes between both treatment groups (palues are listed in Table 2). Therefore significant changes in mRNAxpression can be interpreted as real changes in gene expressionnd are not due to changes in the blood cell, especially the mRNAxpressing white blood cells.
.4. qRT-PCR results and data analysis
Significant regulation of gene expression of the treatment groupompared to the control group could be identified for IL-6, MHC II,K, MTPN and RBM5 after 2 days (Fig. 1), for GR-�, ER-�, Fas and
L-1� after 16 days (Fig. 2) and for Actin-�, GR-�, IL-1� and IL-1�fter 39 days of treatment (Fig. 3). The resulting p values and theegulation ratio between control and treatment are listed in Table 3.
In the box-whisker plots it can be observed that there are alsoifferences of gene expression in the control group compared toaseline. This reflects the natural variability of the non-inducedxpression in each studied subject.
The number of quantified genes was yet too less to draw con-lusions on the different pathways but anyhow first physiologicaleclarations can be made and genes that could act as potentialiomarkers could be identified.
The steroid receptors GR-� and ER-� show an up-regulation inhe treatment group compared to the control. GR-� is up-regulatedt day 16 and day 39 whereas ER-� is only up-regulated at day6. Trenbolone acetate has an antiglucocorticoid effect via bind-ng to the glucocorticoid receptor [2,17,22]. It is already shown thatnabolic steroids influence the mRNA expression of GR-� and ER-
in muscle tissue [24]. The applied hormone combination actsia both regulated steroid receptors. The up-regulation of botheceptors indicate that in white blood cells the expression of theseeceptors is stimulated by its ligands.
The interleukins IL-1� and IL-1� are up-regulated. IL-1� isp-regulated at day 16 and day 39 whereas IL-1� is only regu-
ated after 39 days of treatment. IL-1� and IL-1� are producedy macrophages, monocytes and dendritic cells. During infectionhey induce the release of other cytokines. The expression of IL-1�an be induced by IL-1�. This could be an explanation why IL-1�
s up-regulated after 16 days of treatment whereas IL-1� is onlyp-regulated after 39 days of treatment [5,6].Principal components analysis (PCA) is a technique used toeduce multidimensional data sets to lower dimensions for anal-sis. This statistical method was used to determine whether there
[
2 0.0046 0.6372 0.0129 0.6212 0.0353 0.63739 0.0095 1.345
is a clustering between control and treatment group. Fig. 4 wasobtained by plotting all samples of the two groups in the differenttime points by their two principal components obtained from the11 regulated genes. Each group was marked by a color. Black crossesrepresent samples of the control group and grey triangles show thesamples of the treatment group. At days 2 and 16 of treatment it canbe observed that both group arrange together and that a differencebetween control and treatment group can be monitored.
This observation is a first hint that it is possible to get a geneexpression pattern opening the possibility to develop a screeningmethod to control the misuse of anabolic hormones in cattle viablood cells. It will be a question of further in vivo trials to determine,if the suggested parameters are independent of breed, nutrition,age, gender and immune status of the animals, and whether theyare sensitive enough to uncover low dosages.
4. Conclusions
This pilot study demonstrates that gene expression analysiscould be a promising complement to hormone residue analysis forsurveillance of hormone misuse in animal production. It could beshown that the combination of trenbolone acetate plus estradiolinfluences gene expression of 11 genes out of 38 tested candidategenes. Using principle component analysis such regulated genescould act as first biomarkers to discover the illegal use of anabolichormones in cattle.
Acknowledgements
We thank the Onderstepoort Veterinary Institute, Pretoria,Republic South Africa, for supporting this study. Special thanks goto Azel Swemmer and Kobus van der Merwe for study performance.
References
[1] A.M. Andersson, N.E. Skakkebaek, Eur. J. Endocrinol. 140 (6) (1999) 477.[2] E.R. Bauer, A. Daxenberger, T. Petri, H. Sauerwein, H.H. Meyer, APMIS 108 (12)
(2000) 838.[3] M. Cutolo, S. Capellino, P. Montagna, P. Ghiorzo, A. Sulli, B. Villaggio, Arthritis
Res. Therapy 7 (5) (2005) R1124.[4] A. Daxenberger, D. Ibarreta, H.H.D. Meyer, Hum. Reprod. Update 7 (3) (2001)
340.[5] C.A. Dinarello, Eur. Cytokine Netw. 5 (6) (1994) 517.[6] C.A. Dinarello, FASEB J. 8 (15) (1994) 1314.[7] S. Fleige, M.W. Pfaffl, Mol. Aspects Med. 27 (2–3) (2006) 126.[8] S. Fleige, V. Walf, S. Huch, C. Prgomet, J. Sehm, M.W. Pfaffl, Biotechnol. Lett. 28
(19) (2006) 1601.
[9] S.A. Huber, J. Kupperman, M.K. Newell, Lupus 8 (5) (1999) 384.[10] N.H. Ing, Biol. Reprod. 72 (6) (2005) 1290.[11] J.D. Jacobson, M.A. Ansari, Endocrinology 145 (1) (2004) 330.12] M. Kubista, J.M. Andrade, M. Bengtsson, A. Forootan, J. Jonak, K. Lind, R. Sindelka,
R. Sjoback, B. Sjogreen, L. Strombom, A. Stahlberg, N. Zoric, Mol. Aspects Med.27 (2–3) (2006) 95.

Chimi
[[
[[
[[[[
[[
[
[
[
[
I. Riedmaier et al. / Analytica
13] I.G. Lange, A. Daxenberger, H.H. Meyer, APMIS 109 (1) (2001) 53.14] D. Lehmann, K. Siebold, L.R. Emmons, H. Muller, Clin. Immunol. Immunopathol.
46 (1) (1988) 122.15] K.J. Livak, T.D. Schmittgen, Methods 25 (4) (2001) 402.16] R.W. McMurray, S. Suwannaroj, K. Ndebele, J.K. Jenkins, Pathobiology 69 (1)
(2001) 44.17] H.H.D. Meyer, APMIS 109 (1) (2001) 1.18] H.H.D. Meyer, S. Hoffmann, Food Addit. Contam. 4 (2) (1987) 149.
19] H.H.D. Meyer, L. Rinke, I. Dursch, J. Chromatogr. 564 (2) (1991) 551.20] C. Moran, J.F. Quirke, D.J. Prendiville, S. Bourke, J.F. Roche, J. Anim. Sci. 69 (11)(1991) 4249.21] M.W. Pfaffl, S. Fleige, I. Riedmaier, Biotechnol. Biotechnol. EQ. 22 (2008) 829.22] J. Pottier, C. Cousty, R.J. Heitzman, I.P. Reynolds, Xenobiotica 11 (7) (1981)
489.
[
[
[
ca Acta 638 (2009) 106–113 113
23] M. Reiter, M.W. Pfaffl, M. Schoenfelder, H.H.D. Meyer, Biomarker Insights 4(2009) 1.
24] M. Reiter, V.M. Walf, A. Christians, M.W. Pfaffl, H.H. Meyer, Anal. Chim. Acta 586(1–2) (2007) 73.
25] A. Schroeder, O. Mueller, S. Stocker, R. Salowsky, M. Leiber, M. Gassmann, S.Lightfoot, W. Menzel, M. Granzow, T. Ragg, BMC. Mol. Biol. 7 (2006) 3.
26] M.L. Scippo, G. Degand, A. Duyckaerts, G. Maghuin-Rogister, P. Delahaut, Analyst119 (12) (1994) 2639.
27] S.H. Swan, F. Liu, J.W. Overstreet, C. Brazil, N.E. Skakkebaek, Hum. Reprod. 22(6) (2007) 1497.
28] L. Toffolatti, G.L. Rosa, T. Patarnello, C. Romualdi, R. Merlanti, C. Montesissa, L.Poppi, M. Castagnaro, L. Bargelloni, Domest. Anim. Endocrinol. 30 (1) (2006)38.
29] L.A. van Ginkel, J. Chromatogr. 564 (2) (1991) 363.

Appendix V

1
The potential of bovine vaginal smear for biomarker development to trace the 1
misuse of anabolic agents2
3
Irmgard Riedmaier, Martina Reiter, Ales Tichopad, Michael W. Pfaffl, Heinrich H. D. Meyer4
5
Physiology Weihenstephan, Technische Universitaet Muenchen, Weihenstephaner Berg 3, 6
85354 Freising, Germany7
8
9
10
11
12
13
14
15
16
17
18
Corresponding author:19
20
Irmgard Riedmaier21
Physiology Weihenstephan22
TU Muenchen23
Weihenstephaner Berg 324
85354 Freising25
Germany26
Fax: +49 8161 71420427
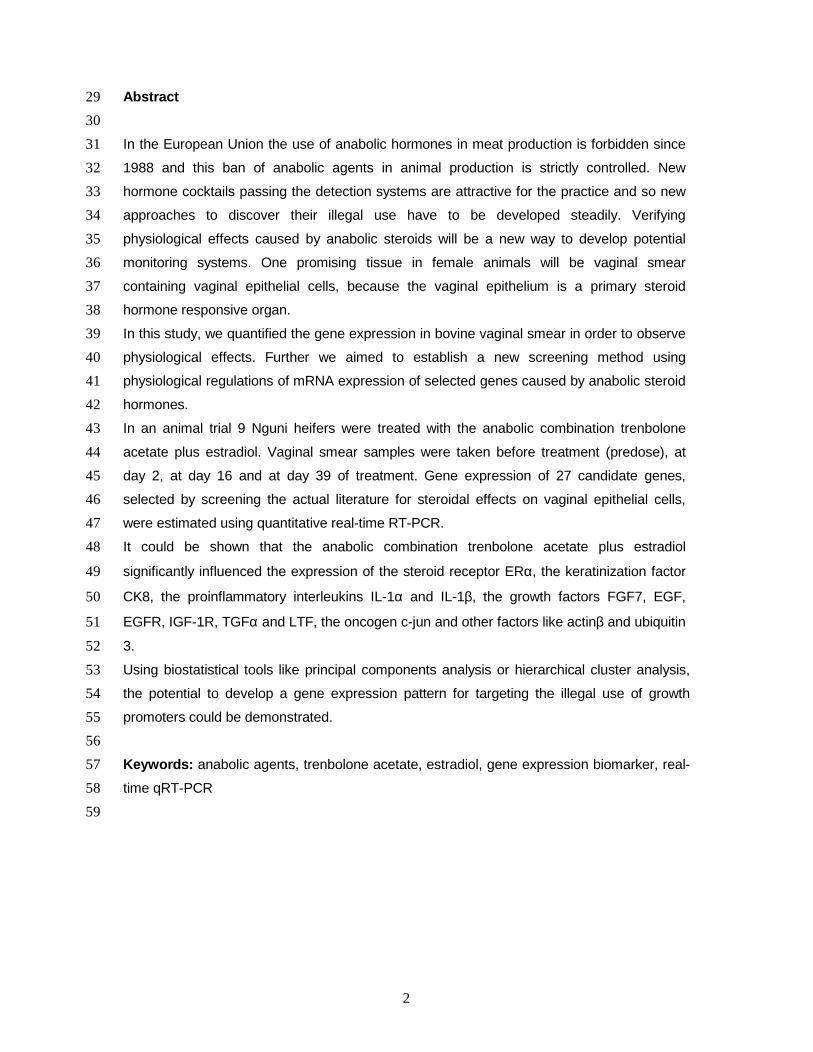
2
Abstract29
30
In the European Union the use of anabolic hormones in meat production is forbidden since 31
1988 and this ban of anabolic agents in animal production is strictly controlled. New 32
hormone cocktails passing the detection systems are attractive for the practice and so new 33
approaches to discover their illegal use have to be developed steadily. Verifying 34
physiological effects caused by anabolic steroids will be a new way to develop potential 35
monitoring systems. One promising tissue in female animals will be vaginal smear36
containing vaginal epithelial cells, because the vaginal epithelium is a primary steroid 37
hormone responsive organ.38
In this study, we quantified the gene expression in bovine vaginal smear in order to observe 39
physiological effects. Further we aimed to establish a new screening method using 40
physiological regulations of mRNA expression of selected genes caused by anabolic steroid 41
hormones. 42
In an animal trial 9 Nguni heifers were treated with the anabolic combination trenbolone 43
acetate plus estradiol. Vaginal smear samples were taken before treatment (predose), at 44
day 2, at day 16 and at day 39 of treatment. Gene expression of 27 candidate genes, 45
selected by screening the actual literature for steroidal effects on vaginal epithelial cells, 46
were estimated using quantitative real-time RT-PCR. 47
It could be shown that the anabolic combination trenbolone acetate plus estradiol 48
significantly influenced the expression of the steroid receptor ERα, the keratinization factor49
CK8, the proinflammatory interleukins IL-1α and IL-1β, the growth factors FGF7, EGF, 50
EGFR, IGF-1R, TGFα and LTF, the oncogen c-jun and other factors like actinβ and ubiquitin 51
3. 52
Using biostatistical tools like principal components analysis or hierarchical cluster analysis, 53
the potential to develop a gene expression pattern for targeting the illegal use of growth 54
promoters could be demonstrated.55
56
Keywords: anabolic agents, trenbolone acetate, estradiol, gene expression biomarker, real-57
time qRT-PCR58
59
3
Introduction60
61
The use of growth promoters like anabolic steroids and β-agonists in meat production is 62
approved e.g. in the USA, Canada or South Africa. These agents are efficient to improve 63
weight gain and feed efficiency in meat producing animals in order to increase the 64
productivity and to reduce costs1,2
. In the European Union the use of growth promoters in 65
animal husbandry is forbidden because of potential adverse effects of hormone residues to 66
the consumer 3,4
. To prevent the misuse of anabolic agents permanent control is essential67
1,3,5-7
. In practice immuno assays or chromatographical methods in combination with mass 68
spectrometry are used to detect hormone residues8-11
. To mask a proper detection by 69
conventional screening methods, hormone cocktails are applied with doses of each single 70
hormone being below the detection limit 12,13
. Therefore it is necessary to develop new 71
monitoring systems to detect a whole class of anabolic drugs at low concentrations. 72
Verifying physiological effects caused by anabolic steroids will be a new way to develop 73
potential monitoring systems. One promising tissue in female animals will be vaginal smear74
containing vaginal epithelial cells, because the vaginal epithelium is a primary hormone 75
responsive organ 14
and vaginal smear can be easily taken in a non-invasive form from the 76
living animal. A potential way to verify physiological effects of steroids will be monitoring of 77
changes in mRNA gene expression15,16
. A specific and sensitive method to quantify changes 78
in mRNA expression is quantitative real-time RT-PCR17
.79
In this pilot study heifers were treated with an anabolic combination used in practice in 80
countries where the application of growth promoters in animal husbandry is permitted. This 81
known preparation was used, because it should be ensured that an anabolic effect occurs. 82
The aim of this study was to test if gene expression changes caused by anabolic agents can 83
be monitored in vaginal smear via RT-qPCR. A second point was to test if these changes 84
could act as potential biomarkers for the effective control of the misuse of anabolic agents.85
4
Experimental86
87
Animal experiment88
18 healthy, non pregnant, two year old Nguni heifers were equally separated to two groups of 89
nine animals each. One group was treated with Revalor H
(140mg trenbolone acetate plus 90
14mg estradiol; Intervet, Isando, RSA) by implantation into the middle third of the pinna of 91
the ear and one group remained untreated serving as control. 92
Vaginal smear samples were taken at four time points: predose samples five days before 93
treatment, and at day 2, day 16 and day 39 of treatment. Vaginal smear, which contains 94
epithelial cells, was taken using a sterilized spoon. The smear was then directly transferred 95
into TriFast (Peqlab Biotechnologies, Erlangen, Germany) and stored at -80°C. 96
To display the cyclic level of the animals at the sampling time points, plasma progesterone 97
was determined 5 days before treatment start, and at day 2, day 16 and day 39 of treatment.98
The animal attendance, blood sampling and determination of plasma progesterone were 99
done by the Onderstepoort Veterinary Institute (Onderstepoort, Pretoria, South Africa). The 100
animals were housed and fed according to common practice and the South African law.101
102
Total RNA extraction and quality analysis103
RNA from vaginal epithelial cells was extracted using peqGold TriFast (PeqLab 104
Biotechologies) according to the manufacturer´s instructions. To quantify the amount of total 105
RNA extracted, optical density (OD) was measured with the NanoDrop 1000 (Peqlab 106
Biotechnologies) for each sample. RNA purity was calculated using the OD260/280
ratio. 107
RNA integrity and quality control was performed via capillary electrophoresis in the 108
Bioanalyzer 2100 (Agilent Technology, Palo Alto, USA). Eukaryotic total RNA Nano Assay 109
was taken for sample analysis and the RNA Integrity Number (RIN) served as RNA quality 110
parameter. Agilent 2100 Bioanalyzer calculated the RIN value based on a numbering system 111
from 1 to 10 (1 being the most degraded profile, 10 being the most intact)18
. 112
113
RNA reverse transcription114
Constant amounts of 500ng total RNA were reverse transcribed to cDNA using the following 115
master mix: 12µL 5×Buffer (Promega, Mannheim, Germany), 3µL Random Hexamer Primers 116
(50 mM; Invitrogen, Carlsbad, USA), 3µL dNTP Mix (10 mM; Fermentas, St Leon-Rot, 117
Germany) and 200 U of MMLV Reverse Transcriptase (Promega) according to the 118
manufacturer’s instructions. 119
120
121
5
Specific primer design122
All primers were designed using published bovine nucleic acid sequences in GenBank 123
(http://www.ncbi.nlm.nih.gov/entrez/query.fcgi). Primer design and optimization was done 124
with primer design program of MWG Biotech (MWG, Ebersberg, Germany) and primer3 125
(http://frodo.wi.mit.edu/cgi-bin/primer3/primer3_www.cgi) with regard to primer dimer and 126
self-priming formation. Newly designed primers were ordered and synthesized at MWG 127
Biotech. Primer testing was performed with three optional samples and a no template control 128
(NTC contains only RNAse free water). To determine the optimal annealing temperature for 129
each primer set a temperature gradient PCR was done. All used primers are listed in table 1.130
131
Quantitative real-time PCR analysis132
To analyze gene expression of candidate genes, qPCR analysis was done using the IQ5 133
(Bio-Rad, Munich, Germany). Quantitative real-time PCR was performed using MESA 134
GREEN qPCR MasterMix Plus for SYBR® Assay w/ fluorescein Kit (Eurogentec, Cologne, 135
Germany) by a standard protocol, recommended by the manufacturer. 136
With the kit the master mix was prepared as follows: For one sample it is 7.5µL MESA 137
GREEN 2x PCR Master Mix, 1.5µL forward primer (10 pmol/µL), 1.5 µL reverse primer (10 138
pmol/µL) and 3µL RNase free water. For qPCR analysis 1.5µL cDNA was added to 13.5µL139
Master Mix. qPCR was performed in 96 Well Plates (Eppendorf, Hamburg, Germany) and 140
pipetting was done by the epMotion 5075 (Eppendorf). 141
The following general real-time PCR protocol was employed for all investigated factors: 142
denaturation for 5 min at 95°C, 40 cycles of a two segmented amplification and quantification 143
program (denaturation for 3 s at 95°C, annealing for 10 s at primer specific annealing 144
temperature), a melting step by slow heating from 60 to 95°C with a dwell time of 10 s and 145
continuous fluorescence measurement. Threshold cycle (Ct) and melting curves were 146
acquired by using the iQ5 Optical System software 2.0 (Bio-Rad). Only genes with clear 147
melting curves were taken for further data analysis. Samples that showed irregular melting 148
peaks were excluded from the quantification procedure.149
150
Selection of target genes151
Candidate genes that might be biomarkers in vaginal epithelial cells were chosen by 152
screening the respective literature for steroidal effects on vaginal epithelial cells. It is known 153
that the expression and mRNA stabilization of the different steroid receptors is influenced by 154
their ligands 19-23
. Therefore the steroid receptors androgen receptor (AR), estrogen receptor 155
alpha (ERα) and beta (ERβ) and the progesterone receptor (PR) were chosen as candidate 156
genes. Estrogens regulate the proliferation and keratinization of vaginal epithelial cells. 157
Therefore following candidate genes were chosen for quantification: the keratinization factors 158
6
cytokeratinase 8 (CK8) and cytokeratinase 18 (CK18)22,24
, the growth factors fibroblast 159
growth factor 7 (FGF7), fibroblast growth factor binding protein (FGFBP) epidermal growth 160
factor (EGF) its receptor EGFR, tumor growth factor α (TGFα), insulin like growth factor 1 161
(IGF-1), its receptor IGF-1R, the insulin like growth factor binding protein 3 (IGF-BP3) and 162
lactoferrin (LTF)22,24-26
, and in addition the apoptosis regulators TNF receptor superfamily 163
member 6 (Fas), its ligand FasL, tumor necrosis factor receptor 1 (TNFR1), its ligand tumor 164
necrosis factor α (TNFα), Caspase 3 (Casp 3) and Caspase 8 (Casp 8) 22
and the 165
proinflammatory interleukins (IL) IL-1α and IL-1β
24
. Further genes that were quantified were 166
the oncogenes c-jun and c-fos 22
and the lingual antimicrobial peptide (LAP). As reference 167
gene candidates Ubiquitin 3 (UB3), glyceraldehyde-3-phosphate dehydrogenase (GAPDH), 168
actinβ (ACTB), histone H3 and tyrosine 3-monooxygenase/tryptophan 5-monooxygenase 169
activation protein, zeta polypeptide (YWHAZ) were measured, whereas histone H3 and 170
YWHAZ were chosen as best reference genes by using GenEx Ver 4.3.6 Software (MultiD 171
Analyses AB, Gothenburg, Sweden).172
173
174
Data Analysis and Statistics175
Statistical description of the expression data as well as statistical tests were produced with 176
Sigma Stat 3.0 (Systat Software GmbH, Erkrath, Germany). The raw data were the Ct values 177
obtained from each qPCR sample. Each qPCR sample was associated with a vaginal smear 178
sample. Since the amplification efficiency was not known, the assumption of identical 179
amplification efficiency 100% was made, allowing more simple quantification model 27
.180
The Ct values of each gene were translated to normalized expression quantities using two 181
reference genes in a form of normalization index. The normalization index was calculated as 182
an arithmetic mean of the Ct values of the two reference genes histone and YWHAZ 183
(equation 1):184
185
reference gene index = mean (Cthistone
, CtYWHAZ
) [1]186
187
Then, an expression of every target gene was calculated relatively to the expression of the 188
housekeeping gene as (equation 2):189
190
normalized expression (N) = 2 reference gene index
/ 2 Ct target gene
, [2]191
192
where the 2 represents the 100% amplification efficiency in each performed PCR cycle. 193
194
7
The normalized expression was then analyzed statistically using the t-test (Sigma Stat 3.0, 195
Systat Software GmbH). The objective of the statistical analysis was to disclose genes with 196
significant regulation between control group and treatment group. Hence, this study is to be 197
considered as purely explorative whereas significant findings here indicate candidate 198
biomarkers. 199
To disclose multivariate response to the treatment, the method of principal components200
analysis (PCA) was employed using GenEx version 4.3.6 (MultiD Analyses AB). PCA 201
involves a mathematical procedure that transforms a number of variables (here normalized 202
expression values) into a smaller number of uncorrelated variables called principal 203
components. By this the dimensionality of the data is reduced to a number of dimensions that 204
can be plotted in a scatter plot, here two dimensions. The first principal component accounts 205
for as much of the variability in the expression data as possible, and each succeeding 206
component accounts for as much of the remaining variability as possible. Normalized 207
expression values of all responding genes were taken as the initial variables and reduced to 208
two principal components only, facilitating thus resolution of treatment clusters in the scatter 209
plot 28
. 210
Another method for visualizing treatment patterns based on multivariate data is hierarchical 211
cluster analysis. The hierarchical order is represented by a tree dendogram, in which related 212
samples are more closely together than samples that are more different. Hierarchical 213
clustering was employed using GenEx v. 4.3.6 (MultiD Analyses AB).214
8
Results and Discussion215
216
Plasma progesterone levels217
To determine the estrous state of the animals, plasma progesterone levels were determined 218
at all four sampling time points. The average progesterone levels of the two groups at the 219
different time points and the standard deviations are shown in table 2.220
Before treatment start mean plasma progesterone and the standard deviation of both groups 221
were relatively high. In the control group, this effect persisted during the whole trial. At days 222
2, 16 and 39 of treatment, mean plasma progesterone levels and the standard deviation of 223
the treatment group were much lower than in the control group. This indicates that the 224
treatment down-regulates the estrous cycle of the animals. The high standard deviations in 225
the control group denotes, that the control animals were at different stages of the estrous 226
cycle, when vaginal smear samples were taken. This is of advantage, because by this means 227
there is high variability in natural estrogen levels in the control group and changes in gene 228
expression quantified between the control group and the treatment group are real effects of 229
the treatment and do not occur due to low estrogen levels in all animals of the control group.230
Used in practice as a screening method, tested animals will also be at different stages of the 231
estrous cycle. Though untreated control samples used in treatment screening have to be 232
obtained from animals at different stages of the estrous cycle to exclude the influence of 233
natural variability of estrogen level during the estrous cycle on the test results.234
The observation that progesterone levels of treated animals is lower than that of the 235
untreated animals could act as an additional indicator for anabolic treatment in heifers. Using 236
progesterone levels as single indicator, progesterone levels would have to be determined 237
several times over a long period for each animal. Furthermore there are also other factors 238
that could result in a low progesterone level. Twin born female calves for example could have 239
lost ovaries and so no progesterone is released. But in combination with other parameters, 240
like gene expression analysis, the determination of blood progesterone could act as potential 241
indicator for the use of anabolic steroids.242
243
RNA Integrity, primer testing and gel electrophoresis244
The RNA degradation level was determined using the lab-on-a-chip technology of the Agilent245
2100 Bioanalyzer. The RIN value of the vaginal smear samples was 4.5 ± 2.02 (mean ± SD).246
The relatively low RNA quality could be due to the fact that cells found in the vaginal smear 247
are detached, keratinized and partly degraded. Another reason for the low RNA quality 248
results can be RNases present in the vaginal flora. But quantitative analysis via real-time RT-249
PCR measurements worked very well and primer pairs of 29 genes (27 candidate genes and 250
2 reference genes) were successfully used in qRT-PCR analysis to get single peaks and 251
9
uniform melting curves, as well as a specific single band in high resolution agarose gel 252
electrophoresis. 253
254
RT-qPCR results and data analysis255
The steroid receptor ERα showed a significant down-regulation after two days of treatment 256
(p=0.046). Hormones regulate the concentrations of their receptor proteins. Either they do it 257
by regulating the transcription of the receptor gene or by regulating the stability of the 258
receptor mRNA 20
. The observed down-regulating effect of estrogens on the estrogen 259
receptor was already reported for vaginal cells of mice and rats 19,22
. 260
The keratinization factor CK8 (p=0.003) was significantly down-regulated after two days of 261
treatment. CK8 is preferentially expressed in epithelial cells, e.g. in vaginal epithelium. In 262
mice it was already shown that estrogens down regulate the mRNA expression of CK8 24
.263
The growth factors FGF7 (p=0.009), EGF (p=0.005), EGFR (p=0.5×10⁻⁴
), TGFα (p=0.5 ×10-
264
3
), IGF-1R (p=0.007) and LTF (p=0.031) were significantly regulated, whereas EGF, TGFα, 265
IGF-1R were down-regulated at day 2, FGF7 and EGFR were up-regulated after 16 days and 266
LTF was up-regulated after 39 days of treatment. Factors that are involved in the stimulation 267
of the proliferation of epithelial cells are the growth factors FGF7, EGF and EGFR 22,29,30
. 268
FGF7 and EGF stimulate epithelial growth in vaginal epithelium in mice 24,31,32
. The effect of 269
estrogens on mRNA expression of these three factors was already shown in mice vaginal 270
epithelial cells 22,31-33
. The regulation of the growth factors IGF-1R and LTF also goes in line 271
with effects of estrogens that could already be shown in mice. Miyagawa et al (2004) 272
reported, that the mRNA expression of members of the IGF Family is regulated by 273
diethylstilbestrol, a synthetic nonsteroidal estrogen 24
. In this study the down-regulating effect 274
of estrogens on IGF-1R could also be observed. Sato et al (2004) demonstrated that 275
neonatal exposure of mice with diethylstilbestrol results in an up-regulation of EGF and LTF 276
22,33
. It is already known that estrogen stimulates LTF mRNA expression in uterine tissue 25,34
277
and that LTF is present at various stages of the estrus cycle in human uterus and vaginal 278
epithelium 25,35,36
. This study shows that LTF mRNA expression is increased by estrogen 279
treatment in the bovine vaginal epithelium. 280
Other factors of which the mRNA expression level was changed are the pro-inflammatory 281
interleukins IL-1α (p=0.016) and IL-1β (p=0.005) (both down-regulated after 39 days of 282
treatment) and the oncogen c-jun (p=0.005) (down-regulation at day 2). Furthermore ACTB283
(down-regulation at day 2, p=0,007) and UB3 (down-regulation at day 2, p=0.018, and day 284
16, p=0.001) were significantly regulated. The expression ratios are listed in table 3. 285
The second aim of this study was to investigate whether the observed changes of mRNA 286
expression can act as biomarkers to develop a screening method for the combination of 287
trenbolone acetate plus estradiol.288
10
Principal components analysis (PCA) was used to determine whether there is a clustering 289
between control and treatment group. Figure 1 was obtained by plotting all samples of the 290
two groups in the different time points by their two principal components obtained from the 13 291
significantly regulated genes. Some genes showed no significant regulation but showed a292
trend to be regulated (p<0.1) Therefore PCA was also done by plotting all samples of the two 293
groups in the different time points by their two principal components obtained from all 27 294
measured candidate genes. Each group was marked by color. Black crosses represent 295
samples of the control group and grey triangles show the samples of the treatment group. At 296
all three treatment time points it can be observed that both groups arrange together and that 297
a difference between control and treatment group can be monitored. Before treatment the 298
groups show no difference in gene expression of analyzed target genes. This effect is better 299
visible using all 27 quantified genes. 300
Another biostatistical method to visualize whether the groups arrange together is Hierarchical 301
Cluster Analysis. To verify if the effect observed by PCA is also visibly by using this method, 302
hierarchical clustering was done with the data of the day 16 samples obtained from all 303
measured genes (Figure 3). The dendogram shows a clear separation between the two 304
groups by showing two main branches. The one above only represents untreated samples. 305
The other one represents treatment samples exept of sample Revalor H 6. Performed as 306
treatment screening this sample would be a false positive one.307
308
309
310
311
11
Conclusions312
In this study the potential of gene expression analysis in vaginal smear for developing a new 313
screening method to trace the abuse of anabolic steroid hormones is examined.314
Although the quality of RNA obtained from bovine vaginal smear is poor, gene expression315
data in combination with PCA or hierarchical cluster analysis show promising results for the 316
development of potential gene expression biomarkers. Both biostatistical methods show a 317
clear clustering of the treatment groups. 318
To confirm these results, new studies using anabolic agents in concentrations under the 319
detection limit of conventional methods will be helpful. 320
321
Acknowledgement: We thank the Onderstepoort Veterinary Institute, Pretoria, South Africa, 322
for supporting this study. Special thanks to Azel Swemmer and Kobus van der Merwe for 323
animal study performance.324
12
Reference List325
326
1. I. G. Lange, A. Daxenberger and H. H. Meyer, APMIS, 2001, 109, 53.327
2. C. Moran, J. F. Quirke, D. J. Prendiville, S. Bourke and J. F. Roche, J. Anim Sci., 1991, 328
69, 4249.329
3. A. Daxenberger, D. Ibarreta and H. H. D. Meyer, Hum. Reprod. Update, 2001, 7, 340.330
4. S. H. Swan, F. Liu, J. W. Overstreet, C. Brazil and N. E. Skakkebaek, Hum. Reprod., 331
2007, 22, 1497.332
5. H. H. D. Meyer, APMIS, 2001, 109, 1.333
6. R. Schilt, M. J. Groot, P. L. Berende, V. Ramazza, J. S. Ossenkoppele, W. Haasnoot, 334
E. O. Van Bennekom, L. Brouwer and H. Hooijerink, Analyst, 1998, 123, 2665.335
7. R. W. Stephany, APMIS Suppl, 2001, S357.336
8. H. H. D. Meyer, L. Rinke and I. Dursch, J. Chromatogr., 1991, 564, 551.337
9. H. H. D. Meyer and S. Hoffmann, Food Addit. Contam, 1987, 4, 149.338
10. M. L. Scippo, G. Degand, A. Duyckaerts, G. Maghuin-Rogister and P. Delahaut, 339
Analyst, 1994, 119, 2639.340
11. L. A. van Ginkel, J. Chromatogr., 1991, 564, 363.341
12. A. M. Andersson and N. E. Skakkebaek, Eur. J. Endocrinol., 1999, 140, 477.342
13. M. Cantiello, M. Carletti, F. T. Cannizzo, C. Nebbia, C. Bellino, S. Pie, I. P. Oswald, E. 343
Bollo and M. Dacasto, Toxicology, 2007, 242, 39.344
14. M. S. Kronenberg and J. H. Clark, Endocrinology, 1985, 117, 1480.345
15. I. Riedmaier, A. Tichopad, M. Reiter, M. W. Pfaffl and H. H. Meyer, Anal. Chim. Acta, 346
2009, 638, 106.347
16. I. Riedmaier, C. Becker, M. W. Pfaffl and H. H. Meyer, J Chromatogr. A, 2009, 348
17. M. W. Pfaffl, I. G. Lange and H. H. D. Meyer, J. Steroid Biochem. Mol. Biol., 2003, 84, 349
159.350
18. A. Schroeder, O. Mueller, S. Stocker, R. Salowsky, M. Leiber, M. Gassmann, S. 351
Lightfoot, W. Menzel, M. Granzow and T. Ragg, BMC. Mol. Biol., 2006, 7, 3.352
19. J. S. Kang, B. J. Lee, B. Ahn, D. J. Kim, S. Y. Nam, Y. W. Yun, K. T. Nam, M. Choi, H. 353
S. Kim, D. D. Jang, Y. S. Lee and K. H. Yang, J. Vet. Med. Sci., 2003, 65, 1293.354
20. N. H. Ing, Biol. Reprod., 2005, 72, 1290.355
21. M. A. Pessina, R. F. Hoyt, Jr., I. Goldstein and A. M. Traish, J. Sex Med., 2006, 3, 804.356
22. T. Sato, Y. Fukazawa, Y. Ohta and T. Iguchi, Reprod. Toxicol., 2004, 19, 43.357
23. A. M. Traish, S. W. Kim, M. Stankovic, I. Goldstein and N. N. Kim, J. Sex Med., 2007, 358
4, 609.359

13
24. S. Miyagawa, A. Suzuki, Y. Katsu, M. Kobayashi, M. Goto, H. Handa, H. Watanabe and 360
T. Iguchi, J. Mol. Endocrinol., 2004, 32, 663.361
25. C. T. Teng, Biochem. Cell Biol., 2002, 80, 7.362
26. M. W. Pfaffl, A. Daxenberger, M. Hageleit and H. H. D. Meyer, J. Vet. Med. A Physiol 363
Pathol. Clin. Med., 2002, 49, 57.364
27. K. J. Livak and T. D. Schmittgen, Methods, 2001, 25, 402.365
28. M. Kubista, J. M. Andrade, M. Bengtsson, A. Forootan, J. Jonak, K. Lind, R. Sindelka, 366
R. Sjoback, B. Sjogreen, L. Strombom, A. Stahlberg and N. Zoric, Mol. Aspects 367
Med., 2006, 27, 95.368
29. T. Iguchi, F. D. Uchima and H. A. Bern, In Vitro Cell Dev. Biol., 1987, 23, 535.369
30. T. Iguchi, F. D. Uchima, P. L. Ostrander and H. A. Bern, Proc. Natl. Acad. Sci. U. S. A, 370
1983, 80, 3743.371
31. Y. K. Hom, P. Young, A. A. Thomson and G. R. Cunha, Endocrinology, 1998, 139, 372
3772.373
32. Y. K. Hom, P. Young, J. F. Wiesen, P. J. Miettinen, R. Derynck, Z. Werb and G. R. 374
Cunha, Endocrinology, 1998, 139, 913.375
33. K. G. Nelson, Y. Sakai, B. Eitzman, T. Steed and J. McLachlan, Cell Growth Differ., 376
1994, 5, 595.377
34. B. T. Pentecost and C. T. Teng, J. Biol. Chem., 1987, 262, 10134.378
35. M. S. Cohen, B. E. Britigan, M. French and K. Bean, Am. J. Obstet. Gynecol., 1987, 379
157, 1122.380
36. M. E. Kelver, A. Kaul, B. Nowicki, W. E. Findley, T. W. Hutchens and M. Nagamani, 381
Am. J. Reprod. Immunol., 1996, 36, 243.382
383
384
385
386
387
388
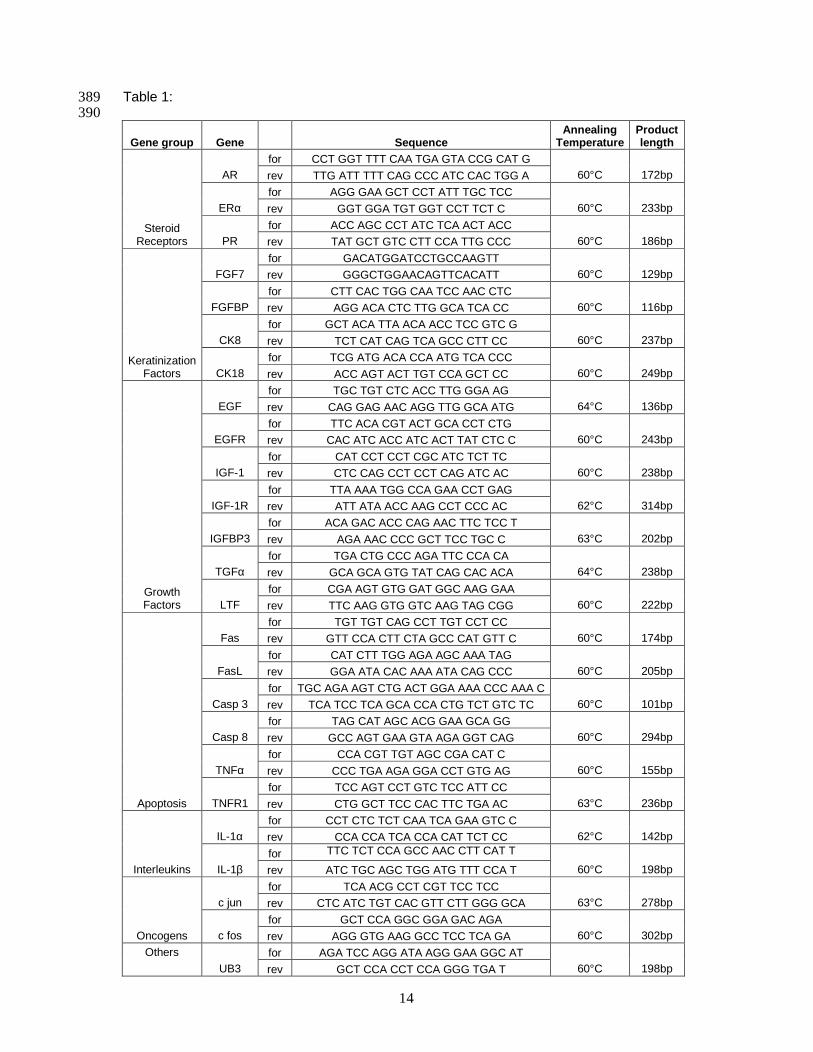
14
Table 1:389
390
Gene group Gene Sequence
Annealing
Temperature
Product
length
for CCT GGT TTT CAA TGA GTA CCG CAT G
AR rev TTG ATT TTT CAG CCC ATC CAC TGG A 60°C 172bp
for AGG GAA GCT CCT ATT TGC TCC
ERα rev GGT GGA TGT GGT CCT TCT C 60°C 233bp
for ACC AGC CCT ATC TCA ACT ACCSteroid
Receptors PR rev TAT GCT GTC CTT CCA TTG CCC 60°C 186bp
for GACATGGATCCTGCCAAGTT
FGF7 rev GGGCTGGAACAGTTCACATT 60°C 129bp
for CTT CAC TGG CAA TCC AAC CTC
FGFBP rev AGG ACA CTC TTG GCA TCA CC 60°C 116bp
for GCT ACA TTA ACA ACC TCC GTC G
CK8 rev TCT CAT CAG TCA GCC CTT CC 60°C 237bp
for TCG ATG ACA CCA ATG TCA CCCKeratinization
Factors CK18 rev ACC AGT ACT TGT CCA GCT CC 60°C 249bp
for TGC TGT CTC ACC TTG GGA AG
EGF rev CAG GAG AAC AGG TTG GCA ATG 64°C 136bp
for TTC ACA CGT ACT GCA CCT CTG
EGFR rev CAC ATC ACC ATC ACT TAT CTC C 60°C 243bp
for CAT CCT CCT CGC ATC TCT TC
IGF-1 rev CTC CAG CCT CCT CAG ATC AC 60°C 238bp
for TTA AAA TGG CCA GAA CCT GAG
IGF-1R rev ATT ATA ACC AAG CCT CCC AC 62°C 314bp
for ACA GAC ACC CAG AAC TTC TCC T
IGFBP3 rev AGA AAC CCC GCT TCC TGC C 63°C 202bp
for TGA CTG CCC AGA TTC CCA CA
TGFα rev GCA GCA GTG TAT CAG CAC ACA 64°C 238bp
for CGA AGT GTG GAT GGC AAG GAAGrowth
Factors LTF rev TTC AAG GTG GTC AAG TAG CGG 60°C 222bp
for TGT TGT CAG CCT TGT CCT CC
Fas rev GTT CCA CTT CTA GCC CAT GTT C 60°C 174bp
for CAT CTT TGG AGA AGC AAA TAG
FasL rev GGA ATA CAC AAA ATA CAG CCC 60°C 205bp
for TGC AGA AGT CTG ACT GGA AAA CCC AAA C
Casp 3 rev TCA TCC TCA GCA CCA CTG TCT GTC TC 60°C 101bp
for TAG CAT AGC ACG GAA GCA GG
Casp 8 rev GCC AGT GAA GTA AGA GGT CAG 60°C 294bp
for CCA CGT TGT AGC CGA CAT C
TNFα rev CCC TGA AGA GGA CCT GTG AG 60°C 155bp
for TCC AGT CCT GTC TCC ATT CC
Apoptosis TNFR1 rev CTG GCT TCC CAC TTC TGA AC 63°C 236bp
for CCT CTC TCT CAA TCA GAA GTC C
IL-1α rev CCA CCA TCA CCA CAT TCT CC 62°C 142bp
forTTC TCT CCA GCC AAC CTT CAT T
Interleukins IL-1β rev ATC TGC AGC TGG ATG TTT CCA T 60°C 198bp
for TCA ACG CCT CGT TCC TCC
c jun rev CTC ATC TGT CAC GTT CTT GGG GCA 63°C 278bp
for GCT CCA GGC GGA GAC AGA
Oncogens c fos rev AGG GTG AAG GCC TCC TCA GA 60°C 302bp
for AGA TCC AGG ATA AGG GAA GGC ATOthers
UB3 rev GCT CCA CCT CCA GGG TGA T 60°C 198bp
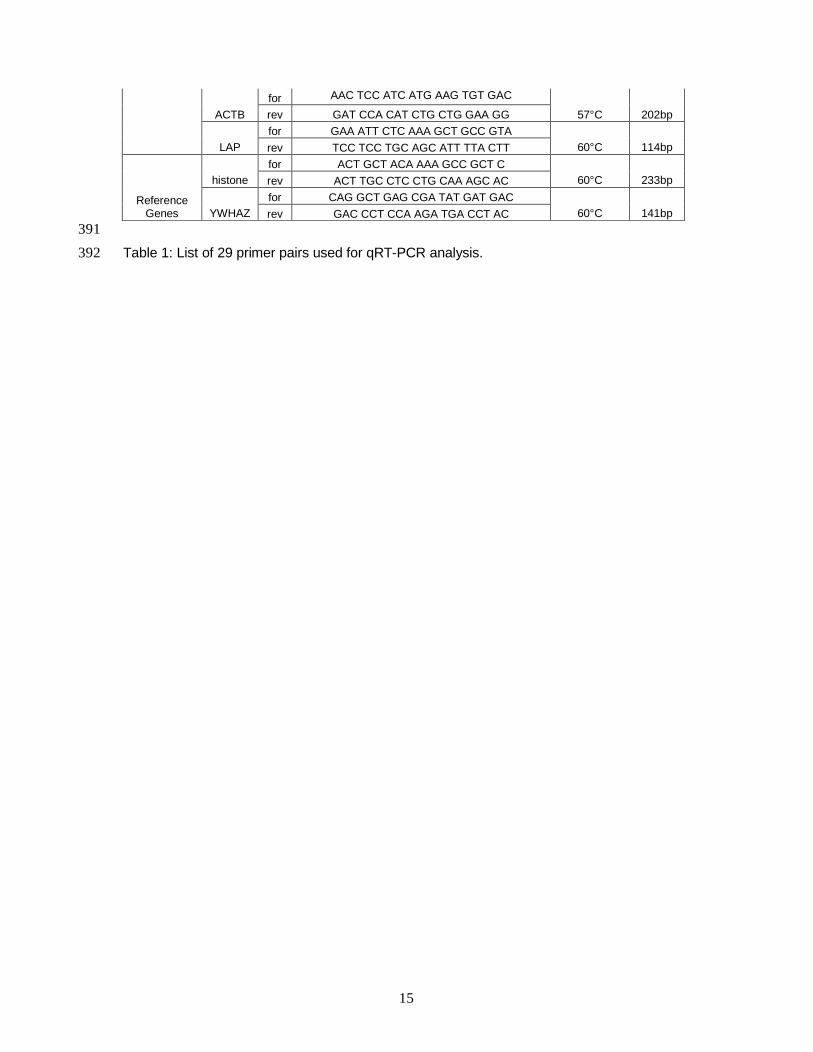
15
forAAC TCC ATC ATG AAG TGT GAC
ACTB rev GAT CCA CAT CTG CTG GAA GG 57°C 202bp
for GAA ATT CTC AAA GCT GCC GTA
LAP rev TCC TCC TGC AGC ATT TTA CTT 60°C 114bp
for ACT GCT ACA AAA GCC GCT C
histone rev ACT TGC CTC CTG CAA AGC AC 60°C 233bp
for CAG GCT GAG CGA TAT GAT GACReference
Genes YWHAZ rev GAC CCT CCA AGA TGA CCT AC 60°C 141bp
391
Table 1: List of 29 primer pairs used for qRT-PCR analysis.392
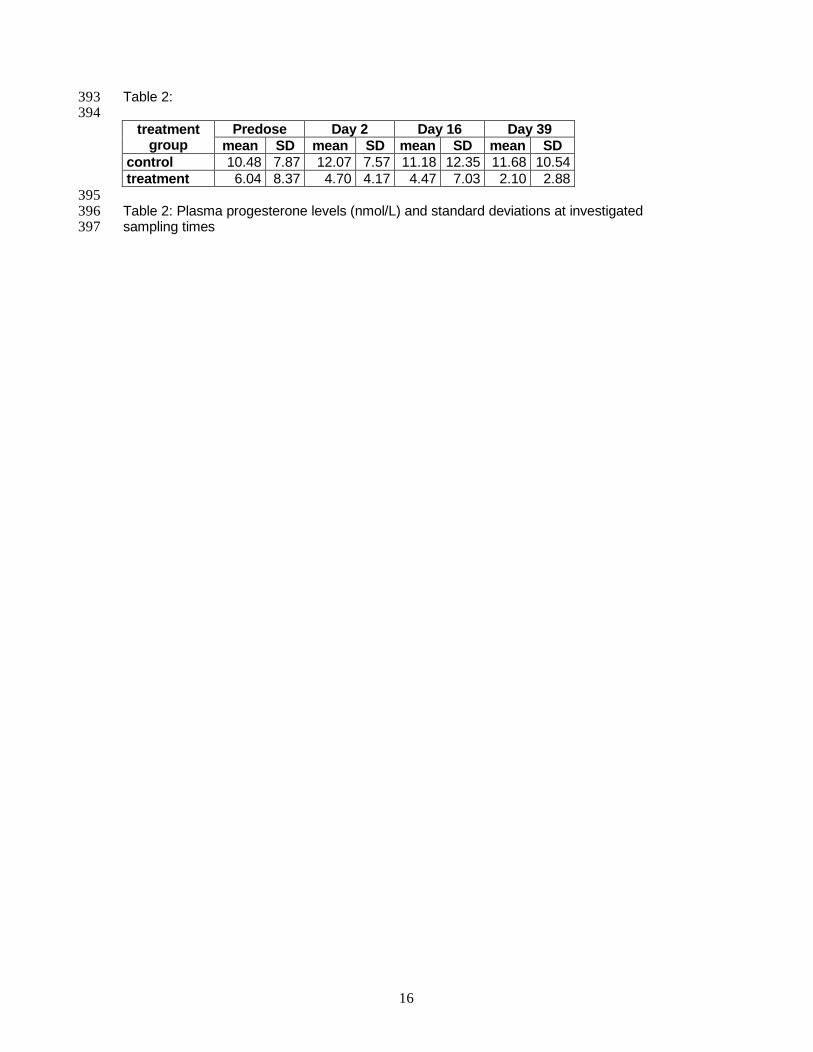
16
Table 2:393
394
Predose Day 2 Day 16 Day 39treatment
group mean SD mean SD mean SD mean SD
control 10.48 7.87 12.07 7.57 11.18 12.35 11.68 10.54
treatment 6.04 8.37 4.70 4.17 4.47 7.03 2.10 2.88
395
Table 2: Plasma progesterone levels (nmol/L) and standard deviations at investigated 396
sampling times397
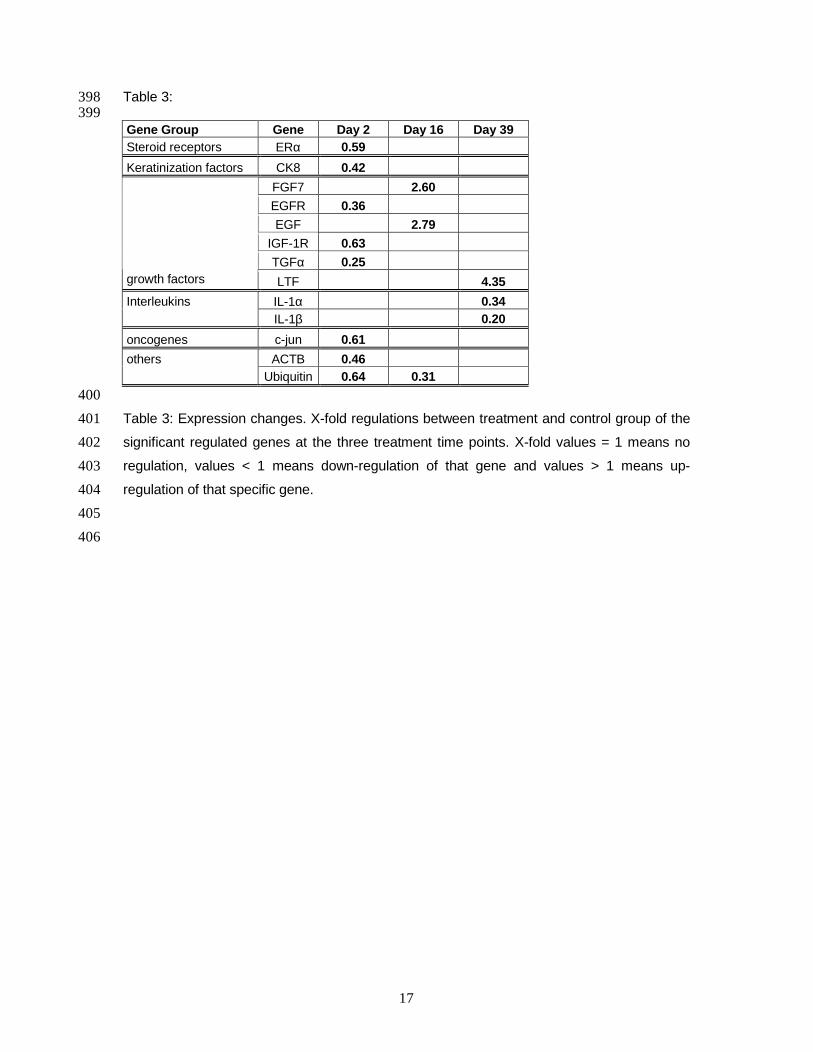
17
Table 3:398
399
Gene Group Gene Day 2 Day 16 Day 39
Steroid receptors ERα 0.59
Keratinization factors CK8 0.42
FGF7 2.60
EGFR 0.36
EGF 2.79
IGF-1R 0.63
TGFα 0.25
growth factorsLTF 4.35
Interleukins IL-1α 0.34
IL-1β 0.20
oncogenes c-jun 0.61
others ACTB 0.46
Ubiquitin 0.64 0.31
400
Table 3: Expression changes. X-fold regulations between treatment and control group of the 401
significant regulated genes at the three treatment time points. X-fold values = 1 means no 402
regulation, values < 1 means down-regulation of that gene and values > 1 means up-403
regulation of that specific gene.404
405
406
18
Figure Legends:407
408
Figure 1: 409
Principal components analysis (PCA) for the thirteen significantly regulated genes at the four 410
different sampling time points. Animals of the control groups are represented by black 411
crosses and animals of the treatment group are represented by grey triangles. 412
413
Figure 2: 414
Principal components analysis (PCA) for all 27 measured candidate genes at the four 415
different sampling time points. Animals of the control groups are represented by black 416
crosses and animals of the treatment group are represented by grey triangles.417
418
Figure 3: 419
Dendogram for all 27 measured candidate genes at sampling time point day 16. Control 420
samples (untreated 1-9) and treated samples (Revalor H) were clustered.421
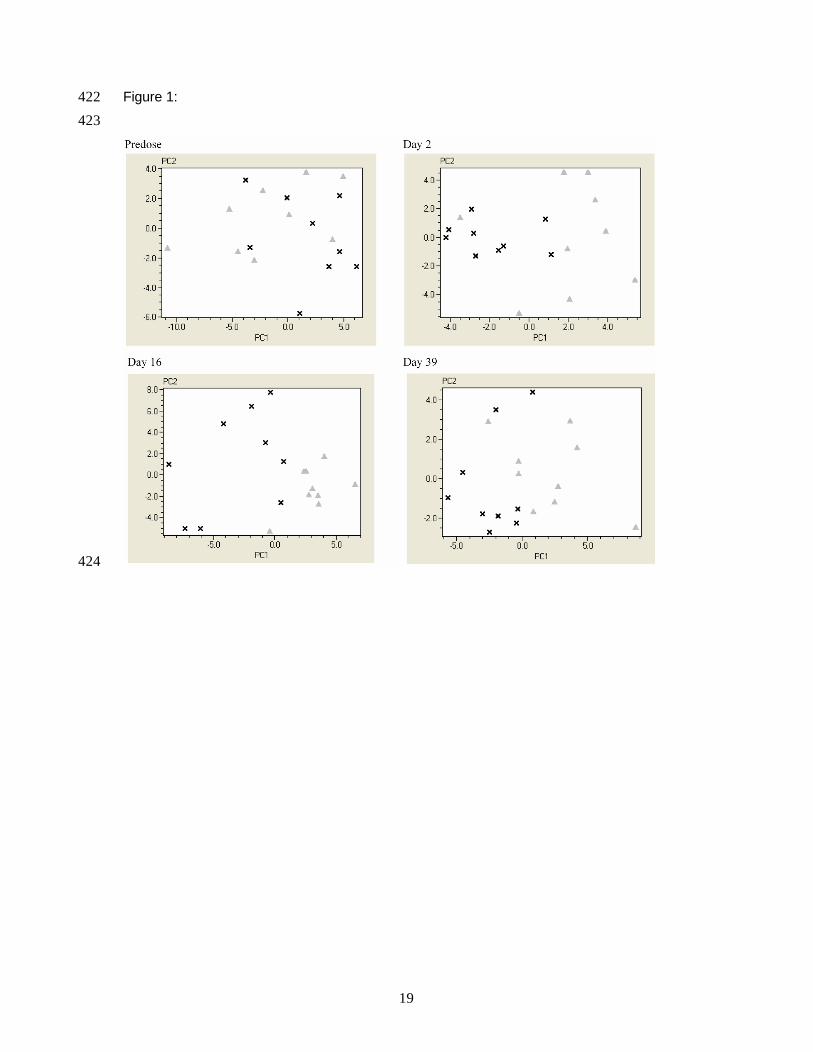
19
Figure 1:422
423
424
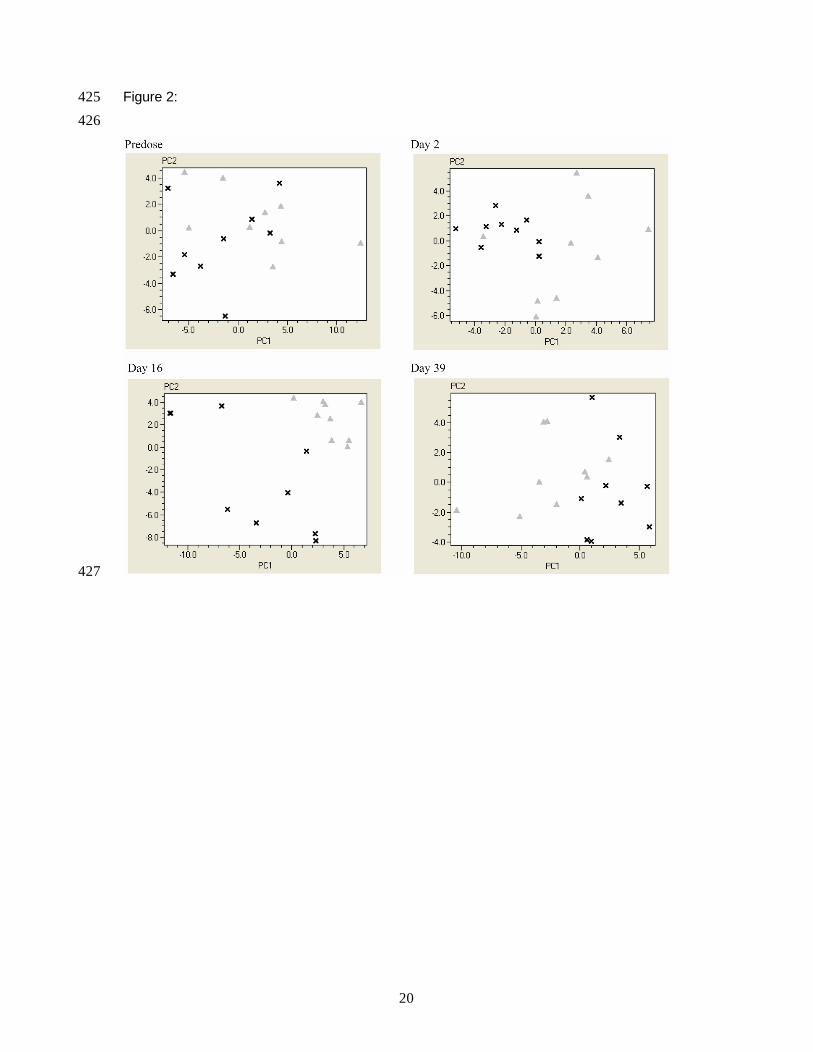
20
Figure 2:425
426
427
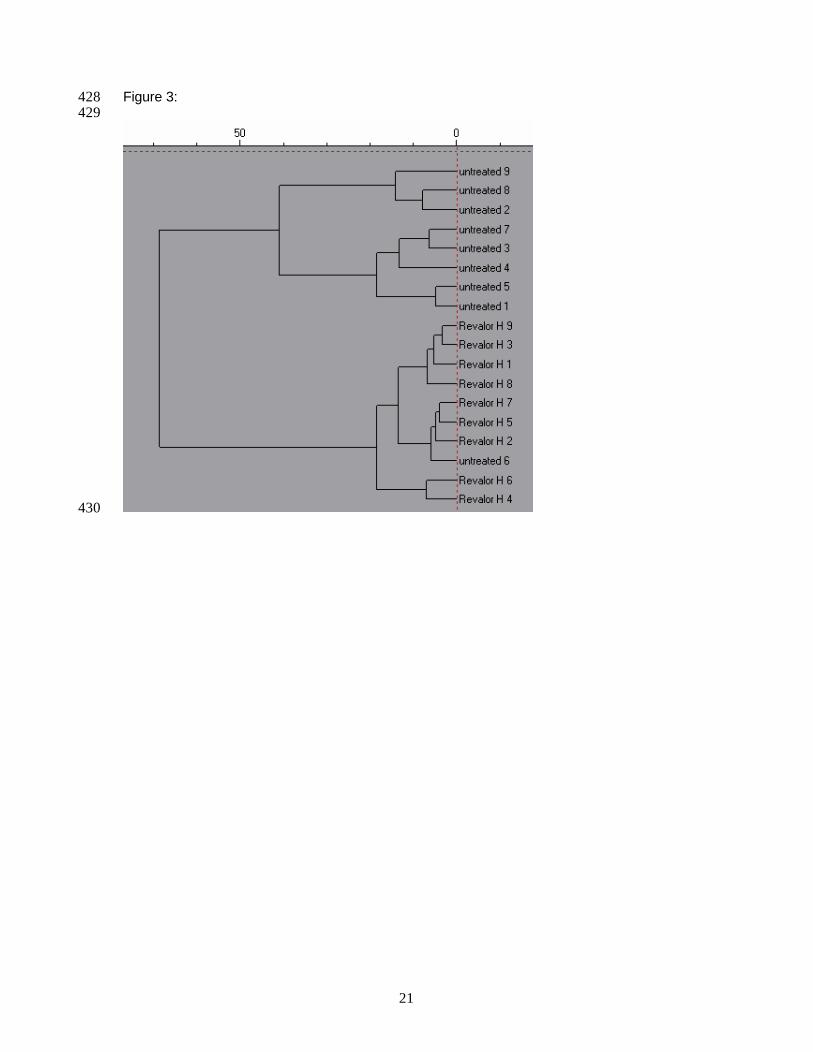
21
Figure 3:428
429
430