Experimental Evaluation of 300 ºC section of Cu-In-Ni ...
11
DOI: http://dx.doi.org/10.1590/1980-5373-MR-2017-0699 Materials Research. 2018; 21(3): e20170699 Experimental Evaluation of 300 ºC section of Cu-In-Ni Phase Diagram, Hardness and Electrical Conductivity of Selected Alloy Aleksandar Djordjević a , Milena Premović a , Duško Minić a *, Vladan Ćosović b , Milutin Živković c , Dragan Manasijević d , Milan Kolarević e Received: July 31, 2017; Revised: December 01, 2017; Accepted: March 06, 2018 The paper reports comparative experimental and thermodynamic calculation of a Cu-In-Ni ternary system. An isothermal section of the Cu-In-Ni system at 300 ºC was extrapolated using optimized thermodynamic parameters for the constitutive binary systems from literature. Microstructural and phase composition analysis were carried out using scanning electron microscopy coupled with energy dispersive spectrometry (SEM-EDS) and X-ray powder diffraction (XRD) technique. Brinell hardness and electrical conductivity of a selected number of alloy samples with compositions along three vertical sections (Cu-In0.5Ni0.5, In-Cu0.8Ni0.2, and x(In) = 0.4) of the studied Cu-In-Ni system were experimentally determined. Based on the obtained experimental results and by using appropriate mathematical models values of hardness and electrical conductivity for the whole ternary system were predicted. A close agreement between calculations and experimental results was obtained both in case of thermodynamic, electrical conductivity and hardness predictions. Keywords: The Cu-In-Ni ternary system, isothermal section at 300 ºC, microstructural analysis, Brinell hardness, electrical conductivity. *e-mail: [email protected] 1. Introduction Nickel and nickel-based alloys are widely used in different industries such as chemical, automotive, marine etc. for making vessels, pipes, heat exchangers, pumps, impellers, valves, and other type of equipment 1 . Furthermore, nickel with copper forms high-quality alloys with a variety of applications 2-4 . Especially Cu-Ni and Cu-Ni-based alloys are used for making parts in the electronics industry 5-8 e.g. for alkaline batteries, gas engines and turbines 9 , optical mirrors 10,11 , equipment for food, chemical and petrochemical industries, as well as for galvanic coating of steel objects. The most commonly used Ni-Cu alloy is Monel 12-14 , which is primarily composed of nickel (up to 67%) and copper, with small amounts of iron, manganese, carbon, and silicon. On the other hand, it is well known that copper is a widely used material because of its high electrical and thermal conductivity. By adding a nickel to copper, it is possible to improve the mechanical properties and corrosion resistance of copper, while adding indium lowers its melting point. To the extent of our knowledge, up to now, ternary Cu-In-Ni alloys have not been investigated from the point of view of mechanical and electrical properties. Furthermore, it can be expected that some of these ternary alloys may be excellent candidates for some of the aforementioned applications. The Cu-In-Ni ternary system has been previously experimentally and thermodynamically assessed by Minic et al. 15 . In their study, Minic et al. 15 reported the liquidus surface, three vertical sections and isothermal sections at 400 ºC and 500 ºC. In the current study, microstructures, electrical and mechanical properties of selected alloy samples from the isothermal sections at 300 ºC of the Cu-In-Ni ternary system are presented. Additionally, chemical and phase compositions of the studied alloys determined by SEM-EDS and XRD analyses are presented as well. The applied research procedure is similar to that given in 16-18 and it is aimed at providing better insight into properties of alloys which should contribute to further expansion of their application possibilities. a University in Priština, Faculty of Technical Science, Kneza Milosa, 7, 4000, Kosovska Mitrovica, Serbia b University of Belgrade, Institute of Chemistry, Technology and Metallurgy, Njegoševa, 12, 11000, Belgrade, Serbia c Technical College of Mechanical Engineering Professional Studies, Radoja Krstića, 19, 37240, Trstenik, Serbia d University of Belgrade, Technical Faculty, Vojske Jugoslavije, 12, 19210, Bor, Serbia e University of Kragujevac, Faculty of Mechanical and Civil Engineering, Dositejeva, 19, 36000, Kraljevo, Serbia
Transcript of Experimental Evaluation of 300 ºC section of Cu-In-Ni ...
DOI: http://dx.doi.org/10.1590/1980-5373-MR-2017-0699Materials Research. 2018; 21(3): e20170699
Experimental Evaluation of 300 ºC section of Cu-In-Ni Phase Diagram, Hardness and Electrical Conductivity of Selected Alloy
Aleksandar Djordjevića, Milena Premovića, Duško Minića*, Vladan Ćosovićb, Milutin Živkovićc,
Dragan Manasijevićd, Milan Kolareviće
Received: July 31, 2017; Revised: December 01, 2017; Accepted: March 06, 2018
The paper reports comparative experimental and thermodynamic calculation of a Cu-In-Ni ternary system. An isothermal section of the Cu-In-Ni system at 300 ºC was extrapolated using optimized thermodynamic parameters for the constitutive binary systems from literature. Microstructural and phase composition analysis were carried out using scanning electron microscopy coupled with energy dispersive spectrometry (SEM-EDS) and X-ray powder diffraction (XRD) technique. Brinell hardness and electrical conductivity of a selected number of alloy samples with compositions along three vertical sections (Cu-In0.5Ni0.5, In-Cu0.8Ni0.2, and x(In) = 0.4) of the studied Cu-In-Ni system were experimentally determined. Based on the obtained experimental results and by using appropriate mathematical models values of hardness and electrical conductivity for the whole ternary system were predicted. A close agreement between calculations and experimental results was obtained both in case of thermodynamic, electrical conductivity and hardness predictions.
Keywords: The Cu-In-Ni ternary system, isothermal section at 300 ºC, microstructural analysis, Brinell hardness, electrical conductivity.
*e-mail: [email protected]
1. Introduction
Nickel and nickel-based alloys are widely used in different industries such as chemical, automotive, marine etc. for making vessels, pipes, heat exchangers, pumps, impellers, valves, and other type of equipment1. Furthermore, nickel with copper forms high-quality alloys with a variety of applications2-4. Especially Cu-Ni and Cu-Ni-based alloys are used for making parts in the electronics industry5-8 e.g. for alkaline batteries, gas engines and turbines9, optical mirrors10,11, equipment for food, chemical and petrochemical industries, as well as for galvanic coating of steel objects. The most commonly used Ni-Cu alloy is Monel12-14, which is primarily composed of nickel (up to 67%) and copper, with small amounts of iron, manganese, carbon, and silicon.
On the other hand, it is well known that copper is a widely used material because of its high electrical and thermal conductivity. By adding a nickel to copper, it is possible to improve the mechanical properties and corrosion resistance
of copper, while adding indium lowers its melting point. To the extent of our knowledge, up to now, ternary Cu-In-Ni alloys have not been investigated from the point of view of mechanical and electrical properties. Furthermore, it can be expected that some of these ternary alloys may be excellent candidates for some of the aforementioned applications.
The Cu-In-Ni ternary system has been previously experimentally and thermodynamically assessed by Minic et al.15. In their study, Minic et al.15 reported the liquidus surface, three vertical sections and isothermal sections at 400 ºC and 500 ºC.
In the current study, microstructures, electrical and mechanical properties of selected alloy samples from the isothermal sections at 300 ºC of the Cu-In-Ni ternary system are presented. Additionally, chemical and phase compositions of the studied alloys determined by SEM-EDS and XRD analyses are presented as well. The applied research procedure is similar to that given in16-18 and it is aimed at providing better insight into properties of alloys which should contribute to further expansion of their application possibilities.
aUniversity in Priština, Faculty of Technical Science, Kneza Milosa, 7, 4000, Kosovska Mitrovica, Serbia
bUniversity of Belgrade, Institute of Chemistry, Technology and Metallurgy, Njegoševa, 12, 11000, Belgrade, Serbia
cTechnical College of Mechanical Engineering Professional Studies, Radoja Krstića, 19, 37240, Trstenik, Serbia
dUniversity of Belgrade, Technical Faculty, Vojske Jugoslavije, 12, 19210, Bor, SerbiaeUniversity of Kragujevac, Faculty of Mechanical and Civil Engineering, Dositejeva, 19, 36000,
Kraljevo, Serbia
Djordjević et al.2 Materials Research
2. Experimental Procedure
Nineteen ternary and three binary alloy samples (marked as a B1, B2, and B3) were prepared from copper, indium, and nickel (99.999 at. %) from Alfa Aesar (Germany) in an induction furnace under high-purity argon atmosphere. In general, the average loss of mass during melting of samples was about 2 mass pct. Then prepared alloy samples were placed in evacuated quartz tubes and sealed. Then alloy samples were annealed at 300 ºC for 4 weeks at high-temperature furnace (GSL1700X, Hefei Kejing Materials Technology Co., Ltd., Hefei, China) with estimated error of the temperature ±1 ºC. After annealing samples were quenched into a water and ice mixture in order to retain reached phase equilibrium. Annealed samples were divided into two part. One part of the sample is subjected to microstructural analysis, hardness and electroconductivity measurements. This part of the sample were prepared by the conventional metallographic procedure without etching. Prepared sample was oval and polished with parallel sides. Polished side of the sample were first subjected to EDS elemental mapping to check compositional homogeneity and possible segregation. Further, overall compositions and compositions of coexisting phases were determined using EDS point and area analysis. This test was carried out on TESCAN VEGA3 scanning electron microscope with energy dispersive spectroscopy (EDS) (Oxford Instruments X-act). Further same sample at the same polished part was subjected to the microhardness test. For this test was used Vickers microhardness tester Sinowon, model Vexus ZHV-1000V. After this test electrical conductivity measurements were carried out by using Foerster SIGMATEST 2.069 instrument. At last step on same samples, the hardness of the samples was determined by using a Brinell hardness tester INNOVATEST, model Nexus 3001.
The second part of the sample was grinded and examined by using X-ray diffraction. XRD patterns of the studied samples were recorded on a D2 PHASER powder diffractometer equipped with a dynamic scintillation detector and ceramic X-ray Cu tube (KFLCu-2K) in a 2θ range of 5 to 75 deg with a step size of 0.02 deg. The patterns were analyzed using Topas 4.2 software and ICDD databases PDF2(2013).
3. Results and Discussion
The isothermal section at 300 ºC of the Cu-In-Ni ternary system has been thermodynamically predicted using optimized thermodynamic parameters for the constitutive binary systems from literature19-21. The parameters for the binary Cu-In a system were taken from Liu et al.19, for the In-Ni system from Waldner and Ipser20, and for the Cu-Ni binary system from Mey21 (supplementary information). Calculations were performed using PANDAT software22.
The list of phases from constitutive binary subsystems considered for thermodynamic binary-based prediction together with their corresponding Pearson symbols is given in Table 1.
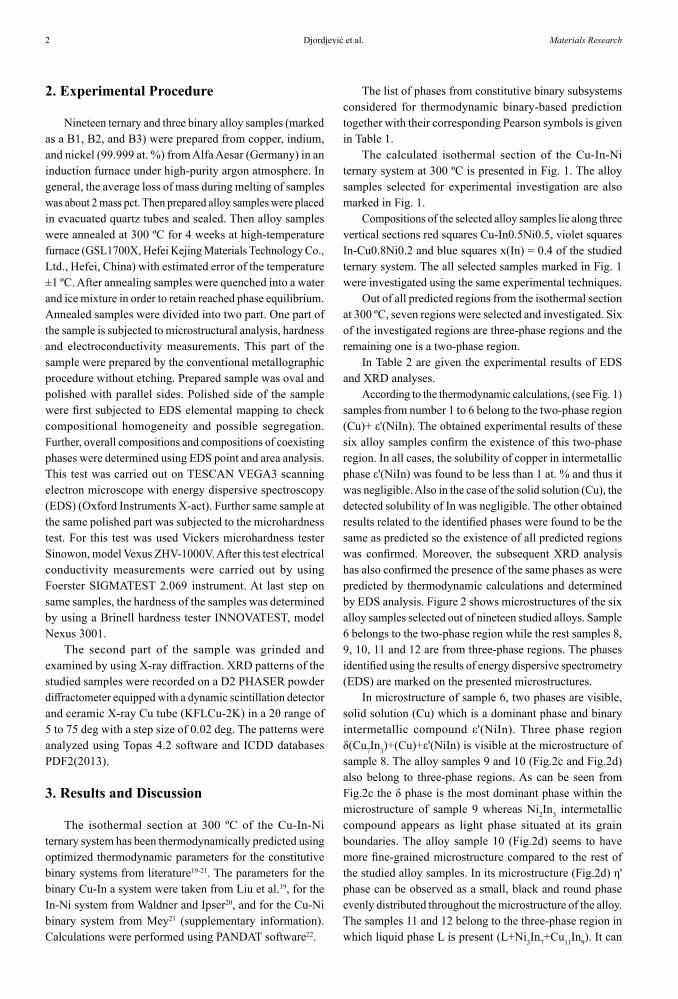
The calculated isothermal section of the Cu-In-Ni ternary system at 300 ºC is presented in Fig. 1. The alloy samples selected for experimental investigation are also marked in Fig. 1.
Compositions of the selected alloy samples lie along three vertical sections red squares Cu-In0.5Ni0.5, violet squares In-Cu0.8Ni0.2 and blue squares x(In) = 0.4 of the studied ternary system. The all selected samples marked in Fig. 1 were investigated using the same experimental techniques.
Out of all predicted regions from the isothermal section at 300 ºC, seven regions were selected and investigated. Six of the investigated regions are three-phase regions and the remaining one is a two-phase region.
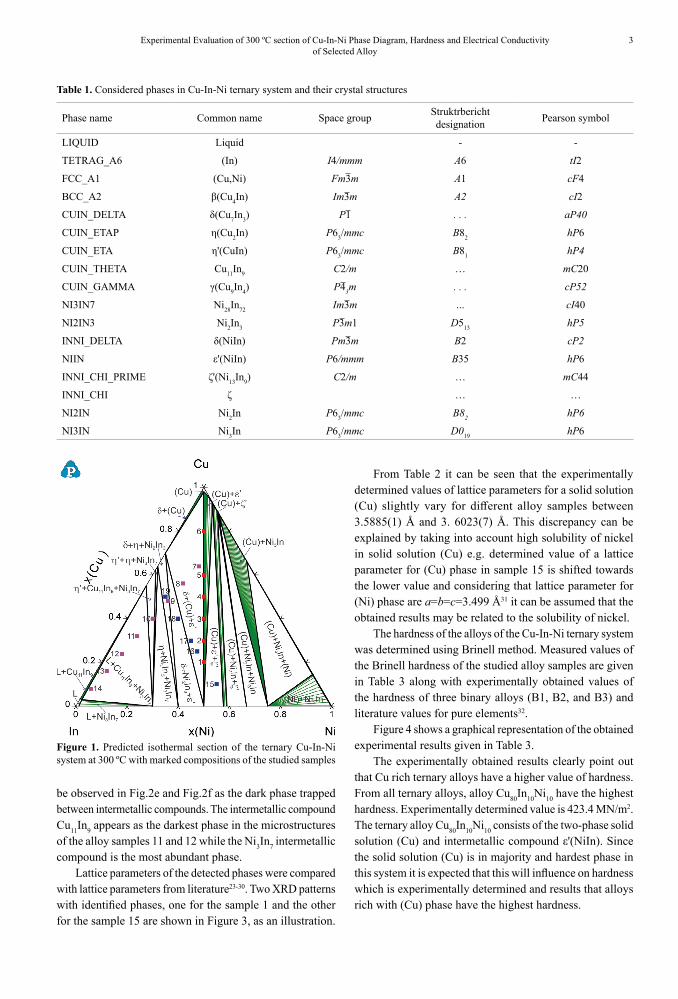
In Table 2 are given the experimental results of EDS and XRD analyses.
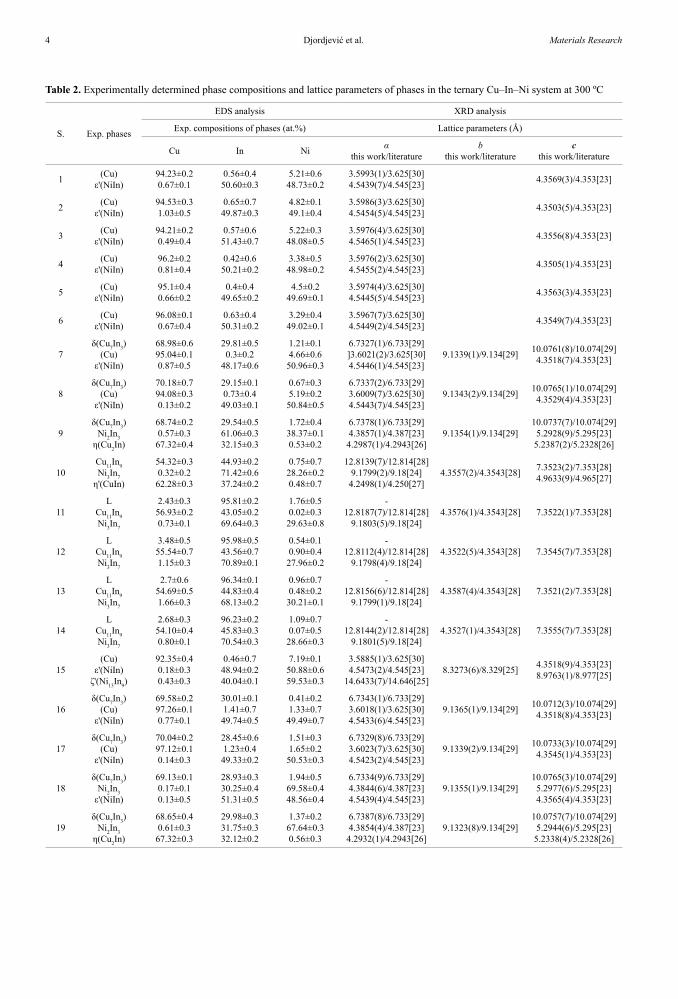
According to the thermodynamic calculations, (see Fig. 1) samples from number 1 to 6 belong to the two-phase region (Cu)+ ε'(NiIn). The obtained experimental results of these six alloy samples confirm the existence of this two-phase region. In all cases, the solubility of copper in intermetallic phase ε'(NiIn) was found to be less than 1 at. % and thus it was negligible. Also in the case of the solid solution (Cu), the detected solubility of In was negligible. The other obtained results related to the identified phases were found to be the same as predicted so the existence of all predicted regions was confirmed. Moreover, the subsequent XRD analysis has also confirmed the presence of the same phases as were predicted by thermodynamic calculations and determined by EDS analysis. Figure 2 shows microstructures of the six alloy samples selected out of nineteen studied alloys. Sample 6 belongs to the two-phase region while the rest samples 8, 9, 10, 11 and 12 are from three-phase regions. The phases identified using the results of energy dispersive spectrometry (EDS) are marked on the presented microstructures.
In microstructure of sample 6, two phases are visible, solid solution (Cu) which is a dominant phase and binary intermetallic compound ε'(NiIn). Three phase region δ(Cu7In3)+(Cu)+ε'(NiIn) is visible at the microstructure of sample 8. The alloy samples 9 and 10 (Fig.2c and Fig.2d) also belong to three-phase regions. As can be seen from Fig.2c the δ phase is the most dominant phase within the microstructure of sample 9 whereas Ni2In3 intermetallic compound appears as light phase situated at its grain boundaries. The alloy sample 10 (Fig.2d) seems to have more fine-grained microstructure compared to the rest of the studied alloy samples. In its microstructure (Fig.2d) η' phase can be observed as a small, black and round phase evenly distributed throughout the microstructure of the alloy. The samples 11 and 12 belong to the three-phase region in which liquid phase L is present (L+Ni3In7+Cu11In9). It can
3Experimental Evaluation of 300 ºC section of Cu-In-Ni Phase Diagram, Hardness and Electrical Conductivity of Selected Alloy
Table 1. Considered phases in Cu-In-Ni ternary system and their crystal structures
Phase name Common name Space group Struktrbericht designation Pearson symbol
LIQUID Liquid - -
TETRAG_A6 (In) I4/mmm A6 tI2
FCC_A1 (Cu,Ni) Fm3m A1 cF4
BCC_A2 β(Cu4In) Im3m A2 cI2
CUIN_DELTA δ(Cu7In3) P1 . . . aP40
CUIN_ETAP η(Cu2In) P63/mmc B82 hP6
CUIN_ETA η'(CuIn) P63/mmc B81 hP4
CUIN_THETA Cu11In9 C2/m … mC20
CUIN_GAMMA γ(Cu9In4) P43m . . . cP52
NI3IN7 Ni28In72 Im3m … cI40
NI2IN3 Ni2In3 P3m1 D513 hP5
INNI_DELTA δ(NiIn) Pm3m B2 cP2
NIIN ε'(NiIn) P6/mmm B35 hP6
INNI_CHI_PRIME ζ'(Ni13In9) C2/m … mC44
INNI_CHI ζ … …
NI2IN Ni2In P63/mmc B82 hP6
NI3IN Ni3In P63/mmc D019 hP6
Figure 1. Predicted isothermal section of the ternary Cu-In-Ni system at 300 ºC with marked compositions of the studied samples
be observed in Fig.2e and Fig.2f as the dark phase trapped between intermetallic compounds. The intermetallic compound Cu11In9 appears as the darkest phase in the microstructures of the alloy samples 11 and 12 while the Ni3In7 intermetallic compound is the most abundant phase.
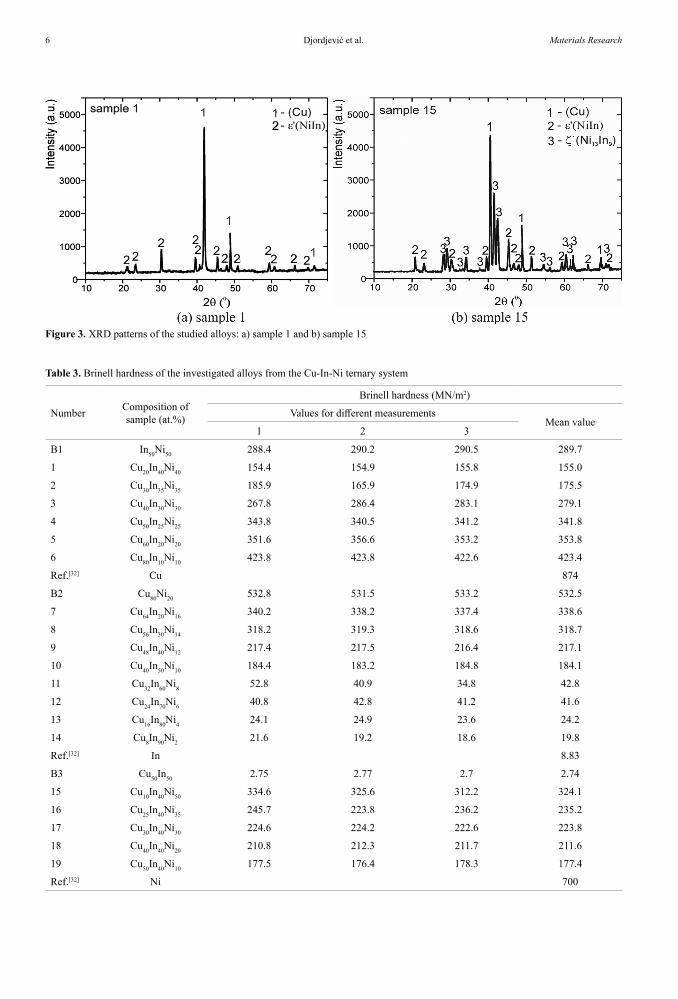
Lattice parameters of the detected phases were compared with lattice parameters from literature23-30. Two XRD patterns with identified phases, one for the sample 1 and the other for the sample 15 are shown in Figure 3, as an illustration.
From Table 2 it can be seen that the experimentally determined values of lattice parameters for a solid solution (Cu) slightly vary for different alloy samples between 3.5885(1) Å and 3. 6023(7) Å. This discrepancy can be explained by taking into account high solubility of nickel in solid solution (Cu) e.g. determined value of a lattice parameter for (Cu) phase in sample 15 is shifted towards the lower value and considering that lattice parameter for (Ni) phase are a=b=c=3.499 Å31 it can be assumed that the obtained results may be related to the solubility of nickel.
The hardness of the alloys of the Cu-In-Ni ternary system was determined using Brinell method. Measured values of the Brinell hardness of the studied alloy samples are given in Table 3 along with experimentally obtained values of the hardness of three binary alloys (B1, B2, and B3) and literature values for pure elements32.
Figure 4 shows a graphical representation of the obtained experimental results given in Table 3.
The experimentally obtained results clearly point out that Cu rich ternary alloys have a higher value of hardness. From all ternary alloys, alloy Cu80In10Ni10 have the highest hardness. Experimentally determined value is 423.4 MN/m2. The ternary alloy Cu80In10Ni10 consists of the two-phase solid solution (Cu) and intermetallic compound ε'(NiIn). Since the solid solution (Cu) is in majority and hardest phase in this system it is expected that this will influence on hardness which is experimentally determined and results that alloys rich with (Cu) phase have the highest hardness.
Djordjević et al.4 Materials Research
Table 2. Experimentally determined phase compositions and lattice parameters of phases in the ternary Cu–In–Ni system at 300 ºC
S. Exp. phases
EDS analysis XRD analysis
Exp. compositions of phases (at.%) Lattice parameters (Å)
Cu In Ni αthis work/literature
bthis work/literature
cthis work/literature
1 (Cu)ε'(NiIn)
94.23±0.20.67±0.1
0.56±0.450.60±0.3
5.21±0.648.73±0.2
3.5993(1)/3.625[30]4.5439(7)/4.545[23] 4.3569(3)/4.353[23]
2 (Cu)ε'(NiIn)
94.53±0.31.03±0.5
0.65±0.749.87±0.3
4.82±0.149.1±0.4
3.5986(3)/3.625[30]4.5454(5)/4.545[23] 4.3503(5)/4.353[23]
3 (Cu)ε'(NiIn)
94.21±0.20.49±0.4
0.57±0.651.43±0.7
5.22±0.348.08±0.5
3.5976(4)/3.625[30]4.5465(1)/4.545[23] 4.3556(8)/4.353[23]
4 (Cu)ε'(NiIn)
96.2±0.20.81±0.4
0.42±0.650.21±0.2
3.38±0.548.98±0.2
3.5976(2)/3.625[30]4.5455(2)/4.545[23] 4.3505(1)/4.353[23]
5 (Cu)ε'(NiIn)
95.1±0.40.66±0.2
0.4±0.449.65±0.2
4.5±0.249.69±0.1
3.5974(4)/3.625[30]4.5445(5)/4.545[23] 4.3563(3)/4.353[23]
6 (Cu)ε'(NiIn)
96.08±0.10.67±0.4
0.63±0.450.31±0.2
3.29±0.449.02±0.1
3.5967(7)/3.625[30]4.5449(2)/4.545[23] 4.3549(7)/4.353[23]
7δ(Cu7In3)
(Cu)ε'(NiIn)
68.98±0.695.04±0.10.87±0.5
29.81±0.50.3±0.2
48.17±0.6
1.21±0.14.66±0.650.96±0.3
6.7327(1)/6.733[29]]3.6021(2)/3.625[30]4.5446(1)/4.545[23]
9.1339(1)/9.134[29] 10.0761(8)/10.074[29]4.3518(7)/4.353[23]
8δ(Cu7In3)
(Cu)ε'(NiIn)
70.18±0.794.08±0.30.13±0.2
29.15±0.10.73±0.449.03±0.1
0.67±0.35.19±0.250.84±0.5
6.7337(2)/6.733[29]3.6009(7)/3.625[30]4.5443(7)/4.545[23]
9.1343(2)/9.134[29] 10.0765(1)/10.074[29]4.3529(4)/4.353[23]
9δ(Cu7In3)
Ni2In3η(Cu2In)
68.74±0.20.57±0.367.32±0.4
29.54±0.561.06±0.332.15±0.3
1.72±0.438.37±0.10.53±0.2
6.7378(1)/6.733[29]4.3857(1)/4.387[23]4.2987(1)/4.2943[26]
9.1354(1)/9.134[29]10.0737(7)/10.074[29]5.2928(9)/5.295[23]5.2387(2)/5.2328[26]
10Cu11In9Ni3In7
η'(CuIn)
54.32±0.30.32±0.262.28±0.3
44.93±0.271.42±0.637.24±0.2
0.75±0.728.26±0.20.48±0.7
12.8139(7)/12.814[28]9.1799(2)/9.18[24]4.2498(1)/4.250[27]
4.3557(2)/4.3543[28] 7.3523(2)/7.353[28]4.9633(9)/4.965[27]
11L
Cu11In9Ni3In7
2.43±0.356.93±0.20.73±0.1
95.81±0.243.05±0.269.64±0.3
1.76±0.50.02±0.329.63±0.8
-12.8187(7)/12.814[28]
9.1803(5)/9.18[24]4.3576(1)/4.3543[28] 7.3522(1)/7.353[28]
12L
Cu11In9Ni3In7
3.48±0.555.54±0.71.15±0.3
95.98±0.543.56±0.770.89±0.1
0.54±0.10.90±0.427.96±0.2
-12.8112(4)/12.814[28]
9.1798(4)/9.18[24]4.3522(5)/4.3543[28] 7.3545(7)/7.353[28]
13L
Cu11In9Ni3In7
2.7±0.654.69±0.51.66±0.3
96.34±0.144.83±0.468.13±0.2
0.96±0.70.48±0.230.21±0.1
-12.8156(6)/12.814[28]
9.1799(1)/9.18[24]4.3587(4)/4.3543[28] 7.3521(2)/7.353[28]
14L
Cu11In9Ni3In7
2.68±0.354.10±0.40.80±0.1
96.23±0.245.83±0.370.54±0.3
1.09±0.70.07±0.528.66±0.3
-12.8144(2)/12.814[28]
9.1801(5)/9.18[24]4.3527(1)/4.3543[28] 7.3555(7)/7.353[28]
15(Cu)
ε'(NiIn)ζ'(Ni13In9)
92.35±0.40.18±0.30.43±0.3
0.46±0.748.94±0.240.04±0.1
7.19±0.150.88±0.659.53±0.3
3.5885(1)/3.625[30]4.5473(2)/4.545[23]
14.6433(7)/14.646[25]8.3273(6)/8.329[25] 4.3518(9)/4.353[23]
8.9763(1)/8.977[25]
16δ(Cu7In3)
(Cu)ε'(NiIn)
69.58±0.297.26±0.10.77±0.1
30.01±0.11.41±0.749.74±0.5
0.41±0.21.33±0.749.49±0.7
6.7343(1)/6.733[29]3.6018(1)/3.625[30]4.5433(6)/4.545[23]
9.1365(1)/9.134[29] 10.0712(3)/10.074[29]4.3518(8)/4.353[23]
17δ(Cu7In3)
(Cu)ε'(NiIn)
70.04±0.297.12±0.10.14±0.3
28.45±0.61.23±0.449.33±0.2
1.51±0.31.65±0.250.53±0.3
6.7329(8)/6.733[29]3.6023(7)/3.625[30]4.5423(2)/4.545[23]
9.1339(2)/9.134[29] 10.0733(3)/10.074[29]4.3545(1)/4.353[23]
18δ(Cu7In3)
Ni2In3ε'(NiIn)
69.13±0.10.17±0.10.13±0.5
28.93±0.330.25±0.451.31±0.5
1.94±0.569.58±0.448.56±0.4
6.7334(9)/6.733[29]4.3844(6)/4.387[23]4.5439(4)/4.545[23]
9.1355(1)/9.134[29]10.0765(3)/10.074[29]5.2977(6)/5.295[23]4.3565(4)/4.353[23]
19δ(Cu7In3)
Ni2In3η(Cu2In)
68.65±0.40.61±0.367.32±0.3
29.98±0.331.75±0.332.12±0.2
1.37±0.267.64±0.30.56±0.3
6.7387(8)/6.733[29]4.3854(4)/4.387[23]4.2932(1)/4.2943[26]
9.1323(8)/9.134[29]10.0757(7)/10.074[29]5.2944(6)/5.295[23]5.2338(4)/5.2328[26]
5Experimental Evaluation of 300 ºC section of Cu-In-Ni Phase Diagram, Hardness and Electrical Conductivity of Selected Alloy
Figure 2. Microstructures of the alloys analyzed using SEM-EDS technique: a) sample 6, b) sample 8, c) sample 9, d) sample 10, e) sample 11 and f) sample 12
Djordjević et al.6 Materials Research
Figure 3. XRD patterns of the studied alloys: a) sample 1 and b) sample 15
Table 3. Brinell hardness of the investigated alloys from the Cu-In-Ni ternary system
Number Composition of sample (at.%)
Brinell hardness (MN/m2)
Values for different measurementsMean value
1 2 3
B1 In50Ni50 288.4 290.2 290.5 289.7
1 Cu20In40Ni40 154.4 154.9 155.8 155.0
2 Cu30In35Ni35 185.9 165.9 174.9 175.5
3 Cu40In30Ni30 267.8 286.4 283.1 279.1
4 Cu50In25Ni25 343.8 340.5 341.2 341.8
5 Cu60In20Ni20 351.6 356.6 353.2 353.8
6 Cu80In10Ni10 423.8 423.8 422.6 423.4
Ref.[32] Cu 874
B2 Cu80Ni20 532.8 531.5 533.2 532.5
7 Cu64In20Ni16 340.2 338.2 337.4 338.6
8 Cu56In30Ni14 318.2 319.3 318.6 318.7
9 Cu48In40Ni12 217.4 217.5 216.4 217.1
10 Cu40In50Ni10 184.4 183.2 184.8 184.1
11 Cu32In60Ni8 52.8 40.9 34.8 42.8
12 Cu24In70Ni6 40.8 42.8 41.2 41.6
13 Cu16In80Ni4 24.1 24.9 23.6 24.2
14 Cu8In90Ni2 21.6 19.2 18.6 19.8
Ref.[32] In 8.83
B3 Cu50In50 2.75 2.77 2.7 2.74
15 Cu10In40Ni50 334.6 325.6 312.2 324.1
16 Cu25In40Ni35 245.7 223.8 236.2 235.2
17 Cu30In40Ni30 224.6 224.2 222.6 223.8
18 Cu40In40Ni20 210.8 212.3 211.7 211.6
19 Cu50In40Ni10 177.5 176.4 178.3 177.4
Ref.[32] Ni 700
7Experimental Evaluation of 300 ºC section of Cu-In-Ni Phase Diagram, Hardness and Electrical Conductivity of Selected Alloy
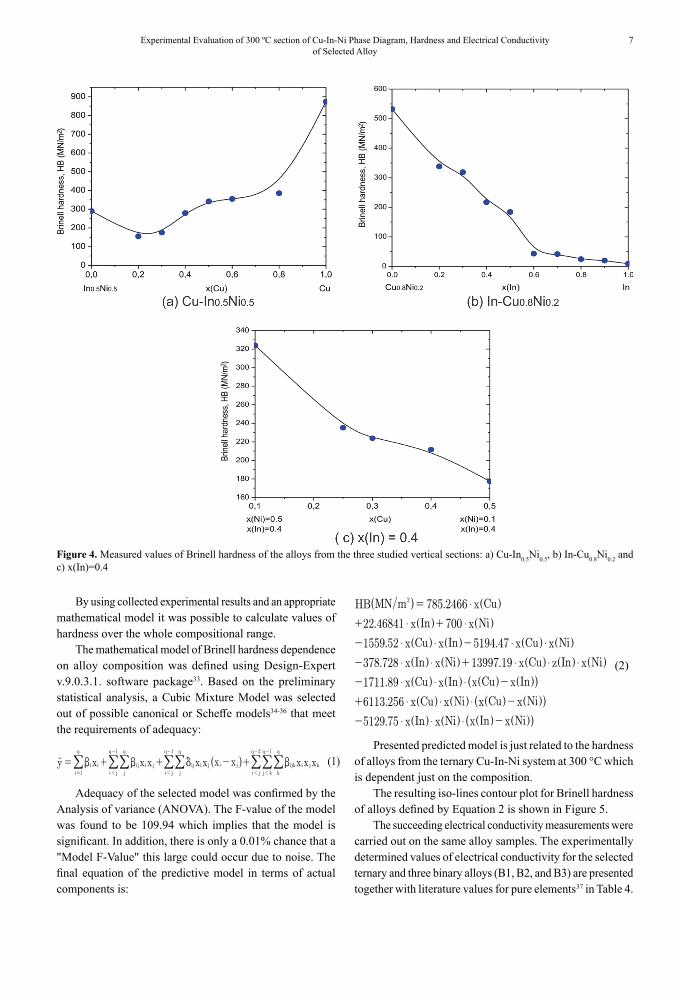
Figure 4. Measured values of Brinell hardness of the alloys from the three studied vertical sections: a) Cu-In0.5Ni0.5, b) In-Cu0.8Ni0.2 and c) x(In)=0.4
y x x x x x x x x x xi ii l
q
ij i j ij i j i j ijk i j kk
q
j k
q
i j
q
j
q
i j
q
j
q
i j
q 1211
b b d b= + + - +1111=
----
t Q V/ ///////
/ .
.
. .
. .
.
.
.
HB MN m x Cu
x In x Ni
x Cu x In x Cu x Ni
x In x Ni x Cu z In x Ni
x Cu x In x Cu x In
x Cu x Ni x Cu x Ni
x In x Ni x In x Ni
785 2466
22 46841 700
1559 52 5194 47
378 728 13997 19
1711 89
6113 256
5129 75
2 $
$ $
$ $ $ $
$ $ $ $ $
$ $ $
$ $ $
$ $ $
=
+ +
- -
- +
- -
+ -
- -
Q
QQQ
Q
Q
Q
Q
Q
Q
Q
Q
Q
Q
Q
Q
Q
Q
QQQ Q
V
V
V
V
V
V
V
V
V
V
VV
V
V
V
V
VVV
VVV
V
V
VVV V
By using collected experimental results and an appropriate mathematical model it was possible to calculate values of hardness over the whole compositional range.
The mathematical model of Brinell hardness dependence on alloy composition was defined using Design-Expert v.9.0.3.1. software package33. Based on the preliminary statistical analysis, a Cubic Mixture Model was selected out of possible canonical or Scheffe models34-36 that meet the requirements of adequacy:
(1)
Adequacy of the selected model was confirmed by the Analysis of variance (ANOVA). The F-value of the model was found to be 109.94 which implies that the model is significant. In addition, there is only a 0.01% chance that a "Model F-Value" this large could occur due to noise. The final equation of the predictive model in terms of actual components is:
(2)
Presented predicted model is just related to the hardness of alloys from the ternary Cu-In-Ni system at 300 °C which is dependent just on the composition.
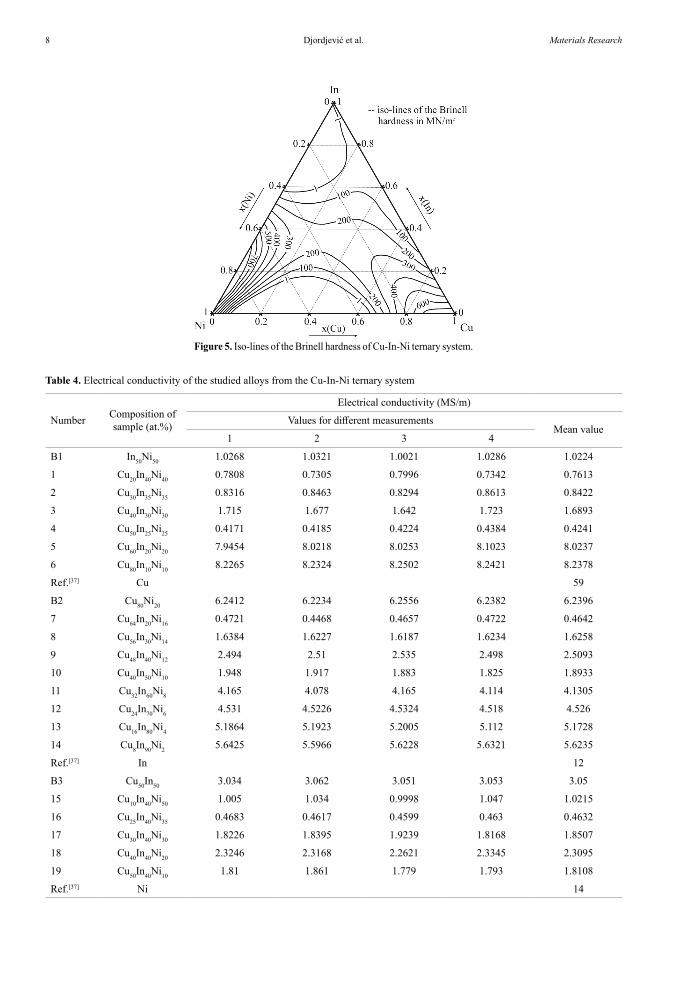
The resulting iso-lines contour plot for Brinell hardness of alloys defined by Equation 2 is shown in Figure 5.
The succeeding electrical conductivity measurements were carried out on the same alloy samples. The experimentally determined values of electrical conductivity for the selected ternary and three binary alloys (B1, B2, and B3) are presented together with literature values for pure elements37 in Table 4.
Djordjević et al.8 Materials Research
Table 4. Electrical conductivity of the studied alloys from the Cu-In-Ni ternary system
Number Composition of sample (at.%)
Electrical conductivity (MS/m)
Values for different measurementsMean value
1 2 3 4
B1 In50Ni50 1.0268 1.0321 1.0021 1.0286 1.0224
1 Cu20In40Ni40 0.7808 0.7305 0.7996 0.7342 0.7613
2 Cu30In35Ni35 0.8316 0.8463 0.8294 0.8613 0.8422
3 Cu40In30Ni30 1.715 1.677 1.642 1.723 1.6893
4 Cu50In25Ni25 0.4171 0.4185 0.4224 0.4384 0.4241
5 Cu60In20Ni20 7.9454 8.0218 8.0253 8.1023 8.0237
6 Cu80In10Ni10 8.2265 8.2324 8.2502 8.2421 8.2378
Ref.[37] Cu 59
B2 Cu80Ni20 6.2412 6.2234 6.2556 6.2382 6.2396
7 Cu64In20Ni16 0.4721 0.4468 0.4657 0.4722 0.4642
8 Cu56In30Ni14 1.6384 1.6227 1.6187 1.6234 1.6258
9 Cu48In40Ni12 2.494 2.51 2.535 2.498 2.5093
10 Cu40In50Ni10 1.948 1.917 1.883 1.825 1.8933
11 Cu32In60Ni8 4.165 4.078 4.165 4.114 4.1305
12 Cu24In70Ni6 4.531 4.5226 4.5324 4.518 4.526
13 Cu16In80Ni4 5.1864 5.1923 5.2005 5.112 5.1728
14 Cu8In90Ni2 5.6425 5.5966 5.6228 5.6321 5.6235
Ref.[37] In 12
B3 Cu50In50 3.034 3.062 3.051 3.053 3.05
15 Cu10In40Ni50 1.005 1.034 0.9998 1.047 1.0215
16 Cu25In40Ni35 0.4683 0.4617 0.4599 0.463 0.4632
17 Cu30In40Ni30 1.8226 1.8395 1.9239 1.8168 1.8507
18 Cu40In40Ni20 2.3246 2.3168 2.2621 2.3345 2.3095
19 Cu50In40Ni10 1.81 1.861 1.779 1.793 1.8108
Ref.[37] Ni 14
Figure 5. Iso-lines of the Brinell hardness of Cu-In-Ni ternary system.
9Experimental Evaluation of 300 ºC section of Cu-In-Ni Phase Diagram, Hardness and Electrical Conductivity of Selected Alloy
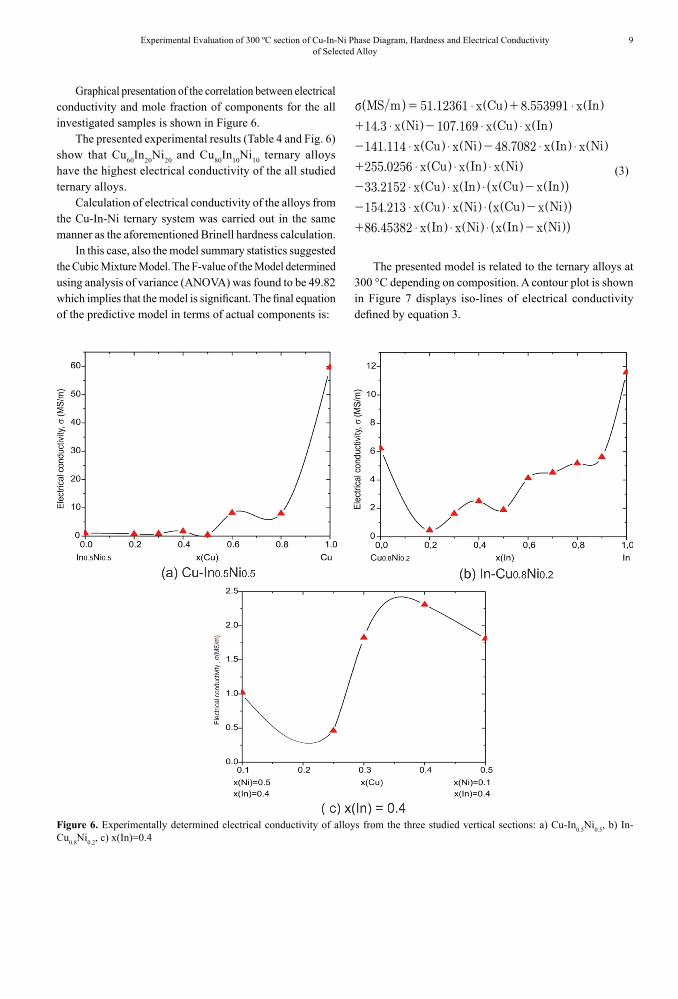
Figure 6. Experimentally determined electrical conductivity of alloys from the three studied vertical sections: a) Cu-In0.5Ni0.5, b) In-Cu0.8Ni0.2, c) x(In)=0.4
/ . .
. .
. .
.
.
.
.
MS m x Cu x In
x Ni x Cu x In
x Cu x Ni x In x Ni
x Cu x In x Ni
x Cu x In x Cu x In
x Cu x Ni x Cu x Ni
x In x Ni x In x Ni
51 12361 8 553991
14 3 107 169
141 114 48 7082
255 0256
33 2152
154 213
86 45382
$ $
$ $ $
$ $ $ $
$ $ $
$ $ $
$ $ $
$ $ $
v = +
+ -
- -
+
- -
- -
+ -
Q
Q
Q
Q
QQQ
Q
Q
QQQ
Q
Q
Q
Q
Q
Q
Q
Q
VV
V
VVV
VV
V
VV
V
VV
VV
VV
V
V
VVV
VV
V
V
V
Graphical presentation of the correlation between electrical conductivity and mole fraction of components for the all investigated samples is shown in Figure 6.
The presented experimental results (Table 4 and Fig. 6) show that Cu60In20Ni20 and Cu80In10Ni10 ternary alloys have the highest electrical conductivity of the all studied ternary alloys.
Calculation of electrical conductivity of the alloys from the Cu-In-Ni ternary system was carried out in the same manner as the aforementioned Brinell hardness calculation.
In this case, also the model summary statistics suggested the Cubic Mixture Model. The F-value of the Model determined using analysis of variance (ANOVA) was found to be 49.82 which implies that the model is significant. The final equation of the predictive model in terms of actual components is:
(3)
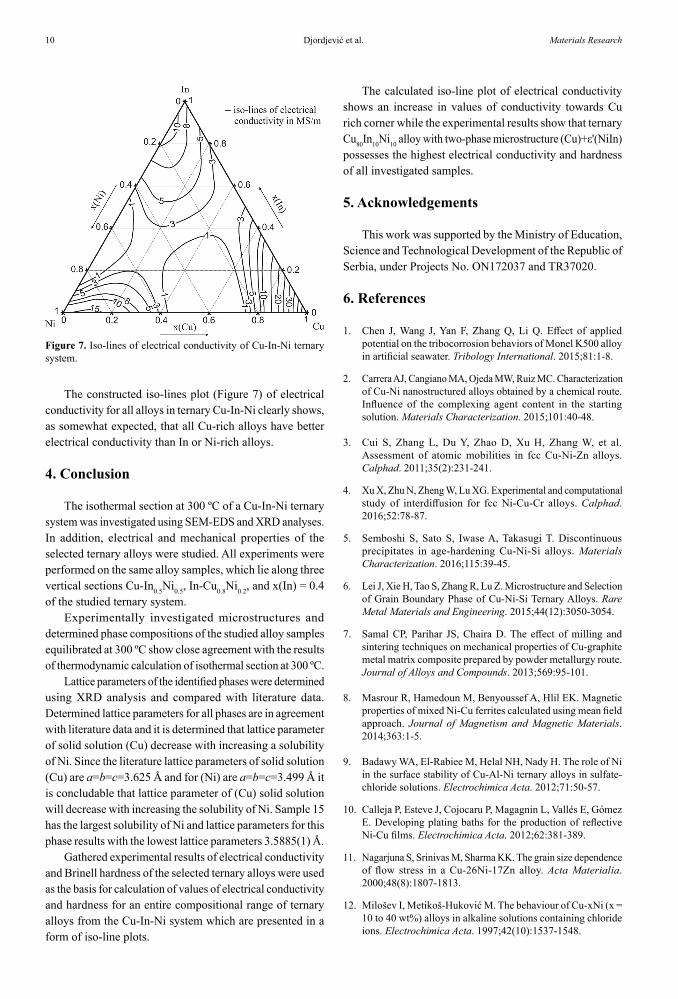
The presented model is related to the ternary alloys at 300 °C depending on composition. A contour plot is shown in Figure 7 displays iso-lines of electrical conductivity defined by equation 3.
Djordjević et al.10 Materials Research
The calculated iso-line plot of electrical conductivity shows an increase in values of conductivity towards Cu rich corner while the experimental results show that ternary Cu80In10Ni10 alloy with two-phase microstructure (Cu)+ε'(NiIn) possesses the highest electrical conductivity and hardness of all investigated samples.
5. Acknowledgements
This work was supported by the Ministry of Education, Science and Technological Development of the Republic of Serbia, under Projects No. ON172037 and TR37020.
6. References
1. Chen J, Wang J, Yan F, Zhang Q, Li Q. Effect of applied potential on the tribocorrosion behaviors of Monel K500 alloy in artificial seawater. Tribology International. 2015;81:1-8.
2. Carrera AJ, Cangiano MA, Ojeda MW, Ruiz MC. Characterization of Cu-Ni nanostructured alloys obtained by a chemical route. Influence of the complexing agent content in the starting solution. Materials Characterization. 2015;101:40-48.
3. Cui S, Zhang L, Du Y, Zhao D, Xu H, Zhang W, et al. Assessment of atomic mobilities in fcc Cu-Ni-Zn alloys. Calphad. 2011;35(2):231-241.
4. Xu X, Zhu N, Zheng W, Lu XG. Experimental and computational study of interdiffusion for fcc Ni-Cu-Cr alloys. Calphad. 2016;52:78-87.
5. Semboshi S, Sato S, Iwase A, Takasugi T. Discontinuous precipitates in age-hardening Cu-Ni-Si alloys. Materials Characterization. 2016;115:39-45.
6. Lei J, Xie H, Tao S, Zhang R, Lu Z. Microstructure and Selection of Grain Boundary Phase of Cu-Ni-Si Ternary Alloys. Rare Metal Materials and Engineering. 2015;44(12):3050-3054.
7. Samal CP, Parihar JS, Chaira D. The effect of milling and sintering techniques on mechanical properties of Cu-graphite metal matrix composite prepared by powder metallurgy route. Journal of Alloys and Compounds. 2013;569:95-101.
8. Masrour R, Hamedoun M, Benyoussef A, Hlil EK. Magnetic properties of mixed Ni-Cu ferrites calculated using mean field approach. Journal of Magnetism and Magnetic Materials. 2014;363:1-5.
9. Badawy WA, El-Rabiee M, Helal NH, Nady H. The role of Ni in the surface stability of Cu-Al-Ni ternary alloys in sulfate-chloride solutions. Electrochimica Acta. 2012;71:50-57.
10. Calleja P, Esteve J, Cojocaru P, Magagnin L, Vallés E, Gómez E. Developing plating baths for the production of reflective Ni-Cu films. Electrochimica Acta. 2012;62:381-389.
11. Nagarjuna S, Srinivas M, Sharma KK. The grain size dependence of flow stress in a Cu-26Ni-17Zn alloy. Acta Materialia. 2000;48(8):1807-1813.
12. Milošev I, Metikoš-Huković M. The behaviour of Cu-xNi (x = 10 to 40 wt%) alloys in alkaline solutions containing chloride ions. Electrochimica Acta. 1997;42(10):1537-1548.
Figure 7. Iso-lines of electrical conductivity of Cu-In-Ni ternary system.
The constructed iso-lines plot (Figure 7) of electrical conductivity for all alloys in ternary Cu-In-Ni clearly shows, as somewhat expected, that all Cu-rich alloys have better electrical conductivity than In or Ni-rich alloys.
4. Conclusion
The isothermal section at 300 ºC of a Cu-In-Ni ternary system was investigated using SEM-EDS and XRD analyses. In addition, electrical and mechanical properties of the selected ternary alloys were studied. All experiments were performed on the same alloy samples, which lie along three vertical sections Cu-In0.5Ni0.5, In-Cu0.8Ni0.2, and x(In) = 0.4 of the studied ternary system.
Experimentally investigated microstructures and determined phase compositions of the studied alloy samples equilibrated at 300 ºC show close agreement with the results of thermodynamic calculation of isothermal section at 300 ºC.
Lattice parameters of the identified phases were determined using XRD analysis and compared with literature data. Determined lattice parameters for all phases are in agreement with literature data and it is determined that lattice parameter of solid solution (Cu) decrease with increasing a solubility of Ni. Since the literature lattice parameters of solid solution (Cu) are a=b=c=3.625 Å and for (Ni) are a=b=c=3.499 Å it is concludable that lattice parameter of (Cu) solid solution will decrease with increasing the solubility of Ni. Sample 15 has the largest solubility of Ni and lattice parameters for this phase results with the lowest lattice parameters 3.5885(1) Å.
Gathered experimental results of electrical conductivity and Brinell hardness of the selected ternary alloys were used as the basis for calculation of values of electrical conductivity and hardness for an entire compositional range of ternary alloys from the Cu-In-Ni system which are presented in a form of iso-line plots.
11Experimental Evaluation of 300 ºC section of Cu-In-Ni Phase Diagram, Hardness and Electrical Conductivity of Selected Alloy
13. Li B, Gu J, Wang Q, Ji C, Wang Y, Qiang J, Dong C. Cluster formula of Fe-containing Monel alloys with high corrosion-resistance. Materials Characterization. 2012;68:94-101.
14. Ganley JC. High temperature and pressure alkaline electrolysis. International Journal of Hydrogen Energy. 2009;34(9):3604-3611.
15. Minić D, Premović M, Ćosović V, Manasijević D, Nedeljković L, Živković D. Experimental investigation and thermodynamic calculations of the Cu-In-Ni phase diagram. Journal of Alloys and Compounds. 2014;617:379-388.
16. Premović M, Manasijević D, Minić D, Živković D. Study of electrical conductivity and hardness of ternary Ag-Ge-Sb system alloys and isothermal section calculation at 300 °C. Metallic Materials. 2016;54(1):45-53.
17. Premović M, Minić D, Manasijević I, Živković D. Electrical conductivity and hardness of ternary Ge-In-Sb allyos and calculation of the isothermal section at 300 °C. Materials Testing. 2010;57(10):883-888.
18. Minić D, Aljilji A, Kolarević M, Manasijević D, Živković D. Mechanical and Electrical Properties of Alloys and Isothermal Section of Ternary Cu-In-Sb System at 673 K. High Temperature Materials and Processes. 2011;30(1-2):131-138.
19. Liu HS, Cui Y, Ishida K, Liu XJ, Wang CP, Ohnuma I, et al. Thermodynamic assessment of the Cu-In binary system. Journal of Phase Equilibria. 2002;23(5):409-415.
20. Waldner P, Ipser H. Thermodynamic modeling of the Ni-In system. Zeitschrift für Metallkunde. 2002;93(8):825-832.
21. Mey S. A thermodynamic evaluation of the Cu-Ni system. Zeitschrift für Metallkunde. 1987;78(7):502-505.
22. Cao W, Chen SL, Zhang F, Wu K, Yang Y, Chang YA, et al. PANDAT software with PanEngine, PanOptimizer and PanPrecipitation for multi-component phase diagram calculation and materials property simulation. Calphad. 2009;33(2):328-342.
23. Hellner E. Das System Nickel-Indium. Zeitschrift für Metallkunde. 1950;41:401-406.
24. Baranova RV, Pinsker ZG. Electron Diffraction Study of the Structure of the γ Phase in the Ni-In System. Kristallografiya. 1965;10(5):614-621.
25. Ellner M, Bhan S, Schubert K. Kristallstruktur von Ni13Ga9 und zwei isotypen. Journal of the Less Common Metals. 1969;19(3):245-252.
26. Che GC, Ellner M. Powder Crystal Data for the High-Temperature Phases Cu4In, Cu9In4(h) and Cu2In(h). Powder Diffraction. 1992;7(2):107-108.
27. de Debiaggi SR, Cabeza GF, Toro CD, Monti AM, Sommadossi S, Fernández Guillermet A. Ab initio study of the structural, thermodynamic and electronic properties of the Cu10In7 intermetallic phase. Journal of Alloys and Compounds. 2011;509(7):3238-3245.
28. Rajasekharan T, Schubert K. Kristallstruktur von Cu11-In9. Zeitschrift für Metallkunde. 1981;72:275-278.
29. Lidin S, Stenberg L, Elding-Pontén M. The B8 type structure of Cu7In3. Journal of Alloys and Compounds. 1997;255(1-2):221-226.
30. Srinivasa R, Anantharaman TR. Accurate Evaluation of Lattice Parameters of α-Brasses. Current Science. 1963;32(6):262-263.
31. Davey WP. Precision Measurements of the Lattice Constants of Twelve Common Metals. Physical Review. 1925;25(6):753-761.
32. Webelements. Hardness - Brinell. Available from: <http://www.webelements.com/periodicity/hardness_brinell/>. Access in: 08/04/2016.
33. Stat-Ease. Design-Expert version 9.0.3.1. Minneapolis: Stat-Ease Inc; 2015.
34. Cornell JA. Experiments with Mixtures: Designs, Models, and the Analysis of Mixture Data. 3rd ed. New York: John Wiley & Sons; 2002.
35. Lazić Ž. Design of Experiments in Chemical Engineering. Weiheim: Wiley-VCH Verlag; 2004.
36. Kolarević M, Vukićević M, Radičević B, Bjelić M, Grković V. A Methodology For Forming The Regression Model Of Ternary System. In: The Seventh Triennial International Conference Heavy Machinery HM 2011; 2011 Jun 29-Jul 2; Vrnjačka Banja, Serbia.
37. Wolfram Research. Electrical Conductivity of the elements. Available from: <http://periodictable.com/Properties/A/ElectricalConductivity.an.html>. Access in: 08/04/2016.


![Mathematics by Experiment: Exploring Patterns of Integer ...users.rowan.edu/~nguyen/experimentalmath/... · experimental mathematics in [BB]: Experimental mathematics is the methodology](https://static.fdokument.com/doc/165x107/5f571ce9bdfe5b4c9e5c36bc/mathematics-by-experiment-exploring-patterns-of-integer-usersrowanedunguyenexperimentalmath.jpg)