
Gws Impact of renewable energy on jobs and growth Gesellschaft für Wirtschaftliche...
21
gws Impact of renewable energy on jobs and growth Gesellschaft für Wirtschaftliche Strukturforschung mbH Heinrichstr. 30 ° D – 49080 Osnabrück Tel.: + 49 (541) 40933-0 ° Fax: + 49 (541) 40933-11 Email: [email protected] ° Internet: www.gws-os.de Ulrike Lehr, Marlene Kratzat, Dietmar Edler, Christian Lutz
Transcript of Gws Impact of renewable energy on jobs and growth Gesellschaft für Wirtschaftliche...
gws
Impact of renewable energy on jobs and growth
Gesellschaft für Wirtschaftliche Strukturforschung mbHHeinrichstr. 30 ° D – 49080 OsnabrückTel.: + 49 (541) 40933-0 ° Fax: + 49 (541) 40933-11Email: [email protected] ° Internet: www.gws-os.de
Ulrike Lehr, Marlene Kratzat, Dietmar Edler, Christian Lutz
2008 GWS mbHSeite 2gws
2 Studies up to now, 3rd currently in progress
Commissioned by
German Federal Ministry of the Environment
2008 GWS mbHSeite 3gws
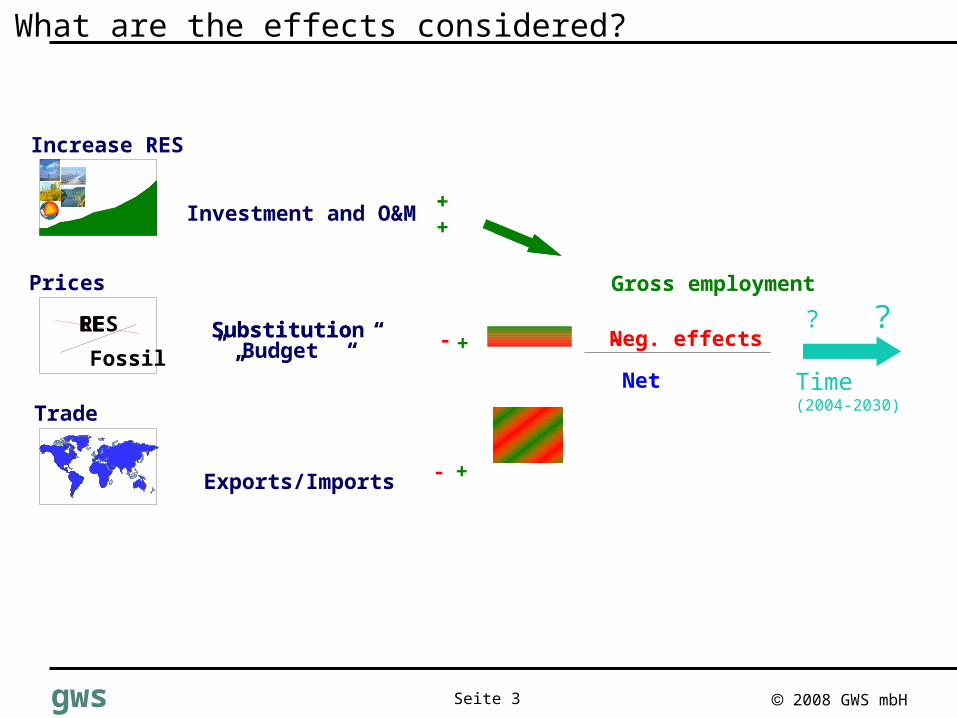
What are the effects considered?
Time(2004-2030)
? ?+
Increase RES
Prices
„Substitutio “„Budget “
Exports/Imports
++
+
- Neg. effects
Net
++
++
-Fossil
EE+
- +
++
„Substitution “„ “
++
+
-
++
++
-RES
- +
++
Investment and O&M
Gross employment
Trade
-
2008 GWS mbHSeite 4gws
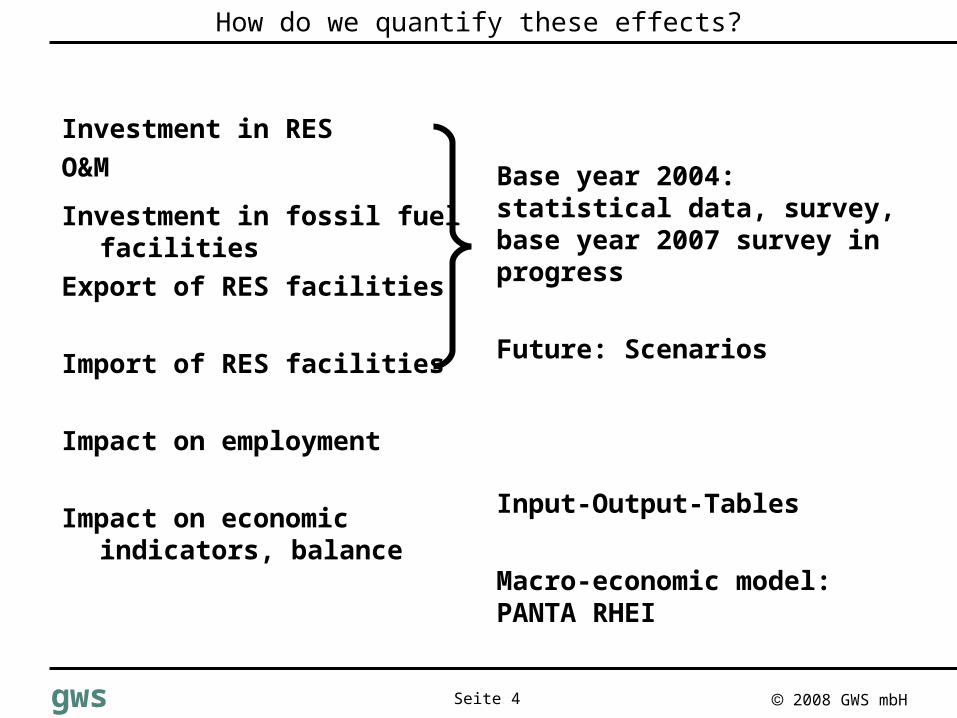
How do we quantify these effects?
Investment in RES
O&M
Investment in fossil fuel facilities
Export of RES facilities
Import of RES facilities
Impact on employment
Impact on economic indicators, balance
Base year 2004: statistical data, survey, base year 2007 survey in progress
Future: Scenarios
Input-Output-Tables
Macro-economic model: PANTA RHEI
2008 GWS mbHSeite 5gws
Earlier studies have shown the economic impacts of an increase in RES compared to the current BAU case.
• But how much did the overall support of RES cost
and what were the benefits?
2008 GWS mbHSeite 6gws
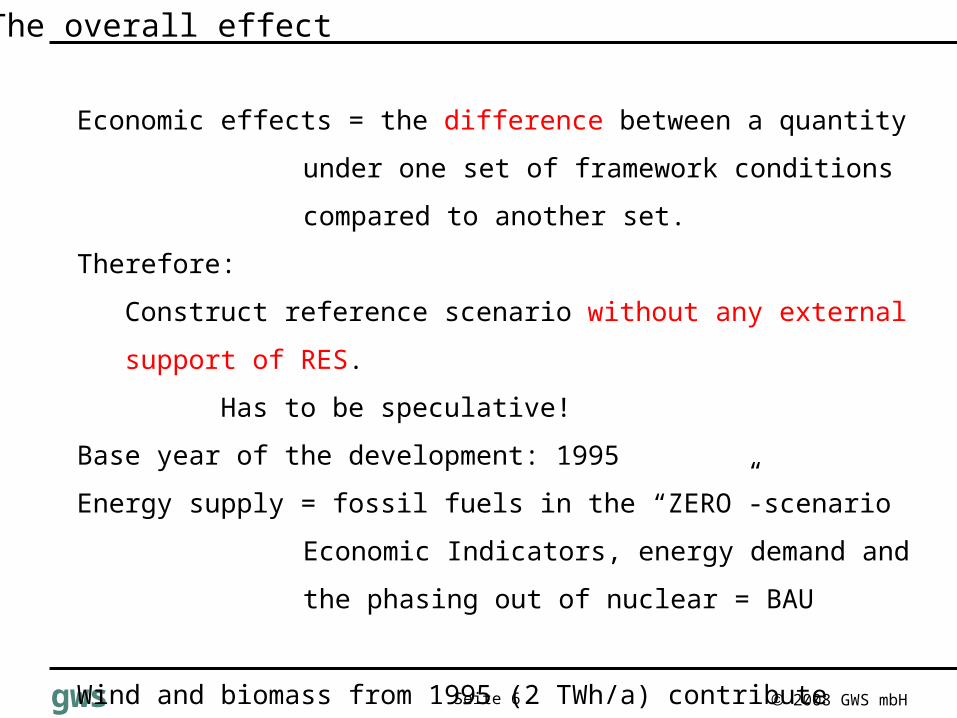
The overall effect
Economic effects = the difference between a quantity under one set of
framework conditions compared to another set.
Therefore:
Construct reference scenario without any external support of RES.
Has to be speculative!
Base year of the development: 1995
Energy supply = fossil fuels in the “ZERO”-scenario Economic
Indicators, energy demand and the phasing out of
nuclear = BAU
Wind and biomass from 1995 (2 TWh/a) contribute until 1025 reflecting
their life time.
2008 GWS mbHSeite 7gws
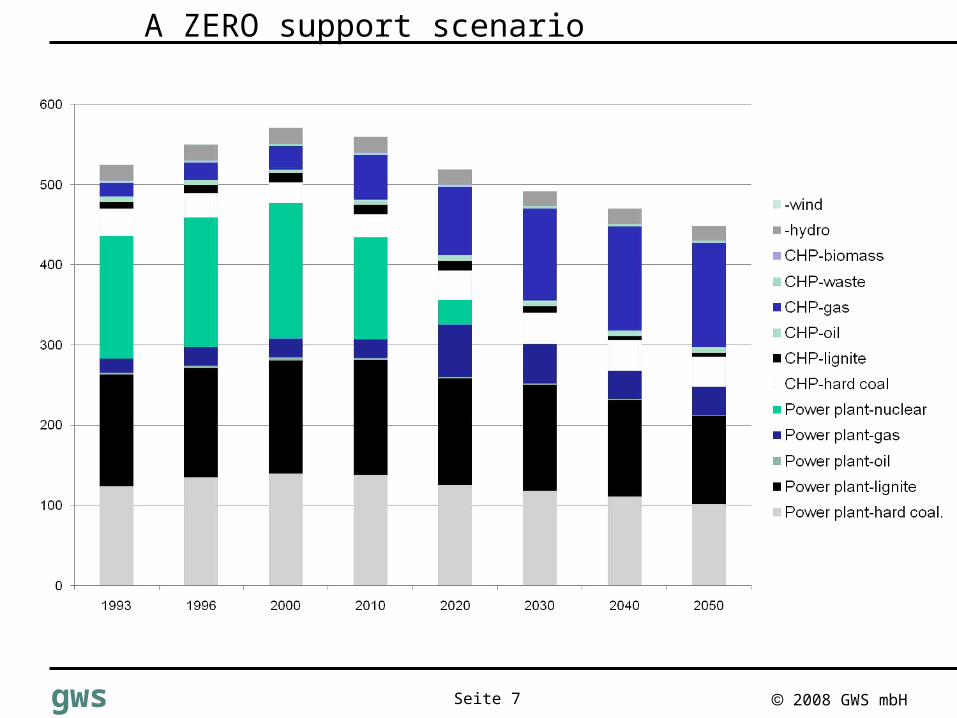
A ZERO support scenario
2008 GWS mbHSeite 8gws
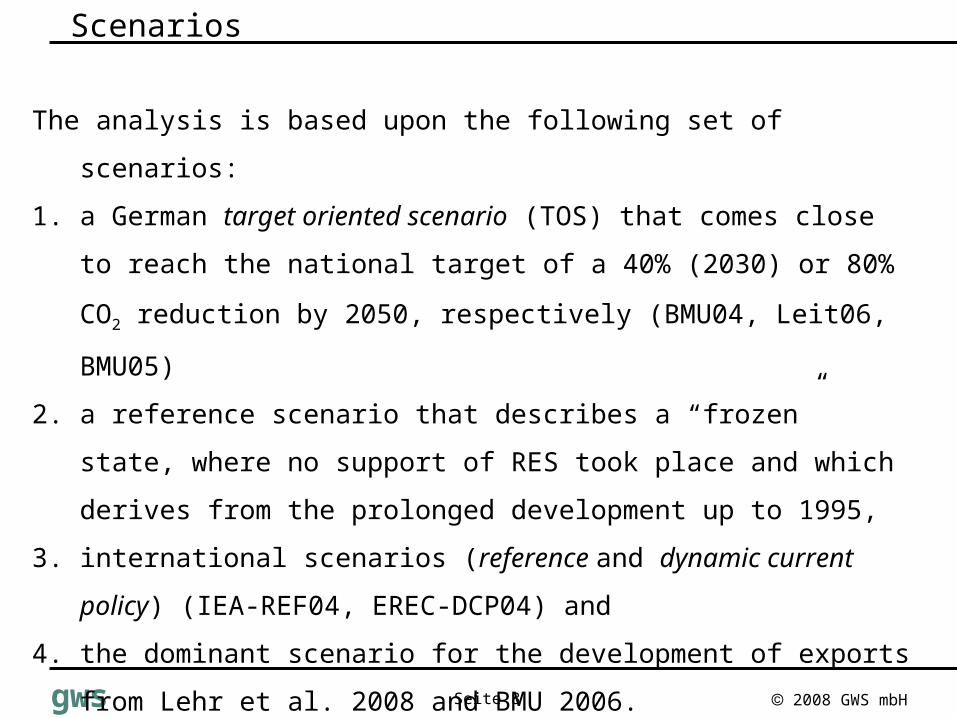
Scenarios
The analysis is based upon the following set of scenarios:
1. a German target oriented scenario (TOS) that comes close to reach
the national target of a 40% (2030) or 80% CO2 reduction by 2050,
respectively (BMU04, Leit06, BMU05)
2. a reference scenario that describes a “frozen” state, where no support
of RES took place and which derives from the prolonged development
up to 1995,
3. international scenarios (reference and dynamic current policy) (IEA-
REF04, EREC-DCP04) and
4. the dominant scenario for the development of exports from Lehr et al.
2008 and BMU 2006.
2008 GWS mbHSeite 9gws
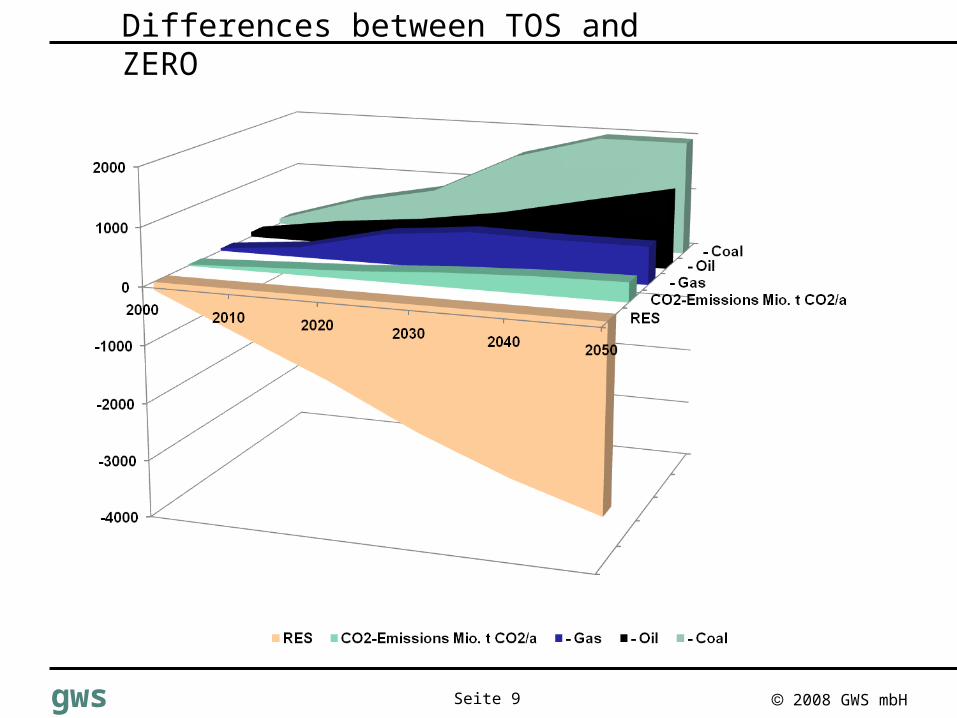
Differences between TOS and ZERO
2008 GWS mbHSeite 10gws
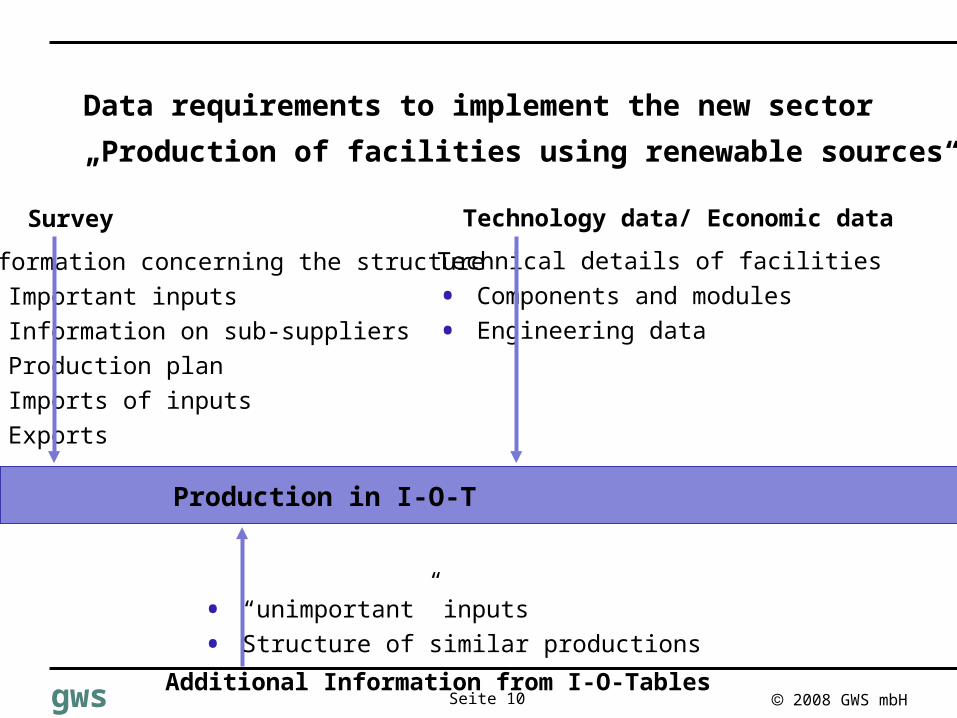
Data requirements to implement the new sector
„Production of facilities using renewable sources“
Information concerning the structure
• Important inputs
• Information on sub-suppliers
• Production plan
• Imports of inputs
• Exports
Technical details of facilities
• Components and modules
• Engineering data
Production in I-O-T
Survey Technology data/ Economic data
Additional Information from I-O-Tables
• “unimportant” inputs
• Structure of similar productions
2008 GWS mbHSeite 11gws
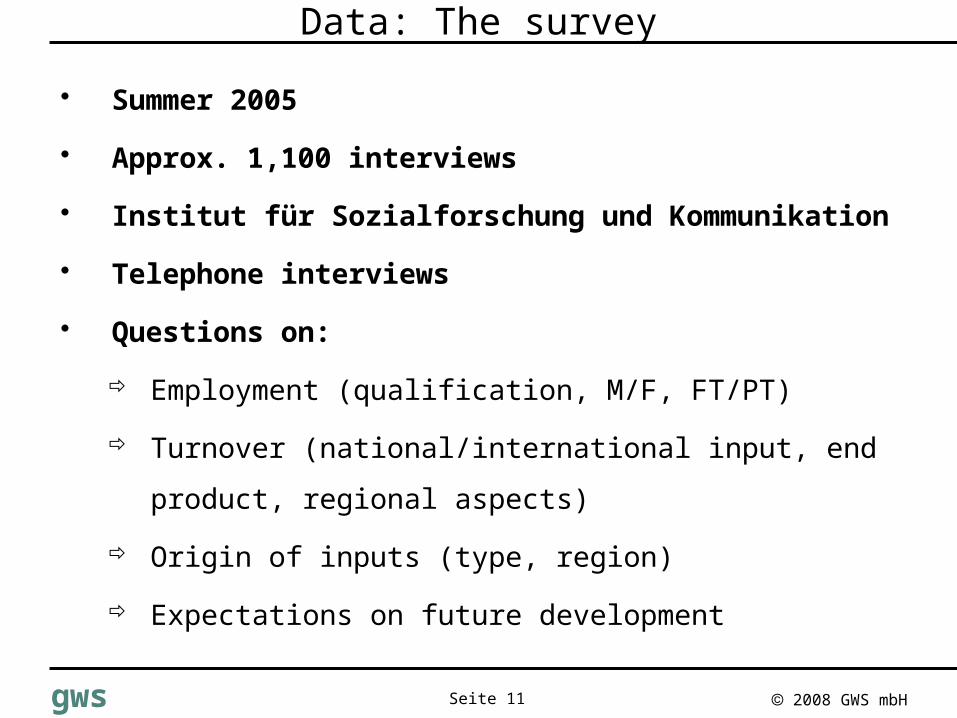
Data: The survey
Summer 2005
Approx. 1,100 interviews
Institut für Sozialforschung und Kommunikation
Telephone interviews
Questions on:
Employment (qualification, M/F, FT/PT)
Turnover (national/international input, end product,
regional aspects)
Origin of inputs (type, region)
Expectations on future development
2008 GWS mbHSeite 12gws
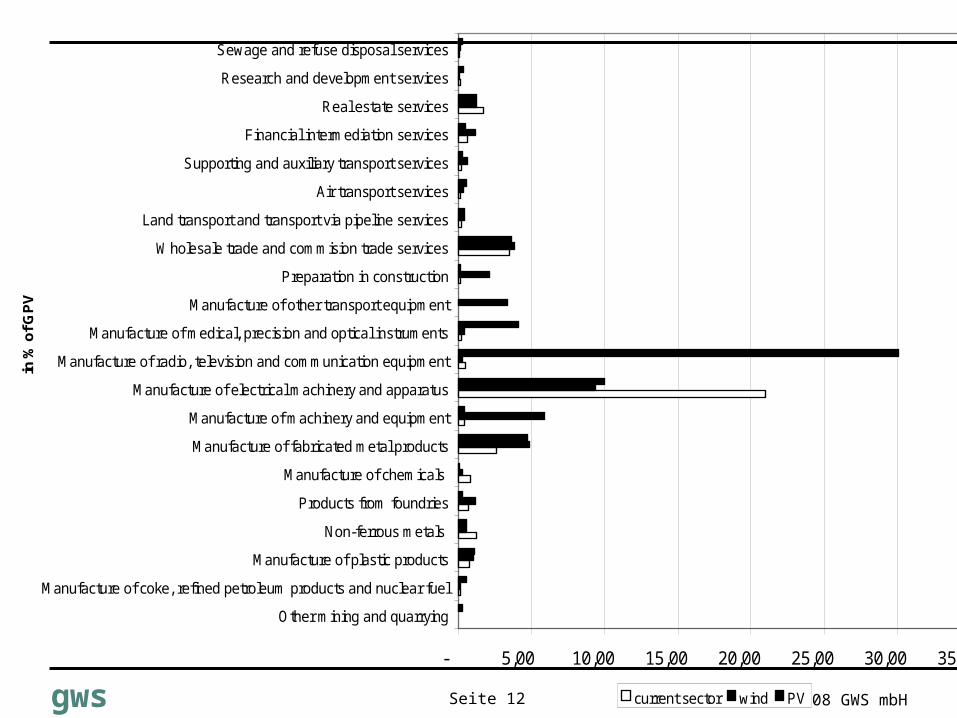
- 5,00 10,00 15,00 20,00 25,00 30,00 35,00
Other mining and quarrying
Manufacture of coke, refined petroleum products and nuclear fuel
Manufacture of plastic products
Non-ferrous metals
Products from foundries
Manufacture of chemicals
Manufacture of fabricated metal products
Manufacture of machinery and equipment
Manufacture of electrical machinery and apparatus
Manufacture of radio, television and communication equipment
Manufacture of medical, precision and optical instruments
Manufacture of other transport equipment
Preparation in construction
Wholesale trade and commision trade services
Land transport and transport via pipeline services
Air transport services
Supporting and auxiliary transport services
Financial intermediation services
Real estate services
Research and development services
Sewage and refuse disposal services
in %
of G
PV
current sector wind PV
2008 GWS mbHSeite 13gws
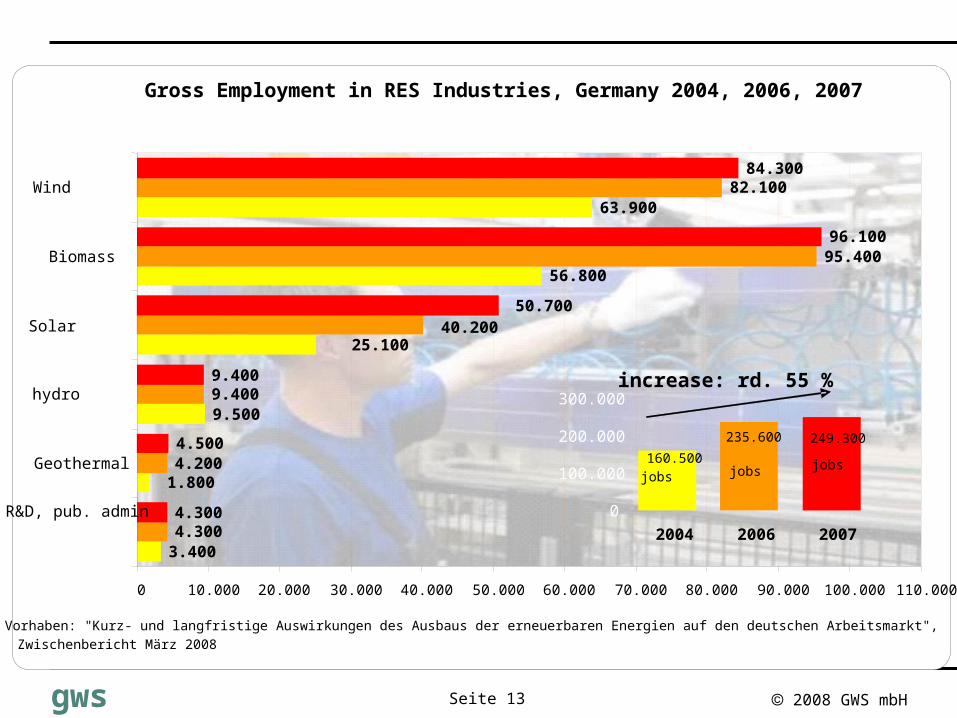
Gross Employment in RES Industries, Germany 2004, 2006, 2007
3.400
9.500
56.800
63.900
4.300
9.400
95.400
82.100
4.300
4.500
9.400
96.100
84.300
25.100
1.800
40.200
4.200
50.700
0 10.000 20.000 30.000 40.000 50.000 60.000 70.000 80.000 90.000 100.000 110.000
Geothermal
hydro
Solar
Biomass
Wind
Source: BMU Vorhaben: "Kurz- und langfristige Auswirkungen des Ausbaus der erneuerbaren Energien auf den deutschen Arbeitsmarkt",
Zwischenbericht März 2008
increase: rd. 55 %
R&D, pub. admin
0
100.000
200.000
300.000
2004 2006 2007
160.500
jobs
235.600 249.300
jobs jobs
2008 GWS mbHSeite 14gws
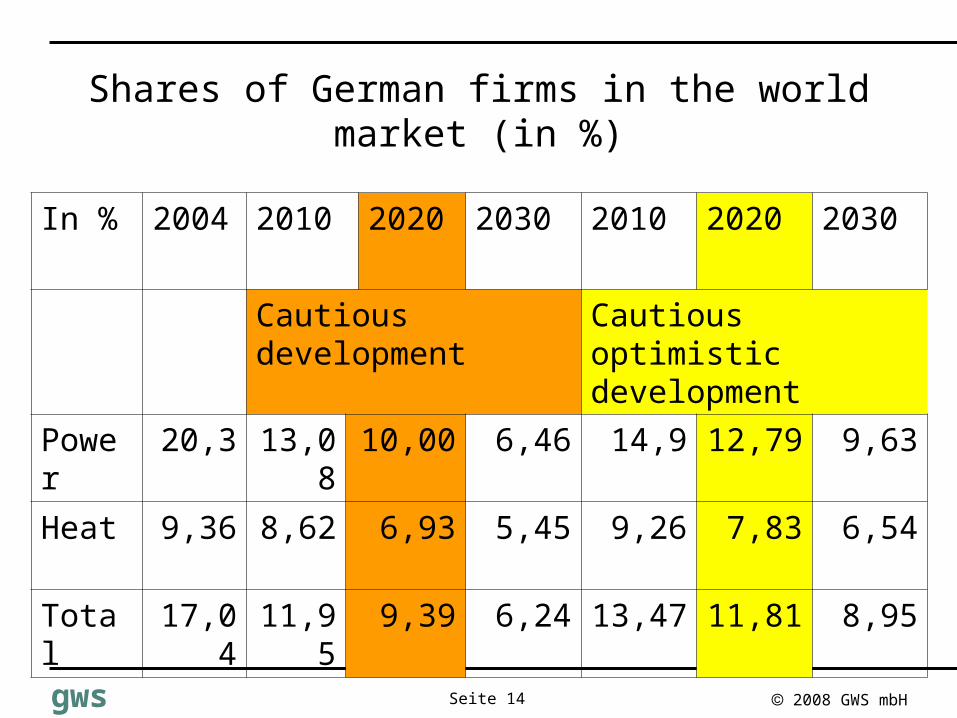
Shares of German firms in the world market (in %)
In % 2004 2010 2020 2030 2010 2020 2030
Cautious development
Cautious optimistic development
Power 20,3 13,08 10,00 6,46 14,9 12,79 9,63
Heat 9,36 8,62 6,93 5,45 9,26 7,83 6,54
Total 17,04 11,95 9,39 6,24 13,47 11,81 8,95
2008 GWS mbHSeite 15gws
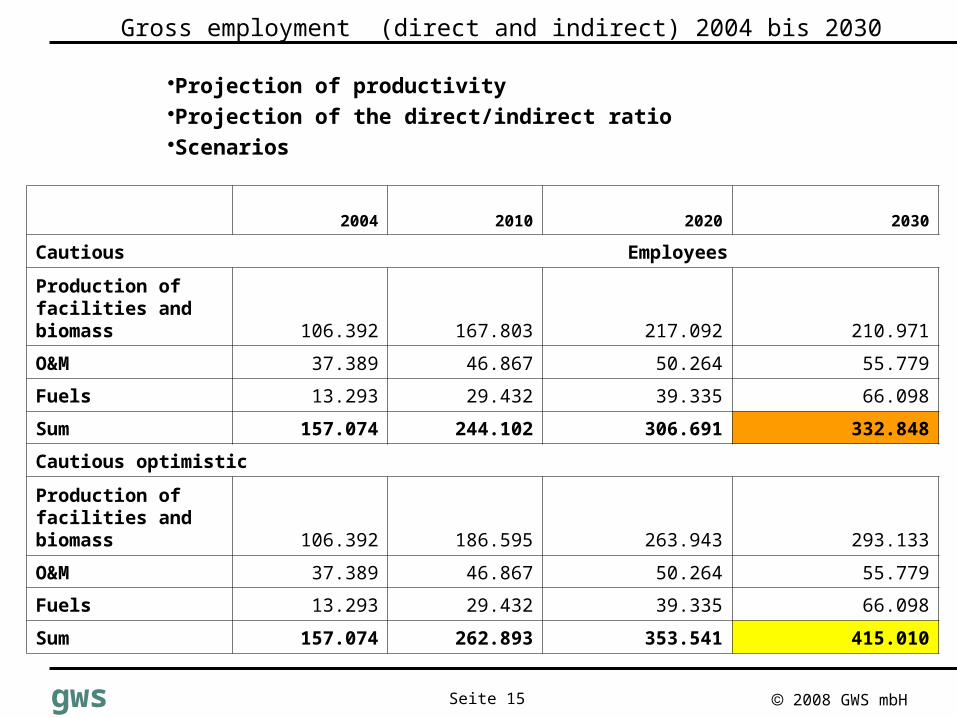
Gross employment (direct and indirect) 2004 bis 2030
Projection of productivityProjection of the direct/indirect ratioScenarios
2004 2010 2020 2030
Cautious Employees
Production of facilities and biomass 106.392 167.803 217.092 210.971
O&M 37.389 46.867 50.264 55.779
Fuels 13.293 29.432 39.335 66.098
Sum 157.074 244.102 306.691 332.848
Cautious optimistic
Production of facilities and biomass 106.392 186.595 263.943 293.133
O&M 37.389 46.867 50.264 55.779
Fuels 13.293 29.432 39.335 66.098
Sum 157.074 262.893 353.541 415.010
2008 GWS mbHSeite 16gws
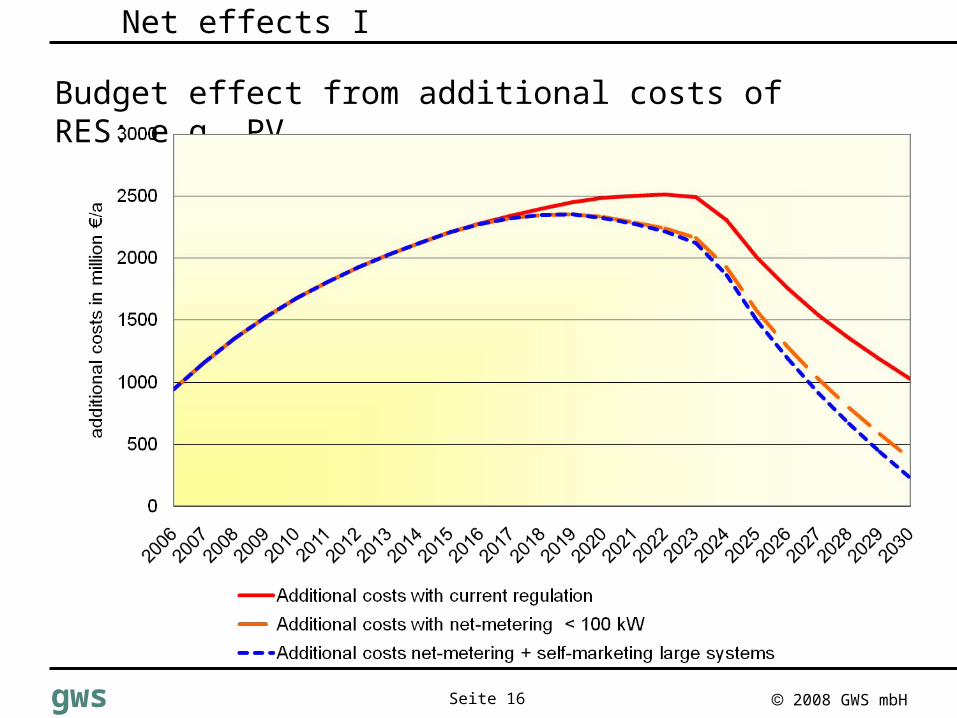
Net effects I
Budget effect from additional costs of RES: e.g. PV
2008 GWS mbHSeite 17gws
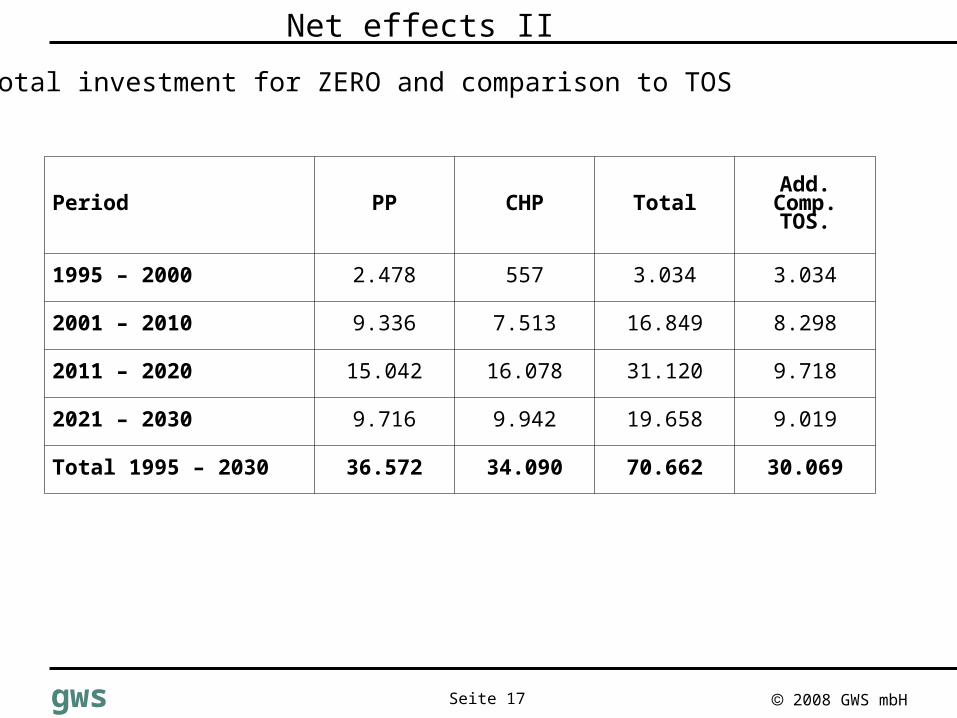
Period PP CHP Total Add. Comp. TOS.
1995 – 2000 2.478 557 3.034 3.034
2001 – 2010 9.336 7.513 16.849 8.298
2011 – 2020 15.042 16.078 31.120 9.718
2021 – 2030 9.716 9.942 19.658 9.019
Total 1995 – 2030 36.572 34.090 70.662 30.069
Total investment for ZERO and comparison to TOS
Net effects II

2008 GWS mbHSeite 18gws
States16 StatesSince 1998
World Trade Model(53 countriesand regions)
France
...
UK
JapanINFORGE59 SectorsSince 1995
BranchesSince 1996
REGIOSince 2004
PANTA RHEI
Energy undEnvironmentSince 1997
USA
GINFORSSeit 1998
Modeling Environment
2008 GWS mbHSeite 19gws
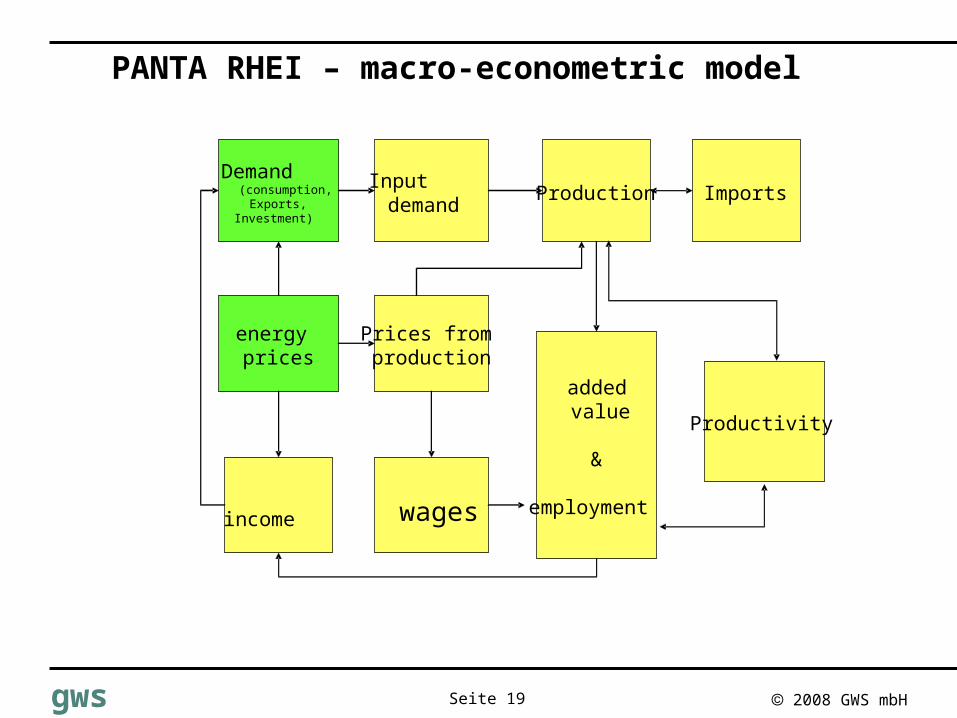
PANTA RHEI – macro-econometric model
Demand(consumption, Exports,
Investment)
Inputdemand
Production Imports
energyprices
Prices fromproduction
addedvalue
&
employment
Productivity
income wages
2008 GWS mbHSeite 20gws
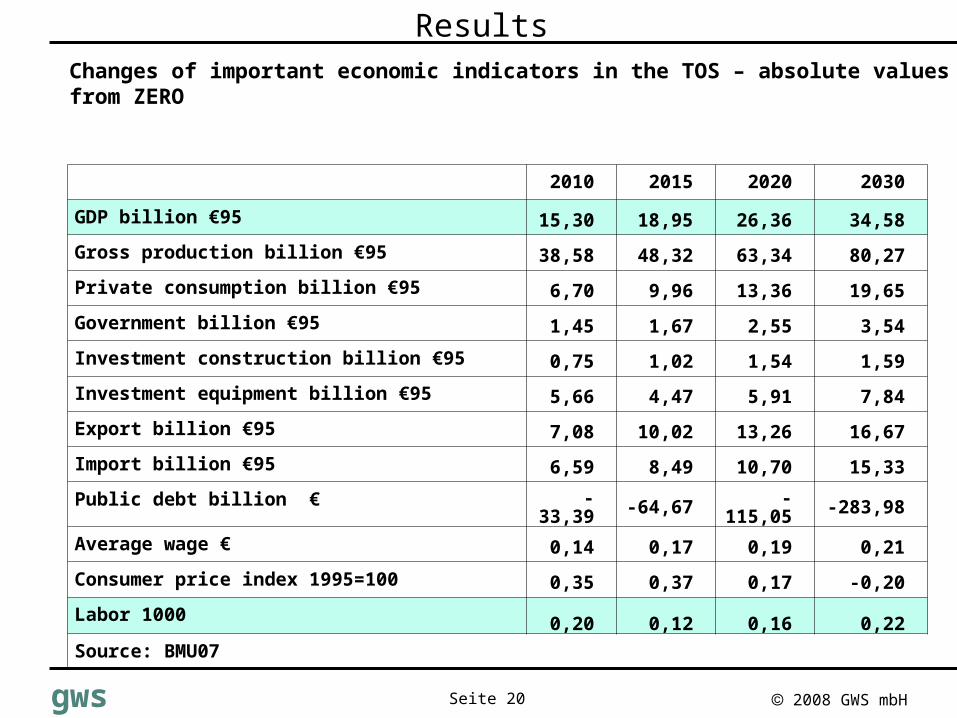
Results
2010 2015 2020 2030
GDP billion €95 15,30 18,95 26,36 34,58
Gross production billion €95 38,58 48,32 63,34 80,27
Private consumption billion €95 6,70 9,96 13,36 19,65
Government billion €95 1,45 1,67 2,55 3,54
Investment construction billion €95 0,75 1,02 1,54 1,59
Investment equipment billion €95 5,66 4,47 5,91 7,84
Export billion €95 7,08 10,02 13,26 16,67
Import billion €95 6,59 8,49 10,70 15,33
Public debt billion € -33,39 -64,67 -115,05 -283,98
Average wage € 0,14 0,17 0,19 0,21
Consumer price index 1995=100 0,35 0,37 0,17 -0,20
Labor 1000 0,20 0,12 0,16 0,22
Source: BMU07
Changes of important economic indicators in the TOS – absolute values from ZERO