Heath, Anthony; Schneider, Silke L.; Butt, Sarah the ...€¦ · Developing a Measure of...
76
www.ssoar.info Developing a measure of socio-cultural origins for the European Social Survey Heath, Anthony; Schneider, Silke L.; Butt, Sarah Veröffentlichungsversion / Published Version Forschungsbericht / research report Zur Verfügung gestellt in Kooperation mit / provided in cooperation with: GESIS - Leibniz-Institut für Sozialwissenschaften Empfohlene Zitierung / Suggested Citation: Heath, A., Schneider, S. L., & Butt, S. (2016). Developing a measure of socio-cultural origins for the European Social Survey. (GESIS Papers, 2016/16). Köln: GESIS - Leibniz-Institut für Sozialwissenschaften. https://doi.org/10.21241/ ssoar.49503 Nutzungsbedingungen: Dieser Text wird unter einer CC BY-NC Lizenz (Namensnennung- Nicht-kommerziell) zur Verfügung gestellt. Nähere Auskünfte zu den CC-Lizenzen finden Sie hier: https://creativecommons.org/licenses/by-nc/4.0/deed.de Terms of use: This document is made available under a CC BY-NC Licence (Attribution-NonCommercial). For more Information see: https://creativecommons.org/licenses/by-nc/4.0 Diese Version ist zitierbar unter / This version is citable under: https://nbn-resolving.org/urn:nbn:de:0168-ssoar-49503-6
Transcript of Heath, Anthony; Schneider, Silke L.; Butt, Sarah the ...€¦ · Developing a Measure of...

www.ssoar.info
Developing a measure of socio-cultural origins forthe European Social SurveyHeath, Anthony; Schneider, Silke L.; Butt, Sarah
Veröffentlichungsversion / Published VersionForschungsbericht / research report
Zur Verfügung gestellt in Kooperation mit / provided in cooperation with:GESIS - Leibniz-Institut für Sozialwissenschaften
Empfohlene Zitierung / Suggested Citation:Heath, A., Schneider, S. L., & Butt, S. (2016). Developing a measure of socio-cultural origins for the European SocialSurvey. (GESIS Papers, 2016/16). Köln: GESIS - Leibniz-Institut für Sozialwissenschaften. https://doi.org/10.21241/ssoar.49503
Nutzungsbedingungen:Dieser Text wird unter einer CC BY-NC Lizenz (Namensnennung-Nicht-kommerziell) zur Verfügung gestellt. Nähere Auskünfte zuden CC-Lizenzen finden Sie hier:https://creativecommons.org/licenses/by-nc/4.0/deed.de
Terms of use:This document is made available under a CC BY-NC Licence(Attribution-NonCommercial). For more Information see:https://creativecommons.org/licenses/by-nc/4.0
Diese Version ist zitierbar unter / This version is citable under:https://nbn-resolving.org/urn:nbn:de:0168-ssoar-49503-6

Developing a Measure of Socio-cultural Origins for the European Social Survey
2016|16
Anthony Heath, Silke L. Schneider & Sarah Butt
GESIS Papers

kölkölölk

Developing a Measure of Socio-cultural Origins for the European Social Survey
GESIS Papers 2016|16
Anthony Heath (University of Oxford),
Silke L. Schneider (GESIS) &
Sarah Butt (City, University of London)
GESIS – Leibniz-Institut für Sozialwissenschaften 2016

GESIS Papers
GESIS – Leibniz-Institut für Sozialwissenschaften
Survey Design and Methodology
Postfach 12 21 55
68072 Mannheim
Telefon: 0621 / 1246 - 249
Telefax: 0621 / 1246 - 100
E-Mail: [email protected]
ISSN: 2364-3773 (Print)
ISSN: 2364-3781 (Online)
Herausgeber,
Druck und Vertrieb: GESIS – Leibniz-Institut für Sozialwissenschaften
Unter Sachsenhausen 6-8, 50667 Köln

Contents
1 Introduction ..................................................................................................................................................................... 6
1.1 Rationale for developing an item on socio-cultural origins .................................................................... 6 1.2 The ancestry item in ESS Round 7 .................................................................................................................... 8 1.3 Overview of the report ......................................................................................................................................... 9
2 Process quality: Question development, testing and implementation ........................................................ 11
2.1 Developing and testing the source question .............................................................................................. 11 2.2 Developing the cross-national code-frame ................................................................................................. 15 2.3 Implementing the item cross-nationally ...................................................................................................... 19 2.4 Summary ................................................................................................................................................................. 24
3 Output quality: Evaluation of country data and derived variables.............................................................. 25
3.1 Non-substantive responses: ‘don’t know’, ‘refusal’ and ‘no answer’ ................................................... 25 3.2 Dual ancestries ...................................................................................................................................................... 27 3.3 Coding of ‘other’ ancestries in the harmonised variables....................................................................... 29 3.4 Producing derived variables ............................................................................................................................. 31 3.5 Discriminant validity ........................................................................................................................................... 40 3.6 Summary ................................................................................................................................................................. 45
4 Conclusions and Recommendations ....................................................................................................................... 46
4.1 Adding ancestry to the ESS core questionnaire ......................................................................................... 46 4.2 Revising the European Standard Classification of Cultural and Ethnic Groups (ESCEG).............. 47 4.3 Other improvements to the ESS ancestry item .......................................................................................... 48 4.4 Final thoughts ....................................................................................................................................................... 50
5 References....................................................................................................................................................................... 51
6 Appendix: Distributions of country-specific variables ..................................................................................... 53

Developing a Measure of Socio-cultural Origins for the European Social Survey 5
Abstract
A person’s ethnic or socio-cultural background has been shown to be an important predictor of a range of social attitudes and behaviours. Ideally, therefore, we want to capture such information alongside other demographic variables in social surveys. However, gathering information about peo-ple’s socio-cultural origins as part of a cross-national survey is complicated, not least because of the need to capture complex variation in national, ethnic and other cultural groupings prevalent across countries: The socio-cultural composition of populations vastly differs across countries.
The European Social Survey (ESS), a biannual survey of cross-national attitudes and opinions conduct-ed in over 36 European countries since 2001, in 2014/15 trialled an approach to collecting data on socio-cultural origins based on a measure of respondents’ self-reported ancestry, i.e. family origins or descent. A questionnaire item was developed which involved countries fielding the item using a coun-try-specific showcard and recoding responses into a newly developed European Standard Classification of Cultural and Ethnic Groups (ESCEG) to create harmonised variables for comparative analysis. Fol-lowing a thorough evaluation of the item’s performance it has since been decided to include the an-cestry item, with some modifications, as a permanent addition to the ESS core questionnaire from Round 8 (2016/17) onwards.
This report summarises findings from the evaluation conducted into the development and perfor-mance of the new ancestry item in ESS Round 7 and the recommendations made for the item’s further development and deployment. It also makes some suggestions on how to code derived variables for statistical analysis. The evaluation concluded that the item worked well across ESS countries and gen-erated meaningful data on respondents’ socio-cultural origins. There were no significant problems with implementation reported. However, the evaluation also highlighted a number of ways in which the item could be improved especially as regards adaptation for different countries. These include improved guidance on translation, revisions to the harmonised code-frame, and more consistent treatment of sub-national socio-cultural groups. This evaluation report will be of interest both to researcher’s wishing to carry out substantive analyses using the new ESS ancestry measure and survey methodologists interested in lessons learned for the development of cross-national questionnaires and classifications.
Acknowledgements
We would like to thank the following people who contributed to the development of a measure of socio-cultural origins for the European Social Survey and its subsequent evaluation: members of the ESS Core Scientific Team involved in the questionnaire design process, particularly Rory Fitzgerald, Brita Dorer, Yvette Prestage, Sally Widdop and Lizzy Winstone; colleagues at the ESS Data Archive at NSD (Norwegian Centre for Research Data), particularly Kirstine Kolsrud, for supporting work on de-veloping the cross-national code-frame and producing harmonised ancestry variables; National Coor-dinators in participating ESS countries who worked with us to agree the country-specific showcards and mappings and, most importantly, all of the survey interviewers and respondents in the 22 ESS countries who provided us with invaluable cross-national data on this topic.
We would also like to acknowledge the support of the other members of the Question Design Team for the ESS Round 7 Rotating module on “Attitudes towards immigration and their antecedents” Eldad Davidov, Robert Ford, Eva Green, Alice Ramos and Peter Schmidt.
6 GESIS Papers 2016|16
1 Introduction
A person’s ethnic or socio-cultural background has been shown to be an important predictor of a range of social attitudes and behaviours (see for example Heath, Fisher, Rosenblatt, Sanders, & Sobolewska, 2013). Ideally, therefore, we want to capture such information alongside other demo-graphic variables in social surveys. However, gathering information about people’s socio-cultural ori-gins as part of a cross-national survey is complicated, not least because of the need to capture com-plex variation in national, ethnic and other cultural groupings prevalent across countries: The socio-cultural composition of populations vastly differs across countries.
The European Social Survey (ESS), a biannual survey of cross-national attitudes and opinions conduct-ed in over 36 European countries since 2001, in 2014/15 (ESS Round 7) trialled an approach to collect-ing data on socio-cultural origins based on a measure of respondents’ self-reported ancestry devel-oped by the Australian Bureau of Statistics and fielded as part of the Australian Census. The new item on ancestry was included alongside existing measures of respondent background such as respondent’s citizenship and respondent and parents’ country of birth.
This report summarises findings from the evaluation conducted into the development and perfor-mance of the new ancestry item in ESS Round 7 and the recommendations made for the item’s further development and deployment. This evaluation report will be of interest both to researchers wishing to carry out substantive analyses using the new ESS ancestry measure and survey methodologists inter-ested in lessons learned for the development of cross-national questionnaires and classifications.
Data for ESS Round 7, including the harmonised versions of the ancestry variables, are freely available to download from the ESS website (www.europeansocialsurvey.org) along with comprehensive docu-mentation of the ancestry item. Syntax for constructing the derived variables presented in this report (see section 3.4) will be made available at www.europeansocialsurvey.org/data/themes.html?t=sociodemo in early 2017.
1.1 Rationale for developing an item on socio-cultural origins
Ethnic and national divisions are of great importance in contemporary Europe, as shown for example by the various movements for independence in several European countries (e.g. Scotland in the UK, Catalonia in Spain), the conflicts that have occurred in neighbouring countries, and the public policy concerns about the integration of migrants and their descendants. Groups such as the European Net-work Against Racism (ENAR) have argued powerfully for the need to collect data on ethnic back-ground for monitoring purposes (Abdikeeva, 2014), while sociologists have argued that ethnicity is a powerful explanatory concept in its own right (Modood & Khattab, 2015). Certainly, it is a powerful predictor of a wide range of outcomes covered in the ESS. Ethnic and national identification are among the strongest predictors of party identification in many European countries, often stronger than traditional predictors such as social class (Heath et al., 2013; Morales & Giugni, 2011). The omis-sion of powerful predictors can lead to incorrect conclusions about other predictors which have been included. Failure to measure a key demographic variable like ethnic and cultural background is likely to mean that models using other demographic variables may be misspecified.
The classical countries of immigration (Australia, Canada and the USA) have long-established tradi-tions and official measures for asking about cultural and ethnic background or heritage, whereas most European scholars and official bodies have been reluctant to ask about this, preferring to use factual measures (if any) such as country of birth or nationality. However, these measures are becoming in-creasingly inappropriate as (migration related) minority populations in Western Europe become more

Developing a Measure of Socio-cultural Origins for the European Social Survey 7
established and also more diverse. Naturalization policies and the prevalence of naturalizations con-tinue to differ across countries covered by the ESS and hence nationality or, more strictly speaking, citizenship is not a cross-nationally comparable indicator of cultural and ethnic background. Many citizens of European countries today also have a migration or ethnic minority background. Therefore, citizenship is a (cross-nationally comparable) indicator for the legal relationship between individual and state, but not a good proxy for socio-cultural origins.
While more cross-nationally comparable than citizenship, measures of migration background based on the indicator country of birth of respondent and parents also have a number of shortcomings. Firstly, the growing number of third-generation people with a migration background is invisible in surveys which rely on country of birth measures alone (unless they also measure grandparents’ country of birth, which is rarely done). Secondly, country of birth measures fail to identify important divisions within sending countries, such as the distinction between people of Turkish and Kurdish origin or be-tween Bosnian Serbs and Bosniaks; and thirdly they often wrongly identify members of the majority group as having a migration background. In a number of Western European countries which once had substantial empires overseas, many migrants apparently born abroad are in fact returning children of colonial expatriates. Strictly speaking, migration background captures individuals’ experiences related to migration, independently of their cultural or ethnic origin. These weaknesses mean that country of birth is a noisy measure of ethnic origin, even if we restrict our interest to respondents with a migra-tion background. Technically it has both low ‘specificity’ and low ‘sensitivity’.
Finally, and particularly relevant in many Eastern European countries (and some Western ones), the indicator ‘country of birth’ simply cannot identify indigenous cultural and ethnic minorities such as Roma or Basques, longstanding sub-national groups such as Scots, Catalans, or Swedish-speaking Finns or the official national minorities in a number of countries, which conceptually also count as specific cultural and ethnic groups.1
The central theoretical concept which the new question intends to measure is that of ‘cultural and ethnic origins’, which refers to the ethnic or cultural group an individual considers himself or herself to descend from. This concept should not be confused with nationality or citizenship, country of birth, or language. While closely related to the concept of ethnic identity – another important aspect of an ethnic group – it is somewhat distinct: It is possible to acknowledge a cultural or ethnic background without necessarily strongly identifying with the respective cultural or ethnic group currently. We prefer to focus on the concept of background or origin rather than of current identity because of what has been termed the problem of ‘leakage’: some people with an ethnic background may no long-er feel close to their ethnic group, with the consequent risk of misleading conclusions about ethnic disadvantages if only current identity is measured (Wimmer, 2009).
The standard definition of ethnic group comes from Max Weber. Weber stated that ‘we shall call ‘eth-nic groups’ those human groups that entertain a subjective belief in their common descent because of similarities of physical type or of customs or both, or because of memories of colonization and migra-tion’ (Weber, 1978, p. 389). The key component of this definition, as in most sociological approaches to ethnicity, is the central role accorded to subjective identities: whether a particular group of people can be counted as an ethnic or cultural group is a matter for the members of that group to decide, not for outside observers to stipulate on the basis of so-called ‘objective’ criteria. Ethnicity is essentially self-defined, akin to national identity, party identification, class identity or religious affiliation, whether looking at ethnic identity or ethnic background. As with membership of a nation, ethnicity will typi-
1 It should be noted that the current ESS question on membership of a minority group or a discriminated group
are unable to perform this function, firstly because they lump together very different groups and second be-cause they lack equivalence of meaning across countries. For example, the Flemish in Belgium or Scots in the UK do not define themselves as minority groups, whereas Estonian Russians in Estonia do.
8 GESIS Papers 2016|16
cally be associated with a distinctive shared culture, history and traditions, and with distinctive pat-terns of commensality and intermarriage. It will sometimes involve a distinct language or religion, although these are by no means universal features. As Weber makes clear, there is no one defining characteristic shared by all ethnic groups.
The sociological concept of ethnic group is very close to political scientists’ concept of a nation (e.g. Anderson, 1991). The main distinction is that nations typically (although not invariably) lay claim to, or already have rights over, a particular territory. However, in a world of migration, the distinction can be contingent and contextual. Thus Kurds in the Middle East might think of themselves as a nation with a homeland to which some would make a territorial claim, whereas people of Kurdish background living in Sweden might be regarded as an ethnic minority. For practical purposes, then, it is not helpful to make a hard and fast distinction between the concepts of ethnic group and nation.
For simplicity, throughout this report we also use the term ‘socio-cultural origins’ to refer to the con-cept of cultural and ethnic origins or background because it encompasses socio-cultural groups with a shared heritage, broadly conceived, rather than narrowly defined ethnic or national minorities (see also section 2.1.1). Following the emphasis in Weber’s definition on belief in common descent, our approach emphasizes self-reported ancestry or origins as the empirical indicator for ethnic and cultur-al origins. Our aim is to develop a measure which can be used to identify majority and minority na-tional groups and indigenous populations as well as respondents with a ‘true’ migration background (rather than returning children of expatriates).
1.2 The ancestry item in ESS Round 7
Figure 1 shows the item on ancestry, developed alongside the ESS Round 7 rotating module on immi-gration, which was included in the ESS questionnaire in ESS Round 7. The item was included at the end of Section F of the questionnaire, which largely covers other socio-demographic background vari-ables. This placement – separate from the existing items on country of birth and citizenship in Section C – avoids disruption to the core time series and separates the ancestry item from too close an associ-ation with respondent or parents’ country of birth.
Similar to the approach used for existing core ESS items such as religion and education, where the realities in the various ESS countries differ too much to provide the same response options everywhere (input harmonisation) the ancestry question used a country-specific showcard. The source question-naire item shown above used the UK item as an example for illustrative purposes. National Coordina-tors were consulted on the categories to be included on the country-specific showcard and how the country-specific categories should be mapped onto the common, harmonised code-frame – the Euro-pean Standard Classification of Cultural and Ethnic Groups (ESCEG, see section 2.2).2 National Coordi-nators were responsible for recoding the country-specific responses into the harmonised code-frame prior to data deposit, according to the mapping specified prior to data collection. ESS Round 7 field-work took place in 22 European countries between August 2014 and December 2015. ESS Round 7 data (European Social Survey, 2016) for all 21 countries, including the ancestry measures, is now freely available to download from the ESS website www.europeansocialsurvey.org.
2 The ESCEG was developed specifically for the ESS by Anthony Heath and Silke Schneider and is more closely
described in Schneider and Heath (2016).

Developing a Measure of Socio-cultural Origins for the European Social Survey 9
90 ‘Ancestry’ in the sense of ‘descent’ or ‘origins’.
Figure 1: ESS Round 7 source questionnaire item on ancestry
1.3 Overview of the report
This report is intended to inform the scientific community on the development of the ESS ancestry item and to present findings from the evaluation which was conducted into the performance of the item included on a trial basis in ESS Round 7. The purpose of the evaluation was to examine whether the ancestry item as fielded in ESS Round 7 was fit for purpose as a measure of socio-cultural origins and could be fielded successfully cross-nationally. It formed the basis for the decision to include a slightly modified version of the ancestry item in the ESS core questionnaire from ESS Round 8 on-wards.
10 GESIS Papers 2016|16
The report addresses the following questions:
Is the ancestry item developed for the ESS a valid measure of socio-cultural origins, i.e. are we measuring what we want to measure?
Can the item be administered successfully cross-nationally? Does the item add value to the ESS questionnaire?
Does it have discriminant validity over and above existing core items such as citizenship and respondent and parent country of birth?
How might the variables be used in cross-national analysis?
The report draws on evidence from the following sources:
Questionnaire design templates and pre-testing reports from ESS Round 7 Cognitive testing prior to ESS Round 8 Consultations with ESS National Coordinators during preparations for ESS Round 7 fieldwork and
subsequently via an online questionnaire ESS Round 7 data files:
draft files deposited by the 15 countries included in the ESS Round 7 first release (pre-release data) (made available to the authors under special license for the purposes of evaluation) ;
ESS Round 7 country-specific ancestry variables (made available to the authors under special license for the purposes of evaluation);
ESS Round 7 data, edition 2.0 published on May 26th, 2016 (European Social Survey, 2016).
The report consists of two main sections: Firstly, in chapter 2, the process of item development and implementation will be described in order to document the process for data users, allowing them to assess process quality (Lyberg et al., 1997; Wolf, Schneider, Behr, & Joye, 2016). Secondly, in chapter 3, the resulting ESS Round 7 data are analysed in order to establish output quality of the new measures. Chapter 4 presents conclusions and recommendations from the evaluation and documents how the item will appear from ESS Round 8 onwards.
Developing a Measure of Socio-cultural Origins for the European Social Survey 11
2 Process quality: Question development, testing and implementation
This chapter documents the development, testing and implementation of the ancestry item in ESS Round 7. The first part of the chapter summarises the development and testing of the source question and the process by which the final question wording and format fielded in ESS Round 7 was arrived at. It also presents additional evidence on respondents’ understanding of and responses to the item ob-tained from cognitive interviewing conducted as part of preparations for ESS Round 8. Section 2 of the chapter explains the development of the common code-frame – the European Standard Classifica-tion of Cultural and Ethnic Groups (ESCEG) - to produce harmonised versions of the ancestry variables for the integrated data file. The final part of the chapter describes the implementation of the ancestry item in the field, focusing in particular on how well the process of translating and adapting the source question worked across participating countries.
2.1 Developing and testing the source question
In common with all new items added to the ESS questionnaire, prior to its inclusion in ESS Round 7 the ancestry item underwent several stages of development and rigorous pre-testing. In addition to extensive expert review and input from the ESS Scientific Advisory Board (SAB), Core Scientific Team (CST) and National Coordinators (NCs), this included two rounds of quantitative testing, first via an international omnibus survey and then as part of the ESS Round 7 two-nation pilot and advance translation in two countries. The development process was fully documented in the Question Design Template for the Round 7 rotating module on ‘Attitudes to immigration and their antecedents’.3 The ESS Round 7 ancestry item has also subsequently undergone cognitive testing alongside new items being developed for inclusion in the ESS core questionnaire in Round 8.
2.1.1 ESS Round 7 international omnibus survey
The initial proposal from the Round 7 module ‘Attitudes to immigration and their antecedents’ Ques-tion Development Team (QDT) was to add an item measuring respondents’ ethnic group to the ESS questionnaire as an additional indicator of socio-cultural background. Information on ethnic group is routinely collected as part of surveys in the UK (and some other ESS countries) and there are standard questions for doing so. An open-ended question asking “How would you describe your ethnic group?” was fielded as part of Ipsos MORI’s face-to-face international omnibus survey in two countries, the UK and Bulgaria. Data were collected from 1,000 respondents in each country in June 2013. The item was fielded alongside a second open-ended item asking respondents for their nationality and a closed question on ethnic background routinely included as part of Ipsos’ standard battery of socio-demographic background variables. It was decided to field an open-ended item at this early stage of development to provide maximum insight into how people understand the term ‘ethnic group’ and the possible range of responses. The item could later be transformed into a closed item with pre-defined response options.
This ethnic group item did not appear to pose problems for respondents in either of the two test coun-tries and generated low levels of item nonresponse (1 per cent in the UK and 0.3 per cent in Bulgaria).
3 The documentation is available via the ESS website: http://www.europeansocialsurvey.org/data/themes.html?t=
immigration
12 GESIS Papers 2016|16
The main finding from the omnibus was that respondents understood the term ‘ethnic group’ quite broadly and in a variety of different ways. Broadly speaking, respondents volunteered one of five kinds of response: A combination of race and nationality, just race, just nationality (including some broad groups such as European, Asian, Caribbean or South/Latin American), religion (such as Christian, Jewish or Muslim), or other (such as sub-national groups or non-national minority groups such as Roma or Vlach). The responses were generally consistent with the responses given to the closed question on ethnic group. The open question, however, gave more details on groups not usually differentiated in national surveys, such as ‘white, other’ in the UK, and allowed respondents to express other aspects of their identity such as religion or membership of a sub-national or other non-national group.
Informed by evidence from the omnibus testing, it was agreed to continue to develop a measure of ethnic group for the ESS. However, given evidence of the variety of ways in which respondents might choose to interpret an open question, and to assist with data harmonisation across countries, it was felt to be preferable to provide a showcard with some possible response categories (plus an ‘other’ category) to guide respondents. These pre-defined response categories could then more easily be re-coded into a harmonised code-frame covering all ESS countries for data publication.
Consultation with ESS National Coordinators regarding the possibility of operationalising a question on ethnic group across ESS countries revealed that it would not be possible to ask about ethnic group membership specifically. The term ‘ethnic group’ is not one that is routinely used or likely to be equally well understood across all ESS countries. More importantly, in some ESS countries e.g. France, it is illegal to ask respondents for their ethnicity as part of a survey. An alternative term than ‘ethnic group’ would need to be found to capture the somewhat broader underlying concept of ‘socio-cultural origins’. Following feedback from omnibus testing and National Coordinators, a new item was thus developed with the term ‘ancestry’ in place of ‘ethnic group’. Use of the term ‘ancestry’ to denote common descent or shared origins is consistent both with the definition of ‘ethnic group’ by Weber (see chapter 1) as well as with the approach taken to measuring socio-cultural origins in the Australian Census to generate data for the Australian Standard Classification of Cultural and Ethnic Groups (ASCCEG, Australian Bureau of Statistics, 2011, see section 2.2).
2.1.2 ESS Round 7 two-nation pilot
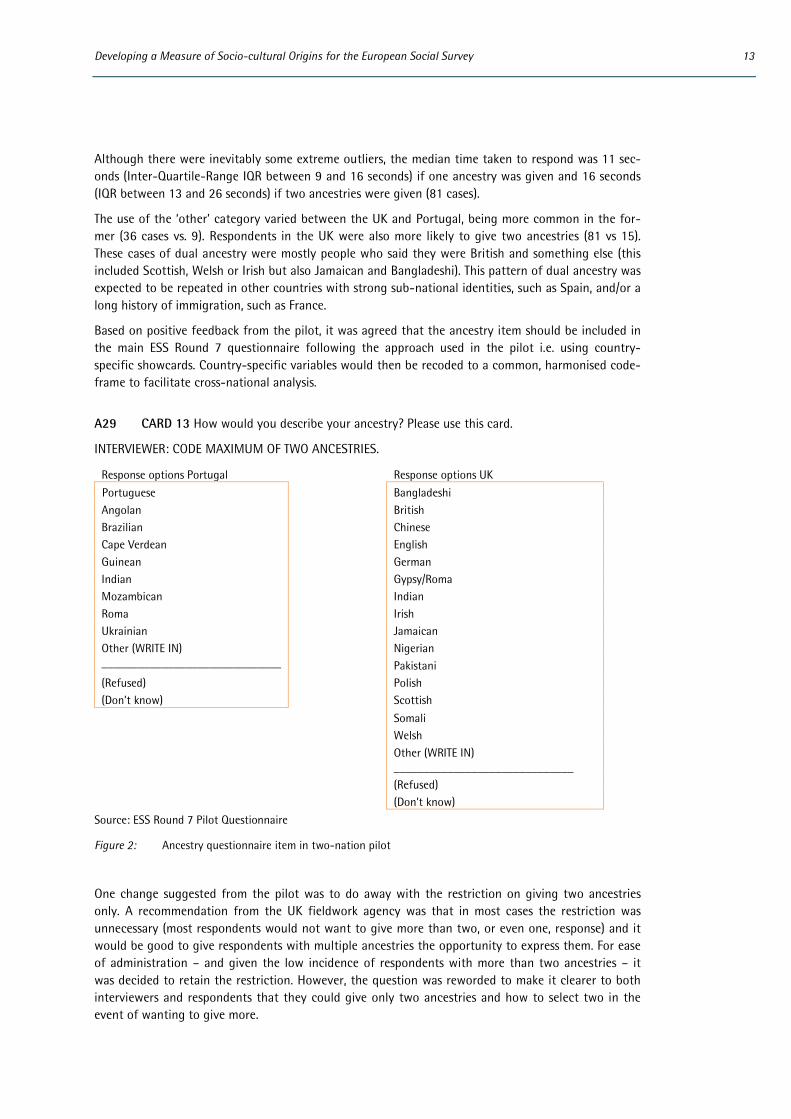
The new item developed following the international omnibus test was fielded in the UK and Portugal as part of the two-nation pilot for ESS Round 7 conducted in October 2013. Data was collected via face to face interviews with more than 400 respondents in each country. Respondents were provided with country-specific showcards listing the most relevant national and ethnic groups to guide their responses but with the option of specifying an ‘other’ response if required. The question wording and pre-defined response categories for the two pilot countries are shown in Figure 2. For fieldwork, the response options for Portugal were of course translated into Portuguese.
The item performed well in both countries. Based on their analysis of the pilot data and feedback from interviewers, the fieldwork agencies in the UK and Portugal reported that the item appeared to be well understood by respondents and that the response options provided were appropriate. Not all of the categories on the showcards were used but this is to be expected given the small sample sizes, and the pattern of ‘other’ responses does not suggest any obvious additions to the showcards. The item gener-ated a low level of item nonresponse (1 ‘Don’t Know’ in the UK, 3 ‘Don’t Know’ and 1 ‘Refusal’ in Por-tugal). Timing data for the UK4 indicate that the question did not take respondents an unduly long time to complete and do not suggest that the item was particularly burdensome for respondents.
4 Timing data for individual items are not available for Portugal where the questionnaire was administered using
PAPI.
Developing a Measure of Socio-cultural Origins for the European Social Survey 13
Although there were inevitably some extreme outliers, the median time taken to respond was 11 sec-onds (Inter-Quartile-Range IQR between 9 and 16 seconds) if one ancestry was given and 16 seconds (IQR between 13 and 26 seconds) if two ancestries were given (81 cases).
The use of the ‘other’ category varied between the UK and Portugal, being more common in the for-mer (36 cases vs. 9). Respondents in the UK were also more likely to give two ancestries (81 vs 15). These cases of dual ancestry were mostly people who said they were British and something else (this included Scottish, Welsh or Irish but also Jamaican and Bangladeshi). This pattern of dual ancestry was expected to be repeated in other countries with strong sub-national identities, such as Spain, and/or a long history of immigration, such as France.
Based on positive feedback from the pilot, it was agreed that the ancestry item should be included in the main ESS Round 7 questionnaire following the approach used in the pilot i.e. using country-specific showcards. Country-specific variables would then be recoded to a common, harmonised code-frame to facilitate cross-national analysis.
A29 CARD 13 How would you describe your ancestry? Please use this card.
INTERVIEWER: CODE MAXIMUM OF TWO ANCESTRIES.
Response options Portugal Response options UK Portuguese Bangladeshi Angolan British Brazilian Chinese Cape Verdean English Guinean German Indian Gypsy/Roma Mozambican Indian Roma Irish Ukrainian Jamaican Other (WRITE IN) ______________________________
Nigerian Pakistani
(Refused) Polish (Don’t know) Scottish
Somali Welsh Other (WRITE IN)
______________________________ (Refused) (Don’t know)
Source: ESS Round 7 Pilot Questionnaire
Figure 2: Ancestry questionnaire item in two-nation pilot
One change suggested from the pilot was to do away with the restriction on giving two ancestries only. A recommendation from the UK fieldwork agency was that in most cases the restriction was unnecessary (most respondents would not want to give more than two, or even one, response) and it would be good to give respondents with multiple ancestries the opportunity to express them. For ease of administration – and given the low incidence of respondents with more than two ancestries – it was decided to retain the restriction. However, the question was reworded to make it clearer to both interviewers and respondents that they could give only two ancestries and how to select two in the event of wanting to give more.

14 GESIS Papers 2016|16
There was some discussion about whether the question needed to distinguish between ‘primary’ and ‘secondary’ ancestry. It was concluded that this was unnecessary and could make the question unnec-essarily restrictive or complicated for respondents. Based on the question as given, no hierarchy can necessarily be inferred from the order of responses. This resulted in the final item shown in Figure 3.
F61 CARD 77 How would you describe your ancestry? Please use this card to choose up to two ancestries that best apply to you.
INTERVIEWER: code maximum of two ancestries in total.
If more than two are mentioned, ask respondent to select two.
If respondent is unable to do this, code first two ancestries mentioned.
INTERVIEWER PROBE ONCE: Which other?
Figure 3: Final ESS Round 7 ancestry item wording
2.1.3 Advance translation
Alongside the pilot, advance translation of the new ancestry item, following ESS translation (TRAPD) procedures (European Social Survey, 2014), was carried out in Portugal and France. No major issues were raised with the translation of the item in either country. However, an annotation was added to aid in the translation of the term ancestry: ‘ancestry in the sense of ‘descent’ or ‘origins’’.
2.1.4 ESS Round 8 cognitive interviewing
Cognitive interviewing provides an insight into the mental processes respondents use when answering survey questions, generating further evidence on how respondents understand and arrive at an answer to the new ancestry item. The ESS Round 7 ancestry item was included in cognitive interviews con-ducted in the lead up to ESS Round 8 in order to be able to supplement the quantitative data from ESS Round 7 with more qualitative feedback on how people understand and respond to a question about ancestry. The item was included in cognitive interviews conducted by NatCen Social Research on behalf of the ESS in the UK, Austria, Poland and Spain in May-June 2015 (NatCen Social Research, 2015). Ten respondents in each country were asked the ancestry item as it was fielded in ESS Round 7, together with some other ESS questions, by specially trained interviewers. Respondents were encour-aged to think aloud regarding how they arrived at their answer and were probed on specific aspects of the question including what they understood by the term ‘ancestry’ and how they selected their cho-sen response category. Respondents were selected to ensure a good spread on age, gender and educa-tion and to include at least some respondents from a minority ethnic group (5 in the UK, 3 in Poland and Austria and 1 in Spain).
It was reported that participants from all countries generally found this question easy to answer. Within each country there were a few participants who hesitated or changed their answers. However this mainly involved respondents questioning whether countries not listed on the showcard were valid answers (i.e. whether they could give an ‘other’ response) and a few respondents hesitating over the meaning of ‘ancestry’ (and its respective translations) during the think aloud exercise. The hesitation over the ‘other’ category suggests that this option may need to be emphasised more on the showcard.
Participants generally understood the term ‘ancestry’ as referring to their place of birth (which wasn’t intended) or where their parents (also unintended) or grandparents were from (see Table 1 below). Respondents also mentioned ‘roots’ or ‘heritage’ and who they were descended from i.e. suggesting
Developing a Measure of Socio-cultural Origins for the European Social Survey 15
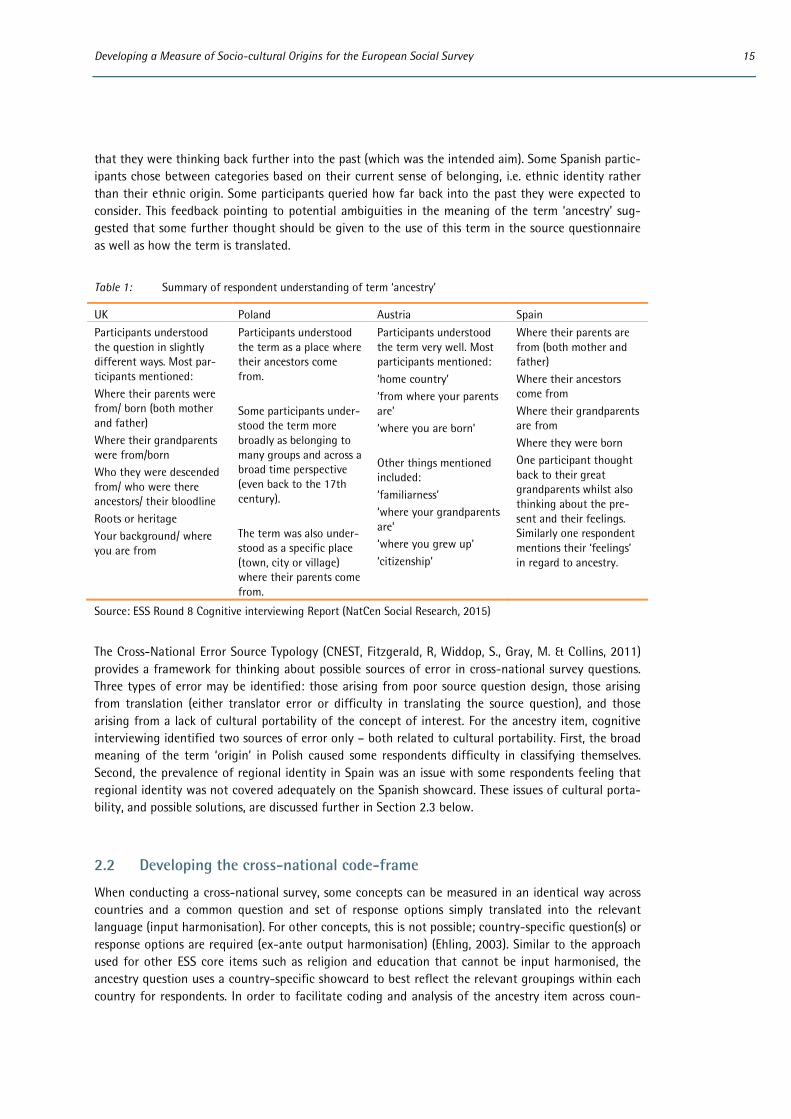
that they were thinking back further into the past (which was the intended aim). Some Spanish partic-ipants chose between categories based on their current sense of belonging, i.e. ethnic identity rather than their ethnic origin. Some participants queried how far back into the past they were expected to consider. This feedback pointing to potential ambiguities in the meaning of the term ‘ancestry’ sug-gested that some further thought should be given to the use of this term in the source questionnaire as well as how the term is translated.
Table 1: Summary of respondent understanding of term ‘ancestry’
UK Poland Austria Spain Participants understood the question in slightly different ways. Most par-ticipants mentioned: Where their parents were from/ born (both mother and father) Where their grandparents were from/born Who they were descended from/ who were there ancestors/ their bloodline Roots or heritage Your background/ where you are from
Participants understood the term as a place where their ancestors come from. Some participants under-stood the term more broadly as belonging to many groups and across a broad time perspective (even back to the 17th century). The term was also under-stood as a specific place (town, city or village) where their parents come from.
Participants understood the term very well. Most participants mentioned: ‘home country’ ‘from where your parents are’ ‘where you are born’ Other things mentioned included: ‘familiarness’ ‘where your grandparents are’ ‘where you grew up’ ‘citizenship’
Where their parents are from (both mother and father) Where their ancestors come from Where their grandparents are from Where they were born One participant thought back to their great grandparents whilst also thinking about the pre-sent and their feelings. Similarly one respondent mentions their ‘feelings’ in regard to ancestry.
Source: ESS Round 8 Cognitive interviewing Report (NatCen Social Research, 2015)
The Cross-National Error Source Typology (CNEST, Fitzgerald, R, Widdop, S., Gray, M. & Collins, 2011) provides a framework for thinking about possible sources of error in cross-national survey questions. Three types of error may be identified: those arising from poor source question design, those arising from translation (either translator error or difficulty in translating the source question), and those arising from a lack of cultural portability of the concept of interest. For the ancestry item, cognitive interviewing identified two sources of error only – both related to cultural portability. First, the broad meaning of the term ‘origin’ in Polish caused some respondents difficulty in classifying themselves. Second, the prevalence of regional identity in Spain was an issue with some respondents feeling that regional identity was not covered adequately on the Spanish showcard. These issues of cultural porta-bility, and possible solutions, are discussed further in Section 2.3 below.
2.2 Developing the cross-national code-frame
When conducting a cross-national survey, some concepts can be measured in an identical way across countries and a common question and set of response options simply translated into the relevant language (input harmonisation). For other concepts, this is not possible; country-specific question(s) or response options are required (ex-ante output harmonisation) (Ehling, 2003). Similar to the approach used for other ESS core items such as religion and education that cannot be input harmonised, the ancestry question uses a country-specific showcard to best reflect the relevant groupings within each country for respondents. In order to facilitate coding and analysis of the ancestry item across coun-
16 GESIS Papers 2016|16
tries, country-specific variables must then be recoded into a common, harmonised code-frame and the harmonised variable(s) made available to analysts as part of the integrated data file.
The code-frame was initially based on the one developed for the measurement of cultural and ethnic groups used by the Australian Bureau of Statistics (ABS, 2011). This contains a long and detailed list of 4-digit unit groups and is regularly updated, reflecting the developing backgrounds of the Australian population. The Australian classification also provides aggregations into 9 broad (1-digit) and 28 narrow (2-digit) composite groups. Such aggregations may be important for analysts who wish to have larger numbers of respondents in each category for statistical analysis.
The Australian classification needed, however, to be adapted to the comparative European context both with respect to the unit groups identified and with respect to the aggregations into broad and narrow groups. A new European Standard Classification of Cultural and Ethnic Groups (ESCEG) was therefore developed for the ESS (for further details, see Schneider & Heath, 2016). According to the Best Practice Guidelines for developing international statistical classifications by the United Nations, ‘Statistical classifications group and organise information meaningfully and systematically, usually in exhaustive and structured sets of categories that are defined according to a set of criteria for similari-ty’ (Hancock, 2013). ESCEG aggregates socio-cultural groups on the basis of cultural similarity rather than just geographic similarity. In many cases, socio-cultural similarity and geographical propinquity go together because of the diffusion of cultures to geographically proximate regions, but this is not an invariable rule. Moreover, because ethnic groups can emerge as a result of a variety of different as-pects of culture, there is no one single cultural criterion which is a necessary or sufficient condition for the formation of an ethnic group. Therefore a range of criteria needs to be taken into account to achieve a classification decision with respect to any individual ethnic or cultural group. In developing ESCEG the criteria we drew upon were (1) a long shared history which is kept alive (thus constituting a shared heritage), (2) religion, since religious communities and traditions are a notable element of his-tory that shape family and social customs, (3) language, which is the most important medium for sus-taining and transferring culture (including history, religion and customs) across generations and geo-graphic distances, (4) social distance (as reflected in marriage or friendship patterns), which can also become the basis of the emergence of wider ‘pan-ethnic’ groups (Okamoto & Mora, 2014).
The classification has four levels which are discussed in more detail below:
• Broad (1-digit) groups largely but not exclusively corresponding to broad geographic regions (e.g. Europe)
• Narrow (2-digit) groups often but not always synonymous with geographic proximity (e.g. West European)
• Cultural or ethnic unit (4-digit) groups which represent national groups (e.g. Belgian, Polish) or ethnic or cultural groups which extend beyond national borders (e.g. Basque, Roma, Silesi-an)
• Sub-national (5-digit) groups which distinguish between within-country regional or minority indigenous groups (e.g. Walloon, Swedish-speaking Finns etc.).
Experience in ESS Round 7 highlighted some limitations in the first iteration of the ESCEG developed prior to ESS Round 7 fieldwork. This included inconsistencies in the way sub-national groups were represented and some missing national and sub-national codes (see section 2.3 for further detail). A revised version of the code-frame has since been produced (see section 4.2). Rather than wait until ESS Round 8, it was decided to amend the code- frame prior to the release of the ESS Round 7 ancestry variables to ensure the best possible data was made available to data users and maximises continuity with future ESS rounds. The revised code-frame is available in Appendix 11 of the survey documenta-tion (Norwegian Centre for Research Data, 2016a).
Developing a Measure of Socio-cultural Origins for the European Social Survey 17
2.2.1 Broad groups (1st digit)
Following the ABS system, the first broad level of classification, while predominantly based on geogra-phy sometimes deviates from geographical groupings in order to classify groups based on socio-cultural similarity. For pragmatic reasons, we felt that no more than 9 categories would be useful. In the European context we felt it was justified to combine the Australian/New Zealand and North Amer-ican groups on the basis of their shared European heritage and English language, but to maintain a separate Latin American broad group (this has been shown to be a major and distinct pan-ethnic group in the USA for example).
2.2.2 Narrow groups (2nd digit)
The list of narrow groups used in the Australian classification needed to be modified in order to make it more useful in a European context. For example, the Australian classification had a separate narrow group for British, another for Irish, but then put all other West European groups into a single narrow group. This would be insufficient – and too Anglo-centric – for use in the ESS or other European sur-veys.
The Australian list of narrow groups also appeared to be based largely on geographical principles with geographically-neighbouring unit groups being placed in the same narrow group, even if they were culturally very dissimilar. For example, Mauritians were included in the Southern and Eastern African narrow group, even though most Mauritians are of Asian (predominantly Indian), not African, heritage. Our principle was to group units into culturally-similar narrow groups with some degree of shared heritage. The aim was to maximize within-narrow group cultural homogeneity, which is most relevant for explanatory purposes, rather than combining disparate cultural and ethnic groups which happen to be geographically proximate.
As new evidence becomes available about inter-ethnic socio-cultural relations and emerging pan-ethnic groupings, adjustments will no doubt need to be made. Providing the 4-digit unit groups re-main, different aggregations can be compared both over time and between scholars. It would thus be possible to revise the narrow group classification between ESS rounds without compromising compa-rability. Table 2 shows both broad and narrow groups of the classification.
18 GESIS Papers 2016|16
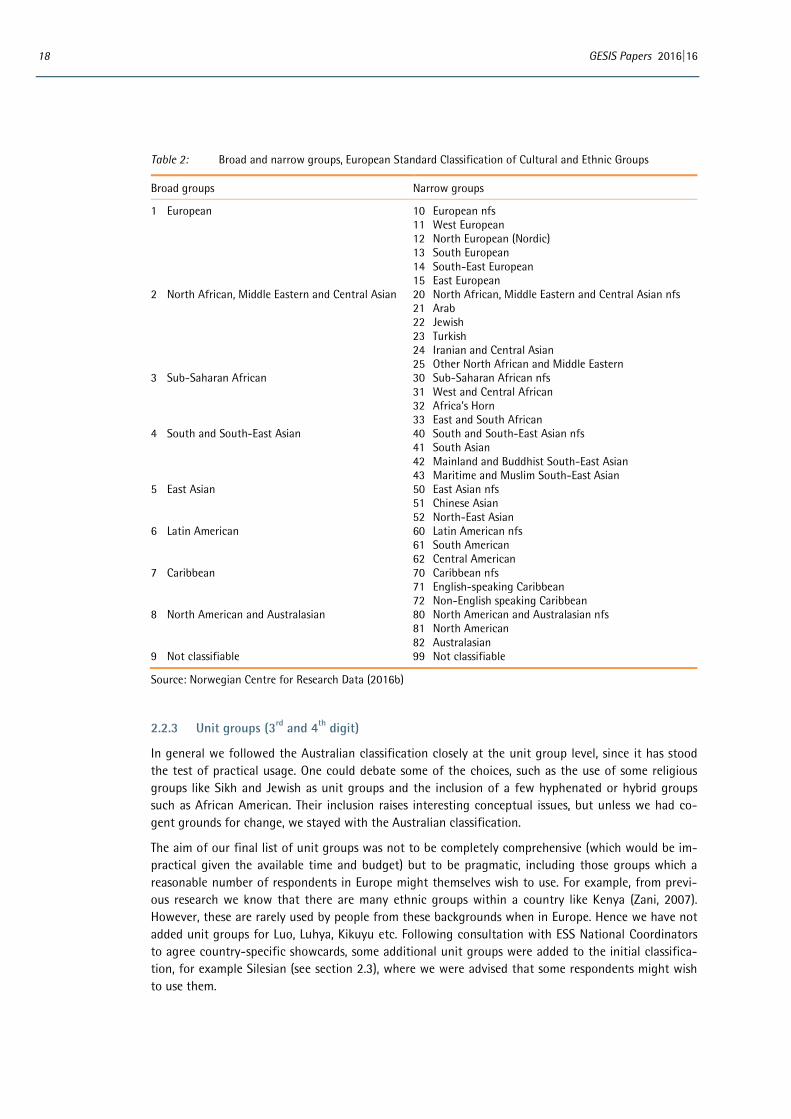
Table 2: Broad and narrow groups, European Standard Classification of Cultural and Ethnic Groups
Broad groups Narrow groups
1 European 10 European nfs 11 West European 12 North European (Nordic) 13 South European 14 South-East European 15 East European 2 North African, Middle Eastern and Central Asian 20 North African, Middle Eastern and Central Asian nfs 21 Arab 22 Jewish 23 Turkish 24 Iranian and Central Asian 25 Other North African and Middle Eastern 3 Sub-Saharan African 30 Sub-Saharan African nfs 31 West and Central African 32 Africa’s Horn 33 East and South African 4 South and South-East Asian 40 South and South-East Asian nfs 41 South Asian 42 Mainland and Buddhist South-East Asian 43 Maritime and Muslim South-East Asian 5 East Asian 50 East Asian nfs 51 Chinese Asian 52 North-East Asian 6 Latin American 60 Latin American nfs 61 South American 62 Central American 7 Caribbean 70 Caribbean nfs 71 English-speaking Caribbean 72 Non-English speaking Caribbean 8 North American and Australasian 80 North American and Australasian nfs 81 North American 82 Australasian 9 Not classifiable 99 Not classifiable
Source: Norwegian Centre for Research Data (2016b)
2.2.3 Unit groups (3rd and 4th digit)
In general we followed the Australian classification closely at the unit group level, since it has stood the test of practical usage. One could debate some of the choices, such as the use of some religious groups like Sikh and Jewish as unit groups and the inclusion of a few hyphenated or hybrid groups such as African American. Their inclusion raises interesting conceptual issues, but unless we had co-gent grounds for change, we stayed with the Australian classification.
The aim of our final list of unit groups was not to be completely comprehensive (which would be im-practical given the available time and budget) but to be pragmatic, including those groups which a reasonable number of respondents in Europe might themselves wish to use. For example, from previ-ous research we know that there are many ethnic groups within a country like Kenya (Zani, 2007). However, these are rarely used by people from these backgrounds when in Europe. Hence we have not added unit groups for Luo, Luhya, Kikuyu etc. Following consultation with ESS National Coordinators to agree country-specific showcards, some additional unit groups were added to the initial classifica-tion, for example Silesian (see section 2.3), where we were advised that some respondents might wish to use them.
Developing a Measure of Socio-cultural Origins for the European Social Survey 19
2.2.4 Sub-national groups (5th digit)
The ESCEG includes one important addition compared with the Australian conceptual scheme. The 4-digit unit groups generally refer to national groups. We added a fifth digit for internal differentiation, e.g. between Flemish and Walloon within the Belgian unit group. Our principle here was that groups such as Basques or Frisians which are to be found in different neighbouring countries would be as-signed a unit group of their own, whereas groups which were restricted to a single country would be identified by a fifth digit within an existing unit group. This provides a flexible way of adding new internal distinctions without upsetting the main classification (thus Luo or Kikuyu for example could if needed be added as subdivisions within the Kenyan unit group.)
2.3 Implementing the item cross-nationally
This section discusses the implementation of the ancestry item in ESS Round 7 across participating countries. It considers the challenges associated with implementing the source question in an equiva-lent way cross-nationally and examines how well the process of translation, ex-ante harmonisation using country-specific showcards and mapping to a common harmonised code-frame worked in prac-tice. It also provides feedback on how easy or difficult the national teams and (where available) field agencies and interviewers found the item to implement. The discussion draws on the consultations with national teams that took place during preparations for Round 7 fieldwork. It also provides feed-back from an online questionnaire administered to National Coordinators after the end of fieldwork.
2.3.1 Translation
Translation of the ancestry item followed the usual ESS TRAPD methodology - Translation, Review, Adjudication, Pretesting and Documentation (European Social Survey, 2014b). Translators were given the following annotation to assist in translating the term ‘ancestry’: ‘ancestry in the sense of ‘descent’ or ‘origins’’. Relatively few issues with the translation of the term ‘ancestry’ were raised during field-work preparations and most National Coordinators reported that translation of this item was straight-forward. In reviewing the translations used, it appears that the approach to translation differed slight-ly across countries though:
In some languages a direct equivalent of the English term ‘ancestry’ was available. In other languages (e.g. Spanish, Estonian) it was felt that the term ‘ancestry’ was too formal
and/or had connotations with nobility and the aristocracy. Alternative terms which emphasised kinship or family ties were preferred.
Many countries used the word ‘origins’ which was consistent with the translation annotation. However, as was found to be the case during cognitive interviewing e.g. in Poland (see section 2.1.4), the term may be problematic because of the breadth with which it can be interpreted: it could refer to ethnic, class, local geographic, national or family origins. Translators were advised not to be more specific and restrict attention e.g. to national or ethnic origin only.
To avoid possible confusion over what was meant by the term ‘origins’, e.g. to avoid people think-ing about their home town or locale, the phrase ‘family origins’ was used in the Spanish, Catalan, Italian, French and Swiss German translations (though not in Germany or Austria where the term ‘Herkunft’ - which refers to general origins - was used in isolation).
Variety in translation need not necessarily be a problem; countries are asked to translate the question so that the meaning is equivalent to the source question, not necessarily to provide a word for word translation. However, it is worth considering whether the translations used in these cases are indeed equivalent. The fact some countries are specifying ‘family origins’ and other countries simply use the broader term ‘origins’ – with its potentially greater ambiguity, e.g. potentially referring to respondents’ own rather than ancestors’ affiliation - suggests that translations are not necessarily equivalent.
20 GESIS Papers 2016|16
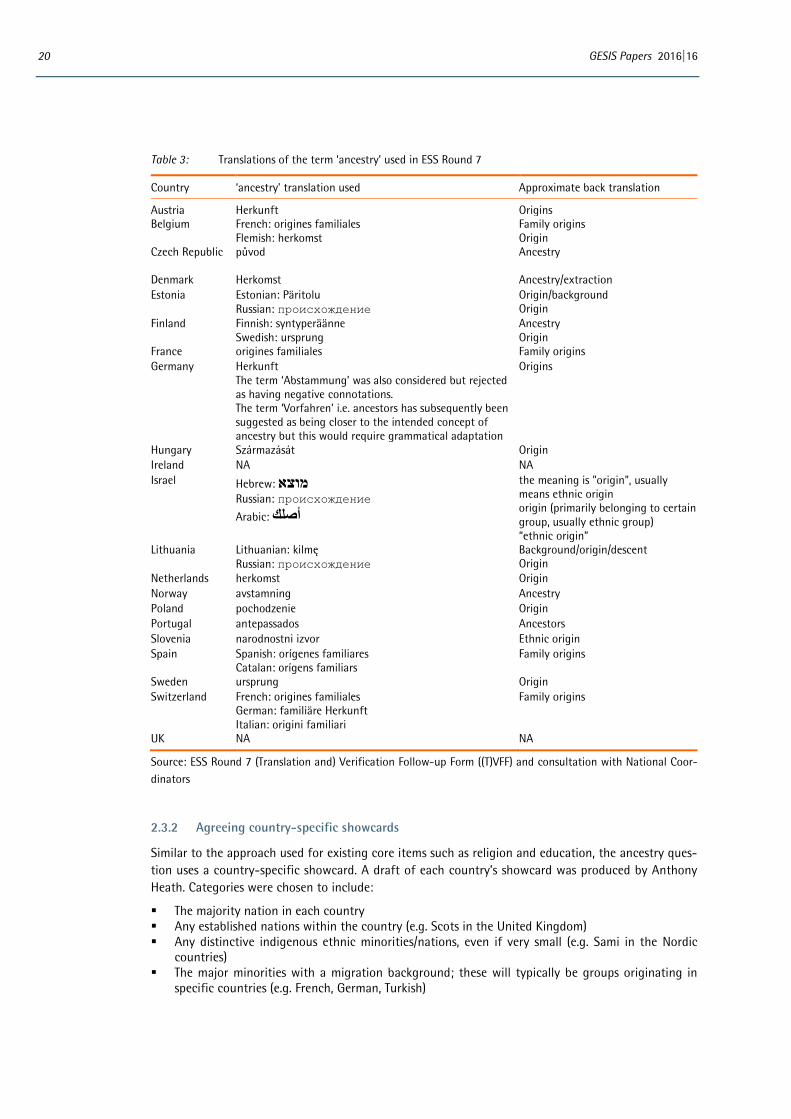
Table 3: Translations of the term ‘ancestry’ used in ESS Round 7
Country ‘ancestry’ translation used Approximate back translation
Austria Herkunft Origins Belgium French: origines familiales
Flemish: herkomst Family origins Origin
Czech Republic původ
Ancestry
Denmark Herkomst Ancestry/extraction Estonia Estonian: Päritolu
Russian: происхождение Origin/background Origin
Finland Finnish: syntyperäänne Swedish: ursprung
Ancestry Origin
France origines familiales Family origins Germany Herkunft
The term ‘Abstammung’ was also considered but rejected as having negative connotations. The term ‘Vorfahren’ i.e. ancestors has subsequently been suggested as being closer to the intended concept of ancestry but this would require grammatical adaptation
Origins
Hungary Származását Origin Ireland NA NA Israel Hebrew: מוצא
Russian: происхождение
Arabic: أصلك
the meaning is "origin", usually means ethnic origin origin (primarily belonging to certain group, usually ethnic group) “ethnic origin”
Lithuania Lithuanian: kilmę Russian: происхождение
Background/origin/descent Origin
Netherlands herkomst Origin Norway avstamning Ancestry Poland pochodzenie Origin Portugal antepassados Ancestors Slovenia narodnostni izvor Ethnic origin Spain Spanish: orígenes familiares
Catalan: orígens familiars Family origins
Sweden ursprung Origin Switzerland French: origines familiales
German: familiäre Herkunft Italian: origini familiari
Family origins
UK NA NA
Source: ESS Round 7 (Translation and) Verification Follow-up Form ((T)VFF) and consultation with National Coor-dinators
2.3.2 Agreeing country-specific showcards
Similar to the approach used for existing core items such as religion and education, the ancestry ques-tion uses a country-specific showcard. A draft of each country’s showcard was produced by Anthony Heath. Categories were chosen to include:
The majority nation in each country Any established nations within the country (e.g. Scots in the United Kingdom) Any distinctive indigenous ethnic minorities/nations, even if very small (e.g. Sami in the Nordic
countries) The major minorities with a migration background; these will typically be groups originating in
specific countries (e.g. French, German, Turkish)
Developing a Measure of Socio-cultural Origins for the European Social Survey 21
Any major divisions within country-of-origin categories (e.g. Kurds or Berbers), even if likely to be very small in number.
All showcards should include an ‘other ancestry’ option. Interviewers should record the ‘other’ answers verbatim.
The showcard was then shared with National Coordinators who were given the opportunity to com-ment and suggest amendments. Amendments were suggested and made to the showcard in all but two countries (Netherlands, Sweden) following consultation with National Coordinators. Mostly these were straightforward and tended to cover similar issues including adding relevant minority groups and replacing some (typically national) groups with others based on prevalence within the population. Questions were sometimes raised about including minority groups (e.g. Ruthenian in Hungary) where numbers are very small. Although insignificant in terms of numbers, the design team argued for re-taining these categories where possible to signal to respondents that they could express their ancestry in other terms than nationality only. The final showcards agreed for each country have been made available alongside the ESS Round 7 edition 2 data at http://www.europeansocialsurvey.org/data/country_index.html.
All country-specific showcards have been reviewed for ESS Round 8 based on feedback from ESS Round 7. Subsequent changes are unlikely to be required round by round but the showcard categories will need to be reviewed periodically to ensure that they still adequately reflect the country’s popula-tion. One issue that has been reviewed for ESS Round 8 is how to include sub-national groups e.g. culturally distinctive regions on the showcard (the related issue of how these sub-national categories should then be mapped to the common code-frame is discussed in the next section). In ESS Round 7 the approach taken was not consistent across countries. Sub-national groups were included as catego-ries on some countries’ showcards (e.g. Switzerland, Spain, Belgium, France) but not others (e.g. Ger-many). To an extent this reflects the greater historical and political salience of (and conflict around) the sub-national level in some countries compared with others. It would not necessarily be appropriate to include regional groups for all countries. Nevertheless, further thought has been given to when and how regional groups are included on countries’ showcards to try and ensure respondents receive a consistent stimulus.
Even in those countries where regional groups were mentioned this was not done consistently. In Spain for example some, but not all, regions were listed separately. In France, a few regions were listed individually and a category for ‘Autres régions françaises’ (other French regions) was provided. In Swit-zerland the category ‘Canton (please specify)’ was used, in addition to categories for the three lan-guage regions. Ideally a consistent approach should be taken across countries.
The showcards were quite long in some countries and, based on the distribution of responses in ESS Round 7, there may be possibilities for shortening them in some countries (see Appendix 6.1). Howev-er, in general there is no evidence that the cards were problematic for respondents. Categories were ordered so that the majority national group appeared first, followed by the main indigenous groups, followed by non-indigenous groups in alphabetical order. This generally seemed to make sense to respondents but did cause an issue for translation. Some countries included categories alphabetically according to the English source showcard whilst other countries ordered the categories alphabetically according to the translated version. This risks confusion at the mapping and documentation stages. For ESS Round 8, therefore, clearer guidance was given to National Coordinators on how to order catego-ries on the showcard, namely following their order in the code-frame of the ESCEG (see section 2.2). This avoids confusion over alphabetical order and should also be easy for respondents to navigate as it means that culturally (and, to some degree, geographically) proximate categories will be close to each other on the showcard.
22 GESIS Papers 2016|16
2.3.3 Mapping to the harmonised code-frame
Again, following a similar approach to that which is used with other ESS background variables, once the country-specific showcard was signed off, national teams were asked to demonstrate how the country-specific codes mapped onto the common code-frame ESCEG (see section 2.2). This was done using a simple spreadsheet template. A document showing how the country-specific showcards are mapped to the common code-frame was made available in Appendix 11 of the survey documentation (Norwegian Centre for Research Data, 2016a).
The mapping was mostly straightforward as there was usually a one to one correspondence between the categories on the showcards and the categories in the code-frame. However, this was not always the case. As the ESS Round 7 country consultation progressed it became clear that there were some gaps in the original code-frame.5 These have subsequently been rectified (see section 4.2).
Only the harmonised variables were included in the published datasets made available via the ESS website. The country-specific variables deposited with the ESS Data Archive based at NSD (the Norwe-gian Centre for Research Data) are retained and could potentially be made available to data users on request. However, it is not considered necessary to make the large number of country-specific varia-bles available as part of the main datasets. Due to its detailed nature, the harmonised variables con-tains as much, if not more, information as the country-specific variables given that ‘other’ responses are post-coded into the harmonised variables whilst being retained as ‘other’ in the country specific source variables. The ESCEG is constructed in such a way as to minimize the aggregation of country-specific categories.
2.3.4 Feedback from the field
There were several opportunities for countries to gather feedback on how well the items worked for interviewers and respondents in the field. Each ESS country carries out a national pre-test of between 30 and 50 cases before mainstage fieldwork to check the translation and administration of the ques-tionnaire in their country. Depending on the country, pre-test interviews may also be observed by the National Coordinator and/or involve an element of respondent or interviewer debrief. During and after mainstage fieldwork many National Coordinators also ask survey agencies to report back on any items that may have caused problems in the field.
Generally speaking, national pre-testing did not flag any issues with the ancestry item and it was re-ported that the item worked well. There was also no evidence of the ancestry item being problematic to administer during mainstage fieldwork. A couple of countries (Israel, Slovenia, UK) did mention that some respondents were disappointed not to be able to give more than two ancestries but this does not appear to have been a widespread problem. A couple of countries specifically mentioned that they had spent some time in interviewer briefings going through the ancestry item, explaining to interviewers how to use the showcard and the option to code one or two ancestries.
5 For example, some unit groups appearing on country-specific showcards (e.g. Silesian in Poland and the Czech
Republic) did not have a corresponding category in the ESCEG and risked having to be coded in a 2nd digit ‘East European nec’ category which at best meant loss of detail and at worse risked inconsistent or inappropriate classifications. Experience also highlighted some inconsistencies in the extent to which a fifth digit classifica-tion was available for sub-national groups. For example, in Belgium separate codes were originally available for Flemish and Walloon but not Brusselian (which had initially to be coded as ‘Belgian‘ or ‘West European nec’ in the harmonised variable). In Spain an issue arose from having separate codes for Catalan and Galician but no other autonomous regions, some of which were, however, itemised on the showcard.
Developing a Measure of Socio-cultural Origins for the European Social Survey 23
2.3.5 Burden for National Coordinators
The addition of a new variable which uses country-specific showcards and thus requires ex-ante out-put harmonisation generates additional work for National Coordinators, who already have many tasks to complete pre- and post-fieldwork. We were therefore keen to ensure that the additional work in-volved in administering the item did not place an undue burden on National Coordinators, especially if the item is repeated in ESS round 8 or included in the core.
Feedback from National Coordinators was largely positive and they reported that the ancestry item was not unduly problematic or time consuming to implement. Several National Coordinators were keen to see evidence that the inclusion of the ancestry item was justified by it providing information and insights over and above those already provided by existing core items on respondent and parents’ country of birth (see section 3.5 of this report for first evidence on this). It was noted that agreeing on the translation of the term ‘ancestry’ had been time consuming. However, as the translation can, in most cases, be reused, this shouldn’t be a problem in future rounds. Similarly, it was noted that agree-ing on the showcard categories (e.g. researching the size of different groups in the country) had been time consuming but also noted that this was likely to be a one-off investment as, although categories would need to be reviewed periodically, it was likely that the showcard would not change much from round to round. There were few reports of finding the process of mapping the country specific varia-bles to the harmonised code-frame or post-coding ’other’ responses time consuming.
Given that National Coordinators did not report finding the task burdensome, there were few sugges-tions for how the process could be improved or streamlined in future rounds. National Coordinators were generally happy for the item to be implemented in future rounds in the same way as in ESS Round 7. One suggestion was to provide National Coordinators with scripts to speed up the process of coding country-specific variables into harmonised variables.
2.3.6 Anonymization
The final ESS datasets made freely available to data users via the website must contain anonymised data. The detailed code-frame used with the ancestry item and the fact that there may only be a few respondents in certain categories raises the question of whether the variable could potentially be disclosive and lead to respondents being indirectly identifiable. Even if this is not a problem for the ancestry variable when considered in isolation, there may be an issue when the ancestry variable is considered in combination with other variables with very detailed code-frames such as respondents’ or parents’ country of birth, occupation etc. The files containing verbatim responses are also potentially identifiable but there are already procedures in place for dealing with such files (i.e. files which are deposited with the ESS Data Archive but not published) and this does not pose any new issues.
The decision on whether and how to anonymise variables rests with countries depositing data. In ESS Round 7 very few countries took steps to anonymise the ancestry variables before depositing the main data file. In most cases the lack of geographic or direct identifiers in the main data file was considered sufficient anonymization. Information on what anonymization has been done – and how – was col-lected as part of the National Technical Summary and is reported in the ESS-7 2014 Documentation Report (ESS ERIC, 2016). Norway deposited variables which distinguish ‘Norwegian’ and ‘Swedish’ at unit level but report all other groups aggregated to 1st digit level. The UK has also voiced some con-cerns about the possibly disclosive nature of variables, including ancestry, which employ detailed code-frames, and recoded a number of substantive responses to ‘no answer’ (code 999999).
For ESS Round 8 clearer guidelines will be issued to countries concerned about disclosure and not wishing to use 5-digit codes for rarely occurring categories. One advantage of the ESCEG as it has been developed is that, although very detailed and potentially disclosive when coded to the five-digit
24 GESIS Papers 2016|16
level, the hierarchical nature of the code-frame means that there are clear guidelines for collapsing categories should this be necessary for disclosure control. We would recommend to only aggregate to the digit necessary for anonymization – and not by default to the 1st digit (as for example was done in Norway).
2.3.7 Other issues
There was some confusion amongst national teams in ESS Round 7 over how country-specific and harmonised versions of the variables should be treated and the format in which they should be depos-ited with the ESS Data Archive (some countries post-coded ‘other’ responses in both versions of the variables for example). Clearer guidance was offered to participating countries in ESS Round 8 to min-imise the effort required from the countries and from the ESS Data Archive.
The inclusion of the ancestry item – and data protection concerns raised by requesting this infor-mation as part of a survey – led to one country (France) being denied access to the population register held by the national statistical office for sampling purposes. France therefore had to use a random route sampling procedure rather than a named individual sample which added to fieldwork burden and – because of difficulties in accessing buildings for enumeration – may have adversely affected the quality of the sample. Difficulties with obtaining the register were exacerbated in ESS Round 7 be-cause the rotating module on immigration was also deemed to be sensitive. However, gaining access to the sample frame is likely to pose difficulties in France even if the ancestry item is fielded in the ab-sence of the immigration module. If this remains an isolated case then it should not influence a deci-sion on the item (which could, if necessary, be excluded in France).
2.4 Summary
A review of the process by which the new ancestry item was developed, tested and implemented in ESS Round 7 suggests that the item is generally fit for purpose and it is feasible to field the item in future rounds of the ESS. Quantitative and qualitative pre-testing in a range of countries demonstrat-ed that respondents generally appear to understand the question and are able to provide answers without too much difficulty, and there is no evidence from ESS Round 7 that the item caused difficul-ties for respondents or interviewers in the field. Although it requires country-specific showcards and post-coding to the harmonised code-frame, National Coordinators did not find the ancestry item burdensome to implement and would generally be happy to see it repeated in future rounds.
Nevertheless, the process evaluation also highlighted important issues, mainly in relation to imple-menting the item cross-nationally. Firstly, cognitive interviewing reveals some variation in the way the term ‘ancestry’ or the respective translated term was understood. The problem was exacerbated in some countries because the translated term ‘origins’ has broader connotations than ‘ancestry’. The term ‘ancestry’ was translated in slightly different ways in different countries and these variants can-not necessarily be viewed as equivalent. Second, the treatment of sub-national groups on showcards and in the harmonised code-frame is a complex issue. The evaluation revealed that this was not always done consistently across countries in ESS Round 7. Both these issues have been addressed for ESS Round 8 (see Chapter 4). Finally, concerns about data protection led to a small number of countries depositing highly aggregated measures of ancestry, thereby limiting the usefulness of these variables for subsequent analysis. The possibility of providing further guidance on how anonymization should be carried out so as to minimise data loss could be considered.
Developing a Measure of Socio-cultural Origins for the European Social Survey 25
3 Output quality: Evaluation of country data and derived variables
In this chapter, we use the data collected during ESS Round 7 to evaluate the data quality of the new ancestry measure. We thereby also respond to specific questions that were asked during the question-naire development process, namely:
How much missing data do we find for this item? Do we need to provide two response options for ancestry, or is one sufficient? Are there difficulties coding ‘other’ ancestries not provided on the show card into the harmonised
code-frame? Is it necessary to offer this option? How can the resulting variables be prepared for and used in analysis? Does the information on ancestry give us any information beyond what we already know from
other indicators of socio-cultural background?
One argument for including the ancestry variable in the ESS core questionnaire is its potential rela-tionship with a number of other core ESS variables. These include but are not limited to: subjective wellbeing, strength of national identity, attitudes to immigration, and political participation or affilia-tion. However, assessing these relationships is beyond the scope of this evaluation. The true analysis potential of the variables will emerge over time. The use of the ESS ancestry variables in analysis and publications should thus be monitored.
This chapter relies on survey data from the 21 countries included in the ESS 7 second data release (ed. 2.0, released May 26th, 2016): Austria (AT), Belgium (BE), Switzerland (CH), Czech Republic (CZ), Ger-many (DE), Denmark (DK), Estonia (EE), Finland (FI), France (FR), Hungary (HU), Ireland (IE), Israel (IL), Lithuania (LT), Netherlands (NL), Norway (NO), Poland (PL), Portugal (PT), Spain (ES), Sweden (SE), Slo-venia (SI) and the United Kingdom (GB). Much analysis is conducted using the final harmonised ver-sions of the ancestry variables available in the public datasets.6 However, where appropriate e.g. to conduct detailed explorations of item non-response, ‘other’ responses or country-specific distributions, we use the original versions of the country-specific variables deposited with the ESS Data Archive (and made available to the authors under special license).
3.1 Non-substantive responses: ‘don’t know’, ‘refusal’ and ‘no answer’
Item nonresponse was analysed using country-specific (i.e. source) variables anc1xx and anc2xx (with xx representing the country code) rather than the final harmonised variables in the published dataset. In the final harmonised variables the ‘no answer’ code sometimes was used for different purposes (e.g. anonymization in the case of GB). In order to get as clear a picture as possible of patterns of item nonresponse generated during fieldwork (rather than via subsequent data processing) we therefore use the country-specific variables. As Table 4 shows, responses such as ‘don’t know’, ‘refusal’ and ‘no an-swer’ are not prevalent in the ancestry items, especially not on the first ancestry item. Thus it does not seem to be a problematic item in terms of whether respondents mind being asked about their ances-try, or have difficulty responding in general. Only in Israel a sizeable but still small number of respond-ents refused to indicate their ancestry.
6 The original evaluation report used to inform decisions about inclusion of the ancestry variables in ESS Round
8 had to rely on draft data from the 15 countries included in the ESS first data release and available prior to the finalisation of the ESS Round 8 Source Questionnaire in March 2016. Findings were very similar to those presented here using the ed. 2.0 data.
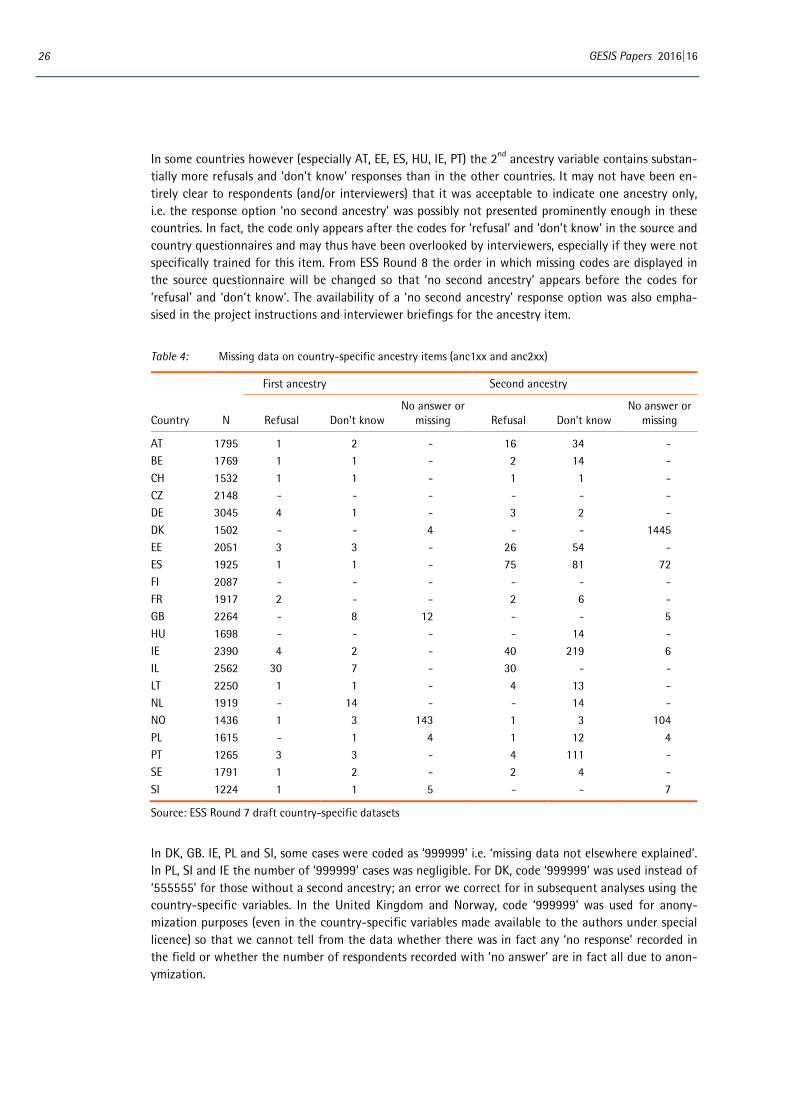
26 GESIS Papers 2016|16
In some countries however (especially AT, EE, ES, HU, IE, PT) the 2nd ancestry variable contains substan-tially more refusals and ‘don’t know’ responses than in the other countries. It may not have been en-tirely clear to respondents (and/or interviewers) that it was acceptable to indicate one ancestry only, i.e. the response option ‘no second ancestry’ was possibly not presented prominently enough in these countries. In fact, the code only appears after the codes for ‘refusal’ and ‘don’t know’ in the source and country questionnaires and may thus have been overlooked by interviewers, especially if they were not specifically trained for this item. From ESS Round 8 the order in which missing codes are displayed in the source questionnaire will be changed so that ‘no second ancestry’ appears before the codes for ‘refusal’ and ‘don’t know’. The availability of a ‘no second ancestry’ response option was also empha-sised in the project instructions and interviewer briefings for the ancestry item.
Table 4: Missing data on country-specific ancestry items (anc1xx and anc2xx)
First ancestry Second ancestry
Country N Refusal Don’t know No answer or
missing Refusal Don’t know No answer or
missing
AT 1795 1 2 - 16 34 - BE 1769 1 1 - 2 14 - CH 1532 1 1 - 1 1 - CZ 2148 - - - - - - DE 3045 4 1 - 3 2 - DK 1502 - - 4 - - 1445 EE 2051 3 3 - 26 54 - ES 1925 1 1 - 75 81 72 FI 2087 - - - - - - FR 1917 2 - - 2 6 - GB 2264 - 8 12 - - 5 HU 1698 - - - - 14 - IE 2390 4 2 - 40 219 6 IL 2562 30 7 - 30 - - LT 2250 1 1 - 4 13 - NL 1919 - 14 - - 14 - NO 1436 1 3 143 1 3 104 PL 1615 - 1 4 1 12 4 PT 1265 3 3 - 4 111 - SE 1791 1 2 - 2 4 - SI 1224 1 1 5 - - 7
Source: ESS Round 7 draft country-specific datasets
In DK, GB. IE, PL and SI, some cases were coded as ‘999999’ i.e. ‘missing data not elsewhere explained’. In PL, SI and IE the number of ‘999999’ cases was negligible. For DK, code ‘999999’ was used instead of ‘555555’ for those without a second ancestry; an error we correct for in subsequent analyses using the country-specific variables. In the United Kingdom and Norway, code ‘999999’ was used for anony-mization purposes (even in the country-specific variables made available to the authors under special licence) so that we cannot tell from the data whether there was in fact any ‘no response’ recorded in the field or whether the number of respondents recorded with ‘no answer’ are in fact all due to anon-ymization.

Developing a Measure of Socio-cultural Origins for the European Social Survey 27
Unless there is a clear processing error, the original coding of the second ancestry variable as ‘don’t know’ etc. was retained in the published dataset. End-users will then have the option of treating these codes as they deem most appropriate. In all the analyses that follow here, we have recoded ‘don’t know’, ‘refusal’ and ‘no answer’ on the second ancestry variable to ‘no second ancestry’ and use only the first mentioned ancestry in these cases.
3.2 Dual ancestries
In the ESS Round 7 questionnaire a ‘check one or two’ approach was chosen, as a middle ground be-tween ‘check all that apply’ or ‘check one only’ to allow at least some level of dual ancestries to be expressed. Responses are coded and deposited in two separate country-specific ancestry variables, from which two harmonised variables are produced for publication and used in this analysis.
As Table 3 shows, a sizeable number of respondents in most countries chose to indicate two rather than just one ancestry, on average 30.8 per cent. In most cases, as intended, respondents mentioned two different ancestries. However, in AT, ES, FR, PT and SE many respondents selected the same ances-try twice (in BE, EE, IE, IL and NO this happened, too, but only in very few cases). In Sweden this was almost standard. It may be that the procedures for coding second ancestry and/or the available cate-gories (including ‘other’) were not sufficiently clear to interviewers in some countries (see also section 3.1).
For the subsequent analyses presented in this report, a ‘corrected’ 2nd ancestry variable was produced, coding all those indicating the same ancestry twice as not having a 2nd ancestry. Table 5 shows both the percentage of cases indicating two ancestries in the original source variables anctry1 and anctry2 and the ‘corrected’ variable after recoding anctry2 to 555555 if the same ancestry was mentioned as in anctry1. After taking the double mentions into account, 23 per cent of respondents across countries mention two ancestries. There is a large degree of variation across countries, with countries allowing for large established minority and/or regional cultural groups in their response categories (BE, CH, CZ, EE, ES, FR, GB, IL) showing more dual ancestries than countries not allowing for such groups (AT, DE, DK, IE, NL, NO, SE, SI). Israel is a somewhat special case because of the inseparable character of reli-gious group and national or ethnic group, where a lot of the dual ancestries are not actually due to mixed ancestry but rather provision of non-exclusive categories on the showcard such as Arab and Muslim or Jewish and Israeli, which was regarded as unavoidable.
As already mentioned in section 2.1.2, what respondents mention as first and what as second ancestry cannot be explained by people’s prioritisation of ancestries. From the ESS Round 7 data it also appears that the first variable tends to code the answer higher up on the show card and the second variable the code further down on the show card. Survey country ancestry was always at the top of the show card. This means that, for those who reported dual ancestries, categories further down the alphabet tend to be found in the second item. We cannot differentiate between a prioritization and category order effect. Therefore, if two ancestries are mentioned, these are not to be understood as hierarchical. For analysis both items thus always need to be considered for every respondent, or derived variables coded in such a way that they take both ancestries into account and apply theoretically guided rules for coding individuals with dual ancestries. (For some ideas on derived variables and their usage for dual ancestries see section 3.4.)
Does this design of allowing two rather than just one ancestry pay off substantively, i.e. is this infor-mation interesting and relevant? We would strongly argue that it is. For those with dual ancestries, one ancestry is often linked to the survey country or national majority while the other ancestry more often refers to a foreign ancestry or national minority/sub-national ancestry, which are given in addi-tion to the national majority ancestry. Researchers often want to know either whether respondents
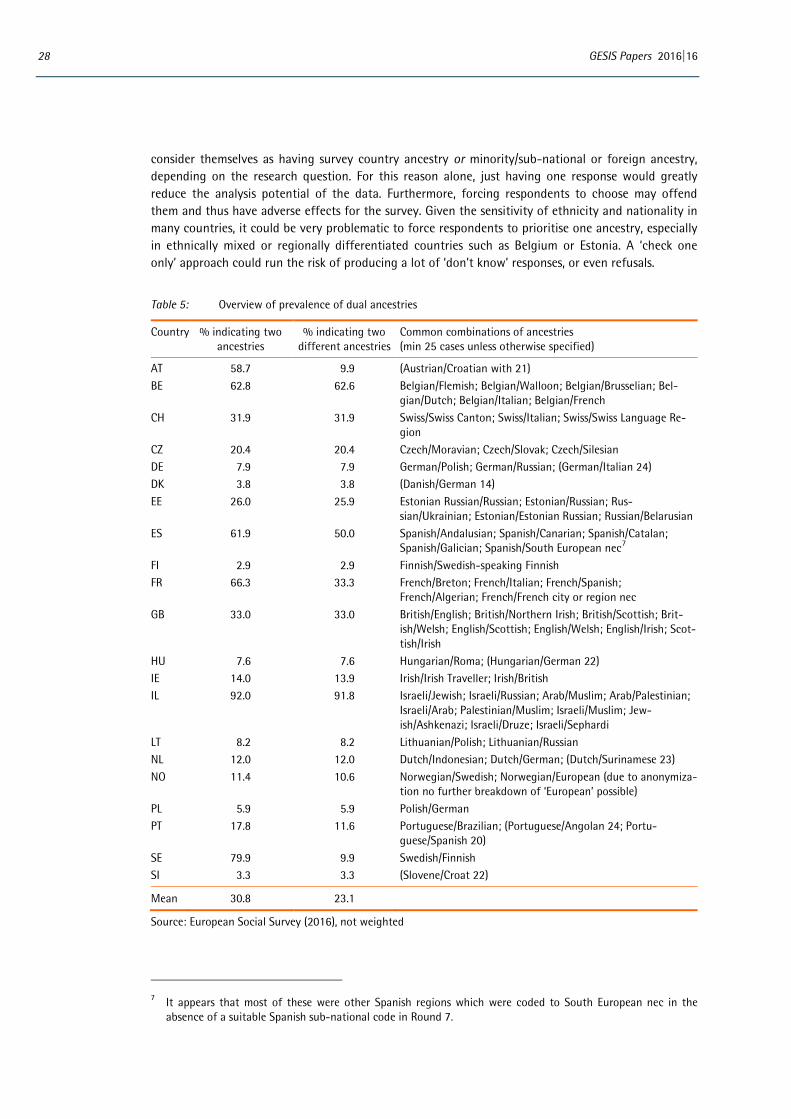
28 GESIS Papers 2016|16
consider themselves as having survey country ancestry or minority/sub-national or foreign ancestry, depending on the research question. For this reason alone, just having one response would greatly reduce the analysis potential of the data. Furthermore, forcing respondents to choose may offend them and thus have adverse effects for the survey. Given the sensitivity of ethnicity and nationality in many countries, it could be very problematic to force respondents to prioritise one ancestry, especially in ethnically mixed or regionally differentiated countries such as Belgium or Estonia. A ‘check one only’ approach could run the risk of producing a lot of ‘don’t know’ responses, or even refusals.
Table 5: Overview of prevalence of dual ancestries
Country % indicating two ancestries
% indicating two different ancestries
Common combinations of ancestries (min 25 cases unless otherwise specified)
AT 58.7 9.9 (Austrian/Croatian with 21) BE 62.8 62.6 Belgian/Flemish; Belgian/Walloon; Belgian/Brusselian; Bel-
gian/Dutch; Belgian/Italian; Belgian/French CH 31.9 31.9 Swiss/Swiss Canton; Swiss/Italian; Swiss/Swiss Language Re-
gion CZ 20.4 20.4 Czech/Moravian; Czech/Slovak; Czech/Silesian DE 7.9 7.9 German/Polish; German/Russian; (German/Italian 24) DK 3.8 3.8 (Danish/German 14) EE 26.0 25.9 Estonian Russian/Russian; Estonian/Russian; Rus-
sian/Ukrainian; Estonian/Estonian Russian; Russian/Belarusian ES 61.9 50.0 Spanish/Andalusian; Spanish/Canarian; Spanish/Catalan;
Spanish/Galician; Spanish/South European nec7 FI 2.9 2.9 Finnish/Swedish-speaking Finnish FR 66.3 33.3 French/Breton; French/Italian; French/Spanish;
French/Algerian; French/French city or region nec GB 33.0 33.0 British/English; British/Northern Irish; British/Scottish; Brit-
ish/Welsh; English/Scottish; English/Welsh; English/Irish; Scot-tish/Irish
HU 7.6 7.6 Hungarian/Roma; (Hungarian/German 22) IE 14.0 13.9 Irish/Irish Traveller; Irish/British IL 92.0 91.8 Israeli/Jewish; Israeli/Russian; Arab/Muslim; Arab/Palestinian;
Israeli/Arab; Palestinian/Muslim; Israeli/Muslim; Jew-ish/Ashkenazi; Israeli/Druze; Israeli/Sephardi
LT 8.2 8.2 Lithuanian/Polish; Lithuanian/Russian NL 12.0 12.0 Dutch/Indonesian; Dutch/German; (Dutch/Surinamese 23) NO 11.4 10.6 Norwegian/Swedish; Norwegian/European (due to anonymiza-
tion no further breakdown of ‘European’ possible) PL 5.9 5.9 Polish/German PT 17.8 11.6 Portuguese/Brazilian; (Portuguese/Angolan 24; Portu-
guese/Spanish 20) SE 79.9 9.9 Swedish/Finnish SI 3.3 3.3 (Slovene/Croat 22)
Mean 30.8 23.1
Source: European Social Survey (2016), not weighted
7 It appears that most of these were other Spanish regions which were coded to South European nec in the
absence of a suitable Spanish sub-national code in Round 7.

Developing a Measure of Socio-cultural Origins for the European Social Survey 29
It remains difficult to collect full information about indigenous minorities/sub-national groups at the same time as about immigrant minorities when limiting the number of responses that can be given to two. Countries that have an internal regional differentiation like the UK, Belgium, Switzerland, the Czech Republic or Spain have many individuals reporting both the national level and the sub-national level ancestries. This will limit those respondents’ opportunities to also indicate foreign ancestry, and thus could make the resulting data less comparable across countries. Given that there may be individ-uals wishing to express their ancestry in terms of e.g. the nation state (e.g. Belgian) and the specific region of their ancestors (e.g. Walloon) and to indicate a migrant background (e.g. French) there may be an advantage to allowing respondents to express more than two ancestries. The additional analytic value of a third ancestry should be weighed against the additional burden this may create for data processing and analysis.
3.3 Coding of ‘other’ ancestries in the harmonised variables
To explore the use of the ‘other’ code we combine analysis of the country-specific variables, which indicate how many ‘other’ responses were initially coded in the field, with analysis of the harmonised variables, which indicate how successful countries were in being able to post-code ‘other’ responses into specific categories included in the harmonised code-frame.
Table 6 shows how many ‘other’ ancestries were mentioned, differentiating the first and second ances-try items. The figures recorded under the ‘country-specific variable’ columns in Table 6 show that usage of the write-in option for ‘other ancestries’ differs substantially across countries. IL, LT, SI and PL have negligible usage. For the three latter countries, this is likely linked to their low level of ethnic heterogeneity. For IL, which is highly heterogeneous, this is rather more surprising. In CH, there is the largest number of ‘other’ mentions (almost 10 per cent of the sample), followed closely by GB (first ancestry). This may reflect the large diversity of these countries with little concentration on specific immigrant groups or, alternatively, difficulties with the question and/or categories provided.
In CZ, the response option ‘other ancestry’ was accidentally not included in the questionnaire. In FR, it was included, but verbatim responses not recorded. In GB (for second ancestry), IL and NO, no ‘other’ ancestries are found in the data, for GB and NO this is potentially as a result of anonymization (see section 2.3.6). These cases are marked by using dashes rather than zeros in Table 4.
Some countries have not post-coded the responses to ‘other ancestry’ into the harmonised code-frame (DK, HU, PL; for DK this is included in ed. 2.1 however). Looking at how many of the ‘other’ responses could be coded into the harmonised variable in those countries that performed the coding, DE, FI, IE, LT, PT and SI managed to code all open responses. AT, BE, CH, ES, GB and NL managed to code more than 90 per cent. This suggests that the information provided by respondents saying ‘other’ is of rather good quality and appropriate to the question being asked. Sweden and Estonia are however somewhat lagging behind with 76 per cent and just over 50 per cent respectively successfully-coded ‘other’ an-cestries. The average proportion of ‘other’ ancestries successfully coded is 96 per cent (excluding those countries that did not do any post-coding; including those leads to a success rate of 73 per cent). However, it should be noted that the quality of post-coding is perhaps lower than the ‘success rate’ would suggest. For example, Spain used the generic code ‘South European nec’ in 284 cases (thus three quarters of all ‘other’ ancestries) rather than any more specific codes. This is due to the fact that the original code-frame did not have the generic ‘Spanish city or region nec’ code that was introduced with the revision of the code-frame after fieldwork, and post-coding of open responses was not re-peated after the revision of the code-frame (see also section 2.2).
To gain a better understanding of how the ‘other’ ancestry response option was used by respondents, and by way of illustration, we took a closer look at the coding of verbatim answers for Belgium. This

30 GESIS Papers 2016|16
suggests that respondents were very largely using the ‘other’ code as intended. The majority of the verbatim responses could be coded unproblematically into existing unit groups in the code-frame. Mostly, there were only one or two mentions of particular unit groups, but in two cases (Romanian and Portuguese) the numbers were sufficiently large that they should be considered to be added to the Belgian showcard (see also section 6.1.2; the appendix looks at this for all countries individually).
Table 6: ‘Other’ ancestry on country-specific and harmonised ancestry items (anc1xx, anc2xx, anctry1 and anctry2)
First ancestry Second ancestry
% coded Country N
‘other’ in country-specific variable %
‘other’ in harmo-nised variable
‘other’ in country-specific variable %
‘other’ in harmo-nised variable
AT 1795 65 3.6 0 36 2 1 99 BE 1769 98 5.5 5 42 2.4 4 94 CH 1532 146 9.5 1 75 4.9 6 97 CZ 2148 - - - - - - - DE 3045 106 3.5 0 82 2.7 0 100 DK 1502 53 3.5 53 25 1.7 25 0 EE 2051 18 0.9 7 21 1.0 11 54 ES 1925 111 5.8 6 259 13.5 12 95 FI 2087 29 1.4 0 10 0.5 0 100 FR 1917 70 3.7 70 76 4.0 76 0 GB 2264 203 9.0 16 - - - 92 HU 1698 8 0.5 8 20 1.2 20 0 IE 2390 58 2.4 0 41 1.7 0 100 IL 2562 0 0.0 0 0 0.0 0 - LT 2250 2 0.1 0 0 0.0 0 100 NL 1919 48 2.5 1 55 2.9 7 92 NO 1436 - - - - - - - PL 1615 2 0.1 2 4 0.2 4 0 PT 1265 20 1.6 0 58 4.6 0 100 SE 1791 125 7.0 16 59 3.3 28 76 SI 1224 3 0.2 0 1 0.1 0 100
Mean 1914 65 34 10 54 2.9 14 73
Source: ESS Round 7 draft country-specific and integrated datasets ed. 2.0, not weighted
A small number of responses referred to small groups which could be considered for inclusion as addi-tional unit groups (for example Rwandan, Chechen). However, all of these could unproblematically be placed in the relevant ‘nec’ category, and in the Belgian case the number of respondents placed in these ‘nec’ categories remained small. One respondent used the term ‘Wereldburger’ [world citizen]. This clearly implies a current identity rather than an ancestry. It was coded into the residual ‘other’ category. If large numbers of respondents were to do similarly, it would clearly be problematic for the use of the question. However, it seems reasonable to allow respondents this option and unless larger numbers of respondents offered terms such as this, we would suggest no change.
The other sort of respondent who initially had to be coded into the residual ‘other’ category of the harmonised code-frame were those who described their ancestry simply as ‘European’. There were four such respondents in the countries included in the first release of ESS Round 7 data. Whereas the one respondent who used the term ‘Latin American’ could be coded into the ‘South American nec’ catego-

Developing a Measure of Socio-cultural Origins for the European Social Survey 31
ry, this could not be done for the Europeans as the original code-frame divided the European groups into two separate broad groups (North and West European, and South and East European) but does not provide a catch-all European group. There is a similar potential problem with the term ‘Asian’, which some respondents might choose to use. As a consequence, the classification was revised at the first and second digit levels, summarizing the former two European categories into one, and adapting the 2nd digit codes accordingly. This allows the post-coding of the response ‘European’. A disadvantage of this solution is that it leads to higher loss of information if countries aggregate detailed groups to the 1st rather than 2nd digit for anonymization purposes (see section 2.3.6) than with the previous version of the classification.
3.4 Producing derived variables
When working with detailed classifications, one important question is how to analyse the resulting data, especially if there is a lot of sparsity (i.e. cells with zeros or low case numbers). In this section, we propose a number of ways to combine and aggregate the ancestry variables, which will in section 3.5 also be used for validation.8 This cannot be exhaustive though because it needs to be guided by specif-ic research questions and theoretical ideas. The flexibility to approach the data from various angles is one of the main advantages of detailed classifications like the one used for coding ancestry in ESS Round 7.
3.4.1 Aggregation of the harmonised code-frame
The easiest way to code ancestry for data analysis is to aggregate the ancestry variables by reducing the number of digits. Highly aggregated socio-cultural groupings may be produced at either the 1-digit or 2-digit level. Table 7 and Table 8 show the distributions of the 1- and 2-digit harmonised ancestry variables across the 21 countries covered in the 2nd release of ESS Round 7 data. In the last two columns, all ancestries mentioned are shown, rather than first and second ancestries separately.9 While the non-European categories are obviously very small, with the exception of North African, Middle Eastern and Central Asian categories (mostly due to the inclusion of Israel in the ESS), most cell sizes are large enough to allow their differentiation in pooled data analyses of all ESS countries. With-in-European differentiation may be analysed at the two digit level. For most non-European categories, the 2-digit level is unlikely to be feasible with only a single round of data but may become possible if ancestry data is collected and pooled over multiple ESS rounds. Combinations of categories at the 1 and 2-digit level may also be used.
8 The syntax for producing these variables will be made available at
www.europeansocialsurvey.org/data/themes.html ?t= sociodemo in early 2017. The syntax was updated to ESS round 7 data ed. 2.1, released December 1st 2016, while this report uses ed. 2.0, including corrections to ances-try variables published June 26th, 2016. Any differences should be minor and due to post-coded ‘other’ re-sponses from DK as well as the correction of some processing errors in ed. 2.0 affecting about 170 cases.
9 Data were not weighted for these analyses. Weights were not yet available at the time the initial analysis - which informed the decision on whether to adopt the ancestry item in future survey rounds - was conducted. ESS data users should look at the weighting guidance available at www.europeansocialsurvey.org before con-ducting their own analysis.
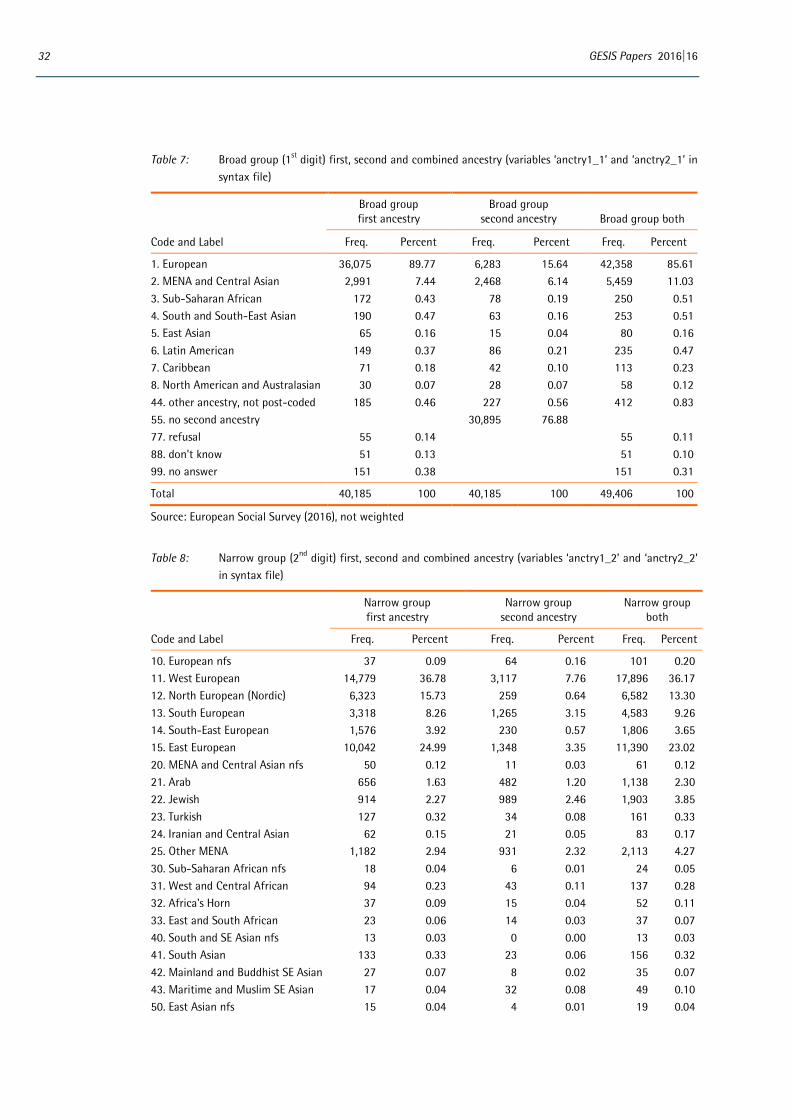
32 GESIS Papers 2016|16
Table 7: Broad group (1st digit) first, second and combined ancestry (variables ‘anctry1_1’ and ‘anctry2_1’ in syntax file)
Broad group first ancestry
Broad group second ancestry Broad group both
Code and Label Freq. Percent Freq. Percent Freq. Percent
1. European 36,075 89.77 6,283 15.64 42,358 85.61 2. MENA and Central Asian 2,991 7.44 2,468 6.14 5,459 11.03 3. Sub-Saharan African 172 0.43 78 0.19 250 0.51 4. South and South-East Asian 190 0.47 63 0.16 253 0.51 5. East Asian 65 0.16 15 0.04 80 0.16 6. Latin American 149 0.37 86 0.21 235 0.47 7. Caribbean 71 0.18 42 0.10 113 0.23 8. North American and Australasian 30 0.07 28 0.07 58 0.12 44. other ancestry, not post-coded 185 0.46 227 0.56 412 0.83 55. no second ancestry 30,895 76.88 77. refusal 55 0.14 55 0.11 88. don't know 51 0.13 51 0.10 99. no answer 151 0.38 151 0.31
Total 40,185 100 40,185 100 49,406 100
Source: European Social Survey (2016), not weighted
Table 8: Narrow group (2nd digit) first, second and combined ancestry (variables ‘anctry1_2’ and ‘anctry2_2’ in syntax file)
Narrow group first ancestry
Narrow group second ancestry
Narrow group both
Code and Label Freq. Percent Freq. Percent Freq. Percent
10. European nfs 37 0.09 64 0.16 101 0.20 11. West European 14,779 36.78 3,117 7.76 17,896 36.17 12. North European (Nordic) 6,323 15.73 259 0.64 6,582 13.30 13. South European 3,318 8.26 1,265 3.15 4,583 9.26 14. South-East European 1,576 3.92 230 0.57 1,806 3.65 15. East European 10,042 24.99 1,348 3.35 11,390 23.02 20. MENA and Central Asian nfs 50 0.12 11 0.03 61 0.12 21. Arab 656 1.63 482 1.20 1,138 2.30 22. Jewish 914 2.27 989 2.46 1,903 3.85 23. Turkish 127 0.32 34 0.08 161 0.33 24. Iranian and Central Asian 62 0.15 21 0.05 83 0.17 25. Other MENA 1,182 2.94 931 2.32 2,113 4.27 30. Sub-Saharan African nfs 18 0.04 6 0.01 24 0.05 31. West and Central African 94 0.23 43 0.11 137 0.28 32. Africa's Horn 37 0.09 15 0.04 52 0.11 33. East and South African 23 0.06 14 0.03 37 0.07 40. South and SE Asian nfs 13 0.03 0 0.00 13 0.03 41. South Asian 133 0.33 23 0.06 156 0.32 42. Mainland and Buddhist SE Asian 27 0.07 8 0.02 35 0.07 43. Maritime and Muslim SE Asian 17 0.04 32 0.08 49 0.10 50. East Asian nfs 15 0.04 4 0.01 19 0.04
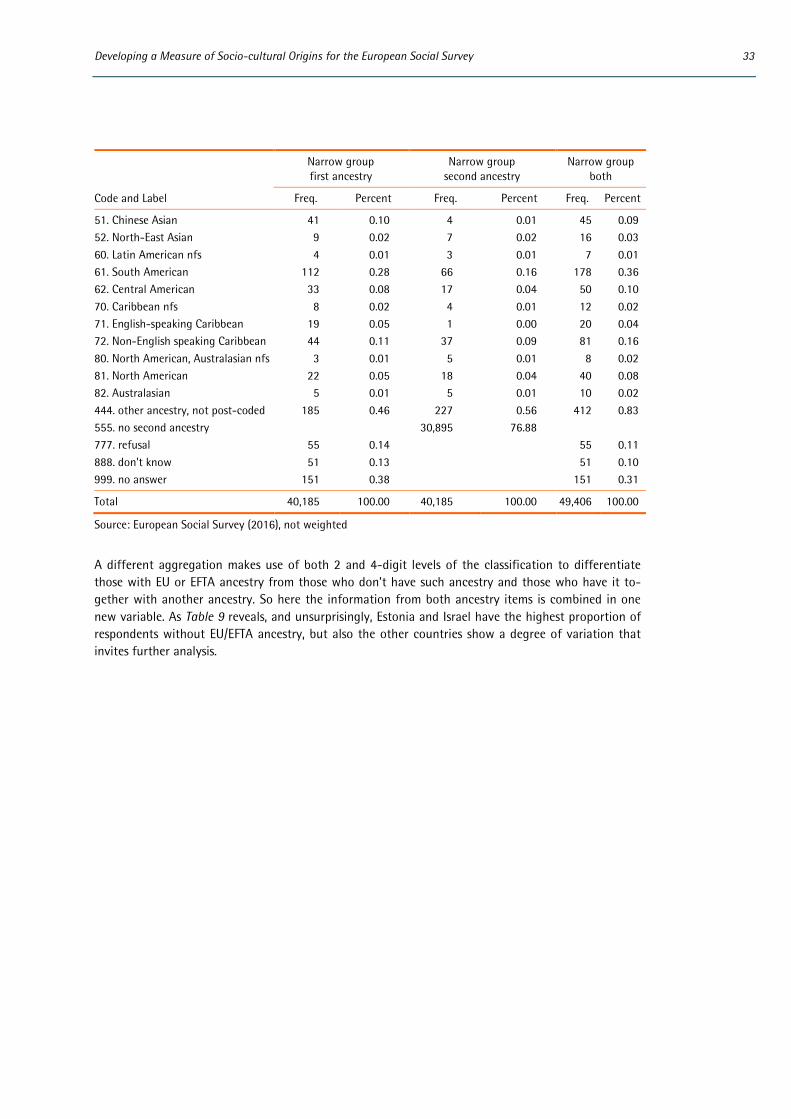
Developing a Measure of Socio-cultural Origins for the European Social Survey 33
Narrow group first ancestry
Narrow group second ancestry
Narrow group both
Code and Label Freq. Percent Freq. Percent Freq. Percent
51. Chinese Asian 41 0.10 4 0.01 45 0.09 52. North-East Asian 9 0.02 7 0.02 16 0.03 60. Latin American nfs 4 0.01 3 0.01 7 0.01 61. South American 112 0.28 66 0.16 178 0.36 62. Central American 33 0.08 17 0.04 50 0.10 70. Caribbean nfs 8 0.02 4 0.01 12 0.02 71. English-speaking Caribbean 19 0.05 1 0.00 20 0.04 72. Non-English speaking Caribbean 44 0.11 37 0.09 81 0.16 80. North American, Australasian nfs 3 0.01 5 0.01 8 0.02 81. North American 22 0.05 18 0.04 40 0.08 82. Australasian 5 0.01 5 0.01 10 0.02 444. other ancestry, not post-coded 185 0.46 227 0.56 412 0.83 555. no second ancestry 30,895 76.88 777. refusal 55 0.14 55 0.11 888. don't know 51 0.13 51 0.10 999. no answer 151 0.38 151 0.31
Total 40,185 100.00 40,185 100.00 49,406 100.00
Source: European Social Survey (2016), not weighted
A different aggregation makes use of both 2 and 4-digit levels of the classification to differentiate those with EU or EFTA ancestry from those who don’t have such ancestry and those who have it to-gether with another ancestry. So here the information from both ancestry items is combined in one new variable. As Table 9 reveals, and unsurprisingly, Estonia and Israel have the highest proportion of respondents without EU/EFTA ancestry, but also the other countries show a degree of variation that invites further analysis.
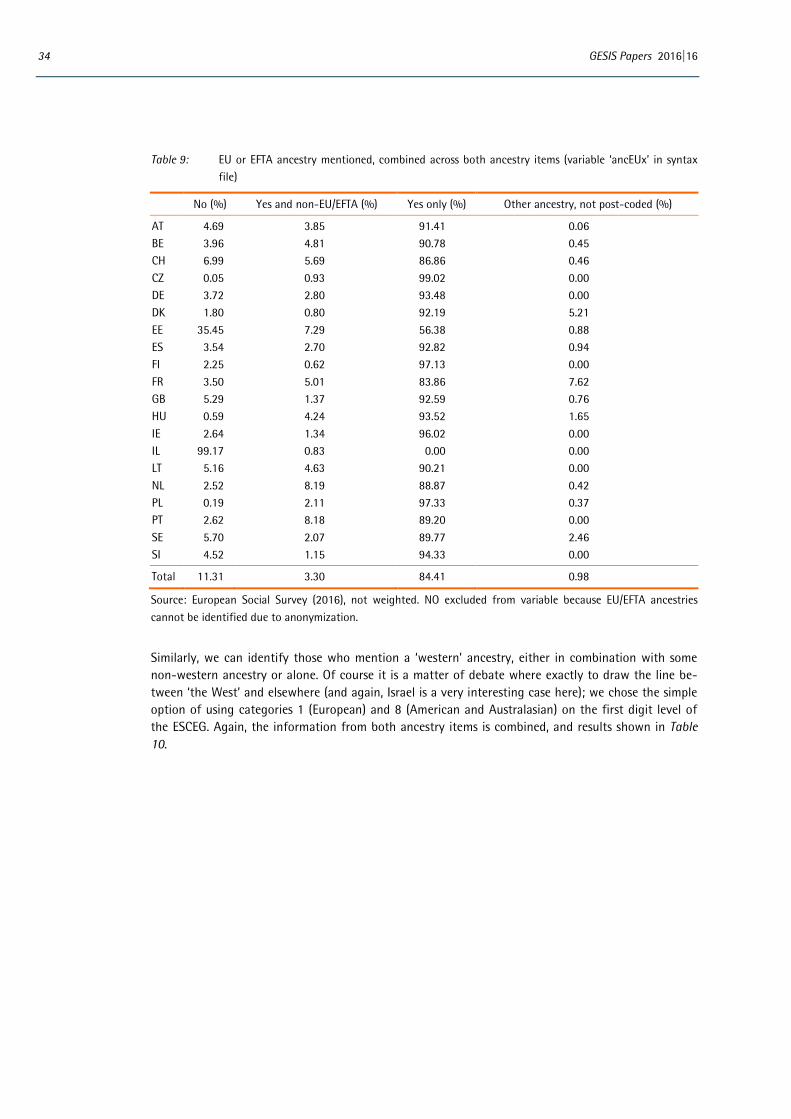
34 GESIS Papers 2016|16
Table 9: EU or EFTA ancestry mentioned, combined across both ancestry items (variable ‘ancEUx’ in syntax file)
No (%) Yes and non-EU/EFTA (%) Yes only (%) Other ancestry, not post-coded (%)
AT 4.69 3.85 91.41 0.06 BE 3.96 4.81 90.78 0.45 CH 6.99 5.69 86.86 0.46 CZ 0.05 0.93 99.02 0.00 DE 3.72 2.80 93.48 0.00 DK 1.80 0.80 92.19 5.21 EE 35.45 7.29 56.38 0.88 ES 3.54 2.70 92.82 0.94 FI 2.25 0.62 97.13 0.00 FR 3.50 5.01 83.86 7.62 GB 5.29 1.37 92.59 0.76 HU 0.59 4.24 93.52 1.65 IE 2.64 1.34 96.02 0.00 IL 99.17 0.83 0.00 0.00 LT 5.16 4.63 90.21 0.00 NL 2.52 8.19 88.87 0.42 PL 0.19 2.11 97.33 0.37 PT 2.62 8.18 89.20 0.00 SE 5.70 2.07 89.77 2.46 SI 4.52 1.15 94.33 0.00
Total 11.31 3.30 84.41 0.98
Source: European Social Survey (2016), not weighted. NO excluded from variable because EU/EFTA ancestries cannot be identified due to anonymization.
Similarly, we can identify those who mention a ‘western’ ancestry, either in combination with some non-western ancestry or alone. Of course it is a matter of debate where exactly to draw the line be-tween ‘the West’ and elsewhere (and again, Israel is a very interesting case here); we chose the simple option of using categories 1 (European) and 8 (American and Australasian) on the first digit level of the ESCEG. Again, the information from both ancestry items is combined, and results shown in Table 10.

Developing a Measure of Socio-cultural Origins for the European Social Survey 35
Table 10: Western ancestry mentioned, combined across both ancestry items (variable ‘ancwestx’ in the syn-tax file)
Country No (%) Yes and non-western (%) Yes only (%) Other ancestry, not post-coded (%)
AT 2.18 2.18 95.59 0.06 BE 3.40 4.58 91.57 0.45 CH 3.73 2.68 93.14 0.46 CZ 0.00 0.00 100.00 0.00 DE 2.37 1.32 96.31 0.00 DK 1.40 0.47 92.92 5.21 EE 0.59 0.78 97.75 0.88 ES 3.33 2.44 93.29 0.94 FI 1.39 0.05 98.56 0.00 FR 3.50 4.86 84.02 7.62 GB 5.24 0.94 93.06 0.76 HU 0.00 0.12 98.23 1.65 IE 2.22 0.92 96.85 0.00 IL 95.45 4.40 0.16 0.00 LT 0.13 0.31 99.56 0.00 NL 2.15 7.93 89.50 0.42 NO 6.70 2.23 91.06 0.00 PL 0.00 0.19 99.44 0.37 PT 2.22 7.70 90.07 0.00 SE 4.59 1.45 91.50 2.46 SI 0.00 0.08 99.92 0.00
Total 8.13 2.10 88.83 0.95
Source: European Social Survey (2016), not weighted
3.4.2 Classifying respondent’s ancestry relative to the survey country
A second approach to grouping ancestry categories for analysis is by classifying respondents relative to the main national ancestry of the country in which they were being interviewed. There are several ways for doing so, depending on which category is used as a reference: the main national group, all sub-national or other minority groups, or any indigenous groups.
Probably the most important variable to be constructed from the ancestry measures is whether re-spondents have autochthonous (‘native’) ancestry or allochthonous (‘immigrant’) ancestry, or a mix of the two. ‘Native’ means reporting main national or sub-national or established minority ancestry, and ‘immigrant’ all other ancestries. For this variable, mostly the 4-digit version of the harmonised code-frame is used (i.e. sub-national groups are throughout considered autochthonous), and autochthonous defined in the following way:
AT: 1101 Austrian BE: 1102 Belgian CH: 1110 Swiss; 1111 Yeniche CZ: 1502 Czech; 1513 Slovak; 1508 Moravian; 1512 Silesian DE: 1107 German; 2311 Sorbian/Wendish; 1106 Frisian (only few post-coded cases) DK: 1201 Danish EE: 2303 Estonian; 15111 Estonian Russian; 12023 Ingrian;
36 GESIS Papers 2016|16
ES: 1307 Spanish, 1301 Basque; 1399 South European nec (most of these are probably sub-national categories for which the specific code in the code-frame was only created after post-coding)
FI: 1202 Finnish; 1205 Sami FR: 1105 French; 1301 Basque; 72010 Antillais (includes DOM-TOM). One can argue whether those
from overseas territories should be regarded as autochthonous or allochthonous, we decided for the former.
GB: 1103 British IE: 1108 Irish IL: 25070 Israeli; 2200 Jewish; 21000 Arab, 21150 Palestinian, 21220 Muslim nfs, 21040 Bedouin,
25050 Druze HU: 1504 Hungarian; 11077 German diaspora LT: 1506 Lithuanian NL: 1104 Dutch; 1106 Frisian NO: 1204 Norwegian; 1205 Sami (excluded from variable since Sami cannot be identified due to
anonymization) PL: 1509 Polish; 1512 Silesian PT: 1306 Portuguese SE: 1206 Swedish; 1205 Sami SI: 1412 Slovenian
In a few cases, it is hard to tell whether a category is an autochthonous minority or allochthonous from the ancestry alone:
Jews (outside of Israel) and Roma are coded as autochthonous when no migration background can be identified (i.e. respondent and both parents born in survey country).
Danes in Germany and Finns in Sweden are not coded as autochthonous although there are (small) established minorities of these groups in those countries. Slovaks in the Czech Republic were regarded as autochthonous because the category is rather large.
Table 11 shows how this variable is distributed across ESS countries, highlighting that in Switzerland, Estonia, the UK and Sweden, more than 10 per cent of respondents do not have an ancestry in the respective countries, followed closely by Austria, Belgium, France, Ireland, Lithuania and Norway. The countries with the highest proportion of incidence of autochthonous ancestry (above 90 per cent) are the Czech Republic, Denmark, Spain, Finland, Hungary, Israel, Poland and Slovenia (i.e. all non-Baltic Eastern European countries plus some North and South European ones). This variable may well serve as a contextual measure of migration-related cultural heterogeneity in data analysis.
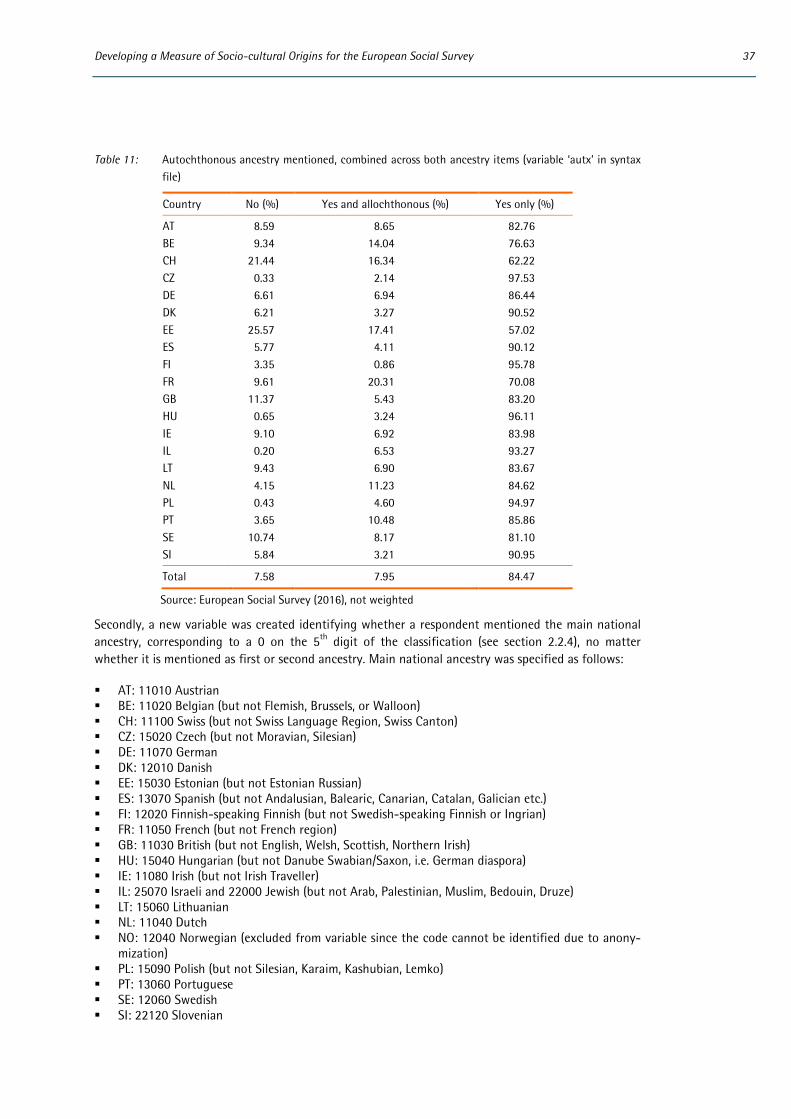
Developing a Measure of Socio-cultural Origins for the European Social Survey 37
Table 11: Autochthonous ancestry mentioned, combined across both ancestry items (variable ‘autx’ in syntax file)
Country No (%) Yes and allochthonous (%) Yes only (%)
AT 8.59 8.65 82.76 BE 9.34 14.04 76.63 CH 21.44 16.34 62.22 CZ 0.33 2.14 97.53 DE 6.61 6.94 86.44 DK 6.21 3.27 90.52 EE 25.57 17.41 57.02 ES 5.77 4.11 90.12 FI 3.35 0.86 95.78 FR 9.61 20.31 70.08 GB 11.37 5.43 83.20 HU 0.65 3.24 96.11 IE 9.10 6.92 83.98 IL 0.20 6.53 93.27 LT 9.43 6.90 83.67 NL 4.15 11.23 84.62 PL 0.43 4.60 94.97 PT 3.65 10.48 85.86 SE 10.74 8.17 81.10 SI 5.84 3.21 90.95
Total 7.58 7.95 84.47
Source: European Social Survey (2016), not weighted
Secondly, a new variable was created identifying whether a respondent mentioned the main national ancestry, corresponding to a 0 on the 5th digit of the classification (see section 2.2.4), no matter whether it is mentioned as first or second ancestry. Main national ancestry was specified as follows:
AT: 11010 Austrian BE: 11020 Belgian (but not Flemish, Brussels, or Walloon) CH: 11100 Swiss (but not Swiss Language Region, Swiss Canton) CZ: 15020 Czech (but not Moravian, Silesian) DE: 11070 German DK: 12010 Danish EE: 15030 Estonian (but not Estonian Russian) ES: 13070 Spanish (but not Andalusian, Balearic, Canarian, Catalan, Galician etc.) FI: 12020 Finnish-speaking Finnish (but not Swedish-speaking Finnish or Ingrian) FR: 11050 French (but not French region) GB: 11030 British (but not English, Welsh, Scottish, Northern Irish) HU: 15040 Hungarian (but not Danube Swabian/Saxon, i.e. German diaspora) IE: 11080 Irish (but not Irish Traveller) IL: 25070 Israeli and 22000 Jewish (but not Arab, Palestinian, Muslim, Bedouin, Druze) LT: 15060 Lithuanian NL: 11040 Dutch NO: 12040 Norwegian (excluded from variable since the code cannot be identified due to anony-
mization) PL: 15090 Polish (but not Silesian, Karaim, Kashubian, Lemko) PT: 13060 Portuguese SE: 12060 Swedish SI: 22120 Slovenian

38 GESIS Papers 2016|16
Table 12 shows the percentage of respondents not mentioning the national ancestry, mentioning it together with another ancestry, and exclusively mentioning the main national ancestry, for all ESS Round 7 countries.
Table 12: Main national ancestry mentioned, combined across both ancestry items (variable ‘natx’ in syntax file)
Country No (%) Yes, and other (%) Yes, only (%)
AT 8.59 8.71 82.70 BE* 18.34 57.56 24.11 CH* 26.60 26.80 46.60 CZ* 4.00 19.46 76.54 DE 6.61 7.14 86.25 DK 6.41 3.74 89.85 EE* 38.34 8.12 53.55 ES* 22.00 44.62 33.39 FI* 8.53 2.59 88.88 FR* 11.59 28.88 59.53 GB* 43.13 26.43 30.44 HU* 1.30 7.48 91.22 IE* 9.44 12.12 78.44 IL* 14.34 21.50 64.16 LT 9.43 7.03 83.54 NL 4.25 11.44 84.30 PL* 0.62 5.90 93.48 PT 3.81 10.88 85.31 SE* 10.79 8.28 80.93 SI 6.17 3.21 90.63
Total 12.92 15.93 71.15
Source: European Social Survey (2016), not weighted. Countries marked with * used sub-national categories.
As already seen when looking at dual ancestries, most countries with regional or other sub-national categories on the show card have the lowest proportion of respondents where only the main national ancestry is mentioned (BE, CH, CZ, EE, ES, FR, GB, IL). Belgium is an extreme case where only 24 per cent mention exclusively a Belgian ancestry, followed by Spain with 33 per cent. These two countries also show the highest proportion of respondents indicating the main national ancestry together with another one. In the UK, 43 per cent of respondents do not mention British ancestry at all, largely re-ferring to the constituent countries of the UK instead. This is followed by Estonia, where 38 per cent of the sample do not mention Estonian ancestry (but often Russian and sometimes Estonian Russian).
Thirdly, a variable was created identifying whether a respondent mentioned a (non-immigrant, i.e. established) minority, sub-national or regional ancestry, no matter whether it is mentioned as 1st or 2nd ancestry. In most cases, this refers to some regional ancestry (but see exact numbers in section 6.1 in the appendix). The ‘minority/regional categories’ were specified as follows:
In all countries: 14100 Roma/Gypsy/Sinti; 22000 Jewish (not in Israel) as well as sub-national groups defined as belonging to the main national group (1-9 on 5th digit of the classification)
CZ: 15080 Moravian; 15120 Silesian; 15130 Slovak DE: 15150 Sorbian/Wendish; 11060 Frisian
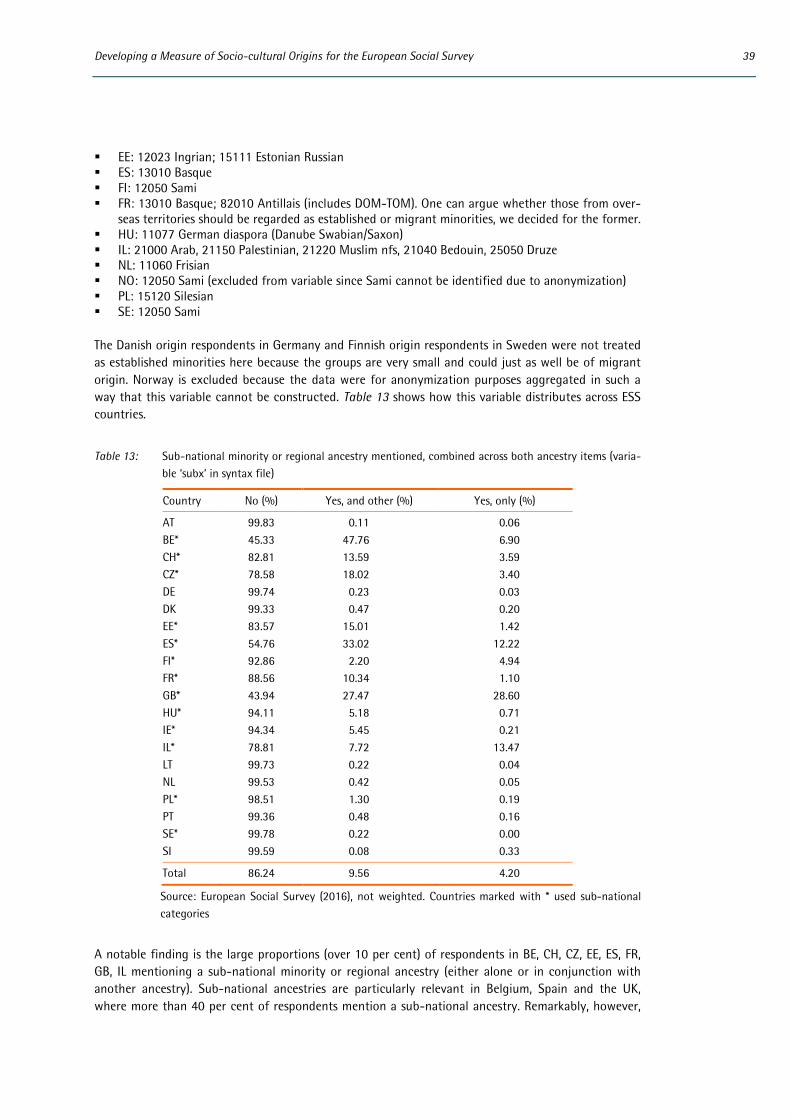
Developing a Measure of Socio-cultural Origins for the European Social Survey 39
EE: 12023 Ingrian; 15111 Estonian Russian ES: 13010 Basque FI: 12050 Sami FR: 13010 Basque; 82010 Antillais (includes DOM-TOM). One can argue whether those from over-
seas territories should be regarded as established or migrant minorities, we decided for the former. HU: 11077 German diaspora (Danube Swabian/Saxon) IL: 21000 Arab, 21150 Palestinian, 21220 Muslim nfs, 21040 Bedouin, 25050 Druze NL: 11060 Frisian NO: 12050 Sami (excluded from variable since Sami cannot be identified due to anonymization) PL: 15120 Silesian SE: 12050 Sami
The Danish origin respondents in Germany and Finnish origin respondents in Sweden were not treated as established minorities here because the groups are very small and could just as well be of migrant origin. Norway is excluded because the data were for anonymization purposes aggregated in such a way that this variable cannot be constructed. Table 13 shows how this variable distributes across ESS countries.
Table 13: Sub-national minority or regional ancestry mentioned, combined across both ancestry items (varia-ble ‘subx’ in syntax file)
Country No (%) Yes, and other (%) Yes, only (%)
AT 99.83 0.11 0.06 BE* 45.33 47.76 6.90 CH* 82.81 13.59 3.59 CZ* 78.58 18.02 3.40 DE 99.74 0.23 0.03 DK 99.33 0.47 0.20 EE* 83.57 15.01 1.42 ES* 54.76 33.02 12.22 FI* 92.86 2.20 4.94 FR* 88.56 10.34 1.10 GB* 43.94 27.47 28.60 HU* 94.11 5.18 0.71 IE* 94.34 5.45 0.21 IL* 78.81 7.72 13.47 LT 99.73 0.22 0.04 NL 99.53 0.42 0.05 PL* 98.51 1.30 0.19 PT 99.36 0.48 0.16 SE* 99.78 0.22 0.00 SI 99.59 0.08 0.33
Total 86.24 9.56 4.20
Source: European Social Survey (2016), not weighted. Countries marked with * used sub-national categories
A notable finding is the large proportions (over 10 per cent) of respondents in BE, CH, CZ, EE, ES, FR, GB, IL mentioning a sub-national minority or regional ancestry (either alone or in conjunction with another ancestry). Sub-national ancestries are particularly relevant in Belgium, Spain and the UK, where more than 40 per cent of respondents mention a sub-national ancestry. Remarkably, however,
40 GESIS Papers 2016|16
much less so in Switzerland, France or Israel, culturally potentially heterogeneous countries that also offered sub-national categories on their showcards. It is also interesting to see where a relatively large number of respondents exclusively mention a sub-national ancestry, and this is the case in Spain, the UK and Israel. In these countries, national ancestry is of limited relevance for certain groups. This is consistent with our understanding of internal differentiation within these countries. The ability to make these distinctions for the first time is likely to have considerable substantive interest in these particular countries. In future ESS rounds particular care will be taken to make sure that all countries where sub-national cultural groups may be relevant mention those on their ancestry show cards.
Finally, it is possible to combine the two general approaches presented so far, thus differentiating e.g. respondents with national ancestry only from all others, who could then be differentiated by their narrow or broad ethnic or cultural group.
Producing these derived variables combining or differentiating between national majorities and re-gional or indigenous minority categories during the evaluation process further exposed the limitations of the original harmonised code-frame and inconsistencies in the way sub-national groups were dealt with. In some cases country-specific versions of the variables originally had to be used to achieve these derived variables. These inconsistencies were corrected before the ESS7 ancestry variables were published, making the creation of such derived variables possible using the harmonised variables alone.
3.5 Discriminant validity
In this section we examine how the derived measures of ancestry just described relate to other measures of cultural, ethnic or migration background, which are already included in the ESS core questionnaire. This enables us to test both the face validity of the ancestry item - is it correlated as we would expect with other related variables such as country of birth? - and the added value it provides to the ESS - does it differentiate respondents’ socio-cultural background in new ways compared with the existing variables?
The existing ESS variables we look at here are survey country citizenship (yes/no), whether the re-spondent was born in the survey country (yes/no), language spoken at home (national language(s) vs. other language(s)) and detailed migration background (i.e. including whether parents were born in survey country, six categories).10 For some analyses (e.g. of minority ancestry) we also consider how this correlates with whether the respondent considers himself or herself as belonging to an ethnic minority group in the country (yes/no).
3.5.1 Respondents with and without autochthonous ancestry
Firstly, we look at the variable indicating whether respondents mentioned any of the autochthonous, i.e. ‘native’, groups amongst the two ancestries, either exclusively or together with another ancestry, or not (called ‘autx’, see also section 3.4.2; left hand columns of Table 14).
Cross-tabulating this new variable with alternative indicators of socio-cultural origins from the ESS core questionnaire reveals strong face validity of the new measure. Individuals who only mention autochthonous categories as their ancestry (thus including sub-national minority or regional catego-ries but not immigrant categories) are almost always citizens of the country (99.7 per cent) and/or
10 We distinguish between: 1) no migration background, 2) one parent born abroad but respondent not, 3) 2nd
generation immigrant: both parents born abroad but respondent not, 4) neither parent but respondent born abroad, 5) one parent and respondent born abroad and 6) 1st generation immigrant: respondent and both par-ents born abroad.

Developing a Measure of Socio-cultural Origins for the European Social Survey 41
born in the country in question (96.4 per cent), do not have a migration background (89.7 per cent) and do not regard themselves as members of an ethnic minority (96.4 per cent). Most (94.0 per cent) also only speak one of the national languages at home. This is according to our expectations.
Table 14: Relationship between ancestry and other measures of socio-cultural background in ESS (cell per-centages)
Respondent has autochthonous ancestry
Respondent has national ancestry
Respondent: Yes only Yes + other No Yes only Yes + other No
…has citizenship 99.7 88.8 47.9 99.8 96.1 66.1 …born in survey country 96.4 68.9 27.3 96.6 84.6 52.6 …has no migration background 89.7 34.1 8.8 90.1 65.0 37.5 …speaks only national language(s) at home 94.0 67.7 43.9 94.4 80.9 63.4 …does not self-identify as member of ethnic minority 96.4 81.3 59.0 98.1 88.8 65.8
N 32,518 3,061 2,917 28,408 6,362 5,158
Source: European Social Survey (2016), not weighted
However, the measure also provides information that is not already covered in the other items. For example, it may be surprising that 10 per cent of respondents with only autochthonous ancestry do seem to have a migration background. Looking in some more detail, almost half of them have one foreign-born parent, a quarter are 2nd generation, and another quarter even 1st generation (with for-eign-born parents). It is plausible that the foreign-born parents have autochthonous ancestry them-selves, so that we find evidence of return migration. An alternative explanation may be that in some translations, the item did not clearly enough refer to ancestry, i.e. family origins, rather than own origins (see sections 2.1.4 and 2.3.1) so that this result could be due to validity problems also. In ESS Round 8 the translation annotation and translation in several countries was improved and it will be important to check whether this result will stay.
For respondents who mention a foreign (allochthonous) ancestry in addition to ‘native’ ancestry, the percentage of respondents reporting citizenship goes down to 88.8 per cent, and for being born in the survey country to 68.9 per cent. This means that there is a substantial group of individuals mentioning autochthonous categories amongst their ancestries without having citizenship and/or not being born in the country. The latter may be ‘returning’ children of emigrants or with mixed parentage. Around one in three (34.1 per cent) of those reporting native and foreign (i.e. mixed) ancestry do not have any apparent migration background and are thus likely to be 3rd generation descendants of immigrants who intermarried with natives (thus exogamous groups); again this is a potentially important group for analysis (but yet again, the note of caution regarding translation of ‘ancestry’ is in place).
Amongst those who do not mention any autochthonous category as one of their ancestries at all, still 47.9 per cent hold the country’s citizenship and 27.3 per cent are born in the country, which is a re-markable sign of ethnic diversity of the populations of ESS countries. More than two-thirds (71.1 per cent) of them are 1st generation immigrants born to parents also born abroad, while 12.8 per cent are 2nd generation (both parents born abroad, not shown in Table 12). There are 8.8 per cent without ap-parent migration background who do not mention any autochthonous category as their ancestry, likely to be 3rd generation descendants of immigrants (without mixed ancestry and thus from highly endogamous groups, e.g. Russians in Estonia, Italians in France, Irish in the UK, Polish and Russian in Lithuania).
42 GESIS Papers 2016|16
Only 41 per cent of those not mentioning an autochthonous category as one of their ancestries regard themselves as belonging to an ethnic minority group in the country on average. This suggests the limitations of the standard ESS question on self-reported minority status: it may rather measure who feels discriminated against because of their ethnic origin, rather than whether they consider them-selves to belong to any (including non-discriminated) minority groups.
3.5.2 Respondents with and without main national ancestry
Reporting main national ancestry (variable ‘natx’, see section 3.4.2) is also closely correlated with other indicators of socio-cultural origin present in the ESS but again, there is far from an exact correspond-ence, suggesting that the new measure adds value to existing ones (right hand columns of Table 14). Unsurprisingly, individuals who exclusively mention the national category as their ancestry (and thus no sub-national minority, regional or immigrant category) are almost always citizens of (99.8 per cent), born in the country in question (96.6 per cent) and only 1.9 per cent regard themselves as mem-bers of an ethnic minority. Nearly all (94.4 per cent) only speak one of the national (including estab-lished minority) languages at home and they are unlikely to have a migration background (90.1 per cent of respondents with exclusively national ancestry are born in the country, and their parents, too). Overall this suggests that the measure of national ancestry has considerable face validity. The 9.9 per cent of respondents with exclusively ‘national’ ancestry and with a migration background will be an important group to consider in due course: they potentially include (children of) ‘returnees’, a group that is typically invisible with previous measures (but yet again, translation issues may explain this result, see above). However, if respondents also mention another ancestry (either a sub-national one or a foreign one) in addition to national ancestry, there is slightly more variation; 96.1 per cent have citizenship and only 84.6 per cent were born in the country. Again, this is in line with expectations.
Amongst those who do not mention the national majority group as one of their ancestries at all (12.9 per cent of all respondents), two thirds (66.1 per cent) nevertheless hold the country’s citizenship and 52.6 per cent are born in the country. 45.1 per cent are first-generation immigrants born to parents also born abroad, while 9.7 per cent are second generation. 37.5 per cent of those who do not mention the national majority amongst their ancestries do not appear to have any migration background. These may be third-generation descendants of immigrants (without mixed ancestry and thus from highly endogamous groups). More likely (see next section for further discussion) they are people who express their ancestry purely in terms of sub-national or minority groups rather than the national majority. This is an important finding, demonstrating that migration background is not the simple obverse of national ancestry. In other words, there is a substantively large group (almost 2000 respondents in the sample as a whole, making up almost 5 per cent) who neither have a migration background nor report the national ancestry. This group would be invisible in a measure which relied purely on migration background. It thus suggests important analytical potential for the new ancestry measure.
3.5.3 Respondents with and without sub-national ancestry
For some research questions, it will be interesting to focus on sub-national minorities or regional cul-tural groups rather than minorities of immigrant origin. We thus also coded a variable (named ‘subx’, see section 3.4.2) indicating whether respondents mentioned any autochthonous minority category amongst the two ancestries, either exclusively or together with another ancestry, or not. Citizenship, country of birth and language will not be useful to look at here because the non-minority group is a very heterogeneous mix of those of main national and immigrant ancestry. A more interesting rela-tionship to look at is whether respondents that the ancestry measure identifies as having a sub-national origin regard themselves as belonging to an ethnic minority group, or not.

Developing a Measure of Socio-cultural Origins for the European Social Survey 43
Only 21 per cent of those who exclusively mention a sub-national minority or regional category as their ancestry regard themselves as members of an ethnic minority, which means that most individuals who mention exclusively a sub-national ancestry do not seem to feel subordinate to the majority na-tional category. Very plausibly, for those who mention a sub-national and another ancestry, even fewer, namely 10.9 per cent, regard themselves as belonging to an ethnic minority group. Amongst those without any sub-national minority, the proportion decreases further to 5 per cent.
3.5.4 Looking at broad ethnic and cultural groups
It is also of considerable interest to compare how different specific allochthonous (foreign) ancestries relate to the other measures of national and immigrant background already included in the ESS core questionnaire. For this purpose we construct a variable which distinguishes on the one hand respond-ents who mention only an autochthonous ancestry (that is, either the national ancestry or one of the sub-national or regional ancestries) and on the other hand, those who give a foreign ancestry (poten-tially in combination with an autochthonous ancestry). Those who give a foreign ancestry are further distinguished according to the broad groups discussed in section 3.4. Those giving a European, Austral-asian or North American ancestry are classified as having ‘Western’ ancestry, whilst those giving an-other ancestry are classified as ‘non-Western’.
The figures in the first column of Table 15 are of course the same as those in the corresponding col-umn of Table 14. These provide us with a baseline for contrasting the different broad groups. As can be seen the percentages of respondents giving an allochthonous ancestry are in general unlikely to have been born in the survey country. The differences range from a high of 63 per cent of respondents with (non-autochthonous) European ancestry to a low of 4 per cent of respondents with North Ameri-can and Australasian ancestry. These figures are in line with what we know about the historical timing of migration flows, with a lot of intra-European migration happening in the mid to late 20th century. Citizenship is at a much higher level (doubtless reflecting naturalization as well as offspring from mixed unions) and follows a somewhat similar pattern.
Table 15: Relationship between ancestry by autochthonous or broad group (allochthonous), and other measures of socio-cultural background in ESS core questionnaire (cell percentages)
Autoch- thonous
only
Western Non-Western
Respondent… European N American, Australasian
MENA and C Asian
Sub-Saharan Africa
S, SE Asia
East Asia
Latin American Caribbean
…has country citizenship 99.7 76.4 30.4 59.2 47.9 64.5 42.3 49.0 83.8 …born in survey country 96.4 62.8 4.4 20.4 5.0 17.1 9.6 7.8 37.8 …has no migra-tion background 89.7 38.8 0.0 2.4 0.7 0.7 2.0 2.9 10.8 …speaks only national lan-guage at home 94.0 67.5 23.8 20.9 34.6 37.3 35.7 50.5 70.6 …does not iden-tify as ethnic minority 96.4 79.3 82.6 55.9 44.3 27.0 44.2 63.7 35.1
N 32,518 6,348 23 417 140 152 52 102 37
Source: European Social Survey (2016), not weighted

44 GESIS Papers 2016|16
Migration background then shows a clear, and expected, picture for those reporting non-European ancestries. Close to 100 per cent of respondents reporting non-European ancestries have a migration background, confirming the face validity of the measure. However, the figure is considerably lower among the groups with European (but not autochthonous) ancestries: a quarter of those reporting a European ancestry do not have a migration background – and this is therefore new information gath-ered using these measures. These may be members of the third-generation following large-scale intra-European migration in the 20th century. The third generation also seems to be visible already amongst those of Caribbean ancestry. Respondents with non-European ancestry also have a higher likelihood of not speaking any of the national languages at home, with the exception of those with Caribbean an-cestry.
It is interesting here that Western or non-Western origin does not show up as an important dividing line, but rather geographical proximity as well as post-colonial and language ties, which would be-come even more obvious when looking at individual countries. The only indicator by which western categories align are whether respondents consider themselves being a member of an ethnic minority – further highlighting that the term ‘ethnic minority’ in popular understanding rather refers to pan-ethnic categories or even racial elements rather than fine-graded cultural or ethnic distinctions. Peo-ple without western ancestry more often regard themselves as belonging to an ethnic minority group in the country. This indicator thus is more strongly related to perceived minority status than those discussed so far, likely because it takes all Europeans into the majority group.
3.5.5 Country of birth and ancestry
We also looked at the relationship between respondents’ specific country of birth and their ancestries. These should be related, but not necessarily be the same. For example, of those 24 respondents born in Angola, half have Sub-Saharan African (mostly Angolan) ancestry and half European (mostly Portu-guese) ancestry, which does not always match with the country of birth of their parents. 71 out of 109 – thus many, but not all – respondents born in Bosnia Herzegovina have Bosnian ancestry. Amongst the 19 respondents born in Indonesia, 13 have parents who were both born in Indonesia, 10 of which however also claim Dutch ancestry, invisible from country of birth-information alone. The relationship between country of birth and ancestry is particularly weak amongst those of Jewish/Israeli ancestry, who were born in many different places. For example, we find 21 respondents reporting MENA or Central Asian ancestry in the data who were born in Argentina. These largely turn out to have Jewish ancestry and were interviewed in Israel. The ancestry measure thus has the potential to produce inter-esting stories to tell, beyond country of origin of recent migrants.
3.5.6 Summary of discriminant analysis
While measures derived from the new ancestry variables correlate with more established indicators of socio-cultural origins - providing evidence of face validity - the correlations are in many instances not perfect. The addition of the ancestry variable can help to identify differences in socio-cultural origin and specific groups - for example third-generation migrants, returning children of colonial emigrants, and sub-national minorities not currently detectable within the ESS dataset. Over time this will permit empirical studies of ethnic diversity, both with respect to regional or sub-national as well as immigra-tion-related, in European societies not possible with any data set so far, allowing researchers to un-cover a lot of variation within the group commonly identified as ‘the majority’.
Of course there are large variations across countries in the relationships reported in this section. Sub-sequently - and as more cases become available in future rounds - it will be interesting and important to explore these associations in more detail for individual countries and/or specific ancestry or migrant groups.
Developing a Measure of Socio-cultural Origins for the European Social Survey 45
3.6 Summary
This chapter has provided detailed evidence of the contents and data quality of the new ancestry measure. The item did not produce a lot of missing data, nor were the bulk of open answers using the ‘other ancestry’ response option difficult to code into the harmonised framework. While some minor tweaks to the design of the questionnaire item were necessary to improve the reporting of dual ances-tries, having the opportunity to mention two ancestries (and potentially more) seems to be worth-while.
A challenge for data users of complex classifications is to derive parsimonious and theoretically mean-ingful variables for statistical analysis. We have proposed a (non-exhaustive) range of derived variables for different theoretical purposes. The resulting variables give testimony to the versatility of the meas-ure and the underlying classification. Cross-tabulating those variables with established indicators of ethnic and migration background showed how diverse the group usually regarded as the ‘majority’ can actually be. The consideration of sub-national and regional categories as well as migration background beyond the 2nd generation is innovative and cannot be proxied by any other indicator included in the ESS.

46 GESIS Papers 2016|16
4 Conclusions and Recommendations
This final chapter summarises the main findings from the evaluation of the ancestry item included in ESS Round 7 and outlines how these findings have been used to develop and improve the item for future rounds.
Overall, the inclusion of an item measuring socio-cultural origins in terms of ancestry as part of the ESS core questionnaire in Round 7 can be considered a success. The development of the ancestry source question, translations, response categories and harmonised code-frame required concerted action and substantial resources both centrally and in country teams. There are also a number of ways in which the item and its administration can and will be improved (see below). Nevertheless, the eval-uation demonstrated that it is possible to develop a pan-European measure of socio-cultural origins based on ancestry and that such an item has the potential to add value to surveys such as the ESS and offer long-term potential for analysis. In light of the findings from the evaluation, and following a recommendation from the ESS Scientific Advisory Board, the Core Scientific Team of the ESS took the decision to make ancestry a long term addition to the core questionnaire from ESS Round 8 onwards.
4.1 Adding ancestry to the ESS core questionnaire
The new item on ancestry developed for the ESS was intended to provide a measure of respondents’ socio-cultural origins and to provide new insights into other aspects of attitudes and behaviour cap-tured by the survey beyond existing core measures such as citizenship, language, and respondent and parental country of birth.
Evidence from the evaluation suggests that the ancestry item is largely fit for purpose and provides a valuable addition to the existing ESS core items. Quantitative and qualitative pre-testing in a range of countries demonstrated that respondents generally appear to understand the question as intended (i.e. as a measure of their roots, heritage or long term family origins) and are able to provide answers without too much difficulty. There is no evidence from ESS Round 7 that the item caused undue diffi-culties for respondents or interviewers in the field. The approach of adopting country-specific show-cards agreed via consultation between country experts (NCs) and subject experts (Heath and Schnei-der) worked smoothly and provides an effective model for future rounds. NCs were generally happy to field the item (subject to some revisions, see below) and did not find the work involved to adapt the item unnecessarily burdensome. The detailed code-frame, including distinctions between national and sub-national groups, provides lots of flexibility whilst the hierarchical structure provides a clear pre-defined logic for collapsing small categories as necessary for use in analysis. As explored in Chapter 3 the item, and variables derived from it, provides scope to uncover information and patterns over and above existing core items such as on citizenship, language, and (respondents’ and their parents’) coun-try of birth.
The real value of the ancestry item will emerge only after several ESS rounds when sufficient data has been collected to allow for in-depth analysis of how different combinations of ancestry may influence other variables measured by the ESS such as wellbeing and partisanship. Time will tell how useful the resulting variables will be in understanding public attitudes and behaviour as measured by the ESS and what the take-up is among the scientific community. However, feedback from the ESS Scientific Advi-sory Board and the high level of interest in the existing ESS variables on this topic as well as the grow-ing salience of the issue in light of increased migration suggest that the item will be well used. The future use of the ancestry item should be carefully monitored but there certainly appears to be value in including the item in several more rounds and building up data for analysis.

Developing a Measure of Socio-cultural Origins for the European Social Survey 47
Although the ancestry item generally performed well and can be considered fit for purpose, the evalu-ation also highlighted some important ways in which the item and underlying classification could be improved. These findings, and the ESS’ response to them, will be summarized in the remaining sections.
4.2 Revising the European Standard Classification of Cultural and Ethnic Groups (ESCEG)
One of the most challenging aspects of developing a new cross-national measure of socio-cultural origins has been to provide a suitable classification into which responses can be coded. The challenge has been to strike a balance between providing a code-frame that is sufficiently detailed to capture the complexities of ethnic and cultural groups in individual countries and one that can be implement-ed cross-nationally and used to derive meaningful variables for comparative analysis. Following the example of the Australian Standard Classification of Cultural and Ethnic Groups (ASCCEG) developed by the Australian Bureau of Statistics, ESS has developed a new hierarchically structured code-frame, the European Standard Classification of Cultural and Ethnic Groups (ESCEG), which provides scope for specific ancestries to be coded at either the unit (4 digit) or sub-national (5 digit) level whilst remaining nested within an overall structure of broad and narrow groups.
Perhaps inevitably the experience of fielding the ancestry item in ESS Round 7 revealed some gaps and inconsistencies in the first iteration of the ESCEG, especially with regard to how sub-national groups were dealt with across countries (see section 2.3). Rather than wait for a future round of the ESS, the decision was taken to revise the code-frame and correct these issues as far as possible already before the release of the ESS Round 7 data. This was to ensure the best quality data was available to end users and to try and minimise disruption to the time-series necessitated by changes implemented in future rounds.
The following changes were made to the ESCEG:
To ensure the completeness and consistency of the code-frame, ‘nfs’ (not further specified) and ‘nec’ (not elsewhere classified) codes were added at relevant points in the hierarchy11
A new 5-digit code, ending with 8, signifying ‘<<Country>> city or region nec’ was added for each (current or former) ESS country to allow for a consistent approach to coding sub-national identities that do not have a more specific place in the classification yet
A new 1-digit code for the broad category ‘European’ was added and 2-digit codes adjusted ac-cordingly
Some new 4 and 5-digit codes were added to rectify omissions in the previous code-frame, e.g. codes added for Estonian Russian, Brusselian etc. This permits deriving variables referring to sub-national categories without having to go back to the country-specific ancestry variables, which are not included in the data release.
The mapping of country-specific ancestry variables onto the harmonised version of the variables avail-able in the final dataset was also reviewed and responses recoded where necessary.12 The revised ver-
11 A trailing 0 at the 5th digit is used to indicate where ancestry is given as the national group without any fur-
ther specification. A ‘not further specified’ (nfs) marker is included in the category label if further distinctions are foreseen by the classification. This is the case for all countries included in the ESS in any round, as well as a few others where the distinction may be relevant in the European context.
12 The majority of revisions to the code-frame necessitated a change in the one-to-one mapping between coun-try-specific codes appearing on the showcard and the corresponding code in the harmonised variable. It was therefore relatively straightforward to implement these changes. Where ‘other’ responses were post coded to a specific harmonised code it was also possible to review and ensure that the correct revised code was used. The small number of ‘other’ responses which were either not post-coded originally or which were coded to an ‘nec’
48 GESIS Papers 2016|16
sion of the code-frame was used to produce the ESS round 7 edition 2.0 version of the harmonised ancestry variables which are available via the ESS Data Archive and which are presented in this evalua-tion report.
Now that the code-frame has been adapted to reflect the learning from ESS Round 7, it is expected that the code-frame will prove durable and will not require much subsequent revision in future rounds. It is possible that the participation of some additional ESS countries, e.g. Russia, may highlight new issues. However, it should be possible to implement any changes, which are likely to be country specific, at the 4 or 5-digit level without too much disruption to other countries’ data or the longer term time series.
4.3 Other improvements to the ESS ancestry item
In addition to changes required to the harmonised code-frame, the evaluation also highlighted a number of other ways in which the ancestry item fielded in ESS Round 7 could be improved. Many of these changes have been adopted for ESS Round 8.
The first set of recommendations relate to possible improvements to the source questionnaire. The translation annotation was amended to improve the quality and consistency of translation. To ensure that all translations focus on the notion of family kinship or descent, it has been revised to read “an-cestry in the sense of ‘descent’ or ‘family origins’. All countries were asked to review their translations for ESS Round 8 to ensure that the translation used conveys the necessary sense of long term origins or background i.e. capturing where the respondents’ forebears including grandparents and prior gen-erations are from, rather than where the respondent themselves is from. The ‘no second ancestry’ op-tion was made more prominent in the questionnaire, appearing before options for ‘don’t know’ and ’refusal’, to try and improve the use of this category and ensure that interviewers are aware of its availability.13
After ESS Round 7, there was a discussion about extending the number of possible ancestries the re-spondent could give from two to three. This was considered potentially useful in countries such as the UK, Belgium and Spain, where there was clear evidence of people expressing both national and sub-national ancestry so that providing for three ancestries, respondents with a migrant background could express national, sub-national and non-native ancestry. However, it was concluded that the number of cases likely to be affected would be small in most countries and that the additional effort required during data collection and processing by the addition of a third ancestry was not warranted. The final version of the ESS Round 8 question on ancestry, including the new translation annotation and revised position of the ‘no second ancestry’ option is shown in Figure 4.
The second set of recommendations relate to possible improvements in the country-specific show-cards. All showcards were reviewed prior to ESS Round 8 to ensure that that the most appropriate national and other groupings are considered. After Round 8 it will probably not be necessary to carry out a comprehensive review of showcards every round but they should be reviewed every few rounds to ensure that the categories (especially those relating to major migrant groups) continue to reflect reality. Further clarification on the order of categories on the showcard has been provided to avoid possible discrepancies between the source and translated versions. To avoid potential confusion caused by adopting an alphabetical approach, and in the absence of definitive information about relative
category have, however, been left as they were originally. The additional effort required for revisiting the orig-inal verbatim responses was not felt to be justified given the small number of cases involved.
13 None of ‘no second ancestry’, ‘don’t know’ or ‘refusal’ are visible to the respondent but are displayed to the interviewer as part of the questionnaire.

Developing a Measure of Socio-cultural Origins for the European Social Survey 49
group size, the primary ordering principle is the order in which groups appear in the code-frame. Cat-egories will appear with the national majority group first, followed by sub-national groups and indig-enous minorities, followed by other groups in code-frame order.
NEW ANNOTATION for ESS8: ‘ancestry’ in the sense of ‘descent’ or ‘family origins’.
Figure 4: ESS Round 8 source questionnaire item on ancestry
The main improvement to the showcards for ESS Round 8 compared with Round 7 is to adopt a more consistent approach to the treatment of sub-national groups, a key feature of the new ancestry meas-ure. In Round 7 many countries (e.g. Belgium, Spain, UK, France) included sub-national groups but others, including countries such as Austria where sub-national identities may be considered salient, did not. For ESS Round 8 it was recommended that each country’s showcard should ideally include at least one category referring to sub-national or regional grouping(s); given that regional or sub-national ancestries are required in some countries, for comparability it is desirable that all showcards include
50 GESIS Papers 2016|16
such a category in order that respondents perceive that they can express their ancestry in these terms. Two different ways for sub-national or regional groups to be indicated on the showcard were allowed. If sub-national socio-cultural differences are strong (e.g. when there are marked language, religious or historical cleavages in a country), then these ancestries can be listed individually (as was previously done in Belgium, Spain and the UK). Where sub-national or regional cultural distinctions are less sali-ent (or too numerous to list them all individually), then a single category can be used in the format ‘Bavarian, Swabian or other regional German ancestry (please specify which)’.14
The final set of recommendations concerns the need for improved guidance and documentation. The evaluation highlighted the importance of fully documenting all stages of the process, and the ra-tionale behind them, when carrying out a cross-country harmonisation exercise. Specifically, it was determined that improved guidance to interviewers was necessary regarding the use of ‘other’ and ‘no second ancestry’ codes. The ESS data protocol will also be improved to provide additional guidance on the post-coding of ‘other’ responses and to ensure that both country-specific and harmonised versions of the ancestry variables deposited with the data archive are in the appropriate format.
4.4 Final thoughts
The exercise to develop and evaluate a new item measuring socio-cultural origins or ancestry for the ESS core questionnaire has equipped us with the tools necessary to improve understanding of the issues surrounding ancestry and socio-cultural origins in Europe. This will benefit substantive research-ers with an interest in understanding the increasingly complex and diverse socio-cultural origins of people resident within Europe and the consequences of this complexity and diversity for attitudes and behaviour. Lessons learned during the development process will also be of interest to survey method-ologists and practitioners interested in the process of and potential for developing detailed measures not only of ancestry but also, potentially, other socio-demographics for cross-national surveys.
There is, as always, scope for further developments and improvements. Further methodological consid-eration should perhaps be given to whether responses to the ancestry question may be sensitive to the presence of an interviewer and may have been influenced by whether the interviewer was perceived as being of the same or different background to the respondent. Substantively, the current ancestry measure provides information on what respondents consider their ancestry to be but no indication of how salient this ancestry is to their current ethnic identity. Where respondents give more than one ancestry, we cannot know which, if either, of these two they consider the most salient. Including an additional item asking respondents about the subjective importance of their ancestry could provide this insight. This would also introduce additional variation within the (rather large) autochthonous categories, which may be predictive of their attitudes especially vis-à-vis, for example, diversity and immigration. However, whilst potentially nice to have, previous experience of trying to measure na-tional and European identity suggests that developing such a subjective item would not be straight-forward.
14 The addition of ‘[CNTRY] city or region nec’ codes to the ESCEG will enable these categories to appear within
the harmonised versions of the variables.
Developing a Measure of Socio-cultural Origins for the European Social Survey 51
5 References
Abdikeeva, A. (2014). Measure, Plan, Act: How data collection can support racial equality. Brussels: European Network against Racism. Retrieved from http://www.enar-eu.org/IMG/pdf/20084_equalitydatacollectionpublication-8-low.pdf
Anderson, B. (1991). Imagined communities: Reflections on the origin and spread of nationalism (Revised). London: Verso.
Australian Bureau of Statistics. (2011). Australian Standard Classification of Cultural and Ethnic Groups (ASCCEG). Retrieved January 15, 2016, from http://www.abs.gov.au/ausstats/[email protected]/mf/1249.0
Ehling, M. (2003). Harmonising data in official statistics. In J. H. P. Hoffmeyer-Zlotnik & C. Wolf (Eds.), Advances in cross-national comparison: A European working book for demographic and socio-economic variables (pp. 17–31). New York; London: Kluwer Academic/Plenum.
ESS ERIC. (2016). ESS7 - 2014 Documentation Report (3.0). Bergen: European Social Survey Data Archive, NSD - Norwegian Centre for Research Data for ESS ERIC. Retrieved from http://www.europeansocialsurvey.org/docs/round7/survey/ESS7_data_documentation_report_e03_0.pdf
European Social Survey. (2014). ESS Round 7 Translation Guidelines. London. Retrieved from http://www.europeansocialsurvey.org/docs/methodology/ESS_R7_Translation_Guidelines_FINAL.pdf
European Social Survey. (2016). ESS Round 7: European Social Survey Round 7 Data (2014). Data file edition 2.0. NSD - Norwegian Centre for Research Data, Norway – Data Archive and distributor of ESS data for ESS ERIC. Retrieved from www.europeansocialsurvey.org
Fitzgerald, R, Widdop, S., Gray, M. & Collins, D. (2011). Identifying Sources of Error in Cross-national Questionnaires: Application of an Error Source Typology to Cognitive Interview Data. Journal of Official Statistics, 27(27 (4)), 569–599.
Hancock, A. (2013). Best practice guidelines for Developing International Statistical Classifications. Expert Group Meeting on International Statistical Classifications. New York. Retrieved from http://unstats.un.org/unsd/class/intercop/expertgroup/2013/AC267-5.PDF
Heath, A. F., Fisher, S. D., Rosenblatt, G., Sanders, D., & Sobolewska, M. (2013). The Political Integration of Ethnic Minorities in Britain. Oxford: Oxford University Press. https://doi.org/10.1093/acprof:oso/9780199656639.001.0001
Lyberg, L., Biemer, P., Collins, M., de Leeuw, E., Dippo, C., Schwarz, N., & Trewin, D. (Eds.). (1997). Survey Measurement and Process Quality. New York: Wiley.
Modood, T., & Khattab, N. (2015). Explaining Ethnic Differences: Can Ethnic Minority Strategies Reduce the Effects of Ethnic Penalties? Sociology, 0038038515575858-. https://doi.org/10.1177/0038038515575858
Morales, L., & Giugni, M. (Eds.). (2011). Social Capital, Political Participation and Migration in Europe. Basingstoke: Palgrave Macmillan. https://doi.org/10.1057/9780230302464
NatCen Social Research. (2015). European Social Survey Wave 8 Cognitive Testing: Report on findings from cognitive interviews with the UK, Poland, Norway, Spain and Austria. London.
Norwegian Centre for Research Data. (2016a). Appendix 11 Ancestry ed. 1.0. Retrieved from http://www.europeansocialsurvey.org/docs/round7/survey/ESS7_appendix_a11_e01_0.pdf
Norwegian Centre for Research Data. (2016b). Appendix 6: Classifications and coding standards, ESS7-2014. Retrieved from http://www.europeansocialsurvey.org/docs/round7/survey/ESS7_appendix_a6_e02_0.pdf
Okamoto, D., & Mora, G. C. (2014). Panethnicity. Annual Review of Sociology, 40(1), 219–239. https://doi.org/10.1146/annurev-soc-071913-043201
52 GESIS Papers 2016|16
Schneider, S. L., & Heath, A. F. (2016). Uncovering ethnic and cultural diversity in Europe: A new classification of ethnic and cultural groups. In 3rd International ESS Conference: Understanding key challenges for European societies in the 21st century. Lausanne: FORS.
Weber, M. (1978). Ethnic groups. In G. Roth & C. Wittich (Eds.), Economy and Society: An Outline of Interpretive Sociology (pp. 385–398). Berkeley (CA): University of California Press.
Wimmer, A. (2009). Herder’s Heritage and the Boundary-Making Approach: Studying Ethnicity in Immigrant Societies. Sociological Theory, 27(3), 244–270. https://doi.org/10.1111/j.1467-9558.2009.01347.x
Wolf, C., Schneider, S. L., Behr, D., & Joye, D. (2016). Harmonizing survey questions between cultures and over time. In C. Wolf, D. Joye, T. W. Smith, & Y. Fu (Eds.), The SAGE Handbook of Survey Methodology (pp. 502–524). Los Angeles: Sage.
Zani, A. P. (2007). Continuity and Change in Kenyan Secondary Education since Independence, 1969 - 2004: A Study of Gender and Social Inequalities. DPhil thesis, Oxford University.
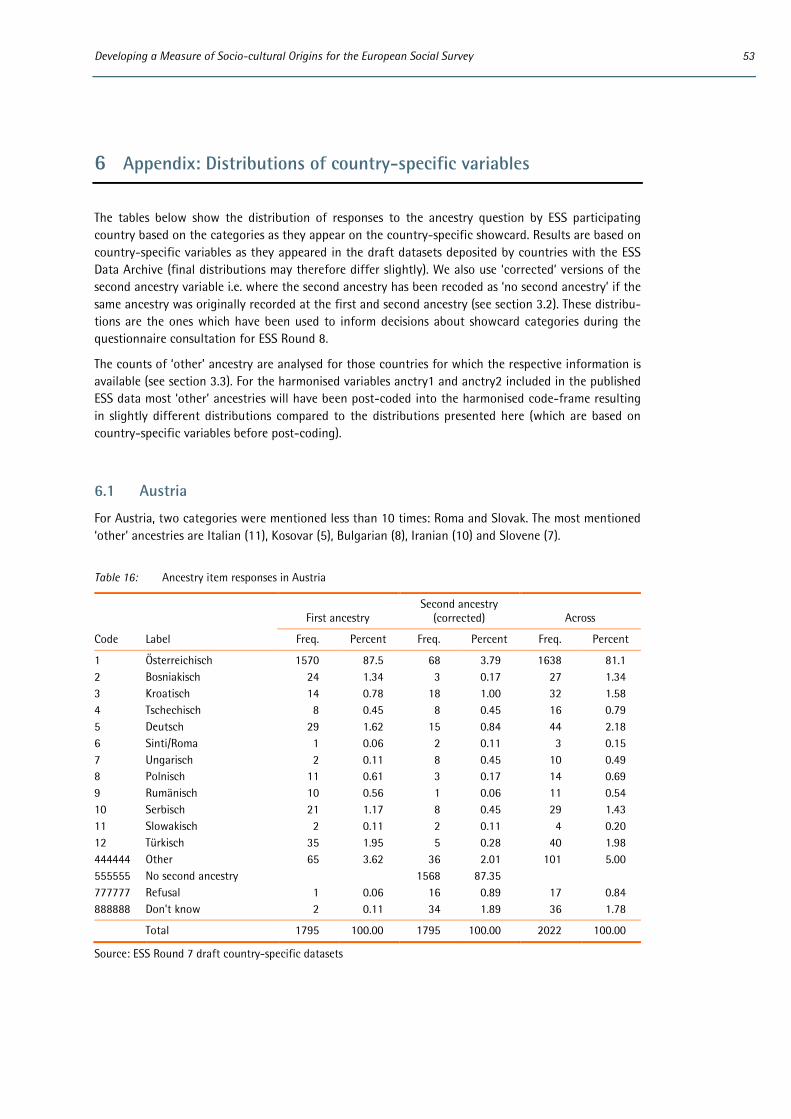
Developing a Measure of Socio-cultural Origins for the European Social Survey 53
6 Appendix: Distributions of country-specific variables
The tables below show the distribution of responses to the ancestry question by ESS participating country based on the categories as they appear on the country-specific showcard. Results are based on country-specific variables as they appeared in the draft datasets deposited by countries with the ESS Data Archive (final distributions may therefore differ slightly). We also use ‘corrected’ versions of the second ancestry variable i.e. where the second ancestry has been recoded as ‘no second ancestry’ if the same ancestry was originally recorded at the first and second ancestry (see section 3.2). These distribu-tions are the ones which have been used to inform decisions about showcard categories during the questionnaire consultation for ESS Round 8.
The counts of ‘other’ ancestry are analysed for those countries for which the respective information is available (see section 3.3). For the harmonised variables anctry1 and anctry2 included in the published ESS data most ‘other’ ancestries will have been post-coded into the harmonised code-frame resulting in slightly different distributions compared to the distributions presented here (which are based on country-specific variables before post-coding).
6.1 Austria
For Austria, two categories were mentioned less than 10 times: Roma and Slovak. The most mentioned ‘other’ ancestries are Italian (11), Kosovar (5), Bulgarian (8), Iranian (10) and Slovene (7).
Table 16: Ancestry item responses in Austria
First ancestry
Second ancestry (corrected) Across
Code Label Freq. Percent Freq. Percent Freq. Percent
1 Österreichisch 1570 87.5 68 3.79 1638 81.1 2 Bosniakisch 24 1.34 3 0.17 27 1.34 3 Kroatisch 14 0.78 18 1.00 32 1.58 4 Tschechisch 8 0.45 8 0.45 16 0.79 5 Deutsch 29 1.62 15 0.84 44 2.18 6 Sinti/Roma 1 0.06 2 0.11 3 0.15 7 Ungarisch 2 0.11 8 0.45 10 0.49 8 Polnisch 11 0.61 3 0.17 14 0.69 9 Rumänisch 10 0.56 1 0.06 11 0.54 10 Serbisch 21 1.17 8 0.45 29 1.43 11 Slowakisch 2 0.11 2 0.11 4 0.20 12 Türkisch 35 1.95 5 0.28 40 1.98 444444 Other 65 3.62 36 2.01 101 5.00 555555 No second ancestry 1568 87.35 777777 Refusal 1 0.06 16 0.89 17 0.84 888888 Don't know 2 0.11 34 1.89 36 1.78
Total 1795 100.00 1795 100.00 2022 100.00
Source: ESS Round 7 draft country-specific datasets
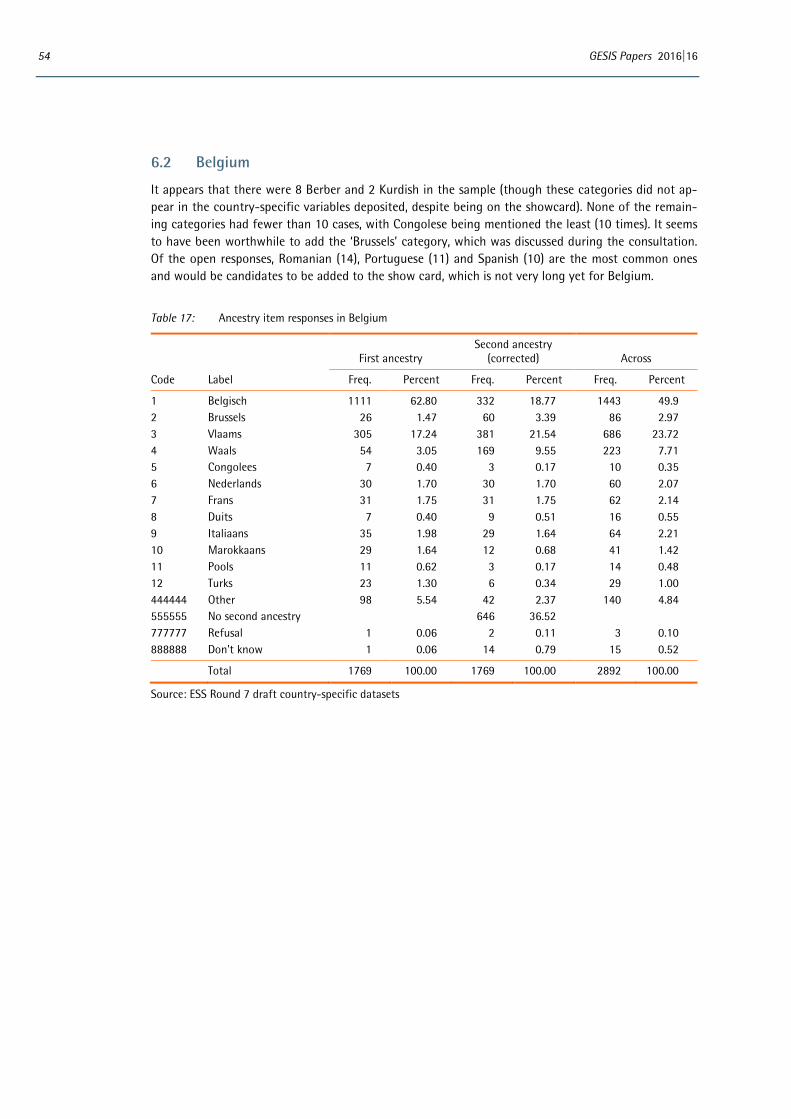
54 GESIS Papers 2016|16
6.2 Belgium
It appears that there were 8 Berber and 2 Kurdish in the sample (though these categories did not ap-pear in the country-specific variables deposited, despite being on the showcard). None of the remain-ing categories had fewer than 10 cases, with Congolese being mentioned the least (10 times). It seems to have been worthwhile to add the ‘Brussels’ category, which was discussed during the consultation. Of the open responses, Romanian (14), Portuguese (11) and Spanish (10) are the most common ones and would be candidates to be added to the show card, which is not very long yet for Belgium.
Table 17: Ancestry item responses in Belgium
First ancestry
Second ancestry (corrected) Across
Code Label Freq. Percent Freq. Percent Freq. Percent
1 Belgisch 1111 62.80 332 18.77 1443 49.9 2 Brussels 26 1.47 60 3.39 86 2.97 3 Vlaams 305 17.24 381 21.54 686 23.72 4 Waals 54 3.05 169 9.55 223 7.71 5 Congolees 7 0.40 3 0.17 10 0.35 6 Nederlands 30 1.70 30 1.70 60 2.07 7 Frans 31 1.75 31 1.75 62 2.14 8 Duits 7 0.40 9 0.51 16 0.55 9 Italiaans 35 1.98 29 1.64 64 2.21 10 Marokkaans 29 1.64 12 0.68 41 1.42 11 Pools 11 0.62 3 0.17 14 0.48 12 Turks 23 1.30 6 0.34 29 1.00 444444 Other 98 5.54 42 2.37 140 4.84 555555 No second ancestry 646 36.52 777777 Refusal 1 0.06 2 0.11 3 0.10 888888 Don't know 1 0.06 14 0.79 15 0.52
Total 1769 100.00 1769 100.00 2892 100.00
Source: ESS Round 7 draft country-specific datasets
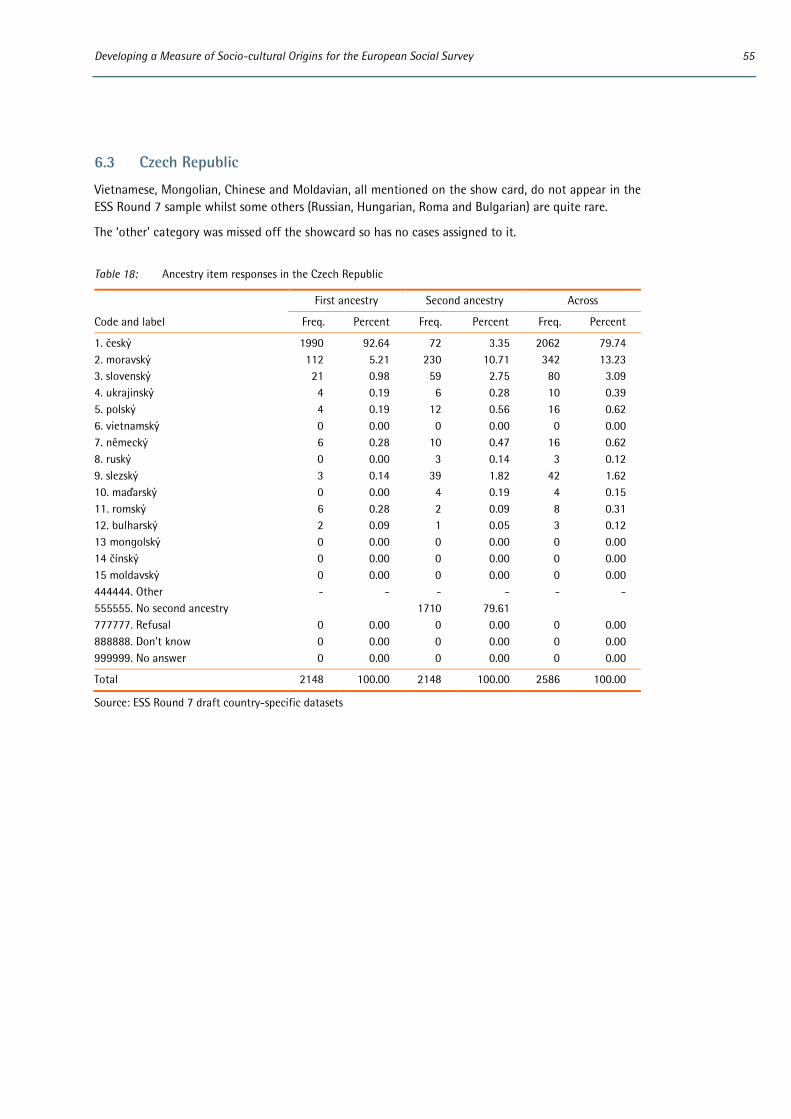
Developing a Measure of Socio-cultural Origins for the European Social Survey 55
6.3 Czech Republic
Vietnamese, Mongolian, Chinese and Moldavian, all mentioned on the show card, do not appear in the ESS Round 7 sample whilst some others (Russian, Hungarian, Roma and Bulgarian) are quite rare.
The ‘other’ category was missed off the showcard so has no cases assigned to it.
Table 18: Ancestry item responses in the Czech Republic
First ancestry Second ancestry Across
Code and label Freq. Percent Freq. Percent Freq. Percent
1. český 1990 92.64 72 3.35 2062 79.74 2. moravský 112 5.21 230 10.71 342 13.23 3. slovenský 21 0.98 59 2.75 80 3.09 4. ukrajinský 4 0.19 6 0.28 10 0.39 5. polský 4 0.19 12 0.56 16 0.62 6. vietnamský 0 0.00 0 0.00 0 0.00 7. německý 6 0.28 10 0.47 16 0.62 8. ruský 0 0.00 3 0.14 3 0.12 9. slezský 3 0.14 39 1.82 42 1.62 10. maďarský 0 0.00 4 0.19 4 0.15 11. romský 6 0.28 2 0.09 8 0.31 12. bulharský 2 0.09 1 0.05 3 0.12 13 mongolský 0 0.00 0 0.00 0 0.00 14 čínský 0 0.00 0 0.00 0 0.00 15 moldavský 0 0.00 0 0.00 0 0.00 444444. Other - - - - - - 555555. No second ancestry 1710 79.61 777777. Refusal 0 0.00 0 0.00 0 0.00 888888. Don't know 0 0.00 0 0.00 0 0.00 999999. No answer 0 0.00 0 0.00 0 0.00
Total 2148 100.00 2148 100.00 2586 100.00
Source: ESS Round 7 draft country-specific datasets
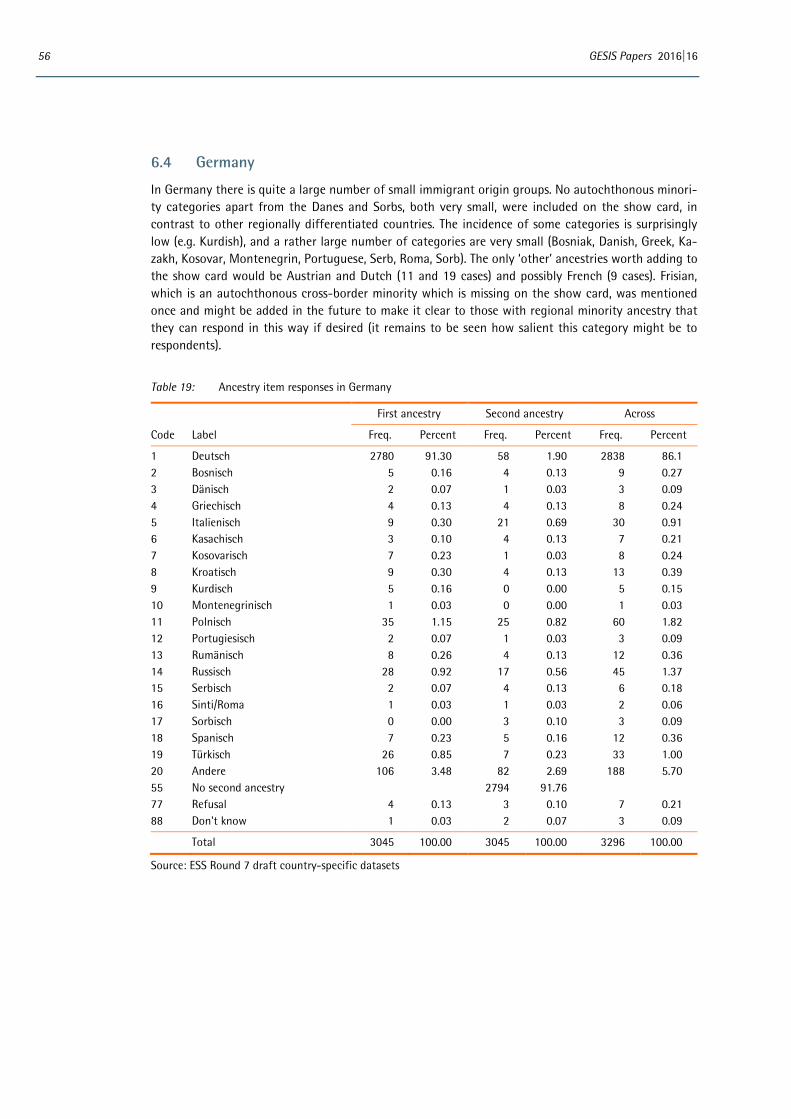
56 GESIS Papers 2016|16
6.4 Germany
In Germany there is quite a large number of small immigrant origin groups. No autochthonous minori-ty categories apart from the Danes and Sorbs, both very small, were included on the show card, in contrast to other regionally differentiated countries. The incidence of some categories is surprisingly low (e.g. Kurdish), and a rather large number of categories are very small (Bosniak, Danish, Greek, Ka-zakh, Kosovar, Montenegrin, Portuguese, Serb, Roma, Sorb). The only ‘other’ ancestries worth adding to the show card would be Austrian and Dutch (11 and 19 cases) and possibly French (9 cases). Frisian, which is an autochthonous cross-border minority which is missing on the show card, was mentioned once and might be added in the future to make it clear to those with regional minority ancestry that they can respond in this way if desired (it remains to be seen how salient this category might be to respondents).
Table 19: Ancestry item responses in Germany
First ancestry Second ancestry Across
Code Label Freq. Percent Freq. Percent Freq. Percent
1 Deutsch 2780 91.30 58 1.90 2838 86.1 2 Bosnisch 5 0.16 4 0.13 9 0.27 3 Dänisch 2 0.07 1 0.03 3 0.09 4 Griechisch 4 0.13 4 0.13 8 0.24 5 Italienisch 9 0.30 21 0.69 30 0.91 6 Kasachisch 3 0.10 4 0.13 7 0.21 7 Kosovarisch 7 0.23 1 0.03 8 0.24 8 Kroatisch 9 0.30 4 0.13 13 0.39 9 Kurdisch 5 0.16 0 0.00 5 0.15 10 Montenegrinisch 1 0.03 0 0.00 1 0.03 11 Polnisch 35 1.15 25 0.82 60 1.82 12 Portugiesisch 2 0.07 1 0.03 3 0.09 13 Rumänisch 8 0.26 4 0.13 12 0.36 14 Russisch 28 0.92 17 0.56 45 1.37 15 Serbisch 2 0.07 4 0.13 6 0.18 16 Sinti/Roma 1 0.03 1 0.03 2 0.06 17 Sorbisch 0 0.00 3 0.10 3 0.09 18 Spanisch 7 0.23 5 0.16 12 0.36 19 Türkisch 26 0.85 7 0.23 33 1.00 20 Andere 106 3.48 82 2.69 188 5.70 55 No second ancestry 2794 91.76 77 Refusal 4 0.13 3 0.10 7 0.21 88 Don't know 1 0.03 2 0.07 3 0.09
Total 3045 100.00 3045 100.00 3296 100.00
Source: ESS Round 7 draft country-specific datasets
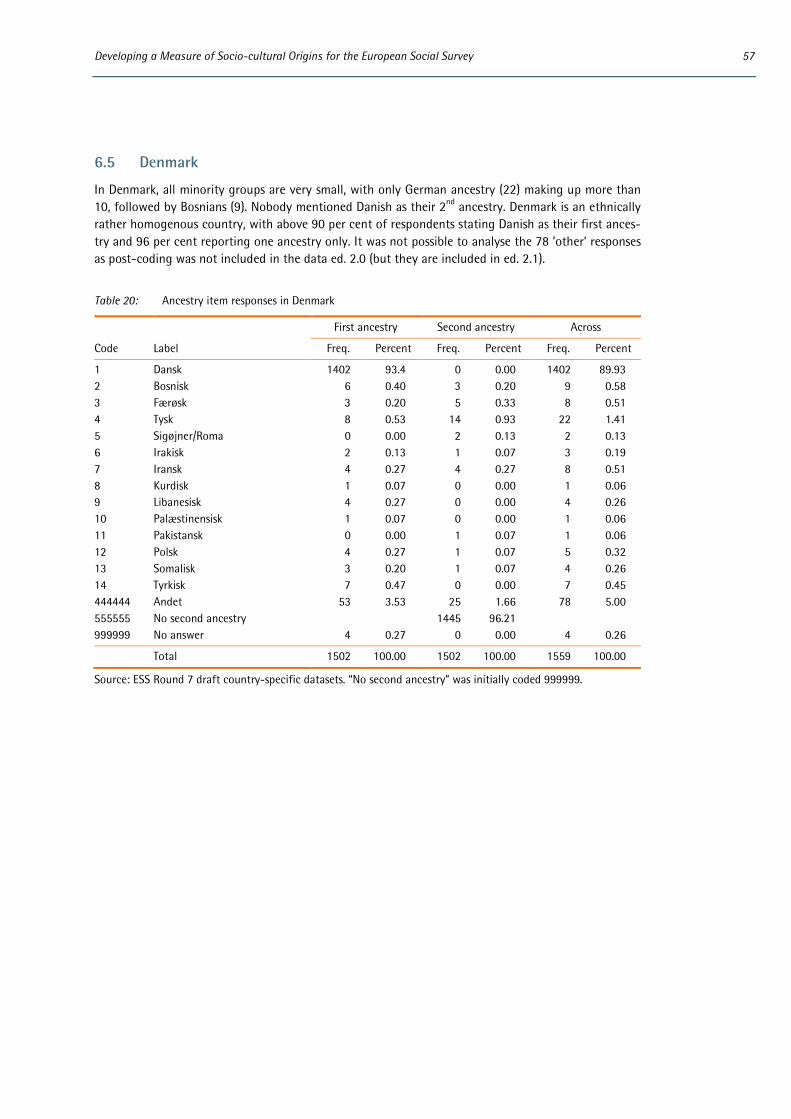
Developing a Measure of Socio-cultural Origins for the European Social Survey 57
6.5 Denmark
In Denmark, all minority groups are very small, with only German ancestry (22) making up more than 10, followed by Bosnians (9). Nobody mentioned Danish as their 2nd ancestry. Denmark is an ethnically rather homogenous country, with above 90 per cent of respondents stating Danish as their first ances-try and 96 per cent reporting one ancestry only. It was not possible to analyse the 78 ’other’ responses as post-coding was not included in the data ed. 2.0 (but they are included in ed. 2.1).
Table 20: Ancestry item responses in Denmark
First ancestry Second ancestry Across
Code Label Freq. Percent Freq. Percent Freq. Percent
1 Dansk 1402 93.4 0 0.00 1402 89.93 2 Bosnisk 6 0.40 3 0.20 9 0.58 3 Færøsk 3 0.20 5 0.33 8 0.51 4 Tysk 8 0.53 14 0.93 22 1.41 5 Sigøjner/Roma 0 0.00 2 0.13 2 0.13 6 Irakisk 2 0.13 1 0.07 3 0.19 7 Iransk 4 0.27 4 0.27 8 0.51 8 Kurdisk 1 0.07 0 0.00 1 0.06 9 Libanesisk 4 0.27 0 0.00 4 0.26 10 Palæstinensisk 1 0.07 0 0.00 1 0.06 11 Pakistansk 0 0.00 1 0.07 1 0.06 12 Polsk 4 0.27 1 0.07 5 0.32 13 Somalisk 3 0.20 1 0.07 4 0.26 14 Tyrkisk 7 0.47 0 0.00 7 0.45 444444 Andet 53 3.53 25 1.66 78 5.00 555555 No second ancestry 1445 96.21 999999 No answer 4 0.27 0 0.00 4 0.26
Total 1502 100.00 1502 100.00 1559 100.00
Source: ESS Round 7 draft country-specific datasets. “No second ancestry” was initially coded 999999.

58 GESIS Papers 2016|16
6.6 Estonia
Estonia is an ethnically heterogeneous country, mostly because of the large groups of individuals with Russian or Estonian Russian ancestry. In Estonia, most minority categories are used, and only 3 attract less than 10 mentions (Roma, Armenian, Georgian). Some but not all of the ‘other’ ancestries were post-coded at the time the analysis was conducted. The largest number of mentions was for ‘Lithuani-an’ (9). This might be worth adding to the show card.
Table 21: Ancestry item responses in Estonia
First ancestry
Second ancestry (corrected) Across
Code and label Freq. Percent Freq. Percent Freq. Percent
1. Eestlane 1232 60.07 29 1.41 1261 47.35 2. Venelane 615 29.99 107 5.22 722 27.11 3. Eesti venelane 80 3.90 223 10.87 303 11.38 4. Ukrainlane 42 2.05 44 2.15 86 3.23 5. Valgevenelane 28 1.37 31 1.51 59 2.22 6. Soomlane 2 0.10 18 0.88 20 0.75 7. Ingerlane 3 0.15 17 0.83 20 0.75 8. Juut 5 0.24 7 0.34 12 0.45 9. Lätlane 6 0.29 4 0.20 10 0.38 10. Poolakas 5 0.24 10 0.49 15 0.56 11. Sakslane 3 0.15 15 0.73 18 0.68 12. Mustlane/ Roma 0 0.00 1 0.05 1 0.04 13. Armeenlane 3 0.15 4 0.20 7 0.26 14. Grusiin 3 0.15 1 0.05 4 0.15 15. Muu 18 0.88 21 1.02 39 1.46 555555. No second ancestry 1439 70.16 777777. Refusal 3 0.15 26 1.27 29 1.09 888888. Don't know 3 0.15 54 2.63 57 2.14
Total 2051 100.00 2051 100.00 2663 100.00
Source: ESS Round 7 draft country-specific datasets
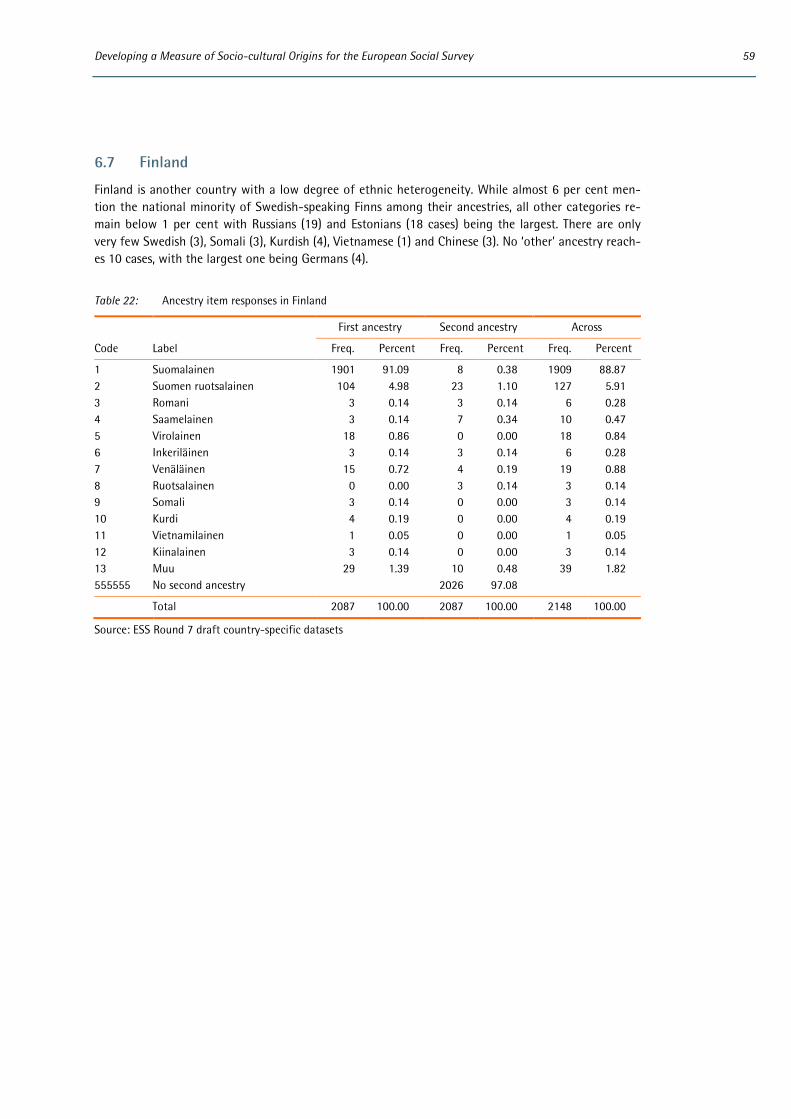
Developing a Measure of Socio-cultural Origins for the European Social Survey 59
6.7 Finland
Finland is another country with a low degree of ethnic heterogeneity. While almost 6 per cent men-tion the national minority of Swedish-speaking Finns among their ancestries, all other categories re-main below 1 per cent with Russians (19) and Estonians (18 cases) being the largest. There are only very few Swedish (3), Somali (3), Kurdish (4), Vietnamese (1) and Chinese (3). No ‘other’ ancestry reach-es 10 cases, with the largest one being Germans (4).
Table 22: Ancestry item responses in Finland
First ancestry Second ancestry Across
Code Label Freq. Percent Freq. Percent Freq. Percent
1 Suomalainen 1901 91.09 8 0.38 1909 88.87 2 Suomen ruotsalainen 104 4.98 23 1.10 127 5.91 3 Romani 3 0.14 3 0.14 6 0.28 4 Saamelainen 3 0.14 7 0.34 10 0.47 5 Virolainen 18 0.86 0 0.00 18 0.84 6 Inkeriläinen 3 0.14 3 0.14 6 0.28 7 Venäläinen 15 0.72 4 0.19 19 0.88 8 Ruotsalainen 0 0.00 3 0.14 3 0.14 9 Somali 3 0.14 0 0.00 3 0.14 10 Kurdi 4 0.19 0 0.00 4 0.19 11 Vietnamilainen 1 0.05 0 0.00 1 0.05 12 Kiinalainen 3 0.14 0 0.00 3 0.14 13 Muu 29 1.39 10 0.48 39 1.82 555555 No second ancestry 2026 97.08
Total 2087 100.00 2087 100.00 2148 100.00
Source: ESS Round 7 draft country-specific datasets
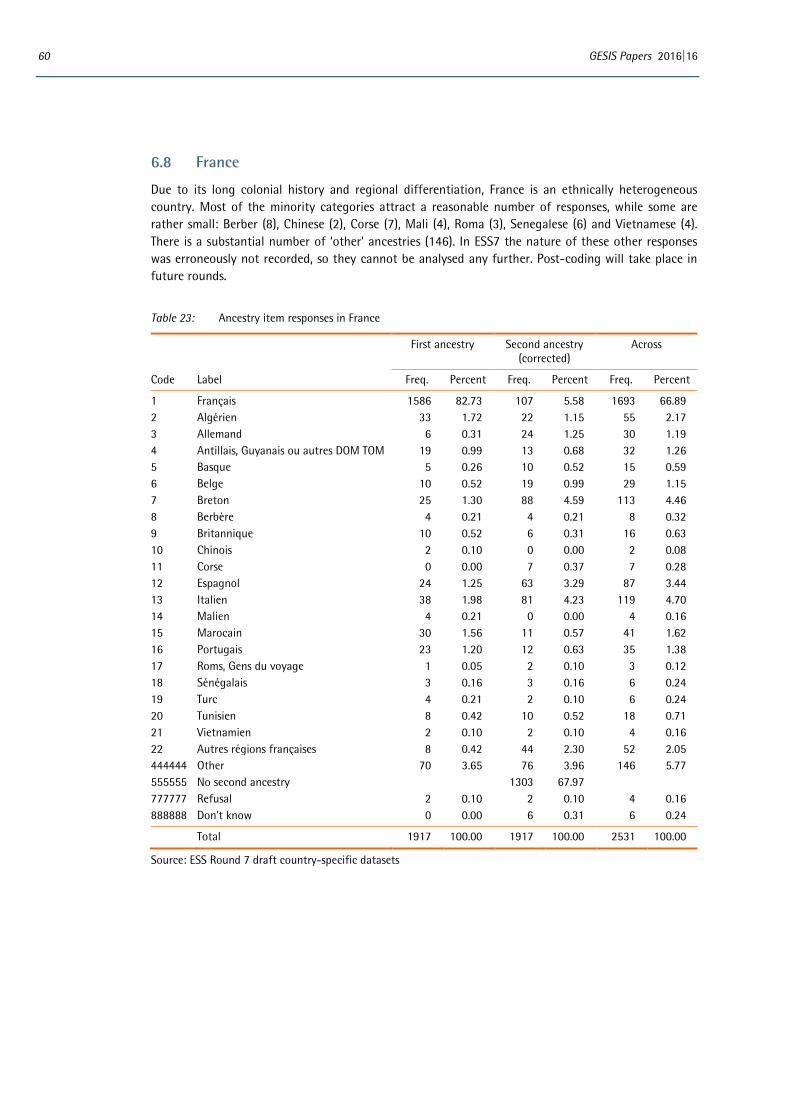
60 GESIS Papers 2016|16
6.8 France
Due to its long colonial history and regional differentiation, France is an ethnically heterogeneous country. Most of the minority categories attract a reasonable number of responses, while some are rather small: Berber (8), Chinese (2), Corse (7), Mali (4), Roma (3), Senegalese (6) and Vietnamese (4). There is a substantial number of ‘other’ ancestries (146). In ESS7 the nature of these other responses was erroneously not recorded, so they cannot be analysed any further. Post-coding will take place in future rounds.
Table 23: Ancestry item responses in France
First ancestry Second ancestry (corrected)
Across
Code Label Freq. Percent Freq. Percent Freq. Percent
1 Français 1586 82.73 107 5.58 1693 66.89 2 Algérien 33 1.72 22 1.15 55 2.17 3 Allemand 6 0.31 24 1.25 30 1.19 4 Antillais, Guyanais ou autres DOM TOM 19 0.99 13 0.68 32 1.26 5 Basque 5 0.26 10 0.52 15 0.59 6 Belge 10 0.52 19 0.99 29 1.15 7 Breton 25 1.30 88 4.59 113 4.46 8 Berbère 4 0.21 4 0.21 8 0.32 9 Britannique 10 0.52 6 0.31 16 0.63 10 Chinois 2 0.10 0 0.00 2 0.08 11 Corse 0 0.00 7 0.37 7 0.28 12 Espagnol 24 1.25 63 3.29 87 3.44 13 Italien 38 1.98 81 4.23 119 4.70 14 Malien 4 0.21 0 0.00 4 0.16 15 Marocain 30 1.56 11 0.57 41 1.62 16 Portugais 23 1.20 12 0.63 35 1.38 17 Roms, Gens du voyage 1 0.05 2 0.10 3 0.12 18 Sénégalais 3 0.16 3 0.16 6 0.24 19 Turc 4 0.21 2 0.10 6 0.24 20 Tunisien 8 0.42 10 0.52 18 0.71 21 Vietnamien 2 0.10 2 0.10 4 0.16 22 Autres régions françaises 8 0.42 44 2.30 52 2.05 444444 Other 70 3.65 76 3.96 146 5.77 555555 No second ancestry 1303 67.97 777777 Refusal 2 0.10 2 0.10 4 0.16 888888 Don't know 0 0.00 6 0.31 6 0.24
Total 1917 100.00 1917 100.00 2531 100.00
Source: ESS Round 7 draft country-specific datasets
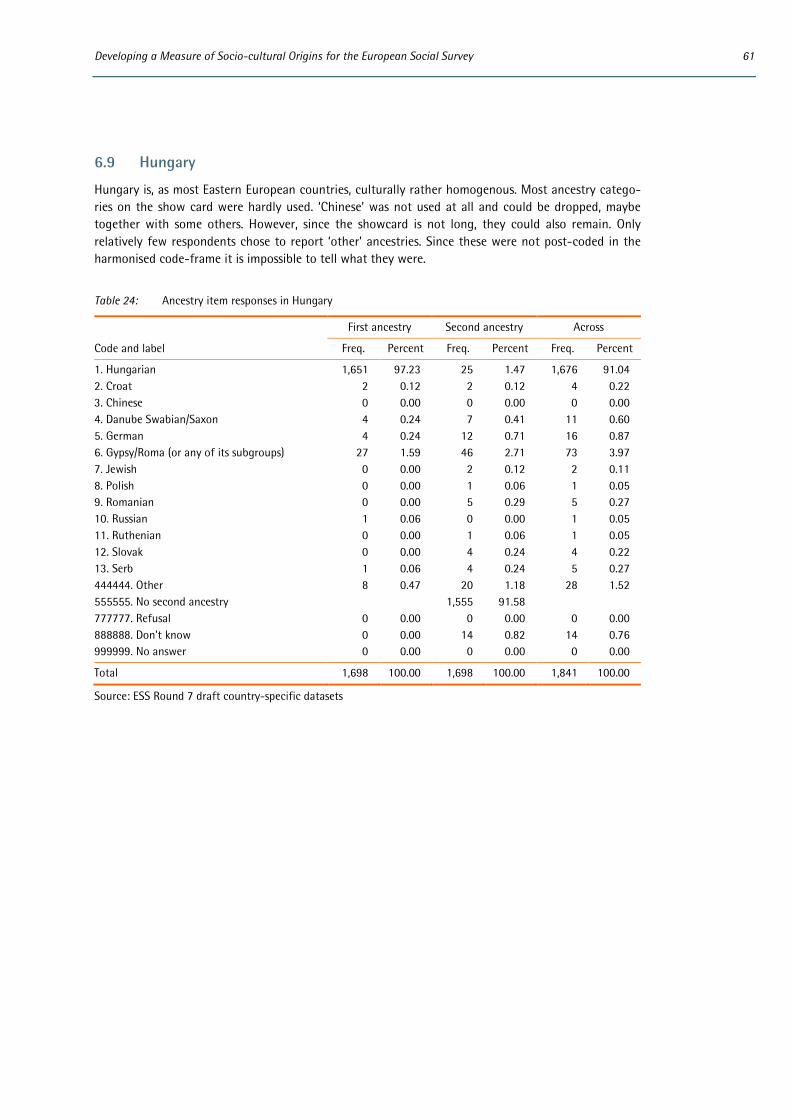
Developing a Measure of Socio-cultural Origins for the European Social Survey 61
6.9 Hungary
Hungary is, as most Eastern European countries, culturally rather homogenous. Most ancestry catego-ries on the show card were hardly used. ‘Chinese’ was not used at all and could be dropped, maybe together with some others. However, since the showcard is not long, they could also remain. Only relatively few respondents chose to report ‘other’ ancestries. Since these were not post-coded in the harmonised code-frame it is impossible to tell what they were.
Table 24: Ancestry item responses in Hungary
First ancestry Second ancestry Across
Code and label Freq. Percent Freq. Percent Freq. Percent
1. Hungarian 1,651 97.23 25 1.47 1,676 91.04 2. Croat 2 0.12 2 0.12 4 0.22 3. Chinese 0 0.00 0 0.00 0 0.00 4. Danube Swabian/Saxon 4 0.24 7 0.41 11 0.60 5. German 4 0.24 12 0.71 16 0.87 6. Gypsy/Roma (or any of its subgroups) 27 1.59 46 2.71 73 3.97 7. Jewish 0 0.00 2 0.12 2 0.11 8. Polish 0 0.00 1 0.06 1 0.05 9. Romanian 0 0.00 5 0.29 5 0.27 10. Russian 1 0.06 0 0.00 1 0.05 11. Ruthenian 0 0.00 1 0.06 1 0.05 12. Slovak 0 0.00 4 0.24 4 0.22 13. Serb 1 0.06 4 0.24 5 0.27 444444. Other 8 0.47 20 1.18 28 1.52 555555. No second ancestry 1,555 91.58 777777. Refusal 0 0.00 0 0.00 0 0.00 888888. Don't know 0 0.00 14 0.82 14 0.76 999999. No answer 0 0.00 0 0.00 0 0.00
Total 1,698 100.00 1,698 100.00 1,841 100.00
Source: ESS Round 7 draft country-specific datasets
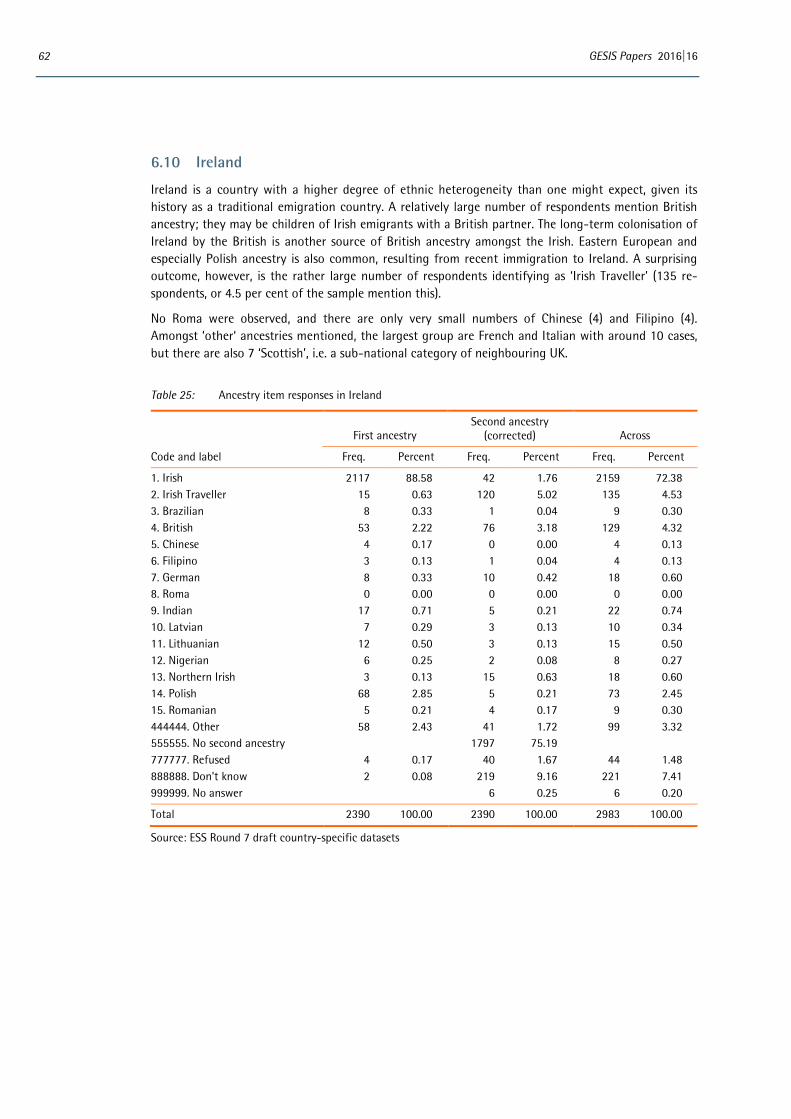
62 GESIS Papers 2016|16
6.10 Ireland
Ireland is a country with a higher degree of ethnic heterogeneity than one might expect, given its history as a traditional emigration country. A relatively large number of respondents mention British ancestry; they may be children of Irish emigrants with a British partner. The long-term colonisation of Ireland by the British is another source of British ancestry amongst the Irish. Eastern European and especially Polish ancestry is also common, resulting from recent immigration to Ireland. A surprising outcome, however, is the rather large number of respondents identifying as ‘Irish Traveller’ (135 re-spondents, or 4.5 per cent of the sample mention this).
No Roma were observed, and there are only very small numbers of Chinese (4) and Filipino (4). Amongst ‘other‘ ancestries mentioned, the largest group are French and Italian with around 10 cases, but there are also 7 ‘Scottish’, i.e. a sub-national category of neighbouring UK.
Table 25: Ancestry item responses in Ireland
First ancestry
Second ancestry (corrected) Across
Code and label Freq. Percent Freq. Percent Freq. Percent
1. Irish 2117 88.58 42 1.76 2159 72.38 2. Irish Traveller 15 0.63 120 5.02 135 4.53 3. Brazilian 8 0.33 1 0.04 9 0.30 4. British 53 2.22 76 3.18 129 4.32 5. Chinese 4 0.17 0 0.00 4 0.13 6. Filipino 3 0.13 1 0.04 4 0.13 7. German 8 0.33 10 0.42 18 0.60 8. Roma 0 0.00 0 0.00 0 0.00 9. Indian 17 0.71 5 0.21 22 0.74 10. Latvian 7 0.29 3 0.13 10 0.34 11. Lithuanian 12 0.50 3 0.13 15 0.50 12. Nigerian 6 0.25 2 0.08 8 0.27 13. Northern Irish 3 0.13 15 0.63 18 0.60 14. Polish 68 2.85 5 0.21 73 2.45 15. Romanian 5 0.21 4 0.17 9 0.30 444444. Other 58 2.43 41 1.72 99 3.32 555555. No second ancestry 1797 75.19 777777. Refused 4 0.17 40 1.67 44 1.48 888888. Don't know 2 0.08 219 9.16 221 7.41 999999. No answer 6 0.25 6 0.20
Total 2390 100.00 2390 100.00 2983 100.00
Source: ESS Round 7 draft country-specific datasets

Developing a Measure of Socio-cultural Origins for the European Social Survey 63
6.11 Israel
Israel is internally highly differentiated along religious and ethnic lines. Almost all categories on the showcard were used by more than 10 respondents – with the exception of ‘Polish’. There are no ‘other’ ancestries reported, although the response option was included in the questionnaire and show card.
Table 26: Ancestry item responses in Israel
First ancestry Second ancestry (corrected)
Across
Code and label Freq. Percent Freq. Percent Freq. Percent
1. Israeli 1,091 42.58 890 34.74 1,981 40.08 2. Arab 228 8.90 105 4.10 333 6.74 3. Palestinian 44 1.72 100 3.90 144 2.91 4. Muslim 162 6.32 143 5.58 305 6.17 5. Jewish 863 33.68 799 31.19 1,662 33.62 6. Ashkenazi 27 1.05 101 3.94 128 2.59 7. Mizrahi 7 0.27 35 1.37 42 0.85 8. Sephardi 9 0.35 35 1.37 44 0.89 9. Bedouin 8 0.31 13 0.51 21 0.42 10. Druze 27 1.05 16 0.62 43 0.87 11. Ethiopian 11 0.43 10 0.39 21 0.42 12. Iraqi 6 0.23 6 0.23 12 0.24 13. Moroccan 6 0.23 17 0.66 23 0.47 14. Polish 4 0.16 4 0.16 8 0.16 15. Romanian 4 0.16 9 0.35 13 0.26 16. Russian 23 0.90 52 2.03 75 1.52 17. Ukrainian 5 0.20 16 0.62 21 0.42 444444. Other 0 0.00 0 0.00 0 0.00 555555. No second ancestry 181 7.06 777777. Refusal 30 1.17 30 1.17 60 1.21 888888. Don't know 7 0.27 0 0.00 7 0.14 999999. No answer 0 0.00 0 0.00 0 0.00
Total 2,562 100.00 2,562 100.00 4,943 100.00
Source: ESS Round 7 draft country-specific datasets
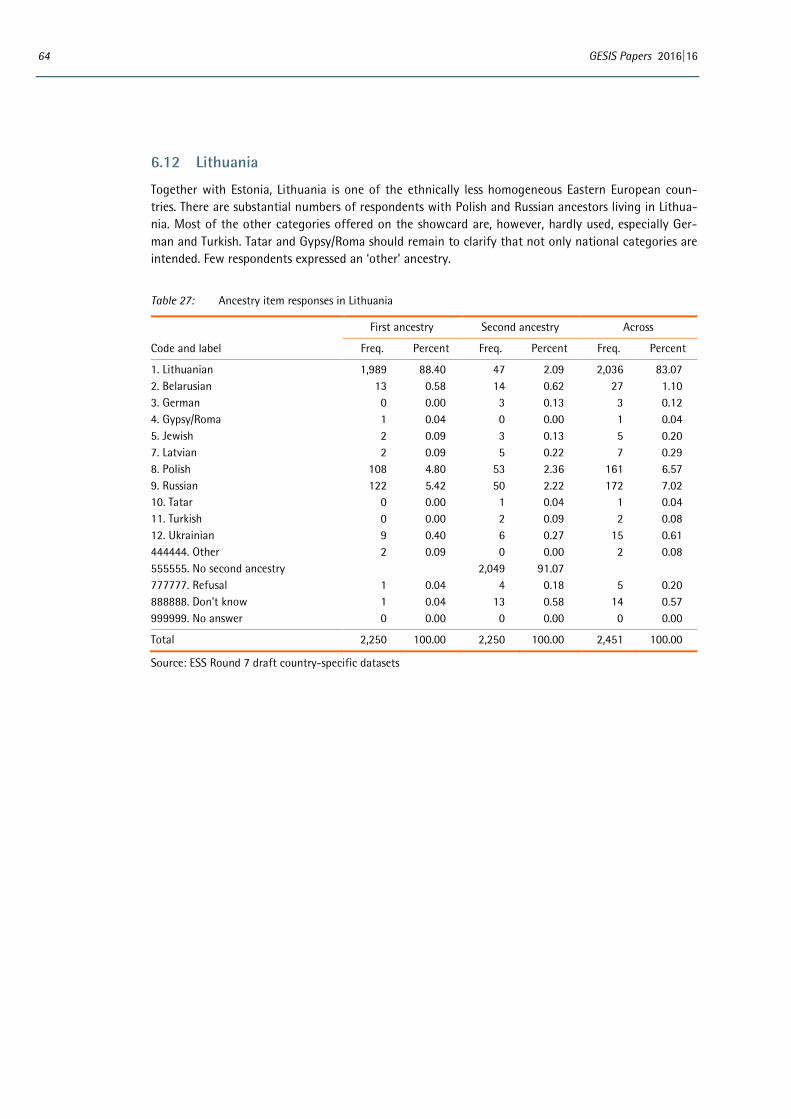
64 GESIS Papers 2016|16
6.12 Lithuania
Together with Estonia, Lithuania is one of the ethnically less homogeneous Eastern European coun-tries. There are substantial numbers of respondents with Polish and Russian ancestors living in Lithua-nia. Most of the other categories offered on the showcard are, however, hardly used, especially Ger-man and Turkish. Tatar and Gypsy/Roma should remain to clarify that not only national categories are intended. Few respondents expressed an ‘other’ ancestry.
Table 27: Ancestry item responses in Lithuania
First ancestry Second ancestry Across
Code and label Freq. Percent Freq. Percent Freq. Percent
1. Lithuanian 1,989 88.40 47 2.09 2,036 83.07 2. Belarusian 13 0.58 14 0.62 27 1.10 3. German 0 0.00 3 0.13 3 0.12 4. Gypsy/Roma 1 0.04 0 0.00 1 0.04 5. Jewish 2 0.09 3 0.13 5 0.20 7. Latvian 2 0.09 5 0.22 7 0.29 8. Polish 108 4.80 53 2.36 161 6.57 9. Russian 122 5.42 50 2.22 172 7.02 10. Tatar 0 0.00 1 0.04 1 0.04 11. Turkish 0 0.00 2 0.09 2 0.08 12. Ukrainian 9 0.40 6 0.27 15 0.61 444444. Other 2 0.09 0 0.00 2 0.08 555555. No second ancestry 2,049 91.07 777777. Refusal 1 0.04 4 0.18 5 0.20 888888. Don't know 1 0.04 13 0.58 14 0.57 999999. No answer 0 0.00 0 0.00 0 0.00
Total 2,250 100.00 2,250 100.00 2,451 100.00
Source: ESS Round 7 draft country-specific datasets
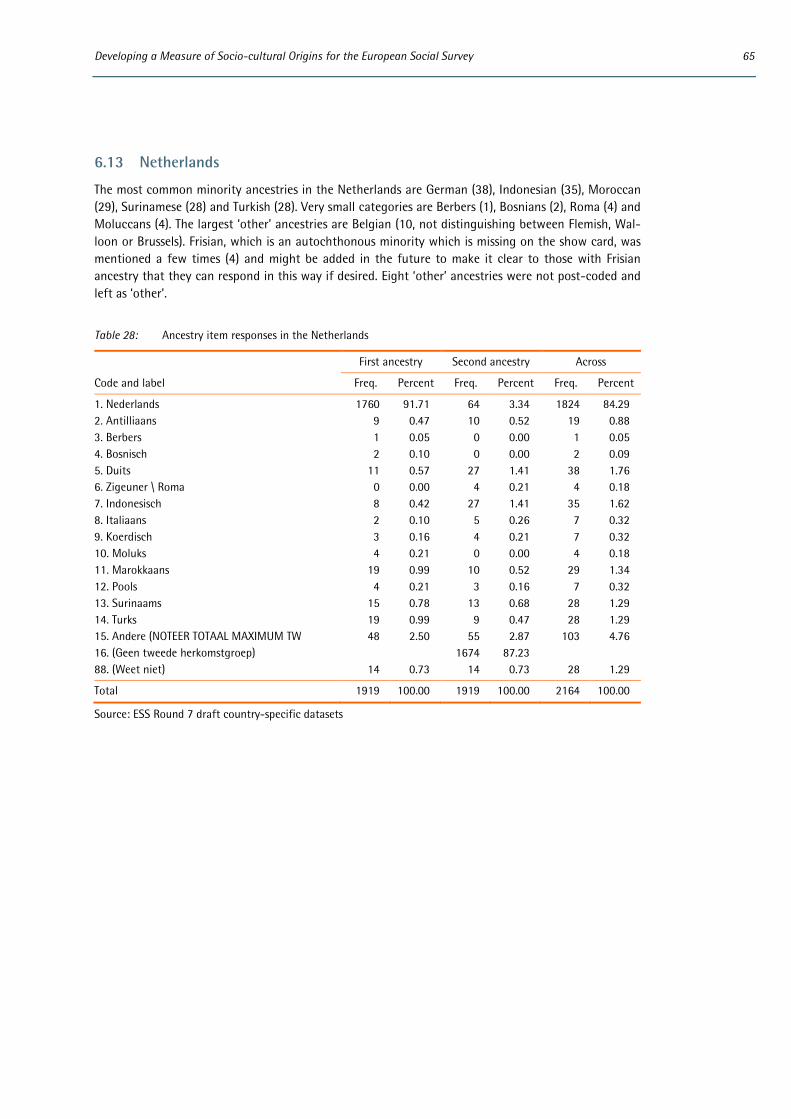
Developing a Measure of Socio-cultural Origins for the European Social Survey 65
6.13 Netherlands
The most common minority ancestries in the Netherlands are German (38), Indonesian (35), Moroccan (29), Surinamese (28) and Turkish (28). Very small categories are Berbers (1), Bosnians (2), Roma (4) and Moluccans (4). The largest ‘other’ ancestries are Belgian (10, not distinguishing between Flemish, Wal-loon or Brussels). Frisian, which is an autochthonous minority which is missing on the show card, was mentioned a few times (4) and might be added in the future to make it clear to those with Frisian ancestry that they can respond in this way if desired. Eight ‘other’ ancestries were not post-coded and left as ‘other’.
Table 28: Ancestry item responses in the Netherlands
First ancestry Second ancestry Across
Code and label Freq. Percent Freq. Percent Freq. Percent
1. Nederlands 1760 91.71 64 3.34 1824 84.29 2. Antilliaans 9 0.47 10 0.52 19 0.88 3. Berbers 1 0.05 0 0.00 1 0.05 4. Bosnisch 2 0.10 0 0.00 2 0.09 5. Duits 11 0.57 27 1.41 38 1.76 6. Zigeuner \ Roma 0 0.00 4 0.21 4 0.18 7. Indonesisch 8 0.42 27 1.41 35 1.62 8. Italiaans 2 0.10 5 0.26 7 0.32 9. Koerdisch 3 0.16 4 0.21 7 0.32 10. Moluks 4 0.21 0 0.00 4 0.18 11. Marokkaans 19 0.99 10 0.52 29 1.34 12. Pools 4 0.21 3 0.16 7 0.32 13. Surinaams 15 0.78 13 0.68 28 1.29 14. Turks 19 0.99 9 0.47 28 1.29 15. Andere (NOTEER TOTAAL MAXIMUM TW 48 2.50 55 2.87 103 4.76 16. (Geen tweede herkomstgroep) 1674 87.23 88. (Weet niet) 14 0.73 14 0.73 28 1.29
Total 1919 100.00 1919 100.00 2164 100.00
Source: ESS Round 7 draft country-specific datasets
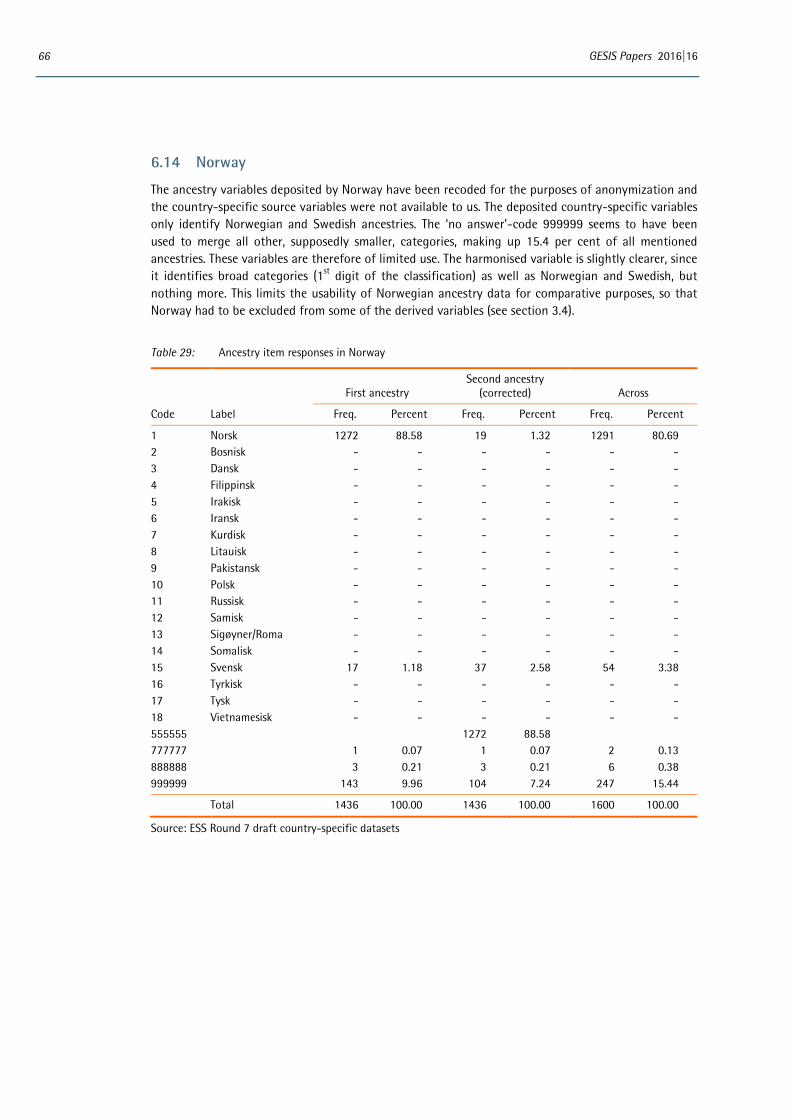
66 GESIS Papers 2016|16
6.14 Norway
The ancestry variables deposited by Norway have been recoded for the purposes of anonymization and the country-specific source variables were not available to us. The deposited country-specific variables only identify Norwegian and Swedish ancestries. The ‘no answer’-code 999999 seems to have been used to merge all other, supposedly smaller, categories, making up 15.4 per cent of all mentioned ancestries. These variables are therefore of limited use. The harmonised variable is slightly clearer, since it identifies broad categories (1st digit of the classification) as well as Norwegian and Swedish, but nothing more. This limits the usability of Norwegian ancestry data for comparative purposes, so that Norway had to be excluded from some of the derived variables (see section 3.4).
Table 29: Ancestry item responses in Norway
First ancestry
Second ancestry (corrected) Across
Code Label Freq. Percent Freq. Percent Freq. Percent
1 Norsk 1272 88.58 19 1.32 1291 80.69 2 Bosnisk - - - - - - 3 Dansk - - - - - - 4 Filippinsk - - - - - - 5 Irakisk - - - - - - 6 Iransk - - - - - - 7 Kurdisk - - - - - - 8 Litauisk - - - - - - 9 Pakistansk - - - - - - 10 Polsk - - - - - - 11 Russisk - - - - - - 12 Samisk - - - - - - 13 Sigøyner/Roma - - - - - - 14 Somalisk - - - - - - 15 Svensk 17 1.18 37 2.58 54 3.38 16 Tyrkisk - - - - - - 17 Tysk - - - - - - 18 Vietnamesisk - - - - - - 555555 1272 88.58 777777 1 0.07 1 0.07 2 0.13 888888 3 0.21 3 0.21 6 0.38 999999 143 9.96 104 7.24 247 15.44
Total 1436 100.00 1436 100.00 1600 100.00
Source: ESS Round 7 draft country-specific datasets
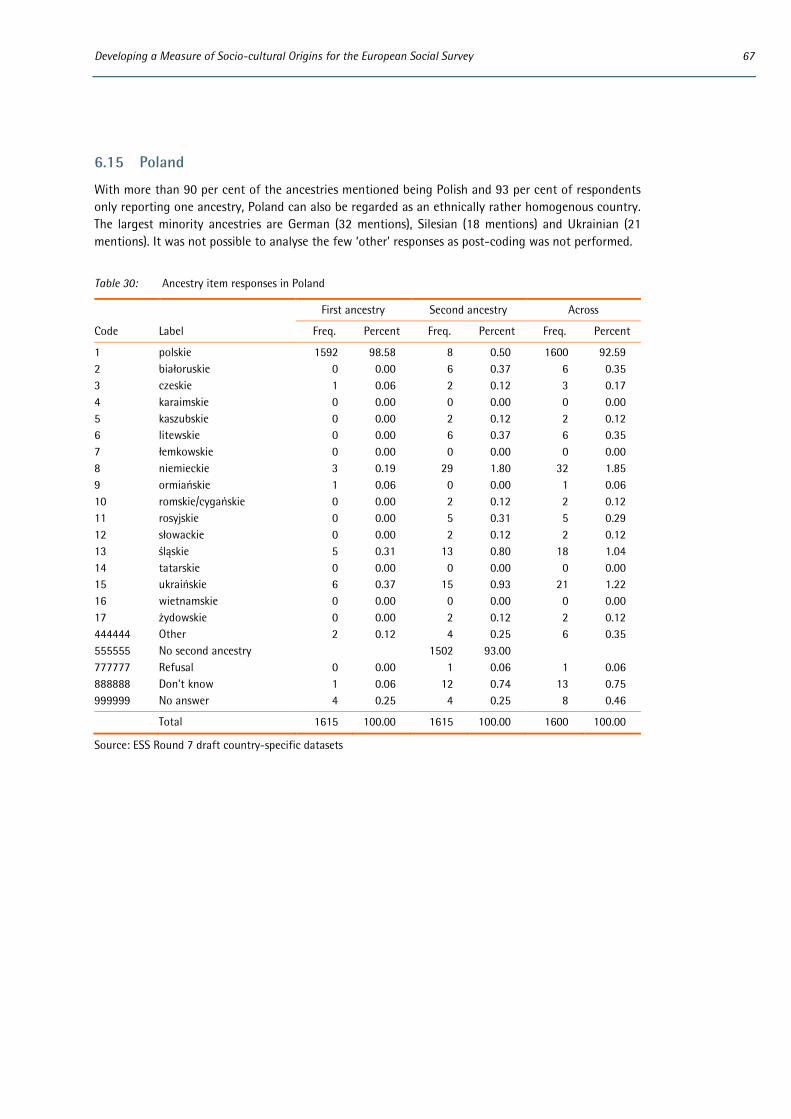
Developing a Measure of Socio-cultural Origins for the European Social Survey 67
6.15 Poland
With more than 90 per cent of the ancestries mentioned being Polish and 93 per cent of respondents only reporting one ancestry, Poland can also be regarded as an ethnically rather homogenous country. The largest minority ancestries are German (32 mentions), Silesian (18 mentions) and Ukrainian (21 mentions). It was not possible to analyse the few ‘other’ responses as post-coding was not performed.
Table 30: Ancestry item responses in Poland
First ancestry Second ancestry Across
Code Label Freq. Percent Freq. Percent Freq. Percent
1 polskie 1592 98.58 8 0.50 1600 92.59 2 białoruskie 0 0.00 6 0.37 6 0.35 3 czeskie 1 0.06 2 0.12 3 0.17 4 karaimskie 0 0.00 0 0.00 0 0.00 5 kaszubskie 0 0.00 2 0.12 2 0.12 6 litewskie 0 0.00 6 0.37 6 0.35 7 łemkowskie 0 0.00 0 0.00 0 0.00 8 niemieckie 3 0.19 29 1.80 32 1.85 9 ormiańskie 1 0.06 0 0.00 1 0.06 10 romskie/cygańskie 0 0.00 2 0.12 2 0.12 11 rosyjskie 0 0.00 5 0.31 5 0.29 12 słowackie 0 0.00 2 0.12 2 0.12 13 śląskie 5 0.31 13 0.80 18 1.04 14 tatarskie 0 0.00 0 0.00 0 0.00 15 ukraińskie 6 0.37 15 0.93 21 1.22 16 wietnamskie 0 0.00 0 0.00 0 0.00 17 żydowskie 0 0.00 2 0.12 2 0.12 444444 Other 2 0.12 4 0.25 6 0.35 555555 No second ancestry 1502 93.00 777777 Refusal 0 0.00 1 0.06 1 0.06 888888 Don't know 1 0.06 12 0.74 13 0.75 999999 No answer 4 0.25 4 0.25 8 0.46
Total 1615 100.00 1615 100.00 1600 100.00
Source: ESS Round 7 draft country-specific datasets
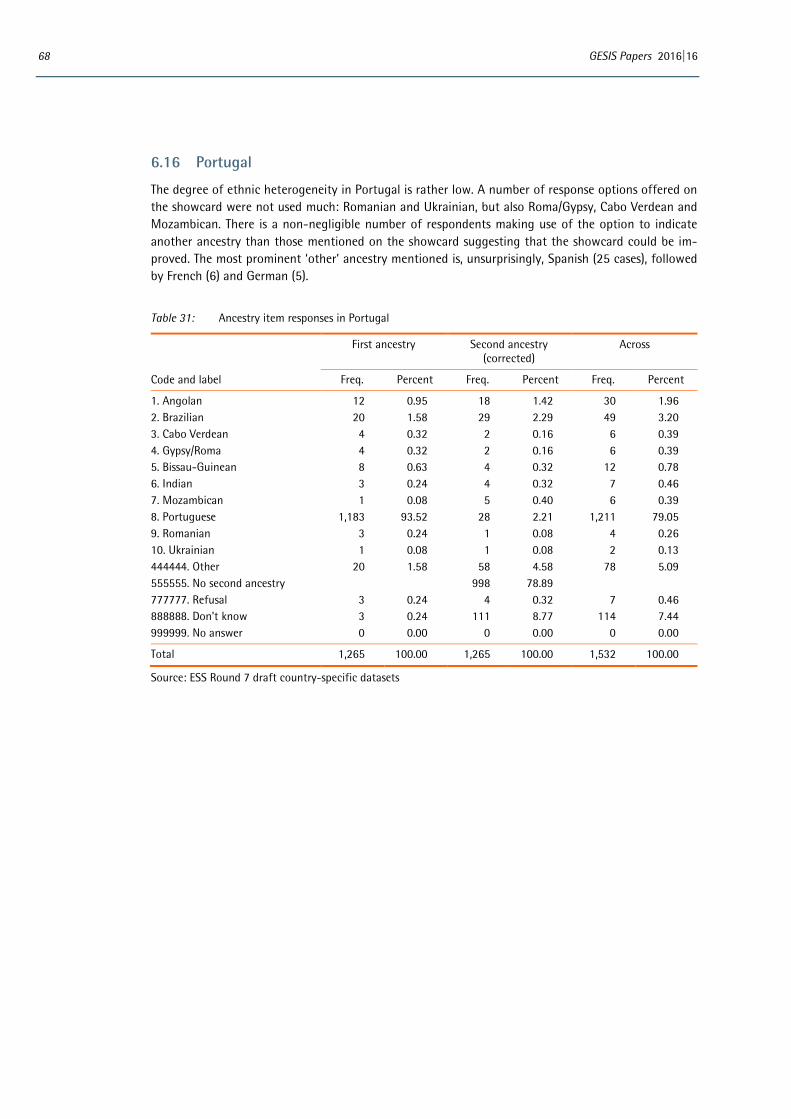
68 GESIS Papers 2016|16
6.16 Portugal
The degree of ethnic heterogeneity in Portugal is rather low. A number of response options offered on the showcard were not used much: Romanian and Ukrainian, but also Roma/Gypsy, Cabo Verdean and Mozambican. There is a non-negligible number of respondents making use of the option to indicate another ancestry than those mentioned on the showcard suggesting that the showcard could be im-proved. The most prominent ‘other’ ancestry mentioned is, unsurprisingly, Spanish (25 cases), followed by French (6) and German (5).
Table 31: Ancestry item responses in Portugal
First ancestry Second ancestry (corrected)
Across
Code and label Freq. Percent Freq. Percent Freq. Percent
1. Angolan 12 0.95 18 1.42 30 1.96 2. Brazilian 20 1.58 29 2.29 49 3.20 3. Cabo Verdean 4 0.32 2 0.16 6 0.39 4. Gypsy/Roma 4 0.32 2 0.16 6 0.39 5. Bissau-Guinean 8 0.63 4 0.32 12 0.78 6. Indian 3 0.24 4 0.32 7 0.46 7. Mozambican 1 0.08 5 0.40 6 0.39 8. Portuguese 1,183 93.52 28 2.21 1,211 79.05 9. Romanian 3 0.24 1 0.08 4 0.26 10. Ukrainian 1 0.08 1 0.08 2 0.13 444444. Other 20 1.58 58 4.58 78 5.09 555555. No second ancestry 998 78.89 777777. Refusal 3 0.24 4 0.32 7 0.46 888888. Don't know 3 0.24 111 8.77 114 7.44 999999. No answer 0 0.00 0 0.00 0 0.00
Total 1,265 100.00 1,265 100.00 1,532 100.00
Source: ESS Round 7 draft country-specific datasets
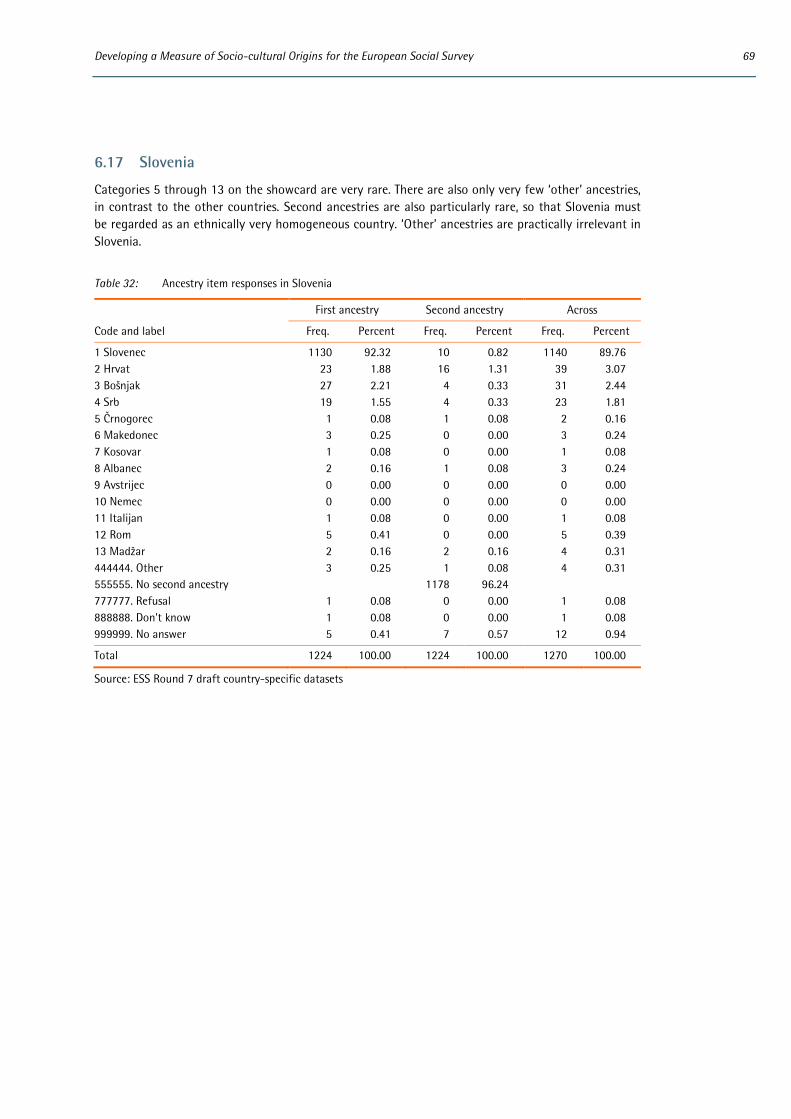
Developing a Measure of Socio-cultural Origins for the European Social Survey 69
6.17 Slovenia
Categories 5 through 13 on the showcard are very rare. There are also only very few ‘other’ ancestries, in contrast to the other countries. Second ancestries are also particularly rare, so that Slovenia must be regarded as an ethnically very homogeneous country. ‘Other’ ancestries are practically irrelevant in Slovenia.
Table 32: Ancestry item responses in Slovenia
First ancestry Second ancestry Across
Code and label Freq. Percent Freq. Percent Freq. Percent
1 Slovenec 1130 92.32 10 0.82 1140 89.76 2 Hrvat 23 1.88 16 1.31 39 3.07 3 Bošnjak 27 2.21 4 0.33 31 2.44 4 Srb 19 1.55 4 0.33 23 1.81 5 Črnogorec 1 0.08 1 0.08 2 0.16 6 Makedonec 3 0.25 0 0.00 3 0.24 7 Kosovar 1 0.08 0 0.00 1 0.08 8 Albanec 2 0.16 1 0.08 3 0.24 9 Avstrijec 0 0.00 0 0.00 0 0.00 10 Nemec 0 0.00 0 0.00 0 0.00 11 Italijan 1 0.08 0 0.00 1 0.08 12 Rom 5 0.41 0 0.00 5 0.39 13 Madžar 2 0.16 2 0.16 4 0.31 444444. Other 3 0.25 1 0.08 4 0.31 555555. No second ancestry 1178 96.24 777777. Refusal 1 0.08 0 0.00 1 0.08 888888. Don't know 1 0.08 0 0.00 1 0.08 999999. No answer 5 0.41 7 0.57 12 0.94
Total 1224 100.00 1224 100.00 1270 100.00
Source: ESS Round 7 draft country-specific datasets
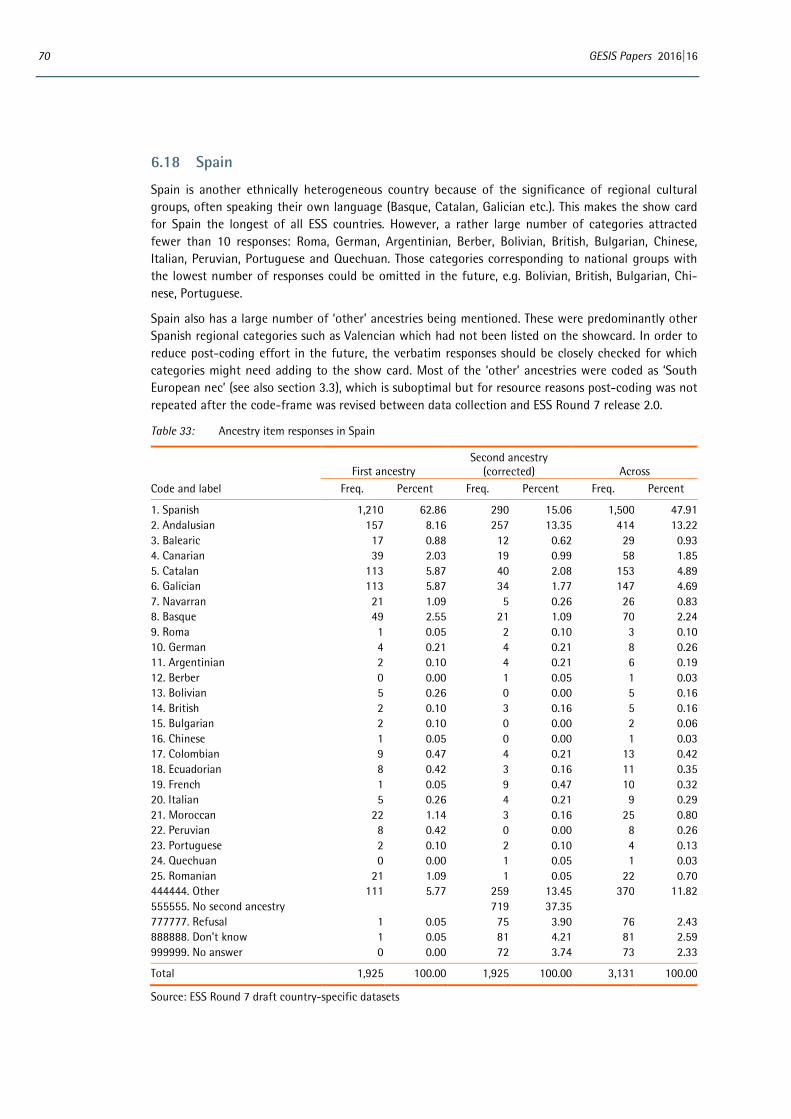
70 GESIS Papers 2016|16
6.18 Spain
Spain is another ethnically heterogeneous country because of the significance of regional cultural groups, often speaking their own language (Basque, Catalan, Galician etc.). This makes the show card for Spain the longest of all ESS countries. However, a rather large number of categories attracted fewer than 10 responses: Roma, German, Argentinian, Berber, Bolivian, British, Bulgarian, Chinese, Italian, Peruvian, Portuguese and Quechuan. Those categories corresponding to national groups with the lowest number of responses could be omitted in the future, e.g. Bolivian, British, Bulgarian, Chi-nese, Portuguese.
Spain also has a large number of ‘other’ ancestries being mentioned. These were predominantly other Spanish regional categories such as Valencian which had not been listed on the showcard. In order to reduce post-coding effort in the future, the verbatim responses should be closely checked for which categories might need adding to the show card. Most of the ‘other’ ancestries were coded as ‘South European nec’ (see also section 3.3), which is suboptimal but for resource reasons post-coding was not repeated after the code-frame was revised between data collection and ESS Round 7 release 2.0.
Table 33: Ancestry item responses in Spain
First ancestry
Second ancestry (corrected) Across
Code and label Freq. Percent Freq. Percent Freq. Percent
1. Spanish 1,210 62.86 290 15.06 1,500 47.91 2. Andalusian 157 8.16 257 13.35 414 13.22 3. Balearic 17 0.88 12 0.62 29 0.93 4. Canarian 39 2.03 19 0.99 58 1.85 5. Catalan 113 5.87 40 2.08 153 4.89 6. Galician 113 5.87 34 1.77 147 4.69 7. Navarran 21 1.09 5 0.26 26 0.83 8. Basque 49 2.55 21 1.09 70 2.24 9. Roma 1 0.05 2 0.10 3 0.10 10. German 4 0.21 4 0.21 8 0.26 11. Argentinian 2 0.10 4 0.21 6 0.19 12. Berber 0 0.00 1 0.05 1 0.03 13. Bolivian 5 0.26 0 0.00 5 0.16 14. British 2 0.10 3 0.16 5 0.16 15. Bulgarian 2 0.10 0 0.00 2 0.06 16. Chinese 1 0.05 0 0.00 1 0.03 17. Colombian 9 0.47 4 0.21 13 0.42 18. Ecuadorian 8 0.42 3 0.16 11 0.35 19. French 1 0.05 9 0.47 10 0.32 20. Italian 5 0.26 4 0.21 9 0.29 21. Moroccan 22 1.14 3 0.16 25 0.80 22. Peruvian 8 0.42 0 0.00 8 0.26 23. Portuguese 2 0.10 2 0.10 4 0.13 24. Quechuan 0 0.00 1 0.05 1 0.03 25. Romanian 21 1.09 1 0.05 22 0.70 444444. Other 111 5.77 259 13.45 370 11.82 555555. No second ancestry 719 37.35 777777. Refusal 1 0.05 75 3.90 76 2.43 888888. Don't know 1 0.05 81 4.21 81 2.59 999999. No answer 0 0.00 72 3.74 73 2.33
Total 1,925 100.00 1,925 100.00 3,131 100.00
Source: ESS Round 7 draft country-specific datasets

Developing a Measure of Socio-cultural Origins for the European Social Survey 71
6.19 Sweden
After correcting for the many respondents who mentioned the same ancestry as 1st and 2nd ancestry (see section 3.2), the data look very plausible. Sweden can be regarded as a somewhat ethnically het-erogeneous country, mostly due to relatively recent immigration. The largest migrant origin groups are however still those with Danish, Finnish or Norwegian ancestry so that overall, regional migration patterns prevail. There are a few very small categories, especially Sami (4) and Somali (5). Amongst the ‘other’’ ancestries mentioned, the largest group refers to German (11 cases), followed by English (sic), Greek, Serbian, Hungarian, Russian and Lebanese (5-7 cases each). However, almost all who mentioned ‘other’ as their 2nd ancestry were mistakenly recoded to ‘no second ancestry’ in the harmonised varia-bles (58 cases) which means these responses cannot easily be used in analysis.
Table 34: Ancestry item responses in Sweden
First ancestry Second ancestry (corrected)
Across
Code and label Freq. Percent Freq. Percent Freq. Percent
1. Swedish 1545 86.26 47 2.62 1592 80.81 2. Bosniak 14 0.78 0 0.00 14 0.71 3. Chilean 7 0.39 1 0.06 8 0.41 4. Danish 8 0.45 10 0.56 18 0.91 5. Finnish 36 2.01 26 1.45 62 3.15 7. Iranian 10 0.56 3 0.17 13 0.66 8. Iraqi 8 0.45 1 0.06 9 0.46 9. Kurdish 11 0.61 1 0.06 12 0.61 10. Norwegian 7 0.39 16 0.89 23 1.17 11. Polish 7 0.39 4 0.22 11 0.56 12. Sami 0 0.00 4 0.22 4 0.20 13. Somali 5 0.28 0 0.00 5 0.25 14. Vietnamese 5 0.28 1 0.06 6 0.30 444444. Other 125 6.98 59 3.29 184 9.34 555555. No second ancestry 1612 90.01 777777. Refused 1 0.06 2 0.11 3 0.15 888888. Don't know 2 0.11 4 0.22 6 0.30
Total 1791 100.00 1791 100.00 1970 100.00
Source: ESS Round 7 draft country-specific datasets
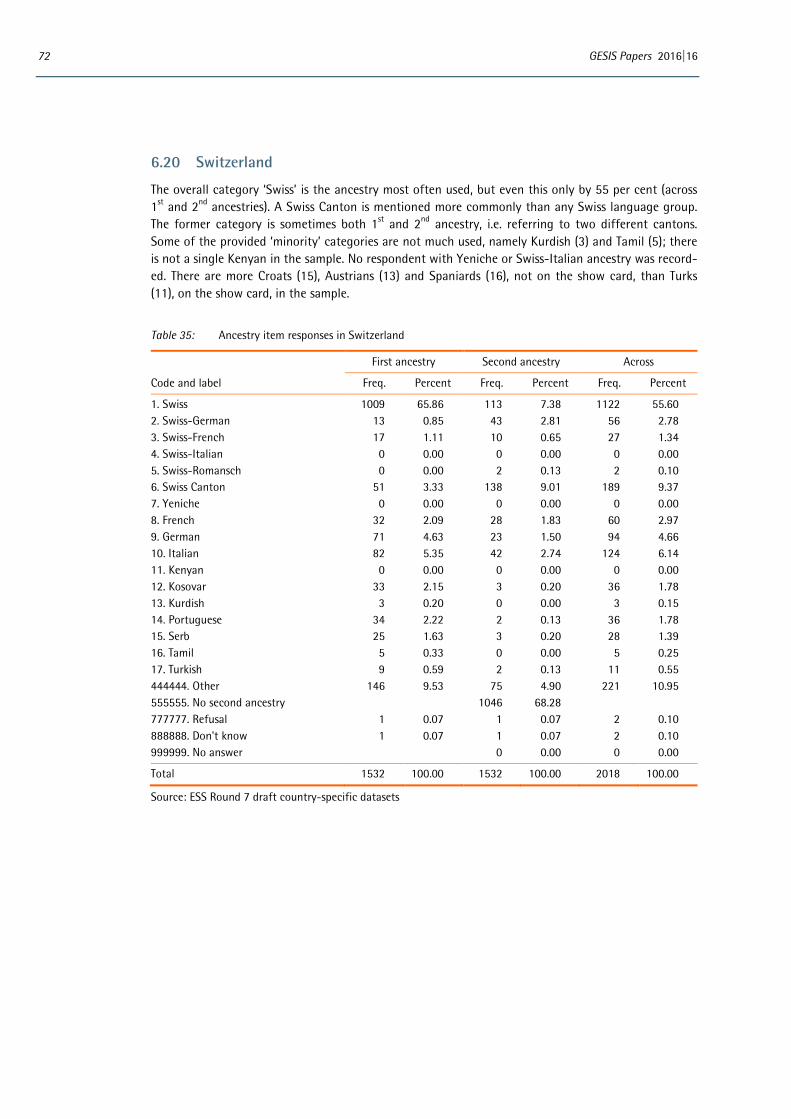
72 GESIS Papers 2016|16
6.20 Switzerland
The overall category ‘Swiss’ is the ancestry most often used, but even this only by 55 per cent (across 1st and 2nd ancestries). A Swiss Canton is mentioned more commonly than any Swiss language group. The former category is sometimes both 1st and 2nd ancestry, i.e. referring to two different cantons. Some of the provided ‘minority’ categories are not much used, namely Kurdish (3) and Tamil (5); there is not a single Kenyan in the sample. No respondent with Yeniche or Swiss-Italian ancestry was record-ed. There are more Croats (15), Austrians (13) and Spaniards (16), not on the show card, than Turks (11), on the show card, in the sample.
Table 35: Ancestry item responses in Switzerland
First ancestry Second ancestry Across
Code and label Freq. Percent Freq. Percent Freq. Percent
1. Swiss 1009 65.86 113 7.38 1122 55.60 2. Swiss-German 13 0.85 43 2.81 56 2.78 3. Swiss-French 17 1.11 10 0.65 27 1.34 4. Swiss-Italian 0 0.00 0 0.00 0 0.00 5. Swiss-Romansch 0 0.00 2 0.13 2 0.10 6. Swiss Canton 51 3.33 138 9.01 189 9.37 7. Yeniche 0 0.00 0 0.00 0 0.00 8. French 32 2.09 28 1.83 60 2.97 9. German 71 4.63 23 1.50 94 4.66 10. Italian 82 5.35 42 2.74 124 6.14 11. Kenyan 0 0.00 0 0.00 0 0.00 12. Kosovar 33 2.15 3 0.20 36 1.78 13. Kurdish 3 0.20 0 0.00 3 0.15 14. Portuguese 34 2.22 2 0.13 36 1.78 15. Serb 25 1.63 3 0.20 28 1.39 16. Tamil 5 0.33 0 0.00 5 0.25 17. Turkish 9 0.59 2 0.13 11 0.55 444444. Other 146 9.53 75 4.90 221 10.95 555555. No second ancestry 1046 68.28 777777. Refusal 1 0.07 1 0.07 2 0.10 888888. Don't know 1 0.07 1 0.07 2 0.10 999999. No answer 0 0.00 0 0.00
Total 1532 100.00 1532 100.00 2018 100.00
Source: ESS Round 7 draft country-specific datasets
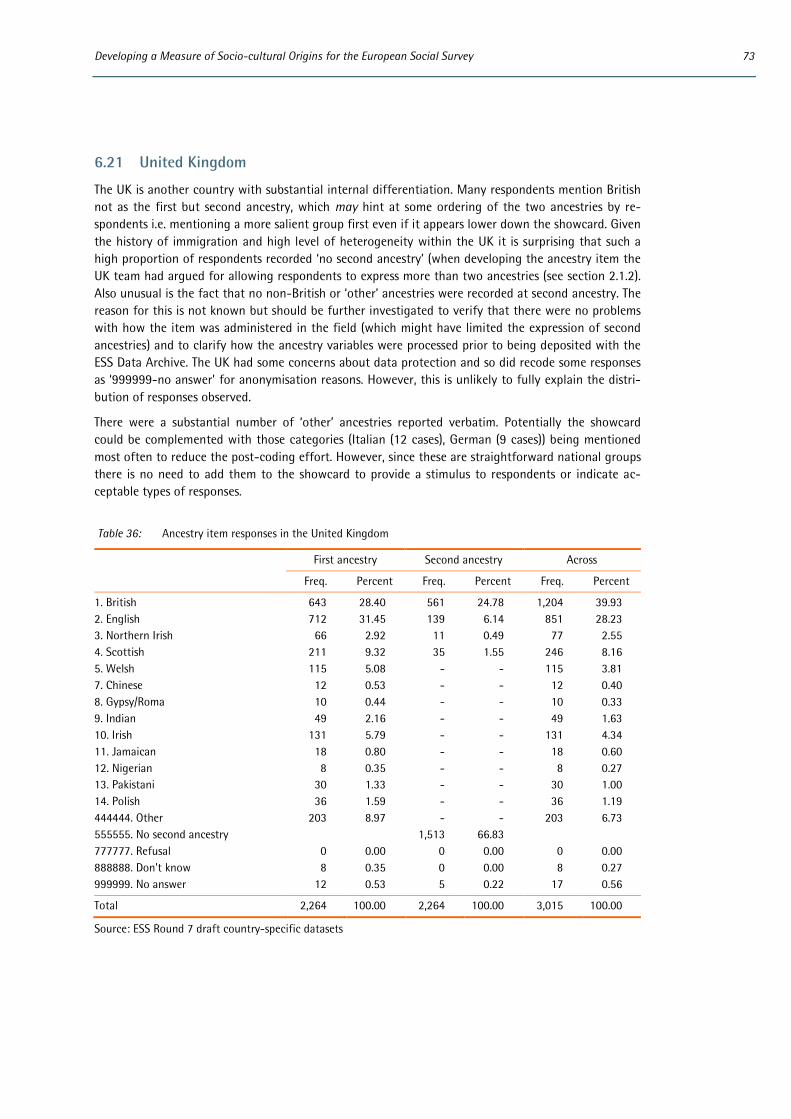
Developing a Measure of Socio-cultural Origins for the European Social Survey 73
6.21 United Kingdom
The UK is another country with substantial internal differentiation. Many respondents mention British not as the first but second ancestry, which may hint at some ordering of the two ancestries by re-spondents i.e. mentioning a more salient group first even if it appears lower down the showcard. Given the history of immigration and high level of heterogeneity within the UK it is surprising that such a high proportion of respondents recorded ‘no second ancestry’ (when developing the ancestry item the UK team had argued for allowing respondents to express more than two ancestries (see section 2.1.2). Also unusual is the fact that no non-British or ‘other’ ancestries were recorded at second ancestry. The reason for this is not known but should be further investigated to verify that there were no problems with how the item was administered in the field (which might have limited the expression of second ancestries) and to clarify how the ancestry variables were processed prior to being deposited with the ESS Data Archive. The UK had some concerns about data protection and so did recode some responses as ‘999999-no answer’ for anonymisation reasons. However, this is unlikely to fully explain the distri-bution of responses observed.
There were a substantial number of ‘other’ ancestries reported verbatim. Potentially the showcard could be complemented with those categories (Italian (12 cases), German (9 cases)) being mentioned most often to reduce the post-coding effort. However, since these are straightforward national groups there is no need to add them to the showcard to provide a stimulus to respondents or indicate ac-ceptable types of responses.
Table 36: Ancestry item responses in the United Kingdom
First ancestry Second ancestry Across
Freq. Percent Freq. Percent Freq. Percent
1. British 643 28.40 561 24.78 1,204 39.93 2. English 712 31.45 139 6.14 851 28.23 3. Northern Irish 66 2.92 11 0.49 77 2.55 4. Scottish 211 9.32 35 1.55 246 8.16 5. Welsh 115 5.08 - - 115 3.81 7. Chinese 12 0.53 - - 12 0.40 8. Gypsy/Roma 10 0.44 - - 10 0.33 9. Indian 49 2.16 - - 49 1.63 10. Irish 131 5.79 - - 131 4.34 11. Jamaican 18 0.80 - - 18 0.60 12. Nigerian 8 0.35 - - 8 0.27 13. Pakistani 30 1.33 - - 30 1.00 14. Polish 36 1.59 - - 36 1.19 444444. Other 203 8.97 - - 203 6.73 555555. No second ancestry 1,513 66.83 777777. Refusal 0 0.00 0 0.00 0 0.00 888888. Don't know 8 0.35 0 0.00 8 0.27 999999. No answer 12 0.53 5 0.22 17 0.56
Total 2,264 100.00 2,264 100.00 3,015 100.00
Source: ESS Round 7 draft country-specific datasets