
Herstellung poröser Metalloxide für katalytische ... · Aus dem Max-Planck Institut für Kolloid...
137
Aus dem Max-Planck Institut für Kolloid and Grenzflächenforschung Herstellung poröser Metalloxide für katalytische Anwendungen unter Verwendung von Templatierungsverfahren Fabrication of porous metal oxides for catalytic applications using templating techniques Dissertation zur Erlangung des akademischen Grades "doctor rerum naturalium" (Dr. rer. nat.) in der Wissenschaftsdisziplin "Kolloidchemie" eingereicht an der Mathematisch-Naturwissenschaftlichen Fakultät der Universität Potsdam von Atul Suresh Deshpande Aus Daund, Indien Potsdam, den 19. April 2004
Transcript of Herstellung poröser Metalloxide für katalytische ... · Aus dem Max-Planck Institut für Kolloid...
Aus dem Max-Planck Institut für Kolloid and Grenzflächenforschung
Herstellung poröser Metalloxide für katalytische Anwendungen unter Verwendung von Templatierungsverfahren
Fabrication of porous metal oxides for catalytic applications using templating
techniques
Dissertation zur Erlangung des akademischen Grades
"doctor rerum naturalium" (Dr. rer. nat.)
in der Wissenschaftsdisziplin "Kolloidchemie"
eingereicht an der Mathematisch-Naturwissenschaftlichen Fakultät
der Universität Potsdam
von Atul Suresh Deshpande
Aus Daund, Indien
Potsdam, den 19. April 2004
Contents
1 Introduction………………………………………………………………………...1
2 Background………………………………………………………………………...5
2.1 Porous materials………………………………………………….……………..…6
2.1.1 Characteristics ………………………………………………………………………6
2.1.2 History……………………………………………………………………………….7
2.2 Precursors………………………………………………………………………….11
2.3 Materials…………………………………………………………………………...13
2.3.1 Titanium dioxide…………………………………………………………………...14
2.3.2 Cerium dioxide……………………………………………………………………..15
2.3.3 CeO2-ZrO2 binary system………………………………………………………….16
2.4 Applications……………………………………………………………………….18
2.4.1 Semiconductor photocatalysis……………………………………………………..18
2.4.2 Steam reforming of methanol……………………………………………………...22
3 Methods…………………………………………………………………………….24
3.1 Nitrogen sorption studies……………………………………………………….24
3.2 Electron microscopy…………………………………………………………….29
3.2.1 Transmission electron microscopy (TEM)………………….……………………..31
3.2.2 Scanning electron microscopy (SEM)……………………………………………..33
3.3 Wide angle x-ray scattering (WAXS)………………………………………...35
I
3.3.1 The powder X-ray diffraction method……………………………………………..37
3.3.2 Diffractometer……………………………………………………………………...38
3.3.3 Peak intensities……………………………………………………………………..40
3.3.4 Diffraction pattern evaluation……………………………………………………...41
3.3.5 Crystallite size measurement………………………………………………………41
3.4 Vibrational spectroscopy………………………………………………………..42
3.4.1 Infrared (IR) spectroscopy…………………………………………………………43
3.4.2 Raman spectroscopy……………………………………………………………….46
3.4.2.1 Raman effect……………………………………………………………………..46
3.5 Analytical ultracentrifugation (AUC)………………………………………..49
4 Aims and Objectives…………………………………………………………..52
4.1 Concept…………………………………………………………………………….52
5 Results and Discussion………………………………………………………..55
5.1 Synthesis of macroporous TiO2-M2O3 spheres……………………………..55
5.2 Photocatalytic degradation of 2-chlorophenol………………………………62
6 Results and Discussion………………………………………………………..68
6.1 Synthesis of CexZr1-xO2 nanoparticle sols……………………………………68
6.2 Synthesis of (CexZr1-xO2)a (CuO)b nanoparticle sols……………………….77
7 Results and Discussion………………………………………………………..78
7.1 Synthesis of mesoporous CexZr1-xO2 spheres………………………….……78
7.2 (Ce0.5Z0.5O2 )0.75 (CuO)0.25 spheres…………………………………………….87
II
7.3 Methanol steam reforming…………………………………………….………..89
8. Results and Discussion………………………………………………………91
8.1 Synthesis of mesoporous CexZr1-xO2 powders………………………………91
9 Experimental……………………………………………………………………..97
9.1 Synthesis of macroporous TiO2-M2O3 spheres……………………………..97
9.1.1 Materials……………………………………………………………………….…..97
9.1.2 Procedure…………………………………………………………………………..97
9.1.3 Pyridine adsorption study………………………………………………………….98
9.1.4 Photocatalytic degradation of 2-chlorophenol……………………………………..98
9.3 Synthesis of CexZr1-xO2 nanoparticles………………………………….…….99
9.3.1 Materials…………………………………………………………………...………99
9.3.2 Procedure…………………………………………………………………………100
9.4 Synthesis of mesoporous
CexZr1-xO2 and (CexZr1-xO2 )a (CuO)b spheres………………………………….101
9.4.1 Materials………………………………………………………………………….101
9.4.2 Procedure…………………………………………………………………………101
9.4.3 Methanol steam reforming……………………………………………………….102
9.5 Synthesis of Mesoporous CexZr1-xO2 powders………………..…………..102
9.5.1 Materials………………………………………………………………………...102
9.5.2 Procedure…………………………………………………………………………102
9.6 Characterization…………………………………………………………..…….103
III
9.6.1 Powder X-ray diffraction (XRD) measurements…………………………………103
9.6.2 Small angle X-ray scattering (SAXS)…………………………………………….104
9.6.3 Scanning electron (SEM) microscopy……………………………………………104
9.6.3 Transmission electron (TEM) microscopy……………………………………….104
9.6.4 Nitrogen sorption studies........................................................................................105
9.6.5 Infrared spectroscopy……………………………………………………………..105
9.6.6 Raman spectroscopy……………………………………………………………...105
9.6.7 Analytical ultracentrifugation…………………………………………………….106
10 Summary………………………………………………………………………..107
11 References…………………………………………………………………...…111
Popular abstract…………………………………………………………………...128
Resume………………………………………………………………………………….130
Acknowledgment……………………………………………………………………….131
IV

Introduction 1
ÈÈÏ; jgkqri fhAÈÈ
1Introduction
“There is plenty of room at the bottom” were the famous words from physicist, Nobel
laureate and a great visionary, Richard P. Feynman 1. In this legendary talk delivered in
1959, he opened the gateways of a vast unexplored territory of “nanoscience”. He
discussed the possibility of maneuvering atoms, building computer circuits that are in the
scale of nanometers, properties of materials and the problems that might arise in dealing
with the machines at very small length scales. Now, after four decades, we see that the
word “nano” is no more restricted to the scientific community but is also playing a role in
the social and political arena. Indeed we come across many things in our daily life, which
are based on nanostructured materials such as electronic devices, automotive catalysts,
batteries, cosmetics and medicines.
Nanostructured materials may differ considerably in terms of properties as compared to
the bulk materials. Confinement of matter in zero (quantum dots), one (nanowires), two
nanosheets) or three (periodic structures) dimensions on the nanometer scale can show
tremendous changes in material properties like conductivity, magnetic behavior, optical
properties. Conventionally, these features were tuned by the ways such as doping,
choosing between synthetic approaches e.g. solid state, hydrothermal or sol-gel process,
and optimizing the synthesis parameter. It was not until the last decade that serious
efforts were made to tailor the properties of materials by structural manipulation. The
more recent synthetic approaches are based on the organization of matter in which the
Introduction 2
kinetic rather than the thermodynamic aspects dictate the terms, and higher order
organizational states dominate over equilibrium states. For example, Mackay in his work
“flexicrystallography” described structure and symmetry properties of about 50 minimal-
energy surfaces 2. He indicated that the traditional crystallographic geometry does not
apply to curved structures but may be generalized to finite and infinite arrangements,
where strict equivalence is replaced by quasi-equivalence. This enables one to go beyond
the conventional crystallography and with its 230 space groups. In fact, nature in the
form of biominerals has already exploited this idea. Many biominerals are organized over
multiple length scales to yield hierarchical materials with complex forms.
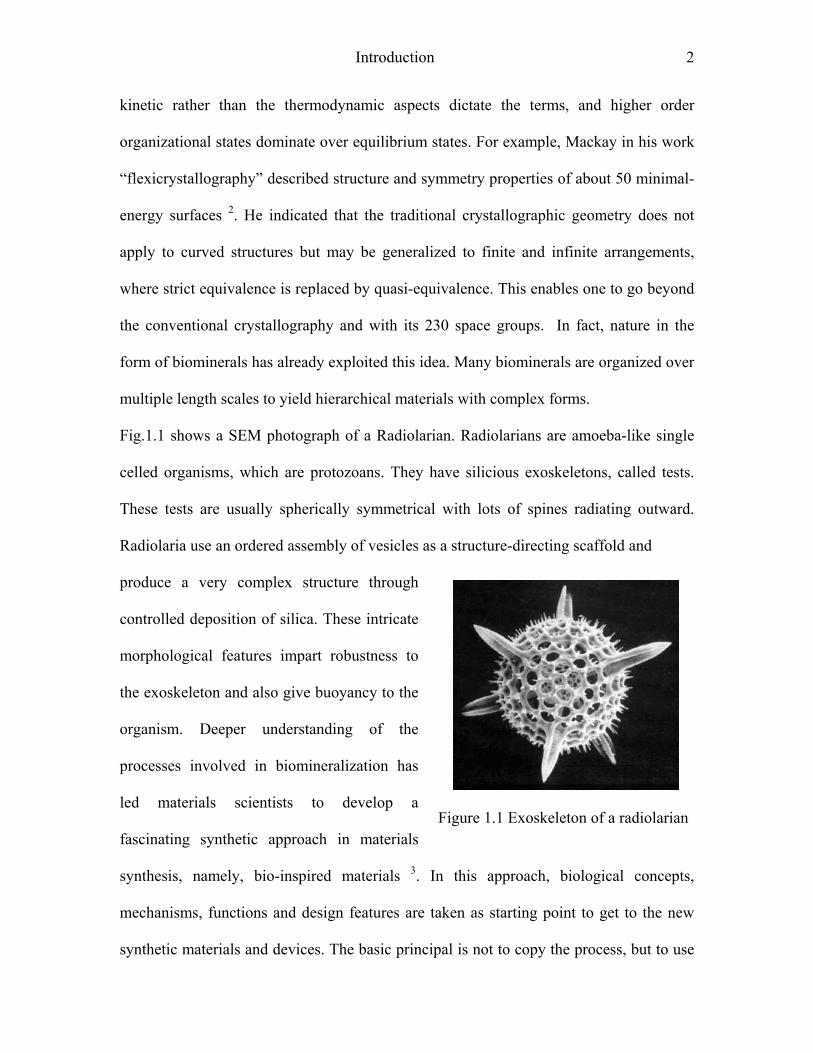
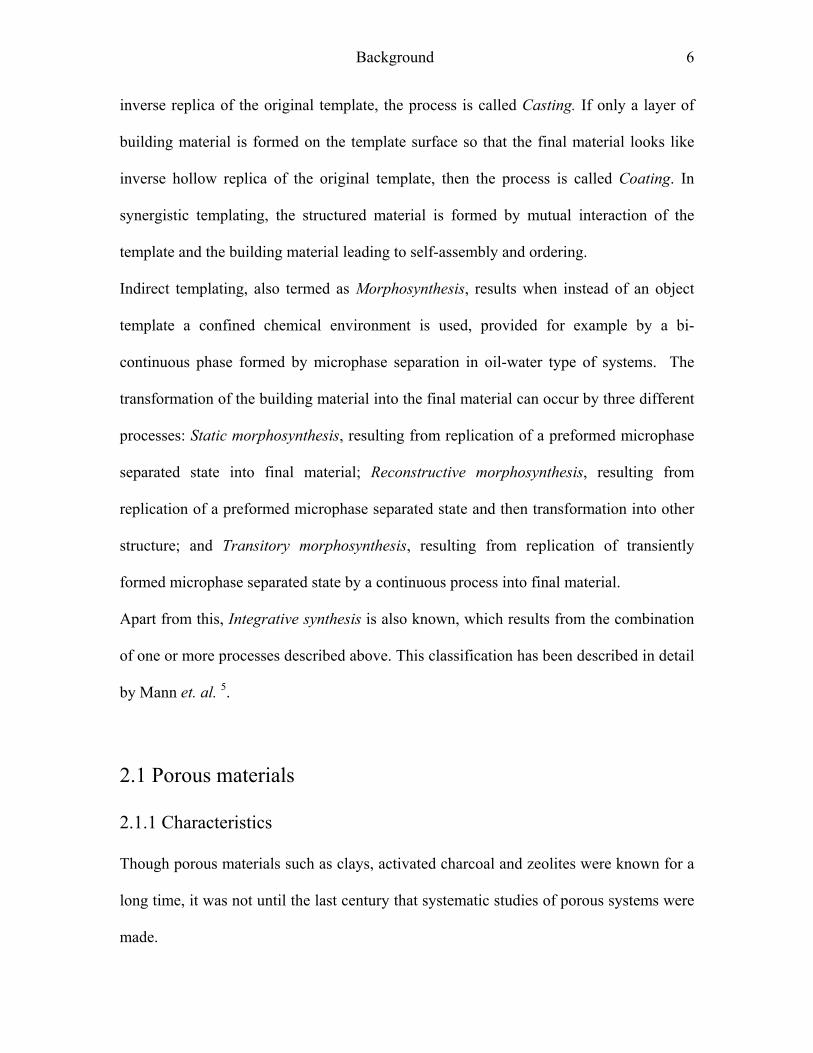
Fig.1.1 shows a SEM photograph of a Radiolarian. Radiolarians are amoeba-like single
celled organisms, which are protozoans. They have silicious exoskeletons, called tests.
These tests are usually spherically symmetrical with lots of spines radiating outward.
Radiolaria use an ordered assembly of vesicles as a structure-directing scaffold and
produce a very complex structure through
controlled deposition of silica. These intricate
morphological features impart robustness to
the exoskeleton and also give buoyancy to the
organism. Deeper understanding of the
processes involved in biomineralization has
led materials scientists to develop a
fascinating synthetic approach in materials
synthesis, namely, bio-inspired materials 3. In this approach, biological concepts,
mechanisms, functions and design features are taken as starting point to get to the new
synthetic materials and devices. The basic principal is not to copy the process, but to use
Figure 1.1 Exoskeleton of a radiolarian
Introduction 3
the knowledge as a guideline. In this context, synthesis of structured inorganic materials
hinges on the idea of using molecular objects or supramolecular assemblies as structure
directing agents to control the morphology of materials at nanometer scale. In recent
years this approach has gained popularity as morphological features and properties of the
final material can be tuned to the requirements by choosing the appropriate structure
directing agent and synthesis conditions.
The motif of the present work to use some of these principles and philosophies to
generate nano-structured functional inorganic materials with enhanced performance.
The present work deals with the synthesis of porous metal oxides using porous polymeric
beads and block-copolymers as structure directing agents. The first section describes the
synthesis of macroporous TiO2-M2O3 (M=Al, Ga, In) spheres. The procedure is based on
the use of the corresponding metal alkoxides in a sol-gel process and macroporous
polystyrene reverse phase chromatography beads. In this part, we discuss the effect of the
structure-directing agent and added oxides on the crystallization behavior and surface
properties of TiO2 and the photocatalytic activity of the final oxide spheres. The second
section describes the synthesis of a complete range of CexZr1-xO2 nanoparticle sols and
their characterization using various techniques. The third part includes the use of CexZr1-
xO2 nanoparticle sols to synthesis mesoporous CexZr1-xO2 spheres as well as CuO loaded
samples of the general composition (CexZr1-xO2)a (CuO)b. Mesoporous polystyrene beads
for size exclusion chromatography were used as templates. The catalytic activity of these
spheres for the steam reforming of methanol is also discussed.

Introduction 4
The fourth section describes the synthesis of mesoporous CexZr1-xO2 powders via an
evaporation induced self-assembly process using CexZr1-xO2 nanoparticle sols and block
co-polymers as template.
Background 5
2 Background
Porosity in materials imparts many advantageous features 4. For example, bones of birds
are highly porous but all the same strong and elastic, which is suitable for flying.
Activated charcoal, which has high porosity, acts as good adsorbent and is used in the
sugar industry as a decolorizing agent. Zeolites, which have specific pore structure, are
used for the ion exchange processes. In general, porous materials have found uses in
various areas of our life and hence it is important to develop and study advanced porous
materials.
In the chemical synthesis processes, porosity can be generated by inter-particle voids
formed during co-precipitation, by controlled hydrolysis of alkoxides to get xerogels or
by combustion method, where the gases evolved during the process result in porous
materials. In general, these methods are unrefined and no control over the porosity is
possible during the synthesis.
A more sophisticated approach is to use an object as a structure-directing agent and to
build the desired material around it. The object used for structure direction is termed as
Template and the process in general is called Templating. The template can be a single
molecule, a molecular assembly or even a larger, object.
Depending on the role of template in generating the final structure, the templating
processes are classified into two main groups: Direct templating and indirect templating.
Direct templating is subdivided into Transcriptive and Synergistic. In transcriptive
templating, one uses template with a definite form. If the building material fills the whole
space around the template so that the final material after the template removal looks like
Background 6
inverse replica of the original template, the process is called Casting. If only a layer of
building material is formed on the template surface so that the final material looks like
inverse hollow replica of the original template, then the process is called Coating. In
synergistic templating, the structured material is formed by mutual interaction of the
template and the building material leading to self-assembly and ordering.
Indirect templating, also termed as Morphosynthesis, results when instead of an object
template a confined chemical environment is used, provided for example by a bi-
continuous phase formed by microphase separation in oil-water type of systems. The
transformation of the building material into the final material can occur by three different
processes: Static morphosynthesis, resulting from replication of a preformed microphase
separated state into final material; Reconstructive morphosynthesis, resulting from
replication of a preformed microphase separated state and then transformation into other
structure; and Transitory morphosynthesis, resulting from replication of transiently
formed microphase separated state by a continuous process into final material.
Apart from this, Integrative synthesis is also known, which results from the combination
of one or more processes described above. This classification has been described in detail
by Mann et. al. 5.
2.1 Porous materials
2.1.1 Characteristics
Though porous materials such as clays, activated charcoal and zeolites were known for a
long time, it was not until the last century that systematic studies of porous systems were
made.
Background 7
Porous materials are differentiated on the basis of pore structure and pore sizes.
According to IUPAC 6 nomenclature, pores of size smaller than 2 nm are called
micropores, pores between 2-50 nm are called mesopores and pores bigger than 50 nm
are called macropores. Depending on the connectivity between the pores, they are termed
open if they are connected and closed if they are not connected.
The porous material are also characterized by the porosity, which is the fraction of
volume occupied by the pores compared to total volume and specific surface area, which
is the surface area per unit mass of the sample.
2.1.2 History
One of the most widely studied classes of porous materials are zeolites. The zeolites are
natural minerals known for almost 250 years. Zeolites (from the greek zein, to boil, and
lithos, stone) are hydrated alkaline or alkaline earth aluminosilicates with the general
formula Mn+x/n[(AlO2)x(SiO2)y]x- ⋅wH2O. They have a cage like open pore structure
formed from interconnected SiO4 and AlO4 tetrahedra. The pore sizes are characteristic
of a particular type of zeolite and are in the range of 0.4-1.5 nm. In 1862, Sainte Claire
Deville reported the first synthetic zeolite 7. Till this date, around 100 synthetic zeolites
are known. The general synthetic procedure involves the use of short chain alkyl amines
as templates and the templating process is considered to be synergistic. The alkyl chains
of these amines are hydrophobic in nature and their dissolution in water occurs via
formation of water pockets. The key point in the synthesis is the weak interaction
between SiO4 and AlO4 with the template, which gives stable structures even after the
template removal. Due to the uniform porosity, zeolites are used for selective ion
Background 8
removal, fluid catalytic cracking of heavy petroleum distillates, in detergents and for
many other applications.
However, zeolites, are not useful to carry out reactions with molecules of larger size,
because the pore size is restricted to below 2 nm. Hence, efforts to get the materials
having uniform pores with size greater than 2 nm was on. The first success was achieved
by Kresge et. al. 8. They reported the synthesis of a new family of porous silicon dioxide
materials called M41S. The templates used in this case were long chain alkyl ammonium
halides. The synthesis mechanism follows synergistic templating, but instead of single
molecules interacting with SiO4 tetrahedra, the alkyl ammonium ions assemble in the
form of micelles, which interact further with the inorganics to give ordered porous
structure.
Depending upon the ratio of template to silica content three main materials were
described in the M41S family. MCM-41 has cylindrical pores, ordered in a hexagonal
fashion, MCM-48 has a cubic, bi-continuous pore structure, and MCM-50 is lamellar.
The discovery of these materials opened a whole new area of mesoporous oxides. The
original work of Kresge et.al. 8 is now amongst the most cited articles with 3461 citation
till date.
In spite of tremendous efforts, the synthesis of only a few mesoporous, M41S-like
transition metal oxides has been reported. The first attempts were reported by Huo et al.
9 They reported a generalized route for the formation of surfactant-inorganic composites.
However, the structures were not stable on surfactant removal. Antonelli and Ying
reported the first non-silica mesoporous material 10. They synthesized mesoporous TiO2
by using the charged surfactant tetradecyl phosphate and controlling the hydrolysis of Ti-
isopropoxide by addition of acetylacetone. These reports were followed by the synthesis
Background 9
of mesoporous Nb2O5 and Ta2O5, using neutral alkyl amine surfactants 11, 12. Mesoporous
zirconia has been obtained with anionic surfactants 13, 14. Three kinds of surfactants,
CH3(CH2)10OSO3Na, CH3(CH2)14OSO2Na, and (C12H25O)PO(OH)2, were used. A
hexagonal mesostructured vanadium oxide can be synthesized by acid-catalyzed
hydrolysis of ethanolic cetyltrimethylammonium vanadate (CTAV) 15.
While the matter of formation mechanism of MCM-41 and related materials remained
controversial, Attard et.al. 16 came up with a new approach of transcriptive (casting)
templating, in which preformed liquid crystalline phases of block-co-polymer were used
for the templating and the formation of mesoporous silica. They demonstrated that silica
materials with various pore-structures could be obtained by choosing the initial liquid
crystalline phase. In 1998, Yang et.al., reported a generalized method for the synthesis of
inorganic materials using block-co-polymers and anhydrous metal chlorides 17. Numerous
accounts of silica and non-silica materials were reported afterwards and excellent reviews
are available to follow this development 18-21
In general, the M41S type synthesis is based on the synergistic approach and depends
upon complex interactions between the surfactant and the inorganic matter. It is not easy
to get the desired product with controlled porosity. The transcriptive approach followed
by Attard et. al. 16 is more useful in this regard. The use of the block-polymers, though
useful in getting mesoporous materials, is unsuitable to get larger pores that are desirable
for many applications. Macroporous materials (i.e., pore size > 50 nm) are particularly
interesting, due to their improved transport properties. Organized macroporous arrays
present optimal fluxes, and diffusion is not a limiting issue for these materials. This is a
central point for any processes concerning accessibility, such as catalysis, sorption,
delivery, or sensors.
Background 10
In this regard, the first case of ordered macroporous silica was reported by Velev et. al.
22. They used monosized spherical latex particles, which on close packing give an ordered
assembly of particles called colloidal crystal as the assembly resembles close packing of
atoms in the normal crystals. The voids between the spheres were filled with a silica
precursor, which was transformed into amorphous silica and the template was
subsequently removed. The process was simplified by Holland et. al. who used metal
alkoxides as precursors 23. This approach has been very popular and various materials
from oxides to metals have been synthesized in this manner. Concurrent with the work of
Velev et. al., Imhof and Pine reported 24 the use of crystal like assemblies of densely
packed, monodisperse non-aqueous emulsion droplets as template to synthesize ordered
macroporous TiO2, ZrO2 and SiO2. Caruso et. al. demonstrated the use of polymer gels
and cellulose based membranes as templates, which have a macroporous bi-continuous
structure 25, 26. A major contribution to the templating approach was given by the same
author in developing different ways of the utilization of precursors such as nanocoating
and nanocasting 27, 28. In the nanocoating process, a thin layer of precursor is formed on
the template surface. The advantage of this approach is that by controlling the thickness
of the precursor layer, one can control to some extent the crystal growth and the
connectivity between the particles. Furthermore, the combined use of macroporous
polymer gels and block-co-polymers to get silica materials with hierarchical pore
structure was also demonstrated 29. The advantage of these kinds of systems is that they
show better flow property due to the macroporous network while occurrence of the
mesopores results in greater surface area.
One more widely used template has been the porous alumina membrane. These
membranes possess cylindrical pores. By using these membranes Lakshmi et. al. first
Background 11
reported the synthesis of TiO2, ZrO2 and WO3 nanotubes and nanofibres, depending upon
the immersion time of the membrane in precursor solution 30.
Apart from this, organogels 31, 32, bacterial fibres 33, electrospun fibers 34, starch gel 35,
eggshell membrane 36, bioskeletons 37, viruses 38 and lot of other systems as templates are
reported in the literature.
From the literature survey one can see that the self-assembly processes are more specific
and depend strongly on the specific template-precursor interactions and reaction
conditions such as pH, temperature, chemical environment. Hence these processes cannot
be applied as general synthetic process.
On the other hand, the transcriptive process in which preformed templates or templates
with well-defined forms are used, is more effective and easy to generalize. Solid
templates such as polymer gels or membranes are stable and can be used in a wide range
of experimental conditions.
In general, an ideal template can be considered as the one that is readily available or easy
to process. It should be stable throughout the templating process and can easily be
removed to obtain the final product. The templating process should be simple, effective
and reproducible. The synthetic approach should be easy to generalize such that a large
variety of materials can be obtained.
2.2 Precusors
Precursor is a general term that can be roughly defined as a material, which can be used
directly or transformed during the synthesis process to obtain the desired product. In the
processing of ceramic materials, contrary to the solid-state synthesis, which give non-
Background 12
structured material, the soft chemical processes designed for obtaining nanostructured
materials, rarely involve the use of bulk oxide. An exception is the synthesis of V2O5
nanotubes reported by Niederberger et. al. 39, which involves the use of V2O5 bulk oxide
as the precursor. A more popular approach is the use of sol-gel processes based on
alkoxides. In these processes, the metal alkoxides react readily with water and undergo
hydrolysis to form small cluster of partially or fully hydrolyzed metal oxide precursor in
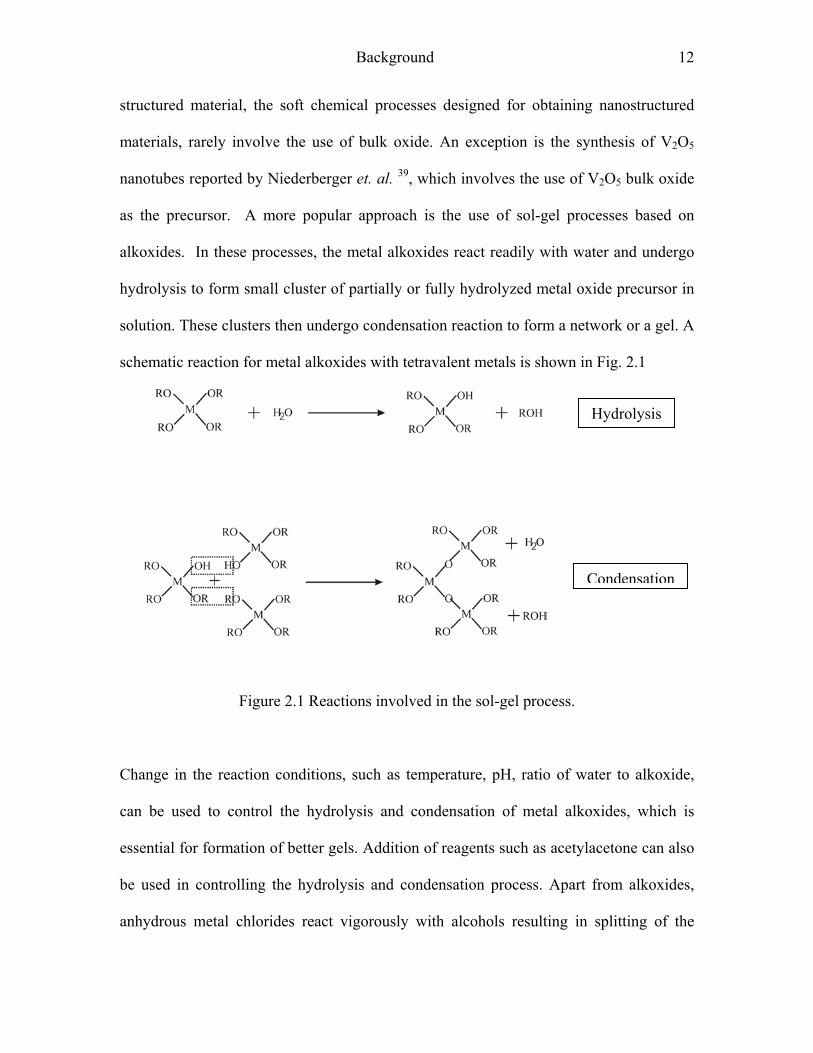
solution. These clusters then undergo condensation reaction to form a network or a gel. A
schematic reaction for metal alkoxides with tetravalent metals is shown in Fig. 2.1
Hydrolysis
n
Figure 2.1 Reactions involved in the sol-gel process.
Change in the reaction conditions, such as temperature, pH, ratio of w
can be used to control the hydrolysis and condensation of metal alk
essential for formation of better gels. Addition of reagents such as acety
be used in controlling the hydrolysis and condensation process. Apar
anhydrous metal chlorides react vigorously with alcohols resulting i
Condensatio
ater to alkoxide,
oxides, which is
lacetone can also
t from alkoxides,
n splitting of the

Background 13
alcohol similar to the hydrolysis process giving extended networks or gels. Yang et. al.
have used this process to produce a large variety of mesoporous metal oxides 17.
Besides alkoxides as precursor, pre-formed nanoparticles also offer an attractive option
40. Nanoparticles possess highly active surface, which can bind to the other particles
forming a network. Increasing the concentration or changing the pH, for example, can
effect the gelation of nanoparticle sols. Many reports demonstrate the successful use of
nanoparticles to obtain nanoporous materials.33, 37, 41-44. The advantage of using
nanoparticles is that the nanoparticles are much denser than the clusters formed during
the hydrolysis reaction of alkoxides. Consequently, template removal by heat treatment
results in less shrinkage of the structure in case of nanoparticulate system as compared to
the gels obtained from alkoxide sol-gel process. If the nanoparticles are crystalline, high
calcination temperatures are not required. Alternatively, the template can be removed by
chemical processes. In the transformation of amorphous gels from alkoxide process, the
process of crystallization may result in the collapse of the structure. This can be avoided
by the use of crystalline nanoparticles.
In the present work, we demonstrate the use of sol-gel processes based on metal alkoxide
chemistry as precursors, as well as the use of preformed nanoparticles as nanobuilding
blocks for the fabrication of porous materials.
2.3 Materials
Throughout the literature, silica and silica-based materials have dominated the arena of
porous materials. The simple reason lies in the fact that silica usually adopts an
amorphous, glass form. It can form homogeneous glasses over a large length scales. The
hydrolysis and condensation of silicon alkoxides can be better controlled as compared to
Background 14
other metal alkoxides. Similar to water, SiO4 tetrahedra show affinity towards surfactants
and amphiphiles, which support the self-assembly process and the formation of ordered
structures by the liquid crystal templating approach. Even though the mesoporous and
macroprous silica materials have been appreciated from a aesthetic point of view, they
have not found as much use as in terms of applications due to there amorphous nature.
Many other transition metal oxides such as TiO2, ZrO2, CeO2, Fe2O3, WO3, or
pervoskites are among the more interesting candidates in regards to their application in
various fields. In the present work, TiO2-based materials and CeO2-ZrO2 solid solution
systems are investigated.
2.3.1 Titanium dioxide (TiO2)
Titanium dioxide or titania is one of the most widely found oxides in the mineral form.
TiO2 exists in three different polymorphs: brookite, anatase and rutile. Anatase and rutile
are the more common forms. Both of them have a tetragonal crystal structure but
different lattice parameters. Brookite on the other hand is a less common polymorph
having an orthorhombic crystal structure. In all the three modifications titanium has a co-
ordination number of six and exhibits octahedral symmetry. Though all the polymorphs
of TiO2 can be obtained in stable form at ambient conditions, rutile remains the
thermodynamically most stable form. Anatase and brookite are transformed into rutile
upon heat treatment at high temperatures ranging from 400ºC to 1000ºC. Both anatase
and rutile have a high refractive index of 2.5-3.0 and 3.87 respectively and hence can
scatter light better than other materials such as alumina or silica. For this reason, TiO2
and in particular rutile has been extensively used in the production of pigments. The
world market for TiO2-based pigments is as huge as four million tons per year 45. The

Background 15
high refractive indices of these substances also make them attractive candidates for
applications in opto-electronics. By far the most actively pursued applied research on
titania is its use for photo-assisted degradation of organic molecules. Anatase and rutile
are semiconducting in nature with a band gap of 3.23 eV and 3.033 eV respectively. The
electron–hole pair that is created upon irradiation with light radiation may separate and
the resulting charge carriers might migrate to the surface where they react with the
adsorbed water and oxygen to produce radical species. Out of the two, anatase is more
active as compared to rutile 46. Hence, it is desirable to have the anatase phase in the
catalyst systems. Reports show that addition of small quantities of metal oxides such as
ZrO2, SiO2, or In2O3 47-49 retards the anatase to rutile transformation.Semiconducting
metal oxides may change their conductivity upon gas adsorption. This change in the
electrical signal is used for gas sensing. TiO2 is not used as extensively as SnO2 and ZnO,
but it has received some attention as an oxygen gas sensor, e.g., to control the air/fuel
mixture in car engines 50, 51.
In general TiO2 is a material with interesting properties and wide range of possible
applications.
2.3.2 Cerium dioxide
Cerium dioxide (CeO2) or generally called ceria is a rare-earth oxide. CeO2 has a cubic
fluorite type structure. Cerium shows two stable oxidation states Ce4+ and Ce3+. Unlike
the other rare-earth oxides, it does not have a stable sesquioxide, Ce2O3. Nevertheless,
because of its ability to shift between Ce4+ and Ce3+ reversibly, CeO2 acts as a good
oxidizing agent. Furthermore, due to this inherent property, CeO2 can generate oxygen
vacancies while still retaining the cubic fluorite structure. As there are no other
Background 16
polymorphs for CeO2 it can act as a thermally stable support. Apart from this, studies
show that CeO2 increases thermal stability of the supports, but also favours noble metal
dispersion, promotes steam reforming and water gas shift reactions. Due to its ability to
switch between Ce4+/ Ce3+ states it can store and release oxygen at oxygen rich and lean
environment respectively at high temperatures 52. It can promote CO removal by
employing lattice oxygen. All these properties make CeO2 as ideal candidate for an auto
exhaust catalyst, catalyst for the reforming reactions and for the fuel cell applications.
Other applications of CeO2 include abrasive for polishing glass due to its high hardness
index of about 6, and oxidizing agent in sunscreens due to the strong UV absorption
property.
2.3.3 CeO2-ZrO2 binary system.
In order to enhance the inherent properties of CeO2, addition of other rare-earth oxides
and transition metal oxides has been tried 52. Of all the combinations explored, the CeO2-
ZrO2 system was best in terms of performance.
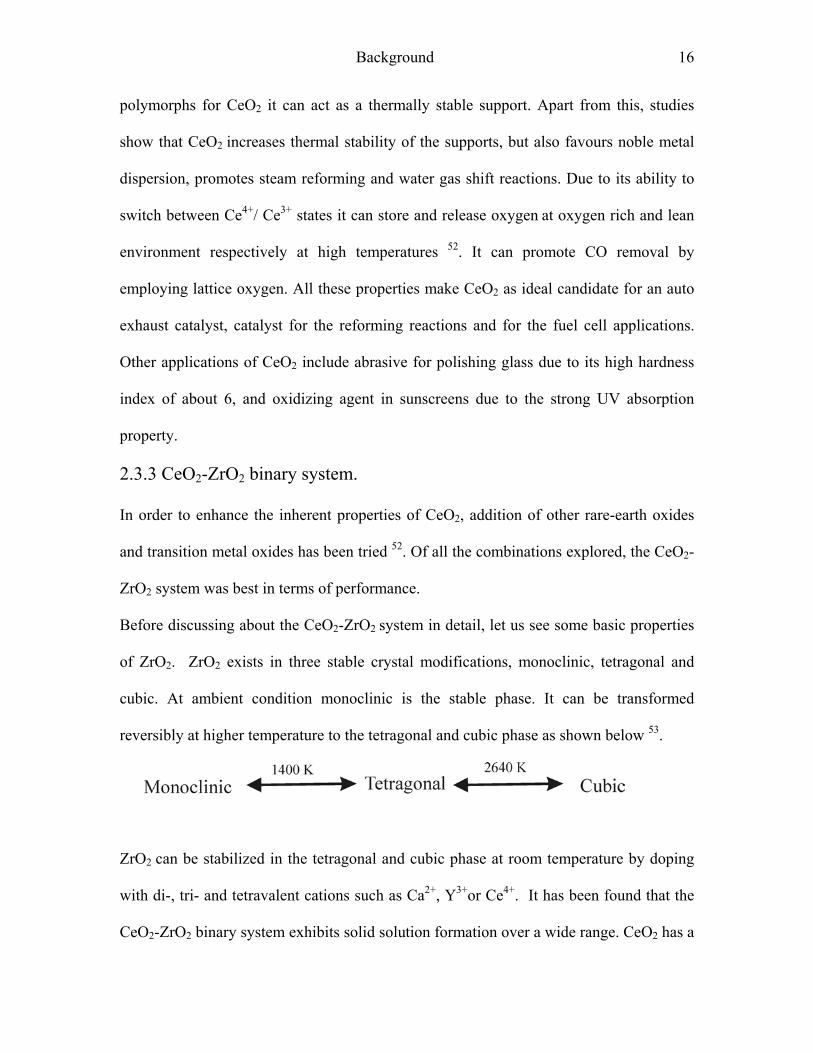
Before discussing about the CeO2-ZrO2 system in detail, let us see some basic properties
of ZrO2. ZrO2 exists in three stable crystal modifications, monoclinic, tetragonal and
cubic. At ambient condition monoclinic is the stable phase. It can be transformed
reversibly at higher temperature to the tetragonal and cubic phase as shown below 53.
ZrO2 can be stabilized in the tetragonal and cubic phase at room temperature by doping
with di-, tri- and tetravalent cations such as Ca2+, Y3+or Ce4+. It has been found that the
CeO2-ZrO2 binary system exhibits solid solution formation over a wide range. CeO2 has a
Background 17
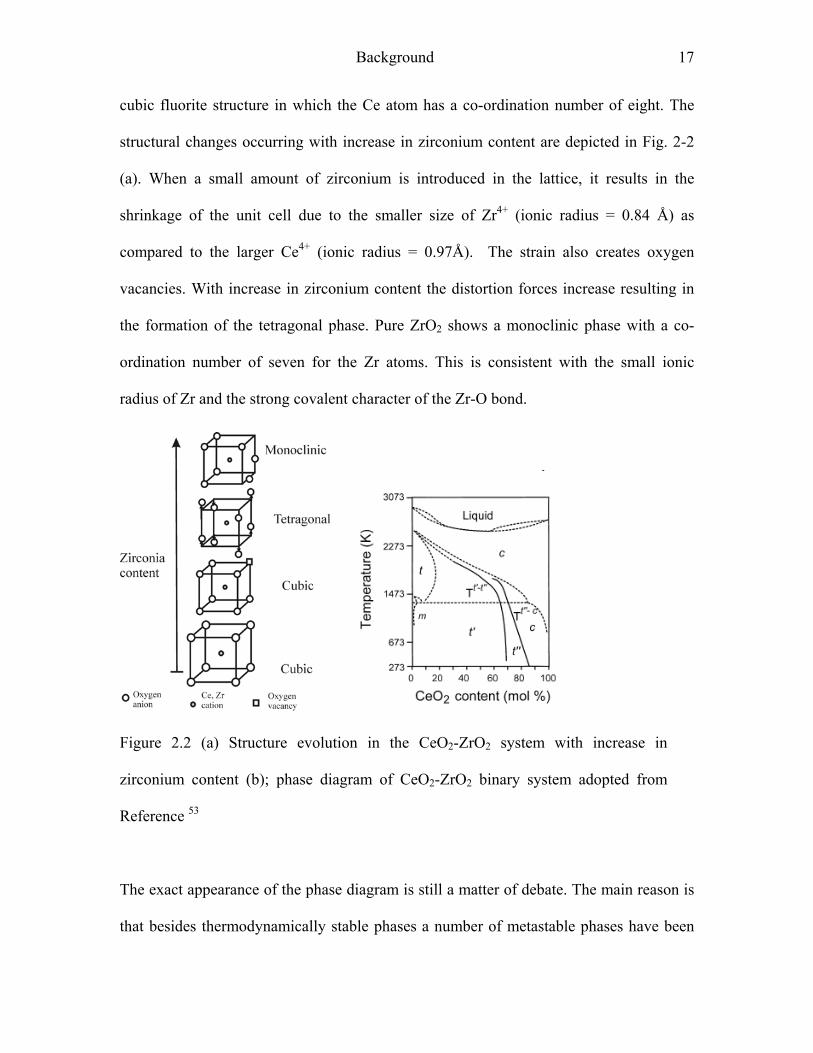
cubic fluorite structure in which the Ce atom has a co-ordination number of eight. The
structural changes occurring with increase in zirconium content are depicted in Fig. 2-2
(a). When a small amount of zirconium is introduced in the lattice, it results in the
shrinkage of the unit cell due to the smaller size of Zr4+ (ionic radius = 0.84 Å) as
compared to the larger Ce4+ (ionic radius = 0.97Å). The strain also creates oxygen
vacancies. With increase in zirconium content the distortion forces increase resulting in
the formation of the tetragonal phase. Pure ZrO2 shows a monoclinic phase with a co-
ordination number of seven for the Zr atoms. This is consistent with the small ionic
radius of Zr and the strong covalent character of the Zr-O bond.
Figure 2.2 (a) Structure evolution in the CeO2-ZrO2 system with increase in
zirconium content (b); phase diagram of CeO2-ZrO2 binary system adopted from
Reference 53
The exact appearance of the phase diagram is still a matter of debate. The main reason is
that besides thermodynamically stable phases a number of metastable phases have been
Background 18
reported. From the phase diagram it can be seen that for a CeO2 content less than 10
mol% a monoclinic phase exists, while for CeO2 content higher than 80 mol% a cubic
phase is found. The phase composition of intermediate compositions is still unclear.
Three different tetragonal phases t, t’ and t” are mainly identified. Of these, t is the stable
tetragonal phase, which can be identified by XRD. The t’ and t” are metastable tetragonal
phases, which are identified by Raman as it is more sensitive in getting information on
the local structure. t” is also called the pseudo cubic phase as there is no real
tetragonality in the structure. The oxygen atoms are slightly displaced from their position
in the cubic conformation.
CeO2-ZrO2 systems have attracted a lot attention due the formation of defect structures.
Mainly the tetragonal and the modified cubic structures both of which have oxygen
vacancies act as good oxide ion conductor and hence are useful for fuel cell applications
and for automotive exhaust catalysts. CeO2-ZrO2 compositions are more stable towards
sintering and loss of surface area than CeO2 alone, which makes it ideal for high
temperature applications.
In general CeO2 and CeO2 based systems have been extensively studied and excellent
reviews and books are available which discuss all the different aspects from structural
properties to catalytic applications 52, 54-57.
2.4 Applications
2.4.1 Semiconductor photocatalysis
The phenomenon of semiconductor photocatalysis has been known for a long time. The
semiconductor zinc oxide attracted a great deal of attention at the turn of this century as a
Background 19
photo-sensitizer for the decomposition of organic compounds and as a sensitizer for a
number of inorganic photoreactions 58. In 1972 Fujishima and Honda demonstrated
photocatalytic splitting of water using a TiO2 electrode. Since then extensive efforts to
understanding and enhancement of photocatalytic efficiency of TiO2 have been carried
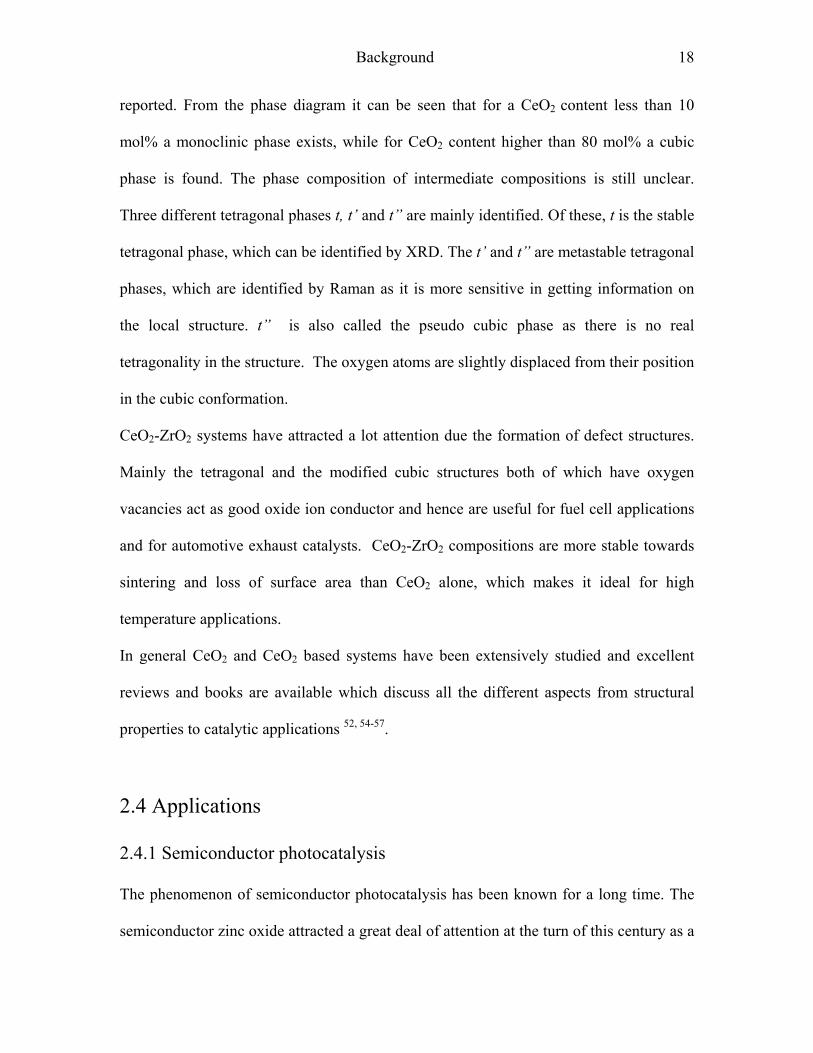
out. The schematic view of processes occurring during photoreaction is depicted in Fig.
2-3. The origin of semicoductor photocatalysis lies in the fact that the energy diagram of
semiconductors consists of a valence band and a conduction band, which is separated by
certain fixed amount of energy between 0,1 and 4 eV, called as the band gap.
Figure 2.3 Major processes occurring in photocatalysis: * generation of electron
hole pair, (a) electron hole pair recombination on the surface and (b) inside the
bulk, (c) reduction of an electron acceptor A by an electron, (d) oxidation of a
electron donor D by the hole
When light of appropriate energy is introduced on the semiconductor, it may result in
excitation of an electron from the valence band into the conduction band leaving a
positive hole in the valence band. This pair of electron and hole may be utilized in
Background 20
carrying out redox reactions. During photocatalysis, light does not act as a catalyst but is
rather consumed during the reaction. So many researchers like to call this phenomenon as
photoreaction rather than photo catalysis.
During the photo excitation the electron excited into the valence band can fall back
immediately, recombining with the hole in the valence band. On the other hand the
electron and the hole may separate and travel within the matrix. As shown in Fig. 2.3
they can either recombine in the bulk (b) or on the surface (a). Those reaching the surface
may also interact with the species in the vicinity of the surface and result in the reduction
and oxidation reactions by the electron and the hole respectively 46, 59.
There are lots of factors that affect the photocatalytic properties of a semiconductor
material. First thing is the size of the band gap. If the band gap is very large, the
excitation radiation used should also have high energy. Secondly the position of the band
gap is important. For a photocatalytic reaction occurring in an aqueous medium two sets
of reactions are illustrated:
e- + O2 O2•−
2O2•− + H2O H2O2 + O2 Reaction-1
and
h+ + H2O OH• + H+
h+ + OH− OH• Reaction -2
Here e- is the photo-generated electron and h+ the photo-generated hole. Which reaction
will take place on the semiconductor surface is decided by the potential of the conduction
band and the valence band. If the potential of the valence band is more negative than the
Background 21
reduction potential of oxygen the Reaction-1 occurs and if the potential of the valence
band is more positive than the oxidation potential of water/ hydroxide ion then the
Reaction-2 is probable. In the case of nanoparticles below a critical particle size, the size
of the band gap is dependent on the size of the particle. This is called the quantum size
effect. The materials like CdS and Fe2O3 undergo decomposition as a result of the
photochemical reaction. This is called photo corrosion. The pH of the medium determines
the position of the band gap of the semiconductor material. These are some of the
parameters that influence the photoactivity of a semiconductor material.
Photo catalysis offers solutions to pressing environmental issues such as pollution and
shortage of energy resources. Examples of most commonly explored reactions include
complete photocatalytic decomposition of halogenated aromatic and non-aromatic
organic compounds, which are found as pollutant in industrial and domestic wastewaters
60. Degradation of poisonous inorganic compounds such as cyanides sulfides is also
reported 61, 62. Furthermore, deactivation of viruses and bacteria has been attempted 63-65.
Cleavage of water to produce oxygen and hydrogen comes as one of the solutions for fuel
problems as hydrogen acts as a clean fuel for fuel cell applications 66.
Semiconductor photocatalysis thus offers various applications based on a simple and
effective process. With materials like TiO2, which is efficient, non-toxic and cost
effective, it is possible to make the technology available for the common people.
Background 22
2.4.2 Steam reforming of methanol
As the reserves of conventional fuels are plummeting, the need to find alternative fuels is
rising. One of the most popular alternative fuel is hydrogen. Reaction of hydrogen with
oxygen gives water and a large amount of energy is released. Production of hydrogen can
be done using photocatalyis. But the system is not suitable for production at very large
scales. Secondly, regarding the hazards in the handling and storage of hydrogen it is
desirable to have sources of hydrogen, which can yield hydrogen in situ for its use in
applications like fuel cells. The remedy comes in the form of reforming reactions in
which a hydrocarbon compound is decomposed to yield hydrogen and carbon dioxide.
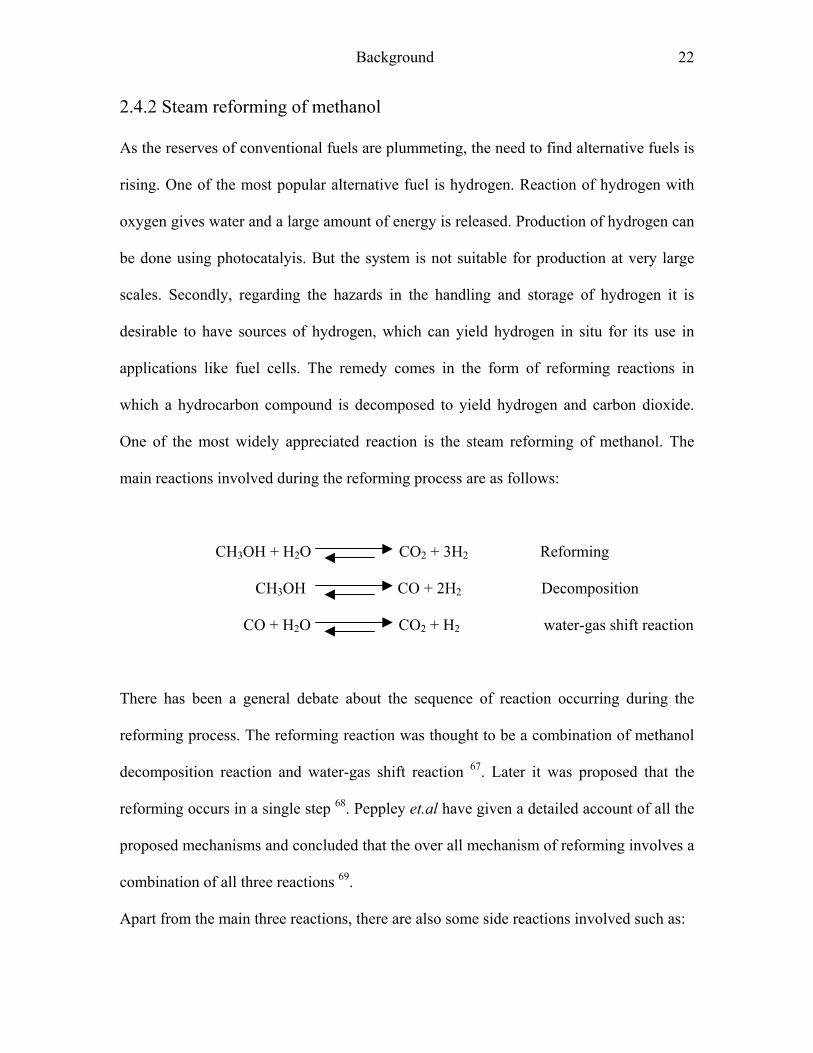
One of the most widely appreciated reaction is the steam reforming of methanol. The
main reactions involved during the reforming process are as follows:
CH3OH + H2O CO2 + 3H2 Reforming
CH3OH CO + 2H2 Decomposition
CO + H2O CO2 + H2 water-gas shift reaction
There has been a general debate about the sequence of reaction occurring during the
reforming process. The reforming reaction was thought to be a combination of methanol
decomposition reaction and water-gas shift reaction 67. Later it was proposed that the
reforming occurs in a single step 68. Peppley et.al have given a detailed account of all the
proposed mechanisms and concluded that the over all mechanism of reforming involves a
combination of all three reactions 69.
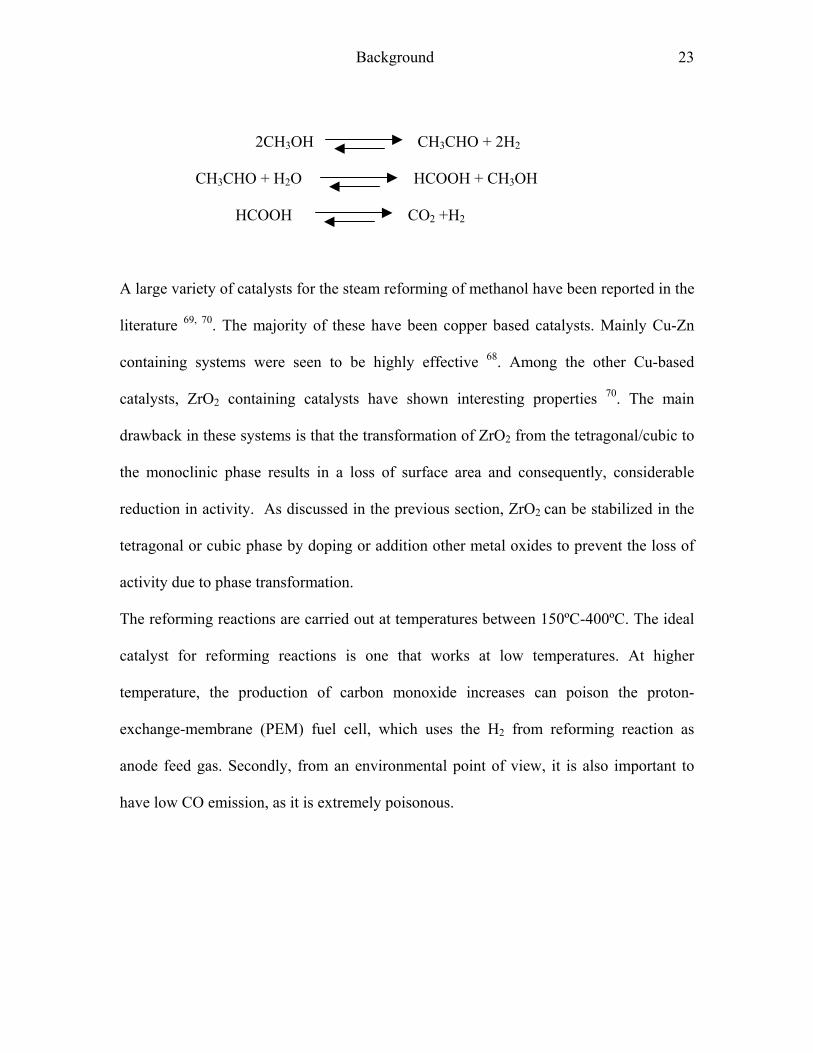
Apart from the main three reactions, there are also some side reactions involved such as:
Background 23
2CH3OH CH3CHO + 2H2
CH3CHO + H2O HCOOH + CH3OH
HCOOH CO2 +H2
A large variety of catalysts for the steam reforming of methanol have been reported in the
literature 69, 70. The majority of these have been copper based catalysts. Mainly Cu-Zn
containing systems were seen to be highly effective 68. Among the other Cu-based
catalysts, ZrO2 containing catalysts have shown interesting properties 70. The main
drawback in these systems is that the transformation of ZrO2 from the tetragonal/cubic to
the monoclinic phase results in a loss of surface area and consequently, considerable
reduction in activity. As discussed in the previous section, ZrO2 can be stabilized in the
tetragonal or cubic phase by doping or addition other metal oxides to prevent the loss of
activity due to phase transformation.
The reforming reactions are carried out at temperatures between 150ºC-400ºC. The ideal
catalyst for reforming reactions is one that works at low temperatures. At higher
temperature, the production of carbon monoxide increases can poison the proton-
exchange-membrane (PEM) fuel cell, which uses the H2 from reforming reaction as
anode feed gas. Secondly, from an environmental point of view, it is also important to
have low CO emission, as it is extremely poisonous.
Methods 24
3 Methods
3.1 Nitrogen sorption studies
Specific surface area of porous materials can be measured by using the phenomenon of
physical adsorption of gases onto the surface at low temperatures. For porous materials,
this method not only gives information about specific surface area of the material but also
on the pore sizes and pore volume, given the pore sizes are in the range accessible by this
method 6.
The gas used for the measurement (adsorbate) should have certain characteristic features.
It should be chemically inert towards the solid sample (adsorbent), it should have
saturation vapour pressure large enough to carry out the measurements accurately at
working temperatures and the shape of adsorbate molecule should be close to spherical
symmetry. In this regards, nitrogen is most widely used as adsorbate gas. Other gases
used for the measurement are krypton, argon, benzene and carbon dioxide.
The nitrogen sorption measurements are carried out at constant temperature of 77.35 K,
which is the boiling point of liquid nitrogen. For the measurement, the sample is
evacuated completely and then, small amounts of gaseous adsorbate are fed gradually and
adsorbed on to the sample. The volume of gas adsorbed VA is taken as volume of the
same amount of gas at standard temperature and pressures condition (STP). The partial
pressure of gas P above the sample surface is measured relative to the atmospheric
pressure P0 at a constant temperature. The plot of the volume adsorbed VA versus relative
pressure P/P0 gives the so-called adsorption isotherm. In general, depending on the nature
of the adsorption isotherm, they are classified into six different types of isotherms called
as Brunauer classification, which has been also accepted by IUPAC 71. They are as shown

Methods 25
in Fig. 3.1. In case of non-porous materials or materials with large pores, an isotherm of
type-II is observed. In this case, as the gas is allowed to come in contact with the sample
surface at lower relative pressure, P/P0, the gas is adsorbed onto the surface forming a
monolayer, while pressure increases very slightly. This is reflected in sharp rise of the
curve. After the monolayer is formed, the added gas is weakly bound to this layer
forming additional layers, which is followed by subsequent increase of pressure and
results in flattening of the curve. As the relative pressure, P/P0, approaches atmospheric
pressure, the gas condenses to a liquid and the curve shows a rise again.
Figure 3.1 Types of isotherms according to the Brunauer classification.
In case of mesopores, the condensation occurs at lower relative pressures. In these pores
the monolayer of nitrogen molecules form a curved interface which acts as nucleation site
for condensation of gaseous nitrogen. According to Kelvin equation (Equation 3-1), the
vapour pressure on the curved liquid surface is always less than the liquid with plane
surface.
Methods 26
mrTR
VPP θγ cos2* 0
0
−=
ln Equation 3-1
P* = Critical condensation pressure
γ = Surface tension of the adsorbate
V0 = Molar volume of the adsorbate
θ = Contact angle of the condensed adsorbate with the sample surface
rm = Mean radius of curvature
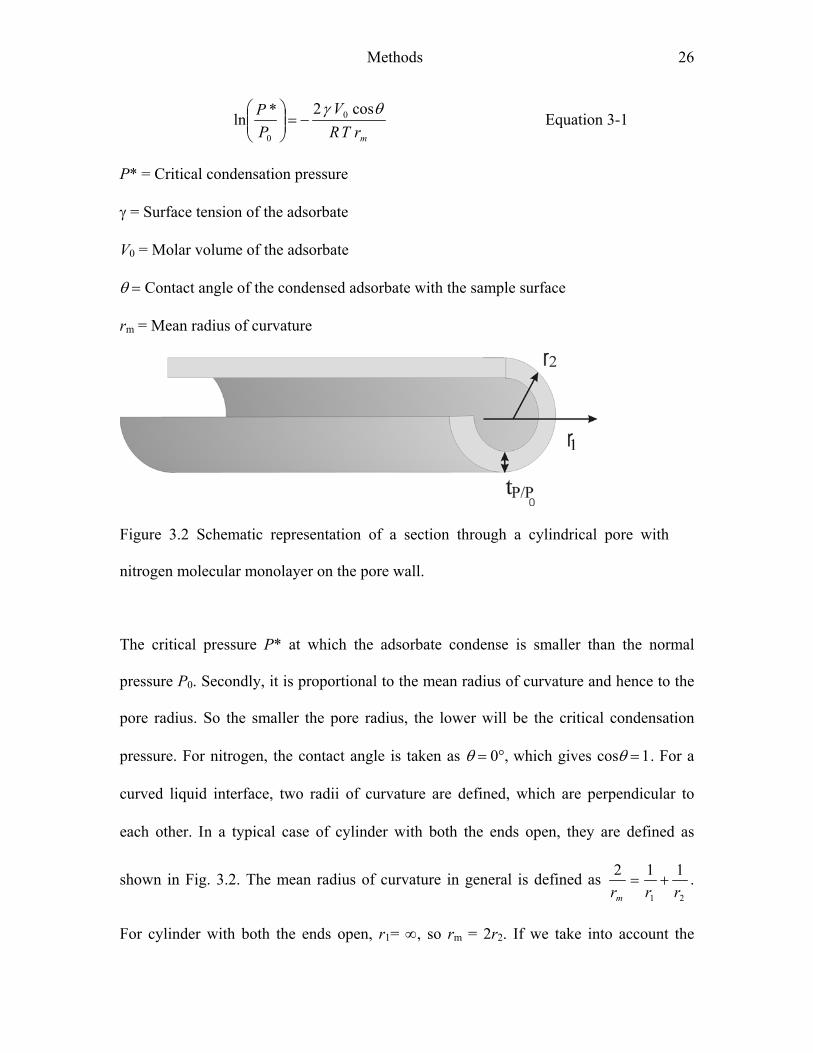
Figure 3.2 Schematic representation of a section through a cylindrical pore with
nitrogen molecular monolayer on the pore wall.
The critical pressure P* at which the adsorbate condense is smaller than the normal
pressure P0. Secondly, it is proportional to the mean radius of curvature and hence to the
pore radius. So the smaller the pore radius, the lower will be the critical condensation
pressure. For nitrogen, the contact angle is taken as θ = 0°, which gives cosθ = 1. For a
curved liquid interface, two radii of curvature are defined, which are perpendicular to
each other. Ιn a typical case of cylinder with both the ends open, they are defined as
shown in Fig. 3.2. The mean radius of curvature in general is defined as 21
112rrrm
+= .
For cylinder with both the ends open, r1= ∞, so rm = 2r2. If we take into account the
Methods 27
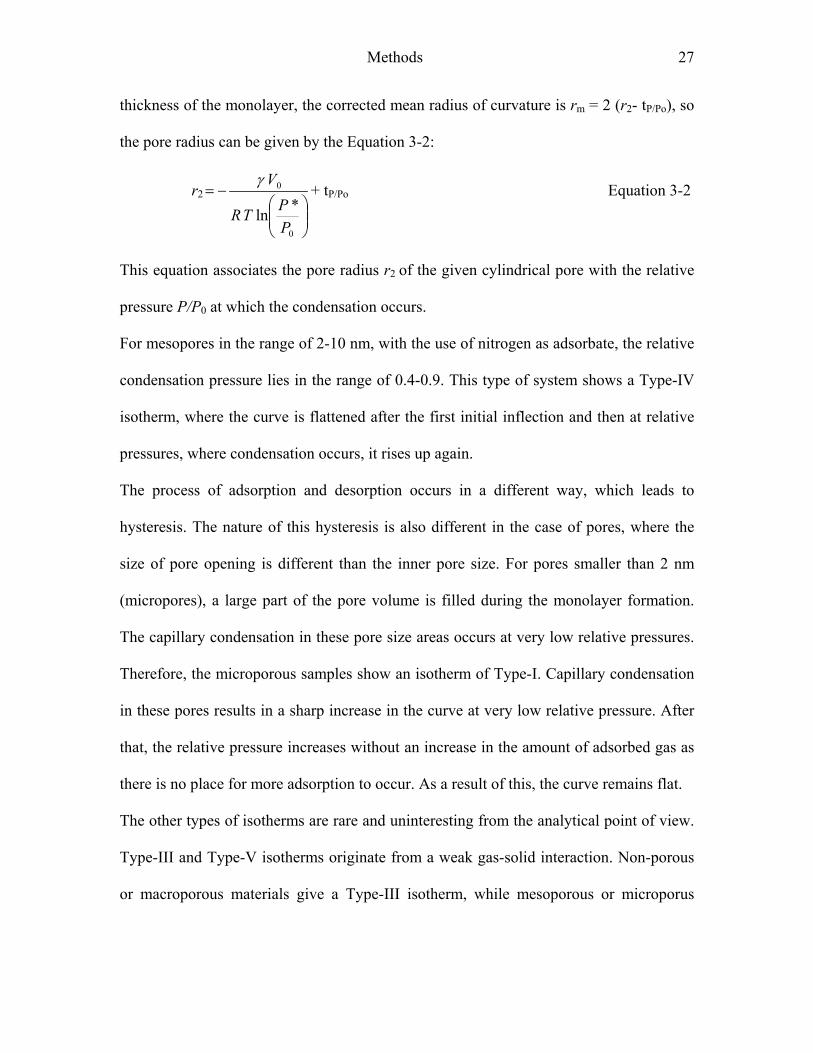
thickness of the monolayer, the corrected mean radius of curvature is rm = 2 (r2- tP/Po), so
the pore radius can be given by the Equation 3-2:
r2
−=
0
0
*lnPPTR
Vγ+ tP/Po Equation 3-2
This equation associates the pore radius r2 of the given cylindrical pore with the relative
pressure P/P0 at which the condensation occurs.
For mesopores in the range of 2-10 nm, with the use of nitrogen as adsorbate, the relative
condensation pressure lies in the range of 0.4-0.9. This type of system shows a Type-IV
isotherm, where the curve is flattened after the first initial inflection and then at relative
pressures, where condensation occurs, it rises up again.
The process of adsorption and desorption occurs in a different way, which leads to
hysteresis. The nature of this hysteresis is also different in the case of pores, where the
size of pore opening is different than the inner pore size. For pores smaller than 2 nm
(micropores), a large part of the pore volume is filled during the monolayer formation.
The capillary condensation in these pore size areas occurs at very low relative pressures.
Therefore, the microporous samples show an isotherm of Type-I. Capillary condensation
in these pores results in a sharp increase in the curve at very low relative pressure. After
that, the relative pressure increases without an increase in the amount of adsorbed gas as
there is no place for more adsorption to occur. As a result of this, the curve remains flat.
The other types of isotherms are rare and uninteresting from the analytical point of view.
Type-III and Type-V isotherms originate from a weak gas-solid interaction. Non-porous
or macroporous materials give a Type-III isotherm, while mesoporous or microporus
Methods 28
materials give isotherms of Type-V. The isotherm of Type-VI, called stepped isotherm, is
also rare and is particularly of theoretical interest.
The region of the isotherm up to which there is no capillary condensation, i.e., the low
relative pressure region of the Type-II and Type-IV isotherm, gives the account of
specific surface area of the samples. Various theories have been put forth to calculate the
specific surface area of the sample. I. Langmuir in 1918 proposed the first theory 72. This
theory gives the relation between volumes of gas adsorbed and the surface area of the
sample based on the kinetic consideration of formation of a monolayer of the adsorbate
over the sample surface.
S. Brunauer, P.H. Emmett and E. Teller improved this model by taking into account the
adsorption of multiple layers of adsorbate molecules. This theory is widely acknowledged
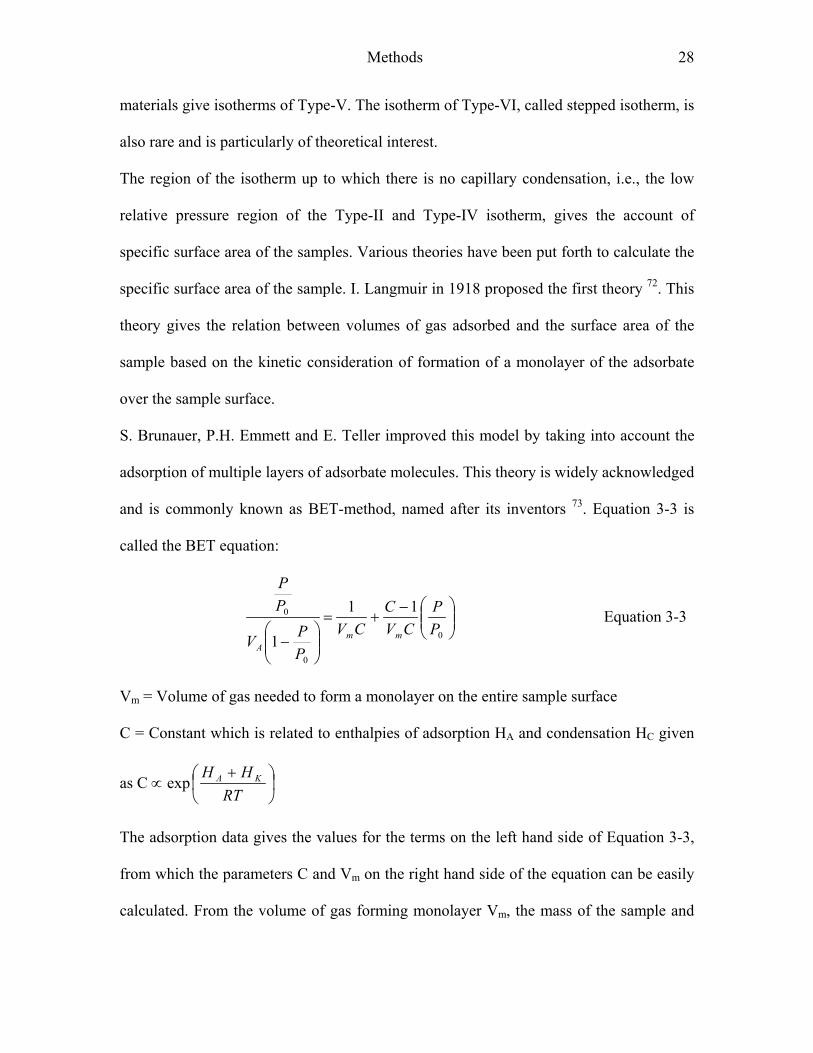
and is commonly known as BET-method, named after its inventors 73. Equation 3-3 is
called the BET equation:
−+=
− 0
0
0 11
1PP
CVC
CVPPV
PP
mmA
Equation 3-3
Vm = Volume of gas needed to form a monolayer on the entire sample surface
C = Constant which is related to enthalpies of adsorption HA and condensation HC given
as C ∝ exp
+RT
HH KA
The adsorption data gives the values for the terms on the left hand side of Equation 3-3,
from which the parameters C and Vm on the right hand side of the equation can be easily
calculated. From the volume of gas forming monolayer Vm, the mass of the sample and
Methods 29
the area per molecule of the adsorbate gas, one can calculate the surface area of the
sample using Equation 3-4:
SABET = mV
NV Am
0
σ Equation 3-4
SABET = Specific surface area from BET method
NA = Avagadro’s number
σ = Area per molecule of the adsorbate gas
m = Mass of the sample
3.2 Electron microscopy
Resolving limit of a microscope is defined as the minimum detectable distance, ∆x
between two points, so that they are recognized as separate objects. In 1900 E. Abbe
showed that the wavelength of electromagnetic radiation λ, the angle of the incident
beam with the objective α and the refractive index of the medium n between the objective
and the sample are related to the resolution limit as given by Equation 3-5:
α
λsinn
x =∆ Equation3-5
The refractive indices of medium used generally lies below 2 and the maximum possible
value for sinα = 1. So the maximum resolution that can be achieved by a microscope
using visible light (λvis > 400 nm) is around 200 nm. Therefore, in order to achieve a
better resolution, electromagnetic radiation sources with a smaller wavelength must be
used.
Methods 30
Around 1930 E. Ruska developed the electron microscope based on De Broglie’s
principle of wave-particle duality. It states that associated with every particle there is a
wave, wavelength of which is given by the Equation 3-6:
mvh
=λ Equation 3-6
h = Planck’s constant
m = rest mass of the particle. In the case of electrons me= 9.109×10 –31kg
v = velocity of the particle
The speed of electron v, accelerated by an electric field U is given in Equation 3-7:
eUvme =2
21 ∴
emeU2
=v Equation 3-7
e = charge on electron = 1.602×10 –19C
For the acceleration voltage U = 100 kV, the De Broglie wavelength of the electrons
using above equation is found to be 0.0037 nm. Accordingly, the theoretical resolution of
electron microscopes is of three order of magnitude higher than that of light microscopes.
Considering the fact that electrons can get scattered by any particle in their way, electron
microscopes are operated at high vacuum.
Methods 31
3.2.1 Transmission electron microscopy (TEM)
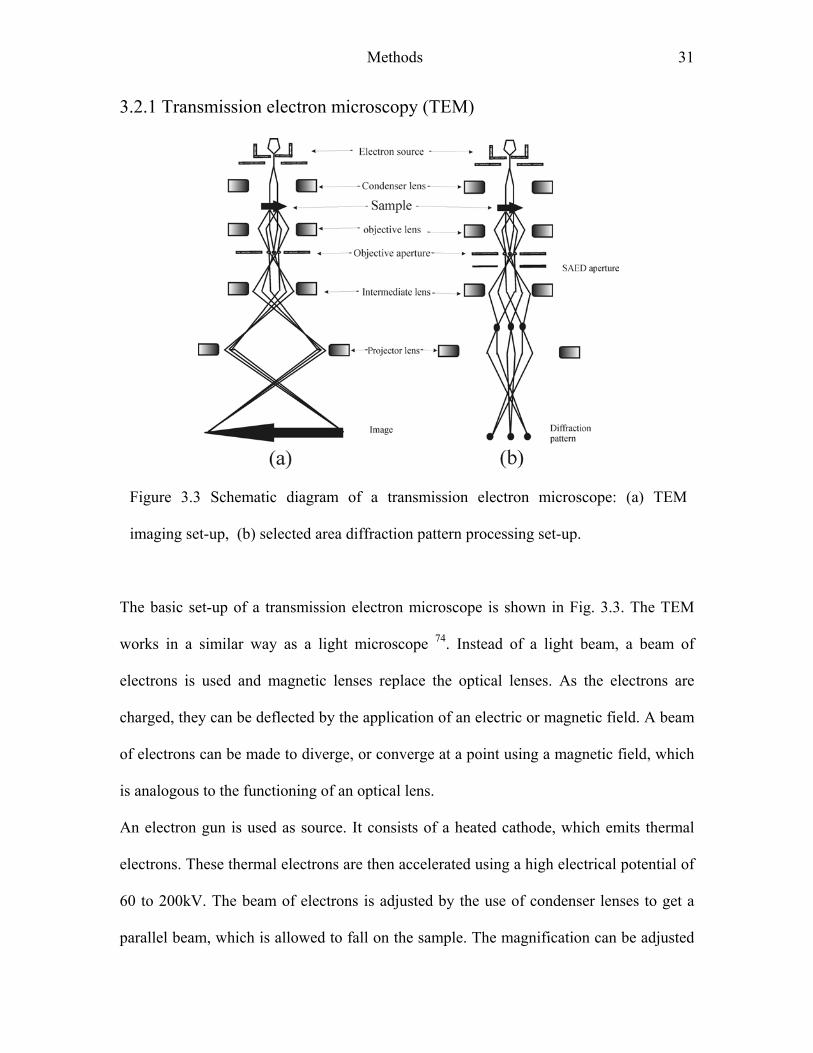
Figure 3.3 Schematic diagram of a transmission electron microscope: (a) TEM
imaging set-up, (b) selected area diffraction pattern processing set-up.
The basic set-up of a transmission electron microscope is shown in Fig. 3.3. The TEM
works in a similar way as a light microscope 74. Instead of a light beam, a beam of
electrons is used and magnetic lenses replace the optical lenses. As the electrons are
charged, they can be deflected by the application of an electric or magnetic field. A beam
of electrons can be made to diverge, or converge at a point using a magnetic field, which
is analogous to the functioning of an optical lens.
An electron gun is used as source. It consists of a heated cathode, which emits thermal
electrons. These thermal electrons are then accelerated using a high electrical potential of
60 to 200kV. The beam of electrons is adjusted by the use of condenser lenses to get a
parallel beam, which is allowed to fall on the sample. The magnification can be adjusted
Methods 32
by adjusting the beam width, which in turn depends on the strength of the condenser lens.
The electrons transmitted through the sample are then passed through a set of objective
lens, objective aperture, intermediate lens and a projector lens to give a highly magnified
image of the sample. As the electrons are scattered by the atoms in the sample, the darker
part of the image correspond to the presence of matter, while lighter parts indicate the
absence or thinning of material. The contrast depends upon the elements present in the
sample. Heavy elements scatter more and hence give greater contrast.
In the case of crystalline samples, change in the set-up can give an electron diffraction
pattern instead of the sample image. As shown in Fig. 3.3 (b), additional aperture limiting
the area of beam and change in the strength of the intermediate lens in accordance with
the objective lens gives a so-called selected area electron diffraction pattern (SAED) of
the sample. The pattern appears as a dot pattern if the area under investigation is a single
crystal. In case of a polycrystalline sample, a ring pattern is observed instead. The pattern
is characteristic of the sample material and its orientation with respect to the beam. It
gives information on crystal structural parameters such as the d-spacing between the
crystal planes and symmetry.
For the TEM investigation, the samples are laid on a copper grid covered with thin
carbon film. The sample thickness should be very small. Typically it should be less than
100 nm. In case of finely powdered samples, the powder is dispersed in a suitable solvent
and a drop of it placed on the grid. Removal of the solvent by evaporation results in
deposition of the sample on the grid. Alternatively, for larger objects ultramicrotomy
technique is used. In this technique, the sample is first embedded in a polymer matrix and
then thin slices of it are cut using a diamond knife. The sections are around 30-100 nm in
thickness. These slices are then laid on the grid for analysis.
Methods 33
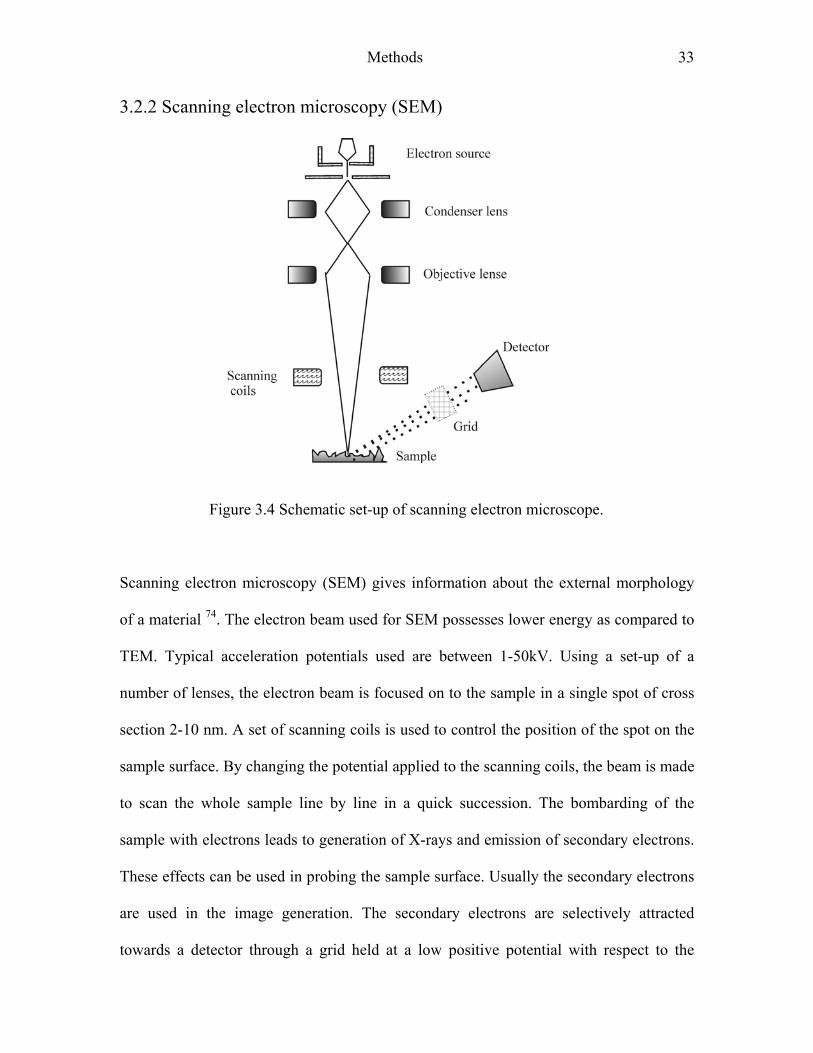
3.2.2 Scanning electron microscopy (SEM)
Figure 3.4 Schematic set-up of scanning electron microscope.
Scanning electron microscopy (SEM) gives information about the external morphology
of a material 74. The electron beam used for SEM possesses lower energy as compared to
TEM. Typical acceleration potentials used are between 1-50kV. Using a set-up of a
number of lenses, the electron beam is focused on to the sample in a single spot of cross
section 2-10 nm. A set of scanning coils is used to control the position of the spot on the
sample surface. By changing the potential applied to the scanning coils, the beam is made
to scan the whole sample line by line in a quick succession. The bombarding of the
sample with electrons leads to generation of X-rays and emission of secondary electrons.
These effects can be used in probing the sample surface. Usually the secondary electrons
are used in the image generation. The secondary electrons are selectively attracted
towards a detector through a grid held at a low positive potential with respect to the
Methods 34
specimen. The electron detector counts the number of secondary electrons that arrive per
unit time and translates this count rate into an electrical signal. The final image is built
up from the information on the number of electrons collected from each point.
The number of secondary electrons reaching the detector depends upon surface topology.
Based on geometrical considerations, secondary electrons generated at the edges and at
convex surfaces have higher probability to escape from surface and reach the detector,
while secondary electrons from shallow surfaces have the least probability to escape from
surface and reach the detector. The area from where more secondary electrons are
collected appears brighter, while the area giving a low secondary electron count appear
dark. Through this contrast mechanism, we get a magnified image of the sample with
topological details of the sample surface.
It is important to have a high amount of secondary electrons generated from the sample
surface in order to get good contrast in the image. As the sample is bombarded with
electrons, charge is built on the surface and if the sample is non-conducting it is not
dissipated. As a result of this, the sample appears bright everywhere. To stop the charge
from building up, the sample needs to be conducting. For these reasons the samples are
coated with a very thin layer of metal such as gold or palladium prior to analysis.
Methods 35
3.3 Wide angle x-ray scattering (WAXS)
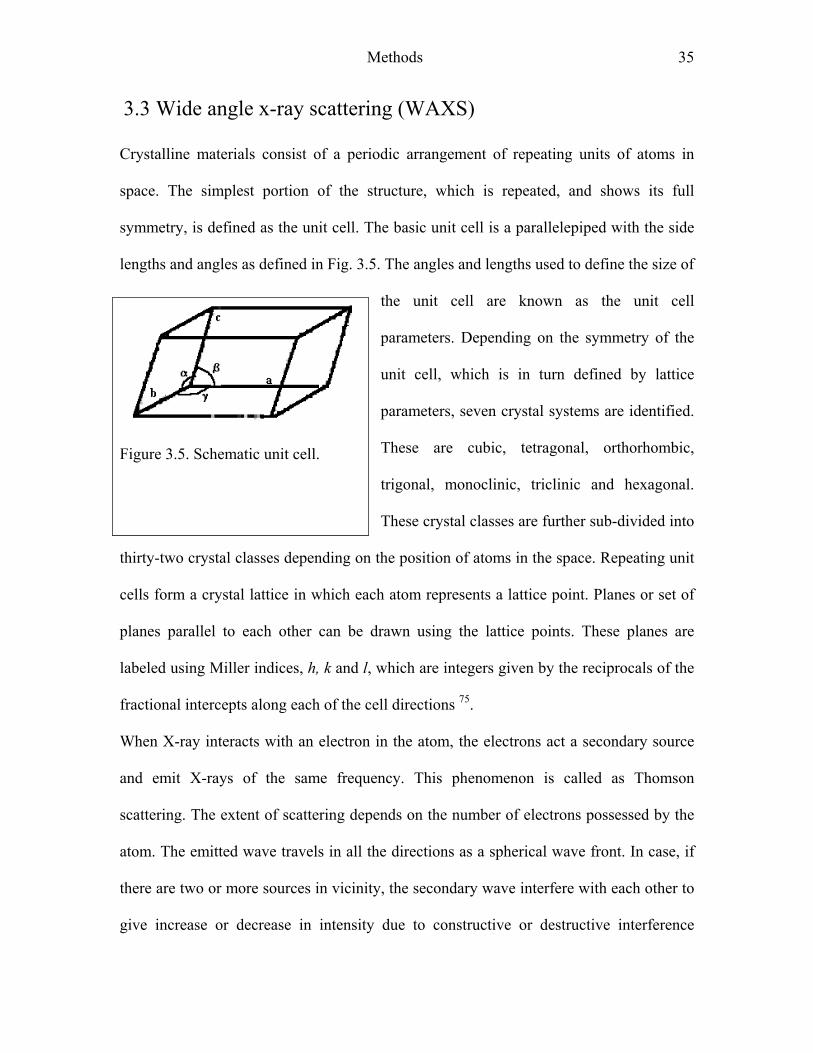
Crystalline materials consist of a periodic arrangement of repeating units of atoms in
space. The simplest portion of the structure, which is repeated, and shows its full
symmetry, is defined as the unit cell. The basic unit cell is a parallelepiped with the side
lengths and angles as defined in Fig. 3.5. The angles and lengths used to define the size of
the unit cell are known as the unit cell
parameters. Depending on the symmetry of the
unit cell, which is in turn defined by lattice
parameters, seven crystal systems are identified.
These are cubic, tetragonal, orthorhombic,
trigonal, monoclinic, triclinic and hexagonal.
These crystal classes are further sub-divided into
thirty-two crystal classes depending on the position of atoms in the space. Repeating unit
cells form a crystal lattice in which each atom represents a lattice point. Planes or set of
planes parallel to each other can be drawn using the lattice points. These planes are
labeled using Miller indices, h, k and l, which are integers given by the reciprocals of the
fractional intercepts along each of the cell directions 75.
Figure 3.5. Schematic unit cell.
When X-ray interacts with an electron in the atom, the electrons act a secondary source
and emit X-rays of the same frequency. This phenomenon is called as Thomson
scattering. The extent of scattering depends on the number of electrons possessed by the
atom. The emitted wave travels in all the directions as a spherical wave front. In case, if
there are two or more sources in vicinity, the secondary wave interfere with each other to
give increase or decrease in intensity due to constructive or destructive interference
Methods 36
respectively, depending on the phase difference at the point of interference. If the
secondary sources are periodically arranged, the interference between the secondary
waves gives high intensity due constructive interferences only at certain angles while, at
other angles, destructive interference leads to the loss of intensity.
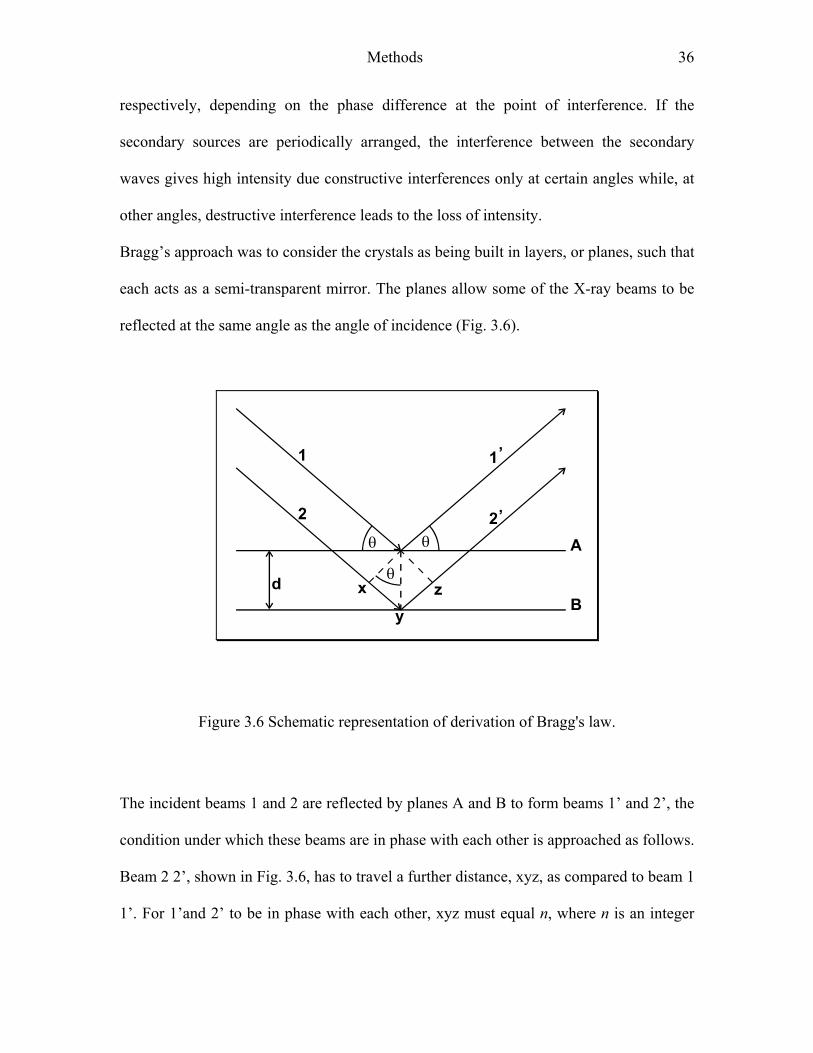
Bragg’s approach was to consider the crystals as being built in layers, or planes, such that
each acts as a semi-transparent mirror. The planes allow some of the X-ray beams to be
reflected at the same angle as the angle of incidence (Fig. 3.6).
Figure 3.6 Schematic representation of derivation of Bragg's law.
The incident beams 1 and 2 are reflected by planes A and B to form beams 1’ and 2’, the
condition under which these beams are in phase with each other is approached as follows.
Beam 2 2’, shown in Fig. 3.6, has to travel a further distance, xyz, as compared to beam 1
1’. For 1’and 2’ to be in phase with each other, xyz must equal n, where n is an integer
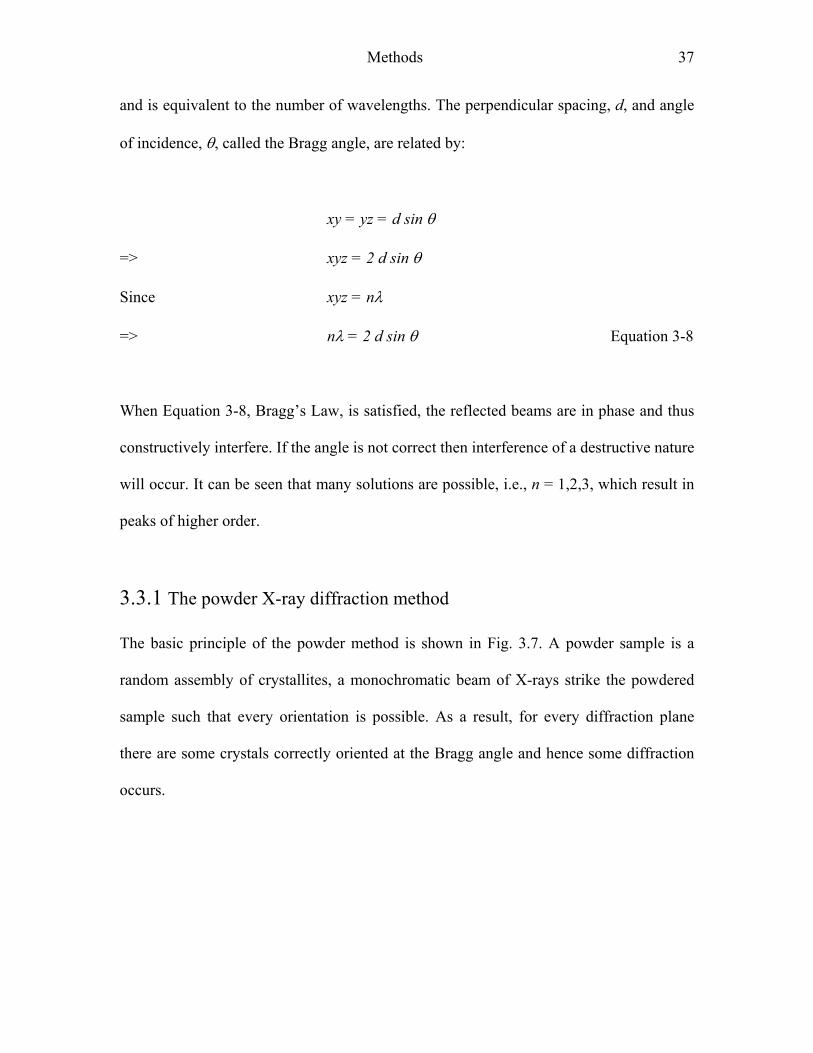
Methods 37
and is equivalent to the number of wavelengths. The perpendicular spacing, d, and angle
of incidence, θ, called the Bragg angle, are related by:
xy = yz = d sin θ
=> xyz = 2 d sin θ
Since xyz = nλ
=> nλ = 2 d sin θ Equation 3-8
When Equation 3-8, Bragg’s Law, is satisfied, the reflected beams are in phase and thus
constructively interfere. If the angle is not correct then interference of a destructive nature
will occur. It can be seen that many solutions are possible, i.e., n = 1,2,3, which result in
peaks of higher order.
3.3.1 The powder X-ray diffraction method
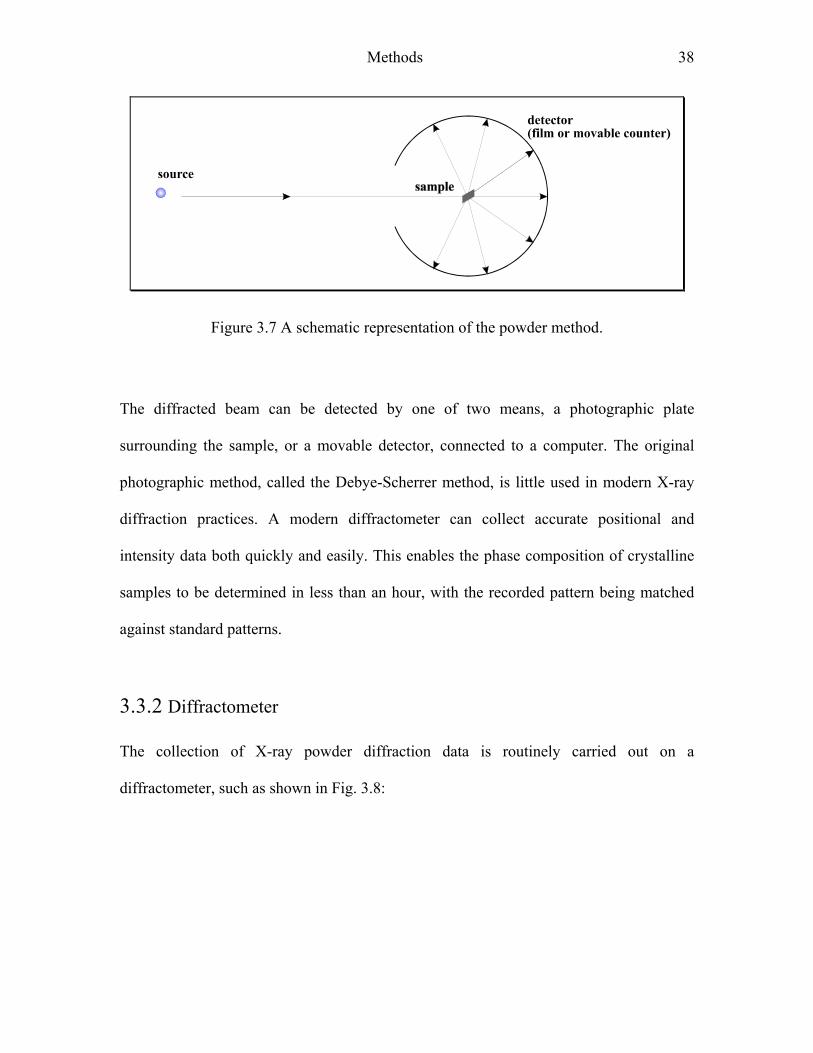
The basic principle of the powder method is shown in Fig. 3.7. A powder sample is a
random assembly of crystallites, a monochromatic beam of X-rays strike the powdered
sample such that every orientation is possible. As a result, for every diffraction plane
there are some crystals correctly oriented at the Bragg angle and hence some diffraction
occurs.
Methods 38
Figure 3.7 A schematic representation of the powder method.
The diffracted beam can be detected by one of two means, a photographic plate
surrounding the sample, or a movable detector, connected to a computer. The original
photographic method, called the Debye-Scherrer method, is little used in modern X-ray
diffraction practices. A modern diffractometer can collect accurate positional and
intensity data both quickly and easily. This enables the phase composition of crystalline
samples to be determined in less than an hour, with the recorded pattern being matched
against standard patterns.
3.3.2 Diffractometer
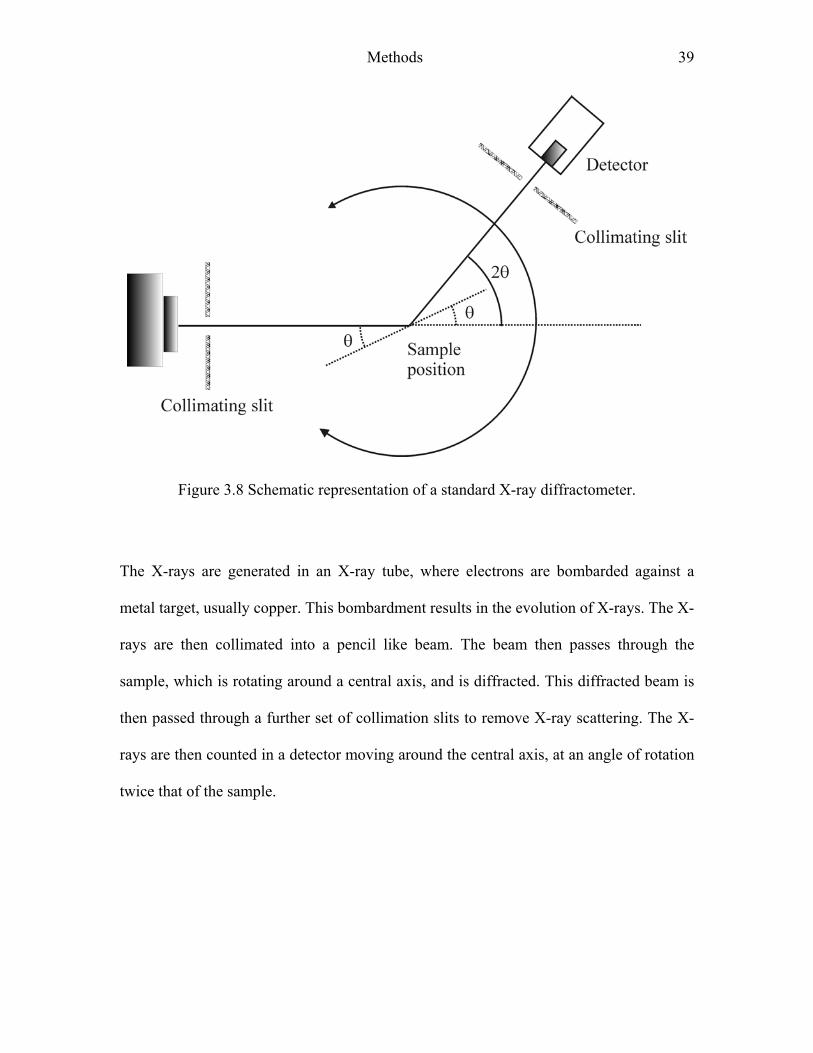
The collection of X-ray powder diffraction data is routinely carried out on a
diffractometer, such as shown in Fig. 3.8:
Methods 39
Figure 3.8 Schematic representation of a standard X-ray diffractometer.
The X-rays are generated in an X-ray tube, where electrons are bombarded against a
metal target, usually copper. This bombardment results in the evolution of X-rays. The X-
rays are then collimated into a pencil like beam. The beam then passes through the
sample, which is rotating around a central axis, and is diffracted. This diffracted beam is
then passed through a further set of collimation slits to remove X-ray scattering. The X-
rays are then counted in a detector moving around the central axis, at an angle of rotation
twice that of the sample.
Methods 40
3.3.3 Peak intensities
There are many factors, which can affect the peak intensity. A few are described below.
i) Structure Factor.
The peak intensity is influenced by the position of the atom in the unit cell and the atom
type. If an atom has a high atomic number then it will scatter X-rays better than an
element with a low atomic number, e.g., Cs scatters better than Li giving greater
intensity.
ii) Multiplicity Factor.
For a cubic system, lattice planes such as (013), (031), (103), (130), all have the same d-
spacing where a = b = c. In a powder XRD pattern the variable co-ordinate is the d-
spacing. Therefore reflections, which give rise to the same d-spacing will be
superimposed. As a result, a more intense peak will be observed.
iii) Preferred orientation.
This occurs if the powder is poorly ground or if the powder is not completely oriented
randomly. This effect can cause some intensities to be increased while others are
decreased.
iv) Temperature factor.
Thermal vibrations of atoms cause a decrease in the observed peak intensity with an
increase in background scattering. This effect is usually only important for experiments
performed at high temperature.
Methods 41
3.3.4 Diffraction pattern evaluation
Usually, X-ray diffraction pattern of a sample is evaluated by calculating the d values
corresponding to each peak and matching with the known patterns from data bases such
as Joint Committee on Powder Diffraction Studies (JCPDS) database.
3.3.5 Crystallite size measurement
It is possible to measure the crystallite size from X-ray powder diffraction patterns using
the effect of line broadening on the diffraction pattern. The relationship between the
mean dimension of the crystallites in a powder, D, and the pure X-ray diffraction
broadening, β, was first determined by Scherrer, and is discussed in detail by Klug and
Alexander 75. Scherrer related the mean dimension, D, to the pure diffraction broadening,
β, by Equation 3-9:
θβ
λcosK = D Equation 3-9
K = Constant
θ = The diffraction angle
λ = The wavelength of the X-ray

Methods 42
3.4 Vibrational spectroscopy
Vibrational spectroscopy is a powerful tool to investigate the symmetry of molecules, the
nature of bonding and interactions of atoms within the molecule. It is useful for
qualitative as well as quantitative investigations 76, 77.
The simplest model of an atom bound in a molecule is given as large mass m by a
weightless spring. The force F that is necessary to move the atom by a certain distance x
from an equilibrium position is proportional to the force constant f, a measure of the
strength of bond by Hooke’s law given in Equation 3-10:
xfF ⋅−= Equation 3-10
By Newton’s law 2
2
dtxdmF ⋅=
⇒ xfdt
xdm ⋅−=⋅ 2
2
Equation 3-11
One of the solutions of this second order differential equation is given as
(2πν t+ϕ) cos0 ⋅= xx
⇒ cos4 022
2
2
xdt
xd νπ−= (2πν t+ϕ) = Equation 3-12 0224 xνπ−
Where ν is vibrational frequency and ϕ is the phase angle.
Combining Equation 3-11 and 3-12
4π2ν2m = f or mf
πν
21
= Equation 3-13
If we consider a diatomic molecule, the mass m is called reduced mass of diatomic
molecule with the masses m1 and m2 :
Methods 43
21
111mmm
+= Equation 3-14
Thus the frequency of vibration of a diatomic molecule is given as
+=
21
1121
mmf
πν Equation 3-15
A diatomic molecule is said to have one vibrational degree of freedom as it can have only
one mode of vibration. Similarly, a molecule containing n number of atoms will have 3n-
6 degree of vibrational degrees of freedom. Part of the energy possessed by a molecule
comes from the vibrational modes and a molecule can be excited from one vibrational
energy level to the other by using radiation of certain frequency. Thus every molecule
shows a characteristic vibrational spectra depending on the mode of vibration and the
frequency of radiation used for excitation. In general, the vibrational frequency is given
in wave number units ν~ (waves per unit length), which is reciprocal of the wave length λ.
3.4.1 Infrared (IR) spectroscopy
Infrared (IR) radiation is electromagnetic radiation that encompasses all the wavelengths
between the visible and microwave regions of the electromagnetic spectrum. The IR
region can also be subdivided into three smaller regions known as near-IR, mid-IR and
far-IR, of which the mid -IR region of radiation with the frequency range of 4000 cm-1 to
400 cm-1 corresponds to the changes in fundamental vibrational levels of most of the
molecules. Hence the radiations in this region are used to probe the vibrational behavior
of the sample molecules.
Methods 44
IR radiations of frequency equal to vibrational frequency are absorbed only if a change in
the dipole moment of the molecule is involved. The vibrations accompanying dipole
moment change are thus termed as IR active, while those without change in dipole
moment are IR inactive. A typical IR spectrum for any material is obtained by irradiating
it with a range of IR radiations and then measuring the transmittance or absorption
corresponding to individual frequency. The intensity of transmitted radiation is given by
the Beer-Lambert law (Equation 3-16):
( )lcII ε−+= exp0 Equation (3-16)
I = Intensity of transmitted radiation
I0 = Initial intensity
ε = Extinction coefficient corresponding to given radiation
c = Concentration of sample
l = Thickness of the sample
In general, IR spectra are obtained by Fourier transform infrared spectroscopy (FT-IR),
which is based on the interferometer originally designed by Michelson and a
mathematical procedure developed by Fourier that converts response from the 'time' to
the 'frequency' domain 77.

Methods 45
Figure 3.9 Sketch of the Michelson interferometer.
In the Michelson interferometer (Fig. 3.9), a parallel, polychromatic beam of radiation
from a source is directed to a beam splitter, made from an infrared transparent material,
such as KBr. The beam splitter reflects approximately half of the light to a mirror, known
as the fixed mirror, which in turn reflects the light back to the beam splitter. The rest of
the light passes through to a mirror, moving continuously, at a known velocity, back and
forth along the direction of the incoming light and this is known as the moving mirror.
Upon reflection from the moving mirror, radiation is then directed back to the beam
splitter. At the beam splitter some of the light that has been reflected from the fixed
mirror combines with light reflected from the moving mirror and is directed towards the
sample. After passing through the sample, the radiation is focused onto the detector. The
detectors are sufficiently fast to cope with time domain signal changes from the
modulation in the interferometer
Methods 46
As the distance of the moving mirror from the beam splitter changes, different
wavelengths of radiation are in-phase and out-of-phase at a frequency that is dependent
both upon the rate at which the mirror moves and the frequency of radiation.
The complex pattern of overlaid sinusoidal waves of light (in the time domain) is known
as an interferogram. The interferogram can be converted back to the original frequency
distribution (spectrum) by means of a Fourier transform, which can be done very rapidly
using a computer.
3.4.2 Raman spectroscopy
3.4.2.1 The Raman effect
The Indian physicist, C. V. Raman in 1928, discovered the effect. The Raman effect is
most simply described as the inelastic scattering of light by matter. When light is
scattered by a molecule there can be one of three outcomes:
1.Elastic (Rayleigh) scattering, where there is no net energy loss or gain to the incident
light beam.
2.The light is scattered to lower energy and frequency (Stokes scattering).
3.The light is scattered to higher energy and frequency (anti-Stokes scattering).

Methods 47
When a beam of monochromatic radiation impinges on a sample, around 99.9% of the
scattered light will be Rayleigh and only 0.1% will be Raman light. The proportions of
the Stokes and anti-Stokes scattering are dependent on the vibrational energy population
distribution before irradiation (and therefore temperature).
Figure 3.10 Schematic representation of various modes of scattering.
Raman spectroscopy is complementary to the IR spectroscopy 76. The IR technique is
based on the change in the dipole moment of the molecule while Raman effect is
observed for only those modes of vibrations where change in the polarizability of the
molecule occurs.
Methods 48
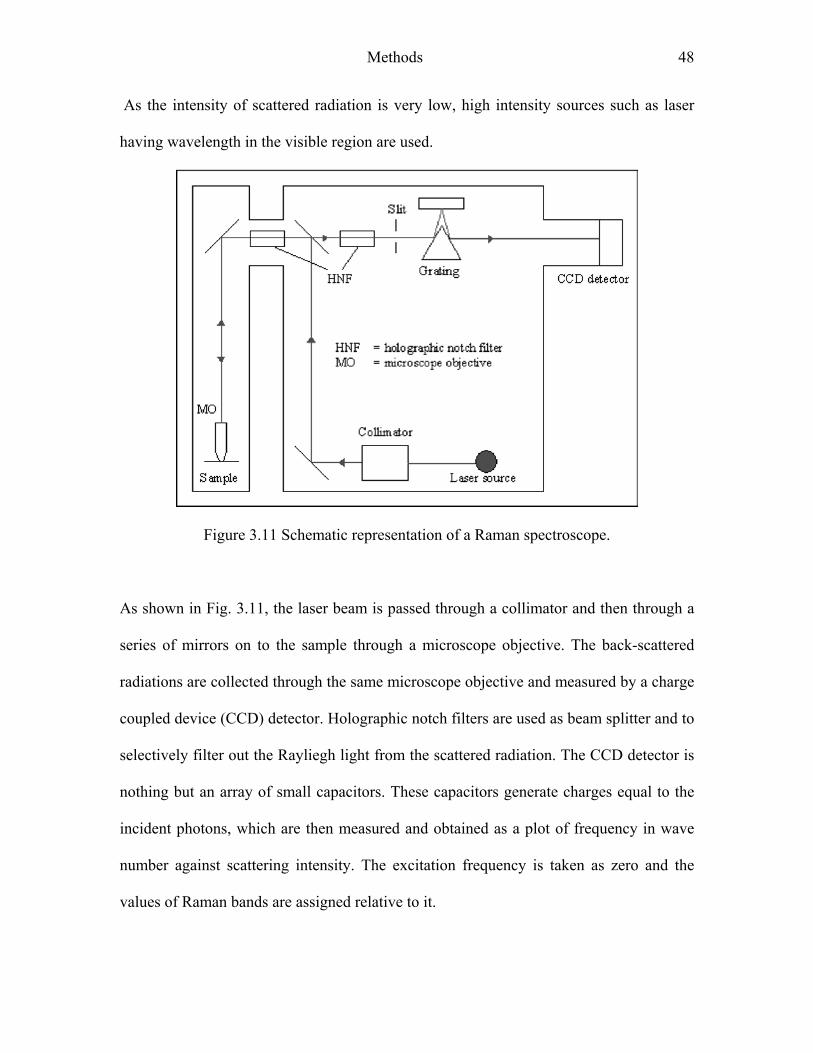
As the intensity of scattered radiation is very low, high intensity sources such as laser
having wavelength in the visible region are used.
Figure 3.11 Schematic representation of a Raman spectroscope.
As shown in Fig. 3.11, the laser beam is passed through a collimator and then through a
series of mirrors on to the sample through a microscope objective. The back-scattered
radiations are collected through the same microscope objective and measured by a charge
coupled device (CCD) detector. Holographic notch filters are used as beam splitter and to
selectively filter out the Rayliegh light from the scattered radiation. The CCD detector is
nothing but an array of small capacitors. These capacitors generate charges equal to the
incident photons, which are then measured and obtained as a plot of frequency in wave
number against scattering intensity. The excitation frequency is taken as zero and the
values of Raman bands are assigned relative to it.

Methods 49
3.5 Analytical ultracentrifugation (AUC)
AUC, invented in 1920’s by Thé Svedberg, is a very powerful and valuable method for
the investigation of the physicochemical properties of macromolecules and colloids 78.
The various techniques used in AUC lead to the direct determination of molar masses,
molecular weight distributions, shapes, particle sizes, interaction constants, sedimentation
and diffusion coefficients.
When centrifugal force is applied on a solute particle suspended in a solvent, three
different forces act on the particle, as illustrated in Fig. 3.12.
Ff = -fu
rmFs2
0ω−=Constant velocity = u
rmFs2ω=
The centrifugal force Fs is given in E
mFs ω=
m = Mass of the particle
r = distance of particle from the axi
ω = Angular velocity
quation 3-17:
r2
s of rotation
Figure 3.12 Forces acting on a solute particle under the influence of centrifugalforce.Equation 3-17
Methods 50
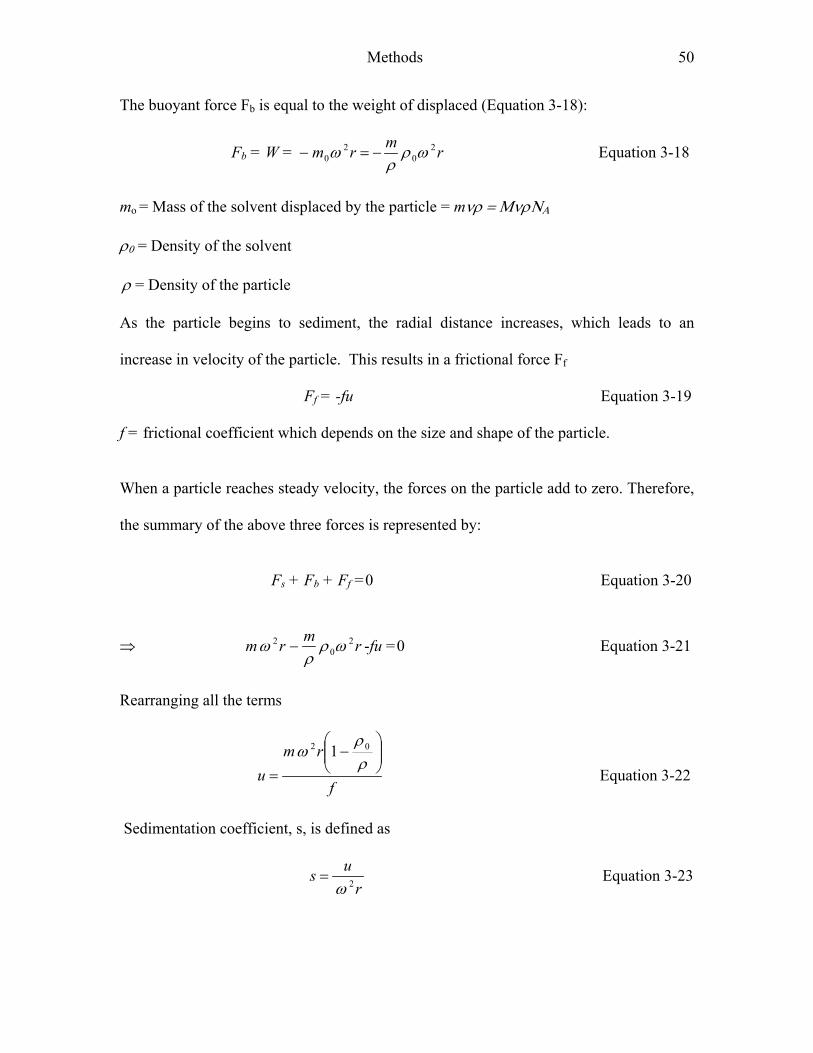
The buoyant force Fb is equal to the weight of displaced (Equation 3-18):
Fb = W = rmrm 20
20 ωρ
ρω −=− Equation 3-18
mo = Mass of the solvent displaced by the particle = mνρ = ΜνρΝΑ
ρ0 = Density of the solvent
ρ = Density of the particle
As the particle begins to sediment, the radial distance increases, which leads to an
increase in velocity of the particle. This results in a frictional force Ff
Ff = -fu Equation 3-19
f = frictional coefficient which depends on the size and shape of the particle.
When a particle reaches steady velocity, the forces on the particle add to zero. Therefore,
the summary of the above three forces is represented by:
Fs + Fb + Ff =0 Equation 3-20
⇒ rmrm 20
2 ωρρ
ω − -fu =0 Equation 3-21
Rearranging all the terms
f
rmu
−
=ρρ
ω 02 1 Equation 3-22
Sedimentation coefficient, s, is defined as
r
us 2ω= Equation 3-23

Methods 51
The frictional coefficient f is related to the solvent viscosity η and the radius of the
particle R as
Rf πη6= Equation 3-24
From equation 3-21, 3-23 and 3-24
R
ms
πηρρ
6
1 0
−
= Equation 3-25
The mass of the particle m can be given as
m = ρ V = ρ π34 R3 Equation 3-26
V= volume of a spherical particle
Substituting the value of m from Equation 3-26 into equation 3-25
( )
ηρρ
184 0
2 −=
Rs =
( )η
ρρ18
02 −D
⇒ )(
18
0ρρη
−=
sD Equation 3-27
D = the particle diameter = 2R
The sedimentation coefficient is obtained directly from the AUC measurements and from
the known values of density of particle, density of solvent and viscosity of solvent one
can easily calculate the particle diameter.
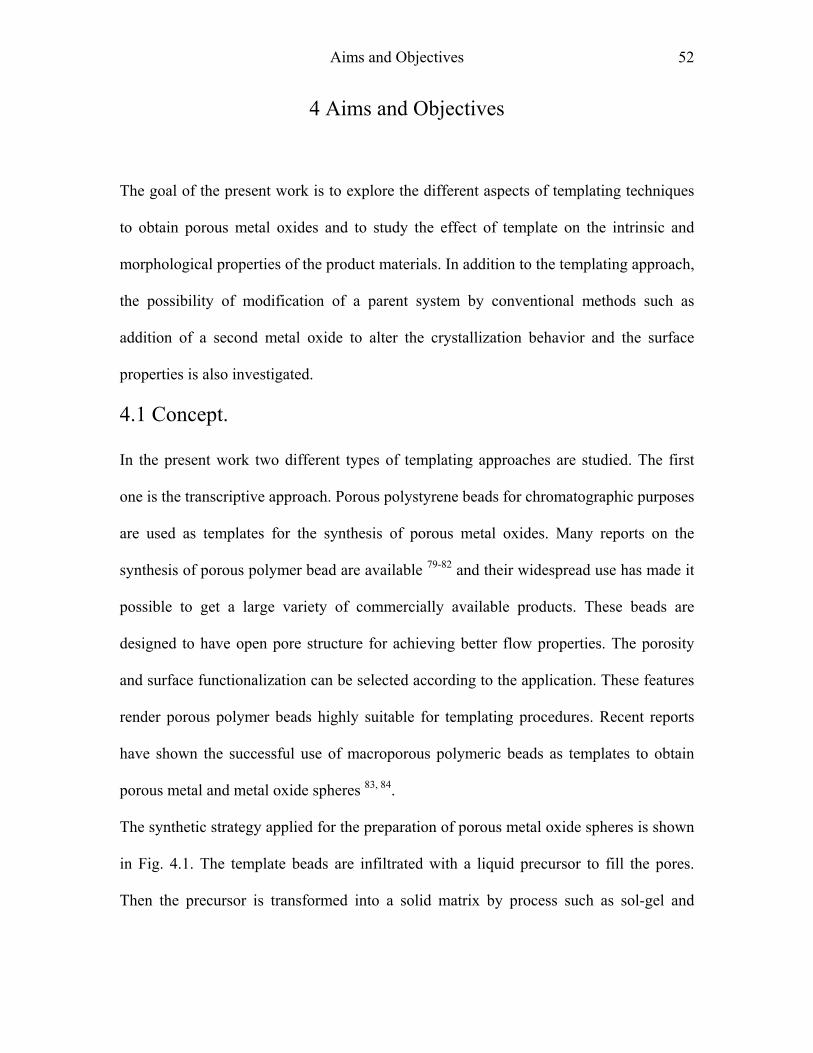
Aims and Objectives 52
4 Aims and Objectives
The goal of the present work is to explore the different aspects of templating techniques
to obtain porous metal oxides and to study the effect of template on the intrinsic and
morphological properties of the product materials. In addition to the templating approach,
the possibility of modification of a parent system by conventional methods such as
addition of a second metal oxide to alter the crystallization behavior and the surface
properties is also investigated.
4.1 Concept.
In the present work two different types of templating approaches are studied. The first
one is the transcriptive approach. Porous polystyrene beads for chromatographic purposes
are used as templates for the synthesis of porous metal oxides. Many reports on the
synthesis of porous polymer bead are available 79-82 and their widespread use has made it
possible to get a large variety of commercially available products. These beads are
designed to have open pore structure for achieving better flow properties. The porosity
and surface functionalization can be selected according to the application. These features
render porous polymer beads highly suitable for templating procedures. Recent reports
have shown the successful use of macroporous polymeric beads as templates to obtain
porous metal and metal oxide spheres 83, 84.
The synthetic strategy applied for the preparation of porous metal oxide spheres is shown
in Fig. 4.1. The template beads are infiltrated with a liquid precursor to fill the pores.
Then the precursor is transformed into a solid matrix by process such as sol-gel and
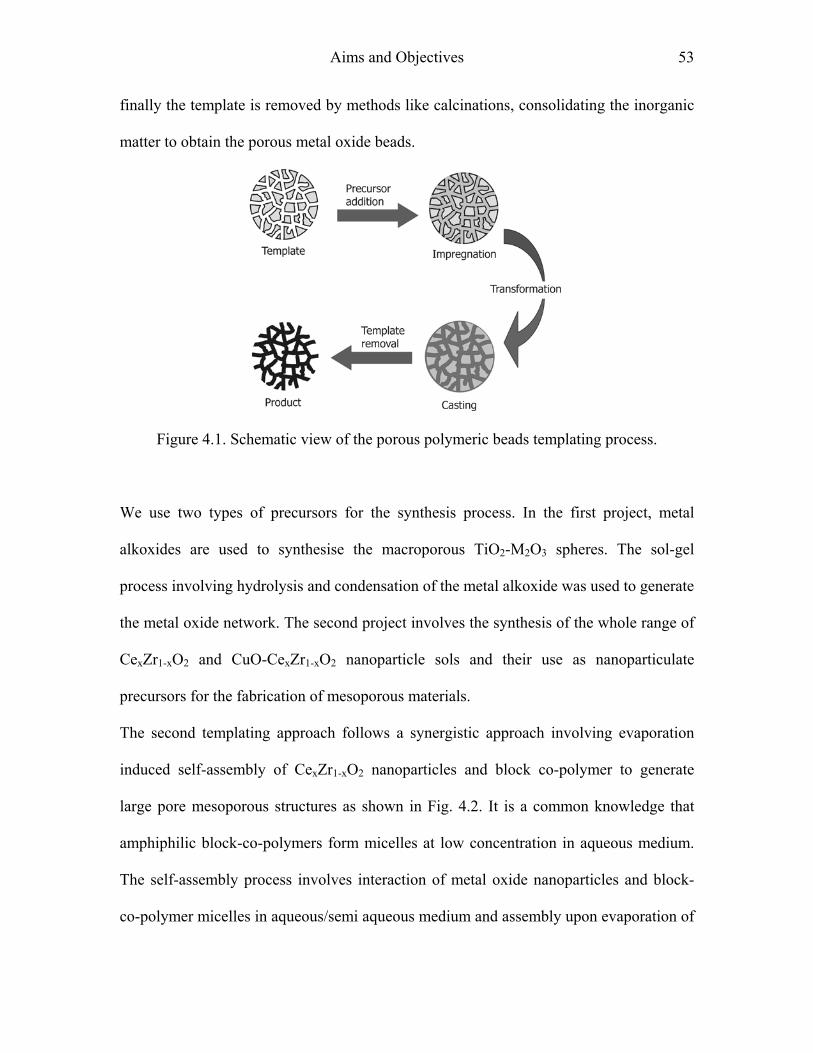
Aims and Objectives 53
finally the template is removed by methods like calcinations, consolidating the inorganic
matter to obtain the porous metal oxide beads.
Figure 4.1. Schematic view of the porous polymeric beads templating process.
We use two types of precursors for the synthesis process. In the first project, metal
alkoxides are used to synthesise the macroporous TiO2-M2O3 spheres. The sol-gel
process involving hydrolysis and condensation of the metal alkoxide was used to generate
the metal oxide network. The second project involves the synthesis of the whole range of
CexZr1-xO2 and CuO-CexZr1-xO2 nanoparticle sols and their use as nanoparticulate
precursors for the fabrication of mesoporous materials.
The second templating approach follows a synergistic approach involving evaporation
induced self-assembly of CexZr1-xO2 nanoparticles and block co-polymer to generate
large pore mesoporous structures as shown in Fig. 4.2. It is a common knowledge that
amphiphilic block-co-polymers form micelles at low concentration in aqueous medium.
The self-assembly process involves interaction of metal oxide nanoparticles and block-
co-polymer micelles in aqueous/semi aqueous medium and assembly upon evaporation of
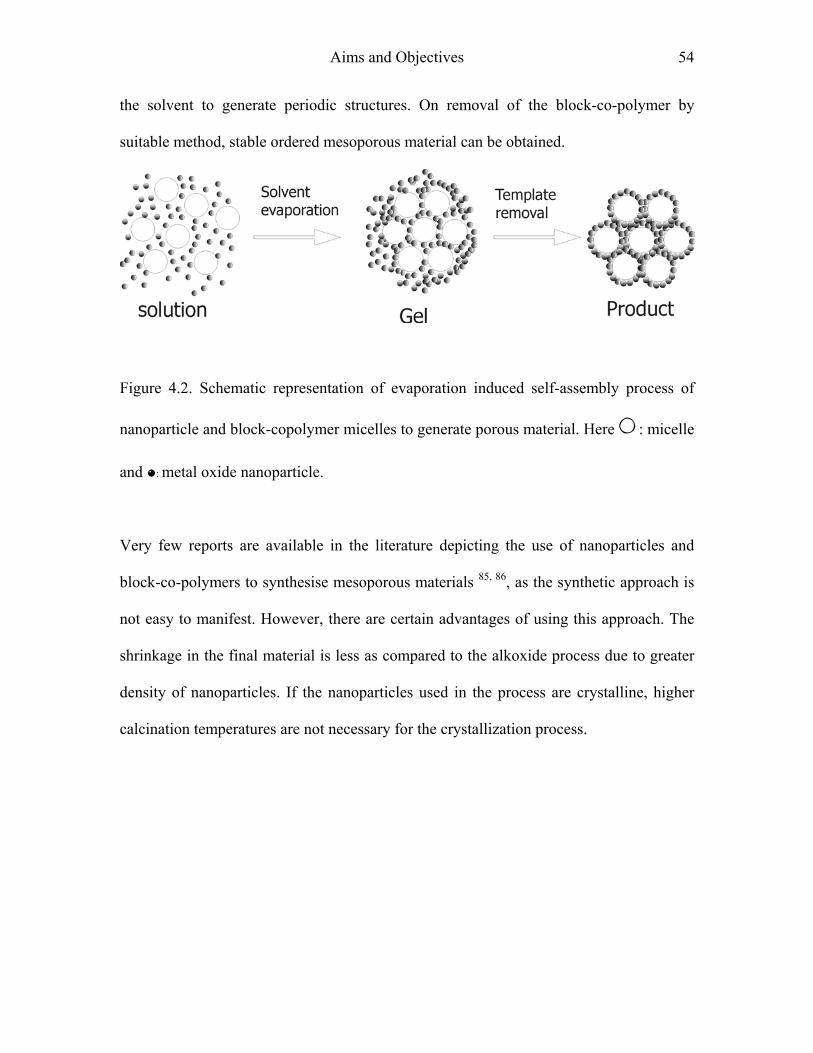
Aims and Objectives 54
the solvent to generate periodic structures. On removal of the block-co-polymer by
suitable method, stable ordered mesoporous material can be obtained.
Figure 4.2. Schematic representation of evaporation induced self-assembly process of
nanoparticle and block-copolymer micelles to generate porous material. Here : micelle
and : metal oxide nanoparticle.
Very few reports are available in the literature depicting the use of nanoparticles and
block-co-polymers to synthesise mesoporous materials 85, 86, as the synthetic approach is
not easy to manifest. However, there are certain advantages of using this approach. The
shrinkage in the final material is less as compared to the alkoxide process due to greater
density of nanoparticles. If the nanoparticles used in the process are crystalline, higher
calcination temperatures are not necessary for the crystallization process.
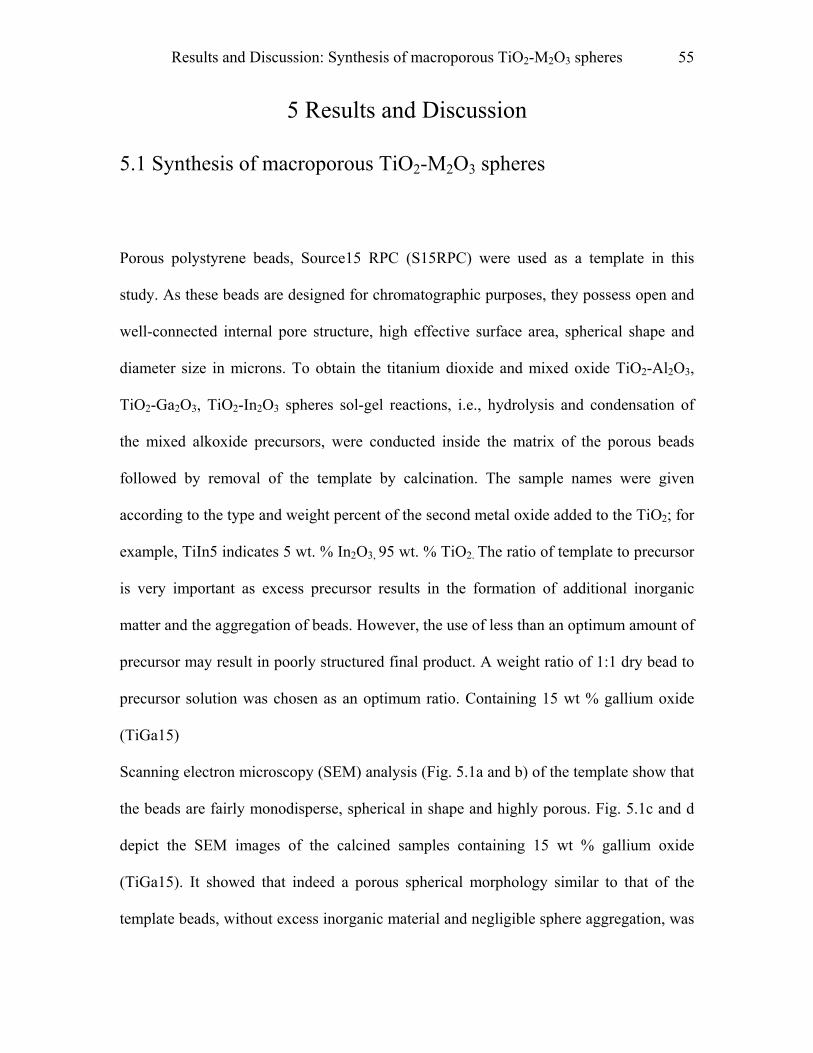
Results and Discussion: Synthesis of macroporous TiO2-M2O3 spheres 55
5 Results and Discussion
5.1 Synthesis of macroporous TiO2-M2O3 spheres
Porous polystyrene beads, Source15 RPC (S15RPC) were used as a template in this
study. As these beads are designed for chromatographic purposes, they possess open and
well-connected internal pore structure, high effective surface area, spherical shape and
diameter size in microns. To obtain the titanium dioxide and mixed oxide TiO2-Al2O3,
TiO2-Ga2O3, TiO2-In2O3 spheres sol-gel reactions, i.e., hydrolysis and condensation of
the mixed alkoxide precursors, were conducted inside the matrix of the porous beads
followed by removal of the template by calcination. The sample names were given
according to the type and weight percent of the second metal oxide added to the TiO2; for
example, TiIn5 indicates 5 wt. % In2O3, 95 wt. % TiO2. The ratio of template to precursor
is very important as excess precursor results in the formation of additional inorganic
matter and the aggregation of beads. However, the use of less than an optimum amount of
precursor may result in poorly structured final product. A weight ratio of 1:1 dry bead to
precursor solution was chosen as an optimum ratio. Containing 15 wt % gallium oxide
(TiGa15)
Scanning electron microscopy (SEM) analysis (Fig. 5.1a and b) of the template show that
the beads are fairly monodisperse, spherical in shape and highly porous. Fig. 5.1c and d
depict the SEM images of the calcined samples containing 15 wt % gallium oxide
(TiGa15). It showed that indeed a porous spherical morphology similar to that of the
template beads, without excess inorganic material and negligible sphere aggregation, was
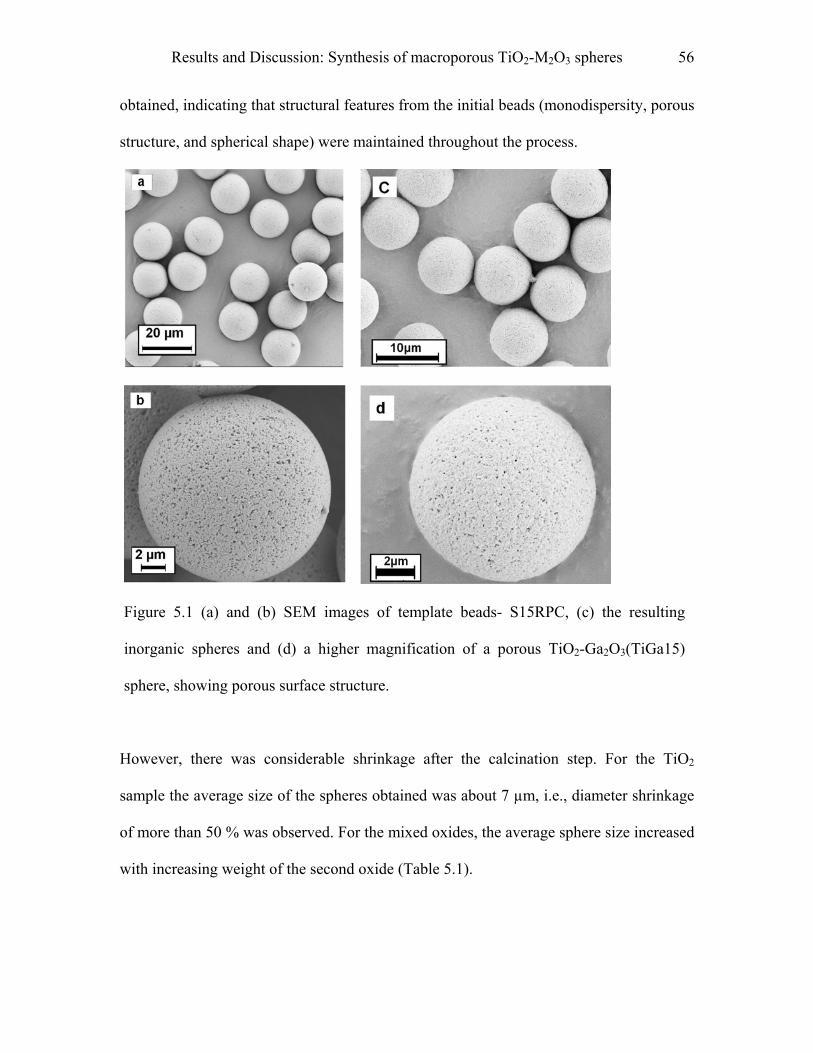
Results and Discussion: Synthesis of macroporous TiO2-M2O3 spheres 56
obtained, indicating that structural features from the initial beads (monodispersity, porous
structure, and spherical shape) were maintained throughout the process.
Figure 5.1 (a) and (b) SEM images of template beads- S15RPC, (c) the resulting
inorganic spheres and (d) a higher magnification of a porous TiO2-Ga2O3(TiGa15)
sphere, showing porous surface structure.
However, there was considerable shrinkage after the calcination step. For the TiO2
sample the average size of the spheres obtained was about 7 µm, i.e., diameter shrinkage
of more than 50 % was observed. For the mixed oxides, the average sphere size increased
with increasing weight of the second oxide (Table 5.1).
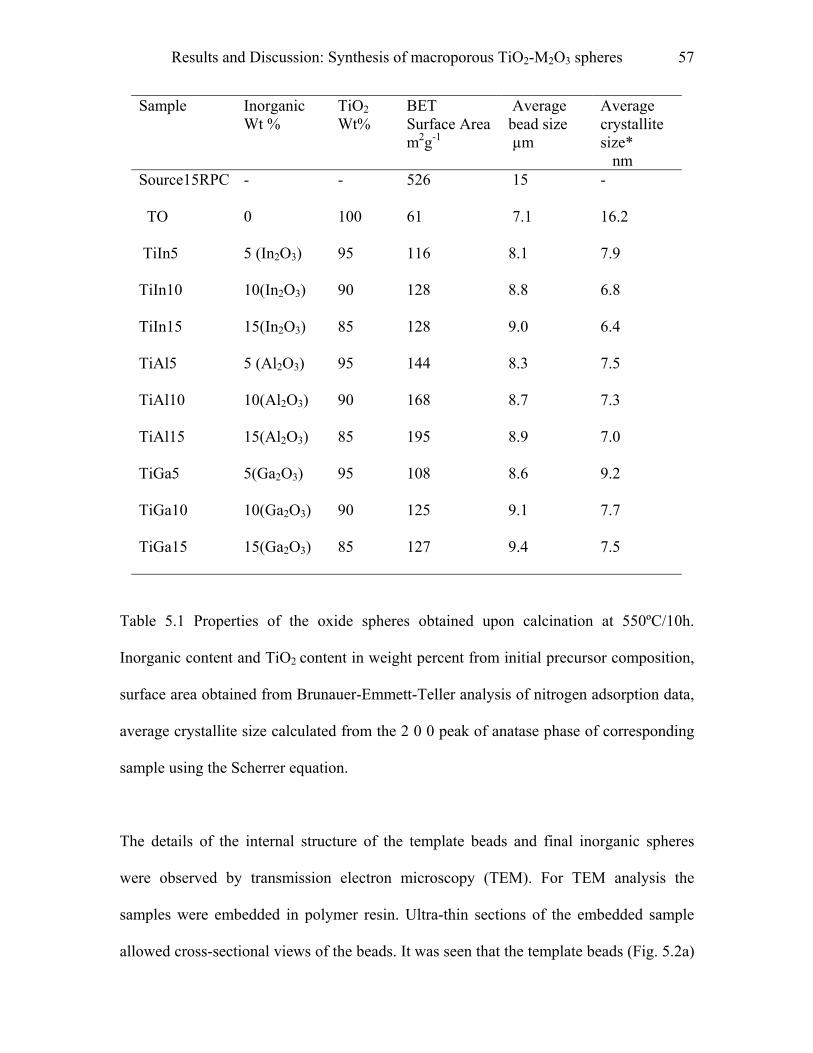
Results and Discussion: Synthesis of macroporous TiO2-M2O3 spheres 57
Sample Inorganic Wt %
TiO2 Wt%
BET Surface Area m2g-1
Average bead size µm
Average crystallite size*
nm Source15RPC - - 526 15 -
TO 0 100 61 7.1 16.2
TiIn5 5 (In2O3) 95 116 8.1 7.9
TiIn10 10(In2O3) 90 128 8.8 6.8
TiIn15 15(In2O3) 85 128 9.0 6.4
TiAl5 5 (Al2O3) 95 144 8.3 7.5
TiAl10 10(Al2O3) 90 168 8.7 7.3
TiAl15 15(Al2O3) 85 195 8.9 7.0
TiGa5 5(Ga2O3) 95 108 8.6 9.2
TiGa10 10(Ga2O3) 90 125 9.1 7.7
TiGa15 15(Ga2O3) 85 127 9.4 7.5
Table 5.1 Properties of the oxide spheres obtained upon calcination at 550ºC/10h.
Inorganic content and TiO2 content in weight percent from initial precursor composition,
surface area obtained from Brunauer-Emmett-Teller analysis of nitrogen adsorption data,
average crystallite size calculated from the 2 0 0 peak of anatase phase of corresponding
sample using the Scherrer equation.
The details of the internal structure of the template beads and final inorganic spheres
were observed by transmission electron microscopy (TEM). For TEM analysis the
samples were embedded in polymer resin. Ultra-thin sections of the embedded sample
allowed cross-sectional views of the beads. It was seen that the template beads (Fig. 5.2a)

Results and Discussion: Synthesis of macroporous TiO2-M2O3 spheres 58
have a random, interconnected internal pore structure with macropores in the range of 50-
500 nm. Infiltration of the beads with precursor followed by hydrolysis and condensation
reactions leads to an intermediate hybrid structure, an example of which is shown in Fig.
5.2b. Upon calcination, the organic material is burnt off and the amorphous inorganic
network crystallizes, thus forming porous metal oxide spheres, Fig. 5.2c.
Figure 5.2 TEM images of ultramicrotomed samples at low and high magnification. (a)
S15RPC template beads, (b) hybrid structure formed after hydrolysis and condensation
of Ti/In isopropoxide mixed precursor inside the bead matrix, (c) TiO2/In2O3 (TiIn10)
spheres.
The effect of the addition of the second metal oxide on the titania particle size could be
observed during the TEM studies: A decrease in particle size was seen in the mixed oxide
samples compared with the TiO2 sample. The average titania particle size decreased with
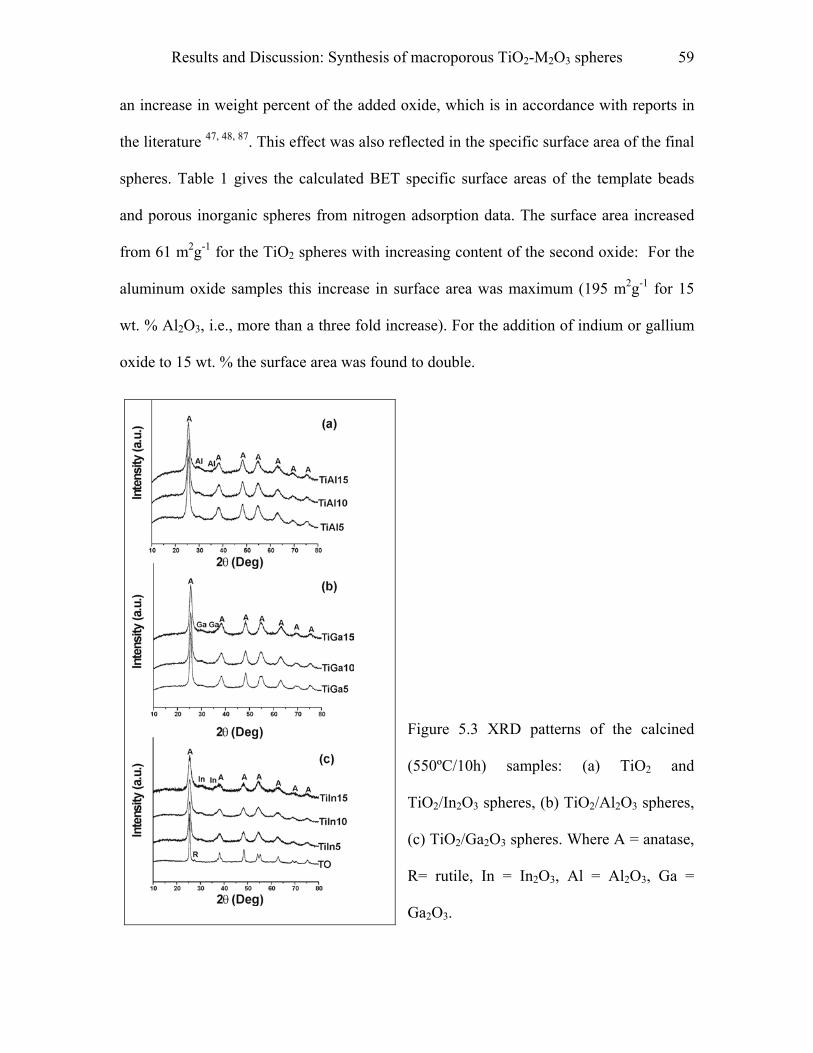
Results and Discussion: Synthesis of macroporous TiO2-M2O3 spheres 59
an increase in weight percent of the added oxide, which is in accordance with reports in
the literature 47, 48, 87. This effect was also reflected in the specific surface area of the final
spheres. Table 1 gives the calculated BET specific surface areas of the template beads
and porous inorganic spheres from nitrogen adsorption data. The surface area increased
from 61 m2g-1 for the TiO2 spheres with increasing content of the second oxide: For the
aluminum oxide samples this increase in surface area was maximum (195 m2g-1 for 15
wt. % Al2O3, i.e., more than a three fold increase). For the addition of indium or gallium
oxide to 15 wt. % the surface area was found to double.
Figure 5.3 XRD patterns of the calcined
(550ºC/10h) samples: (a) TiO2 and
TiO2/In2O3 spheres, (b) TiO2/Al2O3 spheres,
(c) TiO2/Ga2O3 spheres. Where A = anatase,
R= rutile, In = In2O3, Al = Al2O3, Ga =
Ga2O3.
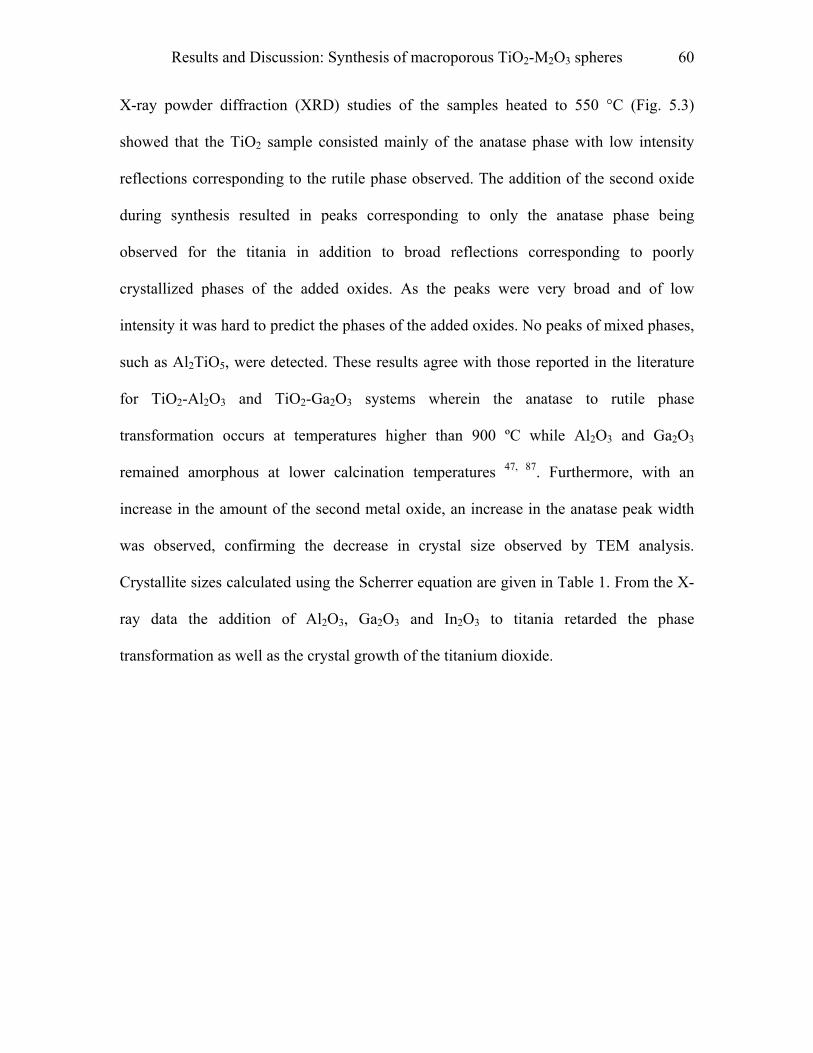
Results and Discussion: Synthesis of macroporous TiO2-M2O3 spheres 60
X-ray powder diffraction (XRD) studies of the samples heated to 550 °C (Fig. 5.3)
showed that the TiO2 sample consisted mainly of the anatase phase with low intensity
reflections corresponding to the rutile phase observed. The addition of the second oxide
during synthesis resulted in peaks corresponding to only the anatase phase being
observed for the titania in addition to broad reflections corresponding to poorly
crystallized phases of the added oxides. As the peaks were very broad and of low
intensity it was hard to predict the phases of the added oxides. No peaks of mixed phases,
such as Al2TiO5, were detected. These results agree with those reported in the literature
for TiO2-Al2O3 and TiO2-Ga2O3 systems wherein the anatase to rutile phase
transformation occurs at temperatures higher than 900 ºC while Al2O3 and Ga2O3
remained amorphous at lower calcination temperatures 47, 87. Furthermore, with an
increase in the amount of the second metal oxide, an increase in the anatase peak width
was observed, confirming the decrease in crystal size observed by TEM analysis.
Crystallite sizes calculated using the Scherrer equation are given in Table 1. From the X-
ray data the addition of Al2O3, Ga2O3 and In2O3 to titania retarded the phase
transformation as well as the crystal growth of the titanium dioxide.
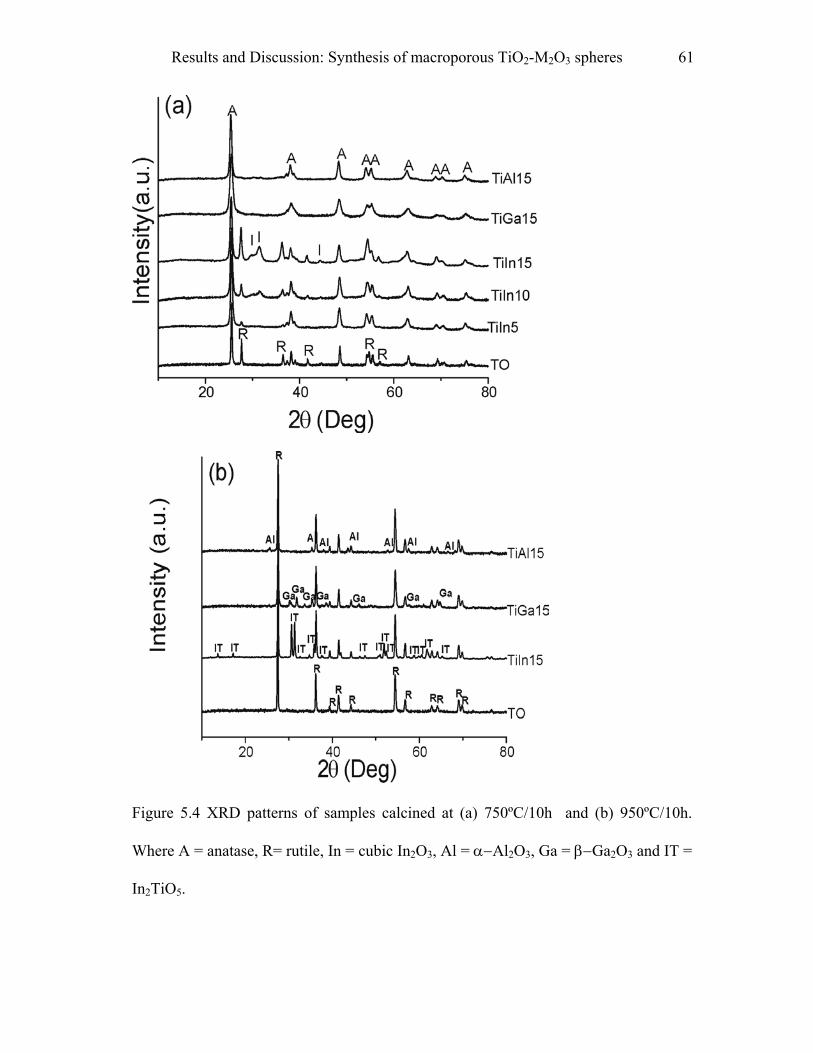
Results and Discussion: Synthesis of macroporous TiO2-M2O3 spheres 61
Figure 5.4 XRD patterns of samples calcined at (a) 750ºC/10h and (b) 950ºC/10h.
Where A = anatase, R= rutile, In = cubic In2O3, Al = α−Al2O3, Ga = β−Ga2O3 and IT =
In2TiO5.
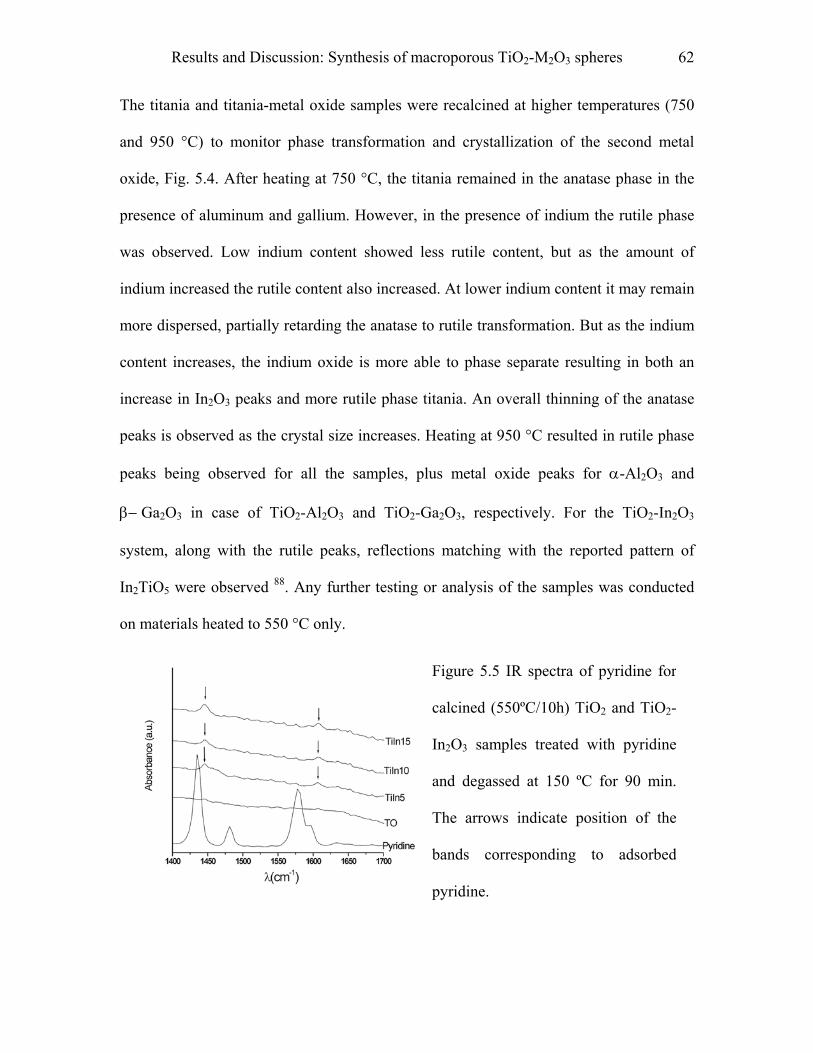
Results and Discussion: Synthesis of macroporous TiO2-M2O3 spheres 62
The titania and titania-metal oxide samples were recalcined at higher temperatures (750
and 950 °C) to monitor phase transformation and crystallization of the second metal
oxide, Fig. 5.4. After heating at 750 °C, the titania remained in the anatase phase in the
presence of aluminum and gallium. However, in the presence of indium the rutile phase
was observed. Low indium content showed less rutile content, but as the amount of
indium increased the rutile content also increased. At lower indium content it may remain
more dispersed, partially retarding the anatase to rutile transformation. But as the indium
content increases, the indium oxide is more able to phase separate resulting in both an
increase in In2O3 peaks and more rutile phase titania. An overall thinning of the anatase
peaks is observed as the crystal size increases. Heating at 950 °C resulted in rutile phase
peaks being observed for all the samples, plus metal oxide peaks for α-Al2O3 and
β− Ga2O3 in case of TiO2-Al2O3 and TiO2-Ga2O3, respectively. For the TiO2-In2O3
system, along with the rutile peaks, reflections matching with the reported pattern of
In2TiO5 were observed 88. Any further testing or analysis of the samples was conducted
on materials heated to 550 °C only.
Figure 5.5 IR spectra of pyridine for
calcined (550ºC/10h) TiO2 and TiO2-
In2O3 samples treated with pyridine
and degassed at 150 ºC for 90 min.
The arrows indicate position of the
bands corresponding to adsorbed
pyridine.
Results and Discussion: Synthesis of macroporous TiO2-M2O3 spheres 63
Pyridine adsorption studies are useful to determine the surface acidity of samples 45, 89.
additionally allowing the distinction between Lewis and Bronsted acid sites. The
formation of coordinated species, pyL, on Lewis acid sites leads to the appearance of IR
bands near 1620-1600 cm-1 and 1450 cm-1, whereas, the formation of pyridinium ions,
pyH+, on protonic sites gives rise to characteristic bands at 1640 and 1540 cm-190, 91. Fig.
5.5 shows representative IR spectra of the TiO2 and TiO2-In2O3 samples after treating
them with pyridine and subsequently degassing at 150 ºC for 90 min. For the TiO2
sample, bands corresponding to adsorbed pyridine were seen when the samples were
degassed at room temperature (data not shown) after pyridine treatment. These bands
disappeared upon degassing at 150 ºC, indicating the absence of strong acidic sites.
However, the TiO2-In2O3 samples even after degassing at 150 ºC, showed the absorption
bands at 1444 cm-1 and 1604 cm-1, corresponding to the presence of adsorbed pyridine.
No other bands were observed, suggesting the presence of strongly acidic Lewis and not
Bronsted acid sites. Similar results were obtained for the TiO2-Al2O3 and TiO2 -Ga2O3
samples. When considering the samples for photocatalysis these acidic sites may prove to
be useful in co-ordination of organic species to the surface, thereby increasing the
concentration of the organic compound at the catalyst surface. As the acidity is of Lewis
type and not Bronsted, there is no influence of the addition of Al2O3, In2O3 or Ga2O3 on
enhancing the concentration of surface hydroxyl groups.
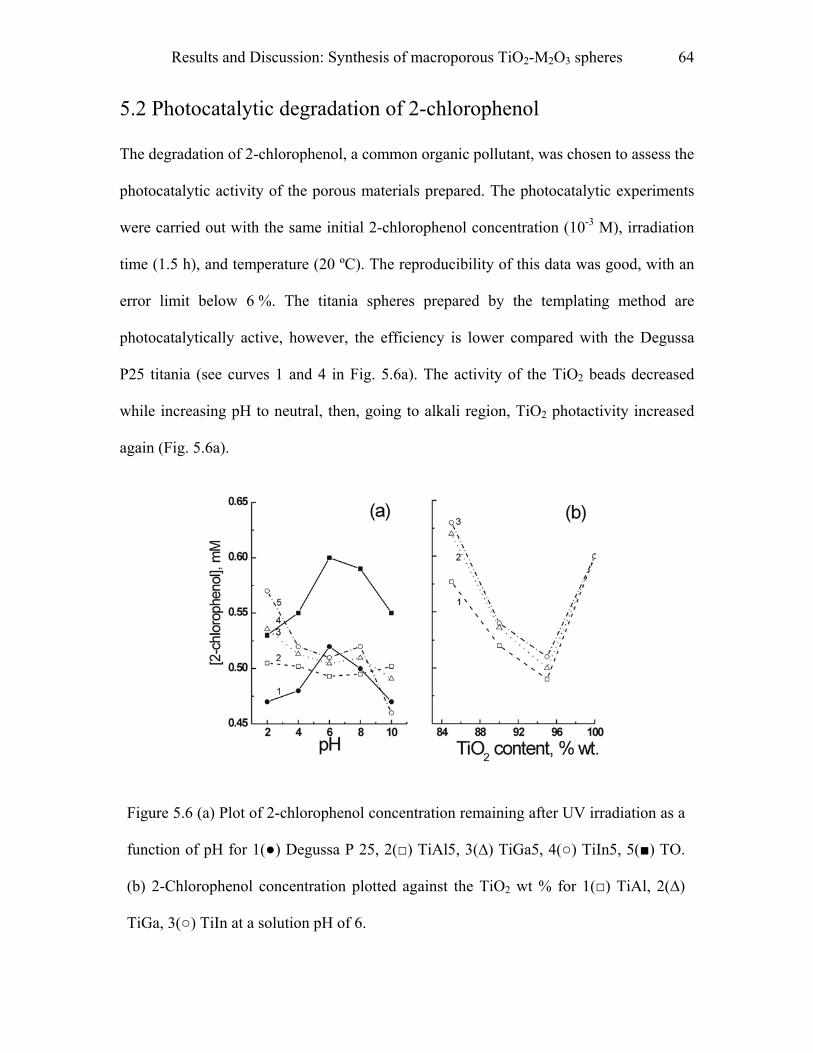
Results and Discussion: Synthesis of macroporous TiO2-M2O3 spheres 64
5.2 Photocatalytic degradation of 2-chlorophenol
The degradation of 2-chlorophenol, a common organic pollutant, was chosen to assess the
photocatalytic activity of the porous materials prepared. The photocatalytic experiments
were carried out with the same initial 2-chlorophenol concentration (10-3 M), irradiation
time (1.5 h), and temperature (20 ºC). The reproducibility of this data was good, with an
error limit below 6 %. The titania spheres prepared by the templating method are
photocatalytically active, however, the efficiency is lower compared with the Degussa
P25 titania (see curves 1 and 4 in Fig. 5.6a). The activity of the TiO2 beads decreased
while increasing pH to neutral, then, going to alkali region, TiO2 photactivity increased
again (Fig. 5.6a).
Figure 5.6 (a) Plot of 2-chlorophenol concentration remaining after UV irradiation as a
function of pH for 1(●) Degussa P 25, 2(□) TiAl5, 3(∆) TiGa5, 4(○) TiIn5, 5(■) TO.
(b) 2-Chlorophenol concentration plotted against the TiO2 wt % for 1(□) TiAl, 2(∆)
TiGa, 3(○) TiIn at a solution pH of 6.
Results and Discussion: Synthesis of macroporous TiO2-M2O3 spheres 65
Literature reports show contradicting data on pH dependence of pure TiO2 photoactivity
in 2-chlorophenol photodegradation reaction. Rao et. al.92 and Oliveria et. al. 93 reported
no significant pH dependence in the pH range of 3-11 and 3-9 respectively, while Doong
et. al. 94 showed an increase in degradation rate with increase in pH (pH range 2.5-12.5).
However, Ku et. al.95 reported a decrease in degradation rate with increase in pH (pH
range 3-11). No proper explanations for such discrepancy can be found in the literature:
Various interdependent parameters, such as sample history, surface properties,
experimental conditions, etc., which greatly influence materials properties and therefore
effect the degradation behavior, making it difficult to find a consistent correlation.
Addition of a second metal oxide component (Al2O3, Ga2O3, In2O3) lead to an
enhancement of the photocatalytic activity (Fig. 5.6b). This was most pronounced for the
TiO2-metal oxide materials with 5 wt. % of the second oxide, which were seen to be more
efficient than Degussa P25 at pH 6. However, increasing the second metal oxide content
from 5 wt % to 15 wt. %, resulted in decreased photocatalytic activity within the
respective series (Fig. 5.6b.). It has been shown previously that the addition of a small
amount of a non-photoactive metal oxide can increase the photocatalytic efficiency of
titania because of its influence on a number of materials properties (such as adsorption
behavior, surface acidity, specific surface area, and crystallinity) 46, 60, 96, 97. However,
further increasing the content of the second metal oxide resulted in decreasing
photocatalytic activity of the material.
Explanations for the observed increase in the photocatalytic activity of the titania after
the addition of the second metal oxide are as follows: Firstly, as it was discussed above,
the specific surface area of the material increased with the addition of the second metal
oxide. Therefore, potentially, with more surface sites there is an increased probability of
Results and Discussion: Synthesis of macroporous TiO2-M2O3 spheres 66
organic moiety-catalyst surface interaction. Secondly, the second metal oxide stabilizes
titanium dioxide against anatase to rutile phase transformation, hence increasing the
amount of the more photoactive titania form, anatase 46, 60. A third reason for the
enhanced activity is the influence of the second metal oxide on the surface properties of
TiO2. It is well known that the activity of TiO2 depends on the surface acidity and surface
recombination rate 96, 97. Modifying the TiO2 with Al2O3, Ga2O3, or In2O3 makes the
material more acidic, as shown by pyridine adsorption. As a result, improved adsorption
of the decomposing substance on the surface of the mixed metal oxide materials,
compared to the TiO2, can be expected. It is also important to add that mixed TiO2-metal
oxide samples show a different pH-dependence of photoactivity than that of TiO2 (Fig.
5.6a). The TiAl5 sample showed least variation in photocatalytic activity with change in
pH. The TiIn5 sample showed greatest variation, being least active at low pH and most
active at pH 10. The possible explanation for these results can be given as follows. XRD
results for all the samples show absence of the second metal oxide even after extended
calcination at 550ºC indicating that they remain amorphous. The reason for this might be
that the second metal oxide remains dispersed, forming a layer on the anatase crystallite.
This layer then dictates the surface properties and electron transfer from anatase crystal to
the organic moiety. Increase in second metal oxide content increases the layer thickness,
which can impede the process of electron transfer. Indeed we can see from Fig. 5.6b, that
the photocatalytic activity decreases with increase in second metal oxide content. Al2O3
is a nonconducting material while In2O3 is a semiconductor. It is known for the
semiconductor that the band position varies as a function of pH 98. Assuming that the
surface layer of the second metal oxide covers the anatase crystallites, we see that the
Al2O3 containing samples show least variation in photoactivity as it is a non conductor
Results and Discussion: Synthesis of macroporous TiO2-M2O3 spheres 67
while In2O3 containing sample show maximum variation as their band gap varies most.
Acidity increases as In2O3 < Ga2O3 < Al2O3. As discussed before, an increase in surface
acidity enhances the adsorption behavior of the organic component and hence results in
greater degradation of organics 96. Accordingly, it is reasonable that the greatest activity
was obtained for Al2O3 containing samples, followed by Ga2O3. In2O3 containing
samples are the least active.

Results and Discussion: Synthesis of CexZr1-xO2 nanoparticle sols 68
6 Results and Discussion
6.1 Synthesis of CexZr1-xO2 nanoparticle sols
During the synthesis of the CexZr1-xO2 sols the first step was the hydrolysis of the mixed
precursor by addition of an aqueous NH3 solution resulting in a pH higher than 10. It was
necessary to wash off the excess of base immediately after the precipitation process. We
observed that aging of the precipitate in basic medium, even for less than an hour, failed
to give a transparent sol. The solubility product of Ce(OH)4 is extraordinarily small (2⋅10-
48) and the basic behaviour of Ce(OH)4 leads to the situation that an increase of pH
decreases the solubility of Ce(OH)4, whereas a decrease of pH increases the solubility 99.
Accordingly, at basic pH the Ostwald ripening process enhances the growth of large
particles, because precipitated Ce(OH)4 clusters contribute to the crystal growth, whereas
smaller grains dissolve slowly. After the washing step, nitric acid was added and the
suspension was sonicated. The addition of acid leads to the opposite situation, namely a
decrease of pH, so that smaller hydroxide particles dissolve fast and that the larger ones
grow slowly because of the low Ce(OH)4 concentration. Sonication enhanced this process
and prevented the growth of particles beyond a certain extent by breaking up the larger
agglomerates. The particle surface is covered with hydroxyl groups. Since the pH of the
sol was below 2, the hydroxyls are protonated, leading to positively charged particles.
The positive charge is counterbalanced by nitrate anions forming an electrical double
layer-Stern layer 100, 101, followed by diffused layers. This imparts stability to the
nanoparticles in the sol. The sols do not undergo gelation or sedimentation for at least 12

Results and Discussion: Synthesis of CexZr1-xO2 nanoparticle sols 69
weeks. Upon dialyzing the sol to a pH of 4-5, it started to gel slowly over a period of 1-2
days. Depending on the composition the colour of sols varied from yellow for pure CeO2
to colourless for pure ZrO2. The solid content in the sols was about 5-8 wt%. Undialyzed
sols were found to be stable on the addition of a large quantity of alcohol. The sols that
were dialyzed against ethanol showed that about 90 % of water could be replaced by
ethanol. However, total water replacement was not possible and resulted in precipitation
of nanoparticles.
For many applications of nanoparticles, particle size distribution is a fundamental
parameter, but still its determination often remains a difficult task. Although literature
reports generally present particle size distribution data based on TEM results 102, 103, there
is no unambiguous statistics for the particle size distribution of the whole sample.
Analytical ultracentrifugation (AUC) has proven to be a versatile tool for the
measurement of the particle size distribution of colloidal samples 78, 104. In contrast to
TEM, AUC detects all particles even down to smallest sizes. The resolution of the
particle size distribution for small nanoparticles lies in the Angström range 105.
Figure 6.1 Particle size distribution curves
for dialyzed CeO2 and ZrO2 sol obtained by
AUC analysis.
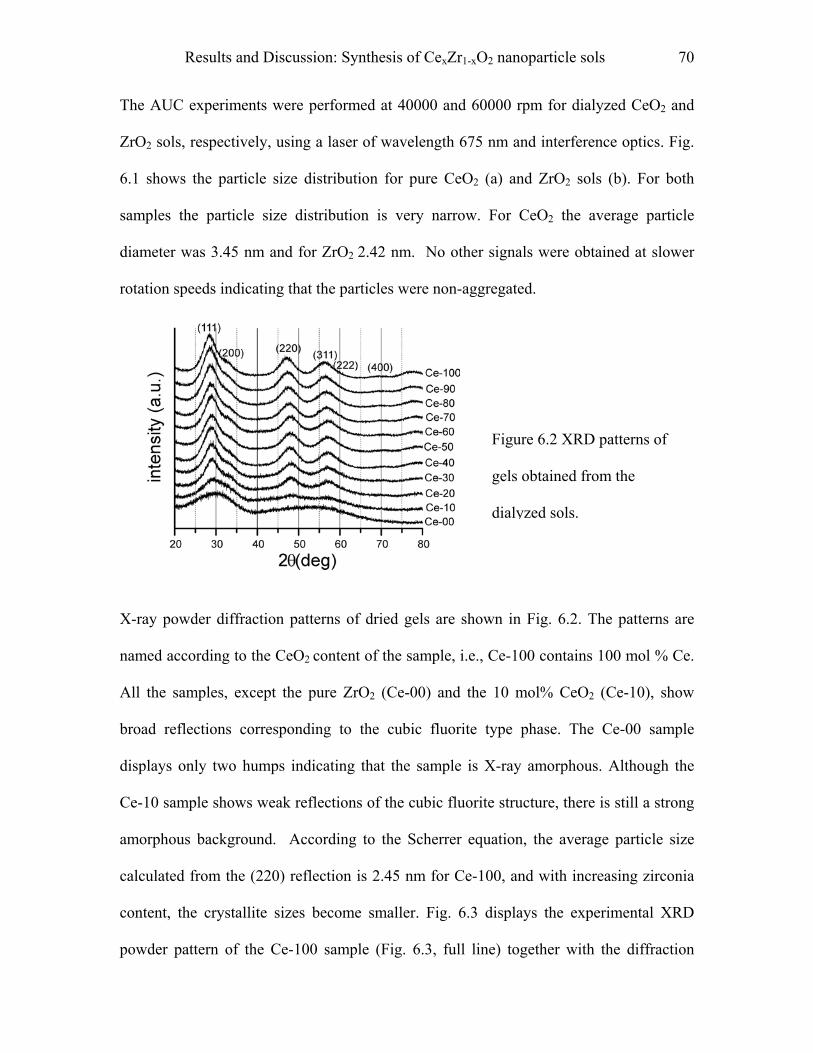
Results and Discussion: Synthesis of CexZr1-xO2 nanoparticle sols 70
The AUC experiments were performed at 40000 and 60000 rpm for dialyzed CeO2 and
ZrO2 sols, respectively, using a laser of wavelength 675 nm and interference optics. Fig.
6.1 shows the particle size distribution for pure CeO2 (a) and ZrO2 sols (b). For both
samples the particle size distribution is very narrow. For CeO2 the average particle
diameter was 3.45 nm and for ZrO2 2.42 nm. No other signals were obtained at slower
rotation speeds indicating that the particles were non-aggregated.
X-ray powder diffraction patterns of dried gels are sho
named according to the CeO2 content of the sample, i.e.,
All the samples, except the pure ZrO2 (Ce-00) and the
broad reflections corresponding to the cubic fluorite
displays only two humps indicating that the sample is
Ce-10 sample shows weak reflections of the cubic fluori
amorphous background. According to the Scherrer eq
calculated from the (220) reflection is 2.45 nm for Ce-1
content, the crystallite sizes become smaller. Fig. 6.3
powder pattern of the Ce-100 sample (Fig. 6.3, full lin
Figure 6.2 XRD patterns of
gels obtained from the
dialyzed sols.
wn in Fig. 6.2. The patterns are
Ce-100 contains 100 mol % Ce.
10 mol% CeO2 (Ce-10), show
type phase. The Ce-00 sample
X-ray amorphous. Although the
te structure, there is still a strong
uation, the average particle size
00, and with increasing zirconia
displays the experimental XRD
e) together with the diffraction
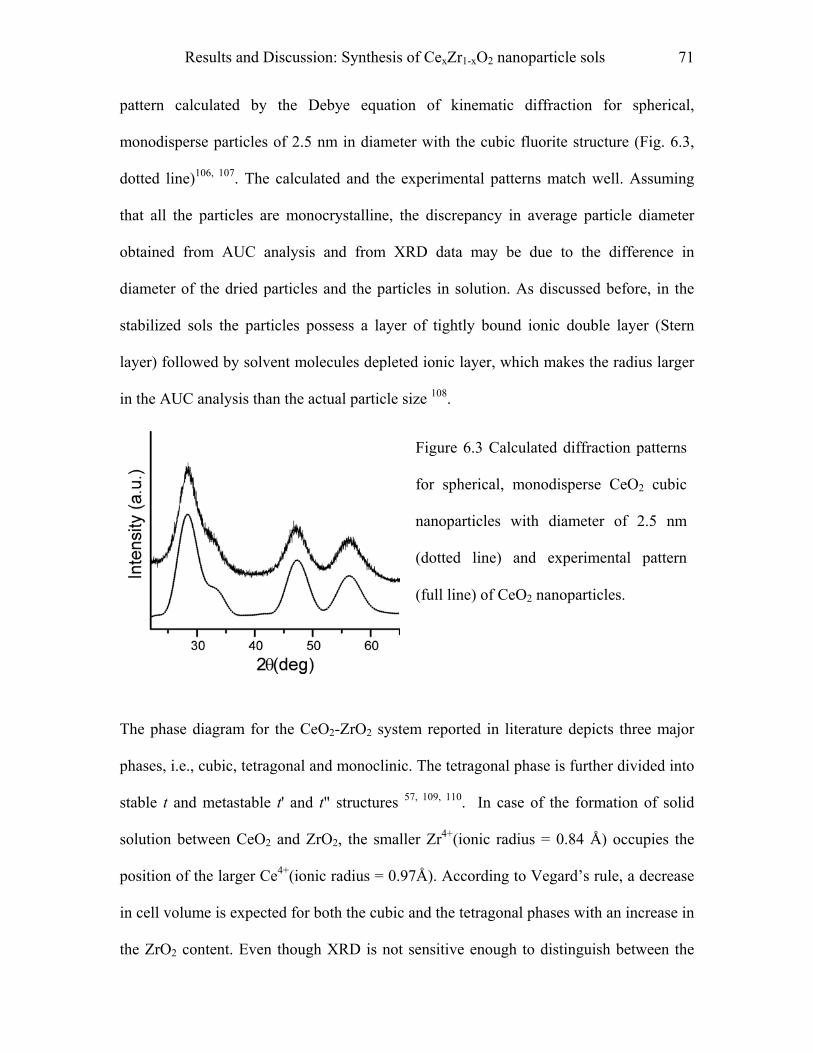
Results and Discussion: Synthesis of CexZr1-xO2 nanoparticle sols 71
pattern calculated by the Debye equation of kinematic diffraction for spherical,
monodisperse particles of 2.5 nm in diameter with the cubic fluorite structure (Fig. 6.3,
dotted line)106, 107. The calculated and the experimental patterns match well. Assuming
that all the particles are monocrystalline, the discrepancy in average particle diameter
obtained from AUC analysis and from XRD data may be due to the difference in
diameter of the dried particles and the particles in solution. As discussed before, in the
stabilized sols the particles possess a layer of tightly bound ionic double layer (Stern
layer) followed by solvent molecules depleted ionic layer, which makes the radius larger
in the AUC analysis than the actual particle size 108.
Figure 6.3 Calculated diffraction patterns
for spherical, monodisperse CeO2 cubic
nanoparticles with diameter of 2.5 nm
(dotted line) and experimental pattern
(full line) of CeO2 nanoparticles.
The phase diagram for the CeO2-ZrO2 system reported in literature depicts three major
phases, i.e., cubic, tetragonal and monoclinic. The tetragonal phase is further divided into
stable t and metastable t' and t" structures 57, 109, 110. In case of the formation of solid
solution between CeO2 and ZrO2, the smaller Zr4+(ionic radius = 0.84 Å) occupies the
position of the larger Ce4+(ionic radius = 0.97Å). According to Vegard’s rule, a decrease
in cell volume is expected for both the cubic and the tetragonal phases with an increase in
the ZrO2 content. Even though XRD is not sensitive enough to distinguish between the
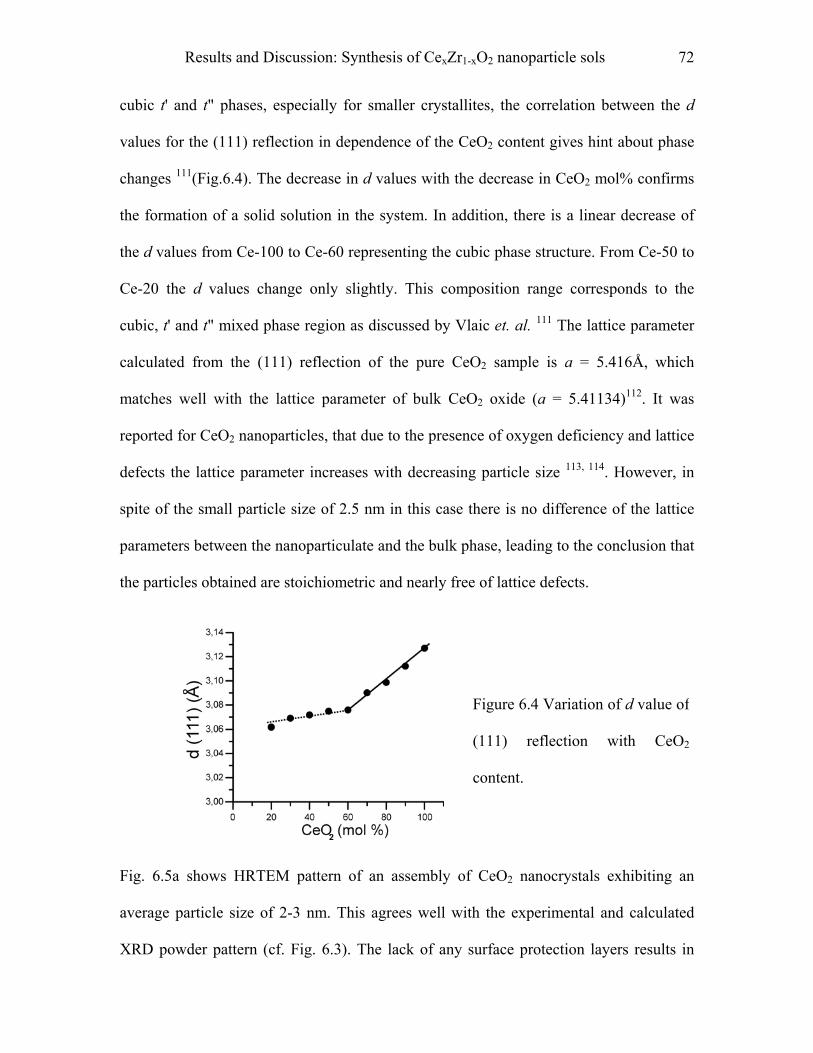
Results and Discussion: Synthesis of CexZr1-xO2 nanoparticle sols 72
cubic t' and t" phases, especially for smaller crystallites, the correlation between the d
values for the (111) reflection in dependence of the CeO2 content gives hint about phase
changes 111(Fig.6.4). The decrease in d values with the decrease in CeO2 mol% confirms
the formation of a solid solution in the system. In addition, there is a linear decrease of
the d values from Ce-100 to Ce-60 representing the cubic phase structure. From Ce-50 to
Ce-20 the d values change only slightly. This composition range corresponds to the
cubic, t' and t" mixed phase region as discussed by Vlaic et. al. 111 The lattice parameter
calculated from the (111) reflection of the pure CeO2 sample is a = 5.416Å, which
matches well with the lattice parameter of bulk CeO2 oxide (a = 5.41134)112. It was
reported for CeO2 nanoparticles, that due to the presence of oxygen deficiency and lattice
defects the lattice parameter increases with decreasing particle size 113, 114. However, in
spite of the small particle size of 2.5 nm in this case there is no difference of the lattice
parameters between the nanoparticulate and the bulk phase, leading to the conclusion that
the particles obtained are stoichiometric and nearly free of lattice defects.
Fig. 6.5a shows HRTEM pattern of an assembly o
average particle size of 2-3 nm. This agrees well w
XRD powder pattern (cf. Fig. 6.3). The lack of any
Figure 6.4 Variation of d value of
(111) reflection with CeO2
content.
f CeO2 nanocrystals exhibiting an
ith the experimental and calculated
surface protection layers results in
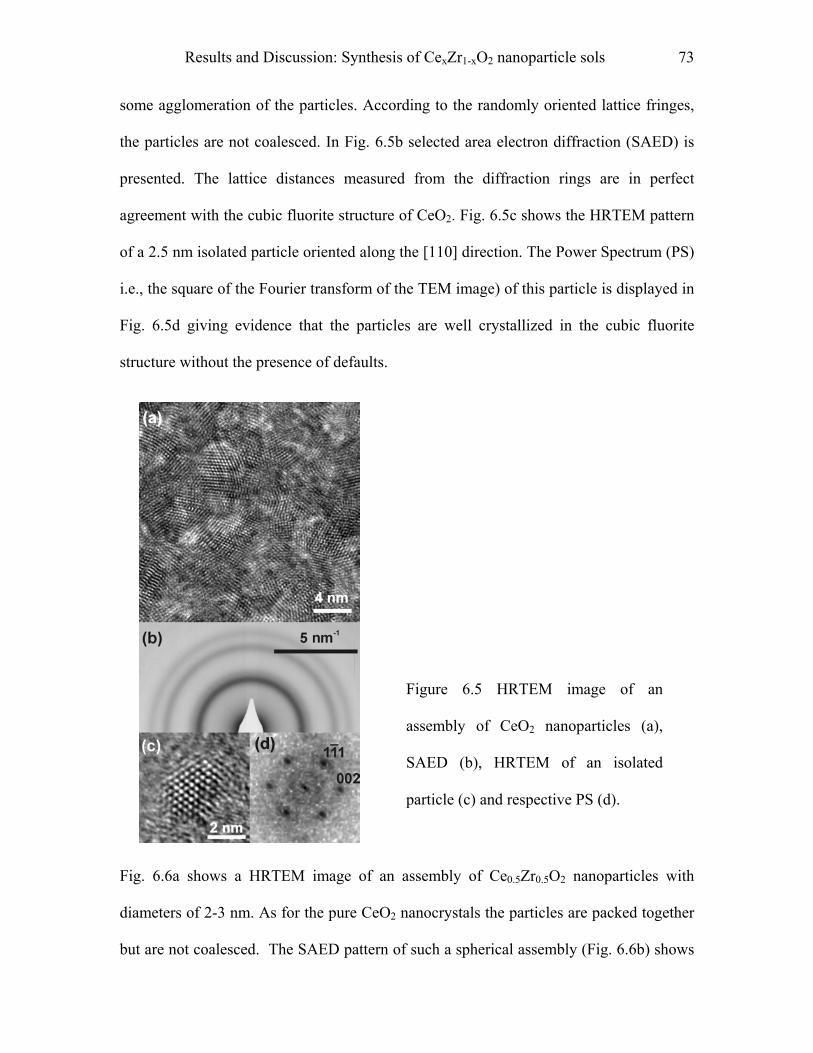
Results and Discussion: Synthesis of CexZr1-xO2 nanoparticle sols 73
some agglomeration of the particles. According to the randomly oriented lattice fringes,
the particles are not coalesced. In Fig. 6.5b selected area electron diffraction (SAED) is
presented. The lattice distances measured from the diffraction rings are in perfect
agreement with the cubic fluorite structure of CeO2. Fig. 6.5c shows the HRTEM pattern
of a 2.5 nm isolated particle oriented along the [110] direction. The Power Spectrum (PS)
i.e., the square of the Fourier transform of the TEM image) of this particle is displayed in
Fig. 6.5d giving evidence that the particles are well crystallized in the cubic fluorite
structure without the presence of defaults.
Figure 6.5 HRTEM image of an
assembly of CeO2 nanoparticles (a),
SAED (b), HRTEM of an isolated
particle (c) and respective PS (d).
Fig. 6.6a shows a HRTEM image of an assembly of Ce0.5Zr0.5O2 nanoparticles with
diameters of 2-3 nm. As for the pure CeO2 nanocrystals the particles are packed together
but are not coalesced. The SAED pattern of such a spherical assembly (Fig. 6.6b) shows
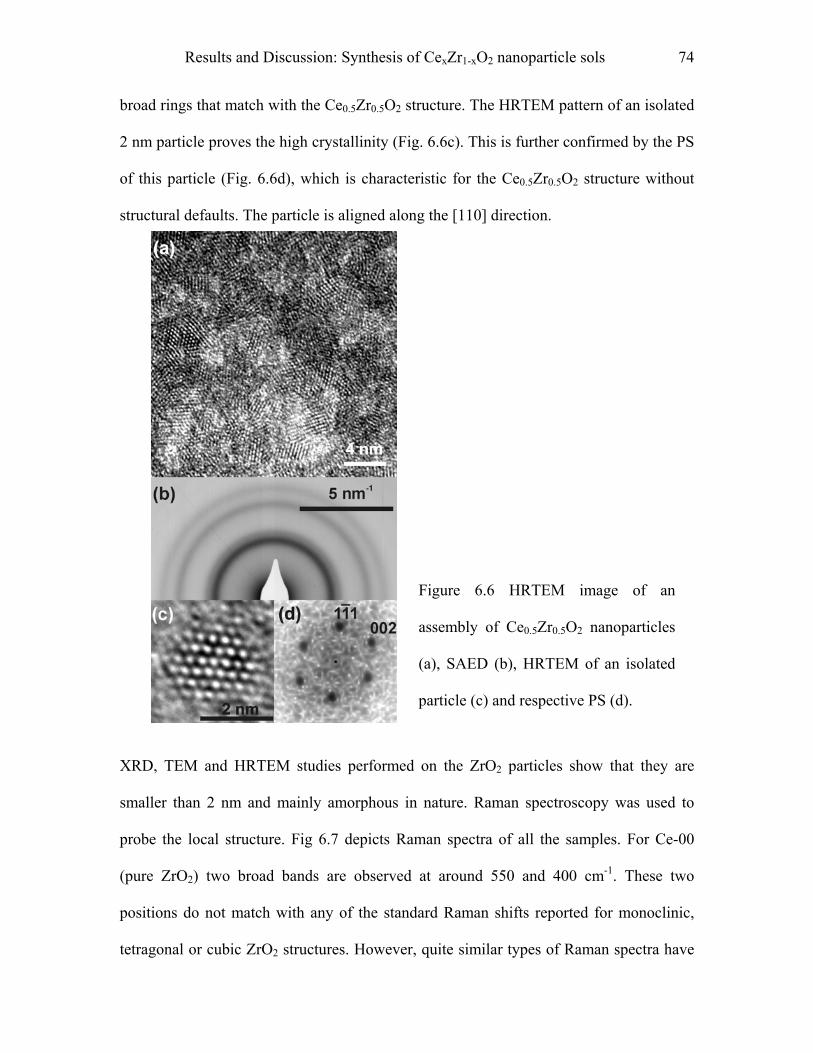
Results and Discussion: Synthesis of CexZr1-xO2 nanoparticle sols 74
broad rings that match with the Ce0.5Zr0.5O2 structure. The HRTEM pattern of an isolated
2 nm particle proves the high crystallinity (Fig. 6.6c). This is further confirmed by the PS
of this particle (Fig. 6.6d), which is characteristic for the Ce0.5Zr0.5O2 structure without
structural defaults. The particle is aligned along the [110] direction.
XRD, TEM and HRTEM studies performed
smaller than 2 nm and mainly amorphous in
probe the local structure. Fig 6.7 depicts Ra
(pure ZrO2) two broad bands are observed
positions do not match with any of the stand
tetragonal or cubic ZrO2 structures. However
Figure 6.6 HRTEM image of an
assembly of Ce0.5Zr0.5O2 nanoparticles
(a), SAED (b), HRTEM of an isolated
particle (c) and respective PS (d).
on the ZrO2 particles show that they are
nature. Raman spectroscopy was used to
man spectra of all the samples. For Ce-00
at around 550 and 400 cm-1. These two
ard Raman shifts reported for monoclinic,
, quite similar types of Raman spectra have
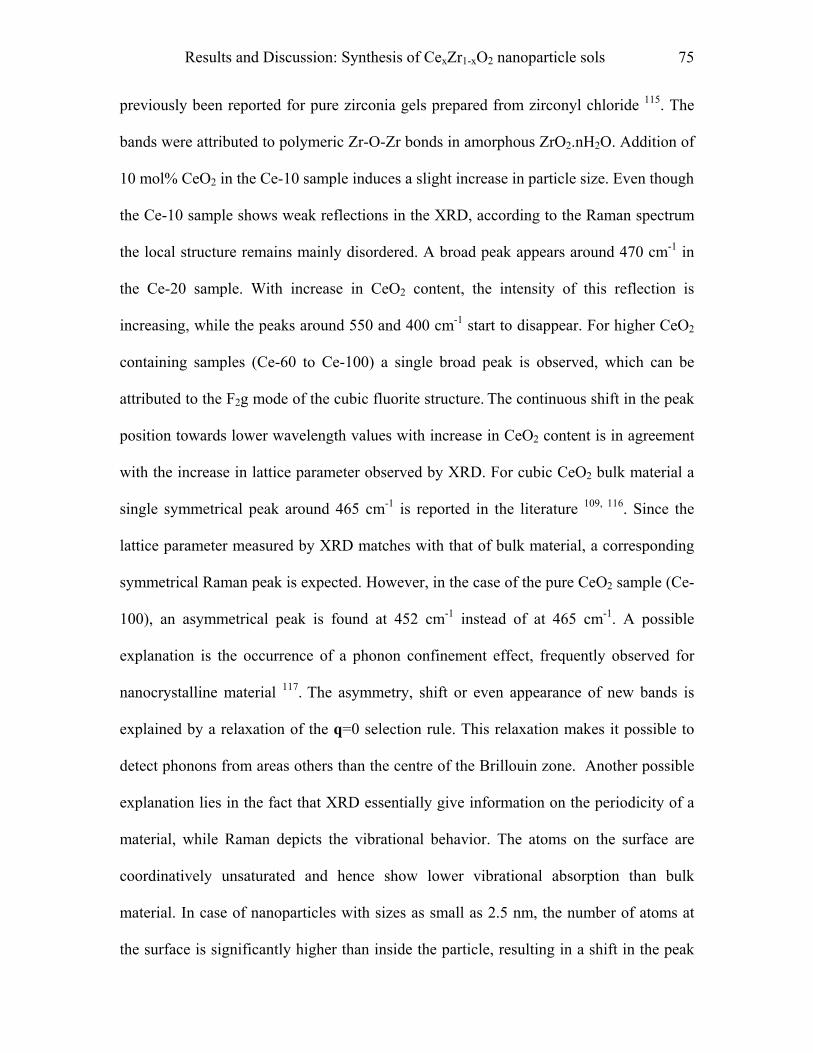
Results and Discussion: Synthesis of CexZr1-xO2 nanoparticle sols 75
previously been reported for pure zirconia gels prepared from zirconyl chloride 115. The
bands were attributed to polymeric Zr-O-Zr bonds in amorphous ZrO2.nH2O. Addition of
10 mol% CeO2 in the Ce-10 sample induces a slight increase in particle size. Even though
the Ce-10 sample shows weak reflections in the XRD, according to the Raman spectrum
the local structure remains mainly disordered. A broad peak appears around 470 cm-1 in
the Ce-20 sample. With increase in CeO2 content, the intensity of this reflection is
increasing, while the peaks around 550 and 400 cm-1 start to disappear. For higher CeO2
containing samples (Ce-60 to Ce-100) a single broad peak is observed, which can be
attributed to the F2g mode of the cubic fluorite structure. The continuous shift in the peak
position towards lower wavelength values with increase in CeO2 content is in agreement
with the increase in lattice parameter observed by XRD. For cubic CeO2 bulk material a
single symmetrical peak around 465 cm-1 is reported in the literature 109, 116. Since the
lattice parameter measured by XRD matches with that of bulk material, a corresponding
symmetrical Raman peak is expected. However, in the case of the pure CeO2 sample (Ce-
100), an asymmetrical peak is found at 452 cm-1 instead of at 465 cm-1. A possible
explanation is the occurrence of a phonon confinement effect, frequently observed for
nanocrystalline material 117. The asymmetry, shift or even appearance of new bands is
explained by a relaxation of the q=0 selection rule. This relaxation makes it possible to
detect phonons from areas others than the centre of the Brillouin zone. Another possible
explanation lies in the fact that XRD essentially give information on the periodicity of a
material, while Raman depicts the vibrational behavior. The atoms on the surface are
coordinatively unsaturated and hence show lower vibrational absorption than bulk
material. In case of nanoparticles with sizes as small as 2.5 nm, the number of atoms at
the surface is significantly higher than inside the particle, resulting in a shift in the peak
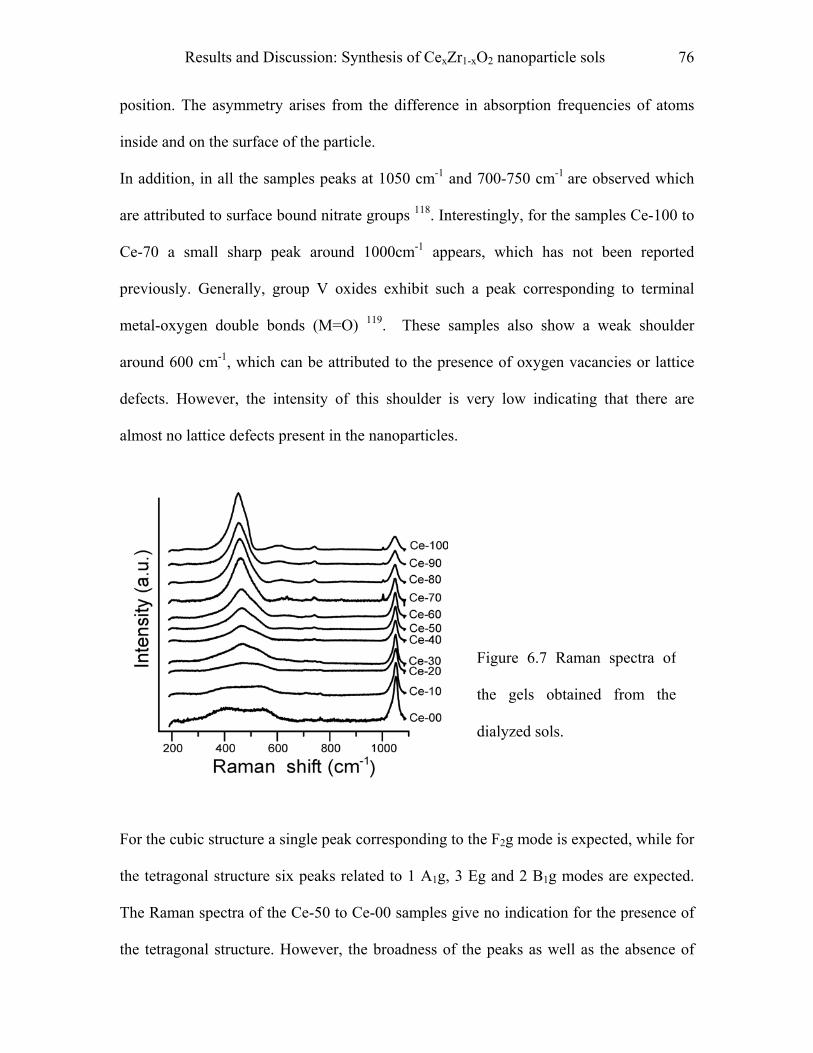
Results and Discussion: Synthesis of CexZr1-xO2 nanoparticle sols 76
position. The asymmetry arises from the difference in absorption frequencies of atoms
inside and on the surface of the particle.
In addition, in all the samples peaks at 1050 cm-1 and 700-750 cm-1 are observed which
are attributed to surface bound nitrate groups 118. Interestingly, for the samples Ce-100 to
Ce-70 a small sharp peak around 1000cm-1 appears, which has not been reported
previously. Generally, group V oxides exhibit such a peak corresponding to terminal
metal-oxygen double bonds (M=O) 119. These samples also show a weak shoulder
around 600 cm-1, which can be attributed to the presence of oxygen vacancies or lattice
defects. However, the intensity of this shoulder is very low indicating that there are
almost no lattice defects present in the nanoparticles.
Figure 6.7 Raman spectra of
the gels obtained from the
dialyzed sols.
For the cubic structure a single peak corresponding to the F2g mode is expected, while for
the tetragonal structure six peaks related to 1 A1g, 3 Eg and 2 B1g modes are expected.
The Raman spectra of the Ce-50 to Ce-00 samples give no indication for the presence of
the tetragonal structure. However, the broadness of the peaks as well as the absence of
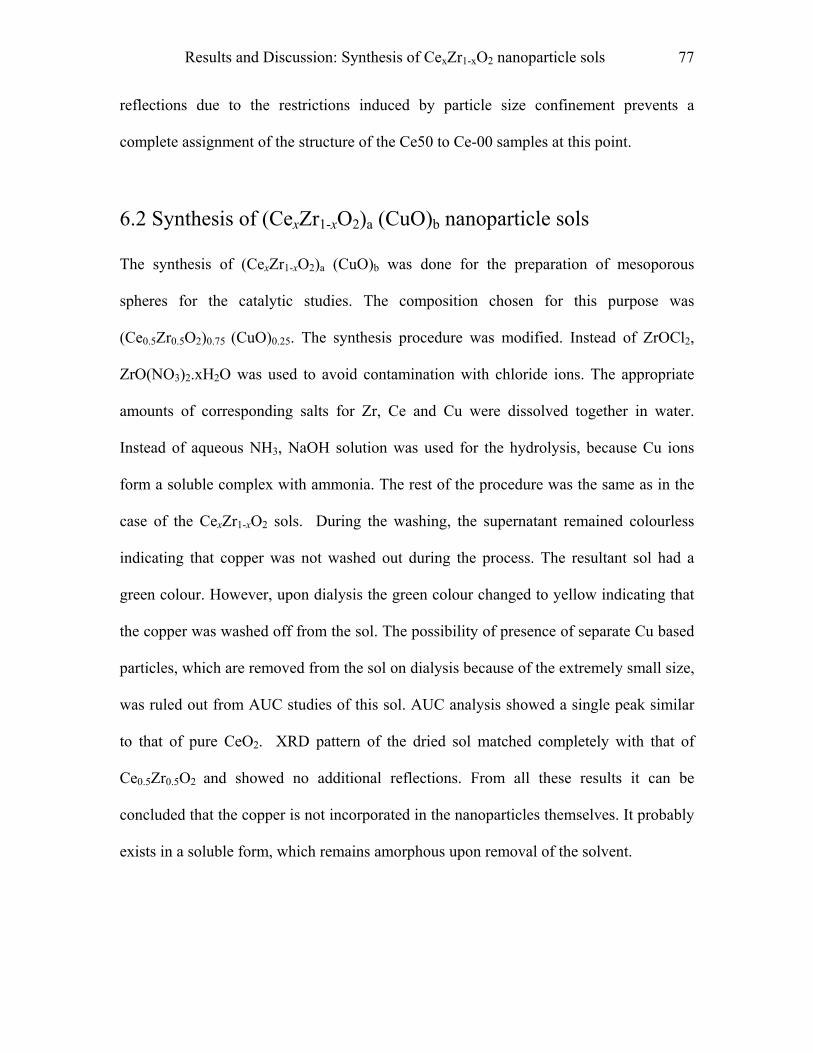
Results and Discussion: Synthesis of CexZr1-xO2 nanoparticle sols 77
reflections due to the restrictions induced by particle size confinement prevents a
complete assignment of the structure of the Ce50 to Ce-00 samples at this point.
6.2 Synthesis of (CexZr1-xO2)a (CuO)b nanoparticle sols
The synthesis of (CexZr1-xO2)a (CuO)b was done for the preparation of mesoporous
spheres for the catalytic studies. The composition chosen for this purpose was
(Ce0.5Zr0.5O2)0.75 (CuO)0.25. The synthesis procedure was modified. Instead of ZrOCl2,
ZrO(NO3)2.xH2O was used to avoid contamination with chloride ions. The appropriate
amounts of corresponding salts for Zr, Ce and Cu were dissolved together in water.
Instead of aqueous NH3, NaOH solution was used for the hydrolysis, because Cu ions
form a soluble complex with ammonia. The rest of the procedure was the same as in the
case of the CexZr1-xO2 sols. During the washing, the supernatant remained colourless
indicating that copper was not washed out during the process. The resultant sol had a
green colour. However, upon dialysis the green colour changed to yellow indicating that
the copper was washed off from the sol. The possibility of presence of separate Cu based
particles, which are removed from the sol on dialysis because of the extremely small size,
was ruled out from AUC studies of this sol. AUC analysis showed a single peak similar
to that of pure CeO2. XRD pattern of the dried sol matched completely with that of
Ce0.5Zr0.5O2 and showed no additional reflections. From all these results it can be
concluded that the copper is not incorporated in the nanoparticles themselves. It probably
exists in a soluble form, which remains amorphous upon removal of the solvent.
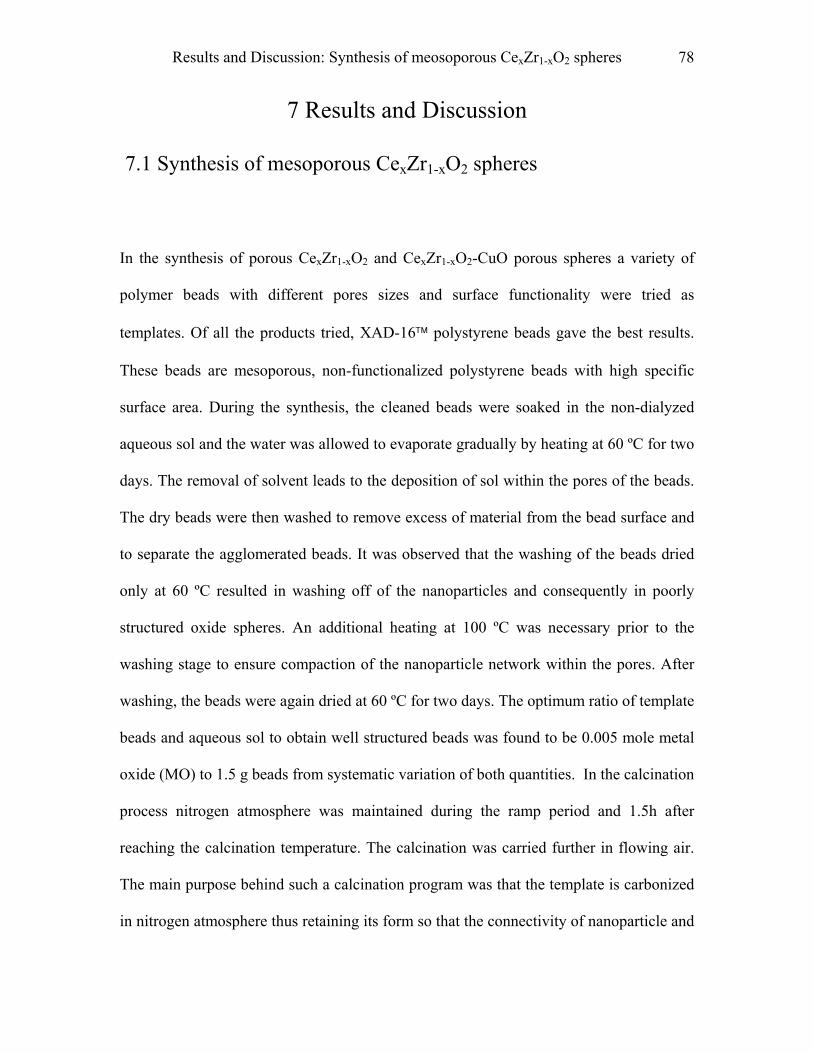
Results and Discussion: Synthesis of meosoporous CexZr1-xO2 spheres 78
7 Results and Discussion
7.1 Synthesis of mesoporous CexZr1-xO2 spheres
In the synthesis of porous CexZr1-xO2 and CexZr1-xO2-CuO porous spheres a variety of
polymer beads with different pores sizes and surface functionality were tried as
templates. Of all the products tried, XAD-16 polystyrene beads gave the best results.
These beads are mesoporous, non-functionalized polystyrene beads with high specific
surface area. During the synthesis, the cleaned beads were soaked in the non-dialyzed
aqueous sol and the water was allowed to evaporate gradually by heating at 60 ºC for two
days. The removal of solvent leads to the deposition of sol within the pores of the beads.
The dry beads were then washed to remove excess of material from the bead surface and
to separate the agglomerated beads. It was observed that the washing of the beads dried
only at 60 ºC resulted in washing off of the nanoparticles and consequently in poorly
structured oxide spheres. An additional heating at 100 ºC was necessary prior to the
washing stage to ensure compaction of the nanoparticle network within the pores. After
washing, the beads were again dried at 60 ºC for two days. The optimum ratio of template
beads and aqueous sol to obtain well structured beads was found to be 0.005 mole metal
oxide (MO) to 1.5 g beads from systematic variation of both quantities. In the calcination
process nitrogen atmosphere was maintained during the ramp period and 1.5h after
reaching the calcination temperature. The calcination was carried further in flowing air.
The main purpose behind such a calcination program was that the template is carbonized
in nitrogen atmosphere thus retaining its form so that the connectivity of nanoparticle and
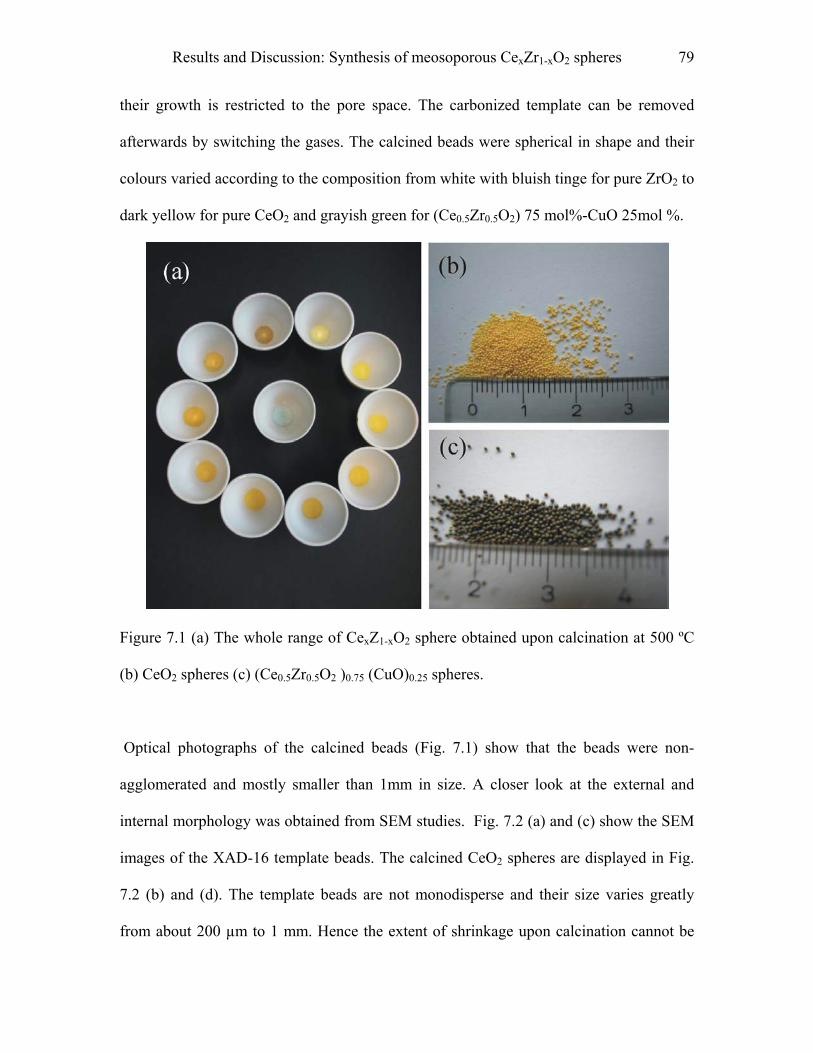
Results and Discussion: Synthesis of meosoporous CexZr1-xO2 spheres 79
their growth is restricted to the pore space. The carbonized template can be removed
afterwards by switching the gases. The calcined beads were spherical in shape and their
colours varied according to the composition from white with bluish tinge for pure ZrO2 to
dark yellow for pure CeO2 and grayish green for (Ce0.5Zr0.5O2) 75 mol%-CuO 25mol %.
Figure 7.1 (a) The whole range of CexZ1-xO2 sphere obtained upon calcination at 500 ºC
(b) CeO2 spheres (c) (Ce0.5Zr0.5O2 )0.75 (CuO)0.25 spheres.
Optical photographs of the calcined beads (Fig. 7.1) show that the beads were non-
agglomerated and mostly smaller than 1mm in size. A closer look at the external and
internal morphology was obtained from SEM studies. Fig. 7.2 (a) and (c) show the SEM
images of the XAD-16 template beads. The calcined CeO2 spheres are displayed in Fig.
7.2 (b) and (d). The template beads are not monodisperse and their size varies greatly
from about 200 µm to 1 mm. Hence the extent of shrinkage upon calcination cannot be

Results and Discussion: Synthesis of meosoporous CexZr1-xO2 spheres 80
estimated. However, similar size ranges were seen for the calcined spheres. It can be seen
that the calcined spheres were spherical in shape with a smooth external surface
indicating absence of extra matter.
Figure 7.2 SEM images of (a) template beads XAD-16 external morphology, (c) internal
morphology; and (b) calcined spheres of CeO2 external morphology, (d) internal
morphology.
Larger spheres showed occasional cracks, which might arise from the heat treatment.
Apart from the cracks, the spheres had fare mechanical stability and it was necessary to
break them by applying force to see the internal structure. The broken CeO2 spheres show
that the internal part of the spheres has a uniform morphology and no uneven shrinkage
or deformation is observed. As the average pore sizes in the template (10-20 nm) and
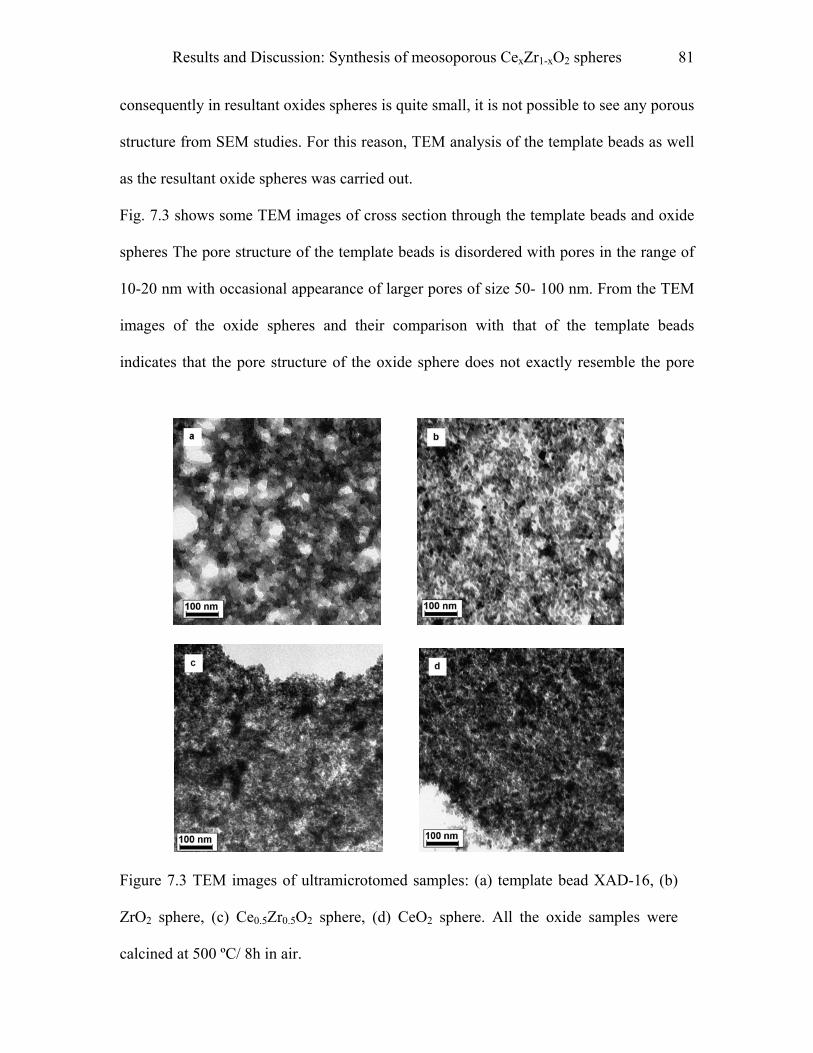
Results and Discussion: Synthesis of meosoporous CexZr1-xO2 spheres 81
consequently in resultant oxides spheres is quite small, it is not possible to see any porous
structure from SEM studies. For this reason, TEM analysis of the template beads as well
as the resultant oxide spheres was carried out.
Fig. 7.3 shows some TEM images of cross section through the template beads and oxide
spheres The pore structure of the template beads is disordered with pores in the range of
10-20 nm with occasional appearance of larger pores of size 50- 100 nm. From the TEM
images of the oxide spheres and their comparison with that of the template beads
indicates that the pore structure of the oxide sphere does not exactly resemble the pore
Figure 7.3 TEM images of ultramicrotomed samples: (a) template bead XAD-16, (b)
ZrO2 sphere, (c) Ce0.5Zr0.5O2 sphere, (d) CeO2 sphere. All the oxide samples were
calcined at 500 ºC/ 8h in air.
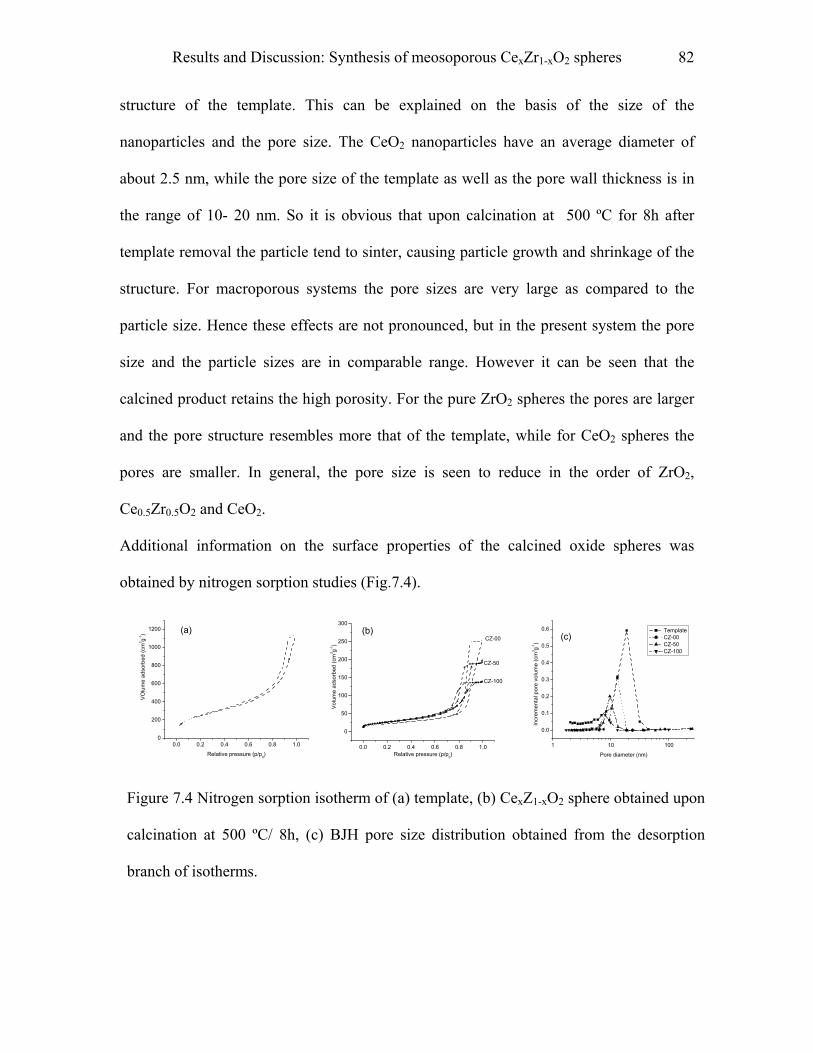
Results and Discussion: Synthesis of meosoporous CexZr1-xO2 spheres 82
structure of the template. This can be explained on the basis of the size of the
nanoparticles and the pore size. The CeO2 nanoparticles have an average diameter of
about 2.5 nm, while the pore size of the template as well as the pore wall thickness is in
the range of 10- 20 nm. So it is obvious that upon calcination at 500 ºC for 8h after
template removal the particle tend to sinter, causing particle growth and shrinkage of the
structure. For macroporous systems the pore sizes are very large as compared to the
particle size. Hence these effects are not pronounced, but in the present system the pore
size and the particle sizes are in comparable range. However it can be seen that the
calcined product retains the high porosity. For the pure ZrO2 spheres the pores are larger
and the pore structure resembles more that of the template, while for CeO2 spheres the
pores are smaller. In general, the pore size is seen to reduce in the order of ZrO2,
Ce0.5Zr0.5O2 and CeO2.
Additional information on the surface properties of the calcined oxide spheres was
obtained by nitrogen sorption studies (Fig.7.4).
0.0 0.2 0.4 0.6 0.8 1.00
200
400
600
800
1000
1200 (a)
VO
lum
e ad
sorb
ed (c
m3 g-1
)
Relative pressure (p/p0)0.0 0.2 0.4 0.6 0.8 1.0
0
50
100
150
200
250
300(b)
CZ-00
CZ-50
CZ-100
Volu
me
adso
rbed
(cm
3 g-1)
Relative pressure (p/p0)
1 10 100
0.0
0.1
0.2
0.3
0.4
0.5
0.6(c)
Incr
emen
tal p
ore
volu
me
(cm
3 g-1)
Pore diameter (nm)
Template CZ-00 CZ-50 CZ-100
Figure 7.4 Nitrogen sorption isotherm of (a) template, (b) CexZ1-xO2 sphere obtained upon
calcination at 500 ºC/ 8h, (c) BJH pore size distribution obtained from the desorption
branch of isotherms.
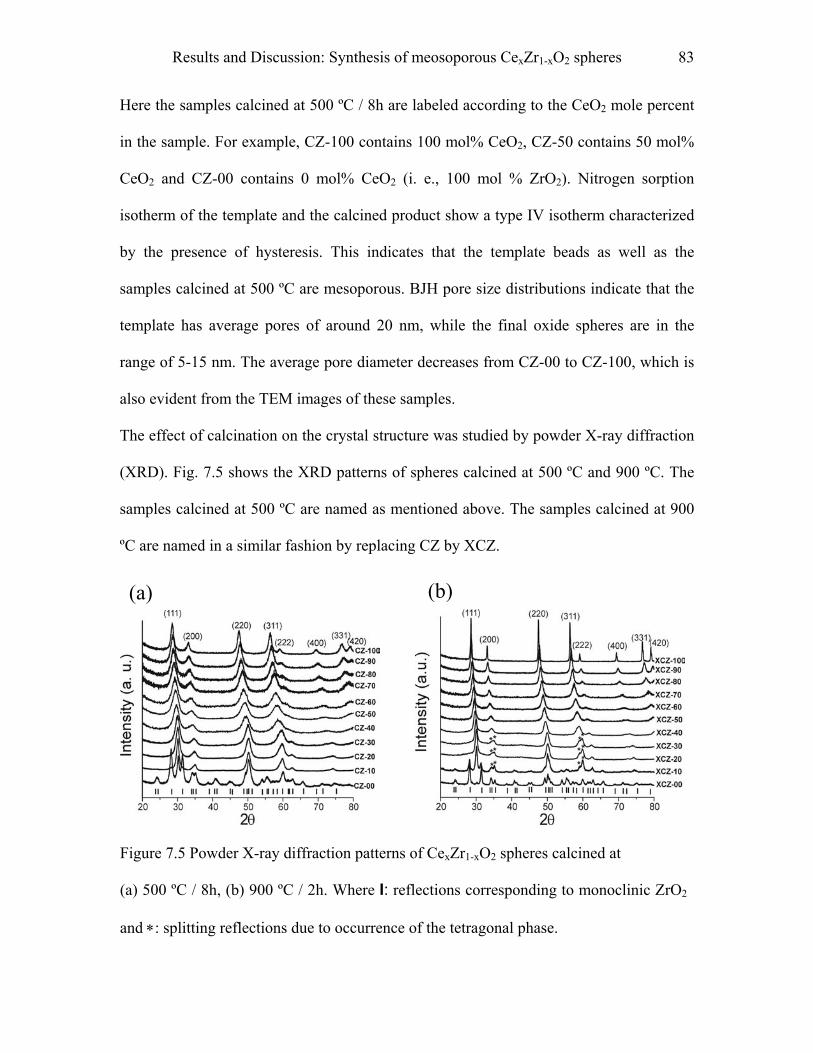
Results and Discussion: Synthesis of meosoporous CexZr1-xO2 spheres 83
Here the samples calcined at 500 ºC / 8h are labeled according to the CeO2 mole percent
in the sample. For example, CZ-100 contains 100 mol% CeO2, CZ-50 contains 50 mol%
CeO2 and CZ-00 contains 0 mol% CeO2 (i. e., 100 mol % ZrO2). Nitrogen sorption
isotherm of the template and the calcined product show a type IV isotherm characterized
by the presence of hysteresis. This indicates that the template beads as well as the
samples calcined at 500 ºC are mesoporous. BJH pore size distributions indicate that the
template has average pores of around 20 nm, while the final oxide spheres are in the
range of 5-15 nm. The average pore diameter decreases from CZ-00 to CZ-100, which is
also evident from the TEM images of these samples.
The effect of calcination on the crystal structure was studied by powder X-ray diffraction
(XRD). Fig. 7.5 shows the XRD patterns of spheres calcined at 500 ºC and 900 ºC. The
samples calcined at 500 ºC are named as mentioned above. The samples calcined at 900
ºC are named in a similar fashion by replacing CZ by XCZ.
)
(a)Figure 7.5 Powder X-ray diffraction patterns of
(a) 500 ºC / 8h, (b) 900 ºC / 2h. Where I: refle
and ∗: splitting reflections due to occurrence of
(b
CexZr1-xO2 spheres calcined at
ctions corresponding to monoclinic ZrO2
the tetragonal phase.
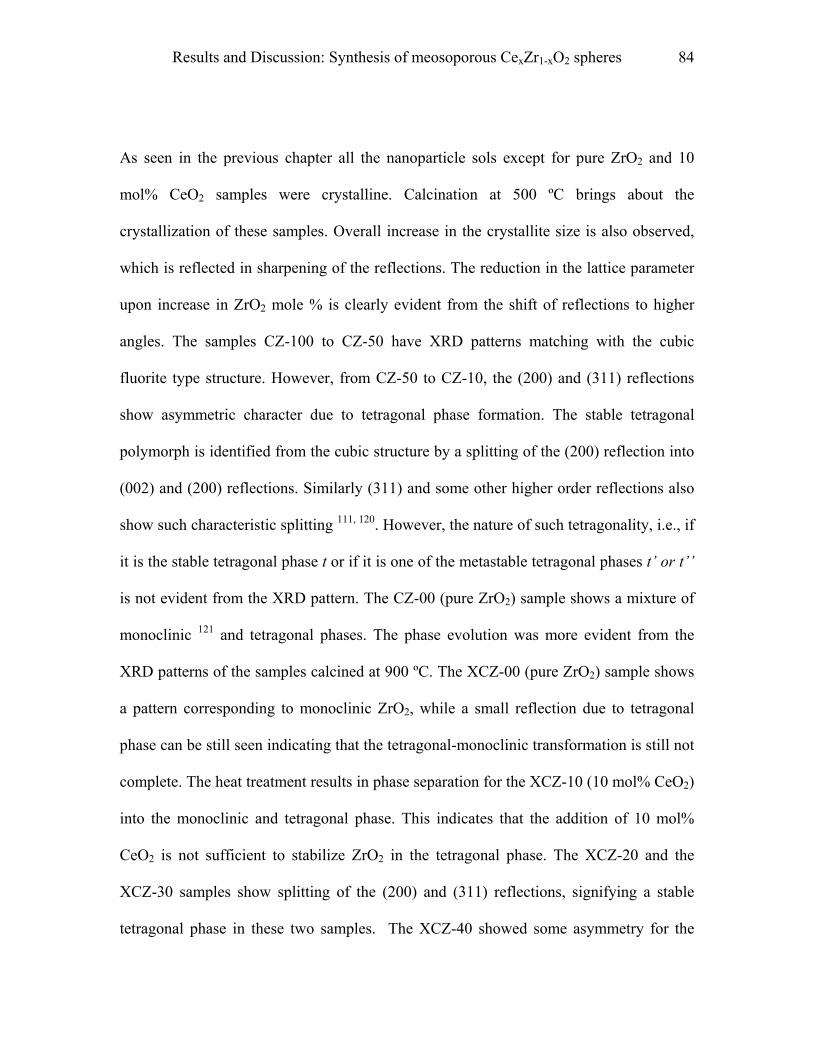
Results and Discussion: Synthesis of meosoporous CexZr1-xO2 spheres 84
As seen in the previous chapter all the nanoparticle sols except for pure ZrO2 and 10
mol% CeO2 samples were crystalline. Calcination at 500 ºC brings about the
crystallization of these samples. Overall increase in the crystallite size is also observed,
which is reflected in sharpening of the reflections. The reduction in the lattice parameter
upon increase in ZrO2 mole % is clearly evident from the shift of reflections to higher
angles. The samples CZ-100 to CZ-50 have XRD patterns matching with the cubic
fluorite type structure. However, from CZ-50 to CZ-10, the (200) and (311) reflections
show asymmetric character due to tetragonal phase formation. The stable tetragonal
polymorph is identified from the cubic structure by a splitting of the (200) reflection into
(002) and (200) reflections. Similarly (311) and some other higher order reflections also
show such characteristic splitting 111, 120. However, the nature of such tetragonality, i.e., if
it is the stable tetragonal phase t or if it is one of the metastable tetragonal phases t’ or t’’
is not evident from the XRD pattern. The CZ-00 (pure ZrO2) sample shows a mixture of
monoclinic 121 and tetragonal phases. The phase evolution was more evident from the
XRD patterns of the samples calcined at 900 ºC. The XCZ-00 (pure ZrO2) sample shows
a pattern corresponding to monoclinic ZrO2, while a small reflection due to tetragonal
phase can be still seen indicating that the tetragonal-monoclinic transformation is still not
complete. The heat treatment results in phase separation for the XCZ-10 (10 mol% CeO2)
into the monoclinic and tetragonal phase. This indicates that the addition of 10 mol%
CeO2 is not sufficient to stabilize ZrO2 in the tetragonal phase. The XCZ-20 and the
XCZ-30 samples show splitting of the (200) and (311) reflections, signifying a stable
tetragonal phase in these two samples. The XCZ-40 showed some asymmetry for the
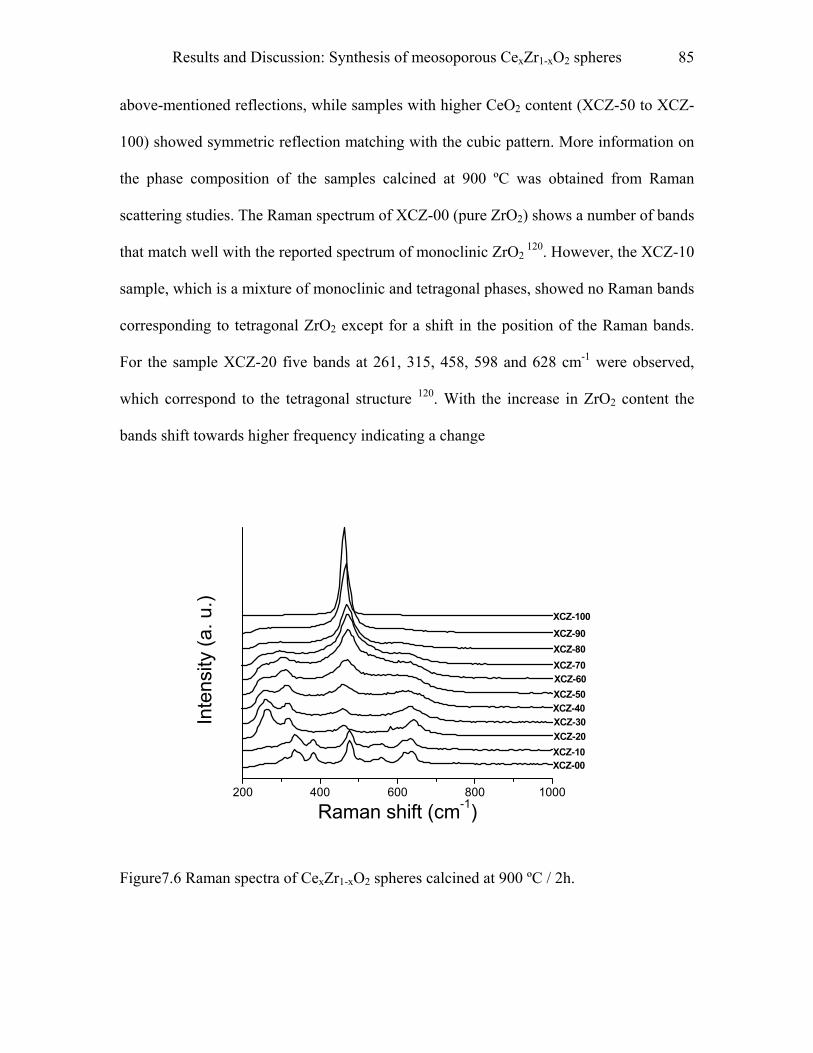
Results and Discussion: Synthesis of meosoporous CexZr1-xO2 spheres 85
above-mentioned reflections, while samples with higher CeO2 content (XCZ-50 to XCZ-
100) showed symmetric reflection matching with the cubic pattern. More information on
the phase composition of the samples calcined at 900 ºC was obtained from Raman
scattering studies. The Raman spectrum of XCZ-00 (pure ZrO2) shows a number of bands
that match well with the reported spectrum of monoclinic ZrO2 120. However, the XCZ-10
sample, which is a mixture of monoclinic and tetragonal phases, showed no Raman bands
corresponding to tetragonal ZrO2 except for a shift in the position of the Raman bands.
For the sample XCZ-20 five bands at 261, 315, 458, 598 and 628 cm-1 were observed,
which correspond to the tetragonal structure 120. With the increase in ZrO2 content the
bands shift towards higher frequency indicating a change
200 400 600 800 1000
XCZ-100XCZ-90XCZ-80XCZ-70XCZ-60XCZ-50XCZ-40XCZ-30XCZ-20XCZ-10XCZ-00
Inte
nsity
(a. u
.)
Raman shift (cm-1)
Figure7.6 Raman spectra of CexZr1-xO2 spheres calcined at 900 ºC / 2h.
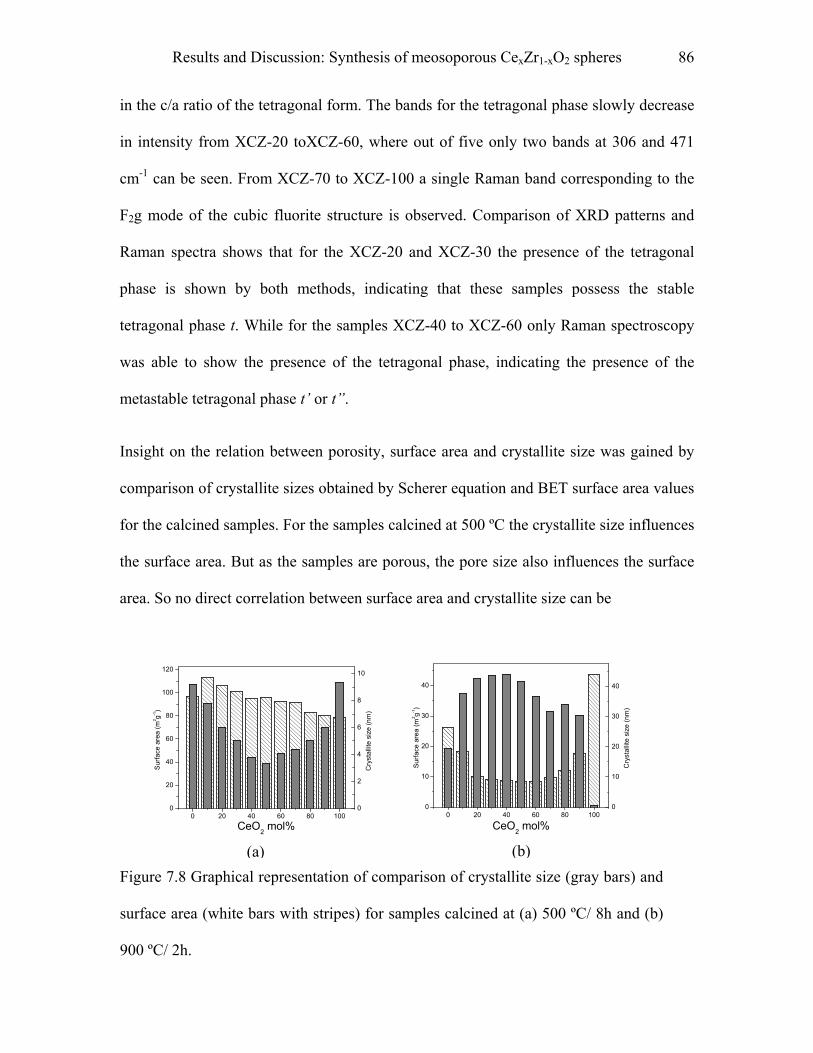
Results and Discussion: Synthesis of meosoporous CexZr1-xO2 spheres 86
in the c/a ratio of the tetragonal form. The bands for the tetragonal phase slowly decrease
in intensity from XCZ-20 toXCZ-60, where out of five only two bands at 306 and 471
cm-1 can be seen. From XCZ-70 to XCZ-100 a single Raman band corresponding to the
F2g mode of the cubic fluorite structure is observed. Comparison of XRD patterns and
Raman spectra shows that for the XCZ-20 and XCZ-30 the presence of the tetragonal
phase is shown by both methods, indicating that these samples possess the stable
tetragonal phase t. While for the samples XCZ-40 to XCZ-60 only Raman spectroscopy
was able to show the presence of the tetragonal phase, indicating the presence of the
metastable tetragonal phase t’ or t”.
Insight on the relation between porosity, surface area and crystallite size was gained by
comparison of crystallite sizes obtained by Scherer equation and BET surface area values
for the calcined samples. For the samples calcined at 500 ºC the crystallite size influences
the surface area. But as the samples are porous, the pore size also influences the surface
area. So no direct correlation between surface area and crystallite size can be
0
2
4
6
8
10
0 20 40 60 80 1000
20
40
60
80
100
120
Surfa
ce a
rea
(m2 g-1
)
C 2 mol%
Cry
stal
lite
size
(nm
)
0
10
20
30
40
0 20 40 60 80 1000
10
20
30
40
Surfa
ce a
rea
(m2 g-1
)
Ce ol%
Cry
stal
lite
size
(nm
)
Figure 7.8 Graphic
surface area (white
900 ºC/ 2h.
eO
(a)
al representation of comparison of crystabars with stripes) for samples calcined
O2 m
(b)
llite size (gray bars) andat (a) 500 ºC/ 8h and (b)
Results and Discussion: Synthesis of meosoporous CexZr1-xO2 spheres 87
made. For the sample calcined at 500 ºC the surface area increases continuously from
CZ-00 (78 m2g-1) to CZ-90 (113 m2g-1) and then drops to 97 m2g-1 for CZ-100. For the
pure oxide products (CZ-00 and CZ-100) the crystallite size is largest. As the
composition reaches from both the ends to intermediate values, the crystallite size
decreases steadily. The minimum crystallite size in the whole series is obtained for CZ-
50, which contains 50 mol% each of both the oxides. This phenomenon is indeed
interesting and is clear evidence that the solid solution compositions are more stable
against sintering compared to individual oxide in case of CeO2-ZrO2 binary system.
A similar change in crystallite sizes with composition was obtained for samples calcined
at 900 ºC. Even though the external form was maintained in these samples, as the
crystallite growth is very large the porous structure is disrupted. Hence the surface area
values are dictated by the crystallite size. In general, for non-porous materials, the surface
area is inversely proportional to the crystallite size. The same observation was made for
the samples calcined at 900 ºC.
7.2 (Ce0.5Zr0.5O2 )0.75 (CuO)0.25 spheres
For the synthesis of (Ce0.5Zr0.5O2 )0.75 (CuO)0.25 the process of nanoparticle synthesis was
modified as mentioned in the previous section. The rest of the synthesis process was
similar to the synthesis of CexZr1-xO2 spheres. These spheres had a grayish green colour.
The surface area value of the spheres obtained upon calcination at 500 ºC was 91 m2g-1.
The XRD pattern of the calcined material showed (Fig. 7.9) very broad reflections
corresponding to Ce0.5Zr0.5O2. In addition there were very weak reflections corresponding
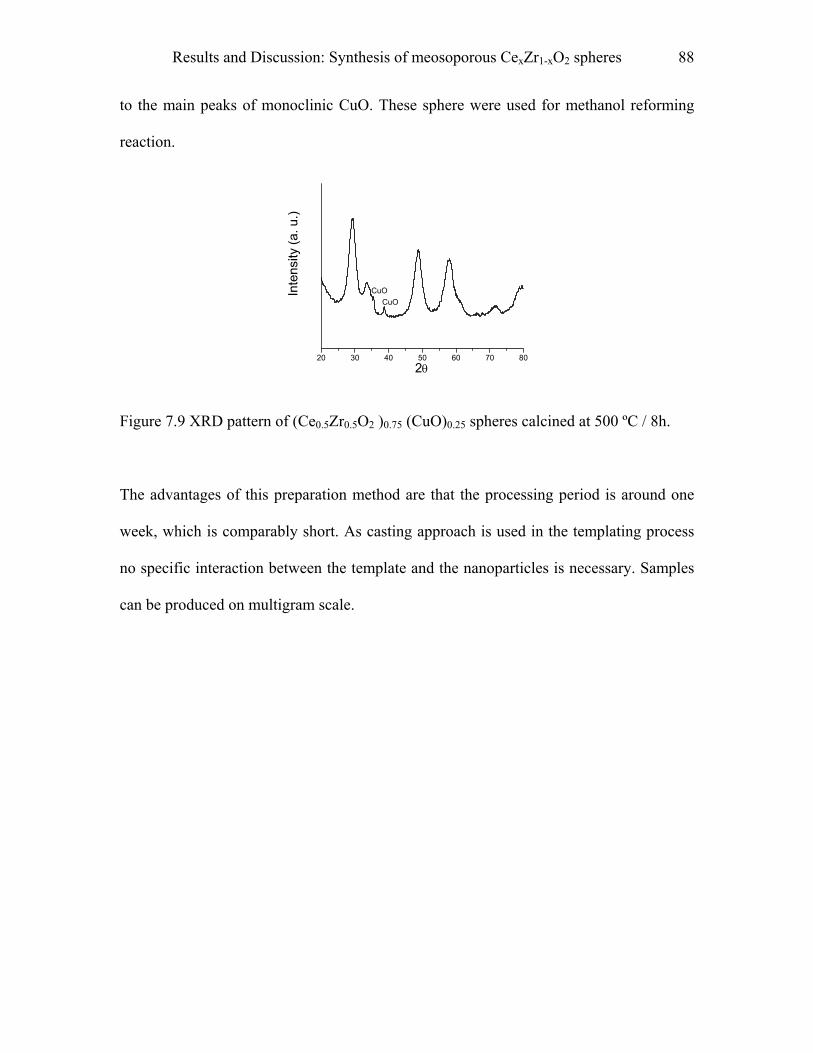
Results and Discussion: Synthesis of meosoporous CexZr1-xO2 spheres 88
to the main peaks of monoclinic CuO. These sphere were used for methanol reforming
reaction.
20 30 40 50 60 70 80
CuOCuO
Inte
nsity
(a. u
.)
2θ
Figure 7.9 XRD pattern of (Ce0.5Zr0.5O2 )0.75 (CuO)0.25 spheres calcined at 500 ºC / 8h.
The advantages of this preparation method are that the processing period is around one
week, which is comparably short. As casting approach is used in the templating process
no specific interaction between the template and the nanoparticles is necessary. Samples
can be produced on multigram scale.

Results and Discussion: Synthesis of meosoporous CexZr1-xO2 spheres 89
7.3 Methanol steam reforming
0 5 10 15 200
10
20
30
40
50
60
70C
onve
rsio
n (%
)
Reaction time (days)
ZCC-CA MeOH1
1000
800
600
400
200
CO
con
cent
ratio
n (p
pm)
ZCC-CA P(CO) MeOH1 P(CO)
Figure 7.10 Graphical representation of the conversion of methanol in steam reforming
reaction over a period of 19 days. and represent % conversion. While and
represent amount of carbon monoxide in ppm formed during the reaction.
Among the various applications of CeO2 based materials, there use as active supports in
reforming reactions is most popular for their use in fuel cell applications. As a model
system we used (Ce0.5Z0.5O2 )0.75 (CuO)0.25 spheres for catalytic steam reforming of
methanol. A commercial product MeOH1 was used as a standard for comparison. The
MeOH1 is a CuO-ZnO catalyst with 50 wt % CuO and surface area of 49 m2g-1. An
online gas chromatographer was used to analyze the products of reforming reaction. The
results of analysis are depicted in Fig. 7.10. Here the (Ce0.5Zr0.5O2 )0.75 (CuO)0.25 sample

Results and Discussion: Synthesis of meosoporous CexZr1-xO2 spheres 90
is labeled as ZCC-CA. The results show that the ZCC-CA catalyst was quite active. In
the initial stages the rate conversion was 46 %, which was slightly higher than that for the
MeOH1 catalyst. With the time, however, the conversion rate decreased and was in the
range between 30-40 %. The amount of carbon monoxide formed was initially less. But
with time it increased and remained around 200 ppm. The main aim of this study was to
get preliminary results regarding the usefulness of CuO-doped ceria-zirconia beads for
reforming reactions. These results are highly promising. Further investigations about the
reactions involved in the process and a more detailed characterization are ongoing and
hence are out of the scope of the present study.
Results and Discussion: Synthesis of meosoporous CexZr1-xO2 powders 91
8. Results and Discussion
8.1 Synthesis of mesoporous CexZr1-xO2 powders
Though the use of nanoparticles to synthesize macroporous materials was widely
demonstrated in the literature 33, 41, 42, 122, 123, reports on the synthesis of ordered
mesoporous material using liquid crystal templating process are scares 85, 86. This
synthetic approach is particularly challenging and needs careful consideration of various
parameters that can possibly affect the process. However, from the point of view of basic
research and also from an application point of view, the development and study of
mesoporous materials using nanoparticle building block is very interesting/promising.
In the present work, the synthesis of mesoporous CexZr1-xO2 with regular pore size was
achieved by using a block-copolymer and CexZr1-xO2 nanoparticle sols through
evaporation induced self-assembly process. We used poly(butadiene-b-ethylene oxide)
(PB-PEO) block-copolymers as structure directing agent. The synthesis of this type of
block-copolymer has been reported before 124. The lyotropic behavior of this class of
block-copolymers has been also studied 125, which shows that these block-copolymers
form very large spherical micelles and various micellar phases. This was the main reason
for choosing this type of block-copolymer. The CexZr1-xO2 nanoparticles are around 2-4
nm in size, hence to form ordered structure it is necessary that the template (micelles) are
large enough to direct and stabilize the assembly of nanoparticles.
During the synthesis 0.3 g of the block-co-polymer was dissolved in ethanol, followed by
the slow addition of the ethanol-water sol under stirring, containing 0.005 moles of
CexZr1-xO2. The resultant transparent solution was transferred into an open petri dish and
the solvent was allowed to evaporate to get a transparent gel. The use of purely aqueous
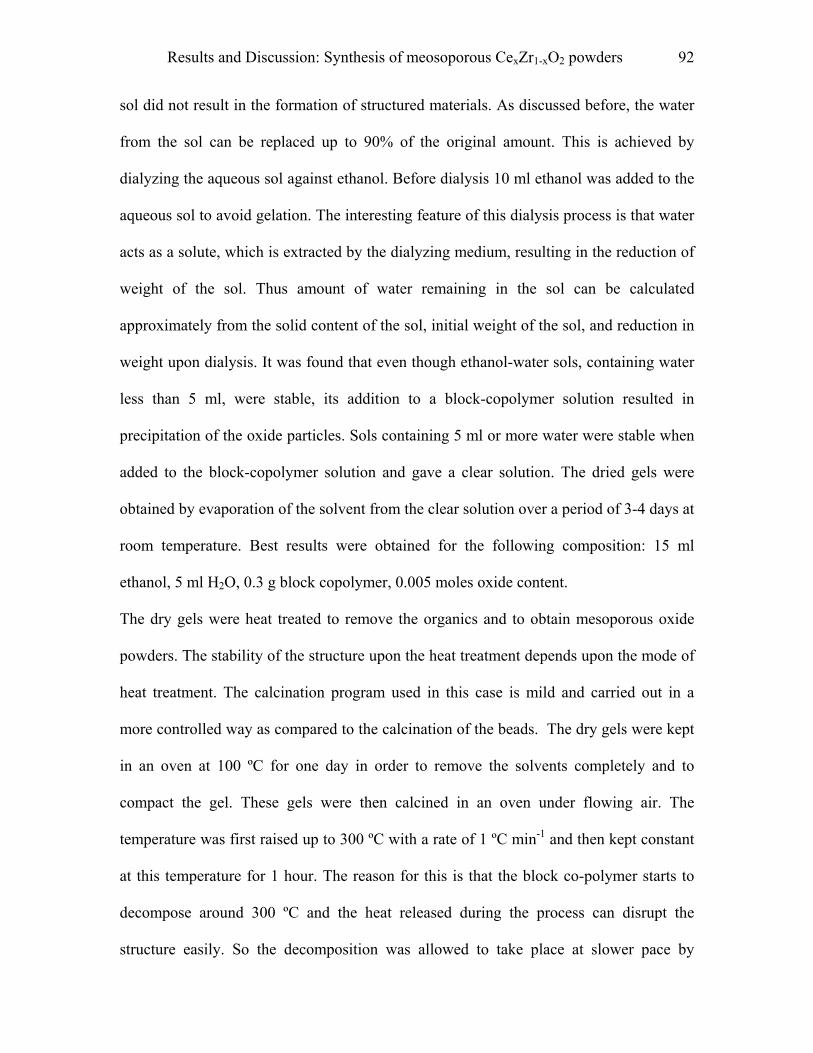
Results and Discussion: Synthesis of meosoporous CexZr1-xO2 powders 92
sol did not result in the formation of structured materials. As discussed before, the water
from the sol can be replaced up to 90% of the original amount. This is achieved by
dialyzing the aqueous sol against ethanol. Before dialysis 10 ml ethanol was added to the
aqueous sol to avoid gelation. The interesting feature of this dialysis process is that water
acts as a solute, which is extracted by the dialyzing medium, resulting in the reduction of
weight of the sol. Thus amount of water remaining in the sol can be calculated
approximately from the solid content of the sol, initial weight of the sol, and reduction in
weight upon dialysis. It was found that even though ethanol-water sols, containing water
less than 5 ml, were stable, its addition to a block-copolymer solution resulted in
precipitation of the oxide particles. Sols containing 5 ml or more water were stable when
added to the block-copolymer solution and gave a clear solution. The dried gels were
obtained by evaporation of the solvent from the clear solution over a period of 3-4 days at
room temperature. Best results were obtained for the following composition: 15 ml
ethanol, 5 ml H2O, 0.3 g block copolymer, 0.005 moles oxide content.
The dry gels were heat treated to remove the organics and to obtain mesoporous oxide
powders. The stability of the structure upon the heat treatment depends upon the mode of
heat treatment. The calcination program used in this case is mild and carried out in a
more controlled way as compared to the calcination of the beads. The dry gels were kept
in an oven at 100 ºC for one day in order to remove the solvents completely and to
compact the gel. These gels were then calcined in an oven under flowing air. The
temperature was first raised up to 300 ºC with a rate of 1 ºC min-1 and then kept constant
at this temperature for 1 hour. The reason for this is that the block co-polymer starts to
decompose around 300 ºC and the heat released during the process can disrupt the
structure easily. So the decomposition was allowed to take place at slower pace by
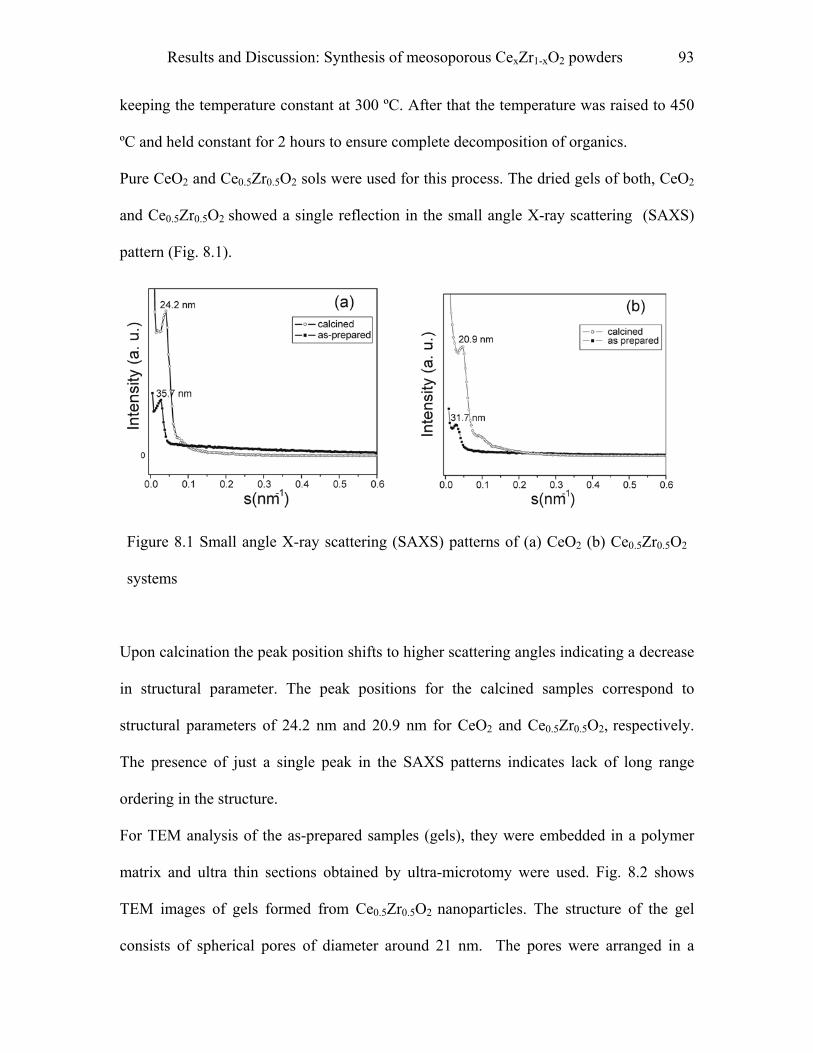
Results and Discussion: Synthesis of meosoporous CexZr1-xO2 powders 93
keeping the temperature constant at 300 ºC. After that the temperature was raised to 450
ºC and held constant for 2 hours to ensure complete decomposition of organics.
Pure CeO2 and Ce0.5Zr0.5O2 sols were used for this process. The dried gels of both, CeO2
and Ce0.5Zr0.5O2 showed a single reflection in the small angle X-ray scattering (SAXS)
pattern (Fig. 8.1).
Figure 8.1 Small angle X-ray scattering (SAXS) patterns of (a) CeO2 (b) Ce0.5Zr0.5O2
systems
Upon calcination the peak position shifts to higher scattering angles indicating a decrease
in structural parameter. The peak positions for the calcined samples correspond to
structural parameters of 24.2 nm and 20.9 nm for CeO2 and Ce0.5Zr0.5O2, respectively.
The presence of just a single peak in the SAXS patterns indicates lack of long range
ordering in the structure.
For TEM analysis of the as-prepared samples (gels), they were embedded in a polymer
matrix and ultra thin sections obtained by ultra-microtomy were used. Fig. 8.2 shows
TEM images of gels formed from Ce0.5Zr0.5O2 nanoparticles. The structure of the gel
consists of spherical pores of diameter around 21 nm. The pores were arranged in a
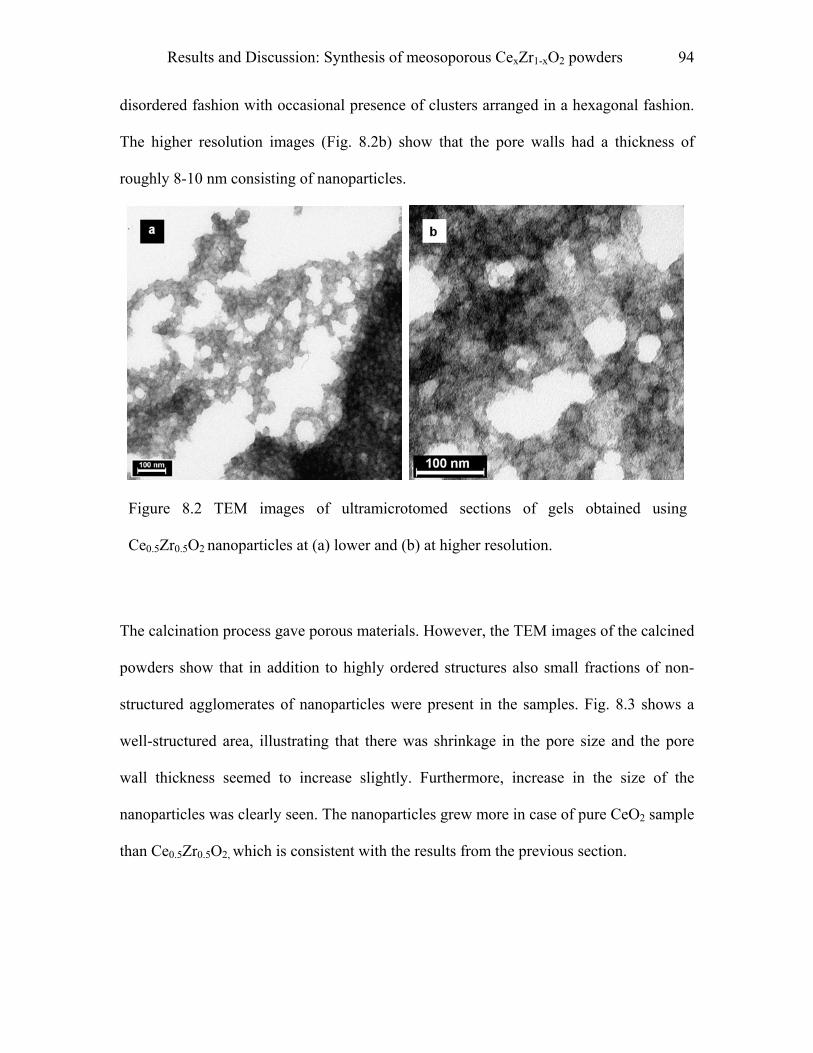
Results and Discussion: Synthesis of meosoporous CexZr1-xO2 powders 94
disordered fashion with occasional presence of clusters arranged in a hexagonal fashion.
The higher resolution images (Fig. 8.2b) show that the pore walls had a thickness of
roughly 8-10 nm consisting of nanoparticles.
Figure 8.2 TEM images of ultramicrotomed sections of gels obtained using
Ce0.5Zr0.5O2 nanoparticles at (a) lower and (b) at higher resolution.
The calcination process gave porous materials. However, the TEM images of the calcined
powders show that in addition to highly ordered structures also small fractions of non-
structured agglomerates of nanoparticles were present in the samples. Fig. 8.3 shows a
well-structured area, illustrating that there was shrinkage in the pore size and the pore
wall thickness seemed to increase slightly. Furthermore, increase in the size of the
nanoparticles was clearly seen. The nanoparticles grew more in case of pure CeO2 sample
than Ce0.5Zr0.5O2, which is consistent with the results from the previous section.

Results and Discussion: Synthesis of meosoporous CexZr1-xO2 powders 95
Figure 8.3 TEM images of powders obtained upon calcination at 450 ºC. (a) and (b)
mesoporous CeO2, (c) and (d) mesoporous Ce0.5Zr0.5O2.
Nitrogen sorption studies performed on these samples showed a Type VI isotherm typical
of mesoporous materials. Fig. 8.4a shows the nitrogen sorption isotherms of the calcined
powders of CeO2 and Ce0.5Zr0.5O2. Large hysteresis was obtained for both the samples.
As discussed in the methods section, the appearance of hysteresis is due to the difference
in the adsorption and desorption mechanism from the cylindrical pores. If the pore
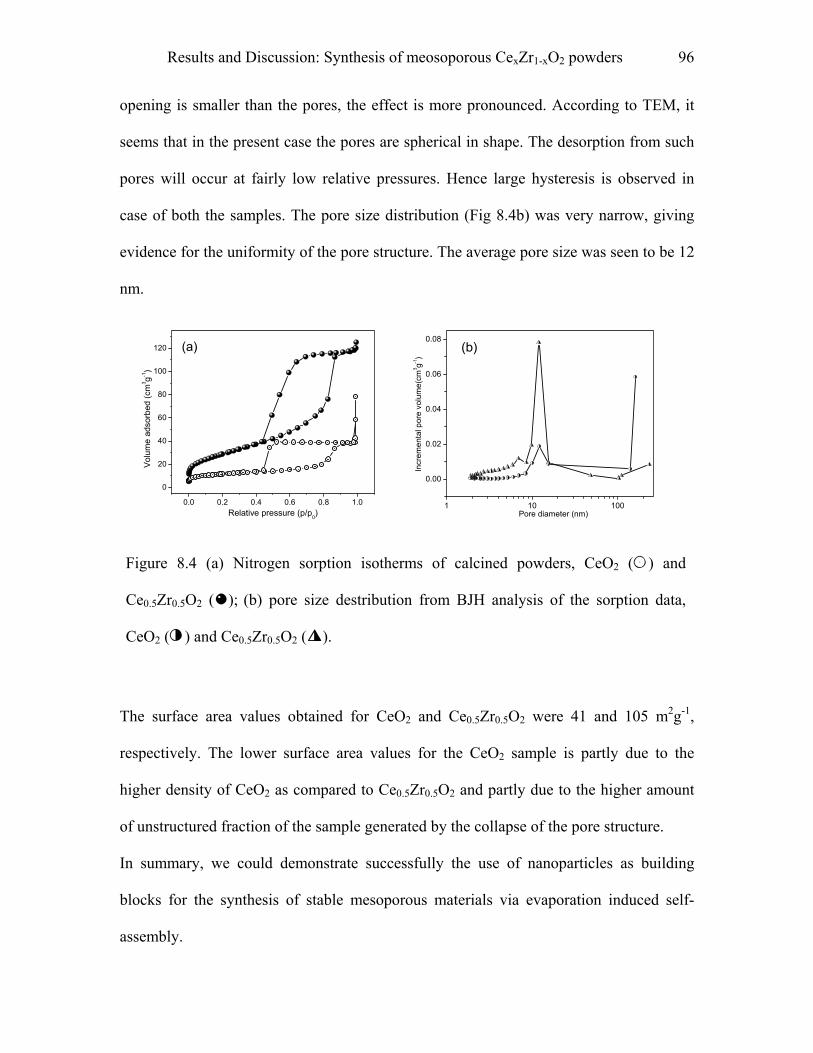
Results and Discussion: Synthesis of meosoporous CexZr1-xO2 powders 96
opening is smaller than the pores, the effect is more pronounced. According to TEM, it
seems that in the present case the pores are spherical in shape. The desorption from such
pores will occur at fairly low relative pressures. Hence large hysteresis is observed in
case of both the samples. The pore size distribution (Fig 8.4b) was very narrow, giving
evidence for the uniformity of the pore structure. The average pore size was seen to be 12
nm.
0.0 0.2 0.4 0.6 0.8 1.0
0
20
40
60
80
100
120 (a)
Volu
me
adso
rbed
(cm
3 g-1)
Relative pressure (p/p0)
1 10 100
0.00
0.02
0.04
0.06
0.08(b)
Incr
emen
tal p
ore
volu
me(
cm3 g-1
)
Pore diameter (nm)
Figure 8.4 (a) Nitrogen sorption isotherms of calcined powders, CeO2 ( ) and
Ce0.5Zr0.5O2 ( ); (b) pore size destribution from BJH analysis of the sorption data,
CeO2 ( ) and Ce0.5Zr0.5O2 ( ).
The surface area values obtained for CeO2 and Ce0.5Zr0.5O2 were 41 and 105 m2g-1,
respectively. The lower surface area values for the CeO2 sample is partly due to the
higher density of CeO2 as compared to Ce0.5Zr0.5O2 and partly due to the higher amount
of unstructured fraction of the sample generated by the collapse of the pore structure.
In summary, we could demonstrate successfully the use of nanoparticles as building
blocks for the synthesis of stable mesoporous materials via evaporation induced self-
assembly.

Experimental 97
9 Experimental
9.1 Synthesis of macroporous TiO2-M2O3 spheres
9.1.1 Materials
The synthesis of porous TiO2-In2O3, TiO2-Ga2O3 and TiO2-Al2O3 spheres required the
use of porous polystyrene/divinyl benzene beads (SOURCE™15 RPC beads, S15RPC,
Amersham Biosciences) as template and the metal alkoxide precursors titanium (IV)
isopropoxide (Aldrich, 99.999%), aluminum (III) isopropoxide (Aldrich, 99.99%),
gallium (III) isopropoxide (Alfa Aesar 99%), and indium (III) isopropoxide (Chemat
Technology Inc. AR grade). The alkoxide precursors were used as obtained from the
suppliers. The S15RPC beads are rigid, porous, and spherical with an average diameter of
15 µm and are conventionally used as reverse phase chromatography media. The beads
were purchased as dispersion in 20 % ethanol. To obtain dry beads for templating the
solvent was evaporated by heating the dispersion in an oven at 60 ºC for 48 h.
9.1.2 Procedure
Titanium dioxide and the mixed titania-metal oxide (metal = In, Al and Ga) spheres, with
compositions as follows: TiO2 (100%); TiO2 (95 wt.%)-M2O3 (5 wt.%); TiO2 (90 wt.%)-
M2O3 (10 wt.%); and TiO2 (85 wt.%)-M2O3 (15 wt.%) were synthesized by using mixed
precursors prepared by dissolving the appropriate amount of metal isopropoxide in the
liquid titanium (IV) isopropoxide. In a typical synthesis 1 g of the mixed precursor
solution and 1 g of the dry beads were mixed together in a plastic bottle and the bottle
was sealed to avoid contact with atmospheric moisture. The bottle was agitated overnight
to ensure infiltration of the mixed precursor throughout the porous matrices of the beads.
Subsequently, 100 ml of water was added to the impregnated beads to initiate hydrolysis
Experimental 98
and condensation of the alkoxide precursor and the mixture was stirred for 24 h. The
hybrid beads were filtered using a sintered glass funnel (ROBU®, Germany) No.3 and
washed with water to remove small particles formed outside of the beads. The washed
beads were dried in an oven at 60 ºC for 24 h, followed by calcination at 550 ºC (ramp of
1.5 h) for 10 h in flowing air, yielding porous TiO2-metal oxide spheres. To monitor
crystal phase transformations, further heating of the spheres was performed at 750 ºC
(ramp 2h) for 10 h under air and 950 ºC (ramp 2.5 h) for 10 h under air.
9.1.3 Pyridine adsorption study
Pyridine adsorption studies were performed on the porous inorganic spheres (calcined at
550 ºC) by Infrared studies to determine surface acidity, using a BIO-RAD FTS 6000
spectrometer. For this purpose the samples were first evacuated in glass tubes to a
pressure of 0.1 mbar at 150 ºC for 90 min and subsequently cooled to room temperature.
Liquid pyridine was added to soak the samples completely and then they were evacuated
again to 0.1 mbar at 150 ºC for 90 min. IR spectra of samples before and after the
addition of pyridine were recorded.
9.1.4 Photocatalytic degradation of 2-chlorophenol
The photocatalytic activity of the TiO2-based porous metal oxide spheres was measured
by monitoring the photo oxidation of 2-chlorophenol. The photochemical reactor was a
cylindrical flask (~ 90 ml) with a quartz window (diameter 3.6 cm) on the bottom
equipped with IR-vis. and UV filters for transmitting light within 340 and 500 nm, and a
magnetic stir bar. The illumination source was a high-pressure mercury lamp (Philips

Experimental 99
HPK 125 W, total radiant flux was 10 mW cm-2). For the irradiation experiments a
mixture of 40 ml of the 2-chlorophenol solution (10-3 M) and the photocatalyst (2 g L-1)
was employed. The irradiation time was set to 1.5 h in all experiments. pH adjustments
were made by using a pH-stat. Commercial titanium dioxide, Degussa P25, was used as a
reference for comparison of the photocatalytic activity. The concentration of 2-
chlorophenol was determined by HPLC using an LDC/Milton Roy system, which
consisted of a Constametric 3000 isocratic pump and a Spectro Monitor D UV-detector
adjusted to 254 nm. A reverse-phase column (25 cm long and 4.6 mm internal diameter)
packed with Spherisorb 5 0DS2 was used. The mobile phase was a mixture of methanol
(35 %), deionized, doubly distilled water (55 %), and acetonitrile. Identification of the
eluting compounds was made by comparing their retention times with those of
commercial compounds purchased from Aldrich.
9.3 Synthesis of CexZr1-xO2 nanoparticles
9.3.1 Materials
Ammonium cerium nitrate, (NH4)2Ce(NO3)6 (Aldrich 98.5%), zirconyl nitrate,
ZrO(NO3)2·x H2O (Aldrich 99.99%), zirconyl chloride, ZrOCl2· 8H2O(Riedel-de Haёn
99.5%), copper nitrate hemipentahydrate Cu(NO3)2·2.5 H2O (Aldrich 98%); ammonia,
NH3 (Fluka 25% aqueous solution), sodium hydroxide, NaOH (Aldrich AR grade), and
nitric acid, HNO3 (Aldrich 90%) were used as received. The exact molecular weight of
ZrO(NO3)2·x H2O calculated from thermal analysis was found to be 276.8 g.
Experimental 100
9.3.2 Procedure
CexZr1-xO2 nanoparticle sols with x = 0, 0.1, 0.2, 0.3… x = 1 were synthesized. For the
synthesis of the sols with a total metal content of 0.005 mole, the appropriate amounts of
(NH4)2Ce(NO3)6 and ZrOCl2·8H2O were dissolved together in 40 ml distilled water. 1.3-
1.5 ml of 25% aqueous NH3 solution was added rapidly to this solution to raise the pH
above 10 leading to co-precipitation of the metal hydroxides. The precipitate was washed
repeatedly with distilled water until the washing was tested neutral by litmus paper. 5 ml
distilled water and a calculated amount of 90% HNO3 was added to the washed
precipitate. Ratio of HNO3-to-metal content was varied systematically from 1:1 for pure
CeO2 sample to 1.5:1 for pure ZrO2 sample. The resultant suspension was sonicated
(Elma Transsonic Digital S, 140% ultrasound power) for 45-60 min to obtain a
transparent sol. During sonication, the temperature of the water bath increased to 40-
50°C. The pH of these sols was below 2. The sols were dialyzed against Millipore water
using Spectra/Por membranes (MWCO: 6-8000). The pH of the dialyzed sols was in the
range of 4-5. Transparent gels were obtained from these sols upon evaporation of water.
For the synthesis of (Ce0.5Zr0.5O2)0.75(CuO)0.25 sols, ZrO(NO3)2·xH2O was used instead of
ZrOCl2· 8H2O. For the synthesis of 0.005 mole metal oxide containing sol, calculated
amounts of Cu(NO3)2·2.5 H2O, ZrO(NO3)2·xH2O and (NH4)2Ce(NO3)6 were dissolved
together in 40 ml distilled water. Instead of aqueous ammonia, NaOH solution was used.
1 g of NaOH was dissolved in 5 ml distilled water and added rapidly to the mixed metal
salt solution. The pH of the solution was raised above 10. The rest of the procedure was
the same as the synthesis of CexZr1-xO2 sols.
Experimental 101
9.4 Synthesis of mesoporous CexZr1-xO2 and (CexZr1-xO2 )a (CuO)b
spheres
9.4.1 Materials
Un-dialyzed sols of CexZr1-xO2 and (Ce0.5Zr0.5O2)0.75(CuO)0.25 were used for the
synthesis. Wet beads of Amberlite® XAD-16 were purchased from Aldrich.
9.4.2 Procedure
The beads received from the manufacturer contained Na2CO3 and NaCl to prevent
bacterial growth. So it was necessary to clean the beads before use. The beads were
washed repeatedly with distilled water until the conductivity of washing was below 1 µS
cm-1. After washing the beads were stored in distilled water. For the templating process
undialyzed sols of CexZr1-xO2 and (Ce0.5Zr0.5O2)0.75(CuO)0.25 were used. 1.5 ml of the
washed wet beads and sols containing 0.005 mole oxide were mixed together and kept in
an oven at 60 ºC for 2 days to evaporate the solvent completely. These beads were then
dried further at 90-100 ºC for 1day. The dried beads were washed thoroughly to clean the
surface of beads and to remove excess deposit from the surface if present. The washed
beads were again dried at 60ºC/1 day and calcined in the oven at 500 ºC for 1.5 h in N2
and then 8 h in air with a ramp of 2.5 h in N2. Well-crystallized porous oxide spheres
with colors from dark yellow to white were obtained with increase in content of ZrO2.

Experimental 102
9.4.3 Methanol steam reforming
The steam reforming of methanol using (Ce0.5Zr0.5O2)0.75(CuO)0.25 spheres as catalyst was
carried out in a fixed bed reactor. The reactor consisted of a stainless steel tube in which
0.394 g of the catalyst beads were packed with silica beads (diameter =750 µm) laid
above and below the catalyst beads. The reactor was heated at 250 ºC and 1:1 mixture of
methanol and water was fed to the reactor at a flow rate of 0.07 ml/min. The effluent
gases were analyzed by an online gas chromatographer (Varian CP-3800). The reaction
was carried out over a period of 19 days. For comparison a commercial catalyst obtained
from Süd Chemie, Germany, which contained 50 wt % CuO in addition to ZnO and
Al2O3 was used.
9.5 Synthesis of Mesoporous CexZr1-xO2 powders
9.5.1 Materials.
Un-dialyzed CeO2 and Ce0.5Zr0.5O2 sols were used as precursors in the synthesis.
Poly(butadiene-b-ethylene oxide) (PB-PEO) block copolymer having the formula
(PB)320(PEO)568 were kindly donated/provided by Dr. H. Schlaad of the Max Plank
Institute of Colloids and Interfaces, Golm, Germany. Both the blocks are narrowly
distributed with Mw = 17290 for polybutadiene block and Mw = 24992 for polyethylene
oxide block. The synthesis of this block-copolymer was done as reported in the literature
124.
9.5.2 Procedure
Un-dialyzed aqueous sols with 0.005 mole oxide content were taken as precursor. To the
aqueous sol 10 ml of absolute ethanol was added. The ethanol/water sol was dialyzed
Experimental 103
against absolute ethanol to remove water using Spectra/Por membranes (MWCO: 6-
8000). Prior to the dialysis, weights of the dialysis membrane, clips and the sol were
determined separately. From the oxide content, the weight of ethanol added and the
weight of the sol, the amount of water in the sol was calculated. The sol was then
transferred to dialysis membrane and dialyzed against abosolute ethanol. Weight of the
membrane tube containing the sol was checked every few minutes and absolute ethanol
was replaced intermittently. The dialysis was carried till approximately 5 ml of water
remained in the sol. 0.3 g of the PB-PEO block-copolymer was dissolved in 5 ml absolute
ethanol and to it the ethanol/water sol was added drop wise with constant stirring to
obtain a clear solution. This solution was transferred to a petridish and the solvent was
allowed to evaporate at ambient condition for 3-4 days to obtain transparent a yellow gel.
The gel was aged at 100 ºC for one day and then calcined in flowing air at 450 ºC for 2h.
A special calcination program was used in which the temperature was raised to 300 ºC
with a ramp of 1 ºC/min. After reaching 300 ºC the temperature was kept constant for 1 h,
raised to 450 ºC and held constant at 450 ºC for 2h. Upon calcination, powdered yellow
products were obtained.
9.6 Characterization
9.6.1 Powder X-ray diffraction (XRD) measurements
An Enraf-Nonius PDS-120 instrument and a D8 advance diffractometer (Bruker AXS,
Germany) with Cu-Kα radiation with a wavelength of 1.540 Å obtained using Ni/C
mirror were used to obtain XRD data of all the samples. The samples were analyzed in
reflection mode.

Experimental 104
9.6.2 Small angle X-ray scattering (SAXS)
SAXS data for the samples were obtained by using Kratky camera assembly
manufactured by Anton-par, Germany. The samples were analyzed in transmission mode
under vacuum with an X-ray source of Cu-Kα radiation.
9.6.3 Scanning electron (SEM) microscopy
A Gemini Leo-1550 instrument was used for obtaining SEM images of the samples. The
samples were loaded on carbon-coated stubs and sputter coated with Au/Pd alloy prior to
analysis.
9.6.3 Transmission electron (TEM) microscopy
TEM images of samples were obtained by using a Zeiss EM-912 Omega instrument
operating at acceleration voltage of 100 kV. To obtain thin cross-section of samples, they
were embedded in an LR-White resin. Ultra thin sections were obtained using a Leica
ultracut UCT ultramicrotome. These sections were supported on carbon-coated copper
grids. Alternatively for powders the samples were dispersed in a suitable solvent and a
drop of this suspension was laid on the carbon-coated copper grid. The solvent was
allowed to evaporate to form a thin layer of sample on the copper grid.
A CM200FEG (Philips) microscope, operated at 200kV, equipped with a field emission
gun was used for high-resolution transmission electron microscopy (HRTEM) and
selected area electron diffraction (SAED).
Experimental 105
9.6.4 Nitrogen sorption studies.
Nitrogen sorption studies were carried out using a Micromeritics Tristar-3000 instrument.
For the analysis the samples were transferred into sample tubes and evacuated at 150 ºC
for at least 6 hour. The analysis was carried out at liquid nitrogen temperature (-196 ºC).
The specific surface area was calculated by applying BET method of analysis.
9.6.5 Infrared spectroscopy
A BIO-RAD FTS 6000 spectrometer was used for FT-IR analysis of the samples. No
specific sample preparation method was necessary for the analysis using this instrument.
Spectra were recorded in the range from 400-4000 cm-1.
9.6.6 Raman spectroscopy
All Raman spectra were recorded with DILOR LABRAM 1 spectrometer. A He-laser
(632.8 nm, Melles Griot, 17 mW) was used for excitation. The laser light was focused
onto the sample using a 10x objective lens (Olympus) and the spectra were recorded in
backscattering geometry. The laser power at the sample location was measured and found
to be less then 1 mW. The entrance slit was set to 100 µm giving a spectral width of 5
cm-1. A notch filter was applied to cut off the laser line and the Rayleigh scattering up to
about 150 cm-1. Each spectrum is the average of 5 accumulations at an integration time of
60 seconds.

Experimental 106
9.6.5 Analytical ultracentrifugation
The particle size distribution was studied for sols using Beckman Optima XL-I analytical
ultracentrifuge (AUC) (Beckman Instruments, Palo alto, CA) equipped with Rayleigh
interference and UV absorption optics.
Summary 107
10 Summary
1. In this work the synthesis of porous metal oxides using a wide variety of different
structure directing agents (templates) and precursor materials is demonstrated. The
effect of template, synthetic mode and composition on the physico-chemical
properties of the final materials, together with the catalytic properties, was
investigated in detail.
2. The first section describes the synthesis of macroporous TiO2-M2O3 (M = Al, Ga, In)
spheres using the corresponding metal alkoxides in a sol-gel process and
macroporous polystyrene reverse phase chromatography beads (source™ 15RPC) as
template.
3. SEM and TEM analysis shows that the morphology of the template was maintained in
the final oxide spheres, which were monodispersed, highly porous with high BET
surface area up to 195 m2g-1.
4. From XRD studies it is observed that the addition of a second metal oxide (M2O3, M
= Al, Ga, In) to TiO2 is effective in retarding the crystallite growth and the anatase to
rutile phase transformation even on calcination at 750 ºC. Furthermore, results from
pyridine adsorption studies indicate that the second metal oxide also enhances the
surface acidity through creation of Lewis acid site.
5. TiO2-M2O3 spheres show better photocatalytic activity for the degradation of 2-
Chlorophenol as compared to the pure TiO2 spheres. The enhancement in the activity
is greatest for the samples containing 5 wt% of Al2O3, Ga2O3 and In2O3, which are
even better than the standard catalyst Degussa P25. In addition, the dependence of pH

Summary 108
on the photocatalytic activity is different for the TiO2-M2O3 spheres than for pure
TiO2, owing to the modification in surface properties of these samples.
6. In the second section, the synthesis of CexZr1-xO2 and (CexZr1-xO2)a(CuO)b
nanoparticle sols is demonstrated. The process involves hydroxide co-precipitation of
mixed metal salts and peptization of the primary particles by ultrasonication using
nitric acid as peptizing agent.
7. AUC analysis of these nanoparticle sols shows a narrow particle size distribution.
HRTEM and XRD studies show that the particles are as small as 2.5 nm, highly
crystalline and defect free. Exceptions are the pure ZrO2 and the 10 mol% containing
CeO2 samples, which are amorphous. Moreover, XRD studies supplemented by
Raman studies show the formation of solid solution over the entire composition
range.
8. The third section demonstrates the use of CexZr1-xO2 and (CexZr1-xO2)a(CuO)b as
nanoparticulate precursors to synthesize mesoporous spheres of large macroscopic
sizes. Mesoporous polymeric beads Amberlite® XAD-16 are used as templates.
9. SEM and TEM results show that the morphology of the template beads is reflected in
the final product. Though the pore structure of the product spheres is not an exact
inverse replica of the template beads, the influence of the template can be clearly
seen.
10. From the nitrogen sorption analysis it follows that the oxide spheres, like the template
beads, are mesoporous in nature and surface area values are up to 113 m2g-1.
11. XRD and Raman studies on samples calcined at 900 ºC show the evolution of the
crystal structure and the transition from the monoclinic to the tetragonal, metastable
tetragonal and cubic crystal structures from pure ZrO2 to pure CeO2. The crystallite
Summary 109
size calculated from XRD data shows the interesting result that the crystallite size is
minimum for intermediate compositions, while it is maximum for the pure oxide,
indicating that the solid solution formation results in retarding of crystal growth.
12. Further comparison of BET surface area and crystallite sizes of samples calcined at
500 ºC and 900 ºC shows that there is less correlation between the two factors lower
calcination temperature as the template induced porosity dictates the surface area
values. 900 ºC calcined sample show inverse relation between crystallite size and
surface area indicating that the pore structure is lost and the porosity in the sample is
interparticle porosity.
13. Methanol reforming reactions performed on (Ce0.5Zr0.5O2)0.75(CuO)0.25 samples show
that they are catalytically as active as commercial catalysts with a conversion
efficiency up to 46 %. However, high amount of CO is also produced and this is not
desirable.
14. The last section describes the use of CexZr1-xO2 nanoparticles and poly(butadiene-b-
ethylene oxide) (PB-PEO) block-copolymers to obtain highly crystalline mesoporous
powders via evaporation induced self-assembly.
15. The SAXS data show a single peak for the as-prepared and calcined product,
indicating that the process successfully gives porous materials with regular pore sizes.
However, the absence of second order reflections shows a lack of long range
ordering.
16. TEM images of as-prepared sample show large spherical pores with an average
diameter of 21 nm and a wall thickness of 8-10 nm. The calcined samples indicate to
some extent shrinkage in pore size and increase in particle size within the pore walls.

Summary 110
17. The nitrogen sorption data show type VI isotherm typical of mesoporous materials
with large hysteresis due to the spherical pore and bottleneck effect. The pore size
distribution is very narrow with an average pore size of 12 nm.
18. In general, the use of templaing techniques and a detailed study of various aspects of
templating processes have been successfully demonstrated in the present work.
References 111
11 References
1. Feynman, R. P. in Annual Meeting of the American Physical Society (Article
available on web at www.zyvex.com/nanotech/feynman.html, California institute of
Technology, 1959)
2. Mackay, A. L. "Flexicrystallography - curved surfaces in chemical structures".
Curr. Sci. 69, 151-161 (1995)
3. Mann, S. and Ozin, G. A. "Synthesis of inorganic materials with complex form".
Nature 382, 313-318 (1996)
4. Antonietti, M. and Ozin, G. A. "Promises and problems of mesoscale materials
chemistry or why meso?" Chem. Eur. J. 10, 29-41 (2004)
5. Mann, S., Burkett, S. L., Davis, S. A., Fowler, C. E., Mendelson, N. H., Sims, S.
D., Walsh, D. and Whilton, N. T. "Sol-gel synthesis of organized matter". Chem. Mater.
9, 2300-2310 (1997)
6. Gregg, S. J. and Sing, K. S. W. Adsorption, surface Area and Porosity (Academic
Press, San Diego, CA, 1982).
7. Ferey, G. "Microporous solids: From organically templated inorganic skeletons to
hybrid frameworks ... ecumenism in chemistry". Chem. Mater. 13, 3084-3098 (2001)
References 112
8. Kresge, C. T., Leonowicz, M. E., Roth, W. J., Vartuli, J. C. and Beck, J. S.
"Ordered mesoporous molecular-sieves synthesized by a liquid-crystal template
mechanism". Nature 359, 710-712 (1992)
9. Huo, Q. S., Margolese, D. I., Ciesla, U., Feng, P. Y., Gier, T. E., Sieger, P., Leon,
R., Petroff, P. M., Schuth, F. and Stucky, G. D. "Generalized synthesis of periodic
surfactant inorganic composite-materials". Nature 368, 317-321 (1994)
10. Antonelli, D. M. and Ying, J. Y. "Synthesis of hexagonally packed mesoporous
TiO2 by a modified sol-gel method". Angew. Chem. Int. Ed. Engl. 34, 2014-2017 (1995)
11. Antonelli, D. M. and Ying, J. Y. "Synthesis of a stable hexagonally packed
mesoporous niobium oxide molecular sieve through a novel ligand-assisted templating
mechanism". Angew. Chem.-Int. Ed. Engl. 35, 426-430 (1996)
12. Antonelli, D. M. and Ying, J. Y. "Synthesis and characterization of hexagonally
packed mesoporous tantalum oxide molecular sieves". Chem. Mater. 8, 874-881 (1996)
13. Pacheco, G., Zhao, E., Garcia, A., Sklyarov, A. and Fripiat, J. J. "Syntheses of
mesoporous zirconia with anionic surfactants". J. Mater. Chem. 8, 219-226 (1998)
14. Pacheco, G., Zhao, E., Garcia, A., Sklyarov, A. and Fripiat, J. J. "Mesoporous
zirconia obtained with anionic templates". Chem. Commun., 491-492 (1997)
15. Luca, V., MacLachlan, D. J., Hook, J. M. and Withers, R. "Synthesis and
characterization of mesostructured vanadium oxide". Chem. Mater. 7, 2220-2223 (1995)
References 113
16. Attard, G. S., Glyde, J. C. and Goltner, C. G. "Liquid-Crystalline Phases as
Templates for the Synthesis of Mesoporous Silica". Nature 378, 366-368 (1995)
17. Yang, P. D., Zhao, D. Y., Margolese, D. I., Chmelka, B. F. and Stucky, G. D.
"Generalized syntheses of large-pore mesoporous metal oxides with semicrystalline
frameworks". Nature 396, 152-155 (1998)
18. Ying, J. Y., Mehnert, C. P. and Wong, M. S. "Synthesis and applications of
supramolecular-templated mesoporous materials". Angew. Chem. Int. Ed. 38, 56-77
(1999)
19. Soler-illia, G. J. D., Sanchez, C., Lebeau, B. and Patarin, J. "Chemical strategies
to design textured materials: From microporous and mesoporous oxides to nanonetworks
and hierarchical structures". Chem. Rev. 102, 4093-4138 (2002)
20. Sayari, A. and Liu, P. "Non-silica periodic mesostructured materials: recent
progress". Microporous Mater. 12, 149-177 (1997)
21. Ma, Y., Tong, W., Zhou, H. and Suib, S. L. "A review of zeolite-like porous
materials". Microporous Mesoporous Mat. 37, 243-252 (2000)
22. Velev, O. D., Jede, T. A., Lobo, R. F. and Lenhoff, A. M. "Porous silica via
colloidal crystallization". Nature 389, 447-448 (1997)
23. Holland, B. T., Blanford, C. F. and Stein, A. "Synthesis of macroporous minerals
with highly ordered three-dimensional arrays of spheroidal voids". Science 281, 538-540
(1998)
References 114
24. Imhof, A. and Pine, D. J. "Ordered macroporous materials by emulsion
templating". Nature 389, 948-951 (1997)
25. Caruso, R. A., Giersig, M., Willig, F. and Antonietti, M. "Porous "coral-like"
TiO2 structures produced by templating polymer gels". Langmuir 14, 6333-6336 (1998)
26. Caruso, R. A. and Schattka, J. H. "Cellulose acetate templates for porous
inorganic network fabrication". Adv. Mater. 12, 1921-1923 (2000)
27. Caruso, R. A., Antonietti, M., Giersig, M., Hentze, H. P. and Jia, J. G.
"Modification of TiO2 network structures using a polymer gel coating technique". Chem.
Mater. 13, 1114-1123 (2001)
28. Caruso, R. A. and Antonietti, M. "Sol-gel nanocoating: An approach to the
preparation of structured materials". Chem. Mater. 13, 3272-3282 (2001)
29. Caruso, R. A. and Antonietti, M. "Silica films with bimodal pore structure
prepared by using membranes as templates and amphiphiles as porogens". Adv. Funct.
Mater. 12, 307-312 (2002)
30. Lakshmi, B. B., Dorhout, P. K. and Martin, C. R. "Sol-gel template synthesis of
semiconductor nanostructures". Chem. Mater. 9, 857-862 (1997)
31. Jung, J. H., Ono, Y., Hanabusa, K. and Shinkai, S. "Creation of both right-handed
and left-handed silica structures by sol-gel transcription of organogel fibers comprised of
chiral diaminocyclohexane derivatives". J. Am. Chem. Soc. 122, 5008-5009 (2000)
References 115
32. Kobayashi, S., Hamasaki, N., Suzuki, M., Kimura, M., Shirai, H. and Hanabusa,
K. "Preparation of helical transition-metal oxide tubes using organogelators as structure-
directing agents". J. Am. Chem. Soc. 124, 6550-6551 (2002)
33. Davis, S. A., Patel, H. M., Mayes, E. L., Mendelson, N. H., Franco, G. and Mann,
S. "Brittle bacteria: A biomimetic approach to the formation of fibrous composite
materials". Chem. Mater. 10, 2516-2524 (1998)
34. Caruso, R. A., Schattka, J. H. and Greiner, A. "Titanium dioxide tubes from sol-
gel coating of electrospun polymer fibers". Adv. Mater. 13, 1577-1579 (2001)
35. Zhang, B. J., Davis, S. A. and Mann, S. "Starch gel templating of spongelike
macroporous silicalite monoliths and mesoporous films". Chem. Mater. 14, 1369-1375
(2002)
36. Yang, D., Qi, L. M. and Ma, J. M. "Eggshell membrane templating of
hierarchically ordered macroporous networks composed of TiO2 tubes". Adv. Mater. 14,
1543-1546 (2002)
37. Seshadri, R. and Meldrum, F. C. "Bioskeletons as templates for ordered,
macroporous structures". Adv. Mater. 12, 1149- 1151(2000)
38. Fowler, C. E., Shenton, W., Stubbs, G. and Mann, S. "Tobacco mosaic virus
liquid crystals as templates for the interior design of silica mesophases and
nanoparticles". Adv. Mater. 13, 1266-1269 (2001)
References 116
39. Niederberger, M., Muhr, H. J., Krumeich, F., Bieri, F., Gunther, D. and Nesper,
R. "Low-cost synthesis of vanadium oxide nanotubes via two novel non-alkoxide routes".
Chem. Mater. 12, 1995-2000 (2000)
40. Davis, S. A., Breulmann, M., Rhodes, K. H., Zhang, B. and Mann, S. "Template-
directed assembly using nanoparticle building blocks: A nanotectonic approach to
organized materials". Chem. Mater. 13, 3218-3226 (2001)
41. Breulmann, M., Davis, S. A., Mann, S., Hentze, H. P. and Antonietti, M.
"Polymer-gel templating of porous inorganic macro-structures using nanoparticle
building blocks". Adv. Mater. 12, 502-507 (2000)
42. Shchukin, D. G., Schattka, J. H., Antonietti, M. and Caruso, R. A. "Photocatalytic
properties of porous metal oxide networks formed by nanoparticle infiltration in a
polymer gel template". J. Phys. Chem. B 107, 952-957 (2003)
43. Subramania, G., Constant, K., Biswas, R., Sigalas, M. M. and Ho, K. M. "Optical
photonic crystals fabricated from colloidal systems". Appl. Phys. Lett. 74, 3933-3935
(1999)
44. Subramanian, G., Manoharan, V. N., Thorne, J. D. and Pine, D. J. "Ordered
macroporous materials by colloidal assembly: A possible route to photonic bandgap
materials". Adv. Mater. 11, 1261-1265 (1999)
45. Diebold, U. "The surface science of titanium dioxide". Surf. Sci. Rep. 48, 53-229
(2003)
References 117
46. Hoffmann, M. R., Martin, S. T., Choi, W. Y. and Bahnemann, D. W.
"Environmental applications of semiconductor photocatalysis". Chem. Rev. 95, 69-96
(1995)
47. Kim, J., Song, K. C., Foncillas, S. and Pratsinis, S. E. "Dopants for synthesis of
stable bimodally porous titania". J. Eur. Ceram. Soc. 21, 2863-2872 (2001)
48. Poznyak, S. K., Talapin, D. V. and Kulak, A. I. "Structural, optical, and
photoelectrochemical properties of nanocrystalline TiO2-In2O3 composite solids and films
prepared by sol-gel method". J. Phys. Chem. B 105, 4816-4823 (2001)
49. Schattka, J. H., Shchukin, D. G., Jia, J. G., Antonietti, M. and Caruso, R. A.
"Photocatalytic activities of porous titania and titania/zirconia structures formed by using
a polymer gel templating". Chem. Mater. 14, 5103-5108 (2002)
50. Birkefeld, L. D., Azad, A. M. and Akbar, S. A. "Carbon-monoxide and hydrogen
detection by anatase modification of titanium-dioxide". J. Am. Ceram. Soc. 75, 2964-
2968 (1992)
51. Tang, H., Prasad, K., Sanjines, R. and Levy, F. "TiO2 anatase thin-films as gas
sensors". Sens. Actuator B-Chem. 26, 71-75 (1995)
52. Kaspar, J., Fornasiero, P. and Graziani, M. "Use of CeO2-based oxides in the
three-way catalysis". Catal. Today 50, 285-298 (1999)
53. Yashima, M., Kakihana, M. and Yoshimura, M. "Metastable-stable phase
diagrams in the zirconia-containing systems utilized in solid-oxide fuel cell application".
Solid State Ion. 86-8, 1131-1149 (1996)
References 118
54. Trovarelli, A. "Catalytic properties of ceria and CeO2-containing materials".
Catal. Rev. Sci. Eng. 38, 439-520 (1996)
55. Trovarelli, A. Catalysis by Ceria and Related Materials (ed. Hutchings, G. H.)
(Imperial College Press, 2002).
56. Kaspar, J. and Fornasiero, P. "Nanostructured materials for advanced automotive
de-pollution catalysts". J. Solid State Chem. 171, 19-29 (2003)
57. Kaspar, J., Fornasiero, P. and Hickey, N. "Automotive catalytic converters:
current status and some perspectives". Catal. Today 77, 419-449 (2003)
58. Mills, A. and LeHunte, S. "An overview of semiconductor photocatalysis". J.
Photochem. Photobiol. A-Chem. 108, 1-35 (1997)
59. Linsebigler, A. L., Lu, G. Q. and Yates, J. T. "Photocatalysis on TiO2 surfaces -
principles, mechanisms, and selected results". Chem. Rev. 95, 735-758 (1995)
60. Legrini, O., Oliveros, E. and Braun, A. M. "Photochemical processes for water-
treatment". Chem. Rev. 93, 671-698 (1993)
61. Frank, S. N. and Bard, A. J. "Heterogeneous photocatalytic oxidation of cyanide
and sulfite in aqueous-solutions at semiconductor powders". J. Phys. Chem. 81, 1484-
1488 (1977)
62. Frank, S. N. and Bard, A. J. "Heterogeneous photocatalytic oxidation of cyanide
ion in aqueous-solutions at TiO2 powder". J. Am. Chem. Soc. 99, 303-304 (1977)
References 119
63. Sjogren, J. C. and Sierka, R. A. "Inactivation of phage MS2 by iron-aided
titanium-dioxide photocatalysis". Appl. Environ. Microbiol. 60, 344-347 (1994)
64. Lee, S., Nishida, K., Otaki, M. and Ohgaki, S. "Photocatalytic inactivation of
phage Q beta by immobilized titanium dioxide mediated photocatalyst". Water Sci.
Technol. 35, 101-106 (1997)
65. Ireland, J. C., Klostermann, P., Rice, E. W. and Clark, R. M. "Inactivation of
Escherichia-coli by titanium-dioxide photocatalytic oxidation". Appl. Environ. Microbiol.
59, 1668-1670 (1993)
66. Borgarello, E., Kiwi, J., Pelizzetti, E., Visca, M. and Gratzel, M. "Photochemical
cleavage of water by photocatalysis". Nature 289, 158-160 (1981)
67. Amphlett, J. C., Evans, M. J., Mann, R. F. and Weir, R. D. "Hydrogen-production
by the catalytic steam reforming of methanol .2. kinetics of methanol decomposition
using Girdler G66b catalyst". Can. J. Chem. Eng. 63, 605-611 (1985)
68. Jiang, C. J., Trimm, D. L., Wainwright, M. S. and Cant, N. W. "Kinetic-study of
steam reforming of methanol over copper-based catalysts". Appl. Catal. A-Gen. 93, 245-
255 (1993)
69. Peppley, B. A., Amphlett, J. C., Kearns, L. M. and Mann, R. F. "Methanol-steam
reforming on Cu/ZnO/Al2O3. Part 1: The reaction network". Appl. Catal. A-Gen. 179, 21-
29 (1999)
References 120
70. Breen, J. P. and Ross, J. R. H. "Methanol reforming for fuel-cell applications:
development of zirconia-containing Cu-Zn-Al catalysts". Catal. Today 51, 521-533
(1999)
71. Rouquerol, J., Avnir, D., Fairbridge, C. W., Everett, D. H., Haynes, J. H.,
Pernicone, N., Ramsay, J. D. F., Sing, K. S. W. and Unger, K. K. "Recommendations for
the characterization of porous solids". Pure Appl. Chem. 66, 1739-1758 (1994)
72. Langmuir, I. "Adsorption of gases on plane surfaces of glass, mica and
platiunum". J. Am. Chem. Soc. 40, 1361-1401 (1918)
73. Brunauer, S., Emmett, P. H. and Teller, E. "Adsorption of gases in multimolecular
layers". J. Am. Chem. Soc. 60, 309-319 (1938)
74. Chescoe, D. and Goodhew, P. J. The Operation of transmission and scanning
electron microscopes (Oxford University Press, 1990).
75. Klug, H. P. and Alexander, L. E. X-ray Diffraction Procedures for Polycrystalline
and Amorphous Materials (Wiley Interscience, New York, 1974).
76. Nakamoto, K. Infrared and Raman Spectra of Inorganic and Coordination
Compounds (Wiley Interscience Publication, Toronto, 1986).
77. Schrader, B. Infrared and Raman Spectroscopy: Methods and Applications (VCH
Publishers Inc., New York, 1995).
78. Svedberg, T. and Rinde, H. "The determination of the distribution of size of
particles in disperse systems". J. Am. Chem. Soc. 45, 943-954 (1923)
References 121
79. Svec, F. and Frechet, J. M. J. "New designs of macroporous polymers and
supports: From separation to biocatalysis". Science 273, 205-211 (1996)
80. Arshady, R. "Beaded Polymer Supports and Gels .1. Manufacturing Techniques".
Journal of Chromatography 586, 181-197 (1991)
81. Dowding, P. J. and Vincent, B. "Suspension polymerisation to form polymer
beads". Colloid Surf. A-Physicochem. Eng. Asp. 161, 259-269 (2000)
82. Smigol, V. and Svec, F. "Synthesis and Properties of Uniform Beads Based on
Macroporous Copolymer Glycidyl Methacrylate Ethylene Dimethacrylate - a Way to
Improve Separation Media for Hplc". J. Appl. Polym. Sci. 46, 1439-1448 (1992)
83. Meyer, U., Larsson, A., Hentze, H. P. and Caruso, R. A. "Templating of porous
polymeric beads to form porous silica and titania spheres". Adv. Mater. 14, 1768-1772
(2002)
84. Shchukin, D. G. and Caruso, R. A. "Template synthesis of porous gold
microspheres". Chem. Commun., 1478-1479 (2003)
85. Hwang, Y. K., Lee, K. C. and Kwon, Y. U. "Nanoparticle routes to mesoporous
titania thin films". Chem. Commun., 1738-1739 (2001)
86. Wong, M. S., Jeng, E. S. and Ying, J. Y. "Supramolecular templating of thermally
stable crystalline mesoporous metal oxides using nanoparticulate precursors". Nano Lett.
1, 637-642 (2001)
References 122
87. Reddy, B. M., Ganesh, I., Reddy, E. P., Fernandez, A. and Smirniotis, P. G.
"Surface characterization of Ga2O3-TiO2 and V2O5/Ga2O3-TiO2 catalysts". J. Phys. Chem.
B 105, 6227-6235 (2001)
88. Gaewdang, T., Chaminade, J. P., Gravereau, P., Garcia, A., Fouassier, C.,
Hagenmuller, P. and Mahiou, R. "Crystal-structure and luminescent properties of indium
titanate". Mater. Res. Bull. 28, 1051-1060 (1993)
89. Ryczkowski, J. "IR spectroscopy in catalysis". Catal. Today 68, 263-381 (2001)
90. Haneda, M., Joubert, E., Menezo, J. C., Duprez, D., Barbier, J., Bion, N., Daturi,
M., Saussey, J., Lavalley, J. C. and Hamada, H. "Surface characterization of alumina-
supported catalysts prepared by sol-gel method. Part I. Acid-base properties". Phys.
Chem. Chem. Phys. 3, 1366-1370 (2001)
91. Busca, G. "Spectroscopic characterization of the acid properties of metal oxide
catalysts". Catal. Today 41, 191-206 (1998)
92. Rao, N. N., Dubey, A. K., Mohanty, S., Khare, P., Jain, R. and Kau, S. N.
"Photocatalytic degradation of 2-chlorophenol: a study of kinetics, intermediates and
biodegradability". J. Hazard. Mater. 101, 301-314 (2003)
93. D'Oliveira, J. C., Alsayyed, G. and Pichat, P. "Photodegradation of 2-
chlorophenol and 3-chlorophenol in TiO2 aqueous suspensions". Environ. Sci. Technol.
24, 990-996 (1990)

References 123
94. Doong, R. A., Chen, C. H., Maithreepala, R. A. and Chang, S. M. "The influence
of pH and cadmium sulfide on the photocatalytic degradation of 2-chlorophenol in
titanium dioxide suspensions". Water Res. 35, 2873-2880 (2001)
95. Ku, Y., Leu, R. M. and Lee, K. C. "Decomposition of 2-chlorophenol in aqueous
solution by UV irradiation with the presence of titanium dioxide". Water Res. 30, 2569-
2578 (1996)
96. Fu, X. Z., Clark, L. A., Yang, Q. and Anderson, M. A. "Enhanced photocatalytic
performance of titania-based binary metal oxides: TiO2/SiO2 and TiO2/ZrO2". Environ.
Sci. Technol. 30, 647-653 (1996)
97. Ohtani, B., Bowman, R. M., Colombo, D. P., Kominami, H., Noguchi, H. and
Uosaki, K. "Femtosecond diffuse reflectance spectroscopy of aqueous Titanium(IV)
oxide suspension: Correlation of electron-hole recombination kinetics with photocatalytic
activity". Chem. Lett., 579-580 (1998)
98. Mills, A., Davies, R. H. and Worsley, D. "Water-purification by semiconductor
photocatalysis". Chem. Soc. Rev. 22, 417-425 (1993)
99. Wu, N. C., Shi, E. W., Zheng, Y. Q. and Li, W. J. "Effect of pH of medium on
hydrothermal synthesis of nanocrystalline cerium(IV) oxide powders". J. Am. Ceram.
Soc. 85, 2462-2468 (2002)
100. Nabavi, M., Spalla, O. and Cabane, B. "Surface-chemistry of nanometric ceria
particles in aqueous dispersions". J. Colloid Interface Sci. 160, 459-471 (1993)
References 124
101. Spalla, O. and Kekicheff, P. "Adhesion between oxide nanoparticles: Influence of
surface complexation". J. Colloid Interface Sci. 192, 43-65 (1997)
102. Wang, H., Zhu, J. J., Zhu, J. M., Liao, X. H., Xu, S., Ding, T. and Chen, H. Y.
"Preparation of nanocrystalline ceria particles by sonochemical and microwave assisted
heating methods". Phys. Chem. Chem. Phys. 4, 3794-3799 (2002)
103. Tsunekawa, S., Sivamohan, R., Ohsuna, T., Kasuya, A., Takahashi, H. and Tohji,
K. in Rare Earths '98 439-445 (Transtec Publications Ltd, Zurich-Uetikon, 1999).
104. Svedberg, T. and Pedersen, K. O. The Ultracentrifuge (Clarendon Press, Oxford,
1940).
105. Colfen, H. and Pauck, T. "Determination of particle size distributions with
angstrom resolution". Colloid Polym. Sci. 275, 175-180 (1997)
106. Pinna, N., Wild, U., Urban, J. and Schlogl, R. "Divanadium pentoxide nanorods".
Adv. Mater. 15, 329-331 (2003)
107. Vogel, W. "X-ray diffraction from clusters". Cryst. Res. Technol. 33, 1141-1154
(1998)
108. Kurth, D. G., Lehmann, P., Volkmer, D., Colfen, H., Koop, M. J., Muller, A. and
Du Chesne, A. "Surfactant-encapsulated clusters (SECs):
(DODA)20(NH4)[H3Mo57V6(NO)6O-183(H2O)18], a case study". Chem. Eur. J. 6, 385-393
(2000)
References 125
109. Yashima, M., Arashi, H., Kakihana, M. and Yoshimura, M. "Raman-scattering
study of cubic-tetragonal phase-transition in Zr1-XCexO2 solid-solution". J. Am. Ceram.
Soc. 77, 1067-1071 (1994)
110. Yashima, M., Takashina, H., Kakihana, M. and Yoshimura, M. "Low-temperature
phase-equilibria by the flux method and the metastable-stable phase-diagram in the ZrO2-
CeO2 system". J. Am. Ceram. Soc. 77, 1869-1874 (1994)
111. Vlaic, G., Di Monte, R., Fornasiero, P., Fonda, E., Kaspar, J. and Graziani, M.
"Redox property-local structure relationships in the ph-loaded CeO2-ZrO2 mixed oxides".
J. Catal. 182, 378-389 (1999)
112. JCPDS. Card No. 43-1002
113. Tsunekawa, S., Sivamohan, R., Ito, S., Kasuya, A. and Fukuda, T. "Structural
study on monosize CeO2-x nano-particles". Nanostruct. Mater. 11, 141-147 (1999)
114. Tsunekawa, S., Ishikawa, K., Li, Z. Q., Kawazoe, Y. and Kasuya, A. "Origin of
anomalous lattice expansion in oxide nanoparticles". Phys. Rev. Lett. 85, 3440-3443
(2000)
115. Tosan, J. L., Durand, B., Roubin, M., Bertin, F. and Loiseleur, H. "Potentiometric
and Raman-Spectroscopic Characterization of Gelatinous Precipitates Formed by
Hydrolysis of Zirconium Oxychloride Solutions". Eur. J. Solid State Inorg. Chem. 30,
179-193 (1993)

References 126
116. Spanier, J. E., Robinson, R. D., Zheng, F., Chan, S. W. and Herman, I. P. "Size-
dependent properties of CeO2-y nanoparticles as studied by Raman scattering". Phys. Rev.
B 64 (2001)
117. Richter, H., Wang, Z. P. and Ley, L. "The One Phonon Raman-Spectrum in
Microcrystalline Silicon". Solid State Commun. 39, 625-629 (1981)
118. Southon, P. D., Bartlett, J. R., Woolfrey, J. L. and Ben-Nissan, B. "Formation and
characterization of an aqueous zirconium hydroxide colloid". Chem. Mater. 14, 4313-
4319 (2002)
119. Wachs, I. E. "Raman and IR studies of surface metal oxide species on oxide
supports: Supported metal oxide catalysts". Catal. Today 27, 437-455 (1996)
120. Colon, G., Pijolat, M., Valdivieso, F., Vidal, H., Kaspar, J., Finocchio, E., Daturi,
M., Binet, C., Lavalley, J. C., Baker, R. T. and Bernal, S. "Surface and structural
characterization of CexZr1-xO2 CEZIRENCAT mixed oxides as potential three-way
catalyst promoters". J. Chem. Soc. Faraday Trans. 94, 3717-3726 (1998)
121. JCPDS. Card No. 37-1484
122. Rhodes, K. H., Davis, S. A., Caruso, F., Zhang, B. J. and Mann, S. "Hierarchical
assembly of zeolite nanoparticles into ordered macroporous monoliths using core-shell
building blocks". Chem. Mater. 12, 2832-2834 (2000)
123. Bouchara, A., Soler-Illia, G., Chane-Ching, J. Y. and Sanchez, C. "Nanotectonic
approach of the texturation of CeO2 based nanomaterials". Chem. Commun., 1234-1235
(2002)
References 127
124. Forster, S. and Kramer, E. "Synthesis of PB-PEO and PI-PEO block copolymers
with alkyllithium initiators and the phosphazene base t-BuP4". Macromolecules 32,
2783-2785 (1999)
125. Forster, S., Berton, B., Hentze, H. P., Kramer, E., Antonietti, M. and Lindner, P.
"Lyotropic phase morphologies of amphiphilic block copolymers". Macromolecules 34,
4610-4623 (2001)
Popular abstract 128
Popular abstract
Nanostructured materials are the materials having structural features on the scale of
nanometers i.e. 10-9 m. the structural features can enhance the natural properties of the
materials or induce additional properties, which are useful for day to technology as well
as the future technologies
One way to synthesize nanostructured materials is using templating techniques. The
templating process involves use of a certain “mould” or “scaffold” to generate the
structure. The mould is called as the template, can be a single molecule or assembly of
molecule or a larger object, which has its own structure. The product material can be
obtained by filling the space around the template with a “precursor”, transformation of
precursor into the desired material and then removal of template to get product. The
precursor can be any chemical moiety that can be easily transformed in to the desired
material. Alternatively the desired material is processed into very tiny bricks or “nano
building blocks (NBB)” and the product is obtained by arrangement of the NBB by using
a scaffold.
We synthesized porous metal oxide spheres of namely TiO2-M2O3: titanium dioxide- M-
oxide (M = aluminum, gallium and indium) TiO2-M2O3 and cerium oxide-zirconium
oxide solid solution. We used porous polymeric beads as templates. These beads used for
chromatographic purposes. For the synthesis of TiO2-M2O3 we used metal- alkoxides as
precursor. The pore of beads were filled with precursor and then reacted with water to
give transformation of the precursor to amorphous oxide network. The network is
crystallized and template is removed by heat treatment at high temperatures. In a similar
Popular abstract 129
way we obtained porous spheres of CexZr1-xO2. For this we synthesized nanoparticle of
CexZr1-xO2 and used then for the templating process to obtain porous CexZr1-xO2 spheres.
Additionally, using the same nanoparticles we synthesized nano-porous powder using
self-assembly process between a block-copolymers scaffold and nanoparticles.
Morphological and physico-chemical properties of these materials were studies
systematically by using various analytical techniques
TiO2-M2O3 material were tested for photocatalytic degradation of 2-Chlorophenol a
poisonous pollutant. While CexZr1-xO2 spheres were tested for methanol steam reforming
reaction to generate hydrogen, which is a fuel for future generation power sources like
fuel cells. All the materials showed good catalytic performance.

Resume 130
Resume
Atul Suresh Deshpande
Birth date: 2nd of March 1977 in Nanded, India.
1982-1994
Primary and secondary education at S. J. Vidyalaya, Daund.
India.
1994-1997 Bachelor of Science (Chemistry)
From S. P. College, Pune
University of Pune, India.
1997-1999 Master of Science (Inorganic Chemistry)
From The Department of Chemistry,
University of Pune, India.
Since 2001 Ph.D. student at Max Planck Institute of Colloids and Interfaces,
Golm, under the guidance of Prof. Dr. Markus Antonietti in the
group of Dr. Rachel Caruso (formerly) and Dr. Markus
Niederberger working on the project “Fabrication of porous metal
oxide for catalytic applications using templating techniques”

Acknowledgement 131
Acknowledgement
I would like to express my gratitude towards all the persons who have helped me or
stayed along my side during this work.
First, I would like to thank Prof. Dr. Markus Antonietti for giving me this great
opportunity to work in this internationally acclaimed research institute.
I am grateful to my supervisors Dr. Rachel Caruso and Dr. Markus Niederberger who
guided me through my work. Especially to Markus for being very kind and nice to me
and helping me and working extra long times for correcting my thesis!
I am thankful to the Dr. Angelo Valleriani, the coordinator of IMPRS on biomimetic
systems and other member, for an all-new learning experience.
This work was of course not possible without the kind help from my fellow co-workers
and collaborators. I appreciate the help from Dr. Dmitry Shchukin for the photocatalytic
activity measurement, Dr. Nicola Pinna for the HRTEM measurements, Pablo Beato for
the Raman studies, Hary Soerijanto and Benjamin Frank for the testing of catalyst
methanol steam reforming reactions, Dr.Helmut Schlaad and Ines below for providing the
magic block-copolymer for the self-assembly reactions and Dr. Bernd Smarsly and Dr.
Helmut Cölfen for the fruitful discussions.
I express my gratitude to Ingrid Zenke, Rona Pitchke, Dr. Hartman, Roy knocke, Regina
Rothe and AntjeVölkel for performing all the analytical work for me.

Acknowledgement 132
I thank my former colleagues, Jan and Heike for helping me with the work, my present
colleagues Georg, Julien and Jianhua gave me the true “global family” feeling. I enjoyed
the French lessons from Julien, and learnt a few differences between the Austrian and
German “German” from Georg!
Special thanks to Cilâine, Sandra and Kerstin for giving me moral support, helping me
with my presentations and talks, German language lessons and giving me company for
lunch!
I am in debt of the all my Indian friends in Potsdam and Berlin with whom I celebrated
the festivities, who never let me feel alone, lifted my spirits up in the bad times and gave
me a feeling of home away from home.
No acknowledgement from MPI can be complete without the mention of Eric C.! It was
nice experience for me. I enjoyed the music, the parties in Chez Briel and the kicker!
I admire the support given to me from all my teachers, friends at the University of Pune
and colleagues at NCL who contributed one way or the other in fulfilling this task.
I owe a great deal to my family. My father Suresh, mother Vijaya and my brother Uday,
his wife Vasudha and their son Anish, who supported me in every situation in life,
provided me with the best things they have and took a good care of me. I hope I live up to
their expectation and make them proud.
Thank you!
3Fitrd"