Institute for Farm Management - d-nb.info
92
Institute for Farm Management University of Hohenheim Production Theory and Resource Economics Professor Dr. Stephan Dabbert Economic Analysis and Policy Implications of Wastewater Use in Agriculture in the Central Region of Ethiopia Dissertation Submitted in fulfillment of the requirements for the degree “Doktor der Agrarwissenschaften” (Dr.sc. /Ph.D. in agricultural Sciences) To the Faculty of Agricultural Sciences Presented by Alebel Bayrau Weldesilassie Place of birth: Nazareth, Ethiopia 2008
Transcript of Institute for Farm Management - d-nb.info
Institute for Farm Management
University of Hohenheim
Production Theory and Resource Economics
Professor Dr. Stephan Dabbert
Economic Analysis and Policy Implications of
Wastewater Use in Agriculture
in the
Central Region of Ethiopia
Dissertation
Submitted in fulfillment of the requirements for the degree
“Doktor der Agrarwissenschaften”
(Dr.sc. /Ph.D. in agricultural Sciences)
To the Faculty of Agricultural Sciences
Presented by
Alebel Bayrau Weldesilassie
Place of birth: Nazareth, Ethiopia
2008
Die vorliegende Arbeit wurde am 6. November 2008 von der Fakultät Agrarwissenschaften der
Universität Hohenheim als „Dissertation zur Erlangung des Grades eines Doktors der
Agrarwissenschaften (Dr. Sc. Agr.)“ angenommen.
Tag der mündlichen Prüfung: 3. Dezember 2008
Prodekan: Prof. Dr. Werner Bessei
Berichterstatter, 1. Prüfer: Prof. Dr. Stephan Dabbert
Mitberichterstatter, 2. Prüfer: Prof. Dr. Manfred Zeller
Weiterer Prüfer: Prof. Dr. Harald Grethe
Dissertation der Universitäte Hohenheim (D 100)
i
Declaration I declare that this dissertation is a result of my personal work and that no other than the indicated aids have been used for its completion. All quotations and statements that have been used are indicated. Further more I assure that the work has not been used neither completely nor in parts for achieving any other academic degree. Stuttgart, Hohenheim 3. 12. 2008 Alebel Bayrau Weldesilassie
ii
Acknowledgments I would like to extend my sincere gratitude and appreciation to my supervisor Professor Dr. Stephan Dabbert of the Institute of Farm Management of Hohenheim University for accepting my application to conduct my research under his supervision and guidance. Without his acceptance, my enrollment as a PhD student would not have been realized. Without his professional guidance, constructive comments and his encouragements throughout the course of the study, the completion of this work would have been very difficult. I would also like to thank Dr. Eline Boelee for her kindest acceptance to co-supervise my work from the International Water Management Institute (IWMI) side and for her technical and administrative support throughout my study. I would like to express my sincere gratitude to the International Water Management Institute for the financial support without which I would not have pursued my PhD program. I would like also to thank the Ethiopian Development Research Institute for providing me office and office facilities during my stay in Ethiopia. I also thank David Van Eyck of the International Water Management Institute for his kindest and on time support in financial and administrative matters during the course of the study period. I am also benefited from a number of individuals who provided me with technical support. I am very much benefited from Dr. Pay Drechsel and his valuable comments. I also extend my appreciation to all IWMI-Ethiopia researchers, Dr. Peter G.McCornick and Dr. Akisa Bahri for their constructive comments. I would like also to thank Dr. Oliver Frör of the Environmental Economics unit in the Institute of Economics at Hohenheim University for his comments and suggestions. I would further like to thank Dr. Intizar Hussain and Dr. Liqa Raschid of the International Water Management Institute for encouraging me to work with the area in the early stage of the proposal development. I would like also to extend my deepest gratitude to colleagues in the Institute of Farm Management of Hohenheim University as well as Ethiopian and Eritrean friends at the University for their supportive and important role to ease life in Germany. I am indebted to the farmers in the study areas, experts and officials in the Addis Ababa Water Supply and Sewerage Authorities and district agricultural offices for providing me the necessary information. Finally, the contribution of my family particularly my wife Tsion Werkneh has been enormous. Her personal sacrifice in taking care of our two children, Bethel and Leul, during the course of this work is unforgettable. Above all, I thank the almighty God who blessed the work from its start to end. Alebel Bayrau Weldesilassie Hohenheim University, December 2008
iii
TABLE OF CONTENTS
ACKNOWLEDGMENTS .................................................................................................................... III
LIST OF FIGURES............................................................................................................................ VI
LIST OF TABLES ............................................................................................................................. VI
EXECUTIVE SUMMARY ................................................................................................................. VII
ZUSAMMENFASSUNG...................................................................................................................... IX
LIST OF ABBREVIATIONS...............................................................................................................XII
CHAPTER 1: INTRODUCTION ...............................................................................................13
1.1. BACKGROUND ......................................................................................................................13
1.2. OBJECTIVE AND SCOPE OF THE STUDY ..................................................................................18
1.2.1. Objective ......................................................................................................................18
1.2.2. Scope of the study ........................................................................................................18
1.3. DATA SOURCE, SAMPLING AND SURVEY PROCEDURE............................................................20
1.3.1. Data type and source ....................................................................................................20
1.3.2. Sampling and Survey Procedures.................................................................................21
1.4. GENERAL FRAMEWORK FOR ANALYZING THE IMPACT OF WASTEWATER IRRIGATION ...........24
1.4.1. Definition .....................................................................................................................24
1.4.2. Conceptual framework .................................................................................................28
1.5. OUTLINE OF THE THESIS .......................................................................................................31
REFERENCES ...............................................................................................................................36
CHAPTER 2: WASTEWATER USE IN CROP PRODUCTION: IMPACT ON PRODUCTIVITY AND
POLICY IMPLICATIONS ..................................................................................................................38
2.1. ABSTRACT ............................................................................................................................39
REFERENCES ...............................................................................................................................40
CHAPTER 3: HEALTH IMPACT OF WASTEWATER USE IN CROP PRODUCTION IN PERI-URBAN
AREAS OF ADDIS ABABA: IMPLICATIONS FOR POLICY ................................................................43
3.1. ABSTRACT ............................................................................................................................44
REFERENCES ...............................................................................................................................45
iv
CHAPTER 4: THE ECONOMIC VALUE OF WASTEWATER: A CONTINGENT VALUATION STUDY
IN ADDIS ABABA, ETHIOPIA ..........................................................................................................47
4.1. ABSTRACT ............................................................................................................................48
REFERENCES ...............................................................................................................................49
CHAPTER 5: SUMMARY AND CONCLUSIONS ....................................................................51
ANNEX: QUESTIONNAIRE ..............................................................................................................65
v
List of Figures
FIGURE 1: ADDIS ABABA CATCHMENTS AND WASTEWATER IRRIGATED AREAS ............................25
FIGURE 2: FRAMEWORK FOR ASSESSING IMPACTS OF WASTEWATER USE IN AGRICULTURE .............32
FIGURE 3: FRAMEWORK FOR VALUING IMPACTS OF WASTEWATER USE IN AGRICULTURE................32
List of Tables
TABLE 1.1: DISTRIBUTION OF SAMPLE SIZE BY QUALITY OF IRRIGATION WATER AND DISTRICTS ....23
vi
Executive Summary The general objective of this study was to analyze the impact of wastewater use in agriculture. It mainly focused on three aspects of wastewater use for irrigation and their policy implications: impact on crop production and productivity; its impact on the health of farmers; and the value attached to its safe use for irrigation. The main objectives of the study were, therefore, 1) to define the farming system of wastewater farmers and to analyze the impact of wastewater on crop productivity; 2) to analyze the prevalence of the actual health risks to farmers and estimate the health costs associated with the use of wastewater in irrigation; and 3) to estimate the farmer’s willingness to pay for improved or safe use of wastewater for crop production. This study used mainly primary data collected from a household survey conducted on 415 wastewater and freshwater farm households operating irrigated agricultural activities within and around Addis Ababa, a central region of Ethiopia. A Cobb Douglas production function is specified to analyze the impact of wastewater on crop productivity. The production function was estimated using a Censored Least Absolute Deviation (CLAD) econometric model. To analyze the health impact of wastewater, the probability of illness was estimated based on the theory of the utility maximizing behavior of households subject to the conventional farm household production model modified by adding a health production function. The economic value of safe use of wastewater is estimated from data obtained from a contingent valuation survey administered by in-person interviews. A dichotomous choice model is used to elicit the farmers’ willingness to pay. Bivariate probit and interval regression models are used to analyze the factors determining the farmers’ willingness to pay for safe use of wastewater for crop production. The study shows that the livelihoods of wastewater farm households depend on the wastewater farm. Income from a wastewater farm accounts for 62% of total annual household income, ranging from 27% to 97%. About 61% of the vegetable market of Addis Ababa, the capital city of Ethiopia with more than five million people, is produced from the wastewater farms. Leafy vegetables, which are eaten raw, are mainly produced in less polluted wastewater farms and root vegetables are produced in more polluted wastewater farms. The study revealed that wastewater farm households use significantly less doses of chemical fertilizer compared to the freshwater irrigators. However, they spend three times more on seed and five times more on farm labor. Net farm return per hectare of plots irrigated with wastewater is significantly higher than for plots irrigated with freshwater. The results also indicate that the predicted median output value per hectare is significantly higher in wastewater irrigated plots compared to plots irrigated with freshwater. The CLAD estimation result shows that higher productivity of wastewater plots is explained by investments in inputs (organic fertilizer, improved seed and agricultural extension services), ownership of plots and levels of pollution of the irrigation water. The overall effect of wastewater on crop productivity is negative and insignificant (compared to freshwater). Plots irrigated with less polluted wastewater are more productive than plots irrigated with more polluted wastewater. The implication of the result is that even if wastewater is a reliable source of irrigation water and contains essential plant nutrients such as NPK, the nutrient content exceeds the recommended level of the plant requirement (e.g. nitrogen) or it contains toxic elements (e.g. nickel, zinc) above the recommended limit, and thereby reduce yield. Due to unsafe wastewater irrigation systems, wastewater use in irrigation actually poses health risks to farmers. Apart from working on wastewater farms, different risk factors prevail that can
vii

cause wastewater-related diseases in the studied areas. This study shows that major risk factors causing illness are household demographic characteristics, hygienic behavior of farm families and poor access to sanitation services. Lack of awareness on health risk of wastewater as well as working without protective clothing on the farm are also important risk factors in the study area. The distribution of these risk factors varies between the wastewater and freshwater irrigation areas. The most common incidence of illness reported by farm households are intestinal infection due to hookworm and Ascaris, diarrhea and skin diseases, which also varies between the two groups of farmers as well as within the different areas of wastewater. The findings of this study show that the prevalence of illness is not only significantly higher in farmers working on wastewater farms compared to freshwater irrigators, but is also significantly higher in wastewater areas where the pollution level is higher. The probability of being sick with an intestinal illness is 15% higher for wastewater farmers than for freshwater farmers. Use of protective clothing during farm work and awareness of health risks in working on wastewater farms significantly reduce illness prevalence. In addition, hygienic behavior of farm families including eating safe raw vegetables, compound sweeping, and washing hands before a meal are important determinants of illness prevalence in wastewater irrigation areas. Therefore, use and provision of protective clothing at affordable prices, creating awareness for safe use of wastewater, and reducing the pollution level of irrigation water can significantly decrease the health risk of wastewater use in irrigation. While each of these policy interventions has a significant effect in reducing health risks, combining these measures will result in more significant reduction of health risks to farmers, and thereby maximize the benefit from the wastewater resource as a source of livelihood and vegetable supply to the residents of nearby cities. Farmers are willing to contribute money to improve the existing unsafe irrigation system. Two options were suggested by farmers to improve the existing situation: enforcing laws against polluters who discharge their wastewater without any kind of treatment, and awareness creation of safe use of wastewater for irrigation. Farmers are willing to pay for the improvement programs and there is a welfare gain to the society from safe use of wastewater for crop production. The benefit from irrigated-farming, membership to water users’ association, yield value, off-farm income and working on a wastewater farm all significantly determine the farmers’ probability of accepting offered bids for the improvement program. In addition to these variables, multi-purpose uses of irrigation water as well as education level determines the farmers’ willingness to pay. Irrigation method has no significant effect on the farmers’ willingness to pay, implying that introducing water saving and improved irrigation techniques has an important role in improving the situation without affecting the farmers’ willingness to pay. Overall, this study shows that wastewater is a means of livelihood for many poor households, but the existing use of wastewater for crop production actually causes health risks both to farmers and consumers. Farmers are willing to contribute to programs designed to improve the existing situation so that it is possible to maximize the livelihood benefit at minimum health risks. However, the results do not necessarily imply that the cost of improving the situation has to be borne by the farmers only. Although the study focuses on the central region of Ethiopia, most conclusions can have a wider application in other parts of the country and in many sub-Saharan African countries where wastewater is used for irrigation.
viii
Zusammenfassung Ziel der Studie ist es, die Auswirkungen von Abwassernutzung in der Landwirtschaft zu analysieren. Die Arbeit richtet ihren Focus dabei hauptsächlich auf drei Aspekte der Auswirkungen von Abwassernutzung: die Auswirkungen auf die Pflanzenproduktion und deren Produktivität, die Auswirkungen auf die Gesundheit der Landwirte, sowie auf den Wert einer sicheren Nutzung des Abwassers zur Bewässerung. Die spezifischen Ziele der Studie sind 1) die Abwasser nutzenden Anbausysteme zu definieren und die Auswirkungen der Abwassernutzung auf die Produktivität zu analysieren; 2) die Auswirkungen der Abwassernutzung auf die Gesundheitsrisiken der Landwirte zu analysieren und die dadurch anfallenden Kosten abzuschätzen; und 3) die Zahlungsbereitschaft der Landwirte für eine verbesserte oder sichere Nutzung von Abwässern in der Pflanzenproduktion abzuschätzen. Die Studie nutzt im Wesentlichen Primärdaten aus einer Haushaltserhebung von 415 landwirtschaftlichen Haushalten bei Addis Ababa (Zentral-Äthiopien), die Abwasser und Frischwasser zur Bewässerung verwenden. Eine Cobb-Douglas-Produktionsfunktion wurde spezifiziert, um die Auswirkungen der Abwassernutzung auf die Produktivität zu analysieren, sie wurde mit Hilfe eines ökonometrischen Censored Least Absolute Deviation (CLAD) Modells geschätzt. Um Auswirkungen auf die Gesundheit abzuschätzen, wurde die Wahrscheinlichkeit für eine Erkrankung unter Verwendung einer erweiterten Theorie des nutzenmaximierenden Haushalts durch eine Gesundheitsproduktionsfunktion geschätzt. Der ökonomische Wert der sichereren Nutzung von Abwässern wurde über eine Contingent Value-Analyse von Daten aus persönlichen Interviews geschätzt. Ein Double-Bounded Dichotomes Choice Modell wurde genutzt, um die Zahlungsbereitschaft der Landwirte festzustellen. Bivariate Probit- und Intervall-Regressionsmodelle wurde genutzt, um die Einflussfaktoren auf Zahlungsbereitschaft der Landwirte für eine sichere Nutzung von Abwässern zur Pflanzenproduktion zu ermitteln. Die Studie zeigt, dass das Haushaltseinkommen zu wesentlichen Teilen aus der Landwirtschaft stammt. Für die Haushalte, die Abwasser für die landwirtschaftliche Produktion nutzen, beträgt das aus landwirtschaftlichen Quellen stammende Einkommen ca. 61 % des Gesamteinkommens, mit einer Spannweite zwischen 27% und 97%. Ungefähr 61% des Gemüsemarktes von Addis Ababa, der Hauptstadt Äthiopiens mit mehr als 5 Millionen Einwohnern, werden durch Betriebe bereitgestellt, die Abwässer zur Pflanzenproduktion nutzen. Roh verzehrtes Blattgemüse wird im Gegensatz zu Wurzelgemüse meist in weniger mit Abwasser belasteten Gebieten angebaut. Die Studie ergab, dass Abwasser nutzende Betriebe signifikant geringere Mengen an chemischen Düngern nutzen als Betriebe, die mit Frischwasser bewässern. Jedoch geben sie drei Mal soviel Geld für Saatgut und fünf Mal soviel für Arbeitskräfte aus. Der Nettoertrag pro Hektar auf den mit Abwasser bewässerten Parzellen ist signifikant höher als auf Parzellen, die mit Frischwasser bewässert wurden. Die Ergebnisse zeigen ferner, dass auch der mit Hilfe des ökonometrischen Modells vorausgesagte mediane Ertragswert pro Hektar bei mit Abwässern bewässerten Parzellen signifikant höher ist als auf Parzellen, die mit Frischwasser bewässert wurden. Die Ergebnisse des CLAD-Modells zeigen, dass die höhere Produktivität der Abwässer-Parzellen mit dem Aufwand an Inputs (organischer Dünger, verbessertes Saatgut und landwirtschaftliche Beratungsdienste), mit den Besitzverhältnissen an den Parzellen und der Höhe der Verschmutzung des Wassers erklärt werden kann. Der Gesamteffekt von Abwasser auf die Produktivität ist negativ und nicht signifikant. Parzellen, die mit weniger verschmutztem Wasser bewässert werden sind produktiver als Parzellen mit stärker verschmutzem Abwasser. Daraus
ix
lässt sich folgern, dass, auch wenn das Abwasser wichtige Pflanzennährstoffe wie NPK enthält, diese die benötigte Menge jedoch übersteigen (z.B bei Stickstoff) oder, dass toxische Elemente (z.B. Nickel, Zink) oberhalb der empfohlenen Grenzen liegen, so dass das Pflanzenwachstum negativ beeinflusst wird und der Ertrag reduziert wird. Aufgrund gefährlicher Abwasser-Bewässerungssysteme verursacht Abwasser Gesundheitsrisiken für Landwirte. Abgesehen von der Tatsache, dass sie überhaupt auf solchen Betrieben arbeiten, zeigten sich verschiedene andere Risikofaktoren, die mit dem Abwasser zusammenhängende Krankheiten bewirken können. Die Studie zeigt, dass die Hauptrisikofaktoren die demographischen Charakteristika der Haushalte, das Hygieneverhalten der Familien und ein schlechter Zugang zu sanitären Einrichtungen sind. Zudem sind mangelndes Problembewusstsein sowie das Arbeiten ohne Schutzkleidung wichtige Einflussfaktoren im Untersuchungsgebiet. Die Verteilung dieser Faktoren variiert zwischen den Gebieten der Abwasser- und der Frischwassernutzung. Die am meisten auftretenden Erkrankungen sind die durch den Astaris- und den Hakenwurm verursachte intestinale Infektionen, Durchfall- und Hauterkrankungen, die wiederum zwischen den beiden Gruppen der Landwirte sowie den Abwassergebieten variieren. Die Studie zeigt, dass nicht nur Erkrankungen im Bereich abwassernutzender Areale häufiger sind, sondern dass die Zahl der Erkrankungen signifikant höher in Bereichen höherer Verschmutzung ist. Die Wahrscheinlichkeit an intestinalen Infektionen zu erkranken ist bei Abwassernutzern um 15% höher als bei Frischwassernutzern. Schutzkleidung und verbessertes Risikobewusstsein senken die Krankheitswahrscheinlichkeit signifikant. Zudem sind Hygieneverhalten, das Essen von sicherem rohen Gemüse, das Fegen bzw. Reinigen des Hof-Geländes, sowie das Waschen der Hände vor dem Essen, wichtige Determinanten des Gesundheitsrisikos in abwassernutzenden Gebieten. Daher können das Anbieten und Nutzen von erschwinglicher Schutzkleidung, ein verbessertes Risikobewusstsein sowie Maßnahmen zur Reduzierung der Verunreinigung von Bewässerungswasser das Gesundheitsrisiko signifikant verringern. Während schon jede der genannten Maßnahmen selbst eine signifikante Verbesserung darstellt, würde eine Kombination dieser Maßnahmen das Gesundheitsrisiko noch deutlicher reduzieren und somit den Nutzen der Abwasseressource als Quelle des Lebensunterhalts und der Gemüseversorgung für die Anwohner der nahegelegenen Städte verbessern. Die Landwirte äußerten bei der Befragung die Bereitschaft einen finanziellen Beitrag zu einer größeren Sicherheit der Bewässerungssysteme zu leisten. Zwei Optionen wurden von ihnen zur Verbesserung vorgeschlagen: Die vorgeschriebene Abwasserbehandlung durch die Verursacher, und das Schaffen von Bewusstsein für einen sicheren Umgang mit Abwasser. Die Zahlungsbereitschaft der Landwirte für eine sichere Abwassernutzung bedeutet, dass eine Steigerung der Wohlfahrt möglich wäre. Die Höhe des Nutzens aus der Bewässerungslandwirtschaft, die Mitgliedschaft in Wassernutzungsgemeinschaften, der Wert des Ertrages, das Einkommen außerhalb der Landwirtschaft und die Frage, ob es sich um einen Abwasser nutzenden Betrieben handelt bestimmen signifikant die Wahrscheinlichkeit der Annahme der angebotenen Programme durch die Landwirte. Zusätzlich zu diesen Variablen bestimmt die Frage der Mehrfachnutzung des Bewässerungswassers und der Ausbildungsgrad der Landwirte die Zahlungsbereitschaft. Zusammenfassend zeigt die Studie, dass die Nutzung von Abwasser für viele arme Haushalte bedeutend für den Lebensunterhalt ist, dass jedoch die gegenwärtige Abwassernutzung Gesundheitsrisiken für Landwirte und für Konsumenten birgt. Die Landwirte sind bereit, für
x

Programme zu bezahlen, die die Situation verbessern könnten, so dass es möglich wäre die Lebensbedingungen zu verbessern, bei verringertem Gesundheitsrisiko. Jedoch bedeuten die Ergebnisse nicht zwingend, dass die Kosten allein von den Landwirten getragen werden müssen. Obwohl sich die Studie auf Zentral-Äthiopien bezieht, können die meisten Erkenntnisse auf größere Teile des Landes und auf viele afrikanische Sub-Sahara Länder, in denen Abwasser zu Bewässerung genutzt wird, übertragen werden.
xi
List of abbreviations AAWSSA: Addis Ababa Water Supply and Sewerage Authority BOD: Biochemical Oxygen Demand COD: Chemical Oxygen Demand CLAD: Censored Least Absolute Deviation CSA: Central Statistical Agency of Ethiopia CV: Contingent Valuation CVM: Contingent Valuation Method DBDC: Double-bounded dichotomous choice DO: Dissolved Oxygen EEPA: Ethiopian Environmental Protection Agency ETB: Ethiopian Birr GDP: Gross Domestic Product IWMI: International Water Management Institute MM3: Million Cubic Meters MoFED: Ministry of Finance and Economic Development NPK: Nitrogen, Phosphorous, Potassium SBDC: Single-bounded dichotomous choice SS: Suspended Solids UNDP: United Nations Development Program WTP: Willingness to Pay WHO: World Health Organization WUA: Water Users’ Association
xii
CHAPTER 1: INTRODUCTION
1.1. Background Sub-Saharan African countries, in general and Ethiopia in particular, are facing major
challenges with regard to alleviating the persistent problem of poverty. Agriculture is the
backbone of the economies of these countries, yet it is rain-fed; hence, their people are
subject to frequent droughts. Ethiopia’s economy is dominated by subsistence
smallholder agriculture. The sector contributes the largest share to GDP, export trade,
earnings and employment. It accounts for 46.2% of the GDP, 85% of employment and
82.2% of the income from the export trade for 2003/4 (Ministry of Finance and
Economic Development (MoFED), 2006; Ethiopian Economic Association, 2005). Of
the total population of 77 million, 38.7% live below the poverty line in 2004/05 (MoFED
2006). The performance of Ethiopian agriculture is very low by any standard, which is
reflected in the low level of land and labor productivity. The fluctuation of the
performance of the Ethiopian economy is highly linked to the performance of the
agricultural sector. For instance, between 1999/2000 and 2003/04, the annual agricultural
growth rate has been negative for two years due to drought, during which the real GDP
growth was negative 3.3%. During the remaining three years the economy grew by
11.6% (MoFED, 2006). The differences in growth rate are mainly due to the high
dependence of agriculture on rainfall, which is erratic in nature. Therefore, there is a
pressing need for developing the potential of the country through irrigation.
The increase in population numbers and the high dependence of the economy on
agriculture contributes to increased demand and competition for limited water resources,
thus calling for more efficient management. In light of the growing scarcity and
13

competition for water resources, there are different options for developing and using
water for different uses including food production. The options include, among others,
rainwater harvesting, development of wetlands, use of surface water and ground water,
use of municipal wastewater, and desalination.
A large volume of wastewater is being generated as a result of high rates of urbanization
in developing countries. It is projected that 88% of the world population growth
(projected at one billion by 2015) will take place in cities, the majority of them in
developing countries (UNDP, 1998). This increase in population calls for increased water
use, which ensures wastewater because the depleted fraction of domestic and residential
water use is typically only 15–25% with the remainder returning as wastewater (Scott et
al., 2002). These growing populations are also connected with sewers that deliver largely
untreated wastewater. In most developing countries, wastewater is discharged to nearby
rivers and streams without any kind of treatment.
These rivers are used as source of irrigation water for crop production to feed the urban
population and serve as a livelihood asset for many farm families. It is estimated that
from 3.5 million to 20 million hectares of land are being irrigated with untreated and
semi-treated wastewater in approximately 50 developing countries (Hussain et al., 2002;
IWMI, 2006). The reasons for using wastewater in crop production vary from region to
region and are driven by multiple factors. These factors include water scarcity, reliability
of wastewater supply, lack of alternative water sources, livelihood and economic
dependence, proximity to markets, and nutrient value of the wastewater. Yet, the use of
wastewater in agriculture has both positive and negative impacts that are reflected
14
through crop production, public health, soil resource, groundwater, property value and
ecology (Hussein et al., 2002; Scott et al., 2002).
Evidence of the impact of wastewater on crop production indicates that wastewater is
used as a source of irrigation water both in arid and semi-arid regions as well as in areas
where rainfall is erratic both in terms of distribution and frequency. If crops are under
supplied with essential nutrients such as nitrogen, phosphorus and potassium, wastewater
irrigation serves as a supplementary nutrient and thereby increases crop yield, which in
turn increases returns from farming. It also decreases the need for artificial fertilizer and
reduces farmers’ input cost. On the other hand, yield can also be negatively affected if the
nutrient content of the wastewater is in excess of the plant requirement. This is because it
will add nutrients, dissolved solids and heavy metals, which can accumulate in the soil
over time if the wastewater is used for extended periods. This results in increased salinity
or alkalinity of the soil and water logging that destructs the soil structure and reduces soil
productivity, thereby affecting crop production. From an economic point of view,
Hussein et al. (2002) identified other impacts on soil resources including depreciation in
market value of land, the cost of additional nutrients and soil reclamation measures.
In relation to the negative impact of wastewater use on public health, it has been shown
that irrigation with untreated wastewater can represent a major threat to public health.
Wastewater contains microorganisms such as bacteria, viruses and parasites and thus
increases the exposure of farmers, consumers and neighboring communities to infectious
diseases (Shuval et al., 1986). The concentration of fecal coli forms and nematode eggs
in the wastewater are the two primary sources of waterborne infection that measure the
microbial quality of wastewater. The main concern for wastewater as a source of health
15
risks emanates from its connection to chronic, low-grade gastrointestinal diseases as well
as outbreaks of more acute diseases such as cholera and typhoid. The exposure route to
farmers is through working with wastewater and contaminated soil as well as through the
consumption of raw vegetables produced using the wastewater. For the urban population,
this occurs through the consumption of raw vegetables irrigated with the wastewater
(Fattal and Shuval, 1999). Furthermore, as wastewater is used to irrigate fodders for
livestock consumption, evidence shows that there is also a human health risk due to
heavy metal transmission from the consumption of milk produced from livestock fed with
fodder (Swarup et al., 1997).
The other important potential impact of wastewater is on the environment. This includes
impact on the quality of the soil, ground and surface water as well as the biodiversity of
contaminated water bodies. The impact on the groundwater is also reflected on human
health especially in areas where the water supply source from groundwater is located near
the contaminated water bodies or land. The wastewater drained from crop irrigation may
serve as a source of groundwater recharge and it is estimated that 50-70% of the
irrigation water may percolate to a groundwater aquifer and affect the groundwater
quality (Rashed et al., 1995). However, this impact depends on factors including depth of
the water table, soil drainage and extent of wastewater irrigation. The impact on
biodiversity is pronounced when the irrigation water or wastewater from the city is
drained to confined and small lakes and creates eutrophication that affects aquatic life
and reduces lake biodiversity. This ecological impact can be transformed into economic
impacts in so far as the lakes serve the community for fishing activities.
16
These economic, social and environmental potential benefits and costs of wastewater use
in irrigation vary from region to region and from community to community depending on
the volume and source of the wastewater, composition of the wastewater, degree of
treatment before use as well as its management at the farm level, including irrigation
techniques and crops grown. The new WHO guideline on water quality standards for
irrigation, which recognizes the Hyderabad declaration (http://www.ruaf.org/node/269),
suggests that countries should adapt the guideline to their own social, technical, economic
and environmental circumstances based on scientific information (WHO, 2006).
In general, the practice of wastewater use in irrigation is pervasive, but is largely
unregulated in low-income countries like Ethiopia, and the actual costs and benefits are
poorly understood. The challenge to the decision makers is how to maximize the benefit
from the wastewater resources while reducing health and environmental risks. In order to
propose realistic, effective, and sustainable management approaches, it is crucial to
understand the context-specific tradeoffs between the health of producers and consumers,
on the one hand, and wastewater irrigation benefits and farmers’ perceptions on the other.
This challenge raises the following policy questions: Should the traditional practice of
wastewater use in irrigation be banned? If ‘Yes’, what will be the fate of the poor farm
households who have based their survival on the wastewater and what will happen to the
source of the vegetables for the residences of the nearby city? If ‘No’, what will be the
health of the consumers and farmers? The other policy question is: Should it be treated
and to what level and at what cost? Overall, what should be the basis for policy
decisions? These policy questions should be answered so that policymakers can make
17
sound and scientific-based decisions on how to maximize the benefit from wastewater
resources while reducing health and environmental risks.
1.2. Objective and scope of the study
1.2.1. Objective The general objective of this study is to analyze the actual costs and benefits of
wastewater use in irrigation in Ethiopia so as to maximize the benefits of wastewater use
in crop production while reducing health risks to both farmers and consumers.
Specifically, the main objectives of the study are:
1. To analyze the economic costs and benefits of wastewater use in crop production,
its productivity impact, and define the farming system of the wastewater farmers
and compare with non-wastewater irrigators;
2. To analyze the prevalence of the actual health risks to farmers involved in
wastewater irrigation and contrast those risks with non-wastewater irrigators, and
to estimate the actual health cost associated with wastewater use for irrigation;
3. To estimate farmers’ willingness to pay for improved or safe use of wastewater
for crop production and analyze the factors that affect their willingness to pay;
4. Based on the findings, to draw some policy implications on how to maximize the
benefit from the wastewater resource at minimum health risks.
1.2.2. Scope of the study As discussed previously, the potential impacts of wastewater use in agriculture are
multidimensional and generally classified into socioeconomic, health and environmental
impacts. However, from an economic policy point of view, it is the actual (not the
potential) impact that should be valued. A comprehensive valuation of the benefits and
18
costs of the impacts in relation to these aspects is required to identify, assess and examine
the actual benefits and costs. The research questions pointed out previously are very
broad since the questions are directly related to at least four economic agents both from
the demand and supply side of wastewater. These are the farmers, consumers (or society
as whole), industries and the municipality or the environmental protection agency. Thus,
analysis of the actual impacts of wastewater use in irrigation should incorporate at least
these economic agents. First, from the demand side, the farmers are using the wastewater
for their survival due to absence of other livelihood means, and their objective is to
ensure food security for their family. Second, the residents of a nearby city or society as a
whole want to maximize the social gains from the use of wastewater for irrigation with
minimum health risks and environmental impacts. Since society acts as a consumer of
produce, it benefits from the supply of fresh vegetable produced using wastewater, while
at the same time, society acts as a supplier of wastewater by generating and disposing of
waste, polluting rivers and streams which are used for irrigation. Third, industries are a
supplier of wastewater by generating and discharging it into nearby rivers and streams
without any treatment, since their objective is to minimize production costs. Fourth, the
municipality or the environmental protection agency is responsible for formulating
policy, implementing, monitoring and enforcing rules and regulations so that the
residents of the city live in a healthy environment through efficient environmental
sanitation services without affecting downstream communities. Therefore, these four
economic agents should be taken into consideration when analyzing the impacts of
wastewater use for irrigation.
19
However, our study focuses on the demand side, specifically farmers, for the following
reasons. First, farmers, as producers, are more exposed to wastewater and to
contaminated soil. Second, as farmers are also consumers of produce, studying the
demand side has the advantage of identifying the actual impact of the wastewater that can
be considered as a minimum impact from wastewater both from the producer and
consumer side. Third, any decision made in relation to wastewater use not only directly
affects farmers (since their livelihood is highly linked to wastewater), it also affects the
consumers (both through availability of fresh vegetables and its health risks) as well as
the small business owners who are linked with the vegetable market of the wastewater
farms. As Buechler and Devi (2002) and Drechsel et al. (2002) noted, a key factor that
needs to be integrated in any future research on this area is the livelihood dimension of
the unplanned use and the associated benefits from the use of wastewater in irrigation.
Therefore, this study focuses on the livelihood aspects of farmers, their farming system,
its impact on crop production and productivity as well as health risks to farmers. The
study also examines the value of wastewater based on the farmers’ perception in
attempting to suggest options to improve the existing wastewater use system. Although
the main focus of the study is on the use of wastewater irrigation within and around
Addis Ababa, most conclusions of our study can have a wider application in other parts
of the country and in many urban and peri-urban areas of sub-Saharan African countries.
1.3. Data source, sampling and survey procedure
1.3.1. Data type and source The data used in this study is mainly primary data from a farm household survey
conducted in 2006. Information from the household survey was supplemented with
qualitative data obtained from focus group discussions and key informant interviews as
20
well as with secondary information from relevant institutions. The farm household survey
was conducted in both wastewater and freshwater irrigation areas. The focus group
discussion was held with few selected irrigators in each wastewater sample area. The key
informant interview was held with concerned professionals and officials in agriculture,
health, environmental protection offices and the Addis Ababa Water Supply and
Sewerage Authority (AAWSSA).
1.3.2. Sampling and Survey Procedures The household survey was conducted in three sub-cities of Addis Ababa and in one
administrative zone of the Oromiya regional state. The three sub-cities included in our
survey are Kolfe-Keraneo (Kolfe), Lafto-Nifas Silk (Lafto) and Akaki-Kaliti (Akaki-
Addis), all of which are under the administrative structure of the Addis Ababa city
municipality. Akaki-Oromiya and Ade’a districts are the other two study areas, which are
under the administrative zone of East Shoa of the Oromiya regional state. The location of
the different wastewater farm areas is shown in Figure 1. In the figure, the areas shown in
green dots are wastewater-irrigated areas. Eight districts were chosen to conduct the
household survey. Seven of the districts are from wastewater irrigation areas, and the
remaining one is from a freshwater irrigation area. All survey areas are located in the
central part of Ethiopia. The survey areas were selected because of the following reasons:
first, the quality of irrigation water, which farmers are using, substantially differs. The
first group of farmers is using wastewater for irrigation and the other group of farmers are
using freshwater. This enables us to conduct comparative analysis. Second, the areas are
located within the same basin called the Awash River basin and share similar agro-
ecological and climatic conditions. Third, the areas are located within a 40 kilometers
21
radius from the center of the capital city, such that the farmers have the same access to
market information and road infrastructure facilities.
To ensure homogeneity among farmers, the wastewater farmers are also divided into
different areas based on their location along the Akaki River, which is their source of
irrigation water. Accordingly, the Kolfe farm area is located upstream of the Akaki River;
the Lafto farm area is located in the middle-stream of the river; and Akaki-Addis and
Akaki-Oromiya areas are located downstream of the Akaki River. In freshwater irrigation
areas, we divided the farmers into two subgroups based on the source of irrigation water
and location. The first group of farmers is from the Godino and Goha irrigation areas and
is using government constructed dams diverted from the river, while the other area is the
Fultino farm areas, where farmers are using spring water for irrigation developed by the
government.
The total number of sample was determined by considering mainly the available budget
as well as the minimum number of sample size to conduct statistical analysis at least at
zonal or sub-city level. In addition, due consideration has also been given for possible
survey errors, outliers and missing values in determining the sample size. Thus, 415 farm
households operating irrigation in both wastewater and freshwater areas was included in
our survey. The distribution of the number of samples between the freshwater and
wastewater areas is determined based on a proportion-principle in that, first, information
on the total number of households engaged in irrigated-agricultural activities was
obtained from the respective agricultural office and, then, number of sample from
wastewater and freshwater farm areas is determined proportional to the total sample size.
That is, we first calculate the proportion of farm population in each irrigation areas over
22
the total population, and used this percentage to determine the sample size from each of
the wastewater and freshwater irrigation areas. This method ensures the provision of
equal chance of representing the farm population in the two farm groups. Accordingly,
from a total of 415 farm households, 175 are from freshwater areas and 240 are from
wastewater irrigation areas. We also followed similar criteria to determine the number of
samples to be included from each wastewater and freshwater irrigation sites. The
numbers of farmers in each sub cities were obtained from the respective agricultural
office, and the proportions of the farm households in each sub cities were calculated; and
we used the result to determine the number of farm households to be included in our
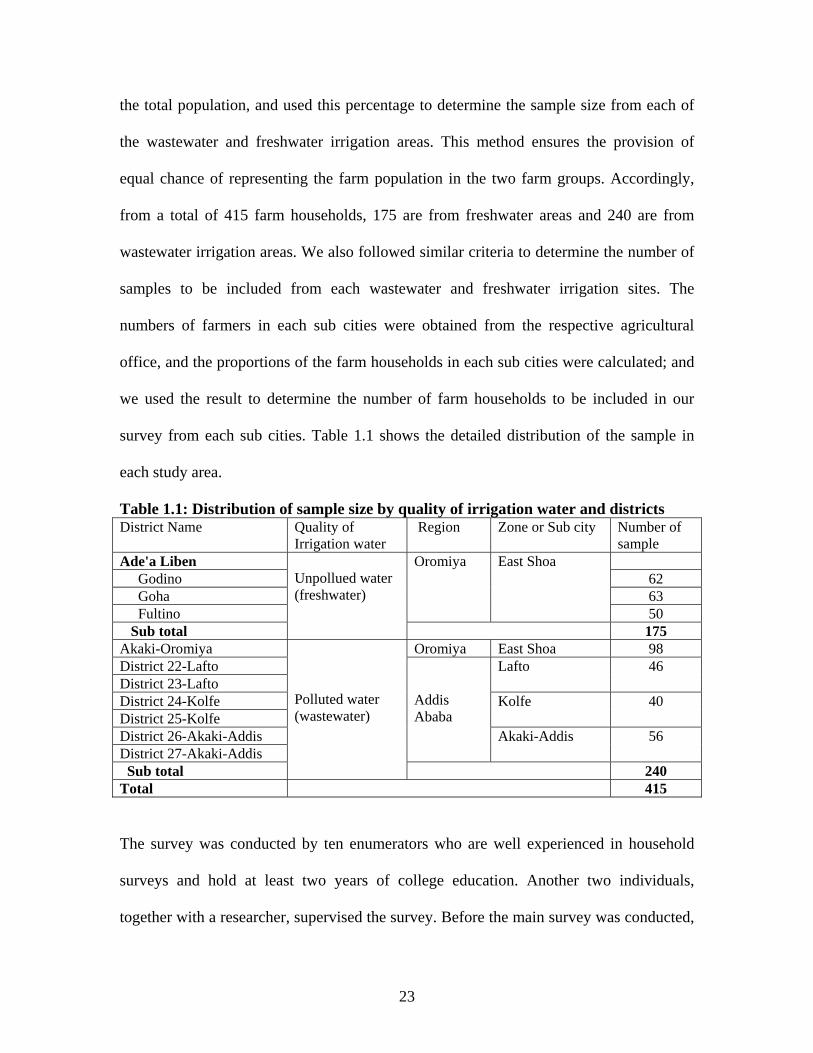
survey from each sub cities. Table 1.1 shows the detailed distribution of the sample in
each study area.
Table 1.1: Distribution of sample size by quality of irrigation water and districts District Name Quality of
Irrigation water Region Zone or Sub city Number of
sample Ade'a Liben Godino 62 Goha 63 Fultino
Oromiya East Shoa
50 Sub total
Unpollued water (freshwater)
175 Akaki-Oromiya Oromiya East Shoa 98 District 22-Lafto District 23-Lafto
Lafto 46
District 24-Kolfe District 25-Kolfe
Kolfe 40
District 26-Akaki-Addis District 27-Akaki-Addis
Addis Ababa Akaki-Addis 56
Sub total
Polluted water (wastewater)
240 Total 415
The survey was conducted by ten enumerators who are well experienced in household
surveys and hold at least two years of college education. Another two individuals,
together with a researcher, supervised the survey. Before the main survey was conducted,
23
the enumerators were given one day training on the details of the questionnaire. A pilot
survey was conducted on ten farm households from each area to check the questionnaire
in terms of the wordings, ordering, and to determine the length of time the interview
would take. The information gathered was classified into ten parts. The data provided
information on the socioeconomic characteristics of the farm households, the farming
system, irrigation water management, wastewater valuation, livestock ownership, income
and expenditure, off-farm employment and remittance, household assets and credit
access, food and non-food expenditures. The questionnaire is provided in an annex to this
dissertation.
1.4. General framework for analyzing the impact of wastewater irrigation
1.4.1. Definition
The aim of this section is to provide definitions for basic terminologies in the use of
wastewater in irrigation and present the conceptual framework for analyzing the impacts
of wastewater use in agriculture. This will ensure the understanding of wastewater use in
agriculture and its impact on agricultural productivity, livelihood, health and the
environment as well as solve the confusion that may arise in relation to terminologies in
wastewater. It will also help to clearly convey our aim, areas of focus and our study
findings to policy makers and to those who involved in such areas. Discussing the
terminology used in this book will also contribute to the worldwide effort being made to
estimate the extent of wastewater use in irrigation based on the experiences in different
countries.
24
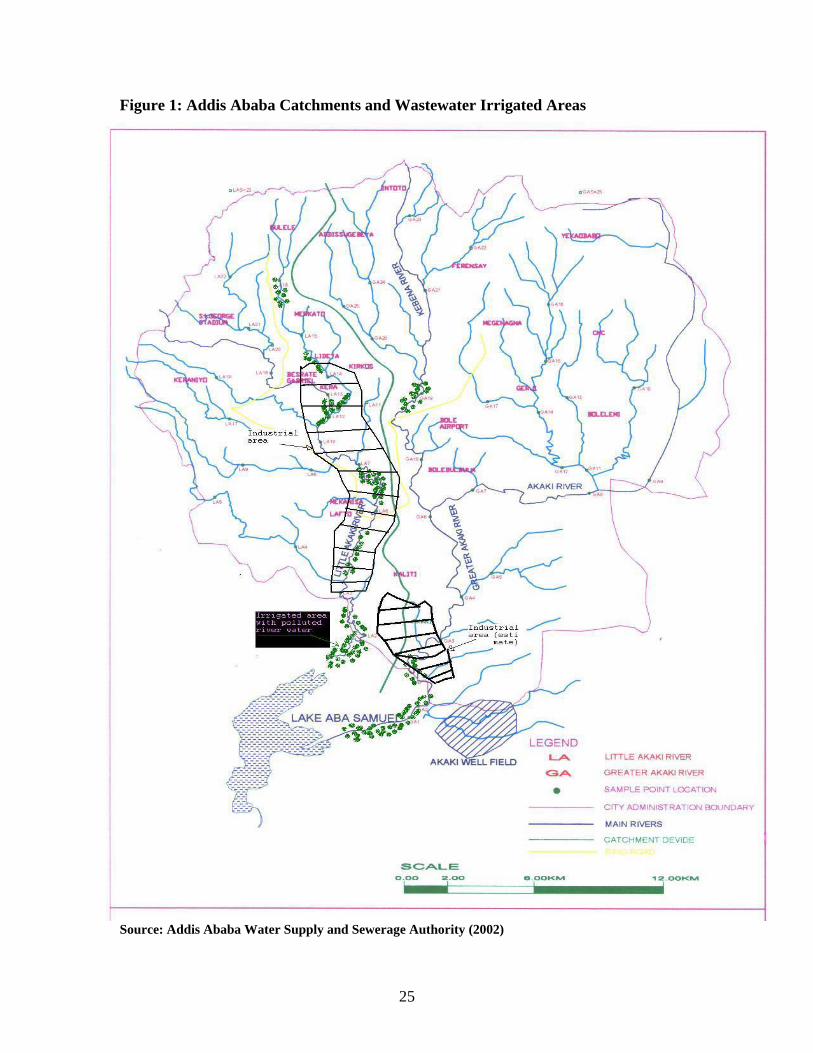
Figure 1: Addis Ababa Catchments and Wastewater Irrigated Areas
Source: Addis Ababa Water Supply and Sewerage Authority (2002)
25
Generally speaking, wastewater is made up of domestic and industrial wastewater.
Domestic wastewater contains effluents discharged from households, institutions and
commercial establishments. Industrial wastewater consists of effluents discharged from
manufacturing units. In this study, wastewater refers to domestic effluents (which
consists of black water (urine and excreta), grey water (kitchen and bathroom water),
wastewater from commercial establishments, hospitals, fuel stations, garages, and
industrial wastewaters as well as storm water and urban run-off. Interviews with experts
from the Addis Ababa water supply and sewerage authority show that, of the total
domestic wastewater production, 76% of the wastes come from households, and 10%
from commercial establishments and institutions. The rest comes from street sweeping,
hospitals and other sources. It is estimated that 31 million cubic meters of domestic
wastewater is being generated per year in the city of Addis Ababa. Wastewater from
manufacturing firms include wastes from food processing and beverages; textile,
clothing, tanning and leather factories; wood and wood products; paper, paper products
and printing; iron and steel factories; and chemical, rubber and plastic factories. Most of
the industries do not have treatment plants and discharge their wastewater without any
kind of treatment, and thus are a source of wastewater in the study areas. The quantity of
wastewater produced from these industries is estimated to be about five million cubic
meters per year (Ethiopian Environmental Protection Agency (EEPA), 2005).
The composition of wastewater also determines the level of impact of its use in
agriculture. The composition differs from region to region and from community to
community. All wastewater is generally composed of organic matter, i.e., nutrients such
as nitrogen, phosphorous, potassium, etc; and inorganic matter (dissolved minerals), toxic
26
chemicals and pathogens. In our study area, domestic wastewater is composed of mainly
organic matter from household wastes and wastes from commercial establishments.
Industrial wastewater varies depending on the raw materials used by each industry, but it
generally includes heavy metals, inorganic and organic substances. The most common
chemicals found in wastewater of the study area are biochemical oxygen demand (BOD),
chemical oxygen demand (COD), ammonia (NH3), nitrate (NO3), phosphate, suspended
solids (SS), and dissolved oxygen (DO). Heavy metals found in wastewater include
cadmium, chromium, lead, nickel, zinc, copper, iron and manganese. These also contain
large quantities of bacteria including coli forms and E. coli (EEPA, 2003).
According to Van der Hoek (2002), the distinctions among three types of wastewater use
are more relevant in ensuring a clear understanding of the subject matter. These include
direct use of untreated wastewater, direct use of treated wastewater, and indirect use of
wastewater. As defined in Van der Hoek, direct use of untreated wastewater is the
application of wastewater to farmland directly from sewer systems or other purpose-built
wastewater conveyance systems. The wastewater is directly taken from the sewage
system or from storm water drains. Direct use of treated wastewater is the use of treated
wastewater where control exists over the conveyance of the wastewater from the point of
discharge of a treatment plant to a controlled area where it is used for irrigation. Indirect
use of wastewater is the planned application of wastewater to farmland from a receiving
water body in the absence of any control over the use of the wastewater for irrigation. In
our study area, the last category of wastewater use is more common. In the study area,
only less than 1% of the populations of Addis Ababa are connected with the sewer lines
of the city that has been constructed long time ago. As a result, domestic and industrial
27
wastes are discharged into the river passing through the center of the city. Many farmers
are extracting water from this river for irrigation purposes and convey the wastewater
using traditionally diverted canals and motor pumps. There is no control over its use
either for irrigation or domestic purposes.
The other concept that should be made clear at the outset, is the term ‘reuse’ or ‘use’ of
wastewater and ‘formal’ and ‘informal’ wastewater irrigation. Wastewater reuse implies
that wastewater is used for a second time, whereas wastewater use is the use of the
wastewater only once. In our study area, farmers are using the wastewater only once, thus
we used the term wastewater ‘use.’ The other terminologies that usually cause confusion
in irrigation literature are the terms ‘formal’ and ‘informal’ use of (waste)water. Formal
use of irrigation (waste)water refers to the presence of an irrigation infrastructure or to a
certain level of permission and control by a state agency. Whereas ‘informal’ use of
wastewater refers to the use of the wastewater in many scattered points and is not
controlled by a state agency. In the latter case, basic irrigation infrastructures are
traditionally constructed by the farmers themselves without state intervention. In our
study area, farmers are using wastewater without the formal recognition of the local state
agency and irrigation infrastructures are traditionally constructed by farmers and water is
extracted from the source either through gravitational force or private- or community-
owned motor pumps. Therefore, the wastewater irrigation system of the study area is
categorized as an ‘informal’ irrigation system.
1.4.2. Conceptual framework
As mentioned previously, the impact of wastewater use in agriculture is multifaceted, and
thus, a comprehensive cost-benefit analysis based on a holistic approach is required.
28
Towards analyzing the impacts of wastewater use in agriculture through a holistic
approach, Hussain et al. (2001) developed a conceptual framework for analyzing the
socioeconomic, health and environmental impacts. In this study we adopted this
framework, and are shown in Figures 2 and 3. Figure 2 conceptualizes the method for
assessing the impacts. The framework suggested that the first step is to identify and
classify the different impacts of wastewater use in irrigation. The impacts can be
identified as economic, social, environmental or other impacts, and are classified into
positive and negative impacts. Both the direct and indirect impacts should be considered
in classifying the impacts. After identifying all relevant impacts, the next step is to
identify indicators or variables to quantify them in physical terms where possible. Since
the aim of the analysis is to single out only the impacts that are clearly associated with
wastewater irrigation and not include those impacts or changes that would have occurred
even without wastewater irrigation, the framework could be developed for two scenarios:
with wastewater irrigation and without wastewater irrigation. Thus, the impacts could be
measured as the difference between the scenarios “with” and “without” the wastewater
irrigation. Once the impacts of wastewater irrigation are quantified, the next step is to
value them in monetary terms where possible.
Public policy decision-making often involves balancing the costs of a policy with its
benefits. When a policy affects goods and services traded in normal markets, costs and
benefits result from consumer responses to changes in prices faced and incomes received.
On the other hand, when a policy affects the availability of characteristics of public
goods, one does not observe price and income changes, and thus must enter the changes
in consumer behavior by using more roundabout methods (Mitchell and Carson, 1989).
29
Therefore, in measuring benefits and costs of impacts, market prices are used wherever
they exist to compare costs and benefits of wastewater irrigation for the different
scenarios. Yet, because of market imperfection, market prices are distorted and may not
reflect the true value of the impact. In this case, the use of shadow prices is
recommended. Where market prices do not exist, non-market valuation techniques are
used to value the impacts. Where monetary valuation is not possible, or impractical, non-
monetary value indicators or qualitative indicators need to be developed. However,
qualitative indicators may not be particularly useful for determining whether the
economic benefits of wastewater use in crop production exceeds costs in quantitative
terms, but may be useful to compare similar impacts across the different scenarios. Figure
3 shows the conceptual framework for valuing the impacts. In valuing the health impact,
for example, there could be potential risk of disease or mortality (with extreme cases)
with wastewater irrigation. Illness caused by wastewater may result in loss of potential
earnings, medical cost or inconvenience cost such as leisure and sleeping disturbances.
Loss of potential earnings or labor productivity can be evaluated using an opportunity
cost principle. These losses can be quantified in economic terms using information on
prevalence of illness, daily wage and incidence of disease. Similarly, impact on crop
production can be valued from a change in productivity or using econometrically
estimated production functions. In the latter case, output is modeled as a function of
major inputs such as fertilizer, seed, labor and wastewater, and the marginal value
estimate of the wastewater is derived from the estimated model. The major issues in
valuing impacts for cost-benefit analysis of wastewater irrigation involve how to
conceptualize and estimate the total value of the impacts in a consistent manner and how
30

to integrate various value measures to generate a single representative measure that may
be used for policy analysis. As it is clear from the two figures, there is no single method
or model that can be readily adopted to assess and value the costs and benefits of
wastewater irrigation. A range of models or methods can be used to analyze the impact of
wastewater use in agriculture.
1.5. Outline of the thesis In addition to the introductory chapter, this dissertation has three major parts. The first
part deals with ‘The impact of wastewater on farm production and productivity.’ The
second part of the dissertation concerns ‘The actual health risks of wastewater use in
agriculture;’ and the third part is on ‘Value of wastewater use in irrigation.’ These three
different, but related, parts are presented in separate chapters, which are organized as
follows.
In Chapter Two, the impact of wastewater on crop production and productivity is
analyzed. This chapter mainly deals with the impact of wastewater on crop productivity
and describes the farming system of wastewater farmers, i.e. it focuses on objective
number one. Specifically, it investigates the costs and benefits of wastewater use in
vegetable production under the ‘with and without’ scenario. The chapter also describes
the farming system of the irrigators and measures the share of wastewater farm income
out of the total annual household income. The chapter also determines the factors
influencing crop productivity. Accordingly, the chapter is divided into six sections. The
first section introduces the chapter, wherein some background on the potential benefits
and costs of wastewater resource use in crop production, and the specific objectives and
organization of the chapter will be discussed. The second section describes the study area
31
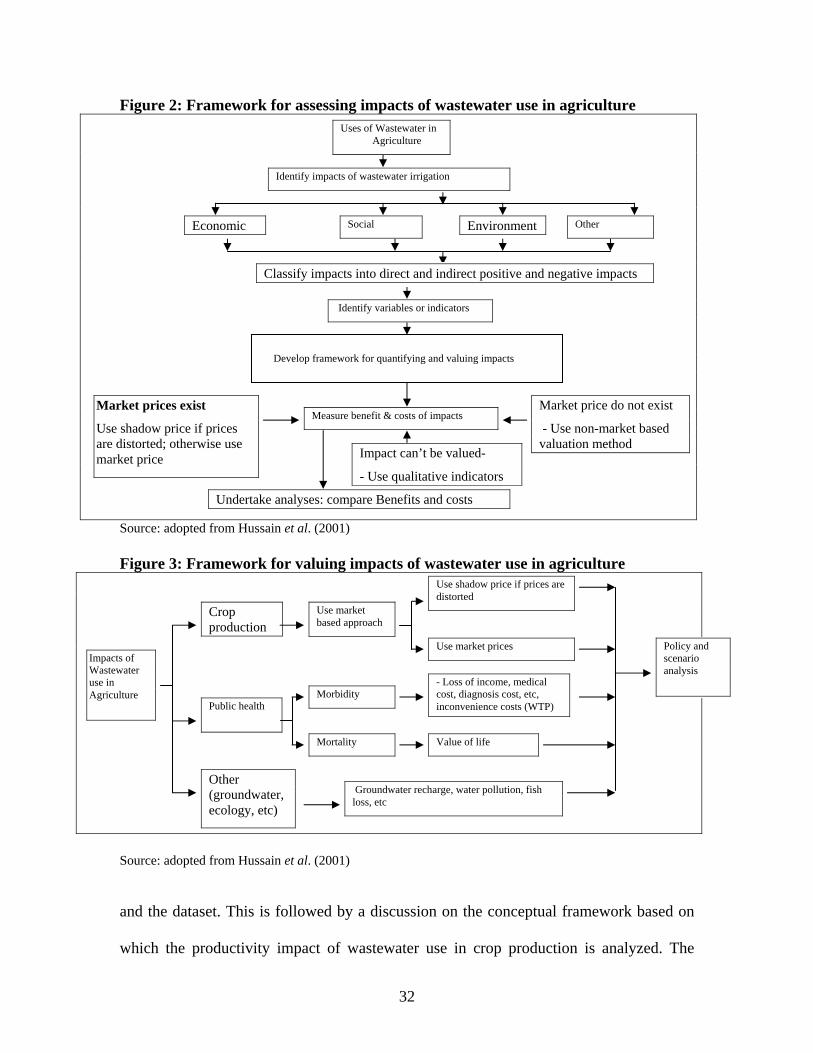
Figure 2: Framework for assessing impacts of wastewater use in agriculture
Uses of Wastewater in Agriculture
Identify impacts of wastewater irrigation
Source: adopted from Hussain et al. (2001) Figure 3: Framework for valuing impacts of wastewater use in agriculture
Economic Social Environment
Identify variables or indicators
Measure benefit & costs of impacts Market prices exist
Use shadow price if prices are distorted; otherwise use market price
Market price do not exist
- Use non-market based valuation method
Impact can’t be valued-
- Use qualitative indicators
Undertake analyses: compare Benefits and costs
Develop framework for quantifying and valuing impacts
Crop production
Public health
Other (groundwater, ecology, etc)
Impacts of Wastewater use in Agriculture
Use market based approach
Use shadow price if prices are distorted
Use market prices
Morbidity
Mortality
- Loss of income, medical cost, diagnosis cost, etc, inconvenience costs (WTP)
Value of life
Groundwater recharge, water pollution, fish loss, etc
Classify impacts into direct and indirect positive and negative impacts
Other
Policy and scenario analysis
Source: adopted from Hussain et al. (2001)
and the dataset. This is followed by a discussion on the conceptual framework based on
which the productivity impact of wastewater use in crop production is analyzed. The
32
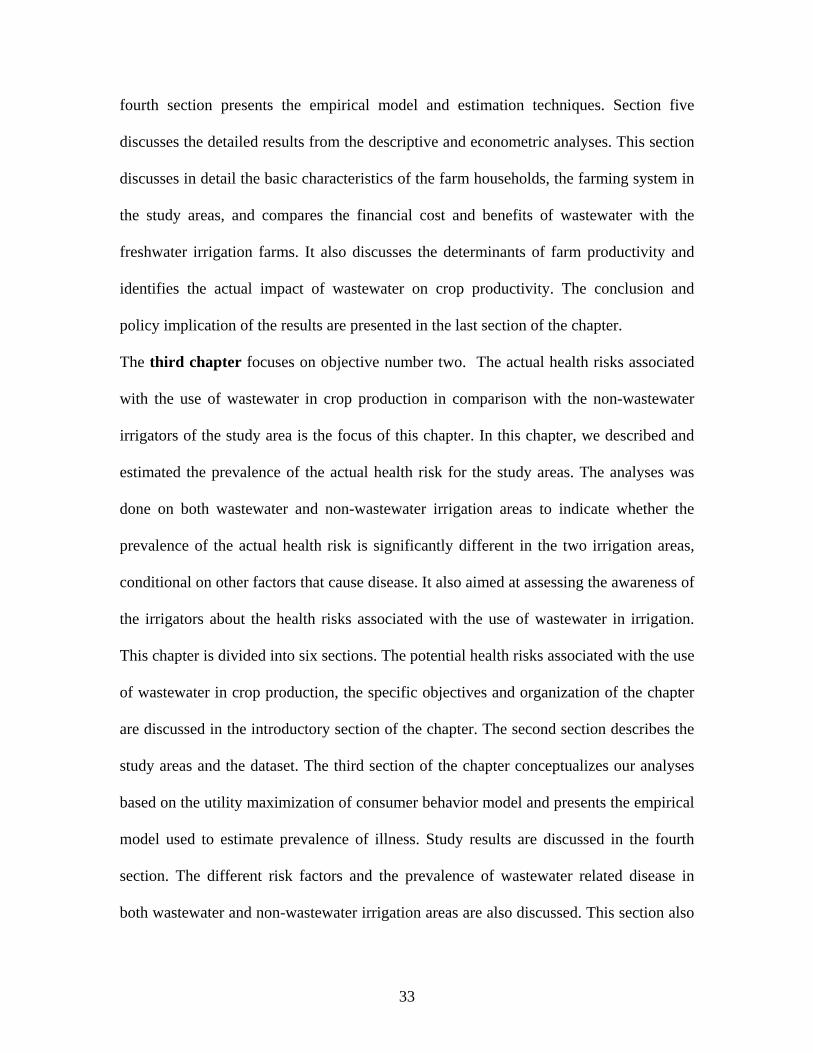
fourth section presents the empirical model and estimation techniques. Section five
discusses the detailed results from the descriptive and econometric analyses. This section
discusses in detail the basic characteristics of the farm households, the farming system in
the study areas, and compares the financial cost and benefits of wastewater with the
freshwater irrigation farms. It also discusses the determinants of farm productivity and
identifies the actual impact of wastewater on crop productivity. The conclusion and
policy implication of the results are presented in the last section of the chapter.
The third chapter focuses on objective number two. The actual health risks associated
with the use of wastewater in crop production in comparison with the non-wastewater
irrigators of the study area is the focus of this chapter. In this chapter, we described and
estimated the prevalence of the actual health risk for the study areas. The analyses was
done on both wastewater and non-wastewater irrigation areas to indicate whether the
prevalence of the actual health risk is significantly different in the two irrigation areas,
conditional on other factors that cause disease. It also aimed at assessing the awareness of
the irrigators about the health risks associated with the use of wastewater in irrigation.
This chapter is divided into six sections. The potential health risks associated with the use
of wastewater in crop production, the specific objectives and organization of the chapter
are discussed in the introductory section of the chapter. The second section describes the
study areas and the dataset. The third section of the chapter conceptualizes our analyses
based on the utility maximization of consumer behavior model and presents the empirical
model used to estimate prevalence of illness. Study results are discussed in the fourth
section. The different risk factors and the prevalence of wastewater related disease in
both wastewater and non-wastewater irrigation areas are also discussed. This section also
33
identifies the factors that significantly determine the prevalence of diseases and estimate
the actual health impact of wastewater use in irrigation. Conclusion and policy
implications of the study results are presented in the last section of the chapter.
Chapter Four deals with the economic value of safe use of wastewater in crop
production. The willingness to pay of farm households for improved wastewater use in
crop production, and its determinants are analyzed in this chapter using information
generated from a contingent valuation survey. The chapter investigates farmers’
perception towards minimizing the health risk from the use of wastewater for irrigation
and the contribution they can make to improve the existing unsafe use of the wastewater.
The value of the wastewater resource is also compared with the value of freshwater based
on the farmers’ perception. Hence, the chapter is divided into five sections. The first
section is an introduction to the chapter, and discusses some background information of
the study and its justification, the specific objectives and organization of the chapter.
The second section describes the methodological approach of this study and lays out the
challenges for the application of the CVM in the context of Ethiopia followed by a brief
description of the study area for this survey. Section 3 presents the survey design of the
actual CVM survey carried out in and around Addis Ababa. Section 4 lays out the
empirical model used for data analysis. Section 5 discusses the result from the descriptive
and econometric analysis, and estimates the welfare gain from safe use of wastewater for
irrigation. This section discusses the existing wastewater irrigation system, the options to
improve the situation and the contribution wastewater farmers can make. The willingness
to pay of farmers for the improvement program and the factors determining their
willingness to pay are identified and analyzed in this section. The total welfare gain from
34
improved use of wastewater for irrigation is also discussed in this section. Section five
also presents the robustness of our CV survey results. The last section presents a
summary and conclusion.
In Chapter Five, a summary of the results of the different parts of the thesis are
assimilated and discussed. Based on the findings of the different parts of the study,
general conclusions and policy implications as well as suggestions for future research are
presented.
35
References Addis Ababa Water and Sewerage Authority (2002), ‘Wastewater Master plan Main Report’,
Volume 3, Addis Ababa, Ethiopia. Buechler, S. and Devi, G (2002), ‘Livelihoods and wastewater irrigated agriculture along the
Musi River in Hyderabad city, Andhra Pradesh, India’, Urban Agriculture Magazine 8, 14-7.
Drechsel, P., U.J. Blumenthal and B.Keraita (2002), ‘Balancing Health and Livelihoods: Adjusting Wastewater Irrigation Guidelines for Resource-Poor Countries’, Urban Agricultural Magazine 8:7-9.
Ethiopian Environmental Protection Authority (2003), ‘Standards for Industrial Pollution Control in Ethiopia’, prepared by The Environmental Protection Authority and The United Nations Industrial Development Organization under the Ecologically Sustainable Industrial Development (ESID) Project, Addis Ababa, Ethiopia
Ethiopian Environmental Protection Authority (2005), ‘Review of the Status of Akaki River Water Pollution (first draft): Document prepared as part I of the Akaki River Management Strategic Implementation Plan for 2005-2010’, Federal Environmental Protection Authority, Addis Ababa.
Ethiopian Economic Association (2005), ‘Transformation of the Ethiopian Agriculture: Potentials, Constraints and Suggested Intervention Measures’, Report on the Ethiopian Economy Vol. IV, 2004/05, Addis Ababa, Ethiopia.
Fatal, B. and Shuval, H (1999), ‘A risk assessment method for evaluating microbiological guidelines and standard for reuse of wastewater in agriculture’, Paper presented at WHO meeting Harmonized Risk Assessment for water Related Microbiological Hazards, Stockholm, Sweden, 12-16 September 1999, pp 1-10.
Hussain, I; L.Raschid; M.A. Hanjra; F. Marikar; and W. van der Hoek (2001), ‘A Framework for Analysing Socio-economic, Health and Environmental Impact of Wastewater Use in Agriculture in Developing Countries’, Working Paper 26, Colombo, Sri Lanka: International Water Management Institute (IWMI).
Hussain, I; L.Raschid; M.A. Hanjra; F. Marikar; and W. van der Hoek (2002), ‘Wastewater use in Agriculture: Review of Impacts and Methodological Issues in Valuing Impacts (With an Extended List if Bibliographical References)’, Working Paper 37 Colombo, Sri Lanka: International Water Management Institute.
IWMI (2006), ‘Water Briefing No. 17: Recycling Realities: Managing Health Risks to Make Wastewater an Asset’, www.iwmi.cgiar.org/waterpolicy briefing/files/wpb17.pdf (accessed 14/04/2007)
Ministry of Finance and Economic Development (2006), ‘A Plan for Accelerated and Sustained Development to End Poverty (PASDEP) 2005/06-2009/10’, Vol. 1: Main Text, Addis Ababa.
Mitchell, R. C. and Carson, R. T. (1989), Using Surveys to Value Public Goods: The Contingent Valuation Method, Washington, D.C: Resources for the Future.
Rashed M.; S.R.Award; M.A.Salam; and E.Smidt, (1995), ‘Monitoring of groundwater in Gabal el Asfar wastewater irrigated area (greater Cairo)’, Water Science and Technology. 32(11), 163-169.
Resource Center on Urban Agriculture and Food Security (RUAF), ‘The Hyderabad Declaration’, http://www.ruaf.org/node/269 (accessed 9/22/2005).
36
Scott C.A, Faruqui N.I. and Raschid-Sally L. (Ed), Wastewater Use in Irrigated Agriculture: Confronting the livelihood and environmental Realities, International Water Management Institute (IWMI) and the International Development Research Center (IDRC) publication.
Shuval, H.I.; A.A. Adin; B. Fattel; E. Rawitz; and Yeutiel (1986), ‘Wastewater Irrigation in Developing Countries: Health Effects and Technical Solutions’, Technical Paper No.51, the World Bank, Washington D.C.
Swarup, D, Dwivedi, S.K and Dey, S (1997), ‘Lead and Cadmium levels in blood and milk of cows from Kanpur city’, Indian Journal of Animal Sciences 67(3), 222-223.
UNDP (United Nations Development Program) (1998), Global Human Development Report 1998. Oxford University Press, New York.
Van der Hoek, W.; M. U. Hassan; J.H.J. Ensink; S. Feenstra; L.Raschid-Sally; S.Munir; R. Aslam; N.Ali; R.Hussain and Y.Matsuno (2002). Urban Wastewater: A Valuable Resource for Agriculture. A Case Study from Harnoonbad, Pakistan. Research Report 63, Colombo, Sri Lanka: International Water Management Institute.
World Health Organization (WHO) (2006), ‘Guidelines for the Safe Use of Wastewater, excreta and Grey Water: Wastewater Use in Agriculture, Vol 2, in press: www.who.int/water_sanitation_health/wastewater/en/ (accessed 15/04/2007).
37
CHAPTER 2: Wastewater Use in Crop Production: Impact on Productivity and Policy Implications
Submitted to Agricultural Economics
Weldesilassie, Alebela; Eline Boeleeb and Stephan Dabbertc
a Institute of Farm Management (410A), Department of Production Theory and Resource Economics, Hohenheim University; e-mail: [email protected] ; 70593, Stuttgart, Germany. b International Water Management Institute (IWMI), email: [email protected] ; International Livestock Research Institute (ILRI), P.o.box 5689, Addis Ababa, Ethiopia c Institute of Farm Management (410A) , Department of Production Theory and Resource Economics, Hohenheim University, email: [email protected]; 70593, Stuttgart, Germany.
38
2.1. Abstract The main objective of this study is to analyze the productivity impact of wastewater use
in Ethiopian crop production using recently collected household data. A Cobb Douglas
production function is specified to identify the determinants of crop productivity. The
incremental productivity gain from the wastewater is obtained from the predicted yield
value per hectare using censored least absolute deviation (CLAD). The results revealed
that predicted yield value per hectare is significantly higher in wastewater-irrigated plots
than in plots irrigated with freshwater. While pollution levels and irrigation with
wastewater for an extended period reduces crop productivity, investments in farm inputs
and plot ownership increase productivity. To prevent the increase in pollution, and
thereby reduce the negative effect on crop productivity, incentive-based policies should
be sought for controlling the discharge of industrial and domestic waste into the river,
which presently serves as a sink for wastes from Ethiopian cities.
Key words: wastewater; irrigation; productivity; Censored Least Absolute Deviation; Ethiopia
39
References Addis Ababa Master Plan Project Office, 2002. Addis Ababa master plan final report:
executive summary. Addis Ababa City Administration Office, Addis Ababa. Ajmal, M. and A.U. Khan, 1985. Effect of textile factory effluents on soil and crop plants.
Environ. Pollution. 37, 131-148. Ali, I., 1987. Wastewater criteria for irrigation in arid regions. J. Irrig. and Drainage Engin.
113 (2), 173-183. Amemiya, Takeshi, 1984. Tobit Models: A survey. J. Economet. 24, 3-61. Arega Demelash Alene, Rashid M. Hassan, and Mulat Demeke, 2003. The technical,
allocative and economic efficiency of maize production under improved technology in Bako Area of Western Oromiya: A stochastic Efficiency Decomposition approach, in Mulat Demeke, Alemu Mekonen, Asefa Admassie and Dejene Aredo, eds., proceedings of the national workshop on technological progress in Ethiopian agriculture Nov. 29-30, 2001, Addis Ababa, Ethiopia, pp107-134.
Asefa Admassie and Franz Heidhues. 1996. Estimation of technical efficiency of smallholder farmers in the central highlands of Ethiopia. Ethiop. J. Agric. Econ. 1(1), 19-37.
Blundell, Richard and Powell, J.L., 2007. Censored regression quintiles with endogenous regressors. J. Economet. 141, 65-83.
Bond W.J, 1999. Effluent irrigation- an environmental challenge for soil science. Aust. J. Soil and Research. No 4, 543(13).
Buchinsky, M. and Hahn, J., 1998. An alternative estimator for the censored quintile regression model. Econometrica. 66(3), 653-671.
Chay, K.Y. and Powell, J.L., 2001. Semi-parametric censored regression models. J. Econ. Perspect. 15, 29-42.
Chernozhukov, Victor and Hansen, Christian, 2008. Instrumental variable quantile regression: A robust inference approach. J. Economet. 142, 379-398.
Christensen, L.R., Jorgenson, D.W., and Lau, L.J., 1975. Transcendental Logarithmic Utility Functions. Amer. Econ. Rev. 65(3), 367-383.
Croppenstedt and Abbi Mamo, 1996. An analysis of the extent and cause of the technical efficiency of farmers growing cereals in Ethiopia: Evidence from three regions. Ethiop. J. Econ. vol. 5(1), 39-61.
Day, A.D.; and T.C. Tucker, 1977. Effects of treated wastewater on growth, fibre, protein and amino acid content of Sorghum grains. J. Environ. Quality. 6(3), 325-327.
Ensink, J.H.J.; W.van der Hoek; Y.Matsuno; S.Munir; and M.R. Aslan, 2002. Use of untreated wastewater in peri-urban agriculture in Pakistan: risks and opportunities. Research Report 64, Colombo, Sri Lanka: International Water Management Institute
Environmental Protection Authority, 2003. Standards for industrial pollution control in Ethiopia. prepared by The Environmental Protection Authority and The United Nations Industrial Development Organization under the Ecologically Sustainable Industrial Development (ESID) project, Addis Ababa, Ethiopia
Green, W.H., 2000. Econometric Analysis. 4th edition Prentice Hall. Hussain, I; L.Raschid; M.A. Hanjra; F. Marikar; and W. van der Hoek, 2001. A framework
for analysing socio-economic, health and environmental impact of wastewater use in agriculture in developing countries. Working Paper 26, Colombo, Sri Lanka: International Water Management Institute (IWMI).
40
Hussain, I; L.Raschid; M.A. Hanjra; F. Marikar; and W. van der Hoek, 2002. Wastewater use in agriculture: Review of impacts and methodological issues in valuing impacts (With an extended list if bibliographical references). Working Paper 37 Colombo, Sri Lanka: International Water Management Institute.
Hussain, I.; Marikar, F. and Jehangir, W., 2000. Productivity and performance of irrigated wheat farms across canal commands in the lower Indus Basin. Colombo, Sri Lanka: International Water Management Institute (IWMI research report 44).
IWMI (International Water Management Institute), 2006.Water Briefing No. 17: Recycling Realities: Managing Health Risks to Make Wastewater an Asset. www.iwmi.cgiar.org/waterpolicy briefing/files/wpb17.pdf
Khanna, Madhu, 2001. Sequential adoption of site-Specific technologies and its implications for nitrogen productivity: A double selectivity model. Am. J. of Agric. Econ. 83(1), 35-51.
Kijne, J.W.; S.A.Parthaper; M.C:S. Sahrawat, 1998. How to manage salinity in irrigated land: A selective review with particular references to irrigation in developing countries. SWIM paper 2, International water management Institute, Colombo, Sri Lnka.
Lau, L.J., 1986. Functional forms in econometric model building, in Z.Griliches and M.D. Intriligator, eds., Handbook of Economet. Vol. 3, Amsterdam, Oxford and Tokyo: Elsevier Science BV, 1515-1566.
Lee, L.F., 1978. Unionism and wage rates: A simultaneous equations model with qualitative and limited dependent variables. Inter. Econ. Rev. 19, 415-433.
Liqa Raschid-Sally, Wim Van der Hoek and Mala Ranawaka, (eds.), 2001. Wastewater reuse in agriculture in Vietnam: water management, environment and human health aspects. Proceedings of a workshop held in Hanoi, Vietnam, 14 March 2001. IWMI working paper 30. Colombo, Sri Lanka: International Water Management Institute.
Mekonen Agaje, 2007. Suitability assessment of little Akaki River for irrigation. unpublished M.Sc., Department of Chemical Engineering, Addis Ababa University, Addis Ababa.
Maddala, G.S., 1983. Limited-Dependent and Qualitative Variables in Econometrics. Cambridge University Press.
Makombe Goddswill, Dawit Kelemework and Dejene Aredo, 2007. A comparative analysis of rainfed and irrigated agricultural production in Ethiopia. Irrigation drainage system.21, 35-44.
McBridge, M.B., 1995. Toxic metal accumulation from agricultural use of sludge: Are USEPA regulations protective. J. Environ. Quality. 24, 5-18.
Ministry of Finance and Economic Development, 2002. Development and poverty profile of Ethiopia. Welfare Monitoring Unit, Federal Democratic Republic of Ethiopia, Addis Ababa.
Mortvedt, J.J; and P.M.Giordano, 1975. Response of corn to Zinc and Aluminum in municipal wastes applied to soil. J. Environ. Quality. 4(2), 171-174.
Mulat D. and Bekele H., 2003. The determinants of yield of major cereals: The contribution of new technologies in selected villages of Ethiopia, in Mulat Demeke, Alemu Mekonen, Asefa Admassie and Dejene Aredo, eds., proceedings of the national workshop on technological progress in Ethiopian agriculture Nov. 29-30, 2001, Addis Ababa, Ethiopia, 87-106.
Nigussie, Tefera and Mulat Demeke, 2003. The productivity and profitability of wheat and teff technologies: Comparison between extension and non-extension plots in three
41
selected villages of Ethiopia, in Mulat Demeke, Alemu Mekonen, Asefa Admassie and Dejene Aredo, eds., proceedings of the national workshop on technological progress in Ethiopian agriculture Nov. 29-30, 2001, Addis Ababa, Ethiopia, 135-172.
Powell, J.L., 1984. Least absolute deviations estimation for the censored regression model. J. Economet. 25, 303-325.
Powell, J.L., 1986. Censored regression quintiles. J. Economet. 32, 143-155. Rashed M.; S.R.Award; M.A.Salam; and E.Smidt, 1995. Monitoring of groundwater in
Gabal el Asfar wastewater irrigated area (greater Cairo). Water Science and Technology. 32(11), 163-169.
Rebol, V.; M.Cerezo; A.Roig; V.Flors; L.Lapena; and P.Garcia-Agustin, 1999. Influences of wastewater Vs groundwater on young citrus trees. J. Science Food and Agric. 80(10), 1441-1446.
Scott C.A, Faruqui N.I. and Raschid-Sally L., (Ed.), 2002. Wastewater use in irrigated agriculture: confronting the livelihood and environmental realities. International Water Management Institute (IWMI) and the International Development Research Center (IDRC) publication.
Seyoum, E.T., G.E. Battese and E.M. Fleming, 1998. Technical efficiency and productivity of maize producers in eastern Ethiopia: A study of Farmers Within and Outside the Sasakawa Global 2000 Project. Agric. Econ. 19(3), 341-348.
Shahalam, A.; B.M.Abuzahra; and A.Jaradat, 1998. Wastewater irrigation effect on soil, crop and environment- a pilot scale study at Irbid, Jordan. Water, Air and Soil pollution. 106(3-4), 425-445.
Shuval, H.I.; A.A. Adin; B. Fattel; E. Rawitz; and Yeutiel, 1986. Wastewater irrigation in developing countries: Health effects and technical solutions. Technical Paper No.51, the World Bank, Washington D.C.
Sidle, R.C.; J.E. Hook; and L.T. Kardos, 1976. Heavy metal application and plant uptake in a land disposal system for wastewater. J. Environ. Quality. 5(1), 97-102.
Tassew Woldehanna, 2000. Economic analysis and policy implications of farm and off-farm employment: A case study in the Tigray Region of Northern Ethiopia. Unpublished PhD dissertation, Wageningen University, the Netherlands.
Tobin, J., 1958. Estimation of relationships for limited dependent variables. Econometrica. 26, 24-36.
Van de Hoek, W.; M. UI Hassan; J.H.J. Ensink; S. Feenstra; L.Raschid-Sally; S.Munir; R. Aslam; N.Ali; R.Hussain and Y.Matsuno, 2002. Urban wastewater: A valuable resource for agriculture. A case study from Harnoonbad, Pakistan. Research Report 63, Colombo, Sri Lanka: International Water Management Institute.
42
CHAPTER 3: Health Impact of Wastewater Use in Crop Production in Peri-urban Areas of Addis Ababa: Implications for Policy
Submitted to Environment and Development Economics
Weldesilassie, Alebela, Eline Boeleeb, Pay Drechselc and Stephan Dabbertd
a Institute of Farm Management (410A), Department of Production Theory and Resource Economics, Hohenheim University; e-mail: [email protected] ; 70593, Stuttgart, Germany. b International Water Management Institute (IWMI), email: [email protected] ; International Livestock Research Institute (ILRI), P.o.box 5689, Addis Ababa, Ethiopia c International Water Management Institute (IWMI) [email protected] d Institute of Farm Management (410A) , Department of Production Theory and Resource Economics, Hohenheim University, email: [email protected]; 70593, Stuttgart, Germany.
43
3.1. Abstract The practice of untreated wastewater use in agriculture is being discussed controversially due
to its negative health impacts. However, policy makers lack reliable information on the actual
health risks associated with wastewater use for crop production. Using data from household
surveys, this study employed comparative analysis to examine the actual health impacts, and
to evaluate the value of health damages, from such practices. The probability of illness was
estimated based on the theory of the utility-maximizing behavior of households subject to the
conventional farm household production model, modified by adding health production
function. The value of health damages for farmers was obtained from the predicted
probability of illness, and compared with the benefits of wastewater use in agriculture. Policy
options are suggested to minimize the health risks to farm workers associated with the use of
wastewater for crop production.
44
References Abadie A., Druckker D. and Imbens G.W. (2004), ‘Implementing Matching Estimators for
Average Treatment Effects in Stata’, The Stata Journal 4, Number 3, pp 290-311. Becker, G.S. (1965), ‘The theory of Allocation of Time’, Economic Journal 75: 493-517. Cifuentes, E; M.Gomez; U.Blumenthal; M.M.Tellez-Rojo; I.Romien; G.Ruiz-Polacios; Ruiz-
Velazco (2000), ‘Risk factors for Giardia Intestinalis in Agricultural Villages Practicing Irrigation in Mexico’, American Journal of Tropical Medicine and Hygiene 62(3): 388-392.
Dehejia R. H., and Wahba S. (February 2002), ‘Propensity Score-Matching Methods for Non Experimental Causal Studies’, The Review of Economics and Statistics, 84(1): 151-161.
Down, T.J.; E. Cifuentes-Garcia; and I.M. suffet (1999), ‘Risk Screening for Exposure to groundwater pollution in a wastewater irrigation district of the Mexico City region’, Environmental Health Perspectives. Jul. 107(7): 553-561.
Drechsel, P., S. Graefe, M. Sonou, O.O. Cofie (2006), ‘Informal irrigation in urban West Africa: An overview’,IWMI, Colombo, Research Report 102, www.iwmi.cgiar.org/pubs/pub102/RR102.pdf
Drechsel, P., U.J. Blumenthal and B.Keraita (2002), ‘Balancing Health and Livelihoods: Adjusting Wastewater Irrigation Guidelines for Resource-Poor Countries’, Urban Agricultural Magazine 8:7-9.
Environmental Protection Authority (2003), ‘Standards for Industrial Pollution Control in Ethiopia’, prepared by The Environmental Protection Authority and The United Nations Industrial Development Organization under the Ecologically Sustainable Industrial Development (ESID) Project, Addis Ababa, Ethiopia
Environmental Protection Authority (2005), ‘Review of the Status of Akaki River Water Pollution (first draft): Document prepared as part I of the Akaki River Management Strategic Implementation Plan for 2005-2010’, Federal Environmental Protection Authority, Addis Ababa.
Fisseha Itana (2002), ‘Metals in Leafy Vegetables Grown in Addis Ababa and Toxicological Implications’, Ethiopian Journal of Health Development 16(3): 295-302.
Grossman, M. (1972), ‘On the Concept of Health Capital and the Demand for Health’, Journal of political economy, vol. 80 (March-April), pp. 223-55.
Habbari, K.; Tifnooti; B. Bitton; and A. Mandil (2000), ‘Geohelminthic Infectious associated with raw wastewater reuse for agricultural purpose in Beni-Mellal, Morocco’, Parasitology International, 48, 249-254.
Heckman, J.J. (1979), ‘Sample Selection Bias as a Specification Error’, Econometrica Vol.47 pp. 153-161
Hussain, I; L.Raschid; M.A. Hanjra; F. Marikar; and W. van der Hoek (2001), ‘A Framework for Analysing Socio-economic, Health and Environmental Impact of Wastewater Use in Agriculture in Developing Countries’, Working Paper 26, Colombo, Sri Lanka: International Water Management Institute (IWMI).
Hussain, I; L.Raschid; M.A. Hanjra; F. Marikar; and W. van der Hoek (2002), ‘Wastewater use in Agriculture: Review of Impacts and Methodological Issues in Valuing Impacts (With an Extended List if Bibliographical References)’, Working Paper 37 Colombo, Sri Lanka: International Water Management Institute.
IWMI (2006), ‘Water Briefing No. 17: Recycling Realities: Managing Health Risks to Make Wastewater an Asset’, www.iwmi.cgiar.org/waterpolicy briefing/files/wpb17.pdf
45
Jacoby, H. (1993), ‘Shadow wages and Peasant Family Labour Supply: An Econometric Application to the Peruvian Sierra’, Review of Economic Studies 60: 903-22.
Jekel J.F, Joann G. Elmore and David L. Katz (1996), Epidemiology, Biostatistics and Preventive Medicine: Saunfers publication
Lire Ersado (2005), ‘Small-Scale Irrigation Dams, Agricultural Production, and Health: Theory and Evidence from Ethiopia’, World Bank Policy Research Working Paper 3494, January 2005.
Maddala, G.S. (1983), Limited-Dependent and Qualitative Variables in Econometrics, Cambridge University Press.
Mekonen A. (2007), ‘Suitability Assessment of Little Akaki River for Irrigation’, unpublished M.Sc., Department of Chemical Engineering, Addis Ababa University, Addis Ababa.
Pitt Mark M., and Mark R. Rosenzweig (1985), ‘Health and Nutrient Consumption Across and Within Farm Households’, the Review of Economics and Statistics, vol. 67 (May), pp 212-23.
Pitt Mark M. and Mark R. Rosenzweig (1986), ‘Agricultural Prices, Food Consumption, and the Health and Productivity of Indonesian Farmers’, in: Singh I., Squire L., and Strauss J. (Ed). Agricultural Household Models: Extensions, Applications, and Policy, Baltimore and London: Published for the World Bank, the Johns Hopkins University Press, pp153-182.
Rosenzweig, Mark R., and Schultz (1982), ‘Market Opportunities, Genetic Endowments and Intra-Family Resource Distribution: Child survival in Rural India’, American Economic Review, vol. 72 (September), pp. 803-15.
Rosenzweig, Mark R., and Schultz (1983), ‘Estimating a Household Production Function: Heterogeneity, the Demand for Health Inputs and their Effect on Birth weight’, Journal of Political Economy, vol. 91 (October), pp 723-46.
Shuval, H.I.; A.A. Adin; B. Fattel; E. Rawitz; and Yeutiel (1986), ‘Wastewater Irrigation in Developing Countries: Health Effects and Technical Solutions’, Technical Paper No.51, the World Bank, Washington D.C.
Scott C.A, Faruqui N.I. and Raschid-Sally L. (Ed), ‘Wastewater Use in Irrigated Agriculture: Confronting the livelihood and environmental Realities’, International Water Management Institute (IWMI) and the International Development Research Center (IDRC) publication.
WHO (2006), ‘Guidelines for the Safe Use of Wastewater, excreta and Grey Water: Wastewater Use in Agriculture, Vol 2, in press: www.who.int/water_sanitation_health/wastewater/en/
Wooldridge J.M. (2002), Econometric Analysis of Cross Section and Panel Data, Cambridge University Press.
46
CHAPTER 4: The Economic Value of Wastewater: A Contingent Valuation Study in Addis Ababa, Ethiopia
Submitted to Journal of Agricultural and Resource Economics
Weldesilassie, Alebela; Oliver Frörb, Eline Boeleec; Stephan Dabbertd
a Institute of Farm Management (410A), Department of Production Theory and Resource Economics, Hohenheim University; e-mail: [email protected] ; 70593, Stuttgart, Germany. b Environmental economics unit, Hohenheim University, Germany; email: [email protected] c International Water Management Institute (IWMI), email: [email protected] ; International Livestock Research Institute (ILRI), P.o.box 5689, Addis Ababa, Ethiopia d Institute of Farm Management (410A) , Department of Production Theory and Resource Economics, Hohenheim University, email: [email protected]; 70593, Stuttgart, Germany.
47
4.1. Abstract
In developing countries the use of wastewater for irrigation often causes considerable
harm to public health and the environment. This paper scrutinizes the applicability of
contingent valuation to estimate the economic value of safe use of wastewater for crop
production on farms within and around Addis Ababa, Ethiopia. We estimate a
surprisingly large welfare gain to society from policies for safe use of wastewater for
irrigation. Our study highlights the potential and the pitfalls of using non-market
valuation techniques as an input into public decision making where traditional resource
use interacts with public health and environmental concerns in complex ways.
Keywords: contingent valuation; dichotomous choice; Ethiopia; irrigation; wastewater;
willingness to pay
48
References Alberini, Anna. (1995), “Efficiency vs. Bias of Willingness-to-Pay Estimates: Bivariate and Interval-
Data Models”, Journal of Environmental Economics and Management 29, 169-180. Ahlheim, M. (1998), “Measures of economic welfare. In: Barberà, S., Hammond, P. J., Seidl,
C. (eds.): Handbook of utility theory”, Volume 1: Principles. Kluwer Academic Publisher, Dordrecht, Boston, London, 483-568.
Alemu Mekonen. (1997), “Valuation of Community Forest in Ethiopia: A contingent Valuation Study of Rural Households”, Environment and Development Economics 5, 289-308
Amemiya, Takeshi. (1984), “Tobit Models: A survey”, Journal of Econometrics 24, 3-61. Aprahamian, F., Chanel, O., Luchini, S. (2007), “Modeling starting point bias as unobserved
heterogeneity in contingent valuation surveys: an application to air pollution”, American Journal of Agricultural Economics 89 (2), 533-547.
Bond W.J, (1999), “Effluent irrigation- an environmental challenge for soil science”, Australia Journal of Soil and Research, No 4, 543(13).
Cameron Trudy Ann and Quiggin John, (1994), “Estimation Using Contingent Valuation Data from a “Dichotomous Choice with Follow-Up” Questionnaire”, Journal of Environmental Economics and Management 27, 218-234.
DeShazo, J.R. (2002), “Designing Transactions without Framing Effects in Iterative Question Formats”, Journal of Environmental Economics and Management 43, 360-385.
Ethiopian Economic Association (2005), “Transformation of the Ethiopian Agriculture: Potentials, Constraints and Suggested Intervention Measures”, Report on the Ethiopian Economy Vol. IV, 2004/05, Addis Ababa, Ethiopia.
Ethiopian Environmental Protection Authority (2003), “Standards for industrial pollution control in Ethiopia”, Prepared by The Environmental Protection Authority and The United Nations Industrial Development Organization under the Ecologically Sustainable Industrial Development (ESID) project, Addis Ababa, Ethiopia
Fisseha Itana. (2002), “Metals in Leafy Vegetables Grown in Addis Ababa and Toxicological Implications”, Ethiopian Journal of Health Development 16(3), 295-302.
Freeman, M. A. III (2003), The Measurement of Environmental and Resource Values: Theory and Methods, Washington, D.C: Resources for the Future.
Frör, O. (2008), “Bounded rationality in contingent valuation: empirical evidence using cognitive psychology”, Ecological Economics, doi:10.1016/j.ecolecon.2008.05.021
Haab, T. C., and McConnell, K. E. (2002), Valuing Environmental and Natural Resources: The Econometrics of Non-Market Valuation, UK: Edward Elgar
Hanemann, M.W., Loomis, J. and Kanninen, B (1991), “Statistical Efficiency of Double-Bounded Dichotomous Choice Contingent Valuation”, American Journal of Agricultural Economics 73(4), 1255-1263
Hanemann, M.W. (1984), “Welfare Evaluations in Contingent Valuation Experiments with Discrete Responses”, American Journal of Agricultural Economics 66(3), 332-341.
Herriges, J.A., Shogren, J.F., (1996), “Starting point bias in dichotomous choice valuation with follow-up questioning”, Journal of environmental economics and management 30, 112-131.
Hussain, I; L.Raschid; M.A. Hanjra; F. Marikar; and W. van der Hoek (2002), “Wastewater use in agriculture: Review of impacts and methodological issues in valuing impacts (With an extended list of bibliographical references)”, working Paper 37 Colombo, Sri Lanka: International Water Management Institute.
Hussain, I; L.Raschid; M.A. Hanjra; F. Marikar; and W. van der Hoek (2001), “A framework for analysing socio-economic, health and environmental impact of wastewater use in agriculture
49
in developing countries”, working Paper 26, Colombo, Sri Lanka: International Water Management Institute (IWMI).
Meyerhoff, M., Liebe, U., (2006), “Protest beliefs in contingent valuation: explaining their motivation”, Ecological Economics 57, 583-594.
Mitchell, R. C. and Carson, R. T. (1989), Using Surveys to Value Public Goods: The Contingent Valuation Method, Washington, D.C: Resources for the Future.
Rashed M.; S.R.Award; M.A.Salam; and E.Smidt, (1995), “Monitoring of groundwater in Gabal el Asfar wastewater irrigated area (greater Cairo)”, Water Science and Technology, 32(11), 163-169.
Ready, R.C., Buzby, J.C., Hu, D., (1996), “Differences between continuous and discrete contingent value estimates”, Land Economics 72(3), 397-411.
Shuval, H.I.; A.A. Adin; B. Fattel; E. Rawitz; and Yeutiel (1986), “Wastewater Irrigation in Developing Countries: Health Effects and Technical Solutions”, Technical Paper No.51, the World Bank, Washington D.C.
Tegene Gebreegziabher, (1999), “Willingness to pay for Environmental Protection: An Application of Contingent Valuation Method (CVM) in Sekota District Northern Ethiopia”, Ethiopian Journal of Agricultural Economics 4(1), 1-16.
Varian, H.R. (1984), Microeconomic Analyses, New York: Norton Weldesilassie, Alebel; Boelee Eline; Dabbert Stephan. “Wastewater Use in Crop Production: Impact
on Productivity and Policy Implication.” Unpublished Paper, Department of Production Theory and Resource Economics, University of Hohenheim, Germany 2008.
Weldesilassie, Alebel; Boelee Eline; Pay Drechsel and Dabbert Stephan. “Health Impact of Wastewater Use in Crop Production in Peri-Urban Areas of Addis Ababa: Implication for Policy.” Unpublished Paper, Department of Production Theory and Resource Economics, University of Hohenheim, Germany 2008.
Whittington, D. (2002), “Improving the Performance of Contingent Valuation Studies in Developing Countries”, Environmental and Resource Economics 22, 323-367
Whittington, D., D.T Lauria and X. Mu (1991), “A study of Water Vending and Willingness to Pay in Onisha, Nigeria”, World Development 19(2/3), 179-198.
Whittington D., J.Briscoe, X. Mu and W. Barron (1990), “Estimating the Willingness to pay for Water Services in Developing Countries: A case study of the contingent Valuation Method in Southern Haiti”, Economic Development and Cultural Changes 38 (2), 293-312.
50
CHAPTER 5: SUMMARY and CONCLUSIONS The use of wastewater in agriculture is a common practice in low-income countries. The
reasons for using wastewater vary from region to region, depending on the specific situation
and local context. Its use in agriculture has both positive and negative potential impacts,
which are reflected through crop production, public health, soil resource and the ecosystem.
The main challenge to policy makers in developing countries is how to maximize the benefit
at minimum adverse effect on public health and the environment. As outlined in the
‘Hyderabad Declaration on Wastewater Use in Agriculture,’ these benefits and costs
associated with wastewater call for developing a balanced approach. The new WHO
guideline on water quality standards for irrigation, which recognizes the Hyderabad
declaration, suggests that countries should adapt the guideline to their own social, technical,
economic and environmental circumstances based on scientific information.
As in most developing countries, wastewater is used for agricultural activity in Ethiopia, the
second most populous country in sub-Saharan Africa. Even though urbanization is at its
lowest level in Ethiopia, its rate of growth is increasing. It is estimated that by 2030 about
29.7% of the Ethiopian population will reside in urban areas. Rural-urban migration and the
poor performance of the agriculture sector contribute for the high rate of urbanization in the
country. Urban areas in Ethiopia are characterized by a host of problems including, among
others, unemployment, inadequate water and sanitation services as well as poor waste
management. As a result of the increase in population number and low level of improved
environmental sanitation and waste management services, a huge volume of wastewater is
being generated and disposed of without any kind of treatment, polluting nearby rivers and
streams flowing within cities. This is especially true in Addis Ababa, the capital, where
approximately five million people are living. Despite the production of a large volume of
51
domestic and industrial wastes, the sanitation service is very low by any standard. Only 15%
of the population has access to improved sanitation services and only 1% of the households
are connected to the limited sewer lines of the city. The existing public-owned treatment
plants treat only less than 1% of the 36 million cubic meters of wastewater generated per
year. As a result, rivers and streams flowing across the city serve as a sink to the huge
volume of wastewater being generated. These rivers and streams are tributaries of the Akaki
River, which is highly polluted with industrial as well as domestic wastes.
Farmers are growing vegetables using the Akaki River within and around Addis Ababa, and
make a living out of the wastewater from the city. This practice has both positive and
negative impacts on the producers, consumers and the nearby community, and poses a
challenge to policy makers to make decision on the practice of wastewater agriculture. This
study, therefore, attempts to answer basic questions like ‘should the practice of wastewater
within and around the city be discontinued?’ In attempting to address this basic question, the
study is divided into three major areas including the impact of the wastewater on crop
production and productivity; its health impact and on the way to improve the existing unsafe
use of wastewater for vegetable production. Both quantitative and qualitative data are used.
The quantitative data comes from a household survey conducted on 415 farm households in
both wastewater and freshwater irrigation areas. It is supplemented with information from
focus group discussions and key informant interviews made on selected individuals from the
farm community and professionals and officials from agriculture, environmental as well as
water supply and waste management offices.
The first part of this study deals with the impacts of wastewater on crop productivity and the
livelihoods of the wastewater farm families. The study investigated the costs and benefits of
52
the wastewater farm and compared the results with the freshwater irrigated farms using
descriptive and econometric analytical techniques. The descriptive results show that, on
average, income from wastewater farms accounts for 62% of the total annual household
income, ranging from 29% to 97%. Major crops grown in wastewater areas are cabbage,
lettuce, Swiss chard, beat root, potatoes, tomatoes, spring onions and carrot. Leafy vegetables
including lettuce and Swiss chard are exclusively grown in the upstream and middle-stream
of wastewater farm areas, where the pollution level is relatively lower, whereas root crops
including potatoes, carrot, beat root, onion and tomatoes are grown in the downstream areas
of wastewater where the pollution level is higher. Cabbage grows in the middle and down
stream farm areas. About 61% of the city’s vegetable markets are supplied from these farms.
Moreover, physical observation of the central market and some small markets in the city
show that the livelihood of many small business households is linked with wastewater farms
through the vegetable market channels. These results highlight the importance of the
wastewater resource for livelihood of farmers and small business owners as well as for the
vegetable market supply of nearby cities.
The bivariate analysis revealed that wastewater farmers use significantly smaller doses of
inorganic fertilizer compared to freshwater farmers, but spend three times more on seed input
and about five times more on farm labor. This suggests the importance of wastewater to input
and labor markets in the study area. Despite the higher cost of production for the wastewater
farms, net farm return per hectare of plots irrigated with wastewater is significantly higher
than from plots irrigated with freshwater. This is also confirmed from the econometric
estimation. The regression result indicated that the predicted median output value per hectare
is significantly higher in wastewater-irrigated plots than in freshwater-irrigated plots. The
53
factors determining this significant difference are analyzed using Censored Least Absolute
Deviation (CLAD). We found that higher productivity of wastewater plots is explained by
investments in inputs (organic fertilizer, improved seed and agricultural extension services),
ownership of plots and level of pollution of the irrigation water. The study also found that
yield value per hectare is significantly higher in plots irrigated with less polluted wastewater
than in plots irrigated with more polluted wastewater.
The second part of the study deals with the actual health impact of wastewater use in
vegetable production in the study areas. This part of the thesis analyzed the different risk
factors, the prevalence of wastewater-related illness as well as the impacts of wastewater on
farmers’ illness. We made an attempt to single-out the impact of wastewater (measured by
dummies for working on wastewater farm) from the different risk factors. The risk factors,
the different kind of wastewater-related illness and their frequency of occurrence or
prevalence rate were analyzed using descriptive analyses. The results show that apart from
working on wastewater farms, different risk factors are prevalent, which can cause
wastewater-related disease in the study areas. The major risk factors in the study areas
include household demographic characteristics including education level, age and income;
poor sanitation services such as lack of potable water supply, poor toilet facilities, improper
solid waste disposal, lack of access to health services as well as poor hygienic behavior of
farm families, such as eating unsafe raw vegetables, use of unsafe water for domestic
purposes without boiling and irregular compound sweeping.
The study also found that wastewater irrigators do not use protective clothing that protect
them from exposing their body to the wastewater and contaminated soils. This is partly
explained by lack of awareness of the health risks of working on wastewater farms. The
54
occurrences and distributions of these risk factors differ between the wastewater and the
freshwater farm areas.
The most common incidence of illness reported by farmers are intestinal nematodes, diarrhea
and skin disease, but these vary significantly between the wastewater farmers (treatment
group) and freshwater farmers (control group). The prevalence of intestinal illness due to
hookworm or Ascaris infection is significantly higher in freshwater areas than wastewater
areas since the occurrences of disease-causing risk factors are higher in the freshwater
irrigation areas. The prevalence of illness also differs within the different locations of
wastewater farm areas, mainly due to differences in the pollution level of the wastewater as
well as prevalence of the risk factors. This study revealed that the prevalence of intestinal
nematodes and diarrhea is significantly higher in downstream irrigators, where the pollution
level is higher, compared to the upstream and middle-stream farm areas.
The probit model estimation shows that marital status, sex and religion of the household
head, education, eating unsafe raw vegetable and regular sweeping of compound determine
the prevalence of intestinal illness in the study area. Results on the effects of hygienic
characteristics of irrigators show that eating unsafe raw vegetable increases illness, while
regularly and frequently sweeping compounds reduces it. Illness prevalence rates are also
higher in wastewater irrigators who do not have the habit of washing hands before meals.
This suggests that general hygienic behavior of farm families correlate with the prevalence of
illness.
An important finding of this study is that the dummy coefficient for working on a wastewater
farm is found to have a positive sign and is statistically significant in the probit estimation,
indicating that illness prevalence is significantly higher in farmers working on wastewater
55
farms than on freshwater farms. This result is also confirmed by the propensity score
matching method. On the other hand, use of protective clothing during farm work and
awareness of the health risk of wastewater use in crop production also significantly reduces
intestinal illness. These results show that the use of wastewater for vegetable production
actually causes illness to farmers in the study area. Prevalence of illness due to wastewater is
higher for farmers who work in the downstream wastewater farm areas compared to
upstream and middle-stream farm areas. This indicates that illness incidence varies with
pollution level of the river and that the probability of being sick will increase as the pollution
level increases. Off-farm income has significant and negative effects on the probability of
illness, indicating that higher off farm income reduces illness incidence.
The study revealed that the marginal impact of wastewater on farmers’ heath is 0.15. This
means that, holding other risk factors at their mean value, the probability of being sick is
higher by 16% for farmers working on wastewater farms compared to those working on
freshwater irrigation farms. This marginal effect, together with the predicted probability of
illness from the probit model, is used to estimate the value of health risk associated with
working on a wastewater farm. The value of the health risk is measured by the time spent
away from farm work due to illness caused by wastewater. It is the opportunity cost of the
farmer’s time spent in bed and visiting local clinics. The results indicate that the marginal
health cost of working on a wastewater farm for a representative wastewater farm household
is about 1.6% of its annual net farm income. Our study analyzed the possible policy
intervention to minimize this health cost. We found that the predicted probability of being ill
due to the wastewater significantly decreases with the use and provision of protective dress at
affordable prices, creating awareness of safe use of wastewater and through measures taken
56
to reduce the pollution level of the irrigation water source. While each of the policy
interventions has a significant effect in reducing health risks, combining these measures will
result in more significant reductions of health risks to farmers, and thereby maximize the
benefit from the wastewater as a source of livelihood and vegetables for the residences of the
nearby city.
The study also estimated the resource value of wastewater based on the farmers’ perception
in an attempt to analyze farmers’ willingness to pay for safe use of the wastewater for crop
production and the welfare gain to society from the improved service. This part of the thesis
intends to investigate the farmers’ perception to reduce the health risk of working on
wastewater and the contribution they can make to improve the existing unsafe use of the
wastewater for crop production. We used a double bounded dichotomous CV format to elicit
farmers’ WTP. The survey was administered using an in-person interview. Currently, farmers
are operating unsafe wastewater irrigation. They are using the furrow irrigation method and
most farm activities including land preparation, weeding and harvesting are done using their
hands and farmers work with bare feet on wastewater farms. Besides, the consumption of raw
vegetables is unhygienic since farmers eat the raw vegetables directly from the farm area
without disinfection. Due to the unsafe wastewater irrigation system, farmers perceived that
even if they are benefited from the use of the wastewater for crop production, their health is
affected by working on the wastewater farms. In addition to its health effect, the wastewater
creates a bad odor for the surrounding community. In addition, the focus group discussion
with representatives of the farm households shows that farmers have the risk of losing their
farm land since they think that the government may ban the use of wastewater for
agricultural purposes due to the health risks associated with the use of wastewater.
57
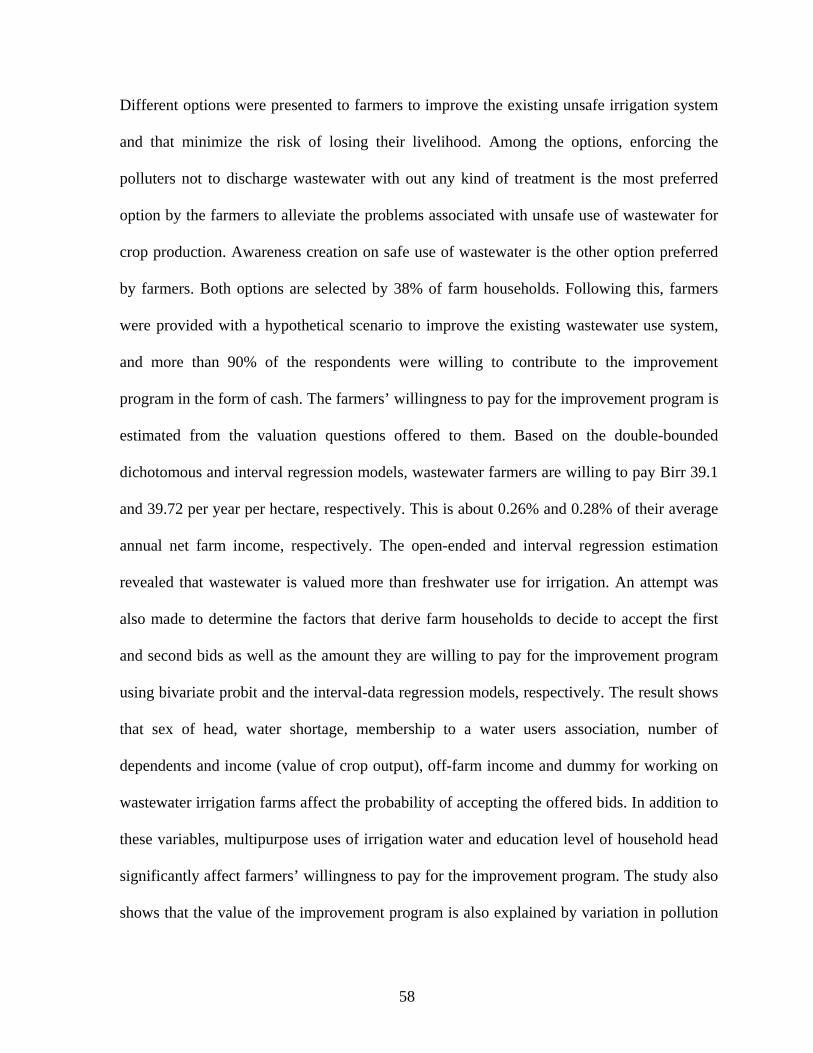
Different options were presented to farmers to improve the existing unsafe irrigation system
and that minimize the risk of losing their livelihood. Among the options, enforcing the
polluters not to discharge wastewater with out any kind of treatment is the most preferred
option by the farmers to alleviate the problems associated with unsafe use of wastewater for
crop production. Awareness creation on safe use of wastewater is the other option preferred
by farmers. Both options are selected by 38% of farm households. Following this, farmers
were provided with a hypothetical scenario to improve the existing wastewater use system,
and more than 90% of the respondents were willing to contribute to the improvement
program in the form of cash. The farmers’ willingness to pay for the improvement program is
estimated from the valuation questions offered to them. Based on the double-bounded
dichotomous and interval regression models, wastewater farmers are willing to pay Birr 39.1
and 39.72 per year per hectare, respectively. This is about 0.26% and 0.28% of their average
annual net farm income, respectively. The open-ended and interval regression estimation
revealed that wastewater is valued more than freshwater use for irrigation. An attempt was
also made to determine the factors that derive farm households to decide to accept the first
and second bids as well as the amount they are willing to pay for the improvement program
using bivariate probit and the interval-data regression models, respectively. The result shows
that sex of head, water shortage, membership to a water users association, number of
dependents and income (value of crop output), off-farm income and dummy for working on
wastewater irrigation farms affect the probability of accepting the offered bids. In addition to
these variables, multipurpose uses of irrigation water and education level of household head
significantly affect farmers’ willingness to pay for the improvement program. The study also
shows that the value of the improvement program is also explained by variation in pollution
58
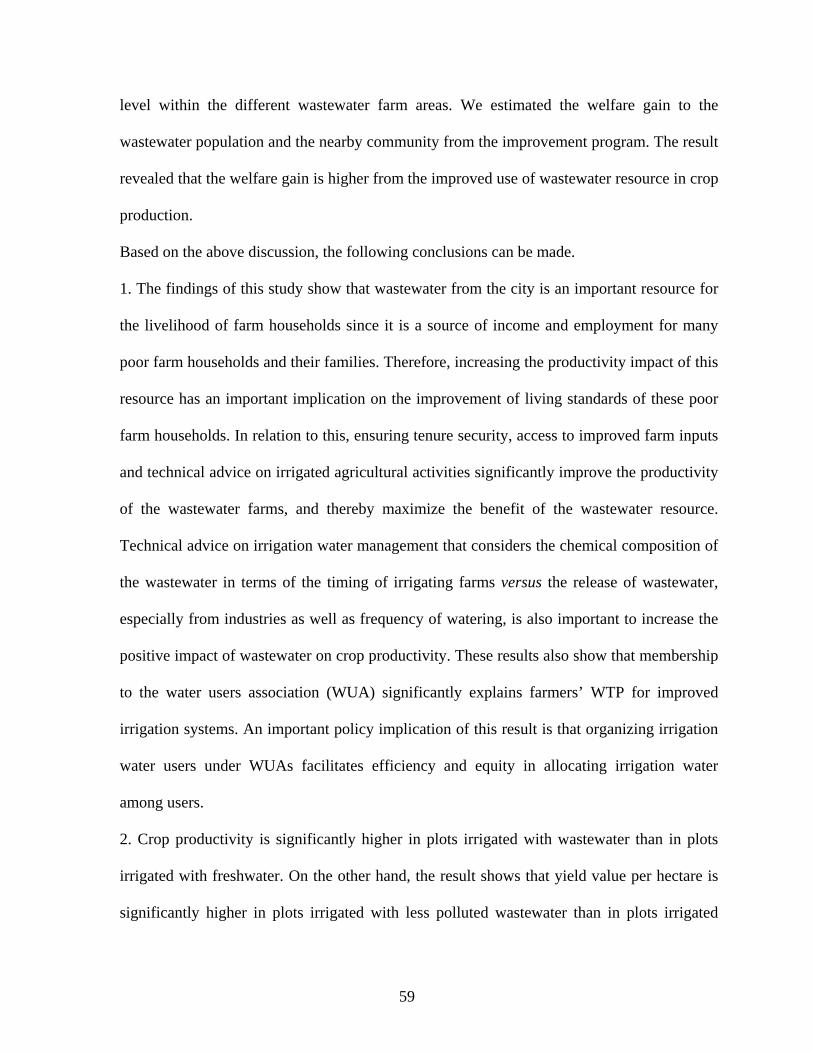
level within the different wastewater farm areas. We estimated the welfare gain to the
wastewater population and the nearby community from the improvement program. The result
revealed that the welfare gain is higher from the improved use of wastewater resource in crop
production.
Based on the above discussion, the following conclusions can be made.
1. The findings of this study show that wastewater from the city is an important resource for
the livelihood of farm households since it is a source of income and employment for many
poor farm households and their families. Therefore, increasing the productivity impact of this
resource has an important implication on the improvement of living standards of these poor
farm households. In relation to this, ensuring tenure security, access to improved farm inputs
and technical advice on irrigated agricultural activities significantly improve the productivity
of the wastewater farms, and thereby maximize the benefit of the wastewater resource.
Technical advice on irrigation water management that considers the chemical composition of
the wastewater in terms of the timing of irrigating farms versus the release of wastewater,
especially from industries as well as frequency of watering, is also important to increase the
positive impact of wastewater on crop productivity. These results also show that membership
to the water users association (WUA) significantly explains farmers’ WTP for improved
irrigation systems. An important policy implication of this result is that organizing irrigation
water users under WUAs facilitates efficiency and equity in allocating irrigation water
among users.
2. Crop productivity is significantly higher in plots irrigated with wastewater than in plots
irrigated with freshwater. On the other hand, the result shows that yield value per hectare is
significantly higher in plots irrigated with less polluted wastewater than in plots irrigated
59
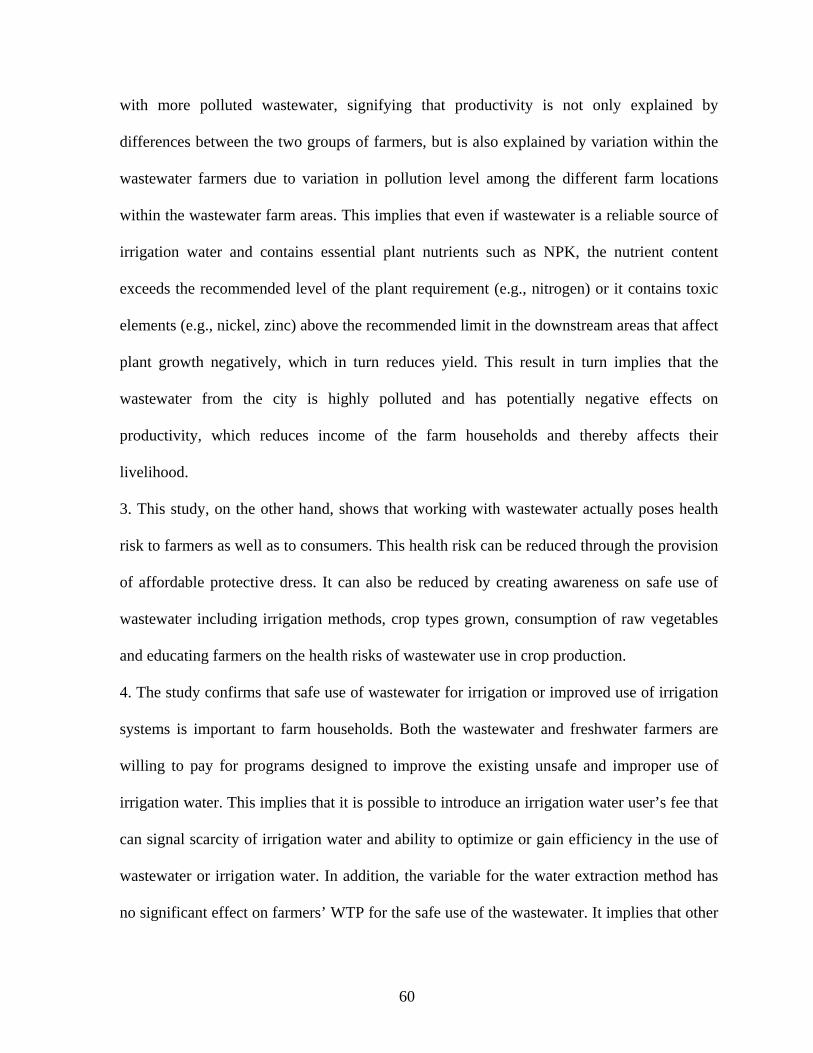
with more polluted wastewater, signifying that productivity is not only explained by
differences between the two groups of farmers, but is also explained by variation within the
wastewater farmers due to variation in pollution level among the different farm locations
within the wastewater farm areas. This implies that even if wastewater is a reliable source of
irrigation water and contains essential plant nutrients such as NPK, the nutrient content
exceeds the recommended level of the plant requirement (e.g., nitrogen) or it contains toxic
elements (e.g., nickel, zinc) above the recommended limit in the downstream areas that affect
plant growth negatively, which in turn reduces yield. This result in turn implies that the
wastewater from the city is highly polluted and has potentially negative effects on
productivity, which reduces income of the farm households and thereby affects their
livelihood.
3. This study, on the other hand, shows that working with wastewater actually poses health
risk to farmers as well as to consumers. This health risk can be reduced through the provision
of affordable protective dress. It can also be reduced by creating awareness on safe use of
wastewater including irrigation methods, crop types grown, consumption of raw vegetables
and educating farmers on the health risks of wastewater use in crop production.
4. The study confirms that safe use of wastewater for irrigation or improved use of irrigation
systems is important to farm households. Both the wastewater and freshwater farmers are
willing to pay for programs designed to improve the existing unsafe and improper use of
irrigation water. This implies that it is possible to introduce an irrigation water user’s fee that
can signal scarcity of irrigation water and ability to optimize or gain efficiency in the use of
wastewater or irrigation water. In addition, the variable for the water extraction method has
no significant effect on farmers’ WTP for the safe use of the wastewater. It implies that other
60
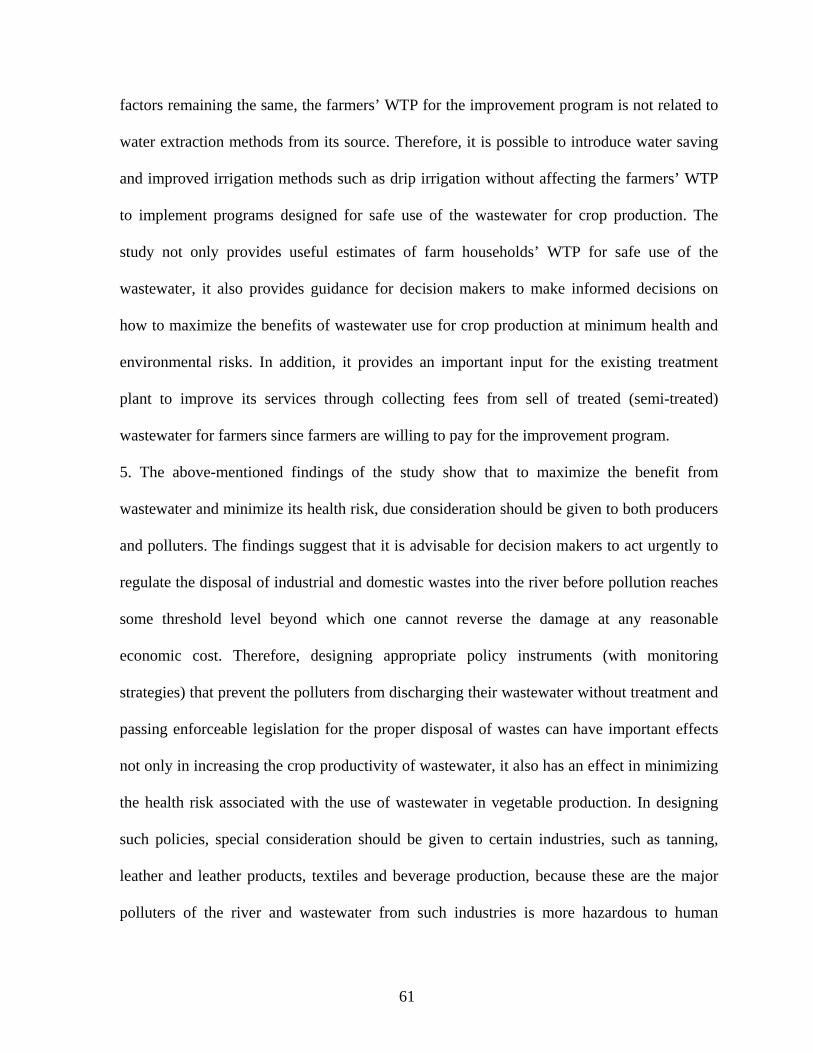
factors remaining the same, the farmers’ WTP for the improvement program is not related to
water extraction methods from its source. Therefore, it is possible to introduce water saving
and improved irrigation methods such as drip irrigation without affecting the farmers’ WTP
to implement programs designed for safe use of the wastewater for crop production. The
study not only provides useful estimates of farm households’ WTP for safe use of the
wastewater, it also provides guidance for decision makers to make informed decisions on
how to maximize the benefits of wastewater use for crop production at minimum health and
environmental risks. In addition, it provides an important input for the existing treatment
plant to improve its services through collecting fees from sell of treated (semi-treated)
wastewater for farmers since farmers are willing to pay for the improvement program.
5. The above-mentioned findings of the study show that to maximize the benefit from
wastewater and minimize its health risk, due consideration should be given to both producers
and polluters. The findings suggest that it is advisable for decision makers to act urgently to
regulate the disposal of industrial and domestic wastes into the river before pollution reaches
some threshold level beyond which one cannot reverse the damage at any reasonable
economic cost. Therefore, designing appropriate policy instruments (with monitoring
strategies) that prevent the polluters from discharging their wastewater without treatment and
passing enforceable legislation for the proper disposal of wastes can have important effects
not only in increasing the crop productivity of wastewater, it also has an effect in minimizing
the health risk associated with the use of wastewater in vegetable production. In designing
such policies, special consideration should be given to certain industries, such as tanning,
leather and leather products, textiles and beverage production, because these are the major
polluters of the river and wastewater from such industries is more hazardous to human
61
health. These measures, coupled with programs that enable farmers to operate safe
wastewater-irrigated farms and increase their awareness of the health risk associated with the
unsafe use of wastewater, will make important contributions towards minimizing health risks
and maximizing the benefits from this resource.
6. The findings of this study suggest that prohibition of wastewater use for crop production is
not the best option at least for three reasons. First, the existing situation in the study area
shows that the livelihood of many poor farm households and small business owners is highly
dependent on wastewater. Thus, prohibition of this practice affects the livelihoods of many
poor households unless and otherwise other livelihood alternatives are sought. Second, a high
proportion of the vegetable market of Addis Ababa is produced from wastewater farms,
implying that a ban will require looking for other sources of vegetables to meet at least the
current demand for these produce. Third, the available resource for enforcement of
prohibition of wastewater use for crop production is very limited, as it is seen from past
experience in the study areas and other developing countries. On the other hand, municipal
treatment of wastewater, which is the first and best option, is not a realistic option in the
study areas both in the short- and medium-terms since it requires large capital investment and
operating costs to construct and run wastewater treatment plants in a poorly developed
country like Ethiopia, where resources are very limited both at the municipal and country
levels. Furthermore, depending on the treatment level, wastewater treatment could also
result in an increase in farm input cost for wastewater farmers as our result shows that
farmers have a significantly lower cost for fertilizer compared to freshwater farmers.
Therefore, awareness of farmers on the health risk, use of protective dress during farming,
safe consumption of produce from wastewater farms, use of improved irrigation techniques,
62
restricting type of crops grown and enforcing the treatment of industrial wastewater before
discharge are the second best option in the short-term to maximize the benefit from the
wastewater resource with minimum health risk to farmers as well as consumers. In the
medium-term, improving the capacity of the existing public treatment plants can be the
second best option since the fee collected from farmers can also serve as the source of
finance for the treatment plant to improve its existing low capacity. Besides, improving the
existing domestic solid and liquid waste management services can also be used as second
best option in the medium term, but this requires further study on the perception of the
residence of Addis Ababa on improving the existing waste management service.
A number of issues are excluded from our study that should be considered in future research:
1. One of the main limitations of this study is the use of a dummy variable to determine the
impact of wastewater on productivity and health impact. We also used dummy variables for
location and results from an old study conducted by the Ethiopian Environmental Protection
Authority to describe the pollution level of the river. Therefore, future studies should attempt
to use the pollution level of the river by measuring the chemical, physical and biological
composition of the river water by conducting detailed water sample analysis at different
locations of the river both during the dry and rainy seasons of the year.
2. In evaluating the health impact of wastewater use in agriculture, our study considers only
intestinal illness due to worm infection. Illnesses including diarrhea, skin and hepatitis,
which can also be caused by wastewater, are excluded from our estimation despite their
prevalence in the study area. This underestimates the actual health cost. Hence, future
research should also consider such illnesses to accurately estimate the actual health risks.
Furthermore, our study analyzed only the impact on farmers, excluding the health impact on
63
consumers and the nearby community. Thus, we suggest further study be made on consumers
risk and the nearby community to estimate the health cost to the society. This value should
also be weighted against the benefit from wastewater use in agriculture, so as to identify the
welfare contributions of the wastewater resource.
3. Our study on improving the existing use of wastewater is made based on the perception of
farm households and the result is subject to these limitations. We suggest further study to be
made on the attitude and willingness of the residences in Addis Ababa to pay for improved
waste management service as they are the source of the waste and at the same time benefit
from and are affected by the vegetable supply of wastewater farms.
4. Industrial wastewater is one of the major components of wastewater in the study areas, and
poses a human health risk because of the nature of the industries within the city. These
industries discharge their wastewater without any kind of treatment. Therefore, a study
should be made to determine the optimum level of treatment that can serve as a bench mark
to regulate industrial wastewater discharge and mechanisms should be designed to control
and enforce the implementation of environmental pollution policy. Since the existing policy
on the discharge of industrial wastes to surface water bodies is based on regulatory
mechanisms, which have high transaction costs and limited applicability due to poor
enforcement mechanisms (as has been seen since this policy’s inception), further studies
should consider market-based or incentive-based policy options to minimize the pollution
level of the Akaki River.
64
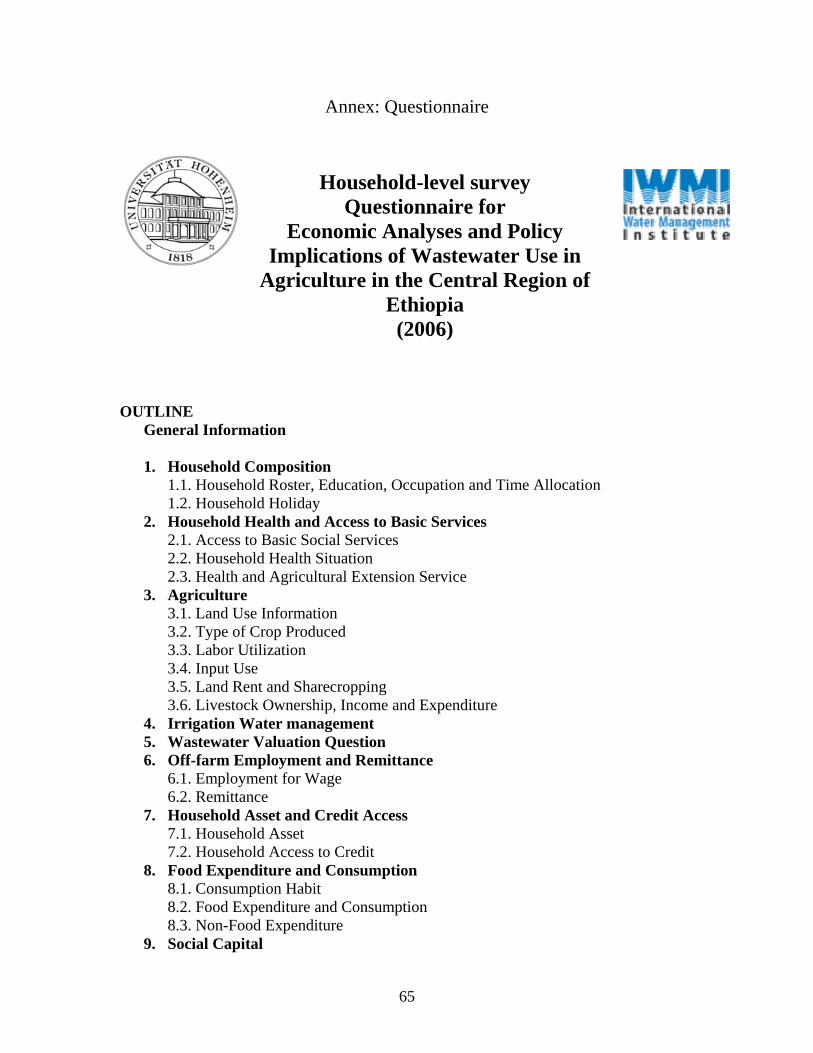
Annex: Questionnaire
Household-level survey
Questionnaire for Economic Analyses and Policy
Implications of Wastewater Use in Agriculture in the Central Region of
Ethiopia
(2006)
OUTLINE
General Information 1. Household Composition
1.1. Household Roster, Education, Occupation and Time Allocation 1.2. Household Holiday
2. Household Health and Access to Basic Services 2.1. Access to Basic Social Services 2.2. Household Health Situation 2.3. Health and Agricultural Extension Service
3. Agriculture 3.1. Land Use Information 3.2. Type of Crop Produced 3.3. Labor Utilization 3.4. Input Use 3.5. Land Rent and Sharecropping 3.6. Livestock Ownership, Income and Expenditure
4. Irrigation Water management 5. Wastewater Valuation Question 6. Off-farm Employment and Remittance
6.1. Employment for Wage 6.2. Remittance 7. Household Asset and Credit Access
7.1. Household Asset 7.2. Household Access to Credit
8. Food Expenditure and Consumption 8.1. Consumption Habit 8.2. Food Expenditure and Consumption 8.3. Non-Food Expenditure
9. Social Capital
65
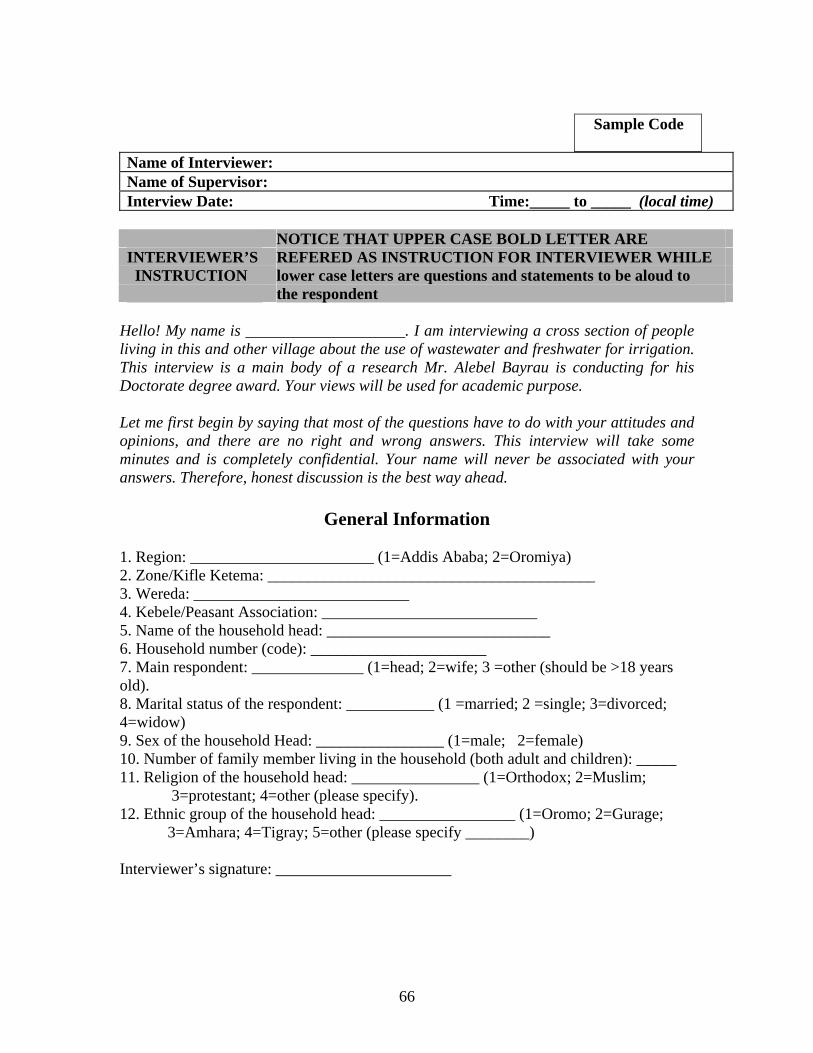
66
Sample Code
Name of Interviewer: Name of Supervisor: Interview Date: Time:_____ to _____ (local time)
NOTICE THAT UPPER CASE BOLD LETTER ARE INTERVIEWER’S REFERED AS INSTRUCTION FOR INTERVIEWER WHILE INSTRUCTION lower case letters are questions and statements to be aloud to the respondent
Hello! My name is ____________________. I am interviewing a cross section of people living in this and other village about the use of wastewater and freshwater for irrigation. This interview is a main body of a research Mr. Alebel Bayrau is conducting for his Doctorate degree award. Your views will be used for academic purpose. Let me first begin by saying that most of the questions have to do with your attitudes and opinions, and there are no right and wrong answers. This interview will take some minutes and is completely confidential. Your name will never be associated with your answers. Therefore, honest discussion is the best way ahead.
General Information
1. Region: _______________________ (1=Addis Ababa; 2=Oromiya) 2. Zone/Kifle Ketema: _________________________________________ 3. Wereda: ___________________________ 4. Kebele/Peasant Association: ___________________________ 5. Name of the household head: ____________________________ 6. Household number (code): ______________________ 7. Main respondent: ______________ (1=head; 2=wife; 3 =other (should be >18 years old). 8. Marital status of the respondent: ___________ (1 =married; 2 =single; 3=divorced; 4=widow) 9. Sex of the household Head: ________________ (1=male; 2=female) 10. Number of family member living in the household (both adult and children): _____ 11. Religion of the household head: ________________ (1=Orthodox; 2=Muslim; 3=protestant; 4=other (please specify). 12. Ethnic group of the household head: _________________ (1=Oromo; 2=Gurage; 3=Amhara; 4=Tigray; 5=other (please specify ________) Interviewer’s signature: ______________________
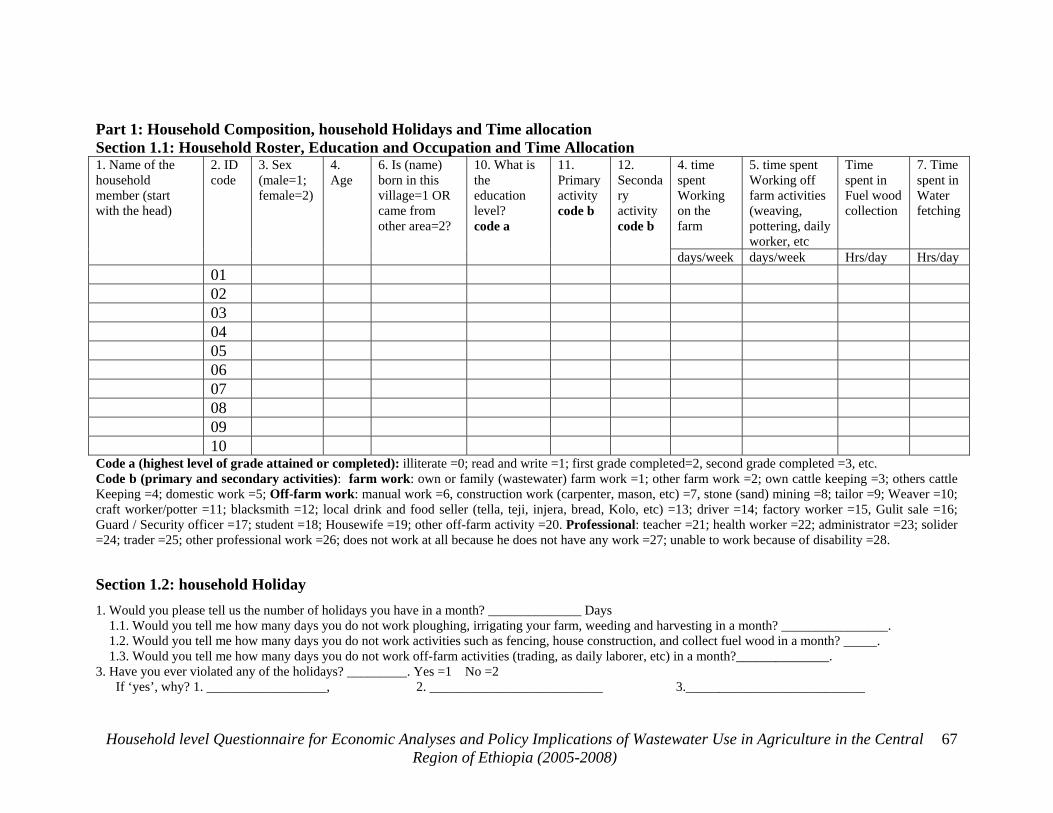
Part 1: Household Composition, household Holidays and Time allocation Section 1.1: Household Roster, Education and Occupation and Time Allocation
4. time spent Working on the farm
5. time spent Working off farm activities (weaving, pottering, daily worker, etc
Time spent in Fuel wood collection
7. Time spent in Water fetching
1. Name of the household member (start with the head)
2. ID code
3. Sex (male=1; female=2)
4. Age
6. Is (name) born in this village=1 OR came from other area=2?
10. What is the education level? code a
11. Primary activity code b
12. Secondary activity code b
days/week days/week Hrs/day Hrs/day 01 02 03 04 05 06 07 08 09 10 Code a (highest level of grade attained or completed): illiterate =0; read and write =1; first grade completed=2, second grade completed =3, etc. Code b (primary and secondary activities): farm work: own or family (wastewater) farm work =1; other farm work =2; own cattle keeping =3; others cattle Keeping =4; domestic work =5; Off-farm work: manual work =6, construction work (carpenter, mason, etc) =7, stone (sand) mining =8; tailor =9; Weaver =10; craft worker/potter =11; blacksmith =12; local drink and food seller (tella, teji, injera, bread, Kolo, etc) =13; driver =14; factory worker =15, Gulit sale =16; Guard / Security officer =17; student =18; Housewife =19; other off-farm activity =20. Professional: teacher =21; health worker =22; administrator =23; solider =24; trader =25; other professional work =26; does not work at all because he does not have any work =27; unable to work because of disability =28.
Section 1.2: household Holiday 1. Would you please tell us the number of holidays you have in a month? ______________ Days 1.1. Would you tell me how many days you do not work ploughing, irrigating your farm, weeding and harvesting in a month? ________________. 1.2. Would you tell me how many days you do not work activities such as fencing, house construction, and collect fuel wood in a month? _____. 1.3. Would you tell me how many days you do not work off-farm activities (trading, as daily laborer, etc) in a month?______________. 3. Have you ever violated any of the holidays? _________. Yes =1 No =2 If ‘yes’, why? 1. __________________, 2. __________________________ 3.___________________________
Household level Questionnaire for Economic Analyses and Policy Implications of Wastewater Use in Agriculture in the Central Region of Ethiopia (2005-2008)
67
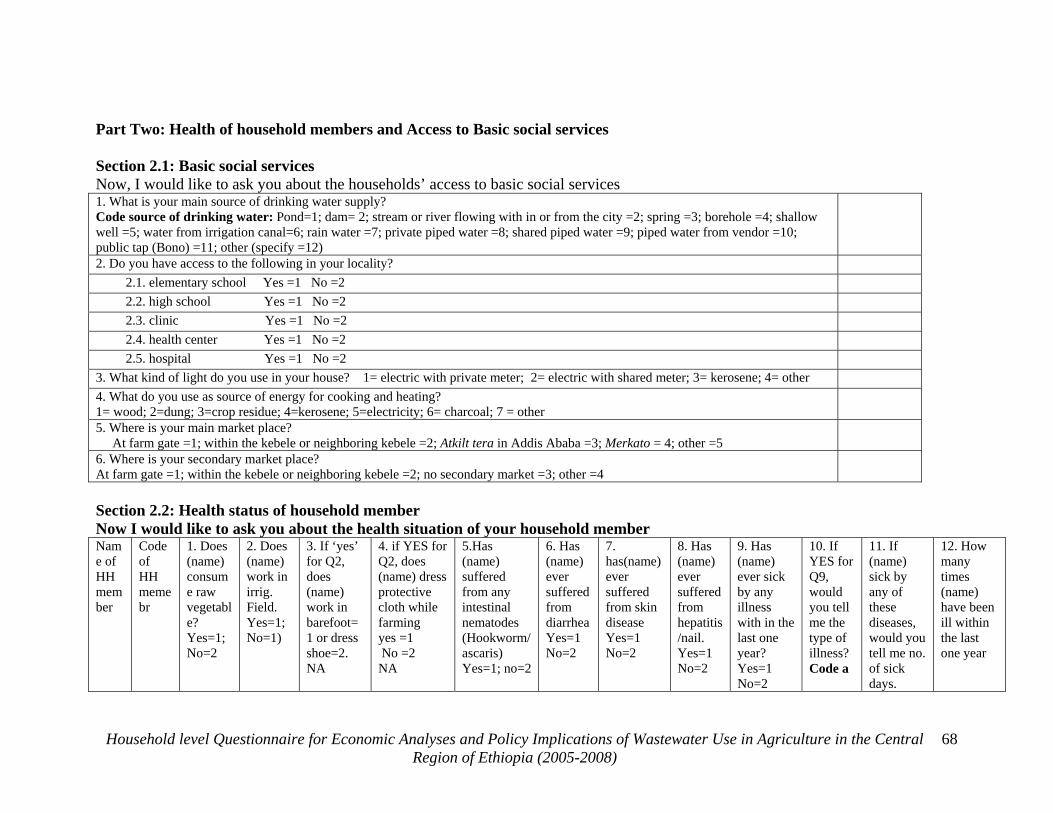
Part Two: Health of household members and Access to Basic social services Section 2.1: Basic social services Now, I would like to ask you about the households’ access to basic social services 1. What is your main source of drinking water supply? Code source of drinking water: Pond=1; dam= 2; stream or river flowing with in or from the city =2; spring =3; borehole =4; shallow well =5; water from irrigation canal=6; rain water =7; private piped water =8; shared piped water =9; piped water from vendor =10; public tap (Bono) =11; other (specify =12)
2. Do you have access to the following in your locality? 2.1. elementary school Yes =1 No =2 2.2. high school Yes =1 No =2 2.3. clinic Yes =1 No =2
2.4. health center Yes =1 No =2 2.5. hospital Yes =1 No =2 3. What kind of light do you use in your house? 1= electric with private meter; 2= electric with shared meter; 3= kerosene; 4= other 4. What do you use as source of energy for cooking and heating? 1= wood; 2=dung; 3=crop residue; 4=kerosene; 5=electricity; 6= charcoal; 7 = other
5. Where is your main market place? At farm gate =1; within the kebele or neighboring kebele =2; Atkilt tera in Addis Ababa =3; Merkato = 4; other =5 6. Where is your secondary market place? At farm gate =1; within the kebele or neighboring kebele =2; no secondary market =3; other =4
Section 2.2: Health status of household member Now I would like to ask you about the health situation of your household member Name of HH member
Code of HH memebr
1. Does (name) consume raw vegetable? Yes=1; No=2
2. Does (name) work in irrig. Field. Yes=1; No=1)
3. If ‘yes’ for Q2, does (name) work in barefoot=1 or dress shoe=2. NA
4. if YES for Q2, does (name) dress protective cloth while farming yes =1 No =2 NA
5.Has (name) suffered from any intestinal nematodes (Hookworm/ascaris) Yes=1; no=2
6. Has (name) ever suffered from diarrhea Yes=1 No=2
7. has(name) ever suffered from skin disease Yes=1 No=2
8. Has (name) ever suffered from hepatitis/nail. Yes=1 No=2
9. Has (name) ever sick by any illness with in the last one year? Yes=1 No=2
10. If YES for Q9, would you tell me the type of illness? Code a
11. If (name) sick by any of these diseases, would you tell me no. of sick days.
12. How many times (name) have been ill within the last one year
Household level Questionnaire for Economic Analyses and Policy Implications of Wastewater Use in Agriculture in the Central Region of Ethiopia (2005-2008)
68
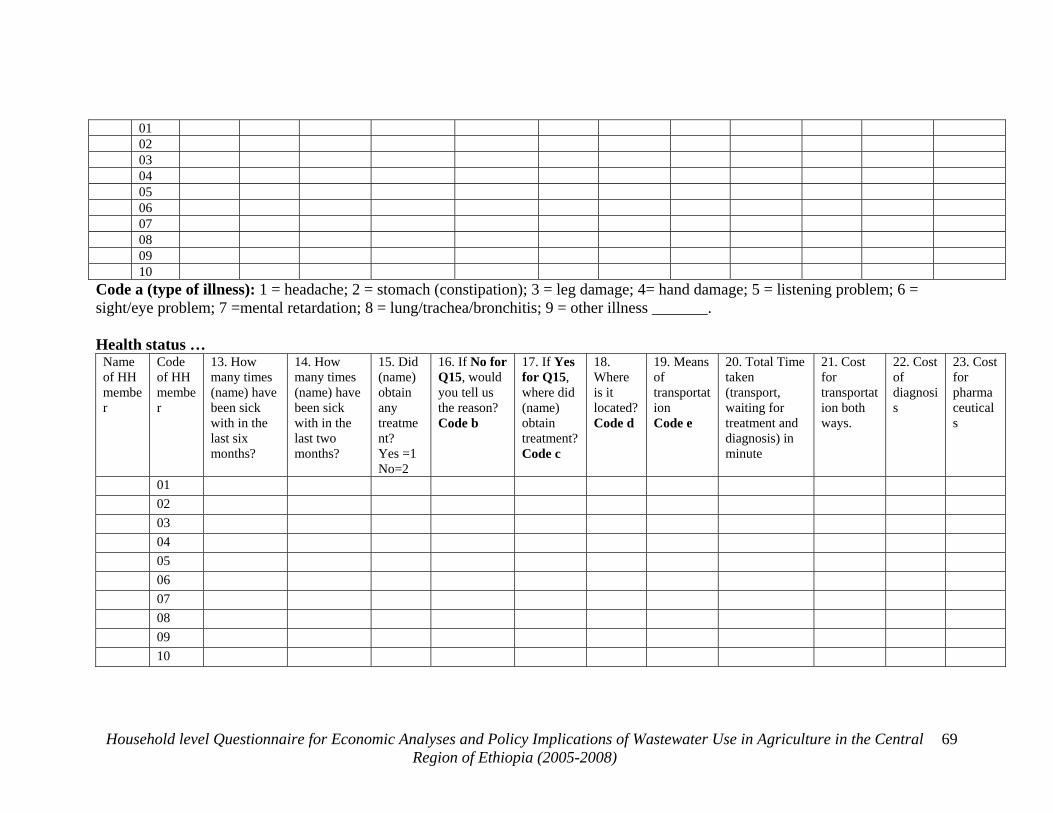
01 02 03 04 05 06 07 08 09 10 Code a (type of illness): 1 = headache; 2 = stomach (constipation); 3 = leg damage; 4= hand damage; 5 = listening problem; 6 = sight/eye problem; 7 =mental retardation; 8 = lung/trachea/bronchitis; 9 = other illness _______. Health status …
Name of HH member
Code of HH member
13. How many times (name) have been sick with in the last six months?
14. How many times (name) have been sick with in the last two months?
15. Did (name) obtain any treatment? Yes =1 No=2
16. If No for Q15, would you tell us the reason? Code b
17. If Yes for Q15, where did (name) obtain treatment? Code c
18. Where is it located? Code d
19. Means of transportation Code e
20. Total Time taken (transport, waiting for treatment and diagnosis) in minute
21. Cost for transportation both ways.
22. Cost of diagnosis
23. Cost for pharmaceuticals
01 02 03 04 05 06 07 08 09 10
Household level Questionnaire for Economic Analyses and Policy Implications of Wastewater Use in Agriculture in the Central Region of Ethiopia (2005-2008)
69
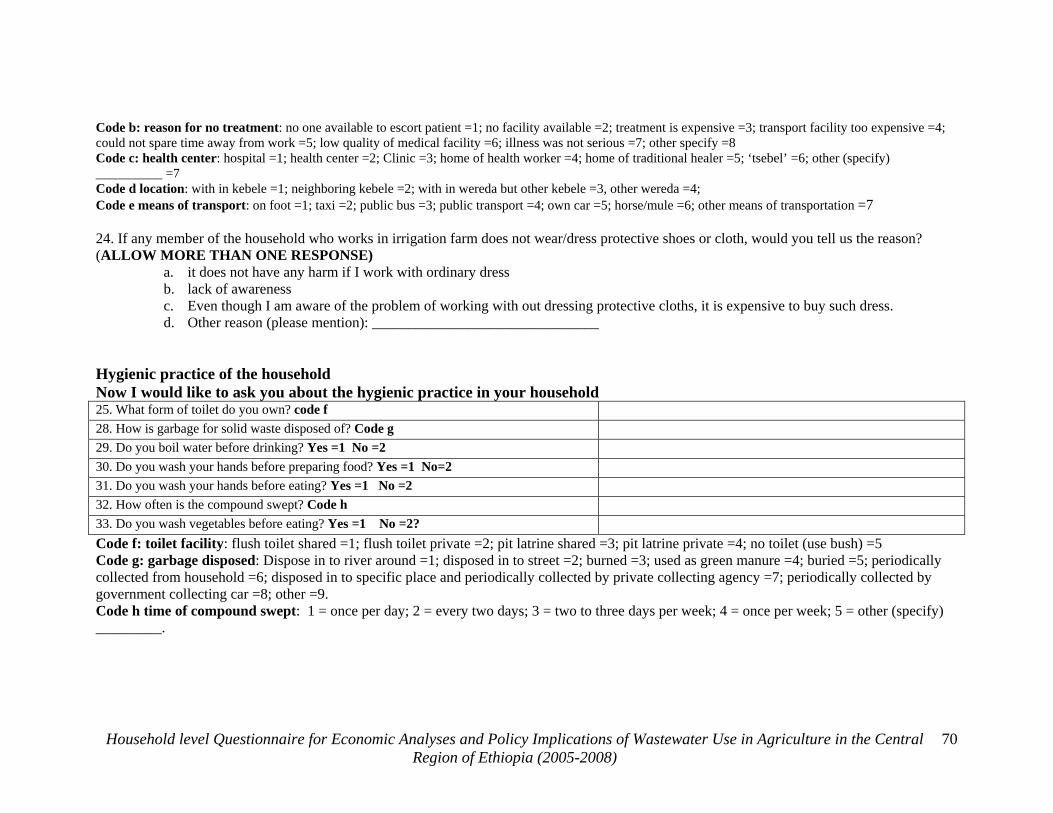
Code b: reason for no treatment: no one available to escort patient =1; no facility available =2; treatment is expensive =3; transport facility too expensive =4; could not spare time away from work =5; low quality of medical facility =6; illness was not serious =7; other specify =8 Code c: health center: hospital =1; health center =2; Clinic =3; home of health worker =4; home of traditional healer =5; ‘tsebel’ =6; other (specify) __________ =7 Code d location: with in kebele =1; neighboring kebele =2; with in wereda but other kebele =3, other wereda =4; Code e means of transport: on foot =1; taxi =2; public bus =3; public transport =4; own car =5; horse/mule =6; other means of transportation =7 24. If any member of the household who works in irrigation farm does not wear/dress protective shoes or cloth, would you tell us the reason? (ALLOW MORE THAN ONE RESPONSE)
a. it does not have any harm if I work with ordinary dress b. lack of awareness c. Even though I am aware of the problem of working with out dressing protective cloths, it is expensive to buy such dress. d. Other reason (please mention): _______________________________
Hygienic practice of the household Now I would like to ask you about the hygienic practice in your household 25. What form of toilet do you own? code f 28. How is garbage for solid waste disposed of? Code g 29. Do you boil water before drinking? Yes =1 No =2 30. Do you wash your hands before preparing food? Yes =1 No=2 31. Do you wash your hands before eating? Yes =1 No =2 32. How often is the compound swept? Code h 33. Do you wash vegetables before eating? Yes =1 No =2? Code f: toilet facility: flush toilet shared =1; flush toilet private =2; pit latrine shared =3; pit latrine private =4; no toilet (use bush) =5 Code g: garbage disposed: Dispose in to river around =1; disposed in to street =2; burned =3; used as green manure =4; buried =5; periodically collected from household =6; disposed in to specific place and periodically collected by private collecting agency =7; periodically collected by government collecting car =8; other =9. Code h time of compound swept: 1 = once per day; 2 = every two days; 3 = two to three days per week; 4 = once per week; 5 = other (specify) _________.
Household level Questionnaire for Economic Analyses and Policy Implications of Wastewater Use in Agriculture in the Central Region of Ethiopia (2005-2008)
70
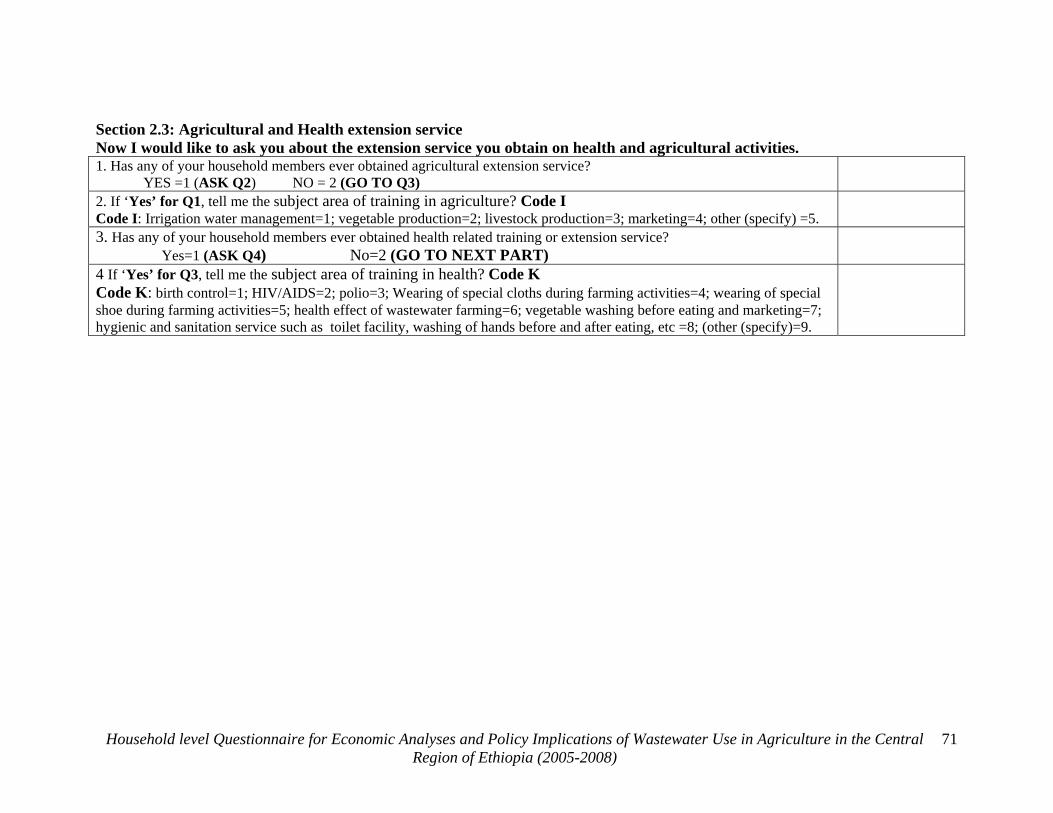
Section 2.3: Agricultural and Health extension service Now I would like to ask you about the extension service you obtain on health and agricultural activities. 1. Has any of your household members ever obtained agricultural extension service? YES =1 (ASK Q2) NO = 2 (GO TO Q3)
2. If ‘Yes’ for Q1, tell me the subject area of training in agriculture? Code I Code I: Irrigation water management=1; vegetable production=2; livestock production=3; marketing=4; other (specify) =5.
3. Has any of your household members ever obtained health related training or extension service? Yes=1 (ASK Q4) No=2 (GO TO NEXT PART) 4 If ‘Yes’ for Q3, tell me the subject area of training in health? Code K Code K: birth control=1; HIV/AIDS=2; polio=3; Wearing of special cloths during farming activities=4; wearing of special shoe during farming activities=5; health effect of wastewater farming=6; vegetable washing before eating and marketing=7; hygienic and sanitation service such as toilet facility, washing of hands before and after eating, etc =8; (other (specify)=9.
Household level Questionnaire for Economic Analyses and Policy Implications of Wastewater Use in Agriculture in the Central Region of Ethiopia (2005-2008)
71
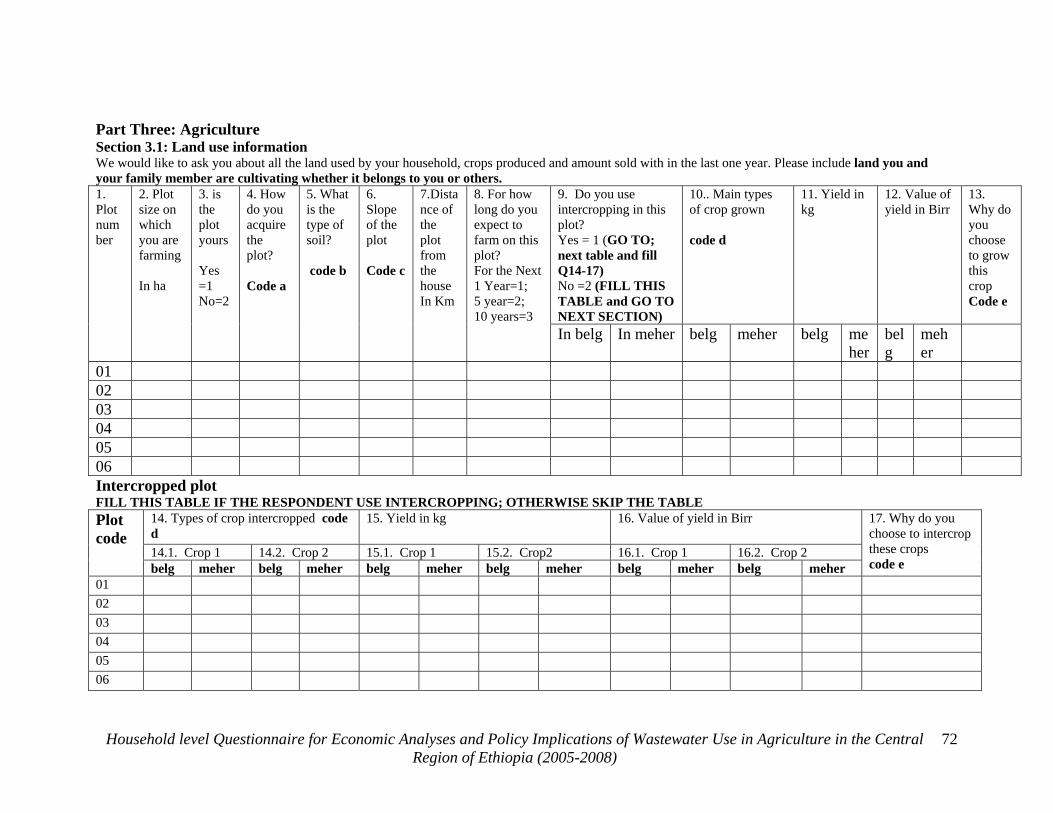
Part Three: Agriculture Section 3.1: Land use information We would like to ask you about all the land used by your household, crops produced and amount sold with in the last one year. Please include land you and your family member are cultivating whether it belongs to you or others.
9. Do you use intercropping in this plot? Yes = 1 (GO TO; next table and fill Q14-17) No =2 (FILL THIS TABLE and GO TO NEXT SECTION)
10.. Main types of crop grown code d
11. Yield in kg
12. Value of yield in Birr
13. Why do you choose to grow this crop Code e
1. Plot number
2. Plot size on which you are farming In ha
3. is the plot yours Yes =1 No=2
4. How do you acquire the plot? Code a
5. What is the type of soil? code b
6. Slope of the plot Code c
7.Distance of the plot from the house In Km
8. For how long do you expect to farm on this plot? For the Next 1 Year=1; 5 year=2; 10 years=3
In belg In meher belg meher belg meher
belg
meher
01 02 03 04 05 06 Intercropped plot FILL THIS TABLE IF THE RESPONDENT USE INTERCROPPING; OTHERWISE SKIP THE TABLE
14. Types of crop intercropped code d
15. Yield in kg
16. Value of yield in Birr
14.1. Crop 1 14.2. Crop 2 15.1. Crop 1 15.2. Crop2 16.1. Crop 1 16.2. Crop 2
Plot code
belg meher belg meher belg meher belg meher belg meher belg meher
17. Why do you choose to intercrop these crops code e
01 02 03 04 05 06
Household level Questionnaire for Economic Analyses and Policy Implications of Wastewater Use in Agriculture in the Central Region of Ethiopia (2005-2008)
72
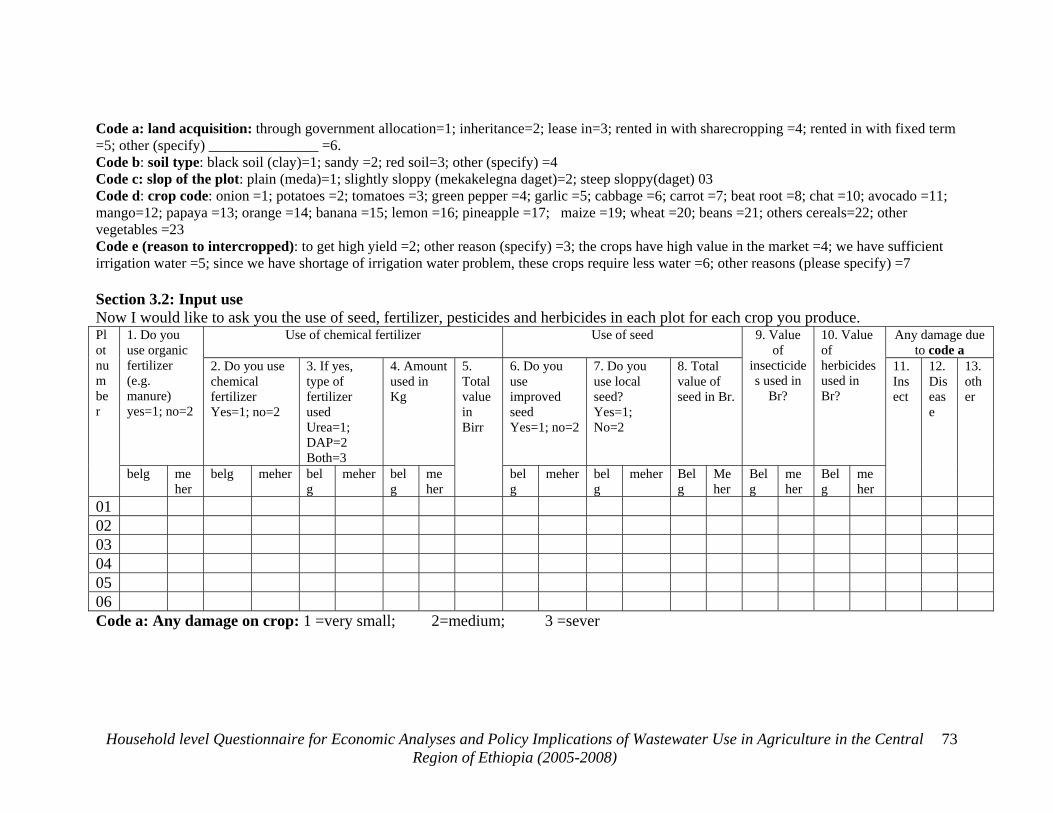
Code a: land acquisition: through government allocation=1; inheritance=2; lease in=3; rented in with sharecropping =4; rented in with fixed term =5; other (specify) _______________ =6. Code b: soil type: black soil (clay)=1; sandy =2; red soil=3; other (specify) =4 Code c: slop of the plot: plain (meda)=1; slightly sloppy (mekakelegna daget)=2; steep sloppy(daget) 03 Code d: crop code: onion =1; potatoes =2; tomatoes =3; green pepper =4; garlic =5; cabbage =6; carrot =7; beat root =8; chat =10; avocado =11; mango=12; papaya =13; orange =14; banana =15; lemon =16; pineapple =17; maize =19; wheat =20; beans =21; others cereals=22; other vegetables =23 Code e (reason to intercropped): to get high yield =2; other reason (specify) =3; the crops have high value in the market =4; we have sufficient irrigation water =5; since we have shortage of irrigation water problem, these crops require less water =6; other reasons (please specify) =7 Section 3.2: Input use Now I would like to ask you the use of seed, fertilizer, pesticides and herbicides in each plot for each crop you produce.
Use of chemical fertilizer Use of seed Any damage due to code a
1. Do you use organic fertilizer (e.g. manure) yes=1; no=2
2. Do you use chemical fertilizer Yes=1; no=2
3. If yes, type of fertilizer used Urea=1; DAP=2 Both=3
4. Amount used in Kg
6. Do you use improved seed Yes=1; no=2
7. Do you use local seed? Yes=1; No=2
8. Total value of seed in Br.
9. Value of
insecticides used in
Br?
10. Value of herbicides used in Br?
Plot number
belg meher
belg meher belg
meher belg
meher
5. Total value in Birr
belg
meher belg
meher Belg
Meher
Belg
meher
Belg
meher
11. Insect
12. Disease
13. other
0 1 0 2 0 3 0 4 0 5 0 6 Code a: Any damage on crop: 1 =very small; 2=medium; 3 =sever
Household level Questionnaire for Economic Analyses and Policy Implications of Wastewater Use in Agriculture in the Central Region of Ethiopia (2005-2008)
73
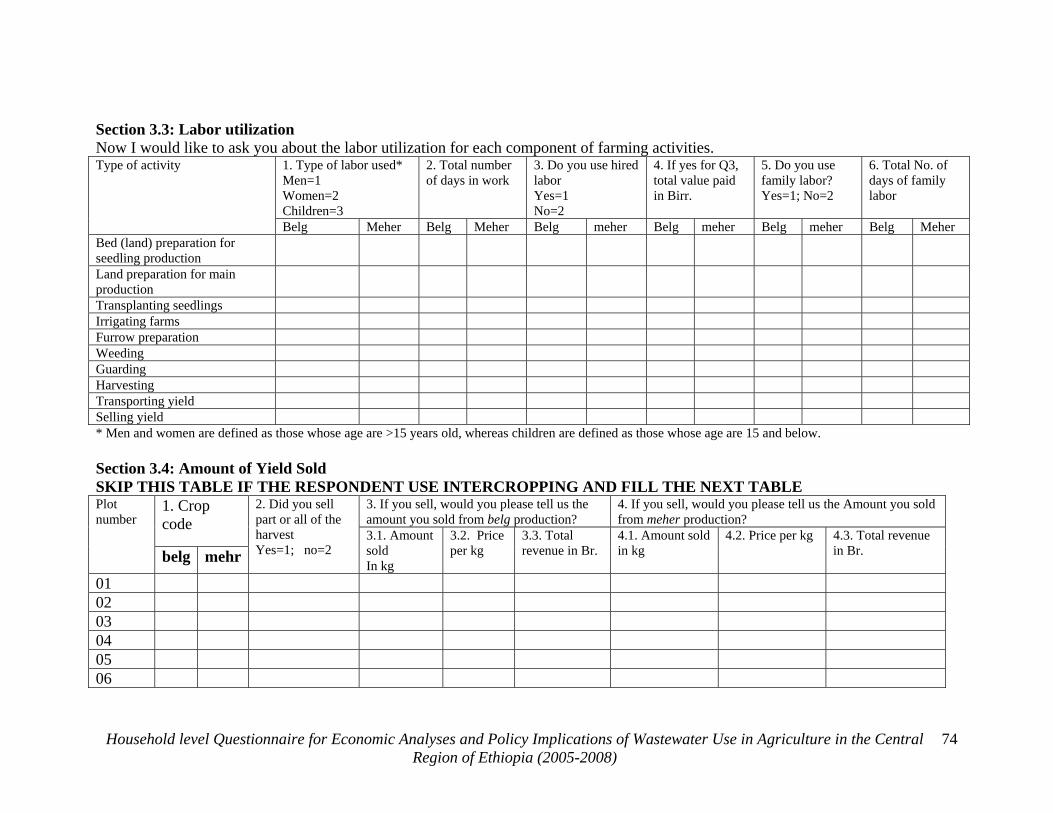
Section 3.3: Labor utilization Now I would like to ask you about the labor utilization for each component of farming activities.
1. Type of labor used* Men=1 Women=2 Children=3
2. Total number of days in work
3. Do you use hired labor Yes=1 No=2
4. If yes for Q3, total value paid in Birr.
5. Do you use family labor? Yes=1; No=2
6. Total No. of days of family labor
Type of activity
Belg Meher Belg Meher Belg meher Belg meher Belg meher Belg Meher Bed (land) preparation for seedling production
Land preparation for main production
Transplanting seedlings Irrigating farms Furrow prepara tion Wee ding Guar ding Harves ting Transporting yield Selling yield * Men and women are defined as those whose age are >15 years old, whereas children are defined as those whose age are 15 and below. Section 3.4: Amount of Yield Sold SKIP THIS TABLE IF THE RESPONDENT USE INTERCROPPING AND FILL THE NEXT TABLE
3. If you sell, would you please tell us the amount you sold from belg production?
4. If you sell, would you please tell us the Amount you sold from meher production?
1. Crop code
Plot number
belg mehr
2. Did you sell part or all of the harvest Yes=1; no=2
3.1. Amount sold In kg
3.2. Price per kg
3.3. Total revenue in Br.
4.1. Amount sold in kg
4.2. Price per kg 4.3. Total revenue in Br.
01 02 03 04 05 06
Household level Questionnaire for Economic Analyses and Policy Implications of Wastewater Use in Agriculture in the Central Region of Ethiopia (2005-2008)
74
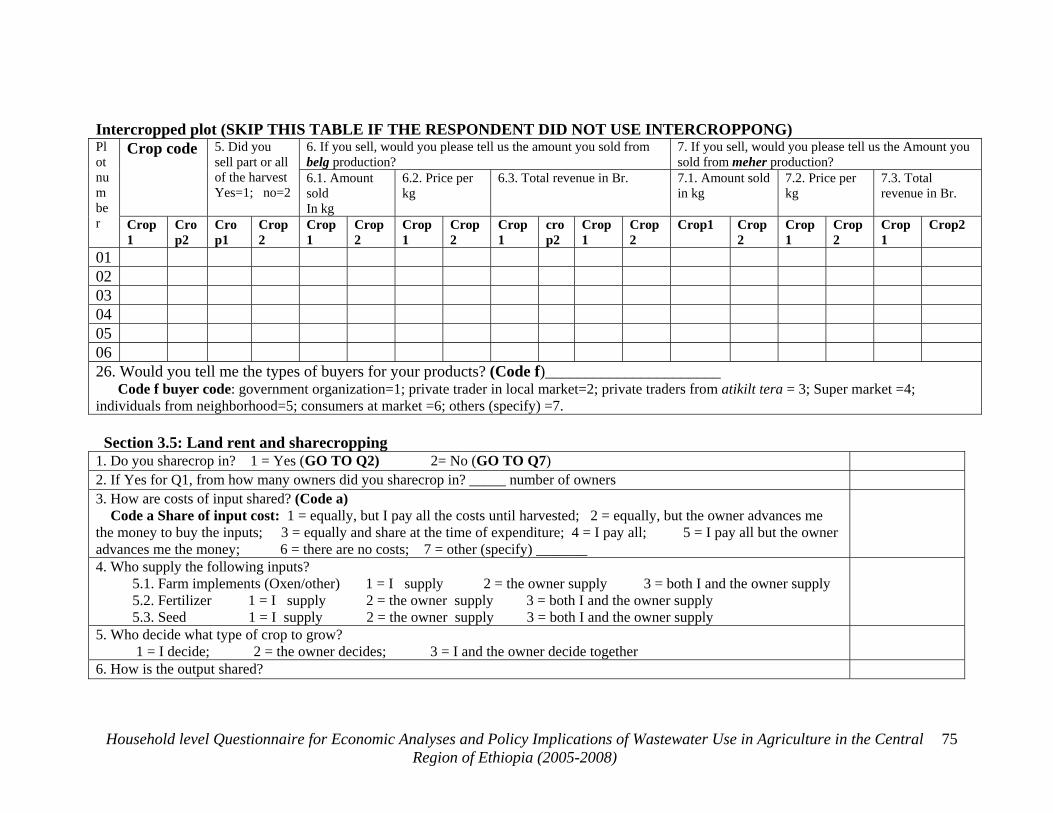
Intercropped plot (SKIP THIS TABLE IF THE RESPONDENT DID NOT USE INTERCROPPONG) 6. If you sell, would you please tell us the amount you sold from belg production?
7. If you sell, would you please tell us the Amount you sold from meher production?
Crop code 5. Did you sell part or all of the harvest Yes=1; no=2
6.1. Amount sold In kg
6.2. Price per kg
6.3. Total revenue in Br. 7.1. Amount sold in kg
7.2. Price per kg
7.3. Total revenue in Br.
Plot number Crop
1 Crop2
Crop1
Crop2
Crop1
Crop2
Crop1
Crop2
Crop1
crop2
Crop1
Crop2
Crop1 Crop2
Crop1
Crop2
Crop1
Crop2
01 02 03 04 05 06 26. Would you tell me the types of buyers for your products? (Code f)______________________ Code f buyer code: government organization=1; private trader in local market=2; private traders from atikilt tera = 3; Super market =4; individuals from neighborhood=5; consumers at market =6; others (specify) =7. Section 3.5: Land rent and sharecropping 1. Do you sharecrop in? 1 = Yes (GO TO Q2) 2= No (GO TO Q7) 2. If Yes for Q1, from how many owners did you sharecrop in? _____ number of owners 3. How are costs of input shared? (Code a) Code a Share of input cost: 1 = equally, but I pay all the costs until harvested; 2 = equally, but the owner advances me the money to buy the inputs; 3 = equally and share at the time of expenditure; 4 = I pay all; 5 = I pay all but the owner advances me the money; 6 = there are no costs; 7 = other (specify) _______
4. Who supply the following inputs? 5.1. Farm implements (Oxen/other) 1 = I supply 2 = the owner supply 3 = both I and the owner supply 5.2. Fertilizer 1 = I supply 2 = the owner supply 3 = both I and the owner supply 5.3. Seed 1 = I supply 2 = the owner supply 3 = both I and the owner supply
5. Who decide what type of crop to grow? 1 = I decide; 2 = the owner decides; 3 = I and the owner decide together
6. How is the output shared?
Household level Questionnaire for Economic Analyses and Policy Implications of Wastewater Use in Agriculture in the Central Region of Ethiopia (2005-2008)
75
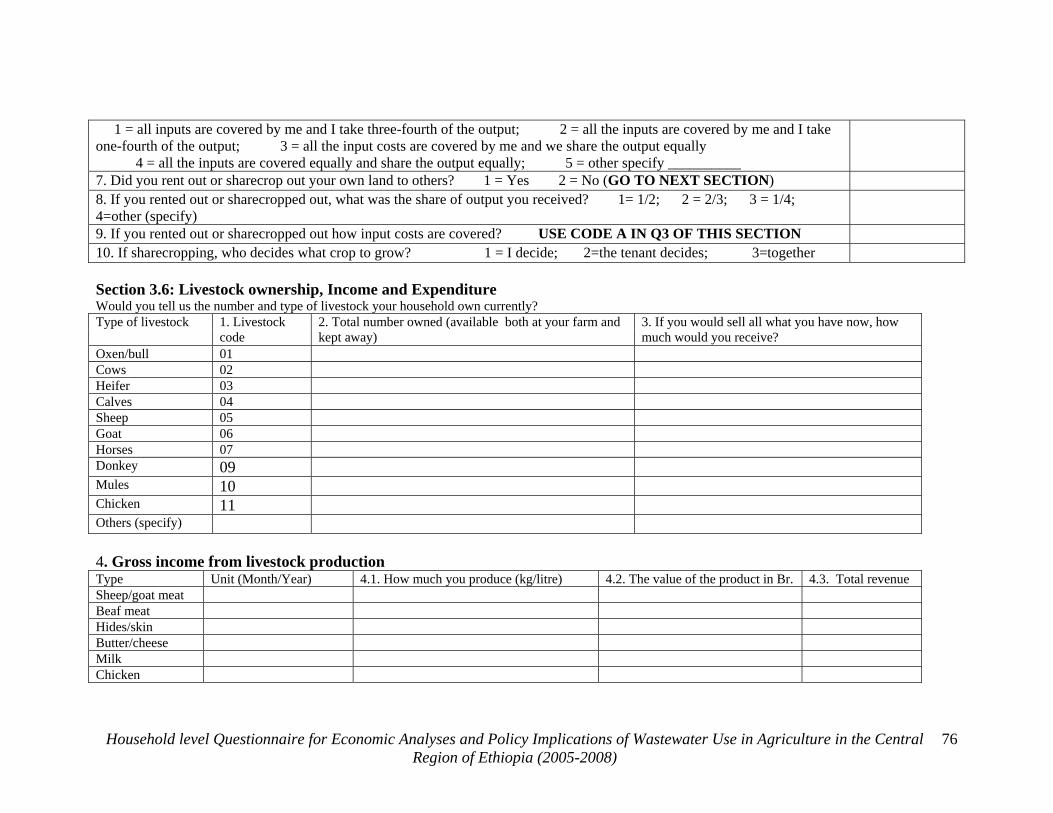
1 = all inputs are covered by me and I take three-fourth of the output; 2 = all the inputs are covered by me and I take one-fourth of the output; 3 = all the input costs are covered by me and we share the output equally 4 = all the inputs are covered equally and share the output equally; 5 = other specify __________
7. Did you rent out or sharecrop out your own land to others? 1 = Yes 2 = No (GO TO NEXT SECTION) 8. If you rented out or sharecropped out, what was the share of output you received? 1= 1/2; 2 = 2/3; 3 = 1/4;
4=other (specify) 9. If you rented out or sharecropped out how input costs are covered? USE CODE A IN Q3 OF THIS SECTION 10. If sharecropping, who decides what crop to grow? 1 = I decide; 2=the tenant decides; 3=together Section 3.6: Livestock ownership, Income and Expenditure Would you tell us the number and type of livestock your household own currently? Type of livestock 1. Livestock
code 2. Total number owned (available both at your farm and kept away)
3. If you would sell all what you have now, how much would you receive?
Oxen/bull 01 Cows 02 Heifer 03 Calves 04 Sheep 05 Goat 06 Horses 07 Donkey 09 Mules 10 Chicken 11 Others (specify) 4. Gross income from livestock production Type Unit (Month/Year) 4.1. How much you produce (kg/litre) 4.2. The value of the product in Br. 4.3. Total revenue Sheep/goat meat Beaf meat Hides/skin Butter/cheese Milk Chicken
Household level Questionnaire for Economic Analyses and Policy Implications of Wastewater Use in Agriculture in the Central Region of Ethiopia (2005-2008)
76
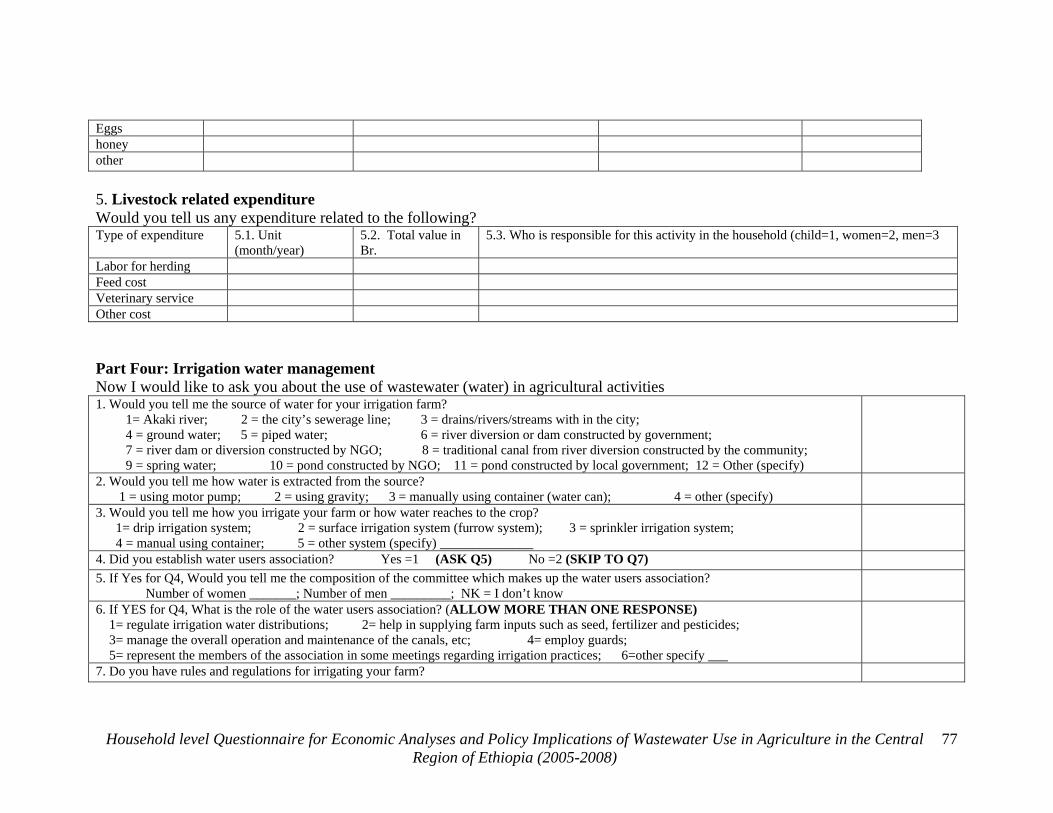
Eggs honey other 5. Livestock related expenditure Would you tell us any expenditure related to the following? Type of expenditure 5.1. Unit
(month/year) 5.2. Total value in Br.
5.3. Who is responsible for this activity in the household (child=1, women=2, men=3
Labor for herding Feed cost Veterinary service Other cost Part Four: Irrigation water management Now I would like to ask you about the use of wastewater (water) in agricultural activities 1. Would you tell me the source of water for your irrigation farm? 1= Akaki river; 2 = the city’s sewerage line; 3 = drains/rivers/streams with in the city; 4 = ground water; 5 = piped water; 6 = river diversion or dam constructed by government; 7 = river dam or diversion constructed by NGO; 8 = traditional canal from river diversion constructed by the community; 9 = spring water; 10 = pond constructed by NGO; 11 = pond constructed by local government; 12 = Other (specify)
2. Would you tell me how water is extracted from the source? 1 = using motor pump; 2 = using gravity; 3 = manually using container (water can); 4 = other (specify)
3. Would you tell me how you irrigate your farm or how water reaches to the crop? 1= drip irrigation system; 2 = surface irrigation system (furrow system); 3 = sprinkler irrigation system; 4 = manual using container; 5 = other system (specify) ______________
4. Did you establish water users association? Yes =1 (ASK Q5) No =2 (SKIP TO Q7) 5. If Yes for Q4, Would you tell me the composition of the committee which makes up the water users association? Number of women _______; Number of men _________; NK = I don’t know
6. If YES for Q4, What is the role of the water users association? (ALLOW MORE THAN ONE RESPONSE) 1= regulate irrigation water distributions; 2= help in supplying farm inputs such as seed, fertilizer and pesticides; 3= manage the overall operation and maintenance of the canals, etc; 4= employ guards; 5= represent the members of the association in some meetings regarding irrigation practices; 6=other specify ___
7. Do you have rules and regulations for irrigating your farm?
Household level Questionnaire for Economic Analyses and Policy Implications of Wastewater Use in Agriculture in the Central Region of Ethiopia (2005-2008)
77
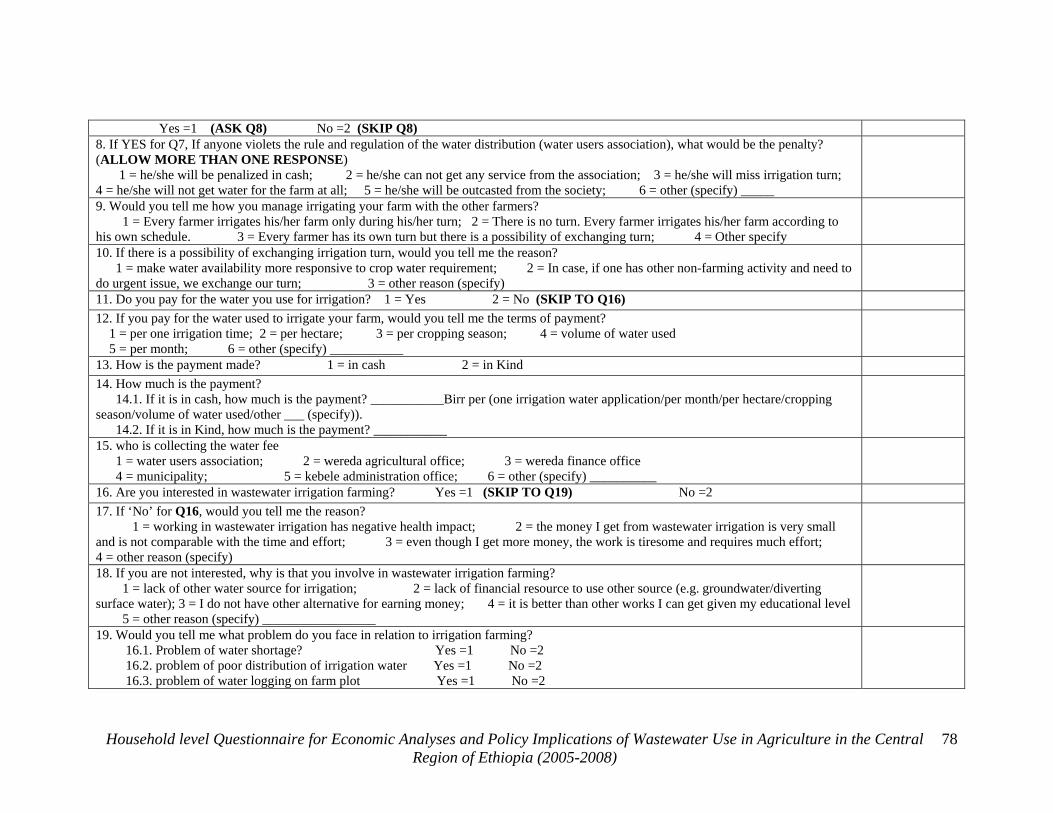
Yes =1 (ASK Q8) No =2 (SKIP Q8) 8. If YES for Q7, If anyone violets the rule and regulation of the water distribution (water users association), what would be the penalty? (ALLOW MORE THAN ONE RESPONSE) 1 = he/she will be penalized in cash; 2 = he/she can not get any service from the association; 3 = he/she will miss irrigation turn; 4 = he/she will not get water for the farm at all; 5 = he/she will be outcasted from the society; 6 = other (specify) _____
9. Would you tell me how you manage irrigating your farm with the other farmers? 1 = Every farmer irrigates his/her farm only during his/her turn; 2 = There is no turn. Every farmer irrigates his/her farm according to his own schedule. 3 = Every farmer has its own turn but there is a possibility of exchanging turn; 4 = Other specify
10. If there is a possibility of exchanging irrigation turn, would you tell me the reason? 1 = make water availability more responsive to crop water requirement; 2 = In case, if one has other non-farming activity and need to do urgent issue, we exchange our turn; 3 = other reason (specify)
11. Do you pay for the water you use for irrigation? 1 = Yes 2 = No (SKIP TO Q16) 12. If you pay for the water used to irrigate your farm, would you tell me the terms of payment? 1 = per one irrigation time; 2 = per hectare; 3 = per cropping season; 4 = volume of water used 5 = per month; 6 = other (specify) ___________
13. How is the payment made? 1 = in cash 2 = in Kind 14. How much is the payment? 14.1. If it is in cash, how much is the payment? ___________Birr per (one irrigation water application/per month/per hectare/cropping season/volume of water used/other ___ (specify)). 14.2. If it is in Kind, how much is the payment? ___________
15. who is collecting the water fee 1 = water users association; 2 = wereda agricultural office; 3 = wereda finance office 4 = municipality; 5 = kebele administration office; 6 = other (specify) __________
16. Are you interested in wastewater irrigation farming? Yes =1 (SKIP TO Q19) No =2 17. If ‘No’ for Q16, would you tell me the reason? 1 = working in wastewater irrigation has negative health impact; 2 = the money I get from wastewater irrigation is very small and is not comparable with the time and effort; 3 = even though I get more money, the work is tiresome and requires much effort; 4 = other reason (specify)
18. If you are not interested, why is that you involve in wastewater irrigation farming? 1 = lack of other water source for irrigation; 2 = lack of financial resource to use other source (e.g. groundwater/diverting surface water); 3 = I do not have other alternative for earning money; 4 = it is better than other works I can get given my educational level 5 = other reason (specify) _________________
19. Would you tell me what problem do you face in relation to irrigation farming? 16.1. Problem of water shortage? Yes =1 No =2 16.2. problem of poor distribution of irrigation water Yes =1 No =2 16.3. problem of water logging on farm plot Yes =1 No =2
Household level Questionnaire for Economic Analyses and Policy Implications of Wastewater Use in Agriculture in the Central Region of Ethiopia (2005-2008)
78
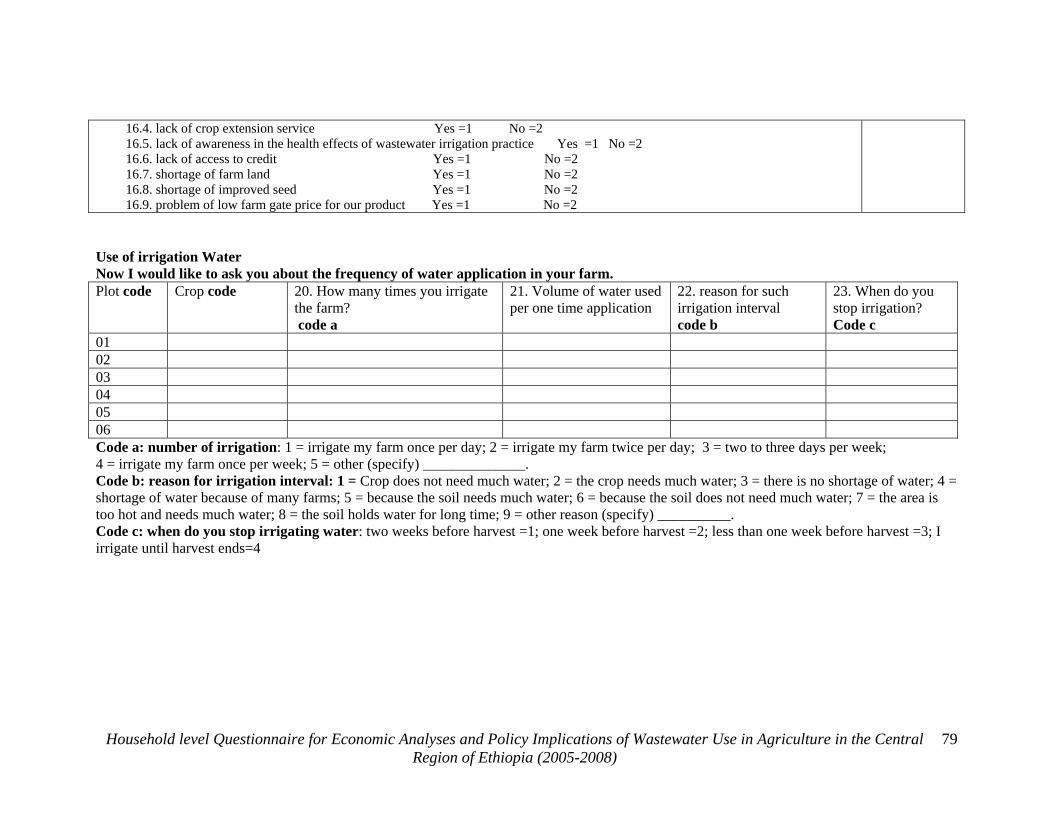
Household level Questionnaire for Economic Analyses and Policy Implications of Wastewater Use in Agriculture in the Central Region of Ethiopia (2005-2008)
79
16.4. lack of crop extension service Yes =1 No =2 16.5. lack of awareness in the health effects of wastewater irrigation practice Yes =1 No =2 16.6. lack of access to credit Yes =1 No =2 16.7. shortage of farm land Yes =1 No =2 16.8. shortage of improved seed Yes =1 No =2 16.9. problem of low farm gate price for our product Yes =1 No =2 Use of irrigation Water Now I would like to ask you about the frequency of water application in your farm. Plot code
Crop code 20. How many times you irrigate the farm? code a
21. Volume of water used per one time application
22. reason for such irrigation interval code b
23. When do you stop irrigation? Code c
01 02 03 04 05 06 Code a: number of irrigation: 1 = irrigate my farm once per day; 2 = irrigate my farm twice per day; 3 = two to three days per week; 4 = irrigate my farm once per week; 5 = other (specify) ______________. Code b: reason for irrigation interval: 1 = Crop does not need much water; 2 = the crop needs much water; 3 = there is no shortage of water; 4 = shortage of water because of many farms; 5 = because the soil needs much water; 6 = because the soil does not need much water; 7 = the area is too hot and needs much water; 8 = the soil holds water for long time; 9 = other reason (specify) __________. Code c: when do you stop irrigating water: two weeks before harvest =1; one week before harvest =2; less than one week before harvest =3; I irrigate until harvest ends=4
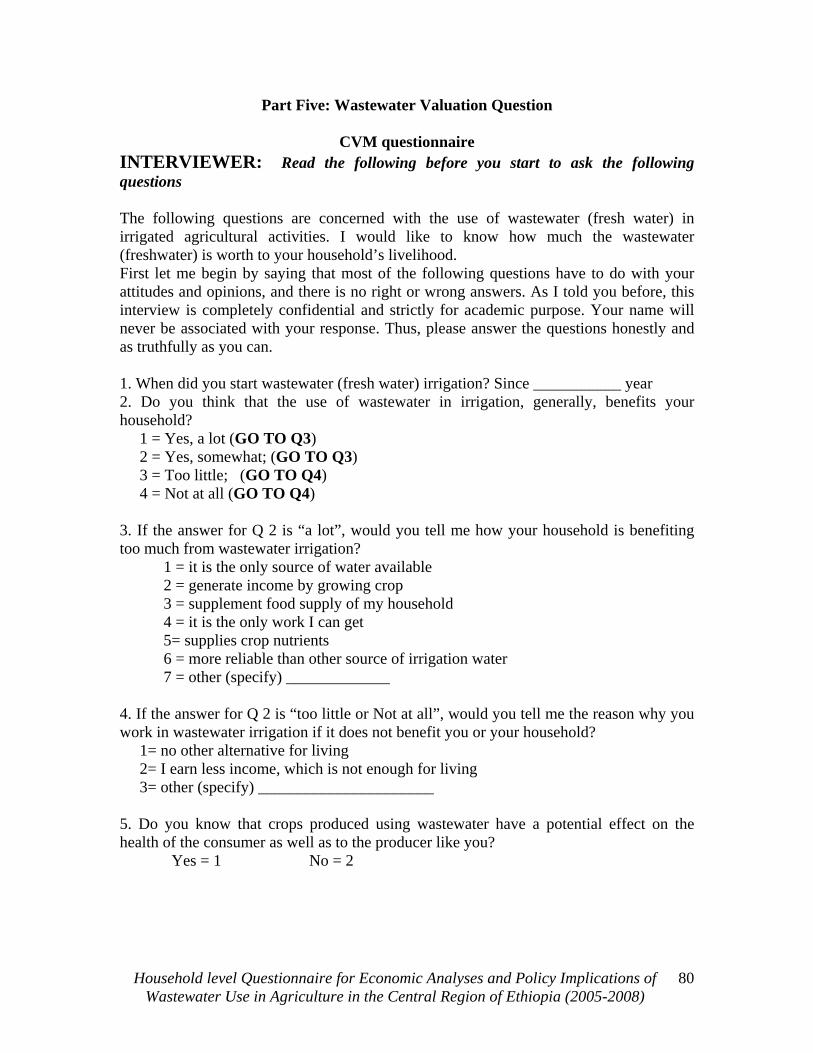
Part Five: Wastewater Valuation Question
CVM questionnaire INTERVIEWER: Read the following before you start to ask the following questions The following questions are concerned with the use of wastewater (fresh water) in irrigated agricultural activities. I would like to know how much the wastewater (freshwater) is worth to your household’s livelihood. First let me begin by saying that most of the following questions have to do with your attitudes and opinions, and there is no right or wrong answers. As I told you before, this interview is completely confidential and strictly for academic purpose. Your name will never be associated with your response. Thus, please answer the questions honestly and as truthfully as you can. 1. When did you start wastewater (fresh water) irrigation? Since ___________ year 2. Do you think that the use of wastewater in irrigation, generally, benefits your household? 1 = Yes, a lot (GO TO Q3) 2 = Yes, somewhat; (GO TO Q3) 3 = Too little; (GO TO Q4) 4 = Not at all (GO TO Q4) 3. If the answer for Q 2 is “a lot”, would you tell me how your household is benefiting too much from wastewater irrigation? 1 = it is the only source of water available 2 = generate income by growing crop 3 = supplement food supply of my household 4 = it is the only work I can get 5= supplies crop nutrients 6 = more reliable than other source of irrigation water 7 = other (specify) _____________ 4. If the answer for Q 2 is “too little or Not at all”, would you tell me the reason why you work in wastewater irrigation if it does not benefit you or your household? 1= no other alternative for living 2= I earn less income, which is not enough for living 3= other (specify) ______________________ 5. Do you know that crops produced using wastewater have a potential effect on the health of the consumer as well as to the producer like you? Yes = 1 No = 2
Household level Questionnaire for Economic Analyses and Policy Implications of Wastewater Use in Agriculture in the Central Region of Ethiopia (2005-2008)
80
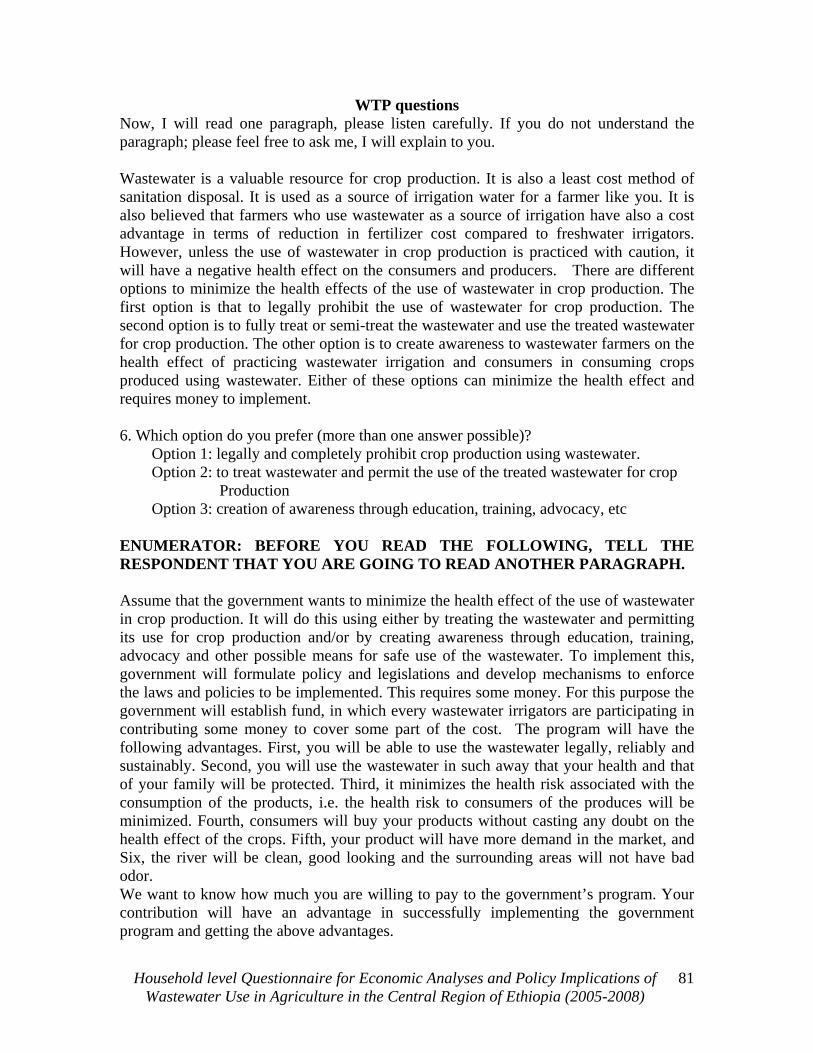
WTP questions Now, I will read one paragraph, please listen carefully. If you do not understand the paragraph; please feel free to ask me, I will explain to you. Wastewater is a valuable resource for crop production. It is also a least cost method of sanitation disposal. It is used as a source of irrigation water for a farmer like you. It is also believed that farmers who use wastewater as a source of irrigation have also a cost advantage in terms of reduction in fertilizer cost compared to freshwater irrigators. However, unless the use of wastewater in crop production is practiced with caution, it will have a negative health effect on the consumers and producers. There are different options to minimize the health effects of the use of wastewater in crop production. The first option is that to legally prohibit the use of wastewater for crop production. The second option is to fully treat or semi-treat the wastewater and use the treated wastewater for crop production. The other option is to create awareness to wastewater farmers on the health effect of practicing wastewater irrigation and consumers in consuming crops produced using wastewater. Either of these options can minimize the health effect and requires money to implement. 6. Which option do you prefer (more than one answer possible)? Option 1: legally and completely prohibit crop production using wastewater. Option 2: to treat wastewater and permit the use of the treated wastewater for crop Production Option 3: creation of awareness through education, training, advocacy, etc ENUMERATOR: BEFORE YOU READ THE FOLLOWING, TELL THE RESPONDENT THAT YOU ARE GOING TO READ ANOTHER PARAGRAPH. Assume that the government wants to minimize the health effect of the use of wastewater in crop production. It will do this using either by treating the wastewater and permitting its use for crop production and/or by creating awareness through education, training, advocacy and other possible means for safe use of the wastewater. To implement this, government will formulate policy and legislations and develop mechanisms to enforce the laws and policies to be implemented. This requires some money. For this purpose the government will establish fund, in which every wastewater irrigators are participating in contributing some money to cover some part of the cost. The program will have the following advantages. First, you will be able to use the wastewater legally, reliably and sustainably. Second, you will use the wastewater in such away that your health and that of your family will be protected. Third, it minimizes the health risk associated with the consumption of the products, i.e. the health risk to consumers of the produces will be minimized. Fourth, consumers will buy your products without casting any doubt on the health effect of the crops. Fifth, your product will have more demand in the market, and Six, the river will be clean, good looking and the surrounding areas will not have bad odor. We want to know how much you are willing to pay to the government’s program. Your contribution will have an advantage in successfully implementing the government program and getting the above advantages.
Household level Questionnaire for Economic Analyses and Policy Implications of Wastewater Use in Agriculture in the Central Region of Ethiopia (2005-2008)
81
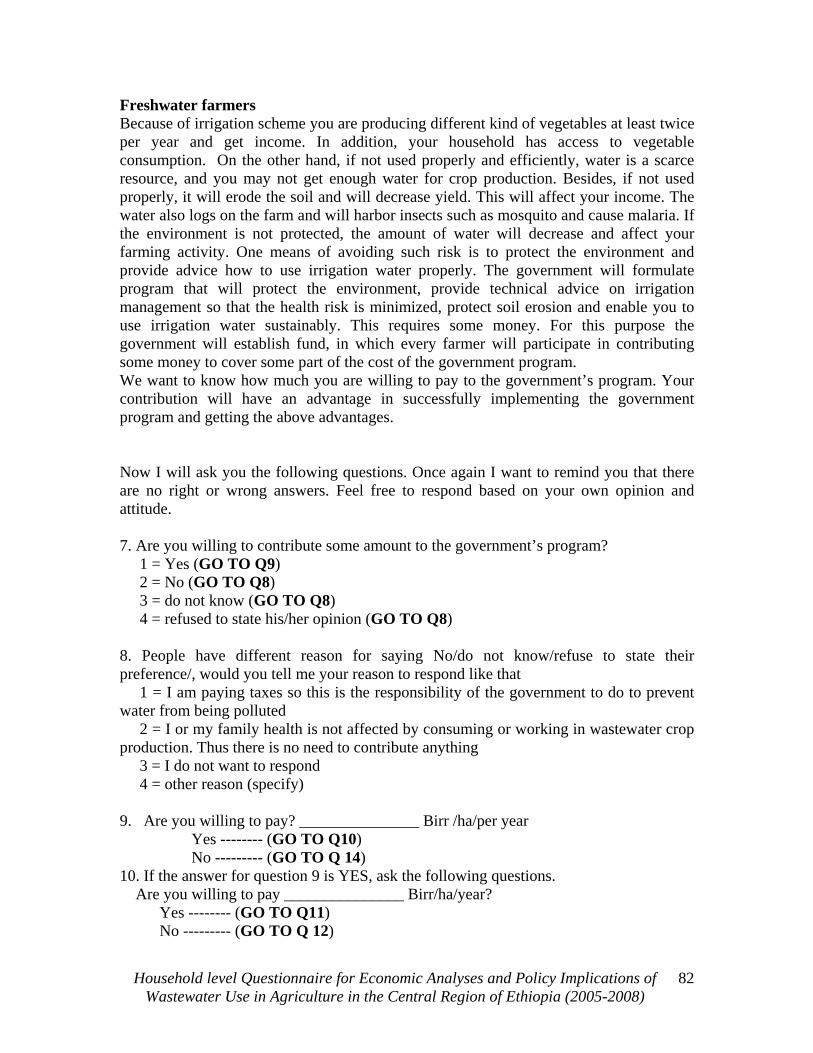
Freshwater farmers Because of irrigation scheme you are producing different kind of vegetables at least twice per year and get income. In addition, your household has access to vegetable consumption. On the other hand, if not used properly and efficiently, water is a scarce resource, and you may not get enough water for crop production. Besides, if not used properly, it will erode the soil and will decrease yield. This will affect your income. The water also logs on the farm and will harbor insects such as mosquito and cause malaria. If the environment is not protected, the amount of water will decrease and affect your farming activity. One means of avoiding such risk is to protect the environment and provide advice how to use irrigation water properly. The government will formulate program that will protect the environment, provide technical advice on irrigation management so that the health risk is minimized, protect soil erosion and enable you to use irrigation water sustainably. This requires some money. For this purpose the government will establish fund, in which every farmer will participate in contributing some money to cover some part of the cost of the government program. We want to know how much you are willing to pay to the government’s program. Your contribution will have an advantage in successfully implementing the government program and getting the above advantages. Now I will ask you the following questions. Once again I want to remind you that there are no right or wrong answers. Feel free to respond based on your own opinion and attitude. 7. Are you willing to contribute some amount to the government’s program? 1 = Yes (GO TO Q9) 2 = No (GO TO Q8) 3 = do not know (GO TO Q8) 4 = refused to state his/her opinion (GO TO Q8) 8. People have different reason for saying No/do not know/refuse to state their preference/, would you tell me your reason to respond like that 1 = I am paying taxes so this is the responsibility of the government to do to prevent water from being polluted 2 = I or my family health is not affected by consuming or working in wastewater crop production. Thus there is no need to contribute anything 3 = I do not want to respond 4 = other reason (specify) 9. Are you willing to pay? _______________ Birr /ha/per year Yes -------- (GO TO Q10) No --------- (GO TO Q 14) 10. If the answer for question 9 is YES, ask the following questions. Are you willing to pay _______________ Birr/ha/year? Yes -------- (GO TO Q11) No --------- (GO TO Q 12)
Household level Questionnaire for Economic Analyses and Policy Implications of Wastewater Use in Agriculture in the Central Region of Ethiopia (2005-2008)
82
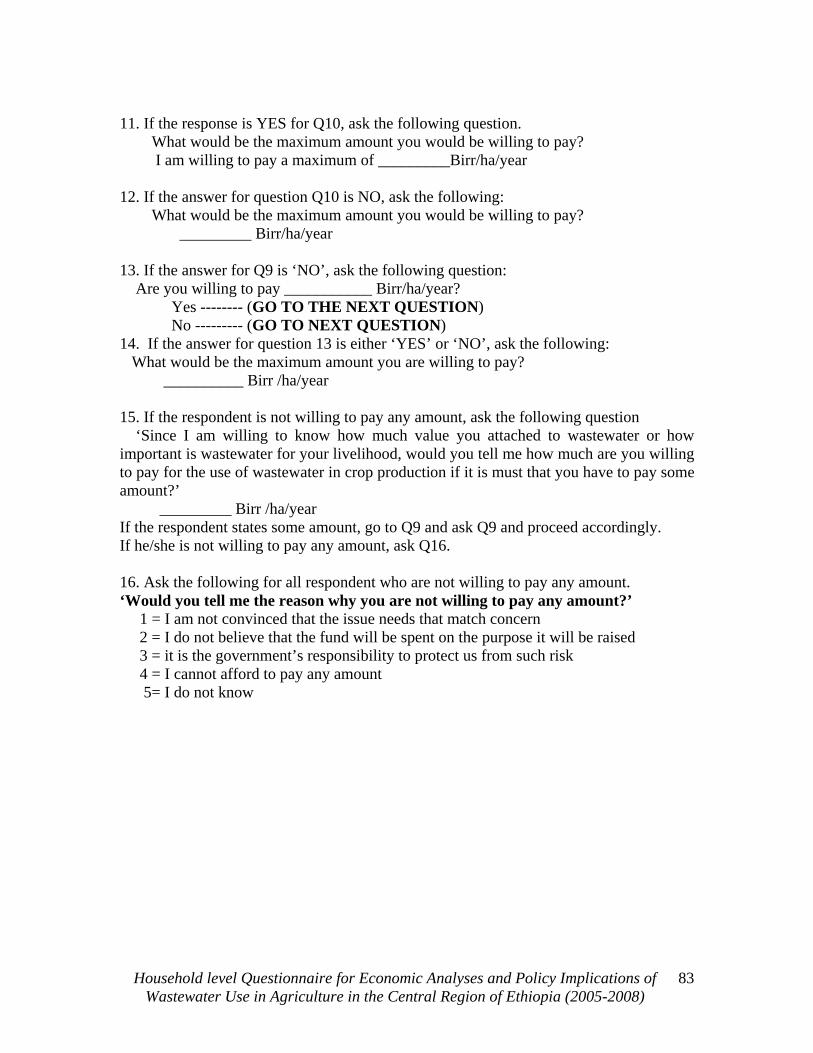
Household level Questionnaire for Economic Analyses and Policy Implications of Wastewater Use in Agriculture in the Central Region of Ethiopia (2005-2008)
83
11. If the response is YES for Q10, ask the following question. What would be the maximum amount you would be willing to pay? I am willing to pay a maximum of _________Birr/ha/year 12. If the answer for question Q10 is NO, ask the following: What would be the maximum amount you would be willing to pay? _________ Birr/ha/year 13. If the answer for Q9 is ‘NO’, ask the following question: Are you willing to pay ___________ Birr/ha/year? Yes -------- (GO TO THE NEXT QUESTION) No --------- (GO TO NEXT QUESTION) 14. If the answer for question 13 is either ‘YES’ or ‘NO’, ask the following: What would be the maximum amount you are willing to pay? __________ Birr /ha/year 15. If the respondent is not willing to pay any amount, ask the following question ‘Since I am willing to know how much value you attached to wastewater or how important is wastewater for your livelihood, would you tell me how much are you willing to pay for the use of wastewater in crop production if it is must that you have to pay some amount?’ _________ Birr /ha/year If the respondent states some amount, go to Q9 and ask Q9 and proceed accordingly. If he/she is not willing to pay any amount, ask Q16. 16. Ask the following for all respondent who are not willing to pay any amount. ‘Would you tell me the reason why you are not willing to pay any amount?’ 1 = I am not convinced that the issue needs that match concern 2 = I do not believe that the fund will be spent on the purpose it will be raised 3 = it is the government’s responsibility to protect us from such risk 4 = I cannot afford to pay any amount 5= I do not know
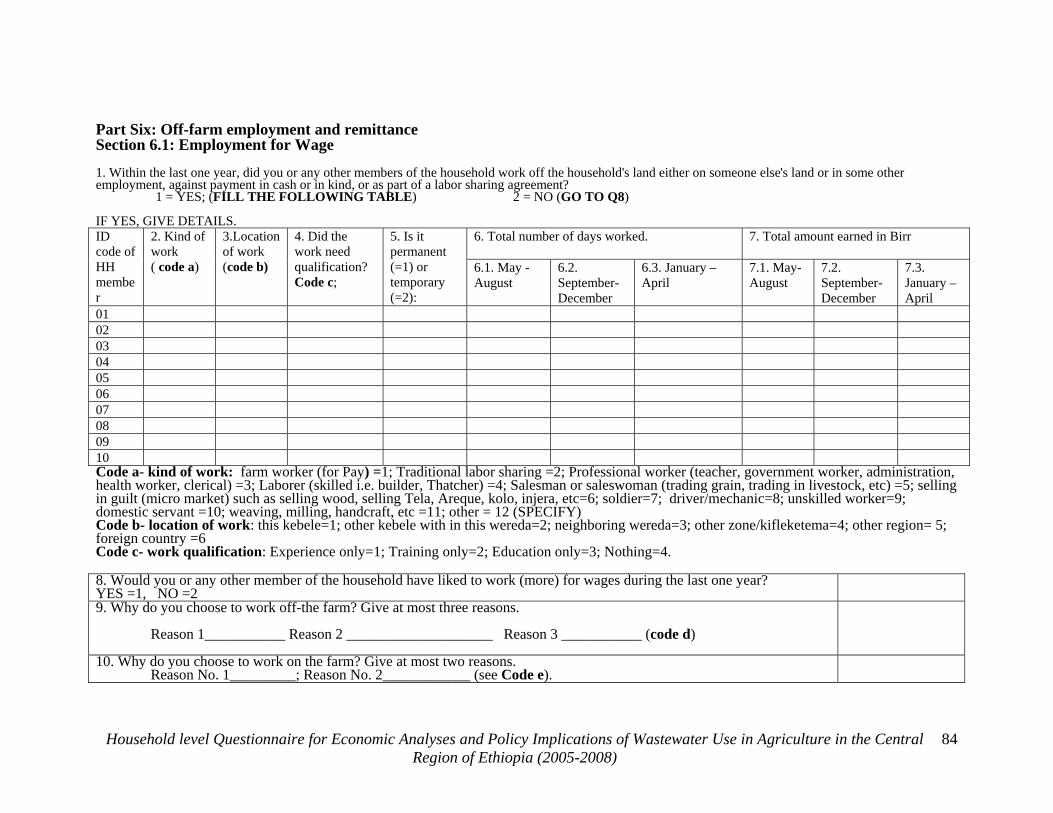
Part Six: Off-farm employment and remittance Section 6.1: Employment for Wage 1. Within the last one year, did you or any other members of the household work off the household's land either on someone else's land or in some other employment, against payment in cash or in kind, or as part of a labor sharing agreement? 1 = YES; (FILL THE FOLLOWING TABLE) 2 = NO (GO TO Q8) IF YES, GIVE DETAILS.
6. Total number of days worked. 7. Total amount earned in Birr
ID code of HH member
2. Kind of work ( code a)
3.Location of work (code b)
4. Did the work need qualification? Code c;
5. Is it permanent (=1) or temporary (=2):
6.1. May -August
6.2. September-December
6.3. January –April
7.1. May-August
7.2. September-December
7.3. January – April
01 02 03 04 05 06 07 08 09 10 Code a- kind of work: farm worker (for Pay) =1; Traditional labor sharing =2; Professional worker (teacher, government worker, administration, health worker, clerical) =3; Laborer (skilled i.e. builder, Thatcher) =4; Salesman or saleswoman (trading grain, trading in livestock, etc) =5; selling in guilt (micro market) such as selling wood, selling Tela, Areque, kolo, injera, etc=6; soldier=7; driver/mechanic=8; unskilled worker=9; domestic servant =10; weaving, milling, handcraft, etc =11; other = 12 (SPECIFY) Code b- location of work: this kebele=1; other kebele with in this wereda=2; neighboring wereda=3; other zone/kifleketema=4; other region= 5; foreign country =6 Code c- work qualification: Experience only=1; Training only=2; Education only=3; Nothing=4. 8. Would you or any other member of the household have liked to work (more) for wages during the last one year? YES =1, NO =2
9. Why do you choose to work off-the farm? Give at most three reasons. Reason 1___________ Reason 2 ____________________ Reason 3 ___________ (code d) 10. Why do you choose to work on the farm? Give at most two reasons. Reason No. 1_________; Reason No. 2____________ (see Code e).
Household level Questionnaire for Economic Analyses and Policy Implications of Wastewater Use in Agriculture in the Central Region of Ethiopia (2005-2008)
84
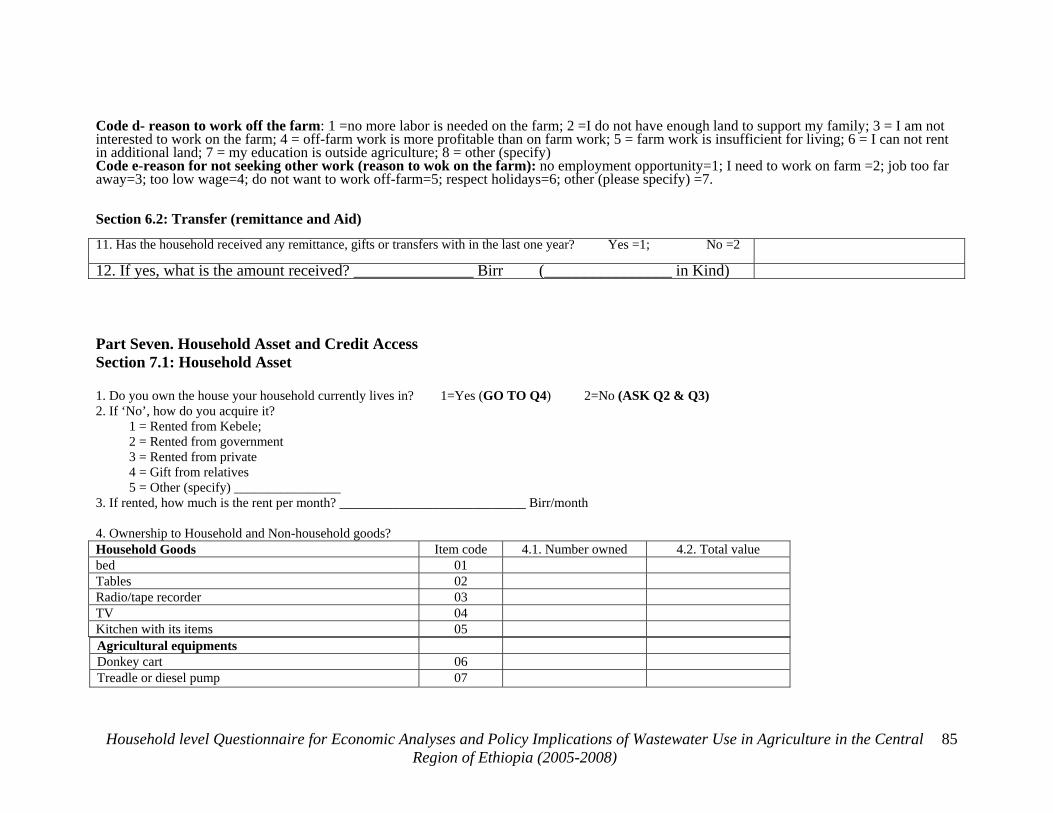
Code d- reason to work off the farm: 1 =no more labor is needed on the farm; 2 =I do not have enough land to support my family; 3 = I am not interested to work on the farm; 4 = off-farm work is more profitable than on farm work; 5 = farm work is insufficient for living; 6 = I can not rent in additional land; 7 = my education is outside agriculture; 8 = other (specify) Code e-reason for not seeking other work (reason to wok on the farm): no employment opportunity=1; I need to work on farm =2; job too far away=3; too low wage=4; do not want to work off-farm=5; respect holidays=6; other (please specify) =7. Section 6.2: Transfer (remittance and Aid) 11. Has the household received any remittance, gifts or transfers with in the last one year? Yes =1; No =2 12. If yes, what is the amount received? _______________ Birr (________________ in Kind) Part Seven. Household Asset and Credit Access Section 7.1: Household Asset 1. Do you own the house your household currently lives in? 1=Yes (GO TO Q4) 2=No (ASK Q2 & Q3) 2. If ‘No’, how do you acquire it? 1 = Rented from Kebele; 2 = Rented from government 3 = Rented from private 4 = Gift from relatives 5 = Other (specify) ________________ 3. If rented, how much is the rent per month? ____________________________ Birr/month 4. Ownership to Household and Non-household goods? Household Goods Item code 4.1. Number owned 4.2. Total value bed 01 Tables 02 Radio/tape recorder 03 TV 04 Kitchen with its items 05 Agricultural equipments Donkey cart 06 Treadle or diesel pump 07
Household level Questionnaire for Economic Analyses and Policy Implications of Wastewater Use in Agriculture in the Central Region of Ethiopia (2005-2008)
85
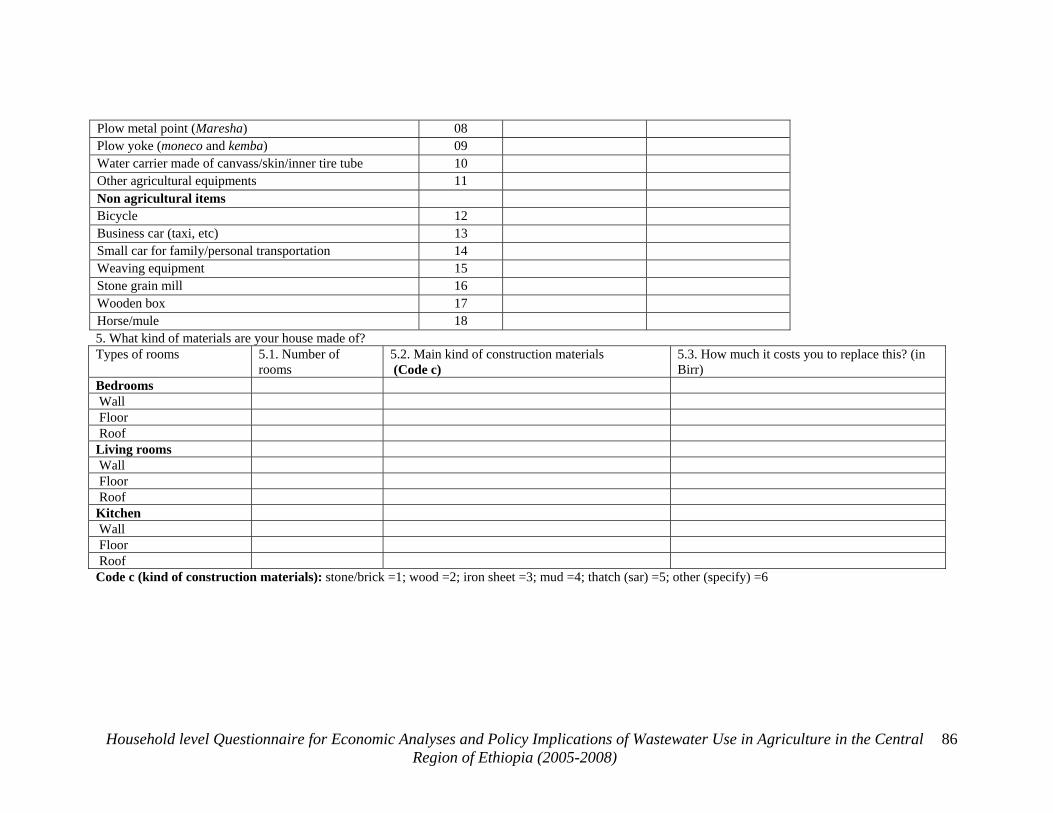
Plow metal point (Maresha) 08 Plow yoke (moneco and kemba) 09 Water carrier made of canvass/skin/inner tire tube 10 Other agricultural equipments 11 Non agricultural items Bicycle 12 Business car (taxi, etc) 13 Small car for family/personal transportation 14 Weaving equipment 15 Stone grain mill 16 Wooden box 17 Horse/mule 18 5. What kind of materials are your house made of? Types of rooms 5.1. Number of
rooms 5.2. Main kind of construction materials (Code c)
5.3. How much it costs you to replace this? (in Birr)
Bedrooms Wall Floor Roof Living rooms Wall Floor Roof Kitchen Wall Floor Roof Code c (kind of construction materials): stone/brick =1; wood =2; iron sheet =3; mud =4; thatch (sar) =5; other (specify) =6
Household level Questionnaire for Economic Analyses and Policy Implications of Wastewater Use in Agriculture in the Central Region of Ethiopia (2005-2008)
86
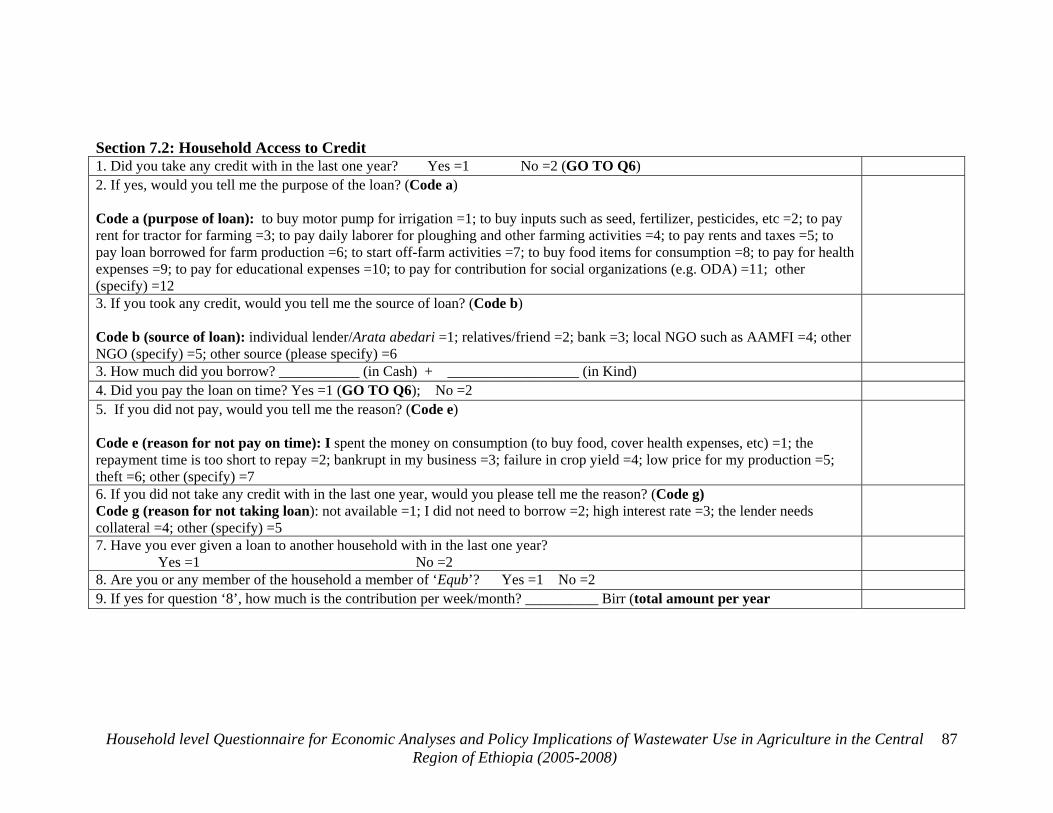
Section 7.2: Household Access to Credit 1. Did you take any credit with in the last one year? Yes =1 No =2 (GO TO Q6) 2. If yes, would you tell me the purpose of the loan? (Code a) Code a (purpose of loan): to buy motor pump for irrigation =1; to buy inputs such as seed, fertilizer, pesticides, etc =2; to pay rent for tractor for farming =3; to pay daily laborer for ploughing and other farming activities =4; to pay rents and taxes =5; to pay loan borrowed for farm production =6; to start off-farm activities =7; to buy food items for consumption =8; to pay for health expenses =9; to pay for educational expenses =10; to pay for contribution for social organizations (e.g. ODA) =11; other (specify) =12
3. If you took any credit, would you tell me the source of loan? (Code b) Code b (source of loan): individual lender/Arata abedari =1; relatives/friend =2; bank =3; local NGO such as AAMFI =4; other NGO (specify) =5; other source (please specify) =6
3. How much did you borrow? ___________ (in Cash) + __________________ (in Kind) 4. Did you pay the loan on time? Yes =1 (GO TO Q6); No =2 5. If you did not pay, would you tell me the reason? (Code e) Code e (reason for not pay on time): I spent the money on consumption (to buy food, cover health expenses, etc) =1; the repayment time is too short to repay =2; bankrupt in my business =3; failure in crop yield =4; low price for my production =5; theft =6; other (specify) =7
6. If you did not take any credit with in the last one year, would you please tell me the reason? (Code g) Code g (reason for not taking loan): not available =1; I did not need to borrow =2; high interest rate =3; the lender needs collateral =4; other (specify) =5
7. Have you ever given a loan to another household with in the last one year? Yes =1 No =2 8. Are you or any member of the household a member of ‘Equb’? Yes =1 No =2 9. If yes for question ‘8’, how much is the contribution per week/month? __________ Birr (total amount per year
Household level Questionnaire for Economic Analyses and Policy Implications of Wastewater Use in Agriculture in the Central Region of Ethiopia (2005-2008)
87
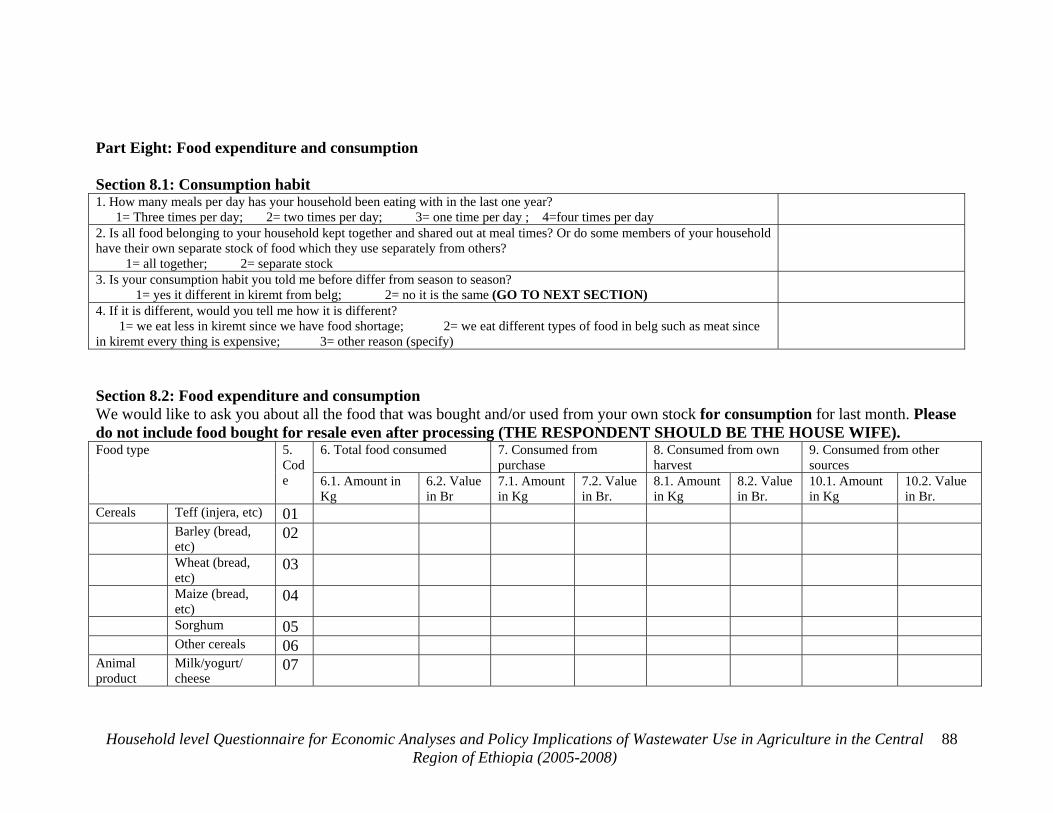
Part Eight: Food expenditure and consumption Section 8.1: Consumption habit 1. How many meals per day has your household been eating with in the last one year? 1= Three times per day; 2= two times per day; 3= one time per day ; 4=four times per day
2. Is all food belonging to your household kept together and shared out at meal times? Or do some members of your household have their own separate stock of food which they use separately from others? 1= all together; 2= separate stock
3. Is your consumption habit you told me before differ from season to season? 1= yes it different in kiremt from belg; 2= no it is the same (GO TO NEXT SECTION) 4. If it is different, would you tell me how it is different? 1= we eat less in kiremt since we have food shortage; 2= we eat different types of food in belg such as meat since in kiremt every thing is expensive; 3= other reason (specify)
Section 8.2: Food expenditure and consumption We would like to ask you about all the food that was bought and/or used from your own stock for consumption for last month. Please do not include food bought for resale even after processing (THE RESPONDENT SHOULD BE THE HOUSE WIFE).
6. Total food consumed 7. Consumed from purchase
8. Consumed from own harvest
9. Consumed from other sources
Food type 5. Code 6.1. Amount in
Kg 6.2. Value in Br
7.1. Amount in Kg
7.2. Value in Br.
8.1. Amount in Kg
8.2. Value in Br.
10.1. Amount in Kg
10.2. Value in Br.
Cereals Teff (injera, etc) 01 Barley (bread,
etc) 02
Wheat (bread, etc)
03
Maize (bread, etc)
04
Sorghum 05 Other cereals 06 Animal product
Milk/yogurt/ cheese
07
Household level Questionnaire for Economic Analyses and Policy Implications of Wastewater Use in Agriculture in the Central Region of Ethiopia (2005-2008)
88
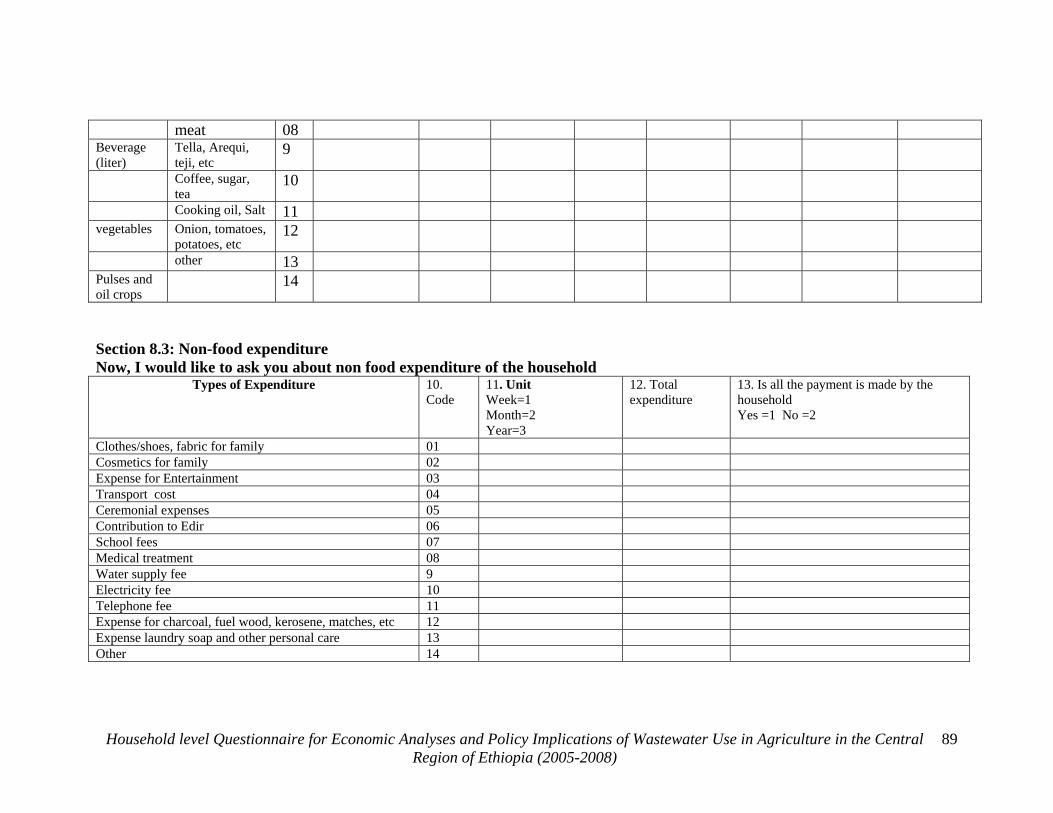
meat 08 Beverage (liter)
Tella, Arequi, teji, etc
9
Coffee, sugar, tea
10
Cooking oil, Salt 11 vegetables Onion, tomatoes,
potatoes, etc 12
other 13 Pulses and oil crops
14
Section 8.3: Non-food expenditure Now, I would like to ask you about non food expenditure of the household
Types of Expenditure 11. Unit Week=1 Month=2 Year=3
12. Total expenditure
10. Code
13. Is all the payment is made by the household Yes =1 No =2
Clothes/shoes, fabric for family 01 Cosmetics for family 02 Expense for Entertainment 03 Transport cost 04 Ceremonial expenses 05 Contribution to Edir 06 School fees 07 Medical treatment 08 Water supply fee 9 Electricity fee 10 Telephone fee 11 Expense for charcoal, fuel wood, kerosene, matches, etc 12 Expense laundry soap and other personal care 13
Other 14
Household level Questionnaire for Economic Analyses and Policy Implications of Wastewater Use in Agriculture in the Central Region of Ethiopia (2005-2008)
89
Part Nine: Social Capital Now I would like to ask you about membership to any local or external organization you or your family member belongs.
1. Are you or any of your family member belong to one or more of the organizations or associations listed below (code a) (LIST AS MANY AS THE RESPONDENT STATES)
2. Do you or any of your family members obtain or received any support (emotional, economic, or other) from any of the organization(s) or individual(s)? Yes =1 No =2
3. If ‘yes’, list the name of the organization/association from which the household obtained support. (code a ) 4. What are the different benefits you enjoy from them? (code b) 5. Do you feel that you are the member of the community? Yes =1 No =2 6. Generally speaking, would you say that most people in your locality can be trusted? (Code c) 7. Do you feel that most people would try and take advantage of you if they could? Yes =1 No =2 I don’t
know = 3 8. Do you agree that most people in this village are willing to help you if you need? (Code d) 9. Do you agree that in this village, people generally do not trust each other in matters of lending and borrowing money?
(Code e) 10. Have you or any member of your household join together with any person or organization to discuss or address common
issues and/or talk with the local authority on problems of the community? Yes =1 No =2 11. Have you attended any of the following last year? 11.1. Wedding Yes =1 No =2 11.2. Mahiber Yes =1 No =2 11.3. Sedeka Yes =1 No =2 12. To what extent do you trust the kebele and other authorities? (Code f) 13. What rank do you give your self in terms of happiness compared to other residents of the village? (Code g) 13.1. Now 13.2. Five years before 13.3. Ten years before
Code a Membership: Village associations =1; Peasant association =2; Women association =3; Youth associations =4; Elder association =5; Church/mosque =7; Water users associations =8; Edir =9; Equb =10; Marketing cooperatives =11; Input supply cooperatives =12; other (specify) =14
Household level Questionnaire for Economic Analyses and Policy Implications of Wastewater Use in Agriculture in the Central Region of Ethiopia (2005-2008)
90
Code b benefits obtained: Improve access to social services =1; Important in times of emergency/insurance =2; Enjoyment =3; Spiritual, social status, self esteem =4; Fair input price =5; Fair output price =6; Better access to off-farm employment =7; Feeling good about being part of a group =8; Other (specify) =9 Code c: Yes, I strongly agree =1; No, I disagree =2; neither agree nor disagree =3 Code d: Agree strongly =1; Agree some what =2; Disagree =3; I don’t know =4 Code e: Agree strongly =1; Agree somewhat =2; Disagree =3; I don’t know =4 Code f: Very much =1; Not so much =2; Not at all =3 Code g: Very happy =1; Happy =2; Not so happy =3; I don’t know =4
THANK YOU FOR YOUR COOPERATION
Household level Questionnaire for Economic Analyses and Policy Implications of Wastewater Use in Agriculture in the Central Region of Ethiopia (2005-2008)
91